Availability Evaluation and Optimisation of Grid Connection ...
Upload
khangminh22Category
view
5download
0
Geilo Oilfield Chemicals Symposium, March 2006, Geilo Norway
Prediction and optimisation of Pb/Zn/Fe sulphide scales in gasproduction fields
AuthorsSarah Dyer (Scaled Solutions), Karine Orski (Total E&P UK Ltd.), Carlos Menezes (Total E&P UK Ltd.), Steve Heath (Clariant) Calum MacPherson (Clariant), Caroline Simpson (Scaled Solutions) Gordon Graham (Scaled Solutions)
ABSTRACTLead, zinc and iron sulphide scales are known to be a particular issue with gas production fields, particularly those producing from HP/HT reservoirs. However the prediction of sulphide scale and the methodologies available for their laboratory assessment are not as well developed as those for the more conventional sulphate and carbonate scales.
This work examines a particular sulphide scaling regime from a North Sea high temperature gas condensate production field containing only 0.8ppm of sulphide ions. Sulphide scales were identified in the production system which was shown to be a mixture of lead and zinc sulphide, primarily lead sulphide. This formed as a result of cooling during production resulting in the oversaturation of these minerals. This paper describes scale prediction and modified laboratory test protocols used to recreate the scales formed in the field prior to chemical performance testing. From the brine composition, scale prediction identified that the major scales that could be formed were calcium carbonate, iron carbonate, iron sulphide, lead sulphide and zinc sulphide. In addition, modification of the brine compositions led to prediction of primarily one scale or the other. Given the predicted oversaturation of various minerals, preliminary laboratory tests were therefore conducted in order to ensure that the scale formed under laboratory conditions was representative of the field scale.
Laboratory protocols were therefore developed to ensure that the scales formed in fully anaerobic dynamic performance tests and static performance tests were similar to those encountered in the field. The paper compares results from field analysis, scale predictions and laboratory scale formation tests using newly developed test protocols and shows differences between prediction and laboratory data. The paper therefore demonstrates the importance of ensuring that the correct scale is formed under laboratory test conditions and also indicates some potential limitations of current thermodynamic models at predicting the type of sulphide scale which may occur.
INTRODUCTIONCarbonate and sulphate scales are a common problem in oil wells and their formation and inhibition are well documented. However, in some wells in the North Sea and the Gulf of Mexico, the production of sulphide scales is becoming a problem.1-4 These sulphide scales include zinc sulphide (sphalerite), lead sulphide (galena) and various forms of iron sulphide. Once the conditions are right for the formation of zinc sulphide and lead sulphide scale they will form readily as they both have very low
1

solubility’s. Sphalerite and galena are considerably less soluble than both calcium sulphate (gypsum) and barium sulphate (barite) and the carbonate scales calcite (calcium carbonate) and siderite (iron carbonate).
Iron sulphide is the most common of the sulphide scales, but zinc sulphide and lead sulphide have considerably lower solubility’s than iron sulphide. The solubility of zinc sulphide ranges from 30 times more than lead sulphide in a 1M sodium chloride brine, to 1000 times more soluble in fresh water at pH 7. Due to their relative solubility’s, lead sulphide will form preferentially relative to zinc sulphide, if the zinc and lead ions are present in equal quantities.1 Despite the low solubility of zinc sulphide and lead sulphide it is thought that their solubility increases with increasing brine salinity, increasing temperature and decreasing brine pH. Therefore as the temperature decreases, brine is diluted and pH increases during production, the tendency for zinc sulphide and lead sulphide scaling will increase.1 The very low solubility of lead sulphide and zinc sulphide make it very unlikely that zinc and lead ions will co-exist with sulphide ions for long. What is more likely is that the sources of zinc and lead ions mix with the source of sulphide ions within the near-wellbore area or production tubing during flood extraction and then changes in temperature, solution pH and residence time control the location of deposition as is the case for other sparingly soluble minerals.
Sources of Scaling IonsThere are various sources of zinc and lead ions and these include:1,2
- reaction products of dissolution of formation minerals (sphalerite and galena) during connate and aquifer water contact (the ionic concentrations in one HP/HT field in the Gulf of Mexico were [Pb] = 70 ppm and [Zn] = 245 ppm because of dissolution),- dissolution of minerals by injected fresh or sea water, which is used for pressure support in the reservoir during production- zinc ions from heavy brine completion fluids (zinc bromide) lost into the formation during drilling and well workover operations (zinc in brine could be 10 - 50 ppm from this source).
There are also several potential sources of sulphide ions. These include:- hydrogen sulphide gas (low concentrations in the 10’s of ppm level have resulted in sulphide scale formation, which either naturally occurs in the oil and gas reservoir or is produced as a result of sulphide reducing bacteria activity.- decomposition of drilling compounds and corrosion inhibitors within heavy brines when at high temperature (although this is likely to be a short term problem, rather than one extending over many years).
Removal of Sulphide ScalesThe removal of zinc sulphide and lead sulphide is expensive, including costs associated with the treatment itself but also those associated with deferred oil and gas production while treatments are mobilized and conducted. Both chemical and physical removal are possible but they are only short term solutions.2 Mechanical removal is possible by jetting pipe work and valves if access is available. However depending on the severity of the sulphide scaling involved, it is likely that removal will need to be repeated regularly unless chemical treatments to inhibit or prevent its recurrence are successfully employed. The deferred oil costs and equipment rental
2

costs can be high if removal is needed within the production string. Milling may be required if the restriction is severe.3
Chemical removal of sulphide scale is possible with acid washes. As with mechanical removal, acid washing will recover production, but new scale will form over a similar time period. Usually hydrochloric acid is used in the acid wash at a concentration of 15% to 30% v/v. However, there are risks associated with chemical treatments, especially in high temperature and high pressure wells. At high temperatures acid can give rise to general corrosion and hydrogen and chloride stress cracking. Acid washing will result in the generation of hydrogen sulphide gas which has safety issues. Further safety issues are also associated with applying acid in high pressure environments.10
There are various other potential problems associated with chemical removal of zinc sulphide and lead sulphide scales. If iron sulphide is present in the scale, then it will be preferentially dissolved relative to the lead sulphide and zinc sulphide owing to the greater solubility of iron sulphide. If insufficient acid is used in the chemical removal process then elemental sulphur could form as the pH rises within the spent acid solution.3 Przybylinski5 has studied iron (ferrous) sulphide and its removal by acid dissolution. As with zinc sulphide and lead sulphide scale, iron sulphide will evolve hydrogen sulphide gas with acid washing.
A further problem associated with acid washing may be the re-depositing of iron sulphide further down the system. This may also be true for zinc sulphide and lead sulphide scales. Other acids, including mixed organic acids have been used in the chemical removal of sulphide scales. These acids have resulted in less corrosion and hydrogen cracking effects, but the reaction rate against sulphide scales was much less and therefore longer contact times were needed.3 At low temperature acid washing with hydrogen chloride is the most effective method of chemical removal.3
Inhibition/Dispersion of Sulphide ScalesIt is generally considered difficult to screen chemicals for sulphide scale inhibition because of the requirement to use hydrogen sulphide and the requirement for anaerobic conditions, but some field tests have shown some success for polymer based scale inhibitors against zinc sulphide.3 As sphalerite and galena are much less soluble than barite it is likely that these minerals will be more difficult to control using threshold inhibitors. One commercial scale inhibitor has been tested at 300 - 400 ppm against zinc sulphide and lead sulphide using coupons in laboratory tests for3 months and the inhibitor was found to be effective.5 However, the concentration of inhibitor required was considerably higher than the concentrations used against barium sulphate and calcium carbonate scales. Several works have described the inhibition of sulphide scales. Some of the work carried out has been done in the laboratory, but most has been conducted as field trials. Emmons and Chesnut6 have described the use of a hydroxyethylacrylate/acrylate co-polymer at a concentration of4 - 10 ppm active against zinc sulphide scale. The application of this co-polymer increased the pump life from ~ 21 days to over 4-6 months.
Kaplan7 has described the use of a combined scale inhibitor (for calcium carbonate)/alkyldiphenyl ether sulphonate dispersant (for zinc sulphide) in two wells with a 2 ppm zinc concentration in the produced water. After application of the
3
combined scale inhibitor/dispersant the zinc concentration increased and this well then operated for over 9 months without failure, whereas before the use of this inhibitor/dispersant the well was failing every month or less.
Jordan et al2 have found that a low molecular weight polymer has inhibited zinc sulphide and lead sulphide found in high salinity brines in the Gulf of Mexico and both the UK and Norwegian sectors of the North Sea, with no adverse effect on the performance of the sulphate and carbonate scale inhibitor. Like Przybylinski,5 Collins and Jordan3 have shown results with conventional sulphate and carbonate scale inhibitors against zinc sulphide as well as 2 commercial chelating agents. The polymers AMPS/A A, PHOS/MA, PM A/AMPS and PAA2 and the phosphonate DTPMP were effective against zinc sulphide scale by threshold scale inhibition at sub-stoichiometric concentrations and therefore were not preventing sulphide scale by chelating the dissolved zinc. The phosphonate species HEDP and ATMP were likely to be working as chelating agents and TEAPE failed to inhibit zinc sulphide. These workers3 also tested the chelating agents Na4EDTA and Na5EDTA which provided 60 - 70% chelation of Zn2+ at a molar ratio of 1:1 chelatant:Zn2+.
A low molecular weight polymer was applied in the field at a concentration of 25-30 ppm and has controlled the build up of zinc sulphide and dissolved some of it. The pH was about 5.8 and therefore the dissolution of zinc sulphide was not due to the inhibitor acting as an acid wash. Although the concentration was higher than for conventional scale inhibitors this may be more cost effective than allowing scale to build up and then having to remove it.3
Lopez et al4 have laboratory tested and field trialed a propriety polymeric scale inhibitor using downhole capillary injection.
In addition to the above, Stalker et al9 showed how the influence of small concentrations of dissolved iron (10 ppm Fe(II)) in a mild carbonate scaling regime led to a dramatic reduction in the performance of a range of carbonate scale inhibitors when tested under fully anaerobic conditions in dynamic tube blocking type tests. The results from this work indicated that rather than exhibiting a “poisoning” effect on the scale inhibitors, the dissolved iron was resulting in a change in the type of scale formed from calcium carbonate towards iron carbonate - a scale which was not readily inhibited by the chemicals being examined. Further to this, Simpson et al.12 examined the performance of several scale inhibitor species against carbonate scale in a system containing dissolved iron at concentrations up to 2,000mg/l (Fe(II) = 0, 200 and 2,000mg/l) again using fully anaerobic dynamic tube blocking tests. This work demonstrated that a range of chemicals performed effectively against calcium carbonate scale even in the presence of 2,000mg/l of Fe(II). In addition only selected products where also shown to be effective against iron carbonate.
Laboratory Procedures to Determine Sulphide Scale InhibitionCollins and Jordan3 conducted laboratory tests to determine the relative performances of sulphide scale inhibitors and chelating agents by adapting the standard sulphate scaling bottle test.8 They added various concentrations of sulphide scale inhibitors and chelating agents to a sodium chloride brine with the potential to scale 37 mg/L of zinc sulphide. They then measured the zinc ions in solution and compared them to the zinc concentration in blank and base brine composition samples and determined the
4

percentage of inhibition relative to the sulphide inhibitor composition. Kaplan7 adopted a similar technique in his sulphide inhibitor tests as he mixed zinc chloride with sodium sulphate in brine. He then filtered the solution and analysed the filtrate for zinc concentration by ICP. Kaplan7 then used a different procedure to determine whether pre-formed zinc sulphide would settle out of solution after the addition of a dispersant. In this second procedure a brine containing zinc sulphate and dispersant was stirred and then allowed to settle. After an hour the turbidity of the brine was measured.
Przybylinski5,11 describes in detail the meticulous test procedure to exclude oxygen from iron sulphide scaling tests. This procedure was essential to prevent the Fe2+ oxidising to Fe3+ before it had a chance to form iron sulphide. Such meticulous testing would also be required to investigate zinc sulphide and lead sulphide scaling, so as not to oxidise the oxygen sensitive salts. Lopez et al.4 have described similar rigorous maintenance of anaerobic conditions in tube blocking tests. They made up cation and anion brines of non-oxidising salts and then sparged these brines with nitrogen for several hours until the oxygen concentration was less than 0.050 ppm. Ascorbic acid was added as an oxygen scavenger and the oxygen sensitive salts were added to the brines in an anaerobic environment, which was maintained for the duration of the test.
Przybylinski5 relied on visual determination of iron sulphide formation as ferrous sulphide is black. This would be harder for zinc and lead sulphide, although Jordan et al.1 have described a fluid turbidity method to evaluate the amount and size of suspended scale solids by measuring light (450nm) transmitted through fluid samples containing different levels of scale inhibitor to screen inhibitor performance. Kaplan7 also used turbidity measurements when determining the ability of chemicals to disperse zinc sulphide scale. After laboratory inhibition tests it is also imperative to include tests to confirm that the scale formed in the laboratory is comparative with the scale found in the field.
Types of scale formation - field & lab: In many field examples which lead to the formation of more exotic scales a range of different scales may be oversaturated at given conditions. Given that a range of scales that may occur under “representative” conditions, and the limitations of model calculations to accurately predict the formation of these “more exotic” oilfield precipitates (discussed below), it is imperative to ensure that scale formed in the laboratory is representative of the type of scale found in the field9, prior to chemical performance or optimization studies. This was also demonstrated in previous works examining chemical selection for carbonate scales in the presence of dissolved iron, where the precise nature of the scale formed within the laboratory tests (viz: calcium carbonate, iron carbonate or mixed Fe/Ca carbonate scales) could be changed by relatively small changes in the test parameters. This then led to significant differences in the relative performance of the different chemicals as a result of the changing nature of the scale forming within the laboratory tests.9,12
SCALE PREDICTION AND EXPERIMENTAL PROCEDURES
5

Scale PredictionPredictive modeling tests were undertaken to determine the scaling potential of the formation brine towards lead sulphide and zinc sulphide scale at 90oC, 125oC, 190oC using the composition in Table 1 and from these results the laboratory test temperature was determined. Furthermore, to ensure the scale formed under the chosen test conditions would be comparable to that observed in the field, another series of tests was conducted varying the lead, zinc and bisulphide ion concentrations within the brine composition. The supplied solids analysis of the scale produced in the field showed a 5: 3:1.3:0.4 ratio of lead sulphide: zinc sulphide: calcium carbonate: iron sulphide. A second analysis however indicated that the scale deposit contained approx. 85% PbS.
Table 1 Brine compositionIon Composition
(PPm)Sodium 76865.4Calcium 16651.1Magnesium 2830.2Potassium 7075.5Barium 3679.26Strontium 100Lead 300Zinc 300Iron 528Sulphate 0Sulphide 0.8Bicarbonate 160Acetate 65
Table 2 presents the scale prediction for this field and indicates that as the temperature increases (300 ppm lead and zinc) the scaling tendency of lead and zinc sulphide decreases and lead sulphide rather than zinc sulphide will precipitate (at 90°C and 125°C). At the highest temperature calcium carbonate will preferentially form (highest scaling index) in the absence of lead and zinc sulphide. As the concentration of zinc increases the scaling tendency of zinc sulphide increases and the scaling potential of lead sulphide and calcium carbonate remain (more or less) constant. At 300 ppm and 500 ppm zinc the predominant scale formation is calcium carbonate with some lead sulphide formation (and no zinc sulphide) when examined in terms of the mass of scale which is predicted to form at equilibrium (mg/l in Table 2). At this brine mixture however the saturation index, SI, for PbS and ZnS are equivalent to ~13 - 14 with CaCO3 at ~ 4.3. Pb/ZnS would therefore be predicted to form more readily than CaCO3. The slightly higher saturation index for PbS over ZnS means that the model predicts precipitation of PbS over ZnS. At higher concentration of zinc (750 ppm and 1000 ppm) the scaling index for ZnS increases over that of PbS and therefore the model indicates that ZnS would form in preference to PbS. At reduced lead concentrations of 200 ppm and 250 ppm and 300ppm Zn, lead sulphide is again shown to form preferentially to zinc sulphide. However, as the zinc concentration is increased to 500 ppm, zinc sulphide is shown to preferentially form instead of lead sulphide due to its higher supersaturation. Therefore, under these test conditions either lead sulphide or zinc sulphide will form but not both. None of the brine compositions predicted the ratio
6
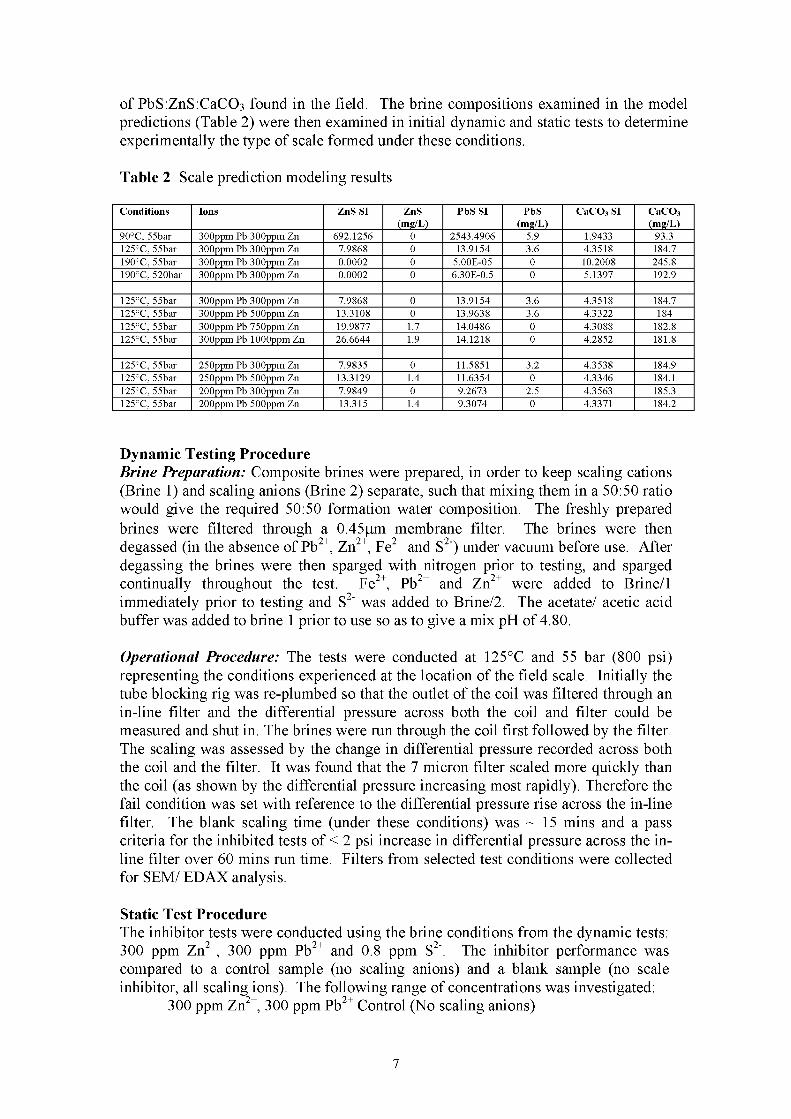
of PbS:ZnS:CaCO3 found in the field. The brine compositions examined in the model predictions (Table 2) were then examined in initial dynamic and static tests to determine experimentally the type of scale formed under these conditions.
Table 2 Scale prediction modeling results
Conditions Ions ZnS SI ZnS(mg/L)
PbS SI PbS(mg/L)
CaCO SI CaCO3(mg/L)
90°C, 55bar 300ppm Pb 300ppm Zn 692.1256 0 2543.4906 5.9 1.9433 93.3125°C, 55bar 300ppm Pb 300ppm Zn 7.9868 0 13.9154 3.6 4.3518 184.7190°C, 55bar 300ppm Pb 300ppm Zn 0.0002 0 5.00E-05 0 10.2008 245.8190°C, 520bar 300ppm Pb 300ppm Zn 0.0002 0 6.30E-0.5 0 5.1397 192.9125°C, 55bar 300ppm Pb 300ppm Zn 7.9868 0 13.9154 3.6 4.3518 184.7125°C, 55bar 300ppm Pb 500ppm Zn 13.3108 0 13.9638 3.6 4.3322 184125°C, 55bar 300ppm Pb 750ppm Zn 19.9877 1.7 14.0486 0 4.3088 182.8125°C, 55bar 300ppm Pb 1000ppm Zn 26.6644 1.9 14.1218 0 4.2852 181.8125°C, 55bar 250ppm Pb 300ppm Zn 7.9835 0 11.5851 3.2 4.3538 184.9125°C, 55bar 250ppm Pb 500ppm Zn 13.3129 1.4 11.6354 0 4.3346 184.1125°C, 55bar 200ppm Pb 300ppm Zn 7.9849 0 9.2673 2.5 4.3563 185.3125°C, 55bar 200ppm Pb 500ppm Zn 13.315 1.4 9.3074 0 4.3371 184.2
Dynamic Testing ProcedureBrine Preparation: Composite brines were prepared, in order to keep scaling cations (Brine 1) and scaling anions (Brine 2) separate, such that mixing them in a 50:50 ratio would give the required 50:50 formation water composition. The freshly prepared brines were filtered through a 0.45pm membrane filter. The brines were then degassed (in the absence of Pb2+, Zn2+, Fe2+ and S2-) under vacuum before use. After degassing the brines were then sparged with nitrogen prior to testing, and sparged continually throughout the test. Fe2+, Pb2+ and Zn2+ were added to Brine/1 immediately prior to testing and S2- was added to Brine/2. The acetate/ acetic acid buffer was added to brine 1 prior to use so as to give a mix pH of 4.80.
Operational Procedure: The tests were conducted at 125°C and 55 bar (800 psi) representing the conditions experienced at the location of the field scale. Initially the tube blocking rig was re-plumbed so that the outlet of the coil was filtered through an in-line filter and the differential pressure across both the coil and filter could be measured and shut in. The brines were run through the coil first followed by the filter. The scaling was assessed by the change in differential pressure recorded across both the coil and the filter. It was found that the 7 micron filter scaled more quickly than the coil (as shown by the differential pressure increasing most rapidly). Therefore the fail condition was set with reference to the differential pressure rise across the in-line filter. The blank scaling time (under these conditions) was ~ 15 mins and a pass criteria for the inhibited tests of < 2 psi increase in differential pressure across the inline filter over 60 mins run time. Filters from selected test conditions were collected for SEM/ EDAX analysis.
Static Test ProcedureThe inhibitor tests were conducted using the brine conditions from the dynamic tests: 300 ppm Zn2+, 300 ppm Pb2+ and 0.8 ppm S2-. The inhibitor performance was compared to a control sample (no scaling anions) and a blank sample (no scale inhibitor, all scaling ions). The following range of concentrations was investigated:
300 ppm Zn2+, 300 ppm Pb2+ Control (No scaling anions)
7
300 ppm Zn2+, 300 ppm Pb2+ and 0.8 ppm S2- Blank (no scale inhibitor)10 ppm SI + 300 ppm Zn2+, 300 ppm Pb2+ and 0.8 ppm S2- 50 ppm SI + 300 ppm Zn2+, 300 ppm Pb2+ and 0.8 ppm S2- 100 ppm SI + 300 ppm Zn2+, 300 ppm Pb2+ and 0.8 ppm S2- 200 ppm SI + 300 ppm Zn2+, 300 ppm Pb2+ and 0.8 ppm S2-
The following measurements were made to elucidate the scale inhibitor performance:1) visual observations (including digital images), 2) % transmittance (UV spectrophotometer X = 450 nm), 3) samples of test solution taken and quenched in 5% nitric acid and analysed by ICP and 4) warm filtering of the static solutions and SEM analysis of the collected filtrate.
Anaerobic Procedure: The formation brine (Table 1) was prepared so that the scaling ions were separated into two brines and the brines were filtered through 0.45pm membrane filters. The inhibitor solution and bicarbonate was added to brine 2 (scaling anion brine) and the Pb2+, Zn2+ and acetate buffer were added into brine 1 (to give a mixed brine pH of 4.8). Both brines were then degassed separately using oxygen free nitrogen (to remove the oxygen from the solutions). Once the oxygen level was sufficiently low (< 20 ppb) the Fe2+ was added to brine 1 and the solutions heated to 90oC. When at temperature, brine 2 was added to brine 1 and the time taken as t = 0 h. After t = 2hr and t = 20hr the cells were visually inspected, photographed and sampled for assay analysis (quenched in 5% nitric acid for Zn2+ and Pb2+ analysis). The cells were also sampled and the % transmittance measured using a UV spectrophotometer (X = 450 nm). On completion of the tests the warm supernatant was decanted and the particulates accumulated in each test collected by filtration. The filters were then rinsed with methanol and dried over night. Once dry the filters were analysed by SEM/ EDAX analysis.
SEM Sample Preparation ProcedureThe filters were flushed with 10ml of methanol and allowed to dry overnight at room temperature. The filter was then fixed to a 1” diameter aluminium SEM stub using conductive carbon tape. Prior to the SEM analysis, the samples were coated with a thin layer of gold using a sputter coater, to provide a conductive pathway for the electron beam.
RESULTS AND DISCUSSION I - OPTIMISATION STUDIES (SCALE FORMATION AND IDENTIFICATION)
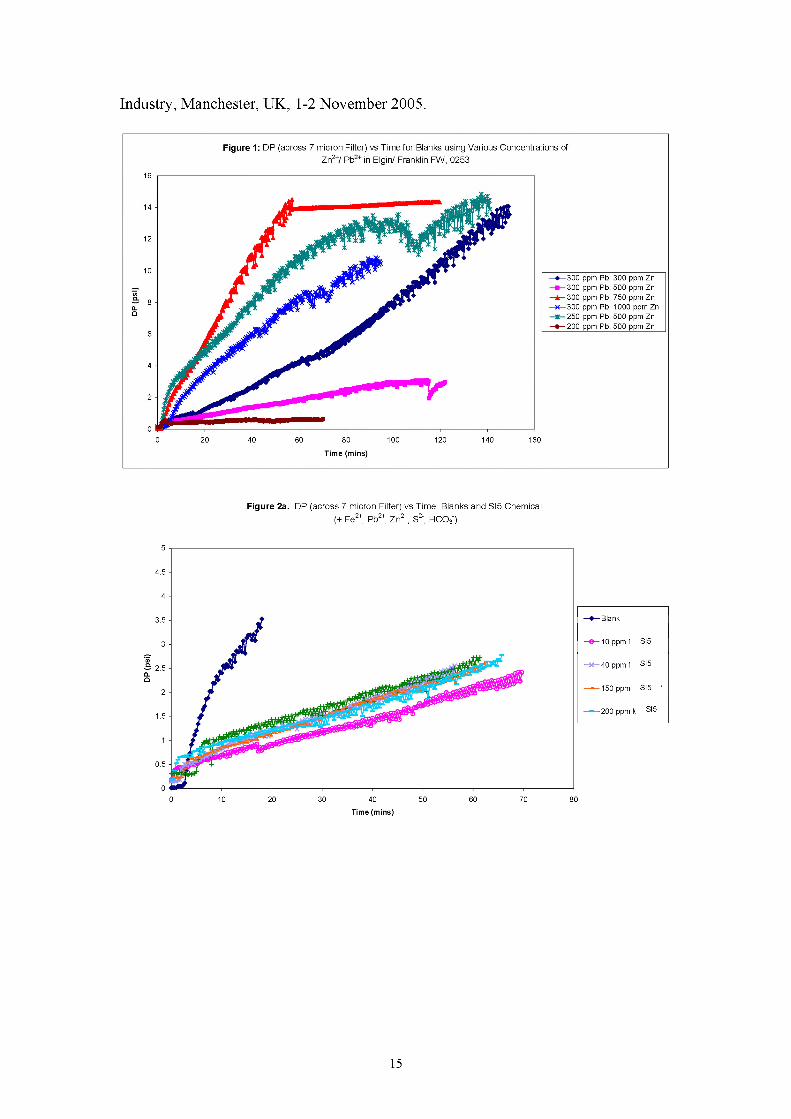
Dynamic Test OptimisationInitial dynamic tests were undertaken under fully anaerobic conditions to determine the optimal brine composition for the laboratory tests and the pressure profiles were measured across the 7 micron in-line filters (Figure 1) and coil. In-line filters were added to increase sensitivity to blocking as only the 300 ppm Pb2+, 300 ppm Zn2+ test and the 300 ppm Pb2+, 750 ppm Zn2+ test showed a nominal increase in differential pressure across the coil. The solid from the filter was sent for SEM/EDAX analyses and the scale composition was found to be entirely lead sulphide, even at high zinc concentrations and not the same as predicted using the thermodynamic model discussed above. Therefore since the predominant scale formation in the field was lead sulphide and small modifications to the brine composition did not result in a mixed Pb/ZnS scale, the original brine composition was selected to be suitable for further inhibitor
8
performance tests (Table 1).
Static Test OptimisationTo determine the amount and type of scale formed for a given brine composition, a number of brine compositions were investigated to ascertain if mixed PbS/ZnS scale formation could be obtained. The brine compositions investigated included:
• 300 ppm Zn2+, 300 ppm Pb2+ and 0.8 ppm S2- (as used in the dynamic tests)• 300 ppm Zn2+, 300 ppm Pb2+ and 10 ppm S2- (increased S concentration)• 300 ppm Zn2+, 300 ppm Pb2+ and 20 ppm S2- (increased S concentration)• 750 ppm Zn2+, 300 ppm Pb2+ and 10 ppm S2- (increased Zn / S concentration)• 300 ppm Zn2+, 300 ppm Pb2+ Control (No scaling anions)• 750 ppm Zn2+, 300 ppm Pb2+ Control (No scaling anions)
The initial blank tests were conducted to ensure: 1) the appropriate Pb/Zn sulphides were formed (various tests conditions were investigated), 2) the procedure adopted was appropriate and 3) no other scales were forming in the laboratory tests e.g. FeCO3 / CaCO3 which were not present in significant quantities in the field samples. A number of “measurements” were recorded in order to elucidate the scale formation: 1) visual observations (including digital images), 2) % transmittance (UVspectrophotometer X = 450 nm), 3) samples of test solution taken and quenched in 5% nitric acid and analysed by ICP and 4) warm filtering of the static solutions and SEM analysis of the collected filtrate.
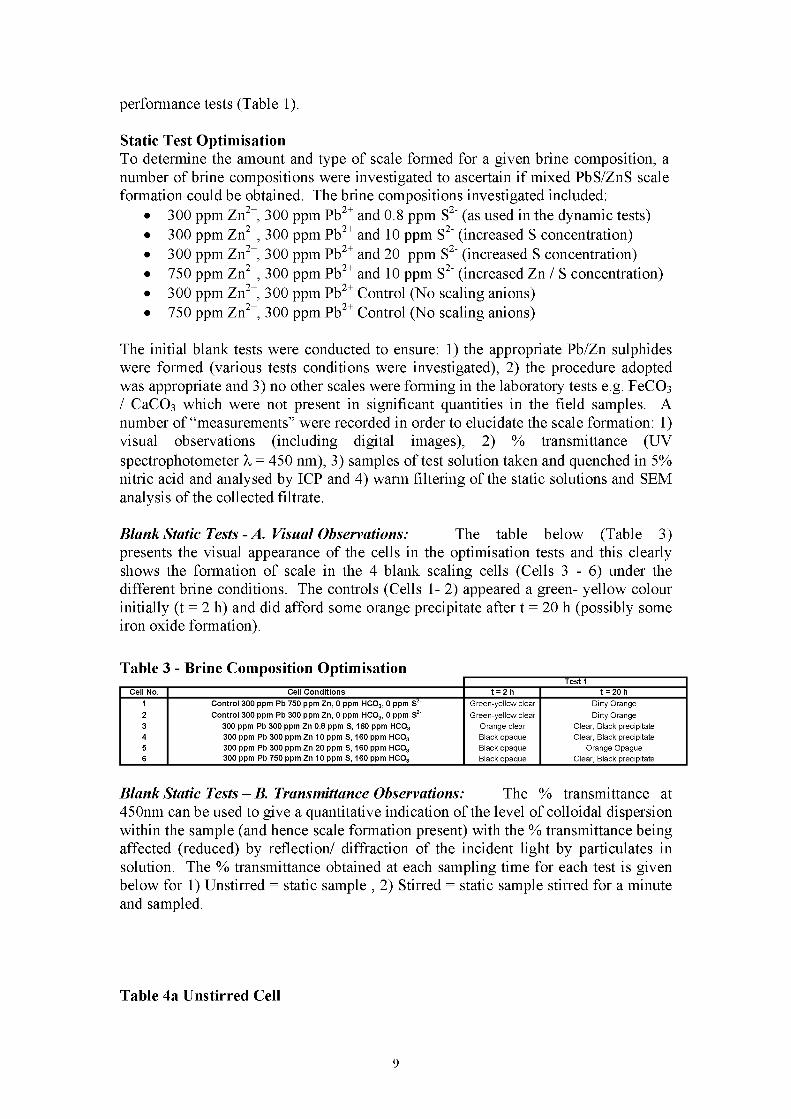
Blank Static Tests - A. Visual Observations: The table below (Table 3)presents the visual appearance of the cells in the optimisation tests and this clearly shows the formation of scale in the 4 blank scaling cells (Cells 3 - 6) under the different brine conditions. The controls (Cells 1- 2) appeared a green- yellow colour initially (t = 2 h) and did afford some orange precipitate after t = 20 h (possibly some iron oxide formation).
Table 3 - Brine Composition OptimisationTest 1
Cell No. Cell Conditions t = 2 h t = 20 h
1 Control 300 ppm Pb 750 ppm Zn, 0 ppm HCO3, 0 ppm S2- Green-yellow clear Dirty Orange
2 Control 300 ppm Pb 300 ppm Zn, 0 ppm HCO3, 0 ppm S2- Green-yellow clear Dirty Orange
3 300 ppm Pb 300 ppm Zn 0.8 ppm S, 160 ppm HCO3 Orange clear Clear, Black precipitate
4 300 ppm Pb 300 ppm Zn 10 ppm S, 160 ppm HCO3 Black opaque Clear, Black precipitate
5 300 ppm Pb 300 ppm Zn 20 ppm S, 160 ppm HCO3 Black opaque Orange Opague
6 300 ppm Pb 750 ppm Zn 10 ppm S, 160 ppm HCO3 Black opaque Clear, Black precipitate
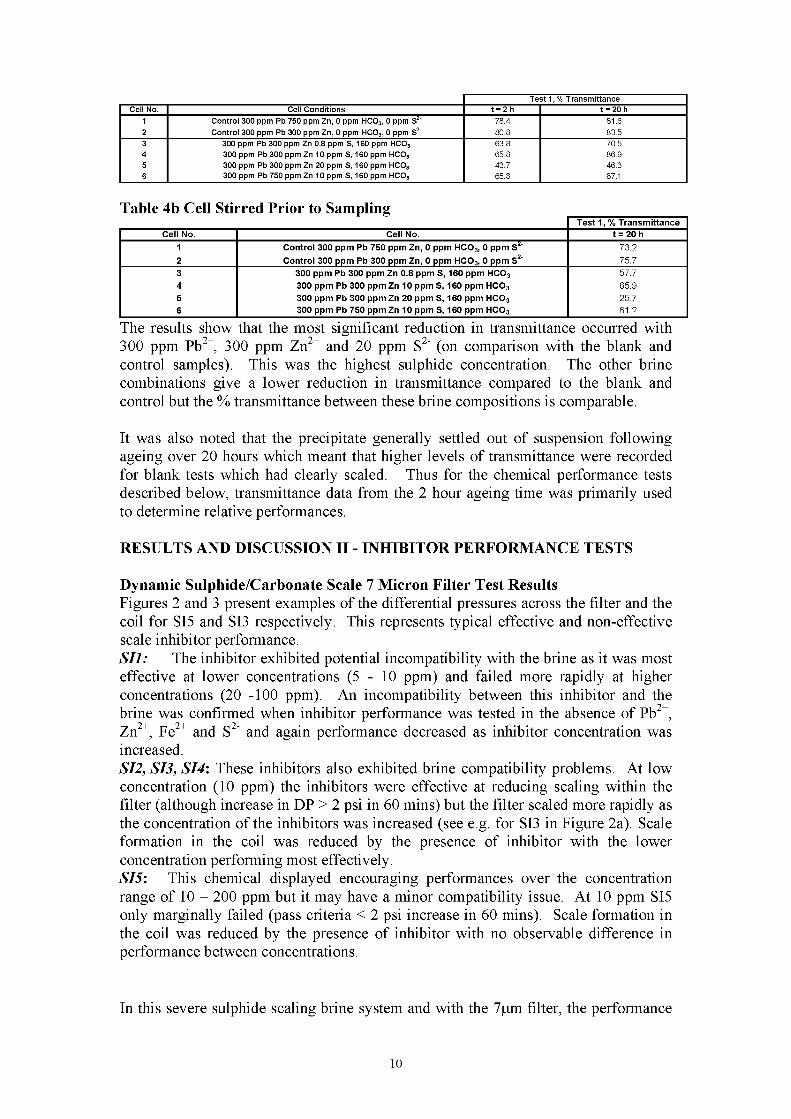
Blank Static Tests - B. Transmittance Observations: The % transmittance at450nm can be used to give a quantitative indication of the level of colloidal dispersion within the sample (and hence scale formation present) with the % transmittance being affected (reduced) by reflection/ diffraction of the incident light by particulates in solution. The % transmittance obtained at each sampling time for each test is given below for 1) Unstirred = static sample , 2) Stirred = static sample stirred for a minute and sampled.
Table 4a Unstirred Cell
9
Test 1, % Transmittance
Cell No. Cell Conditions t = 2 h t = 20 h
1 Control 300 ppm Pb 750 ppm Zn, 0 ppm HCO3, 0 ppm S2- 78.4 81.6
2 Control 300 ppm Pb 300 ppm Zn, 0 ppm HCO3, 0 ppm S2- 80.8 83.5
3 300 ppm Pb 300 ppm Zn 0.8 ppm S, 160 ppm HCO3 63.8 70.5
4 300 ppm Pb 300 ppm Zn 10 ppm S, 160 ppm HCO3 65.8 86.9
5 300 ppm Pb 300 ppm Zn 20 ppm S, 160 ppm HCO3 43.7 46.3
6 300 ppm Pb 750 ppm Zn 10 ppm S, 160 ppm HCO3 65.3 87.1
Table 4b Cell Stirred Prior to SamplingTest 1, % Transmittance
Cell No. Cell No. t = 20 h1 Control 300 ppm Pb 750 ppm Zn, 0 ppm HCO3, 0 ppm S2- 73.22 Control 300 ppm Pb 300 ppm Zn, 0 ppm HCO3, 0 ppm S2- 75.73 300 ppm Pb 300 ppm Zn 0.8 ppm S, 160 ppm HCO3 57.74 300 ppm Pb 300 ppm Zn 10 ppm S, 160 ppm HCO3 65.95 300 ppm Pb 300 ppm Zn 20 ppm S, 160 ppm HCO3 25.76 300 ppm Pb 750 ppm Zn 10 ppm S, 160 ppm HCO3 61.2
The results show that the most significant reduction in transmittance occurred with 300 ppm Pb2+, 300 ppm Zn2+ and 20 ppm S2- (on comparison with the blank and control samples). This was the highest sulphide concentration. The other brine combinations give a lower reduction in transmittance compared to the blank and control but the % transmittance between these brine compositions is comparable.
It was also noted that the precipitate generally settled out of suspension following ageing over 20 hours which meant that higher levels of transmittance were recorded for blank tests which had clearly scaled. Thus for the chemical performance tests described below, transmittance data from the 2 hour ageing time was primarily used to determine relative performances.
RESULTS AND DISCUSSION II - INHIBITOR PERFORMANCE TESTS
Dynamic Sulphide/Carbonate Scale 7 Micron Filter Test ResultsFigures 2 and 3 present examples of the differential pressures across the filter and the coil for SI5 and SI3 respectively. This represents typical effective and non-effective scale inhibitor performance.SI1: The inhibitor exhibited potential incompatibility with the brine as it was mosteffective at lower concentrations (5 - 10 ppm) and failed more rapidly at higher concentrations (20 -100 ppm). An incompatibility between this inhibitor and the brine was confirmed when inhibitor performance was tested in the absence of Pb2+, Zn2+, Fe2+ and S2- and again performance decreased as inhibitor concentration was increased.SI2, SI3, SI4: These inhibitors also exhibited brine compatibility problems. At low concentration (10 ppm) the inhibitors were effective at reducing scaling within the filter (although increase in DP > 2 psi in 60 mins) but the filter scaled more rapidly as the concentration of the inhibitors was increased (see e.g. for SI3 in Figure 2a). Scale formation in the coil was reduced by the presence of inhibitor with the lower concentration performing most effectively.SI5: This chemical displayed encouraging performances over the concentration range of 10 - 200 ppm but it may have a minor compatibility issue. At 10 ppm SI5 only marginally failed (pass criteria < 2 psi increase in 60 mins). Scale formation in the coil was reduced by the presence of inhibitor with no observable difference in performance between concentrations.
In this severe sulphide scaling brine system and with the 7pm filter, the performance
10
of the different scale inhibitors examined to date can be ranked as follows, where “>” indicates “has better performance than”:
SI5 > SI4 ~ SI2 ~ SI3 ~ SI1
SI5, showed partial performance at much lower levels (5 - 10 ppm) but much reduced apparent performance (faster blocking times) at elevated concentrations. Further tests were therefore progressed to examine compatibility issues and the impact of the mild in- situ compatibility observed in more detail for products SI1 - SI5 in more details prior to final chemical selection and field application. These additional investigations are however outwith the scope of this paper.
SEM/ EDAX Analyses of 7 Micron FiltersThe SEM/EDAX analysis for scale collected from the 7 micron filters showed that all the inhibitors prevented the formation of calcium carbonate. No zinc sulphide was observed to form in the blank scaling tests and all the inhibitors tested did not completely prevent the formation of lead sulphide scale. All the inhibitors (except SI3) showed the possible precipitation of the scale inhibitor by EDAX analysis of the filters. Other observations include:
• a high abundance of mineral scale was collected during dynamic tests involving all the inhibitors although some was lost during the dismounting of the test filter
• lead sulphide mineral scale formation alone was observed during dynamic tests involving inhibitors SI2, SI3 and SI4
• a mixture of lead sulphide, zinc sulphide, lead chloride and iron containing mineral scale was collected during dynamic tests involving inhibitor SI5
An example of a SEM/EDAX analysis is given in Figure 4.
Static Test ResultsA. Visual Observations: Table 5 below summarizes the visual observations recorded at the sampling times of t = 2hr and t = 20hr. The samples had the following appearance initially:
511 - solution was a cloudy yellow/ brown colour for all concentrations512 - solution was a clear brown colour (0ppm), clear, dirty yellow colour with no
indication of scale (10 & 50ppm), clear, dirty yellow colour with some scale (100ppm) and clear dirty brown colour (200ppm)
513 - solution was a clear golden orange/ yellow colour (0 - 50ppm) and cloudy golden orange/ yellow colour (100 & 200 ppm)
514 - solution was clear brown with the formation of some black precipitate (0ppm), clear, golden colour with a black precipitate (10ppm), clear golden colour with no precipitate (100 & 200ppm)
515 - solution was a golden colour and clear with no indication of scale for all concentrationsFigures 5 and 6 show the appearance of the cells with SI5 and SI3 respectively.
Table 5 Visual Observations from Static Tests - All brines with 300 ppm Pb2+ and 300 ppm Zn2+___________ _______________________ _______________________Cell Conditions t = 2hrs t = 20hrsControl 0ppm HCO3-, 0ppmS2- Pale yellow, a little cloudy, little ppt Yellow clearBlank 0ppm HCO3-, 0.8ppmS2- Yellowy brown, a little cloudy Brown clear, black/brown ppt0.8ppmS2-, 160ppm HCO3-, 10ppm SI1 Yellow brown, less cloudy than blank Yellowy brown, opaque little ppt0.8ppmS2-, 160ppm HCO3-, 50ppm SI1 Yellow brown, little more cloudy than Yellowy brown, opaque, cloudier than
11

blank blank ppt0.8ppmS2-, 160ppm HCO3-, 100ppm SI1 Yellow brown, little more cloudy than
50 ppmYellowy brown, opaque, cloudier than 50ppm, ppt
0.8ppmS2-, 160ppm HCO3-, 200ppm SI1 Yellow brown, little more cloudy than 100 ppm
Yellowy brown, opaque, cloudier than 100ppm, ppt
Control 0ppm HCO3-, 0ppmS2- Pale yellow, clear OrangeBlank 0ppm HCO3-, 0.8ppmS2- Dirty brown, clear Brown, black/brown ppt0.8ppmS2-, 160ppm HCO3-, 10ppm SI2 Dirty yellow, clear Yellow, cloudy0.8ppmS2-, 160ppm HCO3-, 50ppm SI2 Dirty yellow, clear Dirty brown yellow, cloudy0.8ppmS2-, 160ppm HCO3-, 100ppm SI2 Dirty brown/yellow, little ppt Dirty brown yellow, cloudy0.8ppmS2-, 160ppm HCO3-, 200ppm SI2 Dirty brown, clear Dirty brown yellow, more cloudy than
50 & 100 ppm
Control 0ppm HCO3-, 0ppmS2- Pale yellow Yellow/orange cloudy orange/yellow ppt
Blank 0ppm HCO3-, 0.8ppmS2- Golden pale orange/yellow, clear Clear brown dark/black ppt0.8ppmS2-, 160ppm HCO3-, 10ppm SI3 Golden pale orange/yellow, clear Orange brown cloudy little brown ppt0.8ppmS2-, 160ppm HCO3-, 50ppm SI3 Golden pale orange/yellow, clear Orange/brown cloudy0.8ppmS2-, 160ppm HCO3-, 100ppm SI3 Golden pale orange/yellow, slightly
cloudyOrange/brown opaque a lot of black/brown ppt
0.8ppmS2-, 160ppm HCO3-, 200ppm SI3 Golden pale orange/yellow, slightly cloudier than 100ppm
Orange/brown opaque, less black/brown ppt than 100ppm
Control (distilled water) 0ppm HCO3-, 0ppmS2-
Yellow clear Yellow, clearControl (brine 2) 0ppm HCO3-, 0ppmS2- Yellow clear Yellow, clear, orange pptBlank 0ppm HCO3-, 0.8ppmS2- Brown, clear, black ppt Brown, clear, black ppt0.8ppmS2-, 160ppm HCO3-, 10ppm SI4 Golden. clear, little black ppt Browny yellow, black/brown ppt0.8ppmS2-, 160ppm HCO3-, 100ppm SI4 Golden, clear Golden yellow, clear0.8ppmS2-, 160ppm HCO3-, 200ppm SI4 Golden, clear Golden yellow, clear
Control 0ppm HCO3-, 0ppmS2- Yellow, clear Yellow, clear, yellow pptBlank 0ppm HCO3-, 0.8ppmS2- Golden, clear Brown opaque, dark ppt0.8ppmS2-, 160ppm HCO3-, 10ppm SI5 Golden, clear Clear, brown/black ppt0.8ppmS2-, 160ppm HCO3-, 50ppm SI5 Golden, clear Golden, clear, brown/black ppt0.8ppmS2-, 160ppm HCO3-, 100ppm SI5 Golden, clear Golden, clear, brown/black ppt0.8ppmS2-, 160ppm HCO3-, 200ppm SI5 Golden, clear Golden, clear, brown/black ppt
These results indicate that the performance of SI4 and SI1 increased as the inhibitor concentration increased, but incompatibility of inhibitor with the brine was observed for SI1, SI2, SI3 and SI5. In this sulphide/carbonate scaling brine system, the performance of the different scale inhibitors examined can be ranked as follows, where “>” indicates “has better performance (lower MIC) than”:
SI2 ~ (SI1*) > SI3 ~ SI4 >> SI5 * although mild incompatibility issue in test brines (see also dynamic tests above)
Transmittance Observations: The % Transmittance obtained at each sampling time for each test with 300 ppm Pb2+ and 300 ppm Zn2+ in the brine is given in Table 6.
Table 6 % TransmittanceCell Conditions % Transmittance t = 2hrs % Transmittance t = 20hrsControl 0ppm HCO3-, 0ppmS2- 70.1 67.3Blank 0ppm HCO3-, 0.8ppmS2- 45 53.20.8ppmS2-, 160ppm HCO3-, 10ppm SI1 52.8 37.80.8ppmS2-, 160ppm HCO3-, 50ppm SI1 44.2 34.30.8ppmS2-, 160ppm HCO3-, 100ppm SI1 38.2 27.50.8ppmS2-, 160ppm HCO3-, 200ppm SI1 25 27.8
Control 0ppm HCO3-, 0ppmS2- 65.4 29.5Blank 0ppm HCO3-, 0.8ppmS2- 36.5 290.8ppmS2-, 160ppm HCO3-, 10ppm SI2 48 22.20.8ppmS2-, 160ppm HCO3-, 50ppm SI2 40.3 19.55
12
0.8ppmS2-, 160ppm HCO3-, 100ppm SI2 30.6 12.60.8ppmS2-, 160ppm HCO3-, 200ppm SI2 26 16.5
Control 0ppm HCO3-, 0ppmS2- 66.4 71.2Blank 0ppm HCO3-, 0.8ppmS2- 43 72.20.8ppmS2-, 160ppm HCO3-, 10ppm SI3 40.7 44.50.8ppmS2-, 160ppm HCO3-, 50ppm SI3 46.4 41.20.8ppmS2-, 160ppm HCO3-, 100ppm SI3 37.5 310.8ppmS2-, 160ppm HCO3-, 200ppm SI3 41 47.7
Control (distilled water) 0ppm HCO3-, 0ppmS2- 68.5 66.9Control (brine 2) 0ppm HCO3-, 0ppmS2- 63.6 64.8Blank 0ppm HCO3-, 0.8ppmS2- 36.5 50.90.8ppmS2-, 160ppm HCO3-, 10ppm SI4 47.1 410.8ppmS2-, 160ppm HCO3-, 100ppm SI4 62.5 50.60.8ppmS2-, 160ppm HCO3-, 200ppm SI4 56.4 49
Control 0ppm HCO3-, 0ppmS2- 76.6Blank 0ppm HCO3-, 0.8ppmS2- 46.30.8ppmS2-, 160ppm HCO3-, 10ppm SI5 76.70.8ppmS2-, 160ppm HCO3-, 50ppm SI5 63.10.8ppmS2-, 160ppm HCO3-, 100ppm SI5 650.8ppmS2-, 160ppm HCO3-, 200ppm SI5 61.6
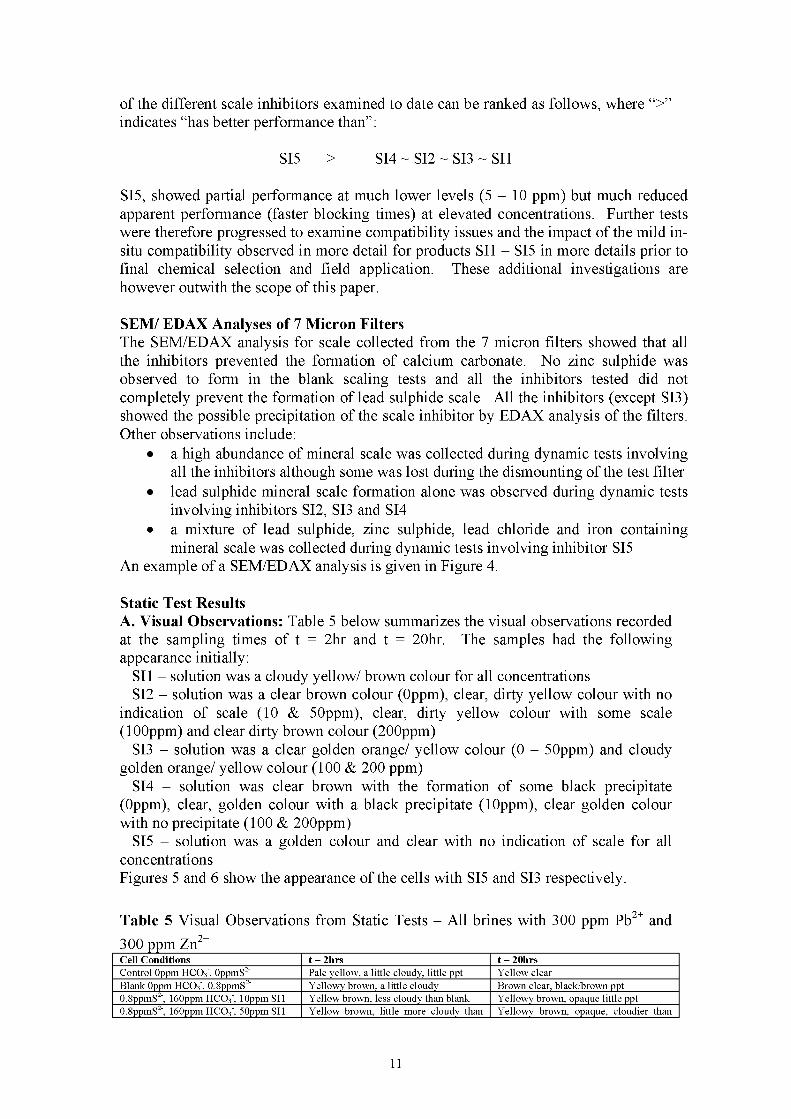
The results from Table 6 indicate that both SI5 and SI1 exhibited greater efficiency at low concentration and there may have been incompatibility of the inhibitor and brine at higher concentration. SI3 performed consistently poorly at all concentrations and although SI2 performed better at lower concentrations after 2 hrs, it performed poorly compared to the blank after 20 hrs. SI4 performed better as the inhibitor concentration increased, SI4 had the best performance at 100 ppm. The transmittance data is only useful when good compatibility is observed between the chemical and the brine condition being tested. In circumstances when there is an incompatibility issue the visual assessment is most useful. In addition and as discussed above, transmittance data is only effective when the scale particles remain as small particles in suspension. At longer residence times (20 hours) the scale was observed to drop out of suspension for blank tests resulting in much higher transmittance values that for some of the inhibited tests where the particles remained in suspension. Transmittance data was therefore only analysed at 2 hours for the purposes of chemical performance ranking.
CONCLUSIONSThis study has indicated that the more exotic sulphide scales can be formed in the laboratory, however reproducing the ratio of Pb:Zn sulphide as found in the field was not possible, with the lead sulphide forming preferentially to the zinc sulphide. This emphasizes the importance of accurate field brine compositions, which is a key issue for further studies.The performance of scale inhibitors for the laboratory formed sulphide scale can be tested under fully anaerobic conditions by a number of different tests. The work has also identified limitations with current thermodynamic modeling packages for these more exotic scales especially when several different scale types can be formed and illustrates the need to assess the nature of the scale formed under laboratory test conditions. The work therefore identifies the importance of ensuring that the scale formed under laboratory test conditions is representative of that formed in the field.
13

In summary a combination of predictive modeling (thermodynamic modeling) coupled with dynamic and static fully anaerobic scale formation tests have been conducted in order to optimize the test conditions to ensure that scale formation is as field representative as possible. The work has then progressed to select the most appropriate scale inhibitor for field application and has shown the effectiveness of a range of different scale inhibitors against lead sulphides. However, performance of these inhibitors appears only partially effective at lower inhibitor concentrations.
References1. Jordan M. M., Mackin K., Johnston C. J. and Feasey N. D.: “Control of Hydrogen Sulphide Scavenger Induced Scale and the Associated Challenge of Sulphide Scale Formation Within a North Sea High Temperature/High Salinity Fields Production Wells. Laboratory Evaluation to Field Application,” SPE87433 presented at the 6th International Symposium on Oilfield Scale, Aberdeen, UK, 26-27 May 2004.2. Jordan M. M., Sjursaether K., Edgerton M. C. and Bruce R.: “Inhibition of Lead and Zinc Sulphide Scale Deposits Formed During Production From High Temperature Oil and Condensate Reservoirs,” SPE64427 presented at the SPE Asia Pacific Oil and Gas Conference and Exhibition, Brisbane, Australia, 16 - 18 October 2000.3. Collins I. R. and Jordan M. M.: “Occurrence, prediction and prevention of Zinc Sulphide Scale Within Gulf Coast and North Sea High Temperature/High Salinity Production Wells,” SPE 68317 presented at the 3rd International Symposium on Oilfield Scale, Aberdeen, UK, 30-31 January 2001.4. Lopez T. H., Yuan M., Williamson D. A. and Przybylinski J. L.: “Comparing Efficacy of Scale Inhibitors for Inhibition of Zinc Sulphide and Lead Sulphide Scales,” SPE95097 presented at the 7th International Symposium on Oilfield Scale, Aberdeen, UK, 11 - 12 May 2005.5. Przybylinski J. L.: “Iron Sulphide Scale Deposit Formation and Prevention Under Anaerobic Conditions Typically Found in the Oil Field,” SPE65030 presented at the SPE International Symposium on Oilfield Chemistry, Houston, Texas, 13-16 February 2001.6. Emmons D. and Chesnut G. R.: “Hydroxyethylacrylate/Acrylate Copolymers as Zinc Sulphide Scale Inhibitors,” United States Patent 4,762,626, 9th August 1988.7. Kaplan R. I: “Scale Deposition Inhibitor,” United States Patent 5,171,459, 25th December 1992.8. Graham G. M., Jordan M. M. and Sorbie K. S.: “How Scale Inhibitors Work and How This Affects Test Methodology,” presented at IBC 3rd International Conference on Solving Oilfield Scaling, Aberdeen, UK, 22-23 January 1997.9. Graham G. M., Stalker, R., McIntosh, R.: “The Impact of Dissolved Iron on the Performance of Scale Inhibitors Under Carbonate Scaling Conditions”, SPE 80254, SPE International Symposium on Oilfield Chemistry, Houston Texas, USA, 5-7 February 2003.10. Nasr-El-Din H.A., Al-Humaidan A.y.: “Iron Sulfide Scale: Formation, Removal and Prevention”, SPE 68315, SPE International Symposium on Oilfield Scale, Aberdeen, 30-31 January 2001.11. Przybylinski J.L.: “Ferrsous Sulfide Solid Formation and Inhibition at Oxidation- Reduction Potentials and Scaling Indices Like Those That Occur in the Oil Filed”, SPE 80260, SPE International Symposium on Oil Field Chemistry , Houston, Texas, USA, 5 -7 February 2003.12. Johnson T., Roggelin C., Simpson C. and Stalker R.: “Phosphonate Based Scale Inhibitors for High Iron and High Salinity Environments”, RSC Chemicals in the Oil
14
Industry, Manchester, UK, 1-2 November 2005.
Figure 2a. DP (across 7 micron Filter) vs Time, Blanks and SIS Chemical, (+ Fe2+, Pb2+, Zn2+, S2', HC03)
5
4.5
4
3.5
3
2
1.5
1
0.5
0
♦ Blank
-©-10 ppm I SIS
—x—40 ppm I SIS
——150 ppm SIS '
— 200 ppm l\ SIS
Time (mins)
15

Figure 2b. DP (across coil) vs Time, Blanks and SI 5 Chemical, (+ Fe2+, Pb2+, Zn2+, S2", HC03")
Time (mins)
♦ Blank
-©-10 ppm I\ SI 5
*—40 ppm I\ SI 5
------150 ppm l\ SI 5
— 200 ppm l\ SI 5
Figure 3a. Differential Pressure Profile vs Time across the 7pm In-line Filter, T = 125°C, 50:50 Elgin/ Franklin FW, 10mL/min, SS316 L= 1000mm, P = 800 psi,
Blanks and SIS Chemical, (+ Fe2+, Pb2+, Zn2+, S2", HC03)
Blank10 ppm SIS 20 ppm SIS 50 ppm SIS 100 ppm SIS
Time (mins)
16

Figure 3b. Differential Pressure Profile vs Time across the 1000mm, 1/16" SS316 Coil, T = 125°C, 50:50 Elgin/ Franklin FW, 10mL/min, SS316 L= 1000mm, P = 800 psi,
Blanks and SIS Chemical, (+ Fe2+, Pb2*, Zn2*, S2", HC03 )
Blank10 ppm SIS 20 ppm SIS 50 ppm SIS 100 ppm SIS
-= 2.5
Time (mins)
Figure 4: SCANNING ELECTRON MICROSCOPY
Scale Formation of Brine containing 300 ppm Zn2+, 300 ppm Pb2+, 0.8 ppm S2" and 528 ppm Fe2+ + 100 ppm SI6
Figure 4 a Figure 4 b
Scanning Electron Microscopy (S.E.M.) at low magnification k (Figure 4 a) of the 7 fxm filter surface blocked in the presence of
300 ppm Zn2+ 300 ppm Pb2+, 528 ppm Fe2+, 0.8 ppm S2" and SI6 showed a high abundance of mineral scale formation which covered the entire filter surface. The higher magnification of the scale area (Figure 4 b) showed a cracked amorphous skin of Pb sulphide scale. The ED AX analysis suggested the presence of lead sulphide, calcium chloride and iron oxide. The ED .AX analysis
* -..-ft—JZi—--------- also showed the presence of phosphorous which indicated thepresence of some solid scale inihbitor material.
: ft
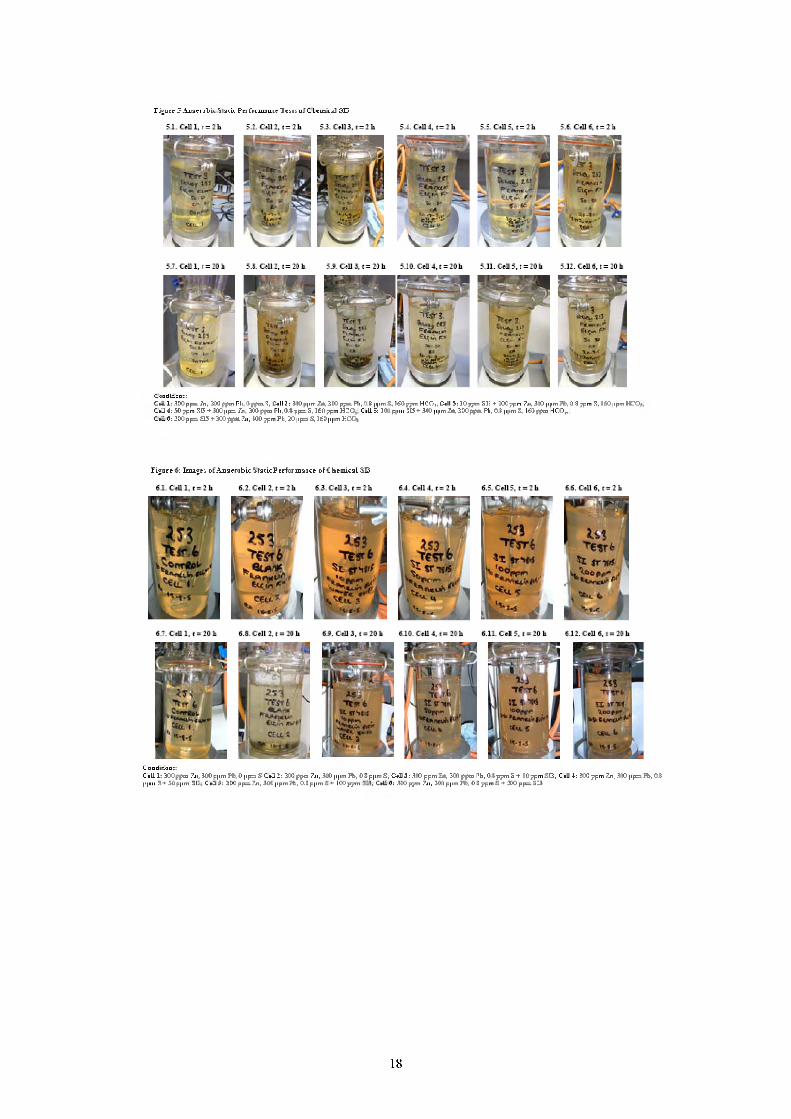
Figure 5 Anaerobic Stack Performance Tests of Chemical SI5
CaadiiMaj:Cell: 300ppm Zn, 300ppm Ph, 0ppm 3, Cell2:300ppm Zn. 300 ppm Pb, 0.1 ppm S, 160 ppm HCOt, Cell >: 10ppm SIS * 300ppm Zn, 300ppm Ffc, 0 S ppm 8,160 ppmHOO*. C#il4: 50 ppm SIS - 300 ppm Zn. 3ZC p?m Hi. C 1 ppm S. 160 ppmHCO,. Cell 5: ICO ppm 3D * 300ppm Zn. 3CZ'pp= Pb, 0.8 ppm 3.160ppm HCO,..C#*d: 300ppm SIS* 300 ppm Zn, 100 ppmPb. 30ppmS, 160ppm HCO,
Figure 5: Image:, of Anaerobic Stack Performance nf C hemkal SB
CendiiHns:Cell 1: SBpja Zn, 100 ppm Pb, D ppm £■ CeJ 2: 3Zt ppm Zn, BOD ppm Pfc, 0 S ppm S. C*U 5: 306 ppm Zn. SB ppm Pb, C 5 |^m H + DO ppm SB, Cell *: 3CC ppm Zn. 306 ppm Tfc, O.B ppn S ■+ 50 ppm SIB; CeS 5: SCO ppm Zb, .300 ppm Pfc, 0 S ppm S +• 166 ppm 313, Ceti fl: 306 ppm Zn, 3C0 ppm Pb, O S ppm S ■+ 200 pp=s 5Z1
18
Copyright © 2022 FDOKUMEN