Predicting Neonatal Perchlorate Dose and Inhibition of Iodide Uptake in the Rat during Lactation...
74
1 Predicting Neonatal Perchlorate Dose and Inhibition of Iodide Uptake in the Rat During Lactation Using Physiologically-Based Pharmacokinetic Modeling Rebecca A. Clewell 1#* , Elaine A. Merrill 1 , Kyung O. Yu. 3 , Deirdre A. Mahle 4 , Teresa R. Sterner 2 , Jeffrey W. Fisher 3† , Jeffery M. Gearhart 4 1 Geo-Centers, Inc., Wright-Patterson AFB, OH 45433 2 Operational Technologies Corp., Dayton, OH 45432 3 AFRL/HEST, Wright-Patterson AFB, OH 45433 4 Mantech Environmental Technology, Inc., Dayton, OH 45437 # Current Address: CIIT Centers for Health Research, RTP, NC 27709 † Current Address: The University of Georgia, Athens, GA * To whom correspondence should be addressed: Rebecca A. Clewell CIIT Centers for Health Research Six Davis Drive Research Triangle Park, NC 27709-2137 Tel: (919) 558-1307 Fax: (919) 558-1300 E-mail: [email protected] Abbreviated title: PBPK ClO 4 - Model for Rat Lactation Copyright (c) 2003 Society of Toxicology ToxSci Advance Access published June 12, 2003 by guest on June 11, 2013 http://toxsci.oxfordjournals.org/ Downloaded from
-
Upload
independent -
Category
Documents
-
view
0 -
download
0
Transcript of Predicting Neonatal Perchlorate Dose and Inhibition of Iodide Uptake in the Rat during Lactation...

1
Predicting Neonatal Perchlorate Dose and Inhibition of Iodide Uptake in the Rat During
Lactation Using Physiologically-Based Pharmacokinetic Modeling
Rebecca A. Clewell1#*, Elaine A. Merrill1, Kyung O. Yu.3,
Deirdre A. Mahle4, Teresa R. Sterner2, Jeffrey W. Fisher3†, Jeffery M. Gearhart4
1Geo-Centers, Inc., Wright-Patterson AFB, OH 45433
2Operational Technologies Corp., Dayton, OH 45432
3AFRL/HEST, Wright-Patterson AFB, OH 45433
4Mantech Environmental Technology, Inc., Dayton, OH 45437
#Current Address: CIIT Centers for Health Research, RTP, NC 27709
†Current Address: The University of Georgia, Athens, GA
* To whom correspondence should be addressed:
Rebecca A. Clewell
CIIT Centers for Health Research
Six Davis Drive
Research Triangle Park, NC 27709-2137
Tel: (919) 558-1307
Fax: (919) 558-1300
E-mail: [email protected]
Abbreviated title: PBPK ClO4- Model for Rat Lactation
Copyright (c) 2003 Society of Toxicology
ToxSci Advance Access published June 12, 2003 by guest on June 11, 2013
http://toxsci.oxfordjournals.org/D
ownloaded from

2
ABSTRACT
Perchlorate (ClO4-), a contaminant in drinking water, competitively inhibits active uptake
of iodide (I-) into various tissues, including mammary tissue. During postnatal development,
inhibition of I- uptake in the mammary gland and neonatal thyroid, and the active concentration
ClO4- in milk indicate a potentially increased susceptibility of neonates to endocrine disruption.
A physiologically based pharmacokinetic (PBPK) model was developed to reproduce measured
ClO4- distribution in the lactating and neonatal rat and predict resulting effects on I- kinetics from
competitive inhibition at the sodium iodide symporter (NIS). Kinetic I- and ClO4- behavior in
tissues with NIS (thyroid, stomach, mammary gland and skin) was simulated with multiple sub-
compartments, Michaelis-Menten (M-M) kinetics and competitive inhibition. Physiological and
kinetic parameters were obtained from literature and experiment. Systemic clearance and M-M
parameters were estimated by fitting simulations to tissue and serum data. The model
successfully describes maternal and neonatal thyroid, stomach, skin, and plasma, as well as
maternal mammary gland and milk data after ClO4- exposure (from 0.01 to 10 mg/kg-day ClO4
-)
and acute radioiodide (2.1 to 33,000 ng/kg I-) dosing. The model also predicts I- uptake
inhibition in the maternal thyroid, mammary gland and milk. Model simulations predict a
significant transfer of ClO4- through milk after maternal exposure; approximately 50% to 6% of
the daily maternal dose at doses ranging from 0.01 to 10.0 mg ClO4-/kg-day, respectively.
Comparison of predicted dosimetrics across life-stages in the rat indicates that neonatal thyroid I-
uptake inhibition is similar to the adult and approximately 10-fold less than the fetus.
Keywords: PBPK model, lactation, perchlorate, iodide, inhibition, milk
by guest on June 11, 2013http://toxsci.oxfordjournals.org/
Dow
nloaded from
3
INTRODUCTION
Perchlorate (ClO4-), the soluble anion of ammonium and potassium perchlorate, is
a thyroid iodide uptake inhibitor known to be present in several United States drinking water
sources, ranging in concentrations from less than 4 ppb to more than 3,700 ppm in some Las
Vegas water samples (Motzer, 2001). Human health concerns arise from the fact that ClO4-,
being similar in size and shape to iodide (I-), is able to bind to the sodium-iodide symporter
(NIS), thus reducing the amount of iodide taken up into the thyroid. Thyroid hormones are
synthesized from I- in the thyroid and are responsible for regulating metabolism. In the adult,
lack of iodide causes reduced thyroxine (T4) and triiodothyronine (T3) levels and can eventually
lead to hypothyroidism (Wolff, 1998). Furthermore, since these hormones are required for
normal physical and mental development, exposure to thyroid inhibitors during the period of
rapid growth in late gestation and early infancy could result in long-term consequences
(Howdeshell, 2002; Porterfield, 1994). Congenital hypothyroidism and gestational iodide
deficiency are known to cause delayed development and, in severe cases, lowered IQ, mental
retardation and even cretinism (Delange, 2000; Haddow et al., 1999; Howdeshell, 2002; Klein et
al., 1972; Porterfield, 1994). In the case of perchlorate contamination of drinking water sources,
the question is whether ClO4- is capable of inducing these same developmental effects and at
what level of exposure the fetus or infant may be at risk of adverse effects.
In order to help answer these questions, several studies have been conducted in rats
involving chronic and short-term perchlorate exposure during gestation, lactation and in adult
males at a variety of doses (Bekkedal et al., 2001; Mahle et al., 2002; Mahle et al., In Press;
York et al., 1999; York et al., 2001; Yu et al., 2002). None of the available studies show the
same extent of adverse effects from perchlorate exposure as are known to occur in iodide
by guest on June 11, 2013http://toxsci.oxfordjournals.org/
Dow
nloaded from

4
deficiency. However, consolidating these various data sets into a quantitative measure of risk to
the perchlorate-exposed infant is quite difficult due to the variations in study design, as well as
the rapid physical and biochemical changes taking place during lactation and infancy. To
incorporate these kinetic, physiological and biochemical data into a predictive tool for
perchlorate, iodide and perchlorate-induced inhibition kinetics, a physiologically based
pharmacokinetic (PBPK) model was developed in the lactating and neonatal rat. Together with
the concurrent PBPK models developed for the male rat (Merrill et al., In Press), pregnant and
fetal rat (Clewell et al., In Press), and the adult human (Merrill et al., 2001), the models can be
used to compare internal dose metrics, such as ClO4- concentration in the serum across
developmental life stages and species. Thus, the models provide a means for extrapolating
predicted kinetics and measures of dose to the potentially more sensitive and often overlooked
subpopulation, the human fetus and infant (Clewell and Gearhart, 2002a).
Although the hormone feedback system of the postnatal rat is independent of the mother
(Howdeshell, 2002; Potter et al., 1959; Vigouroux and Rostaqui, 1980), the affect of maternal
perchlorate exposure is intricately tied to neonatal risk. In fact, there are several unique factors
that must be accounted for when attempting to quantify risk to the nursing neonate. For
example, the lactating mammary gland contains active NIS that concentrates iodide in the milk
ensuring an adequate supply of iodide to the newborn. However, since ClO4- competitively
inhibits iodide binding to NIS, maternal exposure during lactation also inhibits iodide transfer in
the milk, as has been noted in several species including the rat, goat, rabbit and cow (Brown-
Grant, 1957; Cline et al., 1969; Grosvenor, 1963; Lengemann, 1965; Potter et al., 1959). It is
also possible that this binding of perchlorate to NIS, which inhibits iodide uptake, is responsible
for concentration of ClO4- in milk. Intra-laboratory studies have shown milk ClO4
- levels to be
by guest on June 11, 2013http://toxsci.oxfordjournals.org/
Dow
nloaded from

5
consistently higher than the maternal plasma, and the neonate was found to have significant
blood ClO4- concentrations after nursing from the exposed dams (Yu et al., 2001). Thus, the
infant would be at risk not only from the diminished iodide intake from the milk, but also from
the significant doses of ClO4- received from the milk, and the resulting additional inhibition of
iodide uptake at the neonatal thyroid NIS. The PBPK model described here is able to account for
the changing physiology of the lactating dam and pup, as well as the resulting impact of these
physiological changes on experimentally determined iodide and perchlorate kinetics in order to
provide a meaningful, quantitative estimate of two previously uncharacterized determinants of
neonatal risk: the relative ClO4- dose to maternal and neonatal rats, and the dose-response
relationship between perchlorate exposure and iodide inhibition in the maternal thyroid and milk.
At this stage, the model includes only a rudimentary description of endogenous I- kinetics and
incorporation into thyroid hormones, sufficient to reproduce the kinetics of radioiodide.
METHOD
Supporting Experiments
All supporting experiments were performed on timed-pregnant rats and pups of the
Sprague-Dawley strain (Crl: CD, Charles River Laboratory, Raleigh, NC). Animals were housed
in individual light, heat and humidity controlled cages and were kept on a 12 h light/dark cycle
with access to water and food ad libitum. Euthanization was performed by CO2 asphyxiation on
either postnatal day (PND) 5 or 10 and tissues were collected for analysis of ClO4- or radioiodide
content using the methods described in Narayanan et al. (In Press), respectively. In all
by guest on June 11, 2013http://toxsci.oxfordjournals.org/
Dow
nloaded from
6
experiments, pup serum was pooled by sex within individual litters due to small sample volumes.
Pup skin, gastrointestinal (GI) tract, GI contents and maternal tissues were analyzed individually.
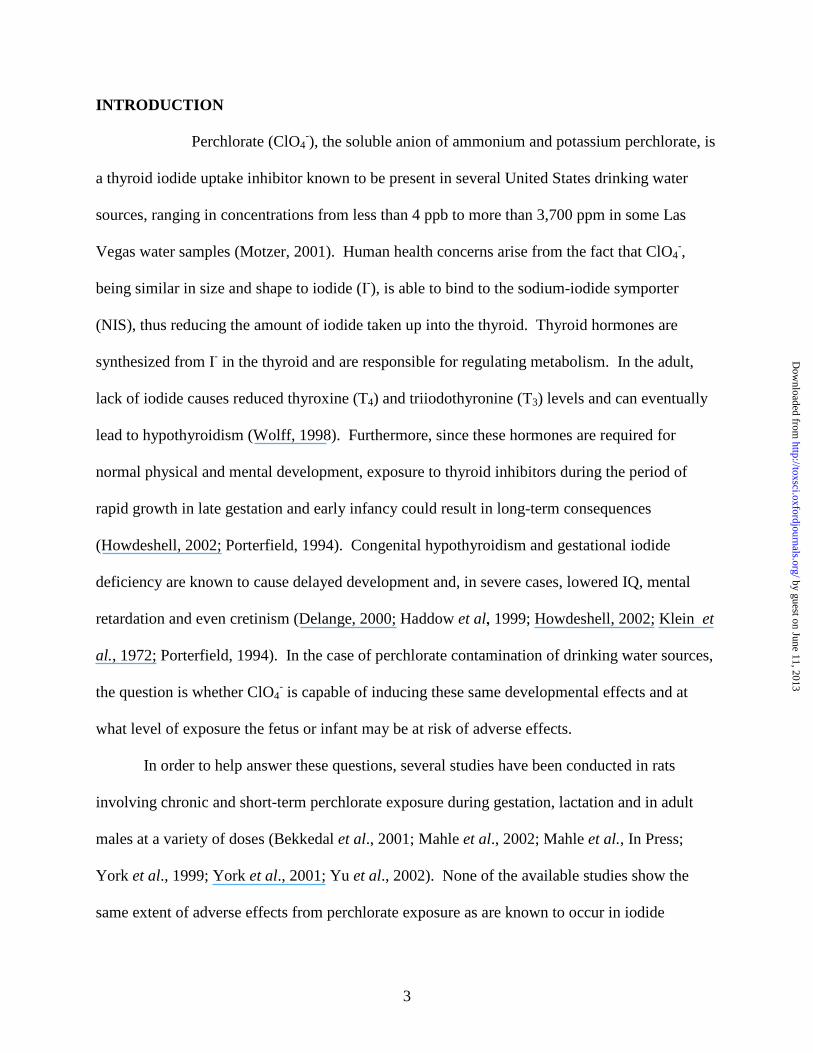
Perchlorate Drinking Water Study. Pregnant dams (n=12 per group) were given either
deionized water or water containing perchlorate from gestational day (GD) 2 through the day of
sacrifice. Daily measurements of body weight and water intake were taken to ensure consistent
dosing at levels of 0.0, 0.01, 0.1, 1.0 and 10.0 mg ClO4-/kg-day. Maternal serum, thyroid and
milk, and neonatal serum were collected from the PND 10 groups and analyzed for ClO4-
content. On PND 5, 6 of the dams from each dosing regimen were given a tail vein injection of
33 µg/kg 125I- 2 hours prior to sacrifice. Maternal and neonatal serum, skin, GI contents and GI
tract, as well as maternal thyroid and mammary gland, were collected from these PND 5 rats and
analyzed for ClO4- and 125I-. Thyroid hormones (free and total T4 and T3) and TSH were also
measured in the serum of PND 5 rats that were not dosed with radioiodide.
Radioiodide and Inhibition Kinetic Studies. Lactating dams (6 control, 6 inhibition) were
dosed via tail vein injection to 125I- (average dose = 2.10 ng/kg) on PND 10 and euthanized at
0.5, 2, 4, 8 and 24 h postdosing. Two hours prior to the administration of 125I-, dams from the
inhibition group were given a 1.0 mg/kg ClO4- iv and euthanized at 0.5, 1, 2, 4, 8, 12 and 24 h
post-125I- dosing. This particular ClO4- dose was chosen to be large enough dose to significantly
affect iodide uptake, based on inhibition of thyroid iodide uptake in the male rat (Merrill et al., In
Press), while being lower than the dose required to saturate the symporter, based on the drinking
water study results (see Results section below). Maternal and neonatal serum, skin, GI contents
and GI tract, and maternal thyroid and mammary gland tissue were collected from both control
and perchlorate dosed groups and analyzed for 125I- with a gamma counter.
by guest on June 11, 2013http://toxsci.oxfordjournals.org/
Dow
nloaded from

7
Direct Pup Radioiodide Dosing. PND 10 Sprague-Dawley pups (n=6) were given an oral
gavage of 125I- (0.001mg/kg) in water. Pups and nursing dams were euthanized at 0.5, 1, 2, 4, 8
and 24 h postdosing. Neonatal serum, thyroid, skin, GI contents and GI tract, as well as maternal
serum and thyroid were harvested and analyzed for radioiodide content.
Model Structure.
All model code was written in ACSL (Advanced Continuous Simulation Language,
Aegis Technologies Group, Inc., Huntsville, AL). The model structure is based on those of the
male rat and gestation models for iodide and perchlorate kinetics developed concurrently by
Merrill et al. (In Press) and Clewell et al. (In Press). The maternal model (Figure 1A) consists of
compartments for plasma, thyroid, skin, GI, kidney, liver, fat, mammary gland and milk, plus
compartments for the combined slowly and richly perfused tissues. The thyroid, GI and
mammary gland are described with three subcompartments representing the stroma, follicle and
colloid in the thyroid, the capillary bed, GI tissue and GI contents in the GI, and the capillary
blood, tissue and milk in the mammary gland. For iodide, additional compartments representing
the organified (hormone-bound) iodine were included in the thyroid and serum (Figure 1B).
Skin is described with two subcompartments, representing the capillary bed and tissue. Active
uptake into the thyroid follicle and colloid, as well as the skin tissue, mammary gland, milk and
GI contents, was described with Michaelis-Menten (M-M) type kinetics for saturable processes
(bold arrows in Fig. 1). Permeability area cross products and partition coefficients were used to
describe the passive movement of the anions (I- and ClO4-) between the capillary bed, tissue and
inner compartments (small arrows in Fig. 1), which results from the inherent electrochemical
by guest on June 11, 2013http://toxsci.oxfordjournals.org/
Dow
nloaded from
8
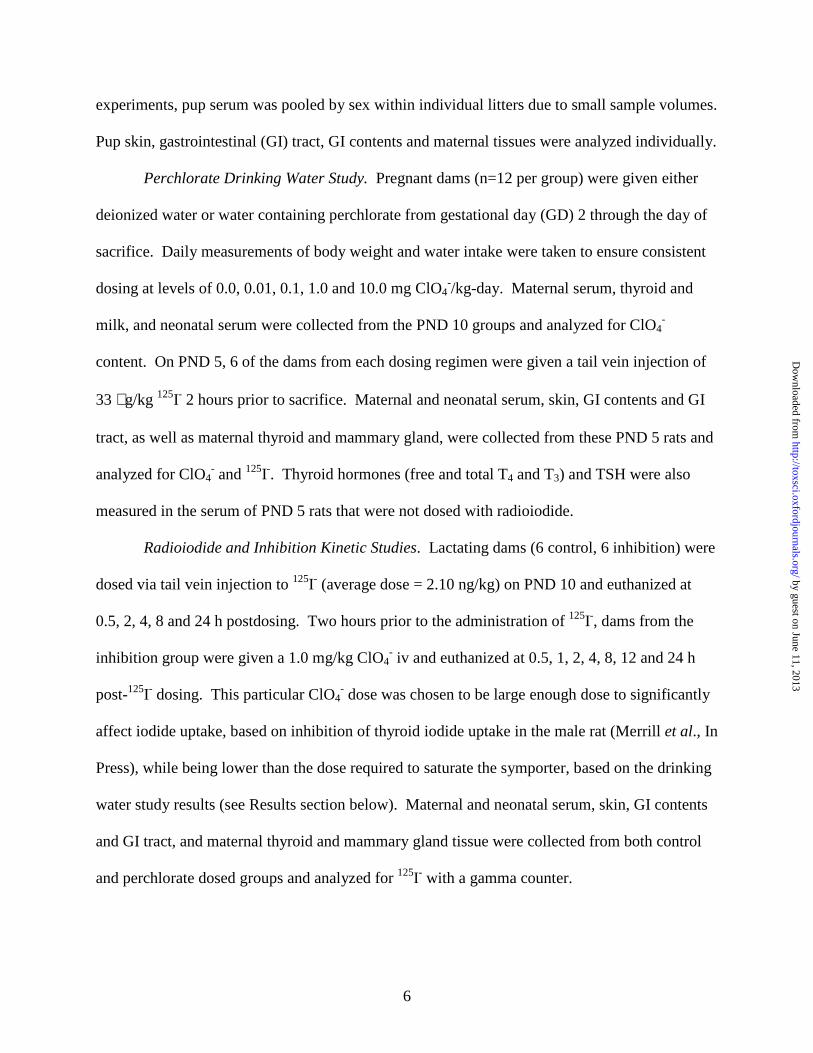
gradients within these tissues (Chow et al., 1969). The flow-limited kidney, liver and fat
compartments were described with partitions and blood flows. Plasma binding of the inorganic
anions (I- and ClO4-) was simulated using a saturable term for association of the anions to
binding sites in the plasma and a first order clearance rate for dissociation from plasma binding
sites. Urinary clearance and transfer of anions between the dam and pup were represented by
first order clearance rates.
Due to the short time-frame of the radioiodide experiments, the kinetic behavior of total
radioiodine was assumed to behave as free iodide in all compartments other than the thyroid and
plasma. Inorganic iodide and perchlorate were then modeled in the same manner, based on the
similar size and charge of the ions and their shared affinity for NIS (Wolff, 1998). The thyroid,
skin, GI and mammary gland contain active NIS and were therefore defined separately in the
structure of the model (Kotani et al., 1998; Spitzweg et al., 1998). The thyroid, mammary gland,
milk, skin and GI contents have also been found to maintain higher concentrations of ClO4- and
I- than the plasma (Brown-Grant, 1961; Brown-Grant and Pethes, 1959; Chow et al., 1969;
Halmi and Stuelke, 1959; Wolff, 1998; Zeghal et al., 1995). Although other tissues, such as the
salivary gland, ovary and choroid plexus, are also known to sequester iodide and perchlorate in
the rat and human (Brown-Grant, 1961; Honour et al., 1952; Spitzweg et al., 1998), the small
amounts of anions present in these tissues do not affect plasma concentrations. These tissues
were therefore combined in the richly or slowly perfused compartments.
In order to describe free thyroidal iodide, it was necessary to account for the
incorporation of iodide into hormones in the thyroid and the secretion of this incorporated iodine
into the blood. Our goal was to describe this process with enough detail to predict time course
data, while keeping the model as parsimonious as possible. Thus, thyroid hormone production,
by guest on June 11, 2013http://toxsci.oxfordjournals.org/
Dow
nloaded from

9
or the incorporation of iodide into hormones, is described using a first order clearance (ClProdci)
of inorganic iodide from the thyroid follicle to the incorporated thyroid iodine compartment.
Secretion of the incorporated iodine into the plasma is also described with a first order clearance
(ClSecrci) from the incorporated thyroid iodine compartment to the incorporated plasma iodine
compartment (Figure 1B). It was not necessary to include a description of hormone
incorporation in the perchlorate model, since ClO4- is not organified or metabolized in vivo
(Anbar et al., 1959).
The incorporated plasma iodine compartment represents combined plasma hormonal iodine,
including free T3 and T4 as well as protein bound T3 and T4, but does not attempt to predict
individual hormone kinetics. Studies of iodine distribution from dietary intake suggest that the
majority (>80%) of serum iodine is, in fact, incorporated into hormones or bound to plasma
proteins (Stolc et al., 1973a). In contrast, studies in our laboratory found that inorganic iodide
accounts for approximately 80% of the total measured plasma radioiodine up to 24 h after an
administered 125I- dose (Mahle et al., 2002). This apparent discrepancy may be explained by the
slow incorporation of administered or ingested iodide into hormones over time. Endogenous
serum iodine data primarily reflect hormone-incorporated iodine, since the system is at steady
state. This normal iodine turnover is well established in the animal when the radioiodide is
introduced. However, the kinetics reflected in the radiolabeled iodide time course is primarily
due to binding of the free anion to plasma proteins, uptake of the anion into various tissues and
urinary clearance. Hormone incorporation would have little effect on these radioiodide kinetics,
due to the long time-frame required to incorporate the radioiodide into hormones in the thyroid
and the slow secretion of these newly produced radiolabeled hormones into the serum. The
model is able to reconcile these data by including an incorporated iodine compartment in the
by guest on June 11, 2013http://toxsci.oxfordjournals.org/
Dow
nloaded from
10
plasma, into which the hormone-incorporated iodine enters as it is secreted from the thyroid. A
generic first order rate (ClDeiodci) is then used to describe the overall deiodination accomplished
in the various tissues, allowing the inorganic iodide to re-enter the free plasma compartment.
Some description of plasma binding was required for both anions in order to adequately
reproduce the available data. The inclusion of binding to plasma proteins is especially important
in the case of perchlorate. In fact, at low serum concentrations (<100 µg/L), approximately 99%
of the anion is bound to plasma proteins and at higher concentrations (>500 µg/L), 50% is bound
(Fisher, 2002). Binding of perchlorate to plasma proteins has also been measured in both human
and bovine serum (Carr, 1952; Scatchard and Black, 1949). Iodine also binds to plasma proteins,
but to a lesser extent than ClO4-. Therefore, the model includes a description for the binding of I-
and ClO4- to plasma proteins. Competition of the two anions for plasma binding sites was also
included in the model.
In addition to the reported presence of NIS in the mammary gland (Spitzweg et al.,
1998), studies of perchlorate-induced inhibition of iodide uptake in milk and mammary tissue
support the conclusion that a transport mechanism similar to that of the thyroid exists in the
mammary gland (Brown-Grant, 1957; Grosvenor; 1963; Potter et al., 1959). Furthermore,
hormones produced during lactation, such as prolactin, regulate the mammary gland NIS activity
(Tazebay et al., 2000). Shennan and Peaker (2000) also found evidence of a second anion
transport mechanism in the secretory cells of the mammary gland, suggesting that this transporter
is also able to move iodide and perchlorate against a concentration gradient. This second anion
channel is represented in the model as active uptake into the milk compartment.
by guest on June 11, 2013http://toxsci.oxfordjournals.org/
Dow
nloaded from

11
The kidney and liver were separately defined within the structure of the model in order to
describe the rapid urinary clearance of the anions and to allow for future elaboration of the model
that would address hormone metabolism in the liver. A fat compartment was also included to
account for the possible effect of changing fat volume on the kinetics due to the hydrophilic
nature of both anions. Since kidney, liver and fat do not maintain tissue:plasma ratios greater
than one for either anion, these tissues were described as single, flow-limited compartments and
do not contain terms for active uptake. Effective partitioning into these compartments is thought
to result from the electrochemical gradient that moves ClO4- from serum to tissue (Chow and
Woodbury, 1970).
The basic structure of the neonatal model (Figure 1A) is similar to that of the lactating
rat, excluding the mammary gland. In order to simplify the model, all pups from a single litter
were combined together within the model structure. Neonatal dose is described as a first order
transfer rate between the maternal milk and pup GI contents. The anions are then recirculated to
the mother through the pup urine based on the work of Samel and Caputa (1965), showing that
lactating dams ingest approximately 60% of the neonate’s iodine dose while grooming their
pups.
Perchlorate-induced inhibition of iodide uptake was included in the maternal and
neonatal thyroid follicle and colloid, GI contents and skin, as well as the maternal mammary
gland and milk. Literature sources have reported inhibition of iodide uptake into gastric juice of
the male rat (Halmi and Stuelke, 1959) and the milk of the lactating rat (Brown-Grant, 1957;
Grosvenor, 1963; Potter et al., 1959). Studies in our laboratory have also shown consistent
evidence of significant inhibition of iodide uptake in neonatal GI and skin, and slight inhibition
in the maternal skin and mammary gland (Mahle et al., 2002).
by guest on June 11, 2013http://toxsci.oxfordjournals.org/
Dow
nloaded from

12
Dosing Procedures.
In order to simulate the daily dosing regimen of the perchlorate drinking water
experiment, a pulse function in ACSL was used to introduce drinking water to the GI contents of
the lactating dam at a constant rate for 12 hours per day (1800 to 0600 hours). The neonate was
dosed continuously throughout the day from the maternal milk. Both the pup milk dose and the
oral bolus dose were introduced into the GI contents of the neonate utilizing pulse functions.
Tail vein injections were simulated by introducing the anions into the intravenous serum
compartment. Dosing for the dietary iodine studies (Stolc et al., 1973a,b) was based on the
iodine content of the feed and supplemented water, as well as published water, milk and dietary
intake data (Stolc et al., 1966) in both the maternal and neonatal rat throughout the postnatal time
period, assuming a constant (24 h/day) intake for both dam and neonate.
Model Parameters.
Model equations are described in the appendix. Whenever possible, physiological and
kinetic parameters were obtained from literature or experiments. Allometric scaling was
generally employed to account for differences in parameters due to variations in body weight of
male, female and neonatal rats. Tissue volumes were scaled linearly by body weight (BW).
Blood flows, maximum velocities, permeability area cross products (PA) and clearance values
were scaled by BW0.75. Pup values were scaled in a similar manner to the maternal parameters.
Physiological and chemical specific parameters were scaled first by the body weight of an
individual pup, as described above, and were then multiplied by the total number of neonates to
represent the value for the entire the litter.
by guest on June 11, 2013http://toxsci.oxfordjournals.org/
Dow
nloaded from

13
Physiological Parameters. The physiological description of maternal and neonatal rats
during lactation is based on the work of Fisher et al. (1990), measurements from our laboratory
and published physiological data. Due to the non-uniform changes in tissue volume and body
weight during lactation, it was necessary to include gender and life stage-specific physiological
descriptions whenever possible. Parameters that were not available specifically for the lactating
female or neonate were described by adjusting male rat values by body weight. Final values for
the physiological parameters and sources from which they were obtained are listed in Table 1.
Lactation-specific changes in tissue volumes and suckling rates were included in the
model using ACSL TABLE functions, which employ linear interpolation between available data
points. Maternal body weight was assumed to increase by 12% between PND 1 and 10, based on
the daily measurements of dams in the perchlorate drinking water study described previously.
Since there was no significant difference in the average daily body weights between the five dose
groups, the average body weight from all doses were used. The relative volume of the mammary
tissue increased from 4.4% on PND 2 to 5.6, 6.3 and 6.6% of the maternal body weight on PND
7, 14 and 21, respectively (Knight et al., 1984). Maternal body fat increased from 12.4 to 15.2%
of the body weight between parturition and PND 2, with a subsequent decrease to 6.9% of the
body weight from PND 2 to 16 (Naismith et al., 1982). Values for body fat content on PND 2
and 16 were taken from the measured values of Naismith et al. (1982). Maternal body fat at
parturition was calculated from the previously developed PBPK model for the pregnant rat
(Clewell et al., In Press). Thus, the relative volume of the maternal body fat in the model
increases slightly between PND 1 and 2 and then decreases after PND 2. The rate of milk
production was assumed to be equal to the suckling rate described below.
by guest on June 11, 2013http://toxsci.oxfordjournals.org/
Dow
nloaded from

14
As in the maternal tissues, TABLE functions were used to interpolate between reported
data points for the changing body weight, suckling rate and relative tissue volumes in the
neonate. Growth of the neonate is directly dependent on the ingestion of milk. Stolc et al.
(1966) measured both pup body weight and the milk ingestion of suckling rats from birth
through weaning. Although the author used a different strain of rats than was used in our
studies, the pup body weights were nearly identical between the two studies. Thus, the more
comprehensive, published data set of Stolc et al. (1966) was used for these physiological
parameters. Values for neonatal body fat were based on the data of Naismith et al. (1982),
showing a rapid increase from 2.7 to 11% BW between PND 2 and 16 and a subsequent decrease
to the adult value of 4.61% (Brown et al., 1997).
Increase in neonatal thyroid volume was based on the work of Florsheim et al. (1966),
who reported relative thyroid volumes of 0.013, 0.015, 0.012, 0.014, 0.013, 0.013 and 0.013%
body weight for neonates on PND 1 through 5, 7 and 11, respectively. The model also describes
changing thyroid stroma, follicle and colloid fractions over time based on the work of Conde et
al. (1991), who measured the fractional volumes on postnatal days 0, 5, 10, 15, 20, 25, 30, 60
and 120. Relative tissue volumes of the skin, GI tract, liver and kidney were modeled based on
measured body and tissue weights on PND 1, 5, 10, 20, 30 and 64 (Palou et al. 1983). Relative
skin volume increased from 19.3 to 20.8% BW from PND 1 to 20 and then decreased to 19%
BW by PND 30. Similar trends were also seen in the GI, kidney and liver, with increasing
volume (with respect to body weight) peaking at PND 30, 20 and 30, respectively.
All maternal blood flows that were not directly affected by the changes induced by
lactation were scaled allometrically from the adult male rat parameters. TABLE functions were
used to describe the changing in cardiac output and fractional blood flow to the mammary tissue
by guest on June 11, 2013http://toxsci.oxfordjournals.org/
Dow
nloaded from
15
throughout lactation, according to the data of Hanwell and Linzell (1973) and the neonatal
cardiac output, hematocrit and regional blood flows, based on the data of Rakusan and Marcinek
(1973). Among other tissues, Rakusan and Marcinek (1973) measured fractional blood flows to
the kidney, liver, skin, stomach and large and small intestines in 1, 30, 60, and 140 day-old rats.
Relative blood flow to the neonatal kidney, liver and total GI are modeled as increasing from 3.6,
4.5 and 4.6 to 15.5, 5.2 and 6.8 % cardiac output, respectively, in the first 60 days. Blood flow
to the skin remains relatively constant after birth, at approximately 11% of the cardiac output.
Chemical Specific Parameters. Chemical specific parameters (Table 2) for perchlorate
and iodide in tissues other than the mammary gland were kept as similar as possible to those
used in the PBPK models for the male and pregnant rat (Merrill et al., In Press; Clewell et al., In
Press) in order to facilitate comparison of the models and extrapolation between life-stages. As
in the previous models, binding of I- to NIS was given a Km of 4.0x 10⁶ ng/L based on the work
of Gluzman and Niepomniszcze (1983) in human thyroid slices. This value for the follicular Km
(KmTFi) remained constant across species (Gluzman and Niepomniszcze, 1983) and tissues
(Wolff, 1998) and was therefore applied to all compartments in the model with NIS. The second
transporter located at the apical membrane in the thyroid was studied by Golstein et al. (1992),
who measured a Km of approximately 4.0 x 10⁹ ng/L for iodide (KmTLi) in bovine thyroid. In
the model, a somewhat lower value than that measured by Golstein et al. of 1.0 x 10⁹ was used
for KmTLi, based on the ability of the model to fit the later (> 8 h) time-points. The Km for the
second active transport mechanism in the mammary gland (KmMk), for milk uptake, was set by
fitting the model simulation to available mammary gland and milk data.
The Km value for ClO4- transport by NIS was given a value of 1.5 x 10⁵ ng/L for all
relevant compartments. This value is based on the assumption that perchlorate acts as a
by guest on June 11, 2013http://toxsci.oxfordjournals.org/
Dow
nloaded from

16
competitive inhibitor of iodide uptake and is, in fact, transferred into the tissues via NIS (Clewell
and Gearhart, 2002b). Therefore, the Km value for perchlorate transport by NIS would be equal
to its Ki value. Kosugi et al. (1996) measured the Ki for ClO4- at 1.5 x 10⁵ ng/L. This value was
adjusted slightly to obtain the best fit of thyroid perchlorate to the drinking water data, resulting
in a Km of 2.0 x 10⁵ng/L. This value is further supported by various literature sources suggesting
that ClO4- actually has as much as an order of magnitude greater affinity for NIS than I- itself
(Chow et al., 1969; Halmi and Stuelke, 1959; Harden et al., 1968; Lazarus et al., 1974).
Likewise, the Km values for perchlorate transport by the second anion channels in the thyroid and
mammary gland were also nearly a factor of 10 less than that of iodide, resulting in values of 1.0
x 108 and 1.0 x 10⁶ ng/L for KmTLp and KmMkp, respectively.
The values for Vmax vary significantly across species and tissues with NIS (Glutzman and
Niepomniszcze, 1983; Wolff, 1998) and were, therefore, determined by fitting the model
simulations to available data in the various tissues of PND 5 and 10 rats. In the perchlorate
drinking water study, the non-linearity of tissue ClO4- concentrations across doses in
compartments with NIS suggests that the symporter is saturated between the 1.0 and 10.0 mg/kg-
day doses. Thus at doses below saturation (<1.0 mg ClO4-/kg-day), the active transport via NIS
would drive tissue concentrations and were therefore used to set Vmax values. For iodide, kinetic
data were taken at doses well below the saturation of NIS. Thus, the time course data from the
kinetic studies were used to determine values for Vmax in tissues with active uptake.
Partitioning of ClO4- and I- into tissues results from the electrochemical potential present
across tissue membranes (Chow and Woodbury, 1970). Theoretical effective partition
coefficients were calculated from measured electrical potentials presented by Chow and
Woodbury (1970) using the equations given in Kotyk and Janacek (1977). Calculations are
by guest on June 11, 2013http://toxsci.oxfordjournals.org/
Dow
nloaded from

17
described in detail in the male rat perchlorate model (Merrill et al., In Press). Ranges for the
partition coefficients corresponding to the stroma:follicle and follicle:lumen membrane diffusion
were estimated to be 0.11 to 0.15 and 6.48 to 8.74, respectively. Based on the fit of the model
simulation to the data and the calculated values above, values of 0.15 and 7.0 were used for PTFi
and PTLi, respectively.
As mentioned previously, the perchlorate drinking water data indicate that NIS transport
is saturated between the 1.0 and 10.0 mg ClO4-/kg-day doses. Therefore, at 10.0 mg/kg-day,
ClO4- uptake into the various tissues would be predominantly determined by the passive
diffusion parameters. Thus, parameters describing partitioning of ClO4- into the tissues were
obtained by fitting the model simulation to the highest dose group data from the drinking water
study. In the cases where data were not available in the lactating or neonatal rat, such as the
muscle (slowly perfused), liver (richly perfused), kidney and red blood cells, values were
obtained from those used in the adult male rat model (Merrill et al., In Press). The partition
coefficient for perchlorate in fat was measured in the laying hen (Pena et al., 1976). Other
tissues in the hen, such as the muscle and kidney, were found to have similar partition
coefficients to those of the rat.
Iodide partition coefficients and PA values were calculated from the tissue:blood ratios
measured during the clearance phase of data for the tissue of interest either from literature or
experimental data in the rat. The partitioning parameters for the muscle (slowly perfused), liver
(richly perfused), kidney and red blood cells were given the same values measured in the male
rat (Merrill et al., In Press) and the value for partitioning of iodide into the fat was given the
same value as ClO4-.
by guest on June 11, 2013http://toxsci.oxfordjournals.org/
Dow
nloaded from

18
Parameters for plasma binding were determined by fitting the model to time course data
in the case of iodide and the 0.01 and 0.1 mg/kg-day drinking water data in the case of ClO4-, due
to the fact that binding was most prevalent at the lower doses. Urinary clearance of ClO4- was
determined from fitting the serum at the 10.0 mg/kg-day dose group, where binding had little
effect on serum concentrations. First-order clearances for incorporation of iodide into thyroid
hormones and hormone secretion were determined by the fit of the model to the incorporated and
free thyroid iodide time course data. Parameters for binding of inorganic iodide to plasma
proteins were determined by the fit of the model simulation to initial portion of the serum
radioiodine data. Later time-points were assumed to be more affected by hormone secretion and
deiodination rates, as sufficient time had passed to allow for incorporation of the administered
radioiodide into hormones. Urinary iodide clearance was determined from the fit of the model to
serum inorganic iodide time course data.
Up-regulation of Thyroid NIS Activity. At the time of data collection in the drinking
water study, rats had been exposed to ClO4- throughout gestation and up to the day of sacrifice.
At this point, up-regulation of the thyroid activity is evidenced by decreased T4 and elevated
TSH levels in the serum at all doses, as well as a lack of noticeable thyroid iodide uptake
inhibition (Yu et al., 2001). Since increased TSH up-regulates thyroid iodide uptake by
increasing the number and activity of NIS (Wolff, 1998), the value for VmaxcTFi, which
corresponds to the maximum capacity of active transport at the basolateral membrane, was
increased to fit the measured radioiodide concentrations in the up-regulated thyroids for each
dose. The resulting values for VmaxcTFi were then plotted versus the corresponding
concentrations of serum free ClO4- and the data were fitted with a Michaelis-Menten (M-M)
equation. This equation then was used in the model to describe the induction of NIS up-
by guest on June 11, 2013http://toxsci.oxfordjournals.org/
Dow
nloaded from

19
regulation with dose, in a similar manner to the description used by Andersen et al. (1984) to
describe enzyme induction.
Up-regulation of thyroidal NIS also affects thyroid ClO4- uptake, and hence the
measured thyroid ClO4- concentrations in the drinking water study, as both ClO4
- and I- are
transported by the same symporter (Wolff, 1964, 1998). Thus, increased thyroid ClO4- uptake
was modeled in the same manner as I-, increasing the value for VmaxcTFp with dose and
applying the resulting M-M fit to the model.
Dietary Iodine Model. The dietary iodine model is identical to that of the radioiodine
model. Dosing is accomplished as a constant intake of iodine through water and diet. All
chemical specific parameters are assumed to be the same as those determined from the
radioiodide kinetics. The radioiodide, endogenous iodine and perchlorate models operate
independently in tissues with passive diffusion, and are linked through competitive uptake in
tissues with NIS (e.g,. thyroid follicle). Thus, in tissues governed by passive diffusion,
tissue:blood ratios are identical for the radiolabeled and dietary iodine models. The interaction
of the three models through competitive inhibition at NIS allows us to explore the effect of
varying dietary intake on both radiolabeled iodine kinetics and perchlorate-induced inhibition of
radioiodide uptake in the thyroid.
Sensitivity Analysis of Chemical Specific Parameters. A sensitivity analysis was run after
finalizing the model parameters as to examine the relative influence of each of the chemical
specific parameters on model predictions. The model was run to determine the change in the
average serum ClO4- concentration (AUC: area under the curve) and total thyroid iodide uptake
at 8 hr post-dosing, resulting from a 1% change in the value of each kinetic parameter. In an
effort to determine the effect of NIS saturation on relative parameter importance, the sensitivity
by guest on June 11, 2013http://toxsci.oxfordjournals.org/
Dow
nloaded from

20
analysis was performed at two ClO4- doses, presumably representing unsaturated and saturated
symporter states (0.1 and 10.0 mg-kg-day, respectively). Since the iodide doses used in this
model are not expected to saturate the NIS, thyroid iodide sensitivity analysis was run only at the
dose used in the kinetic experiments (2.1 ng/kg 125I-). The following equation shows the
calculation of the sensitivity coefficient for each parameter.
Sensitivity Coefficient = (A - B)/B(C - D)/D
Where A is the serum AUC with 1% increased parameter value, B is the serum AUC at the
starting parameter value, C is the parameter value after 1% increase and D is the original
parameter value.
RESULTS
Model Parameterization.
The ClO4- data from the drinking water study were used to determine kinetic parameters
for ClO4- in the lactating and neonatal rat. Up-regulation of NIS transport of ClO4
- into the
thyroid was accounted for as described in the Methods section. Figure 2 shows the model
simulations for ClO4- concentrations in the maternal and neonatal serum, maternal thyroid, GI
contents, mammary gland and milk, versus measured data from the drinking water study on PND
5 and 10 at 0.01, 0.1, 1.0 and 10.0 mg ClO4-/kg-day. The up-regulated values for Vmaxc_TFp
were used in the simulation of the thyroid as described in the Methods section. In these and
subsequent plots, solid lines indicate the model prediction and cross-bars indicate the mean ±
standard deviation (SD) of measured data.
by guest on June 11, 2013http://toxsci.oxfordjournals.org/
Dow
nloaded from

21
Neonatal iodide kinetic parameters were determined by the fit of the model to the data
obtained from directly dosing the pup, while maternal parameters were primarily determined
from the data obtained by dosing the dam via iv. Transfer from the neonate to the dam was
established by fitting the maternal kinetic parameters first and then utilizing maternal data from
the pup dosing study to determine the magnitude of iodide transfer to the maternal stomach via
pup urine. In the same way, milk transfer was parameterized by first fitting the neonatal
parameters from the pup dosing study and then utilizing the pup data from the maternal dosing
kinetic study to estimate pup exposure via milk. PA values were adjusted to describe the
behavior of iodide data, where increasing PA values toward 1.0 L/h-kg generally increased the
rate at which uptake and clearance in a particular tissue occurred, and decreasing PA slowed
uptake and clearance. Model simulations of radioiodide kinetics in maternal and neonatal tissues
versus the data obtained from dosing the dams are shown as the control group in the inhibition
study (Figure 3). The fit of the model to iodide levels in maternal and neonatal tissues from the
direct oral dosing of PND 10 pups are shown in Figure 4. The model was able to reproduce data
in both maternal and neonatal tissues, whether exposure occurred via maternal iv or oral bolus to
the pup. Thus, the model is able to describe both maternal to neonatal and neonatal to maternal
iodide transfer, and is also able to reproduce data across exposure routes.
Model Validation. Once model parameters were established as described above, the robustness
of the model was tested against a variety of data sets taken across different laboratories, rat
strains, exposure routes and time points in lactation. Several published kinetic studies using
various isotopes of iodide were used to test the model description of iodide kinetics in the dam
and neonate (see below). Accuracy and usefulness of the model perchlorate and iodide
by guest on June 11, 2013http://toxsci.oxfordjournals.org/
Dow
nloaded from

22
descriptions were further validated against studies of perchlorate-induced inhibition of iodide
uptake in the maternal thyroid, mammary gland, milk and neonatal tissues based on the
description of competitive binding to NIS.
Radioiodide Kinetics on PND 10. Validation of PND 10 iodide kinetics was performed
with the data of Iino and Greer (1961), Samel and Caputa (1965), Vigouroux (1976) and
Vigouroux and Rostaqui (1980). In order to simplify comparison of the different data sets,
which were originally performed at slightly different dose levels, the data of each study were
normalized to a dose of 1.0 ng. The model simulation was then run versus the combined data
sets (Figure 5). Figures 5A and 5B show the maternal and neonatal thyroid radioiodide levels on
PND 10 following an acute 131I- dose to the dam. The model is able to predict the maternal
thyroid iodide, but underpredicts pup thyroid iodide levels at the 24 h time point. However, the
model prediction is within a factor of two of the measured data. Figures 5C and 5D show the
model-predicted maternal and neonatal thyroid iodide levels after an ip dose to the pup. The
model simulation is able to describe both maternal and neonatal thyroid uptake, again within a
factor of two.
The data of Samel and Caputa (1965) also allowed validation of the model parameters for
urinary output in the pup. Difficulty in separating maternal and pup urine precluded the
collection of these data in our own studies. Therefore, urinary clearance values in the model
were determined by the fit of the serum to the time course data. Using the previously determined
kinetic parameters, the model-predicted urinary iodide, 4 hours after an iv dose of 131I- in the
PND 10 rat, was 14% of the pup dose, which is close to the range of values (0.61 to 10.9%)
given by Samel and Caputa (1965).
by guest on June 11, 2013http://toxsci.oxfordjournals.org/
Dow
nloaded from

23
Radioiodide Kinetics on PND 5. In order to determine whether the model would provide
reasonable predictions of iodide and perchlorate kinetics in younger pups (<PND 10), the model
was tested against data obtained in our laboratory after a single iv injection of 125I- on PND 5 of
the ClO4- drinking water study. Since the control group did not receive perchlorate during the
study, tissue 125I- data from these animals can be used to confirm the model’s ability to predict
kinetics in PND 5 rats. Figure 6 shows that the model-predicted radioiodide concentrations in
the maternal serum, thyroid and mammary gland and neonatal serum are in good agreement with
the available data on PND 5.
Up-regulation of thyroid NIS activity was modeled against the thyroid iodide levels
measured after 23 days of exposure to perchlorate in drinking water at doses of 0.01, 0.1, 1.0,
and 10.0 mg ClO4-/kg-day as was described in the Methods section. Using this equation for the
up-regulation of the follicular Vmaxc (VmaxcTFi) , it was possible to describe the increase in
iodide uptake based on the perchlorate dose in chronic exposure scenarios. Neither the measured
data nor the model showed any inhibition in iodide concentrations in the maternal thyroid 2 h
postdosing with 125I- after 18 days of exposure to 0.01, 0.1, 1.0 and 10.0 mg/kg ClO4- in drinking
water. Thus, the model was able to describe the up-regulation of thyroid NIS activity resulting
from subchronic perchlorate exposures.
Radioiodide Kinetics in Late Lactation. The model’s ability to simulate iodide kinetics at
later time points in lactation (>PND 10) was tested against the normalized data of several
literature studies. Figure 7 shows the model-predicted radioiodide milk:plasma ratio versus the
data of Brown-Grant (1957), Grosvenor (1963) and Potter et al. (1959) collected on PND 14, 17-
20 and 18, respectively. Although the simulation shown in Figure 7 was run on PND 14, there is
no noticeable change in the model-predicted milk:plasma ratio when run at different days in
by guest on June 11, 2013http://toxsci.oxfordjournals.org/
Dow
nloaded from

24
lactation. Despite the changing kinetics (body composition, suckling rate, etc.), the model
prediction of relative iodide concentration in the milk remains constant. Although the amount of
milk provided to the infant may change during the course of lactation, the concentration of iodide
does not. This assumption is supported by the available data, which do not show any increasing
or decreasing trend in milk iodide concentrations. Dietary iodine studies by Stolc et al. (1966;
1973a,b) also showed a relatively unchanging milk iodine concentration through the different
stages of lactation. The model predictions are in reasonable agreement with the trend suggested
by the total composite of the different data sets.
The maternal urinary iodide was tested against the data of Grosvenor (1960). For the
reasons mentioned previously, urine was not collected in our own studies. Thus, model
parameters for maternal urinary clearance (ClUci) were determined by fitting the model
simulation to serum time course data, while maintaining fits to data in the thyroid, mammary
gland and pup. Using these previously set parameters, the model predicts that 40.8% of the 131I-
dose will be excreted within 8 hours post-131I- dosing, which is within the range of 36.7 to 42.1%
reported in Grosvenor’s 1960 study.
Perchlorate-induced Inhibition of Iodide Uptake. The ability of the model to predict
inhibition of iodide uptake into the thyroid, milk and other tissues is not only important in
calculating risk to the dam and neonate, but is also indicative of the model’s ability to accurately
describe both perchlorate and iodide kinetics. Thus, the available data for perchlorate-induced
inhibition of iodide kinetics in lactation was used as the final validation of the current model
structure. Using the conditions for the inhibition time course study described in the methods
section, the model simulation was run to predict the effect of the administration of 1.0 mg ClO4-
/kg on the kinetic behavior of an iv dose of radioiodide (given 2 h post-ClO4- dosing). Figure 8
by guest on June 11, 2013http://toxsci.oxfordjournals.org/
Dow
nloaded from

25
shows that the model accurately simulates inhibition of iodide uptake in the maternal thyroid and
mammary gland. The simulations of the iodide inhibition kinetics in the mammary gland also
suggest that the model is able to predict the affect of perchlorate exposure on the availability of
iodide to the neonate. Although NIS inhibition would occur in both maternal GI and skin,
neither the data nor the model showed significant difference between the control and ClO4- dosed
animals, suggesting that other factors (i.e. diffusion, partitioning) are offsetting the effects of
symporter inhbition.
The model-predicted inhibition of both milk and thyroid iodide was validated against the
data of Potter et al. (1959). Potter and coauthors measured the amount of radioiodide ( 131I-)
taken up into the thyroid gland and the combined mammary gland and expressed milk 24 h after
dosing with iodide in PND 18 rats. The total effect on iodide uptake was measured after two
ClO4- doses given 1 h prior to and 30 min after the radioiodide dose. At these large doses of
ClO4-, thyroid iodide uptake is essentially blocked (approximately 99% inhibition). Therefore, it
is likely that the NIS transport of iodide into the mammary gland is also completely inhibited.
However, unlike the thyroid, the milk still showed significant amounts of iodide (approximately
10% of the control value at 24 h). It is possible that the second mammary transport mechanism
is responsible for this difference in tissue response to ClO4- exposure, because it depletes iodine
content in the mammary gland to the extent that passive diffusion between the gland and the
blood becomes significant. In contrast, passive diffusion of iodine into the thyroid is restricted
by the slow clearance via secretion of hormones into the blood, as well as the lower permeability
and partitioning of the anions suggested by the model. The ability of the model to predict the
combined mammary gland and milk control and ClO4- dosed data of Potter et al. (1959) (Figure
9) supports the accuracy of the description of iodide partitioning in the mammary gland and the
by guest on June 11, 2013http://toxsci.oxfordjournals.org/
Dow
nloaded from
26
second active transporter. The model predicts the data remarkably well despite significant
differences between this study and those used for model development, such as different time
points in lactation (PND 18 vs. 10) and a different dosing regimen.
Dietary Iodine. In three separate experiments, Stolc et al. (1966; 1973a,b) studied the
distribution of endogenous iodine in various tissues of the maternal and neonatal rat resulting
from a controlled intake of iodine through the diet and water. Model-predictions of the maternal
and neonatal tissue iodine concentrations are shown in Figure 10 versus data collected at water
and feed concentrations of 60 ng I/g and 500ng I/mL, respectively (Stolc et al., 1973b), which
corresponds to daily doses of 4.8 mg I/kg-d. Of the three dosing levels presented by Stolc and
coauthors, this highest dose was chosen to validate the model prediction of normal iodine
distribution, due to the fact that it is within the range of normal dietary intake for rats and it is
closest to dietary intake expected for our experimental studies (800 ng I/mg food). The two
lower dose groups would be considered moderately deficient and deficient iodine diets, resulting
in changes in the H-P-T axis in order to affect up-regulation as is evidenced by the measured
tissue iodine concentrations. Despite a 5-fold difference in water iodide concentrations, the
serum and thyroid concentrations remain unchanged. Other tissues, including the skin and GI,
do show a dose-dependent change in tissue concentration. Thus, since this model does not yet
include the pharmacodynamic response of the thyroid axis to dietary insufficiency, it is
premature to attempt to predict such data. Using kinetic parameters obtained from acute data,
the model is generally able to predict endogenous data within a factor of 2 of the measured data
for tissue concentrations ranging over more than four orders of magnitude (Figure 10).
While admittedly only a preliminary description, this endogenous iodine model could be
exercised to assess the affect of changing dietary intake on predicted acute radioiodide kinetics,
by guest on June 11, 2013http://toxsci.oxfordjournals.org/
Dow
nloaded from

27
as well as predicted perchlorate-induced inhibition of radioiodide kinetics in the perinatal and
adult rats. Since the radioiodide, endogenous iodine and perchlorate models operate
independently in tissues with passive diffusion, and are linked through competitive uptake in
tissues with NIS (e.g thyroid follicle), only tissues with active uptake are expected to show any
change in tissue concentrations with varying dietary intake. From this modeling exercise, it was
determined that the effects of changes in dietary iodine intake on acute radioiodide kinetics are
likely to be negligible. In fact, significant differences in predicted thyroid concentrations were
not observed at feed concentrations as high as 8.0 ppm (more than an order of magnitude higher
than standard laboratory diet). Indeed, the first apparent change in predicted inhibition of
thyroidal radioiodide uptake is seen at feed concentrations 100 times greater than standard
laboratory rat chow.
Sensitivity Analysis. Sensitivity analysis performed at 0.1 and 10.0 mg ClO4-/kg-day
drinking water revealed a dose-dependent difference in model sensitivity to several of the
chemical specific parameters (Figure 11). At 0.1 mg/kg-day, the maternal serum is primarily
dependent on serum binding, showing less sensitivity to urinary clearance. All other parameters
had calculated sensitivity coefficients less than 0.1. At the 10.0 mg/kg-day dose, binding
parameters are no longer important determinants of predicted serum levels. Only the urinary
clearance remains significant, with a sensitivity coefficient of – 0.87. Neonatal serum ClO4-
levels are influenced by several model parameters at the 0.1 mg/kg-day dose, including the
parameters defining passive diffusion and active transfer in the mammary gland, milk and
neonatal GI. However, similar to dam, neonatal serum AUC shows the greatest sensitivity to
serum binding parameters at this lower dose. At the higher dose (10.0 mg/kg-day), where active
uptake into the mammary gland and serum binding are likely saturated, partitioning into
by guest on June 11, 2013http://toxsci.oxfordjournals.org/
Dow
nloaded from
28
mammary gland and milk and urinary clearance (both maternal and neonatal) show the greatest
influence on pup serum ClO4- levels. Results of the sensitivity analysis for thyroid iodide uptake
(not shown) were similar, in that the magnitude of all of the parameter sensitivities were less
than one, although model predictions for this metric were sensitive to a much larger number of
input parameters. This result is not unexpected due to the fact that the uptake prediction is for a
specific point in time after administration of the radioiodide, and the rate of distribution into all
tissues can effect the time-dependent result (as compared to an average, or AUC, measure, which
reflects steady-state behavior). Thus, the validation of the model with kinetic thyroid iodine
uptake and inhibition data provides a reasonable test of the model parameterization.
Calculation of Internal Dose Metrics
The model was used to calculate internal dose metrics corresponding to both acute and
subchronic perchlorate exposure in the lactating and neonatal rat. These internal measures of
dose include: area under the curve (AUC) for ClO4- in the maternal and neonatal serum, relative
neonatal dose (% maternal dose) and inhibition of thyroid iodide uptake after acute dosing.
Table 3 shows the predicted neonatal dose on PND 10 as % maternal dose and as an amount
adjusted for milk intake and pup body weight. The model predicts a significant transfer of
maternal ClO4- to the neonate on PND 10 at low maternal doses. In fact, per kg body weight, the
PND 10 pup receives a greater dose than the dam (0.07 vs. 0.01 mg/kg BW). Tables 4 and 5
show the dose metric comparisons between the adult male, pregnant, fetal, lactating and neonatal
rats for serum ClO4- AUCs from drinking water exposure, as well as thyroid iodide inhibition
after acute iv exposures in the adult male, GD 20 pregnant and fetal rats, and the PND 10
lactating and neonatal rats. The internal dose metrics in the lactating and neonatal rat were
by guest on June 11, 2013http://toxsci.oxfordjournals.org/
Dow
nloaded from

29
compared to those of the male (Merrill et al., In Press), pregnant and fetal rat (Clewell et al., In
Press) in order to provide insight on relative exposure at different life stages. From Tables 4 and
5, it is apparent that while the lactating rat shows the highest serum ClO4- concentrations, the
fetal rat actually shows the greatest inhibition of thyroid iodide uptake.
DISCUSSION
The PBPK model is able to describe iodine kinetics across doses, exposure routes and
time points during lactation for both acute dosing and dietary iodine studies. The iodide model
was simplified by assuming that radiolabeled iodide could be described as free iodide in all
compartments other than the thyroid and plasma. Simulations were performed against total
radioiodide concentrations in extrathyroidal tissues and against inorganic and incorporated iodide
in thyroid and serum. Despite this simplification, the model is able to describe radiodide data in
maternal and neonatal tissues from PND 5 through 18 over doses spanning more than 4 orders of
magnitude, as well as distribution data from dietary iodine intake. Thus, the model description
of extrathyroidal tissue iodide uptake based on the transfer of inorganic iodide via NIS predicts
the data reasonably well without the added uncertainty or complexity of significant contribution
from the uptake of incorporated radioiodine by extrathyroidal tissues.
Although preliminary extrapolation of the acute iodide kinetic model to long-term
exposure scenarios compares favorably with the data, this model does not yet address the
feedback mechanisms involved in maintaining normal iodine homeostasis. However, the model
predicted interaction between dietary and administered radioiodide does indicate that the small
variations in laboratory rat chow expected between studies should not affect model predictions of
by guest on June 11, 2013http://toxsci.oxfordjournals.org/
Dow
nloaded from

30
radioiodide distribution or perchlorate-induced inhibition of thyroid radioiodide uptake. At the
dietary intake required to affect competition for NIS, serum levels would be high enough (>250
µg/L) to trigger a response from the thyroid known as the Wolff-Chaikoff effect, wherein the
thyroid appears to expel inorganic iodide from the cells (Wolff and Chaikoff, 1948). In order to
address cases of dietary iodine excess or deficiency, future elaborations of the model would have
to include a more detailed description of hormone distribution, homeostasis and regulation.
However, the present model should be useful for predicting tissue dosimetry and inhibition of
thyroid iodide uptake in the rat and for extrapolation to the average human with a normal iodide
diet.
The PBPK model described here also successfully reproduces measured perchlorate and
radioiodide distribution kinetics in the lactating rat and neonate. The model simulates ClO4-
distribution and transfer via breast milk with reasonable accuracy in drinking water exposures
ranging over three orders of magnitude (0.01 - 10.0 mg/kg-day) and at two time-points in
lactation, PND 5 and 10. In the absence of acute perchlorate kinetic data in rat lactation, we rely
on the consistency of this model structure and its parameters with those of the male rat (Merrill
et al., In Press), which successfully describes such data. Having accounted for differences in
physiology due to lactation, most of the remaining chemical specific parameters remain
essentially unchanged from those of the adult male rat. Therefore, we can assume that, like the
male rat model, the acute perchlorate kinetics can be adequately described with model structure
based on iodide kinetics. This is further supported by the ability of the model to predict acute
iodide inhibition kinetics, as inhibition of thyroid uptake is dependent on free serum perchlorate
levels. Additionally, in terms of exposure route, drinking water dosing is actually more relevant
to the risk assessment. Thus, the model is able to describe distribution to the target tissues and in
by guest on June 11, 2013http://toxsci.oxfordjournals.org/
Dow
nloaded from

31
the serum resulting from exposure via the route that is most applicable to that of humans. The
accuracy of the model ClO4- description allows us to answer two vital questions in determining
risk across life stages: 1) the dose to the neonate and 2) the relative sensitivity, with respect to
tissue dose and thyroid iodide inhibition, compared to the non-pregnant and pregnant adult, as
well as to the fetus (Tables 3 through 5).
Experiments in our laboratory have confirmed that perchlorate was indeed transferred to
the pup through suckling through the detection of ClO4- in milk, as well as in the neonate serum,
GI contents and skin (Figure 2). However, the small number of data points and the difficulty in
determining ingestion of milk, loss through urinary clearance and other competing processes
made the determination of neonatal dose quite difficult by classical methods. Because the model
accounts for physiological and kinetic differences, it is able to provide a reasonable estimate of a
previously uncharacterized measure of risk, ClO4- dose to the neonate (Table 3). In fact, the
model predicts that the pup receives a 7-fold greater perchlorate dose than the dam on PND 10
when adjusted for body weight at the lowest experimental dose (0.01 mg ClO4-/kg-day). This
difference between the maternal and neonatal dose disappears, however, at higher doses (10 mg
ClO4-/kg-day), where toxicity would be expected.
Additional calculations were performed with the model to determine the AUC for
perchlorate in serum across doses and life stages. Serum, rather than thyroid, perchlorate
concentration was designated as a dose metric for life-stage and species comparison.
Perchlorate’s action on the thyroid is the inhibition of iodide uptake, leading to diminished
intrathyroidal I- levels and potentially decreased hormone production. Since thyroid iodide
uptake inhibition is dependent on serum ClO4- levels, this variable was determined to be a more
appropriate dose metric by which to judge relative sensitivity to later effects. By comparing these
by guest on June 11, 2013http://toxsci.oxfordjournals.org/
Dow
nloaded from
32
measures of average serum concentrations across life stages, valuable insight can be gained
regarding relative sensitivity to perchlorate exposure. Thus it is evident that, despite the
increased dose to the neonate (0.07 vs. 0.01 mg/kg-day in the adult), the PND 10 pup serum
average ClO4- concentrations are consistently lower than those of the adult. In fact, a
comparison across life stages reveals that the serum ClO4- concentrations of the lactating dam
were slightly higher than the male, pregnant, fetal or neonatal rat, suggesting that lactation may
be the time period with the greatest internal perchlorate exposure. This increased serum
concentration of ClO4- in the lactating rat, suggested by both model simulations and measured
data, is somewhat surprising, considering the additional clearance route provided through the
milk, and is likely due to increased serum binding (Iino and Greer, 1961).
In developing the perchlorate thyroid model, some assumptions were made concerning
the mode of action, as well as in the designation of values for some of the parameters. The
model structure is highly dependent on the chosen definition of the mode of action, which in the
case of perchlorate involves the competitive binding of the perchlorate ion to NIS, resulting in
diminished I- thyroidal uptake and the active concentration of ClO4- in the thyroid cells.
Although it has been suggested that ClO4- may not be transferred into the thyrocytes based on
electrogenicity studies in oocytes (Soldin, 2002), the larger body of evidence suggests otherwise.
Specifically, published studies with both radiolobeled and cold perchlorate consistently report
thyroid: serum ratios that are greater than 1 and as much as 30 (Chow and Woodbury, 1970;
Clewell et al., 2002b; Clewell et al., In Press; Yu et al., 2002). Furthermore, ClO4- has been
shown in studies in our laboratory to be concentrated in all of the measured extra-thyroidal
tissues known to contain NIS, including the GI contents, skin and milk (see Figure 2 and Clewell
by guest on June 11, 2013http://toxsci.oxfordjournals.org/
Dow
nloaded from

33
et al, 2002b; Yu et al., 2002). A more detailed justification for the use of competitive inhibition
is available elsewhere (Clewell and Gearhart, 2002b).
Thus, this model structure is based upon competitive inhibition of iodide at the
symporter. However, despite the obvious influence this interpretation has on predicted internal
thyroid ClO4- levels, it actually has very little influence on the either thyroid iodide inhibition or
serum ClO4- levels. Since the relative thyroid volume is very small, the total amount of chemical
is quite low in spite of the high concentrations. Therefore, large changes in predicted thyroid
concentrations do not significantly affect blood levels. Additionally, the ability of ClO4- to
inhibit iodide uptake is based on the relative affinities and the amount of free ClO4- in the blood,
rather than the amount of perchlorate in the thyroid itself. Thus, the active uptake of perchlorate
into the thyroid cells, though included for pharmacokinetic accuracy, does not affect the
usefulness of the model for comparing life-stage and species differences in the precursors to
hormone disruption.
Linking the perchlorate and iodide models via competitive inhibition at the symporter
also enables the model to predict ClO4--induced inhibition of iodide uptake in the maternal and
neonatal tissues after acute ClO4- exposure in the lactating rat. Because ClO4
- has a greater
affinity for NIS than I-, it effectively inhibits uptake not only into the thyroid, but also into the
milk, stomach and skin. The model accurately predicts data on this inhibition of iodide uptake in
the maternal thyroid mammary gland and milk from our studies and those of Potter et al. (1959).
Although data are not available directly in the neonate, confidence in the model predictions is
increased by the ability of the maternal model, as well as the previously described sister models
in the male, pregnant and fetal rat (Clewell et al., In Press; Merrill et al., In Press), to describe
this inhibition using the same mechanistic construct and validated chemical specific parameters.
by guest on June 11, 2013http://toxsci.oxfordjournals.org/
Dow
nloaded from

34
Thus, the model provides a means for estimating neonatal inhibition of thyroid iodide in the
absence of such data.
The ability of ClO4- to reduce iodide levels in the milk, as well as uptake in thyroid,
presents a potentially increased health risk to the neonate. In order to quantitatively determine
the effect of maternal ClO4- exposure on the transfer of iodide in breast milk and subsequent
neonatal thyroid levels, the model predicted percent inhibition in maternal and neonatal thyroids
were compared to those generated for the male, pregnant and fetal rat with the models of Merrill
et al. (In Press) and Clewell et al. (In Press). In spite of the multiple inhibition sites (mammary
gland, milk and thyroid), inhibition in the neonatal thyroid was similar to that of the dam. This
may be due to the fact that neonatal serum perchlorate levels are less than those of the dam.
From the model estimates given in Table 5, the neonate shows less perchlorate-induced
inhibition of thyroid iodide uptake compared to the other life stages in the rat. Model estimates
suggest that the fetal rat thyroid is most vulnerable to inhibition, with a 10-fold greater inhibition
than the neonate at the lowest measured dose (0.01 mg/kg ClO4-).
Thus, it is possible to utilize these pharmacokinetic models to develop reasonable
estimates of internal dose metrics based on quantitative biological concepts and a variety of data
collected in different conditions, species and life stages. The chosen dose metrics are measures
of internal dose, and should be better indicators of relative risk than external dose (i.e.
perchlorate intake). However, these internal dose metrics are merely measures of the precursor
kinetics and do not give a complete picture of perchlorate’s affect on hormone homeostasis.
Indeed, determining which life stage is at greatest risk actually depends on the chosen precursor
dose metric. Of those presented in this paper, utilizing serum ClO4- levels indicates that the
by guest on June 11, 2013http://toxsci.oxfordjournals.org/
Dow
nloaded from

35
lactating dam is at highest risk, while thyroid iodide inhibition suggests the fetus is the most
sensitive life stage.
In reality, many factors must be taken into consideration when assessing the risk
associated with perchlorate exposure. For example, although the predicted thyroid inhibitions
across life stages indicate that the fetal thyroid is most vulnerable, overall risk to the fetus may
actually be less than that of the neonate. This is due to the fact that inhibition of thyroid iodide
uptake is only a precursor to hormone disruption. In gestation, maternal thyroid hormones are
available to the fetus, as opposed to lactation, where the neonate is responsible for its hormone
synthesis. Therefore, the maternal hormones may compensate for the increased inhibition seen
in the fetal thyroid resulting in less chance of adverse developmental effects. In fact, in the
developmental studies of York et al. (1999; 2001), the pregnant dam showed the greatest change
in serum TSH and T4 levels. Thus, it is possible that the additional pharmacodynamic
interactions (hormone synthesis, metabolism, etc.) could result in a relative risk profile not at all
suggested by the preliminary measurements of tissue dose or pharmacokinetic perturbations. For
this reason, further elaboration of these models to include hormone homeostasis and the
pharamocodynamic interactions is critical to improve the risk assessment for perchlorate.
This model allows the integration of a wide variety of physiological, biochemical and
dosimetry information, to produce parameter estimates consistent with measured perchlorate and
iodide kinetic data during important periods of development. In order to further assess model
performance, other analytical tools can be applied to the model, including statistical evaluation
of the goodness of model fit to present data sets, more comprehensive sensitivity analyses for
multiple dosimetrics and assessment of the effects of parameter variability on dose measures.
Sensitivity analysis (Figure 11) provides insight into the relative importance of model parameters
by guest on June 11, 2013http://toxsci.oxfordjournals.org/
Dow
nloaded from

36
with respect to specific measures of dose. The variability analysis, performed with known
distributions for model parameters, allows the prediction of likely ranges of the dosimetrics
within a human population. For the application of risk assessment, incorporation of a more
comprehensive evaluation of variability of the more sensitive model parameters will be more
important than a formal estimation with the present data sets.
An informative use of this PBPK model is in the correlation of predicted internal
dosimetrics to periods in gestation where perchlorate exposure and/or iodide deficiency has been
associated with developmental effects. The model can be used to predict tissue dosimetry in
effects studies and to pinpoint specific times in development fetal/neonatal iodide uptake is most
critical.
Further elaboration of these models to extrapolate dosimetry to humans has been
explored elsewhere (Clewell et al., 2001; Clewell and Gearhart, 2002a). Together with the
models of Merrill et al. (2001; In Press) and Clewell et al. (In Press), this model can be used to
approximate species and life stage kinetic differences at specific doses. Furthermore, since these
PBPK models to relate complex pharmacokinetic variables back to the basic physiological and
biochemical parameters that are often measurable, we can use the comparative information
provided by the PBPK models about the chemical kinetics to develop quantitative estimates of
species and life stage differences. Thus, it is possible to extrapolate these models to the
population of interest (human gestation and lactation), in order to run simulations for sensitive
human populations at a variety of exposure scenarios to estimate internal dose (Clewell et al.,
2001).
by guest on June 11, 2013http://toxsci.oxfordjournals.org/
Dow
nloaded from

37
ACKNOWLEDGEMENTS
The animals used in in-house studies were handled in accordance with the principles
stated in the Guide for the Care and Use of Laboratory Animals, National Research Council,
1996, and the Animal Welfare Act of 1966, as amended.
The authors would like to thank Tammie Covington, Harvey Clewell, Dr. Melvin
Andersen and Dr. Peter Robinson for their modeling advice; Latha Narayanan and Gerry Buttler
for sample analyses; Charles Goodyear for performing statistical analyses of the data; and Dick
Godfrey, Peggy Parish, Susan Young, TSgt Todd Ligman, MSgt Jim McCafferty, Tim Bausman,
SSgt Paula Todd and MSgt Rick Black for technical support. The authors would like to
acknowledge Annie Jarabek, LtCol Dan Rogers, Dr. David Mattie, Dr. Richard Stotts and the
U.S. Air Force for their support of this project and the U.S. Navy for financial support.
by guest on June 11, 2013http://toxsci.oxfordjournals.org/
Dow
nloaded from
38
REFERENCES
Altman, P.L., and Dittmer, D.S. (1971). Volume of blood in tissue: Vertebrates. In Respiration
and Circulation. Ch. 148, pp. 383-387. Federation of American Societies for Experimental
Biology: Bethesda, MD.
Anbar M., Guttmann S., Lewitus Z. 1959. The mode of action of perchlorate ions on the iodine
uptake of the thyroid gland. Int J Appl Radiat Isot. 7, 87-96.
Andersen, M. E., Gargas, M. L. Ramsey, J. C. (1984). Inhalation pharmacokinetics: Evaluating
systemic extraction, total in vivo metabolism, and the time course of enzyme induction for
inhaled styrene in rats based on arterial blood:inhaled air concentration ratios. Toxicol. Appl.
Pharmacol. 73(1), 176-187.
Bekkedal, M.Y., Carpenter, T.L., Mattie, D.R. (2001). A neurodevelopmental study of the effects
of oral ammonium perchlorate exposure on the motor activity of pre-weanling rat pups.
Toxicol. Sci. 60(1-S), 218 (Abstract).
Brown, R.P., Delp, M.D., Lindstedt, S.L., Rhomberg, L.R., Beliles, R.P. (1997). Physiological
parameter values for physiologically based pharmacokinetic models. Toxicol. Ind. Health 13,
407-484.
Brown-Grant, K. (1957). The iodide concentrating mechanism in the mammary gland. J. Physiol.
135, 644-654.
Brown-Grant, K. (1961). Extrathyroidal iodide concentrating mechanisms. Physiol. Rev. 41, 189-
213.
Brown-Grant, K., and Pethes, G. (1959). Concentration of radioiodine in the skin of the rat. J.
Physiol. 148, 683-693.
by guest on June 11, 2013http://toxsci.oxfordjournals.org/
Dow
nloaded from

39
Carr, C.W. (1952). Studies on the binding of small ions in protein solutions with the use of
membrane electrodes. I. The binding of the chloride ion and other inorganic anions in
solutions of serum albumin. Arch. Biochem. Biophys. 40, 286-294.
Chow, S.Y., and Woodbury, D.M. (1970). Kinetics of distribution of radioactive perchlorate in
rat and guinea-pig thyroid glands. J. Endocrinol., 47, 207-218.
Chow, S.Y., Chang, L.R., and Yen, M.S. (1969). A comparison between the uptakes of
radioactive perchlorate and iodide by rat and guinea pig thyroid glands. J. Endocrinol. 45, 1-
8.
Clewell, R.A., and Gearhart, J.M. (2002a). Pharmacokinetics of Toxic Chemicals in Breast Milk:
Use of PBPK Models to Predict Infant Exposure. Environ. Health Perspect. 110(6), A333-
A337.
Clewell, R.A., and Gearhart, J.M. (2002b). Response to Dr. Soldin’s Comments on the Proposed
PBPK Model to Predict Infant Exposure: Pharmacokinetics of Toxic Chemicals in Breast
Milk. Environ. Health Perspect. 110(11), A663-664.
Clewell, R.A., Merrill, E.A., Robinson, P.J. (2001). The use of physiologically based models to
integrate diverse data sets and reduce uncertainty in the prediction of perchlorate kinetics
across life stages and species. Toxicol. Ind. Health. 17, 210-222.
Clewell, R.A., Merrill, E.A., Yu, K.O., Mahle, D.A., Sterner, T.R., Fisher, J.W., Gearhart, J.M.
(In Press). Predicting fetal perchlorate dose and inhibition of iodide kinetics in gestation: A
physiologically based pharmacokinetic analysis of perchlorate and iodide kinetics in the rat.
Toxicol. Sci. (Accepted for publication in Toxicological Sciences March 3, 2003).
by guest on June 11, 2013http://toxsci.oxfordjournals.org/
Dow
nloaded from

40
Cline T.R., Plumlee M.P., Christian J.E., Kessler W.V. (1969). Effect of potassium perchlorate
and sodium chloride given orally upon radioiodide deposition into milk of goats. J. Dairy
Sci. 52(7), 1124-1126.
Conde, E., Martin-Lacave, I., Godalez-Campora, R., Galera-Davidson, H. (1991). Histometry of
normal thyroid glands in neonatal and adult rats. Am. J. Anat. 191, 384-390.
Delange, F. (2000). The role of iodine in brain development. Proc. Nutr. Soc. 59, 75-79.
Fisher, J., Todd, P., Mattie, D., Godfrey, D., Narayanan, L., Yu, K. (2000). Preliminary
development of a physiological model for perchlorate in the adult male rat: a framework for
further studies. Drug Chem. Toxicol. 23, 243-258.
Fisher, J.W., Whittaker, T.A., Taylor, D.H., Clewell, H.J., Andersen, M.E. (1990).
Physiologically based pharmacokinetic modeling of the lactating rat and nursing pup: A
multiroute exposure model for trichloroethylene and its metabolite, trichloroacetic acid:
Toxicol. Appl. Pharmacol. 102(3), 497-513.
Fisher, J.W. (2002). Personal electronic communication between J.W. Fisher and R.A. Clewell.
July 26, 2002 6:04 PM.
Florsheim, W.H., Faircloth, M.A., Corcorran, N.L., Rudko, P. (1966). Perinatal thyroid function
in the rat. Acta Endocrinol. 32, 375-332.
Gluzman, B.E., and Niepomniszcze, H. (1983). Kinetics of the iodide trapping mechanism in
normal and pathological human thyroid slices. Acta Endocrinol. 103, 34-39.
Golstein, P., Abramow, M., Dumont, J.E., Beauwens, R. (1992). The iodide channel of the
thyroid: A membrane vesicle study. Am. J. Physiol. 263, C590-597.
Grosvenor, C.E. (1960). Secretion of I131 into milk by lactating rat mammary glands. Am. J.
Physiol. 199(3), 419-422.
by guest on June 11, 2013http://toxsci.oxfordjournals.org/
Dow
nloaded from

41
Grosvenor, C.E. (1963). I131 accumulation by the lactating rat mammary gland. Am. J. Physiol.
204(5), 856-860.
Haddow, J.E., Palomaki, G.E., Allan, W.C., Williams, J.R., Knight, G.J., Gagnon, J., O’Heir,
C.E., Mitchell, M.L., Hermos, R.J., Waisbren, S.E., Faix, J.D., Klein, R.Z. (1999). Maternal
thyroid deficiency during pregnancy and subsequent neuropsychological development of the
child. New Eng. J. Med. 341, 549-555.
Halmi, N.S., and Stuelke, R.G. (1959). Comparison of thyroidal and gastric iodide pumps in rats.
Endocrinology. 64, 103-109.
Hanwell, A., and Linzell, J.L. (1973). The time course of cardiovascular changes in the rat. J.
Physiol. 233, 99-109.
Harden, R.G., Alexander, W.D., Shimmins, J., Robertson, J.W. (1968). A comparison between
the inhibitory effect of perchlorate on iodide and pertechnetate concentrations in saliva in
man. Q. J. Exp. Physiol. Cogn. Med. Sci. 3, 227-238.
Honour, A.J., Myant, N.B., Rowlands, E.N. (1952). Secretion of radioiodine in digestive juices
and milk in man. Clin. Sci. 11, 447-463.
Howdeshell, K. L. (2002). A model of the development of the brain as a construct of the thyroid
system. Environ. Health Perspect., 110(3), 337-348.
Iino, S., and Greer, M.A. (1961). Thyroid function in the rat during pregnancy and lactation.
Endocrinology. 68, 253-262.
Klein, A.H., Meltzer, S., Kenny, F.M. (1972). Improved prognosis in congenital hypothyroidism
treated before age three months. J. Pediatr. 81, 912-915.
Knight, C.H., Docherty, A.H., Peaker, M. (1984). Milk yield in the rat in relation to activity and
size of the mammary secretory cell population. J. Dairy. Res. 51, 29-35.
by guest on June 11, 2013http://toxsci.oxfordjournals.org/
Dow
nloaded from
42
Kosugi, S., Sasaki, N., Hai, N., Sugawa, H., Aoki, N., Shigemass, C., Mori, T., Yoshida, A.
(1996). Establishment and characterization of a Chinese hamster ovary cell line, CHO-4J,
stably expressing a number of Na+/I- symporters. Biochem. Biophys. Res. Commun., 227(1),
94-101.
Kotani, T., Ogata, Y., Yamamoto, I., Aratake, Y., Kawano, J.I., Suganuma, T., and Ohtaki, S.
(1998). Characterization of gastric Na+/I- symporter of the rat. Clin. Immunol.
Immunopathol. 89, 271-278.
Kotyk, A., and Janacek, K. (1977). Transport of ions. In Membrane transport: An
interdisciplinary approach, Ch. 5, pp. 243-247. Plenum Press, New York.
Lazarus, J.H., Harden, R.M., Robertson, J.W.K. (1974). Quantitative studies of the inhibitory
effect of perchlorate on the concentration of 36ClO4-, 125I-, and 99mTcO4
- in salivary glands of
male and female mice. Arch. Oral. Biol. 19, 493-498.
Lengemann, F.W. (1965). Factors affecting iodine concentration in bovine milk. J. Dairy Sci. 48,
197-202.
Mahle, D.A., Godfrey, R.J., McCafferty, J.D., Bausman, T.A., Narayanan, L., Parish, M.A.,
Todd, P.N., Ligman, T.A., Mattie, D.R., Yu, K.O. (2002). Kinetics of perchlorate and iodide
in lactating S-D rats and pups at postnatal day 10. Toxicol. Sci, 66(1-S), 139 (Abstract).
Mahle, D.A., Yu, K.O., Narayanan, L., Mattie, D.R., Fisher, J.W. (In Press). Thyroid Hormonal
Changes in Cross-Fostered Sprague-Dawley Rat Litters Exposed to Perchlorate. Int. J.
Toxicol. (Accepted for publication in International Journal of Toxicology December, 2002).
Malendowicz, L.K., and Bednarek, J. (1986). Sex dimorphism in the thyroid gland. Acta Anat.
127, 115-118.
by guest on June 11, 2013http://toxsci.oxfordjournals.org/
Dow
nloaded from

43
Merrill E.A., Clewell R.A., Gearhart J.M., Robinson P.J., Sterner T.R., Yu K.O., and Fisher J.W.
(In Press). PBPK model for perchlorate-induced radioiodide inhibition in the male rat.
Toxicol. Sci. (Accepted for Publication in Toxicological Sciences March 3, 2003).
Merrill E.A., Jarabek A.M., Mattie D.R., Fisher J.W. 2001. Human PBPK model for perchlorate
inhibition of iodide uptake in the thyroid. Toxicol. Sci.; 60(1-S):148 (Abstract).
Motzer, W.E. 2001. Perchlorate: Problems, detection, and solutions. Environ. Forensics. 2(4),
301-311.
Naismith, D.J., Richardson, D.P., Pritchard, A.E. (1982). The utilization of protein and energy
during lactation in the rat, with particular regard to the use of fat accumulated during
pregnancy. Br. J. Nutr. 48, 433-441.
Narayanan, L., Buttler, G.W., Yu, K.O, Mattie, D.R., Fisher, J.W. (In Press). Sensitive high
performance liquid chromatography method for the determination of low levels of
perchlorate in biological samples. J. Chrom. B. (Accepted for publication in Journal of
Chromatography B December 23, 2002).
Palou, A., Remesar, X., Arola, L., Alemany, M. (1983). Body and organ size and composition
during late foetal and postnatal development of rat. Comp. Biochem. Physiol. A, 75(4), 597-
601.
Pena, H.G., Kessler, W.V., Christian, J.E., Cline, T.R., Plumlee, M.P. (1976). A comparative
study of iodine and potassium perchlorate metabolism in the laying hen. 2. Uptake,
distribution, and excretion of potassium perchlorate. Poult. Sci. 55, 188-201.
Porterfield, S.P. (1994). Vulnerability of the developing brain to thyroid abnormalities:
Environmental insults to the thyroid system. Environ. Health Perspect. 102(Suppl. 2), 125-
130.
by guest on June 11, 2013http://toxsci.oxfordjournals.org/
Dow
nloaded from

44
Potter, G.D., Tong, W., Chaikoff, I.L. (1959). The metabolism of I131-labeled iodine, thyroxine,
and triiodothyronine in the mammary gland of the lactating rat. J. Biol. Chem. 243(2), 350-
354.
Rakusan, K., and Marcinek, H. (1973). Postnatal development of the cardiac output distribution
in rat. Biol. Neonate. 22 (1), 58-63.
Samel, M., and Caputa, A. (1965). The role of the mother in 131I metabolism of sucking and
weanling rats. Can. J. Physiol. Pharmacol. 43, 431-436.
Scatchard, G., and Black, E.S. (1949). The effects of salts on the isoionic and isoelectric points
of proteins. J. Phys. Colloid Chem. 53, 88-99.
Shennan, D.B., and Peaker, M. (2000). Transport of milk constituents by the mammary gland.
Physiol. Rev. 80(3), 925-951.
Soldin O.P. (2002). Proposed PBPK model to predict infant exposure to toxic chemicals in breast
milk. Environ Health Perspect. 110 (11), A663.
Spitzweg C., Joba W., Eisenmenger W., Heufelder A.E. (1998). Analysis of human sodium
iodide symporter gene expression in extrathyroidal tissues and cloning of its complementary
deoxyribonucleic acids from salivary gland, mammary gland, and gastric mucosa. J. Clin.
Endocrinol. Metab. 83, 1746-1751.
Stolc V., Knopp J., Stolcova, E. (1966). Iodine, solid diet, water and milk intake by lactating rats
and their offspring. Physiol. Bohemoslov. 15(3), 219-225.
Stolc V., Knopp, J., Stolcova E. (1973a). Iodine concentration and content in the organs of rat
during postnatal development. Biol. Neonate. 23, 35-44.
Stolc V., Knopp J., Stolcova E. (1973b). Effect of varying iodine intake on its concentration in
rat tissues during early development. Biol. Neonate. 23 , 339-345.
by guest on June 11, 2013http://toxsci.oxfordjournals.org/
Dow
nloaded from

45
Tazebay U.H., Wapnir I.L., Levy O., Dohan O., Zuckier L.S., Zhao Q.H., Deng, H.F., Amenta,
P.S., Fineberg, S., Pestell., R.G., Carrasco, N. (2000). The mammary gland iodide transporter
is expressed during lactation and in breast cancer. Nat. Med. 6, 871-878.
Vigouroux, E. (1976). Dynamic study of postnatal thyroid function in the rat. Acta Enocrinol.
83(4), 752-762.
Vigouroux, E., and Rostaqui, N. (1980). Particular aspects of thyroid function development in
the postnatal rat with special reference to interrelationships between mother and young.
Reprod. Nutr. Dev. 20(1B), 209-215.
Wolff, J. (1964). Transport of iodide and other anions in the thyroid gland. Physiol. Rev. 44, 45-
90.
Wolff, J. (1998). Perchlorate and the thyroid gland. Pharmacolog. Rev. 50, 89-105.
Wolff, J., and Chaikoff, I. L. (1948). Plasma inorganic iodide as a homeostatic regulator of
thyroid function. J. Biol. Chem. 174, 555-564.
York, R.G., Brown, W.R., Girard, M.F., Dollarhide, J.S. (2001). Two-generation reproduction
study of ammonium perchlorate in drinking water in rats evaluates thyroid toxicity. Int. J.
Toxicol. 20, 183-197.
York, R.G., Parker, R.M., Mattie, D.R., Dodd, D.E. (1999). A neurobehavioral developmental
study of ammonium perchlorate administered orally in drinking water to rats. Toxicol. Sci.
48(1-S), 111 (Abstract).
Yu K, Mahle D, Narayanan L, Godfrey R, Todd P, Parish P, McCafferty J, Ligman T, Sterner T,
Buttler G, Mattie D, Fisher J. 2001. Tissue distribution and inhibition of iodide uptake by
perchlorate in pregnant and lactating rats in drinking water studies. Toxicol. Sci., 60(1):291
(Abstract).
by guest on June 11, 2013http://toxsci.oxfordjournals.org/
Dow
nloaded from

46
Yu, K. O., Narayanan, L., Mattie, D. R., Godfrey, R. J., Todd, P. N., Sterner, T. R., Mahle, D.
A., Lumpkin, M. H., and Fisher, J. W. (2002). The pharmacokinetics of perchlorate and its
effect on the hypothalamus/pituitary-thyroid axis in the male rat. Toxicol. Appl. Pharmacol.
182(2), 148-159.
Zeghal, N., Redjem, M., Gondran, F., Vigouroux, E. (1995). [Analysis of iodine compounds in
young rat skin in the period of suckling and in the adult. Effect of perchlorate]. Arch.
Physiol. Biochem. 103, 502-511.
by guest on June 11, 2013http://toxsci.oxfordjournals.org/
Dow
nloaded from

47
Figure Titles
Figure 1. (A) Schematic of perchlorate PBPK model for lactating dam (left) and neonate (right).
Model structure for sister iodine model is similar. Differences are contained within the inset area
outlined with the dashed line. (B) Thyroid and serum compartments for radioiodide, with
additional compartments for the incorporation of iodide into hormones in the thyroid and
secretion of the hormones into the serum incorporated iodine compartment as is discussed in the
Methods section.
Figure 2. Perchlorate concentration in maternal (A) serum (Clewell et al., 2001) (B) thyroid (up-
regulated) (Clewell et al., 2001) (C) GI contents (D) mammary gland (E) milk (Clewell and
Gearhart, 2002a) and (F) male neonatal serum (Clewell and Gearhart, 2002) at the 0.01, 0.1, 1.0
and 10.0 mg/kg-day doses on PND 5 and 10. Solid lines indicate model prediction. Cross-bars
indicate mean ± SD of the measured data.
Figure 3. Concentration of maternal (A) inorganic radioiodide in serum, (B) plasma bound
radioiodine, (C) thyroidal inorganic radioiodide and incorporated radioiodine, (D) mammary
gland and neonatal (E) serum after an iv dose to the dam of 2.10 ng/kg 125I- on PND 10.
Figure 4. Concentration of neonatal (A) plasma bound radioiodine and plasma inorganic
radioiodide, (B) thyroidal incorporated radioiodine and inorganic radioiodide, (C) GI contents
(●) and skin (□) radioiodide and (D) maternal total serum and thyroid radioiodine after an oral
gavage of 1.0 ng/kg 125I- to the pup on PND 10.
by guest on June 11, 2013http://toxsci.oxfordjournals.org/
Dow
nloaded from

48
Figure 5. Amount of radioiodide in (A) maternal and (B) neonatal thyroid after iv dose to dam
and in (C) maternal and (D) neonatal serum after iv dose to pup on PND 10 versus the
normalized data (1.0 ng 131I-) of (○) Iino and Greer (1961), (■) Samel and Caputa (1965), (▲)
Vigouroux (1976) and (●) Vigouroux and Rostaqui (1980).
Figure 6. Radioiodide concentration in maternal serum, mammary gland, thyroid and neonatal
serum versus the measured data after an iv dose of 33,000 ng/kg 131I- to the dam on PND 5.
Figure 7. Radioiodide milk:plasma concentration after an iv dose to the dam versus the combined
literature data. The data points represent individual measurements provided in (▲) Brown-Grant
(1957), (●) Grosvenor (1963) and (■) Potter et al. (1959) on PND 14, 18 and 17-20, respectively.
Figure 8. Iodide concentration in (A) maternal thyroid and (B) mammary gland with and without
1.0 mg/kg ClO4- iv dose 2 hours prior to an iv dose of 2.10 ng/kg 125I- to the dam on PND 10.
The top simulation (solid line) and data (□) indicate the control group. The lower simulation
(dashed line) and data (■) indicate inhibition.
Figure 9. Radioiodide concentration in milk with and without ClO4- (Clewell et al., 2001).
Perchlorate doses of 25 mg and 12.5 mg were given to the dam 30 min before and 4 h after
administration of 131I-, respectively. The top simulation and data (▲) indicate the control group.
The lower simulation and data (●) indicate the inhibition group. Data points represent milk
samples from individual dams from Potter et al. (1959).
by guest on June 11, 2013http://toxsci.oxfordjournals.org/
Dow
nloaded from

49
Figure 10. Model predicted tissue iodine vs. measured data of Stolc et al. (1973b) with a normal
dietary intake (approx. 560 ng/day). Standard deviations were given with the measured maternal
data only.
Figure 11. Calculated sensitivity coefficients for model parameters with respect to serum
perchlorate AUC at drinking water doses of 0.1 and 10.0 mg/kg-day.
by guest on June 11, 2013http://toxsci.oxfordjournals.org/
Dow
nloaded from

50
Neonate
KidneyQK
Urine
KidneyQK
Urine
RBCs
bound
free
PlasmaQC
SlowlyPerfused
QT
QS
LiverQL
RichlyPerfused
QR
Colloid
ThyroidFollicle
Stroma
BoundIodide
Skin
SkinBlood
Skin
SkinBlood QSK
FatQF
CA
GIContents
GITissue
GIBlood
QG
QG
KidneyQK
Pup Urine
Plasma
Ktrans
ClUC_N
Milk
Lactating Female
RBCs
bound
free
PlasmaQC
Ivc
SlowlyPerfused
QT
QS
LiverQL
RichlyPerfused
QR
Colloid
ThyroidFollicle
Stroma
Skin
SkinBlood QSK
FatQF
CA
GIContents
GITissue
GIBlood
QG
QG
pDose
Plasma
QM
Milk
Mammary Tissue
Mammary Blood
(inset)
Lactating Female
RBCs
bound
free
PlasmaQC
Ivc
SlowlyPerfused
QT
QS
LiverQL
RichlyPerfused
QR
Colloid
ThyroidFollicle
Stroma
Skin
SkinBlood
Skin
SkinBlood QSK
FatQF
CA
GIContents
GITissue
GIBlood
QG
QG
pDose
Plasma
QM
Milk
Mammary Tissue
Mammary Blood
(inset)
Figure 1A.
by guest on June 11, 2013http://toxsci.oxfordjournals.org/
Dow
nloaded from

51
RBCs
I-
QC
Ivc
QT
Colloid
ThyroidFollicle
Stroma
CA
Plasma
(inset)
Alb-I-Alb-T3, Alb-T4, fT3, fT4
IncorporatedAlb-T3, Alb-T4, fT3, fT4
Incorp. Bound
RBCs
I-
QC
Ivc
QT
Colloid
ThyroidFollicle
Stroma
CA
Plasma
(inset)
Alb-I-Alb-T3, Alb-T4, fT3, fT4
IncorporatedAlb-T3, Alb-T4, fT3, fT4
Incorp. Bound
Figure 1B.
by guest on June 11, 2013http://toxsci.oxfordjournals.org/
Dow
nloaded from

52
0 64 128 192 256 320
0.01
0.1
1.0
10.0
Time after Parturition (hours)
Perc
hlor
ate
in M
ater
nal S
erum
(m
g/L
)
A
0 64 128 192 256 320
0.01
0.1
1.0
10.0
Time after Parturition (hours)
Perc
hlor
ate
in M
ater
nal S
erum
(m
g/L
)
A
0 64 128 192 256 320
0.1
1.0
10
100
Time after Parturition (hours)
Perc
hlor
ate
in M
ater
nal T
hyro
id (
mg/
L)
B
0 64 128 192 256 320
0.1
1.0
10
100
Time after Parturition (hours)
Perc
hlor
ate
in M
ater
nal T
hyro
id (
mg/
L)
B
0 64 128 192 256 320
0.1
1.0
10
100
Time after Parturition (hours)
Perc
hlor
ate
in M
ater
nal G
I C
onte
nts
(mg/
L) C
0 64 128 192 256 320
0.1
1.0
10
100
Time after Parturition (hours)
Perc
hlor
ate
in M
ater
nal G
I C
onte
nts
(mg/
L) C
320256192128640
0.01
0.1
1.0
Time after Parturition (hours)
Perc
hlor
ate
in M
amm
ary
Gla
nd (
mg/
L)
D
320256192128640
0.01
0.1
1.0
Time after Parturition (hours)
Perc
hlor
ate
in M
amm
ary
Gla
nd (
mg/
L)
D
by guest on June 11, 2013http://toxsci.oxfordjournals.org/
Dow
nloaded from

53
Figure 2
0 64 128 192 256 320
0.01
1.0
10.0
Time after Parturition (hours)
Perc
hlor
ate
in M
ilk
(mg/
L)
0.1
E
0 64 128 192 256 320
0.01
1.0
10.0
Time after Parturition (hours)
Perc
hlor
ate
in M
ilk
(mg/
L)
0.1
E
Time after Parturition (hours)
0 64 128 192 256 320
0.01
0.1
1.0
10.0
Perc
hlor
ate
in M
ale
Neo
nata
l Ser
um (
mg/
L) F
Time after Parturition (hours)
0 64 128 192 256 320
0.01
0.1
1.0
10.0
Perc
hlor
ate
in M
ale
Neo
nata
l Ser
um (
mg/
L) F
by guest on June 11, 2013http://toxsci.oxfordjournals.org/
Dow
nloaded from
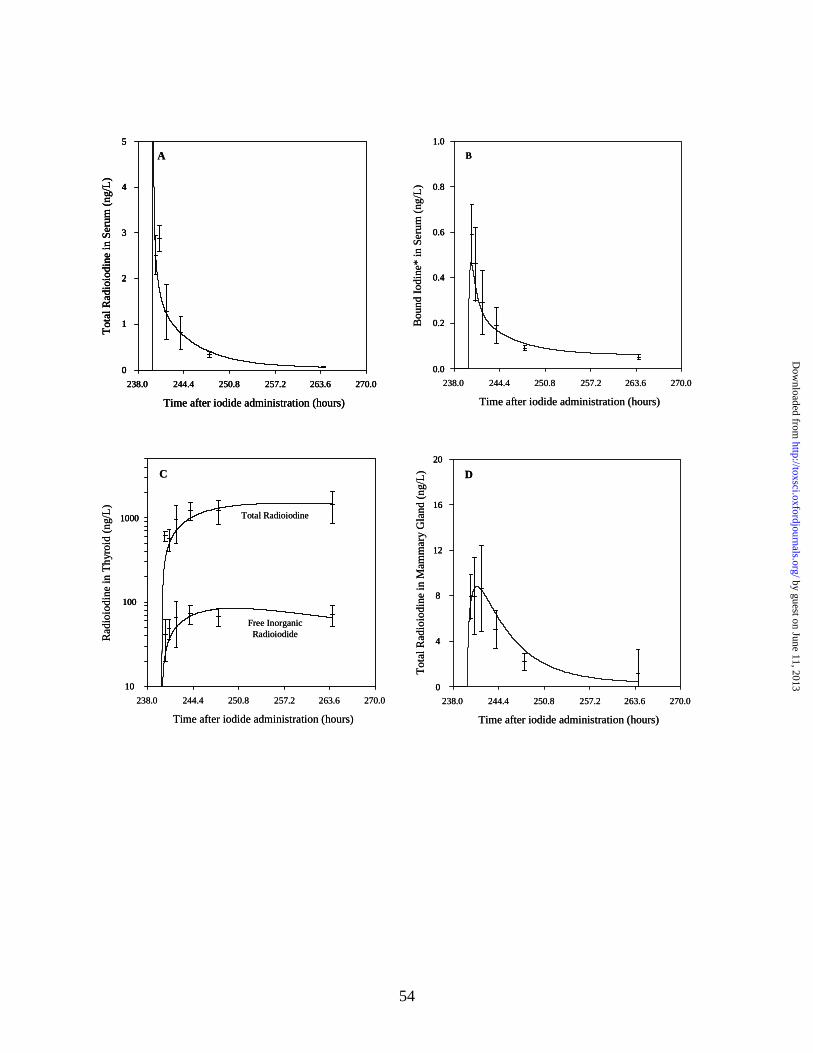
54
238.0 244.4 250.8 257.2 263.6 270.0
Time after iodide administration (hours)
0
1
2
3
4
5
Tot
al R
adio
iodi
nein
Ser
um (
ng/L
)
A
238.0 244.4 250.8 257.2 263.6 270.0
Time after iodide administration (hours)
0
1
2
3
4
5
Tot
al R
adio
iodi
nein
Ser
um (
ng/L
)
238.0 244.4 250.8 257.2 263.6 270.0
Time after iodide administration (hours)
0
1
2
3
4
5
0
1
2
3
4
5
Tot
al R
adio
iodi
nein
Ser
um (
ng/L
)
A
238.0 244.4 250.8 257.2 263.6 270.0
Time after iodide administration (hours)
0.0
0.2
0.4
0.6
0.8
1.0
Bou
nd I
odin
e* in
Ser
um (
ng/L
)
B
238.0 244.4 250.8 257.2 263.6 270.0
Time after iodide administration (hours)
0.0
0.2
0.4
0.6
0.8
1.0
0.0
0.2
0.4
0.6
0.8
1.0
Bou
nd I
odin
e* in
Ser
um (
ng/L
)
B
238.0 244.4 250.8 257.2 263.6 270.0
Time after iodide administration (hours)
10
100
1000
Rad
ioio
dine
in T
hyro
id (
ng/L
)
Free Inorganic Radioiodide
Total Radioiodine
C
238.0 244.4 250.8 257.2 263.6 270.0
Time after iodide administration (hours)
10
100
1000
10
100
1000
Rad
ioio
dine
in T
hyro
id (
ng/L
)
Free Inorganic Radioiodide
Total Radioiodine
C
238.0 244.4 250.8 257.2 263.6 270.0
Time after iodide administration (hours)
0
4
8
12
16
20
Tot
al R
adio
iodi
ne in
Mam
mar
y G
land
(ng
/L) D
238.0 244.4 250.8 257.2 263.6 270.0
Time after iodide administration (hours)
0
4
8
12
16
20
0
4
8
12
16
20
Tot
al R
adio
iodi
ne in
Mam
mar
y G
land
(ng
/L) D
by guest on June 11, 2013http://toxsci.oxfordjournals.org/
Dow
nloaded from

55
Figure 3
238.0 244.4 250.8 257.2 263.6 270.0
0.3
0.6
0.9
1.2
1.5
0.0Tot
alR
adio
labe
led
Iodi
de in
Mal
e N
eona
te S
erum
(n
g/L
)
Time after iodide administration (hours)
E
238.0 244.4 250.8 257.2 263.6 270.0
0.3
0.6
0.9
1.2
1.5
0.0Tot
alR
adio
labe
led
Iodi
de in
Mal
e N
eona
te S
erum
(n
g/L
)
Time after iodide administration (hours)
E
by guest on June 11, 2013http://toxsci.oxfordjournals.org/
Dow
nloaded from

56
Figure 4
240 315300285270255
100
102
Time after iodide administration (hours)
Rad
ioio
dine
in M
ater
nal T
issu
es (
ng/L
)
Thyroid
Serum
104
101
103
105
D
240 315300285270255
100
102
Time after iodide administration (hours)
Rad
ioio
dine
in M
ater
nal T
issu
es (
ng/L
)
Thyroid
Serum
104
101
103
105
D
240 315300285270255
10
100
1000
Time after iodide administration (hours)
Rad
ioio
dine
in N
eona
te S
erum
(ng
/L)
Total Iodine
Bound Iodine
A
240 315300285270255
10
100
1000
Time after iodide administration (hours)
Rad
ioio
dine
in N
eona
te S
erum
(ng
/L)
Total Iodine
Bound Iodine
240 315300285270255
10
100
1000
Time after iodide administration (hours)
Rad
ioio
dine
in N
eona
te S
erum
(ng
/L)
Total Iodine
Bound Iodine
A
240 315300285270255
103
104
Time after iodide administration (hours)R
adio
iodi
nein
Neo
nate
Thy
roid
(ng
/L)
Total Iodine
Free Iodide
105
106
B
240 315300285270255
103
104
Time after iodide administration (hours)R
adio
iodi
nein
Neo
nate
Thy
roid
(ng
/L)
Total Iodine
Free Iodide
105
106
B
240 315300285270255
102
103
Time after iodide administration (hours)
Rad
ioio
dine
in N
eona
te T
issu
es (
ng/L
)
GI Contents
Skin
104
C
240 315300285270255
102
103
Time after iodide administration (hours)
Rad
ioio
dine
in N
eona
te T
issu
es (
ng/L
)
GI Contents
Skin
104
C
by guest on June 11, 2013http://toxsci.oxfordjournals.org/
Dow
nloaded from

57
Figure 5
Time after iodide administration (hours)
Rad
ioio
dide
in M
ater
nal T
hyro
id (
ng)
0.2
0.4
0.0
1.0
0.8
0.6
Dose Administered to Dam
15 25201050
A
Time after iodide administration (hours)
Rad
ioio
dide
in M
ater
nal T
hyro
id (
ng)
0.2
0.4
0.0
1.0
0.8
0.6
Dose Administered to Dam
15 25201050
A
Time after iodide administration (hours)R
adio
iodi
de in
Neo
nata
l Thy
roid
(ng
)
0.2
0.4
0.0
1.0
0.8
0.6
Dose Administered to Dam
15 25201050
B
Time after iodide administration (hours)R
adio
iodi
de in
Neo
nata
l Thy
roid
(ng
)
0.2
0.4
0.0
1.0
0.8
0.6
Dose Administered to Dam
15 25201050
B
15
Time after iodide administration (hours)
Rad
ioio
dide
in M
ater
nal T
hyro
id (
ng)
25201050
0.08
0.16
0.00
0.40
0.32
0.24
Dose Administered to NeonateC
15
Time after iodide administration (hours)
Rad
ioio
dide
in M
ater
nal T
hyro
id (
ng)
25201050
0.08
0.16
0.00
0.40
0.32
0.24
Dose Administered to NeonateC
Time after iodide administration (hours)
Rad
ioio
dide
in N
eona
tal T
hyro
id (
ng)
0.4
0.8
0.0
2.0
1.6
1.2
Dose Administered to Neonate
15 25201050
D
Time after iodide administration (hours)
Rad
ioio
dide
in N
eona
tal T
hyro
id (
ng)
0.4
0.8
0.0
2.0
1.6
1.2
Dose Administered to Neonate
15 25201050
D
by guest on June 11, 2013http://toxsci.oxfordjournals.org/
Dow
nloaded from

58
Figure 6
3
Time after iodide administration (hours)
Rad
ioio
dide
Con
cent
rati
on (
ng/L
)
54210
103
104
105
102
107
Maternal Thyroid
Maternal Serum
106
Mammary Gland
Neonatal Serum
3
Time after iodide administration (hours)
Rad
ioio
dide
Con
cent
rati
on (
ng/L
)
54210
103
104
105
102
107
Maternal Thyroid
Maternal Serum
106
Mammary Gland
Neonatal Serum
by guest on June 11, 2013http://toxsci.oxfordjournals.org/
Dow
nloaded from

59
Figure 7
Time after iodide administration (hours)
Rad
ioio
dide
Mil
k:Pl
asm
a R
atio
16
32
0
80
64
48
15 25201050
Time after iodide administration (hours)
Rad
ioio
dide
Mil
k:Pl
asm
a R
atio
16
32
0
80
64
48
15 25201050
by guest on June 11, 2013http://toxsci.oxfordjournals.org/
Dow
nloaded from

60
Figure 8
0.0 30.023.617.210.84.4
0
1200
Time after perchlorate administration (hours)
Rad
ioio
dine
in M
ater
nal T
hyro
id (
ng/L
)
Control
Perchlorate
2400
600
1800
3000
0.0 30.023.617.210.84.4
0
1200
Time after perchlorate administration (hours)
Rad
ioio
dine
in M
ater
nal T
hyro
id (
ng/L
)
Control
Perchlorate
2400
600
1800
3000
238.0 270.0263.6257.2250.8244.4
0
6
Time after perchlorate administration (hours)
Rad
ioio
dine
in M
amm
ary
Gla
nd (
ng/L
)
Control
Perchlorate
12
3
9
15
B
238.0 270.0263.6257.2250.8244.4
0
6
Time after perchlorate administration (hours)
Rad
ioio
dine
in M
amm
ary
Gla
nd (
ng/L
)
Control
Perchlorate
12
3
9
15
B
by guest on June 11, 2013http://toxsci.oxfordjournals.org/
Dow
nloaded from

61
Figure 9
Time after Parturition (hours)460454.2448.4442.6463.8431
Rad
ioio
dide
in M
ilk
(ng/
L)
0.0
1.2
2.0
0.4
0.8
1.6 Control
Perchlorate
Time after Parturition (hours)460454.2448.4442.6463.8431
Rad
ioio
dide
in M
ilk
(ng/
L)
0.0
1.2
2.0
0.4
0.8
1.6
Time after Parturition (hours)460454.2448.4442.6463.8431
Rad
ioio
dide
in M
ilk
(ng/
L)
0.0
1.2
2.0
0.4
0.8
1.6 Control
Perchlorate
by guest on June 11, 2013http://toxsci.oxfordjournals.org/
Dow
nloaded from
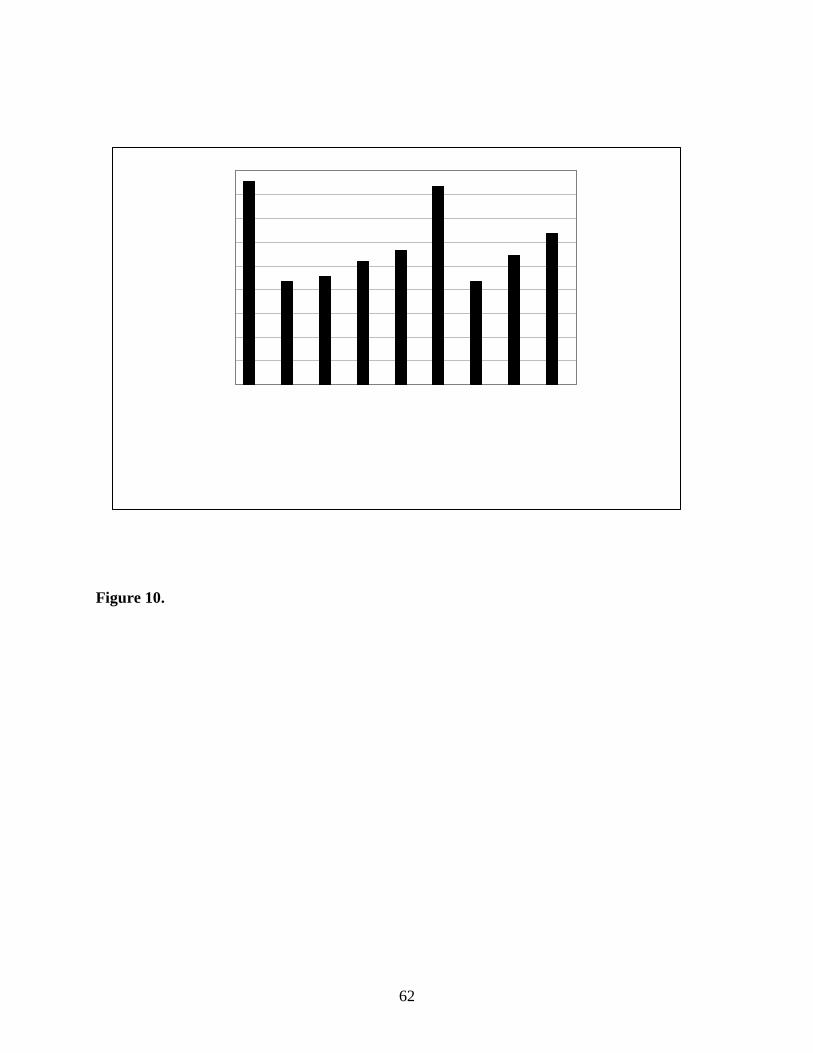
62
Figure 10.
1.0E+00
1.0E+01
1.0E+02
1.0E+03
1.0E+041.0E+05
1.0E+06
1.0E+07
1.0E+08
1.0E+09
Dam T
hyro
id
Dam B
ound
Ser
um
Dam S
kin
Dam G
IM
ilk
Pup T
hyro
id
Pup B
ound
Ser
um
Pup S
kin
Pup G
I
Iod
ine
Co
nce
ntr
atio
n (
ng
/L)
PredictedTissueConcentration
MeasuredTissueConcentration
by guest on June 11, 2013http://toxsci.oxfordjournals.org/
Dow
nloaded from

63
-1-0.8-0.6-0.4-0.2
00.20.40.60.8
1
Vmax
cBKm
B
Kunbc
ClUc
PMPM
k
Vmax
cM
Vmax
cMk
KmM
PaMc
PG_F
PGJ_F
Vmax
cG_F
PAGJc_F
ClUc_
F
Vmax
cB_F
Kunbc
_F
Sen
siti
vity
Co
effi
cien
t
Dam Serum AUC - 0.1 mg/kg-d Dam Serum AUC - 10.0 mg/kg-d
Pup Serum AUC - 0.1 mg/kg-d Pup Serum AUC - 10.0 mg/kg-d
Figure 11.
by guest on June 11, 2013http://toxsci.oxfordjournals.org/
Dow
nloaded from

64
Table 1. Physiological Parameters
Parameters Lactation SourceTissue Volumes Dam Neonate
Body Weight BW (kg)0.277 -0.310 0.0075 - 0.1985 Yu et al., 2001
Slowly Perfused VSc (%BW) 37.07-40.42 53.92-49.31 Brown et al., 1997Richly Perfused VRc (%BW) 5.35 5.36 Brown et al., 1997Fat VFc (%BW) 12.45 - 6.9 0.0 - 4.61 Naismith et al., 1982Kidney VKc (%BW) 1.7 1.7 Brown et al., 1997Liver VLc (%BW) 3.4 3.4 Brown et al., 1997Stomach Tissue VGc (%BW) 3.9 3.9 Merrill et al., In PressGastric Juice VGJc (%BW) 7.2 7.2 Yu et al., 2002Stomach Blood VGBc (%VG) 2.9 2.9 Altman & Dittmer, 1971Skin Tissue VSkc (%BW) 19.0 19.0 Brown et al., 1997Skin Blood VSkBc (%VSkc) 2.0 2.0 Brown et al., 1997
Thyroid Total VTc (%BW) 0.0105 0.0125Malendowicz & Bednarek, 1986; Florsheim et al., 1966
Thyroid Follicle VTFc (%Vttot) 45.89 61.4 - 37.2
Malendowicz & Bednarek, 1986; Conde et al.,1991
Thyroid Colloid VTLc (%VTtot) 45 18.3 – 32.5
Malendowicz & Bednarek, 1986; Conde et al.,1991
Thyroid Blood VTBc (%VTtot) 9.1 20.3 – 30.3
Malendowicz & Bednarek, 1986; Conde et al.,1991
Plasma VPlasc (%BW) 4.7 4.7Brown et al., 1997, Altman & Dittmer, 1971
Red Blood Cells VRBCc (%BW) 2.74 2.74
Brown et al., 1997, Altman & Dittmer, 1971
Mammary Tissue VMc (%BW) 4.4 - 6.6 --- Knight et al., 1984Mammary Blood VMBc (%VM) 18.1 --- Assume same % as Thyroid BloodMilk VMk (L) 0.002 --- Fisher et al., 1990Blood Flows
Cardiac Output QCc (L/h/kg) 14.0 - 21.0 14.0Hanwell & Linzell, 1973; Brown et al., 1997
Slowly Perfused QSc (%QC) 7.9-1.9 16.9 Brown et al., 1997Richly Perfused QRc (%QC) 40.8 40.8 Brown et al., 1997Fat QFc (%QC) 7.0 7.0 Brown et al., 1997Kidney QKc (%QC) 14.0 14.0 Brown et al., 1997Liver QLc (%QC) 18.0 18.0 Brown et al., 1997GI QGc (%QC) 1.61 1.61 Brown et al., 1997Skin QSkc (%QC) 0.058 0.058 Brown et al., 1997Thyroid QTc (%QC) 1.6 1.6 Brown et al., 1997Mammary QMc (%QC) 9.0 - 15.0 --- Hanwell & Linzell, 1973
by guest on June 11, 2013http://toxsci.oxfordjournals.org/
Dow
nloaded from

65
Table 2. Chemical Specific ParametersParameters Perchlorate Iodide
Partition Coefficients (unitless) Dam Pup Dam PupSlowly Perfused / Plasma PS 0.31 0.31 0.21 0.21Rapidly Perfused / Plasma PR 0.5 0.5 0.4 0.4Fat/ Plasma PF 0.05 0.05 0.05 0.05Kidney/ Plasma PK 0.99 0.99 1.09 1.09Liver/Plasma PL 0.56 0.56 0.44 0.44Gastric Tissue/Gastric Blood PG 1.80 3.21 1.00 1.20Gastric Juice/Gastric Tissue PGJ 2.30 5.64 1.00 1.00Skin Tissue/Skin Blood PSk 1.15 1.15 0.70 1.00Thyroid Tissue/Thyroid Blood PTF 0.13 0.13 0.15 0.15Thyroid Lumen/Thyroid Tissue PTL 7.0 7.0 7.0 7.0Red Blood Cells/Plasma PRBC 0.73 0.73 1.00 1.00Mammary Tissue/ Mammary Blood PM 0.66 --- 0.80 ---Mammary/Milk PMk 2.39 --- 1.00 ---Max Capacity, Vmaxc (ng/h/kg)Thyroid Follicle VmaxcTF 1.5x10³ 1.50x10³ 5.0x10⁴ 1.3x10⁴
Thyroid Colloid VmaxcTL 1.0x10⁴ 1.0x10⁴ 6.0x10⁷ 6.0x10⁷
Skin VmaxcS 8.0x10⁵ 8.0x10⁵ 4.0x10⁵ 2.5x10⁵
GI VmaxcG 1.0x10⁶ 1.0x10⁶ 2.0x10⁶ 2.0x10⁶
Mammary VmaxcM 2.0x10⁴ --- 8.0x10⁵ ---Milk VmaxcMk 2.0x10⁴ --- 4.0x10⁵ ---Affinity Constants, Km (ng/L)Thyroid Follicle KmTF 1.5x10⁵ 1.5x10⁵ 4.0x10⁶ 4.0x10⁶
Thyroid Lumen KmTL 1.0x10⁸ 1.0x10⁸ 1.0x10⁹ 1.0x10⁹
Skin KmS 1.5x10⁵ 1.5x10⁵ 4.0x10⁶ 4.0x10⁶
GI KmG 1.5x10⁵ --- 4.0x10⁶ ---Mammary KmM 1.5x10⁵ --- 4.0x10⁶ ---Milk KmMk 1.0x10⁶ --- 1.0x10⁷ ---
Permeability Area Cross Products, (L/h-kg)Gastric Blood to Gastric Tissue PAGc 1.00 1.00 0.80 0.04Gastric Tissue to Gastric Juice PAGJc 1.00 1.00 0.60 0.09Thyroid Blood to Thyroid Tissue PATFc 4.0x10⁻⁵ 4.0x10⁻⁵ 1.0x10⁻⁴ 1.0x10⁻⁴ Thyroid Tissue to Thyroid Lumen PATLc 0.01 0.01 1.0x10⁻⁴ 1.0x10⁻⁴ Skin Blood to Skin Tissue PASkc 0.50 1.00 0.20 0.02Mammary Blood to Mammary Tissue PAMc 0.01 --- 0.02 ---Mammary Tissue/Milk PAMkc 0.10 --- 0.02 ---Plasma to Red Blood Cells PARBCc 1.00 1.00 1.00 1.00
Clearance Values, (L/h-kg)Urinary excretion CLUc 0.07 0.0075 0.06 0.012Fraction of pup urine ingested by dam 0.80 0.80Hormone productions rate ClProdc_i --- --- 0.1 0.06
by guest on June 11, 2013http://toxsci.oxfordjournals.org/
Dow
nloaded from

66
Hormone secretion rate ClSecrc_i --- --- 7.0x10⁻⁷ 1.0e-6 Deiodination --- --- 0.02 0.025Binding ConstantsVmaxcB 9.0x10³ 2.0x10³ 1.5x10³ 500KmB 1.0x10⁴ 1.0x10⁴ 1.0x10⁵ 1.0x10⁵
Kunbc 0.034 0.01 0.09 0.05
by guest on June 11, 2013http://toxsci.oxfordjournals.org/
Dow
nloaded from
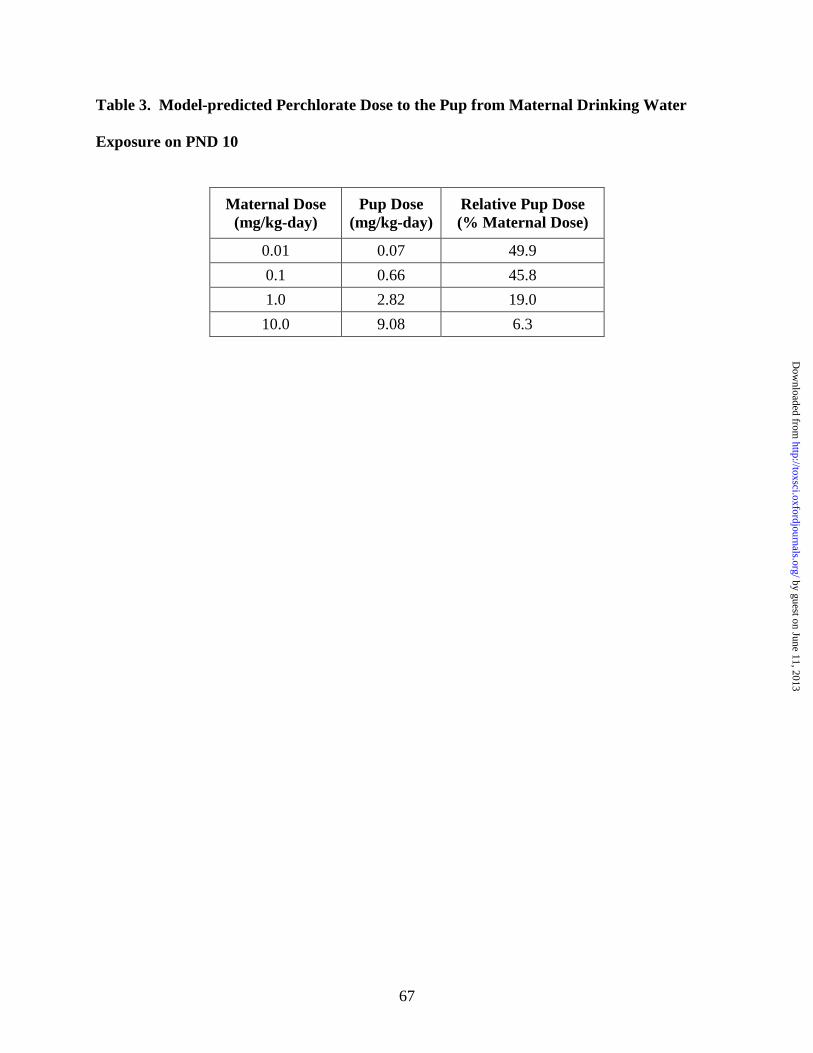
67
Table 3. Model-predicted Perchlorate Dose to the Pup from Maternal Drinking Water
Exposure on PND 10
Maternal Dose(mg/kg-day)
Pup Dose(mg/kg-day)
Relative Pup Dose(% Maternal Dose)
0.01 0.07 49.9
0.1 0.66 45.8
1.0 2.82 19.0
10.0 9.08 6.3
by guest on June 11, 2013http://toxsci.oxfordjournals.org/
Dow
nloaded from

68
Table 4: Model Predicted Internal Dosimetrics: Serum ClO4- AUC (mg/L) in Male,
Pregnant, Fetal, Lactating and Neonatal Rat from Drinking Water Perchlorate Exposure
ClO4- Dose
(mg/kg-day)
MaleRat
Pregnant Rat
(GD20)
FetalRat
(GD20)
Lactating Rat
(PND 10)
Neonate Rat
(PND 10)0.01 0.05 0.05 0.02 0.06 0.030.1 0.16 0.17 0.10 0.22 0.141.0 0.60 0.61 0.32 0.65 0.5410.0 1.52 1.56 0.62 4.63 1.72
by guest on June 11, 2013http://toxsci.oxfordjournals.org/
Dow
nloaded from

69
Table 5: Model Predicted Internal Dosimetrics: %Inhibition of Thyroid Iodide Uptake in
Male, Pregnant, Fetal, Lactating and Neonatal Rat from Acute Perchlorate Exposure
ClO4- Dose
(mg/kg/day)MaleRat
Pregnant Rat
FetalRat
Lactating Rat
NeonateRat
0.01 1.7 2.5 4.1 0.3 0.40.1 17.9 25.4 36.0 3.4 4.41.0 76.0 87.1 88.8 49.0 53.810.0 90.6 93.4 95.7 92.5 94.9
by guest on June 11, 2013http://toxsci.oxfordjournals.org/
Dow
nloaded from
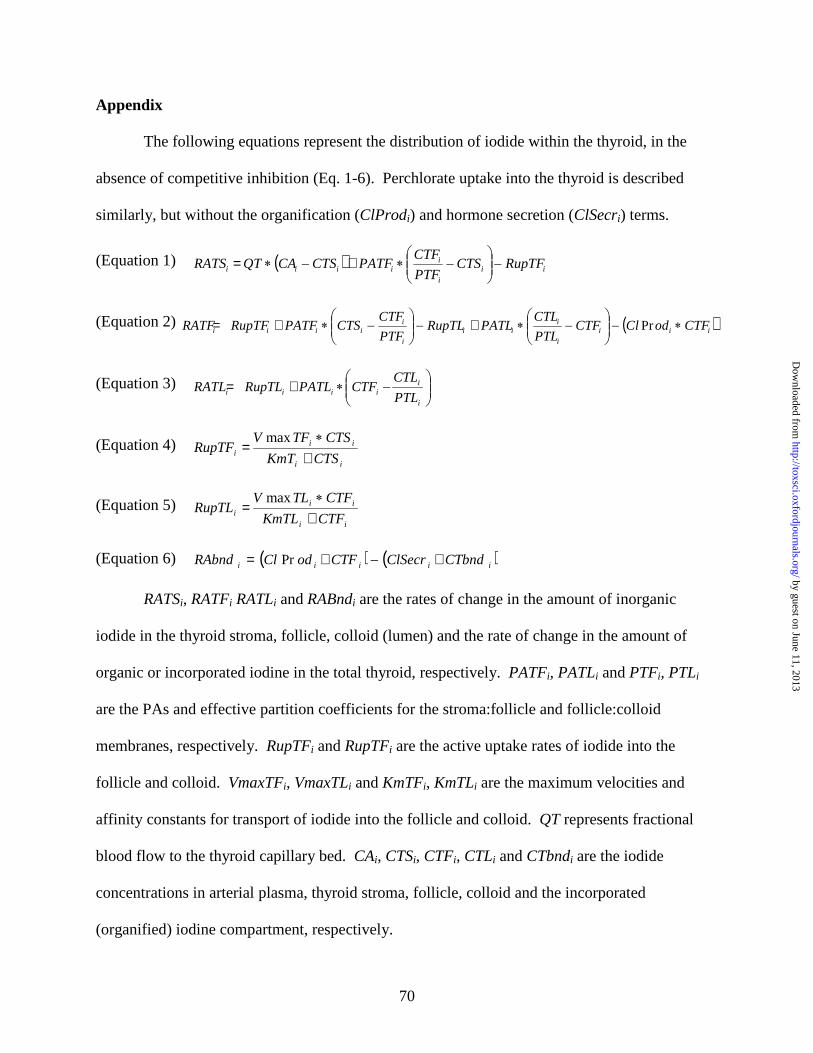
70
Appendix
The following equations represent the distribution of iodide within the thyroid, in the
absence of competitive inhibition (Eq. 1-6). Perchlorate uptake into the thyroid is described
similarly, but without the organification (ClProdi) and hormone secretion (ClSecri) terms.
(Equation 1) ( ) iii
iiiii RupTFCTS
PTF
CTFPATFCTSCAQTRATS −
−∗+−∗=
(Equation 2) ( )iii
i
iii
i
iiiii CTFodClCTF
PTL
CTLPATLRupTL
PTF
CTFCTSPATFRupTFRATF ∗−
−∗+−
−∗+= Pr
(Equation 3)
−∗+=
i
iiiii PTL
CTLCTFPATLRupTLRATL
(Equation 4)ii
iii CTSKmT
CTSTFVRupTF
+∗
=max
(Equation 5)ii
iii CTFKmTL
CTFTLVRupTL
+∗
=max
(Equation 6) ( ) ( )iiiii CTbndClSecrCTFodClRAbnd ×−×= Pr
RATSi, RATFi RATLi and RABndi are the rates of change in the amount of inorganic
iodide in the thyroid stroma, follicle, colloid (lumen) and the rate of change in the amount of
organic or incorporated iodine in the total thyroid, respectively. PATFi, PATLi and PTFi, PTLi
are the PAs and effective partition coefficients for the stroma:follicle and follicle:colloid
membranes, respectively. RupTFi and RupTFi are the active uptake rates of iodide into the
follicle and colloid. VmaxTFi, VmaxTLi and KmTFi, KmTLi are the maximum velocities and
affinity constants for transport of iodide into the follicle and colloid. QT represents fractional
blood flow to the thyroid capillary bed. CAi, CTSi, CTFi, CTLi and CTbndi are the iodide
concentrations in arterial plasma, thyroid stroma, follicle, colloid and the incorporated
(organified) iodine compartment, respectively.
by guest on June 11, 2013http://toxsci.oxfordjournals.org/
Dow
nloaded from
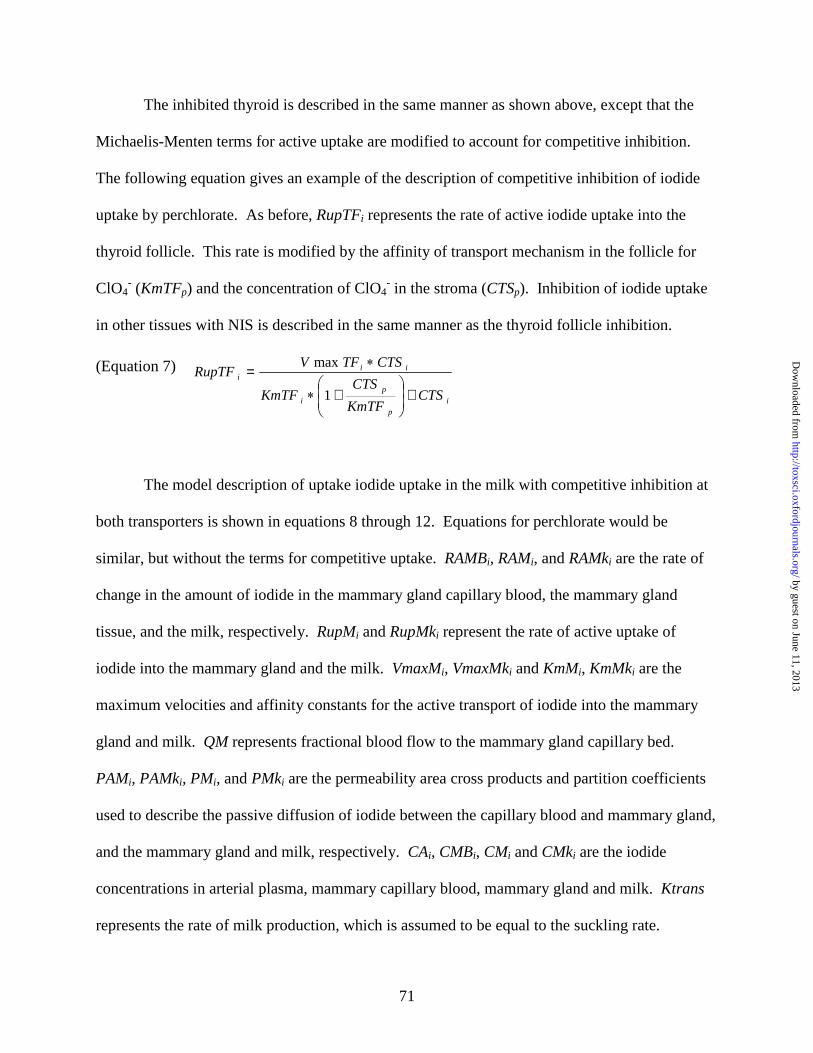
71
The inhibited thyroid is described in the same manner as shown above, except that the
Michaelis-Menten terms for active uptake are modified to account for competitive inhibition.
The following equation gives an example of the description of competitive inhibition of iodide
uptake by perchlorate. As before, RupTFi represents the rate of active iodide uptake into the
thyroid follicle. This rate is modified by the affinity of transport mechanism in the follicle for
ClO4- (KmTFp) and the concentration of ClO4
- in the stroma (CTSp). Inhibition of iodide uptake
in other tissues with NIS is described in the same manner as the thyroid follicle inhibition.
(Equation 7)
ip
pi
iii
CTSKmTF
CTSKmTF
CTSTFVRupTF
+
+∗∗
=
1
max
The model description of uptake iodide uptake in the milk with competitive inhibition at
both transporters is shown in equations 8 through 12. Equations for perchlorate would be
similar, but without the terms for competitive uptake. RAMBi, RAMi, and RAMki are the rate of
change in the amount of iodide in the mammary gland capillary blood, the mammary gland
tissue, and the milk, respectively. RupMi and RupMki represent the rate of active uptake of
iodide into the mammary gland and the milk. VmaxMi, VmaxMki and KmMi, KmMki are the
maximum velocities and affinity constants for the active transport of iodide into the mammary
gland and milk. QM represents fractional blood flow to the mammary gland capillary bed.
PAMi, PAMki, PMi, and PMki are the permeability area cross products and partition coefficients
used to describe the passive diffusion of iodide between the capillary blood and mammary gland,
and the mammary gland and milk, respectively. CAi, CMBi, CMi and CMki are the iodide
concentrations in arterial plasma, mammary capillary blood, mammary gland and milk. Ktrans
represents the rate of milk production, which is assumed to be equal to the suckling rate.
by guest on June 11, 2013http://toxsci.oxfordjournals.org/
Dow
nloaded from

72
(Equation 8) ( ) iii
iiiii RupMCVMB
PM
CMPAMCVMBCAQMRAMB −
−×+−×=
(Equation 9)
−×+−+
−×= i
i
iiii
i
iiii CM
PMk
CMkPAMkRupMkRupM
PM
CMCVMBPAMRAM
(Equation 10) ( )ii
iiiii CMkKtrans
PMk
CMkCMPAMkRupMkRAMk ×−
−×+=
(Equation 11)
ip
pi
iii
CMBKmM
CMBKmM
CMBMVRupM
+
+∗∗=
1
max
(Equation 12) ip
p
i
iii
CMKmMk
CMKmMk
CMMkVRupMk
+
+∗∗
=
1
max
The model description for active uptake of iodide into the GI contents with competitive
inhibition by ClO4- is given in equations 13 through 16. The skin compartment is modeled in the
same manner. Equations for perchlorate would be similar to those of iodide without the terms
for competitive inhibition. Here RAGBi RAGi and RAGJi represent the rates of change in the GI
capillary blood, GI tract and GI contents, respectively. QG is the regional blood flow to the GI,
RMR is the rate of oral dosing, and CGBi CGi and CGJi are the total iodide concentration in the
GI blood, tract and contents. Finally, partitioning of iodide between the GI blood and tract and
the GI tract and contents is described using the partition coefficients (PGi and PGJi) and
permeability area cross products (PAGi and PAGJi).
(Equation 13)) ( )
−×+−×= ii
iiiii CVGBPG
CGPAGCVGBCAQGRAGB
(Equation 14)i
iii
ii
iiii RupGJCGPGJ
CGJPAGJPGCGCVGBPAGRAG −
−×+
−×=
by guest on June 11, 2013http://toxsci.oxfordjournals.org/
Dow
nloaded from

73
(Equation 15)i
iii
iii RMRPGJCGJCGPAGJRupGJRAGJ +
−×+=
(Equation 16)i
p
pi
ii
CGKmGCG
1KmG
CGGJmaxVRupGJi
+
+×
×=
Model equations for compartments without active uptake (shown for the liver, Eq. 17)
were modeled in the as flow-limited, using only partitioning and blood flow to control tissue
iodide and perchlorate concentrations. In the following equations, RALi is the rate of change in
the amount of total iodide in the liver, QL is the fractional blood flow to the liver, CLi is the
concentration of iodide in the liver and PLi is the blood:liver partition coefficient. The kidney
and fat are modeled similarly.
(Equation 17)
−×=i
iii PL
CLCAQLRAL
Model equations describing iodine in the arterial blood are given below (Eq. 18 –19). Where
RaBndi and RaIncorpi are the rates of change in amount of iodide bound to plasma proteins and
hormone incorporated iodine, respectively. VmaxBi and Kmi are the Michaelis-Menten terms for
saturable binding of inorganic iodide to plasma proteins. Kmp is the affinity constant for the
binding of ClO4- to plasma proteins, which is used to adjust the affinity of iodide in order to
mathematically describe the competitive inhibition of the anions for binding sites. Kunbi, Ksecri
and Kdeiodi are the first order rate constants for the dissociation of I- from plasma proteins, the
secretion of thyroid hormones (hormone incorporated iodine) form the thyroid and the whole-
body deiodination of thyroid hormones, respectively. CAi and CAp are the concentrations of free
inorganic iodide and free ClO4- in the plasma. The binding of perchlorate to plasma proteins
would be described in the same manner as iodide (Eq. 18).
by guest on June 11, 2013http://toxsci.oxfordjournals.org/
Dow
nloaded from

74
(Equation 18)
( ) ( )ii
ip
pi
iii CAbndKunb
CAKmBCA
KmB
CABVRabnd ×−
+
+×
×=)1(
max
(Equation 19)( ) ( )iii CAIncorpKDeiodCTbndKSecrRaIncorp ×−×=
by guest on June 11, 2013http://toxsci.oxfordjournals.org/
Dow
nloaded from