A PHYSIOLOGICALLY BASED PHARMACOKINETIC
48
Published by Oxford University Press 2008. 1 2 3 4 A PHYSIOLOGICALLY BASED PHARMACOKINETIC 5 MODEL FOR INTRAVENOUS AND INGESTED 6 DIMETHYLARSINIC ACID (DMA V ) IN MICE. 7 8 9 10 Marina V. Evans, Sean M. Dowd, Elaina M. Kenyon, Michael F. 11 Hughes, and Hisham A. El-Masri 12 13 14 15 16 17 National Health and Environmental Effects Research Laboratory 18 Office of Research and Development 19 U.S. Environmental Protection Agency 20 Research Triangle Park, North Carolina 27711 21 22 23 24 Corresponding author: Marina V. Evans, Ph.D. 25 US EPA 26 MD B143-01 27 Research Triangle Park, NC 27711 28 Email: [email protected] 29 Phone: (919) 541- 0838 30 Fax: (919) 541- 3680 31 32 33 34 Keywords: Physiologically-based pharmacokinetic (PBPK) model, 35 Toxicokinetics, dimethylarsinic acid. 36 37 38 39 Page 1 of 48 Toxicological Sciences 1 2 3 4 5 6 7 8 9 10 11 12 13 14 15 16 17 18 19 20 21 22 23 24 25 26 27 28 29 30 31 32 33 34 35 36 37 38 39 40 41 42 43 44 45 46 47 48 49 50 51 52 53 54 55 56 57 58 59 60 ToxSci Advance Access published May 5, 2008 by guest on February 17, 2014 http://toxsci.oxfordjournals.org/ Downloaded from
-
Upload
independent -
Category
Documents
-
view
1 -
download
0
Transcript of A PHYSIOLOGICALLY BASED PHARMACOKINETIC

Published by Oxford University Press 2008.
1234
A PHYSIOLOGICALLY BASED PHARMACOKINETIC 5MODEL FOR INTRAVENOUS AND INGESTED 6
DIMETHYLARSINIC ACID (DMAV) IN MICE. 789
10 Marina V. Evans, Sean M. Dowd, Elaina M. Kenyon, Michael F. 11
Hughes, and Hisham A. El-Masri 12 13 14 15 16 17
National Health and Environmental Effects Research Laboratory 18 Office of Research and Development 19
U.S. Environmental Protection Agency 20 Research Triangle Park, North Carolina 27711 21
22 23
24 Corresponding author: Marina V. Evans, Ph.D. 25 US EPA 26 MD B143-01 27 Research Triangle Park, NC 27711 28 Email: [email protected] Phone: (919) 541- 0838 30 Fax: (919) 541- 3680 31 32 33 34 Keywords: Physiologically-based pharmacokinetic (PBPK) model, 35 Toxicokinetics, dimethylarsinic acid. 36 37 38 39
Page 1 of 48 Toxicological Sciences
123456789101112131415161718192021222324252627282930313233343536373839404142434445464748495051525354555657585960
ToxSci Advance Access published May 5, 2008 by guest on February 17, 2014
http://toxsci.oxfordjournals.org/D
ownloaded from

2
Acknowledgements: 12
This manuscript has been reviewed by the National Health and Environmental 3Effects Research Laboratory, U.S. E.P.A. and approved for publication. Mention 4of trade names and commercial products does not constitute endorsement 5or recommendation for use. 6
7The authors would like to thank Dr. Karen Yokley for invaluable help with the 8mathematical editor used to prepare the manuscript, and Drs. David Thomas, 9Miles Okino, Mike DeVito, and Linda Birnbaum for helpful comments during the 10preparation of this manuscript. We would also like to thank Mr. Christopher 11Eklund for editorial contributions. 12
13 14
15 16
17 18
19 20
21 22
23 24
25 26
27 28
29 30
31 32
33 34
35 36
37 38
39 40
41 42
43 44
45
Page 2 of 48Toxicological Sciences
123456789101112131415161718192021222324252627282930313233343536373839404142434445464748495051525354555657585960
by guest on February 17, 2014http://toxsci.oxfordjournals.org/
Dow
nloaded from

3
Abstract 12
A physiologically based pharmacokinetic (PBPK) model for the organoarsenical 3
dimethylarsinic acid (DMAV) was developed in mice. The model was calibrated 4
using tissue time course data from multiple tissues in mice administered DMAV5
intravenously. The final model structure was based on diffusion limitation 6
kinetics. In general, PBPK models use the assumption of blood flow-limited 7
transport into tissues. This assumption has historically worked for small lipophilic 8
organic solvents. However, the conditions under which flow-limited kinetics 9
occurs and how to distinguish when flow-limited versus diffusion-limited transport 10
is more appropriate, have been rarely evaluated. One important goal of this 11
modeling effort was to systematically evaluate descriptions of flow-limited 12
compared to diffusion-limited tissue distribution for DMAV, using the relatively 13
extensive pharmacokinetic data available in mice. The diffusion-limited model 14
consistently provided an improved fit over flow-limited simulations when 15
compared to tissue time course iv experimental data. After model calibration, an 16
independent data set obtained by oral gavage of DMAV, was used to further test 17
model structure. Sensitivity analysis of the two PBPK model structures showed 18
the importance of early time course data collection, and the impact of diffusion for 19
kidney time course data description. In summary, this modeling effort suggests 20
the importance of availability of organ specific time course data sets necessary 21
for the discernment of PBPK modeling structure, motivated by knowledge of 22
biology, and providing necessary feedback between experimental design and 23
biological modelers. 24
Page 3 of 48 Toxicological Sciences
123456789101112131415161718192021222324252627282930313233343536373839404142434445464748495051525354555657585960
by guest on February 17, 2014http://toxsci.oxfordjournals.org/
Dow
nloaded from

4
Introduction 1
Dimethylarsinic acid (DMAV, cacodylic acid) is produced commercially for 2
use as a nonselective herbicide, and is also the major metabolite formed from 3
ingested or inhaled inorganic arsenic in both rodents and humans (Hughes and 4
Kenyon, 1998; ATSDR, 2007). In terms of metabolism, DMAV is initially reduced 5
to dimethylarsinous acid (DMAIII) and then oxidatively methylated to 6
trimethylarsine oxide (TMAO) (Cohen et al., 2006). When administered directly 7
by the oral route, DMAV is excreted mainly in the urine of mice and humans. In 8
mouse urine, parent, DMAIII, TMAO, and low levels of arsenic thiol compounds 9
have been detected (Hughes et al., 2008). Because of its unique binding to rat 10
hemoglobin, the rat avidly retains DMAIII for an extended period, much longer 11
than mice or humans (Stevens et al., 1977; Vahter et al., 1984) DMAV not 12
retained as DMAIII bound to hemoglobin in rats is extensively metabolized to 13
trimethylated forms and excreted in urine (Yoshida et al., 1997; Yoshida et al.,14
1998; Cohen et al., 2006; Adair et al., 2007). 15
DMAV is a tumor promoter in mouse skin and lung (Yamanaka et al.,16
1996; Yamanaka et al., 2000) and in rat urinary bladder, liver, kidney and thyroid 17
gland (Yamamoto et al., 1995). DMAV is also a complete urinary bladder 18
carcinogen in female rats via diet at levels in the range of 40 to 200 ppm (Arnold 19
et al., 1999), and male rats via drinking water at levels of 50 and 200 ppm (Wei et 20
al., 2002). The proposed mode of action for the carcinogenic effects of DMAV in 21
rat bladder is cytotoxicity followed by regenerative proliferation. DMAIII has been 22
proposed to be the active metabolite involved in this process (Cohen et al.,23
Page 4 of 48Toxicological Sciences
123456789101112131415161718192021222324252627282930313233343536373839404142434445464748495051525354555657585960
by guest on February 17, 2014http://toxsci.oxfordjournals.org/
Dow
nloaded from

5
2006). The carcinogenic mode of action of a chemical is but one of the pieces 1
needed in the risk assessment together with knowledge of differences in 2
metabolism and disposition between species (Cohen et al., 2006). 3
Physiologically based pharmacokinetic (PBPK) modeling has become a 4
preferred option for various types of extrapolation implemented in risk 5
assessment. These forms of toxicokinetic extrapolations include interspecies 6
(rodent to human), high to low dose, duration (acute to chronic) and from the 7
average human to potentially susceptible subpopulations (Andersen and 8
Dennison, 2001). A PBPK model for arsenic would be applicable for species 9
extrapolation in animal models to humans, particularly as it relates to tissue 10
dosimetry, where little or no data exists in humans (El-Masri and Kenyon, 2007). 11
One of the fundamental questions faced by a modeler at the start of a new 12
physiological quantitative description is whether chemical distribution into tissues 13
is best described as blood flow-limited or diffusion-limited. In most applications 14
within toxicology, once the organs to be included in the model are selected, the 15
assumption of blood flow-limited distribution of chemicals is the major factor 16
affecting movement of chemical into the particular organ (Andersen and 17
Dennison, 2001). However, the initial PBPK work started in the clinical 18
therapeutics field made use of a diffusion description of distribution which 19
included separation of the blood and tissue compartments by a capillary 20
membrane (Lutz et al., 1980). The justification for this addition to model 21
complexity was based on the data available and on the larger molecular size of 22
the modeled drugs. In general terms, the implicit assumption has been made 23
Page 5 of 48 Toxicological Sciences
123456789101112131415161718192021222324252627282930313233343536373839404142434445464748495051525354555657585960
by guest on February 17, 2014http://toxsci.oxfordjournals.org/
Dow
nloaded from
6
that blood flow is sufficient to describe most data sets for smaller environmental 1
molecules with high lipophilicity. Despite wide application of the flow-limited 2
description, there has been limited examination of the impact of increasing 3
structure complexity to include a complete description of transport biology, or 4
even a description of when this change may be necessary (Collins et al., 1999) 5
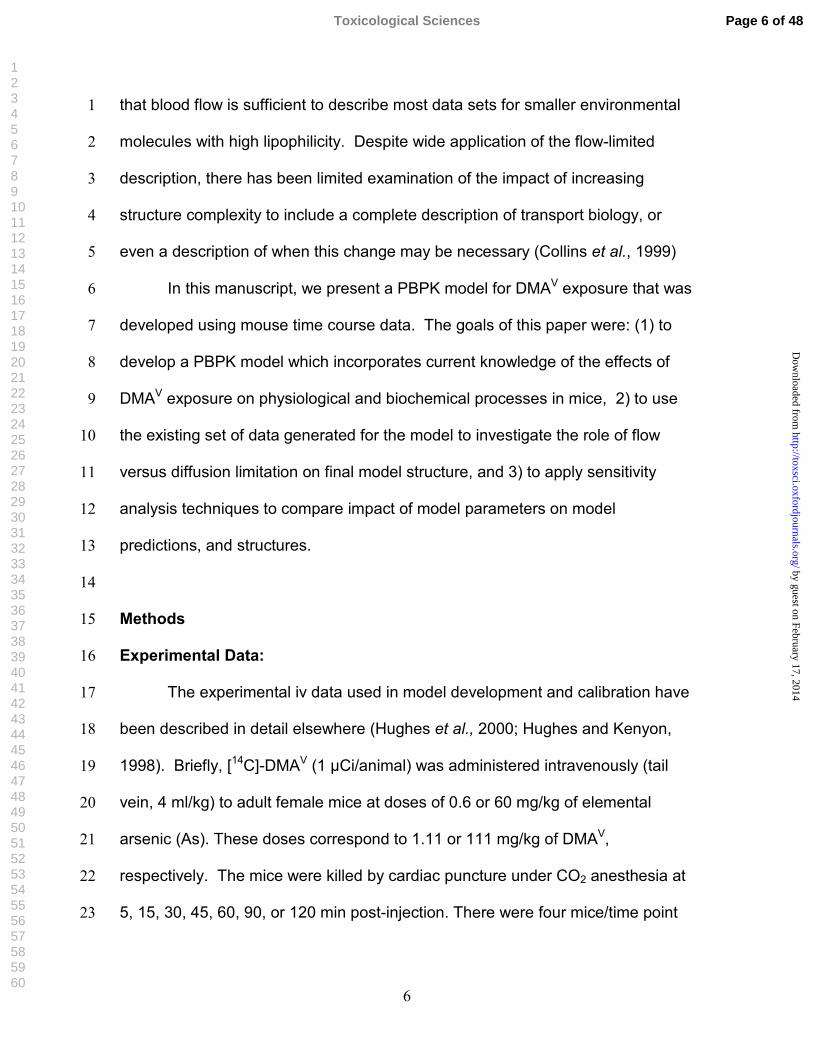
In this manuscript, we present a PBPK model for DMAV exposure that was 6
developed using mouse time course data. The goals of this paper were: (1) to 7
develop a PBPK model which incorporates current knowledge of the effects of 8
DMAV exposure on physiological and biochemical processes in mice, 2) to use 9
the existing set of data generated for the model to investigate the role of flow 10
versus diffusion limitation on final model structure, and 3) to apply sensitivity 11
analysis techniques to compare impact of model parameters on model 12
predictions, and structures. 13
14
Methods 15
Experimental Data: 16
The experimental iv data used in model development and calibration have 17
been described in detail elsewhere (Hughes et al., 2000; Hughes and Kenyon, 18
1998). Briefly, [14C]-DMAV (1 µCi/animal) was administered intravenously (tail 19
vein, 4 ml/kg) to adult female mice at doses of 0.6 or 60 mg/kg of elemental 20
arsenic (As). These doses correspond to 1.11 or 111 mg/kg of DMAV,21
respectively. The mice were killed by cardiac puncture under CO2 anesthesia at 22
5, 15, 30, 45, 60, 90, or 120 min post-injection. There were four mice/time point 23
Page 6 of 48Toxicological Sciences
123456789101112131415161718192021222324252627282930313233343536373839404142434445464748495051525354555657585960
by guest on February 17, 2014http://toxsci.oxfordjournals.org/
Dow
nloaded from

7
for the two dose levels of DMAV administered. Blood, liver, lung, and kidney 1
were removed from the animals. Blood was fractionated into plasma and red 2
blood cells (RBCs) by centrifugation. The tissues and blood fractions were 3
combusted and analyzed for radioactivity in a liquid scintillation spectrometer 4
(Hughes et al., 2000). In a second experiment, mice were similarly treated with 5
unlabeled DMAV and sacrificed over time. Tissues were removed, solubilized 6
and analyzed for speciated arsenicals by hydride generation-atomic absorption 7
spectrometry (HG-AAS) (Hughes et al., 2000). 8
Cumulative urinary elimination data were collected in mice administered 9
[14C]-DMAV intravenously using the same dosing protocol described above 10
(Hughes and Kenyon, 1998). Cumulative percent of the dose excreted in urine 11
as DMAV-derived radioactivity was determined at 1, 2, 4, 8, 12 and 24 h post-12
dosing. 13
The experimental data (mouse oral gavage) used for model evaluation 14
have been described in detail elsewhere (Hughes et al., 2008). Briefly, mice 15
were administered [14C]-DMAV (2 µCi/animal) by oral gavage (10 ml/kg) at the 16
same dose levels administered via iv. Mice were then placed in individual 17
metabolism cages to collect urine and feces until they were killed by cardiac 18
puncture under CO2 anesthesia. Mice were euthanized at the following time 19
intervals: 0.25, 0.5, 1, 2, 4, 8, 12, and 24 h post-dosing. There were four 20
mice/time point for each dose level. Blood, liver, lung, kidney, and urinary 21
bladder were harvested immediately, flash frozen in liquid nitrogen, and stored 22
until analyzed for radioactivity as described above. In a second experiment, mice 23
Page 7 of 48 Toxicological Sciences
123456789101112131415161718192021222324252627282930313233343536373839404142434445464748495051525354555657585960
by guest on February 17, 2014http://toxsci.oxfordjournals.org/
Dow
nloaded from

8
were similarly treated with unlabeled DMAV. One group of mice was sacrificed at 1
2 h post-dosing. Tissues were removed, solubilized and analyzed for speciated 2
arsenicals by HG-AAS. A second group of mice were held in metabolism cages 3
for 24 h. The urine from these animals was collected and analyzed for speciated 4
arsenicals by HG-AAS. 5
The data are presented in this paper as concentration in the different 6
tissues in µg/l, as opposed to % of dose injected. In this way, we can directly 7
match the output of the PBPK model with the experimental data. The data used 8
for model development and evaluation was based on radioactivity, with no 9
speciation of DMAV and DMAIII. The results from the speciated arsenic tissue 10
analysis following iv administration of unlabeled DMAV detected only total 11
dimethylarsenic (DMA) at 2 h for the low dose and 8 hr for the high dose ( see 12
Fig. 6, Hughes et al., 2000). For this data, it was not possible to differentiate 13
between DMAV or DMAIII in the samples. However, neither TMAO nor 14
demethylated metabolites of DMAV were detected in tissues following iv 15
administration. TMAO was detected in kidney, liver, lung and urinary bladder in 16
tissues from the oral study with unlabeled DMAV using a more sensitive HG-AAS 17
method (see Table 4 in Hughes et al., 2008). Tissue analysis was performed at 18
2 h (where maximum tissue levels were attained based on the results from the 19
experiments with [14C]-DMAV). However, TMAO was only consistently detected 20
at the high dose (111 mg/kg), with the highest levels in liver (approximately 10% 21
of the total arsenic detected). TMAO levels in the other tissues were no more 22
than half that detected in the liver. Again, it was not possible to speciate DMAV23
Page 8 of 48Toxicological Sciences
123456789101112131415161718192021222324252627282930313233343536373839404142434445464748495051525354555657585960
by guest on February 17, 2014http://toxsci.oxfordjournals.org/
Dow
nloaded from

9
and DMAIII in these tissues, but total DMA was the predominant arsenical 1
detected. The descriptor DMA (for dimethylarsenic) will be used to signify the 2
radioactivity derived from [14C]-DMAV. The use of this descriptor in the model 3
development adequately represents DMA because tissue analysis results using 4
HG-AAS for arsenic speciation showed the arsenic was predominately 5
dimethylarsenic. In urine, most of the detected radioactivity can be associated 6
with DMA when given by iv route to mice. This is supported by findings from rat 7
studies which are efficient methylators of DMAV (Cui et al., 2004; Suzuki et al.,8
2004) . 9
10
General Model Structure and Parameterization 11
The tissue compartments used in the PBPK model include lung, liver, 12
kidney, bladder, skin, gastrointestinal (GI) tract and residual body. Blood plasma 13
and red blood cells were included as separate compartments because this model 14
will ultimately be extended to rats in order to evaluate the impact of species-15
specific differences in metabolism and disposition for orally ingested DMAV. Two 16
different model structures were developed to evaluate the transport kinetics of 17
DMA into body organs: flow-limited and diffusion-limited. The model structures 18
are illustrated in Figures 1 and 2. Distribution in the flow-limited model is through 19
blood flow mainly, while the diffusion-limited model includes an additional term to 20
describe diffusion through a capillary membrane. The partition and permeability 21
coefficients were estimated using tissue time course data after an intravenous 22
injection in mice (Hughes et al., 2000). The blood compartment included 23
Page 9 of 48 Toxicological Sciences
123456789101112131415161718192021222324252627282930313233343536373839404142434445464748495051525354555657585960
by guest on February 17, 2014http://toxsci.oxfordjournals.org/
Dow
nloaded from

10
separate mathematical descriptions for RBCs and plasma in both flow- and 1
diffusion-limited models, with distribution of DMA into tissues assumed to occur 2
via the plasma. In terms of organ clearance, the model included metabolism of 3
DMAV to TMAO in the liver and urinary clearance of DMA via the kidneys. Skin, 4
lung, GI, bladder and the residual body compartments were assumed to be non-5
metabolizing organs. 6
Organ DMA time course data points generated from a separate oral 7
gavage data set obtained from Hughes et al., (2008), which were not used for 8
parameter estimation, were used for model evaluation. This particular oral 9
experimental design matched the initial doses given for the iv exposures. 10
Physiological parameters for the model were either experiment-specific 11
(e.g., body weight) or obtained from the literature (Tables 1 and 2). Details of 12
chemical-specific parameter estimation for partition and permeation coefficients 13
are described in the results section and presented in Tables 1 and 2, 14
respectively. Although the present model includes saturable fecal clearance 15
using a standard Michaelis-Menten equation to describe kinetics, we chose to set 16
biliary maximal rate excretion to zero in this version of the model, since urine is 17
the major route of excretion of DMAV and studies of mice (Hughes and Kenyon, 18
1998) and rats (Stevens et al., 1977; Suzuki et al., 2004). Metabolism of DMAV19
to TMAO was assumed to be first order (ktmao, h-1) over the relevant range of 20
exposure concentrations (12.5-200 ppm) based on rat data presented by (Wei et 21
al., 2002). Their results for TMAO concentration in urine (3-37 µg/ml) increased 22
linearly with dose over the entire dose range. Urinary excretion was assumed to 23
Page 10 of 48Toxicological Sciences
123456789101112131415161718192021222324252627282930313233343536373839404142434445464748495051525354555657585960
by guest on February 17, 2014http://toxsci.oxfordjournals.org/
Dow
nloaded from

11
be constant across doses based on iv kinetic data in mice (Hughes and Kenyon, 1
1998). Using the assumption of first order metabolism from DMAV to TMAO and 2
dose independence for urinary excretion rates, an estimate for ktmao was derived 3
from urinary excretion data for TMAO in mice (Marafante and Vahter, 1987). 4
Specifically, (Marafante and Vahter, 1987) reported that 3.5% of an oral dose of 5
DMAV was excreted in urine in 48 hours as TMAO. Hence, the first-order 6
metabolic rate constant (ktmao) is approximated as -ln(c/c0)/t where c is the urine 7
concentration of TMAO at time=t , and c0 is the initial TMAO urine concentration. 8
The calculation yields an estimate of 0.07 h-1[-ln(0.035)/48] for ktmao.9
10
Mathematical description of each organ 11
Rate equations for each compartment were obtained using the basic 12
principle of mass balance conservation: the net amount of chemical in the organ 13
must equal the sum of everything that comes in minus everything that leaves 14
minus any amount that is converted by chemical reaction (e.g. metabolism). The 15
simplest case for a PBPK modeler starting with a new chemical is to assume that 16
flow-limited conditions apply for each body organ. For this type of model, one 17
mass balance differential equation describes the chemical’s distribution in each 18
separate organ. As an example, the flow-limited lung equation is: 19
20
where, 21
QC = total cardiac output, l/h 22
Page 11 of 48 Toxicological Sciences
123456789101112131415161718192021222324252627282930313233343536373839404142434445464748495051525354555657585960
by guest on February 17, 2014http://toxsci.oxfordjournals.org/
Dow
nloaded from

12
Vlu = total lung organ volume, l 1
CVlu = venous blood concentration coming into the lung, µg/l 2
Ca = arterial blood concentration leaving the lung, µg/l 3
4
In cases when the blood flow-limited description is not sufficient to 5
describe the experimental data, a capillary membrane can be added to describe 6
separately mass conservation in the blood and tissue compartments. Using the 7
lung again as an example, mass conservation in the lung blood leads to the 8
following equation: 9
10
Mass conservation in the lung tissue leads to the following equation: 11
12
where, 13
Vbllu = volume of the blood compartment within the lung, l 14
CVlu = venous concentration of DMA coming into the lung, µg/l 15
Qc = blood flow through the lung, or cardiac output, l/h 16
Ca = arterial concentration of DMA leaving the lung, µg/l 17
πlu = permeability constant describing diffusion through the capillary 18
membrane, l/h 19
Clu = total tissue concentration of DMA, µg/l 20
Page 12 of 48Toxicological Sciences
123456789101112131415161718192021222324252627282930313233343536373839404142434445464748495051525354555657585960
by guest on February 17, 2014http://toxsci.oxfordjournals.org/
Dow
nloaded from
13
Plu = partition coefficient for DMA in lung tissue, dimensionless 1
VluT = lung tissue volume, l 2
3
Also, the definition for partitioning in this case becomes the ratio between 4
DMA concentration staying inside the tissue, and the DMA blood concentration 5
leaving the organ, which in this case equals capillary concentration. This paper 6
will present a case for developing a PBPK model for DMA in the mouse by 7
considering blood flow or diffusion-limited kinetics. All equations used are fully 8
described in the Appendix (in Supplementary Materials). 9
10
PBPK Model Implementation and Software 11
The current PBPK model was implemented using Simulink© (Mathworks, 12
Natick, MA, version 6.4, 2006), a graphical user modeling software package. 13
After pilot simulations were performed and the determination to use the general 14
diffusion-limited case was made, both cases were simulated using the same 15
general code. That is, the flow-limited version was adapted from the general 16
model by setting all permeability coefficients (π parameters) to zero. 17
Blood, liver, kidney, and lung were fitted to a blood flow-limited model 18
including binding in the venous compartment to RBCs. Subsequently, these 19
same tissues were fitted to a diffusion-limited model which included a capillary 20
membrane. 21
22
Page 13 of 48 Toxicological Sciences
123456789101112131415161718192021222324252627282930313233343536373839404142434445464748495051525354555657585960
by guest on February 17, 2014http://toxsci.oxfordjournals.org/
Dow
nloaded from
14
Sensitivity analysis 1
Sensitivity analysis has been primarily used in PBPK modeling to prioritize 2
the impact of key model parameters (Clewell et al., 1994; Evans et al., 1994).3
The simplest sensitivity analysis provides answers to the question: If a known % 4
change occurs in the model constants, what % change occurs in the model 5
predictions? Although there are different ways to calculate sensitivity 6
coefficients, we used normalized sensitivity coefficients described as the partial 7
derivative of each variable of interest with respect to each model constant 8
(parameter), normalized by both the variable and model parameter. In 9
mathematical terms: 10
11
where, x(t) represents any variable predicted by the model, and q represents any 12
constant assigned within each model. In general, the authors assumed 13
normalized coefficients higher than a value of 1 to be helpful in solving 14
identifiability issues for that particular parameter. 15
The partial derivatives needed to calculate sensitivity coefficients were 16
calculated using the Automated Differentiation (AD) algorithm written by Martin 17
Fink, and available in MatlabCentral, (http://www.mathworks.com/matlabcentral/). 18
Further theoretical details can be found in Dr. J.A. David’s dissertation 19
(http://catalog.lib.ncsu.edu/web2/tramp2.exe/do_ccl_search/guest?setting_key=fil20
es&record_screen=record.html&*search_button=keyword&servers=1home&inde21
x=ckey&query=1998319).. 22
Page 14 of 48Toxicological Sciences
123456789101112131415161718192021222324252627282930313233343536373839404142434445464748495051525354555657585960
by guest on February 17, 2014http://toxsci.oxfordjournals.org/
Dow
nloaded from
15
The AD sensitivity method presented in this paper is similar in concept to 1
the normalized sensitivity coefficient calculations used in Simusolv® (1993) in 2
previous modeling efforts. The present code calculates normalized sensitivity 3
coefficients over time, for each model parameter and predicted variable defined 4
by the modeler. The AD sensitivity method numerically approximates the 5
analytical solution for each partial derivative over time, increasing our confidence 6
in the sensitivity calculations. We believe this is the first time that such a 7
comprehensive sensitivity analysis has been applied to a diffusion-limited model. 8
For the flow-limited case, we analyzed 8 model variables and 25 input constants. 9
For the diffusion-limited case, we analyzed 14 model variables and 43 constants. 10
Plots for each partial derivative were generated and evaluated. 11
12
Parameter estimation 13
After initial visual fits using the iv data set, optimizations were performed 14
with Simulink’s Response Optimization© (Mathworks, Natick, MA) software using 15
the Simplex Search method. The Simplex Search method is a numerical 16
technique based on the Nelder-Mead search methodology used to optimize a 17
parameter defined within an ordinary differential equation. 18
The partition coefficients were estimated for the flow-limited iv model first, 19
where by definition, the diffusion constants are set to zero. Individual tissue time 20
course concentration data was used to estimate partition coefficients, using the 21
area under the curve method (Vahter et al., 1984; Gallo et al., 1993). Once the 22
flow-limited model was developed, simulations were compared with tissue time 23
Page 15 of 48 Toxicological Sciences
123456789101112131415161718192021222324252627282930313233343536373839404142434445464748495051525354555657585960
by guest on February 17, 2014http://toxsci.oxfordjournals.org/
Dow
nloaded from
16
course data for model evaluation. Next, the diffusion limited structure was used 1
for parameter estimation. Both the partition and diffusion coefficients were 2
allowed to vary during the optimization using the diffusion-limited structure. The 3
partition coefficients obtained for the diffusion-limited case were not significantly 4
different from the ones obtained in the flow-limited case. 5
6
Statistical index for goodness of fit 7
A statistical index for comparison of experimental data to simulations was 8
adopted from Krishnan et al., (1995) and coded in Matlab©. This index was used 9
for comparison of experimental data and simulation results. The index was then 10
calculated for each available time course data set for both flow and diffusion-11
limited PBPK models. If there are N number of data points, then the index is: 12
13
where, expdata represents actual experimental data at various time points, and 14
predictions represents the simulated predictions resulting at the same time points 15
as the data. The smaller the index value, the closer the agreement between 16
experimental and simulated values. 17
Results 18
Intravenous Route – Model Calibration 19
In this section, we show the ability of the two different structures of the 20
PBPK model (flow-limited vs. diffusion-limited) to predict the experimental data. 21
Page 16 of 48Toxicological Sciences
123456789101112131415161718192021222324252627282930313233343536373839404142434445464748495051525354555657585960
by guest on February 17, 2014http://toxsci.oxfordjournals.org/
Dow
nloaded from

17
Figures 3, 5, 7, 9, and 10 show results for the iv exposure at both doses of DMAV1
in tissues. The parameters that were varied for each organ included partition and 2
permeability coefficients, in addition to kidney clearance for the cumulative 3
amount excreted in urine (Figure 13). The parameters estimated from the model 4
are summarized in Table 1. 5
After testing the flow-limited case, the diffusion-limited model was applied. 6
The same kidney clearance value obtained for the flow-limited case was 7
assumed to be the same for the diffusion-limited case (Table 1). The parameters 8
that were varied for each organ included partition and permeability coefficients. 9
These results are summarized in Table 2. Figures 3, 5, 7, 9, and 10 show the 10
results for the diffusion-limited cases. Visually, and as a whole, the diffusion-11
limited model fit the experimental better than the flow-limited model. Both 12
models fit some organs better than others. In general, the diffusion-limited case 13
resulted in lower statistical indices when compared to the flow-limited case 14
(Table 3, Supplementary Materials). As discussed in Krishnan et al., (1995) the 15
lower statistical indices (lower numerical value) are a direct quantitative measure 16
of improved fits with data. 17
18
Oral Route – Model Evaluation 19
In this section we show the simulation fits combined with experimental 20
data gathered from different tissues following oral exposure to low (1.11 mg/kg) 21
or high (111 mg/kg) doses of DMAV. The ability of the two different versions of 22
the PBPK model: (flow- vs. diffusion-limited) was tested statistically using the 23
Page 17 of 48 Toxicological Sciences
123456789101112131415161718192021222324252627282930313233343536373839404142434445464748495051525354555657585960
by guest on February 17, 2014http://toxsci.oxfordjournals.org/
Dow
nloaded from

18
same index described by Krishnan et al., (1995). Figures 4, 6, 8, 11 and 12 1
show the results for both oral doses. The results shown were obtained by using 2
the same parameters as listed in Tables 1 and 2 and estimated using the iv data. 3
Due to stomach absorption, one additional parameter estimated in the oral 4
exposure model is the absorption proportionality constant from the stomach, 5
kabs(h-1). Only kabs was optimized using the oral data set, while other parameters 6
were fixed to values obtained with the iv data set. The final optimized value for 7
kabs in both cases was 0.5 /h. 8
As for the iv case, the diffusion-limited model statistical indeces were 9
calculated after the flow-limited simulations were finished. The resulting shapes 10
of the diffusion-limited and flow-limited curves are very different, and continue to 11
become farther apart from each other as time progresses. These individual organ 12
results were plotted using the log of the tissue concentration (Figures 3-12). 13
14
Sensitivity Analysis 15
Results for the iv sensitivity analysis for both flow- and diffusion-limited iv 16
exposures are shown in Figures 14 and 15. For the flow-limited case, we looked 17
at the results of 8 model variables and 25 model constants, for a total of 200 18
plots. For the diffusion limited case, we looked at the results of 14 model 19
variables and 43 constants, for a total of 602 plots. We present here the results 20
summarizing a small subset of model parameters for both flow- and diffusion-21
limited iv. The sensitivity analysis for both structural cases studied illustrates the 22
importance of collecting data at early experimental time points. 23
Page 18 of 48Toxicological Sciences
123456789101112131415161718192021222324252627282930313233343536373839404142434445464748495051525354555657585960
by guest on February 17, 2014http://toxsci.oxfordjournals.org/
Dow
nloaded from

19
The only constant present in both models was RBC binding, which was 1
examined for impact during early experimental time points. Very small 2
differences were noted between the two model structures (i.e. flow vs diffusion), 3
due to the inclusion of the same constant in both model structures. 4
For the flow-limited model, sensitivity coefficients for kidney clearance 5
gradually decreased to a minimum of -1 during the first 5 hours, and then 6
increased to zero (Figure 14). These results suggest the relative importance of 7
early time points in experimental design for maximum parameter identifiability in 8
comparison to data. For the diffusion-limited model, sensitivity coefficients for 9
most permeability coefficients examined were zero for the time course examined 10
(Supplementary material). The one exception found was the kidney, where 11
normalized sensitivity coefficients were close to one, particularly at early time 12
points (Figure 15). 13
14
15
Statistical Analysis 16
The results for the index calculations across different structures and 17
exposure routes are calculated for every model simulation. Results are given in a 18
table in Supplementary Material. For the iv route, the diffusion-limited indices 19
calculated for each organ were smaller than flow-limited indices, except for the 20
lung, where index values were similar. These results were consistent for both the 21
low and high experimental concentrations analyzed. The statistical analysis 22
Page 19 of 48 Toxicological Sciences
123456789101112131415161718192021222324252627282930313233343536373839404142434445464748495051525354555657585960
by guest on February 17, 2014http://toxsci.oxfordjournals.org/
Dow
nloaded from

20
increases our confidence in stating that the diffusion-limited case resulted in 1
better fits when compared to the flow-limited description (Krishnan et al., 1995). 2
For the oral route, the lower diffusion-limited statistical indices calculated 3
for each organ are consistently smaller than their flow-limited counterparts. For 4
the highest oral concentration simulated, there was no consistent pattern across 5
indices between the two model structures. Therefore, the higher oral dose was 6
not as helpful in distinguishing between the two different model structures 7
examined in this paper. 8
9
Discussion 10
The overall goal of PBPK modeling is to mathematically describe the 11
distribution of a chemical or drug once inside the body. In the past, PBPK model 12
development has included increased levels of complexity in describing transport 13
from blood to organ with physiological information such as blood flow, organ 14
volume, protein binding in plasma, and the presence of a capillary membrane 15
(Bischoff et al., 1971). Although there are precedents in the literature for adding 16
a capillary membrane when describing chemical transport between blood and 17
tissue, complexity is often reduced to minimize the number of estimated 18
parameters by assuming that blood flow drives all transport into each organ 19
(Kohn, 1997; Levitt, 2002). This simplifying assumption of blood flow limitation 20
has worked well for lipophilic drugs (Bjorkman, 2003) and solvents (Andersen, 21
1995). In most clinical studies, it would be impossible to obtain tissue time 22
course data for all organs included in a PBPK model. Using animal models, we 23
Page 20 of 48Toxicological Sciences
123456789101112131415161718192021222324252627282930313233343536373839404142434445464748495051525354555657585960
by guest on February 17, 2014http://toxsci.oxfordjournals.org/
Dow
nloaded from

21
have the advantage of being able to gather tissue time course data for several 1
organs of different species and routes of exposure. Just as this is important for 2
drug delivery, accurate description of environmental contaminants is important 3
for risk assessment applications. The final form of the model and the predicted 4
shape of the concentration time course data will play a role in calculations such 5
as areas under the curve, a potential dose metric for risk assessment purposes, 6
which is also dependent on the particular mode of action chosen for a particular 7
toxic effect. 8
Previously published PBPK models for inorganic arsenic kinetics in 9
rabbits, hamsters and mice have included a final submodel for DMA in a series 10
that includes sequential models for arsenate, arsenite, monomethylarsonic acid 11
(MMAV) and DMAV (Mann et al., 1996; Gentry et al., 2004) . In all of these 12
models, DMA tissue distribution was modeled as diffusion-limited. The Gentry et 13
al. (2004) mouse model was based upon the Mann et al. (1996) hamster/rabbit 14
model. Gentry et al. (2004) chose to use the same permeability coefficients for 15
DMA, but re-estimated the partition coefficients for the mouse based on DMAV-16
derived radioactivity present in tissues 24 hours after iv administration (Hughes 17
and Kenyon, 1998). This re-estimation resulted in partition coefficients for DMA 18
that are 10, 2000 and 5000-fold lower in the mouse model of Gentry et al. (2004) 19
for liver, lung and kidney, respectively, compared to the same partition 20
coefficients in the hamster/rabbit model of Mann et al. (1996). Gentry et al. 21
(2004) do not offer an explanation for their choice to retain the values for the 22
permeability coefficients and re-estimate the partition coefficients. To our 23
Page 21 of 48 Toxicological Sciences
123456789101112131415161718192021222324252627282930313233343536373839404142434445464748495051525354555657585960
by guest on February 17, 2014http://toxsci.oxfordjournals.org/
Dow
nloaded from

22
knowledge, there does not appear to be data in the literature that provide a basis 1
to conclude that partition coefficients would be more likely to change across 2
species compared to permeability coefficients. In our model development effort 3
for DMA, we made maximal use of extensive tissue-time course data following iv 4
administration of DMAV to mice (Hughes et al., 2000) that was not used in 5
Gentry et al. (2004), together with sensitivity analysis, to both evaluate the need 6
for diffusion-limited tissue transport and to provide greater accuracy in parameter 7
estimation. The validity of this approach is supported by the ability of our model 8
to successfully simulate an entirely separate data for DMAV administered orally 9
without adjustment of the parameters (Hughes et al., 2008). 10
The model described in this paper also differs from other published 11
models because of its intended risk analysis application, i.e., the model can be 12
extended to both rats and humans to conduct cross-species dosimetry 13
comparisons. The purpose of such comparisons is that it will allow evaluation of 14
the hypothesis that pharmacokinetic differences between rats and mice account 15
for the greater sensitivity of the rat to DMAV-induced bladder cancer, and to 16
extrapolate between rodents and humans. Therefore, our mouse model includes 17
an explicit erythrocyte compartment because binding to hemoglobin is significant 18
in the rat compared to the mouse (Lu et al., 2004). This model also includes a 19
bladder compartment (target organ) and metabolic clearance of DMAV to TMAO 20
which was not incorporated in any of the published models for inorganic arsenic. 21
Inclusion of metabolic clearance is critical for three reasons: (1) metabolism of 22
DMAV to TMAO is quite extensive in rats (Adair et al., 2007), (2) there is 23
Page 22 of 48Toxicological Sciences
123456789101112131415161718192021222324252627282930313233343536373839404142434445464748495051525354555657585960
by guest on February 17, 2014http://toxsci.oxfordjournals.org/
Dow
nloaded from

23
compelling evidence that metabolism is necessary for DMAV-induced bladder 1
cytotoxicity and cancer in rats (Cohen et al., 2006) and (3) DMAIII is an obligate 2
intermediate in production of TMAO. It would be optimal if the DMA model were 3
to distinguish between DMAV and DMAIII in tissues because DMAIII is believed to 4
be the causative metabolite for DMAV-induced bladder tumors in rats (Cohen et 5
al., 2006). However, current analytical technologies are not sufficient to 6
distinguish between DMAIII and DMAV in solid tissues and even when measured 7
in urine, careful sample preservation and handling are required to ensure the 8
stability of trivalent arsenical metabolites. 9
The DMAV model is also relevant to the issues associated with inorganic 10
arsenic exposure and toxicity. Exposure to inorganic arsenic in drinking water is 11
known to cause cancer of the bladder and other organs in human populations 12
(Yoshida et al., 2004). However, conventional lifetime bioassays with inorganic 13
arsenic and its pentavalent metabolites (MMAV and DMAV) have generally not 14
shown convincing evidence of cancer in rodents with one notable exception. 15
This exception is induction of bladder tumors in rats, but not mice, exposed to 16
DMAV in lifetime bioassays (Arnold et al., 2006) . Because DMAV is a metabolite 17
of inorganic arsenic, a question may arise to its involvement in tumor production 18
in humans exposed to inorganic arsenic. Additionally, the possibility of direct 19
exposure of humans to DMAV exists because of its use as a herbicide and its 20
presence in certain seafood (Borak and Hosgood, 2007). Differences in 21
response between humans and rodents, and between rats and mice, when 22
exposed to inorganic arsenic or its metabolites (MMAV and DMAV) highlights the 23
Page 23 of 48 Toxicological Sciences
123456789101112131415161718192021222324252627282930313233343536373839404142434445464748495051525354555657585960
by guest on February 17, 2014http://toxsci.oxfordjournals.org/
Dow
nloaded from
24
importance of evaluating the impact of pharmacokinetic differences between 1
species. The quantitative impact of pharmacokinetic differences in tissue levels 2
of DMA, either from direct exposure or as a metabolite of inorganic arsenic, is an 3
important factor to consider in interspecies extrapolation for the risk assessment 4
of either inorganic arsenic or DMAV. The model described in this paper can be 5
linked to the risk assessment of either inorganic arsenic or DMAV by extending it 6
to both rats and humans to conduct cross-species dosimetry comparisons. 7
In this work, differences in the shape of the simulation curves are visually 8
apparent between the flow- and diffusion-limited model structures. The diffusion-9
limited simulation more closely approximated the experimental data. Both flow- 10
and diffusion-limited models provided close predictions for the iv data after the 11
first hour. Simulations using both model structures diverge at earlier time points. 12
This is expected, since diffusion or flow limitation affects the distribution and 13
disposition of the chemicals in tissues. Later phases of the data time points are 14
more influenced by clearance (metabolic and/or urinary). Therefore, the behavior 15
of both models in comparison to data was consistent with biological processes. 16
One important question related to application of regression techniques to 17
calculate model parameters is how to quantify the ability to estimate the desired 18
parameters. One of the standard tools used to answer this question is local 19
sensitivity analysis. Sensitivity analysis is related to model structure and 20
formulation. Once a model is constructed, simulations of output variables (such 21
as tissue concentrations) are conducted using various levels of input parameters. 22
A sensitivity coefficient is obtained as the ratio of output (e.g. tissue levels) to 23
Page 24 of 48Toxicological Sciences
123456789101112131415161718192021222324252627282930313233343536373839404142434445464748495051525354555657585960
by guest on February 17, 2014http://toxsci.oxfordjournals.org/
Dow
nloaded from

25
input (e.g. blood flow rate) change. Hence, sensitivity analysis can be conducted 1
in the absence of data to identify the impact of parameter variability on output 2
simulations based on model structure and assumptions. In general, the higher 3
the sensitivity coefficients, the higher the ability to estimate the input parameter 4
when data is present. In this manner, sensitivity analysis can lead to improved 5
experimental design by helping prioritize key input parameters in a model 6
(Clewell et al., 1994; Evans et al., 1994) 7
To our knowledge, this is the first time that both sensitivity and goodness 8
of fit analyses have been applied to a diffusion-limited PBPK model. Since 9
diffusion increases the complexity and number of model parameters, the 10
sensitivity analysis concentrated on possible identifiability issues for permeability 11
coefficients. The one exception to this rule was the kidney, where the 12
permeability coefficient was identifiable at early time points. Both types of 13
analyses, goodness of fit and sensitivity analysis, showed how the diffusion- 14
limited structure increases our confidence in the overall fits with the experimental 15
data. While goodness of fit does not include time course dependencies, 16
sensitivity analysis does include the impact of experimental time. The current 17
sensitivity analysis confirms how the diffusion-limited structure improves the time 18
course description when compared to a flow-limited structure, particularly when 19
early experimental time points are available. 20
In summary, a PBPK model was developed to describe the tissue 21
disposition of administered DMAV in mice utilizing data that allowed evaluation of 22
the impact of differing assumptions concerning transport of DMA into tissue. The 23
Page 25 of 48 Toxicological Sciences
123456789101112131415161718192021222324252627282930313233343536373839404142434445464748495051525354555657585960
by guest on February 17, 2014http://toxsci.oxfordjournals.org/
Dow
nloaded from

26
results of the diffusion-limited model consistently provided an improved fit over 1
flow-limited simulations when compared to tissue time course experimental data. 2
This modeling effort shows the importance of collecting time course data from 3
different exposure scenarios and from different tissues. 4
5
Page 26 of 48Toxicological Sciences
123456789101112131415161718192021222324252627282930313233343536373839404142434445464748495051525354555657585960
by guest on February 17, 2014http://toxsci.oxfordjournals.org/
Dow
nloaded from

27
References 12
Adair, B. M., Moore, T., Conklin, S. D., Creed, J. T., Wolf, D. C., and Thomas, D. J. 3(2007). Tissue distribution and urinary excretion of dimethylated arsenic and its 4metabolites in dimethylarsinic acid- or arsenate-treated rats. Toxicol Appl 5Pharmacol 222, 235-242. 6
Andersen, M. E. (1995). Development of physiologically based pharmacokinetic and 7physiologically based pharmacodynamic models for applications in toxicology 8and risk assessment. Toxicol Lett 79, 35-44. 9
Andersen, M. E., and Dennison, J. E. (2001). Mode of action and tissue dosimetry in 10current and future risk assessments. Sci Total Environ 274, 3-14. 11
Arnold, L. L., Cano, M., St John, M., Eldan, M., van Gemert, M., and Cohen, S. M. 12(1999). Effects of dietary dimethylarsinic acid on the urine and urothelium of rats. 13Carcinogenesis 20, 2171-2179. 14
Arnold, L. L., Eldan, M., Nyska, A., van Gemert, M., and Cohen, S. M. (2006). 15Dimethylarsinic acid: results of chronic toxicity/oncogenicity studies in F344 rats 16and in B6C3F1 mice. Toxicology 223, 82-100. 17
ATSDR (2007). Toxicological Profile for Arsenic. U. S. Department of Health and 18Human Services. Agency for Toxic Substances and Disease Registry, Public 19Health Service, Atlanta. 20
Bischoff, K. B., Dedrick, R. L., Zaharko, D. S., and Longstreth, J. A. (1971). 21Methotrexate pharmacokinetics. J Pharm Sci 60, 1128-1133. 22
Bjorkman, S. (2003). Reduction and lumping of physiologically based pharmacokinetic 23models: prediction of the disposition of fentanyl and pethidine in humans by 24successively simplified models. J Pharmacokinet Pharmacodyn 30, 285-307. 25
Borak, J., and Hosgood, H. D. (2007). Seafood arsenic: implications for human risk 26assessment. Regul Toxicol Pharmacol 47, 204-212. 27
Brown, R. P., Delp, M. D., Lindstedt, S. L., Rhomberg, L. R., and Beliles, R. P. (1997). 28Physiological parameter values for physiologically based pharmacokinetic 29models. Toxicol Ind Health 13, 407-484. 30
Clewell, H. J., 3rd, Lee, T. S., and Carpenter, R. L. (1994). Sensitivity of physiologically 31based pharmacokinetic models to variation in model parameters: methylene 32chloride. Risk Anal 14, 521-531. 33
Cohen, S. M., Arnold, L. L., Eldan, M., Lewis, A. S., and Beck, B. D. (2006). Methylated 34arsenicals: the implications of metabolism and carcinogenicity studies in rodents 35to human risk assessment. Crit Rev Toxicol 36, 99-133. 36
Collins, A. S., Sumner, S. C., Borghoff, S. J., and Medinsky, M. A. (1999). A 37physiological model for tert-amyl methyl ether and tert-amyl alcohol: hypothesis 38testing of model structures. Toxicol Sci 49, 15-28. 39
Cui, X., Kobayashi, Y., Hayakawa, T., and Hirano, S. (2004). Arsenic speciation in bile 40and urine following oral and intravenous exposure to inorganic and organic 41arsenics in rats. Toxicol Sci 82, 478-487. 42
El-Masri, H. A., and Kenyon, E. M. (2007). Development of a human physiologically 43based pharmacokinetic (PBPK) model for inorganic arsenic and its mono- and di-44methylated metabolites. J Pharmacokinet Pharmacodyn.45
Page 27 of 48 Toxicological Sciences
123456789101112131415161718192021222324252627282930313233343536373839404142434445464748495051525354555657585960
by guest on February 17, 2014http://toxsci.oxfordjournals.org/
Dow
nloaded from

28
Evans, M. V., Crank, W. D., Yang, H. M., and Simmons, J. E. (1994). Applications of 1sensitivity analysis to a physiologically based pharmacokinetic model for carbon 2tetrachloride in rats. Toxicol Appl Pharmacol 128, 36-44. 3
Gallo, B. V., Hinson, J. L., and Weidler, D. J. (1993). Pharmacokinetic profile of 4flosequinan in patients with compromised renal function. J Pharm Sci 82, 282-5285. 6
Gentry, P. R., Covington, T. R., Mann, S., Shipp, A. M., Yager, J. W., and Clewell, H. J., 73rd (2004). Physiologically based pharmacokinetic modeling of arsenic in the 8mouse. J Toxicol Environ Health A 67, 43-71. 9
Hughes, M. F., Del Razo, L. M., and Kenyon, E. M. (2000). Dose-dependent effects on 10tissue distribution and metabolism of dimethylarsinic acid in the mouse after 11intravenous administration. Toxicology 143, 155-166. 12
Hughes, M. F., Devesa, V., Adair, B. M., Conklin, S. D., Creed, J. T., Styblo, M., 13Kenyon, E. M., and Thomas, D. J. (2008). Tissue dosimetry, metabolism and 14excretion of pentavalent and trivalent dimethylated arsenic in mice after oral 15administration. Toxicol Appl Pharmacol 227, 26-35. 16
Hughes, M. F., and Kenyon, E. M. (1998). Dose-dependent effects on the disposition of 17monomethylarsonic acid and dimethylarsinic acid in the mouse after intravenous 18administration. J Toxicol Environ Health A 53, 95-112. 19
Kohn, M. C. (1997). The importance of anatomical realism for validation of 20physiological models of disposition of inhaled toxicants. Toxicol Appl Pharmacol 21147, 448-458. 22
Krishnan, K., Haddad, S., and Pelekis, M. (1995). A simple index for representing the 23discrepancy between simulations of physiological pharmacokinetic models and 24experimental data. Toxicol Ind Health 11, 413-422. 25
Levitt, D. G. (2002). PKQuest: capillary permeability limitation and plasma protein 26binding - application to human inulin, dicloxacillin and ceftriaxone 27pharmacokinetics. BMC Clin Pharmacol 2, 7.28
Lu, M., Wang, H., Li, X. F., Lu, X., Cullen, W. R., Arnold, L. L., Cohen, S. M., and Le, 29X. C. (2004). Evidence of hemoglobin binding to arsenic as a basis for the 30accumulation of arsenic in rat blood. Chem Res Toxicol 17, 1733-1742. 31
Lutz, R. J., Dedrick, R. L., and Zaharko, D. S. (1980). Physiological pharmacokinetics: 32an in vivo approach to membrane transport. Pharmacol Ther 11, 559-592. 33
Mann, S., Droz, P. O., and Vahter, M. (1996). A physiologically based pharmacokinetic 34model for arsenic exposure. I. Development in hamsters and rabbits. Toxicol Appl 35Pharmacol 137, 8-22. 36
Marafante, E., and Vahter, M. (1987). Solubility, retention, and metabolism of 37intratracheally and orally administered inorganic arsenic compounds in the 38hamster. Environ Res 42, 72-82. 39
Stevens, J. T., Hall, L. L., Farmer, J. D., DiPasquale, L. C., Chernoff, N., and Durham, 40W. F. (1977). Disposition of 14C and/or 74As-cacodylic acid in rats after 41intravenous, intratracheal, or peroral administration. Environ Health Perspect 19,42151-157. 43
Suzuki, K. T., Katagiri, A., Sakuma, Y., Ogra, Y., and Ohmichi, M. (2004). Distributions 44and chemical forms of arsenic after intravenous administration of dimethylarsinic 45and monomethylarsonic acids to rats. Toxicol Appl Pharmacol 198, 336-344. 46
Page 28 of 48Toxicological Sciences
123456789101112131415161718192021222324252627282930313233343536373839404142434445464748495051525354555657585960
by guest on February 17, 2014http://toxsci.oxfordjournals.org/
Dow
nloaded from
29
Vahter, M., Marafante, E., and Dencker, L. (1984). Tissue distribution and retention of 174As-dimethylarsinic acid in mice and rats. Arch Environ Contam Toxicol 13,2259-264. 3
Wei, M., Wanibuchi, H., Morimura, K., Iwai, S., Yoshida, K., Endo, G., Nakae, D., and 4Fukushima, S. (2002). Carcinogenicity of dimethylarsinic acid in male F344 rats 5and genetic alterations in induced urinary bladder tumors. Carcinogenesis 23,61387-1397. 7
Yamamoto, K., Tsutsumi, M., Kobayashi, E., Endoh, T., Noguchi, O., Okajima, E., 8Denda, A., Mori, Y., and Konishi, Y. (1995). Initiation of hepatocarcinogenesis 9by endogenously formed N-nitrosobis(2-hydroxypropyl)amine, N-10nitrosodiethanolamine and N-nitroso-2,6-dimethylmorpholine in rats. 11Carcinogenesis 16, 2633-2636. 12
Yamanaka, K., Katsumata, K., Ikuma, K., Hasegawa, A., Nakano, M., and Okada, S. 13(2000). The role of orally administered dimethylarsinic acid, a main metabolite of 14inorganic arsenics, in the promotion and progression of UVB-induced skin 15tumorigenesis in hairless mice. Cancer Lett 152, 79-85. 16
Yamanaka, K., Ohtsubo, K., Hasegawa, A., Hayashi, H., Ohji, H., Kanisawa, M., and 17Okada, S. (1996). Exposure to dimethylarsinic acid, a main metabolite of 18inorganic arsenics, strongly promotes tumorigenesis initiated by 4-nitroquinoline 191-oxide in the lungs of mice. Carcinogenesis 17, 767-770. 20
Yoshida, K., Chen, H., Inoue, Y., Wanibuchi, H., Fukushima, S., Kuroda, K., and Endo, 21G. (1997). The urinary excretion of arsenic metabolites after a single oral 22administration of dimethylarsinic acid to rats. Arch Environ Contam Toxicol 32,23416-421. 24
Yoshida, K., Inoue, Y., Kuroda, K., Chen, H., Wanibuchi, H., Fukushima, S., and Endo, 25G. (1998). Urinary excretion of arsenic metabolites after long-term oral 26administration of various arsenic compounds to rats. J Toxicol Environ Health A 2754, 179-192. 28
Yoshida, T., Yamauchi, H., and Fan Sun, G. (2004). Chronic health effects in people 29exposed to arsenic via the drinking water: dose-response relationships in review. 30Toxicol Appl Pharmacol 198, 243-252. 31
32 33
Page 29 of 48 Toxicological Sciences
123456789101112131415161718192021222324252627282930313233343536373839404142434445464748495051525354555657585960
by guest on February 17, 2014http://toxsci.oxfordjournals.org/
Dow
nloaded from
30
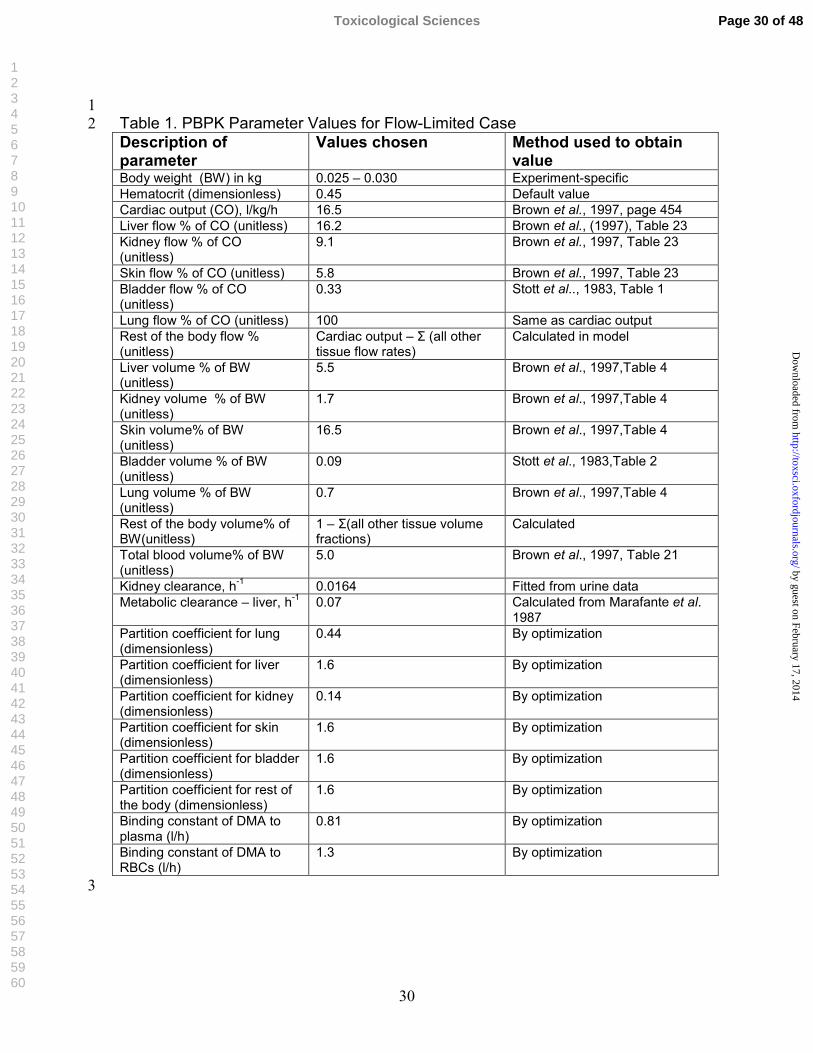
1Table 1. PBPK Parameter Values for Flow-Limited Case 2Description of parameter
Values chosen Method used to obtain value
Body weight (BW) in kg 0.025 – 0.030 Experiment-specific Hematocrit (dimensionless) 0.45 Default value Cardiac output (CO), l/kg/h 16.5 Brown et al., 1997, page 454 Liver flow % of CO (unitless) 16.2 Brown et al., (1997), Table 23 Kidney flow % of CO (unitless)
9.1 Brown et al., 1997, Table 23
Skin flow % of CO (unitless) 5.8 Brown et al., 1997, Table 23 Bladder flow % of CO (unitless)
0.33 Stott et al.., 1983, Table 1
Lung flow % of CO (unitless) 100 Same as cardiac output Rest of the body flow % (unitless)
Cardiac output – Σ (all other tissue flow rates)
Calculated in model
Liver volume % of BW (unitless)
5.5 Brown et al., 1997,Table 4
Kidney volume % of BW (unitless)
1.7 Brown et al., 1997,Table 4
Skin volume% of BW (unitless)
16.5 Brown et al., 1997,Table 4
Bladder volume % of BW (unitless)
0.09 Stott et al., 1983,Table 2
Lung volume % of BW (unitless)
0.7 Brown et al., 1997,Table 4
Rest of the body volume% of BW(unitless)
1 – Σ(all other tissue volume fractions)
Calculated
Total blood volume% of BW (unitless)
5.0 Brown et al., 1997, Table 21
Kidney clearance, h-1 0.0164 Fitted from urine data Metabolic clearance – liver, h-1 0.07 Calculated from Marafante et al.
1987 Partition coefficient for lung (dimensionless)
0.44 By optimization
Partition coefficient for liver (dimensionless)
1.6 By optimization
Partition coefficient for kidney (dimensionless)
0.14 By optimization
Partition coefficient for skin (dimensionless)
1.6 By optimization
Partition coefficient for bladder (dimensionless)
1.6 By optimization
Partition coefficient for rest of the body (dimensionless)
1.6 By optimization
Binding constant of DMA to plasma (l/h)
0.81 By optimization
Binding constant of DMA to RBCs (l/h)
1.3 By optimization
3
Page 30 of 48Toxicological Sciences
123456789101112131415161718192021222324252627282930313233343536373839404142434445464748495051525354555657585960
by guest on February 17, 2014http://toxsci.oxfordjournals.org/
Dow
nloaded from

31
Table 2. Parameter Values for Diffusion-Limited Case 1Description of parameter
Values chosen Method used to obtain value
Permeability coefficient for lung (l/h)
0.94 By optimization
Permeability coefficient for liver (l/h)
0.0095 By optimization
Permeability coefficient for kidney (l/h)
0.12 By optimization
Permeability coefficient for skin (l/h)
0.0095 Assumed equal to liver value
Permeability coefficient for bladder (l/h)
0.0095 Assumed equal to liver value
Permeability coefficient for rest of the body (l/h)
0.0095 Assumed equal to liver value
Fraction of blood in lung 0.5 Brown et al., 1997 Fraction of blood in skin 0.03 Brown et al., 1997 Fraction of blood in liver and GI
0.31 Brown et al., 1997
Fraction of blood in kidney 0.24 Brown et al., 1997 Fraction of blood in bladder 0.03 Assumed to be equal to adrenal Fraction of blood in rest of body
0.04 Assumed similar to bladder
234
Page 31 of 48 Toxicological Sciences
123456789101112131415161718192021222324252627282930313233343536373839404142434445464748495051525354555657585960
by guest on February 17, 2014http://toxsci.oxfordjournals.org/
Dow
nloaded from

32
12
Figure Legends 34
Figure 1 Schematic diagram of flow-limited version of DMAV PBPK model. 5Ca represents arterial blood, kel represents kidney clearance, kabs 6represents absorption from stomach. 7
Figure 2 Schematic diagram of diffusion-limited version of DMAV PBPK 8model. 9
Figure 3 Model calibration, iv data: simulations compared to experimental 10data for DMA-derived radioactivity in kidney (ug As/l) for flow-11limited and diffusion-limited cases at two dose levels (1.11 and 111 12mg/kg DMAV). 13
Figure 4 Model evaluation, oral data: simulations compared to experimental 14data for DMA-derived radioactivity in kidney (ug As/l) for flow-15limited and diffusion-limited cases at two dose levels (1.11 and 111 16mg/kg DMAV). 17
Figure 5 Model calibration, iv data: simulations compared to experimental 18data for DMA-derived radioactivity in liver (ug As/l) for flow-limited 19and diffusion-limited cases at two dose levels (1.11 and 111 mg/kg 20DMAV). 21
Figure 6 Model evaluation, oral data: simulations compared to experimental 22data for DMA-derived radioactivity in liver (ug As/l) for flow-limited 23and diffusion-limited cases at two dose levels (1.11 and 111 mg/kg 24DMAV). 25
Figure 7 Model calibration, iv data: simulations compared to experimental 26data for DMA-derived radioactivity in lung (ug As/L) for flow-limited 27and diffusion-limited cases at two dose levels (1.11 and 111 mg/kg 28DMAV). 29
Figure 8 Model evaluation, oral data: simulations compared to experimental 30data for DMA-derived radioactivity in lung (ug As/l) for flow-limited 31and diffusion-limited cases at two dose levels (1.11 and 111 mg/kg 32DMAV). 33
Figure 9 Model calibration, iv data: simulations compared to experimental 34data for DMA-derived radioactivity in plasma (ug As/l) for flow-35limited and diffusion-limited cases at two dose levels (1.11 and 111 36mg/kg DMAV). 37
Figure 10 Model calibration, iv data: simulations compared to experimental 38data for DMA-derived radioactivity in red blood cells (ug As/l) for 39flow-limited and diffusion-limited cases at two dose levels (1.11 and 40111 mg/kg DMAV). 41
Figure 11 Model evaluation, oral data: simulations compared to experimental 42data for DMA-derived radioactivity in whole blood (ug As/l) for flow-43limited and diffusion-limited cases at two dose levels (1.11 and 111 44mg/kg DMAV). 45
Page 32 of 48Toxicological Sciences
123456789101112131415161718192021222324252627282930313233343536373839404142434445464748495051525354555657585960
by guest on February 17, 2014http://toxsci.oxfordjournals.org/
Dow
nloaded from

33
Figure 12 Model evaluation, oral data: simulations compared to experimental 1data for DMA-derived radioactivity in bladder tissue (ug As/l) for 2flow-limited and diffusion-limited cases at two dose levels (1.11 and 3111 mg/kg DMAV). 4
Figure 13 Model calibration, i.v. data: simulations compared to experimental 5data for cumulative DMA-derived radioactivity in urine (ug As 6excreted) for diffusion-limited case at two dose levels (1.11 and 111 7mg/kg DMAV). 8
Figure 14 Normalized sensitivity coefficients for iv simulations of flow-limited 9structure. The sensitivity coefficients were calculated for changes in 10amount to kidney tissue with respect to kidney clearance. 11
Figure 15 Normalized sensitivity coefficients for iv simulations of diffusion- 12limited structure. The sensitivity coefficients were calculated for 13changes in amount in kidney tissue with respect to kidney 14permeability. 15
16
Page 33 of 48 Toxicological Sciences
123456789101112131415161718192021222324252627282930313233343536373839404142434445464748495051525354555657585960
by guest on February 17, 2014http://toxsci.oxfordjournals.org/
Dow
nloaded from
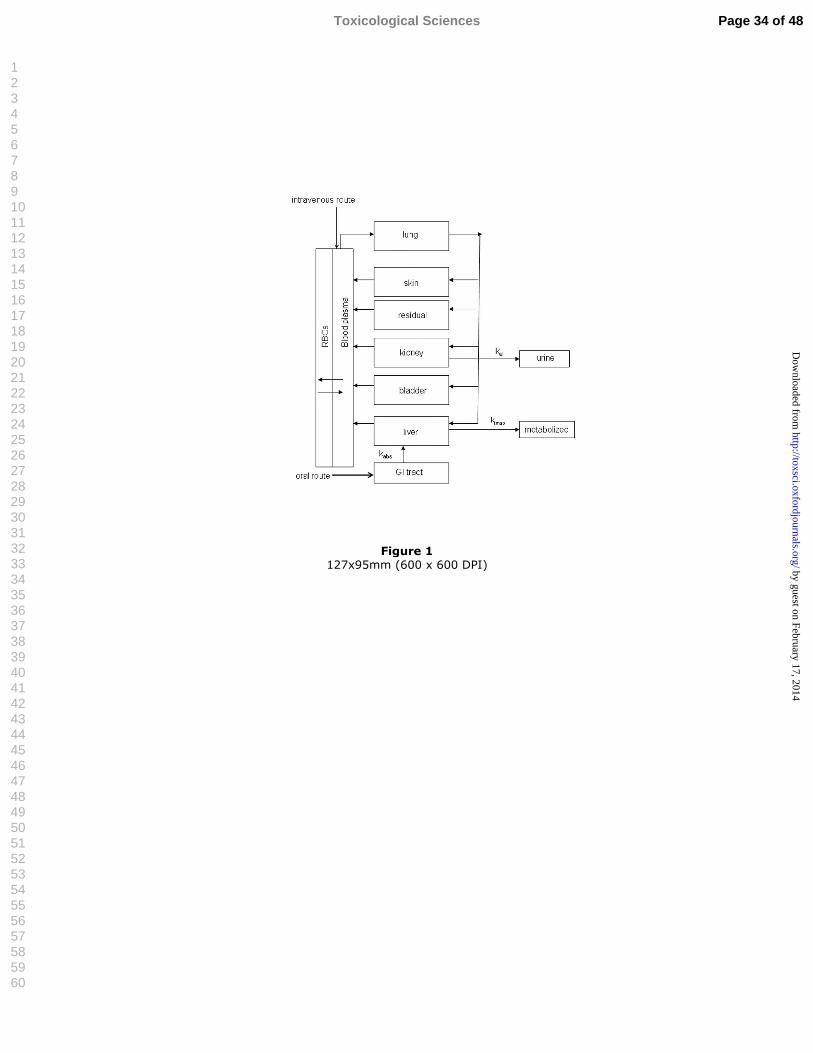
Figure 1 127x95mm (600 x 600 DPI)
Page 34 of 48Toxicological Sciences
123456789101112131415161718192021222324252627282930313233343536373839404142434445464748495051525354555657585960
by guest on February 17, 2014http://toxsci.oxfordjournals.org/
Dow
nloaded from

Figure 2 127x95mm (600 x 600 DPI)
Page 35 of 48 Toxicological Sciences
123456789101112131415161718192021222324252627282930313233343536373839404142434445464748495051525354555657585960
by guest on February 17, 2014http://toxsci.oxfordjournals.org/
Dow
nloaded from

Figure 3 229x136mm (600 x 600 DPI)
Page 36 of 48Toxicological Sciences
123456789101112131415161718192021222324252627282930313233343536373839404142434445464748495051525354555657585960
by guest on February 17, 2014http://toxsci.oxfordjournals.org/
Dow
nloaded from
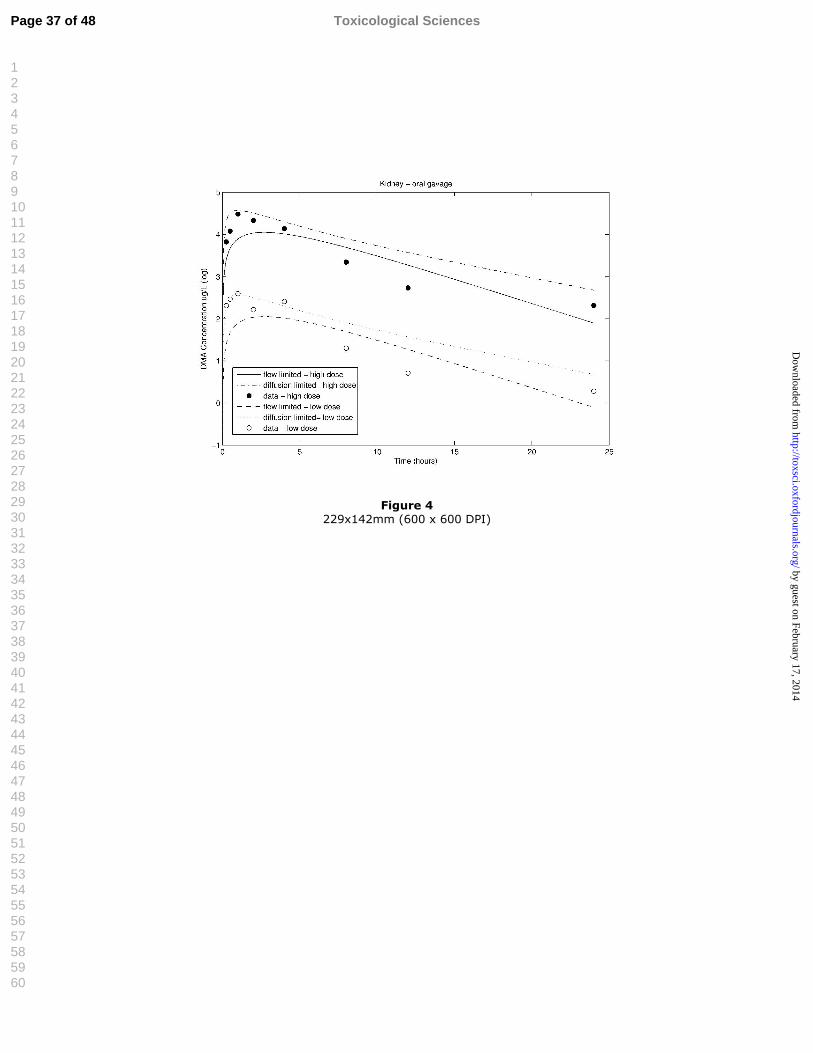
Figure 4 229x142mm (600 x 600 DPI)
Page 37 of 48 Toxicological Sciences
123456789101112131415161718192021222324252627282930313233343536373839404142434445464748495051525354555657585960
by guest on February 17, 2014http://toxsci.oxfordjournals.org/
Dow
nloaded from

Figure 5 229x142mm (600 x 600 DPI)
Page 38 of 48Toxicological Sciences
123456789101112131415161718192021222324252627282930313233343536373839404142434445464748495051525354555657585960
by guest on February 17, 2014http://toxsci.oxfordjournals.org/
Dow
nloaded from

Figure 6 229x142mm (600 x 600 DPI)
Page 39 of 48 Toxicological Sciences
123456789101112131415161718192021222324252627282930313233343536373839404142434445464748495051525354555657585960
by guest on February 17, 2014http://toxsci.oxfordjournals.org/
Dow
nloaded from

Figure 7 229x142mm (600 x 600 DPI)
Page 40 of 48Toxicological Sciences
123456789101112131415161718192021222324252627282930313233343536373839404142434445464748495051525354555657585960
by guest on February 17, 2014http://toxsci.oxfordjournals.org/
Dow
nloaded from

Figure 8 229x142mm (600 x 600 DPI)
Page 41 of 48 Toxicological Sciences
123456789101112131415161718192021222324252627282930313233343536373839404142434445464748495051525354555657585960
by guest on February 17, 2014http://toxsci.oxfordjournals.org/
Dow
nloaded from

Figure 9 229x142mm (600 x 600 DPI)
Page 42 of 48Toxicological Sciences
123456789101112131415161718192021222324252627282930313233343536373839404142434445464748495051525354555657585960
by guest on February 17, 2014http://toxsci.oxfordjournals.org/
Dow
nloaded from

Figure 10 229x142mm (600 x 600 DPI)
Page 43 of 48 Toxicological Sciences
123456789101112131415161718192021222324252627282930313233343536373839404142434445464748495051525354555657585960
by guest on February 17, 2014http://toxsci.oxfordjournals.org/
Dow
nloaded from

Figure 11 229x142mm (600 x 600 DPI)
Page 44 of 48Toxicological Sciences
123456789101112131415161718192021222324252627282930313233343536373839404142434445464748495051525354555657585960
by guest on February 17, 2014http://toxsci.oxfordjournals.org/
Dow
nloaded from
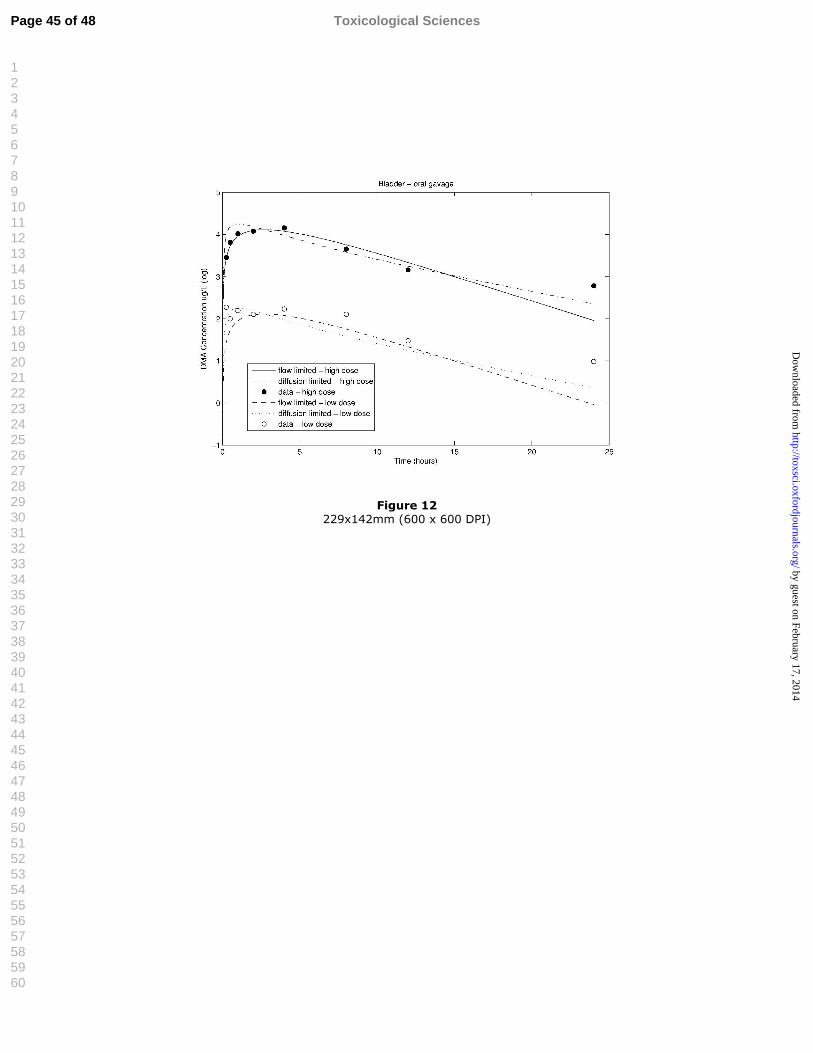
Figure 12 229x142mm (600 x 600 DPI)
Page 45 of 48 Toxicological Sciences
123456789101112131415161718192021222324252627282930313233343536373839404142434445464748495051525354555657585960
by guest on February 17, 2014http://toxsci.oxfordjournals.org/
Dow
nloaded from

Figure 13 229x142mm (600 x 600 DPI)
Page 46 of 48Toxicological Sciences
123456789101112131415161718192021222324252627282930313233343536373839404142434445464748495051525354555657585960
by guest on February 17, 2014http://toxsci.oxfordjournals.org/
Dow
nloaded from

Figure 14 229x142mm (600 x 600 DPI)
Page 47 of 48 Toxicological Sciences
123456789101112131415161718192021222324252627282930313233343536373839404142434445464748495051525354555657585960
by guest on February 17, 2014http://toxsci.oxfordjournals.org/
Dow
nloaded from

Figure 15 229x142mm (600 x 600 DPI)
Page 48 of 48Toxicological Sciences
123456789101112131415161718192021222324252627282930313233343536373839404142434445464748495051525354555657585960
by guest on February 17, 2014http://toxsci.oxfordjournals.org/
Dow
nloaded from