Metabonomic investigation of rat tissues following intravenous administration of cyanidin...
15
1 23 ! " # $!%& #'%% ( %)%%*%+%!%,% ! " #! !
Transcript of Metabonomic investigation of rat tissues following intravenous administration of cyanidin...

1 23
������ ����������� ����������������������������������������� !"������#��������������������$!%��&�#' ��%%(����%)�%%�*����%+�%�!�%,�%�
������ �� ����� ��� ��������� ��������� ��� ������������� � ����� ������� � ��������� ������������ �� �����������������
��������� ����������������� ������������������������������������������������������ ������!� �"��#�!�������!�

1 23
Your article is protected by copyright andall rights are held exclusively by SpringerScience+Business Media, LLC. This e-offprintis for personal use only and shall not be self-archived in electronic repositories. If youwish to self-archive your work, please use theaccepted author’s version for posting to yourown website or your institution’s repository.You may further deposit the accepted author’sversion on a funder’s repository at a funder’srequest, provided it is not made publiclyavailable until 12 months after publication.

ORIGINAL ARTICLE
Metabonomic investigation of rat tissues following intravenousadministration of cyanidin 3-glucoside at a physiologicallyrelevant dose
Andreja Vanzo • Matthias Scholz • Mattia Gasperotti •
Federica Tramer • Sabina Passamonti •
Urska Vrhovsek • Fulvio Mattivi
Received: 23 December 2011 / Accepted: 24 April 2012 / Published online: 11 May 2012! Springer Science+Business Media, LLC 2012
Abstract Anthocyanins, which are dietary flavonoidsoccurring in fruit and beverages, are reported to have a
beneficial impact on a wide range of chronic diseases, such
as cardiovascular, neurodegenerative and neoplastic dis-eases. To understand the underlying mechanisms, a bio-
chemical description of the changes in cell metabolism
caused by anthocyanins can be provided by metabonomicstudies. The aim of this study was to detect changes in the
profiles of metabolites induced by the administration of
cyanidin 3-glucoside to adult male rats. A physiologicaldose of cyanidin 3-glucoside was intravenously adminis-
tered, and blood, kidneys and liver were collected after
5 min. The tissues were rapidly frozen in liquid nitrogen,stored briefly at -80 "C, homogenised under cryogenic
conditions and extracted in ice-cold methanol:water (95:5,
v/v). The extracts were then analysed using UPLC/QTOF-
MS. Multivariate statistical analysis of the data was per-formed using orthogonal projections to latent structures-
discriminant analysis (OPLS-DA). Discriminating vari-
ables were compared to the in-house standard database,considering matches in retention times, parent mass ions,
mass fragment patterns and isotopic patterns. This meta-
bolomic approach made it possible to identify as many aseight metabolite markers, including bile acids, reduced and
oxidised glutathione and some lipids. Such changes suggest
that cyanidin 3-glucoside has a major effect on tissueantioxidant status as well as on energy and glucose
metabolism.
Keywords Anthocyanins ! Cyanidin 3-glucoside !Metabolomics ! Metabonomics ! Wistar rats !Ultra performance liquid chromatography !Quadrupole-time-of-flight mass spectrometry
1 Introduction
In the past few decades scientists have recognised the posi-
tive value of dietary anthocyanins, red flavonoid pigmentsoccurring in fruit and vegetables, for human health. From
there on much progress was achieved by investigating the
presence of anthocyanins in food (Wu et al. 2006; U.S.Department of Agriculture 2007), estimating their daily
intake (Wu et al. 2006) and investigating their absorption,
distribution, metabolism, excretion and bioactivity (McGhieand Walton 2007; Manach and Donovan 2004; Manach et al.
2005; Hanhineva et al. 2010; Ichiyanagi 2008; Kay 2006).
Alongside such studies, epidemiologic studies have shownthe connection between consumption of food rich in antho-
cyanins and health benefits (Cassidy et al. 2011; Mursu et al.
2008; Spormann et al. 2008; Basu et al. 2010; Prior 2003;
Electronic supplementary material The online version of thisarticle (doi:10.1007/s11306-012-0430-8) contains supplementarymaterial, which is available to authorized users.
A. VanzoCentral Laboratory, Agricultural Institute of Slovenia,Hacquetova 17, 1000 Ljubljana, Slovenia
A. Vanzo ! M. Gasperotti ! U. Vrhovsek ! F. Mattivi (&)Department of Food Quality and Nutrition, Fondazione EdmundMach, Centro Ricerca e Innovazione, via E. Mach 1, 38010 SanMichele all’Adige, Italye-mail: [email protected]
A. Vanzo ! F. Tramer ! S. PassamontiDepartment of Life Sciences, University of Trieste, via L.Giorgieri 1, 34127 Trieste, Italy
M. ScholzDepartment of Computational Biology, Fondazione EdmundMach, Centro Ricerca e Innovazione, via E. Mach 1,38010 San Michele all’Adige, Italy
123
Metabolomics (2013) 9:88–100
DOI 10.1007/s11306-012-0430-8
Author's personal copy

Hertog et al. 1993). The recently updated recommendations
promote daily consumption of fresh fruit and fruit juice aspart of a healthy dietary plan to reduce the risk of chronic
diseases, such as cardiovascular diseases, type-2 diabetes,
osteoporosis and some forms of neurodegenerative diseases(Lichtenstein et al. 2006; WHO 2004; U.S. Department of
Health & Human services and U.S. Department of Agri-
culture 2010).The mechanisms underlying the reported observations
have still not been clarified. A mechanistic understanding ofthe action of anthocyanin in living organisms requires a
biochemical description of cell metabolism changes caused
by anthocyanins, which can be provided by metabolomic/metabonomic studies. Metabolomic/metabonomic is the
analysis of metabolome, a set of small molecular mass
organic compounds in a given biological medium, at givenconditions (Roux et al. 2011). At present, there is still no
absolute agreement over the exact differences between
metabolomics and metabonomics and the terminology isoften used interchangeably (Robertson 2005). Initially,
metabolomics refers to the measurements of the pools of
cellular metabolites (Fiehn 2002) and metabonomicsextends metabolic profiling to the quantitative measurement
of the time related multi-parametric metabolic response of
living systems to pathophysiological stimuli or geneticmodification (Nicholson et al. 1999). Finally, both meta-
bolomics and metabonomic employ similar methodologies
for analyzing the metabolome by using the state-of-the-artNMR- (Coen et al. 2008) or mass spectrometry-based
(Dettmer et al. 2007; Scalbert et al. 2009) technological
platforms. Beside selective and sensitive analytical tools,processing generated data creates a big challenge in ‘-omics’
approaches. The use of chemometric methods to analyze
complex spectral data sets can greatly affect the metabolitesthat are identified. Principal components analysis (PCA) has
been widely used in metabonomic studies and is an unsu-
pervised approach in that it allows inherent clusteringbehavior of samples to be ascertained with no a priori
knowledge of sample class membership (Jackson 1991).
Alternatively, one widely used supervised method is partialleast squares or projection to latent structures (PLS) (Wold
1985). A relatively new approach is orthogonal partial least
squares-discriminant analysis (OPLS-DA) that extends thetraditional supervised algorithm of PLS by prefiltering
classification-irrelevant orthogonal variation from data
(Trygg and Wold 2002; Trygg and Holmes 2007; Bylesjoet al. 2006). This prefiltered, structured noise in the data set is
modeled separately from the class variation and can also be
further interpreted via the loading matrices. The applicationof OPLS-DA improves the interpretability of spectral vari-
ation between classes and has been shown to successfully
discriminate metabolic profiles in a wide range of studies(Qiu et al. 2010; Moazzami et al. 2011; Ali et al. 2012; Stella
et al. 2006). So far, little is known about how the nutrient
content of the diet impact changes in metabolic profiles. Thecapacity of anthocyanins to affect the mammalian metabo-
lism has recently been demonstrated by investigating met-
abolomic changes in the brain and the plasma of elderly ratsafter dietary supplementation with blueberry extract. It was
found that metabolites connected to neurological functions
were selectively affected, i.e. choline, phosphocholine,taurine and GABA (Yang et al. 2011). The aim of this study
was a non-targeted mass spectrometry-based investigationof the metabolic effects induced by the intravenous admin-
istration of cyanidin 3-glucoside, a common dietary antho-
cyanin, at a physiologically relevant dose in adult male rats.The kinetics of cyanidin 3-glucoside transfer from the
plasma into tissues, and subsequent transformation in its
methylated derivative peonidin 3-glucoside is extraordi-narily fast (Vanzo et al. 2011). Shifts in the cellular meta-
bolic homeostasis induced by cyanidin 3-glucoside would be
expected to occur shortly after tissue uptake. Thus blood,kidneys and liver were collected 5 min after intravenous
(i.v.) administration. In order to identify reliable metabolic
markers, this study followed a carefully designed experi-mental protocol in terms of choosing animals, timing of
experiments, randomisation, repeatability and quenching.
Proper collection, preparation and extraction of sampleswere also strictly controlled (Fiehn 2001; Gika and Theo-
doridis 2011). Data were analysed by ultra performance
liquid chromatography (UPLC) coupled to a quadrupole-time-of-flight mass spectrometry (QTOF-MS). UPLC/
QTOF-MS is a highly sensitive and selective technique for
metabolite profiling (De Vos et al. 2007) allowing us iden-tifying metabolites by in-house made database on the basis
of parent mass ions, mass fragment patterns and isotopic
patterns. Data were then processed by multivariate OPLS-DA statistical approach. The results of presented study
showed that cyanidin 3-glucoside led to the alteration of
some important cellular metabolites, such as bile acids,glutathione, oxidised glutathione and some lipids in the
blood, kidneys and liver of rats.
2 Materials and methods
2.1 Chemicals and materials
Formic acid (LC–MS, Fluka), methanol (LC–MS, Chro-masolv) and ultra pure water of Milli Q gradient (Millipore
Corporation, Billerica, MA, USA) were used for chroma-
tography. Cyanidin 3-glucoside was obtained from Poly-phenol Laboratories AS (Sandnes, Norway) and Heparin
from Schwarz Pharma (Milan, Italy). Phosphate saline
buffer (PBS) was prepared as following: 6.03 mMNa2HPO4, 3.91 mM NaH2PO4 and 139 mM NaCl (Carlo
Metabonomic investigation of rat tissues 89
123
Author's personal copy

Erba, Milan, Italy) were dissolved in Milli Q water (Mil-
lipore) and pH was adjusted to 7.4 with HCl. Anaesthetic:2,2,2-tribromoethanol (Sigma–Aldrich, Steinheim, Ger-
many) was dissolved in ethanol at 2.5 % (w/v) and then it
was 1:9 (v/v) diluted in 0.15 M NaCl. 0.22 lm PVDF fil-ters were from Millipore Corporation (MA, USA). For
tissue grinding under cryogenic conditions (-196 "C) a
CryoMill from Retsch (Haan, Germany) was used.
2.2 Study design
The rats (Rattus norvegicus, Wistar, Harlan Italy S.r.l.) were
bred at animal breeding facilities at the University of Trieste.The experiments on the animals were carried out in com-
pliance with the provisions of the European Community
Council Directive (no. 86/609/CEE) and Italian law (D.L.gs.116/92 and D.L.gs. 633/96, Ministry of Health). The
experiment passed evaluation by the bioethical committee of
the University of Trieste. Rats (n = 24) of the same age(12 weeks) and weight (290 ± 5 g) were maintained in
temperature-controlled rooms at 22–24 "C, 50–60 %
humidity and 12 h light/dark cycles. They were fed withstandard laboratory chow (Harland Teklad, 2018), which
ensures stability of metabolite profiles (Kind and Fiehn
2009). Prior to the tests, the rats were starved overnight, butprovided with water ad libitum. They were divided into two
groups, serving as the control and test groups (each n = 12).
They received i.v. administration of 0.2 mL PBS, with (test)or without (control) 0.67 lmol cyanidin 3-glucoside.
According to a previous study, the same dose of cyanidin
3-glucoside made it possible to observe a peak plasmaconcentration of about 1.5 lM cyanidin 3-glucoside 1 min
after i.v. administration (Vanzo et al. 2011). There are recent
reports that the metabolomic profile of blood may changeduring the 24 h cycle (Minami et al. 2009). Thus the
experiments were carried out within 3 days (n = 8 per day),
always in the morning (from 8 a.m. to 1 p.m.). Randomisa-tion was further implemented by alternative performing of
the experiment on test and control rats.
2.3 Surgical procedure
The rats were anesthetised with intra-peritoneal adminis-tration of 2,2,2-tribromoethanol (0.25 g/kg body weight).
During anaesthesia (15 min in all cases), the heart and
ventilation rate were controlled. The rats were placed ontheir backs, with the ventral side up and with the legs
spread separately on a thermo-isolated support. The left
iliac lateral vein was exposed and exactly 10 min afteranaesthesia 0.2 mL PBS with (test) or without (control)
0.67 lmol cyanidin 3-glucoside was injected using an
insulin syringe. One min before sacrificing the rats (i.e.14 min after anaesthesia) sodium heparin (0.1 ml, 500 IU)
was injected into the right lateral iliac vein, exposed in the
same way. Exactly 15 min after anaesthesia and 5 minafter i.v. administration, the rats were sacrificed by
decapitation. Blood draining and excision of the organs
were carried out according to the literature (Vanzo et al.2011). The kidneys and liver were immediately frozen in
liquid nitrogen and stored at -80 "C.
2.4 Tissue extraction
The choice of the solvent in which the metabolites are
extracted from tissues plays a crucial role in metabolomic
investigations (Cevallos-Cevallos et al. 2009). Our choicewas aqueous methanol (5:95, v/v), deoxygenated by
streaming nitrogen and pre-chilled to -20 "C. It is an
efficient solvent for protein precipitation, enzyme inacti-vation and extraction of polar to semi non-polar metabo-
lites from tissues (Shin et al. 2010; De Vos et al. 2007;
Villas-Boas 2006). When analysing different extractionsolvents for both reproducibility and suppression effects for
a wide range of targeted metabolites in different animal
tissue types including the liver, kidney, muscle, brain, andfat tissue from mice and cattle, it has been concluded that
for most metabolites simple methanolic extraction is best
suited for reliable results (Romisch-Margl et al. 2011).Methanol was reported to offer efficient and reproducible
extraction from the liver (Masson et al. 2010), from the
human blood plasma (Adhikari et al. 2005) and humanblood serum (Zelena et al. 2009).
2.4.1 Blood
Immediately after sampling, the blood was transferred into
ice-cold (-20 "C), deoxygenated aqueous 95 % methanolin a ratio 1:9 (v/v). The sample was vortexed and extracted
for 10 min by gentle shaking at room temperature. The
extract was then centrifuged for 5 min at 3,6009g at 4 "C,decanted under a stream of nitrogen in 50 mL dark glass
vessels and stored at -80 "C for less than a week. Samples
were filtered through 0.2 lm PVDF filters (Millipore) andinjected into a UPLC/QTOF-MS system, as described
below. The aim of extracting blood instead of plasma or
serum was to skip a centrifugation or blood clotting step,during which metabolic changes might occur ex vivo (Gika
and Theodoridis 2011). Both blood and plasma extracts
were compared using UPLC/QTOF-MS analysis to identifypossible adverse effects on resolution or sensitivity due to
the blood matrix. The data showed no matrix effect.
2.4.2 Kidneys and liver
The organs, frozen in liquid nitrogen immediately afterexcision, were stored at -80 "C. Unthawed kidneys (2.0 g)
90 A. Vanzo et al.
123
Author's personal copy
and liver (7.0 g) were ground under cryogenic conditions
to 5 lm particles in a CryoMill using a single 25 mm i.d.steel ball. The pulverised tissue was rapidly transferred
(without thawing) into ice-cold, deoxygenated aqueous
95 % methanol in tissue:solvent ratio 1:9 (w/v). Assumingthat tissue contained approximately 70 % of water the final
aqueous part in methanol after extraction was c.a. 12 %
what improved the solubility of hydrophilic metabolites.The sample was vortexed, extracted, centrifuged and dec-
anted as described above (Sect. 2.4.1). and stored at-80 "C for less than a week before being injected (5 lL)
into the UPLC/QTOF-MS system.
2.5 UPLC/QTOF-MS
Analysis was carried out using a Waters Acquity UPLC,coupled to a Synapt HDMS QTOF-MS (Waters, Man-
chester, UK) via an electrospray interface (ESI), operating
in W-mode. The software used was Masslynx 4.1. Thereverse phase method was performed on a ACQUITY
UPLC 1.8 lm 2.1 9 100 mm HSS T3 (Waters) column,
maintained at 30 "C for 60 min using 0.1 % formic acid inwater as solvent A and 0.1 % formic acid in methanol as
solvent B with a flow of 0.3 mL/min and the following
gradient: until 6 min isocratic at 100 % A, then increasinglinearly to 100 % B at 56 min and held isocratic at 100 %
B till 60 min (Theodoridis et al. 2012). A blank solution
(methanol, 5 lL) was injected every twelve samples. 24samples of each investigated tissue were randomised
before injection. The stability of the retention times, areas
and heights was checked in all injections for one impuritypresent in the solvent (methanol) used to prepare the
samples, which was considered suitable to check the global
stability of the process. Moreover, the stability of retentiontimes, areas and heights was monitored in all tissue from
the control rats, observing a few features of the chro-
matograms which in preliminary experiments wereobserved to be in homeostasis in the tissues analysed under
the condition of the experiments. Finally, the stability was
confirmed also by injecting a standard mixture of 11compounds (Theodoridis et al. 2012) at the beginning and
at the end of the analyses of each tissue both in positive and
in negative ESI mode. Results for positive mode are pre-sented in the online resource Table S1.
Spectra were collected in positive and negative ESI
mode over a mass range 50–3,000 amu with a scan dura-tion of 0.3 s in centroid mode. The transfer collision energy
and trap collision energy were set at 6 and 4 V, respec-
tively. The source parameters were: capillary 3 kV, sam-pling cone 25 V, extraction cone 3 V, source temperature
150 "C, desolvation temperature 500 "C, desolvation gas
flow 1,000 L/h and nebulizer gas flow 50 L/h. Externalcalibration of the instrument was performed at the
beginning of each batch of analysis by direct infusion of
a sodium formate solution (10 % formic acid/0.1 MNaOH/acetonitrile at a ratio of 1/1/8) by controlling the
mass accuracy (\5 ppm) and mass resolution (over
14,000 FWHM). Lock Mass calibration was applied usinga solution of leucine enkephaline (0.5 mg/L, m/z 556.2771
for positive and 554.2620 for negative ion mode) at
0.1 mL/min.
2.6 Data analysis
To eliminate the features [retention time (RT) and mass to
charge (m/z) data pairs] generated by the solvent, theinjected methanol fraction (i.e., the blank) was subtracted
from chromatograms. The features were detected by using
MarkerLynxTM
XS Application Manager for MasslynxTM
Mass Spectrometry software. AppexTrack peak integration
was used with a peak wide estimate of 10 s, peak to peak
base line noise of 30, minimum intensity of 10 counts,mass window of 0.05 Da, retention time window of
0.20 min, noise elimination level of 5 and mass tolerance
of 0.05 Da. The ion intensities for each peak were thennormalised within each sample to the sum of the peak
intensities in that sample. The resulting normalised peak
intensities were multiplied by 10,000 and the normaliseddata were statistically analysed.
In case of using unsupervised PCA, obtained results
might be influenced by factors, such as: biological vari-ability, pathological variations, instrumental drift, artifacts,
and other experimental variations which might divert the
focus of a PCA model to the systematic variation unrelatedto the scientific question of interest. In such cases, there is a
need for methods that make use of any a priori information
to refocus the analysis toward the studied objectives by useof, for example, PLS or OPLS (Wiklund et al. 2008). In
order to specify the metabolic variations associated with
cyanidin 3-glucoside, statistical analysis of Pareto-scaledand centered mode data was performed with MarkerLynx
statistics using OPLS-DA. OPLS (Trygg and Wold 2002) is
an extension to the supervised PLS regression methodfeaturing an integrated orthogonal signal correction-filter.
The OPLS-DA method combines the strengths of PLS-DA
and SIMCA classification (Bylesjo et al. 2006). As PLS-DA explains differences between overall class properties,
interpretation becomes progressively more complicated as
the number of classes increases. The main benefit of usingOPLS-DA as compared to PLS-DA in terms of interpre-
tation thus lies in the ability of OPLS-DA to separate
predictive from non-predictive (orthogonal) variation(Bylesjo et al. 2006).
Variable importance for projection (VIP) plots were
created for ESI positive and ESI negative records in orderto detect features differing for test and control rats. The
Metabonomic investigation of rat tissues 91
123
Author's personal copy

VIP score reflects the variable’s contribution to the clas-
sification and can be used to discover the most relevantdifferential variables responsible for group separation.
Potential candidates for discrimination were selected on the
basis of the threshold VIP [ 1 which is shown to be aoptimal cut-off (Wold et al. 2001; Chong and Jun 2005)
and hence is frequently used in metabolomics data analysis
(Qiu et al. 2010; Moazzami et al. 2011; Ali et al. 2012).Discriminating features were then compared to an in-house
standard database prepared by injecting standard com-pounds under identical analytical conditions. Matches in
retention times, parent mass ions, mass fragment patterns
and isotopic patterns were considered for compoundidentification. Compounds having VIP [ 1 and matching
standards according to the above parameters were high-
lighted as putative markers for discrimination betweencyanidin 3-glucoside administered rats and control rats.
Identified markers from VIP lists (VIP [ 1) in positive
mode were also annotated in the Human MetabolomeDatabase (HMDB) (http://www.hmdb.ca) using MS search
(Wishart et al. 2007; Wishart et al. 2009). It was considered
that the accuracy of masses recorded was B3 ppm.
3 Results and discussion
3.1 Tissue extraction and number of features
Blood, kidneys and liver extracts were compared in terms
of the extracted features in ESI? and ESI- mode. The
total number of extracted features detected in ESI? was2,186 in blood, 3019 in kidney and 2,443 in liver extracts.
On the other hand, the total number of features detected in
ESI- was 926 in blood, 1,378 in kidney and 1,291 in liver
extracts. This is in accordance with other studies reporting
a higher number of features detected by the ESI? ionisa-tion interface than by ESI- (Sana et al. 2008; Yin et al.
2006). Kidney extracts showed the highest number of
detected features in both ionisation modes, ESI? andESI-. Although the number of features does not correlate
directly with the number of metabolites, it can be consid-
ered to be ‘‘proportional’’ to metabolites. The distributionin the space defined by the m/z ratio and chromatographic
retention time of the experimental features obtained in ESIpositive mode, evidenced that most of them were generated
from highly hydrophilic, polar compounds eluting in the
earliest part of the chromatogram, as well as hydrophobicmetabolites, eluting in the final part of the gradient (Fig. 1).
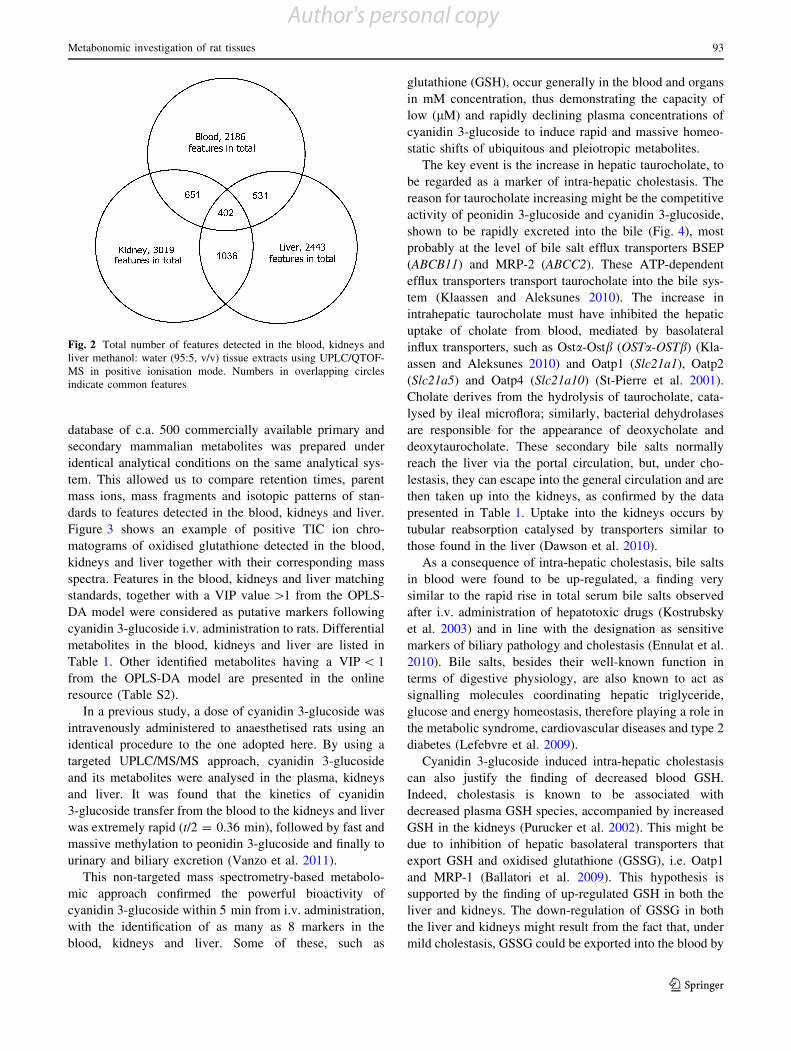
The number of features common to organs investigated
using ESI? is indicated in Fig. 2. Blood, kidneys and liverwere found to share 402 features, corresponding to c.a. 18,
13 and 16 % of their features respectively. Kidneys and
liver shared 1,036 features, corresponding to c.a. 34 and42 % of their features respectively. These results show that
both the liver and the kidney express related metabolic
functions.
3.2 Identification of markers matching with the internal
standard database
Giving names to the features obtained is a challenge in
metabolomic studies. In the event that the metabolite hasbeen identified only through a parent ion mass match in a
database, its identity should be considered very tentative. If
the retention time, parent ion mass, isotopic pattern andmass fragment pattern of a compound match the known
standard, then its identity is better established (Moco et al.
2007; Koulman et al. 2009). In this study, the in-house
Fig. 1 Distribution in the space defined by the m/z ratio andchromatographic retention time of the experimental features obtainedin ESI positive mode, for the extracts from blood, kidneys and liver of
adult male rats. The samples were collected 5 min after intravenousadministration of 0.67 lmol cyanidin 3-glucoside
92 A. Vanzo et al.
123
Author's personal copy
database of c.a. 500 commercially available primary andsecondary mammalian metabolites was prepared under
identical analytical conditions on the same analytical sys-
tem. This allowed us to compare retention times, parentmass ions, mass fragments and isotopic patterns of stan-
dards to features detected in the blood, kidneys and liver.
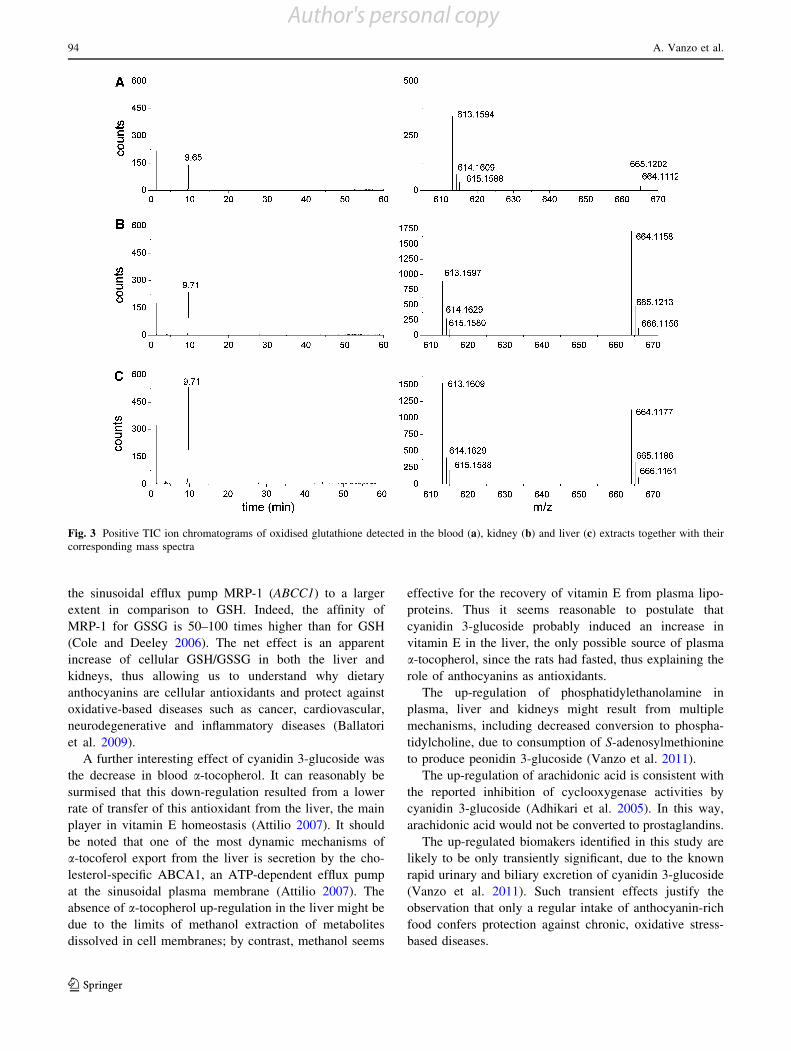
Figure 3 shows an example of positive TIC ion chro-matograms of oxidised glutathione detected in the blood,
kidneys and liver together with their corresponding mass
spectra. Features in the blood, kidneys and liver matchingstandards, together with a VIP value [1 from the OPLS-
DA model were considered as putative markers following
cyanidin 3-glucoside i.v. administration to rats. Differentialmetabolites in the blood, kidneys and liver are listed in
Table 1. Other identified metabolites having a VIP \ 1
from the OPLS-DA model are presented in the onlineresource (Table S2).
In a previous study, a dose of cyanidin 3-glucoside was
intravenously administered to anaesthetised rats using anidentical procedure to the one adopted here. By using a
targeted UPLC/MS/MS approach, cyanidin 3-glucoside
and its metabolites were analysed in the plasma, kidneysand liver. It was found that the kinetics of cyanidin
3-glucoside transfer from the blood to the kidneys and liver
was extremely rapid (t/2 = 0.36 min), followed by fast andmassive methylation to peonidin 3-glucoside and finally to
urinary and biliary excretion (Vanzo et al. 2011).
This non-targeted mass spectrometry-based metabolo-mic approach confirmed the powerful bioactivity of
cyanidin 3-glucoside within 5 min from i.v. administration,
with the identification of as many as 8 markers in theblood, kidneys and liver. Some of these, such as
glutathione (GSH), occur generally in the blood and organs
in mM concentration, thus demonstrating the capacity oflow (lM) and rapidly declining plasma concentrations of
cyanidin 3-glucoside to induce rapid and massive homeo-
static shifts of ubiquitous and pleiotropic metabolites.The key event is the increase in hepatic taurocholate, to
be regarded as a marker of intra-hepatic cholestasis. The
reason for taurocholate increasing might be the competitiveactivity of peonidin 3-glucoside and cyanidin 3-glucoside,
shown to be rapidly excreted into the bile (Fig. 4), mostprobably at the level of bile salt efflux transporters BSEP
(ABCB11) and MRP-2 (ABCC2). These ATP-dependent
efflux transporters transport taurocholate into the bile sys-tem (Klaassen and Aleksunes 2010). The increase in
intrahepatic taurocholate must have inhibited the hepatic
uptake of cholate from blood, mediated by basolateralinflux transporters, such as Osta-Ostb (OSTa-OSTb) (Kla-
assen and Aleksunes 2010) and Oatp1 (Slc21a1), Oatp2
(Slc21a5) and Oatp4 (Slc21a10) (St-Pierre et al. 2001).Cholate derives from the hydrolysis of taurocholate, cata-
lysed by ileal microflora; similarly, bacterial dehydrolases
are responsible for the appearance of deoxycholate anddeoxytaurocholate. These secondary bile salts normally
reach the liver via the portal circulation, but, under cho-
lestasis, they can escape into the general circulation and arethen taken up into the kidneys, as confirmed by the data
presented in Table 1. Uptake into the kidneys occurs by
tubular reabsorption catalysed by transporters similar tothose found in the liver (Dawson et al. 2010).
As a consequence of intra-hepatic cholestasis, bile salts
in blood were found to be up-regulated, a finding verysimilar to the rapid rise in total serum bile salts observed
after i.v. administration of hepatotoxic drugs (Kostrubsky
et al. 2003) and in line with the designation as sensitivemarkers of biliary pathology and cholestasis (Ennulat et al.
2010). Bile salts, besides their well-known function in
terms of digestive physiology, are also known to act assignalling molecules coordinating hepatic triglyceride,
glucose and energy homeostasis, therefore playing a role in
the metabolic syndrome, cardiovascular diseases and type 2diabetes (Lefebvre et al. 2009).
Cyanidin 3-glucoside induced intra-hepatic cholestasis
can also justify the finding of decreased blood GSH.Indeed, cholestasis is known to be associated with
decreased plasma GSH species, accompanied by increased
GSH in the kidneys (Purucker et al. 2002). This might bedue to inhibition of hepatic basolateral transporters that
export GSH and oxidised glutathione (GSSG), i.e. Oatp1
and MRP-1 (Ballatori et al. 2009). This hypothesis issupported by the finding of up-regulated GSH in both the
liver and kidneys. The down-regulation of GSSG in both
the liver and kidneys might result from the fact that, undermild cholestasis, GSSG could be exported into the blood by
Fig. 2 Total number of features detected in the blood, kidneys andliver methanol: water (95:5, v/v) tissue extracts using UPLC/QTOF-MS in positive ionisation mode. Numbers in overlapping circlesindicate common features
Metabonomic investigation of rat tissues 93
123
Author's personal copy
the sinusoidal efflux pump MRP-1 (ABCC1) to a largerextent in comparison to GSH. Indeed, the affinity of
MRP-1 for GSSG is 50–100 times higher than for GSH
(Cole and Deeley 2006). The net effect is an apparentincrease of cellular GSH/GSSG in both the liver and
kidneys, thus allowing us to understand why dietary
anthocyanins are cellular antioxidants and protect againstoxidative-based diseases such as cancer, cardiovascular,
neurodegenerative and inflammatory diseases (Ballatori
et al. 2009).A further interesting effect of cyanidin 3-glucoside was
the decrease in blood a-tocopherol. It can reasonably be
surmised that this down-regulation resulted from a lowerrate of transfer of this antioxidant from the liver, the main
player in vitamin E homeostasis (Attilio 2007). It should
be noted that one of the most dynamic mechanisms ofa-tocoferol export from the liver is secretion by the cho-
lesterol-specific ABCA1, an ATP-dependent efflux pump
at the sinusoidal plasma membrane (Attilio 2007). Theabsence of a-tocopherol up-regulation in the liver might be
due to the limits of methanol extraction of metabolitesdissolved in cell membranes; by contrast, methanol seems
effective for the recovery of vitamin E from plasma lipo-proteins. Thus it seems reasonable to postulate that
cyanidin 3-glucoside probably induced an increase in
vitamin E in the liver, the only possible source of plasmaa-tocopherol, since the rats had fasted, thus explaining the
role of anthocyanins as antioxidants.
The up-regulation of phosphatidylethanolamine inplasma, liver and kidneys might result from multiple
mechanisms, including decreased conversion to phospha-
tidylcholine, due to consumption of S-adenosylmethionineto produce peonidin 3-glucoside (Vanzo et al. 2011).
The up-regulation of arachidonic acid is consistent with
the reported inhibition of cyclooxygenase activities bycyanidin 3-glucoside (Adhikari et al. 2005). In this way,
arachidonic acid would not be converted to prostaglandins.
The up-regulated biomakers identified in this study arelikely to be only transiently significant, due to the known
rapid urinary and biliary excretion of cyanidin 3-glucoside
(Vanzo et al. 2011). Such transient effects justify theobservation that only a regular intake of anthocyanin-rich
food confers protection against chronic, oxidative stress-based diseases.
Fig. 3 Positive TIC ion chromatograms of oxidised glutathione detected in the blood (a), kidney (b) and liver (c) extracts together with theircorresponding mass spectra
94 A. Vanzo et al.
123
Author's personal copy

Tab
le1
Dis
crim
inat
ing
com
poun
dsde
tect
edin
the
bloo
d,ki
dney
san
dli
ver
ofra
tsaf
ter
intr
aven
ous
adm
inis
trat
ion
ofcy
anid
in3-
gluc
osid
e(n
=12
)as
com
pare
dto
the
cont
rol
(n=
12)
Com
poun
dM
onoi
soto
pic
mas
sR
eten
tion
(min
)V
aria
ble
(m/z
)V
aria
ble
(m/z
)Is
otop
icpa
tter
nsa
mpl
eaIs
otop
icpa
tter
nst
anda
rdV
IPF
old
chan
geb
Cha
nge
tren
dH
MD
BID
and
shor
tde
scri
ptio
n
Blo
odE
SI?
,V
IP[
1B
lood
Sta
ndar
dB
lood
Sta
ndar
d
Glu
tath
ione
307.
0838
3.45
M?
H[1
?]
308.
0916
M?
H[1
?]
308.
0912
308.
0907
100
%
309.
0929
17%
310.
0887
5%
308.
0912
100
%
309.
0952
15%
310.
0916
8%
2.26
-1.
3;
HM
DB
0012
5co
mpo
und
synt
hesi
sed
from
cyst
eine
,an
impo
rtan
tpa
rtof
the
body
’sto
xic
was
tedi
spos
alsy
stem
Hyo
deox
ycho
lic
acid
392.
2927
46.2
935
7.27
8435
7.27
9135
7.28
0210
0%
358.
2866
28%
359.
2837
5%
357.
2791
100
%
358.
2833
28%
359.
2876
5%
2.25
2.5
:H
MD
B00
733
bile
acid
Pho
spha
tidy
l-et
hano
lam
ine
635.
4526
53.7
948
2.32
3848
2.32
4148
2.32
3610
0%
483.
3286
28%
484.
3336
7%
482.
3241
100
%
483.
3281
28%
484.
3339
7%
1.70
1.1
:H
MD
B08
821
glyc
erop
hosp
holi
pid,
aph
osph
oryl
etha
nola
min
em
oiet
yoc
cupi
esa
glyc
erol
subs
titu
tion
site
a-T
ocop
hero
l43
0.38
1059
.23
430.
3795
430.
3733
429.
3765
100
%
430.
3798
80%
431.
3880
45%
429.
3733
87%
430.
3805
100
%
431.
3863
68%
1.57
-2.
3;
HM
DB
0189
3th
em
ost
acti
vefo
rmof
vita
min
Ein
hum
ans
L-T
rypt
opha
n20
4.08
9816
.31
188.
0703
188.
0711
188.
0706
100
%
189.
0747
18%
190.
0769
2%
188.
0711
100
%
189.
0758
16%
190.
0775
2%
1.40
1.3
:H
MD
B00
929
anes
sent
ial
amin
oac
idw
hich
isth
epr
ecur
sor
ofse
roto
nin
Oxi
dize
dgl
utat
hion
e61
2.15
199.
65M
?H
[1?
]
613.
1596
M?
H[1
?]
613.
1596
613.
1594
100
%
614.
1609
29%
615.
1610
15%
613.
1596
100
%
614.
1667
25%
615.
1580
14%
1.39
-1.
8;
HM
DB
0333
7gl
utat
hion
edi
mer
form
edby
adi
sulfi
debo
ndbe
twee
nth
ecy
stei
nesu
lfhy
dryl
side
chai
ns
Cho
lic
acid
408.
2876
46.8
1M
?N
a[1
?]
431.
2764
M?
Na
[1?
]
431.
2768
431.
2762
100
%
432.
2787
33%
433.
2769
8%
431.
2768
100
%
432.
2808
35%
433.
2824
7%
1.24
1.5
:H
MD
B00
619
maj
orpr
imar
ybi
leac
idpr
oduc
edin
the
live
ran
dus
uall
yco
njug
ated
wit
hgl
ycin
eor
taur
ine
Deo
xych
olic
acid
392.
2927
49.6
235
7.27
7435
7.27
8735
7.28
0710
0%
358.
2805
28%
359.
2802
20%
357.
2787
100
%
358.
2848
28%
359.
2879
5%
1.22
2.6
:H
MD
B00
626
bile
acid
form
edby
bact
eria
lac
tion
from
chol
ate.
Itis
usua
lly
conj
ugat
edw
ith
glyc
ine
orta
urin
e
Kid
neys
ES
I?,
VIP
[1
Kid
neys
Sta
ndar
dK
idne
ysS
tand
ard
Pho
spha
tidy
l-et
hano
lam
ine
635.
4526
53.8
148
2.32
4048
2.32
3848
2.32
4610
0%
483.
3300
28%
484.
3334
5%
482.
3238
100
%
483.
3288
28%
484.
3338
5%
3.06
1.1
:H
MD
B08
821s
eeab
ove
Metabonomic investigation of rat tissues 95
123
Author's personal copy

Tab
le1
cont
inue
d
Com
poun
dM
onoi
soto
pic
mas
sR
eten
tion
(min
)V
aria
ble
(m/z
)V
aria
ble
(m/z
)Is
otop
icpa
tter
nsa
mpl
eaIs
otop
icpa
tter
nst
anda
rdV
IPF
old
chan
geb
Cha
nge
tren
dH
MD
BID
and
shor
tde
scri
ptio
n
Ara
chid
onic
acid
304.
2402
53.5
4M
?H
[1?
]
305.
2475
M?
H[1
?]
305.
2474
305.
2477
100
%
306.
2526
25%
307.
2575
3%
305.
2474
100
%
306.
2513
24%
307.
2545
3%
2.63
1.1
:H
MD
B01
043
poly
unsa
tura
ted,
esse
ntia
lfa
tty
acid
.It
isfo
rmed
bysy
nthe
sis
from
diet
ary
lino
leic
acid
Cho
lic
acid
408.
2876
46.8
5M
?N
a[1
?]
431.
2758
M?
Na
[1?
]
431.
2768
431.
2779
100
%
432.
2795
35%
433.
2957
5%
431.
2768
100
%
432.
2808
35%
433.
2824
7%
2.05
1.8
:H
MD
B00
619
see
abov
e
Deo
xych
olic
acid
392.
2927
49.4
135
7.27
7435
7.27
8735
7.27
8710
0%
358.
2807
20%
359.
2730
5%
357.
2787
100
%
358.
2848
28%
359.
2879
5%
1.47
3.9
:H
MD
B00
626
see
abov
e
Eic
osen
oic
acid
310.
2872
57.0
9M
?H
[1?
]
311.
2938
M?
H[1
?]
311.
2950
311.
2950
100
%
312.
2992
22%
313.
2955
5%
311.
2950
100
%
312.
2999
25%
313.
3062
5%
1.47
-2.
0;
HM
DB
0223
1m
onou
nsat
urat
edom
ega-
9fa
tty
acid
.It
isfo
und
inth
ere
dce
llm
embr
ane
Oxi
dize
dgl
utat
hion
e61
2.15
199.
66M
?H
[1?
]
613.
1589
M?
H[1
?]
613.
1596
613.
1597
100
%
614.
1629
28%
615.
1580
15%
613.
1596
100
%
614.
1667
25%
615.
1580
14%
1.40
-1.
2;
HM
DB
0333
7se
eab
ove
Glu
tath
ione
307.
0838
3.45
M?
H[1
?]
308.
0899
M?
H[1
?]
308.
0912
308.
0904
100
%
309.
0958
17%
310.
0915
8%
308.
0912
100
%
309.
0952
15%
310.
0916
8%
1.35
1.04
:H
MD
B00
125
see
abov
e
Hyo
deox
ycho
lic
acid
392.
2927
46.3
235
7.27
9435
7.27
8735
7.27
9410
0%
358.
2855
28%
359.
2930
7%
357.
2787
100
%
358.
2833
28%
359.
2881
5%
1.18
2.1
;H
MD
B00
733
see
abov
e
Liv
erE
SI?
,V
IP[
1L
iver
Sta
ndar
dL
iver
Sta
ndar
d
Glu
tath
ione
307.
0838
3.45
M?
H[1
?]
308.
0895
M?
H[1
?]
308.
0912
308.
0898
100
%
309.
0947
15%
310.
0914
8%
308.
0912
100
%
309.
0952
15%
310.
0916
8%
5.64
1.2
:H
MD
B00
125
see
abov
e
Pho
spha
tidy
l-et
hano
lam
ine
635.
4526
53.8
248
2.32
2648
2.32
3848
2.32
4610
0%
483.
3300
28%
484.
3334
5%
482.
3238
100
%
483.
3288
28%
484.
3338
5%
3.35
1.1
:H
MD
B08
821
see
abov
e
Oxi
dize
dgl
utat
hion
e61
2.15
199.
69M
?H
[1?
]
613.
1587
M?
H[1
?]
613.
1596
613.
1609
100
%
614.
1624
28%
615.
1588
15%
613.
1596
100
%
614.
1667
25%
615.
1580
14%
2.89
-1.
4;
HM
DB
0333
7se
eab
ove
Ara
chid
onic
acid
304.
2402
53.5
5M
?H
[1?
]
305.
2476
M?
H[1
?]
305.
2474
305.
2477
100
%
306.
2512
25%
307.
2527
5%
305.
2474
100
%
306.
2513
24%
307.
2545
3%
2.60
1.2
:H
MD
B01
043
see
abov
e
96 A. Vanzo et al.
123
Author's personal copy

Tab
le1
cont
inue
d
Com
poun
dM
onoi
soto
pic
mas
sR
eten
tion
(min
)V
aria
ble
(m/z
)V
aria
ble
(m/z
)Is
otop
icpa
tter
nsa
mpl
eaIs
otop
icpa
tter
nst
anda
rdV
IPF
old
chan
geb
Cha
nge
tren
dH
MD
BID
and
shor
tde
scri
ptio
n
Tau
roch
olic
acid
515.
2917
42.3
8M
?N
a[1
?]
538.
2796
M?
Na
[1?
]
538.
2789
538.
2802
100
%
539.
2842
30%
540.
2794
10%
538.
2789
100
%
539.
2834
30%
540.
2808
10%
2.22
1.1
:H
MD
B00
036
abi
leac
id;
the
prod
uct
ofco
njug
atio
nof
chol
icac
idw
ith
taur
ine
Tau
rode
oxy-
chol
icac
id49
9.29
6845
.18
M?
Na
[1?
]
522.
2844
M?
Na
[1?
]
522.
2859
522.
2896
100
%
523.
2906
30%
524.
2874
15%
522.
2859
100
%
523.
2909
30%
524.
2870
15%
1.99
1.1
:H
MD
B00
896
abi
lesa
ltfo
rmed
inth
eli
ver
byco
njug
atio
nof
deox
ycho
late
wit
hta
urin
e,us
uall
yas
the
sodi
umsa
lt
L-G
luta
min
e14
6.06
911.
28M
?H
[1?
]
147.
0765
M?
H[1
?]
147.
0759
147.
0761
100
%
148.
0651
30%
149.
0706
5%
147.
0759
100
%
148.
0818
9%
149.
0822
1%
1.58
1.1
:H
MD
B00
641
one
ofth
e20
amin
oac
ids
enco
ded
byth
est
anda
rdge
neti
cco
de
L-S
acch
arop
ine
276.
1321
1.34
M?
H[1
?]
277.
1405
M?
H[1
?]
277.
1396
277.
1416
100
%
278.
1409
15%
277.
1396
100
%
278.
1448
15%
279.
1547
3%
1.49
1.2
:H
MD
B00
279
inte
rmed
iate
inth
ede
grad
atio
nof
lysi
neby
cond
ensa
tion
ofly
sine
and
alph
a-ke
togl
utar
ate
The
com
poun
dsw
ere
iden
tifi
edby
the
OP
LS
-DA
mod
el(V
IP[
1)an
dby
com
pari
son
ofre
tent
ion
tim
es,
pare
ntm
ass
ions
,m
ass
frag
men
tpa
tter
nsan
dis
otop
icpa
tter
nsw
ith
the
in-h
ouse
stan
dard
data
base
am
/zof
feat
ures
inre
pres
enta
tive
sam
ple
isot
opic
patt
ern
mig
htdi
ffer
tova
riab
les
from
VIP
for*
±3
ppm
bF
old
chan
gew
asca
lcul
ated
from
the
arit
hmet
icm
ean
valu
esof
each
grou
p.A
posi
tive
valu
ein
dica
tes
are
lati
vely
high
erno
rmal
ized
peak
area
ofm
arke
rsin
cyan
idin
3-gl
ucos
ide
test
rats
whi
lea
nega
tive
valu
em
eans
are
lati
vely
low
erno
rmal
ised
peak
area
inte
stra
tsas
com
pare
dto
cont
rol
rats
Metabonomic investigation of rat tissues 97
123
Author's personal copy

This study shows that the markers identified in blood
consistently reflect unbalanced hepatic and renal metabolic
homeostasis. As a consequence, this study deserves to bereplicated in humans, so to assess if a similar panel of
blood biomarkers will be found in the early time window
following the oral administration of cyanidin 3-glucoside atphysiological relevant dose. While biomarkers found in
human fluids might not be easily interpreted in terms of
mechanisms of metabolic unbalance, biomarkers found inrat blood can be more easily understood, given the possi-
bility to relate them to biomarkers identified in rat liver and
kidney. Thus, this study paves the way to further analogousobservations in humans and has therefore an interesting
translational potential.
3.3 Annotation of compounds using the HMDB
Significantly differential variables in positive mode foundby the OPLS-DA model and identified by internal stan-
dards were also annotated using HMDB, as indicated in
Table 1. When the compounds found were protonated,identification using the in-house database and HMDB
matched very well. In cases when adduct was not a proton
but sodium for example, the compound identified by thein-house database was not the best match with HMDB, or
worse still the identifications were false. Finally, annota-
tion using HMDB was impossible in cases when the mol-ecule fragmented and its mass fragment was the
significantly differential variable. Therefore, for reliable
identification of features an internal database on the ana-lytical system is urgently required.
4 Concluding remarks
In this study we found that a small amount of cyanidin
3-glucoside caused some major changes in rat blood, kid-
ney and liver metabolic profile, detected 5 min afterintravenous administration and summarised in Fig. 4.
These alterations seem to stem from blocking of bile salt
efflux transporters in the liver and kidneys. A shift in theredox equilibrium of glutathione species involved both the
liver and the kidneys. Under experimental conditions,
chosen to simulate a normal situation, reduced and oxidisedglutathione were up- and down-regulated respectively, thus
suggesting that endogenous antioxidant cell defence
improved. Furthermore, other biochemical markers werefound, making it possible to conclude that cyanidin
3-glucoside must have had an impact on different meta-
bolic pathways in the mammalian organism. The markersarose because their specific metabolic pathways adapted to
cyanidin 3-glucoside i.v. administration through relatively
slow kinetics. Thus, the identification of markers and thepattern of markers might change on the basis of the
experimental protocol, so tests done by independent labo-
ratories might provide different and even contradictoryresults. For future perspectives, metabonomics is a pow-
erful tool through which alterations in diverse metabolic
pathways connected to nutrition rich in dietary anthocya-nins could be better understood. However, at this stage,
connections between the statistical differences in individ-ual metabolites and metabolic pathways have still to be
elucidated.
Acknowledgments The authors gratefully thank Domenico Masu-ero for his expert assistance in MS analysis. The study was carried outwith support of: the Slovenian Research Agency (project: Z4-2280),the ADP2010 MetaQuality projects, funded by the AutonomousProvince of Trento, Italy and the ‘‘Integrated and Sustainable Vine-Wine Management (GISVI)’’ project (L.R. 26/2010 – Support for theproduction and exploitation of knowledge) funded by the Autono-mous Region of Friuli Venezia Giulia.
References
Adhikari, D. P., Francis, J. A., Schutzki, R. E., Chandra, A., & Nair,M. G. (2005). Quantification and characterisation of cyclo-oxygenase and lipid peroxidation inhibitory anthocyanins infruits of Amelanchier. Phytochemical Analysis, 16(3), 175–180.
Ali, K., Iqbal, M., Korthout, H., Maltese, F., Fortes, A., Pais, M., et al.(2012). NMR spectroscopy and chemometrics as a tool for anti-TNFa activity screening in crude extracts of grapes and otherberries. Metabolomics. doi:10.1007/s11306-012-0406-8.
Attilio, R. (2007). Absorption, transport, and tissue delivery ofvitamin E. Molecular Aspects of Medicine, 28(5–6), 423–436.
Ballatori, N., Krance, S. M., Notenboom, S., Shi, S., Tieu, K., &Hammond, C. L. (2009). Glutathione dysregulation and the
Fig. 4 Scheme of the biochemical steps presumably occurred at thehepatic level and accounting for the appearance of the biomarkerslisted in Table 1. Bile salt export pump (BSEP) and multidrugresistance protein 2 (MRP-2) actively pump taurocholate (TC) intothe bile. Cyanidin 3-glucoside (C3G) and peonidin 3-glucoside (P3G)might also have been actively pumped into the bile, probably byBSEP and MRP-2. As a consequence of this competition, TC mighthave accumulated into the hepatocyte, inhibiting the MRP-2-mediatedefflux of glutathione (GSH, reduced; GSSG, disulfide) as well asuptake of cholic acid (CA) and deoxycholate (DOC) from the blood,mediated by the organic anion transporters Oatp and Oat
98 A. Vanzo et al.
123
Author's personal copy

etiology and progression of human diseases. Biological Chem-istry, 390(3), 191–214.
Basu, A., Rhone, M., & Lyons, T. J. (2010). Berries: emerging impacton cardiovascular health. Nutrition Reviews, 68(3), 168–177.
Bylesjo, M., Rantalainen, M., Cloarec, O., Nicholson, J. K., Holmes,E., & Trygg, J. (2006). OPLS discriminant analysis: combiningthe strengths of PLS-DA and SIMCA classification. Journal ofChemometrics, 20(8–10), 341–351.
Cassidy, A., O’Reilly, E. J., Kay, C., Sampson, L., Franz, M., Forman,J. P., et al. (2011). Habitual intake of flavonoid subclasses andincident hypertension in adults. The American Journal ofClinical Nutrition, 93(2), 338–347.
Cevallos-Cevallos, J. M., Reyes-De-Corcuera, J. I., Etxeberria, E.,Danyluk, M. D., & Rodrick, G. E. (2009). Metabolomic analysisin food science: a review. Trends in Food Science & Technology,20(11–12), 557–566.
Chong, I.-G., & Jun, C.-H. (2005). Performance of some variableselection methods when multicollinearity is present. Chemomet-rics and Intelligent Laboratory Systems, 78(1–2), 103–112.
Coen, M., Holmes, E., Lindon, J. C., & Nicholson, J. K. (2008).NMR-based metabolic profiling and metabonomic approaches toproblems in molecular toxicology. Chemical Research inToxicology, 21(1), 9–27.
Cole, S. P. C., & Deeley, R. G. (2006). Transport of glutathione andglutathione conjugates by MRP1. Trends in PharmacologicalSciences, 27(8), 438–446.
Dawson, P. A., Hubbert, M. L., & Rao, A. (2010). Getting the mOSTfrom OST: Role of organic solute transporter, OSTa-OSTb, inbile acid and steroid metabolism. Biochimica et Biophysica Acta,1801(9), 994–1004.
De Vos, R. C. H., Moco, S., Lommen, A., Keurentjes, J. J. B., Bino,R. J., & Hall, R. D. (2007). Untargeted large-scale plantmetabolomics using liquid chromatography coupled to massspectrometry. Nature Protocols, 2(4), 778–791.
Dettmer, K., Aronov, P. A., & Hammock, B. D. (2007). Massspectrometry-based metabolomics. Mass Spectrometry Reviews,26(1), 51–78.
Ennulat, D., Magid-Slav, M., Rehm, S., & Tatsuoka, K. S. (2010).Diagnostic performance of traditional hepatobiliary biomarkersof drug-induced liver injury in the rat. Toxicological Sciences,116(2), 397–412.
Fiehn, O. (2001). Combining genomics, metabolome analysis, andbiochemical modelling to understand metabolic networks. Com-parative and Functional Genomics, 2(3), 155–168.
Fiehn, O. (2002). Metabolomics—The link between genotypes andphenotypes. Plant Molecular Biology, 48(1), 155–171.
Gika, H., & Theodoridis, G. (2011). Sample preparation prior to theLC-MS-based metabolomics/metabonomics of blood-derivedsamples. Bioanalysis, 3(14), 1647–1661.
Hanhineva, K., Torronen, R., Bondia-Pons, I., Pekkinen, J., Koleh-mainen, M., Mykkanen, H., et al. (2010). Impact of dietarypolyphenols on carbohydrate metabolism. International Journalof Molecular Sciences, 11(4), 1365–1402.
Hertog, M. G., Feskens, E. J., Hollman, P. C., Katan, M. B., &Kromhout, D. (1993). Dietary antioxidant flavonoids and risk ofcoronary heart disease: The Zutphen Elderly Study. Lancet,342(8878), 1007–1011.
Ichiyanagi, T. (2008). Bioavailability and metabolic fate of anthocy-anins. Functional food and health. ACS Symposium Series, 993,48–61.
Jackson, J. E. (1991). User’s guide to principal components. NewYork: Wiley.
Kay, C. D. (2006). Aspects of anthocyanin absorption, metabolismand pharmacokinetics in humans. Nutrition Research Reviews,19(01), 137–146.
Kind, T., & Fiehn, O. (2009). What are the obstacles for an integratedsystem for comprehensive interpretation of cross-platformmetabolic profile data? Bioanalysis, 1(9), 1511–1514.
Klaassen, C. D., & Aleksunes, L. M. (2010). Xenobiotic, bile acid,and cholesterol transporters: function and regulation. Pharma-cological Reviews, 62(1), 1–96.
Kostrubsky, V. E., Strom, S. C., Hanson, J., Urda, E., Rose, K.,Burliegh, J., et al. (2003). Evaluation of hepatotoxic potential ofdrugs by inhibition of bile-acid transport in cultured primaryhuman hepatocytes and intact rats. Toxicological Sciences,76(1), 220–228.
Koulman, A., Lane, G., Harrison, S., & Volmer, D. (2009). Fromdifferentiating metabolites to biomarkers. Analytical and Bioan-alytical Chemistry, 394(3), 663–670.
Lefebvre, P., Cariou, B., Lien, F., Kuipers, F., & Staels, B. (2009).Role of bile acids and bile acid receptors in metabolic regulation.Physiological Reviews, 89(1), 147–191.
Lichtenstein, A. H., Appel, L. J., Brands, M., Carnethon, M., Daniels,S., Franch, H. A., et al. (2006). Diet and lifestyle recommen-dations revision 2006. Circulation, 114(1), 82–96.
Manach, C., & Donovan, J. L. (2004). Pharmacokinetics andmetabolism of dietary flavonoids in humans. Free RadicalResearch, 38(8), 771–785.
Manach, C., Williamson, G., Morand, C., Scalbert, A., & Remesy, C.(2005). Bioavailability and bioefficacy of polyphenols inhumans. I. Review of 97 bioavailability studies. AmericanJournal of Clinical Nutrition, 81(1), 230S–242S.
Masson, P., Alves, A. C., Ebbels, T. M. D., Nicholson, J. K., & Want,E. J. (2010). Optimization and evaluation of metabolite extrac-tion protocols for untargeted metabolic profiling of liver samplesby UPLC-MS. Analytical Chemistry, 82(18), 7779–7786.
McGhie, T. K., & Walton, M. C. (2007). The bioavailability andabsorption of anthocyanins: Towards a better understanding.Molecular Nutrition & Food Research, 51(6), 702–713.
Minami, Y., Kasukawa, T., Kakazu, Y., Iigo, M., Sugimoto, M.,Ikeda, S., et al. (2009). Measurement of internal body time byblood metabolomics. Proceedings of the National Academy ofSciences, 106(24), 9890–9895.
Moazzami, A. A., Andersson, R., & Kamal-Eldin, A. (2011). Changesin the metabolic profile of rat liver after a-tocopherol deficiencyas revealed by metabolomics analysis. NMR in Biomedicine,24(5), 499–505.
Moco, S., Vervoort, J., Moco, S., Bino, R. J., De Vos, R. C. H., &Bino, R. (2007). Metabolomics technologies and metaboliteidentification. TrAC Trends in Analytical Chemistry, 26(9),855–866.
Mursu, J., Nurmi, T., Tuomainen, T.-P., Salonen, J. T., Pukkala, E., &Voutilainen, S. (2008). Intake of flavonoids and risk of cancer inFinnish men: The Kuopio Ischaemic Heart Disease Risk FactorStudy. International Journal of Cancer, 123(3), 660–663.
Nicholson, J. K., Lindon, J. C., & Holmes, E. (1999). ‘Metabonom-ics’: Understanding the metabolic responses of living systems topathophysiological stimuli via multivariate statistical analysis ofbiological NMR spectroscopic data. Xenobiotica, 29(11),1181–1189.
Prior, R. L. (2003). Fruits and vegetables in the prevention of cellularoxidative damage. American Journal of Clinical Nutrition, 78(3Suppl.), 570S–578S.
Purucker, E., Marschall, H.-U., Geier, A., Gartung, C., & Matern, S.(2002). Increase in renal glutathione in cholestatic liver diseaseis due to a direct effect of bile acids. American Journal ofPhysiology, 283(6), F1281–F1289.
Qiu, Y., Cai, G., Su, M., Chen, T., Liu, Y., Xu, Y., et al. (2010).Urinary metabonomic study on colorectal cancer. Journal ofProteome Research, 9(3), 1627–1634.
Metabonomic investigation of rat tissues 99
123
Author's personal copy

Robertson, D. G. (2005). Metabonomics in toxicology: A review.Toxicological Sciences, 85(2), 809–822.
Romisch-Margl, W., Prehn, C., Bogumil, R., Rohring, C., Suhre, K., &Adamski, J. (2011). Procedure for tissue sample preparation andmetabolite extraction for high-throughput targeted metabolomics.Metabolomics, 1–10. doi: 10.1007/s11306-011-0293-4.
Roux, A., Lison, D., Junot, C., & Heilier, J.-F. (2011). Applications ofliquid chromatography coupled to mass spectrometry-basedmetabolomics in clinical chemistry and toxicology: A review.Clinical Biochemistry, 44(1), 119–135.
Sana, T. R., Waddell, K., & Fischer, S. M. (2008). A sampleextraction and chromatographic strategy for increasing LC/MSdetection coverage of the erythrocyte metabolome. Journal ofChromatography B, 871(2), 314–321.
Scalbert, A., Brennan, L., Fiehn, O., Hankemeier, T., Kristal, B., vanOmmen, B., et al. (2009). Mass-spectrometry-based metabolo-mics: limitations and recommendations for future progresswith particular focus on nutrition research. Metabolomics, 5(4),435–458.
Shin, M. H., Lee, D. Y., Liu, K.-H., Fiehn, O., & Kim, K. H. (2010).Evaluation of sampling and extraction methodologies for theglobal metabolic profiling of Saccharophagus degradans. Ana-lytical Chemistry, 82(15), 6660–6666.
Spormann, T. M., Albert, F. W., Rath, T., Dietrich, H., Will, F.,Stockis, J.-P., et al. (2008). Anthocyanin/polyphenolic-rich fruitjuice reduces oxidative cell damage in an intervention study withpatients on hemodialysis. Cancer Epidemiology, Biomarkers andPrevention, 17(12), 3372–3380.
Stella, C., Beckwith-Hall, B., Cloarec, O., Holmes, E., Lindon, J. C.,Powell, J., et al. (2006). Susceptibility of human metabolicphenotypes to dietary modulation. Journal of ProteomeResearch, 5(10), 2780–2788.
St-Pierre, M. V., Kullak-Ublick, G. A., Hagenbuch, B., & Meier, P. J.(2001). Transport of bile acids in hepatic and non-hepatictissues. Journal of Experimental Biology, 204(10), 1673–1686.
Theodoridis, G., Gika, H., Franceschi, P., Caputi, L., Arapitsas, P.,Scholz, M., et al. (2012). LC-MS based global metaboliteprofiling of grapes: solvent extraction protocol optimisation.Metabolomics, 8(2), 175–185.
Trygg, J., Holmes, E., & Lundstedt, T. (2007). Chemometrics inmetabonomics. Journal of Proteome Research, 6(2), 469–479.
Trygg, J., & Wold, S. (2002). Orthogonal projections to latentstructures (O-PLS). Journal of Chemometrics, 16(3), 119–128.
U.S. Department of Agriculture, A. R. S. (2007). USDA Database forthe flavonoid content of selected Foods, Release 2.1. AccessedMay 4, 2011, from http://www.nal.usda.gov/fnic/foodcomp/Data/Flav/Flav02-1.pdf.
U.S. Department of Health & Human services, & U.S. Department ofAgriculture (2010). Dietary Guidelines for Americans, 2010.
Accessed Oct 3, 2011 from http://health.gov/dietaryguidelines/dga2010/DietaryGuidelines2010.pdf.
Vanzo, A., Vrhovsek, U., Tramer, F., Mattivi, F., & Passamonti, S.(2011). Exceptionally fast uptake and metabolism of cyanidin3-glucoside by rat kidneys and liver. Journal of NaturalProducts, 74(5), 1049–1054.
Villas-Boas, S. G. (2006). Sampling and sample preparation. In S.G. Villas-Boas, U. Roessner, M. A. E. Hansen, J. Smedsgaard, &J. Nielsen (Eds.), Metabolome analysis: An introduction (pp.39–82). New Yersey: Wiley.
WHO (2004). Global strategy on diet, physical activity and health.Accessed September 2, 2011, from http://www.who.int/dietphysicalactivity/strategy/eb11344/strategy_english_web.pdf.
Wiklund, S., Johansson, E., Sjostrom, L., Mellerowicz, E. J., Edlund,U., Shockcor, J. P., et al. (2008). Visualization of GC/TOF-MS-based metabolomics data for identification of biochemicallyinteresting compounds using OPLS class models. AnalyticalChemistry, 80(1), 115–122.
Wishart, D. S., Knox, C., Guo, A. C., Eisner, R., Young, N., Gautam,B., et al. (2009). HMDB: A knowledgebase for the humanmetabolome. Nucleic Acids Research, 37(suppl 1), D603–D610.
Wishart, D. S., Tzur, D., Knox, C., Eisner, R., Guo, A. C., Young, N.,et al. (2007). HMDB: The human metabolome database. NucleicAcids Research, 35(suppl 1), D521–D526.
Wold, H. (1985). Partial least squares. In S. Kotz & N. L. Johnson(Eds.), Encyclopedia of statistical sciences (vol. 6, pp. 581–591).New York: Willey.
Wold, S., Sjostrom, M., & Eriksson, L. (2001). PLS-regression: Abasic tool of chemometrics. Chemometrics and IntelligentLaboratory Systems, 58(2), 109–130.
Wu, X., Beecher, G. R., Holden, J. M., Haytowitz, D. B., Gebhardt, S.E., & Prior, R. L. (2006). Concentrations of anthocyanins incommon foods in the United States and estimation of normalconsumption. Journal of Agricultural and Food Chemistry,54(11), 4069–4075.
Yang, H., Pang, W., Lu, H., Cheng, D., Yan, X., Cheng, Y., et al.(2011). Comparison of metabolic profiling of cyanidin-3-O-galactoside and extracts from blueberry in aged mice. Journal ofAgricultural and Food Chemistry, 59(5), 2069–2076.
Yin, P., Zhao, X., Li, Q., Wang, J., Li, J., & Xu, G. (2006).Metabonomics study of intestinal fistulas based on ultraperfor-mance liquid chromatography coupled with Q-TOF massspectrometry (UPLC/Q-TOF MS). Journal of ProteomeResearch, 5(9), 2135–2143.
Zelena, E., Dunn, W. B., Broadhurst, D., Francis-McIntyre, S.,Carroll, K. M., Begley, P., et al. (2009). Development of a robustand repeatable UPLC-MS method for the long-term metabolo-mic study of human serum. Analytical Chemistry, 81(4),1357–1364.
100 A. Vanzo et al.
123
Author's personal copy