NMR and Pattern Recognition Studies on the Time-Related Metabolic Effects of...
12
NMR and Pattern Recognition Studies on the Time-Related Metabolic Effects of r-Naphthylisothiocyanate on Liver, Urine, and Plasma in the Rat: An Integrative Metabonomic Approach Nigel J. Waters, ² Elaine Holmes, ² Ann Williams, ‡ Catherine J. Waterfield, ‡ R. Duncan Farrant, § and Jeremy K. Nicholson* ,² Biological Chemistry, Division of Biomedical Sciences, Sir Alexander Fleming Building, Imperial College of Science, Technology and Medicine, London SW7 2AZ, U.K., and Preclinical Safety Evaluation, GlaxoSmithKline Research & Development, Ware, Herts., SG12 0DP, U.K., and Analytical Technologies, GlaxoSmithKline R & D, Stevenage, Herts. SG1 2NY, U.K. Received March 27, 2001 We present here a novel integrative metabonomic approach to probe toxic effects of drugs in experimental animals using R-naphthylisothiocyanate (ANIT) as a model hepatotoxicant. Male Han-Wistar rats were dosed with ANIT (150 mg/kg, n ) 25), and plasma and liver samples were collected for NMR and magic-angle spinning (MAS) NMR spectroscopy at 3, 7, 24, 31, and 168 h postdosing. Urine was collected continuously for 3 days prior to dosing and up to 168 h postdose. Histopathology and plasma clinical chemistry was also performed at all time points. Liver samples were analyzed either intact by 600 MHz 1 H MAS NMR techniques or using high resolution (liquid state) 1 H NMR of water-acetonitrile extracts. These data were related to sequential 1 H NMR measurements in urine and plasma using pattern recognition methods. 1D 1 H NMR spectra were data-reduced and analyzed using principal components analysis (PCA) to show the time-dependent biochemical variations induced by ANIT toxicity. From the eigenvector loadings of the PCA, those regions of the 1 H NMR spectra and hence the combinations of endogenous metabolites marking the main phase of the toxic episode were identified. The ANIT-induced biochemical manifestations included a hepatic lipidosis associated with hyperlipidaemia; hyperglycaemia and glycosuria; increased urinary excretion of taurine and creatine; a shift in energy metabolism characterized by increased plasma ketone bodies with reduced urinary excretion of tricarboxylic acid cycle intermediates and raised hepatic bile acids leading to bile aciduria. The integration of metabolic data derived from several sources gives a holistic approach to the study of time-related toxic effects in the intact system and enables the characterization of key metabolic effects during the development and recovery from a toxic lesion. Introduction We have previously reported that the use of proton NMR spectroscopy and pattern recognition (PR) studies of urine and magic angle spinning (MAS) 1 NMR studies on tissues from animals treated with drugs and toxins can give insight into site and mechanisms of toxic damage (1-10). Here we have investigated the combined applica- tion of NMR and MAS NMR of urine, plasma, and tissue samples taken at various postdose time points in an integrated metabonomic (11) approach to analyze onset, progression, and recovery processes from a toxic lesion using ANIT as a model. ANIT is a model hepatotoxin that causes intrahepatic cholestasis in a reproducible and dose-dependent manner in experimental animals (12), which is pathologically similar to drug-induced cholangiolitic hepatitis in man (13). Prominent features of acute ANIT hepatotoxicity include bile duct epithelial cell necrosis, cessation of bile flow, hepatic parenchymal cell injury and hyperbilirubi- naemia (14). Periportal injury is characterized by cho- langiolitic hepatitis, inflammation of the liver and biliary capillaries, mediated by portal oedema, and neutrophil infiltration. Bile duct obstruction produced by ANIT treatment leads to a proliferative lesion known as biliary epithelial cell hyperplasia (15). The mechanism(s) in- volved in ANIT toxicity have been shown to be neutro- phil- and platelet-dependent (16, 17). ANIT causes hepatocellular damage in vitro by the release of neutro- phil proteases, as demonstrated by an increase in activity of the serine proteases, cathepsin G, and elastase (18). ANIT accumulation in bile is glutathione dependent, and the resultant hepatotoxicity is dependent on glutathione levels (19). It is thought that a reversible glutathione- ANIT conjugate (dithiocarbamyl-linked glutathione) is released from hepatic parenchymal cells and is directed into bile where it dissociates to reduced glutathione and * To whom correspondence should be addressed. ² Biological Chemistry. ‡ Preclinical Safety Evaluation. § Analytical Technologies. 1 Abbreviations: AMIX, analysis of mixtures; ANIT, R-naphthyl- isothiocyanate; CPMG, Carr-Purcell-Meiboom-Gill; D2O, 2 H2O; FID, free induction decay; LDL, low-density lipoprotein; MAS, magic-angle spinning; PCA, principal components analysis; PR, pattern recognition; TMAO, trimethylamine-N-oxide; TSP, 3-(trimethylsilyl)[2,2,3,3- 2 H4] propionate; VLDL, very low-density lipoprotein. 1401 Chem. Res. Toxicol. 2001, 14, 1401-1412 10.1021/tx010067f CCC: $20.00 © 2001 American Chemical Society Published on Web 10/15/2001
-
Upload
independent -
Category
Documents
-
view
0 -
download
0
Transcript of NMR and Pattern Recognition Studies on the Time-Related Metabolic Effects of...
NMR and Pattern Recognition Studies on theTime-Related Metabolic Effects of
r-Naphthylisothiocyanate on Liver, Urine, and Plasma inthe Rat: An Integrative Metabonomic Approach
Nigel J. Waters,† Elaine Holmes,† Ann Williams,‡ Catherine J. Waterfield,‡R. Duncan Farrant,§ and Jeremy K. Nicholson*,†
Biological Chemistry, Division of Biomedical Sciences, Sir Alexander Fleming Building, ImperialCollege of Science, Technology and Medicine, London SW7 2AZ, U.K., and Preclinical SafetyEvaluation, GlaxoSmithKline Research & Development, Ware, Herts., SG12 0DP, U.K., and
Analytical Technologies, GlaxoSmithKline R & D, Stevenage, Herts. SG1 2NY, U.K.
Received March 27, 2001
We present here a novel integrative metabonomic approach to probe toxic effects of drugs inexperimental animals using R-naphthylisothiocyanate (ANIT) as a model hepatotoxicant. MaleHan-Wistar rats were dosed with ANIT (150 mg/kg, n ) 25), and plasma and liver sampleswere collected for NMR and magic-angle spinning (MAS) NMR spectroscopy at 3, 7, 24, 31,and 168 h postdosing. Urine was collected continuously for 3 days prior to dosing and up to168 h postdose. Histopathology and plasma clinical chemistry was also performed at all timepoints. Liver samples were analyzed either intact by 600 MHz 1H MAS NMR techniques orusing high resolution (liquid state) 1H NMR of water-acetonitrile extracts. These data wererelated to sequential 1H NMR measurements in urine and plasma using pattern recognitionmethods. 1D 1H NMR spectra were data-reduced and analyzed using principal componentsanalysis (PCA) to show the time-dependent biochemical variations induced by ANIT toxicity.From the eigenvector loadings of the PCA, those regions of the 1H NMR spectra and hence thecombinations of endogenous metabolites marking the main phase of the toxic episode wereidentified. The ANIT-induced biochemical manifestations included a hepatic lipidosis associatedwith hyperlipidaemia; hyperglycaemia and glycosuria; increased urinary excretion of taurineand creatine; a shift in energy metabolism characterized by increased plasma ketone bodieswith reduced urinary excretion of tricarboxylic acid cycle intermediates and raised hepaticbile acids leading to bile aciduria. The integration of metabolic data derived from several sourcesgives a holistic approach to the study of time-related toxic effects in the intact system andenables the characterization of key metabolic effects during the development and recoveryfrom a toxic lesion.
IntroductionWe have previously reported that the use of proton
NMR spectroscopy and pattern recognition (PR) studiesof urine and magic angle spinning (MAS)1 NMR studieson tissues from animals treated with drugs and toxinscan give insight into site and mechanisms of toxic damage(1-10). Here we have investigated the combined applica-tion of NMR and MAS NMR of urine, plasma, and tissuesamples taken at various postdose time points in anintegrated metabonomic (11) approach to analyze onset,progression, and recovery processes from a toxic lesionusing ANIT as a model.
ANIT is a model hepatotoxin that causes intrahepaticcholestasis in a reproducible and dose-dependent manner
in experimental animals (12), which is pathologicallysimilar to drug-induced cholangiolitic hepatitis in man(13). Prominent features of acute ANIT hepatotoxicityinclude bile duct epithelial cell necrosis, cessation of bileflow, hepatic parenchymal cell injury and hyperbilirubi-naemia (14). Periportal injury is characterized by cho-langiolitic hepatitis, inflammation of the liver and biliarycapillaries, mediated by portal oedema, and neutrophilinfiltration. Bile duct obstruction produced by ANITtreatment leads to a proliferative lesion known as biliaryepithelial cell hyperplasia (15). The mechanism(s) in-volved in ANIT toxicity have been shown to be neutro-phil- and platelet-dependent (16, 17). ANIT causeshepatocellular damage in vitro by the release of neutro-phil proteases, as demonstrated by an increase in activityof the serine proteases, cathepsin G, and elastase (18).ANIT accumulation in bile is glutathione dependent, andthe resultant hepatotoxicity is dependent on glutathionelevels (19). It is thought that a reversible glutathione-ANIT conjugate (dithiocarbamyl-linked glutathione) isreleased from hepatic parenchymal cells and is directedinto bile where it dissociates to reduced glutathione and
* To whom correspondence should be addressed.† Biological Chemistry.‡ Preclinical Safety Evaluation.§ Analytical Technologies.1 Abbreviations: AMIX, analysis of mixtures; ANIT, R-naphthyl-
isothiocyanate; CPMG, Carr-Purcell-Meiboom-Gill; D2O, 2H2O; FID,free induction decay; LDL, low-density lipoprotein; MAS, magic-anglespinning; PCA, principal components analysis; PR, pattern recognition;TMAO, trimethylamine-N-oxide; TSP, 3-(trimethylsilyl)[2,2,3,3-2H4]propionate; VLDL, very low-density lipoprotein.
1401Chem. Res. Toxicol. 2001, 14, 1401-1412
10.1021/tx010067f CCC: $20.00 © 2001 American Chemical SocietyPublished on Web 10/15/2001
ANIT. The bile duct is, therefore, exposed to a highconcentration of ANIT (20). Previous studies have shownthat ANIT treatment increases urinary excretion of bileacids, glucose, creatine, and taurine together and lowersthe excretion of tricarboxylic acid cycle intermediates (6).
For non-rigid solid materials or highly viscous liquids,high resolution 1H MAS NMR spectroscopy offers anapproach whereby some of the major line broadeningcontributions related to restricted molecular motion areeliminated or considerably reduced (21). High resolution1H NMR spectroscopic studies of excised tissues normallyrequire relatively large amounts of tissue (>0.25 g) whichmust be extracted via protein precipitation methods toenable the collection of sharp line spectra. MAS NMR oftissues is non-destructive, requires no sample prepara-tion, and additionally allows molecular compartmenta-tion and dynamic interactions to be investigated (22). 1HMAS NMR spectroscopy has recently been applied to thestudy of whole biological tissue such as renal cortex andliver (23), adipose tissue (24), intact red blood cells (22),prostate (25), and brain (26). Procedures involved in thistechnique have been optimized to validate the informa-tion gained from such MAS NMR studies of toxicologicalepisodes and disease processes (23). 1H MAS NMRspectroscopy of whole tissue has been applied to the studyof cadmium-induced renal toxicity in the bank vole (2)and to the assessment of renal and mitochondrial toxicityof 2-bromoethanamine (4).
We show here that the combination of 1H MAS NMRspectral data on tissues with 1H NMR-PR data from bloodplasma, urine and liver tissue extracts, conventionalclinical chemistry, and histopathological data can give acomprehensive overview of the effects of ANIT in vivo,gathering tissue specific and whole system biochemicalinformation and its variation in time.
Materials and Methods
Animal Handling Procedure and Tissue Preparation.Thirty-five male Han-Wistar rats (250 g, Charles River, Cambs.,U.K.) were acclimatized for 13 days in plastic cages prior togroup allocation and treatment. They were then housed indi-vidually in metabolism cages in a well-ventilated room at atemperature of 21 ( 2 °C and a relative humidity of 50 ( 10%,with a 12 h light/12 h dark cycle. Food [Rat and Mouse No. 1Diet (Special Diet Services Ltd., Cambridge, U.K.)] and tapwater were provided ad libitum. Body weights were measureddaily. Each rat received either a single dose of ANIT in corn oil(p.o. 150 mg/kg, n ) 25) or corn oil only (p.o. 10 mL/kg, n ) 10).Animals were sacrificed (n ) 5) by exsanguination from theabdominal aorta under isoflurane anaesthesia at 3, 7, 24, 31,and 168 h after dosing with ANIT, and vehicle-dosed controlanimals at 24 and 31 h p.d. Triplicate samples of the left laterallobe of the liver, weighing between 15 and 23 mg, were excisedand immediately snap-frozen in liquid nitrogen. Another largersection was snap-frozen for tissue extraction. These sampleswere stored at -70 °C until NMR spectroscopic analysis. Theremainder of the left lateral liver lobe, a kidney, and a testiswere fixed in 10.5% phosphate buffered formalin, embedded inparaffin wax, sectioned (3-4 µm), and stained with haematoxy-lin and eosin for histopathological assessment.
1H MAS NMR Spectroscopic Analysis of Intact Tissues.Samples (15-23 mg) were rinsed in 0.9% saline D2O, placed inzirconia 4 mm diameter rotors (Bruker Analytische GmbH,Rheinstetten, Germany) and analyzed by 1H MAS NMR spec-troscopy at 600.13 MHz using a Bruker DRX600 spectrometerat an MAS spin rate of 6000 Hz (23). MAS NMR spectra wereacquired at 283 K, as measured by the thermocouple systemand maintained by the cooling of the inlet gas pressures
responsible for sample spinning. The in situ temperaturecalculated using the chemical shifts of the water resonance(temperature sensitive) and the R-anomeric proton of glucose(temperature insensitive) averaged 288 K (27). For each sample,128 transients were collected into 32 K data points using a waterpresaturation pulse sequence (D-90°-t1-90°-tm-90°-acquire FID).A secondary irradiation field is applied at the water frequencyduring the relaxation delay of 3 s and during the mixing periodtm (100 ms), with t1 fixed at 3 µs. A spectral width of 12000 Hzand an acquisition time per scan of 1.36 s were used. The 1DCarr-Purcell-Meiboom-Gill (CPMG) spin-echo pulse sequence[90°-(τ-180°-τ)n acquisition] (τ ) 200 µs, n ) 200) with standardpresaturation of the water resonance, using a fixed total spin-spin relaxation delay of 80 ms was applied to measure spin-echo 1H MAS NMR spectra on all samples.
1H NMR Spectroscopic Analysis of Liver Tissue Ex-tracts. Samples of liver tissue (∼250 mg) taken from the leftlateral lobe were homogenized in 2 mL of 50% acetonitrile inan ice/water bath. The homogenates were centrifuged at 5070gfor 5 min at 4 °C. The supernatants were removed andlyophilized before being reconstituted in 1 mL of D2O. Thereconstituted solutions were pipetted into 5 mm NMR tubestogether with 0.1% 3-(trimethylsilyl)[2,2,3,3-2H4] propionate(TSP, an internal standard δ 0.0) and 1% sodium azide (bacte-riostatic agent) in D2O. 1H NMR spectra were acquired on eachsample at 600.13 MHz on a Bruker DRX600 spectrometer atambient probe temperature (298 K). 1D single pulse experi-ments were carried out using the standard pulse sequence toachieve satisfactory water suppression (see above). For eachsample, 128 transients were collected into 64 K data points witha relaxation delay of 2 s and a mixing period of 100 ms. Aspectral width of 9600 Hz and an acquisition time per scan of3.41 s were used.
1H NMR Spectroscopic Analysis of Blood Plasma. Ali-quots (2.0 mL) of blood were collected into heparin containersfrom abdominal aortal exsanguination, and the plasma wasseparated by centrifugation and frozen prior to NMR measure-ment. For each sample, 250 µL of blood plasma was made up toa total volume of 600 µL by the addition of an appropriatevolume of D2O. The samples were centrifuged at 4200g for 20min at 4 °C. Aliquots (500 µL) were decanted into 5 mm NMRtubes and inverted several times to ensure thorough mixing.1H NMR spectra were acquired on each sample at 600.13 MHzon a Bruker DRX600 spectrometer at ambient probe tempera-ture (298 K). 1D single pulse experiments were carried out usingthe standard pulse sequence, as described for the acquisition ofMAS NMR spectra. For each sample, 64 transients werecollected into 64 K data points with a relaxation delay of 2 sand a mixing period of 100 ms. A spectral width of 9600 Hzand an acquisition time per scan of 3.41 s were used. The 1DCPMG spin-echo pulse sequence using a fixed total spin-spinrelaxation delay of 80 ms was applied to measure spin-echo1H NMR spectra on all samples.
1H NMR Spectroscopic Analysis of Urine. Urine wascollected in 1% sodium azide during the following periods:predose (daytime collection 0-7 h period on day -5, -4, and-1), and 0-7, 7-24, 24-31, 31-48, 48-56, 56-72, 72-79, 79-96, 144-151, and 151-168 h postdose. Aliquots (600 µL) of urinewere mixed with phosphate buffer (300 µL of 0.1 M) andcentrifuged at 2230g for 15 min. The supernatants (800 µL) werepipetted into sample vials together with 0.1% TSP/1% azide inD2O. NMR measurements were made on a Bruker AMX600spectrometer, operating at 600.13 MHz 1H frequency, using aBruker BEST flow-injection probe (Bruker Analyticshe GmbH,Rheinstetten, Germany). NMR spectra were acquired using thestandard pulse sequence (as previously described). For eachsample, 64 free induction decays (FIDs) were collected into 48K data points using a spectral width of 12 000 Hz and anacquisition time per scan of 2.04 s.
Automatic Data Reduction and Principal ComponentsAnalysis (PCA). Single pulse and CPMG (MAS-) NMR spectrawere data reduced using the program AMIX (Bruker GmbH,
1402 Chem. Res. Toxicol., Vol. 14, No. 10, 2001 Waters et al.
Germany). The spectral region δ 0.2-10.0 was segmented intoregions of 0.04 ppm width giving a total of 256 integratedregions per NMR spectrum. The area for each segmented regionwas expressed as an integral value resulting in an intensitydistribution description of the whole spectrum with 256 vari-ables prior to PR analysis. The region of the spectrum, whichincluded water (δ 4.8-5.4), was removed from the analysis forall groups to eliminate variation in water suppression efficiency.For urine spectra, the region containing urea (δ 5.4-6.0) wasalso excluded. For the aqueous liver extracts, the region of thespectrum containing a residual acetonitrile signal (δ 2.08) wasremoved from all spectra. All remaining spectral segments werescaled to the total integrated area of each spectrum (28).
The single pulse and CPMG 1H NMR spectral data sets wereimported into the SIMCA-P8.0 software package (Umetrics AB,Umea, Sweden) separately. These data were then scaled usingcentered scaling prior to PCA. With mean-centering, the averagevalue of each variable is calculated and then subtracted fromthe data. PCA methods involve the calculation of linear com-binations of the original descriptors, the PCs, such that eachPC is orthogonal to all others with the first PC (PC1) containingthe largest amount of variance with subsequent PCs containingprogressively less variance (29). Thus, a plot of PC1 versus PC2provides the most efficient 2D representation of the informationcontained in the data set. Much of the PCA data was presentedas mean trajectory plots, where the magnitude and direction ofeach point represents the severity and extent of the lesion, andas an average of all individual samples in each group.
Clinical Chemistry and Haematology. Clinical chemistryanalysis was carried out on a Hitachi 917 analyzer usingappropriate kits. Blood was collected at autopsy time points byabdominal aortal exsanguination. Blood (0.5 mL) was collectedinto EDTA anticoagulant. A Technicon H* 1 analyzer was usedto determine a range of haematological parameters. Reticulocytecount was determined using a Sysmex R-1000 analyzer. Inaddition to this, 0.01 mL of blood was collected into thrombotestreagent and used to determine thrombotest time. Also, 1.8 mLof blood was collected into 0.2 mL of 0.106 M trisodium citrate.Prothrombin time, activated thromboplastin time and fibrinogenconcentration were determined using a Sysmex CA-5000 ana-lyzer. Unpaired Mann-Whitney tests were used to compareclinical chemical data between groups.
Results1H MAS NMR Spectroscopic and Pattern Recog-
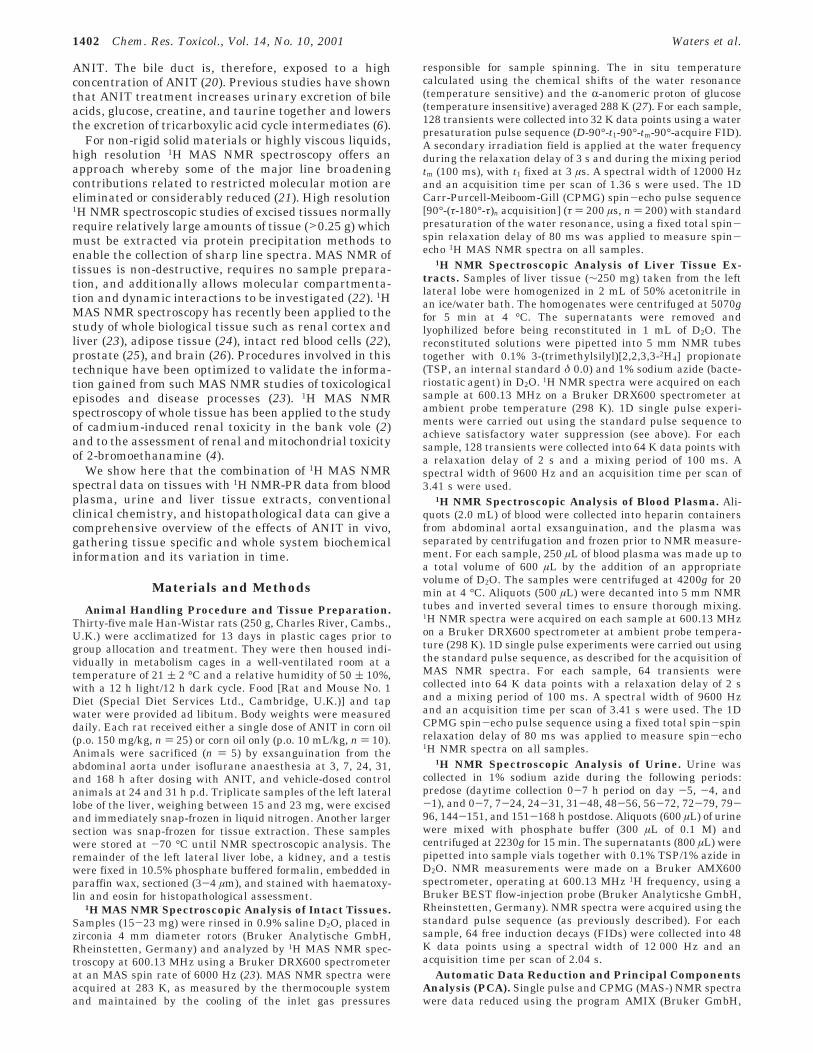
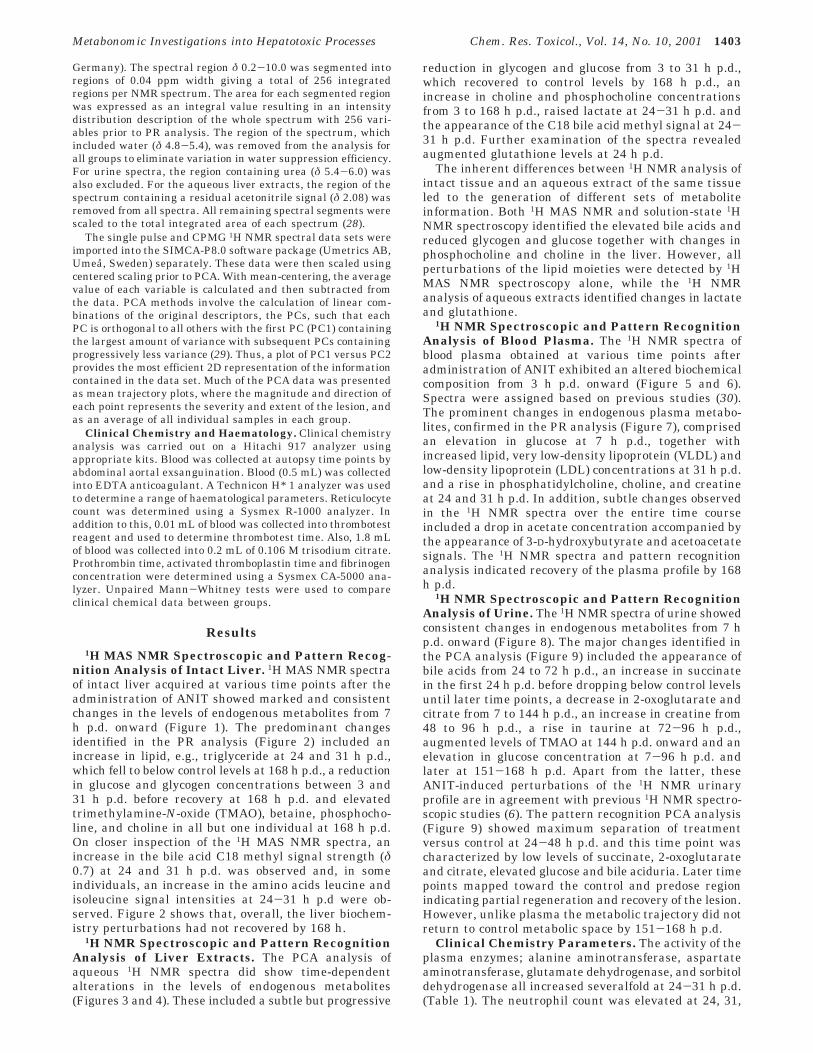
nition Analysis of Intact Liver. 1H MAS NMR spectraof intact liver acquired at various time points after theadministration of ANIT showed marked and consistentchanges in the levels of endogenous metabolites from 7h p.d. onward (Figure 1). The predominant changesidentified in the PR analysis (Figure 2) included anincrease in lipid, e.g., triglyceride at 24 and 31 h p.d.,which fell to below control levels at 168 h p.d., a reductionin glucose and glycogen concentrations between 3 and31 h p.d. before recovery at 168 h p.d. and elevatedtrimethylamine-N-oxide (TMAO), betaine, phosphocho-line, and choline in all but one individual at 168 h p.d.On closer inspection of the 1H MAS NMR spectra, anincrease in the bile acid C18 methyl signal strength (δ0.7) at 24 and 31 h p.d. was observed and, in someindividuals, an increase in the amino acids leucine andisoleucine signal intensities at 24-31 h p.d were ob-served. Figure 2 shows that, overall, the liver biochem-istry perturbations had not recovered by 168 h.
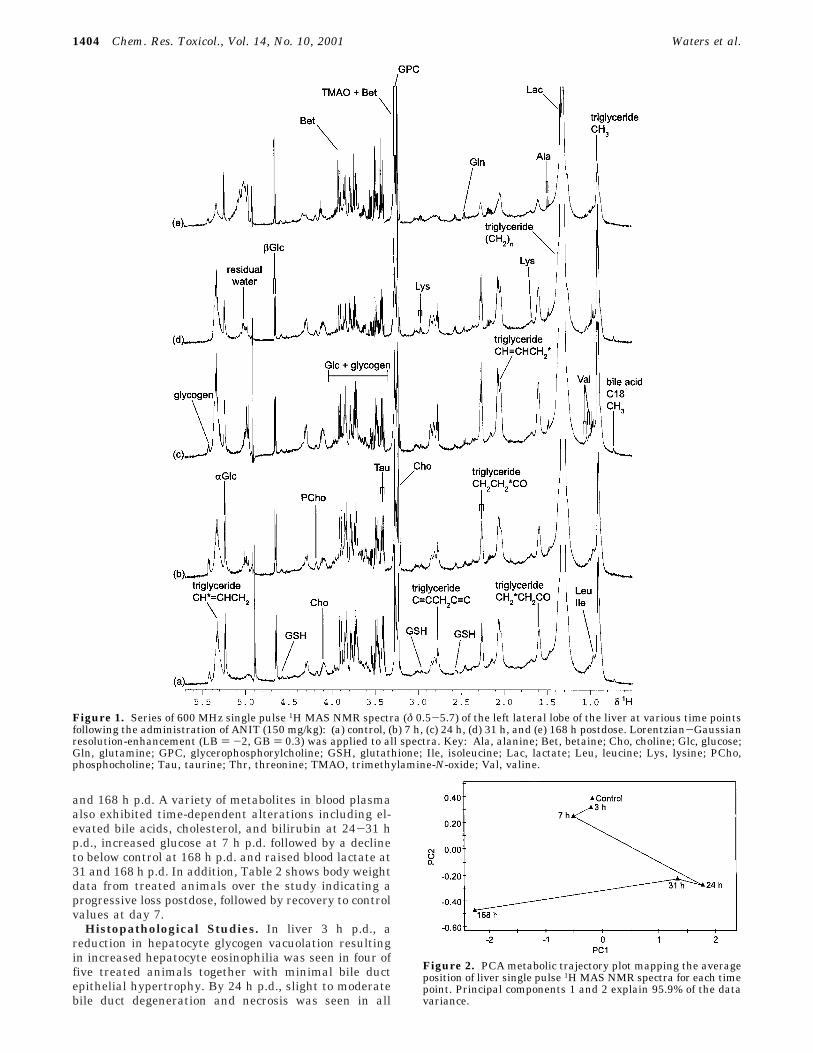
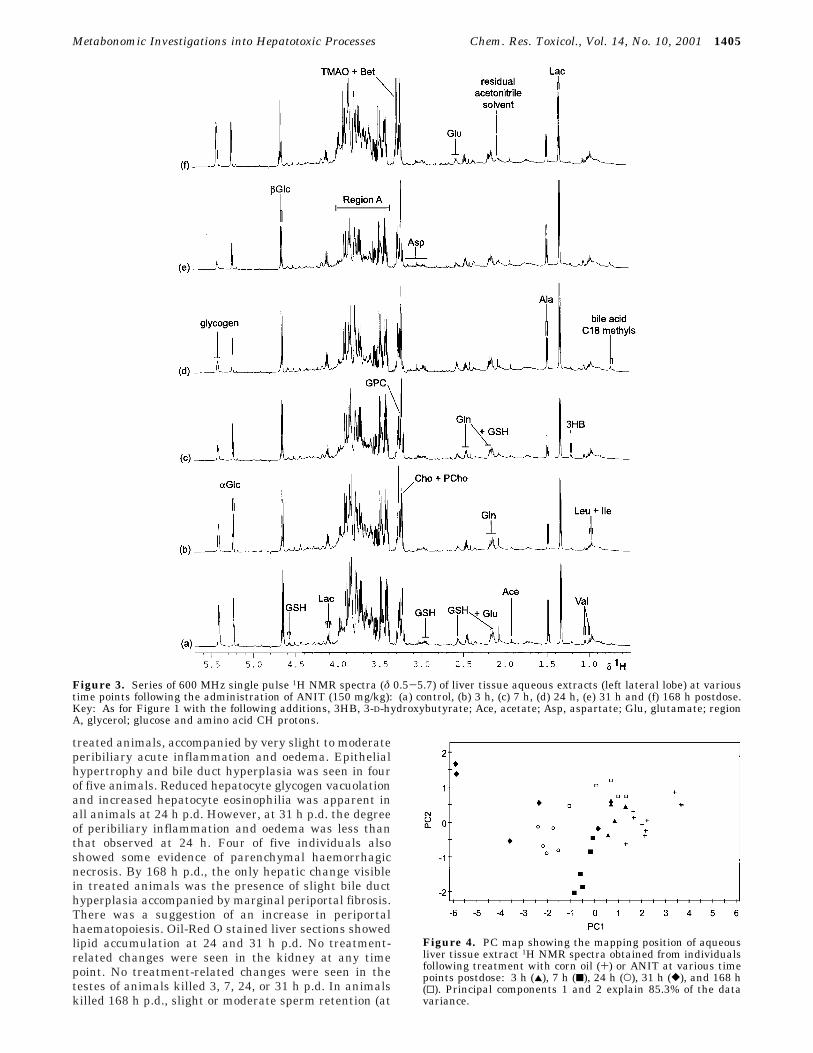
1H NMR Spectroscopic and Pattern RecognitionAnalysis of Liver Extracts. The PCA analysis ofaqueous 1H NMR spectra did show time-dependentalterations in the levels of endogenous metabolites(Figures 3 and 4). These included a subtle but progressive
reduction in glycogen and glucose from 3 to 31 h p.d.,which recovered to control levels by 168 h p.d., anincrease in choline and phosphocholine concentrationsfrom 3 to 168 h p.d., raised lactate at 24-31 h p.d. andthe appearance of the C18 bile acid methyl signal at 24-31 h p.d. Further examination of the spectra revealedaugmented glutathione levels at 24 h p.d.
The inherent differences between 1H NMR analysis ofintact tissue and an aqueous extract of the same tissueled to the generation of different sets of metaboliteinformation. Both 1H MAS NMR and solution-state 1HNMR spectroscopy identified the elevated bile acids andreduced glycogen and glucose together with changes inphosphocholine and choline in the liver. However, allperturbations of the lipid moieties were detected by 1HMAS NMR spectroscopy alone, while the 1H NMRanalysis of aqueous extracts identified changes in lactateand glutathione.
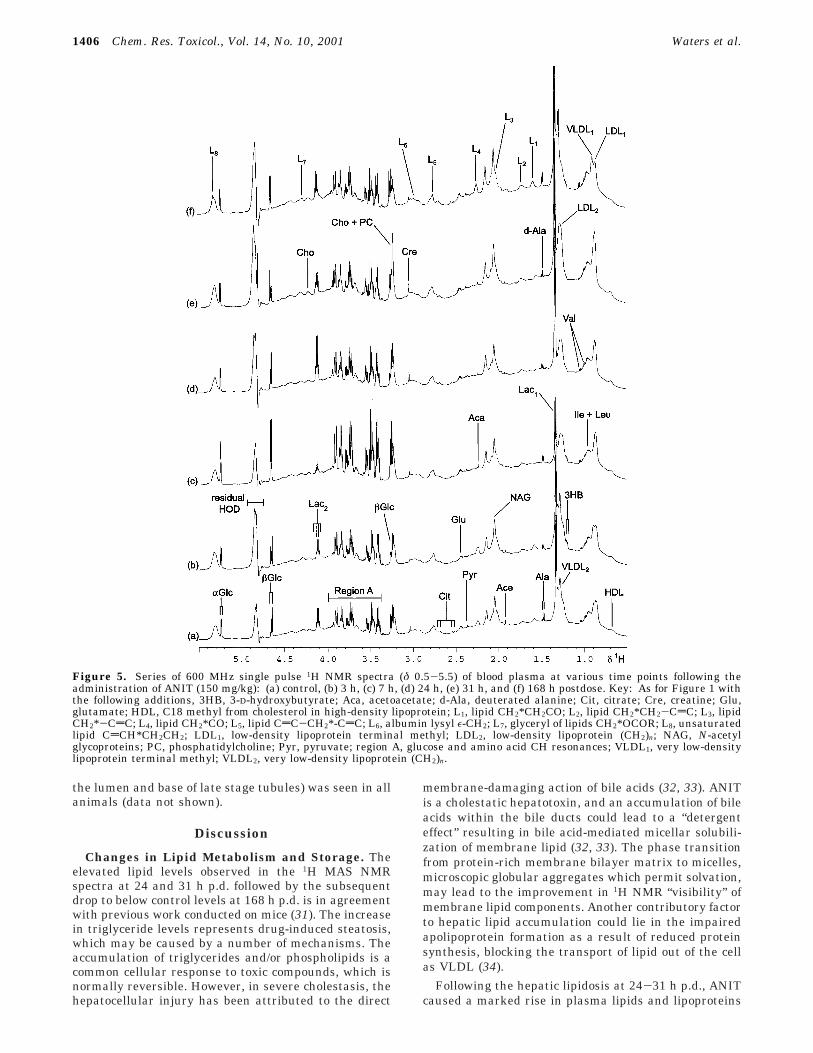
1H NMR Spectroscopic and Pattern RecognitionAnalysis of Blood Plasma. The 1H NMR spectra ofblood plasma obtained at various time points afteradministration of ANIT exhibited an altered biochemicalcomposition from 3 h p.d. onward (Figure 5 and 6).Spectra were assigned based on previous studies (30).The prominent changes in endogenous plasma metabo-lites, confirmed in the PR analysis (Figure 7), comprisedan elevation in glucose at 7 h p.d., together withincreased lipid, very low-density lipoprotein (VLDL) andlow-density lipoprotein (LDL) concentrations at 31 h p.d.and a rise in phosphatidylcholine, choline, and creatineat 24 and 31 h p.d. In addition, subtle changes observedin the 1H NMR spectra over the entire time courseincluded a drop in acetate concentration accompanied bythe appearance of 3-D-hydroxybutyrate and acetoacetatesignals. The 1H NMR spectra and pattern recognitionanalysis indicated recovery of the plasma profile by 168h p.d.
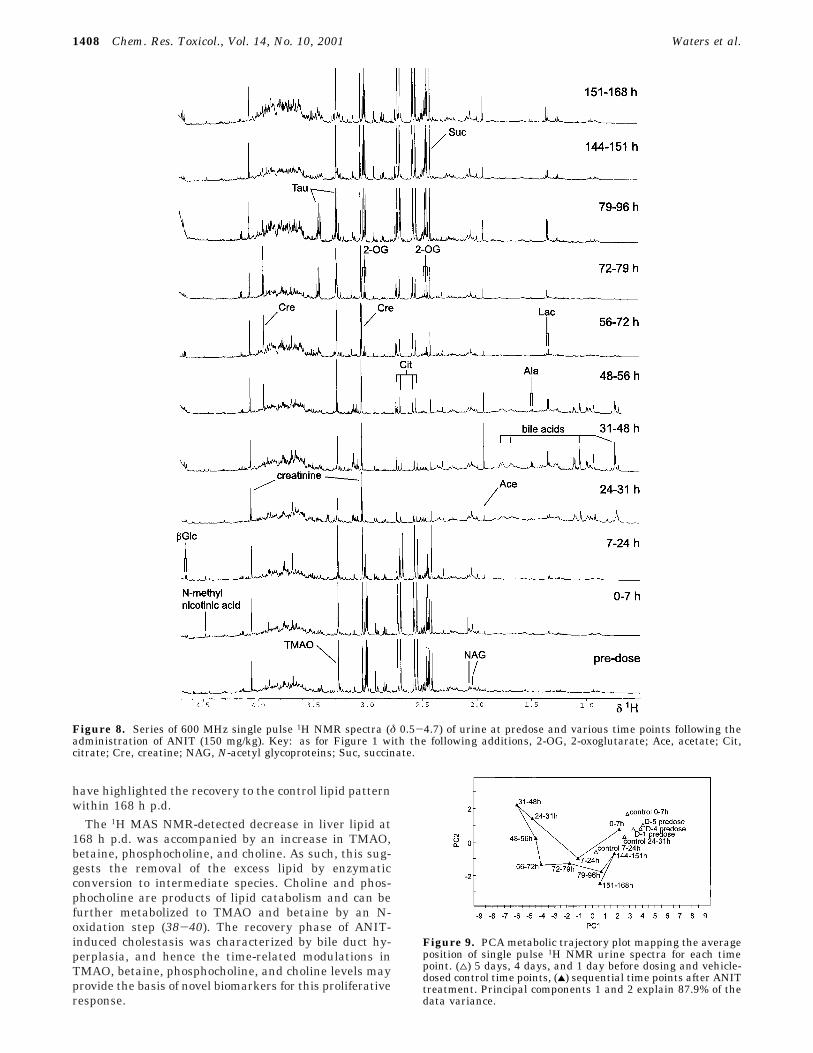
1H NMR Spectroscopic and Pattern RecognitionAnalysis of Urine. The 1H NMR spectra of urine showedconsistent changes in endogenous metabolites from 7 hp.d. onward (Figure 8). The major changes identified inthe PCA analysis (Figure 9) included the appearance ofbile acids from 24 to 72 h p.d., an increase in succinatein the first 24 h p.d. before dropping below control levelsuntil later time points, a decrease in 2-oxoglutarate andcitrate from 7 to 144 h p.d., an increase in creatine from48 to 96 h p.d., a rise in taurine at 72-96 h p.d.,augmented levels of TMAO at 144 h p.d. onward and anelevation in glucose concentration at 7-96 h p.d. andlater at 151-168 h p.d. Apart from the latter, theseANIT-induced perturbations of the 1H NMR urinaryprofile are in agreement with previous 1H NMR spectro-scopic studies (6). The pattern recognition PCA analysis(Figure 9) showed maximum separation of treatmentversus control at 24-48 h p.d. and this time point wascharacterized by low levels of succinate, 2-oxoglutarateand citrate, elevated glucose and bile aciduria. Later timepoints mapped toward the control and predose regionindicating partial regeneration and recovery of the lesion.However, unlike plasma the metabolic trajectory did notreturn to control metabolic space by 151-168 h p.d.
Clinical Chemistry Parameters. The activity of theplasma enzymes; alanine aminotransferase, aspartateaminotransferase, glutamate dehydrogenase, and sorbitoldehydrogenase all increased severalfold at 24-31 h p.d.(Table 1). The neutrophil count was elevated at 24, 31,
Metabonomic Investigations into Hepatotoxic Processes Chem. Res. Toxicol., Vol. 14, No. 10, 2001 1403
and 168 h p.d. A variety of metabolites in blood plasmaalso exhibited time-dependent alterations including el-evated bile acids, cholesterol, and bilirubin at 24-31 hp.d., increased glucose at 7 h p.d. followed by a declineto below control at 168 h p.d. and raised blood lactate at31 and 168 h p.d. In addition, Table 2 shows body weightdata from treated animals over the study indicating aprogressive loss postdose, followed by recovery to controlvalues at day 7.
Histopathological Studies. In liver 3 h p.d., areduction in hepatocyte glycogen vacuolation resultingin increased hepatocyte eosinophilia was seen in four offive treated animals together with minimal bile ductepithelial hypertrophy. By 24 h p.d., slight to moderatebile duct degeneration and necrosis was seen in all
Figure 1. Series of 600 MHz single pulse 1H MAS NMR spectra (δ 0.5-5.7) of the left lateral lobe of the liver at various time pointsfollowing the administration of ANIT (150 mg/kg): (a) control, (b) 7 h, (c) 24 h, (d) 31 h, and (e) 168 h postdose. Lorentzian-Gaussianresolution-enhancement (LB ) -2, GB ) 0.3) was applied to all spectra. Key: Ala, alanine; Bet, betaine; Cho, choline; Glc, glucose;Gln, glutamine; GPC, glycerophosphorylcholine; GSH, glutathione; Ile, isoleucine; Lac, lactate; Leu, leucine; Lys, lysine; PCho,phosphocholine; Tau, taurine; Thr, threonine; TMAO, trimethylamine-N-oxide; Val, valine.
Figure 2. PCA metabolic trajectory plot mapping the averageposition of liver single pulse 1H MAS NMR spectra for each timepoint. Principal components 1 and 2 explain 95.9% of the datavariance.
1404 Chem. Res. Toxicol., Vol. 14, No. 10, 2001 Waters et al.
treated animals, accompanied by very slight to moderateperibiliary acute inflammation and oedema. Epithelialhypertrophy and bile duct hyperplasia was seen in fourof five animals. Reduced hepatocyte glycogen vacuolationand increased hepatocyte eosinophilia was apparent inall animals at 24 h p.d. However, at 31 h p.d. the degreeof peribiliary inflammation and oedema was less thanthat observed at 24 h. Four of five individuals alsoshowed some evidence of parenchymal haemorrhagicnecrosis. By 168 h p.d., the only hepatic change visiblein treated animals was the presence of slight bile ducthyperplasia accompanied by marginal periportal fibrosis.There was a suggestion of an increase in periportalhaematopoiesis. Oil-Red O stained liver sections showedlipid accumulation at 24 and 31 h p.d. No treatment-related changes were seen in the kidney at any timepoint. No treatment-related changes were seen in thetestes of animals killed 3, 7, 24, or 31 h p.d. In animalskilled 168 h p.d., slight or moderate sperm retention (at
Figure 3. Series of 600 MHz single pulse 1H NMR spectra (δ 0.5-5.7) of liver tissue aqueous extracts (left lateral lobe) at varioustime points following the administration of ANIT (150 mg/kg): (a) control, (b) 3 h, (c) 7 h, (d) 24 h, (e) 31 h and (f) 168 h postdose.Key: As for Figure 1 with the following additions, 3HB, 3-D-hydroxybutyrate; Ace, acetate; Asp, aspartate; Glu, glutamate; regionA, glycerol; glucose and amino acid CH protons.
Figure 4. PC map showing the mapping position of aqueousliver tissue extract 1H NMR spectra obtained from individualsfollowing treatment with corn oil (+) or ANIT at various timepoints postdose: 3 h (2), 7 h (9), 24 h (O), 31 h ([), and 168 h(0). Principal components 1 and 2 explain 85.3% of the datavariance.
Metabonomic Investigations into Hepatotoxic Processes Chem. Res. Toxicol., Vol. 14, No. 10, 2001 1405
the lumen and base of late stage tubules) was seen in allanimals (data not shown).
Discussion
Changes in Lipid Metabolism and Storage. Theelevated lipid levels observed in the 1H MAS NMRspectra at 24 and 31 h p.d. followed by the subsequentdrop to below control levels at 168 h p.d. is in agreementwith previous work conducted on mice (31). The increasein triglyceride levels represents drug-induced steatosis,which may be caused by a number of mechanisms. Theaccumulation of triglycerides and/or phospholipids is acommon cellular response to toxic compounds, which isnormally reversible. However, in severe cholestasis, thehepatocellular injury has been attributed to the direct
membrane-damaging action of bile acids (32, 33). ANITis a cholestatic hepatotoxin, and an accumulation of bileacids within the bile ducts could lead to a “detergenteffect” resulting in bile acid-mediated micellar solubili-zation of membrane lipid (32, 33). The phase transitionfrom protein-rich membrane bilayer matrix to micelles,microscopic globular aggregates which permit solvation,may lead to the improvement in 1H NMR “visibility” ofmembrane lipid components. Another contributory factorto hepatic lipid accumulation could lie in the impairedapolipoprotein formation as a result of reduced proteinsynthesis, blocking the transport of lipid out of the cellas VLDL (34).
Following the hepatic lipidosis at 24-31 h p.d., ANITcaused a marked rise in plasma lipids and lipoproteins
Figure 5. Series of 600 MHz single pulse 1H NMR spectra (δ 0.5-5.5) of blood plasma at various time points following theadministration of ANIT (150 mg/kg): (a) control, (b) 3 h, (c) 7 h, (d) 24 h, (e) 31 h, and (f) 168 h postdose. Key: As for Figure 1 withthe following additions, 3HB, 3-D-hydroxybutyrate; Aca, acetoacetate; d-Ala, deuterated alanine; Cit, citrate; Cre, creatine; Glu,glutamate; HDL, C18 methyl from cholesterol in high-density lipoprotein; L1, lipid CH2*CH2CO; L2, lipid CH2*CH2-CdC; L3, lipidCH2*-CdC; L4, lipid CH2*CO; L5, lipid CdC-CH2*-CdC; L6, albumin lysyl ε-CH2; L7, glyceryl of lipids CH2*OCOR; L8, unsaturatedlipid CdCH*CH2CH2; LDL1, low-density lipoprotein terminal methyl; LDL2, low-density lipoprotein (CH2)n; NAG, N-acetylglycoproteins; PC, phosphatidylcholine; Pyr, pyruvate; region A, glucose and amino acid CH resonances; VLDL1, very low-densitylipoprotein terminal methyl; VLDL2, very low-density lipoprotein (CH2)n.
1406 Chem. Res. Toxicol., Vol. 14, No. 10, 2001 Waters et al.
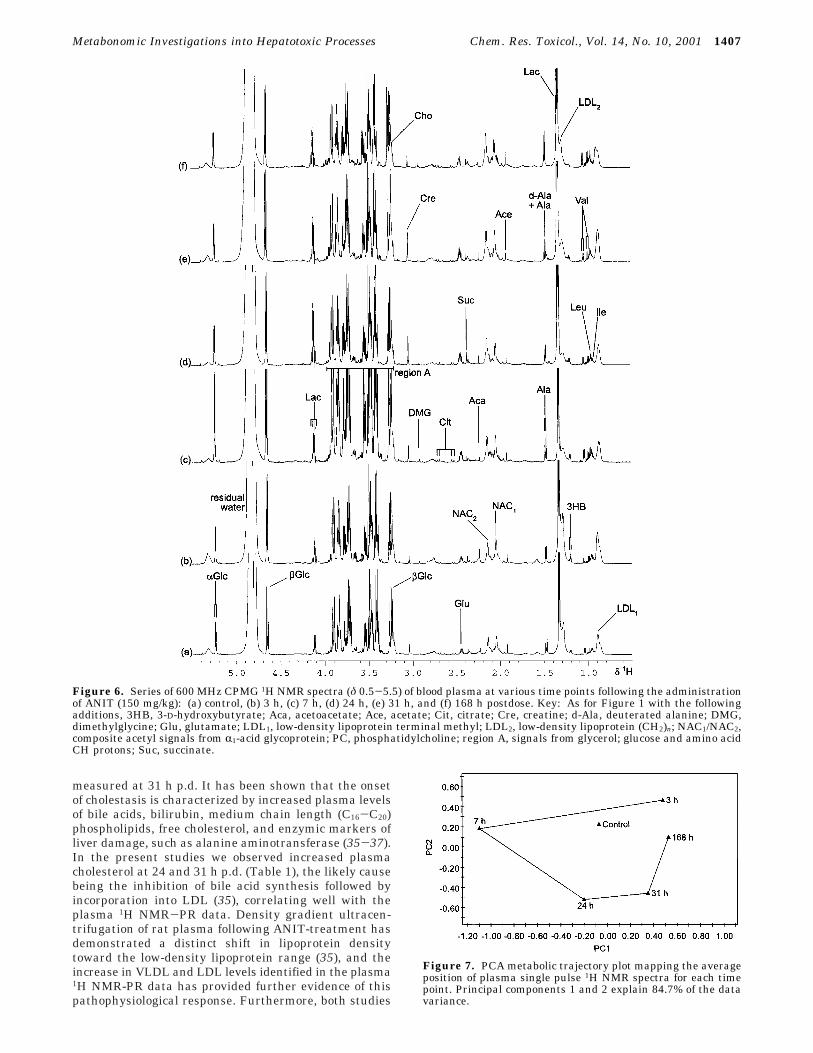
measured at 31 h p.d. It has been shown that the onsetof cholestasis is characterized by increased plasma levelsof bile acids, bilirubin, medium chain length (C16-C20)phospholipids, free cholesterol, and enzymic markers ofliver damage, such as alanine aminotransferase (35-37).In the present studies we observed increased plasmacholesterol at 24 and 31 h p.d. (Table 1), the likely causebeing the inhibition of bile acid synthesis followed byincorporation into LDL (35), correlating well with theplasma 1H NMR-PR data. Density gradient ultracen-trifugation of rat plasma following ANIT-treatment hasdemonstrated a distinct shift in lipoprotein densitytoward the low-density lipoprotein range (35), and theincrease in VLDL and LDL levels identified in the plasma1H NMR-PR data has provided further evidence of thispathophysiological response. Furthermore, both studies
Figure 6. Series of 600 MHz CPMG 1H NMR spectra (δ 0.5-5.5) of blood plasma at various time points following the administrationof ANIT (150 mg/kg): (a) control, (b) 3 h, (c) 7 h, (d) 24 h, (e) 31 h, and (f) 168 h postdose. Key: As for Figure 1 with the followingadditions, 3HB, 3-D-hydroxybutyrate; Aca, acetoacetate; Ace, acetate; Cit, citrate; Cre, creatine; d-Ala, deuterated alanine; DMG,dimethylglycine; Glu, glutamate; LDL1, low-density lipoprotein terminal methyl; LDL2, low-density lipoprotein (CH2)n; NAC1/NAC2,composite acetyl signals from R1-acid glycoprotein; PC, phosphatidylcholine; region A, signals from glycerol; glucose and amino acidCH protons; Suc, succinate.
Figure 7. PCA metabolic trajectory plot mapping the averageposition of plasma single pulse 1H NMR spectra for each timepoint. Principal components 1 and 2 explain 84.7% of the datavariance.
Metabonomic Investigations into Hepatotoxic Processes Chem. Res. Toxicol., Vol. 14, No. 10, 2001 1407
have highlighted the recovery to the control lipid patternwithin 168 h p.d.
The 1H MAS NMR-detected decrease in liver lipid at168 h p.d. was accompanied by an increase in TMAO,betaine, phosphocholine, and choline. As such, this sug-gests the removal of the excess lipid by enzymaticconversion to intermediate species. Choline and phos-phocholine are products of lipid catabolism and can befurther metabolized to TMAO and betaine by an N-oxidation step (38-40). The recovery phase of ANIT-induced cholestasis was characterized by bile duct hy-perplasia, and hence the time-related modulations inTMAO, betaine, phosphocholine, and choline levels mayprovide the basis of novel biomarkers for this proliferativeresponse.
Figure 8. Series of 600 MHz single pulse 1H NMR spectra (δ 0.5-4.7) of urine at predose and various time points following theadministration of ANIT (150 mg/kg). Key: as for Figure 1 with the following additions, 2-OG, 2-oxoglutarate; Ace, acetate; Cit,citrate; Cre, creatine; NAG, N-acetyl glycoproteins; Suc, succinate.
Figure 9. PCA metabolic trajectory plot mapping the averageposition of single pulse 1H NMR urine spectra for each timepoint. (4) 5 days, 4 days, and 1 day before dosing and vehicle-dosed control time points, (2) sequential time points after ANITtreatment. Principal components 1 and 2 explain 87.9% of thedata variance.
1408 Chem. Res. Toxicol., Vol. 14, No. 10, 2001 Waters et al.
Lesion-Specific Biomarkers of Hepatotoxicity.Clinical chemistry measurements revealed a severalfoldincrease in the activity of the plasma enzymes alanineaminotransferase, aspartate aminotransferase, glutamatedehydrogenase, and sorbitol dehydrogenase confirmingliver damage, together with hyperbilirubinaemia andelevated plasma bile acids indicating liver cholestasis,at the 24 and 31 h p.d. time points. Raised numbers ofcirculating neutrophils at 24, 31, and 168 h p.d. suggestedan inflammatory response to ANIT administration, cen-tered on the liver.
NMR analysis of urine presented bile-aciduria ac-companied by glycosuria: lesion-specific biomarkers ofcholestasis (6). The observed increase in urinary creatine(48-96 h p.d.) and taurine (72-96 h p.d.) levels are, incombination, well-documented biomarkers of hepatotox-icity (6, 41). Changes in taurine levels are closely relatedto changes in the pool of the precursor amino acidcysteine, which reflect both changes in protein synthesisand glutathione demand (42). It is thought that areversible glutathione-ANIT conjugate (dithiocarbamyl-linked glutathione) is released from hepatic parenchymalcells which is directed into bile where it dissociates toreduced glutathione and ANIT; a reaction which isnecessary for hepatotoxicity to occur (19, 20). As theGSH-ANIT conjugate dissociates in the biliary system,an excess of free GSH will accumulate and this appearsto be the case since 1H NMR spectral analysis of liverextracts showed an acute rise in glutathione at 24 h p.d.This would then cause a shift in the sulfur metabolitepathway, as less GSH production leads to the potentiallytoxic build-up of cysteine, which is bypassed by metabo-lism to taurine, prior to excretion into the urine.
Bile Duct Obstruction and Damage. Histopathol-ogy confirmed the ANIT-induced lesion such that cho-langiolitic hepatitis and bile duct degeneration werefollowed by bile duct hyperplasia, as is well-documented.In addition, conventional assay techniques identifiedraised bile acids and cholesterol levels in the plasma atthe time points of maximum effect (24-31 h p.d.). Thenumbers of circulating neutrophils increased at maxi-mum effect, also confirming an inflammatory response,characteristic of the ANIT-induced liver lesion (12).
Under normal physiological conditions, bile salts se-creted into the canalicular lumen aggregate phospholipid
(consisting principally of phosphatidylcholine) as mi-celles, which are transported in the bile prior to intestinalsecretion (43). The hepatocyte canalicular membraneplays a crucial role in nascent bile formation and biliarysecretion of bile salts, phosphatidylcholine, and choles-terol. The canalicular membrane is made up of mainlyphosphatidylcholine, sphingomyelin, and cholesterol,where the two latter species provide decreased fluidityand increased resistance against the detergent effects ofbile salts. However, cholestasis-induced hepatocyte ne-crosis and the subsequent membrane breakdown, willprovide not only elevated bile acids, but also an increasedavailable source of phosphatidylcholine for bile acid-mediated micellar solubilization to take place. The bileduct obstruction would then lead to a reflux of these bileconstituents into the plasma compartment (35), explain-ing the rise in phosphatidylcholine and bile acids ob-served in the plasma 1H NMR-PR and clinical chemistryanalysis at 24 and 31 h p.d. As a consequence, abnormallyhigh levels of bile acids would then be excreted into theurine.
The increase in choline and phosphocholine over theentire time course in the 1H NMR spectra of aqueous livertissue extracts was not observed in the 1H MAS NMRspectra. It is possible that the extraction procedure hadreleased these species from a constrained motionalenvironment within the cellular matrix, into solutionwhere an isotropic motion had enabled their visualizationby liquid state 1H NMR spectroscopy. The elevated levelsof choline and phosphocholine maybe products of mem-brane breakdown and lipid catabolism as a result of theaction of ANIT, which in the solid tissue contributed tothe obstruction of the bile ducts resulting in a constrainedmolecular motion. The appearance of the bile acid methylsignal in liver extracts at 24-31 h p.d. is in agreementwith the 1H MAS NMR-PR analysis and this is likely tobe due to the bile duct obstruction leading to a cessationof bile flow.
Effects on Glucose and Glycogen Metabolism. 1HNMR spectroscopic and clinical chemistry measurementson blood plasma highlighted a hyperglycaemic effect at7 h p.d. This effect may also relate to the presence ofplasma ketone bodies, 3-D-hydroxybutyrate and aceto-acetate, from 3 h p.d. onward, verifying the onset ofketogenesis: â-oxidation of fatty acids and/or oxidation
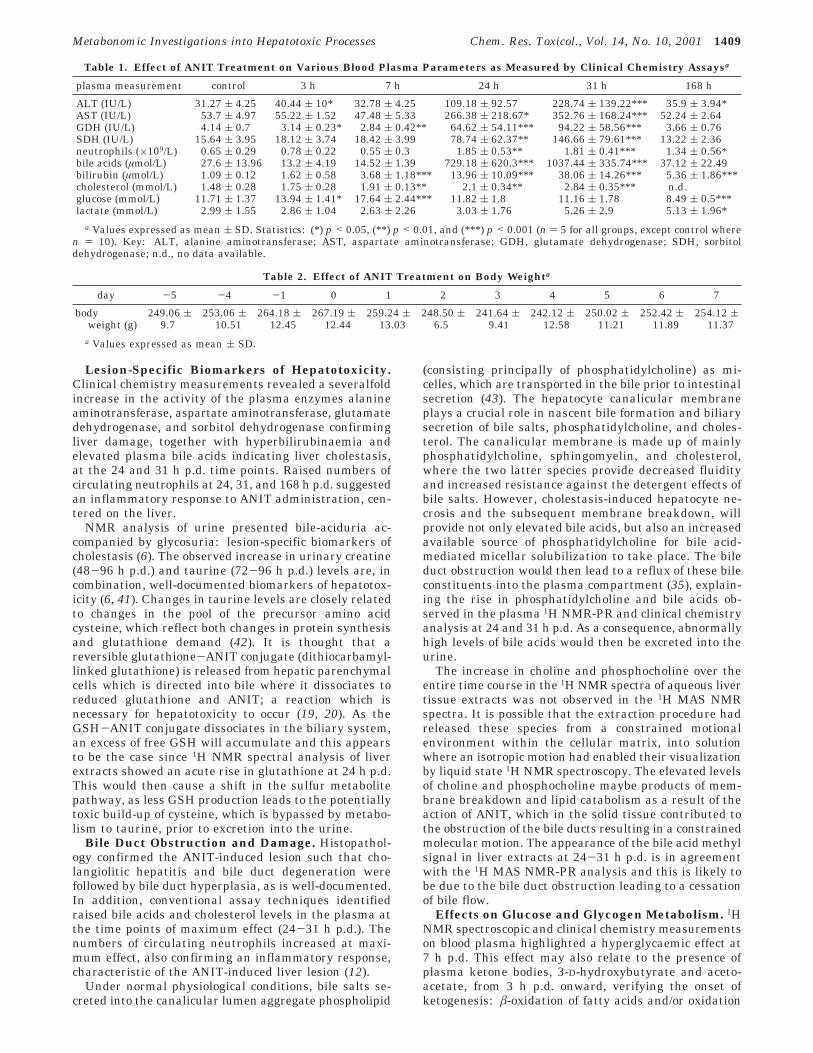
Table 1. Effect of ANIT Treatment on Various Blood Plasma Parameters as Measured by Clinical Chemistry Assaysa
plasma measurement control 3 h 7 h 24 h 31 h 168 h
ALT (IU/L) 31.27 ( 4.25 40.44 ( 10* 32.78 ( 4.25 109.18 ( 92.57 228.74 ( 139.22*** 35.9 ( 3.94*AST (IU/L) 53.7 ( 4.97 55.22 ( 1.52 47.48 ( 5.33 266.38 ( 218.67* 352.76 ( 168.24*** 52.24 ( 2.64GDH (IU/L) 4.14 ( 0.7 3.14 ( 0.23* 2.84 ( 0.42** 64.62 ( 54.11*** 94.22 ( 58.56*** 3.66 ( 0.76SDH (IU/L) 15.64 ( 3.95 18.12 ( 3.74 18.42 ( 3.99 78.74 ( 62.37** 146.66 ( 79.61*** 13.22 ( 2.36neutrophils (×109/L) 0.65 ( 0.29 0.78 ( 0.22 0.55 ( 0.3 1.85 ( 0.53** 1.81 ( 0.41*** 1.34 ( 0.56*bile acids (µmol/L) 27.6 ( 13.96 13.2 ( 4.19 14.52 ( 1.39 729.18 ( 620.3*** 1037.44 ( 335.74*** 37.12 ( 22.49bilirubin (µmol/L) 1.09 ( 0.12 1.62 ( 0.58 3.68 ( 1.18*** 13.96 ( 10.09*** 38.06 ( 14.26*** 5.36 ( 1.86***cholesterol (mmol/L) 1.48 ( 0.28 1.75 ( 0.28 1.91 ( 0.13** 2.1 ( 0.34** 2.84 ( 0.35*** n.d.glucose (mmol/L) 11.71 ( 1.37 13.94 ( 1.41* 17.64 ( 2.44*** 11.82 ( 1.8 11.16 ( 1.78 8.49 ( 0.5***lactate (mmol/L) 2.99 ( 1.55 2.86 ( 1.04 2.63 ( 2.26 3.03 ( 1.76 5.26 ( 2.9 5.13 ( 1.96*
a Values expressed as mean ( SD. Statistics: (*) p < 0.05, (**) p < 0.01, and (***) p < 0.001 (n ) 5 for all groups, except control wheren ) 10). Key: ALT, alanine aminotransferase; AST, aspartate aminotransferase; GDH, glutamate dehydrogenase; SDH, sorbitoldehydrogenase; n.d., no data available.
Table 2. Effect of ANIT Treatment on Body Weighta
day -5 -4 -1 0 1 2 3 4 5 6 7
bodyweight (g)
249.06 (9.7
253.06 (10.51
264.18 (12.45
267.19 (12.44
259.24 (13.03
248.50 (6.5
241.64 (9.41
242.12 (12.58
250.02 (11.21
252.42 (11.89
254.12 (11.37
a Values expressed as mean ( SD.
Metabonomic Investigations into Hepatotoxic Processes Chem. Res. Toxicol., Vol. 14, No. 10, 2001 1409
of the ketogenic amino acids to form acetyl-CoA in theliver and the resultant transport of ketone bodies toperipheral tissues (44). The body weight data show aprogressive loss over the first 4 days after dosing due toreduced food intake, hence causing a shift toward ketonebody metabolism.
The drop in the 1H (MAS)-NMR-detected hepaticconcentrations of R-glucose, â-glucose and glycogen overthe first 31 h p.d., together with the rise in liver and bloodlactate concentration at 24-31 h p.d. implied an in-creased rate of glycogenolysis and glycolysis. The reduc-tion in urinary levels of succinate, citrate, and 2-oxoglu-tarate also confirmed a general increase in energy
metabolism. Studies on isolated rat liver mitochondriasuggest that toxicologically relevant concentrations of bileacids can alter mitochondrial function, initialized bymitochondrial membrane depolarization (45), and thesubsequent perturbations in bioenergetics may lead toaltered excretion of the tricarboxylic acid cycle intermedi-ates.
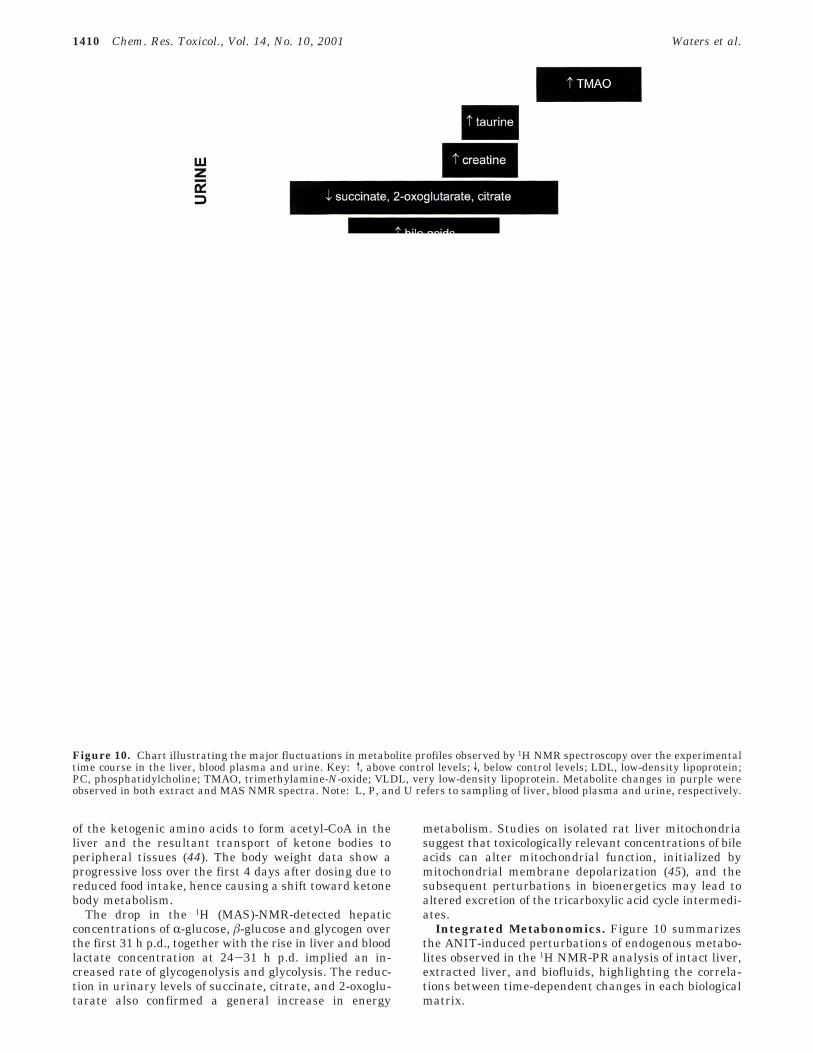
Integrated Metabonomics. Figure 10 summarizesthe ANIT-induced perturbations of endogenous metabo-lites observed in the 1H NMR-PR analysis of intact liver,extracted liver, and biofluids, highlighting the correla-tions between time-dependent changes in each biologicalmatrix.
Figure 10. Chart illustrating the major fluctuations in metabolite profiles observed by 1H NMR spectroscopy over the experimentaltime course in the liver, blood plasma and urine. Key: v, above control levels; V, below control levels; LDL, low-density lipoprotein;PC, phosphatidylcholine; TMAO, trimethylamine-N-oxide; VLDL, very low-density lipoprotein. Metabolite changes in purple wereobserved in both extract and MAS NMR spectra. Note: L, P, and U refers to sampling of liver, blood plasma and urine, respectively.
1410 Chem. Res. Toxicol., Vol. 14, No. 10, 2001 Waters et al.
A 1H MAS NMR spectroscopic and pattern recognitionapproach has enabled the detailed study of biochemicalperturbations in intact liver tissue spectra following ahepatotoxic insult, thereby allowing a direct correlationwith biofluid NMR spectra, histopathological data, andclinical chemistry parameters. The use of these NMR-based metabonomic techniques has allowed the visual-ization of key time periods in the development of a toxicinjury, enabling the identification of lesion-specific, matrix-specific biomarkers, of cholestasis and hepatotoxicity. Thevariety and complexity of the biochemical changes arisingfrom a single dose of the hepatotoxicant over time showsthe importance of the use of multiparametric analyticalapproaches (such as NMR-PR) to the study of toxicepisodes in order to relate biochemical changes to clas-sically accepted pathological end-points.
References(1) Holmes, E., Nicholls, A. W., Lindon, J. C., Connor, S. C., Connelly,
J. C., Haselden, J. N., Damment, S. J. P., Spraul, M., Neidig, P.,and Nicholson, J. K. (2000) Chemometric models for toxicityclassification based on NMR spectra of biofluids. Chem. Res.Toxicol. 13, 471-478.
(2) Griffin, J. L., Walker, L. A., Troke, J., Osborn, D., Shore, R. F.,and Nicholson, J. K. (2000) The initial pathogenesis of cadmiuminduced renal toxicity. FEBS Lett. 478, 147-150.
(3) Nicholls, A. W., Nicholson, J. K., Haselden, J. N., and Waterfield,C. J. (2001) A metabonomic approach to the investigation of drug-induced phospholipidosis: A NMR spectroscopy and patternrecognition study. Biomarkers 5, 410-423.
(4) Garrod, S., Humpfer, E., Connor, S. C., Connelly, J. C., Spraul,M., Nicholson, J. K., and Holmes, E. (2000) High resolution 1HNMR and Magic Angle Spinning NMR spectroscopic investigationof the biochemical effects of 2-bromoethanamine in intact renaland hepatic tissue. Magn. Reson. Med. 45, 781-790.
(5) Holmes, E., Nicholls, A. W., Lindon, J. C., Ramos, S., Spraul, M.,Neidig, P., Connor, S. C., Connelly, J., Damment, S. J. P.,Haselden, J., and Nicholson, J. K. (1998) Development of a modelfor classification of toxin-induced lesions using 1H NMR spec-troscopy of urine combined with pattern recognition. NMRBiomed. 11, 235-244.
(6) Beckwith-Hall, B. M., Nicholson, J. K., Nicholls, A. W., Foxall,P. J. D., Lindon, J. C., Connor, S. C., Abdi, M., Connelly, J., andHolmes, E. (1998) Nuclear magnetic resonance spectroscopic andprincipal components analysis investigations into biochemicaleffects of three model hepatotoxins. Chem. Res. Toxicol. 11, 260-272.
(7) Holmes, E., Bonner, F. W., and Nicholson, J. K. (1995) Compara-tive studies on the nephrotoxicity of 2-bromoethanamine hydro-bromide in the Fischer 344 rat and the multimammate desertmouse (Mastomys natalensis). Arch. Toxicol. 70 (2), 89-95.
(8) Anthony, M. L., Sweatman, B. C., Beddell, C. R., Lindon, J. C.,and Nicholson, J. K. (1994) Pattern recognition classification ofthe site of nephrotoxicity based on metabolic data derived fromproton nuclear magnetic resonance spectra of urine. Mol. Phar-macol. 46, 199-211.
(9) Nicholson, J. K., Higham, D. P., Timbrell, J. A., and Sadler, P. J.(1989) Quantitative high resolution 1H NMR urinalysis studieson the biochemical effects of cadmium in the rat. Mol. Pharmacol.36, 398-404.
(10) Gartland, K. P. R., Bonner, F. W., and Nicholson, J. K. (1989)Investigations into the biochemical effects of region-specificnephrotoxins. Mol. Pharmacol. 35, 242-250.
(11) Nicholson, J. K., Lindon, J. C., and Holmes, E. (1999) ‘Metabo-nomics’: understanding the metabolic responses of living systemsto pathophysiological stimuli via multivariate statistical analysisof biological NMR spectroscopic data. Xenobiotica. 29, 1181-1189.
(12) Goldfarb, S., Singer, E. J., and Popper, H. (1962) Experimentalcholangitis due to alpha-naphthylisothiocyanate (ANIT). Am. J.Pathol. 40, 685-698.
(13) Zimmerman, H. J. (1978) Drug-induced liver disease. Drugs 16,25-45.
(14) Plaa, G. L., and Priestly, B. G. (1976) Intrahepatic cholestasisinduced by drugs and chemicals. Pharmacol. Rev. 28, 207-273.
(15) Kosser, D. C., Meunier, P. C., Dulik, D. M., Leonard, T. B., andGoldstein, R. S. (1998) Bile duct obstruction is not a prerequisitefor Type 1 biliary epithelial cell hyperplasia. Toxicol. Appl.Pharmacol. 152, 327-338.
(16) Dahm, L. J., Schultze, A. E., and Roth, R. A. (1991) An antibodyto neutrophils attenuates R-naphthylisothiocyanate induced liverinjury. J. Pharmacol. Exp. Ther. 256, 412-420.
(17) Bailie, M. B., Pearson, J. M., Lappin, P. B., Killam, A. L., andRoth, R. A. (1994) Platelets and R-naphthylisothiocyanate-inducedliver injury. Toxicol. Appl. Pharmacol. 129, 207-213.
(18) Hill, D. A., and Roth, R. A. (1998) R-Naphthylisothiocyanatecauses neutrophils to release factors that are cytotoxic to hepa-tocytes. Toxicol. Appl. Pharmacol. 148, 169-175.
(19) Jean, P. A., Bailie, M. B., and Roth, R. A. (1995) 1-naphthyl-isothiocyanate-induced elevation of biliary glutathione. Biochem.Pharmacol. 49, 197-202.
(20) Jean, P. A., and Roth, R. A. (1995) Naphthylisothiocyanatedisposition in bile and its relationship to liver glutathione andtoxicity. Biochem. Pharmacol. 50, 1469-1474.
(21) Andrew, E. R., and Eades, R. G. (1959) Removal of dipolarbroadening of NMR spectra of solids by specimen rotation. Nature183, 1802.
(22) Humpfer, E., Spraul, M., Nicholls, A. W., Nicholson, J. K., andLindon, J. C. (1997) Direct observation of resolved intracellularand extracellular water signals in intact human red blood cellsusing 1H MAS NMR spectroscopy. Magn. Reson. Med. 38, 334-336.
(23) Waters, N. J., Garrod, S., Farrant, R. D., Haselden, J. N., Connor,S. C., Connelly, J., Lindon, J. C., Holmes, E., and Nicholson, J.K. (2000) High-resolution magic angle spinning 1H NMR spec-troscopy of intact liver and kidney: Optimisation of samplepreparation procedures and biochemical stability of tissue duringspectral acquisition. Anal. Biochem. 282, 16-23.
(24) Millis, K. K., Maas, W. E., Cory, D. G., and Singer, S. (1997)Gradient high-resolution magic angle spinning NMR spectroscopyof human adipocyte tissue. Magn. Reson. Med. 38, 399-403.
(25) Tomlins, A. M., Foxall, P. J. D., Lindon, J. C., Lynch, M. J., Spraul,M., Everett, J. R., and Nicholson, J. K. (1998) High-resolutionmagic angle spinning 1H NMR analysis of intact prostatichyperplastic and tumour tissues. Anal. Commun. 35, 113-115.
(26) Cheng, L. L., Ma, M. J., Becerra, L., Ptak, T., Tracey, I., Lackner,A., and Gonzalez, R. G. (1997) Quantitative neuropathology byhigh-resolution magic angle spinning proton magnetic resonancespectroscopy. Proc. Natl. Acad. Sci. U.S.A. 94, 6408-6413.
(27) Farrant, R. D., Lindon, J. C., and Nicholson, J. K. (1994) Internaltemperature calibration for 1H NMR spectroscopy of blood plasmaand other biofluids. NMR Biomed. 7, 243-247.
(28) Holmes, E., Foxall, P. J. D., Nicholson, J. K., Neild, G. H., Brown,S. M., Beddell, C. R., Sweatman, B. C., Rahr, E., Lindon, J. C.,Spraul, M., and Neidig, P. (1994) Automatic data reduction andpattern recognition methods for analysis of 1H nuclear magneticresonance spectra of human urine from normal and pathologicalstates. Anal. Biochem. 220, 284-296.
(29) Beebe, K. R., Pell, R. J., and Seahsholt, M. B. (1998) Chemomet-rics: A practical guide, John Wiley & Sons, New York.
(30) Nicholson, J. K., Foxall, P. J. D., Spraul, M., Farrant, R. D., andLindon, J. C. (1995) 750 MHz 1H and 1H-13C NMR spectroscopyof human blood plasma. Anal. Chem. 67 (5), 793-811.
(31) Chisholm, J. W., Torchia, E. C., Nation, P., Dolphin, P. J., andAgellon, L. B. (1997) Disruption of lipid homeostasis in micetreated with R-naphthylisothiocyanate (ANIT). Hepatology 26 (4),1456.
(32) Benz, C., Angermuller, S., Tox, U., Kloters-Plachky, P., Riedel,H.-D., Sauer, P., Stremmel, W., and Stiehl, A. (1998) Effect oftauroursodeoxycholic acid on bile-acid-induced apoptosis andcytolysis in rat hepatocytes. J. Hepatol. 28, 99-106.
(33) Greim, H., Trulzsch, D., Czygan, P., Rudick, J., Hutterer, F., andSchaffner, F. (1972) Mechanisms of cholestasis. 6. Bile acids inhuman livers with and without biliary obstruction. Gastroenterol-ogy 63, 837-45.
(34) Timbrell, J. A. (1991) Principles of Biochemical Toxicology, Taylor& Francis, London.
(35) Chisholm, J. W., and Dolphin, P. J. (1996) Abnormal lipoproteinsin the ANIT-treated rat: A transient and reversible animal modelof intrahepatic cholestasis. J. Lipid Res. 37, 1086-1098.
(36) Mitamura, T. (1984) Alterations of high-density lipoproteins inexperimental intrahepatic cholestasis in the rat induced byadministration of R-naphthylisothiocyanate. J. Biochem. 95, 29-36.
(37) Felker, T. E., Hamilton, R. L., Vigne, J., and Havel, R. J. (1982)Properties of lipoproteins in blood plasma and liver perfusates ofrats with cholestasis. Gastroenterology 83, 652-663.
(38) Tjoa, S., and Fennessey, P. (1991) The identification of trimethyl-amine excess in man: Quantitative analysis and biochemicalorigins. Anal. Biochem. 197, 77-82.
(39) Zeisel, S. H., Gettner, S., and Youssef, M. (1989) Formation ofaliphatic amine precursors of N-nitrosodimethylamine after oral
Metabonomic Investigations into Hepatotoxic Processes Chem. Res. Toxicol., Vol. 14, No. 10, 2001 1411
administration of choline analogues in the rat. Food Chem.Toxicol. 27, 31-34.
(40) Smith, J. L., Wishnok, J. S., and Deen, W. M. (1994) Metabolismand excretion of methylamines in rats. Toxicol. Appl. Pharmacol.125, 296-308.
(41) Waterfield, C. J., Turton, J. A., Scales, M. D. C., and Timbrell, J.A. (1993) Investigations into the effects of various hepatotoxiccompounds on urinary and liver taurine levels in rats. Arch.Toxicol. 67, 244-254.
(42) Timbrell, J. A., Waterfield, C. J., and Draper, R. P. (1995) Use ofurinary taurine and creatine as biomarkers of organ dysfunctionand metabolic perturbations. Comput. Haematol. Int. 5, 112-119.
(43) Eckhardt, E. R. M., Moschetta, A., Renooij, W., Goerdayal, S. S.,vanBergeHenegouwen, G. P., and vanErpecum, K. J. (1999)Asymmetric distribution of phosphatidylcholine and sphingo-myelin between micellar and vesicular phases: potential implica-tions for canalicular bile formation. J. Lipid Res. 40, 2022-2033.
(44) Voet, D., and Voet, J. G. (1995) Biochemistry, John Wiley &Sons: New York.
(45) Rolo, A. P., Oliveira, P. J., Moreno, A. J. M., and Palmeira, C. M.(2000) Bile acids affect liver mitochondrial bioenergetics: possiblerelevance for cholestasis therapy. Toxicol. Sci. 57, 177-185.
TX010067F
1412 Chem. Res. Toxicol., Vol. 14, No. 10, 2001 Waters et al.