
Negotiating the “Relevant” in Culturally Relevant Mathematics
Icarus 243 (2014) 420–428
Contents lists available at ScienceDirect
Icarus
journal homepage: www.elsevier .com/ locate/ icarus
Comment
Deliquescence and efflorescence of calcium perchlorate: An investigationof stable aqueous solutions relevant to Mars
http://dx.doi.org/10.1016/j.icarus.2014.08.0360019-1035/� 2014 Elsevier Inc. All rights reserved.
⇑ Corresponding author. Address: Jet Propulsion Laboratory, Pasadena, CA 91106,United States.
E-mail address: [email protected] (D.L. Nuding).
D.L. Nuding a,b,⇑, E.G. Rivera-Valentin c, R.D. Davis a,d, R.V. Gough a,d, V.F. Chevrier e, M.A. Tolbert a,d
a Cooperative Institute for Research in Environmental Sciences, University of Colorado, Boulder, CO 80309, United Statesb Department of Atmospheric and Oceanic Sciences, University of Colorado, Boulder, CO 80309, United Statesc Arecibo Observatory (USRA), National Astronomy and Ionosphere Center, Arecibo, PR 00612d Department of Chemistry and Biochemistry, University of Colorado, Boulder, CO 80309, United Statese W.M. Keck Laboratory for Space and Planetary Simulation, Arkansas Center for Space and Planetary Science, University of Arkansas, Fayetteville, AR 72701, United States
a r t i c l e i n f o
Article history:Received 30 January 2014Revised 3 July 2014Accepted 20 August 2014Available online 27 August 2014
Keywords:MarsMars, surfaceSpectroscopy
a b s t r a c t
Calcium perchlorate (Ca(ClO4)2) is a highly deliquescent salt that may exist on the surface of present-dayMars; however, its water uptake properties have not been well characterized at temperatures and rela-tive humidity conditions relevant to Mars. Here, we quantify the deliquescent relative humidity (DRH)and efflorescent relative humidity (ERH) of Ca(ClO4)2 as a function of temperature (223–273 K) to eluci-date its behavior on the surface of Mars. A Raman microscope equipped with an environmental cell wasused to simulate Mars relevant temperature and relative humidity conditions and monitor deliquescence(solid to aqueous) and efflorescence (aqueous to solid) phase transitions of Ca(ClO4)2. Deliquescence andefflorescence were monitored visually using optical images and spectroscopically using Raman micros-copy. We find that there is a wide range of deliquescence RH values between 5% and 55% RH. This rangeis due to the formation of hydrates in different temperatures regimes, with the higher DRH values occur-ring at the lowest temperatures. Experimental deliquescence results were compared to a thermodynamicmodel for three hydration states of Ca(ClO4)2. The model predicts that the higher hydration states deli-quesce at a higher RH than the lower hydration states. Calcium perchlorate was found to supersaturate,with lower ERH values than DRH values. The ERH results were less dependent on temperature with anaverage 15 ± 4%, but values as low as 3 ± 2% were measured at 273 K. Levitation experiments were per-formed on single particles of Ca(ClO4)2 and Mg(ClO4)2 at 298 K. While efflorescence was observed around15% RH for Mg(ClO4)2, the efflorescence of Ca(ClO4)2 was not observed, even when exposed to 1% RH at298 K. Additionally, a 17-h experiment was conducted to simulate a martian subsurface diurnal cycle.This demonstrated Ca(ClO4)2 aqueous solutions can persist without efflorescing for the majority of a mar-tian sol, up to 17 h under Mars temperature heating rates and RH conditions. We find that Ca(ClO4)2
aqueous solutions could persist for most of the martian sol under present-day conditions. The aqueousphase stability and metastability quantified for Ca(ClO4)2 under Mars relevant temperature and relativehumidity conditions has important implications for the water cycle and the stability of liquid water onpresent day Mars.
� 2014 Elsevier Inc. All rights reserved.
1. Introduction
One of the most unexpected discoveries made by the Phoenix Lander in themartian arctic plains was the presence of 0.5% by weight perchlorate (ClO�4 ) withthe Wet Chemistry Laboratory (WCL) (Hecht et al., 2009; Cull et al., 2010). Perchlo-rate was also confirmed with the Thermal and Evolved Gas Analyzer (TEGA), whichheated martian soil samples and detected evolved oxygen gas (O2) at the thermaldecomposition temperatures expected for alkali or alkaline Earth perchlorates
(Hecht et al., 2009). Reanalysis of the Viking gas chromatography-mass spectrome-try results also suggest perchlorates were present in the soil (Navarro-Gonzálezet al., 2010). Additionally, the Mars Science Laboratory (MSL) rover has potentiallyfound perchlorate at Gale Crater (Glavin et al., 2013; Leshin et al., 2013; Ming et al.,2014).
The presence of perchlorate is important because of its impact on the soil’s abil-ity to retain water, thus influencing the water cycle and potential habitability ofMars. Perchlorate salts are known to readily absorb water vapor from the atmo-sphere and deliquesce (crystalline solid to aqueous solution) into aqueous solutions(Chevrier et al., 2009; Zorzano et al., 2009; Gough et al., 2011). Perchlorates, likemost salts, also tend to remain in a supersaturated aqueous phase instead of efflo-rescing (aqueous solution to crystalline solid) back into a solid crystal (Wills et al.,2009; Gough et al., 2011). When the solutions persist below the RH where deliques-
Comment / Icarus 243 (2014) 420–428 421
cence is observed, a metastable state is achieved. A metastable state is one that isnot an energetic minimum, but can persist for some time due to kinetic limitations.This hysteresis behavior allows liquid brine solutions to exist at low relative humid-ity (RH) values, relevant to the martian day. Understanding the deliquescent andefflorescent properties of perchlorates under martian temperature and RH condi-tions can give insights into present-day water activity on Mars.
Previously, we performed laboratory studies to investigate the deliquescenceand efflorescence of two perchlorate salts at low temperatures. These studiesshowed that sodium perchlorate (NaClO4) and magnesium perchlorate (Mg(ClO4)2)are highly deliquescent, forming aqueous solutions at humidity values as low as40% RH at temperatures as low as 223 K (Gough et al., 2011), which were conditionsobserved at the Phoenix landing site (Zent et al., 2010). A significant hysteresis wasobserved during efflorescence of these salt solutions, as expected, due to the kineticinhibition of crystal nucleation. The efflorescence RH values of sodium and magne-sium perchlorate solutions were found to be 13% RH and 19% RH, respectively, indi-cating that perchlorate salts could exist as stable or metastable aqueous solutionsover a wide range of martian RH and temperature conditions (Gough et al., 2011).
Although the low temperature deliquescence and efflorescence of sodium andmagnesium perchlorate salts has been characterized, instruments onboard Phoenixand MSL have identified calcium perchlorate (Ca(ClO4)2) as the likely parent salt(Cull et al., 2010; Glavin et al., 2013; Kounaves et al., 2014). Calcium and magne-sium chlorate may also be present at the MSL landing site (Glavin et al., 2013;Leshin et al., 2013; Ming et al., 2014), but the highly deliquescent properties andlow eutectic point of Ca(ClO4)2 (Pestova et al., 2005) motivated the investigationof Ca(ClO4)2. The deliquescence and efflorescence behavior of Ca(ClO4)2 have notyet been quantified as a function of temperature. Here, we report experimentallydetermined deliquescence and efflorescence relative humidity values of Ca(ClO4)2
as a function of temperature utilizing Raman microscopy. Results are also presentedfor efflorescence of levitated Ca(ClO4)2 and Mg(ClO4)2 particles at room tempera-ture. The experimental DRH and ERH results are then plotted on a theoreticalCa(ClO4)2 thermodynamic stability diagram to demonstrate where stable and meta-stable aqueous solutions persist. Results are compared to modeled surface and sub-surface temperature and RH environments at the Viking and Phoenix landing sites,respectively, to assess martian conditions where an aqueous Ca(ClO4)2 solutioncould persist. Finally, a diurnal cycle experiment was performed to simulate themartian subsurface temperature and RH environment to further investigate thephase state of Ca(ClO4)2 in Mars relevant conditions.
2. Experimental setup
2.1. Raman and optical methods, materials
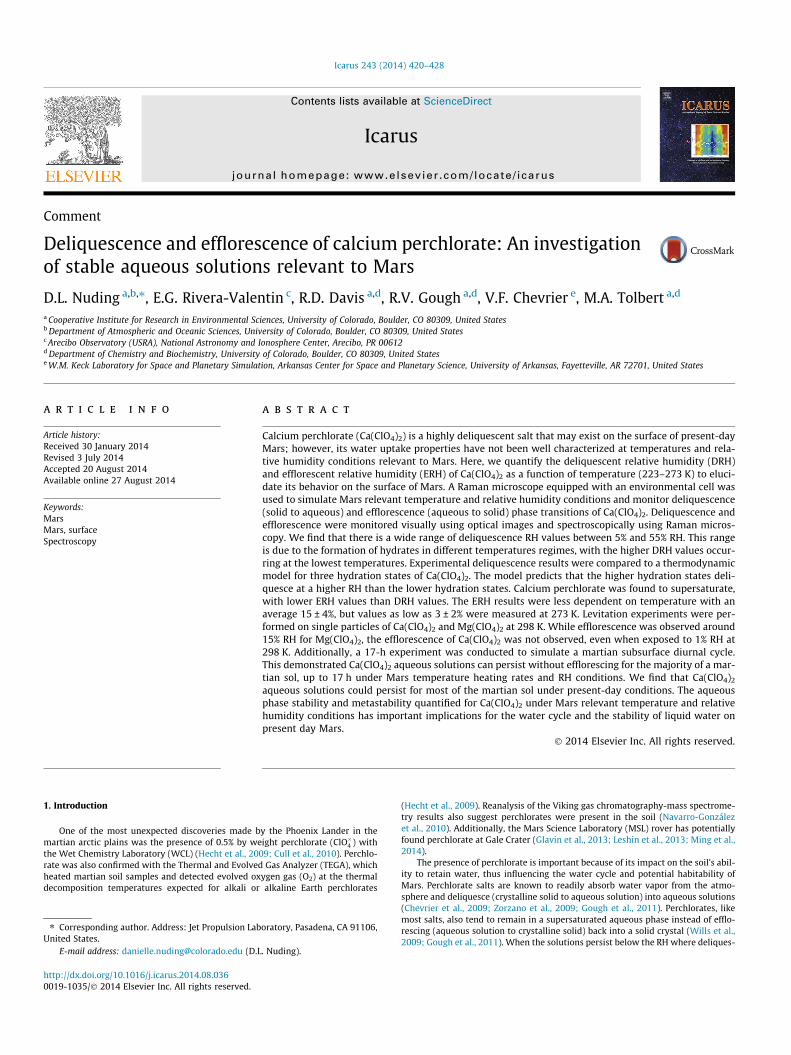
To characterize the deliquescence and efflorescence of Ca(ClO4)2, changes in saltphase and hydration state were studied using a combination of Raman and opticalmicroscopy. The instrument setup used in this study is described in detail inBaustian et al. (2010), Gough et al. (2011) and shown in Fig. 1. A Raman microscopeequipped with an environmental cell was used to determine the deliquescence rel-ative humidity (DRH) and efflorescence relative humidity (ERH) as a function oftemperature (223–273 K). Specifically, a Nicolet Almega XR Dispersive Raman spec-
Fig. 1. A schematic of the Raman microscope eq
trometer was outfitted with a Linkam THMS600 environmental cell, a Linkam auto-mated temperature controller, and a Buck Research chilled-mirror hygrometer.
Ca(ClO4)2 � 4H2O was purchased from Sigma Aldrich (99% purity). A calciumperchlorate solution (1% by weight) was nebulized using high purity nitrogen anddroplets were deposited onto a hydrophobic quartz disk that was placed directlyon a silver block in the environmental cell. The temperature of the silver blockwas controlled by a combination of cooling using a continuous flow of liquid nitro-gen and resistive heating. Particle size diameters ranged from 1–40 lm.
Initially, high purity dry N2 (99.9% purity) continuously flowed through the cellto ensure a dry environment with RH <1%. The RH in the cell was controlled by com-bining a separate stream of N2 passed through a H2O vapor bubbler before connect-ing to the dry flow. After passing through the cell, the flow was directed to a frostpoint hygrometer for measurement of water vapor. Frost point measurements, spe-cifically dewpoint, from the hygrometer and sample temperature measurementsfrom the platinum resistance sensor allow determination of RH with respect tothe sample. A diaphragm pump pulling at a rate of 1 L/min was attached to the out-let of the hygrometer to ensure a constant airflow through the cell regardless of anyvariability in flow rate through the H2O vapor bubbler. For experiments above253 K, H2O vapor was increased or decreased stepwise (at intervals less than orequal to 1% RH) while temperature was held constant. For experiments below253 K, temperature was varied while holding H2O partial pressure constant. Thisprocess allowed for fine tuned RH control at lower temperatures. RH was variedslowly (61% RH/min) and then held at each value for several minutes until the va-por flow through the cell was constant (for step-wise experiments) and the Ramanspectra of the individual particles did not change. The estimated uncertainty in theDRH and ERH values due to the accuracy of the instrumental apparatus is ±1% RH.Uncertainty in the experimental data due to reproducibility of results is larger (±1–5% RH). Error is reported as the standard deviation of multiple measurements withat least three experiments per data point.
2.2. Particle levitation experiments
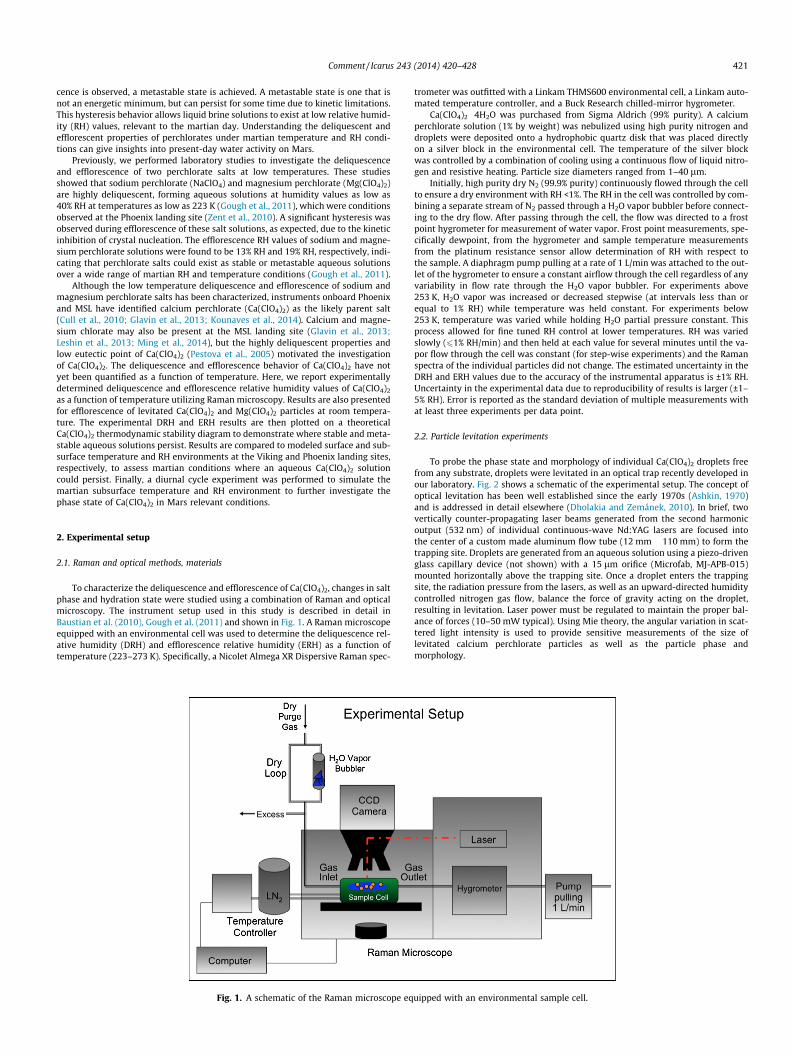
To probe the phase state and morphology of individual Ca(ClO4)2 droplets freefrom any substrate, droplets were levitated in an optical trap recently developed inour laboratory. Fig. 2 shows a schematic of the experimental setup. The concept ofoptical levitation has been well established since the early 1970s (Ashkin, 1970)and is addressed in detail elsewhere (Dholakia and Zemánek, 2010). In brief, twovertically counter-propagating laser beams generated from the second harmonicoutput (532 nm) of individual continuous-wave Nd:YAG lasers are focused intothe center of a custom made aluminum flow tube (12 mm � 110 mm) to form thetrapping site. Droplets are generated from an aqueous solution using a piezo-drivenglass capillary device (not shown) with a 15 lm orifice (Microfab, MJ-APB-015)mounted horizontally above the trapping site. Once a droplet enters the trappingsite, the radiation pressure from the lasers, as well as an upward-directed humiditycontrolled nitrogen gas flow, balance the force of gravity acting on the droplet,resulting in levitation. Laser power must be regulated to maintain the proper bal-ance of forces (10–50 mW typical). Using Mie theory, the angular variation in scat-tered light intensity is used to provide sensitive measurements of the size oflevitated calcium perchlorate particles as well as the particle phase andmorphology.
uipped with an environmental sample cell.
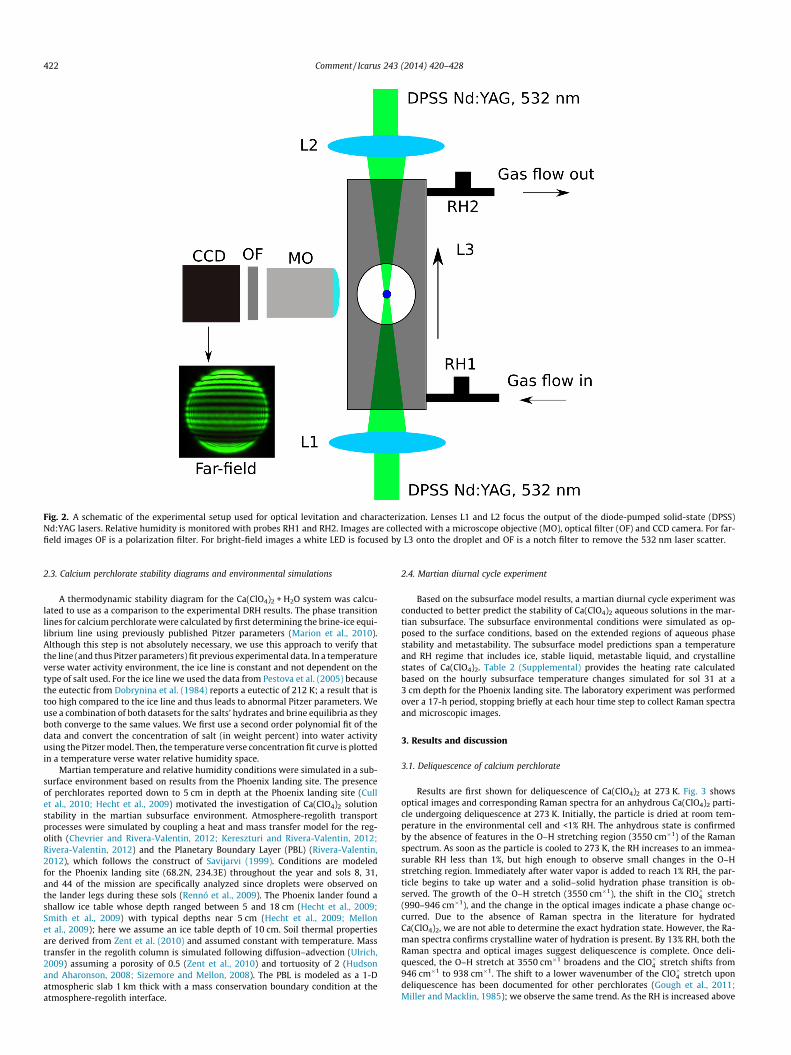
Fig. 2. A schematic of the experimental setup used for optical levitation and characterization. Lenses L1 and L2 focus the output of the diode-pumped solid-state (DPSS)Nd:YAG lasers. Relative humidity is monitored with probes RH1 and RH2. Images are collected with a microscope objective (MO), optical filter (OF) and CCD camera. For far-field images OF is a polarization filter. For bright-field images a white LED is focused by L3 onto the droplet and OF is a notch filter to remove the 532 nm laser scatter.
422 Comment / Icarus 243 (2014) 420–428
2.3. Calcium perchlorate stability diagrams and environmental simulations
A thermodynamic stability diagram for the Ca(ClO4)2 + H2O system was calcu-lated to use as a comparison to the experimental DRH results. The phase transitionlines for calcium perchlorate were calculated by first determining the brine-ice equi-librium line using previously published Pitzer parameters (Marion et al., 2010).Although this step is not absolutely necessary, we use this approach to verify thatthe line (and thus Pitzer parameters) fit previous experimental data. In a temperatureverse water activity environment, the ice line is constant and not dependent on thetype of salt used. For the ice line we used the data from Pestova et al. (2005) becausethe eutectic from Dobrynina et al. (1984) reports a eutectic of 212 K; a result that istoo high compared to the ice line and thus leads to abnormal Pitzer parameters. Weuse a combination of both datasets for the salts’ hydrates and brine equilibria as theyboth converge to the same values. We first use a second order polynomial fit of thedata and convert the concentration of salt (in weight percent) into water activityusing the Pitzer model. Then, the temperature verse concentration fit curve is plottedin a temperature verse water relative humidity space.
Martian temperature and relative humidity conditions were simulated in a sub-surface environment based on results from the Phoenix landing site. The presenceof perchlorates reported down to 5 cm in depth at the Phoenix landing site (Cullet al., 2010; Hecht et al., 2009) motivated the investigation of Ca(ClO4)2 solutionstability in the martian subsurface environment. Atmosphere-regolith transportprocesses were simulated by coupling a heat and mass transfer model for the reg-olith (Chevrier and Rivera-Valentin, 2012; Kereszturi and Rivera-Valentin, 2012;Rivera-Valentin, 2012) and the Planetary Boundary Layer (PBL) (Rivera-Valentin,2012), which follows the construct of Savijarvi (1999). Conditions are modeledfor the Phoenix landing site (68.2N, 234.3E) throughout the year and sols 8, 31,and 44 of the mission are specifically analyzed since droplets were observed onthe lander legs during these sols (Rennó et al., 2009). The Phoenix lander found ashallow ice table whose depth ranged between 5 and 18 cm (Hecht et al., 2009;Smith et al., 2009) with typical depths near 5 cm (Hecht et al., 2009; Mellonet al., 2009); here we assume an ice table depth of 10 cm. Soil thermal propertiesare derived from Zent et al. (2010) and assumed constant with temperature. Masstransfer in the regolith column is simulated following diffusion–advection (Ulrich,2009) assuming a porosity of 0.5 (Zent et al., 2010) and tortuosity of 2 (Hudsonand Aharonson, 2008; Sizemore and Mellon, 2008). The PBL is modeled as a 1-Datmospheric slab 1 km thick with a mass conservation boundary condition at theatmosphere-regolith interface.
2.4. Martian diurnal cycle experiment
Based on the subsurface model results, a martian diurnal cycle experiment wasconducted to better predict the stability of Ca(ClO4)2 aqueous solutions in the mar-tian subsurface. The subsurface environmental conditions were simulated as op-posed to the surface conditions, based on the extended regions of aqueous phasestability and metastability. The subsurface model predictions span a temperatureand RH regime that includes ice, stable liquid, metastable liquid, and crystallinestates of Ca(ClO4)2. Table 2 (Supplemental) provides the heating rate calculatedbased on the hourly subsurface temperature changes simulated for sol 31 at a3 cm depth for the Phoenix landing site. The laboratory experiment was performedover a 17-h period, stopping briefly at each hour time step to collect Raman spectraand microscopic images.
3. Results and discussion
3.1. Deliquescence of calcium perchlorate
Results are first shown for deliquescence of Ca(ClO4)2 at 273 K. Fig. 3 showsoptical images and corresponding Raman spectra for an anhydrous Ca(ClO4)2 parti-cle undergoing deliquescence at 273 K. Initially, the particle is dried at room tem-perature in the environmental cell and <1% RH. The anhydrous state is confirmedby the absence of features in the O–H stretching region (3550 cm�1) of the Ramanspectrum. As soon as the particle is cooled to 273 K, the RH increases to an immea-surable RH less than 1%, but high enough to observe small changes in the O–Hstretching region. Immediately after water vapor is added to reach 1% RH, the par-ticle begins to take up water and a solid–solid hydration phase transition is ob-served. The growth of the O–H stretch (3550 cm�1), the shift in the ClO�4 stretch(990–946 cm�1), and the change in the optical images indicate a phase change oc-curred. Due to the absence of Raman spectra in the literature for hydratedCa(ClO4)2, we are not able to determine the exact hydration state. However, the Ra-man spectra confirms crystalline water of hydration is present. By 13% RH, both theRaman spectra and optical images suggest deliquescence is complete. Once deli-quesced, the O–H stretch at 3550 cm�1 broadens and the ClO�4 stretch shifts from946 cm�1 to 938 cm�1. The shift to a lower wavenumber of the ClO�4 stretch upondeliquescence has been documented for other perchlorates (Gough et al., 2011;Miller and Macklin, 1985); we observe the same trend. As the RH is increased above
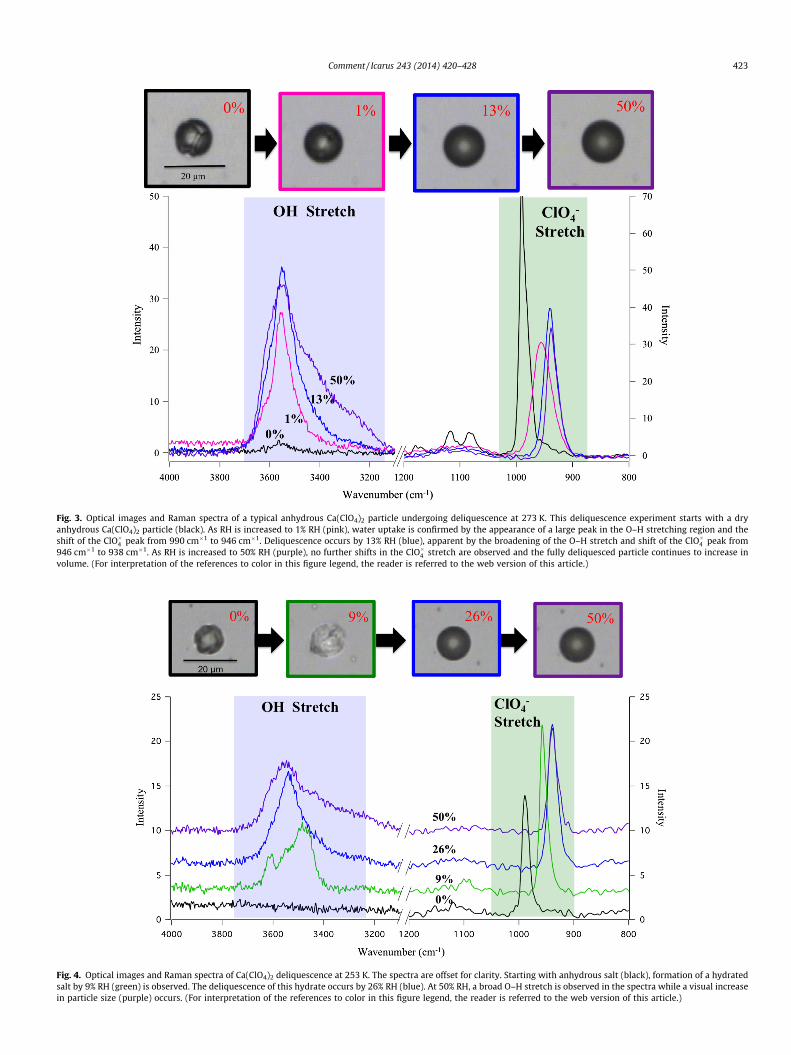
Fig. 3. Optical images and Raman spectra of a typical anhydrous Ca(ClO4)2 particle undergoing deliquescence at 273 K. This deliquescence experiment starts with a dryanhydrous Ca(ClO4)2 particle (black). As RH is increased to 1% RH (pink), water uptake is confirmed by the appearance of a large peak in the O–H stretching region and theshift of the ClO�4 peak from 990 cm�1 to 946 cm�1. Deliquescence occurs by 13% RH (blue), apparent by the broadening of the O–H stretch and shift of the ClO�4 peak from946 cm�1 to 938 cm�1. As RH is increased to 50% RH (purple), no further shifts in the ClO�4 stretch are observed and the fully deliquesced particle continues to increase involume. (For interpretation of the references to color in this figure legend, the reader is referred to the web version of this article.)
Fig. 4. Optical images and Raman spectra of Ca(ClO4)2 deliquescence at 253 K. The spectra are offset for clarity. Starting with anhydrous salt (black), formation of a hydratedsalt by 9% RH (green) is observed. The deliquescence of this hydrate occurs by 26% RH (blue). At 50% RH, a broad O–H stretch is observed in the spectra while a visual increasein particle size (purple) occurs. (For interpretation of the references to color in this figure legend, the reader is referred to the web version of this article.)
Comment / Icarus 243 (2014) 420–428 423
424 Comment / Icarus 243 (2014) 420–428
the DRH value, the O–H stretch increases in height and width as the particle absorbsadditional liquid water, as demonstrated by the spectra in Fig. 3. The ClO�4 stretchremains at 938 cm�1, suggesting that deliquescence is complete. After deliques-cence, the optical images show the particle increases in volume as RH is increased.
Deliquescence of Ca(ClO4)2 was also studied at low temperatures. Fig. 4 demon-strates a typical deliquescence experiment at 253 K. This experiment began with ananhydrous Ca(ClO4)2 crystal particle at 253 K. The optical image shows a salt crystaland the Raman spectrum indicates that no H2O of any phase is present. As RH is in-creased, spectral and visual changes suggest that a hydrated salt forms by 9% RH. Incontrast to cases at 273 K, different sharp features indicative of crystalline water ina hydrate appear in the Raman spectra in the O–H stretch region (3500 cm�1). Thereis also a peak shift from 990 cm�1 to 958 cm�1 in the ClO�4 stretch region. The dif-ference in the spectral features may suggest a different hydrate formed. Lower tem-peratures typically correlate to the formation of a more hydrated crystalline particleand a similar trend is observed with other salts (Wise et al., 2012). In addition, theoptical microscope images show a highly scattering crystalline particle not seen at273 K. Alternatively, the hydrate may be the same as the 273 K cases with the dif-ference in spectral and optical features explained by temperature dependence. By26% RH, optical images suggest deliquescence into an aqueous solution. The O–Hstretching feature broadens and the ClO�4 stretch shifts to 938 cm�1, confirmingthe deliquescence phase change. The same deliquescence behavior is observed attemperatures down to 223 K.
3.2. Efflorescence of calcium perchlorate
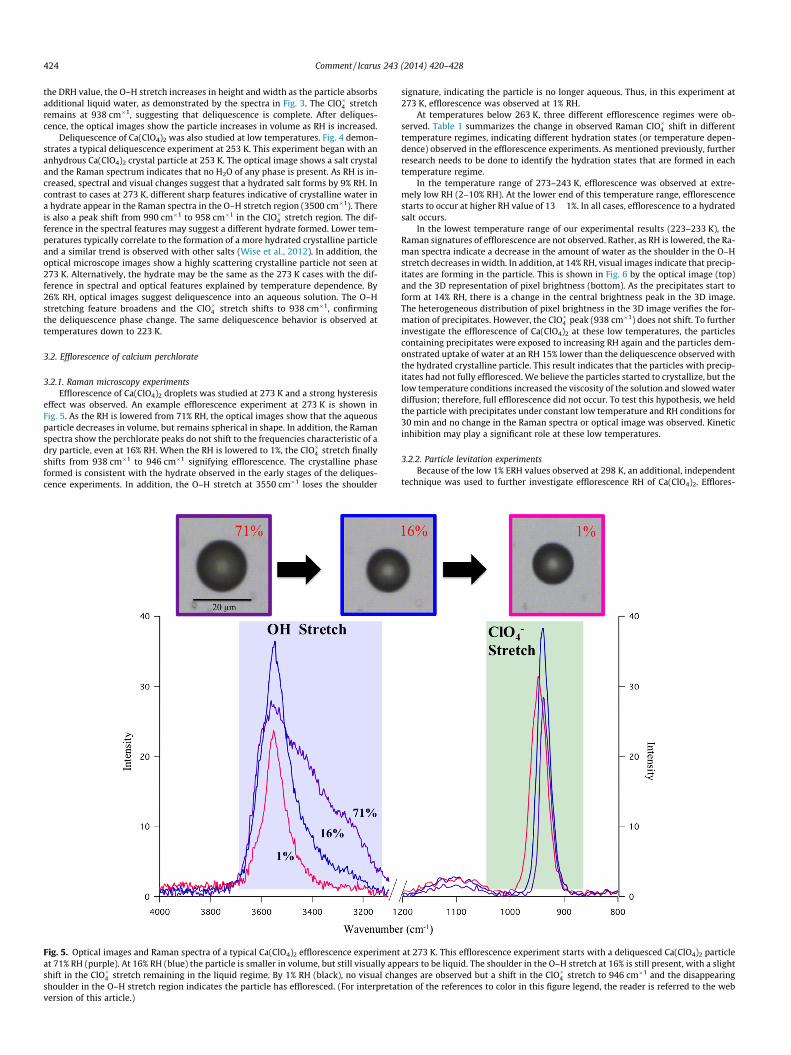
3.2.1. Raman microscopy experimentsEfflorescence of Ca(ClO4)2 droplets was studied at 273 K and a strong hysteresis
effect was observed. An example efflorescence experiment at 273 K is shown inFig. 5. As the RH is lowered from 71% RH, the optical images show that the aqueousparticle decreases in volume, but remains spherical in shape. In addition, the Ramanspectra show the perchlorate peaks do not shift to the frequencies characteristic of adry particle, even at 16% RH. When the RH is lowered to 1%, the ClO�4 stretch finallyshifts from 938 cm�1 to 946 cm�1 signifying efflorescence. The crystalline phaseformed is consistent with the hydrate observed in the early stages of the deliques-cence experiments. In addition, the O–H stretch at 3550 cm�1 loses the shoulder
Fig. 5. Optical images and Raman spectra of a typical Ca(ClO4)2 efflorescence experimentat 71% RH (purple). At 16% RH (blue) the particle is smaller in volume, but still visually appshift in the ClO�4 stretch remaining in the liquid regime. By 1% RH (black), no visual chashoulder in the O–H stretch region indicates the particle has effloresced. (For interpretatversion of this article.)
signature, indicating the particle is no longer aqueous. Thus, in this experiment at273 K, efflorescence was observed at 1% RH.
At temperatures below 263 K, three different efflorescence regimes were ob-served. Table 1 summarizes the change in observed Raman ClO�4 shift in differenttemperature regimes, indicating different hydration states (or temperature depen-dence) observed in the efflorescence experiments. As mentioned previously, furtherresearch needs to be done to identify the hydration states that are formed in eachtemperature regime.
In the temperature range of 273–243 K, efflorescence was observed at extre-mely low RH (2–10% RH). At the lower end of this temperature range, efflorescencestarts to occur at higher RH value of 13 � 1%. In all cases, efflorescence to a hydratedsalt occurs.
In the lowest temperature range of our experimental results (223–233 K), theRaman signatures of efflorescence are not observed. Rather, as RH is lowered, the Ra-man spectra indicate a decrease in the amount of water as the shoulder in the O–Hstretch decreases in width. In addition, at 14% RH, visual images indicate that precip-itates are forming in the particle. This is shown in Fig. 6 by the optical image (top)and the 3D representation of pixel brightness (bottom). As the precipitates start toform at 14% RH, there is a change in the central brightness peak in the 3D image.The heterogeneous distribution of pixel brightness in the 3D image verifies the for-mation of precipitates. However, the ClO�4 peak (938 cm�1) does not shift. To furtherinvestigate the efflorescence of Ca(ClO4)2 at these low temperatures, the particlescontaining precipitates were exposed to increasing RH again and the particles dem-onstrated uptake of water at an RH 15% lower than the deliquescence observed withthe hydrated crystalline particle. This result indicates that the particles with precip-itates had not fully effloresced. We believe the particles started to crystallize, but thelow temperature conditions increased the viscosity of the solution and slowed waterdiffusion; therefore, full efflorescence did not occur. To test this hypothesis, we heldthe particle with precipitates under constant low temperature and RH conditions for30 min and no change in the Raman spectra or optical image was observed. Kineticinhibition may play a significant role at these low temperatures.
3.2.2. Particle levitation experimentsBecause of the low 1% ERH values observed at 298 K, an additional, independent
technique was used to further investigate efflorescence RH of Ca(ClO4)2. Efflores-
at 273 K. This efflorescence experiment starts with a deliquesced Ca(ClO4)2 particleears to be liquid. The shoulder in the O–H stretch at 16% is still present, with a slight
nges are observed but a shift in the ClO�4 stretch to 946 cm�1 and the disappearingion of the references to color in this figure legend, the reader is referred to the web
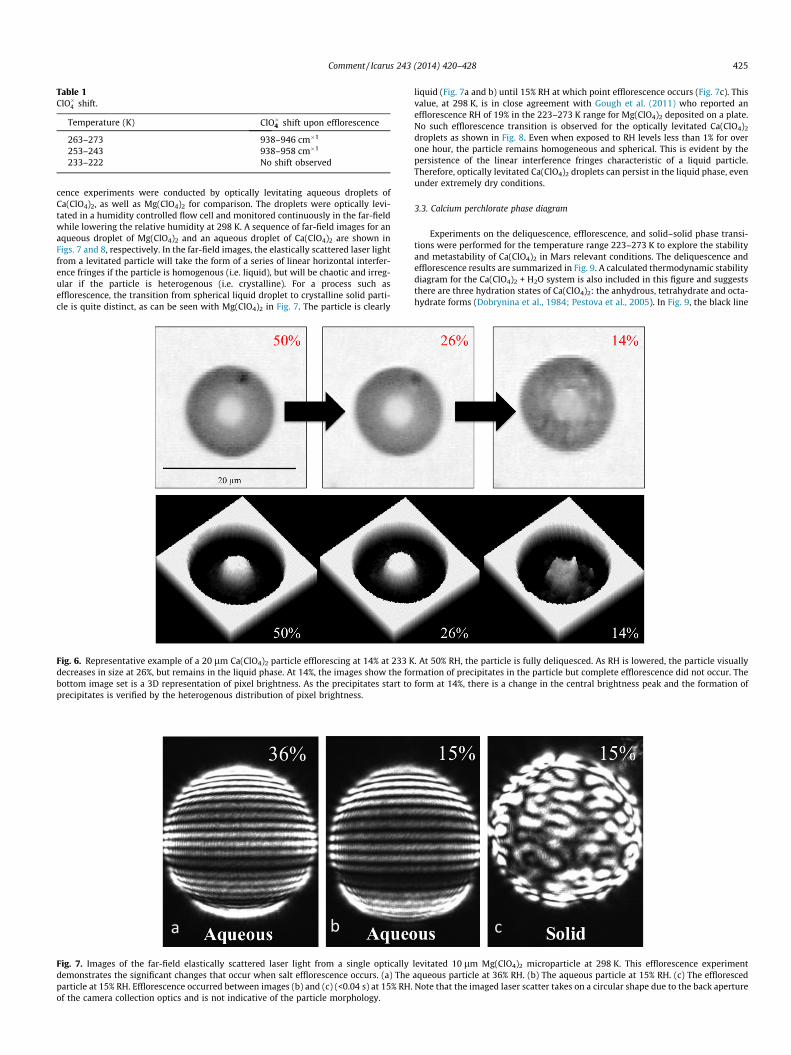
Table 1ClO�4 shift.
Temperature (K) ClO�4 shift upon efflorescence
263–273 938–946 cm�1
253–243 938–958 cm�1
233–222 No shift observed
Comment / Icarus 243 (2014) 420–428 425
cence experiments were conducted by optically levitating aqueous droplets ofCa(ClO4)2, as well as Mg(ClO4)2 for comparison. The droplets were optically levi-tated in a humidity controlled flow cell and monitored continuously in the far-fieldwhile lowering the relative humidity at 298 K. A sequence of far-field images for anaqueous droplet of Mg(ClO4)2 and an aqueous droplet of Ca(ClO4)2 are shown inFigs. 7 and 8, respectively. In the far-field images, the elastically scattered laser lightfrom a levitated particle will take the form of a series of linear horizontal interfer-ence fringes if the particle is homogenous (i.e. liquid), but will be chaotic and irreg-ular if the particle is heterogenous (i.e. crystalline). For a process such asefflorescence, the transition from spherical liquid droplet to crystalline solid parti-cle is quite distinct, as can be seen with Mg(ClO4)2 in Fig. 7. The particle is clearly
Fig. 6. Representative example of a 20 lm Ca(ClO4)2 particle efflorescing at 14% at 233 Kdecreases in size at 26%, but remains in the liquid phase. At 14%, the images show the fobottom image set is a 3D representation of pixel brightness. As the precipitates start toprecipitates is verified by the heterogenous distribution of pixel brightness.
Fig. 7. Images of the far-field elastically scattered laser light from a single opticallydemonstrates the significant changes that occur when salt efflorescence occurs. (a) Theparticle at 15% RH. Efflorescence occurred between images (b) and (c) (<0.04 s) at 15% RH.of the camera collection optics and is not indicative of the particle morphology.
liquid (Fig. 7a and b) until 15% RH at which point efflorescence occurs (Fig. 7c). Thisvalue, at 298 K, is in close agreement with Gough et al. (2011) who reported anefflorescence RH of 19% in the 223–273 K range for Mg(ClO4)2 deposited on a plate.No such efflorescence transition is observed for the optically levitated Ca(ClO4)2
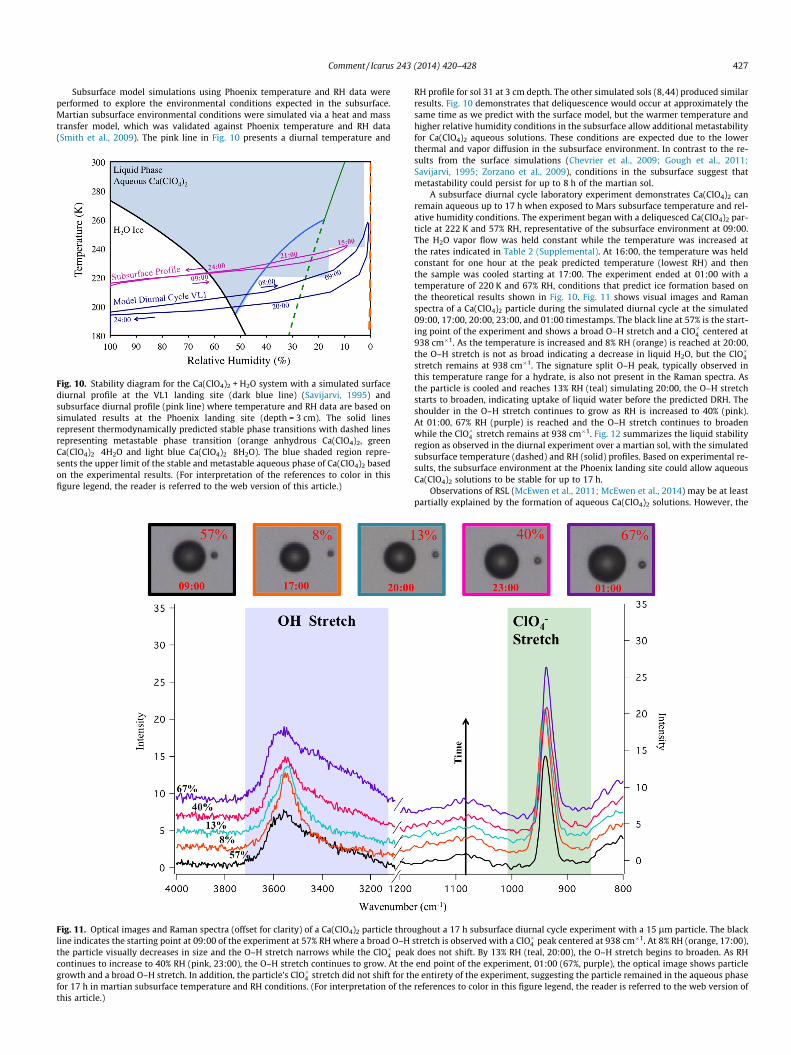
droplets as shown in Fig. 8. Even when exposed to RH levels less than 1% for overone hour, the particle remains homogeneous and spherical. This is evident by thepersistence of the linear interference fringes characteristic of a liquid particle.Therefore, optically levitated Ca(ClO4)2 droplets can persist in the liquid phase, evenunder extremely dry conditions.
3.3. Calcium perchlorate phase diagram
Experiments on the deliquescence, efflorescence, and solid–solid phase transi-tions were performed for the temperature range 223–273 K to explore the stabilityand metastability of Ca(ClO4)2 in Mars relevant conditions. The deliquescence andefflorescence results are summarized in Fig. 9. A calculated thermodynamic stabilitydiagram for the Ca(ClO4)2 + H2O system is also included in this figure and suggeststhere are three hydration states of Ca(ClO4)2: the anhydrous, tetrahydrate and octa-hydrate forms (Dobrynina et al., 1984; Pestova et al., 2005). In Fig. 9, the black line
. At 50% RH, the particle is fully deliquesced. As RH is lowered, the particle visuallyrmation of precipitates in the particle but complete efflorescence did not occur. Theform at 14%, there is a change in the central brightness peak and the formation of
levitated 10 lm Mg(ClO4)2 microparticle at 298 K. This efflorescence experimentaqueous particle at 36% RH. (b) The aqueous particle at 15% RH. (c) The efflorescedNote that the imaged laser scatter takes on a circular shape due to the back aperture
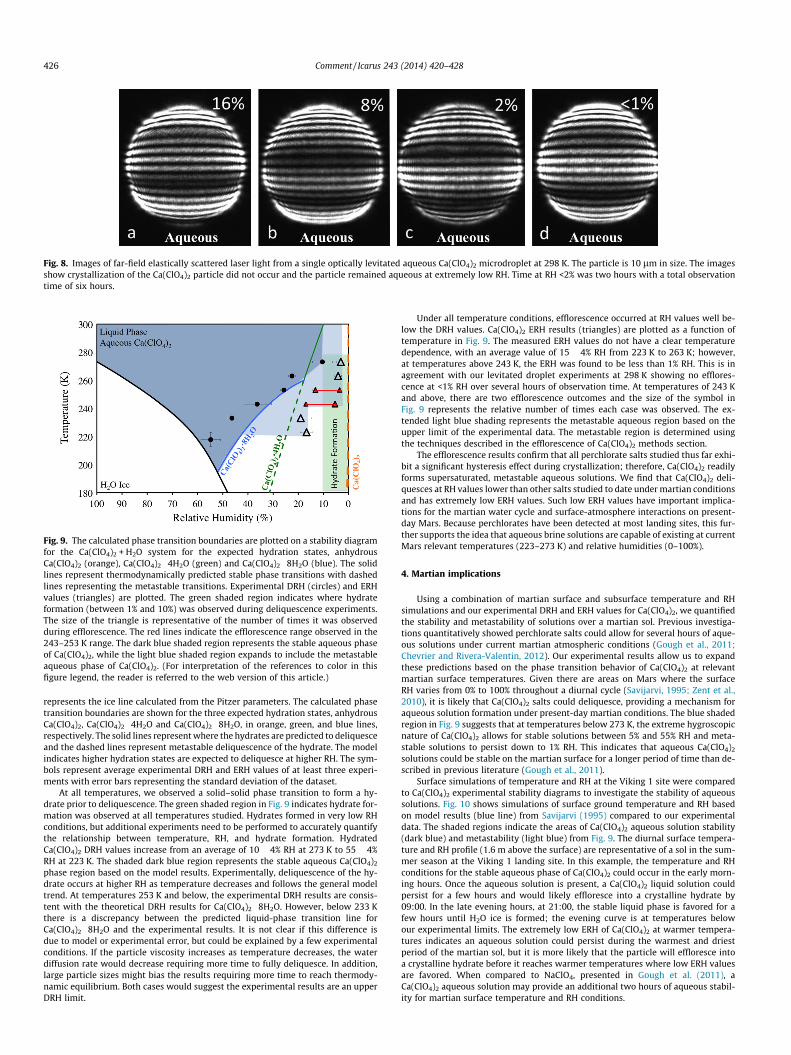
Fig. 8. Images of far-field elastically scattered laser light from a single optically levitated aqueous Ca(ClO4)2 microdroplet at 298 K. The particle is 10 lm in size. The imagesshow crystallization of the Ca(ClO4)2 particle did not occur and the particle remained aqueous at extremely low RH. Time at RH <2% was two hours with a total observationtime of six hours.
Fig. 9. The calculated phase transition boundaries are plotted on a stability diagramfor the Ca(ClO4)2 + H2O system for the expected hydration states, anhydrousCa(ClO4)2 (orange), Ca(ClO4)2 � 4H2O (green) and Ca(ClO4)2 � 8H2O (blue). The solidlines represent thermodynamically predicted stable phase transitions with dashedlines representing the metastable transitions. Experimental DRH (circles) and ERHvalues (triangles) are plotted. The green shaded region indicates where hydrateformation (between 1% and 10%) was observed during deliquescence experiments.The size of the triangle is representative of the number of times it was observedduring efflorescence. The red lines indicate the efflorescence range observed in the243–253 K range. The dark blue shaded region represents the stable aqueous phaseof Ca(ClO4)2, while the light blue shaded region expands to include the metastableaqueous phase of Ca(ClO4)2. (For interpretation of the references to color in thisfigure legend, the reader is referred to the web version of this article.)
426 Comment / Icarus 243 (2014) 420–428
represents the ice line calculated from the Pitzer parameters. The calculated phasetransition boundaries are shown for the three expected hydration states, anhydrousCa(ClO4)2, Ca(ClO4)2 � 4H2O and Ca(ClO4)2 � 8H2O, in orange, green, and blue lines,respectively. The solid lines represent where the hydrates are predicted to deliquesceand the dashed lines represent metastable deliquescence of the hydrate. The modelindicates higher hydration states are expected to deliquesce at higher RH. The sym-bols represent average experimental DRH and ERH values of at least three experi-ments with error bars representing the standard deviation of the dataset.
At all temperatures, we observed a solid–solid phase transition to form a hy-drate prior to deliquescence. The green shaded region in Fig. 9 indicates hydrate for-mation was observed at all temperatures studied. Hydrates formed in very low RHconditions, but additional experiments need to be performed to accurately quantifythe relationship between temperature, RH, and hydrate formation. HydratedCa(ClO4)2 DRH values increase from an average of 10 � 4% RH at 273 K to 55 � 4%RH at 223 K. The shaded dark blue region represents the stable aqueous Ca(ClO4)2
phase region based on the model results. Experimentally, deliquescence of the hy-drate occurs at higher RH as temperature decreases and follows the general modeltrend. At temperatures 253 K and below, the experimental DRH results are consis-tent with the theoretical DRH results for Ca(ClO4)2 � 8H2O. However, below 233 Kthere is a discrepancy between the predicted liquid-phase transition line forCa(ClO4)2 � 8H2O and the experimental results. It is not clear if this difference isdue to model or experimental error, but could be explained by a few experimentalconditions. If the particle viscosity increases as temperature decreases, the waterdiffusion rate would decrease requiring more time to fully deliquesce. In addition,large particle sizes might bias the results requiring more time to reach thermody-namic equilibrium. Both cases would suggest the experimental results are an upperDRH limit.
Under all temperature conditions, efflorescence occurred at RH values well be-low the DRH values. Ca(ClO4)2 ERH results (triangles) are plotted as a function oftemperature in Fig. 9. The measured ERH values do not have a clear temperaturedependence, with an average value of 15 � 4% RH from 223 K to 263 K; however,at temperatures above 243 K, the ERH was found to be less than 1% RH. This is inagreement with our levitated droplet experiments at 298 K showing no efflores-cence at <1% RH over several hours of observation time. At temperatures of 243 Kand above, there are two efflorescence outcomes and the size of the symbol inFig. 9 represents the relative number of times each case was observed. The ex-tended light blue shading represents the metastable aqueous region based on theupper limit of the experimental data. The metastable region is determined usingthe techniques described in the efflorescence of Ca(ClO4)2 methods section.
The efflorescence results confirm that all perchlorate salts studied thus far exhi-bit a significant hysteresis effect during crystallization; therefore, Ca(ClO4)2 readilyforms supersaturated, metastable aqueous solutions. We find that Ca(ClO4)2 deli-quesces at RH values lower than other salts studied to date under martian conditionsand has extremely low ERH values. Such low ERH values have important implica-tions for the martian water cycle and surface-atmosphere interactions on present-day Mars. Because perchlorates have been detected at most landing sites, this fur-ther supports the idea that aqueous brine solutions are capable of existing at currentMars relevant temperatures (223–273 K) and relative humidities (0–100%).
4. Martian implications
Using a combination of martian surface and subsurface temperature and RHsimulations and our experimental DRH and ERH values for Ca(ClO4)2, we quantifiedthe stability and metastability of solutions over a martian sol. Previous investiga-tions quantitatively showed perchlorate salts could allow for several hours of aque-ous solutions under current martian atmospheric conditions (Gough et al., 2011;Chevrier and Rivera-Valentin, 2012). Our experimental results allow us to expandthese predictions based on the phase transition behavior of Ca(ClO4)2 at relevantmartian surface temperatures. Given there are areas on Mars where the surfaceRH varies from 0% to 100% throughout a diurnal cycle (Savijarvi, 1995; Zent et al.,2010), it is likely that Ca(ClO4)2 salts could deliquesce, providing a mechanism foraqueous solution formation under present-day martian conditions. The blue shadedregion in Fig. 9 suggests that at temperatures below 273 K, the extreme hygroscopicnature of Ca(ClO4)2 allows for stable solutions between 5% and 55% RH and meta-stable solutions to persist down to 1% RH. This indicates that aqueous Ca(ClO4)2
solutions could be stable on the martian surface for a longer period of time than de-scribed in previous literature (Gough et al., 2011).
Surface simulations of temperature and RH at the Viking 1 site were comparedto Ca(ClO4)2 experimental stability diagrams to investigate the stability of aqueoussolutions. Fig. 10 shows simulations of surface ground temperature and RH basedon model results (blue line) from Savijarvi (1995) compared to our experimentaldata. The shaded regions indicate the areas of Ca(ClO4)2 aqueous solution stability(dark blue) and metastability (light blue) from Fig. 9. The diurnal surface tempera-ture and RH profile (1.6 m above the surface) are representative of a sol in the sum-mer season at the Viking 1 landing site. In this example, the temperature and RHconditions for the stable aqueous phase of Ca(ClO4)2 could occur in the early morn-ing hours. Once the aqueous solution is present, a Ca(ClO4)2 liquid solution couldpersist for a few hours and would likely effloresce into a crystalline hydrate by09:00. In the late evening hours, at 21:00, the stable liquid phase is favored for afew hours until H2O ice is formed; the evening curve is at temperatures belowour experimental limits. The extremely low ERH of Ca(ClO4)2 at warmer tempera-tures indicates an aqueous solution could persist during the warmest and driestperiod of the martian sol, but it is more likely that the particle will effloresce intoa crystalline hydrate before it reaches warmer temperatures where low ERH valuesare favored. When compared to NaClO4, presented in Gough et al. (2011), aCa(ClO4)2 aqueous solution may provide an additional two hours of aqueous stabil-ity for martian surface temperature and RH conditions.
Comment / Icarus 243 (2014) 420–428 427
Subsurface model simulations using Phoenix temperature and RH data wereperformed to explore the environmental conditions expected in the subsurface.Martian subsurface environmental conditions were simulated via a heat and masstransfer model, which was validated against Phoenix temperature and RH data(Smith et al., 2009). The pink line in Fig. 10 presents a diurnal temperature and
Fig. 11. Optical images and Raman spectra (offset for clarity) of a Ca(ClO4)2 particle throline indicates the starting point at 09:00 of the experiment at 57% RH where a broad O–Hthe particle visually decreases in size and the O–H stretch narrows while the ClO�4 peakcontinues to increase to 40% RH (pink, 23:00), the O–H stretch continues to grow. At thegrowth and a broad O–H stretch. In addition, the particle’s ClO�4 stretch did not shift for thfor 17 h in martian subsurface temperature and RH conditions. (For interpretation of thethis article.)
Fig. 10. Stability diagram for the Ca(ClO4)2 + H2O system with a simulated surfacediurnal profile at the VL1 landing site (dark blue line) (Savijarvi, 1995) andsubsurface diurnal profile (pink line) where temperature and RH data are based onsimulated results at the Phoenix landing site (depth = 3 cm). The solid linesrepresent thermodynamically predicted stable phase transitions with dashed linesrepresenting metastable phase transition (orange anhydrous Ca(ClO4)2, greenCa(ClO4)2 � 4H2O and light blue Ca(ClO4)2 � 8H2O). The blue shaded region repre-sents the upper limit of the stable and metastable aqueous phase of Ca(ClO4)2 basedon the experimental results. (For interpretation of the references to color in thisfigure legend, the reader is referred to the web version of this article.)
RH profile for sol 31 at 3 cm depth. The other simulated sols (8,44) produced similarresults. Fig. 10 demonstrates that deliquescence would occur at approximately thesame time as we predict with the surface model, but the warmer temperature andhigher relative humidity conditions in the subsurface allow additional metastabilityfor Ca(ClO4)2 aqueous solutions. These conditions are expected due to the lowerthermal and vapor diffusion in the subsurface environment. In contrast to the re-sults from the surface simulations (Chevrier et al., 2009; Gough et al., 2011;Savijarvi, 1995; Zorzano et al., 2009), conditions in the subsurface suggest thatmetastability could persist for up to 8 h of the martian sol.
A subsurface diurnal cycle laboratory experiment demonstrates Ca(ClO4)2 canremain aqueous up to 17 h when exposed to Mars subsurface temperature and rel-ative humidity conditions. The experiment began with a deliquesced Ca(ClO4)2 par-ticle at 222 K and 57% RH, representative of the subsurface environment at 09:00.The H2O vapor flow was held constant while the temperature was increased atthe rates indicated in Table 2 (Supplemental). At 16:00, the temperature was heldconstant for one hour at the peak predicted temperature (lowest RH) and thenthe sample was cooled starting at 17:00. The experiment ended at 01:00 with atemperature of 220 K and 67% RH, conditions that predict ice formation based onthe theoretical results shown in Fig. 10. Fig. 11 shows visual images and Ramanspectra of a Ca(ClO4)2 particle during the simulated diurnal cycle at the simulated09:00, 17:00, 20:00, 23:00, and 01:00 timestamps. The black line at 57% is the start-ing point of the experiment and shows a broad O–H stretch and a ClO�4 centered at938 cm�1. As the temperature is increased and 8% RH (orange) is reached at 20:00,the O–H stretch is not as broad indicating a decrease in liquid H2O, but the ClO�4stretch remains at 938 cm�1. The signature split O–H peak, typically observed inthis temperature range for a hydrate, is also not present in the Raman spectra. Asthe particle is cooled and reaches 13% RH (teal) simulating 20:00, the O–H stretchstarts to broaden, indicating uptake of liquid water before the predicted DRH. Theshoulder in the O–H stretch continues to grow as RH is increased to 40% (pink).At 01:00, 67% RH (purple) is reached and the O–H stretch continues to broadenwhile the ClO�4 stretch remains at 938 cm�1. Fig. 12 summarizes the liquid stabilityregion as observed in the diurnal experiment over a martian sol, with the simulatedsubsurface temperature (dashed) and RH (solid) profiles. Based on experimental re-sults, the subsurface environment at the Phoenix landing site could allow aqueousCa(ClO4)2 solutions to be stable for up to 17 h.
Observations of RSL (McEwen et al., 2011; McEwen et al., 2014) may be at leastpartially explained by the formation of aqueous Ca(ClO4)2 solutions. However, the
ughout a 17 h subsurface diurnal cycle experiment with a 15 lm particle. The blackstretch is observed with a ClO�4 peak centered at 938 cm�1. At 8% RH (orange, 17:00),
does not shift. By 13% RH (teal, 20:00), the O–H stretch begins to broaden. As RHend point of the experiment, 01:00 (67%, purple), the optical image shows particlee entirety of the experiment, suggesting the particle remained in the aqueous phasereferences to color in this figure legend, the reader is referred to the web version of
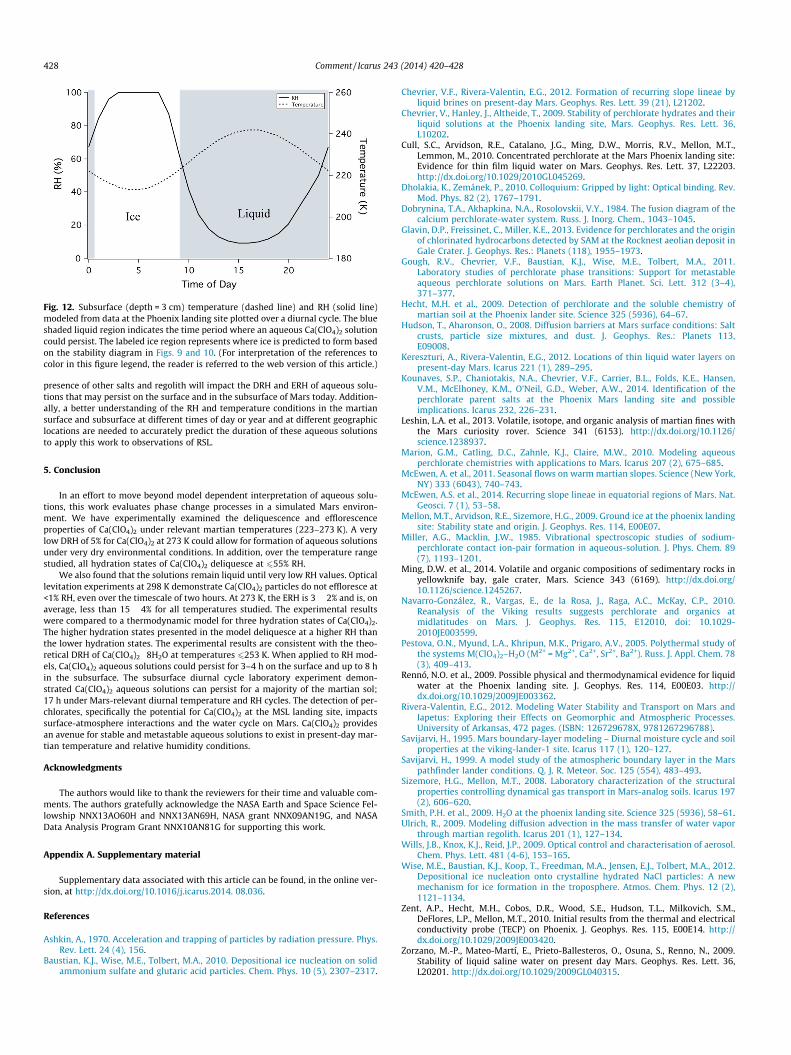
Fig. 12. Subsurface (depth = 3 cm) temperature (dashed line) and RH (solid line)modeled from data at the Phoenix landing site plotted over a diurnal cycle. The blueshaded liquid region indicates the time period where an aqueous Ca(ClO4)2 solutioncould persist. The labeled ice region represents where ice is predicted to form basedon the stability diagram in Figs. 9 and 10. (For interpretation of the references tocolor in this figure legend, the reader is referred to the web version of this article.)
428 Comment / Icarus 243 (2014) 420–428
presence of other salts and regolith will impact the DRH and ERH of aqueous solu-tions that may persist on the surface and in the subsurface of Mars today. Addition-ally, a better understanding of the RH and temperature conditions in the martiansurface and subsurface at different times of day or year and at different geographiclocations are needed to accurately predict the duration of these aqueous solutionsto apply this work to observations of RSL.
5. Conclusion
In an effort to move beyond model dependent interpretation of aqueous solu-tions, this work evaluates phase change processes in a simulated Mars environ-ment. We have experimentally examined the deliquescence and efflorescenceproperties of Ca(ClO4)2 under relevant martian temperatures (223–273 K). A verylow DRH of 5% for Ca(ClO4)2 at 273 K could allow for formation of aqueous solutionsunder very dry environmental conditions. In addition, over the temperature rangestudied, all hydration states of Ca(ClO4)2 deliquesce at 655% RH.
We also found that the solutions remain liquid until very low RH values. Opticallevitation experiments at 298 K demonstrate Ca(ClO4)2 particles do not effloresce at<1% RH, even over the timescale of two hours. At 273 K, the ERH is 3 � 2% and is, onaverage, less than 15 � 4% for all temperatures studied. The experimental resultswere compared to a thermodynamic model for three hydration states of Ca(ClO4)2.The higher hydration states presented in the model deliquesce at a higher RH thanthe lower hydration states. The experimental results are consistent with the theo-retical DRH of Ca(ClO4)2 � 8H2O at temperatures 6253 K. When applied to RH mod-els, Ca(ClO4)2 aqueous solutions could persist for 3–4 h on the surface and up to 8 hin the subsurface. The subsurface diurnal cycle laboratory experiment demon-strated Ca(ClO4)2 aqueous solutions can persist for a majority of the martian sol;17 h under Mars-relevant diurnal temperature and RH cycles. The detection of per-chlorates, specifically the potential for Ca(ClO4)2 at the MSL landing site, impactssurface-atmosphere interactions and the water cycle on Mars. Ca(ClO4)2 providesan avenue for stable and metastable aqueous solutions to exist in present-day mar-tian temperature and relative humidity conditions.
Acknowledgments
The authors would like to thank the reviewers for their time and valuable com-ments. The authors gratefully acknowledge the NASA Earth and Space Science Fel-lowship NNX13AO60H and NNX13AN69H, NASA grant NNX09AN19G, and NASAData Analysis Program Grant NNX10AN81G for supporting this work.
Appendix A. Supplementary material
Supplementary data associated with this article can be found, in the online ver-sion, at http://dx.doi.org/10.1016/j.icarus.2014. 08.036.
References
Ashkin, A., 1970. Acceleration and trapping of particles by radiation pressure. Phys.Rev. Lett. 24 (4), 156.
Baustian, K.J., Wise, M.E., Tolbert, M.A., 2010. Depositional ice nucleation on solidammonium sulfate and glutaric acid particles. Chem. Phys. 10 (5), 2307–2317.
Chevrier, V.F., Rivera-Valentin, E.G., 2012. Formation of recurring slope lineae byliquid brines on present-day Mars. Geophys. Res. Lett. 39 (21), L21202.
Chevrier, V., Hanley, J., Altheide, T., 2009. Stability of perchlorate hydrates and theirliquid solutions at the Phoenix landing site, Mars. Geophys. Res. Lett. 36,L10202.
Cull, S.C., Arvidson, R.E., Catalano, J.G., Ming, D.W., Morris, R.V., Mellon, M.T.,Lemmon, M., 2010. Concentrated perchlorate at the Mars Phoenix landing site:Evidence for thin film liquid water on Mars. Geophys. Res. Lett. 37, L22203.http://dx.doi.org/10.1029/2010GL045269.
Dholakia, K., Zemánek, P., 2010. Colloquium: Gripped by light: Optical binding. Rev.Mod. Phys. 82 (2), 1767–1791.
Dobrynina, T.A., Akhapkina, N.A., Rosolovskii, V.Y., 1984. The fusion diagram of thecalcium perchlorate-water system. Russ. J. Inorg. Chem., 1043–1045.
Glavin, D.P., Freissinet, C., Miller, K.E., 2013. Evidence for perchlorates and the originof chlorinated hydrocarbons detected by SAM at the Rocknest aeolian deposit inGale Crater. J. Geophys. Res.: Planets (118), 1955–1973.
Gough, R.V., Chevrier, V.F., Baustian, K.J., Wise, M.E., Tolbert, M.A., 2011.Laboratory studies of perchlorate phase transitions: Support for metastableaqueous perchlorate solutions on Mars. Earth Planet. Sci. Lett. 312 (3–4),371–377.
Hecht, M.H. et al., 2009. Detection of perchlorate and the soluble chemistry ofmartian soil at the Phoenix lander site. Science 325 (5936), 64–67.
Hudson, T., Aharonson, O., 2008. Diffusion barriers at Mars surface conditions: Saltcrusts, particle size mixtures, and dust. J. Geophys. Res.: Planets 113,E09008.
Kereszturi, A., Rivera-Valentin, E.G., 2012. Locations of thin liquid water layers onpresent-day Mars. Icarus 221 (1), 289–295.
Kounaves, S.P., Chaniotakis, N.A., Chevrier, V.F., Carrier, B.L., Folds, K.E., Hansen,V.M., McElhoney, K.M., O’Neil, G.D., Weber, A.W., 2014. Identification of theperchlorate parent salts at the Phoenix Mars landing site and possibleimplications. Icarus 232, 226–231.
Leshin, L.A. et al., 2013. Volatile, isotope, and organic analysis of martian fines withthe Mars curiosity rover. Science 341 (6153). http://dx.doi.org/10.1126/science.1238937.
Marion, G.M., Catling, D.C., Zahnle, K.J., Claire, M.W., 2010. Modeling aqueousperchlorate chemistries with applications to Mars. Icarus 207 (2), 675–685.
McEwen, A. et al., 2011. Seasonal flows on warm martian slopes. Science (New York,NY) 333 (6043), 740–743.
McEwen, A.S. et al., 2014. Recurring slope lineae in equatorial regions of Mars. Nat.Geosci. 7 (1), 53–58.
Mellon, M.T., Arvidson, R.E., Sizemore, H.G., 2009. Ground ice at the phoenix landingsite: Stability state and origin. J. Geophys. Res. 114, E00E07.
Miller, A.G., Macklin, J.W., 1985. Vibrational spectroscopic studies of sodium-perchlorate contact ion-pair formation in aqueous-solution. J. Phys. Chem. 89(7), 1193–1201.
Ming, D.W. et al., 2014. Volatile and organic compositions of sedimentary rocks inyellowknife bay, gale crater, Mars. Science 343 (6169). http://dx.doi.org/10.1126/science.1245267.
Navarro-González, R., Vargas, E., de la Rosa, J., Raga, A.C., McKay, C.P., 2010.Reanalysis of the Viking results suggests perchlorate and organics atmidlatitudes on Mars. J. Geophys. Res. 115, E12010, doi: 10.1029-2010JE003599.
Pestova, O.N., Myund, L.A., Khripun, M.K., Prigaro, A.V., 2005. Polythermal study ofthe systems M(ClO4)2–H2O (M2+ = Mg2+, Ca2+, Sr2+, Ba2+). Russ. J. Appl. Chem. 78(3), 409–413.
Rennó, N.O. et al., 2009. Possible physical and thermodynamical evidence for liquidwater at the Phoenix landing site. J. Geophys. Res. 114, E00E03. http://dx.doi.org/10.1029/2009JE003362.
Rivera-Valentin, E.G., 2012. Modeling Water Stability and Transport on Mars andIapetus: Exploring their Effects on Geomorphic and Atmospheric Processes.University of Arkansas, 472 pages. (ISBN: 126729678X, 9781267296788).
Savijarvi, H., 1995. Mars boundary-layer modeling – Diurnal moisture cycle and soilproperties at the viking-lander-1 site. Icarus 117 (1), 120–127.
Savijarvi, H., 1999. A model study of the atmospheric boundary layer in the Marspathfinder lander conditions. Q. J. R. Meteor. Soc. 125 (554), 483–493.
Sizemore, H.G., Mellon, M.T., 2008. Laboratory characterization of the structuralproperties controlling dynamical gas transport in Mars-analog soils. Icarus 197(2), 606–620.
Smith, P.H. et al., 2009. H2O at the phoenix landing site. Science 325 (5936), 58–61.Ulrich, R., 2009. Modeling diffusion advection in the mass transfer of water vapor
through martian regolith. Icarus 201 (1), 127–134.Wills, J.B., Knox, K.J., Reid, J.P., 2009. Optical control and characterisation of aerosol.
Chem. Phys. Lett. 481 (4-6), 153–165.Wise, M.E., Baustian, K.J., Koop, T., Freedman, M.A., Jensen, E.J., Tolbert, M.A., 2012.
Depositional ice nucleation onto crystalline hydrated NaCl particles: A newmechanism for ice formation in the troposphere. Atmos. Chem. Phys. 12 (2),1121–1134.
Zent, A.P., Hecht, M.H., Cobos, D.R., Wood, S.E., Hudson, T.L., Milkovich, S.M.,DeFlores, L.P., Mellon, M.T., 2010. Initial results from the thermal and electricalconductivity probe (TECP) on Phoenix. J. Geophys. Res. 115, E00E14. http://dx.doi.org/10.1029/2009JE003420.
Zorzano, M.-P., Mateo-Martí, E., Prieto-Ballesteros, O., Osuna, S., Renno, N., 2009.Stability of liquid saline water on present day Mars. Geophys. Res. Lett. 36,L20201. http://dx.doi.org/10.1029/2009GL040315.
Copyright © 2022 FDOKUMEN