PowerShares Global Funds Ireland plc - TeleTrader.com
319
PowerShares Global Funds Ireland plc (an umbrella investment company with variable capital and segregated liability between sub-funds) ANNUAL REPORT AND AUDITED FINANCIAL STATEMENTS For the year ended 30 September 2011
-
Upload
khangminh22 -
Category
Documents
-
view
3 -
download
0
Transcript of PowerShares Global Funds Ireland plc - TeleTrader.com

PowerShares Global Funds Ireland plc (an umbrella investment company with variable capital and segregated liability
between sub-funds)
ANNUAL REPORT AND AUDITED FINANCIAL STATEMENTS
For the year ended 30 September 2011

PowerShares Global Funds Ireland plc Annual Report and Audited Financial Statements
for the year ended 30 September 2011
2
Table of Contents
Pages General Information……………………………………………………………………………….. 3 Investment Manager’s Report…………………………………………………………………….. 4-21 Director’s Report………………………………………………………………………………….. 22-39 Report of the Custodian to the Shareholders……………………………………………………… 40 Independent Auditors’ Report to the Shareholders……………………………………………….. 41-42 Balance Sheet as at 30 September 2011………………………………………............................... 43-46 Balance Sheet as at 30 September 2010………………………………………............................... 47-50 Profit and Loss Account for year ended 30 September 2011……..………………………………. 51-58 Profit and Loss Account for year ended 30 September 2010……..………………………………. 59-66 Statement of Changes in Net Assets Attributable to Holders of Redeemable Participating Shares for year ended 30 September 2011……….…………………………………. 67-70 Statement of Changes in Net Assets Attributable to Holders of Redeemable Participating Shares for year ended 30 September 2010……….…………………………………. 71-74 Notes to the Financial Statements…………………………………………………………………. 75-159 Schedule of Investments………………………………................................................................... 160-279 Statement of Changes in Composition of Portfolio…………………………………...................... 280-317 Additional Information……………………………………………………………………………. 318-319

PowerShares Global Funds Ireland plc Annual Report and Audited Financial Statements
for the year ended 30 September 2011
3
General Information PowerShares Global Funds Ireland plc (the “Company”) was incorporated on 5 February 2002 and is established as an open-ended investment company under registration number 352941 with variable capital, under the laws of Ireland as a public limited company pursuant to the Companies Acts, 1963 to 2009 and the European Communities (Undertakings for Collective Investment in Transferable Securities) Regulations, 2011. As at 30 September 2011, nineteen funds of the Company had been established namely, PowerShares EQQQ Fund, PowerShares FTSE RAFI US 1000 Fund, PowerShares Global Clean Energy Fund, PowerShares Dynamic US Market Fund, PowerShares FTSE RAFI Europe Fund, PowerShares Global Listed Private Equity Fund, PowerShares Palisades Global Water Fund, PowerShares FTSE RAFI Asia Pacific Ex-Japan Fund, PowerShares FTSE RAFI Emerging Markets Fund, PowerShares FTSE RAFI UK 100 Fund, PowerShares FTSE RAFI All-World 3000 Fund, PowerShares FTSE RAFI Developed Europe Mid-Small Fund, PowerShares FTSE RAFI Developed 1000 Fund, PowerShares FTSE RAFI Italy 30 Fund, PowerShares FTSE RAFI Switzerland Fund, PowerShares FTSE RAFI Hong Kong China Fund, PowerShares Global Agriculture NASDAQ OMX Fund, PowerShares Middle East North Africa NASDAQ OMX Fund and PowerShares EuroMTS Cash 3 Months Fund.
Board of Directors: Registered Office: Eimear Cowhey (Irish)* Fitzwilton House Benjamin Thomas Fulton (American) Wilton Place Eugene Regan (Irish)* Dublin 2 Adrian Waters (Irish) ^^ Ireland Leslie Schmidt (American)*** Brian Collins (Irish)** Manager:# Cormac O’Sullivan (Irish)*** Invesco PowerShares Capital Management *Independent non-executive directors, resigned 31 Dec 2011 Ireland Limited **Independent non-executive director, appointed 18 Nov 2011 Fitzwilton Place, Wilton Place, Dublin 2, Ireland ***Non-independent executive director, appointed 18 Nov 2011 ^^ Independent non-executive director
Investment Manager: #Effective 1 January 2012 Invesco Powershares Invesco PowerShares Capital Management LLC Capital Management Ireland Limited retired as 301 West Roosevelt Road Manager and Invesco Global Asset Management Wheaton Limited was appointed as the new Manager Illinois 60187 United States
Independent Auditors: Administrator, Registrar and Transfer Agent: PricewaterhouseCoopers BNY Mellon Fund Services (Ireland) Limited One Spencer Dock Guild House North Wall Quay Guild Street Dublin 1 International Financial Services Centre Ireland Dublin 1 Ireland
Legal Advisers in U.K.: Custodian: Clifford Chance Limited Liability Partnership BNY Mellon Trust Company (Ireland) Limited 10 Upper Bank Street Guild House London Guild Street E14 5JJ International Financial Services Centre England Dublin 1 Ireland
Secretary: Legal Advisers in Ireland: Wilton Secretarial Limited William Fry Fitzwilton House, Wilton Place Fitzwilton House, Wilton Place Dublin 2 Dublin 2 Ireland Ireland

PowerShares Global Funds Ireland plc Annual Report and Audited Financial Statements
for the year ended 30 September 2011
4
Investment Manager’s Report
PowerShares EQQQ Fund PowerShares FTSE RAFI US 1000 Fund PowerShares Global Clean Energy Fund PowerShares Dynamic US Market Fund PowerShares FTSE RAFI Europe Fund
PowerShares Global Listed Private Equity Fund PowerShares Palisades Global Water Fund
PowerShares FTSE RAFI Asia Pacific Ex-Japan Fund PowerShares FTSE RAFI Emerging Markets Fund
PowerShares FTSE RAFI UK 100 Fund PowerShares FTSE RAFI All-World 3000 Fund
PowerShares FTSE RAFI Developed Europe Mid-Small Fund PowerShares FTSE RAFI Developed 1000 Fund
PowerShares FTSE RAFI Italy 30 Fund PowerShares FTSE RAFI Switzerland Fund
PowerShares FTSE RAFI Hong Kong China Fund PowerShares Global Agriculture NASDAQ OMX Fund
PowerShares Middle East North Africa NASDAQ OMX Fund PowerShares EuroMTS Cash 3 Months Fund
For the year ended 30 September 2011

PowerShares Global Funds Ireland plc Annual Report and Audited Financial Statements
for the year ended 30 September 2011
5
Investment Manager’s Report (continued)
List of Current Funds
US Equity ETFs
• PowerShares EQQQ Fund
• PowerShares FTSE RAFI US 1000 Fund
• PowerShares Dynamic US Market Fund
Intelligent Access ETFs
• PowerShares Global Clean Energy Fund
• PowerShares Global Listed Private Equity Fund
• PowerShares Palisades Global Water Fund
• PowerShares Global Agriculture NASDAQ OMX Fund
• PowerShares Middle East North Africa NASDAQ OMX Fund
Global ETFs
• PowerShares FTSE RAFI Developed 1000 Fund
• PowerShares FTSE RAFI Developed Europe Mid-Small Fund
• PowerShares FTSE RAFI All-World 3000 Fund
• PowerShares FTSE RAFI Emerging Markets Fund
• PowerShares FTSE RAFI Asia Pacific Ex-Japan Fund
Country Specific ETFs
• PowerShares FTSE RAFI Europe Fund
• PowerShares FTSE RAFI UK 100 Fund
• PowerShares FTSE RAFI Italy 30 Fund
• PowerShares FTSE RAFI Switzerland Fund
• PowerShares FTSE RAFI Hong Kong China Fund
Fixed Income ETFs
• PowerShares EuroMTS Cash 3 Months Fund

PowerShares Global Funds Ireland plc Annual Report and Audited Financial Statements
for the year ended 30 September 2011
6
Investment Manager’s Report (continued) Investment Strategy for the Year PowerShares EQQQ Fund The investment objective of the Fund is to provide investment results which, before expenses, generally correspond to the price and yield performance of the Nasdaq-100 Index® (“the Index”) in U.S. Dollar terms, by generally holding all of the shares in the Index in their respective weightings in the Index, subject to the investment restrictions as disclosed in the Fund’s prospectus. PowerShares FTSE RAFI US 1000 Fund The investment objective of the Fund is to provide investment results which, before expenses, generally correspond to the price and yield performance of the FTSE RAFI US 1000 Index (“the Index”) in U.S. Dollar terms, by, so far as possible and practicable, holding all of the shares in the Index in their respective weightings in the Index, subject to the investment restrictions as disclosed in the Fund’s prospectus. PowerShares Global Clean Energy Fund The investment objective of the Fund is to provide investment results which, before expenses, correspond to the price and yield performance of the WilderHill New Energy Global Innovation Index (“the Index”) in Euro terms by, so far as possible and practicable, holding all of the shares in the Index in their respective weightings in the Index, subject to the investment restrictions as disclosed in the Fund’s prospectus. PowerShares Dynamic US Market Fund The investment objective of the Fund is to provide investment results which, before expenses, correspond to the price and yield performance of the Dynamic Market Intellidex (“the Index”) in U.S. Dollar terms, by, so far as possible and practicable, holding all of the shares in the Index in their respective weightings in the Index, subject to the investment restrictions as disclosed in the Fund’s prospectus. PowerShares FTSE RAFI Europe Fund The investment objective of the Fund is to provide investment results which, before expenses, correspond to the price and yield performance of the FTSE RAFI Europe Index (“the Index”) in Euro terms, by, so far as possible and practicable, holding all of the shares in the Index in their respective weightings in the Index, subject to the investment restrictions as disclosed in the Fund’s prospectus. PowerShares Global Listed Private Equity Fund The investment objective of the Fund is to provide investment results which, before expenses, generally correspond to the price and yield performance of the Global Listed Private Equity Index (“the Index”) in Euro terms, by, so far as possible and practicable, holding all of the shares in the Index in their respective weightings in the Index, subject to the investment restrictions as disclosed in the Fund’s prospectus. PowerShares Palisades Global Water Fund The investment objective of the Fund is to provide investment results which, before expenses, correspond to the price and yield performance of the Palisades Global Water Index (“the Index”) in Euro terms, by, so far as possible and practicable, holding all of the shares in the Index in their respective weightings in the Index, subject to the investment restrictions as disclosed in the Fund’s prospectus. PowerShares FTSE RAFI Asia Pacific Ex-Japan Fund
The investment objective of the Fund is to provide investment results which, before expenses, correspond to the price and yield performance of the FTSE RAFI Asia Pacific Ex-Japan Index (“the Index”) in U.S. Dollar terms, by, so far as possible and practicable, holding all of the shares in the Index in their respective weightings in the Index, subject to the investment restrictions as disclosed in the Fund’s prospectus.

PowerShares Global Funds Ireland plc Annual Report and Audited Financial Statements
for the year ended 30 September 2011
7
Investment Manager’s Report (continued) Investment Strategy for the Year (continued) PowerShares FTSE RAFI Emerging Markets Fund The investment objective of the Fund is to provide investment results which, before expenses, correspond to the price and yield performance of the FTSE RAFI Emerging Markets Index (“the Index”) in US Dollar terms, through the use of FDIs, principally total return swaps. As of 5 January 2011, this Fund transitioned from a direct replication strategy to a swap-based replication strategy. PowerShares FTSE RAFI UK 100 Fund The investment objective of the Fund is to provide investment results which, before expenses, correspond to the price and yield performance of the FTSE RAFI UK 100 Index (“the Index”) in Sterling terms, by, so far as possible and practicable, holding all of the shares in the Index in their respective weightings in the Index, subject to the investment restrictions as disclosed in the Fund’s prospectus. PowerShares FTSE RAFI All-World 3000 Fund The investment objective of the Fund is to provide investment results which, before expenses, correspond to the price and yield performance of the FTSE RAFI All-World 3000 Index (“the Index”) in US Dollar terms, through the use of FDIs, principally total return swaps. As of 5 January 2011, this Fund transitioned from a direct replication strategy to a swap-based replication strategy. PowerShares FTSE RAFI Developed Europe Mid-Small Fund The investment objective of the Fund is to provide investment results which, before expenses, correspond to the price and yield performance of the FTSE RAFI Developed Europe Mid-Small Index (“the Index”) in Euro terms, by, so far as possible and practicable, holding all of the shares in the Index in their respective weightings in the Index, subject to the investment restrictions as disclosed in the Fund’s prospectus. PowerShares FTSE RAFI Developed 1000 Fund The investment objective of the Fund is to provide investment results which, before expenses, correspond to the price and yield performance of the FTSE RAFI Developed 1000 Index (“the Index”) in Euro terms, by, so far as possible and practicable, holding all of the shares in the Index in their respective weightings in the Index, subject to the investment restrictions as disclosed in the Fund’s prospectus. PowerShares FTSE RAFI Italy 30 Fund The investment objective of the Fund is to provide investment results which, before expenses, correspond to the price and yield performance of the FTSE RAFI Italy 30 Index (“the Index”) in Euro terms, by, so far as possible and practicable, holding all of the shares in the Index in their respective weightings in the Index, subject to the investment restrictions as disclosed in the Fund’s prospectus. PowerShares FTSE RAFI Switzerland Fund The investment objective of the Fund is to provide investment results which, before expenses, correspond to the price and yield performance of the FTSE RAFI Switzerland Index (“the Index”) in Swiss Franc terms, by, so far as possible and practicable, holding all of the shares in the Index in their respective weightings in the Index, subject to the investment restrictions as disclosed in the Fund’s prospectus. PowerShares FTSE RAFI Hong Kong China Fund The investment objective of the Fund is to provide investors with investment results which, before expenses, correspond to the price and yield performance of the FTSE RAFI Hong Kong China Index (“the Index”) in US Dollar terms by, so far as possible and practicable, holding all of the shares in the Index in their respective weightings in the Index, subject to the investment restrictions as disclosed in the Fund’s prospectus.

PowerShares Global Funds Ireland plc Annual Report and Audited Financial Statements
for the year ended 30 September 2011
8
Investment Manager’s Report (continued) Investment Strategy for the Year (continued) PowerShares Global Agriculture NASDAQ OMX Fund The investment objective of the Fund is to provide investors with investment results which, before expenses, correspond to the price and yield performance of the NASDAQ OMX Global Agriculture Index (“the Index”) in US Dollar terms, by, so far as possible and practicable, holding all of the shares in the Index in their respective weightings in the Index, subject to the investment restrictions as disclosed in the Fund’s prospectus. PowerShares Middle East North Africa NASDAQ OMX Fund The investment objective of the Middle East North Africa Fund is to provide investors with investment results which, before expenses, correspond to the price and yield performance of the NASDAQ OMX Middle East North Africa Index (“the Index”) in US Dollar terms through the use of FDIs, principally total return swaps. As of 5 January 2011, this Fund transitioned from a direct replication strategy to a swap-based replication strategy. PowerShares EuroMTS Cash 3 Months Fund The investment objective of the EuroMTS Cash 3 Months Fund is to provide investors with investment results which, before expenses, correspond to the price and yield performance of the EuroMTS Government Bill Index (“the Index”) in Euro terms, by holding a portfolio of securities that consist of the component securities of the index.

PowerShares Global Funds Ireland plc Annual Report and Audited Financial Statements
for the year ended 30 September 2011
9
Investment Manager’s Report (continued)
PowerShares Investment Manager’s Report 4th Quarter 2010 Dividends
The Invesco PowerShares portfolio management team proposed and the Board approved the following dividends payable in October 2010 for the Funds, zero (0) which exceeded the 1% yield test* and thirteen (13) where dividend amounts were adequate to distribute back to shareholders for a total of thirteen (13) Funds with distributions:
X-Date - 29 September 2010 Record Date - 1 October 2010 Payment Date - 29 October 2010
Fund Name Currency ISIN Dividend PowerShares EQQQ Fund USD IE0032077012 0.0320 PowerShares FTSE RAFI US 1000 Fund USD IE00B23D8S39 0.0350 PowerShares Dynamic US Market Fund USD IE00B23D9240 0.0254 PowerShares FTSE RAFI Europe Fund EUR IE00B23D8X81 0.0286 PowerShares Global Listed Private Equity Fund EUR IE00B23D8Z06 0.0281 PowerShares FTSE RAFI UK 100 Fund GBP IE00B23LNN70 0.0318 PowerShares FTSE RAFI All-World 3000 Fund USD IE00B23LNQ02 0.0426 PowerShares FTSE RAFI Developed Europe Mid-Small Fund EUR IE00B23D8Y98 0.0260 PowerShares FTSE RAFI Developed 1000 Fund EUR IE00B23D8W74 0.0290 PowerShares FTSE RAFI Italy 30 Fund EUR IE00B23LNP94 0.0208 PowerShares FTSE RAFI Hong Kong China Fund USD IE00B3BPCG45 0.0618 PowerShares Global Agriculture NASDAQ OMX Fund USD IE00B3BQ0418 0.0173 PowerShares Middle East North Africa NASDAQ OMX Fund USD IE00B3BPCJ75 0.0501 PowerShares Investment Manager’s Report 1st Quarter 2011 Dividends
The Invesco PowerShares portfolio management team proposed and the board approved the following dividends payable in January 2011 for the Funds, zero (0) which exceeded the 1% yield test* and six (6) where dividend amounts were adequate to distribute back to shareholders for a total of six (6) Funds with dividends:
X-Date - 29 December 2010 Record Date - 31 December 2010 Payment Date - 28 January 2011
Fund Name Currency ISIN Dividend PowerShares EQQQ Fund USD IE0032077012 0.1264 PowerShares FTSE RAFI Hong Kong China Fund USD IE00B3BPCG45 0.1196 PowerShares FTSE RAFI UK 100 Fund GBP IE00B23LNN70 0.0509 PowerShares FTSE RAFI Italy 30 Fund EUR IE00B23LNP94 0.0465 PowerShares FTSE RAFI US 1000 Fund USD IE00B23D8S39 0.0312 PowerShares Dynamic US Market Fund USD IE00B23D9240 0.0142 *the 1% yield test requires that if a fund receives greater than 1% dividend yield during a quarter it must make a distribution to shareholders.

PowerShares Global Funds Ireland plc Annual Report and Audited Financial Statements
for the year ended 30 September 2011
10
Investment Manager’s Report (continued) PowerShares Investment Manager’s Report 2nd Quarter 2011 Dividends The Invesco PowerShares portfolio management team proposed and the Board approved the following dividends payable in April 2011 for the Funds, four (4) which exceeded the 1% yield test* and thirteen (13) where dividend amounts were adequate to distribute back to shareholders for a total of seventeen (17) Funds with dividends: X-Date - 30 March 2011 Record Date - 1 April 2011 Payment Date - 29 April 2011 Fund Name Currency ISIN Dividend PowerShares EQQQ Fund USD IE0032077012 0.0490 PowerShares FTSE RAFI US 1000 Fund USD IE00B23D8S39 0.0627 PowerShares Global Clean Energy Fund EUR IE00B23D9133 0.0077 PowerShares Dynamic US Market Fund USD IE00B23D9240 0.0454 PowerShares FTSE RAFI Europe Fund EUR IE00B23D8X81 0.1179 PowerShares Global Listed Private Equity Fund EUR IE00B23D8Z06 0.0565 PowerShares Palisades Global Water Fund EUR IE00B23D9026 0.0651 PowerShares FTSE RAFI Asia Pacific Ex-Japan Fund USD IE00B23D9463 0.1165 PowerShares FTSE RAFI Emerging Markets Fund USD IE00B23D9570 0.1140 PowerShares FTSE RAFI UK 100 Fund GBP IE00B23LNN70 0.0647 PowerShares FTSE RAFI All-World 3000 Fund USD IE00B23LNQ02 0.1348 PowerShares FTSE RAFI Developed Europe Mid-Small Fund EUR IE00B23D8Y98 0.0437 PowerShares FTSE RAFI Developed 1000 Fund EUR IE00B23D8W74 0.1701 PowerShares FTSE RAFI Switzerland Fund CHF IE00B23LNR19 0.0494 PowerShares FTSE RAFI Hong Kong China Fund USD IE00B3BPCG45 0.0285 PowerShares Global Agriculture NASDAQ OMX Fund USD IE00B3BQ0418 0.0301 PowerShares Middle East North Africa NASDAQ OMX Fund USD IE00B3BPCJ75 0.0307 *the 1% yield test requires that if a fund receives greater than 1% dividend yield during a quarter it must make a distribution to shareholders.

PowerShares Global Funds Ireland plc Annual Report and Audited Financial Statements
for the year ended 30 September 2011
11
Investment Manager’s Report (continued) PowerShares Investment Manager’s Report 3rd Quarter 2011 Dividends The Invesco PowerShares portfolio management team proposed and the board approved the following dividends payable in July 2011 for the Funds, six (6) which exceeded the 1% yield test* and ten (10) where dividend amounts were adequate to distribute back to shareholders, for a total of sixteen (16) Funds with dividends: X-Date - 29 June 2011 Record Date - 1 July 2011 Payment Date - 29 July 2011 Fund Name Currency ISIN Dividend PowerShares EQQQ Fund USD IE0032077012 0.0916 PowerShares FTSE RAFI US 1000 Fund USD IE00B23D8S39 0.0305 PowerShares FTSE RAFI Europe Fund EUR IE00B23D8X81 0.1282 PowerShares Global Listed Private Equity Fund EUR IE00B23D8Z06 0.0453 PowerShares Palisades Global Water Fund EUR IE00B23D9026 0.0462 PowerShares FTSE RAFI Asia Pacific Ex-Japan Fund USD IE00B23D9463 0.0406 PowerShares FTSE RAFI Emerging Markets Fund USD IE00B23D9570 0.0952 PowerShares FTSE RAFI UK 100 Fund GBP IE00B23LNN70 0.1288 PowerShares FTSE RAFI All-World 3000 Fund USD IE00B23LNQ02 0.1239 PowerShares FTSE RAFI Developed Europe Mid-Small Fund EUR IE00B23D8Y98 0.1152 PowerShares FTSE RAFI Developed 1000 Fund EUR IE00B23D8W74 0.0699 PowerShares FTSE RAFI Switzerland Fund CHF IE00B23LNR19 0.0394 PowerShares FTSE RAFI Italy 30 Fund EUR IE00B23LNP94 0.1286 PowerShares FTSE RAFI Hong Kong China Fund USD IE00B3BPCG45 0.3166 PowerShares Global Agriculture NASDAQ OMX Fund USD IE00B3BQ0418 0.0378 PowerShares Middle East North Africa NASDAQ OMX Fund USD IE00B3BPCJ75 0.2923
*the 1% yield test requires that if a fund receives greater than 1% dividend yield during a quarter it must make a distribution to shareholders.

PowerShares Global Funds Ireland plc Annual Report and Audited Financial Statements
for the year ended 30 September 2011
12
Investment Manager’s Report (continued)
PowerShares Investment Manager’s Report 4th Quarter 2011 Dividends The Invesco PowerShares portfolio management team proposed and the board approved the following dividends payable in October 2011 for the Funds, none(0) which exceeded the 1% yield test* and fifteen (15) where dividend amounts were adequate to distribute back to shareholders, for a total of fifteen (15) Funds with dividends: X-Date - 28 September 2011 Record Date - 30 September 2011 Payment Date - 28 October 2011 Fund Name Currency ISIN Dividend PowerShares EQQQ Fund USD IE0032077012 0.0793 PowerShares FTSE RAFI US 1000 Fund USD IE00B23D8S39 0.0391 PowerShares Global Clean Energy Fund EUR IE00B23D9133 0.0186 PowerShares Dynamic US Market Fund USD IE00B23D9240 0.0128 PowerShares FTSE RAFI Europe Fund EUR IE00B23D8X81 0.0468 PowerShares Global Listed Private Equity Fund EUR IE00B23D8Z06 0.0434 PowerShares Palisades Global Water Fund EUR IE00B23D9026 0.0430 PowerShares FTSE RAFI Asia Pacific Ex-Japan Fund USD IE00B23D9463 0.0674 PowerShares FTSE RAFI Emerging Markets Fund USD IE00B23D9570 0.0851 PowerShares FTSE RAFI UK 100 Fund GBP IE00B23LNN70 0.0672 PowerShares FTSE RAFI Developed Europe Mid-Small Fund EUR IE00B23D8Y98 0.0456 PowerShares FTSE RAFI Developed 1000 Fund EUR IE00B23D8W74 0.0607 PowerShares FTSE RAFI Italy 30 Fund EUR IE00B23LNP94 0.0287 PowerShares FTSE RAFI Hong Kong China Fund USD IE00B3BPCG45 0.1041 PowerShares Global Agriculture NASDAQ OMX Fund USD IE00B3BQ0418 0.0124 *the 1% yield test requires that if a fund receives greater than 1% dividend yield during a quarter it must make a distribution to shareholders.

PowerShares Global Funds Ireland plc Annual Report and Audited Financial Statements
for the year ended 30 September 2011
13
Investment Manager’s Report (continued)
Performance Analysis
Index versus Fund Performance – through September 30, 2011
Ticker Fund Name Currency AUM 1 Mo 3 Mo YTD 1 Yr Since Inception
PSRF PowerShares FTSE RAFI US 1000 Fund USD 52,823,863 -7.49% -15.87% -11.42% -1.02% -2.73%
FTSE RAFI US 1000 Index -7.47% -15.81% -10.97% -0.38% -2.10%
Variance -0.02% -0.07% -0.45% -0.64% -0.63%
PSBW PowerShares Global Clean Energy Fund EUR 5,344,523 -16.01% -29.66% -36.75% -34.38% -25.01%
Wilderhill New Energy Global Innovation Index - EUR -15.79% -29.29% -36.40% -33.76% -23.86%
Variance -0.22% -0.37% -0.35% -0.62% -1.14%
PSWC PowerShares Dynamic US Market Fund USD 12,582,076 -11.59% -22.71% -17.11% -6.75% -7.45%
Dynamic Market Intellidex Index -11.50% -22.53% -16.38% -5.56% -6.38%
Variance -0.09% -0.18% -0.73% -1.19% -1.07%
PSSP PowerShares Global Listed Private Equity Fund EUR 3,784,734 -8.73% -20.84% -22.62% -10.31% -14.42%
Global Listed Private Equity Index - EUR -8.27% -20.22% -21.45% -8.62% -11.64%
Variance -0.46% -0.62% -1.16% -1.70% -2.78%
PSHO PowerShares Palisades Global Water Fund EUR 5,865,394 -3.20% -14.65% -19.69% -8.93% -6.56%
Palisades Global Water Index - EUR -3.20% -14.59% -19.47% -8.46% -6.20%
Variance 0.01% -0.06% -0.22% -0.46% -0.36%
PSRE PowerShares FTSE RAFI Europe Fund EUR 7,076,791 -4.55% -19.42% -18.94% -14.66% -9.56%
FTSE RAFI Europe Index - EUR -4.53% -19.29% -18.40% -13.85% -8.31%
Variance -0.02% -0.13% -0.54% -0.81% -1.25%
PSRA PowerShares FTSE RAFI Asia Pacific Ex-Japan USD 5,464,628 -14.05% -21.42% -17.06% -8.58% 3.43%
Blended - FTSE RAFI Asia Pacific Ex-Japan Index -14.12% -21.40% -16.52% -7.74% 4.69%
Variance 0.07% -0.02% -0.54% -0.84% -1.26%
PSRM PowerShares FTSE RAFI Emerging Market Fund USD 13,468,418 -14.22% -22.37% -22.31% -15.73% -3.47%
Blended - FTSE RAFI Emerging Market -14.30% -22.32% -21.46% -15.14% -1.27%
Variance 0.09% -0.05% -0.85% -0.59% -2.21%
PSES PowerShares FTSE RAFI Developed Europe Mid-Small Fund
EUR 6,757,251 -7.41% -18.85% -19.53% -9.48% -5.78%
FTSE RAFI Developed Europe Mid-Small Index - EUR -7.47% -18.60% -18.87% -8.48% -5.13%
Variance 0.06% -0.25% -0.67% -1.01% -0.64%

PowerShares Global Funds Ireland plc Annual Report and Audited Financial Statements
for the year ended 30 September 2011
14
Investment Manager’s Report (continued) Performance Analysis
Index versus Fund Performance – through September 30, 2011 (continued) Ticker Fund Name Currency AUM 1 Mo 3 Mo YTD 1 Yr Since Inception
PSRD PowerShares FTSE RAFI Developed 1000 Fund EUR 5,392,572 -1.76% -12.50% -14.70% -6.49% -5.65%
FTSE RAFI Developed 1000 Index - EUR -1.82% -12.43% -14.20% -5.60% -4.54%
Variance 0.05% -0.08% -0.50% -0.90% -1.11%
EQQQ PowerShares EQQQ Fund USD 940,740,692 -4.52% -7.85% -3.19% 7.61% 7.82%
Nasdaq 100 Index -4.52% -7.77% -2.95% 7.99% 8.15%
Variance 0.00% -0.08% -0.24% -0.39% -0.33%
PSRU PowerShares FTSE RAFI UK 100 Fund GBP 25,388,301 -3.71% -13.35% -11.78% -6.04% -3.58%
FTSE RAFI UK 100 Index - GBP -3.60% -13.21% -11.29% -5.27% -2.90%
Variance -0.11% -0.15% -0.49% -0.76% -0.68%
PSRW PowerShares FTSE RAFI All-World 3000 Fund USD 7,559,107 -9.42% -20.23% -16.34% -9.21% -0.95%
Blended - FTSE RAFI All World 3000 Index -9.27% -19.20% -14.85% -7.45% 0.53%
Variance -0.16% -1.03% -1.49% -1.76% -1.48%
PTI PowerShares FTSE RAFI Italy 30 Fund EUR 2,325,528 -3.72% -25.82% -24.83% -27.06% -18.77%
FTSE RAFI Italy 30 Index - EUR -3.85% -25.85% -24.47% -26.66% -18.10%
Variance 0.13% 0.03% -0.36% -0.40% -0.67%
PDI PowerShares FTSE RAFI Switzerland Fund CHF 2,393,833 0.13% -12.60% -15.19% -12.81% -7.40%
Blended - FTSE RAFI Swiss Index - CHF 0.21% -12.62% -14.48% -12.02% -6.39%
Variance -0.09% 0.03% -0.71% -0.79% -1.02%
PSRH PowerShares FTSE RAFI Hong Kong China Fund USD 1,573,828 -17.01% -21.81% -24.48% -20.17% 0.95%
Blended - FTSE RAFI Hong Kong China -17.26% -22.13% -23.99% -19.45% 1.63%
Variance 0.25% 0.32% -0.49% -0.72% -0.67%
PSGA PowerShares Global Agriculture NASDAQ OMX Fund USD 29,060,784 -18.50% -20.79% -18.84% -5.38% 1.51%
NASDAQ OMX Global Agriculture Index (UCITs Index) -18.34% -20.44% -18.06% -4.01% 2.66%
Variance -0.16% -0.35% -0.78% -1.37% -1.16%
PEU PowerShares EuroMTS Cash 3 Month Fund EUR 72,033,882 0.10% 0.36% 0.75% 0.91% 0.73%
EuroMTS Government Bills Index - EUR 0.08% 0.41% 0.91% 1.09% 1.08%
Variance 0.02% -0.05% -0.16% -0.18% -0.36%
PSMN PowerShares Middle East North Africa NASDAQ OMX
Fund
USD 5,188,248 -4.33% -9.11% -19.13% -15.48% 4.11%
NASDAQ OMX MENA Index -4.33% -8.89% -17.66% -13.41% 6.87%
Variance 0.00% -0.22% -1.47% -2.07% -2.76%

PowerShares Global Funds Ireland plc Annual Report and Audited Financial Statements
for the year ended 30 September 2011
15
Investment Manager’s Report (continued)
Tracking Error Analysis Tracking error is defined as the difference between a portfolio's return and the benchmark or index it is managed against. The calculation used is the standard deviation of the monthly difference in the portfolio and benchmark returns over a given time period (YTD, 1 year, 3 years, since inception, etc.). Causes of Tracking Error ETFs, like index funds, are designed to track a specific market segment, investment theme or widely followed benchmark. Since they are passive in nature, tracking error for an ETF should be low or nonexistent in theory. The causes of tracking error for ETFs can include, but are not limited to the following: holdings/size of the fund, regulatory issues/constraints, cash flows and fees. In addition, a majority of the creation/redemptions are done via the “cash” process versus “in-specie”. The greatest challenge for our funds tends to be cash management due to fund size and, given the concentrated nature of some of the funds and limited liquidity on certain securities, a modest amount of tracking error is unavoidable. The report uses at least 12 months of performance difference between fund and index to obtain an accurate tracking error value for the funds. Recommended Ranges for the Funds The chart below lists appropriate levels of tracking error ranges for the current products listed in Europe using the US study discussed below as a guideline. It has been previously noted that the recommended tracking level ranges were the product of an Ibbotson report generated for the US PowerShares Board of Trustees in 2007. In that report, Ibbotson researched the ETF marketplace and proposed certain ranges as appropriate based on the nature of the underlying security, asset class, trading restrictions, etc. These ranges were updated in April 2010 with a new Ibbotson report which was authorized and analyzed by the PowerShares Management team. The Investment Manager will periodically revisit the “minimum” and “maximum” of each fund to make sure it is still appropriate as well as alternative measurements to gauge tracking accuracy. The ranges are identical to those used for PowerShares US-listed funds. Furthermore, several of the funds are listed both in the US and in Europe (cross-listed). When comparing the cross-listed tracking error levels, the European-listed funds’ results are very close to their US-listed counterparts.

PowerShares Global Funds Ireland plc Annual Report and Audited Financial Statements
for the year ended 30 September 2011
16
Investment Manager’s Report (continued) Tracking Error Analysis (continued)
Tracking Error Range (%)
Strategy Minimum Maximum
Broad Market 0.00 0.35
Thematic 0.30 2.00
Global Developed Equity 1.00 2.00
Emerging Markets Equity 2.00 4.00
Fixed Income 1.00 2.00
Source: Ibbotson Broad Market �PowerShares EQQQ Fund, PowerShares FTSE RAFI US 1000 Fund, PowerShares Dynamic US Market Fund Thematic � PowerShares Global Agriculture NASDAQ OMX Fund, PowerShares Palisades Global Water Fund, PowerShares Global Clean Energy Fund, PowerShares Global Listed Private Equity Fund Global Developed Equity � PowerShares FTSE RAFI All World 3000 Fund, PowerShares FTSE RAFI Europe Fund, PowerShares FTSE RAFI Italy 30 Fund, PowerShares FTSE RAFI Switzerland Fund, PowerShares FTSE RAFI Europe Mid-Small Fund, PowerShares FTSE RAFI UK 100 Fund, PowerShares FTSE RAFI HK China Fund, PowerShares FTSE RAFI Developed 1000 Fund, PowerShares FTSE RAFI Asia Pacific Ex-Japan Fund Emerging Markets Equity � PowerShares FTSE RAFI Emerging Markets Fund , PowerShares NASDAQ Middle East North Africa NASDAQ OMX Fund Fixed Income � PowerShares EuroMTS Cash 3 Months Fund Please note, the Irish and US boards are independent of one another and the Irish Management Company is simply using this report as a guideline for our tracking error analysis.

PowerShares Global Funds Ireland plc Annual Report and Audited Financial Statements
for the year ended 30 September 2011
17
Investment Manager’s Report (continued) Tracking Error Analysis (Continued) Through September 30, 2011
Ticker Fund Name Strategy 1 Year 2 Year 3 Year Since Inception
EQQQ PowerShares EQQQ Fund Broad Market 0.04% 0.05% 0.08% 0.09%
PSWC PowerShares Dynamic US Market Fund Broad Market 0.21% 0.26% 0.30% 0.30%
PSRF PowerShares FTSE RAFI US 1000 Fund Broad Market 0.15% 0.17% 0.48% 0.47%
PSBW PowerShares Global Clean Energy Fund Thematic 0.95% 0.91% 1.66% 1.62%
PSRE PowerShares FTSE RAFI Europe Fund Global Developed Equity 0.25% 0.32% 0.43% 0.72%
PSDE PowerShares FTSE RAFI Emerging Markets Fund Emerging Markets Equity 0.58% 1.18% 1.86% 2.14%
PSHO PowerShares Palisades Global Water Fund Thematic 0.67% 0.76% 1.62% 2.10%
PSDD PowerShares FTSE RAFI Asia Pacific Ex-Japan Fund Global Developed Equity 0.87% 0.73% 1.22% 1.14%
PSSP PowerShares Global Listed Private Equity Fund Thematic 0.47% 0.37% 1.30% 2.13%
PSRD PowerShares FTSE RAFI Developed 1000 Fund Global Developed Equity 0.66% 0.54% 0.69% 1.37%
PSES PowerShares FTSE RAFI Developed Europe Mid-Small Fund Global Developed Equity 0.30% 0.42% 0.96% 1.54%
PSRU PowerShares FTSE RAFI UK 100 Fund Global Developed Equity 0.79% 0.62% 0.63% 0.71%
PSDU PowerShares FTSE RAFI All-World 3000 Fund Global Developed Equity 0.96% 1.13% 1.56% 1.92%
PTI PowerShares FTSE RAFI Italy 30 Fund Global Developed Equity 1.63% 1.25% 1.12% 1.03%
PDI PowerShares FTSE RAFI Switzerland Fund Global Developed Equity 2.72% 2.03% N/A 2.67%
PSGA PowerShares Global Agriculture Fund Thematic 0.38% 0.34% N/A 0.81%
PSDJ PowerShares FTSE RAFI Hong Kong China Fund Global Developed Equity 2.39% 2.07% N/A 4.13%
PSMN PowerShares Middle East North Africa Fund Emerging Markets Equity 1.25% N/A N/A 1.52%
PEU PowerShares EuroMTS Cash 3 Months Fund Fixed Income 0.09% 0.07% N/A 0.08%

PowerShares Global Funds Ireland plc Annual Report and Audited Financial Statements
for the year ended 30 September 2011
Directors’ Report for the year ended 30 September 2011 (continued)
18
Investment Manager’s Report (continued) Correlation Analysis Correlation represents the relationship between two or more variables with a value assigned between 1 and -1. Correlation is the degree to which these variables are observed to move together: if they move in the same direction, there is positive correlation; if they move in opposite directions, there is negative correlation. A value of 1 indicates they are perfectly correlated and a value of −1, means they are exact opposites. The calculated value usually falls somewhere in between indicating the degree of linear dependence between the variables. The closer the coefficient is to either 1 and -1, the stronger or more weak the correlation between the variables (in this case the fund and index). The table below outlines the correlation of each of the PowerShares Irish Domiciled funds compared to their respective underlying indices. At least 1 year of data is beneficial when doing correlation analysis for the funds. To get the 1 year and since inception figures, monthly data was used for the analysis. Additional Information:
• PowerShares EQQQ – monthly data from December 2002 to present • Other Funds – monthly data from inception of fund to present
Please see the below table for detailed correlation analysis by fund for time periods of 1 year and since inception. Through September 30, 2011 Ticker Name Shares in
Issue Currency Net Asset Value Correlation 1-
Year Correlation Since
Inception
EQQQ PowerShares EQQQ Fund 17,900,000 USD 940,740,692 1.000 1.000
PSWC PowerShares Dynamic US Market Fund 1,800,001 USD 12,582,076 1.000 1.000
PSRF PowerShares FTSE RAFI US 1000 Fund 6,500,001 USD 52,823,863 1.000 1.000
PSBW PowerShares Global Clean Energy Fund 1,700,001 EUR 5,344,523 0.999 0.999
PSRE PowerShares FTSE RAFI Europe Fund 1,200,001 EUR 7,076,791 1.000 1.000
PSDE PowerShares FTSE RAFI Emerging Markets Fund 1,700,001 USD 13,468,418 1.000 0.998
PSHO PowerShares Palisades Global Water Fund 900,001 EUR 5,865,394 0.999 0.996
PSDD PowerShares FTSE RAFI Asia Pacific Ex-Japan Fund 900,001 USD 5,464,628 0.999 0.999
PSSP PowerShares Global Listed Private Equity Fund 800,001 EUR 3,784,734 1.000 0.998
PSRD PowerShares FTSE RAFI Developed 1000 Fund 700,001 EUR 5,392,572 0.999 0.998
PSES PowerShares FTSE RAFI Developed Europe Mid-Small Fund 900,001 EUR 6,757,251 1.000 0.998
PSRU PowerShares FTSE RAFI UK 100 Fund 3,250,001 GBP 25,388,301 0.998 0.999
PSDU PowerShares FTSE RAFI All-World 3000 Fund 650,001 USD 7,559,107 0.999 0.998
PTI PowerShares FTSE RAFI Italy 30 Fund 600,001 EUR 2,325,528 0.998 0.999
PDI PowerShares FTSE FARI Switzerland Fund 300,001 CHF 2,393,833 0.981 0.995
PSGA PowerShares Global Agriculture NASDAQ OMX Fund 2,800,001 USD 29,060,784 1.000 1.000
PSDJ PowerShares FTSE RAFI Hong Kong China Fund 100,001 USD 1,573,828 0.995 0.985
PSMN PowerShares Middle East North Africa NASDAQ OMX Fund 500,001 USD 5,188,248 0.996 0.997
PEU PowerShares EuroMTS Cash 3 Months Fund 705,001 EUR 72,033,882 0.898 0.949

PowerShares Global Funds Ireland plc Annual Report and Audited Financial Statements
for the year ended 30 September 2011
19
Investment Manager’s Report (continued) Outlook
The funds continue to be managed closely against their underlying indices. Minimal to moderate levels of tracking error have the potential to persist in funds with extremely small assets sizes as well the funds in which account openings are problematic in countries (such as China, India and Russia). As asset sizes grow, correlation and tracking error continue to be minimized when compared to underlying indices for the funds.
As of September 30th 2011, the total AUM for all the funds was USD1,256.3 Million or EUR936.1 Million.
For September, at the fund level, the PSRU fund had USD1.2 Million inflows and the EQQQ fund had USD30.6 Million outflows. One other fund experienced inflows and two additional fund experienced outflows.
Updates for Reg 49A Status
The following five funds were re-registered under UCITS Rule 49A. This designation will allow the portfolio managers to fully replicate the indexes.
Names of the funds:
PSHO - PowerShares Palisades Global Water Fund (re-registered on 10 May 2010)
PSRU - PowerShares FTSE RAFI UK 100 Fund (re-registered on 10 May 2010)
PSGA - PowerShares Global Agriculture NASDAQ OMX Fund (re-registered on 10 May 2010)
PSDE – PowerShares FTSE RAFI Emerging Markets Fund (re-registered on 25 November 2010)
PSMN – PowerShares Middle East North Africa NASDAQ OMX Fund (re-registered on 25 November 2010)

PowerShares Global Funds Ireland plc Annual Report and Audited Financial Statements
for the year ended 30 September 2011
20
Investment Manager’s Report (continued)
PEA Eligibility (Plan d'Eparnge en Actions)
This PEA Eligibility test is to ensure that the ETFs noted below are eligible to French investors wishing to invest in the funds within their PEA (French saving plan). The requirement is that 75% of their net assets in equity securities issued by companies have their head office in the European Union, Norway or Iceland. This is an annual check for the regulators, however, quarterly we keep track of PEA Eligibility status for the Board.
During the period under review, ended 30 September 2011, the PowerShares FTSE RAFI Europe Fund has invested on average 99.9% of its net assets in equity securities, as listed in article L.221-31, I, 1°, a, b, and c of the Code Monétaire et Financier, issued by companies which have their head office in the European Union, Norway or Iceland.
During the period under review, ended 30 September 2011, the PowerShares FTSE RAFI Developed Europe Mid-Small Fund has invested on average 95.11% of its net assets in equity securities, as listed in article L.221-31, I,1°, a, b, and c of the Code Monétaire et Financier, issued by companies which have their head office in the European Union, Norway or Iceland.

PowerShares Global Funds Ireland plc Annual Report and Audited Financial Statements
for the year ended 30 September 2011
21
Investment Manager’s Report (continued) Swap Transition
As of 5th January 2011, Invesco PowerShares team transitioned three funds from a direct replication strategy to a
swap-based replication strategy. The following chart lists the three funds.
Swap-Based Fund Old Expense
Ratio
New Expense Ratio
Counterparty
PowerShares FTSE RAFI Emerging Markets Fund
0.85% 0.65% Morgan Stanley
PowerShares FTSE RAFI All -World 3000 Fund
0.55% 0.50% Morgan Stanley
PowerShares Middle East North Africa NASDAQ OMX Fund
0.95% 0.75% Morgan Stanley
Index Transition
As discussed at the December 2009 board meeting and approved, the Invesco PowerShares team transitioned the underlying indices for five of the UCITS funds from the legacy Dynamic Indices (sponsored by QSG) to new FTSE RAFI Indices.
The transition for the existing Dynamic funds to the new funds tracking the FTSE RAFI Indices was effective 1st
February 2010. The following chart outlines the legacy fund and the corresponding new fund:
Old Fund Old Fund Currency
New Fund New Fund Currency
New FTSE RAFI Index
PowerShares Dynamic Italy Fund
EUR PowerShares FTSE RAFI Switzerland Fund
CHF FTSE RAFI Switzerland Index
PowerShares Dynamic Europe Fund
EUR FTSE RAFI Emerging Markets Fund
USD FTSE RAFI Emerging Markets Index
PowerShares Dynamic Global Developed Markets Fund
USD FTSE RAFI Asia Pacific Ex Japan Fund
USD FTSE RAFI Asia Pacific Ex -Japan Index
PowerShares Dynamic Japan Fund
GBP FTSE RAFI Hong Kong China Fund
USD FTSE RAFI Hong Kong China Index
PowerShares Dynamic UK Fund
GBP FTSE RAFI All World 3000 Fund
USD FTSE RAFI All- World 3000 Index
Invesco PowerShares Capital Management LLC Date: 14 October 2011.

PowerShares Global Funds Ireland plc Annual Report and Audited Financial Statements
for the year ended 30 September 2011
22
Directors’ Report for the year ended 30 September 2011 The Directors submit their annual report together with the audited financial statements for the year ended 30 September 2011.
Directors’ Responsibilities Irish company law requires the Directors to prepare financial statements for each financial period which give a true and fair view of the state of affairs of the Company and of the profit or loss of the Company for that period. In preparing those financial statements, the Directors are required to: • select suitable accounting policies and then apply them consistently; • make judgements and estimates that are reasonable and prudent; and • prepare the financial statements on a going concern basis unless it is inappropriate to presume that the Company
will continue in business.
The Directors confirm that they have complied with the above requirements in preparing the financial statements.
The Company’s business activities, together with the factors likely to affect its future development, performance and position are set out in the Investment Manager's Report. The financial position of the company, is described in the financial statements on pages 43 to 74. In addition, the Investment Manager's Report (pages 4 to 21) sets out the objectives of each fund and the outlook for the funds. The Company has considerable assets under management with minimal to moderate levels of tracking error. As a consequence, the Directors believe that the company is well placed to manage its business successfully despite the current uncertain economic outlook.
The Directors have a reasonable expectation that the company has adequate resources to continue in operational existence for the foreseeable future. Thus they continue to adopt the going concern basis of accounting in preparing the annual financial statements.
The Directors are responsible for keeping proper books of account which disclose with reasonable accuracy at any time the financial position of the Company and to enable them to ensure that the financial statements are prepared in accordance with accounting standards generally accepted in Ireland and comply with the Companies Acts, 1963 to 2009 and the European Communities (Undertakings for Collective Investment in Transferable Securities) Regulations, 2011. They are also responsible for safeguarding the assets of the Company and hence for taking reasonable steps for the prevention and detection of fraud and other irregularities.
The Company has appointed Invesco PowerShares Capital Management Ireland Limited (“the Manager”) as manager of the Company who has, in turn delegated certain duties to the Investment Manager, Invesco PowerShares Capital Management LLC (the “Investment Manager”) and the Administrator, BNY Mellon Fund Services (Ireland) Limited (the “Administrator”). The Company has appointed BNY Mellon Trust Company (Ireland) Limited (the “Custodian”) to act as custodian of the Company’s assets.
The measures taken by the Directors to secure compliance with the Company’s obligations to keep proper books of account include the use of appropriate systems and procedures and the employment of competent persons. The books of account are retained at the office of the Administrator at Guild House, Guild Street, International Financial Services Centre, Dublin 1.
Corporate Governance Statement
General Principles The Company is subject to compliance with the requirements of the Irish Companies Acts 1963 to 2009 (the “Irish Companies Acts”), the European Communities (Undertakings for Collective Investment in Transferable Securities) Regulations, 2011, (the “UCITS Regulations”) and the Central Bank of Ireland (the “Central Bank”) UCITS Notices and guidance notes, as applicable to the Company. The requirements stemming from these are set out in the Corporate Governance Code published by the the Irish Funds Industry Association for Irish Domiciled Collective Investment Schemes (the “IFIA Code”). The IFIA Code is publically available at www.irishfunds.ie.

PowerShares Global Funds Ireland plc Annual Report and Audited Financial Statements
for the year ended 30 September 2011
23
Directors’ Report for the year ended 30 September 2011 (continued) Corporate Governance Statement (continued) General Principles (continued) While the IFIA Code sets out the minimum standards that the Company must adhere to, the Company adheres to corporate governance practices that are significantly in excess of these minimum standards and therefore operates on the basis of its own corporate governance policy. The Company, however, complies with all of the provisions of the IFIA Code and also adheres to additional corporate governance practices which are set out below. As an overseas company with a premium listing, the Company is required to comply with the provisions of the UK Corporate Governance Code published by the Financial Reporting Council (the “UK Code”). The Directors place a significant emphasis on strong corporate governance practices. Accordingly, in addition to complying with the IFIA Code, a number of the principles of the UK Code have also been incorporated into the Company’s corporate governance practices to the extent that they are relevant and appropriate given the Company’s activities as an open-ended investment company and its compliance with the laws and regulations outlined above. The UK Code is publicly available at www.frc.org.uk. The UK Listing Rules in the FSA Handbook require the Company to state how it has applied the Main Principles set out in the UK Code in a manner that would enable shareholders to evaluate how the principles have been applied and to explain any areas and the reasons for non-compliance with the provisions of the UK Code. Compliance The Board considers that the Company has complied with the provisions contained in the UK Code throughout the accounting period, except as explained below, and this statement describes how the relevant principles of governance are applied to the Company. The UK Code contains provisions relating to: (i) the appointment and role of chief executive; (ii) the need to designate a Director as a senior independent director; (ii) the need to establish a nomination committee; (iii) the need to establish a remuneration committee; (iv) contractual periods for Directors; and (v) formal reviews of the Board's performance. For the reasons already set out and which will be further explained herein, the Board does not consider these provisions relevant to the Company. Therefore the Company was not compliant with these provisions during the period under review. The Board In accordance with the Irish Companies Acts and the Articles of Association of the Company, unless otherwise determined by an ordinary resolution of the Company in general meeting, the number of Directors may not be less than two provided however that a majority of the Directors are at all times resident outside of the United Kingdom. During the period covered in this Annual Report, the Board comprised four non-executive Directors, three of whom were independent. The independence of these Directors has been considered by the Board. The Chariman of the Board is not an independent Director, but as he was the only non-independent Director during the period covered, the Board believes that the integrity and independence of the board as a whole is preserved and that his connection to the Investment Manager has assisted the Board in carrying out its oversight duties. The Board believes that because the Company is an OEIC and due to the size of the Board, it is not necessary to appoint either a senior independent Director or a chief executive. Subsequent to the year-end, Mr Brian Collins, Mr Cormac O'Sullivan and Ms Leslie Schmidt were all appointed as non-executive Directors, whilst Eugene Regan and Eimear Cowhey resigned as independent non-executive directors (effective 31 December 2011). Details of the Directors and the positions held are set out below, under the heading “Directors Biographies”.

PowerShares Global Funds Ireland plc Annual Report and Audited Financial Statements
for the year ended 30 September 2011
24
Directors’ Report for the year ended 30 September 2011 (continued) Corporate Governance Statement (continued) The Board (continued) The Company does not have a nominations committee. The Board itself scrutinises candidates to fill any vacancies in the Board which may arise from time to time. Appointments to the Board are also subject to the approval of the Central Bank. As the Company is an OEIC, the Board does not consider it necessary to engage an external search consultancy or openly advertise in order to fill vacancies in the board which may arise from time to time. The Directors do not have service contracts and are not appointed for specified time periods subject to re-election by shareholders. Since the Company is an OEIC and executive management is carried out by the Investment Manager, the Board does not consider it necessary to protect shareholders' interests by setting out specified time periods and re-election conditions for the Directors. The Board believes that the Directors dealings with shareholders (as outlined below) and the shareholder rights under Irish law and the Company's Articles of Association offer sufficient protection to shareholders in this regard. The Company has not constituted a remuneration committee. The Company is an OEIC and has no employees or executive Directors. Therefore much of Schedule A of the UK Code does not apply, for example none of the Directors receive performance related remuneration, pension contributions or any other type of incentive related payments. All other Directors have fees paid to them which are agreed with the Investment Manager. The Board believes that the level of remuneration for those Directors who take a fee properly reflects the time commitment and responsibilities of their roles. The maximum amount of remuneration payable to the Directors is €25,000, as set out on page 41 of the prospectus of the Company. Prior to their appointment each new Director is provided with all relevant information regarding the Company and their duties and responsibilities as a Director. The Company’s policy is to encourage Directors to keep up to date with developments relevant to the Company. The Directors have attended and will continue to attend updates and briefings run by the Investment Manager and which are relevant to the Company. The Directors also receive regular briefings from, amongst others, the auditors, investment strategists, trustees and legal advisors regarding any proposed product developments or changes in laws or regulations that could affect the Company. The Board is supplied with information in a timely manner and in a form and of a quality appropriate to enable it to discharge its duties. There is no formal review process to assess the performance of the Board, its committees and the individual Directors. The Board meets at regular intervals and a majority of the members are independent. The independent Directors effectively perform the function of reviewing both the Board's work and the work of the Investment Manager, who exercises the day-to-day running of the funds. Furthermore, the the Directors are always available to discuss any concerns or views of shareholders and, as such, the Board does not feel that a routine review process is necessary, as the Board is already effectively performing this function by reviewing the work of the Investment Manager. All shareholders are encouraged to attend the Annual General Meeting to discuss the business tabled and to exercise their voting rights. The Company announces the result of resolutions proposed at general meetings but does not make the full details of voting available on its website. The external auditor of the Company (the “Auditor”) has full access to the Board should they deem it necessary. The Board is responsible for the Company’s overall direction and strategy and to this end it reserves the decision making power on issues such as the determination of medium and long term goals, review managerial performance, organisational structure and capital needs and commitments to achieve the Company’s strategic goals. To achieve these responsibilities, the Board meets on a quarterly basis to review the operations of the Company, address matters of strategic importance and to receive reports from the Administrator, Custodian and the Investment Manager. However, a Director may, and the Company Secretary on the requisition of a Director will, at any time summon a meeting of the Directors and ad hoc meetings in addition to the quarterly meetings are convened as required.

PowerShares Global Funds Ireland plc Annual Report and Audited Financial Statements
for the year ended 30 September 2011
Directors’ Report for the year ended 30 September 2011 (continued)
25
Corporate Governance Statement (continued) The Board (continued) The Board also approves the prospectus, circulars to shareholders, listing particulars and other relevant legal documentation. A formal schedule of matters specifically reserved for decision by the Board has been defined. The Directors also have access to the advice and services of the Company Secretary, external counsel and the resources of the Investment Manager should they be needed. Where necessary, in the furtherance of their duties, the Board and individual Directors may seek independent professional advice at the expense of the Company. Any Director who resigns their position is obliged to confirm to the Board and the Central Bank that the resignation is not connected with any issues with or claims against the Company. Furthermore, any Director who has concerns about the running of the Company or a proposed course of action may provide a written statement to the Chairman outlining his concerns for circulation to the Board or alternatively may have his concerns formally recorded in the minutes of a Board meeting. Questions arising at any meeting of the Directors are determined by a majority of votes. In the case of an equality of votes, the chairman has a second or casting vote. The quorum necessary for the transaction of business at a meeting of the Directors is two, provided that if a majority of the Directors present are resident in the UK, the Directors present, irrespective of their number, shall not constitute a quorum, other than for the purposes of filling vacancies in their number or for summoning general meetings of the Company, but not for any other purpose.
The Company has maintained appropriate Directors’ and officers’ liability insurance cover throughout the year. Strategic issues and all operational matters of a material nature are determined by the Board. If the shareholders wish to engage on matters relating to the management of the Company then invariably they will wish to discuss these matters or meet with the Investment Manager. However, the Board is willing to make itself available to shareholders on request.
Attendance Record Board – year
ended 30 September
2011
Audit Committee – year ended 30
September 2011
Number of meetings held 6 3
Benjamin T. Fulton (Chairman of the Board) 5 -
Eimear Cowhey 6 3
Eugene Regan 5 2
Adrian Waters (Audit Committee Chair) 6 3

PowerShares Global Funds Ireland plc Annual Report and Audited Financial Statements
for the year ended 30 September 2011
26
Directors’ Report for the year ended 30 September 2011 (continued) Corporate Governance Statement (continued) The Board (continued) Directors’ Biographies Eimear Cowhey – Independent Non-Executive Director / Member of the Audit Committee Mrs Cowhey is an Irish Resident with over 20 years' experience in the offshore funds industry and acts as an independent director in relation to a number of Irish companies and investment funds. From 1999 to 2006 she held various executive positions within The Pioneer Group, including Head of Legal and Compliance and Head of Product Development. From 1992 to 1999 she was Global Fund Director and Head Legal Counsel of INVESCO Asset Management. She qualified in 1990 as an Irish solicitor with the Irish law firm William Fry and she holds a Bachelor of Civil Law received from University College Dublin in 1986. She also holds a C. Dip. A F (Certified Diploma in Accounting and Finance) which was received from the Chartered Association of Certified Accountants in 1989. Mrs Cowhey acts as a non-executive director to a number of Irish companies. She is a former Council member and past Chairman of IFIA. She was also a member of the IFSC Funds Group which is run under the auspices of the Department of An Taoiseach and is a joint government/industry group to advise the government of investment fund related matters. Mrs Cowhey is a regular speaker at conferences and lectures at the Law Society on financial services law. Mrs Cowhey resigned from the Board with effect from 31 December 2011. Benjamin T. Fulton – Chairman and Non-Executive Director Mr Fulton is a US citizen with over twenty years experience in the financial industry specialising in the areas of new product development and management and is currently the Managing Director and Head of Global ETFs of PowerShares Capital Management LLC. Prior to working with the Promoter he was a principal of Clermont Consulting a consulting firm focussed on the creation and development of retail investment products. Mr Fulton was a President and founding partner of Claymore Securities, a financial services firm. In his capacity as President, he oversaw the development and product management of all the firm’s product offerings, including closed-ended funds, mutual funds, unit investment trusts, structured investments and hedge funds. Prior to founding Claymore Securities, Mr Fulton was Managing Director of Structured Investments at Nuveen Investments. His responsibilities included product development and management for Nuveen Structured Investments and International Division. Under Mr Fulton’s tenure, Nuveen Investments’ product line increased from a predominantly municipal bond focus to a broad array of equity offerings. Before joining Nuveen Investments, Mr Fulton was Senior Vice President of Product Development at Nike Securities L.P. His responsibilities included the expansion of Nike’s unit investment trust product line. He has also served as a financial consultant for Thomson McKinnon and Bear Stearns. Mr Fulton received a BA in Business Administration from Taylor University in 1984. Mr Fulton is chairman of PowerShares Global Funds Ireland plc and has had no changes to any other significant commitments during the year ending 30 September 2011. Eugene Regan – Independent Non-Executive Director / Member of the Audit Committee Mr Regan is an Irish citizen and a practicing barrister of the Four Courts in Dublin, Ireland. Prior to entering private practice in 1995, Mr Regan was Director and General Manager of Agra Trading, Ltd, an international trading company. Mr Regan has served as a member of the cabinet for a European Commissioner in Brussels and also was Chief Executive for the Irish Meat Exporters Association. Mr Regan also serves as a board member for several Goldman Sachs Funds. Mr Regan holds a B.A. and M.A.(Economics) from University College Dublin, an M.A. in International Law from Vrije Universiteit Brussels, Belgium, and a diploma in Applied Finance from the Irish Management Institute in Dublin. Mr Regan is a Senator in the Irish Seanad (the upper house of the Irish Parliament). Mr. Regan resigned from the Board with effect from 31 December 2011

PowerShares Global Funds Ireland plc Annual Report and Audited Financial Statements
for the year ended 30 September 2011
Directors’ Report for the year ended 30 September 2011 (continued)
27
Corporate Governance Statement (continued) The Board (continued) Adrian Waters – Independent Non-Executive Director / Member of the Audit Committee Mr Waters is an Irish citizen resident in Ireland and a Fellow of The Institute of Chartered Accountants in Ireland. He has been awarded Chartered Director status by the UK Institute of Directors. He is the Principal of Fund Governance Solutions, an independent funds consultancy. He has over 20 years’ experience in the offshore funds industry. From 1993 to 2001, he held various executive positions within The BISYS Group, Inc. (now part of Citi), including Chief Executive Officer of BISYS Fund Services (Ireland) Limited and finally as Senior Vice President – Europe for BISYS Investment Services out of London. From 1989 to 1993, he was employed by the Investment Services Group of PricewaterhouseCoopers in New York and prior to that by Oliver Freaney and Company, Chartered Accountants, in Dublin. Mr Waters holds a Bachelor of Commerce degree and a Post Graduate Diploma in Corporate Governance both received from University College Dublin in 1985 and 2005, respectively. He is an independent director of several other offshore funds. Brian Collins – Independent Non-Executive Director Mr Collins is an Irish citizen and joined Bank of Ireland (Corporate Banking) in 1972 where he held various management positions. From 1986 to 1992 Mr. Collins served as General Manager and Managing Director of Bank of Ireland’s Hong Kong business and was primarily engaged in Treasury, Corporate and Trade finance before his appointment as Managing Director of Bank of Ireland International Finance in 1992 where he served until 1996. From 1996 until July 2004 Mr. Collins served as Managing Director of Bank of Ireland Securities Services where he had responsibility for client assets in excess of €120 billion and was a member of the Bank of Ireland Group Operating Risk Committee. Mr. Collins was formerly Chairman of the Dublin Funds Industry Association and Chairman of An Taoiseach’s Fund Industry Committee. Mr. Collins is a fellow of the Institute of Bankers in Ireland. Mr. Collins holds other non executive directorships, mostly in the fund management industry. Mr. Collins was appointed to the Board with effective date 1 December 2011. Cormac O’Sullivan – Non-Executive Director Mr O'Sullivan is an Irish citizen and head of Invesco Ireland. He is also a director of a number of Invesco promoted funds. Mr. O’Sullivan is a member of the Invesco Global Product Committee which is responsible for the on-going development of the Invesco Global Product Range. Mr. O’Sullivan joined Invesco in 2000 and has served in various roles, including the establishment of an internal team to provide project management and consultancy across the organisation. Prior to joining Invesco, Mr. O’Sullivan worked with the Bank of Ireland in a number of progressive roles in the bank’s information technology division. Mr. O’Sullivan is a member of the Institute of Bankers in Ireland. Mr. O’Sullivan was appointed to the Board with effective date 1 December 2011. Leslie Schmidt – Non-Executive Director Ms Schmidt is a US citizen and a Managing Director responsible for a majority of Invesco’s worldwide fund account ex-Asia Pacific. She is also Senior Vice President of Invesco Advisers, Inc., a U.S. registered investment adviser subsidiary of Invesco Ltd. Since 1992 Ms. Schmidt has served in various roles and capacities with Invesco Ltd. and its various investment advisory and distributor subsidiaries in various locations. She is also a director of Invesco Management S.A. a Luxembourg management company. Ms. Schmidt is a director of a number of Invesco promoted funds. Ms. Schmidt was the General Manager of the Invesco Dublin office from March 2008 until December 2010. Prior to joining Invesco, Ms. Schmidt spent seven years with KPMG Peat Marwick in a number of progressive auditing roles primarily in the investment services area. Ms Schmidt is a Certified Public Accountant and a member of the American Institute of Certified Public Accountants. Ms. Schmidt was appointed to the Board with effective date 1 December 2011.

PowerShares Global Funds Ireland plc Annual Report and Audited Financial Statements
for the year ended 30 September 2011
Directors’ Report for the year ended 30 September 2011 (continued)
28
Corporate Governance Statement (continued) Audit Committee The Board, on the Company’s behalf, has appointed an Audit Committee, which comprises the three independent non-executive directors who are responsible for conducting certain tasks in relation to financial reporting and the supervision of the preparation of the financial accounts of the Company as set out below. The Audit Committee is also tasked with, amongst other matters, compliance reporting and internal audit matters. The terms of reference of the Audit committee can be made available to shareholders upon request. The members of the Audit Committee possess the relevant expertise to ensure the management and functions of the Company are properly carried out, as is highlighted in their biographies above. The Audit Committee proposes recommendations to the Board regarding the approval of the interim financial accounts and annual financial accounts for the Company. The Audit Committee reviews and monitors the external auditors’ independence, objectivity and the effectiveness of the audit process regularly, taking into consideration relevant professional and regulatory requirements. During the year ended 30 September 2011, the tax department with PricewaterhouseCoopers provided tax compliance services to the Company. The provision of these services was approved by the Board. The Board is satisfied that there are sufficient safeguards in place to protect the objectivity and independence of the Auditor. The specific safeguards in place include the segregation between the departments providing the services within PricewaterhouseCoopers. In addition, the services provided by the taxation department are one of compliance and not the performance of Management functions which the Auditor may need to rely on. Internal Control and Risk Management Systems The Board is responsible for the overall internal controls of the Company and for reviewing their effectiveness, including reviewing operational compliance and risk management carried out by third parties involved in the management and administration of the Company. The Board is also responsible for ensuring that financial information published or used within the business is reliable, and for regularly monitoring compliance with regulations governing the operation of the Company. The Board is assisted in this regard by the Audit Committee and together they review the effectiveness of the internal control systems on an ongoing basis to identify, evaluate and manage the Company’s significant risks. As part of this process, there are procedures designed to capture and evaluate any failings or weaknesses. Should a case be categorised by the Board as significant, procedures exist to ensure that necessary action is taken to remedy the failings. The Board is not aware of any significant failings or weaknesses in internal control arising in the period under review. As the management and administration of the Company is delegated to the Manager, the Investment Manager, Administrator and Custodian, the control processes of the risks identified, covering financial, operational, compliance and risk management, are embedded in the operations of the Manager, the Investment Manager, the Administrator and the Custodian. There is a monitoring and reporting process to review these controls, which has been in place throughout the period under review and up to the date of this report, carried out by the Manager’s corporate audit department. The Manager’s internal audit and operational risk units report to the Company through the Audit Committee on a quarterly basis. The Audit Committee also receives a report from the Administrator and the Custodian on the internal controls of the administrative and custodial operations of the Company. It is not necessary for the Company to have its own internal audit function because all of the management and administration of the Company is delegated to the Manager, Investment Manager, Administrator and Custodian. The Board recognises that these control systems can only be designed to manage rather than eliminate the risk of failure to achieve fund objectives, and to provide reasonable, but not absolute, assurance against material misstatement or loss, and relies on the operating controls established by the service providers.

PowerShares Global Funds Ireland plc Annual Report and Audited Financial Statements
for the year ended 30 September 2011
Directors’ Report for the year ended 30 September 2011 (continued)
29
Corporate Governance Statement (continued) Internal Control and Risk Management Systems (continued) The Company does not have any employees and therefore it does not have a “Whistleblowing” policy. However, the Investment Manager has a “Whistleblowing” policy under which its staff, in confidence, may raise concerns about possible improprieties in matters of financial reporting or other matters in so far as they may affect the Company. During the year ended 30 September 2011, the Board was responsible for the approval of the annual financial statements as set out in the Statement of Directors’ Responsibilities. It is a statutory requirement that the annual financial statements are audited by one or more persons empowered to audit accounts in accordance with the Irish Companies Acts and in this regard the Board, on the Company’s behalf, engages the Auditor. The annual financial accounts of the Company are produced by the Administrator, reviewed by the Investment Manager, then presented to the Audit Committee for consideration prior to the Audit Committee's recommendation to the Board. The Audit Committee supports the work of the Board in ensuring that records are correctly maintained to support the production of the annual financial accounts. As part of its review procedures the Audit Committee receives presentations from relevant parties including consideration of Irish accounting standards and their impact on the annual financial statements, and presentations and reports on the audit process. The Chairman of the Audit Committee reports directly to the Board and presents the findings of the Audit Committee at the board meeting where the Board is asked to approve the annual financial accounts. Once the annual financial accounts are approved by the Board of Directors, the annual financial accounts are filed with the Central Bank, the Irish Stock Exchange and the UK Listing Authority, the German Federal Financial Supervisory Authority (BaFin), the Swiss Financial Market Supervisory authority (FINMA), French Financial Markets Authority (AMF), Italian Commissione Nazionale Per LsSocieta La Borsa (CONSOB), and the Netherlands Authority for Financial Markets (AFM). Dealings with Shareholders Direct contact with shareholders is usually through the Investment Manager who then reports back to the Directors and this is normally the main forum through which the Directors develop an understanding of the views of major shareholders. However, the Directors are always available to discuss any concerns or views of shareholders. All shareholders are encouraged to attend the Annual General Meeting to discuss the business tabled and to exercise their voting rights. The Company announces the result of resolutions proposed at general meetings but does not make the full details of voting available on its website. The convening and conduct of shareholders’ meetings are governed by the Articles of Association of the Company (the “Articles”) and the Irish Companies Acts. Although the Directors may convene an extraordinary general meeting of the Company at any time, the Directors were required to convene the first annual general meeting of the Company within eighteen months of incorporation and each subsequent annual general meeting thereafter must be within fifteen months of the date of the previous annual general meeting provided that an annual general meeting is held once in each year within six months of the financial year end of the Company. Shareholders representing not less than one-tenth of the paid up share capital of the Company may also request the Directors to convene a shareholders’ meeting. At least twenty one clear days’ notice of every annual general meeting and any meeting convened for the passing of a special resolution must be given to shareholders and fourteen days’ notice must be given in the case of any other general meeting, unless the Auditors and all the shareholders of the Company entitled to attend and vote thereat, agree to shorter notice. The Chairman ensures that the chairman of the Audit Committee is available to answer questions at the annual general meeting and that all Directors will attend.

PowerShares Global Funds Ireland plc Annual Report and Audited Financial Statements
for the year ended 30 September 2011
Directors’ Report for the year ended 30 September 2011 (continued)
30
Corporate Governance Statement (continued) Dealings with Shareholders (continued) Two shareholders present either in person or by proxy constitutes a quorum at a general meeting. The share capital of the Company is divided into different classes of shares and the Irish Companies Acts and the Articles of Association provide that the quorum for a general meeting convened to consider any alteration to the rights attached to any class of shares, is two or more shareholders present in person or by proxy, holding or representing by proxy at least one third of the issued shares of the relevant class. Every holder of participating shares or non-participating shares present, in person or by proxy who, votes on a show of hands is entitled to one vote. On a poll, every holder of participating shares present, in person or by proxy, is entitled to one vote in respect of each share held by him and every holder of non-participating shares is entitled to one vote in respect of all non-participating shares held by him. At any general meeting, a resolution put to the vote of the meeting is decided on a show of hands unless, before or upon the declaration of the result of the show of hands, a poll is demanded by the chairman of the general meeting, or by at least five shareholders present having the right to vote at such meeting, or any holder or holders of participating shares present, in person or by proxy, representing at least one tenth of the shares in issue having the right to vote at such meeting. Shareholders may resolve to sanction an ordinary resolution or special resolution at a shareholders’ meeting. Alternatively, a resolution in writing signed by all of the shareholders for the time being entitled to attend and vote on such resolution at a general meeting, will be valid and effective for all purposes as if the resolution had been passed at a general meeting of the Company duly convened and held and may consist of several documents in like form, each signed by one or more shareholders. An ordinary resolution of the Company (or of the shareholders of a particular class of shares) requires a simple majority of the votes cast by the shareholders voting, in person or by proxy, at the meeting at which the resolution is proposed. A special resolution of the Company (or of the shareholders of a particular class of shares) requires a majority of not less than three quarters of the votes cast by the shareholders present, in person or by proxy, and voting in general meeting in order to pass a special resolution including a resolution to amend the Articles. Review of the Business and Future Developments The Company is structured as an umbrella fund which may comprise one or more funds. The Company may at any time establish new classes of shares within a fund as well as new funds. Any new fund will require the prior approval of the Central Bank and the establishment of any new class of shares must be notified in advance to the Central Bank. A review of market activities and strategy for the Funds can be found in the Investment Manager’s report on pages 6 to 8. The Company's strategy for generating value over time is set out in the investment objectives of each of the individual Funds. As ETFs, the funds should preserve their value in line with the relevant exchanges. The Funds have procedures in place to minimise tracking errors, as detailed in the Investment Manager's report on pages 17 to 19. Any alteration to the investment objectives set out in the supplemental prospectuses of the Funds (as summarised in the Investment Manager's report above) are subject to prior approval by the shareholders of such Fund. Investment Objective Please see Investment Manager Report on pages 4-21 for investment objectives.

PowerShares Global Funds Ireland plc Annual Report and Audited Financial Statements
for the year ended 30 September 2011
31
Directors’ Report for the year ended 30 September 2011 (continued) Risk Management Objectives and Policies Investment in the Company carries with it a degree of risk including, but not limited to, the risks referred to in note 14 of these financial statements. Results and Dividends The results and dividends for the year are set out in the Profit and Loss Account on pages 51-58. The Company may declare and pay dividends on any classes of shares in the funds of the Company which are structured as distributing share classes.

PowerShares Global Funds Ireland plc Annual Report and Audited Financial Statements
for the year ended 30 September 2011
Directors’ Report for the year ended 30 September 2011 (continued)
32
Results and Dividends (continued)
December 2009
Fund Name Dividend Per Share
Record Date Payment Date
Dividend Cash Amount
PowerShares EQQQ Fund USD0.055 4 January 2010 29 January 2010 USD836,000 PowerShares Global Listed Private Equity Fund
EUR0.031 4 January 2010 29 January 2010 EUR15,500
PowerShares FTSE RAFI US 1000 Fund
USD0.019 4 January 2010 29 January 2010 USD76,000
PowerShares Dynamic US Market Fund
USD0.018 4 January 2010 29 January 2010 USD54,000
PowerShares FTSE RAFI Developed Europe Mid-Small Fund
EUR0.012 4 January 2010 29 January 2010 EUR7,200
PowerShares FTSE RAFI UK 100 Fund
GBP0.048 4 January 2010 29 January 2010 GBP21,600
PowerShares Dynamic UK Fund GBP0.046 4 January 2010 29 January 2010 GBP16,100 PowerShares FTSE RAFI Italy 30 Fund
EUR0.032 4 January 2010 29 January 2010 EUR19,200
PowerShares Dynamic Italy Fund EUR0.016 4 January 2010 29 January 2010 EUR3,200 PowerShares Dynamic Japan Fund GBP0.087 4 January 2010 29 January 2010 GBP8,700
March 2010
Fund Name Dividend Per Share
Record Date Payment Date
Dividend Cash Amount
PowerShares EQQQ Fund USD0.031 6 April 2010 30 April 2010 USD474,300 PowerShares FTSE RAFI US 1000 Fund
USD0.020 6 April 2010 30 April 2010 USD68,000
PowerShares FTSE RAFI UK 100 Fund
GBP0.042 6 April 2010 30 April 2010 GBP18,900
June 2010
Fund Name Dividend Per Share
Record Date Payment Date
Dividend Cash Amount
PowerShares EQQQ Fund USD0.063 2 July 2010 30 July 2010 USD1,045,800 PowerShares FTSE RAFI US 1000 Fund
USD0.030 2 July 2010 30 July 2010 USD105,000
PowerShares FTSE RAFI Europe Fund
EUR0.115 2 July 2010 30 July 2010 EUR264,500
PowerShares Global Listed Private Equity Fund
EUR0.052 2 July 2010 30 July 2010 EUR26,000
PowerShares FTSE RAFI UK 100 Fund
GBP0.109 2 July 2010 30 July 2010 GBP49,050
PowerShares FTSE RAFI All-World 3000 Fund
USD0.040 2 July 2010 30 July 2010 USD46,000
PowerShares FTSE RAFI Developed Europe Mid-Small Fund
EUR0.086 2 July 2010 30 July 2010 EUR51,600
PowerShares FTSE RAFI Developed 1000 Fund
EUR0.061 2 July 2010 30 July 2010 EUR30,500

PowerShares Global Funds Ireland plc Annual Report and Audited Financial Statements
for the year ended 30 September 2011
Directors’ Report for the year ended 30 September 2011 (continued)
33
Results and Dividends (continued) June 2010 (continued) Fund Name Dividend Per
Share Record Date Payment Date
Dividend Cash
Amount PowerShares FTSE RAFI Italy 30 Fund
EUR0.124 2 July 2010 30 July 2010 EUR111,600
PowerShares FTSE RAFI Switzerland Fund
CHF 0.132 2 July 2010 30 July 2010 CHF 26,400
PowerShares FTSE RAFI Hong Kong China Fund
USD0.238 2 July 2010 30 July 2010 USD23,800
PowerShares Middle East North Africa NASDAQ OMX Fund
USD0.268 2 July 2010 30 July 2010 USD53,600
September 2010 Fund Name Dividend Per
Share Record Date Payment Date
Dividend Cash
Amount PowerShares EQQQ Fund USD0.0320 01 October 2010 29 October 2010 USD515,200 PowerShares FTSE RAFI US 1000 Fund
USD0.0350 01 October 2010 29 October 2010 USD171,500
PowerShares Dynamic US Market Fund
USD0.0254 01 October 2010 29 October 2010 USD83,820
PowerShares FTSE RAFI Europe Fund
EUR0.0286 01 October 2010 29 October 2010 EUR48,620
PowerShares Global Listed Private Equity Fund
EUR0.0281 01 October 2010 29 October 2010 EUR14,050
PowerShares FTSE RAFI UK 100 Fund
GBP0.0318 01 October 2010 29 October 2010 GBP14,310
PowerShares FTSE RAFI All-World 3000 Fund
USD0.0426 01 October 2010 29 October 2010 USD53,250
PowerShares FTSE RAFI Developed Europe Mid-Small Fund
EUR0.0260 01 October 2010 29 October 2010 EUR18,200
PowerShares FTSE RAFI Developed 1000 Fund
EUR0.0290 01 October 2010 29 October 2010 EUR23,200
PowerShares FTSE RAFI Italy 30 Fund
EUR0.0208 01 October 2010 29 October 2010 EUR20,800
PowerShares FTSE RAFI Hong Kong China Fund
USD0.0618 01 October 2010 29 October 2010 USD6,180
PowerShares Global Agriculture NASDAQ OMX Fund
USD0.0173 01 October 2010 29 October 2010 USD24,220
PowerShares Middle East North Africa NASDAQ OMX Fund
USD0.0501 01 October 2010 29 October 2010 USD10,020
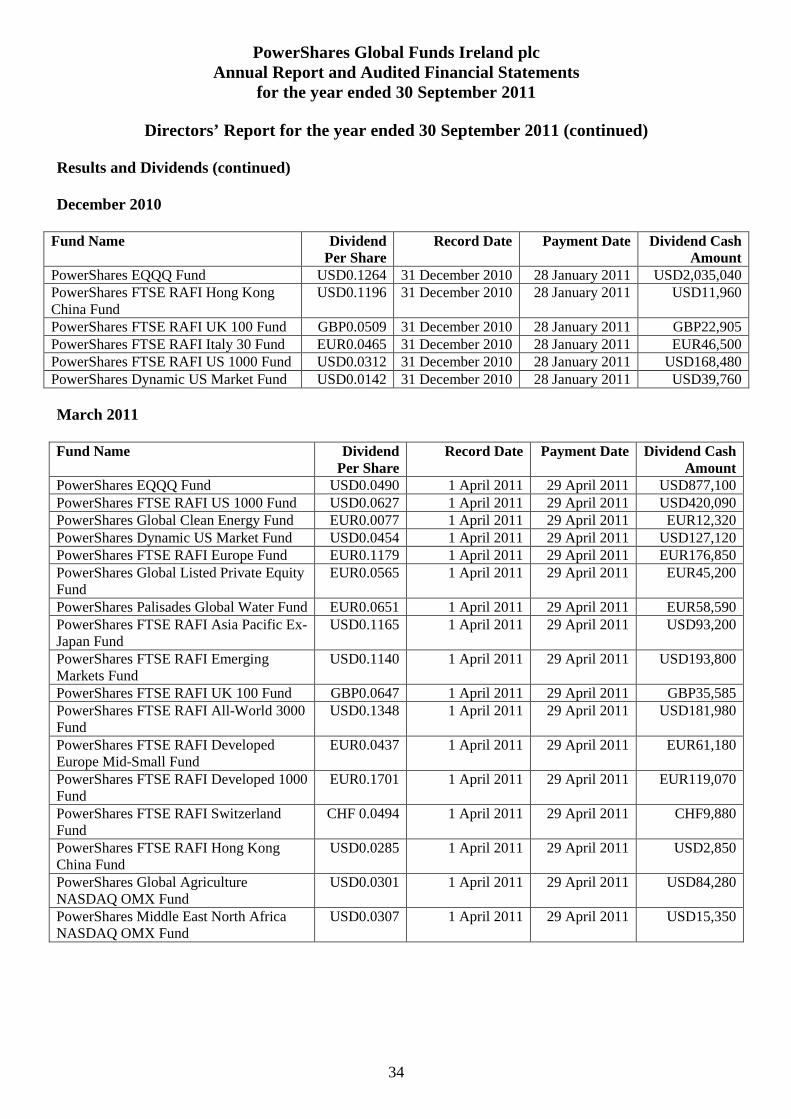
PowerShares Global Funds Ireland plc Annual Report and Audited Financial Statements
for the year ended 30 September 2011
Directors’ Report for the year ended 30 September 2011 (continued)
34
Results and Dividends (continued) December 2010
Fund Name Dividend Per Share
Record Date Payment Date
Dividend Cash Amount
PowerShares EQQQ Fund USD0.1264 31 December 2010 28 January 2011 USD2,035,040 PowerShares FTSE RAFI Hong Kong China Fund
USD0.1196 31 December 2010 28 January 2011 USD11,960
PowerShares FTSE RAFI UK 100 Fund GBP0.0509 31 December 2010 28 January 2011 GBP22,905 PowerShares FTSE RAFI Italy 30 Fund EUR0.0465 31 December 2010 28 January 2011 EUR46,500 PowerShares FTSE RAFI US 1000 Fund USD0.0312 31 December 2010 28 January 2011 USD168,480 PowerShares Dynamic US Market Fund USD0.0142 31 December 2010 28 January 2011 USD39,760 March 2011 Fund Name Dividend
Per Share Record Date Payment Date
Dividend Cash
Amount PowerShares EQQQ Fund USD0.0490 1 April 2011 29 April 2011 USD877,100 PowerShares FTSE RAFI US 1000 Fund USD0.0627 1 April 2011 29 April 2011 USD420,090 PowerShares Global Clean Energy Fund EUR0.0077 1 April 2011 29 April 2011 EUR12,320 PowerShares Dynamic US Market Fund USD0.0454 1 April 2011 29 April 2011 USD127,120 PowerShares FTSE RAFI Europe Fund EUR0.1179 1 April 2011 29 April 2011 EUR176,850 PowerShares Global Listed Private Equity Fund
EUR0.0565 1 April 2011 29 April 2011 EUR45,200
PowerShares Palisades Global Water Fund EUR0.0651 1 April 2011 29 April 2011 EUR58,590 PowerShares FTSE RAFI Asia Pacific Ex-Japan Fund
USD0.1165 1 April 2011 29 April 2011 USD93,200
PowerShares FTSE RAFI Emerging Markets Fund
USD0.1140 1 April 2011 29 April 2011 USD193,800
PowerShares FTSE RAFI UK 100 Fund GBP0.0647 1 April 2011 29 April 2011 GBP35,585 PowerShares FTSE RAFI All-World 3000 Fund
USD0.1348 1 April 2011 29 April 2011 USD181,980
PowerShares FTSE RAFI Developed Europe Mid-Small Fund
EUR0.0437 1 April 2011 29 April 2011 EUR61,180
PowerShares FTSE RAFI Developed 1000 Fund
EUR0.1701 1 April 2011 29 April 2011 EUR119,070
PowerShares FTSE RAFI Switzerland Fund
CHF 0.0494 1 April 2011 29 April 2011 CHF9,880
PowerShares FTSE RAFI Hong Kong China Fund
USD0.0285 1 April 2011 29 April 2011 USD2,850
PowerShares Global Agriculture NASDAQ OMX Fund
USD0.0301 1 April 2011 29 April 2011 USD84,280
PowerShares Middle East North Africa NASDAQ OMX Fund
USD0.0307 1 April 2011 29 April 2011 USD15,350

PowerShares Global Funds Ireland plc Annual Report and Audited Financial Statements
for the year ended 30 September 2011
Directors’ Report for the year ended 30 September 2011 (continued)
35
Results and Dividends (continued) June 2011 Fund Name Dividend
Per Share Record Date Payment Date
Dividend Cash
Amount PowerShares EQQQ Fund USD0.0916 1 July 2011 29 July 2011 USD1,731,240 PowerShares FTSE RAFI US 1000 Fund USD0.0305 1 July 2011 29 July 2011 USD198,250 PowerShares FTSE RAFI Europe Fund EUR0.1282 1 July 2011 29 July 2011 EUR192,300 PowerShares Global Listed Private Equity Fund
EUR0.0453 1 July 2011 29 July 2011 EUR36,240
PowerShares Palisades Global Water Fund
EUR0.0462 1 July 2011 29 July 2011 EUR41,580
PowerShares FTSE RAFI Asia Pacific Ex-Japan Fund
USD0.0406 1 July 2011 29 July 2011 USD32,480
PowerShares FTSE RAFI Emerging Markets Fund
USD0.0952 1 July 2011 29 July 2011 USD180,880
PowerShares FTSE RAFI UK 100 Fund GBP0.1288 1 July 2011 29 July 2011 GBP83,720 PowerShares FTSE RAFI All-World 3000 Fund
USD0.1239 1 July 2011 29 July 2011 USD154,875
PowerShares FTSE RAFI Developed Europe Mid-Small Fund
EUR0.1152 1 July 2011 29 July 2011 EUR172,800
PowerShares FTSE RAFI Developed 1000 Fund
EUR0.0699 1 July 2011 29 July 2011 EUR48,930
PowerShares FTSE RAFI Switzerland Fund
CHF 0.0394 1 July 2011 29 July 2011 CHF11,820
PowerShares FTSE RAFI Italy 30 Fund EUR0.1286 1 July 2011 29 July 2011 EUR102,880 PowerShares FTSE RAFI Hong Kong China Fund
USD0.3166 1 July 2011 29 July 2011 USD31,660
PowerShares Global Agriculture NASDAQ OMX Fund
USD0.0378 1 July 2011 29 July 2011 USD109,620
PowerShares Middle East North Africa NASDAQ OMX Fund
USD0.2923 1 July 2011 29 July 2011 USD146,150

PowerShares Global Funds Ireland plc Annual Report and Audited Financial Statements
for the year ended 30 September 2011
Directors’ Report for the year ended 30 September 2011 (continued)
36
Results and Dividends (continued) September 2011 Fund Name Dividend
Per Share Record Date Payment Date
Dividend Cash
Amount PowerShares EQQQ Fund USD0.0793 30 September
2011 28 October
2011 USD1,411,540
PowerShares FTSE RAFI US 1000 Fund USD0.0391 30 September 2011
28 October 2011
USD254,150
PowerShares Global Clean Energy Fund EUR0.0186 30 September 2011
28 October 2011
EUR31,620
PowerShares Dynamic US Market Fund USD0.0128 30 September 2011
28 October 2011
USD23,040
PowerShares FTSE RAFI Europe Fund EUR0.0468 30 September 2011
28 October 2011
EUR56,160
PowerShares Global Listed Private Equity Fund
EUR0.0434 30 September 2011
28 October 2011
EUR34,720
PowerShares Palisades Global Water Fund
EUR0.0430 30 September 2011
28 October 2011
EUR38,700
PowerShares FTSE RAFI Asia Pacific Ex-Japan Fund
USD0.0674 30 September 2011
28 October 2011
USD60,660
PowerShares FTSE RAFI Emerging Markets Fund
USD0.0851 30 September 2011
28 October 2011
USD144,670
PowerShares FTSE RAFI UK 100 Fund GBP0.0672 30 September 2011
28 October 2011
GBP218,400
PowerShares FTSE RAFI Developed Europe Mid-Small Fund
EUR0.0456 30 September 2011
28 October 2011
EUR41,040
PowerShares FTSE RAFI Developed 1000 Fund
EUR0.0607 30 September 2011
28 October 2011
EUR42,490
PowerShares FTSE RAFI Italy 30 Fund EUR0.0287 30 September 2011
28 October 2011
EUR17,220
PowerShares FTSE RAFI Hong Kong China Fund
USD0.1041 30 September 2011
28 October 2011
USD10,410
PowerShares Global Agriculture NASDAQ OMX Fund
USD0.0124 30 September 2011
28 October 2011
USD34,720
Directors The Directors of the Company, who served during the year, are Eimear Cowhey, Benjamin Thomas Fulton, Adrian Waters and Eugene Regan. Directors’ and Secretary’s Interests The Directors and Secretary and their families had no interests in the shares of the Company at 30 September 2011.

PowerShares Global Funds Ireland plc Annual Report and Audited Financial Statements
for the year ended 30 September 2011
Directors’ Report for the year ended 30 September 2011 (continued)
37
Distribution The Articles of Association, the Company’s full prospectus, supplements to the prospectus, simplified prospectus, and the annual and half-yearly statements of the Company, which include a statement of purchases and sales, can be obtained free of charge from the relevant information agent in Switzerland1, Germany2, Austria3, France4 and from Computershare Investors Services PLC in the U.K5. In addition, the Company’s full prospectus, supplements to the prospectus, and simplified prospectus, annual and half-yearly statements are available on the following website: http://www.invescopowershares.net. 1. Switzerland – Invesco Asset Management (Schweiz) AG, Stockerstr, 14, 8002 Zurich has been approved by the Swiss Financial Market Supervisory Authority as Swiss Representative of the Company. BNP Paribas Securities Services Paris, Succursale de Zurich, Selnaustrasse 16, 8002 Zurich acts as a paying agent for the Company in Switzerland. The Memorandum and Articles of Association, the Prospectus and Simplified Prospectus as well as the annual and semi-annual Report and audited Financial Statements, which contain the list of redemptions and sales, are available without cost at the offices of Invesco Asset Management (Schweiz) AG. The Prospectus and the Simplified Prospectus of the Company as well as the annual and semi-annual Reports may further be down-loaded from the following website: http://www.invescopowershares.net. 2. Germany – BNP PARIBAS Securities Services, Europa-Allee 124, 60327 Frankfurt am Main 3. Austria – ALIZEE Bank AG, Renngasse 6-8, A- 1010 Wien, Austria 4. France – BNP Paribas Securities Services, 9 rue du débacadère, 93500 Pantin, France 5. Computershare Investor Services PLC, The Pavilions, Bridgwater Road, Bristol, BS 13 8AE, United Kingdom
Re-Election of Directors At the forthcoming AGM, none of the Directors are up for re-election. None of the Directors have a service contract with the Company.
Independent Auditors
The auditors, PricewaterhouseCoopers, have indicated their willingness to remain in office in accordance with section 160(2) of the Companies Act, 1963. Swiss disclosure requirement
The PowerShares EQQQ Fund, PowerShares FTSE RAFI Emerging Markets Fund, Powershares FTSE RAFI Switzerland Fund, and Powershares Global Agriculture NASDAQ OMX Fund are authorised for distribution in Switzerland. Total expense ratio expresses the sum of all costs and commissions charged on an on-going basis to the sub-funds’ assets. Operating expenses are taken retrospectively as a percentage of the sub-fund's average net asset value for the year. The Total Expense Ratio percentage of the PowerShares EQQQ Fund for the year ended 30 September 2011 was 0.30% (30 September 2010: 0.30%). Performance ratio is the percentage of the movement in the PowerShares EQQQ Fund's net asset value per share over a defined period. The performance ratio over the year was 6.94% (30 September 2010: 16.13%). The portfolio turnover rate for the year ended 30 September 2011 was 56.43% (30 September 2010: 10.72%) The Total Expense Ratio percentage of the PowerShares FTSE RAFI Emerging Markets Fund for the year ended 30 September 2011 was 0.65% (30 September 2010: 0.85%). Performance ratio is the percentage of the movement in the PowerShares FTSE RAFI Emerging Markets Fund’s net asset value per share over a defined period. The performance ratio over the year was (18.27%) (30 September 2010: (10.62)%). The portfolio turnover rate for the year ended 30 September 2011 was 224.33% (30 September 2010: 224.84%)
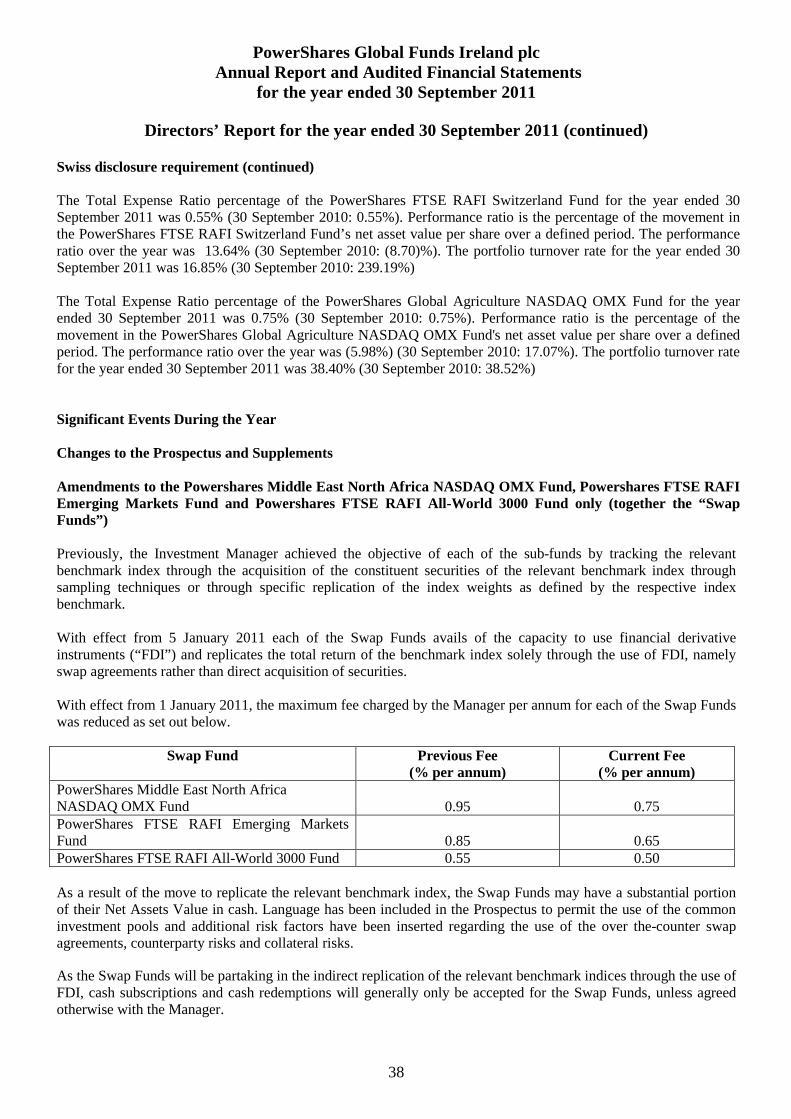
PowerShares Global Funds Ireland plc Annual Report and Audited Financial Statements
for the year ended 30 September 2011
Directors’ Report for the year ended 30 September 2011 (continued)
38
Swiss disclosure requirement (continued) The Total Expense Ratio percentage of the PowerShares FTSE RAFI Switzerland Fund for the year ended 30 September 2011 was 0.55% (30 September 2010: 0.55%). Performance ratio is the percentage of the movement in the PowerShares FTSE RAFI Switzerland Fund’s net asset value per share over a defined period. The performance ratio over the year was 13.64% (30 September 2010: (8.70)%). The portfolio turnover rate for the year ended 30 September 2011 was 16.85% (30 September 2010: 239.19%) The Total Expense Ratio percentage of the PowerShares Global Agriculture NASDAQ OMX Fund for the year ended 30 September 2011 was 0.75% (30 September 2010: 0.75%). Performance ratio is the percentage of the movement in the PowerShares Global Agriculture NASDAQ OMX Fund's net asset value per share over a defined period. The performance ratio over the year was (5.98%) (30 September 2010: 17.07%). The portfolio turnover rate for the year ended 30 September 2011 was 38.40% (30 September 2010: 38.52%) Significant Events During the Year Changes to the Prospectus and Supplements Amendments to the Powershares Middle East North Africa NASDAQ OMX Fund, Powershares FTSE RAFI Emerging Markets Fund and Powershares FTSE RAFI All-World 3000 Fund only (together the “Swap Funds”) Previously, the Investment Manager achieved the objective of each of the sub-funds by tracking the relevant benchmark index through the acquisition of the constituent securities of the relevant benchmark index through sampling techniques or through specific replication of the index weights as defined by the respective index benchmark. With effect from 5 January 2011 each of the Swap Funds avails of the capacity to use financial derivative instruments (“FDI”) and replicates the total return of the benchmark index solely through the use of FDI, namely swap agreements rather than direct acquisition of securities. With effect from 1 January 2011, the maximum fee charged by the Manager per annum for each of the Swap Funds was reduced as set out below.
Swap Fund Previous Fee (% per annum)
Current Fee (% per annum)
PowerShares Middle East North Africa NASDAQ OMX Fund 0.95 0.75 PowerShares FTSE RAFI Emerging Markets Fund 0.85 0.65 PowerShares FTSE RAFI All-World 3000 Fund 0.55 0.50 As a result of the move to replicate the relevant benchmark index, the Swap Funds may have a substantial portion of their Net Assets Value in cash. Language has been included in the Prospectus to permit the use of the common investment pools and additional risk factors have been inserted regarding the use of the over the-counter swap agreements, counterparty risks and collateral risks.
As the Swap Funds will be partaking in the indirect replication of the relevant benchmark indices through the use of FDI, cash subscriptions and cash redemptions will generally only be accepted for the Swap Funds, unless agreed otherwise with the Manager.

PowerShares Global Funds Ireland plc Annual Report and Audited Financial Statements
for the year ended 30 September 2011
Directors’ Report for the year ended 30 September 2011 (continued)
39
Significant Events During the Year (continued) Change of Manager With effective date of 1 January 2011 Invesco PowerShares Capital Management Ireland Limited retired as Manager of the Company. In its place Invesco Global Asset Management limited was appointed as the new Manager. The decision reduced the number of Irish incorporated and regulated group companies which provide services to Invesco’s range of funds to one regulated company, Invesco Global Asset Management Limited. This will simplify the structure of the Invesco group, thereby facilitating ease of regulation by the Central Bank and reducing costs for investors. Significant Events After the Year End Post year end redemptions totalled EUR1,434,580 in value for the PowerShares Global Listed Private Equity Fund (38% of year end NAV). Post year end redemptions totalled EUR1,264,257 in value for the PowerShares Palisades Global Water Fund (22% of year end NAV). Post year end redemptions totalled EUR776,116 in value for the PowerShares FTSE RAFI Developed Europe Mid - Small Fund (11% of year end NAV). Post year end redemptions totalled EUR16,944,779 in value for the PowerShares FTSE Euro MTS Cash 3 Months Fund (24% of year end NAV). Post year end redemptions totalled EUR943,708 in value for the PowerShares Global Clean Energy Fund (18% of year end NAV). Post year end redemptions totalled EUR774,272 in value for the PowerShares FTSE RAFI Developed 1000 Fund (14% of year end NAV). Post year end redemptions totalled USD1,178,211 in value for the PowerShares FTSE RAFI All-World 3000 Fund (16% of year end NAV). Board Changes Leslie Schmidt, Cormac O’Sullivan and Brian Collins were appointed to the Board of the Company with effective date 18 November 2011. Eugene Regan and Eimear Cowhey resigned from the Board with effect from 31 December 2011. UCITS IV Update With effect from 1 December 2011 the prospectus documentation of the Company was updated to comply with the new requirements of the European Communities (Undertakings for Collective Investment in Transferable Securities) Regulations 2011 issued by the Central Bank of Ireland on 1 July 2011.
On behalf of the Board
Brian Collins Adrian Waters __________________ ______________________ Director Director

PowerShares Global Funds Ireland plc Annual Report and Audited Financial Statements
for the year ended 30 September 2011
40
Report of the Custodian to the Shareholders We have enquired into the conduct of PowerShares Global Funds Ireland plc (the “Company”) for the year ended 30 September 2011 in our capacity as custodian to the Company. This report including the opinion has been prepared for and solely for the shareholders in the Company, in accordance with the Central Bank of Ireland’s UCITS Notice 4, and for no other purpose. We do not, in giving this opinion, accept or assume responsibility for any other purpose or to any other person to whom this report is shown. Responsibilities of the Custodian Our duties and responsibilities are outlined in the Central Bank of Ireland’s UCITS Notice 4. One of those duties is to enquire into the conduct of the Company in each annual accounting period and report thereon to the shareholders. Our report shall state whether, in our opinion, the Company has been managed in that period in accordance with the provisions of the Company’s Memorandum and Articles of Association and the European Communities (Undertakings for Collective Investment in Transferable Securities) Regulations 2011 (the “Regulations”). It is the overall responsibility of the Company to comply with these provisions. If the Company has not so complied, we as custodian must state why this is the case and outline the steps which we have taken to rectify the situation. Basis of Custodian Opinion The custodian conducts such reviews as it, in its reasonable opinion, considers necessary in order to comply with its duties as outlined in UCITS Notice 4 and to ensure that, in all material respects, the Company has been managed (i) in accordance with the limitations imposed on its investment and borrowing powers by the provisions of its constitutional documentation and the appropriate regulations and (ii) otherwise in accordance with the Company’s constitutional documentation and the appropriate regulations. Opinion In our opinion, the Company has been managed during the year, in all material respects: (i) in accordance with the limitations imposed on the investment and borrowing powers of the Company by the
Memorandum and Articles of Association and by the Regulations; and (ii) otherwise in accordance with the provisions of the Memorandum and Articles of Association and the
Regulations. David Kelly ____________________ BNY Mellon Trust Company (Ireland) Ltd. Guild House, Guild Street, IFSC, Dublin 1 Ireland Date:

PowerShares Global Funds Ireland plc Annual Report and Audited Financial Statements
for the year ended 30 September 2011
41
Independent Auditors’ Report to the Members of PowerShares Global Funds Ireland plc (the “Company”)
We have audited the Company’s financial statements for the year ended 30 September 2011 which comprise the Balance Sheet, the Profit and Loss Account, the Statement of Changes in Net Assets Attributable to Holders of Redeemable Participating Shares, the schedule of investments and the related notes. These financial statements have been prepared under the accounting policies set out therein.
Respective responsibilities of directors and auditors The directors’ responsibilities for preparing the Annual Report and the financial statements in accordance with applicable Irish law and the accounting standards issued by the Accounting Standards Board and published by the Institute of Chartered Accountants in Ireland (Generally Accepted Accounting Practice in Ireland) are set out in the Statement of Directors’ Responsibilities.
Our responsibility is to audit the financial statements in accordance with relevant legal and regulatory requirements and International Standards on Auditing (UK and Ireland). This report, including the opinion, has been prepared for and only for the Company’s members as a body in accordance with Section 193 of the Companies Act, 1990 and for no other purpose. We do not, in giving this opinion, accept or assume responsibility for any other purpose or to any other person to whom this report is shown or into whose hands it may come save where expressly agreed by our prior consent in writing.
We report to you our opinion as to whether the financial statements give a true and fair view in accordance with Generally Accepted Accounting Practice in Ireland, and are properly prepared in accordance with Irish statute comprising the Companies Acts, 1963 to 2009 and the European Communities (Undertakings for Collective Investment in Transferable Securities) Regulations, 2011. We state whether we have obtained all the information and explanations we consider necessary for the purposes of our audit, and whether the financial statements are in agreement with the books of account. We also report to you our opinion as to:
• whether the Company has kept proper books of account; and • whether the directors’ report is consistent with the financial statements.
We also report to you if, in our opinion, any information specified by law regarding directors’ remuneration and directors’ transactions is not disclosed and where practicable, include such information in our report.
We review whether the Corporate Governance Statement reflects the company’s compliance with the nine provisions of the UK Corporate Governance Code specified for our review by the Listing Rules of the Financial Services Authority, and we report if it does not. We are not required to consider whether the board’s statements on internal control cover all risks and controls, or form an opinion on the effectiveness of the Company’s corporate governance procedures or its risk and control procedures.
We read the other information contained in the Annual Report, and consider whether it is consistent with the audited financial statements. We consider the implications for our report if we become aware of any apparent misstatements or material inconsistencies with the financial statements. Our responsibilities do not extend to any other information.
Basis of audit opinion We conducted our audit in accordance with International Standards on Auditing (UK and Ireland) issued by the Auditing Practices Board. An audit includes examination, on a test basis, of evidence relevant to the amounts and disclosures in the financial statements. It also includes an assessment of the significant estimates and judgements made by the directors in the preparation of the financial statements, and of whether the accounting policies are appropriate to the Company's circumstances, consistently applied and adequately disclosed.
We planned and performed our audit so as to obtain all the information and explanations which we considered necessary in order to provide us with sufficient evidence to give reasonable assurance that the financial statements are free from material misstatement, whether caused by fraud or other irregularity or error. In forming our opinion we also evaluated the overall adequacy of the presentation of information in the financial statements.

PowerShares Global Funds Ireland plc Annual Report and Audited Financial Statements
for the year ended 30 September 2011
42
Independent Auditors’ Report to the Members of PowerShares Global Funds Ireland plc (the “Company”) (continued)
Opinion In our opinion the financial statements • give a true and fair view in accordance with Generally Accepted Accounting Practice in Ireland, of the state of
the Company's affairs at 30 September 2011 and of its results for the year then ended; and • have been properly prepared in accordance with the requirements of the Companies Acts, 1963 to 2009 and the
European Communities (Undertakings for Collective Investment in Transferable Securities) Regulations, 2011.
We have obtained all the information and explanations we consider necessary for the purposes of our audit. In our opinion proper books of account have been kept by the Company. The Company’s financial statements are in agreement with the books of account. In our opinion the information given in the directors' report is consistent with the financial statements. Siobhán Collier ___________________________________ For and on behalf of PricewaterhouseCoopers Chartered Accountants and Statutory Audit Firm Dublin Date:

PowerShares Global Funds Ireland plc Annual Report and Audited Financial Statements
for the year ended 30 September 2011 Balance Sheet
43
.
30 September
2011 30 September
2011 30 September
2011 30 September
2011 30 September
2011
PowerShares EQQQ Fund
PowerShares FTSE RAFI US
1000 Fund
PowerShares Global Clean Energy Fund
PowerShares Dynamic US Market Fund
USD USD USD EUR USD Current Assets Notes Cash 11,514,553 6,983,236 242,036 48,131 28,508 Cash collateral held 10 10,215,382 10,215,382 – – – Financial assets at fair value through profit or loss 5 1,250,020,034 935,497,047 52,755,942 5,309,901 12,575,057 Accrued income and other receivables 6 572,098 204,262 69,224 2,405 9,952 Capital shares receivable 5,256,491 5,256,491 – – – Securities sold receivable 2,953,887 – 28,381 951,460 – Total assets 1,280,532,445 958,156,418 53,095,583 6,311,897 12,613,517
Liabilities - amounts falling due within one year Financial liabilities at fair value through profit or loss (48,529) – – – – Bank overdraft (4) – – – – Cash collateral held 10 (10,215,382) (10,215,382) – – – Accrued expenses 7 (367,010) (245,422) (17,570) (3,682) (8,400) Swap expense payable (3,906) – – – – Securities purchased payable (5,420,026) – – (932,072) – Capital shares payable (5,543,382) (5,543,382) – – – Dividend payable 18 (2,630,873) (1,411,540) (254,150) (31,620) (23,041) Other payable (81) – – – – Total liabilities (excluding net assets attributable to holders of redeemable participating shares) (24,229,193) (17,415,726) (271,720) (967,374) (31,441)
Net assets attributable to holders of redeemable participating shares 1,256,303,252 940,740,692 52,823,863 5,344,523 12,582,076
Adjustments from bid market prices to last traded market prices 26,489 – – – – Net assets attributable to holders of redeemable participating shares at last traded prices 1,256,329,741 940,740,692 52,823,863 5,344,523 12,582,076
Number of redeemable participating shares 17,900,000 6,500,001 1,700,001 1,800,001 Net asset value per share attributable to holders of redeemable participating shares 52.56 8.13 3.14 6.99
The accompanying notes form an integral part of the financial statements Director: Brian Collins Director: Adrian Waters

PowerShares Global Funds Ireland plc Annual Report and Audited Financial Statements
for the year ended 30 September 2011
Balance Sheet (continued)
44
30 September
2011 30 September
2011 30 September
2011 30 September
2011 30 September
2011 30 September
2011
PowerShares FTSE RAFI
Europe Fund
PowerShares Global Listed
Private Equity Fund
PowerShares Palisades
Global Water Fund
PowerShares FTSE RAFI Asia Pacific
Ex-Japan Fund
PowerShares FTSE RAFI
Emerging Markets Fund
PowerShares FTSE RAFI
UK 100 Fund
EUR EUR EUR USD USD GBP Current Assets Notes Cash 51,193 32,422 31,738 100,658 863,117 131,641 Cash collateral held 10 – – – – – – Financial assets at fair value through profit or loss 5 7,075,120 3,798,944 5,834,783 5,365,829 12,751,109 25,387,255 Accrued income and other receivables 6 9,389 7,603 7,429 21,181 8,890 98,350 Capital shares receivable – – – – – – Securities sold receivable 167 300,955 820,686 41,611 – – Total assets 7,135,869 4,139,924 6,694,636 5,529,279 13,623,116 25,617,246
Liabilities - amounts falling due within one year Financial liabilities at fair value through profit or loss – – – – – – Bank overdraft – – (3) – – – Cash collateral held 10 – – – – – – Accrued expenses 7 (2,918) (2,462) (3,676) (3,910) (7,915) (10,545) Swap expense payable – – – – (2,113) – Securities purchased payable – (318,008) (786,863) – – – Capital shares payable – – – – – – Dividend payable 18 (56,160) (34,720) (38,700) (60,660) (144,670) (218,400) Other payable – – – (81) – – Total liabilities (excluding net assets attributable to holders of redeemable participating shares) (59,078) (355,190) (829,242) (64,651) (154,698) (228,945)
Net assets attributable to holders of redeemable participating shares 7,076,791 3,784,734 5,865,394 5,464,628 13,468,418 25,388,301
Adjustments from bid market prices to last traded market prices – – – – – –
Net assets attributable to holders of redeemable participating shares at last traded prices 7,076,791 3,784,734 5,865,394 5,464,628 13,468,418 25,388,301
Number of redeemable participating shares 1,200,001 800,001 900,001 900,001 1,700,001 3,250,001
Net asset value per share attributable to holders of redeemable participating shares 5.90 4.73 6.52 6.07 7.92 7.81

PowerShares Global Funds Ireland plc Annual Report and Audited Financial Statements
for the year ended 30 September 2011
Balance Sheet (continued)
45
30 September
2011 30 September
2011 30 September
2011 30 September
2011 30 September
2011 30 September
2011
PowerShares FTSE RAFI
All-World 3000 Fund
PowerShares FTSE RAFI Developed
Europe Mid-Small Fund
PowerShares FTSE RAFI Developed 1000 Fund
PowerShares FTSE RAFI
Italy 30 Fund
PowerShares FTSE RAFI Switzerland
Fund
PowerShares FTSE RAFI Hong Kong China Fund
USD EUR EUR EUR CHF USD Current Assets Notes Cash 45,904 41,619 41,731 23,986 50,285 45,189 Cash collateral held 10 – – – – – – Financial assets at fair value through profit or loss 5 7,508,090 6,751,511 5,381,247 2,300,077 2,345,673 1,533,535 Accrued income and other receivables 6 9,536 7,896 13,330 – – 6,317 Capital shares receivable – – – – – – Securities sold receivable – 142 987 – – – Total assets 7,563,530 6,801,168 5,437,295 2,324,063 2,395,958 1,585,041
Liabilities - amounts falling due within one year Financial liabilities at fair value through profit or loss – – – – – – Bank overdraft – – – – – – Cash collateral held 10 – – – – – – Accrued expenses 7 (3,232) (2,877) (2,233) (1,058) (2,125) (803) Swap expense payable (1,191) – – – – – Securities purchased payable – – – – – – Capital shares payable – – – – – – Dividend payable 18 – (41,040) (42,490) (17,220) – (10,410) Other payable – – – – – – Total liabilities (excluding net assets attributable to holders of redeemable participating shares) (4,423) (43,917) (44,723) (18,278) (2,125) (11,213)
Net assets attributable to holders of redeemable participating shares 7,559,107 6,757,251 5,392,572 2,305,785 2,393,833 1,573,828
Adjustments from bid market prices to last traded market prices – – – 19,743 – – Net assets attributable to holders of redeemable participating shares at last traded prices 7,559,107 6,757,251 5,392,572 2,325,528 2,393,833 1,573,828
Number of redeemable participating shares 650,001 900,001 700,001 600,001 300,001 100,001 Net asset value per share attributable to holders of redeemable participating shares 11.63 7.51 7.70 3.88 7.98 15.74

PowerShares Global Funds Ireland plc Annual Report and Audited Financial Statements
for the year ended 30 September 2011
Balance Sheet (continued)
46
30 September
2011 30 September
2011 30 September
2011
PowerShares Global
Agriculture NASDAQ
OMX Fund
PowerShares Middle East North Africa
NASDAQ OMX Fund
PowerShares EuroMTS Cash 3 Months Fund
USD USD EUR Current Assets Notes Cash 40,778 10,373 1,886,385 Cash collateral held 10 – – – Financial assets at fair value through profit or loss 5 29,047,279 5,321,151 72,018,449 Accrued income and other receivables 6 25,055 – – Capital shares receivable – – – Securities sold receivable 2,962 97,714 – Total assets 29,116,074 5,429,238 73,904,834
Liabilities - amounts falling due within one year Financial liabilities at fair value through profit or loss – (48,529) – Bank overdraft – – – Cash collateral held 10 – – – Accrued expenses 7 (20,570) (3,298) (8,763) Swap expense payable – (602) – Securities purchased payable – (188,561) (1,862,189) Capital shares payable – – – Dividend payable 18 (34,720) – – Other payable – – – Total liabilities (excluding net assets attributable to holders of redeemable participating shares) (55,290) (240,990) (1,870,952)
Net assets attributable to holders of redeemable participating shares 29,060,784 5,188,248 72,033,882
Adjustments from bid market prices to last traded market prices – – –
Net assets attributable to holders of redeemable participating shares at last traded prices 29,060,784 5,188,248 72,033,882
Number of redeemable participating shares 2,800,001 500,001 705,001 Net asset value per share attributable to holders of redeemable participating shares 10.38 10.38 102.18

PowerShares Global Funds Ireland plc Annual Report and Audited Financial Statements
for the year ended 30 September 2011
Balance Sheet (continued)
47
30 September
2010 30 September
2010 30 September
2010 30 September
2010 30 September
2010
Total PowerShares EQQQ Fund
PowerShares FTSE RAFI US
1000 Fund
PowerShares Global Clean Energy Fund
PowerShares Dynamic US Market Fund
USD USD USD EUR USD Current Assets Notes Cash 14,576,182 – 10,515 3,186 – Cash collateral held 10 14,984,000 14,984,000 – – – Financial assets at fair value through profit or loss 5 1,059,980,044 786,419,112 40,973,876 7,717,495 24,929,518 Accrued income and other receivables 6 387,937 142,845 31,736 1,556 22,563 Capital shares receivable 1,483 1,483 – – – Securities sold receivable 8,133,210 5,508,113 249,422 778,902 90,419 Total assets 1,098,062,856 807,055,553 41,265,549 8,501,139 25,042,500
Liabilities - amounts falling due within one year Financial liabilities at fair value through profit or loss – – – – – Bank overdraft (388,408) (10,736) – (383) (6,929) Cash collateral held 10 (14,984,000) (14,984,000) – – – Accrued expenses 7 (287,130) (189,965) (7,454) (4,771) (14,930) Swap expense payable – – – – – Securities purchased payable (16,383,349) – (108,648) (786,288) – Capital shares payable (4,942,269) (4,942,269) – – – Dividend payable 18 (1,057,216) (515,200) (171,500) – (83,820) Other payable – – – – – Total liabilities (excluding net assets attributable to holders of redeemable participating shares) (38,042,372) (20,642,170) (287,602) (791,442) (105,679)
Net assets attributable to holders of redeemable participating shares 1,060,020,484 786,413,383 40,977,947 7,709,697 24,936,821
Adjustments from bid market prices to last traded market prices 26,650 – – – –
Net assets attributable to holders of redeemable participating shares at last traded prices 1,060,047,134 786,413,383 40,977,947 7,709,697 24,936,821
Number of redeemable participating shares 16,000,000 4,900,001 1,600,001 3,300,001
Net asset value per share attributable to holders of redeemable participating shares 49.15 8.36 4.82 7.56

PowerShares Global Funds Ireland plc Annual Report and Audited Financial Statements
for the year ended 30 September 2011
Balance Sheet (continued)
48
30 September
2010 30 September
2010 30 September
2010 30 September
2010 30 September
2010 30 September
2010
PowerShares FTSE RAFI
Europe Fund
PowerShares Global Listed
Private Equity Fund
PowerShares Palisades
Global Water Fund
PowerShares FTSE RAFI Asia Pacific
Ex-Japan Fund
PowerShares FTSE RAFI
Emerging Markets Fund
PowerShares FTSE RAFI
UK 100 Fund
EUR EUR EUR USD USD GBP Current Assets Notes Cash 32,390 172 – 233 103,041 1,958 Cash collateral held 10 – – – – – – Financial assets at fair value through profit or loss 5 12,238,337 2,706,965 5,876,883 4,106,326 12,595,341 3,870,692 Accrued income and other receivables 6 11,660 4,807 4,704 12,078 47,899 11,429 Capital shares receivable – – – – – – Securities sold receivable 71,394 109,958 506,201 – – 14,544 Total assets 12,353,781 2,821,902 6,387,788 4,118,637 12,746,281 3,898,623
Liabilities - amounts falling due within one year Financial liabilities at fair value through profit or loss – – – – – – Bank overdraft (38,756) (4,048) (2,106) (8,018) (141,052) (9,971) Cash collateral held 10 – – – – – – Accrued expenses 7 (5,201) (1,664) (3,653) (2,566) (8,418) (1,581) Swap expense payable – – – – – – Securities purchased payable (26,016) (98,764) (534,790) – – – Capital shares payable – – – – – – Dividend payable 18 (48,620) (14,050) – – – (14,310) Other payable – – – – – – Total liabilities (excluding net assets attributable to holders of redeemable participating shares) (118,593) (118,526) (540,549) (10,584) (149,470) (25,862)
Net assets attributable to holders of redeemable participating shares 12,235,188 2,703,376 5,847,239 4,108,053 12,596,811 3,872,761
Adjustments from bid market prices to last traded market prices – – – – – –
Net assets attributable to holders of redeemable participating shares at last traded prices 12,235,188 2,703,376 5,847,239 4,108,053 12,596,811 3,872,761
Number of redeemable participating shares 1,700,001 500,001 800,001 600,001 1,300,001 450,001
Net asset value per share attributable to holders of redeemable participating shares 7.20 5.41 7.31 6.85 9.69 8.61

PowerShares Global Funds Ireland plc Annual Report and Audited Financial Statements
for the year ended 30 September 2011
Balance Sheet (continued)
49
30 September
2010 30 September
2010 30 September
2010 30 September
2010 30 September
2010 30 September
2010
PowerShares FTSE RAFI
All-World 3000 Fund
PowerShares FTSE RAFI Developed
Europe Mid-Small Fund
PowerShares FTSE RAFI Developed 1000 Fund
PowerShares FTSE RAFI
Italy 30 Fund
PowerShares FTSE RAFI Switzerland
Fund
PowerShares FTSE RAFI Hong Kong China Fund
USD EUR EUR EUR CHF USD Current Assets Notes Cash – 1,399 11,994 2,324 826 2,707 Cash collateral held 10 – – – – – – Financial assets at fair value through profit or loss 5 16,302,509 5,937,389 6,811,385 5,541,012 1,848,555 2,029,842 Accrued income and other receivables 6 32,491 7,485 12,396 – – 4,686 Capital shares receivable – – – – – – Securities sold receivable 58,190 19,472 16,498 21,393 – – Total assets 16,393,190 5,965,745 6,852,273 5,564,729 1,849,381 2,037,235
Liabilities - amounts falling due within one year Financial liabilities at fair value through profit or loss – – – – – – Bank overdraft (14,768) (4,581) (8,049) – – – Cash collateral held 10 – – – – – – Accrued expenses 7 (7,158) (2,428) (2,861) (2,274) (852) (862) Swap expense payable – – – – – – Securities purchased payable (15,221) – (2) – – – Capital shares payable – – – – – – Dividend payable 18 (53,250) (18,200) (23,200) (20,800) – (6,180) Other payable – – – – – – Total liabilities (excluding net assets attributable to holders of redeemable participating shares) (90,397) (25,209) (34,112) (23,074) (852) (7,042)
Net assets attributable to holders of redeemable participating shares 16,302,793 5,940,536 6,818,161 5,541,655 1,848,529 2,030,193
Adjustments from bid market prices to last traded market prices – – – – – – Net assets attributable to holders of redeemable participating shares at last traded prices 16,302,793 5,940,536 6,818,161 5,541,655 1,848,529 2,030,193
Number of redeemable participating shares 1,250,001 700,001 800,001 1,000,001 200,001 100,001 Net asset value per share attributable to holders of redeemable participating shares 13.04 8.49 8.52 5.54 9.24 20.30

PowerShares Global Funds Ireland plc Annual Report and Audited Financial Statements
for the year ended 30 September 2011
Balance Sheet (continued)
50
30 September
2010 30 September
2010 30 September
2010
PowerShares Global
Agriculture NASDAQ
OMX Fund
PowerShares Middle East North Africa
NASDAQ OMX Fund
PowerShares EuroMTS Cash 3 Months Fund
USD USD EUR Current Assets Notes Cash 19,576 – 10,522,792 Cash collateral held 10 – – – Financial assets at fair value through profit or loss 5 15,461,867 2,498,056 60,704,354 Accrued income and other receivables 6 12,144 5,315 – Capital shares receivable – – – Securities sold receivable 14,176 109,617 – Total assets 15,507,763 2,612,988 71,227,146
Liabilities - amounts falling due within one year Financial liabilities at fair value through profit or loss – – – Bank overdraft (12,124) (99,991) – Cash collateral held 10 – – – Accrued expenses 7 (9,002) (1,922) (7,584) Swap expense payable – – – Securities purchased payable – (1,544) (10,462,753) Capital shares payable – – – Dividend payable 18 (24,220) (10,020) – Other payable – – – Total liabilities (excluding net assets attributable to holders of redeemable participating shares) (45,346) (113,477) (10,470,337)
Net assets attributable to holders of redeemable participating shares 15,462,417 2,499,511 60,756,809
Adjustments from bid market prices to last traded market prices – 26,650 –
Net assets attributable to holders of redeemable participating shares at last traded prices 15,462,417 2,526,161 60,756,809
Number of redeemable participating shares 1,400,001 200,001 600,001
Net asset value per share attributable to holders of redeemable participating shares 11.04 12.63 101.26

PowerShares Global Funds Ireland plc Annual Report and Audited Financial Statements
for the year ended 30 September 2011
Profit and Loss Account
51
For the year ended 30
September 2011
For the year ended 30
September 2011
For the year ended 30
September 2011
For the year ended 30
September 2011
For the year ended 30
September 2011
Total PowerShares EQQQ Fund
PowerShares FTSE RAFI US
1000 Fund
PowerShares Global Clean Energy Fund
PowerShares Dynamic US Market Fund
USD
USD
USD
EUR
USD
Investment income Notes Dividend income 14,549,884 8,940,875 1,383,739 83,495 403,139 Bond interest 1,150,701 – – – – Bank interest income 2,783 – 270 17 158 Stock lending income 520,026 520,026 – – – Net gain/(loss) on financial assets and liabilities at fair value through profit or loss 16 10,132,681 40,698,655 (2,834,693) (2,838,874) 934,123 Total investment income/(expense) 26,356,075 50,159,556 (1,450,684) (2,755,362) 1,337,420 Expense Management fee (3,987,512) (2,363,342) (226,531) (57,321) (169,687) Shareholder servicing fee (590,110) (590,110) – – – Total expense (4,577,622) (2,953,452) (226,531) (57,321) (169,687) Net investment income/(expense) 21,778,453 47,206,104 (1,677,215) (2,812,683) 1,167,733

PowerShares Global Funds Ireland plc
Annual Report and Audited Financial Statements for the year ended 30 September 2011
Profit and Loss Account (continued)
52
For the year ended 30
September 2011
For the year ended 30
September 2011
For the year ended 30
September 2011
For the year ended 30
September 2011
For the year ended 30
September 2011
Total PowerShares EQQQ Fund
PowerShares FTSE RAFI US
1000 Fund
PowerShares Global Clean Energy Fund
PowerShares Dynamic US Market Fund
USD
USD
USD
EUR
USD
Finance costs Bank interest expense (39,610) (17,208) (766) (221) (277) Distributions to holders of redeemable participating shares (11,298,324) (6,054,920) (1,040,970) (43,940) (189,920) Total finance costs (11,337,934) (6,072,128) (1,041,736) (44,161) (190,197) Profit/(Loss) for the financial period before taxation 10,440,519 41,133,976 (2,718,951) (2,856,844) 977,536 Withholding taxes on dividends 2(b) (1,849,441) (1,223,164) (187,271) (10,364) (61,998) Adjustment from bid market prices to last traded market prices 20 27,537 – – – – Increase/(Decrease) in assets attributable to holders of redeemable participating shares from operations 8,618,615 39,910,812 (2,906,222) (2,867,208) 915,538 The accompanying notes form an integral part of the financial statements. Gains and losses arose solely from continuing operations. There were no gains or losses other than those dealt with in the Profit and Loss Account.
Director :Brian Collins Director: Adrian Waters

PowerShares Global Funds Ireland plc
Annual Report and Audited Financial Statements for the year ended 30 September 2011
Profit and Loss Account (continued)
53
For the year ended 30
September 2011
For the year ended 30
September 2011
For the year ended 30
September 2011
For the year ended 30
September 2011
For the year ended 30
September 2011
For the year ended 30
September 2011
PowerShares FTSE RAFI
Europe Fund
PowerShares Global Listed
Private Equity Fund
PowerShares Palisades Global
Water Fund
PowerShares FTSE RAFI Asia Pacific Ex-Japan
Fund
PowerShares FTSE RAFI
Emerging Markets Fund
PowerShares FTSE RAFI UK
100 Fund
EUR
EUR
EUR
USD
USD
GBP
Investment income Notes Dividend income 432,256 162,695 154,513 202,912 44,971 431,854 Bond interest – – – – – – Bank interest income 135 614 31 22 90 – Stock lending income – – – – – – Net loss on financial assets and liabilities at fair value through profit or loss 16 (1,241,227) (687,610) (664,572) (859,235) (3,787,906) (3,790,731) Total investment expense (808,836) (524,301) (510,028) (656,301) (3,742,845) (3,358,877) Expense Management fee (55,486) (34,516) (51,774) (45,963) (120,790) (46,579) Shareholder servicing fee – – – – – – Total expense (55,486) (34,516) (51,774) (45,963) (120,790) (46,579) Net investment expense (864,322) (558,817) (561,802) (702,264) (3,863,635) (3,405,456)

PowerShares Global Funds Ireland plc
Annual Report and Audited Financial Statements for the year ended 30 September 2011
Profit and Loss Account (continued)
54
For the year ended 30
September 2011
For the year ended 30
September 2011
For the year ended 30
September 2011
For the year ended 30
September 2011
For the year ended 30
September 2011
For the year ended 30
September 2011
PowerShares FTSE RAFI
Europe Fund
PowerShares Global Listed
Private Equity Fund
PowerShares Palisades Global
Water Fund
PowerShares FTSE RAFI Asia Pacific Ex-Japan
Fund
PowerShares FTSE RAFI
Emerging Markets Fund
PowerShares FTSE RAFI UK
100 Fund
EUR
EUR
EUR
USD
USD
GBP
Finance costs Bank interest expense (242) (1,222) (304) (345) (2,011) (449) Distributions to holders of redeemable participating shares (425,310) (116,160) (138,870) (186,340) (519,350) (360,610) Total finance costs (425,552) (117,382) (139,174) (186,685) (521,361) (361,059) Loss for the financial period before taxation (1,289,874) (676,199) (700,976) (888,949) (4,384,996) (3,766,515) Withholding taxes on dividends 2(b) (41,893) (26,560) (11,213) (7,728) (5,087) (45,236) Decrease in assets attributable to holders of redeemable participating shares from operations (1,331,767) (702,759) (712,189) (896,677) (4,390,083) (3,811,751) The accompanying notes form an integral part of the financial statements.

PowerShares Global Funds Ireland plc
Annual Report and Audited Financial Statements for the year ended 30 September 2011
Profit and Loss Account (continued)
55
For the year ended 30
September 2011
For the year ended 30
September 2011
For the year ended 30
September 2011
For the year ended 30
September 2011
For the year ended 30
September 2011
For the year ended 30
September 2011
PowerShares FTSE RAFI All-
World 3000 Fund
PowerShares FTSE RAFI Developed
Europe Mid-Small Fund
PowerShares FTSE RAFI
Developed 1000 Fund
PowerShares FTSE RAFI Italy
30 Fund
PowerShares FTSE RAFI
Switzerland Fund
PowerShares FTSE RAFI Hong Kong China Fund
USD
EUR
EUR
EUR
CHF
USD
Investment income Notes Dividend income 92,311 371,288 202,146 184,633 44,306 66,627 Bond interest – – – – – – Bank interest income 16 90 96 – – – Stock lending income – – – – – – Net gain/(loss) on financial assets and liabilities at fair value through profit or loss 16 202,600 (1,418,054) (487,919) (1,293,515) (404,747) (454,716) Total investment income/(expense) 294,927 (1,046,676) (285,677) (1,108,882) (360,441) (388,089) Expense Management fee (84,659) (56,026) (31,316) (23,211) (12,383) (11,350) Shareholder servicing fee – – – – – – Total expense (84,659) (56,026) (31,316) (23,211) (12,383) (11,350) Net investment income/(expense) 210,268 (1,102,702) (316,993) (1,132,093) (372,824) (399,439)

PowerShares Global Funds Ireland plc
Annual Report and Audited Financial Statements for the year ended 30 September 2011
Profit and Loss Account (continued)
56
For the year ended 30
September 2011
For the year ended 30
September 2011
For the year ended 30
September 2011
For the year ended 30
September 2011
For the year ended 30
September 2011
For the year ended 30
September 2011
PowerShares FTSE RAFI All-
World 3000 Fund
PowerShares FTSE RAFI Developed
Europe Mid-Small Fund
PowerShares FTSE RAFI
Developed 1000 Fund
PowerShares FTSE RAFI Italy
30 Fund
PowerShares FTSE RAFI
Switzerland Fund
PowerShares FTSE RAFI Hong Kong China Fund
USD
EUR
EUR
EUR
CHF
USD
Finance costs Bank interest expense (1,464) (226) (263) (1) (3) (46) Distributions to holders of redeemable participating shares (336,855) (275,020) (210,490) (166,600) (21,700) (56,880) Total finance costs (338,319) (275,246) (210,753) (166,601) (21,703) (56,926) Loss for the financial period before taxation (128,051) (1,377,948) (527,746) (1,298,694) (394,527) (456,365) Withholding taxes on dividends 2(b) (9,197) (41,817) (22,641) – (15,513) – Adjustment from bid market prices to last traded market prices 20 – – – 19,743 – – Decrease in assets attributable to holders of redeemable participating shares from operations (137,248) (1,419,765) (550,387) (1,278,951) (410,040) (456,365)
PowerShares Global Funds Ireland plc
Annual Report and Audited Financial Statements for the year ended 30 September 2011
Profit and Loss Account (continued)
57
For the year ended 30
September 2011
For the year ended 30
September 2011
For the year ended 30
September 2011
PowerShares Global
Agriculture NASDAQ OMX
Fund
PowerShares Middle East North Africa
NASDAQ OMX Fund
PowerShares EuroMTS Cash 3
Months Fund
USD
USD
EUR
Investment income Notes Dividend income 451,557 1,837 – Bond interest – – 825,009 Bank interest income 25 160 481 Stock lending income – – – Net loss on financial assets and liabilities at fair value through profit or loss 16 (4,248,889) (940,145) – Total investment income/(expense) (3,797,307) (938,148) 825,490 Expense Management fee (238,443) (38,813) (120,060) Shareholder servicing fee – – – Total expense (238,443) (38,813) (120,060) Net investment income/(expense) (4,035,750) (976,961) 705,430

PowerShares Global Funds Ireland plc
Annual Report and Audited Financial Statements for the year ended 30 September 2011
Profit and Loss Account (continued)
58
For the year ended 30
September 2011
For the year ended 30
September 2011
For the year ended 30
September 2011
PowerShares Global
Agriculture NASDAQ OMX
Fund
PowerShares Middle East North Africa
NASDAQ OMX Fund
PowerShares EuroMTS Cash 3
Months Fund
USD
USD
EUR
Finance costs Bank interest expense (1,914) (3,801) (5,446) Distributions to holders of redeemable participating shares (228,620) (161,500) – Total finance costs (230,534) (165,301) (5,446) Profit/(Loss) for the financial period before taxation (4,266,284) (1,142,262) 699,984 Withholding taxes on dividends 2(b) (48,715) (115) (555) Increase/(Decrease) in assets attributable to holders of redeemable participating shares from operations (4,314,999) (1,142,377) 699,429 The accompanying notes form an integral part of the financial statements. P&L End
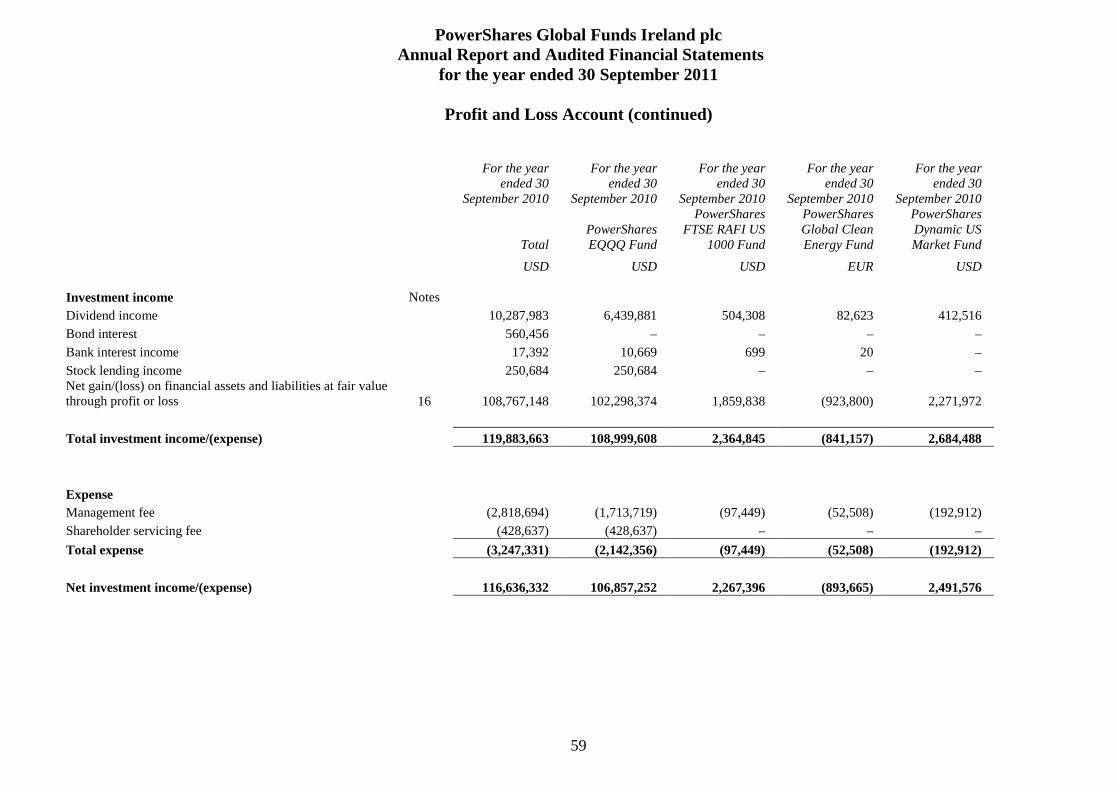
PowerShares Global Funds Ireland plc
Annual Report and Audited Financial Statements for the year ended 30 September 2011
Profit and Loss Account (continued)
59
For the year ended 30
September 2010
For the year ended 30
September 2010
For the year ended 30
September 2010
For the year ended 30
September 2010
For the year ended 30
September 2010
Total PowerShares EQQQ Fund
PowerShares FTSE RAFI US
1000 Fund
PowerShares Global Clean Energy Fund
PowerShares Dynamic US Market Fund
USD
USD
USD
EUR
USD
Investment income Notes Dividend income 10,287,983 6,439,881 504,308 82,623 412,516 Bond interest 560,456 – – – – Bank interest income 17,392 10,669 699 20 – Stock lending income 250,684 250,684 – – – Net gain/(loss) on financial assets and liabilities at fair value through profit or loss 16 108,767,148 102,298,374 1,859,838 (923,800) 2,271,972 Total investment income/(expense) 119,883,663 108,999,608 2,364,845 (841,157) 2,684,488 Expense Management fee (2,818,694) (1,713,719) (97,449) (52,508) (192,912) Shareholder servicing fee (428,637) (428,637) – – – Total expense (3,247,331) (2,142,356) (97,449) (52,508) (192,912) Net investment income/(expense) 116,636,332 106,857,252 2,267,396 (893,665) 2,491,576

PowerShares Global Funds Ireland plc
Annual Report and Audited Financial Statements for the year ended 30 September 2011
Profit and Loss Account (continued)
60
For the year ended 30
September 2010
For the year ended 30
September 2010
For the year ended 30
September 2010
For the year ended 30
September 2010
For the year ended 30
September 2010
Total PowerShares EQQQ Fund
PowerShares FTSE RAFI US
1000 Fund
PowerShares Global Clean Energy Fund
PowerShares Dynamic US Market Fund
USD
USD
USD
EUR
USD
Finance costs Bank interest expense (51,708) (4,277) (1,251) (706) (364) Distributions to holders of redeemable participating shares (4,764,201) (2,871,300) (420,500) – (137,820) Total finance costs (4,815,909) (2,875,577) (421,751) (706) (138,184) Profit/(Loss) for the financial period before taxation 111,820,423 103,981,675 1,845,645 (894,371) 2,353,392 Withholding taxes on dividends 2(b) (1,195,355) (753,649) (72,300) (10,680) (64,820) Adjustment from bid market prices to last traded market prices 20 26,650 – – – – Increase/(Decrease) in assets attributable to holders of redeemable participating shares from operations 110,651,718 103,228,026 1,773,345 (905,051) 2,288,572

PowerShares Global Funds Ireland plc Annual Report and Audited Financial Statements
for the year ended 30 September 2011
Profit and Loss Account (continued)
61
For the year ended 30
September 2010
For the year ended 30
September 2010
For the year ended 30
September 2010
For the year ended 30
September 2010
For the year ended 30
September 2010
For the year ended 30
September 2010
PowerShares FTSE RAFI
Europe Fund
PowerShares Global Listed
Private Equity Fund
PowerShares Palisades Global
Water Fund
PowerShares FTSE RAFI Asia Pacific Ex-Japan
Fund
PowerShares FTSE RAFI
Emerging Markets Fund
PowerShares FTSE RAFI UK
100 Fund
EUR
EUR
EUR
USD
USD
GBP
Investment income Notes Dividend income 457,604 90,356 120,910 88,187 304,856 141,240 Bond interest – – – – – – Bank interest income 57 – 103 71 4,627 – Stock lending income – – – – – – Net gain/(loss) on financial assets and liabilities at fair value through profit or loss 16 (520,649) 392,334 412,397 339,515 1,143,452 42,467 Total investment income/(expense) (62,988) 482,690 533,410 427,773 1,452,935 183,707 Expense Management fee (73,207) (18,990) (39,154) (23,689) (68,568) (19,264) Shareholder servicing fee – – – – – – Total expense (73,207) (18,990) (39,154) (23,689) (68,568) (19,264) Net investment income/(expense) (136,195) 463,700 494,256 404,084 1,384,367 164,443

PowerShares Global Funds Ireland plc
Annual Report and Audited Financial Statements for the year ended 30 September 2011
Profit and Loss Account (continued)
62
For the year ended 30
September 2010
For the year ended 30
September 2010
For the year ended 30
September 2010
For the year ended 30
September 2010
For the year ended 30
September 2010
For the year ended 30
September 2010
PowerShares FTSE RAFI
Europe Fund
PowerShares Global Listed
Private Equity Fund
PowerShares Palisades Global
Water Fund
PowerShares FTSE RAFI Asia Pacific Ex-Japan
Fund
PowerShares FTSE RAFI
Emerging Markets Fund
PowerShares FTSE RAFI UK
100 Fund
EUR
EUR
EUR
USD
USD
GBP
Finance costs Bank interest expense (1,956) (140) (923) (352) (6,452) (313) Distributions to holders of redeemable participating shares (313,120) (55,550) – – – (103,860) Total finance costs (315,076) (55,690) (923) (352) (6,452) (104,173) Profit/(Loss) for the financial period before taxation (451,271) 408,010 493,333 403,732 1,377,915 60,270 Withholding taxes on dividends 2(b) (48,151) (11,738) (11,668) (4,592) (25,698) (14,854) Increase/(Decrease) in assets attributable to holders of redeemable participating shares from operations (499,422) 396,272 481,665 399,140 1,352,217 45,416

PowerShares Global Funds Ireland plc
Annual Report and Audited Financial Statements for the year ended 30 September 2011
Profit and Loss Account (continued)
63
For the year ended 30
September 2010
For the year ended 30
September 2010
For the year ended 30
September 2010
For the year ended 30
September 2010
For the year ended 30
September 2010
For the year ended 30
September 2010
PowerShares FTSE RAFI All-
World 3000 Fund
PowerShares FTSE RAFI Developed
Europe Mid-Small Fund
PowerShares FTSE RAFI
Developed 1000 Fund
PowerShares FTSE RAFI Italy
30 Fund
PowerShares FTSE RAFI
Switzerland Fund
PowerShares FTSE RAFI Hong Kong China Fund
USD
EUR
EUR
EUR
CHF
USD
Investment income Notes Dividend income 294,197 128,231 126,552 186,139 56,585 47,898 Bond interest – – – – – – Bank interest income 470 66 184 – – 137 Stock lending income – – – – – – Net gain/(loss) on financial assets and liabilities at fair value through profit or loss 16 673,739 524,885 278,316 (490,055) (107,765) 302,153 Total investment income/(expense) 968,406 653,182 405,052 (303,916) (51,180) 350,188 Expense Management fee (54,311) (24,230) (22,770) (22,044) (12,092) (11,352) Shareholder servicing fee – – – – – – Total expense (54,311) (24,230) (22,770) (22,044) (12,092) (11,352) Net investment income/(expense) 914,095 628,952 382,282 (325,960) (63,272) 338,836

PowerShares Global Funds Ireland plc
Annual Report and Audited Financial Statements for the year ended 30 September 2011
Profit and Loss Account (continued)
64
For the year ended 30
September 2010
For the year ended 30
September 2010
For the year ended 30
September 2010
For the year ended 30
September 2010
For the year ended 30
September 2010
For the year ended 30
September 2010
PowerShares FTSE RAFI All-
World 3000 Fund
PowerShares FTSE RAFI Developed
Europe Mid-Small Fund
PowerShares FTSE RAFI
Developed 1000 Fund
PowerShares FTSE RAFI Italy
30 Fund
PowerShares FTSE RAFI
Switzerland Fund
PowerShares FTSE RAFI Hong Kong China Fund
USD
EUR
EUR
EUR
CHF
USD
Finance costs Bank interest expense (2,530) (337) (360) (63) (68) (389) Distributions to holders of redeemable participating shares (125,049) (77,000) (53,700) (151,600) (31,089) (43,921) Total finance costs (127,579) (77,337) (54,060) (151,663) (31,157) (44,310) Profit/(Loss) for the financial period before taxation 786,516 551,615 328,222 (477,623) (94,429) 294,526 Withholding taxes on dividends 2(b) (32,065) (10,881) (14,609) (10,708) (18,479) (177) Increase/(Decrease) in assets attributable to holders of redeemable participating shares from operations 754,451 540,734 313,613 (488,331) (112,908) 294,349

PowerShares Global Funds Ireland plc
Annual Report and Audited Financial Statements for the year ended 30 September 2011
Profit and Loss Account (continued)
65
For the year ended 30
September 2010
For the year ended 30
September 2010
For the year ended 30
September 2010
PowerShares Global
Agriculture NASDAQ OMX
Fund
PowerShares Middle East North Africa
NASDAQ OMX Fund
PowerShares EuroMTS Cash 3
Months Fund
USD
USD
EUR
Investment income Notes Dividend income 206,185 92,620 – Bond interest – 87 411,830 Bank interest income 2 132 – Stock lending income – – – Net gain/(loss) on financial assets and liabilities at fair value through profit or loss 16 745,290 (377,972) (5,721) Total investment income/(expense) 951,477 (285,133) 406,109 Expense Management fee (68,476) (20,597) (133,623) Shareholder servicing fee – – – Total expense (68,476) (20,597) (133,623) Net investment income/(expense) 883,001 (305,730) 272,486

PowerShares Global Funds Ireland plc
Annual Report and Audited Financial Statements for the year ended 30 September 2011
Profit and Loss Account (continued)
66
For the year ended 30
September 2010
For the year ended 30
September 2010
For the year ended 30
September 2010
PowerShares Global
Agriculture NASDAQ OMX
Fund
PowerShares Middle East North Africa
NASDAQ OMX Fund
PowerShares EuroMTS Cash 3
Months Fund
USD
USD
EUR
Finance costs Bank interest expense (847) (845) (20,391) Distributions to holders of redeemable participating shares (24,220) (63,620) – Total finance costs (25,067) (64,465) (20,391) Profit/(Loss) for the financial period before taxation 857,934 (370,195) 252,095 Withholding taxes on dividends 2(b) (25,807) (7,044) (5,238) Adjustment from bid market prices to last traded market prices 20 – 26,650 – Increase/(Decrease) in assets attributable to holders of redeemable participating shares from operations 832,127 (350,589) 246,857

PowerShares Global Funds Ireland plc
Annual Report and Audited Financial Statements for the year ended 30 September 2011
Statement of Changes in Net Assets Attributable to Holders of Redeemable Participating Shares
67
For the year ended 30
September 2011
For the year ended 30
September 2011
For the year ended 30
September 2011
For the year ended 30
September 2011
For the year ended 30
September 2011
Total PowerShares EQQQ Fund
PowerShares FTSE RAFI US
1000 Fund
PowerShares Global Clean Energy Fund
PowerShares Dynamic US Market Fund
USD USD USD EUR USD Net Assets attributable to Holders of Redeemable Participating Shares at beginning of year 1,060,047,134 786,413,383 40,977,947 7,709,697 24,936,821 Translation adjustment (see note 2(i)) (3,414,088) – – – – Increase/(Decrease) in assets attributable to Holders of Redeemable Participating Shares from operations
8,618,615 39,910,812 (2,906,222) (2,867,208) 915,538
Proceeds from redeemable participating shares issued 546,944,839 315,021,939 34,070,988 473,040 463 Cost of redeemable participating shares redeemed (356,430,675) (200,609,883) (19,375,873) – (13,278,758) Equalisation 563,916 4,441 57,023 28,994 8,012 Net increase/(decrease) in net assets from share transactions
191,078,080 114,416,497 14,752,138 502,034 (13,270,283)
Net Assets attributable to Holders of Redeemable Participating Shares at end of year 1,256,329,741 940,740,692 52,823,863 5,344,523 12,582,076 The accompanying notes form an integral part of the financial statements .

PowerShares Global Funds Ireland plc
Annual Report and Audited Financial Statements for the year ended 30 September 2011
Statement of Changes in Net Assets Attributable to Holders of Redeemable Participating Shares (continued)
68
For the year ended 30
September 2011
For the year ended 30
September 2011
For the year ended 30
September 2011
For the year ended 30
September 2011
For the year ended 30
September 2011
For the year ended 30
September 2011
PowerShares FTSE RAFI
Europe Fund
PowerShares Global Listed
Private Equity Fund
PowerShares Palisades
Global Water Fund
PowerShares FTSE RAFI Asia Pacific
Ex-Japan Fund
PowerShares FTSE RAFI
Emerging Markets Fund
PowerShares FTSE RAFI
UK 100 Fund
EUR EUR EUR USD USD GBP Net Assets attributable to Holders of Redeemable Participating Shares at beginning of year 12,235,188 2,703,376 5,847,239 4,108,053 12,596,811 3,872,761 Decrease in assets attributable to Holders of Redeemable Participating Shares from operations
(1,331,767) (702,759) (712,189) (896,677) (4,390,083) (3,811,751)
Proceeds from redeemable participating shares issued 1,914 1,784,138 702,580 2,208,146 12,421,324 25,297,961 Cost of redeemable participating shares redeemed (3,884,839) (11,599) – (7,890) (7,252,555) – Equalisation 56,295 11,578 27,764 52,996 92,921 29,330 Net increase/(decrease) in net assets from share transactions
(3,826,630) 1,784,117 730,344 2,253,252 5,261,690 25,327,291
Net Assets attributable to Holders of Redeemable Participating Shares at end of year 7,076,791 3,784,734 5,865,394 5,464,628 13,468,418 25,388,301

PowerShares Global Funds Ireland plc
Annual Report and Audited Financial Statements for the year ended 30 September 2011
Statement of Changes in Net Assets Attributable to Holders of Redeemable Participating Shares (continued)
69
For the year ended 30
September 2011
For the year ended 30
September 2011
For the year ended 30
September 2011
For the year ended 30
September 2011
For the year ended 30
September 2011
For the year ended 30
September 2011
PowerShares FTSE RAFI
All-World 3000 Fund
PowerShares FTSE RAFI Developed
Europe Mid-Small Fund
PowerShares FTSE RAFI Developed 1000 Fund
PowerShares FTSE RAFI
Italy 30 Fund
PowerShares FTSE RAFI Switzerland
Fund
PowerShares FTSE RAFI Hong Kong China Fund
USD EUR EUR EUR CHF USD Net Assets attributable to Holders of Redeemable Participating Shares at beginning of year 16,302,793 5,940,536 6,818,161 5,541,655 1,848,529 2,030,193 Decrease in assets attributable to Holders of Redeemable Participating Shares from operations
(137,248) (1,419,765) (550,387) (1,278,951) (410,040) (456,365)
Proceeds from redeemable participating shares issued 7,289,648 12,317,904 953,744 1,188 955,344 – Cost of redeemable participating shares redeemed (15,960,619) (10,076,073) (1,855,407) (1,933,829) – – Equalisation 64,533 (5,351) 26,461 (4,535) – – Net increase/(decrease) in net assets from share transactions
(8,606,438) 2,236,480 (875,202) (1,937,176) 955,344 –
Net Assets attributable to Holders of Redeemable Participating Shares at end of year 7,559,107 6,757,251 5,392,572 2,325,528 2,393,833 1,573,828

PowerShares Global Funds Ireland plc
Annual Report and Audited Financial Statements for the year ended 30 September 2011
Statement of Changes in Net Assets Attributable to Holders of Redeemable Participating Shares (continued)
70
For the year ended 30
September 2011
For the year ended 30
September 2011
For the year ended 30
September 2011
PowerShares Global
Agriculture NASDAQ OMX
Fund
PowerShares Middle East North Africa
NASDAQ OMX Fund
PowerShares EuroMTS Cash 3 Months Fund
USD USD EUR Net Assets attributable to Holders of Redeemable Participating Shares at beginning of year 15,462,417 2,526,161 60,756,809 Increase/(Decrease) in assets attributable to Holders of Redeemable Participating Shares from operations
(4,314,999) (1,142,377) 699,429
Proceeds from redeemable participating shares issued 20,349,857 3,804,464 62,697,228 Cost of redeemable participating shares redeemed (2,476,433) – (52,119,584) Equalisation 39,942 – – Net increase in net assets from share transactions 17,913,366 3,804,464 10,577,644 Net Assets attributable to Holders of Redeemable Participating Shares at end of year 29,060,784 5,188,248 72,033,882 The accompanying notes form an integral part of the financial statements.

PowerShares Global Funds Ireland plc
Annual Report and Audited Financial Statements for the year ended 30 September 2011
Statement of Changes in Net Assets Attributable to Holders of Redeemable Participating Shares (continued)
71
For the year ended 30
September 2010
For the year ended 30
September 2010
For the year ended 30
September 2010
For the year ended 30
September 2010
For the year ended 30
September 2010
Total PowerShares EQQQ Fund
PowerShares FTSE RAFI US
1000 Fund
PowerShares Global Clean Energy Fund
PowerShares Dynamic US Market Fund
USD USD USD EUR USD Net Assets attributable to Holders of Redeemable Participating Shares at beginning of year 914,598,575 607,279,957 16,504,859 5,435,118 29,080,627 Translation adjustment (see note 2(i)) (15,919,461) – – – – Translation adjustment arising on change of presentation currency (242,884) – – – – Increase/(Decrease) in assets attributable to Holders of Redeemable Participating Shares from operations
110,651,718 103,228,026 1,773,345 (905,051) 2,288,572
Proceeds from redeemable participating shares issued 254,383,015 127,385,829 43,268,312 4,204,749 6,669,481 Cost of redeemable participating shares redeemed (203,520,590) (51,468,505) (20,693,679) (1,009,107) (13,086,025) Equalisation 96,761 (11,924) 125,110 (16,012) (15,834) Net increase/(decrease) in net assets from share transactions
50,959,186 75,905,400 22,699,743 3,179,630 (6,432,378)
Net Assets attributable to Holders of Redeemable Participating Shares at end of year 1,060,047,134 786,413,383 40,977,947 7,709,697 24,936,821 The accompanying notes form an integral part of the financial statements.

PowerShares Global Funds Ireland plc
Annual Report and Audited Financial Statements for the year ended 30 September 2011
Statement of Changes in Net Assets Attributable to Holders of Redeemable Participating Shares (continued)
72
For the year ended 30
September 2010
For the year ended 30
September 2010
For the year ended 30
September 2010
For the year ended 30
September 2010
For the year ended 30
September 2010
For the year ended 30
September 2010
PowerShares FTSE RAFI
Europe Fund
PowerShares Global Listed
Private Equity Fund
PowerShares Palisades
Global Water Fund
PowerShares FTSE RAFI Asia Pacific
Ex-Japan Fund
PowerShares FTSE RAFI
Emerging Markets Fund
PowerShares FTSE RAFI
UK 100 Fund
EUR EUR EUR USD USD GBP Net Assets attributable to Holders of Redeemable Participating Shares at beginning of year 19,008,735 2,307,104 3,920,570 2,377,844 4,380,707 3,827,345 Translation adjustment (see note 2(i)) – – – – – – Translation adjustment arising on change of presentation currency – – – – (193,268) – Increase/(Decrease) in assets attributable to Holders of Redeemable Participating Shares from operations
(499,422) 396,272 481,665 399,140 1,352,217 45,416
Proceeds from redeemable participating shares issued 15,051,795 – 1,471,458 1,374,238 8,079,857 – Cost of redeemable participating shares redeemed (21,384,416) – – – (909,180) – Equalisation 58,496 – (26,454) (43,169) (113,522) – Net increase/(decrease) in net assets from share transactions
(6,274,125) – 1,445,004 1,331,069 7,057,155 –
Net Assets attributable to Holders of Redeemable Participating Shares at end of year 12,235,188 2,703,376 5,847,239 4,108,053 12,596,811 3,872,761
The accompanying notes form an integral part of the financial statements.

PowerShares Global Funds Ireland plc
Annual Report and Audited Financial Statements for the year ended 30 September 2011
Statement of Changes in Net Assets Attributable to Holders of Redeemable Participating Shares (continued)
73
For the year ended 30
September 2010
For the year ended 30
September 2010
For the year ended 30
September 2010
For the year ended 30
September 2010
For the year ended 30
September 2010
For the year ended 30
September 2010
PowerShares FTSE RAFI
All-World 3000 Fund
PowerShares FTSE RAFI Developed
Europe Mid-Small Fund
PowerShares FTSE RAFI Developed 1000 Fund
PowerShares FTSE RAFI
Italy 30 Fund
PowerShares FTSE RAFI Switzerland
Fund
PowerShares FTSE RAFI Hong Kong China Fund
USD EUR EUR EUR CHF USD Net Assets attributable to Holders of Redeemable Participating Shares at beginning of year 4,267,754 3,793,157 3,206,363 3,948,855 2,024,344 1,732,787 Translation adjustment (see note 2(i)) – – – – – – Translation adjustment arising on change of presentation currency 7,676 – – – (62,907) 3,057 Increase/(Decrease) in assets attributable to Holders of Redeemable Participating Shares from operations
754,451 540,734 313,613 (488,331) (112,908) 294,349
Proceeds from redeemable participating shares issued 11,333,488 1,606,848 3,299,899 2,068,680 – – Cost of redeemable participating shares redeemed – – – – – – Equalisation (60,576) (203) (1,714) 12,451 – – Net increase in net assets from share transactions 11,272,912 1,606,645 3,298,185 2,081,131 – – Net Assets attributable to Holders of Redeemable Participating Shares at end of year 16,302,793 5,940,536 6,818,161 5,541,655 1,848,529 2,030,193
The accompanying notes form an integral part of the financial statements.

PowerShares Global Funds Ireland plc
Annual Report and Audited Financial Statements for the year ended 30 September 2011
Statement of Changes in Net Assets Attributable to Holders of Redeemable Participating Shares (continued)
74
For the year ended 30
September 2010
For the year ended 30
September 2010
For the year ended 30
September 2010
PowerShares Global
Agriculture NASDAQ OMX
Fund
PowerShares Middle East North Africa
NASDAQ OMX Fund
PowerShares EuroMTS Cash 3 Months Fund
USD USD EUR Net Assets attributable to Holders of Redeemable Participating Shares at beginning of year 3,772,674 1,404,675 119,646,285 Translation adjustment (see note 2(i)) – – – Translation adjustment arising on change of presentation currency – – – Increase/(Decrease) in assets attributable to Holders of Redeemable Participating Shares from operations
832,127 (350,589) 246,857
Proceeds from redeemable participating shares issued 10,893,465 1,471,829 4,564,637 Cost of redeemable participating shares redeemed (1,165) – (63,858,957) Equalisation (34,684) 246 157,987 Net increase/(decrease) in net assets from share transactions
10,857,616 1,472,075 (59,136,333)
Net Assets attributable to Holders of Redeemable Participating Shares at end of year 15,462,417 2,526,161 60,756,809 The accompanying notes form an integral part of the financial statements.

PowerShares Global Funds Ireland plc
Annual Report and Audited Financial Statements for the year ended 30 September 2011
Notes to the Financial Statements
75
1. EstablishmentNTF Star
The Company is an open-ended investment company with variable capital having segregated liability between its funds, incorporated in Ireland, on 5 February 2002 with limited liability pursuant to the Companies Acts, 1963 to 2009. The Company was authorised on 13 September 2002 by the Central Bank of Ireland and is now regulated by the Central Bank of Ireland as an Undertaking for Collective Investments in Transferable Securities, a “UCITS”. It is authorised pursuant to the European Communities (Undertaking for Collective Investments in Transferable Securities) Regulations, 2011.
The Company has segregated liability between its funds. Given that the Company is a segregated liability company, each fund is treated as bearing its own liabilities exclusively from its own assets.
The Company is structured as an umbrella fund which may comprise one or more funds. The Company may at any time establish new classes of shares within a fund as well as new funds. Any new fund will require the prior approval of the Central Bank of Ireland and the establishment of any new class of shares must be notified in advance to the Central Bank of Ireland. The Company currently has nineteen funds.
Objectives Please refer to the Investment Manager’s report on pages 4 to 21 where the objectives of each fund are listed. 2. Significant Accounting Policies
Basis of Preparation The financial statements have been prepared in accordance with accounting standards generally accepted in Ireland and Irish statute comprising the Companies Acts, 1963 to 2009 and the European Communities (Undertakings for Collective Investment in Transferable Securities) Regulations, 2011. Accounting standards generally accepted in Ireland in preparing financial statements giving a true and fair view are those published by the Institute of Chartered Accountants in Ireland and issued by the Accounting Standards Board (“ASB”).
The financial statements have been prepared under the historical cost convention as modified by the revaluation of financial assets and financial liabilities held at fair value through profit or loss.
The format and certain wordings of the financial statements has been adapted from those contained in the Companies (Amendment) Act, 1986 and FRS 3 “Reporting Financial Performance” so that, in the opinion of the Directors, they more appropriately reflect the nature of the Company’s business as an investment fund.
The Company has availed of the exemption available to open-ended investment funds under FRS 1 not to prepare a cash flow statement.
FRS 29 “Financial Instruments: Disclosures” (“FRS29”) FRS 29 requires enhanced disclosure about fair value measurement and liquidity risk disclosures for derivative and non-derivative financial liabilities. In relation to fair value measurement, FRS29 requires the Company to classify fair value measurements using a fair value hierarchy that reflects the significance of the inputs used in making the measurements. The standard requires an entity to provide a quantitative and qualitative analysis of those instruments recognised at fair value based on a three-level measurement hierarchy.

PowerShares Global Funds Ireland plc
Annual Report and Audited Financial Statements for the year ended 30 September 2011
Notes to the Financial Statements (continued)
76
2. Significant Accounting Policies (continued)
FRS 29 “Financial Instruments: Disclosures” (continued)
The fair value hierarchy has the following levels as defined under FRS 29: Level 1 - Quoted prices (unadjusted) in active markets for identical assets or liabilities; Level 2 - Inputs other than quoted prices included within Level 1 that are observable for the asset or liability, either directly (as prices) or indirectly (derived from prices); and Level 3 - Inputs for the asset or liability that are not based on observable market data (unobservable inputs). Furthermore, for those instruments which have significant unobservable inputs (Level 3), the standard requires disclosures on the transfers into and out of Level 3, a reconciliation of the opening and closing balances, total gains and losses for the year split between those recognised in the profit and loss account and recognised through the statement of total recognised gains and losses, purchases, sales issues and settlements, and a sensitivity analysis of assumptions used in determining the fair value of Level 3 positions.
The following table shows financial investments recognised at fair value at levels 1, 2 and 3.
30 September 2011 PowerShares EQQQ Fund Level 1 Level 2 Level 3 Total USD USD USD USD Financial assets at fair value through profit or loss Equities 935,497,047 – – 935,497,047 Total investments 935,497,047 – – 935,497,047 PowerShares FTSE RAFI US 1000 Fund Level 1 Level 2 Level 3 Total USD USD USD USD Financial assets at fair value through profit or loss Equities 52,755,942 – – 52,755,942 Total investments 52,755,942 – – 52,755,942 PowerShares Dynamic US Market Fund Level 1 Level 2 Level 3 Total USD USD USD USD Financial assets at fair value through profit or loss Equities 12,575,057 – – 12,575,057 Total investments 12,575,057 – – 12,575,057 PowerShares Global Clean Energy Fund Level 1 Level 2 Level 3 Total EUR EUR EUR EUR Financial assets at fair value through profit or loss Equities 5,309,901 – – 5,309,901 Total investments 5,309,901 – – 5,309,901

PowerShares Global Funds Ireland plc
Annual Report and Audited Financial Statements for the year ended 30 September 2011
Notes to the Financial Statements (continued)
77
2. Significant Accounting Policies (continued)
FRS 29 “Financial Instruments: Disclosures” (continued)
30 September 2011 (continued)
PowerShares Global Listed Private Equity Fund Level 1 Level 2 Level 3 Total EUR EUR EUR EUR Financial assets at fair value through profit or loss Equities 3,798,944 – – 3,798,944 Total investments 3,798,944 – – 3,798,944 PowerShares Palisades Global Water Fund Level 1 Level 2 Level 3 Total EUR EUR EUR EUR Financial assets at fair value through profit or loss Equities 5,834,783 – – 5,834,783 Total investments 5,834,783 – – 5,834,783 PowerShares Global Agriculture NASDAQ OMX Fund Level 1 Level 2 Level 3 Total USD USD USD USD Financial assets at fair value through profit or loss Equities 29,047,279 – – 29,047,279 Total investments 29,047,279 – – 29,047,279 PowerShares Middle East North Africa NASDAQ OMX Fund Level 1 Level 2 Level 3 Total USD USD USD USD Financial assets at fair value through profit or loss Common Investment Pool – 5,321,151 – 5,321,151 Total Return Swap – (48,529) – (48,529) Total investments – 5,272,622 – 5,272,622 PowerShares FTSE RAFI Developed 1000 Fund Level 1 Level 2 Level 3 Total EUR EUR EUR EUR Financial assets at fair value through profit or loss Equities 5,381,247 – – 5,381,247 Total investments 5,381,247 – – 5,381,247 PowerShares FTSE RAFI Developed Europe Mid-Small Fund Level 1 Level 2 Level 3 Total EUR EUR EUR EUR Financial assets at fair value through profit or loss Equities 6,751,511 – – 6,751,511 Total investments 6,751,511 – – 6,751,511

PowerShares Global Funds Ireland plc
Annual Report and Audited Financial Statements for the year ended 30 September 2011
Notes to the Financial Statements (continued)
78
2. Significant Accounting Policies (continued)
FRS 29 “Financial Instruments: Disclosures” (continued)
30 September 2011 (continued) PowerShares FTSE RAFI All-World 3000 Fund Level 1 Level 2 Level 3 Total USD USD USD USD Financial assets at fair value through profit or loss Common Investment Pool – 7,364,880 – 7,364,880 Total Return Swap – 143,210 – 143,210 Total investments – 7,508,090 – 7,508,090 PowerShares FTSE RAFI Emerging Markets Fund Level 1 Level 2 Level 3 Total USD USD USD USD Financial assets at fair value through profit or loss Common Investment Pool – 12,476,795 – 12,476,795 Total Return Swap – 274,314 – 274,314 Total investments – 12,751,109 – 12,751,109 PowerShares FTSE RAFI Asia Pacific Ex-Japan Fund Level 1 Level 2 Level 3 Total USD USD USD USD Financial assets at fair value through profit or loss Equities 5,365,639 190 – 5,365,829 Total investments 5,365,639 190 – 5,365,829 PowerShares FTSE RAFI Europe Fund Level 1 Level 2 Level 3 Total EUR EUR EUR EUR Financial assets at fair value through profit or loss Equities 7,075,120 – – 7,075,120 Total investments 7,075,120 – – 7,075,120 PowerShares FTSE RAFI UK 100 Fund Level 1 Level 2 Level 3 Total GBP GBP GBP GBP Financial assets at fair value through profit or loss Equities 25,387,255 – – 25,387,255 Total investments 25,387,255 – – 25,387,255 PowerShares FTSE RAFI Italy 30 Fund Level 1 Level 2 Level 3 Total EUR EUR EUR EUR Financial assets at fair value through profit or loss Equities 2,300,077 – – 2,300,077 Total investments 2,300,077 – – 2,300,077
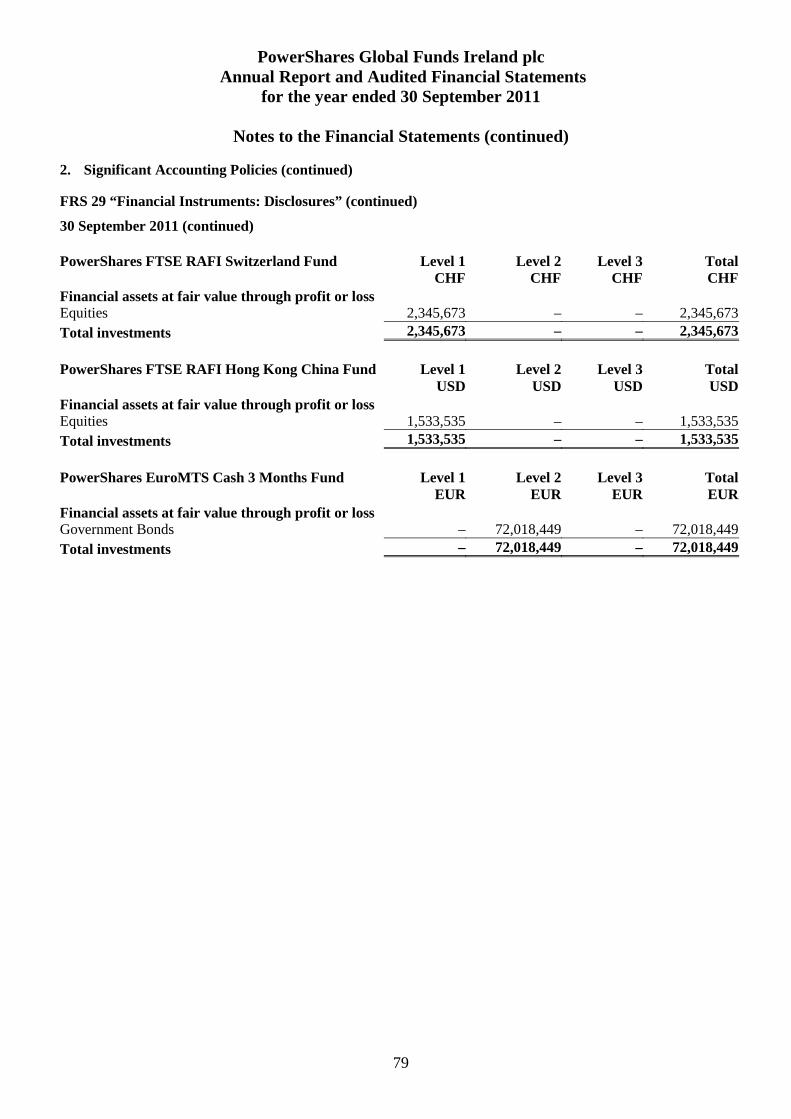
PowerShares Global Funds Ireland plc
Annual Report and Audited Financial Statements for the year ended 30 September 2011
Notes to the Financial Statements (continued)
79
2. Significant Accounting Policies (continued)
FRS 29 “Financial Instruments: Disclosures” (continued)
30 September 2011 (continued) PowerShares FTSE RAFI Switzerland Fund Level 1 Level 2 Level 3 Total CHF CHF CHF CHF Financial assets at fair value through profit or loss Equities 2,345,673 – – 2,345,673 Total investments 2,345,673 – – 2,345,673 PowerShares FTSE RAFI Hong Kong China Fund Level 1 Level 2 Level 3 Total USD USD USD USD Financial assets at fair value through profit or loss Equities 1,533,535 – – 1,533,535 Total investments 1,533,535 – – 1,533,535 PowerShares EuroMTS Cash 3 Months Fund Level 1 Level 2 Level 3 Total EUR EUR EUR EUR Financial assets at fair value through profit or loss Government Bonds – 72,018,449 – 72,018,449 Total investments – 72,018,449 – 72,018,449

PowerShares Global Funds Ireland plc
Annual Report and Audited Financial Statements for the year ended 30 September 2011
Notes to the Financial Statements (continued)
80
2. Significant Accounting Policies (continued)
FRS 29 “Financial Instruments: Disclosures” (continued) 30 September 2010 PowerShares FTSE RAFI US 1000 Fund Level 1 Level 2 Level 3 Total USD USD USD USD Financial assets at fair value through profit or loss Equities 40,973,876 – – 40,973,876 Total investments 40,973,876 – – 40,973,876 PowerShares EQQQ Fund Level 1 Level 2 Level 3 Total USD USD USD USD Financial assets at fair value through profit or loss Equities 786,419,112 – – 786,419,112 Total investments 786,419,112 – – 786,419,112 PowerShares Global Clean Energy Fund Level 1 Level 2 Level 3 Total EUR EUR EUR EUR Financial assets at fair value through profit or loss Equities 7,717,495 – – 7,717,495 Total investments 7,717,495 – – 7,717,495 PowerShares Dynamic US Market Fund Level 1 Level 2 Level 3 Total USD USD USD USD Financial assets at fair value through profit or loss Equities 24,929,518 – – 24,929,518 Total investments 24,929,518 – – 24,929,518 PowerShares FTSE RAFI Europe Fund Level 1 Level 2 Level 3 Total EUR EUR EUR EUR Financial assets at fair value through profit or loss Equities 12,236,616 1,721 – 12,238,337 Total investments 12,236,616 1,721 – 12,238,337 PowerShares Global Listed Private Equity Fund Level 1 Level 2 Level 3 Total EUR EUR EUR EUR Financial assets at fair value through profit or loss Equities 2,706,965 – – 2,706,965 Total investments 2,706,965 – – 2,706,965 PowerShares Palisades Global Water Fund Level 1 Level 2 Level 3 Total EUR EUR EUR EUR Financial assets at fair value through profit or loss Equities 5,876,883 – – 5,876,883 Total investments 5,876,883 – – 5,876,883

PowerShares Global Funds Ireland plc
Annual Report and Audited Financial Statements for the year ended 30 September 2011
Notes to the Financial Statements (continued)
81
2. Significant Accounting Policies (continued) FRS 29 “Financial Instruments: Disclosures” (continued) 30 September 2010 (continued) PowerShares FTSE RAFI Asia Pacific Ex-Japan Fund Level 1 Level 2 Level 3 Total USD USD USD USD Financial assets at fair value through profit or loss Equities 4,106,326 – – 4,106,326 Total investments 4,106,326 – – 4,106,326 PowerShares FTSE RAFI Emerging Markets Fund Level 1 Level 2 Level 3 Total USD USD USD USD Financial assets at fair value through profit or loss Equities 12,595,341 – – 12,595,341 Total investments 12,595,341 – – 12,595,341 PowerShares FTSE RAFI UK 100 Fund Level 1 Level 2 Level 3 Total GBP GBP GBP GBP Financial assets at fair value through profit or loss Equities 3,870,692 – – 3,870,692 Total investments 3,870,692 – – 3,870,692 PowerShares FTSE RAFI All-World 3000 Fund Level 1 Level 2 Level 3 Total USD USD USD USD Financial assets at fair value through profit or loss Equities 16,302,509 – – 16,302,509 Total investments 16,302,509 – – 16,302,509 PowerShares FTSE RAFI Developed Europe Mid-Small Fund Level 1 Level 2 Level 3 Total EUR EUR EUR EUR Financial assets at fair value through profit or loss Equities 5,937,389 – – 5,937,389 Total investments 5,937,389 – – 5,937,389 PowerShares FTSE RAFI Developed 1000 Fund Level 1 Level 2 Level 3 Total EUR EUR EUR EUR Financial assets at fair value through profit or loss Equities 6,811,385 – – 6,811,385 Total investments 6,811,385 – – 6,811,385

PowerShares Global Funds Ireland plc
Annual Report and Audited Financial Statements for the year ended 30 September 2011
Notes to the Financial Statements (continued)
82
2. Significant Accounting Policies (continued)
FRS 29 “Financial Instruments: Disclosures” (continued) 30 September 2010 (continued) PowerShares FTSE RAFI Italy 30 Fund Level 1 Level 2 Level 3 Total EUR EUR EUR EUR Financial assets at fair value through profit or loss Equities 5,514,664 26,348 – 5,541,012 Total investments 5,514,664 26,348 – 5,541,012 PowerShares FTSE RAFI Switzerland Fund Level 1 Level 2 Level 3 Total CHF CHF CHF CHF Financial assets at fair value through profit or loss Equities 1,848,555 – – 1,848,555 Total investments 1,848,555 – – 1,848,555 PowerShares FTSE RAFI Hong Kong China Fund Level 1 Level 2 Level 3 Total USD USD USD USD Financial assets at fair value through profit or loss Equities 2,029,842 – – 2,029,842 Total investments 2,029,842 – – 2,029,842 PowerShares Global Agriculture NASDAQ OMX Fund Level 1 Level 2 Level 3 Total USD USD USD USD Financial assets at fair value through profit or loss Equities 15,461,867 – – 15,461,867 Total investments 15,461,867 – – 15,461,867 PowerShares Middle East North Africa NASDAQ OMX Fund Level 1 Level 2 Level 3 Total USD USD USD USD Financial assets at fair value through profit or loss Equities 2,496,804 – – 2,496,804 Corporate Bonds – 1,252 – 1,252 Total investments 2,496,804 1,252 – 2,498,056 PowerShares EuroMTS Cash 3 Months Fund Level 1 Level 2 Level 3 Total EUR EUR EUR EUR Financial assets at fair value through profit or loss Treasury Bills – 60,704,354 – 60,704,354 Total investments – 60,704,354 – 60,704,354

PowerShares Global Funds Ireland plc
Annual Report and Audited Financial Statements for the year ended 30 September 2011
Notes to the Financial Statements (continued)
83
2. Significant Accounting Policies (continued)
The significant accounting policies adopted by the Company are as follows:
(a) Financial assets and financial liabilities at fair value through profit or loss
Classification The Company classifies its investments as financial assets or financial liabilities at fair value through profit or loss. These financial assets and financial liabilities are classified as held for trading or designated by the Board of Directors at fair value through profit or loss at inception.
Financial assets and financial liabilities designated at fair value through profit or loss at inception are those that are managed and their performance evaluated on a fair value basis in accordance with the Company's documented investment strategy.
Recognition/derecognition Purchases and sales of investments are recognised on the trade date being the date on which the Company commits to purchase or sell the investment. Investments are derecognised when the rights to receive cash flows from the investments have expired or the Company has transferred substantially all risks and rewards of ownership. Initial Measurement of investments Financial assets and financial liabilities at fair value through profit or loss are initially recognised at fair value. Transaction costs are expensed in the profit and loss statement. Gains and losses arising from changes in the fair value of the financial assets or financial liabilities at fair value through profit or loss category are presented in the profit and loss account in the period in which they arise.
Valuation of investments The estimation of fair value, after initial recognition, is determined as follows:
Listed investments Investments which are quoted, listed, traded or dealt on a market or exchange are based on quoted prices which, for the purpose of the financial statements, is the closing bid-market price for financial assets and the closing ask market price for financial liabilities, as at the period end date, on the relevant market or exchange which is normally the principal market or exchange for such investments.
Total Return Swaps A total return swap is a financial contract whereby one party agrees to pay another party the total return of a defined asset in return for receiving a floating rate return. The Company enters into unfunded swap agreements on behalf of the sub-funds listed on page 21 of the Investment Manager’s report. The agreements involve each relevant sub-fund paying to the Counterparty, Morgan Stanley, a finance cost in exchange for the investment returns from the counterparty which reflect the performance of the relevant Fund’s benchmark index plus dividends paid/declared by the constituents of that index. The Finance cost is linked to the Federal Fund Rate plus a spread. The swap agreements reset on a monthly basis or in the event of certain triggers such as a redemption request. Collateral is provided to the counterparty in the form of a charge over the Common Investment Pool Assets described below. Total return swaps are marked-to-market using a valuation model and the fair value is recorded on the Balance Sheet. The change in unrealised gains or losses is shown in net gains on financial assets/liabilities at fair value through profit or loss in the Profit and loss account. Total return swap positions are valued using models which utilise observable data to the extent practicable and contain assumptions on the application of this data. Changes in data inputs and assumptions about these factors could affect the reported fair value of the total return swaps.
Common Investment Pool While each fund has separate investment objectives and policies, the investment policies of certain sub-funds, particularly those replicating their respective index utilising unfunded total return swaps, may result in those funds having substantial holdings in cash assets.

PowerShares Global Funds Ireland plc
Annual Report and Audited Financial Statements for the year ended 30 September 2011
Notes to the Financial Statements (continued)
84
2. Significant Accounting Policies (continued)
(a) Financial assets and financial liabilities at fair value through profit or loss (continued)
Common Investment Pool (continued) The Investment Manager may in its discretion pool all or a specified portion of the cash assets of such sub- funds for the purpose of achieving common investment policies on the management of that cash, each such pool shall be called a “Common Investment Pool”. A Common Investment Pool is not a separate legal entity from the Company or any of the sub-funds. The Common Investment Pool will hold investments in accordance with the investment policies common to the sub-funds participating in it. Each sub-fund will be entitled to the underlying assets and liabilities, which may be allocated to it arising out of Investments made through the conduit of a Common Investment Pool. The share of a participating sub-fund in the Common Investment Pool is measured by reference to notional units of equal value in the Common Investment Pool. On formation of the Common Investment Pool, the directors, determined the initial value of the notional units and allocated to each of the participating sub-funds units having an aggregate value equal to the amount of cash contributed. Thereafter, the value of the notional units shall be determined by dividing the net asset value of the Common Investment Pool by the number of notional units subsiding. When additional cash is contributed to or withdrawn from the Common Investment Pool, the allocation of units of the sub-fund concerned will be increased or reduced, as the case may be, by a number of units determined by dividing the net asset value of the Common Investment Pool by the current number of units. The net asset value of the Common Investment Pool will be calculated in accordance with the accounting policies set out above and represent fair value. The cash invested into the Common Investment Pool is invested by the Investment Manager in a variety of money market instruments such as commercial paper, certificates of deposit, treasury bills, government guaranteed bonds, asset back securities, publically traded corporate bonds and floating rate notes. Investments which are quoted, listed traded or dealt on a market or exchange are based on quoted prices. Securities such as commercial paper or certificates of deposit are carried at amortised cost which approximates fair value. Time deposits and cash balances in the pool are carried at par. The Investments of the Common Investment Pool as at year end are detailed in the schedule of investments on page 279. (b) Income from Investments (i) Dividend Income Dividends are credited to the Profit and Loss Account on the dates on which the relevant securities are listed as “ex-dividend”. Dividend income is shown gross of any non-recoverable withholding taxes, which are disclosed separately in the Profit and Loss Account, and net of any tax credits. Recoverable taxes if any are accounted for on a cash receipts basis.

PowerShares Global Funds Ireland plc
Annual Report and Audited Financial Statements for the year ended 30 September 2011
Notes to the Financial Statements (continued)
85
2. Significant Accounting Policies (continued)
(b) Income from Investments (continued) (ii) Bond Interest Interest income on securities is accrued on a daily basis and recognised in the Profit and Loss Account. Interest income on securities includes interest and discount earned (net of premium), which is the difference between the face value and the original cost, including original issue discount.
(c) Expense recognition All expenses are recognised in the Profit and Loss Account on an accruals basis, with the exception of transaction charges relating to the acquisition and realisation of investments which are charged when incurred. Bank interest expense is accrued on a daily basis.
(d) Receivables Receivables are non-derivative financial assets with fixed or determinable payments that are not quoted in an active market. Receivables are recognised initially at fair value plus transaction costs that are directly attributable to their acquisition origination. They are subsequently measured at amortised cost using the effective interest method, less provision for impairment. The carrying amount of other receivables approximates to their fair values.
(e) Payables Payables are recognised initially at fair value and subsequently stated at amortised cost, using the effective interest method. The difference between the proceeds and the amount payable is recognised over the period of the payable. The carrying amount of payables approximates to their fair values.
(f) Redeemable Participating Shares The net asset value per share is computed for each dealing day. The price at which shares are allotted or redeemed is calculated with reference to the net asset value per share as at the close of business on the relevant dealing day in accordance with the prospectus of the Company, as amended.
Redeemable participating shares are redeemable at the shareholder’s option and are classified as financial liabilities. The distribution on these shares is recognised in the profit and loss account as finance costs.
The participating share can be redeemed at any time for cash equal to a proportionate share of the net asset value. The participating share is carried at the redemption amount that is payable at the balance sheet date if the shareholder exercised its right to put the share back into the Company.
The fair value of the financial liability for the redeemable participating shares is the redemption amount per share, calculated as the Net Asset Value per share less any associated duties and charges and any redemption dividend which is payable on the shares redeemed.
(g) Dividends to redeemable participating shareholders Dividends payable to holders of redeemable participating shares are classified as finance costs in the Profit and Loss account.
(h) Taxation Under current law and practice the Company qualifies as an investment undertaking as defined in Section 739B of the Taxes Consolidation Act, 1997, as amended. On that basis, it is not chargeable to Irish tax on its income or gains.

PowerShares Global Funds Ireland plc
Annual Report and Audited Financial Statements for the year ended 30 September 2011
Notes to the Financial Statements (continued)
86
2. Significant Accounting Policies (continued)
(h) Taxation (continued) No Irish tax will arise on the Company in respect of chargeable events in respect of:
a) a shareholder who is neither Irish resident nor ordinarily resident in Ireland for tax purposes, at the time of the chargeable event, provided appropriate valid declarations in accordance with the provisions of the Taxes Consolidation Act, 1997, as amended, are held by the Company; and
b) certain exempted Irish tax resident shareholders who have provided the Company with the necessary signed statutory declarations.
Dividends, interest and capital gains (if any) received on investments made by the Company may be subject to withholding taxes imposed by the country from which the investment income/gains are received and such taxes may not be recoverable by the Company or its shareholders.
(i) Foreign currency Items included in the Company's financial statements are measured using the currency of the primary economic environment in which it operates ("the functional currency"). This is US Dollar, which reflects the fact that the Company's investor base is located in the United States.
For the purpose of combining the Financial Statements of the Funds to arrive at Total Company figures (required under Irish Company Law), the amounts in the Funds' Balance Sheets have been translated to US Dollar at the exchange rate ruling at 30 September 2011. The Profit and Loss Accounts and proceeds from subscriptions and amounts paid on redemptions of redeemable participating shares are translated at the average rates prevailing at the date of the transactions. For rates of exchange please see note 17 on page 155. The notional foreign exchange loss of USD3,414,088 (2010: USD16,162,345) is due to the use of average rates as stated above and the difference in opening and closing rates in translation of opening net assets. This notional foreign exchange adjustment has no impact on the Net Asset Value of the individual Funds.
The following fund has GBP as its functional and presentation currency: PowerShares FTSE RAFI UK 100 Fund.
The following funds have EUR as their functional and presentation currency: PowerShares Global Clean Energy Fund, PowerShares FTSE RAFI Europe Fund, PowerShares Global Listed Private Equity Fund, PowerShares Palisades Global Water Fund, PowerShares FTSE RAFI Developed Europe Mid-Small Fund, PowerShares FTSE RAFI Developed 1000 Fund, PowerShares FTSE RAFI Italy 30 Fund and PowerShares EuroMTS Cash 3 Months Fund.
The following fund has CHF as its functional and presentation currency: PowerShares FTSE RAFI Switzerland Fund.

PowerShares Global Funds Ireland plc
Annual Report and Audited Financial Statements for the year ended 30 September 2011
Notes to the Financial Statements (continued)
87
3. Adjustment to align to the published pricing net asset value The accounting policy of the Company, for the purpose of compliance with FRS 26, is to value its investments at the relevant closing bid market prices on the balance sheet date.
The difference between the bid price valuation of investments stated in the financial statements and the valuation methodology indicated in the prospectus, results in an adjustment between the net assets as per the financial statements and the published pricing net asset value.
Net assets attributable to redeemable participating shareholders represent a liability on the balance sheet, carried at the redemption amount that would be payable at the balance sheet date if the shareholder exercised the right to redeem shares in the Company. The redemption amount is based on the number of shares in issue at the balance sheet date multiplied by the price.
Consequently, the last trading to bid pricing difference described above, adjusts the carrying amount of the net assets attributable to shareholders and the cumulative differences are included as an “Adjustment from bid market prices to last traded market prices” on the balance sheet. Further details are set out in note 20. 4. Cash
The Fund’s cash balances are maintained in an interest-bearing account with the sub-custodian of the Company, The Bank of New York (Luxembourg). These cash balances are held in the name of BNY Mellon Trust Company (Ireland) Limited, the Custodian.
Cash and other liquid assets with a maturity of less than 3 months will be valued at their face value with interest accrued.

PowerShares Global Funds Ireland plc
Annual Report and Audited Financial Statements for the year ended 30 September 2011
Notes to the Financial Statements (continued)
88
5. Financial Assets at fair value through profit or loss
Investments at fair value category has two sub categories: financial assets and liabilities held for trading and those designated by management at fair value through profit and loss at inception. Financial assets or liabilities held for trading are acquired or incurred principally for the purpose of selling or repurchasing over a short period of time.
Total PowerShares EQQQ Fund
PowerShares FTSE RAFI US
1000 Fund
PowerShares Global Clean Energy Fund
PowerShares Dynamic US Market Fund
PowerShares FTSE RAFI
Europe Fund
USD USD USD EUR USD EUR
30 September
2011 30 September
2011 30 September
2011 30 September
2011 30 September
2011 30 September
2011 Financial Asset at Fair Value through Profit or Loss - Held for Trading Equities, at fair value 1,127,812,530 935,497,047 52,755,942 5,309,901 12,575,057 7,075,120 Bonds, at fair value 96,627,153 – – – – – Common Investment Pool 25,162,826 – – – – – Total Return Swaps 417,525 – – – – – Total Assets, at fair value 1,250,020,034 935,497,047 52,755,942 5,309,901 12,575,057 7,075,120

PowerShares Global Funds Ireland plc
Annual Report and Audited Financial Statements for the year ended 30 September 2011
Notes to the Financial Statements (continued)
89
5. Financial Assets at fair value through profit or loss (continued)
PowerShares Global Listed
Private Equity Fund
PowerShares Palisades
Global Water Fund
PowerShares FTSE RAFI Asia Pacific
Ex-Japan Fund
PowerShares FTSE RAFI
Emerging Markets Fund
PowerShares FTSE RAFI
UK 100 Fund
PowerShares FTSE RAFI
All-World 3000 Fund
EUR EUR USD USD GBP USD
30 September
2011 30 September
2011 30 September
2011 30 September
2011 30 September
2011 30 September
2011 Financial Asset at Fair Value through Profit or Loss - Held for Trading Equities, at fair value 3,798,944 5,834,783 5,365,829 – 25,387,255 – Bonds, at fair value – – – – – – Common Investment Pool – – – 12,476,795 – 7,364,880 Total Return Swaps – – – 274,314 – 143,210 Total Assets, at fair value 3,798,944 5,834,783 5,365,829 12,751,109 25,387,255 7,508,090

PowerShares Global Funds Ireland plc
Annual Report and Audited Financial Statements for the year ended 30 September 2011
Notes to the Financial Statements (continued)
90
5. Financial Assets at fair value through profit or loss (continued)
PowerShares FTSE RAFI Developed
Europe Mid-Small Fund
PowerShares FTSE RAFI Developed 1000 Fund
PowerShares FTSE RAFI
Italy 30 Fund
PowerShares FTSE RAFI Switzerland
Fund
PowerShares FTSE RAFI Hong Kong China Fund
PowerShares Global
Agriculture NASDAQ OMX
Fund
PowerShares Middle East North Africa
NASDAQ OMX Fund
EUR EUR EUR CHF USD USD USD
30 September
2011 30 September
2011 30 September
2011 30 September
2011 30 September
2011 30 September
2011 30 September
2011 Financial Asset at Fair Value through Profit or Loss - Held for Trading Equities, at fair value 6,751,511 5,381,247 2,300,077 2,345,673 1,533,535 29,047,279 0 Bonds, at fair value – – – – – – – Common Investment Pool – – – – – – 5,321,151 Total Assets, at fair value 6,751,511 5,381,247 2,300,077 2,345,673 1,533,535 29,047,279 5,321,151
PowerShares EuroMTS Cash 3 Months Fund
EUR
30 September
2011 Financial Asset at Fair Value through Profit or Loss - Held for Trading Equities, at fair value – Bonds, at fair value 72,018,449 Total Assets, at fair value 72,018,449

PowerShares Global Funds Ireland plc
Annual Report and Audited Financial Statements for the year ended 30 September 2011
Notes to the Financial Statements (continued)
91
5. Financial Assets at fair value through profit or loss (continued)
Total PowerShares EQQQ Fund
PowerShares FTSE RAFI US
1000 Fund
PowerShares Global Clean Energy Fund
PowerShares Dynamic US Market Fund
PowerShares FTSE RAFI
Europe Fund
USD USD USD EUR USD EUR
30 September
2010 30 September
2010 30 September
2010 30 September
2010 30 September
2010 30 September
2010 Financial Asset at Fair Value through Profit or Loss - Held for Trading Equities, at fair value 977,103,691 786,419,112 40,973,876 7,717,495 24,929,518 12,238,337 Bonds, at fair value 82,876,353 – – – – – Total Assets, at fair value 1,059,980,044 786,419,112 40,973,876 7,717,495 24,929,518 12,238,337
PowerShares Global Listed
Private Equity Fund
PowerShares Palisades
Global Water Fund
PowerShares FTSE RAFI Asia Pacific
Ex-Japan Fund
PowerShares FTSE RAFI
Emerging Markets Fund
PowerShares FTSE RAFI
UK 100 Fund
PowerShares FTSE RAFI
All-World 3000 Fund
EUR EUR USD USD GBP USD
30 September
2010 30 September
2010 30 September
2010 30 September
2010 30 September
2010 30 September
2010 Financial Asset at Fair Value through Profit or Loss - Held for Trading Equities, at fair value 2,706,965 5,876,883 4,106,326 12,595,341 3,870,692 16,302,509 Bonds, at fair value – – – – – – Total Assets, at fair value 2,706,965 5,876,883 4,106,326 12,595,341 3,870,692 16,302,509

PowerShares Global Funds Ireland plc
Annual Report and Audited Financial Statements for the year ended 30 September 2011
Notes to the Financial Statements (continued)
92
5. Financial Assets at fair value through profit or loss (continued)
PowerShares FTSE RAFI Developed
Europe Mid-Small Fund
PowerShares FTSE RAFI Developed 1000 Fund
PowerShares FTSE RAFI
Italy 30 Fund
PowerShares FTSE RAFI Switzerland
Fund
PowerShares FTSE RAFI Hong Kong China Fund
PowerShares Global
Agriculture NASDAQ OMX
Fund
PowerShares Middle East North Africa
NASDAQ OMX Fund
EUR EUR EUR CHF USD USD USD
30 September
2010 30 September
2010 30 September
2010 30 September
2010 30 September
2010 30 September
2010 30 September
2010 Financial Asset at Fair Value through Profit or Loss - Held for Trading Equities, at fair value 5,937,389 6,811,385 5,541,012 1,848,555 2,029,842 15,461,867 2,496,804 Bonds, at fair value – – – – – – 1,252 Total Assets, at fair value 5,937,389 6,811,385 5,541,012 1,848,555 2,029,842 15,461,867 2,498,056
PowerShares EuroMTS Cash 3 Months Fund
EUR
30 September
2010 Financial Asset at Fair Value through Profit or Loss - Held for Trading Equities, at fair value – Bonds, at fair value 60,704,354 Total Assets, at fair value 60,704,354

PowerShares Global Funds Ireland plc
Annual Report and Audited Financial Statements for the year ended 30 September 2011
Notes to the Financial Statements (continued)
93
6. Accrued Income and Other Receivables
Total PowerShares EQQQ Fund
PowerShares FTSE RAFI US
1000 Fund
PowerShares Global Clean Energy Fund
PowerShares Dynamic US Market Fund
PowerShares FTSE RAFI
Europe Fund
PowerShares Global Listed
Private Equity Fund
USD USD USD EUR USD EUR EUR
30 September
2011 30 September
2011 30 September
2011 30 September
2011 30 September
2011 30 September
2011 30 September
2011 Dividend income receivable 518,619 165,552 69,224 2,405 9,952 9,389 7,603 Interest income receivable 14,769 – – – – – – Stock lending income receivable 38,710 38,710 – – – – – Bond income receivable – – – – – – – Total Other Receivables 572,098 204,262 69,224 2,405 9,952 9,389 7,603

PowerShares Global Funds Ireland plc
Annual Report and Audited Financial Statements for the year ended 30 September 2011
Notes to the Financial Statements (continued)
94
6. Accrued Income and Other Receivables (continued)
PowerShares Palisades
Global Water Fund
PowerShares FTSE RAFI Asia Pacific
Ex-Japan Fund
PowerShares FTSE RAFI
Emerging Markets Fund
PowerShares FTSE RAFI
UK 100 Fund
PowerShares FTSE RAFI
All-World 3000 Fund
PowerShares FTSE RAFI Developed
Europe Mid-Small Fund
PowerShares FTSE RAFI Developed 1000 Fund
EUR USD USD GBP USD EUR EUR
30 September
2011 30 September
2011 30 September
2011 30 September
2011 30 September
2011 30 September
2011 30 September
2011 Dividend income receivable 7,429 21,181 3,657 98,350 – 7,896 13,330 Interest income receivable – – 5,233 – 9,536 – – Stock lending income receivable – – – – – – – Bond income receivable – – – – – – – Total Other Receivables 7,429 21,181 8,890 98,350 9,536 7,896 13,330

PowerShares Global Funds Ireland plc
Annual Report and Audited Financial Statements for the year ended 30 September 2011
Notes to the Financial Statements (continued)
95
6. Accrued Income and Other Receivables (continued)
PowerShares FTSE RAFI
Italy 30 Fund
PowerShares FTSE RAFI Switzerland
Fund
PowerShares FTSE RAFI Hong Kong China Fund
PowerShares Global
Agriculture NASDAQ OMX
Fund
PowerShares Middle East North Africa
NASDAQ OMX Fund
PowerShares EuroMTS Cash 3 Months Fund
EUR CHF USD USD USD EUR
30 September
2011 30 September
2011 30 September
2011 30 September
2011 30 September
2011 30 September
2011 Dividend income receivable – – 6,317 25,055 – – Interest income receivable – – – – – – Stock lending income receivable – – – – – – Bond income receivable – – – – – – Total Other Receivables – – 6,317 25,055 – –

PowerShares Global Funds Ireland plc
Annual Report and Audited Financial Statements for the year ended 30 September 2011
Notes to the Financial Statements (continued)
96
6. Accrued Income and Other Receivables (continued)
Total PowerShares EQQQ Fund
PowerShares FTSE RAFI US
1000 Fund
PowerShares Global Clean Energy Fund
PowerShares Dynamic US Market Fund
PowerShares FTSE RAFI
Europe Fund
PowerShares Global Listed
Private Equity Fund
USD USD USD EUR USD EUR EUR
30 September
2010 30 September
2010 30 September
2010 30 September
2010 30 September
2010 30 September
2010 30 September
2010 Dividend income receivable 364,754 119,702 31,736 1,556 22,563 11,660 4,807 Interest income receivable – – – – – – – Stock lending income receivable 23,143 23,143 – – – – – Bond income receivable 40 – – – – – – Total Other Receivables 387,937 142,845 31,736 1,556 22,563 11,660 4,807

PowerShares Global Funds Ireland plc
Annual Report and Audited Financial Statements for the year ended 30 September 2011
Notes to the Financial Statements (continued)
97
6. Accrued Income and Other Receivables (continued)
PowerShares Palisades
Global Water Fund
PowerShares FTSE RAFI Asia Pacific
Ex-Japan Fund
PowerShares FTSE RAFI
Emerging Markets Fund
PowerShares FTSE RAFI
UK 100 Fund
PowerShares FTSE RAFI
All-World 3000 Fund
PowerShares FTSE RAFI Developed
Europe Mid-Small Fund
PowerShares FTSE RAFI Developed 1000 Fund
EUR USD USD GBP USD EUR EUR
30 September
2010 30 September
2010 30 September
2010 30 September
2010 30 September
2010 30 September
2010 30 September
2010 Dividend income receivable 4,704 12,078 47,899 11,429 32,491 7,485 12,396 Interest income receivable – – – – – – – Stock lending income receivable – – – – – – – Bond income receivable – – – – – – – Total Other Receivables 4,704 12,078 47,899 11,429 32,491 7,485 12,396

PowerShares Global Funds Ireland plc
Annual Report and Audited Financial Statements for the year ended 30 September 2011
Notes to the Financial Statements (continued)
98
6. Accrued Income and Other Receivables (continued)
PowerShares FTSE RAFI
Italy 30 Fund
PowerShares FTSE RAFI Switzerland
Fund
PowerShares FTSE RAFI Hong Kong China Fund
PowerShares Global
Agriculture NASDAQ OMX
Fund
PowerShares Middle East North Africa
NASDAQ OMX Fund
PowerShares EuroMTS Cash 3 Months Fund
EUR CHF USD USD USD EUR
30 September
2010 30 September
2010 30 September
2010 30 September
2010 30 September
2010 30 September
2010 Dividend income receivable – – 4,686 12,144 5,275 – Interest income receivable – – – – – – Stock lending income receivable – – – – – – Bond income receivable – – – – 40 – Total Other Receivables – – 4,686 12,144 5,315 –

PowerShares Global Funds Ireland plc
Annual Report and Audited Financial Statements for the year ended 30 September 2011
Notes to the Financial Statements (continued)
99
7. Accrued Expenses
Total PowerShares EQQQ Fund
PowerShares FTSE RAFI US
1000 Fund
PowerShares Global Clean Energy Fund
PowerShares Dynamic US Market Fund
PowerShares FTSE RAFI
Europe Fund
USD USD USD EUR USD EUR
30 September
2011 30 September
2011 30 September
2011 30 September
2011 30 September
2011 30 September
2011 Management Fee (317,925) (196,337) (17,570) (3,682) (8,400) (2,918) Shareholder Servicing Fee (49,085) (49,085) – – – – Total (367,010) (245,422) (17,570) (3,682) (8,400) (2,918)
PowerShares Global Listed
Private Equity Fund
PowerShares Palisades Global
Water Fund
PowerShares FTSE RAFI Asia Pacific Ex-Japan
Fund
PowerShares FTSE RAFI
Emerging Markets Fund
PowerShares FTSE RAFI UK
100 Fund
PowerShares FTSE RAFI All-
World 3000 Fund
EUR EUR USD USD GBP USD
30 September
2011 30 September
2011 30 September
2011 30 September
2011 30 September
2011 30 September
2011 Management Fee (2,462) (3,676) (3,910) (7,915) (10,545) (3,232) Shareholder Servicing Fee – – – – – – Total (2,462) (3,676) (3,910) (7,915) (10,545) (3,232)

PowerShares Global Funds Ireland plc
Annual Report and Audited Financial Statements for the year ended 30 September 2011
Notes to the Financial Statements (continued)
100
7. Accrued Expenses (continued)
PowerShares FTSE RAFI
Developed Europe Mid-Small Fund
PowerShares FTSE RAFI
Developed 1000 Fund
PowerShares FTSE RAFI Italy
30 Fund
PowerShares FTSE RAFI
Switzerland Fund
PowerShares FTSE RAFI Hong Kong China Fund
PowerShares Global Agriculture
NASDAQ OMX Fund
EUR EUR EUR CHF USD USD
30 September
2011 30 September
2011 30 September
2011 30 September
2011 30 September
2011 30 September
2011 Management Fee (2,877) (2,233) (1,058) (2,125) (803) (20,570) Shareholder Servicing Fee – – – – – – Total (2,877) (2,233) (1,058) (2,125) (803) (20,570)
PowerShares Middle East North
Africa NASDAQ OMX Fund
PowerShares EuroMTS Cash 3
Months Fund
USD EUR
30 September
2011 30 September
2011 Management Fee (3,298) (8,763) Shareholder Servicing Fee – – Total (3,298) (8,763)

PowerShares Global Funds Ireland plc
Annual Report and Audited Financial Statements for the year ended 30 September 2011
Notes to the Financial Statements (continued)
101
7. Accrued Expenses (continued)
Total PowerShares EQQQ Fund
PowerShares FTSE RAFI US
1000 Fund
PowerShares Global Clean Energy Fund
PowerShares Dynamic US Market Fund
PowerShares FTSE RAFI
Europe Fund
USD USD USD EUR USD EUR
30 September
2010 30 September
2010 30 September
2010 30 September
2010 30 September
2010 30 September
2010 Management Fee (249,159) (151,994) (7,454) (4,771) (14,930) (5,201) Shareholder Servicing Fee (37,971) (37,971) – – – – Total (287,130) (189,965) (7,454) (4,771) (14,930) (5,201)
PowerShares Global Listed
Private Equity Fund
PowerShares Palisades Global
Water Fund
PowerShares FTSE RAFI Asia Pacific Ex-Japan
Fund
PowerShares FTSE RAFI
Emerging Markets Fund
PowerShares FTSE RAFI UK
100 Fund
PowerShares FTSE RAFI All-
World 3000 Fund
EUR EUR USD USD GBP USD
30 September
2010 30 September
2010 30 September
2010 30 September
2010 30 September
2010 30 September
2010 Management Fee (1,664) (3,653) (2,566) (8,418) (1,581) (7,158) Shareholder Servicing Fee – – – – – – Total (1,664) (3,653) (2,566) (8,418) (1,581) (7,158)
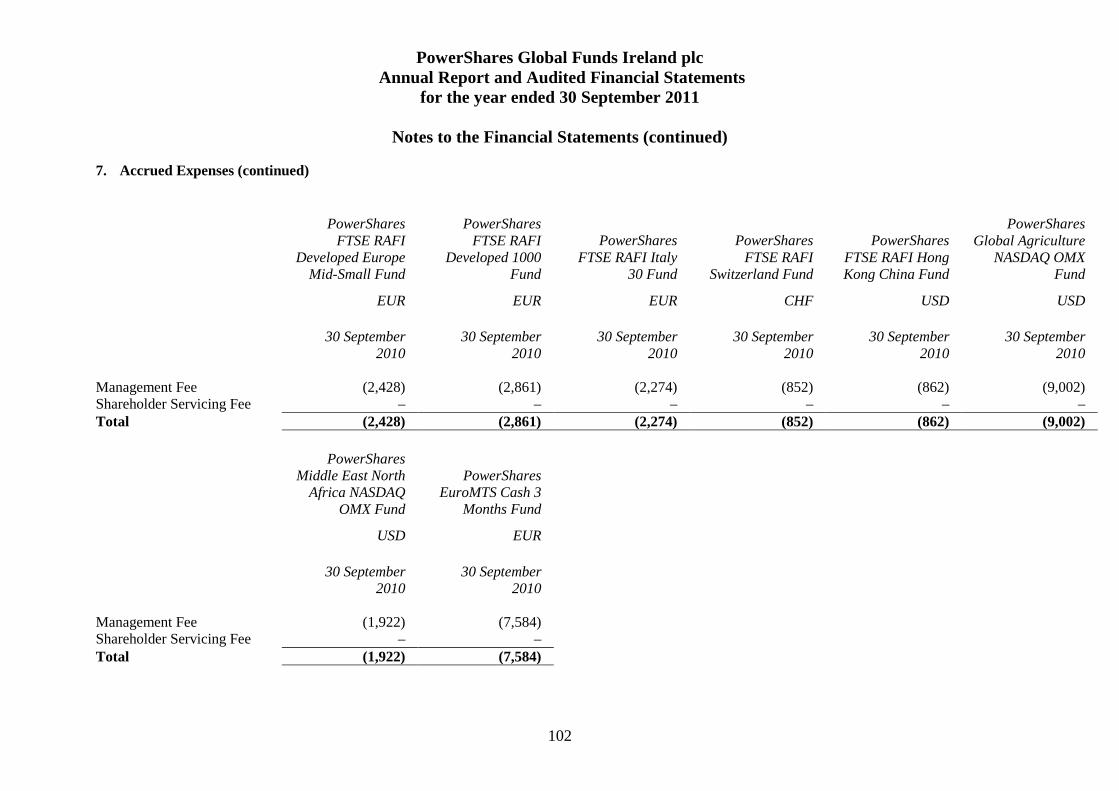
PowerShares Global Funds Ireland plc
Annual Report and Audited Financial Statements for the year ended 30 September 2011
Notes to the Financial Statements (continued)
102
7. Accrued Expenses (continued)
PowerShares FTSE RAFI
Developed Europe Mid-Small Fund
PowerShares FTSE RAFI
Developed 1000 Fund
PowerShares FTSE RAFI Italy
30 Fund
PowerShares FTSE RAFI
Switzerland Fund
PowerShares FTSE RAFI Hong Kong China Fund
PowerShares Global Agriculture
NASDAQ OMX Fund
EUR EUR EUR CHF USD USD
30 September
2010 30 September
2010 30 September
2010 30 September
2010 30 September
2010 30 September
2010 Management Fee (2,428) (2,861) (2,274) (852) (862) (9,002) Shareholder Servicing Fee – – – – – – Total (2,428) (2,861) (2,274) (852) (862) (9,002)
PowerShares Middle East North
Africa NASDAQ OMX Fund
PowerShares EuroMTS Cash 3
Months Fund
USD EUR
30 September
2010 30 September
2010 Management Fee (1,922) (7,584) Shareholder Servicing Fee – – Total (1,922) (7,584)

PowerShares Global Funds Ireland plc
Annual Report and Audited Financial Statements for the year ended 30 September 2011
Notes to the Financial Statements (continued)
103
8. Share Capital Share Capital The authorised share capital of the Company is EUR39,000 divided into 39,000 Subscriber Shares of no par value, and 500 billion shares of no par value. Each of the shares of the Company entitles the holder (the “Shareholder”) to attend and vote at all meetings held by the Company, as well as to participate equally on a pro rata basis in the dividends and net assets of the respective sub-fund.
Subscriber Share Capital The initial share capital of the Company was EUR39,000 divided into 39,000 Subscriber Shares issued at a price of Euro 1 each, which were held by the previous manager, Nasdaq Global Funds (Ireland) Limited, and are now held by the Investment Manager and nominees of the Investment Manager. On 2 December 2002, Nasdaq Global Funds (Ireland) Limited redeemed its holding of 38,993 Subscriber Shares in the Company, leaving 7 shares in issue. The Subscriber Shares do not form part of the share capital representing any fund of the Company and are not included in the calculation of the NAV per share.
The issued and fully paid redeemable participating share capital is at all times equal to the net asset value of the Company. Redeemable participating shares are redeemable at the shareholders option and are classified as financial liabilities. In the case of subscriptions and redemptions for Creation Units, the price per Creation Unit is the number of shares indicated in the prospectus supplement for each sub-fund by the Net Asset Value per Share in each sub-fund. On each Dealing Day on which the application for Creation Units is accepted, the Administrator will report to the applicant the amounts of the Cash Component (the amount of cash required to equalise any differences between the value of the securities set out in the Portfolio Composition File and the Net Asset Value for each Creation Unit), In-Kind Transaction Fee and Transfer Taxes, if any, to be delivered by the applicant to the Custodian with the Portfolio Deposit. Shares in issue Shares Shares Shares Shares Shares
PowerShares EQQQ Fund
PowerShares FTSE RAFI
US 1000 Fund
PowerShares Global Clean Energy Fund
PowerShares Dynamic US Market Fund
PowerShares FTSE RAFI
Europe Fund
Shares in Issue 1 October 2010 16,000,000 4,900,001 1,600,001 3,300,001 1,700,001 Subscriptions for year 5,600,000 3,600,000 100,000 – – Redemptions for year (3,700,000) (2,000,000) – (1,500,000) (500,000) Shares in Issue at 30 September 2011 17,900,000 6,500,001 1,700,001 1,800,001 1,200,001

PowerShares Global Funds Ireland plc
Annual Report and Audited Financial Statements for the year ended 30 September 2011
Notes to the Financial Statements (continued)
104
8. Share Capital (continued) Shares in issue Shares Shares Shares Shares Shares
PowerShares Global Listed
Private Equity Fund
PowerShares Palisades
Global Water Fund
PowerShares FTSE RAFI Asia Pacific
Ex-Japan Fund
PowerShares FTSE RAFI
Emerging Markets Fund
PowerShares FTSE RAFI
UK 100 Fund
Shares in Issue 1 October 2010 500,001 800,001 600,001 1,300,001 450,001 Subscriptions for year 300,000 100,000 300,000 1,200,000 2,800,000 Redemptions for year – – – (800,000) – Shares in Issue at 30 September 2011 800,001 900,001 900,001 1,700,001 3,250,001 Shares in issue Shares Shares Shares Shares Shares
PowerShares FTSE RAFI
All-World 3000 Fund
PowerShares FTSE RAFI Developed
Europe Mid-Small Fund
PowerShares FTSE RAFI Developed 1000 Fund
PowerShares FTSE RAFI
Italy 30 Fund
PowerShares FTSE RAFI Switzerland
Fund
Shares in Issue 1 October 2010 1,250,001 700,001 800,001 1,000,001 200,001 Subscriptions for year 500,000 1,300,000 100,000 – 100,000 Redemptions for year (1,100,000) (1,100,000) (200,000) (400,000) – Shares in Issue at 30 September 2011 650,001 900,001 700,001 600,001 300,001
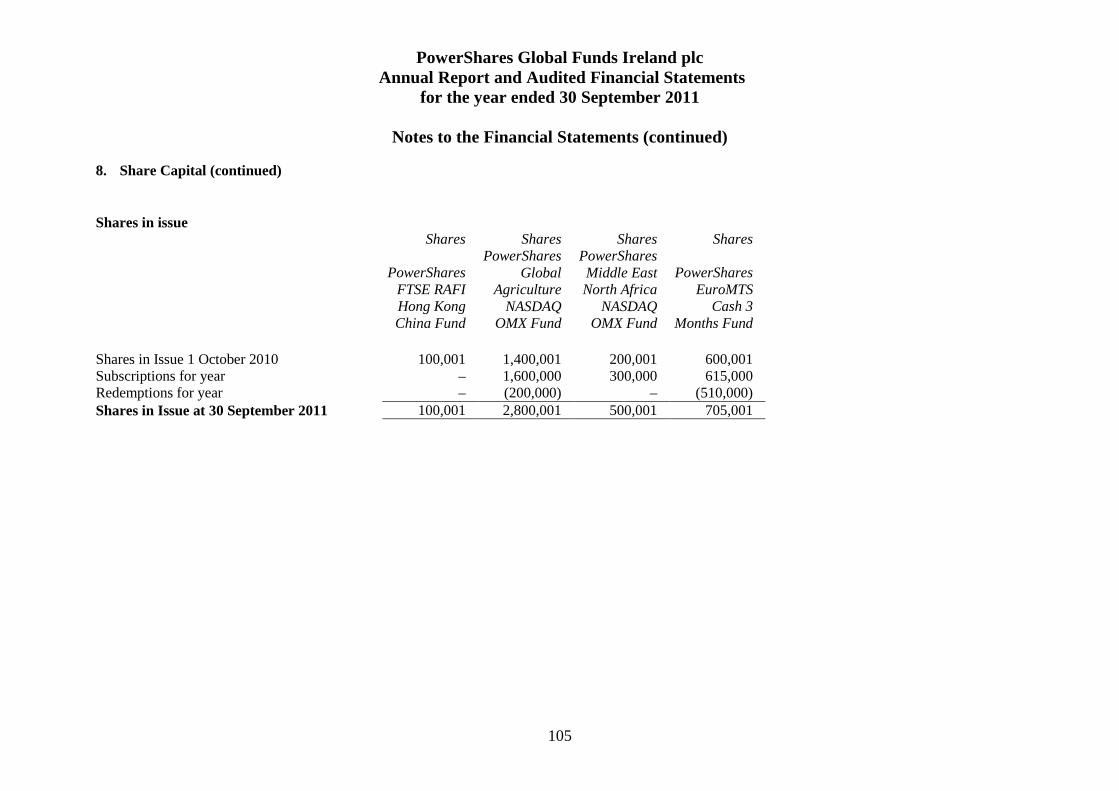
PowerShares Global Funds Ireland plc
Annual Report and Audited Financial Statements for the year ended 30 September 2011
Notes to the Financial Statements (continued)
105
8. Share Capital (continued) Shares in issue Shares Shares Shares Shares
PowerShares FTSE RAFI Hong Kong China Fund
PowerShares Global
Agriculture NASDAQ
OMX Fund
PowerShares Middle East North Africa
NASDAQ OMX Fund
PowerShares EuroMTS
Cash 3 Months Fund
Shares in Issue 1 October 2010 100,001 1,400,001 200,001 600,001 Subscriptions for year – 1,600,000 300,000 615,000 Redemptions for year – (200,000) – (510,000) Shares in Issue at 30 September 2011 100,001 2,800,001 500,001 705,001

PowerShares Global Funds Ireland plc
Annual Report and Audited Financial Statements for the year ended 30 September 2011
Notes to the Financial Statements (continued)
106
8. Share Capital (continued) Shares in issue Shares Shares Shares Shares Shares
PowerShares EQQQ Fund
PowerShares FTSE RAFI
US 1000 Fund
PowerShares Global Clean Energy Fund
PowerShares Dynamic US Market Fund
PowerShares FTSE RAFI
Europe Fund
Shares in Issue 1 October 2009 14,350,000 2,100,001 1,000,001 4,200,001 2,600,001 Subscriptions for year 2,750,000 5,300,000 800,000 900,000 2,100,000 Redemptions for year (1,100,000) (2,500,000) (200,000) (1,800,000) (3,000,000) Shares in Issue at 30 September 2010 16,000,000 4,900,001 1,600,001 3,300,001 1,700,001 Shares in issue Shares Shares Shares Shares Shares
PowerShares Global Listed
Private Equity Fund
PowerShares Palisades
Global Water Fund
PowerShares FTSE RAFI Asia Pacific
Ex-Japan Fund
PowerShares FTSE RAFI
Emerging Markets Fund
PowerShares FTSE RAFI
UK 100 Fund
Shares in Issue 1 October 2009 500,001 600,001 400,001 500,001 450,001 Subscriptions for year – 200,000 200,000 800,000 – Redemptions for year – – – – – Shares in Issue at 30 September 2010 500,001 800,001 600,001 1,300,001 450,001

PowerShares Global Funds Ireland plc
Annual Report and Audited Financial Statements for the year ended 30 September 2011
Notes to the Financial Statements (continued)
107
8. Share Capital (continued) Shares in issue Shares Shares Shares Shares Shares
PowerShares FTSE RAFI
All-World 3000 Fund
PowerShares FTSE RAFI Developed
Europe Mid-Small Fund
PowerShares FTSE RAFI Developed 1000 Fund
PowerShares FTSE RAFI
Italy 30 Fund
PowerShares FTSE RAFI Switzerland
Fund
Shares in Issue 1 October 2009 350,001 500,001 400,001 600,001 200,001 Subscriptions for year 900,000 200,000 400,000 400,000 – Redemptions for year – – – – – Shares in Issue at 30 September 2010 1,250,001 700,001 800,001 1,000,001 200,001 Shares in issue Shares Shares Shares Shares
PowerShares FTSE RAFI Hong Kong China Fund
PowerShares Global
Agriculture NASDAQ
OMX Fund
PowerShares Middle East North Africa
NASDAQ OMX Fund
PowerShares EuroMTS
Cash 3 Months Fund
Shares in Issue 1 October 2009 100,001 400,001 100,001 1,185,001 Subscriptions for year – 1,000,000 100,000 45,000 Redemptions for year – – – (630,000) Shares in Issue at 30 September 2010 100,001 1,400,001 200,001 600,001

PowerShares Global Funds Ireland plc
Annual Report and Audited Financial Statements for the year ended 30 September 2011
Notes to the Financial Statements (continued)
108
9. Efficient Portfolio Management
The Company may, on behalf of each fund and subject to the conditions and within the limits laid down by the Central Bank of Ireland, employ techniques and instruments relating to transferable securities for efficient portfolio management purposes. Transactions for the purposes of efficient portfolio management may be undertaken with a view to achieving a reduction in risk, a reduction in costs or an increase in capital or income returns to a fund and may not be speculative in nature. These techniques and instruments may include investments in financial derivative instruments such as futures (which may be used to manage interest rate risk), options (which may be used to achieve cost efficiencies, for example where the acquisition of the option is more cost effective than purchasing of the underlying asset), swaps and forward currency exchange contracts (both of which may be used to manage currency risk against the base currency of a fund and/or any functional currency of a fund). Such techniques and instruments will be utilised in accordance with the requirements of the Central Bank of Ireland. New techniques and instruments may be developed which may be suitable for use by the Company and the Company (subject as aforesaid) may employ such techniques and instruments. A Fund may enter into stock lending, repurchase and/or reverse repurchase agreements for the purposes of efficient portfolio management in accordance with the provisions of the Notices.
As at 30 September 2011 three of the sub-funds (PowerShares FTSE RAFI Emerging Markets Fund, PowerShares FTSE RAFI All-World 3000 Fund & PowerShares Middle East North Africa NASDAQ OMX Fund) hold total return swaps. A total return swap is a financial contract whereby one party agrees to pay another party the total return of a defined asset in return for receiving a floating rate return. Total return swaps are marked-to-market based upon calculations since the previous reset date using a valuation model and the fair value is recorded on the Balance Sheet. The change in unrealised gains or losses is shown in net gains on financial assets at fair value through profit or loss in the Profit and Loss Account. Please refer to the sub-funds individual schedule of investments for details of the open total return swaps as at 30 September 2011. The collateral for these total return swaps as at 30 September 2011 is provided by the Common Investment Pool as disclosed on page 279 and detailed below.
Common Investment Pool While each Fund will have separate investment objectives and policies, the investment policies of certain Funds may result in each Fund having a substantial holding in cash assets. Where this is the case, the Investment Manager may, in its discretion, pool all or a specified portion of the cash assets of such Funds for the purpose of achieving common investment policies on the management of that cash (each such pool shall be called a “Common Investment Pool”). A Common Investment Pool is not a separate legal entity from the Company or any of the Funds. Rather it is a virtual pool designed to facilitate in an efficient manner the achievement of certain specified investment policies common to two or more Funds.
10. Securities Lending and Collateral
The Company, on behalf of a fund and in furtherance of efficient portfolio management, may enter into stock lending, repurchase and/or reverse repurchase agreements for the purposes of efficient portfolio management in accordance with the provisions of the UCITS Notices. The stock lending agent appointed pursuant to the stock lending agreement is The Bank of New York Mellon. At 30 September 2011, the PowerShares EQQQ Fund had stock on loan to counterparties with a market value of USD9,979,233 (2010: USD15,254,598) and cash collateral attached of USD10,215,382 (2010: USD14,984,000) with securities pledged as collateral of USD nil (2010: USD624,100). The Fund earned stock lending income of USD520,026 (2010: USD250,684) during the year.
On 30 September 2011 the percentage of collateral held over the stocks lent was 102.37% (2010:102.32%). As at 30 September 2011, an accrued rebate of USD56,761 (2010: accrued rebate of USD32,509) was held.
As at 30 September 2011, USD10,215,382 (2010: USD14,984,000) of cash collateral was held on behalf of the PowerShares EQQQ Fund. This has been reflected on the Balance Sheet along with the required liability in accordance with the Accounting Standards.

PowerShares Global Funds Ireland plc
Annual Report and Audited Financial Statements for the year ended 30 September 2011
Notes to the Financial Statements (continued)
109
10. Securities Lending and Collateral (continued) As per the stocklending agreement with the Bank of New York Mellon, the Bank is authorised and directed to invest and re-invest all or substantially all of the cash collateral received in any Approved Investment. All Approved Investments shall be for the account and risk of the lender. To the extent any loss arising out of Approved Investments results in a deficiency in the anount of collateral available to return to a borrower, the lender agrees to pay the Bank on demand cash in amount equal to such deficiency. As at 30 September 2011, USD10,215,382 (2010: USD14,984,000) of cash collateral was re-invested in five short term repurchase agreements. At 30 September 2011 securities pledged as collateral to the Fund in the form of US Treasury notes amounted to $nil (31 December 2010: USD624,100).
11. Schedule of Investments The schedule of investments for each sub-fund are listed on pages 160 to 279.
12. Significant Agreements and Related Party Transactions
Fees of the Investment Manager, the Custodian, Sub-Custodian and the Administrator
The Manager The Company has appointed Invesco PowerShares Capital Management Ireland Limited as its Manager pursuant to the management agreement between the Company and the Manager dated 9 August 2007 (the “Management Agreement”).
Under the terms of the Management Agreement, the Manager has responsibility for the management and administration of the Company’s affairs and the marketing and distribution of the Shares, subject to the overall supervision and control of the Directors.
The Manager has delegated the investment management functions to the Investment Manager and the administration functions to the Administrator.
The Manager may from time to time appoint other entities in relation to the distribution of shares, which entities shall be paid out of the fee payable to the manager and/or out of the subscription proceeds for such shares.
Until further notice, the Manager has undertaken to cap the fee receivable by it from the funds to the following rates per annum of the Net Asset Value (“NAV”) of the relevant Fund, provided that, in no event will the fee receivable by the manager exceed 1% per annum of the NAV of the relevant Fund without the prior approval of Shareholders:
PowerShares EQQQ Fund 0.24% Powershares FTSE RAFI US 1000 Fund 0.39% Powershares Global Clean Energy Fund 0.75% Powershares Dynamic US Market Fund 0.75% PowerShares FTSE RAFI Europe Fund 0.50% PowerShares Global Listed Private Equity Fund 0.75% PowerShares Palisades Global Water Fund 0.75% PowerShares FTSE RAFI Asia Pacific Ex-Japan Fund 0.80% PowerShares FTSE RAFI Emerging Markets Fund 0.65%* Powershares FTSE RAFI UK 100 Fund 0.50% PowerShares FTSE RAFI All-World 3000 Fund 0.50%* PowerShares FTSE RAFI Developed Europe Mid-Small Fund 0.50% PowerShares FTSE RAFI Developed 1000 Fund 0.50% Powershares FTSE RAFI Italy 30 Fund 0.50% PowerShares FTSE RAFI Switzerland Fund 0.55% PowerShares FTSE RAFI Hong Kong China Fund 0.55% PowerShares Global Agriculture NASDAQ OMX Fund 0.75% PowerShares Middle East North Africa NASDAQ OMX Fund 0.75%* Powershares EuroCash 3 Months Fund 0.15%
* Refer to note 19 for changes during the year

PowerShares Global Funds Ireland plc
Annual Report and Audited Financial Statements for the year ended 30 September 2011
Notes to the Financial Statements (continued)
110
12. Significant Agreements and Related Party Transactions (continued)
Fees of the Investment Manager, the Custodian, Sub-Custodian and the Administrator (continued)
The Manager (continued) Fees discharged to the Manager during the period from 1 October 2010 to 30 September 2011 amounted to USD3,987,512 (1 October 2009 to 30 September 2010: USD2,818,694) with USD317,925 payable at year end (2010: USD249,159).
Shareholders servicing fee of 0.06% is receivable by the manager fom the EQQQ Fund.
The Manager will be entitled to a maximum fee of 1% per annum of the Net Asset Value of the funds of the Company and will be responsible for discharging, from its fee, all fees of the Investment Manager, the Administrator and the Custodian together with all reasonable out of pocket expenses of such service providers, excluding sub-custodial fees and expenses, (which will be at normal commercial rates) and transaction related charges of the Administrator and Custodian. The Manager will also be responsible for discharging from its fee other costs attributable to the funds of the Company as detailed under the heading “Operational Expenses” in the Prospectus, this includes directors fees.
The Company’s audit fee and PricewaterhouseCoopers tax charge is outlined in the table below. The audit fee payable at 30 September 2011 was USD144,215 (30 September 2010 : USD196,886).
30 September 2011 30 September 2010 USD USD Auditors remuneration 144,215 196,886 PricewaterhouseCoopers tax charge 46,000 93,000
The Company’s Directors fees were USD60,376 (2010: USD61,435) for the year, with USD5,032 payable at the year end (2010: USDNil). The Audit fee and Directors fee are included in the all-in Manager fee quoted above.
The Administrator The Manager has delegated its responsibilities as administrator, registrar and transfer agent, pursuant to the Administration Agreement dated 8 August 2007 between the Manager and the Administrator. The Administrator will have the responsibility for the administration of the Company's affairs, including the calculation of the NAV per share and preparation of the accounts of the Company, subject to the overall supervision of the Manager and the Directors. The Administrator’s fee is paid out of the all-in-fee by the Manager.
The Custodian The Company has appointed BNY Trust Company (Ireland) Limited (the “Custodian”) as custodian of its assets pursuant to the Custodian Agreement dated 3 September 2002 between the Company and the Custodian.
The Custodian provides safe custody of the Company's assets pursuant to the Regulations. The Custodian’s fees and that of the sub-custodian and their transaction charges are paid out of the all-in-fee by the Manager.
Related Parties The Manager is deemed related to the Company.
As at 30 September 2011, PowerShares FTSE RAFI US 1000 Fund and PowerShares FTSE RAFI Developed 1000 Fund contained two securities related to the Investment Manager. These are bought/sold and valued at arms length. These securities are identified on each schedule of investments by an asterisk.

PowerShares Global Funds Ireland plc
Annual Report and Audited Financial Statements for the year ended 30 September 2011
Notes to the Financial Statements (continued)
111
12. Significant Agreements and Related Party Transactions (continued)
The Manager will discharge the Directors’ fees and legal fees out of its all-in-fee.
Invesco PowerShares Capital Management LLC holds one subscriber share in the Company.
Some employees of Invesco PowerShares Capital Management Ireland Limited hold subscriber shares in the Company.
Invesco Limited, is a related party, by virtue of it being the ultimate parent of Invesco PowerShares Capital Management L.L.C.
13. Soft Commissions
There were no soft commission agreements entered into during the year ended 30 September 2011 or during the year ended 30 September 2010.
14. Derivatives and Other Financial Instruments
Strategy in using financial instruments The Company’s activities expose it to a variety of financial risks: market risk (including currency risk, interest rate risk and price risk), credit risk and liquidity risk. The Company’s overall risk management programme focuses on the unpredictability of financial markets and seeks to minimise potential adverse effects on each funds financial performance.
The following information is not intended to be a comprehensive summary of all risks and investors should refer to the Prospectus for a more detailed discussion of the risks inherent in investing in the Company.
Please refer to the Investment Managers report on pages 6 to 8 for each sub-funds investment strategy and objective.
The Company can, subject to the approval of a risk management process, use derivative financial instruments to moderate certain risk exposures.
The Investment Manager is responsible for ensuring that the funds are managed within the terms of the funds’ investment guidelines and limits set out in the Funds’ Prospectus and Supplements.
The Directors of the Company and Manager review bi-monthly investment performance reports.
The Directors of the Company have delegated the responsibility of the daily risk management to the key management personnel of the Investment Manager.
Market price risk The Company’s equity securities are susceptible to market price risk arising from uncertainties about future prices of the instruments held specifically from price, currency and interest rate movements. It represents the potential gain or loss the Funds might enjoy or suffer as a result of holding market positions in the face of price movements.
The sub-funds of the Company are exposed to market price risk arising from their investments in a wide range of publicly traded financial assets and total return swaps. The correlation of each sub-fund to its related index is a metric monitored by the Investment Manager. All of the indices are diversified and each has its own specific index methodology. This in turn requires each of the funds to be diversified. By diversifying the portfolio, the risk that a price change of a particular investment will have a material impact on a sub-fund is minimized.
There is no significant price risk associated with the investments made through the Common Investment Pool due to the nature of the investments held by the pool, e.g. short term, highly liquid commercial papers which trade at amortised cost. Amortised cost approximates to fair value.

PowerShares Global Funds Ireland plc
Annual Report and Audited Financial Statements for the year ended 30 September 2011
Notes to the Financial Statements (continued)
112
14. Derivatives and Other Financial Instruments (continued)
Market price risk (continued) At 30 September 2011 and 30 September 2010 the overall market rate exposures were as follows:
PowerShares EQQQ Fund PowerShares FTSE RAFI US
1000 Fund
Fair Value % of Net Assets
at Fair Value Fair Value % of Net Assets
at Fair Value 2011 2011 2011 2011 USD % USD % Equities designated at fair value 935,497,047 99.44 52,755,942 99.87 Bonds designated at fair value – – – – Total 935,497,047 99.44 52,755,942 99.87
PowerShares Global Clean
Energy Fund PowerShares Dynamic US
Market Fund PowerShares FTSE RAFI
Europe Fund
Fair Value % of Net Assets
at Fair Value Fair Value % of Net Assets
at Fair Value Fair Value % of Net Assets
at Fair Value 2011 2011 2011 2011 2011 2011 EUR % USD % EUR % Equities designated at fair value 5,309,901 99.35 12,575,057 99.94 7,075,120 99.98 Bonds designated at fair value – – – – – – Common Investment Pool – – – – – – Total 5,309,901 99.35 12,575,057 99.94 7,075,120 99.98

PowerShares Global Funds Ireland plc
Annual Report and Audited Financial Statements for the year ended 30 September 2011
Notes to the Financial Statements (continued)
113
14. Derivatives and Other Financial Instruments (continued)
Market price risk (continued)
PowerShares Global Listed
Private Equity Fund PowerShares Palisades Global
Water Fund PowerShares FTSE RAFI Asia
Pacific Ex-Japan Fund
Fair Value % of Net Assets
at Fair Value Fair Value % of Net Assets
at Fair Value Fair Value % of Net Assets
at Fair Value 2011 2011 2011 2011 2011 2011 EUR % EUR % USD % Equities designated at fair value 3,798,944 100.38 5,834,783 99.48 5,365,829 98.19 Bonds designated at fair value – – – – – – Common Investment Pool – – – – – – Total 3,798,944 100.38 5,834,783 99.48 5,365,829 98.19
PowerShares FTSE RAFI Emerging Markets Fund
PowerShares FTSE RAFI UK 100 Fund
PowerShares FTSE RAFI All-World 3000 Fund
Fair Value % of Net Assets
at Fair Value Fair Value % of Net Assets
at Fair Value Fair Value % of Net Assets
at Fair Value 2011 2011 2011 2011 2011 2011 USD % GBP % USD % Equities designated at fair value – – 25,387,255 100.00 – – Bonds designated at fair value – – – – – – Common Investment Pool 12,476,795 92.63 – – 7,364,880 97.44 Swaps designated at fair value 274,314 2.04 – – 143,210 1.89 Total 12,751,109 94.67 25,387,255 100.00 7,508,090 99.33

PowerShares Global Funds Ireland plc
Annual Report and Audited Financial Statements for the year ended 30 September 2011
Notes to the Financial Statements (continued)
114
14. Derivatives and Other Financial Instruments (continued)
Market price risk (continued)
PowerShares FTSE RAFI Developed Europe Mid-Small
Fund
PowerShares FTSE RAFI Developed 1000 Fund
PowerShares FTSE RAFI Italy 30 Fund
Fair Value % of Net Assets
at Fair Value Fair Value % of Net Assets
at Fair Value Fair Value % of Net Assets
at Fair Value 2011 2011 2011 2011 2011 2011 EUR % EUR % EUR % Equities designated at fair value 6,751,511 99.92 5,381,247 99.79 2,300,077 99.75 Bonds designated at fair value – – – – – – Total 6,751,511 99.92 5,381,247 99.79 2,300,077 99.75
PowerShares FTSE RAFI Switzerland Fund
PowerShares FTSE RAFI Hong Kong China Fund
PowerShares Global Agriculture NASDAQ OMX
Fund
Fair Value % of Net Assets
at Fair Value Fair Value % of Net Assets
at Fair Value Fair Value % of Net Assets
at Fair Value 2011 2011 2011 2011 2011 2011 CHF % USD % USD % Equities designated at fair value 2,345,673 97.99 1,533,535 97.44 29,047,279 99.95 Bonds designated at fair value – – – – – – Total 2,345,673 97.99 1,533,535 97.44 29,047,279 99.95

PowerShares Global Funds Ireland plc
Annual Report and Audited Financial Statements for the year ended 30 September 2011
Notes to the Financial Statements (continued)
115
14. Derivatives and Other Financial Instruments (continued)
Market price risk (continued)
PowerShares Middle East North Africa NASDAQ OMX
Fund
PowerShares EuroMTS Cash 3 Months Fund
Fair Value % of Net Assets
at Fair Value Fair Value % of Net Assets
at Fair Value 2011 2011 2011 2011 USD % EUR % Equities designated at fair value – – – – Bonds designated at fair value – – 72,018,449 99.98 Common Investment Pool 5,321,151 102.56 – – Total 5,321,151 102.56 72,018,449 99.98
PowerShares EQQQ Fund PowerShares FTSE RAFI US
1000 Fund PowerShares Global Clean
Energy Fund
Fair Value % of Net Assets
at Fair Value Fair Value % of Net Assets
at Fair Value Fair Value % of Net Assets
at Fair Value 2010 2010 2010 2010 2010 2010 USD % USD % EUR % Equities designated at fair value 786,419,112 100.00 40,973,876 99.99 7,717,495 100.10 Bonds designated at fair value – – – – – – Total 786,419,112 100.00 40,973,876 99.99 7,717,495 100.10
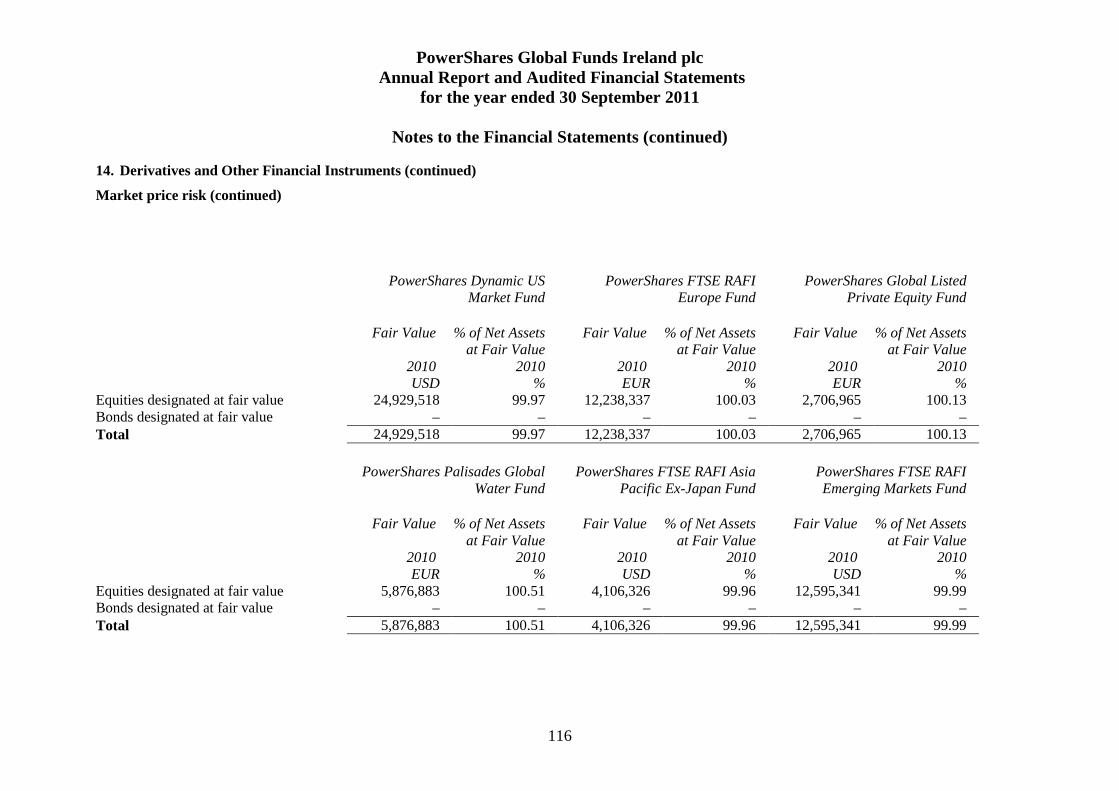
PowerShares Global Funds Ireland plc
Annual Report and Audited Financial Statements for the year ended 30 September 2011
Notes to the Financial Statements (continued)
116
14. Derivatives and Other Financial Instruments (continued)
Market price risk (continued)
PowerShares Dynamic US
Market Fund PowerShares FTSE RAFI
Europe Fund PowerShares Global Listed
Private Equity Fund
Fair Value % of Net Assets
at Fair Value Fair Value % of Net Assets
at Fair Value Fair Value % of Net Assets
at Fair Value 2010 2010 2010 2010 2010 2010 USD % EUR % EUR % Equities designated at fair value 24,929,518 99.97 12,238,337 100.03 2,706,965 100.13 Bonds designated at fair value – – – – – – Total 24,929,518 99.97 12,238,337 100.03 2,706,965 100.13
PowerShares Palisades Global
Water Fund PowerShares FTSE RAFI Asia
Pacific Ex-Japan Fund PowerShares FTSE RAFI Emerging Markets Fund
Fair Value % of Net Assets
at Fair Value Fair Value % of Net Assets
at Fair Value Fair Value % of Net Assets
at Fair Value 2010 2010 2010 2010 2010 2010 EUR % USD % USD % Equities designated at fair value 5,876,883 100.51 4,106,326 99.96 12,595,341 99.99 Bonds designated at fair value – – – – – – Total 5,876,883 100.51 4,106,326 99.96 12,595,341 99.99

PowerShares Global Funds Ireland plc
Annual Report and Audited Financial Statements for the year ended 30 September 2011
Notes to the Financial Statements (continued)
117
14. Derivatives and Other Financial Instruments (continued)
Market price risk (continued)
PowerShares FTSE RAFI UK 100 Fund
PowerShares FTSE RAFI All-World 3000 Fund
PowerShares FTSE RAFI Developed Europe Mid-Small
Fund
Fair Value % of Net Assets
at Fair Value Fair Value % of Net Assets
at Fair Value Fair Value % of Net Assets
at Fair Value 2010 2010 2010 2010 2010 2010 GBP % USD % EUR % Equities designated at fair value 3,870,692 99.95 16,302,509 100.00 5,937,389 99.95 Bonds designated at fair value – – – – – – Total 3,870,692 99.95 16,302,509 100.00 5,937,389 99.95
PowerShares FTSE RAFI
Developed 1000 Fund PowerShares FTSE RAFI Italy
30 Fund PowerShares FTSE RAFI
Switzerland Fund
Fair Value % of Net Assets
at Fair Value Fair Value % of Net Assets
at Fair Value Fair Value % of Net Assets
at Fair Value 2010 2010 2010 2010 2010 2010 EUR % EUR % CHF % Equities designated at fair value 6,811,385 99.90 5,541,012 99.99 1,848,555 100.00 Bonds designated at fair value – – – – – – Total 6,811,385 99.90 5,541,012 99.99 1,848,555 100.00

PowerShares Global Funds Ireland plc
Annual Report and Audited Financial Statements for the year ended 30 September 2011
Notes to the Financial Statements (continued)
118
14. Derivatives and Other Financial Instruments (continued)
Market price risk (continued)
PowerShares FTSE RAFI Hong Kong China Fund
PowerShares Global Agriculture NASDAQ OMX
Fund
PowerShares Middle East North Africa NASDAQ OMX
Fund
Fair Value % of Net Assets
at Fair Value Fair Value % of Net Assets
at Fair Value Fair Value % of Net Assets
at Fair Value 2010 2010 2010 2010 2010 2010 USD % USD % USD % Equities designated at fair value 2,029,842 99.98 15,461,867 100.00 2,496,804 99.89 Bonds designated at fair value – – – – 1,252 0.05 Total 2,029,842 99.98 15,461,867 100.00 2,498,056 99.94
PowerShares EuroMTS Cash 3
Months Fund
Fair Value % of Net Assets
at Fair Value 2010 2010 EUR % Equities designated at fair value – – Bonds designated at fair value 60,704,354 99.91 Total 60,704,354 99.91

PowerShares Global Funds Ireland plc
Annual Report and Audited Financial Statements for the year ended 30 September 2011
Notes to the Financial Statements (continued)
119
14. Derivatives and Other Financial Instruments (continued)
Market price risk (continued) The sensitivity analysis for the sub-funds listed in the below table assumes that the price movement of the sub-funds is independent and all other variables in the market are constant.
The sensitivity analysis uses historical data as a basis for determining future events; it does not encompass all possible scenarios particularly of an extreme nature. These values do not capture all events which can happen within the fund some which can have high volatility and impact.
As detailed in the below table, the increase in the respective underlying indices at 30 September 2011, with all other variables stable, would have resulted in the changes in net assets attributable to holders of redeemable participating shares as follows:
Benchmark Change in
Movement Net Assets
Fund Name Benchmark Index Currency *% 2011
PowerShares EQQQ Fund Nasdaq-100 Index USD 8 74,778,364
PowerShares FTSE RAFI US 1000 Fund FTSE RAFI US 1000 Index USD 0 -
PowerShares Global Clean Energy Fund WilderHill New Energy Global Innovation Index
EUR 34 1,804,434
PowerShares Dynamic US Market Fund Dynamic Market Intellidex USD 6 699,732
PowerShares FTSE RAFI Europe Fund FTSE RAFI Europe Index EUR 14 980,047
PowerShares Global Listed Private Equity Fund Global Listed Private Equity Index EUR 9 326,164
PowerShares Palisades Global Water Fund Palisades Global Water Index EUR 8 496,476
PowerShares FTSE RAFI Asia Pacific Ex-Japan Fund FTSE RAFI Asia Pacific ex-Japan Index USD 8 423,096
PowerShares FTSE RAFI Emerging Markets Fund FTSE RAFI Emerging Markets Index USD 15 2,020,729
PowerShares FTSE RAFI UK 100 Fund FTSE RAFI UK 100 Index GBP 5 1,357,494
PowerShares FTSE RAFI All World 3000 Fund FTSE RAFI All World 3000 Index USD 7 560,528
PowerShares FTSE RAFI Developed Europe Mid-Small Fund
FTSE RAFI Europe Small Index EUR 8 572,876
PowerShares FTSE RAFI Developed 1000 Fund FTSE RAFI Developed 1000 Index EUR 6 301,898
PowerShares FTSE RAFI Italy 30 Fund FTSE RAFI Italy 30 Index EUR 27 627,931
PowerShares FTSE RAFI Switzerland Fund FTSE RAFI Switzerland Index CHF 12 287,715
PowerShares FTSE RAFI Hong Kong China Fund FTSE RAFI Hong Kong/China Index USD 19 306,099
PowerShares Global Agriculture NASDAQ OMX Fund NASDAQ OMX Global Agriculture Index USD 4 1,165,940
PowerShares Middle East North Africa NASDAQ OMX Fund
NASDAQ OMX MENA Index USD 13 693,335
PowerShares EuroMTS Cash 3 Months Fund euroMTS Government Bill Index EUR 1 783,788
An equivalent decrease in the indices, with all variables held constant, would have decreased the net assets attributable to holders of redeemable participating shares by the same amount.
* Rounded to the nearest percent

PowerShares Global Funds Ireland plc
Annual Report and Audited Financial Statements for the year ended 30 September 2011
Notes to the Financial Statements (continued)
120
14. Derivatives and Other Financial Instruments (continued)
Market price risk (continued) As detailed in the below table, the increase in the respective underlying indices at 30 September 2010, with all other variables stable, would have resulted in the changes in net assets attributable to holders of redeemable participating shares as follows:
Fund Name Benchmark Index
Currency
Benchmark Movement *%
Change in Net Assets 2010
('000)
PowerShares EQQQ Fund Nasdaq-100 Index USD 5 39,321
PowerShares FTSE RAFI US 1000 Fund FTSE RAFI US 1000 Index USD 6 2,459
PowerShares Global Clean Energy Fund WilderHill New Energy Global Innovation Index
EUR 12 925
PowerShares Dynamic US Market Fund Dynamic Market Intellidex USD 7 1,746
Powershares FTSE RAFI Europe Fund FTSE RAFI Europe Index EUR 9 1,101
Powershares Global Listed Private Equity Fund Global Listed Private Equity Index EUR 5 135
Powershares Palisades Global Water Fund Palisades Global Water Index EUR 12 702
PowerShares FTSE RAFI Asia Pacific Ex-Japan Fund **
FTSE RAFI Asia Pacific Ex-Japan Index USD 10 411
PowerSharesFTSE RAFI Emerging Markets Fund **
FTSE RAFI Emerging Markets Index USD 15 1,890
PowerShares FTSE RAFI UK 100 Fund FTSE RAFI UK 100 Index GBP 7 271
PowerShares FTSE RAFI All-World 3000 Fund ** FTSE RAFI All-World 3000 Index USD 6 978
PowerShares FTSE RAFI Developed Europe Mid-Small Fund
FTSE RAFI Europe Small Index EUR 9 535
PowerShares FTSE RAFI Developed 1000 Fund FTSE RAFI Developed 1000 Index EUR 5 341
PowerShares FTSE RAFI Italy 30 Fund FTSE RAFI Italy 30 Index EUR 5 277
PowerShares FTSE RAFI Switzerland Fund ** FTSE RAFI Switzerland Index CHF 5 92
PowerShares FTSE RAFI Hong Kong China Fund ** FTSE RAFI Hong Kong China Index USD 10 203
PowerShares Global Agriculture NASDAQ OMX Fund NASDAQ OMX Global Agriculture Index USD 5 773
PowerShares Middle East North Africa NASDAQ OMX Fund
NASDAQ OMX Middle East North Africa Index
USD 13 328
PowerShares EuroMTS Cash 3 Months Fund EuroMTS Government Bills Index EUR 1 608
An equivalent decrease in the indices, with all variables held constant, would have decreased the net assets attributable to holders of redeemable participating shares by the same amount.
*Rounded to the nearest percent
** The Board of Directors approved the transitioning of the underlying indices for five of the UCITS funds from replicating the legacy Dynamic Indices (sponsored by QSG) to replicating new FTSE RAFI Indices. The transition for the existing Dynamic funds to the new funds tracking the FTSE RAFI Indices was effective 1st February 2010. The chart on the following page outlines the legacy fund and the corresponding new fund:

PowerShares Global Funds Ireland plc
Annual Report and Audited Financial Statements for the year ended 30 September 2011
Notes to the Financial Statements (continued)
121
14. Derivatives and Other Financial Instruments (continued)
Market price risk (continued) PowerShares Dynamic Italy Fund PowerShares FTSE RAFI Switzerland PowerShares Dynamic Europe Fund PowerShares FTSE RAFI Emerging Markets PowerShares Dynamic Global Dev Markets Fund PowerShares FTSE RAFI Asia Pacific Ex Japan PowerShares Dynamic Japan Fund PowerShares FTSE RAFI Hong Kong / China PowerShares Dynamic UK Fund PowerShares FTSE RAFI All World 3000
Based on historic movements and volatilities in these market variables, and management’s knowledge and experience of the financial markets, it was determined that the movements listed for respective indices were reasonably possible over a 12 month period.
(Historical movements are not always indicative of future events and the movements may differ significantly from the movements disclosed above.)
Interest rate risk
Any excess cash and cash equivalents are invested at short-term market interest rates. Interest rate risk is the risk that the fair value or future cashflows of a financial instrument will fluctuate because of changes in market interest rates. The Company is exposed to interest rate risks from cash balances held with BNY Mellon Trust Company (Ireland) Limited. The interest rate for those cash accounts, that earn interest, ranges from 0% to 2.15%. The PowerShares EuroMTS Cash 3 Months Fund is exposed to interest rate risk through its investment in corporate and government bonds where the value of these securities may fluctuate as a result of a change in interest rates.
The investments exposed to interest rate risk are detailed on the schedule of investments.
Movements in the prices of these investments are derived from movements in market interest rates and issuer creditworthiness. Issuer creditworthiness and credit spreads are monitored by the Investment Manager regularly. The securities in which the PowerShares EuroMTS Cash 3 Months Fund invest will generally have a minimum rating of investment qrade from a ratings agency as set out in the investment policy of the PowerShares EuroMTS Cash 3 Months Fund.
The sensitivity of the fund’s NAV as a result of interest rate movements is included in the market price paragraphs on pages 119 and 120.
Although the movements in interest rates drive the value of the PowerShares EuroMTS Cash 3 Months Fund, as listed, the performance of the PowerShares EuroMTS Cash 3 Months Fund move in line with its benchmarks. Management manage the PowerShares EuroMTS Cash 3 Months Fund in line with its benchmark rather than specifically managing interest rate risk. The sensitivity analysis for the PowerShares EuroMTS Cash 3 Months Fund assumes that change in the benchmark index while holding all other variables constant. In practice this is unlikely to occur, and changes in some of the variable may be correlated. In addition, as the sensitivity analysis uses historical data as a basis for determining future events, it does not encompass all possible scenarios, particularly those that are of an extreme nature.
Credit risk
Credit risk is the risk that third parties which either hold assets owned by the Funds or owe the Funds cash due to various transactions with the Funds are unable to return or pay the funds the full amount due in a timely manner.
The Funds have appointed BNY Mellon Trust Company (Ireland) Limited to act as Custodian of the Funds assets. Substantially all of the cash and investments in equity securities of the Funds are held by BNY Mellon Trust Company (Ireland) Limited at year end.
The Common Investment Pool contains mainly short term and highly liquid commercial papers and is therefore less at risk of default due to the nature of its holdings.

PowerShares Global Funds Ireland plc
Annual Report and Audited Financial Statements for the year ended 30 September 2011
Notes to the Financial Statements (continued)
122
14. Derivatives and Other Financial Instruments (continued)
Credit risk (continued) The Funds are exposed to credit risk through the use of BNY Mellon Trust Company (Ireland) Limited as Custodian. Bankruptcy or insolvency of the banks may cause the funds rights with respect to its cash and investments held by the bank to be delayed or limited. The maximum exposure to this risk at 30 September 2011 is the cash amounts disclosed on the Balance Sheet and the investments as disclosed in the Schedules of Investments.
To mitigate the risk that the Funds are exposed to from the use of the Custodian and Counterparties, the Advisor employs appropriate procedures to ensure that the counterparties are reputable institutions and the credit risk is acceptable to the Funds. The Funds only transact with custodians/counterparties that are regulated entities subject to prudential supervision, or with high credit-ratings assigned by international credit-rating agencies. In addition, the Funds’ securities are maintained by the Custodian in segregated accounts. In the event of insolvency or bankruptcy of the Custodian, the Funds securities are segregated and protected. Credit risk arising on security transactions with brokers relates to the transactions awaiting settlement. Risk relating to unsettled transactions is considered small due to the short settlement period involved and the credit quality of the brokers used. The Funds monitor the credit ratings and financial positions of the brokers used to further mitigate this risk.
The Company’s holdings in total return swap agreements expose the Company to credit risk. Credit risk arises from the failure of the counterparty to perform according to the terms of the contract. The Company has entered into swap agreements with a single counterparty, Morgan Stanley, and this increases the significance of the counterparty default and associated risks. The credit rating of Morgan Stanley is A-1 (per Standard & Poors). In addition all open swap positions are unfunded thereby mitigating the associated risks of counterparty default. There are no past due or impaired assets as of 30 September 2011 or as of 30 September 2010.
Currency risk Assets and liabilities of the Funds may be denominated in a currency other than the Functional Currency of each Sub-Fund and changes in the exchange rate between the base currency and the currency of the asset may lead to a depreciation of the value of the Fund’s assets as expressed in the base currency. It may not be possible or practical to hedge against such exchange rate risk. The Fund’s Investment Manager may, but is not obliged to, mitigate this risk by using financial instruments.
There was no currency risk on the following funds at 30 September 2011:
PowerShares EQQQ Fund PowerShares FTSE RAFI US 1000 Fund PowerShares Dynamic US Market Fund PowerShares FTSE RAFI Italy 30 Fund PowerShares EuroMTS Cash 3 Months Fund There was no currency risk on the following funds at 30 September 2010:
PowerShares EQQQ Fund PowerShares FTSE RAFI US 1000 Fund PowerShares Dynamic US Market Fund PowerShares FTSE RAFI Italy 30 Fund PowerShares EuroMTS Cash 3 Months Fund The foreign currency sensitivity analysis below is based on a change in one variable while holding all other variables constant. In practice this is unlikely to occur, and changes in some of the assumptions may be correlated – for example, changes in interest rates. In addition, as the sensitivity analysis uses historical data as a basis for determining future events, it does not encompass all possible scenarios, particularly those that are of an extreme nature. The sensitivity movement in the currencies is a standard 5% for less volatile currencies and average of the high and low over the last two years for more volatile currencies. These movements may be different to the long term volatility of the currencies.

PowerShares Global Funds Ireland plc
Annual Report and Audited Financial Statements for the year ended 30 September 2011
Notes to the Financial Statements (continued)
123
14. Derivatives and Other Financial Instruments (continued)
Currency risk (continued) At 30 September 2011 and 30 September 2010, had the Euro/ US Dollar/ Pound Sterling strengthened/(weakened) by 5% in relation to the major currencies listed in the tables below, assuming no hedging of this position, the net assets attributable to redeemable participating shareholders and the change in net assets attributable to holders of redeemable participating shares per the income statement of the funds would have decreased (increased) by the amounts shown below:
The currency exposure for all other sub-funds as at 30 September 2011 is as follows: The 5% sensitivity movement is only calculated on monetary amounts. PowerShares Global Clean Energy Fund 30 September 2011
Monetary
EUR Non- Monetary
EUR
Currency Exposure
EUR Sensitivity Movement
2011 EUR
BRL (20,441) 145,592 125,151 5% (1,022) CAD 38,902 111,702 150,604 5% 1,945 CHF 4 132,708 132,712 5% – DKK – 249,167 249,167 5% – GBP 1 3,323 3,324 5% – HKD (122,801) 893,017 770,216 5% (6,140) JPY 79 209,290 209,369 5% 4 NOK (4) 88,382 88,378 5% – NZD 8 87,555 87,563 5% – PHP 18,021 93,367 111,388 5% 901 TWD (35,182) 115,584 80,402 5% (1,759) USD (1,188) 2,121,441 2,120,253 5% (59) Total (6,130)
PowerShares FTSE RAFI Europe Fund 30 September 2011
Monetary
EUR Non- Monetary
EUR
Currency Exposure
EUR Sensitivity Movement
2011 EUR
CHF 228 551,222 551,450 5% 11 DKK – 61,009 61,009 5% – GBP 8,897 2,279,664 2,288,561 5% 445 NOK – 99,402 99,402 5% – SEK (3) 306,607 306,604 5% – USD 133 – 133 5% 7 Total 463

PowerShares Global Funds Ireland plc
Annual Report and Audited Financial Statements for the year ended 30 September 2011
Notes to the Financial Statements (continued)
124
14. Derivatives and Other Financial Instruments (continued)
Currency risk (continued) PowerShares Global Listed Private Equity Fund 30 September 2011
Monetary
EUR Non- Monetary
EUR
Currency Exposure
EUR Sensitivity Movement
2011 EUR
BRL (9,775) 39,230 29,455 5% (489) CAD 13,816 156,956 170,772 5% 691 CHF (5) 124,809 124,804 5% – DKK – 27,582 27,582 5% – GBP – 423,239 423,239 5% – HKD (77,583) 98,907 21,324 5% (3,879) JPY (1) 70,512 70,511 5% – SEK 5 339,544 339,549 5% – SGD – 18,775 18,775 5% – USD 10,163 1,588,842 1,599,005 5% 508 ZAR (21) 115,659 115,638 5% (1) Total (3,170)
PowerShares Palisades Global Water Fund 30 September 2011
Monetary
EUR Non- Monetary
EUR
Currency Exposure
EUR Sensitivity Movement
2011 EUR
BRL 13,732 101,231 114,963 5% 687 CAD (52,000) 360,603 308,603 5% (2,600) CHF – 246,129 246,129 5% – GBP 3 354,044 354,047 5% – HKD 64,007 105,853 169,860 5% 3,200 JPY 5,454 820,754 826,208 5% 273 MYR (29,324) 110,550 81,226 5% (1,466) SGD 1 352,248 352,249 5% – USD 333,032 1,495,070 1,828,102 5% 16,652 Total 16,746
PowerShares FTSE RAFI Asia Pacific Ex-Japan Fund 30 September 2011
Monetary
USD Non- Monetary
USD
Currency Exposure
USD Sensitivity Movement
2011 USD
AUD 5,664 2,280,172 2,285,836 5% 283 CAD (1) – (1) 5% – HKD 2,426 646,690 649,116 5% 121 KRW – 1,916,473 1,916,473 5% – NZD 427 62,607 63,034 5% 21 SGD 659 388,807 389,466 5% 33 Total 458

PowerShares Global Funds Ireland plc
Annual Report and Audited Financial Statements for the year ended 30 September 2011
Notes to the Financial Statements (continued)
125
14. Derivatives and Other Financial Instruments (continued)
Currency risk (continued) PowerShares FTSE RAFI Emerging Markets Fund 30 September 2011
Monetary
USD Non- Monetary
USD
Currency Exposure
USD Sensitivity Movement
2011 USD
BRL 3,768 – 3,768 5% 188 HKD 5 – 5 5% – MAD (5) – (5) 5% – THB (2) – (2) 5% – TRY – – – 5% – TWD 3 – 3 5% – ZAR (1) – (1) 5% – Total 188
PowerShares FTSE RAFI UK 100 Fund 30 September 2011
Monetary
GBP Non- Monetary
GBP
Currency Exposure
GBP Sensitivity Movement
2011 GBP
USD 27,648 – 27,648 5% 1,382 Total 1,382
PowerShares FTSE RAFI All-World 3000 Fund 30 September 2011
Monetary
USD Non- Monetary
USD
Currency Exposure
USD Sensitivity Movement
2011 USD
AUD (3) – (3) 5% – BRL (1) – (1) 5% – CAD 1 – 1 5% – EUR 30 – 30 5% 2 GBP (36) – (36) 5% (2) HKD (3) – (3) 5% – TWD 30,362 – 30,362 5% 1,518 Total 1,518
PowerShares FTSE RAFI Developed Europe Mid-Small Fund 30 September 2011
Monetary
EUR Non- Monetary
EUR
Currency Exposure
EUR Sensitivity Movement
2011 EUR
CHF – 561,474 561,474 5% – DKK – 227,757 227,757 5% – GBP 6,376 1,835,378 1,841,754 5% 319 NOK (5) 178,650 178,645 5% – SEK – 437,623 437,623 5% – USD 277 – 277 5% 14 Total 333

PowerShares Global Funds Ireland plc
Annual Report and Audited Financial Statements for the year ended 30 September 2011
Notes to the Financial Statements (continued)
126
14. Derivatives and Other Financial Instruments (continued)
Currency risk (continued) PowerShares FTSE RAFI Developed 1000 Fund 30 September 2011
Monetary
EUR Non- Monetary
EUR
Currency Exposure
EUR Sensitivity Movement
2011 EUR
AUD 779 150,147 150,926 5% 39 CAD 442 175,899 176,341 5% 22 CHF 67 156,272 156,339 5% 3 DKK – 15,101 15,101 5% – GBP 2,403 641,697 644,100 5% 120 HKD 83 32,817 32,900 5% 4 ILS – 4,016 4,016 5% – JPY 5,502 515,399 520,901 5% 275 NOK – 26,927 26,927 5% – NZD – 3,291 3,291 5% – SEK – 80,126 80,126 5% – SGD 86 32,649 32,735 5% 4 USD 3,327 2,492,503 2,495,830 5% 166 Total 633
PowerShares FTSE RAFI Switzerland Fund 30 September 2011
Monetary
CHF Non- Monetary
CHF
Currency Exposure
CHF Sensitivity Movement
2011 CHF
USD 2 – 2 5% – Total –
PowerShares FTSE RAFI Hong Kong China Fund 30 September 2011
Monetary
USD Non- Monetary
USD
Currency Exposure
USD Sensitivity Movement
2011 USD
GBP 2 – 2 5% – HKD 10,502 1,416,614 1,427,116 5% 525 Total 525

PowerShares Global Funds Ireland plc
Annual Report and Audited Financial Statements for the year ended 30 September 2011
Notes to the Financial Statements (continued)
127
14. Derivatives and Other Financial Instruments (continued)
Currency risk (continued) PowerShares Global Agriculture NASDAQ OMX Fund 30 September 2011
Monetary
USD Non- Monetary
USD
Currency Exposure
USD Sensitivity Movement
2011 USD
AUD 2,962 753,037 755,999 5% 148 BRL (4) 602,713 602,709 5% – CAD 11 3,454,968 3,454,979 5% 1 CHF 1,900 2,347,451 2,349,351 5% 95 CLP – 1,082,573 1,082,573 5% – EUR 2,989 1,823,299 1,826,288 5% 149 GBP – 181,022 181,022 5% – HKD 4,694 1,023,619 1,028,313 5% 235 IDR – 984,953 984,953 5% – ILS (2) 2,159,692 2,159,690 5% – MYR 19,340 1,954,056 1,973,396 5% 967 NOK 1,969 991,616 993,585 5% 98 SGD – 3,013,273 3,013,273 5% – TWD 8,773 237,890 246,663 5% 439 ZAR – 60,602 60,602 5% – Total 2,132
PowerShares Middle East North Africa NASDAQ OMX Fund 30 September 2011
Monetary
USD Non- Monetary
USD
Currency Exposure
USD Sensitivity Movement
2011 USD
MAD 97,714 – 97,714 5% 4,886 Total 4,886

PowerShares Global Funds Ireland plc
Annual Report and Audited Financial Statements for the year ended 30 September 2011
Notes to the Financial Statements (continued)
128
14. Derivatives and Other Financial Instruments (continued)
Currency risk (continued) PowerShares Global Clean Energy Fund 30 September 2010
Monetary
EUR Non- Monetary
EUR
Currency Exposure
EUR Sensitivity Movement
2010 EUR
AUD – 43,570 43,570 5% – BRL 4,637 214,089 218,726 5% 232 CAD 32,334 – 32,334 5% 1,617 CHF 22,510 157,861 180,371 5% 1,126 DKK (8,620) 403,100 394,480 5% (431) GBP 52,506 102,240 154,746 5% 2,625 HKD 183 747,660 747,843 5% 9 JPY 73 333,315 333,388 5% 4 NOK 8,819 112,665 121,484 5% 441 NZD 1 115,967 115,968 5% – PHP 49,842 117,879 167,721 5% 2,492 TWD 8,561 148,235 156,796 5% 428 USD (266,869) 3,212,034 2,945,165 5% (13,343) Total (4,800)
PowerShares FTSE RAFI Europe Fund 30 September 2010
Monetary
EUR Non- Monetary
EUR
Currency Exposure
EUR Sensitivity Movement
2010 EUR
CHF – 810,075 810,075 5% – DKK – 137,353 137,353 5% – GBP 10,697 3,714,747 3,725,444 5% 535 NOK (1) 178,305 178,304 5% – SEK (3) 524,037 524,034 5% – USD 107 – 107 5% 5 Total 540

PowerShares Global Funds Ireland plc
Annual Report and Audited Financial Statements for the year ended 30 September 2011
Notes to the Financial Statements (continued)
129
14. Derivatives and Other Financial Instruments (continued)
Currency risk (continued) PowerShares Global Listed Private Equity Fund 30 September 2010
Monetary
EUR Non- Monetary
EUR
Currency Exposure
EUR Sensitivity Movement
2010 EUR
AUD 707 24,068 24,775 5% 35 BRL (1,075) 26,653 25,578 5% (54) CAD 577 86,762 87,339 5% 29 CHF (368) 95,698 95,330 5% (18) DKK (1,634) 21,059 19,425 5% (82) GBP 6,488 307,820 314,308 5% 324 HKD – 27,204 27,204 5% – JPY – 65,948 65,948 5% – KRW (3,152) 69,149 65,997 5% (158) SEK 13,171 266,342 279,513 5% 659 SGD – 13,442 13,442 5% – USD (32,900) 1,108,701 1,075,801 5% (1,645) ZAR 417 58,679 59,096 5% 21 Total (889)
PowerShares Palisades Global Water Fund 30 September 2010
Monetary
EUR Non- Monetary
EUR
Currency Exposure
EUR Sensitivity Movement
2010 EUR
BRL (19,440) 150,689 131,249 5% (972) CAD 8,234 333,720 341,954 5% 412 CHF 1,439 197,210 198,649 5% 72 GBP 1,036 608,788 609,824 5% 52 HKD 1 141,053 141,054 5% - JPY 3,048 663,594 666,642 5% 152 MYR (19,157) 147,839 128,682 5% (958) SGD 6 385,148 385,154 5% – USD 104,460 1,717,273 1,821,733 5% 5,223 Total 3,981

PowerShares Global Funds Ireland plc
Annual Report and Audited Financial Statements for the year ended 30 September 2011
Notes to the Financial Statements (continued)
130
14. Derivatives and Other Financial Instruments (continued)
Currency risk (continued) PowerShares FTSE RAFI Asia Pacific Ex-Japan Fund 30 September 2010
Monetary
USD Non- Monetary
USD
Currency Exposure
USD Sensitivity Movement
2010 USD
AUD 7,777 1,714,343 1,722,120 5% 389 CAD (1) – (1) 5% – HKD 1,148 613,367 614,515 5% 57 KRW – 1,407,478 1,407,478 5% – NZD 189 34,763 34,952 5% 9 SGD 1,099 277,261 278,360 5% 55 Total 510
PowerShares FTSE RAFI Emerging Markets Fund 30 September 2010
Monetary
USD Non- Monetary
USD
Currency Exposure
USD Sensitivity Movement
2010 USD
BRL 11,390 1,861,209 1,872,599 5% 570 CNY 42 – 42 5% 2 COP 121 44,820 44,941 5% 65 EGP – 23,650 23,650 5% – HKD 23,252 4,103,004 4,126,256 5% 1,163 HUF – 88,441 88,441 5% – IDR – 158,895 158,895 5% – MYR 674 332,800 333,474 5% 34 MXN – 777,491 777,491 5% – PHP (11) 28,277 28,266 5% (1) PKR 55 13,349 13,404 5% 3 PLN 125 206,229 206,354 5% 6 THB 196 197,999 198,195 5% 10 TRY – 254,135 254,135 5% – TWD 95,339 1,553,030 1,648,369 5% 4,767 ZAR (145) 1,001,845 1,001,700 5% (7) Total 6,553
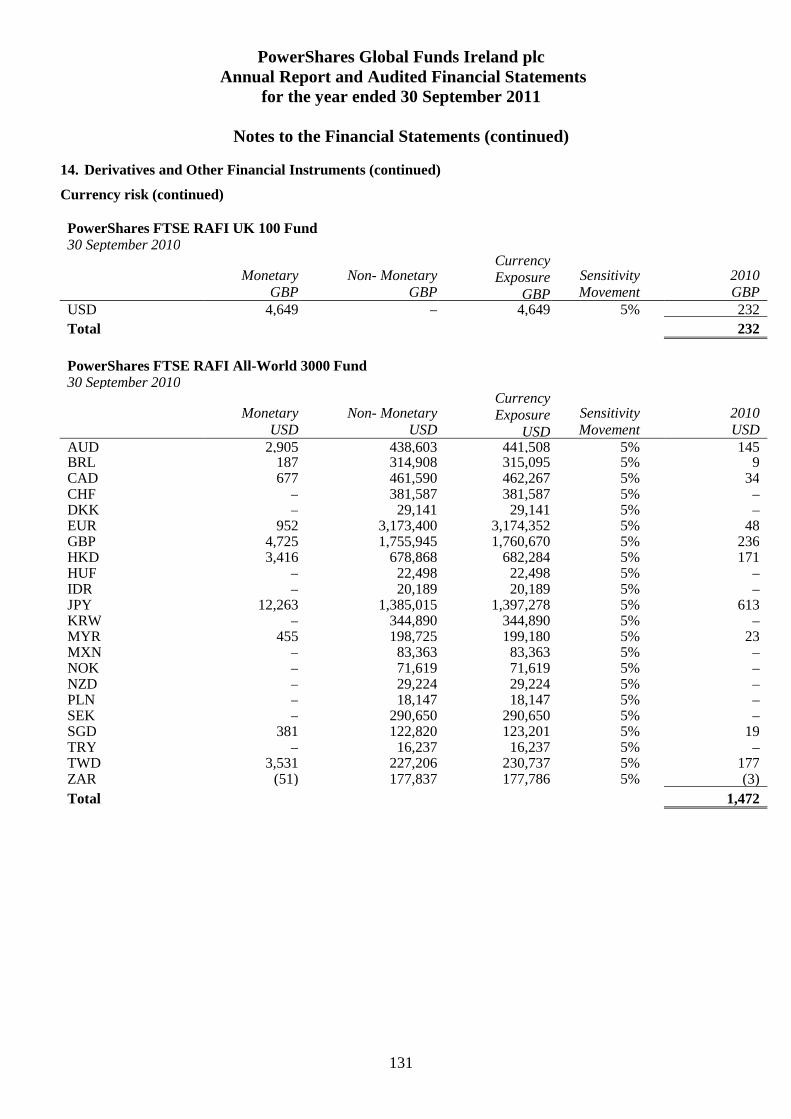
PowerShares Global Funds Ireland plc
Annual Report and Audited Financial Statements for the year ended 30 September 2011
Notes to the Financial Statements (continued)
131
14. Derivatives and Other Financial Instruments (continued)
Currency risk (continued) PowerShares FTSE RAFI UK 100 Fund 30 September 2010
Monetary
GBP Non- Monetary
GBP
Currency Exposure
GBP Sensitivity Movement
2010 GBP
USD 4,649 – 4,649 5% 232 Total 232
PowerShares FTSE RAFI All-World 3000 Fund 30 September 2010
Monetary
USD Non- Monetary
USD
Currency Exposure
USD Sensitivity Movement
2010 USD
AUD 2,905 438,603 441,508 5% 145 BRL 187 314,908 315,095 5% 9 CAD 677 461,590 462,267 5% 34 CHF – 381,587 381,587 5% – DKK – 29,141 29,141 5% – EUR 952 3,173,400 3,174,352 5% 48 GBP 4,725 1,755,945 1,760,670 5% 236 HKD 3,416 678,868 682,284 5% 171 HUF – 22,498 22,498 5% – IDR – 20,189 20,189 5% – JPY 12,263 1,385,015 1,397,278 5% 613 KRW – 344,890 344,890 5% – MYR 455 198,725 199,180 5% 23 MXN – 83,363 83,363 5% – NOK – 71,619 71,619 5% – NZD – 29,224 29,224 5% – PLN – 18,147 18,147 5% – SEK – 290,650 290,650 5% – SGD 381 122,820 123,201 5% 19 TRY – 16,237 16,237 5% – TWD 3,531 227,206 230,737 5% 177 ZAR (51) 177,837 177,786 5% (3) Total 1,472

PowerShares Global Funds Ireland plc
Annual Report and Audited Financial Statements for the year ended 30 September 2011
Notes to the Financial Statements (continued)
132
14. Derivatives and Other Financial Instruments (continued)
Currency risk (continued) PowerShares FTSE RAFI Developed Europe Mid-Small Fund 30 September 2010
Monetary
EUR Non- Monetary
EUR
Currency Exposure
EUR Sensitivity Movement
2010 EUR
CHF – 514,030 514,030 5% – DKK – 206,357 206,357 5% – GBP 6,194 1,890,212 1,896,406 5% 310 NOK (3) 220,247 220,244 5% – SEK – 381,532 381,532 5% – USD 122 – 122 5% 6 Total 316
PowerShares FTSE RAFI Developed 1000 Fund 30 September 2010
Monetary
EUR Non- Monetary
EUR
Currency Exposure
EUR Sensitivity Movement
2010 EUR
AUD 1,539 199,861 201,400 5% 77 CAD 396 221,654 222,050 5% 20 CHF – 190,167 190,167 5% – DKK – 27,934 27,934 5% – GBP 2,368 874,436 876,804 5% 118 HKD 153 54,133 54,286 5% 8 JPY 4,488 501,735 506,223 5% 224 NOK – 42,468 42,468 5% – NZD – 2,759 2,759 5% – SEK – 117,244 117,244 5% – SGD – 10,790 10,790 5% – USD 2,112 2,941,061 2,943,173 5% 106 Total 553
PowerShares FTSE RAFI Switzerland Fund 30 September 2010
Monetary
CHF Non- Monetary
CHF
Currency Exposure
CHF Sensitivity Movement
2010 CHF
USD 2 – 2 5% – Total –

PowerShares Global Funds Ireland plc
Annual Report and Audited Financial Statements for the year ended 30 September 2011
Notes to the Financial Statements (continued)
133
14. Derivatives and Other Financial Instruments (continued)
Currency risk (continued) PowerShares FTSE RAFI Hong Kong China Fund 30 September 2010
Monetary USD
Non- Monetary USD
Currency Exposure
USD Sensitivity Movement
2010 USD
GBP 2 – 2 5% – HKD 3,557 1,873,595 1,877,152 5% 178 Total 178
PowerShares Global Agriculture NASDAQ OMX Fund 30 September 2010
Monetary
USD Non- Monetary
USD
Currency Exposure
USD Sensitivity Movement
2010 USD
AUD – 410,421 410,421 5% – BRL (4) 313,186 313,182 5% – CAD 5 1,978,038 1,978,043 5% – CHF – 1,145,324 1,145,324 5% – CLP – 651,151 651,151 5% – DKK – 222,374 222,374 5% – EUR – 953,727 953,727 5% – HKD 157 820,129 820,286 5% 8 IDR – 190,173 190,173 5% – ILS (2) 825,174 825,172 5% – MYR 11,681 1,366,191 1,377,872 5% 584 NOK – 668,884 668,884 5% – SGD – 1,468,798 1,468,798 5% – TWD 1,892 160,935 162,827 5% 95 ZAR – 35,172 35,172 5% – Total 687
PowerShares Middle East North Africa NASDAQ OMX Fund 30 September 2010
Monetary
USD Non- Monetary
USD
Currency Exposure
USD Sensitivity Movement
2010 USD
AED (1,575) 415,217 413,642 5% (79) EGP – 462,185 462,185 5% – JOD (43) 182,130 182,087 5% (2) KWD 10,133 527,986 538,118 5% 507 MAD 99,448 210,617 310,065 5% 4,972 OMR 40 60,719 60,759 5% 2 QAR – 509,474 509,474 5% – USD (106,547) 156,377 49,830 5% (5,327) Total 73
Monetary items are units of currency held and assets and liabilities to be received or paid in a fixed or determinable number of units of currency. Non monetary items are any other assets and liabilities other than monetary ones.

PowerShares Global Funds Ireland plc
Annual Report and Audited Financial Statements for the year ended 30 September 2011
Notes to the Financial Statements (continued)
134
14. Derivatives and Other Financial Instruments (continued)
Cash Flow/Liquidity risk The Company is exposed to daily cash redemptions of redeemable shares. It therefore invests the majority of its assets in equities which can be readily disposed of.
The table below analyses the Company’s financial liabilities into relevant maturity groupings based on the remaining period at the balance sheet date to the contractual maturity date. The amounts in the table are the contractual undiscounted cash flows. Balances due within 12 months equal their carrying balances, as the impact of discounting is not significant.
Liquidity risk is the risk that the Funds will to some degree be limited in the timely meeting obligations associated with financial liabilities.
The main liquidity risk to the Funds arises from the redemption requests of its investors. The Funds’ Authorized Participants may redeem their shares on any business day for cash or in-kind equal to a proportionate amount of the Funds’ net asset value. Therefore the funds are exposed to the liquidity risk of meeting any daily redemptions by the Authorized Participants.
The Funds have instituted policies and procedures to assist in the managing of the liquidity risk. Share redemptions will only be settled by the Fund three business days after the Authorized Participant notifies the Fund of its intention to redeem shares. The majority of the Funds’ assets are held in the form of highly liquid securities trading on established stock exchanges, this allows the Fund sufficient time to dispose of assets and raise the cash necessary to affect the redemption. The Investment Manager reviews daily forward looking cash reports which project expected cash obligations. These reports allow the Investment Manager to manage the funds’ cash obligations. PowerShares EQQQ Fund As at 30 September 2011 Less than 1 month 1-3 months No stated maturity USD USD USD Accrued expenses (245,422) – – Capital shares payable (5,543,382) – – Dividend payable (1,411,540) – – Other payable – – – Redeemable shares (940,740,692) – – Total financial liabilities (947,941,036) – – PowerShares FTSE RAFI US 1000 Fund As at 30 September 2011 Less than 1 month 1-3 months No stated maturity USD USD USD Accrued expenses (17,570) – – Dividend payable (254,150) – – Other payable – – – Redeemable shares (52,823,863) – – Total financial liabilities (53,095,583) – –

PowerShares Global Funds Ireland plc
Annual Report and Audited Financial Statements for the year ended 30 September 2011
Notes to the Financial Statements (continued)
135
14. Derivatives and Other Financial Instruments (continued)
Cash Flow/Liquidity risk (continued) PowerShares Global Clean Energy Fund As at 30 September 2011 Less than 1 month 1-3 months No stated maturity EUR EUR EUR Accrued expenses (3,682) – – Securities purchased payable (932,072) – – Dividend payable (31,620) – – Other payable – – – Redeemable shares (5,344,523) – – Total financial liabilities (6,311,897) – – PowerShares Dynamic US Market Fund As at 30 September 2011 Less than 1 month 1-3 months No stated maturity USD USD USD Accrued expenses (8,400) – – Dividend payable (23,041) – – Other payable – – – Redeemable shares (12,582,076) – – Total financial liabilities (12,613,517) – – PowerShares FTSE RAFI Europe Fund As at 30 September 2011 Less than 1 month 1-3 months No stated maturity EUR EUR EUR Accrued expenses (2,918) – – Dividend payable (56,160) – – Other payable – – – Redeemable shares (7,076,791) – – Total financial liabilities (7,135,869) – – PowerShares Global Listed Private Equity Fund As at 30 September 2011 Less than 1 month 1-3 months No stated maturity EUR EUR EUR Accrued expenses (2,462) – – Securities purchased payable (318,008) – – Dividend payable (34,720) – – Other payable – – – Redeemable shares (3,784,734) – – Total financial liabilities (4,139,924) – –

PowerShares Global Funds Ireland plc
Annual Report and Audited Financial Statements for the year ended 30 September 2011
Notes to the Financial Statements (continued)
136
14. Derivatives and Other Financial Instruments (continued)
Cash Flow/Liquidity risk (continued) PowerShares Palisades Global Water Fund As at 30 September 2011 Less than 1 month 1-3 months No stated maturity EUR EUR EUR Bank overdraft (3) – – Accrued expenses (3,676) – – Securities purchased payable (786,863) – – Dividend payable (38,700) – – Other payable – – – Redeemable shares (5,865,394) – – Total financial liabilities (6,694,636) – – PowerShares FTSE RAFI Asia Pacific Ex-Japan Fund As at 30 September 2011 Less than 1 month 1-3 months No stated maturity USD USD USD Accrued expenses (3,910) – – Dividend payable (60,660) – – Other payable (81) – – Redeemable shares (5,464,628) – – Total financial liabilities (5,529,279) – – PowerShares FTSE RAFI Emerging Markets Fund As at 30 September 2011 Less than 1 month 1-3 months No stated maturity USD USD USD Accrued expenses (7,915) – – Swap expenses payable (2,113) – – Dividend payable (144,670) – – Other payable – – – Redeemable shares (13,468,418) – – Total financial liabilities (13,623,116) – – PowerShares FTSE RAFI UK 100 Fund As at 30 September 2011 Less than 1 month 1-3 months No stated maturity GBP GBP GBP Accrued expenses (10,545) – – Dividend payable (218,400) – – Other payable – – – Redeemable shares (25,388,301) – – Total financial liabilities (25,617,246) – –

PowerShares Global Funds Ireland plc
Annual Report and Audited Financial Statements for the year ended 30 September 2011
Notes to the Financial Statements (continued)
137
14. Derivatives and Other Financial Instruments (continued)
Cash Flow/Liquidity risk (continued) PowerShares FTSE RAFI All-World 3000 Fund As at 30 September 2011 Less than 1 month 1-3 months No stated maturity USD USD USD Accrued expenses (3,232) – – Swap expenses payable (1,191) – – Dividend payable – – – Other payable – – – Redeemable shares (7,559,107) – – Total financial liabilities (7,563,530) – – PowerShares FTSE RAFI Developed Europe Mid-Small Fund As at 30 September 2011 Less than 1 month 1-3 months No stated maturity EUR EUR EUR Accrued expenses (2,877) – – Dividend payable (41,040) – – Other payable – – – Redeemable shares (6,757,251) – – Total financial liabilities (6,801,168) – – PowerShares FTSE RAFI Developed 1000 Fund As at 30 September 2011 Less than 1 month 1-3 months No stated maturity EUR EUR EUR Accrued expenses (2,233) – – Dividend payable (42,490) – – Other payable – – – Redeemable shares (5,392,572) – – Total financial liabilities (5,437,295) – – PowerShares FTSE RAFI Italy 30 Fund As at 30 September 2011 Less than 1 month 1-3 months No stated maturity EUR EUR EUR Accrued expenses (1,058) – – Dividend payable (17,220) – – Other payable – – – Redeemable shares (2,305,785) – – Total financial liabilities (2,324,063) – –

PowerShares Global Funds Ireland plc
Annual Report and Audited Financial Statements for the year ended 30 September 2011
Notes to the Financial Statements (continued)
138
14. Derivatives and Other Financial Instruments (continued)
Cash Flow/Liquidity risk (continued) PowerShares FTSE RAFI Switzerland Fund As at 30 September 2011 Less than 1 month 1-3 months No stated maturity CHF CHF CHF Accrued expenses (2,125) – – Dividend payable – – – Other payable – – – Redeemable shares (2,393,833) – – Total financial liabilities (2,395,958) – – PowerShares FTSE RAFI Hong Kong China Fund As at 30 September 2011 Less than 1 month 1-3 months No stated maturity USD USD USD Accrued expenses (803) – – Dividend payable (10,410) – – Other payable – – – Redeemable shares (1,573,828) – – Total financial liabilities (1,585,041) – – PowerShares Global Agriculture NASDAQ OMX Fund As at 30 September 2011 Less than 1 month 1-3 months No stated maturity USD USD USD Accrued expenses (20,570) – – Dividend payable (34,720) – – Other payable – – – Redeemable shares (29,060,784) – – Total financial liabilities (29,116,074) – – PowerShares Middle East North Africa NASDAQ OMX Fund As at 30 September 2011 Less than 1 month 1-3 months No stated maturity USD USD USD Derivative financial liabilities at fair value through profit or loss (48,529) – – Accrued expenses (3,298) – – Securities purchased payable (188,561) – – Swap expenses payable (602) – – Dividend payable – – – Other payable – – – Redeemable shares (5,188,248) – – Total financial liabilities (5,429,238) – –

PowerShares Global Funds Ireland plc
Annual Report and Audited Financial Statements for the year ended 30 September 2011
Notes to the Financial Statements (continued)
139
14. Derivatives and Other Financial Instruments (continued)
Cash Flow/Liquidity risk (continued) PowerShares EuroMTS Cash 3 Months Fund As at 30 September 2011 Less than 1 month 1-3 months No stated maturity EUR EUR EUR Accrued expenses (8,763) – – Securities purchased payable (1,862,189) – – Dividend payable – – – Other payable – – – Redeemable shares (72,033,882) – – Total financial liabilities (73,904,834) – –

PowerShares Global Funds Ireland plc
Annual Report and Audited Financial Statements for the year ended 30 September 2011
Notes to the Financial Statements (continued)
140
14. Derivatives and Other Financial Instruments (continued)
Cash Flow/Liquidity risk (continued) PowerShares EQQQ Fund As at 30 September 2010 Less than 1 month 1-3 months No stated maturity USD USD USD Bank overdraft (10,736) – – Accrued expenses (189,965) – – Capital shares payable (4,942,269) – – Dividend payable (515,200) – – Other payable – – – Redeemable shares (786,413,383) – – Total financial liabilities (792,071,553) – – PowerShares FTSE RAFI US 1000 Fund As at 30 September 2010 Less than 1 month 1-3 months No stated maturity USD USD USD Accrued expenses (7,454) – – Securities purchased payable (108,648) – – Dividend payable (171,500) – – Other payable – – – Redeemable shares (40,977,947) – – Total financial liabilities (41,265,549) – – PowerShares Global Clean Energy Fund As at 30 September 2010 Less than 1 month 1-3 months No stated maturity EUR EUR EUR Bank overdraft (383) – – Accrued expenses (4,771) – – Securities purchased payable (786,288) – – Dividend payable – – – Other payable – – – Redeemable shares (7,709,697) – – Total financial liabilities (8,501,139) – – PowerShares Dynamic US Market Fund As at 30 September 2010 Less than 1 month 1-3 months No stated maturity USD USD USD Bank overdraft (6,929) – – Accrued expenses (14,930) – – Dividend payable (83,820) – – Other payable – – – Redeemable shares (24,936,821) – – Total financial liabilities (25,042,500) – –

PowerShares Global Funds Ireland plc
Annual Report and Audited Financial Statements for the year ended 30 September 2011
Notes to the Financial Statements (continued)
141
14. Derivatives and Other Financial Instruments (continued)
Cash Flow/Liquidity risk (continued) PowerShares FTSE RAFI Europe Fund As at 30 September 2010 Less than 1 month 1-3 months No stated maturity EUR EUR EUR Bank overdraft (38,756) – – Accrued expenses (5,201) – – Securities purchased payable (26,016) – – Dividend payable (48,620) – – Other payable – – – Redeemable shares (12,235,188) – – Total financial liabilities (12,353,781) – – PowerShares Global Listed Private Equity Fund As at 30 September 2010 Less than 1 month 1-3 months No stated maturity EUR EUR EUR Bank overdraft (4,048) – – Accrued expenses (1,664) – – Securities purchased payable (98,764) – – Dividend payable (14,050) – – Other payable – – – Redeemable shares (2,703,376) – – Total financial liabilities 2,821,902 – – PowerShares Palisades Global Water Fund As at 30 September 2010 Less than 1 month 1-3 months No stated maturity EUR EUR EUR Bank overdraft (2,106) – – Accrued expenses (3,653) – – Securities purchased payable (534,790) – – Dividend payable – – – Other payable – – – Redeemable shares (5,847,239) – – Total financial liabilities (6,387,788) – – PowerShares FTSE RAFI Asia Pacific Ex-Japan Fund As at 30 September 2010 Less than 1 month 1-3 months No stated maturity USD USD USD Bank overdraft (8,018) – – Accrued expenses (2,566) – – Dividend payable – – – Other payable – – – Redeemable shares (4,108,053) – – Total financial liabilities (4,118,637) – –
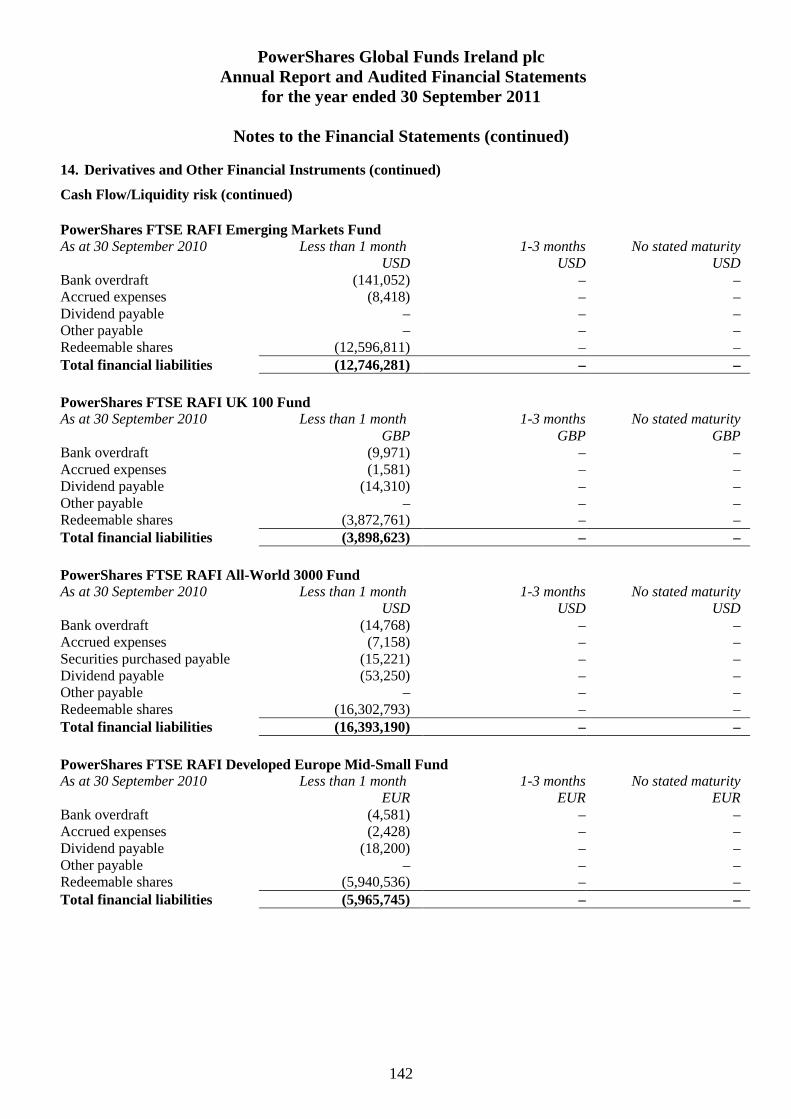
PowerShares Global Funds Ireland plc
Annual Report and Audited Financial Statements for the year ended 30 September 2011
Notes to the Financial Statements (continued)
142
14. Derivatives and Other Financial Instruments (continued)
Cash Flow/Liquidity risk (continued) PowerShares FTSE RAFI Emerging Markets Fund As at 30 September 2010 Less than 1 month 1-3 months No stated maturity USD USD USD Bank overdraft (141,052) – – Accrued expenses (8,418) – – Dividend payable – – – Other payable – – – Redeemable shares (12,596,811) – – Total financial liabilities (12,746,281) – – PowerShares FTSE RAFI UK 100 Fund As at 30 September 2010 Less than 1 month 1-3 months No stated maturity GBP GBP GBP Bank overdraft (9,971) – – Accrued expenses (1,581) – – Dividend payable (14,310) – – Other payable – – – Redeemable shares (3,872,761) – – Total financial liabilities (3,898,623) – – PowerShares FTSE RAFI All-World 3000 Fund As at 30 September 2010 Less than 1 month 1-3 months No stated maturity USD USD USD Bank overdraft (14,768) – – Accrued expenses (7,158) – – Securities purchased payable (15,221) – – Dividend payable (53,250) – – Other payable – – – Redeemable shares (16,302,793) – – Total financial liabilities (16,393,190) – – PowerShares FTSE RAFI Developed Europe Mid-Small Fund As at 30 September 2010 Less than 1 month 1-3 months No stated maturity EUR EUR EUR Bank overdraft (4,581) – – Accrued expenses (2,428) – – Dividend payable (18,200) – – Other payable – – – Redeemable shares (5,940,536) – – Total financial liabilities (5,965,745) – –

PowerShares Global Funds Ireland plc
Annual Report and Audited Financial Statements for the year ended 30 September 2011
Notes to the Financial Statements (continued)
143
14. Derivatives and Other Financial Instruments (continued)
Cash Flow/Liquidity risk (continued) PowerShares FTSE RAFI Developed 1000 Fund As at 30 September 2010 Less than 1 month 1-3 months No stated maturity EUR EUR EUR Bank overdraft (8,049) – – Accrued expenses (2,861) – – Securities purchased payable (2) – – Dividend payable (23,200) – – Other payable – – – Redeemable shares (6,818,161) – – Total financial liabilities (6,852,273) – – PowerShares FTSE RAFI Italy 30 Fund As at 30 September 2010 Less than 1 month 1-3 months No stated maturity EUR EUR EUR Accrued expenses (2,274) – – Dividend payable (20,800) – – Other payable – – – Redeemable shares (5,541,655) – – Total financial liabilities (5,564,729) – – PowerShares FTSE RAFI Switzerland Fund As at 30 September 2010 Less than 1 month 1-3 months No stated maturity CHF CHF CHF Accrued expenses (852) – – Dividend payable – – – Other payable – – – Redeemable shares (1,848,529) – – Total financial liabilities (1,849,381) – – PowerShares FTSE RAFI Hong Kong China Fund As at 30 September 2010 Less than 1 month 1-3 months No stated maturity USD USD USD Accrued expenses (862) – – Dividend payable (6,180) – – Other payable – – – Redeemable shares (2,030,193) – – Total financial liabilities (2,037,235) – – PowerShares Global Agriculture NASDAQ OMX Fund As at 30 September 2010 Less than 1 month 1-3 months No stated maturity USD USD USD Bank overdraft (12,124) – – Accrued expenses (9,002) – – Dividend payable (24,220) – – Other payable – – – Redeemable shares (15,462,417) – – Total financial liabilities (15,507,763) – –

PowerShares Global Funds Ireland plc
Annual Report and Audited Financial Statements for the year ended 30 September 2011
Notes to the Financial Statements (continued)
144
14. Derivatives and Other Financial Instruments (continued)
Cash Flow/Liquidity risk (continued) PowerShares Middle East North Africa NASDAQ OMX Fund As at 30 September 2010 Less than 1 month 1-3 months No stated maturity USD USD USD Bank overdraft (99,991) – – Accrued expenses (1,922) – – Securities purchased payable (1,544) – – Dividend payable (10,020) – – Other payable – – – Redeemable shares (2,499,511) – – Total financial liabilities (2,612,988) – – PowerShares EuroMTS Cash 3 Months Fund As at 30 September 2010 Less than 1 month 1-3 months No stated maturity EUR EUR EUR Accrued expenses (7,584) – – Securities purchased payable (10,462,753) – – Dividend payable – – – Other payable – – – Redeemable shares (60,756,809) – – Total financial liabilities (71,227,146) – – Carrying amounts of trade and other receivables and payables approximate to Fair Value due to short term nature.
15. Comparative Table 2011 2010 2009 PowerShares EQQQ Fund Number of Shares Outstanding 17,900,000 16,000,000 14,350,000 NAV per Share USD52.56 USD49.15 USD42.32 2011 2010 2009 PowerShares FTSE RAFI US 1000 Fund Number of Shares Outstanding 6,500,001 4,900,001 2,100,001 NAV per Share USD8.13 USD8.36 USD7.86 2011 2010 2009 PowerShares Global Clean Energy Fund Number of Shares Outstanding 1,700,001 1,600,001 1,000,001 NAV per Share EUR3.14 EUR4.82 EUR5.44 2011 2010 2009 PowerShares Dynamic US Market Fund Number of Shares Outstanding 1,800,001 3,300,001 4,200,001 NAV per Share USD6.99 USD7.56 USD6.92

PowerShares Global Funds Ireland plc
Annual Report and Audited Financial Statements for the year ended 30 September 2011
Notes to the Financial Statements (continued)
145
15. Comparative Table (continued) 2011 2010 2009 PowerShares FTSE RAFI Europe Fund Number of Shares Outstanding 1,200,001 1,700,001 2,600,001 NAV per Share EUR5.90 EUR7.20 EUR7.31 2011 2010 2009 PowerShares Global Listed Private Equity Fund Number of Shares Outstanding 800,001 500,001 500,001 NAV per Share EUR4.73 EUR5.41 EUR4.61 2011 2010 2009 PowerShares Palisades Global Water Fund Number of Shares Outstanding 900,001 800,001 600,001 NAV per Share EUR6.52 EUR7.31 EUR6.53 2011 2010 2009 PowerShares FTSE RAFI Asia Pacific Ex-Japan Fund Number of Shares Outstanding 900,001 600,001 400,001 NAV per Share USD6.07 USD6.85 USD5.94 2011 2010 2009 PowerShares FTSE RAFI Emerging Markets Fund* Number of Shares Outstanding 1,700,001 1,300,001 500,001 NAV per Share USD7.92 USD9.69 EUR5.99 NAV per Share USD8.76 2011 2010 2009 PowerShares FTSE RAFI UK 100 Fund Number of Shares Outstanding 3,250,001 450,001 450,001 NAV per Share GBP7.81 GBP8.61 GBP8.51 2011 2010 2009 PowerShares FTSE RAFI All-World 3000 Fund* Number of Shares Outstanding 650,001 1,250,001 350,001 NAV per Share USD11.63 USD13.04 GBP7.62 NAV per Share USD12.19 2011 2010 2009 PowerShares FTSE RAFI Developed Europe Mid-Small Fund Number of Shares Outstanding 900,001 700,001 500,001 NAV per Share EUR7.51 EUR8.49 EUR7.59 2011 2010 2009 PowerShares FTSE RAFI Developed 1000 Fund Number of Shares Outstanding 700,001 800,001 400,001 NAV per Share EUR7.70 EUR8.52 EUR8.02 * Currency changed on 1 February 2010

PowerShares Global Funds Ireland plc
Annual Report and Audited Financial Statements for the year ended 30 September 2011
Notes to the Financial Statements (continued)
146
15. Comparative Table (continued) 2011 2010 2009 PowerShares FTSE RAFI Italy 30 Fund Number of Shares Outstanding 600,001 1,000,001 600,001 NAV per Share EUR3.88 EUR5.54 EUR6.58 2011 2010 2009 PowerShares FTSE RAFI Switzerland Fund* Number of Shares Outstanding 300,001 200,001 200,001 NAV per Share CHF7.98 CHF9.24 EUR6.67 NAV per Share CHF10.12 2011 2010 2009 PowerShares FTSE RAFI Hong Kong China Fund* Number of Shares Outstanding 100,001 100,001 100,001 NAV per Share USD15.74 USD20.30 GBP10.83 NAV per Share USD17.33 2011 2010 2009 PowerShares Global Agriculture NASDAQ OMX Fund Number of Shares Outstanding 2,800,001 1,400,001 400,001 NAV per Share USD10.38 USD11.04 USD9.43 2011 2010 2009 PowerShares Middle East North Africa NASDAQ OMX Fund Number of Shares Outstanding 500,001 200,001 100,001 NAV per Share USD10.38 USD12.63 USD14.05 2011 2010 2009 PowerShares EuroMTS Cash 3 Months Fund Number of Shares Outstanding 705,001 600,001 1,185,001 NAV per Share EUR102.18 EUR101.26 EUR100.97 * Currency changed on 1 February 2010

PowerShares Global Funds Ireland plc
Annual Report and Audited Financial Statements for the year ended 30 September 2011
Notes to the Financial Statements (continued)
147
16. Net Gain/(Loss) on Financial Assets at Fair Value through Profit or Loss
Total PowerShares EQQQ Fund
PowerShares FTSE RAFI US
1000 Fund
PowerShares Global Clean Energy Fund
PowerShares Dynamic US Market Fund
USD USD USD EUR USD
30 September
2011 30 September
2011 30 September
2011 30 September
2011 30 September
2011 Net realised investment gain/(loss) 31,857,976 30,286,353 (120,065) (636,357) 5,181,362 Net realised non-investment foreign currency loss (244,007) – – (7,583) – Net change in unrealised investment gain/(loss) (21,483,614) 10,412,302 (2,714,628) (2,194,163) (4,247,239) Net change in unrealised non-investment foreign currency gain/(loss) 2,326 – – (771) – Net gain/(loss) on financial assets at fair value through profit or loss 10,132,681 40,698,655 (2,834,693) (2,838,874) 934,123

PowerShares Global Funds Ireland plc
Annual Report and Audited Financial Statements for the year ended 30 September 2011
Notes to the Financial Statements (continued)
148
16. Net Gain/(Loss) on Financial Assets at Fair Value through Profit or Loss (continued)
PowerShares FTSE RAFI
Europe Fund
PowerShares Global Listed
Private Equity Fund
PowerShares Palisades Global
Water Fund
PowerShares FTSE RAFI Asia Pacific Ex-Japan
Fund
PowerShares FTSE RAFI
Emerging Markets Fund
EUR EUR EUR USD USD
30 September
2011 30 September
2011 30 September
2011 30 September
2011 30 September
2011 Net realised investment gain/(loss) 795,767 (51,657) 107,183 67,464 (3,209,747) Net realised non-investment foreign currency loss (3,824) (6,862) (6,889) (2,294) (39,259) Net change in unrealised investment loss (2,033,950) (629,038) (770,084) (927,377) (535,876) Net change in unrealised non-investment foreign currency gain/(loss) 780 (53) 5,218 2,972 (3,024) Net loss on financial assets at fair value through profit or loss (1,241,227) (687,610) (664,572) (859,235) (3,787,906)

PowerShares Global Funds Ireland plc
Annual Report and Audited Financial Statements for the year ended 30 September 2011
Notes to the Financial Statements (continued)
149
16. Net Gain/(Loss) on Financial Assets at Fair Value through Profit or Loss (continued)
PowerShares FTSE RAFI UK
100 Fund
PowerShares FTSE RAFI All-
World 3000 Fund
PowerShares FTSE RAFI
Developed Europe Mid-Small Fund
PowerShares FTSE RAFI
Developed 1000 Fund
PowerShares FTSE RAFI Italy
30 Fund
GBP USD EUR EUR EUR
30 September
2011 30 September
2011 30 September
2011 30 September
2011 30 September
2011 Net realised investment gain/(loss) 3,021 793,362 (272,856) 125,295 (235,091) Net realised non-investment foreign currency gain/(loss) 1,154 (37,115) (31,074) (4,399) (6) Net change in unrealised investment loss (3,796,275) (552,055) (1,114,503) (609,239) (1,058,432) Net change in unrealised non-investment foreign currency gain/(loss) 1,369 (1,592) 379 424 14 Net gain/(loss) on financial assets at fair value through profit or loss (3,790,731) 202,600 (1,418,054) (487,919) (1,293,515)

PowerShares Global Funds Ireland plc
Annual Report and Audited Financial Statements for the year ended 30 September 2011
Notes to the Financial Statements (continued)
150
16. Net Gain/(Loss) on Financial Assets at Fair Value through Profit or Loss (continued)
PowerShares FTSE RAFI
Switzerland Fund
PowerShares FTSE RAFI Hong Kong China Fund
PowerShares Global Agriculture
NASDAQ OMX Fund
PowerShares Middle East North
Africa NASDAQ OMX Fund
PowerShares EuroMTS Cash 3
Months Fund
CHF USD USD USD EUR
30 September
2011 30 September
2011 30 September
2011 30 September
2011 30 September
2011 Net realised investment gain/(loss) 5,554 56,302 (394,099) (580,067) – Net realised non-investment foreign currency gain/(loss) (16) 94 (76,217) (6,480) – Net change in unrealised investment loss (410,285) (510,971) (3,778,173) (347,557) – Net change in unrealised non-investment foreign currency loss – (141) (400) (6,041) – Net loss on financial assets at fair value through profit or loss (404,747) (454,716) (4,248,889) (940,145) –
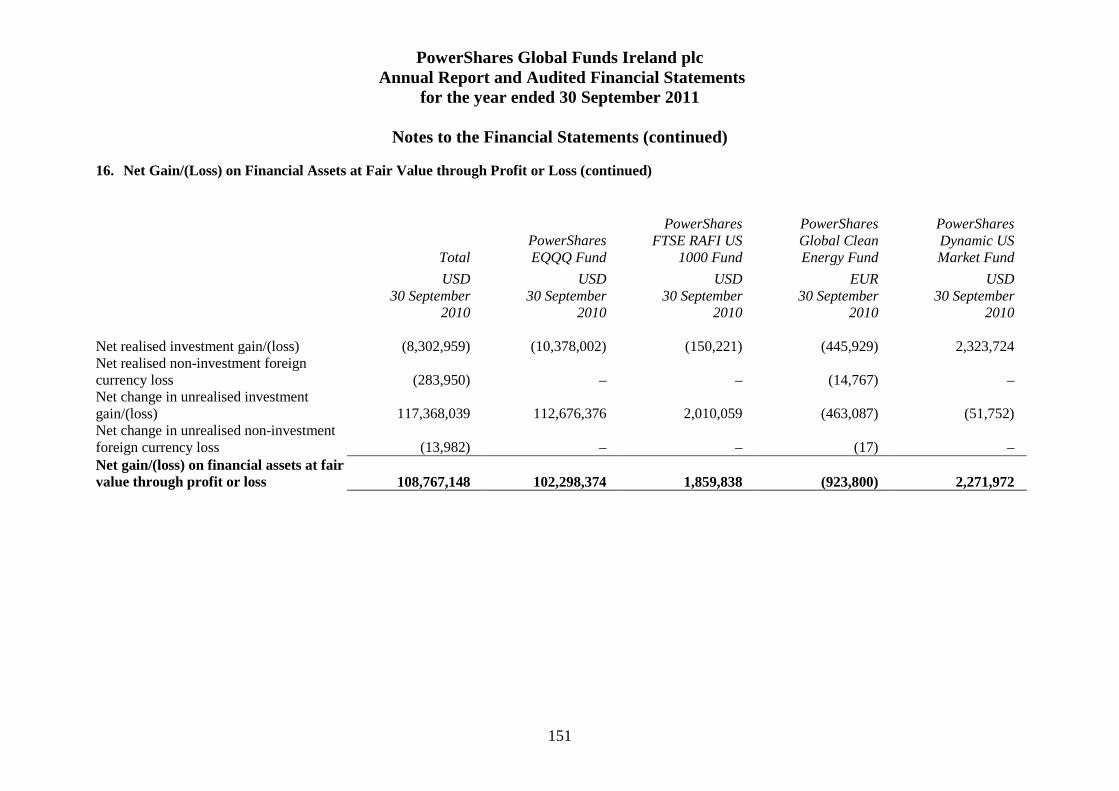
PowerShares Global Funds Ireland plc
Annual Report and Audited Financial Statements for the year ended 30 September 2011
Notes to the Financial Statements (continued)
151
16. Net Gain/(Loss) on Financial Assets at Fair Value through Profit or Loss (continued)
Total PowerShares EQQQ Fund
PowerShares FTSE RAFI US
1000 Fund
PowerShares Global Clean Energy Fund
PowerShares Dynamic US Market Fund
USD USD USD EUR USD
30 September
2010 30 September
2010 30 September
2010 30 September
2010 30 September
2010 Net realised investment gain/(loss) (8,302,959) (10,378,002) (150,221) (445,929) 2,323,724 Net realised non-investment foreign currency loss (283,950) – – (14,767) – Net change in unrealised investment gain/(loss) 117,368,039 112,676,376 2,010,059 (463,087) (51,752) Net change in unrealised non-investment foreign currency loss (13,982) – – (17) – Net gain/(loss) on financial assets at fair value through profit or loss 108,767,148 102,298,374 1,859,838 (923,800) 2,271,972

PowerShares Global Funds Ireland plc
Annual Report and Audited Financial Statements for the year ended 30 September 2011
Notes to the Financial Statements (continued)
152
16. Net Gain/(Loss) on Financial Assets at Fair Value through Profit or Loss (continued)
PowerShares FTSE RAFI
Europe Fund
PowerShares Global Listed
Private Equity Fund
PowerShares Palisades Global
Water Fund
PowerShares FTSE RAFI Asia Pacific Ex-Japan
Fund
PowerShares FTSE RAFI
Emerging Markets Fund
EUR EUR EUR USD USD
30 September
2010 30 September
2010 30 September
2010 30 September
2010 30 September
2010 Net realised investment gain/(loss) (1,106,529) 14,735 104,603 295,483 819,329 Net realised non-investment foreign currency loss (33,033) (4,399) (3,409) (11,527) (47,995) Net change in unrealised investment gain 620,063 382,173 312,223 53,527 368,617 Net change in unrealised non-investment foreign currency gain/(loss) (1,150) (175) (1,020) 2,032 3,501 Net gain/(loss) on financial assets at fair value through profit or loss (520,649) 392,334 412,397 339,515 1,143,452

PowerShares Global Funds Ireland plc
Annual Report and Audited Financial Statements for the year ended 30 September 2011
Notes to the Financial Statements (continued)
153
16. Net Gain/(Loss) on Financial Assets at Fair Value through Profit or Loss (continued)
PowerShares FTSE RAFI UK
100 Fund
PowerShares FTSE RAFI All-
World 3000 Fund
PowerShares FTSE RAFI
Developed Europe Mid-Small Fund
PowerShares FTSE RAFI
Developed 1000 Fund
PowerShares FTSE RAFI Italy
30 Fund
GBP USD EUR EUR EUR
30 September
2010 30 September
2010 30 September
2010 30 September
2010 30 September
2010 Net realised investment gain 3,399 289,328 142,386 256,197 113,186 Net realised non-investment foreign currency gain/(loss) 290 (65,465) (4,231) (23,334) (4,204) Net change in unrealised investment gain/(loss) 39,148 450,944 386,913 45,757 (582,474) Net change in unrealised non-investment foreign currency loss (370) (1,068) (183) (304) (16,563) Net gain/(loss) on financial assets at fair value through profit or loss 42,467 673,739 524,885 278,316 (490,055)

PowerShares Global Funds Ireland plc
Annual Report and Audited Financial Statements for the year ended 30 September 2011
Notes to the Financial Statements (continued)
154
16. Net Gain/(Loss) on Financial Assets at Fair Value through Profit or Loss (continued)
PowerShares FTSE RAFI
Switzerland Fund
PowerShares FTSE RAFI Hong Kong China Fund
PowerShares Global Agriculture
NASDAQ OMX Fund
PowerShares Middle East North
Africa NASDAQ OMX Fund
PowerShares EuroMTS Cash 3
Months Fund
CHF USD USD USD EUR
30 September
2010 30 September
2010 30 September
2010 30 September
2010 30 September
2010 Net realised investment gain/(loss) 109,109 20,458 (51,772) (327,603) – Net realised non-investment foreign currency gain/(loss) 7,136 (587) (33,609) (5,389) (5,721) Net change in unrealised investment gain/(loss) (224,010) 277,844 830,595 (49,010) – Net change in unrealised non-investment foreign currency gain – 4,438 76 4,030 – Net gain/(loss) on financial assets at fair value through profit or loss (107,765) 302,153 745,290 (377,972) (5,721)

PowerShares Global Funds Ireland plc
Annual Report and Audited Financial Statements for the year ended 30 September 2011
Notes to the Financial Statements (continued)
155
17. Exchange Rates
The following exchange rates at 30 September 2011 were used to translate foreign currency assets and liabilities:
USD1 = 3.6730 AED EUR1 = 1.3805 AUD USD1 = 1.0289 AUD EUR1 = 2.4905 BRL USD1 = 1.8562 BRL EUR1 = 1.3981 CAD USD1 = 1.0420 CAD EUR1 = 1.2187 CHF USD1 = 0.9083 CHF EUR1 = 7.4412 DKK USD1 = 523.4750 CLP EUR1 = 0.8613 GBP USD1 = 6.3859 CNY EUR1 = 10.4448 HKD USD1 = 5.5461 DKK EUR1 = 5.0374 ILS USD1 = 5.9652 EGP EUR1 = 103.4183 JPY USD1 = 0.7453 EUR EUR1 = 1580.5904 KRW USD1 = 0.6419 GBP EUR1 = 4.2834 MYR USD1 = 7.7847 HKD EUR1 = 7.8771 NOK USD1 = 8,790.0000 IDR EUR1 = 0.5697 NZD USD1 = 3.7545 ILS EUR1 = 58.6658 PHP USD1 = 0.7086 JOD EUR1 = 9.2151 SEK USD1 = 77.0800 JPY EUR1 = 1.7484 SGD USD1 = 0.2770 KWD EUR1 = 40.8883 TWD USD1 = 8.3417 MAD EUR1 = 1.3417 USD USD1 = 3.1925 MYR EUR1 = 10.7861 ZAR USD1 = 5.8710 NOK USD1 = 0.3851 OMR GBP1 = 1.1611 EUR USD1 = 1.3031 SGD GBP1 = 1.5578 USD USD1 = 30.4750 TWD USD1 = 8.0391 ZAR CHF1 = 1.1010 USD
The following exchange rates at 30 September 2010 were used to translate foreign currency assets and liabilities: USD1 = 3.6730 AED EUR1 = 1.4100 AUD USD1 = 1.0328 AUD EUR1 = 2.3129 BRL USD1 = 1.6942 BRL EUR1 = 1.4005 CAD USD1 = 1.0259 CAD EUR1 = 1.3337 CHF USD1 = 0.9770 CHF EUR1 = 7.4522 DKK USD1 = 483.2000 CLP EUR1 = 0.8664 GBP USD1 = 6.6912 CNY EUR1 = 10.5983 HKD USD1 = 5.4587 DKK EUR1 = 114.0489 JPY USD1 = 5.6930 EGP EUR1 = 1,556.6702 KRW USD1 = 0.7325 EUR EUR1 = 4.2144 MYR USD1 = 7.7632 HKD EUR1 = 7.9949 NOK USD1 = 8,925.0000 IDR EUR1 = 1.8560 NZD USD1 = 3.6347 ILS EUR1 = 59.9118 PHP USD1 = 0.7082 JOD EUR1 = 9.1886 SEK USD1 = 0.2848 KWD EUR1 = 1.7957 SGD USD1 = 8.2264 MAD EUR1 = 42.6509 TWD USD1 = 3.0870 MYR EUR1 = 1.3652 USD USD1 = 5.8562 NOK EUR1 = 9.5213 ZAR

PowerShares Global Funds Ireland plc
Annual Report and Audited Financial Statements for the year ended 30 September 2011
Notes to the Financial Statements (continued)
156
17. Exchange Rates (continued)
The following exchange rates at 30 September 2010 were used to translate foreign currency assets and liabilities: USD1 = 0.3850 OMR GBP1 = 1.1543 EUR USD1 = 1.3154 SGD GBP1 = 1.5758 USD USD1 = 31.2415 TWD USD1 = 6.9743 ZAR CHF1 = 1.0526 USD
Average Rates as at 30 September 2011
USD1 = 0.7170 EUR USD1 = 0.6228 GBP USD1 = 0.8978 CHF
Average Rates as at 30 September 2010
USD1 = 0.7349 EUR USD1 = 0.6404 GBP USD1 = 0.9593 CHF
18. Distributions to redeemable participating shareholders
Please refer to the Directors Report for details of Distributions to redeemable participating shareholders during the year and for the comparative year.

PowerShares Global Funds Ireland plc
Annual Report and Audited Financial Statements for the year ended 30 September 2011
Notes to the Financial Statements (continued)
157
19. Significant Events during the year
Changes to the Prospectus and Supplements
Amendments to the Powershares Middle East North Africa NASDAQ OMX Fund, Powershares FTSE RAFI Emerging Markets Fund and Powershares FTSE RAFI All-World 3000 Fund only (together the “Swap Funds”)
Previously, the Investment Manager achieved the objective of each of the sub-funds by tracking the relevant benchmark index through the acquisition of the constituent securities of the relevant benchmark index through sampling techniques or through specific replication of the index weights as defined by the respective index benchmark. With effect from 5 January 2011 each of the Swap Funds avails of the capacity to use financial derivative instruments (“FDI”) and replicates the total return of the benchmark index solely through the use of FDI, namely swap agreements rather than direct acquisition of securities. With effect from 20 December 2010, the maximum fee charged by the Manager per annum for each of the Swap Funds was reduced as set out below.
Swap Fund Previous Fee (% per annum)
Current Fee (% per annum)
PowerShares Middle East North Africa NASDAQ OMX Fund 0.95 0.75 PowerShares FTSE RAFI Emerging Markets Fund 0.85 0.65 PowerShares FTSE RAFI All-World 3000 Fund 0.55 0.50 As a result of the move to replicate the relevant benchmark index, the Swap Funds may have a substantial portion of their Net Assets Value in cash. Language has been included in the Prospectus to permit the use of the common investment pools and additional risk factors have been inserted regarding the use of the over the-counter swap agreements, counterparty risks and collateral risks.
As the Swap Funds will be partaking in the indirect replication of the relevant benchmark indices through the use of FDI, cash subscriptions and cash redemptions will generally only be accepted for the Swap Funds, unless agreed otherwise with the Manager. Change of Manager With effective date of 1 January 2011 Invesco PowerShares Capital Management Ireland Limited retired as Manager of the Company. In its place Invesco Global Asset Management limited was appointed as the new Manager. The decision reduced the number of Irish incorporated and regulated group companies which provide services to Invesco’s range of funds to one regulated company, Invesco Global Asset Management Limited. This will simplify the structure of the Invesco group, thereby facilitating ease of regulation by the Central Bank and reducing costs for investors.

PowerShares Global Funds Ireland plc
Annual Report and Audited Financial Statements for the year ended 30 September 2011
Notes to the Financial Statements (continued)
158
20. Restatement of Net Asset Value in accordance with FRS26
The value of investments in accordance with FRS26 and in accordance with the latest trade price basis as per the published Net Asset Value (“NAV”) for the year ended 30 September 2011 and for 30 September 2010 is set out below: 2011 2011 2011 Per Published NAV Per FRS26 Difference PowerShares FTSE RAFI Italy 30 Fund EUR EUR EUR Financial assets at fair value through profit or loss 2,319,820 2,300,077 (19,743) 2,319,820 2,300,077 (19,743) 2010 2010 2010 Per Published NAV Per FRS26 Difference PowerShares Middle East North Africa NASDAQ OMX Fund USD USD USD Financial assets at fair value through profit or loss 2,524,706 2,498,056 (26,650) 2,524,706 2,498,056 (26,650) In accordance with the provisions of the Company’s Prospectus and each sub-fund’s Supplement, as amended, listed investments are stated at the last traded price on the valuation day for the purpose of determining net asset value per share for subscriptions and redemptions and for various fee calculations. However, the accounting policy of the Company for the purpose of compliance with FRS26 and for reporting purposes is to value its investments at the relevant bid market prices on the Balance Sheet. As at 30 September 2011, the difference between the valuation of investments stated in the financial statements and the valuation methodology indicated in the Prospectus results in a decrease in value of investments of USD19,743. For the year ended 30 September 2011, none of the other PowerShares sub-funds required an FRS26 adjustment. For the year ended 30 September 2010, the difference between the valuation of investments stated in the financial statements and the valuation methodology indicated in the Prospectus results in a decrease in value of investments of PowerShares Middle East North Africa NASDAQ OMX Fund by USD26,650. For the year ended 30 September 2010, none of the other PowerShares sub-funds required an FRS26 adjustment. Net assets attributable to redeemable participating shareholders represent a liability in the Balance Sheet, carried at the redemption amount that would be payable at the Balance Sheet date if the shareholder exercised the right to redeem shares in the Fund. Consequently, the difference described above further adjusts the carrying amount of the net assets attributable to redeemable participating shareholders and is recognised in the Profit and Loss Account. The cumulative differences are included as “Adjustments from bid market process to last traded market prices” on the Balance Sheet. 21. Segregated Liability
The Company has adopted segregated liability between its Funds. This ensures that the liabilities incurred on behalf of a Fund will generally be discharged solely out of the assets of that Fund and there generally can be no recourse to the other Funds to satisfy those liabilities. Notwithstanding the foregoing there can be no assurance that, should an action be brought against the Company in a court in another jurisdiction, the segregated nature of the Funds would necessarily be upheld.

PowerShares Global Funds Ireland plc
Annual Report and Audited Financial Statements for the year ended 30 September 2011
Notes to the Financial Statements (continued)
159
22. Significant Events after the year end date
Post year end redemptions totalled EUR1,434,580 in value for the PowerShares Global Listed Private Equity Fund (38% of year end NAV). Post year end redemptions totalled EUR1,264,257 in value for the PowerShares Palisades Global Water Fund (22% of year end NAV). Post year end redemptions totalled EUR776,116 in value for the PowerShares FTSE RAFI Developed Europe Mid - Small Fund (11% of year end NAV). Post year end redemptions totalled EUR16,944,779 in value for the PowerShares FTSE Euro MTS Cash 3 Months Fund (24% of year end NAV). Post year end redemptions totalled EUR943,708 in value for the PowerShares Global Clean Energy Fund (18% of year end NAV). Post year end redemptions totalled EUR774,272 in value for the PowerShares FTSE RAFI Developed 1000 Fund (14% of year end NAV). Post year end redemptions totalled USD1,178,211 in value for the PowerShares FTSE RAFI All-World 3000 Fund (16% of year end NAV). Board Changes Leslie Schmidt, Cormac O’Sullivan and Brian Collins were appointed to the Board of the Company with effective date 18 November 2011. Eugene Regan and Eimear Cowhey resigned from the Board with effect from 31 December 2011. UCITS IV Update With effect from 1 December 2011 the prospectus documentation of the Company was updated to comply with the new requirements of the European Communities (Undertakings for Collective Investment in Transferable Securities) Regulations 2011 issued by the Central Bank of Ireland on 1 July 2011.
23. Approval of Financial Statements
The Directors approved the financial statements on 12 January 2012. N

PowerShares Global Funds Ireland plc
Annual Report and Audited Financial Statements for the year ended 30 September 2011
160
Schedule of Investments
PowerShares EQQQ Fund
Nominal Security Description Fair Value USD
% of Net Assets
Basic Materials 48,120 Sigma-Aldrich Corp 2,973,335 0.32
Total Basic Materials 2,973,335 0.32 Communications
73,405 Akamai Technologies Inc 1,459,291 0.16 179,290 Amazon.com Inc 38,767,876 4.12 107,477 Baidu Inc/China 11,490,366 1.22
2,181,374 Cisco Systems Inc 33,789,483 3.59 826,344 Comcast Corp A 17,270,590 1.84 57,848 Ctrip.com International Ltd 1,860,392 0.20
304,299 DIRECTV 12,856,633 1.37 514,510 eBay Inc 15,172,900 1.61 97,792 Expedia, Inc. 2,518,144 0.27 31,991 F5 Networks Inc 2,272,961 0.24
100,349 Google Inc 51,617,518 5.48 226,146 Liberty Interactive Corp 3,340,176 0.36 20,721 Netflix Inc 2,344,788 0.25
724,500 News Corp 11,208,015 1.19 67,071 NII Holdings Inc 1,807,563 0.19 19,673 priceline.com Inc 8,842,227 0.94
662,150 QUALCOMM Inc 32,200,355 3.42 1,557,580 Sirius XM Radio Inc 2,351,946 0.25
298,962 Symantec Corporation 4,873,081 0.52 66,381 VeriSign Inc 1,899,160 0.20
125,289 Virgin Media, Inc. 3,050,787 0.32 343,324 Vodafone Group Plc 8,806,261 0.94 515,947 Yahoo! Inc 6,789,863 0.72
Total Communications 276,590,376 29.40 Consumer, Cyclical
98,595 Bed Bath & Beyond Inc. 5,650,479 0.60 173,157 Costco Wholesale Corp 14,219,653 1.50 48,321 Dollar Tree, Inc. 3,629,390 0.39
116,567 Fastenal Co 3,879,350 0.41 137,385 Mattel, Inc. 3,556,898 0.38 54,502 O'Reilly Automotive Inc 3,631,468 0.39
144,625 PACCAR, Inc. 4,891,218 0.52 46,451 Ross Stores Inc 3,655,229 0.39 42,495 Sears Holdings Corp 2,444,312 0.26
281,943 Staples Inc 3,749,842 0.40 297,070 Starbucks Corp 11,077,740 1.18

PowerShares Global Funds Ireland plc
Annual Report and Audited Financial Statements for the year ended 30 September 2011
161
Schedule of Investments
PowerShares EQQQ Fund (continued)
Nominal Security Description Fair Value USD
% of Net Assets
Consumer, Cyclical (continued) 63,796 Urban Outfitters Inc 1,423,927 0.15 49,402 Wynn Resorts Ltd 5,685,182 0.60
Total Consumer, Cyclical 67,494,688 7.17 Consumer, Non-cyclical
72,716 Alexion Pharmaceuticals Inc 4,658,187 0.50 368,621 Amgen, Inc. 20,255,724 2.15 55,643 Apollo Group Inc 2,204,019 0.23
197,958 Automatic Data Processing Inc 9,333,720 0.99 95,719 Biogen Idec, Inc. 8,916,225 0.95
183,392 Celgene Corporation 11,355,633 1.21 55,420 DENTSPLY International Inc 1,700,840 0.18
209,696 Express Scripts, Inc. 7,773,431 0.83 311,902 Gilead Sciences Inc 12,101,798 1.29 60,478 Green Mountain Coffee Roasters Inc 5,620,825 0.60 36,371 Henry Schein Inc 2,255,366 0.24 48,507 Illumina Inc 1,984,906 0.21 15,551 Intuitive Surgical Inc 5,664,918 0.60 70,568 Life Technologies Corp 2,711,928 0.29
173,524 Mylan Inc/PA 2,949,908 0.31 143,056 Paychex Inc 3,772,387 0.40 91,474 QIAGEN NV 1,265,085 0.13
278,606 Teva Pharmaceutical Industries Ltd 10,369,715 1.10 81,447 Vertex Pharmaceuticals Inc 3,627,649 0.39 99,852 Warner Chilcott Plc 1,427,884 0.15 69,517 Whole Foods Market Inc 4,540,155 0.48
Total Consumer, Non-cyclical 124,490,303 13.23 Energy
33,979 First Solar, Inc. 2,147,813 0.23 Total Energy 2,147,813 0.23 Industrial
65,475 CH Robinson Worldwide Inc 4,483,073 0.48 83,910 Expeditors International of Washington Inc 3,402,551 0.36
298,151 Flextronics International Ltd 1,678,590 0.18 62,799 FLIR Systems, Inc. 1,573,115 0.17 82,090 Garmin Ltd 2,607,999 0.28 41,377 Joy Global, Inc. 2,581,097 0.27

PowerShares Global Funds Ireland plc
Annual Report and Audited Financial Statements for the year ended 30 September 2011
162
Schedule of Investments
PowerShares EQQQ Fund (continued)
Nominal Security Description Fair Value USD
% of Net Assets
Industrial (continued) 33,893 Stericycle Inc 2,735,843 0.29
Total Industrial 19,062,268 2.03 Technology
452,733 Activision Blizzard, Inc. 5,387,523 0.57 199,574 Adobe Systems Inc 4,823,704 0.51 127,428 Altera Corp 4,017,805 0.43 366,877 Apple Inc 139,846,175 14.86 521,662 Applied Materials, Inc. 5,399,202 0.57 90,672 Autodesk Inc 2,518,868 0.27 69,797 BMC Software, Inc. 2,691,372 0.29
191,053 Broadcom Corp 6,360,154 0.68 200,084 CA Inc 3,883,630 0.41 66,537 Cerner Corp 4,559,115 0.48 82,087 Check Point Software Technologies Ltd 4,330,910 0.46 74,332 Citrix Systems Inc 4,053,324 0.43
120,492 Cognizant Technology Solutions Corp 7,554,848 0.80 747,792 Dell Inc 10,581,257 1.12 131,225 Electronic Arts Inc 2,683,551 0.29 56,692 Fiserv Inc 2,878,253 0.31 33,113 Infosys Ltd 1,691,081 0.18
2,103,010 Intel Corp 44,857,203 4.77 119,746 Intuit Inc 5,680,750 0.60 66,269 KLA-Tencor Corp 2,536,777 0.27 49,036 Lam Research Corp 1,862,387 0.20 89,889 Linear Technology Corp 2,485,431 0.26
241,643 Marvell Technology Group Ltd 3,511,073 0.37 116,626 Maxim Integrated Products Inc 2,720,885 0.29 75,154 Microchip Technology Inc 2,338,041 0.25
395,222 Micron Technology Inc 1,991,919 0.21 3,345,309 Microsoft Corporation 83,264,741 8.85
145,579 NetApp Inc 4,940,951 0.53 237,179 NVIDIA Corp 2,964,738 0.32
2,007,388 Oracle Corp 57,692,331 6.13 207,197 Research In Motion Ltd 4,206,099 0.45 94,262 SanDisk Corp 3,803,472 0.40
169,449 Seagate Technology Plc 1,741,936 0.19 104,911 Xilinx Inc 2,878,758 0.31
Total Technology 442,738,264 47.06
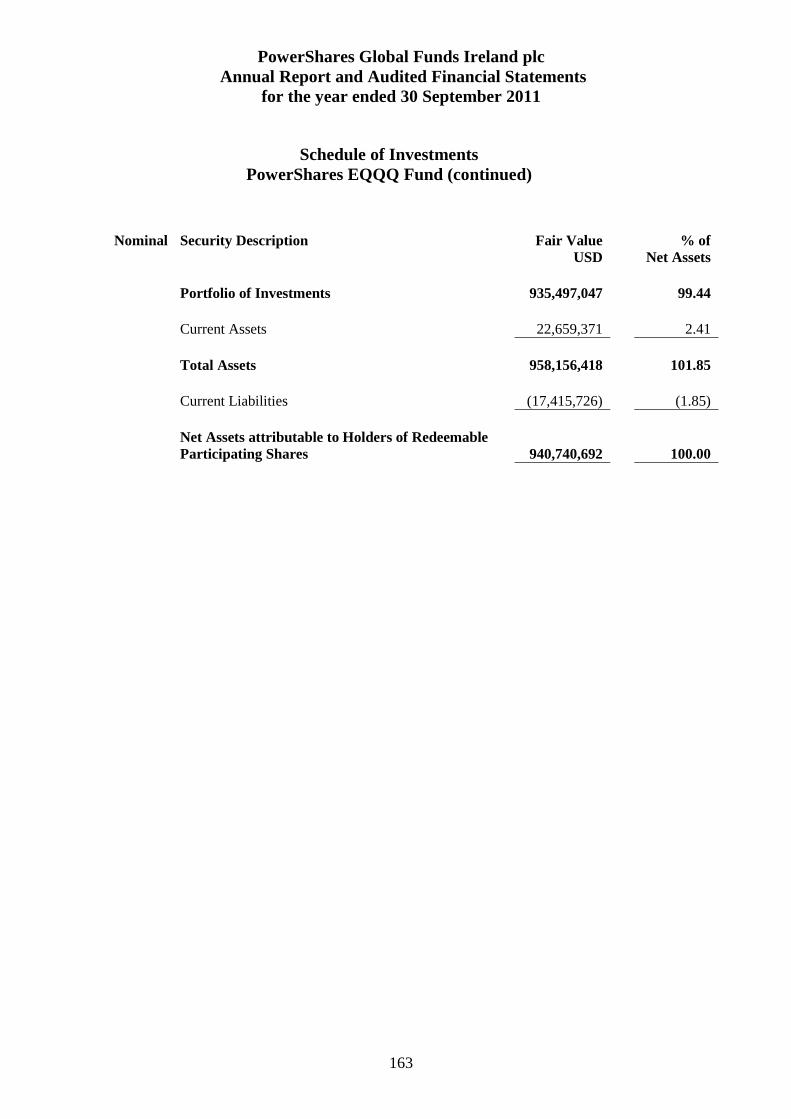
PowerShares Global Funds Ireland plc
Annual Report and Audited Financial Statements for the year ended 30 September 2011
163
Schedule of Investments
PowerShares EQQQ Fund (continued)
Nominal Security Description Fair Value USD
% of Net Assets
Portfolio of Investments 935,497,047 99.44
Current Assets 22,659,371 2.41
Total Assets 958,156,418 101.85
Current Liabilities (17,415,726) (1.85)
Net Assets attributable to Holders of Redeemable Participating Shares 940,740,692 100.00
TF END

PowerShares Global Funds Ireland plc
Annual Report and Audited Financial Statements for the year ended 30 September 2011
164
Schedule of Investments
PowerShares FTSE RAFI US 1000 Fund
Nominal Security Description Fair Value USD
% of Net Assets
Basic Materials 784 Air Products & Chemicals Inc 59,874 0.11 225 Airgas Inc 14,360 0.03
1,083 AK Steel Holding Corp 7,083 0.01 185 Albemarle Corp 7,474 0.01
7,899 Alcoa Inc 75,593 0.14 359 Allegheny Technologies Inc 13,279 0.03 696 Ashland Inc 30,721 0.06 314 Cabot Corp 7,781 0.01 195 Carpenter Technology Corp 8,754 0.02 531 Celanese Corp 17,273 0.03 102 CF Industries Holdings Inc 12,586 0.02 182 Cliffs Natural Resources Inc 9,313 0.02 242 Cytec Industries Inc 8,504 0.02 345 Domtar Corporation 23,519 0.04
7,010 Dow Chemical Co 157,445 0.31 340 Eastman Chemical Co 23,300 0.04 629 Ecolab Inc 30,752 0.06
3,524 EI du Pont de Nemours & Co 140,854 0.27 179 FMC Corp 12,380 0.02
2,255 Freeport-McMoRan Copper & Gold Inc 68,665 0.13 1,246 Huntsman Corporation 12,049 0.02
252 International Flavors & Fragrances Inc 14,167 0.03 3,844 International Paper Company 89,373 0.17 1,805 LyondellBasell Industries NV 44,096 0.08 1,219 MeadWestvaco Corp 29,939 0.06 1,311 Monsanto Company 78,712 0.15
290 Mosaic Co 14,201 0.03 1,445 Newmont Mining Corp 90,891 0.17 2,079 Nucor Corp 65,780 0.12
550 Olin Corp 9,906 0.02 738 PPG Industries Inc 52,147 0.10 847 Praxair Inc 79,178 0.15 444 Reliance Steel & Aluminum Co 15,100 0.03 271 Rockwood Holdings, Inc. 9,130 0.02 769 RPM International Inc 14,380 0.03 233 Sensient Technologies Corp 7,584 0.01 420 Sherwin-Williams Co 31,214 0.06 260 Sigma-Aldrich Corp 16,065 0.03 360 Solutia Inc 4,626 0.01 873 Southern Copper Corporation 21,816 0.04
1,216 Steel Dynamics Inc 12,063 0.02 952 United States Steel Corp 20,954 0.04

PowerShares Global Funds Ireland plc
Annual Report and Audited Financial Statements for the year ended 30 September 2011
165
Schedule of Investments
PowerShares FTSE RAFI US 1000 Fund (continued)
Nominal Security Description Fair Value USD
% of Net Assets
Basic Materials (continued) 1,502 USEC Inc 2,418 0.00
420 Valspar Corp 13,108 0.02 729 Vulcan Materials Co 20,091 0.04 287 WR Grace & Co 9,557 0.02
Total Basic Materials 1,508,055 2.85 Communications
258 Akamai Technologies Inc 5,129 0.01 357 Amazon.com Inc 77,194 0.15 194 AMC Networks Inc 6,198 0.01 829 Amdocs Ltd 22,482 0.04 430 American Tower Corp 23,134 0.04 199 Anixter International Inc 9,441 0.02
2,072 AOL Inc 24,864 0.05 48,974 AT&T Inc 1,396,738 2.65
777 Cablevision Systems Corp 12,222 0.02 4,115 CBS Corp 83,864 0.16 3,190 CenturyLink Inc 105,653 0.20 3,337 Cincinnati Bell Inc 10,311 0.02
19,225 Cisco Systems Inc 297,795 0.57 2,887 Comcast Corp - Special Class A 59,732 0.11 8,363 Comcast Corp A 174,787 0.33 4,036 Corning Inc 49,885 0.09
489 Crown Castle International Corp 19,888 0.04 2,107 Dex One Corp 1,180 0.00 2,104 DIRECTV 88,894 0.17
300 Discovery Communications Inc A 11,286 0.02 266 Discovery Communications Inc C 9,350 0.02
1,198 DISH Network Corp 30,022 0.06 3,034 eBay Inc 89,473 0.17 1,108 Expedia, Inc. 28,531 0.05 4,288 Frontier Communications Corporation 26,200 0.05 3,011 Gannett Co Inc 28,695 0.05
372 Google Inc 191,349 0.36 554 Harris Corp 18,930 0.04 655 IAC/InterActiveCorp 25,905 0.05
2,056 Interpublic Group of Cos Inc 14,803 0.03 876 Juniper Networks Inc 15,120 0.03 394 Lamar Advertising Co 6,710 0.01 848 Leap Wireless International Inc 5,851 0.01
13,526 Level 3 Communications Inc 20,154 0.04 868 Liberty Global Inc 31,404 0.06

PowerShares Global Funds Ireland plc
Annual Report and Audited Financial Statements for the year ended 30 September 2011
166
Schedule of Investments
PowerShares FTSE RAFI US 1000 Fund (continued)
Nominal Security Description Fair Value USD
% of Net Assets
Communications (continued) 821 Liberty Global, Inc. - Series C 28,415 0.05
3,599 Liberty Interactive Corp 53,157 0.10 182 Liberty Media Corp - Liberty Starz 11,568 0.02
1,292 McGraw-Hill Cos Inc 52,972 0.10 1,053 MetroPCS Communications Inc 9,172 0.02 1,132 Motorola Mobility Holdings Inc 42,767 0.08 2,919 Motorola Solutions Inc 122,306 0.23
45 Netflix Inc 5,092 0.01 1,505 New York Times Co 8,744 0.02 7,248 News Corp 112,127 0.21 2,368 News Corp Class B 36,917 0.07
371 Nielsen Holdings NV 9,676 0.02 673 NII Holdings Inc 18,137 0.03
1,158 Omnicom Group, Inc. 42,661 0.08 24 priceline.com Inc 10,787 0.02
2,768 QUALCOMM Inc 134,608 0.25 46,222 Sprint Nextel Corp 140,515 0.27 1,279 SuperMedia Inc 1,982 0.00 2,671 Symantec Corporation 43,537 0.08
876 Telephone & Data Systems Inc 18,615 0.04 1,591 Tellabs Inc 6,825 0.01 1,581 Time Warner Cable Inc 99,081 0.19 8,126 Time Warner Inc 243,536 0.46
472 tw telecom inc 7,797 0.01 270 United States Cellular Corp 10,706 0.02 376 VeriSign Inc 10,757 0.02
24,064 Verizon Communications Inc 885,555 1.69 1,986 Viacom Inc 76,938 0.15 1,440 Virgin Media, Inc. 35,064 0.07 6,185 Walt Disney Co 186,540 0.35 3,289 Windstream Corporation 38,350 0.07 4,568 Yahoo! Inc 60,115 0.11
Total Communications 5,588,193 10.58 Consumer, Cyclical
337 Abercrombie & Fitch Co 20,746 0.04 285 Advance Auto Parts Inc 16,559 0.03 328 Aeropostale Inc 3,546 0.01 285 Alaska Air Group Inc 16,043 0.03
1,220 American Eagle Outfitters Inc 14,298 0.03 9,445 AMR Corp 27,957 0.05
371 ANN INC 8,474 0.02

PowerShares Global Funds Ireland plc
Annual Report and Audited Financial Statements for the year ended 30 September 2011
167
Schedule of Investments
PowerShares FTSE RAFI US 1000 Fund (continued)
Nominal Security Description Fair Value USD
% of Net Assets
Consumer, Cyclical (continued) 526 Asbury Automotive Group Inc 8,674 0.02 290 Ascena Retail Group Inc 7,850 0.01 382 Autoliv Inc 18,527 0.04
1,154 AutoNation Inc 37,828 0.07 90 AutoZone Inc 28,727 0.05
943 Barnes & Noble Inc 11,156 0.02 816 Bed Bath & Beyond Inc. 46,765 0.09
3,709 Best Buy Co Inc 86,420 0.16 411 Big Lots Inc 14,315 0.03 267 BorgWarner Inc 16,162 0.03 915 Boyd Gaming Corp 4,484 0.01 705 Brightpoint Inc 6,493 0.01 604 Brinker International Inc 12,636 0.02 489 Brunswick Corp/DE 6,866 0.01 297 Cabela's, Inc. 6,086 0.01 698 CarMax Inc 16,647 0.03
2,067 Carnival Corp 62,630 0.12 297 Casey's General Stores Inc 12,964 0.02
2,881 Charming Shoppes Inc 7,491 0.01 691 Chico's FAS Inc 7,898 0.01 403 Cinemark Holdings, Inc. 7,609 0.01 838 Cintas Corp 23,581 0.04 385 Coach Inc 19,955 0.04 554 Collective Brands, Inc. 7,180 0.01 359 Cooper Tire & Rubber Company 3,910 0.01 297 Core-Mark Holding Company, Inc. 9,097 0.02
2,409 Costco Wholesale Corp 197,827 0.37 8,218 CVS Caremark Corp 275,959 0.53 1,079 Dana Holding Corp 11,330 0.02
614 Darden Restaurants Inc 26,249 0.05 6,578 Delta Air Lines Inc 49,335 0.09
231 Dick's Sporting Goods Inc 7,729 0.01 404 Dillard's Inc 17,566 0.03 402 Dollar Tree, Inc. 30,194 0.06 719 Domino's Pizza, Inc. 19,593 0.04
2,836 DR Horton Inc 25,637 0.05 829 Exide Technologies 3,316 0.01 503 Family Dollar Stores Inc 25,583 0.05 557 Fastenal Co 18,537 0.04
1,059 Foot Locker Inc 21,275 0.04 21,996 Ford Motor Co 212,700 0.40 1,588 GameStop Corp 36,683 0.07

PowerShares Global Funds Ireland plc
Annual Report and Audited Financial Statements for the year ended 30 September 2011
168
Schedule of Investments
PowerShares FTSE RAFI US 1000 Fund (continued)
Nominal Security Description Fair Value USD
% of Net Assets
Consumer, Cyclical (continued) 2,407 Gap Inc 39,090 0.07 3,527 General Motors Co 71,175 0.13
897 Genuine Parts Co 45,568 0.09 4,249 Goodyear Tire & Rubber Co 42,872 0.08
319 Group 1 Automotive Inc 11,340 0.02 668 Hanesbrands, Inc. 16,707 0.03 963 Harley-Davidson Inc 33,060 0.06 242 Harman International Industries Inc 6,916 0.01 478 Hasbro, Inc. 15,588 0.03 285 HNI Corp 5,452 0.01
9,233 Home Depot Inc 303,488 0.58 295 HSN Inc 9,773 0.02 176 Hyatt Hotels Corp 5,521 0.01
3,182 Ingram Micro Inc 51,326 0.10 1,501 International Game Technology 21,810 0.04
458 Jack in the Box Inc 9,123 0.02 2,042 JC Penney Co Inc 54,685 0.10 2,032 JetBlue Airways Corp 8,331 0.02 2,923 Johnson Controls Inc 77,080 0.15 1,025 Jones Group Inc 9,440 0.02
876 KB Home 5,133 0.01 1,636 Kohl's Corp 80,328 0.15
365 Las Vegas Sands Corporation 13,994 0.03 278 Lear Corp 11,926 0.02
1,938 Liz Claiborne Inc 9,690 0.02 364 LKQ Corp 8,794 0.02
7,776 Lowe's Cos Inc 150,388 0.28 1,487 Ltd Brands Inc 57,264 0.11 3,912 Macy's, Inc. 102,964 0.19
988 Marriott International Inc/DE 26,913 0.05 1,603 Mattel, Inc. 41,502 0.08 3,123 McDonald's Corp 274,261 0.53
359 MDC Holdings Inc 6,081 0.01 320 Men's Wearhouse Inc 8,346 0.02 340 Meritage Homes Corp 5,148 0.01 680 Meritor Inc 4,801 0.01
2,790 MGM Resorts International 25,919 0.05 627 Mohawk Industries Inc 26,905 0.05 655 Navistar International Corp 21,039 0.04
1,724 Newell Rubbermaid Inc 20,464 0.04 721 NIKE Inc 61,653 0.12 791 Nordstrom, Inc. 36,133 0.07

PowerShares Global Funds Ireland plc
Annual Report and Audited Financial Statements for the year ended 30 September 2011
169
Schedule of Investments
PowerShares FTSE RAFI US 1000 Fund (continued)
Nominal Security Description Fair Value USD
% of Net Assets
Consumer, Cyclical (continued) 28 NVR Inc 16,911 0.03
7,802 Office Depot, Inc. 16,072 0.03 1,400 OfficeMax Inc 6,790 0.01
389 O'Reilly Automotive Inc 25,919 0.05 607 Oshkosh Corp 9,554 0.02 474 Owens & Minor Inc 13,500 0.03
1,661 PACCAR, Inc. 56,175 0.11 938 Pantry Inc 11,378 0.02 476 Penn National Gaming Inc 15,846 0.03 615 Penske Automotive Group Inc 9,840 0.02 420 PetSmart Inc 17,913 0.03 228 Polaris Industries Inc 11,393 0.02
3,674 Pulte Homes, Inc. 14,512 0.03 166 PVH Corp 9,668 0.02
1,003 RadioShack Corp 11,655 0.02 132 Ralph Lauren Corp 17,120 0.03
1,325 Regal Entertainment Group 15,556 0.03 562 Regis Corp 7,919 0.01
1,429 Republic Airways Holdings Inc 4,044 0.01 20,336 Rite Aid Corp 19,929 0.04
290 Ross Stores Inc 22,820 0.04 796 Royal Caribbean Cruises Ltd 17,225 0.03
1,812 Saks Inc 15,855 0.03 1,004 Sears Holdings Corp 57,750 0.11
441 Signet Jewelers Ltd 14,906 0.03 814 Skywest Inc 9,369 0.02 728 Sonic Automotive Inc 7,855 0.01
3,905 Southwest Airlines Co 31,396 0.06 3,688 Staples Inc 49,050 0.09 1,286 Starbucks Corp 47,955 0.09
554 Starwood Hotels & Resorts Worldwide Inc 21,506 0.04 4,328 Target Corp 212,245 0.40
354 Tenneco, Inc. 9,066 0.02 310 Tiffany & Co 18,854 0.04
1,304 TJX Cos, Inc. 72,333 0.14 557 Toll Brothers Inc 8,038 0.02 173 Tractor Supply Co 10,821 0.02 838 TRW Automotive Holdings Corp 27,428 0.05
3,664 United Continental Holdings Inc 71,008 0.13 455 United Stationers, Inc. 12,399 0.02 231 Urban Outfitters Inc 5,156 0.01 481 VF Corp 58,451 0.11

PowerShares Global Funds Ireland plc
Annual Report and Audited Financial Statements for the year ended 30 September 2011
170
Schedule of Investments
PowerShares FTSE RAFI US 1000 Fund (continued)
Nominal Security Description Fair Value USD
% of Net Assets
Consumer, Cyclical (continued) 140 WABCO Holdings Inc 5,300 0.01
4,505 Walgreen Co 148,169 0.28 18,240 Wal-Mart Stores Inc 946,655 1.80
164 Warnaco Group Inc 7,559 0.01 2,699 Wendy's Co 12,388 0.02
306 WESCO International Inc 10,266 0.02 722 Whirlpool Corp 36,035 0.07 373 Williams-Sonoma Inc 11,485 0.02 557 World Fuel Services Corp 18,186 0.03 240 WW Grainger Inc 35,890 0.07 680 Wyndham Worldwide Corporation 19,387 0.04 127 Wynn Resorts Ltd 14,615 0.03
1,093 Yum! Brands, Inc. 53,983 0.10 Total Consumer, Cyclical 5,850,176 11.07 Consumer, Non-cyclical
388 Aaron's Inc 9,797 0.02 6,262 Abbott Laboratories 320,239 0.61 2,496 Aetna, Inc. 90,730 0.17
386 Alere Inc 7,585 0.01 407 Allergan Inc/United States 33,529 0.06 136 Alliance Data Systems Corp 12,607 0.02
16,983 Altria Group Inc 455,314 0.86 239 AMERIGROUP Corp 9,323 0.02
3,477 AmerisourceBergen Corporation 129,588 0.25 3,778 Amgen, Inc. 207,601 0.39
560 Apollo Group Inc 22,182 0.04 4,734 Archer-Daniels-Midland Co 117,451 0.22 1,629 Automatic Data Processing Inc 76,807 0.15
753 Avery Dennison Corp 18,885 0.04 2,372 Avis Budget Group, Inc. 22,937 0.04 1,860 Avon Products Inc 36,456 0.07 1,795 Baxter International Inc 100,771 0.19
847 Beam Inc 45,806 0.09 765 Becton Dickinson and Co 56,090 0.11 706 Biogen Idec, Inc. 65,764 0.12
12,152 Boston Scientific Corp 71,818 0.14 9,964 Bristol-Myers Squibb Co 312,670 0.59
349 Brookdale Senior Living, Inc. 4,376 0.01 308 Brown-Forman Corp 21,603 0.04
1,348 Bunge Ltd 78,575 0.15 1,139 Campbell Soup Company 36,869 0.07

PowerShares Global Funds Ireland plc
Annual Report and Audited Financial Statements for the year ended 30 September 2011
171
Schedule of Investments
PowerShares FTSE RAFI US 1000 Fund (continued)
Nominal Security Description Fair Value USD
% of Net Assets
Consumer, Non-cyclical (continued) 4,587 Cardinal Health, Inc. 192,104 0.36
431 Career Education Corp 5,625 0.01 1,237 CareFusion Corp 29,626 0.06
434 Celgene Corporation 26,873 0.05 295 Centene Corp 8,458 0.02 474 Central European Distribution Corp 3,323 0.01 301 Cephalon, Inc. 24,291 0.05 309 Charles River Laboratories International Inc 8,844 0.02 550 Chiquita Brands International Inc 4,587 0.01 321 Church & Dwight Company, Inc. 14,188 0.03
1,446 CIGNA Corp 60,645 0.11 486 Clorox Co 32,236 0.06
6,179 Coca-Cola Co 417,453 0.79 2,575 Coca-Cola Enterprises Inc 64,066 0.12 1,458 Colgate-Palmolive Company 129,295 0.24
900 Community Health Systems Inc 14,976 0.03 2,968 ConAgra Foods Inc 71,885 0.14 1,198 Constellation Brands Inc 21,564 0.04
990 Convergys Corp 9,286 0.02 129 Cooper Cos Inc 10,210 0.02 284 Corn Products International Inc 11,144 0.02 502 Corrections Corp of America 11,390 0.02 213 Covance Inc 9,681 0.02
1,523 Coventry Health Care Inc 43,878 0.08 1,503 Covidien Plc 66,282 0.13
195 CR Bard Inc 17,070 0.03 384 DaVita Inc 24,065 0.05
6,726 Dean Foods Co 59,660 0.11 370 Deluxe Corp 6,882 0.01 359 DENTSPLY International Inc 11,018 0.02 149 DeVry Inc 5,507 0.01 684 Dole Food Co Inc 6,840 0.01 245 Dollar Thrifty Automotive Group Inc 13,794 0.03
1,065 Dr Pepper Snapple Group Inc 41,301 0.08 108 Edwards Lifesciences Corp 7,698 0.01
6,718 Eli Lilly & Co 248,364 0.47 355 Endo Pharmaceuticals Holdings Inc 9,936 0.02 374 Equifax Inc 11,497 0.02 201 Estee Lauder Cos Inc 17,656 0.03
1,263 Express Scripts, Inc. 46,819 0.09 586 Flowers Foods Inc 11,404 0.02
1,125 Forest Laboratories Inc 34,639 0.07

PowerShares Global Funds Ireland plc
Annual Report and Audited Financial Statements for the year ended 30 September 2011
172
Schedule of Investments
PowerShares FTSE RAFI US 1000 Fund (continued)
Nominal Security Description Fair Value USD
% of Net Assets
Consumer, Non-cyclical (continued) 344 Fresh Del Monte Produce Inc 7,981 0.02 256 FTI Consulting Inc 9,423 0.02
2,589 General Mills Inc 99,599 0.19 1,760 Gilead Sciences Inc 68,288 0.13 1,847 H&R Block Inc 24,584 0.05 1,574 Health Management Associates Inc 10,892 0.02 1,419 Health Net Inc 33,644 0.06
361 Henry Schein Inc 22,386 0.04 232 Herbalife Ltd 12,435 0.02 514 Hershey Company 30,449 0.06
4,203 Hertz Global Holdings Inc 37,407 0.07 269 Hill-Rom Holdings Inc 8,075 0.02
1,347 HJ Heinz Co 67,997 0.13 814 Hologic Inc 12,381 0.02 783 Hormel Foods Corp 21,157 0.04 460 Hospira, Inc. 17,020 0.03
1,354 Humana Inc 98,476 0.19 41 Intuitive Surgical Inc 14,935 0.03
855 Iron Mountain Inc 27,035 0.05 489 Jarden Corp 13,819 0.03 489 JM Smucker Co 35,643 0.07
11,193 Johnson & Johnson 713,106 1.34 1,085 Kellogg Co 57,711 0.11
489 Kelly Services Inc 5,575 0.01 2,042 Kimberly-Clark Corp 145,002 0.27
506 Kindred Healthcare Inc 4,362 0.01 275 Kinetic Concepts Inc 18,120 0.03
9,034 Kraft Foods Inc 303,362 0.57 7,482 Kroger Co 164,305 0.31
316 Laboratory Corp of America Holdings 24,980 0.05 315 Lender Processing Services Inc 4,312 0.01 465 Life Technologies Corp 17,870 0.03 444 LifePoint Hospitals Inc 16,268 0.03 425 Lincare Holdings Inc 9,563 0.02
1,068 Live Nation, Inc. 8,555 0.02 952 Lorillard Inc 105,386 0.20 192 Magellan Health Services, Inc. 9,274 0.02 717 Manpower Inc 24,106 0.05 127 Mastercard Inc 40,279 0.08 425 McCormick & Co Inc/MD 19,618 0.04
2,568 McKesson Corp 186,694 0.35 356 Mead Johnson Nutrition Co 24,503 0.05

PowerShares Global Funds Ireland plc
Annual Report and Audited Financial Statements for the year ended 30 September 2011
173
Schedule of Investments
PowerShares FTSE RAFI US 1000 Fund (continued)
Nominal Security Description Fair Value USD
% of Net Assets
Consumer, Non-cyclical (continued) 2,425 Medco Health Solutions Inc 113,708 0.22
145 Mednax Inc 9,083 0.02 3,717 Medtronic, Inc. 123,553 0.23
14,805 Merck & Co Inc 484,272 0.92 770 Molson Coors Brewing Co 30,500 0.06 500 Monster Worldwide Inc 3,590 0.01 555 Moody's Corporation 16,900 0.03 701 Mylan Inc/PA 11,917 0.02 260 Nash Finch Co 7,002 0.01 933 Omnicare Inc 23,726 0.04 375 Patterson Cos Inc 10,736 0.02
1,157 Paychex Inc 30,510 0.06 5,192 PepsiCo Inc/NC 321,385 0.61
119 Perrigo Co 11,556 0.02 49,726 Pfizer, Inc. 879,155 1.65
384 Pharmaceutical Product Development Inc 9,853 0.02 1,011 PHH Corporation 16,257 0.03 4,330 Philip Morris International Inc 270,105 0.51
11,683 Procter & Gamble Co 738,132 1.39 852 Quanta Services Inc 16,009 0.03 723 Quest Diagnostics Inc/DE 35,687 0.07 323 Ralcorp Holdings, Inc. 24,777 0.05 600 Rent-A-Center Inc/TX 16,470 0.03
2,377 Reynolds American Inc 89,090 0.17 508 Robert Half International Inc 10,780 0.02
2,734 RR Donnelley & Sons Co 38,604 0.07 253 Ruddick Corp 9,864 0.02
5,124 Safeway Inc 85,212 0.16 2,302 SAIC Inc 27,187 0.05 3,479 Sara Lee Corp 56,882 0.11
251 Scotts Miracle-Gro Co 11,195 0.02 374 SEI Investments Co 5,752 0.01
1,264 Service Corp International/US 11,578 0.02 1,697 Smithfield Foods Inc 33,092 0.06
821 St Jude Medical Inc 29,712 0.06 249 STERIS Corp 7,288 0.01 673 Stryker Corporation 31,718 0.06
11,054 SUPERVALU Inc 73,620 0.14 4,336 Sysco Corp 112,302 0.21
232 Teleflex Inc 12,475 0.02 4,012 Tenet Healthcare Corp 16,570 0.03 1,162 Total System Services Inc 19,673 0.04

PowerShares Global Funds Ireland plc
Annual Report and Audited Financial Statements for the year ended 30 September 2011
174
Schedule of Investments
PowerShares FTSE RAFI US 1000 Fund (continued)
Nominal Security Description Fair Value USD
% of Net Assets
Consumer, Non-cyclical (continued) 199 Tupperware Brands Corporation 10,694 0.02
3,091 Tyson Foods Inc 53,660 0.10 234 United Natural Foods Inc 8,667 0.02 619 United Rentals Inc 10,424 0.02
6,596 UnitedHealth Group Inc 304,208 0.58 462 Universal American Corp/NY 4,648 0.01 231 Universal Corp/VA 8,284 0.02 396 Universal Health Services Inc 13,464 0.03 212 Varian Medical Systems, Inc. 11,058 0.02 341 VCA Antech Inc 5,449 0.01
1,076 Visa Inc 92,235 0.17 307 Watson Pharmaceuticals, Inc. 20,953 0.04
4,191 WellPoint, Inc. 273,588 0.52 1,128 Western Union Co 17,247 0.03
516 Whole Foods Market Inc 33,700 0.06 2,822 Winn-Dixie Stores, Inc. 16,706 0.03
769 Zimmer Holdings Inc 41,142 0.08 Total Consumer, Non-cyclical 11,621,614 22.00 Diversified
347 Leucadia National Corp 7,870 0.01 Total Diversified 7,870 0.01 Energy
524 Alpha Natural Resources Inc 9,270 0.02 1,529 Anadarko Petroleum Corp 96,403 0.18
899 Apache Corp 72,136 0.14 550 Arch Coal, Inc. 8,019 0.02 192 Atwood Oceanics Inc 6,597 0.01
1,268 Baker Hughes, Inc. 58,531 0.11 229 Cabot Oil & Gas Corp 14,177 0.03 542 Cameron International Corporation 22,515 0.04
2,418 Chesapeake Energy Corp 61,780 0.12 11,397 Chevron Corporation 1,054,450 1.99
129 Cimarex Energy Company 7,185 0.01 11,188 ConocoPhillips 708,424 1.33
535 Consol Energy Inc 18,153 0.03 237 Copano Energy LLC 7,065 0.01 600 Covanta Holding Corporation 9,114 0.02 407 CVR Energy Inc 8,604 0.02 612 Denbury Resources Inc 7,038 0.01
1,354 Devon Energy Corp 75,066 0.14

PowerShares Global Funds Ireland plc
Annual Report and Audited Financial Statements for the year ended 30 September 2011
175
Schedule of Investments
PowerShares FTSE RAFI US 1000 Fund (continued)
Nominal Security Description Fair Value USD
% of Net Assets
Energy (continued) 410 Diamond Offshore Drilling Inc 22,443 0.04 225 Dresser-Rand Group Inc 9,119 0.02
1,999 El Paso Corp 34,943 0.07 251 Energen Corp 10,263 0.02 544 EOG Resources Inc 38,629 0.07 391 EQT Corp 20,864 0.04 854 Exterran Holdings, Inc. 8,301 0.02
22,737 Exxon Mobil Corporation 1,651,389 3.12 75 First Solar, Inc. 4,741 0.01
377 FMC Technologies Inc 14,175 0.03 381 Forest Oil Corp 5,486 0.01
2,346 Halliburton Co 71,600 0.14 926 Helix Energy Solutions Group Inc 12,131 0.02 277 Helmerich & Payne Inc 11,246 0.02
1,800 Hess Corporation 94,428 0.18 770 HollyFrontier Corp 20,189 0.04 611 Key Energy Services Inc 5,798 0.01 355 Linn Energy LLC 12,659 0.02
5,317 Marathon Oil Corp 114,741 0.22 2,658 Marathon Petroleum Corp 71,925 0.14 1,046 Murphy Oil Corp 46,191 0.09 1,687 Nabors Industries Ltd 20,683 0.04
971 National Oilwell Varco Inc 49,735 0.09 355 Newfield Exploration Co 14,090 0.03 937 Noble Corporation 27,501 0.05 424 Noble Energy Inc 30,019 0.06
2,339 Occidental Petroleum Corp 167,239 0.32 14 Ocean Rig UDW Inc 212 0.00
290 Oceaneering International Inc 10,249 0.02 193 Oil States International Inc 9,828 0.02 727 Oneok Inc 48,011 0.09 706 Patterson-UTI Energy Inc 12,242 0.02 582 Peabody Energy Corp 19,718 0.04 218 Pioneer Natural Resources Co 14,338 0.03 575 Plains Exploration & Production Co 13,058 0.02 527 QEP Resources Inc 14,266 0.03 239 Range Resources Corp 13,972 0.03 447 Rowan Cos Inc 13,495 0.03
2,661 Schlumberger Ltd 158,942 0.30 137 SEACOR Holdings Inc 10,989 0.02 116 SM Energy Co 7,035 0.01 514 Southwestern Energy Co 17,132 0.03

PowerShares Global Funds Ireland plc
Annual Report and Audited Financial Statements for the year ended 30 September 2011
176
Schedule of Investments
PowerShares FTSE RAFI US 1000 Fund (continued)
Nominal Security Description Fair Value USD
% of Net Assets
Energy (continued) 3,210 Spectra Energy Corporation 78,741 0.15 2,172 Sunoco Inc 67,354 0.13
245 Superior Energy Services Inc 6,429 0.01 444 Targa Resources Corp 13,209 0.03
2,258 Tesoro Corp 43,963 0.08 173 Ultra Petroleum Corp 4,796 0.01 211 Unit Corp 7,790 0.01
8,965 Valero Energy Corp 159,398 0.30 3,078 Weatherford International Ltd 37,582 0.07
751 Western Refining, Inc. 9,357 0.02 230 Whiting Petroleum Corp 8,068 0.02
2,614 Williams Cos Inc 63,625 0.12 Total Energy 5,698,854 10.79 Financial
1,878 ACE Ltd 113,807 0.22 654 AerCap Holdings NV 6,488 0.01 99 Affiliated Managers Group, Inc. 7,727 0.01
1,589 Aflac Inc 55,536 0.11 159 Alexandria Real Estate Equities Inc 9,761 0.02 24 Alleghany Corp 6,924 0.01
352 Allied World Assurance Co Holdings AG 18,906 0.04 5,571 Allstate Corp 131,977 0.25
369 Alterra Capital Holdings Ltd 7,000 0.01 5,203 American Express Co 233,615 0.45
400 American Financial Group Inc 12,428 0.02 967 American International Group Inc 21,226 0.04 837 Ameriprise Financial, Inc. 32,944 0.06
3,850 Annaly Capital Management Inc 64,026 0.12 923 Aon Corp 38,748 0.07
1,062 Apartment Investment & Management Co 23,491 0.04 965 Arch Capital Group Limited 31,531 0.06 472 Arthur J Gallagher & Co 12,414 0.02 596 Aspen Insurance Holdings Limited 13,732 0.03
1,486 Associated Banc-Corp 13,820 0.03 950 Assurant, Inc. 34,010 0.06 869 Astoria Financial Corporation 6,683 0.01 223 AvalonBay Communities, Inc. 25,433 0.05 854 Axis Capital Holdings Ltd 22,153 0.04 677 BancorpSouth Inc 5,944 0.01
105,678 Bank of America Corp 646,749 1.23 257 Bank of Hawaii Corp 9,355 0.02

PowerShares Global Funds Ireland plc
Annual Report and Audited Financial Statements for the year ended 30 September 2011
177
Schedule of Investments
PowerShares FTSE RAFI US 1000 Fund (continued)
Nominal Security Description Fair Value USD
% of Net Assets
Financial (continued) 5,780 Bank of New York Mellon Corp 107,450 0.20 5,011 BB&T Corp 106,885 0.20 8,708 Berkshire Hathaway Inc 618,616 1.18
559 BioMed Realty Trust Inc 9,263 0.02 242 BlackRock Inc 35,818 0.07 499 Boston Properties, Inc. 44,461 0.08
1,256 Brandywine Realty Trust 10,061 0.02 214 BRE Properties, Inc. 9,061 0.02 385 Brown & Brown Inc 6,853 0.01 274 Camden Property Trust 15,141 0.03
3,378 Capital One Financial Corp 133,870 0.25 2,781 CapitalSource Inc 17,075 0.03
719 CB Richard Ellis Group Inc 9,678 0.02 871 CBL & Associates Properties Inc 9,895 0.02
3,525 Charles Schwab Corp 39,727 0.08 2,232 Chimera Investment Corp 6,183 0.01 2,007 Chubb Corp 120,400 0.23 1,284 Cincinnati Financial Corp 33,808 0.06
829 CIT Group Inc 25,177 0.05 24,253 Citigroup Inc 621,362 1.19
237 City National Corp/CA 8,949 0.02 246 CME Group Inc 60,614 0.11
4,331 CNO Financial Group Inc 23,431 0.04 600 Colonial Properties Trust 10,896 0.02
1,273 Comerica Inc 29,241 0.06 352 Commerce Bancshares Inc/MO 12,232 0.02 622 CommonWealth REIT 11,799 0.02 253 Corporate Office Properties Trust 5,510 0.01 250 Cullen/Frost Bankers Inc 11,465 0.02
1,380 DCT Industrial Trust Inc 6,058 0.01 1,677 DDR Corp 18,279 0.03
264 Delphi Financial Group Inc 5,681 0.01 151 Digital Realty Trust Inc 8,329 0.02
2,770 Discover Financial Services 63,544 0.12 421 Douglas Emmett, Inc. 7,199 0.01
1,683 Duke Realty Corp 17,672 0.03 1,560 E*Trade Financial Corp 14,212 0.03
428 East West Bancorp Inc 6,381 0.01 334 Eaton Vance Corp 7,438 0.01 336 Endurance Specialty Holdings Ltd 11,474 0.02 188 Entertainment Properties Trust 7,328 0.01 968 Equity Residential 50,210 0.10

PowerShares Global Funds Ireland plc
Annual Report and Audited Financial Statements for the year ended 30 September 2011
178
Schedule of Investments
PowerShares FTSE RAFI US 1000 Fund (continued)
Nominal Security Description Fair Value USD
% of Net Assets
Financial (continued) 114 Erie Indemnity Company 8,115 0.02 87 Essex Property Trust Inc 10,443 0.02
380 Everest Re Group Ltd 30,164 0.06 174 Federal Realty Investment Trust 14,339 0.03 615 Federated Investors Inc 10,781 0.02
4,549 Fidelity National Financial Inc 69,054 0.13 5,434 Fifth Third Bancorp 54,883 0.10 2,226 First Horizon National Corporation 13,267 0.03 1,443 First Niagara Financial Group Inc 13,203 0.02
706 FirstMerit Corp 8,020 0.02 791 FNB Corp/PA 6,779 0.01 419 Franklin Resources Inc 40,073 0.08
1,199 Fulton Financial Corporation 9,172 0.02 1,117 General Growth Properties Inc 13,516 0.03 5,587 Genworth Financial, Inc. 32,069 0.06 2,641 Goldman Sachs Group Inc 249,707 0.48
489 Hancock Holding Co 13,095 0.02 310 Hanover Insurance Group Inc 11,005 0.02
5,279 Hartford Financial Services Group Inc 85,203 0.16 215 Hatteras Financial Corp 5,409 0.01 593 HCC Insurance Holdings Inc 16,041 0.03 949 HCP Inc 33,272 0.06 385 Health Care REIT Inc 18,018 0.03 236 Highwoods Properties, Inc. 6,669 0.01 158 Home Properties Inc 8,968 0.02
1,187 Hospitality Properties Trust 25,200 0.05 2,690 Host Hotels & Resorts, Inc. 29,429 0.06 3,439 Hudson City Bancorp, Inc. 19,465 0.04 5,443 Huntington Bancshares Inc 26,126 0.05
814 Interactive Brokers Group Inc 11,339 0.02 99 IntercontinentalExchange Inc 11,708 0.02
1,572 Invesco Limited * 24,382 0.05 2,141 iStar Financial Inc 12,461 0.02
388 Jefferies Group Inc 4,815 0.01 118 Jones Lang LaSalle Inc 6,114 0.01
24,966 JPMorgan Chase & Co 751,976 1.43 534 Kemper Corp 12,795 0.02
7,701 Keycorp 45,667 0.09 240 Kilroy Realty Corp 7,512 0.01
1,563 Kimco Realty Corporation 23,492 0.04 698 Knight Capital Group Inc 8,488 0.02 994 Legg Mason Inc 25,556 0.05

PowerShares Global Funds Ireland plc
Annual Report and Audited Financial Statements for the year ended 30 September 2011
179
Schedule of Investments
PowerShares FTSE RAFI US 1000 Fund (continued)
Nominal Security Description Fair Value USD
% of Net Assets
Financial (continued) 1,001 Lexington Realty Trust 6,547 0.01
673 Liberty Property Trust 19,591 0.04 2,270 Lincoln National Corp 35,480 0.07 2,563 Loews Corp 88,552 0.17
662 M&T Bank Corp 46,274 0.09 429 Macerich Company 18,288 0.03 460 Mack-Cali Realty Corporation 12,305 0.02 46 Markel Corp 16,428 0.03
2,274 Marsh & McLennan Cos Inc 60,352 0.11 951 MBIA Inc 6,914 0.01 194 Mercury General Corporation 7,440 0.01
3,635 MetLife Inc 101,816 0.19 1,684 MF Global Holdings Ltd 6,955 0.01 1,395 MFA Financial Inc 9,793 0.02 1,008 MGIC Investment Corp 1,885 0.00
680 Montpelier Re Holdings Limited 12,022 0.02 10,463 Morgan Stanley 141,251 0.27
935 NASDAQ OMX Group Inc 21,636 0.04 250 National Retail Properties Inc 6,718 0.01
2,386 New York Community Bancorp Inc 28,393 0.05 1,040 Northern Trust Corp 36,379 0.07 1,142 NYSE Euronext 26,540 0.05 2,097 Old Republic International Corp 18,705 0.04
463 PartnerRe Ltd 24,201 0.05 511 Pennsylvania Real Estate Investment Trust 3,950 0.01
1,995 People's United Financial Inc 22,743 0.04 3,198 Phoenix Cos Inc 3,902 0.01
430 Piedmont Office Realty Trust Inc 6,953 0.01 263 Platinum Underwriters Holdings Ltd 8,087 0.02 690 Plum Creek Timber Co Inc 23,950 0.05
2,847 PNC Financial Services Group Inc 137,197 0.26 9,064 Popular Inc 13,596 0.03
372 Potlatch Corp 11,725 0.02 530 Primerica Inc 11,427 0.02
1,747 Principal Financial Group Inc 39,604 0.07 159 ProAssurance Corp 11,451 0.02
3,613 Progressive Corp 64,167 0.12 2,148 ProLogis Inc 52,089 0.10
680 Protective Life Corp 10,628 0.02 2,785 Prudential Financial, Inc. 130,505 0.25
282 Public Storage 31,401 0.06 463 Raymond James Financial Inc 12,019 0.02

PowerShares Global Funds Ireland plc
Annual Report and Audited Financial Statements for the year ended 30 September 2011
180
Schedule of Investments
PowerShares FTSE RAFI US 1000 Fund (continued)
Nominal Security Description Fair Value USD
% of Net Assets
Financial (continued) 467 Rayonier Inc 17,181 0.03 277 Realty Income Corp 8,930 0.02 781 Redwood Trust Inc 8,724 0.02 343 Regency Centers Corporation 12,118 0.02
13,314 Regions Financial Corp 44,336 0.08 420 Reinsurance Group of America Inc 19,299 0.04 290 RenaissanceRe Holdings Ltd 18,502 0.04 139 RLI Corp 8,838 0.02 378 Selective Insurance Group Inc 4,933 0.01 422 Senior Housing Properties Trust 9,090 0.02 641 Simon Property Group, Inc. 70,497 0.13 287 SL Green Realty Corp 16,689 0.03
2,952 SLM Corp 36,752 0.07 338 StanCorp Financial Group Inc 9,319 0.02
2,358 State Street Corp 75,833 0.14 714 Sunstone Hotel Investors Inc 4,063 0.01
4,354 SunTrust Banks Inc 78,154 0.15 1,068 Susquehanna Bancshares Inc 5,842 0.01
165 SVB Financial Group 6,105 0.01 11,078 Synovus Financial Corp 11,853 0.02
520 T Rowe Price Group Inc 24,840 0.05 950 TCF Financial Corp 8,702 0.02
1,247 TD Ameritrade Holding Corp 18,337 0.03 645 Torchmark Corporation 22,485 0.04 453 Transatlantic Holdings Inc 21,980 0.04
4,089 Travelers Cos Inc 199,257 0.38 335 Trustmark Corp 6,080 0.01 623 UDR Inc 13,793 0.03 718 Umpqua Holdings Corp 6,311 0.01
2,124 Unum Group 44,519 0.08 10,372 US Bancorp 244,157 0.47
560 Validus Holdings Limited 13,955 0.03 1,010 Valley National Bancorp 10,696 0.02
666 Ventas Inc 32,900 0.06 623 Vornado Realty Trust 46,488 0.09 615 Washington Federal Inc 7,835 0.01 168 Washington Real Estate Investment Trust 4,734 0.01 466 Webster Financial Corp 7,130 0.01 584 Weingarten Realty Investors 12,363 0.02
26,534 Wells Fargo & Co 640,000 1.22 3,087 Weyerhaeuser Co 48,003 0.09
63 White Mountains Insurance Group Ltd 25,562 0.05

PowerShares Global Funds Ireland plc
Annual Report and Audited Financial Statements for the year ended 30 September 2011
181
Schedule of Investments
PowerShares FTSE RAFI US 1000 Fund (continued)
Nominal Security Description Fair Value USD
% of Net Assets
Financial (continued) 644 Willis Group Holdings Plc 22,134 0.04 956 WR Berkley Corp 28,384 0.05
2,535 XL Group Plc 47,658 0.09 1,542 Zions Bancorporation 21,696 0.04
Total Financial 9,209,860 17.44 Industrial
2,480 3M Co 178,039 0.34 154 Acuity Brands Inc 5,550 0.01 762 AECOM Technology Corp 13,465 0.03 511 AGCO Corp 17,665 0.03 728 Agilent Technologies, Inc. 22,750 0.04 249 Alexander & Baldwin Inc 9,096 0.02 252 Alliant Techsystems, Inc. 13,737 0.03 101 Amerco Inc 6,307 0.01 336 AMETEK Inc 11,078 0.02 309 Amphenol Corp 12,598 0.02 229 Aptargroup Inc 10,229 0.02
1,261 Arrow Electronics Inc 35,031 0.07 120 Atlas Air Worldwide Holdings Inc 3,995 0.01
1,602 Avnet Inc 41,780 0.08 721 Ball Corp 22,365 0.04 311 BE Aerospace Inc 10,297 0.02 636 Bemis Co Inc 18,641 0.04 585 Benchmark Electronics Inc 7,611 0.01
3,318 Boeing Co 200,772 0.38 225 Brady Corp 5,947 0.01 458 Briggs & Stratton Corp 6,188 0.01 334 Brink's Company 7,786 0.01 184 Bristow Group Inc 7,807 0.01 286 Carlisle Cos Inc 9,118 0.02
2,067 Caterpillar, Inc. 152,627 0.29 368 CH Robinson Worldwide Inc 25,197 0.05
1,384 Commercial Metals Co 13,162 0.02 442 Con-way Inc 9,781 0.02 559 Cooper Industries Plc 25,781 0.05 262 Crane Co 9,351 0.02 730 Crown Holdings Inc 22,345 0.04
3,599 CSX Corp 67,193 0.13 459 Cummins Inc 37,482 0.07 221 Curtiss-Wright Corp 6,371 0.01
1,496 Danaher Corporation 62,742 0.12

PowerShares Global Funds Ireland plc
Annual Report and Audited Financial Statements for the year ended 30 September 2011
182
Schedule of Investments
PowerShares FTSE RAFI US 1000 Fund (continued)
Nominal Security Description Fair Value USD
% of Net Assets
Industrial (continued) 1,253 Deere & Co 80,906 0.15
154 Donaldson Co Inc 8,439 0.02 700 Dover Corp 32,620 0.06
1,936 DryShips Inc 4,530 0.01 7,749 Eastman Kodak Co 6,045 0.01
665 Eaton Corp 23,608 0.04 598 EMCOR Group Inc 12,157 0.02
2,641 Emerson Electric Company 109,100 0.21 363 Energizer Holdings Inc 24,118 0.05 229 EnerSys 4,585 0.01 139 Esterline Technologies Corp 7,206 0.01 372 Expeditors International of Washington Inc 15,085 0.03
1,601 FedEx Corp 108,356 0.21 8,744 Flextronics International Ltd 49,229 0.09
227 FLIR Systems, Inc. 5,686 0.01 134 Flowserve Corp 9,916 0.02 705 Fluor Corporation 32,818 0.06 509 Foster Wheeler AG 9,055 0.02 106 Gardner Denver Inc 6,736 0.01 590 Garmin Ltd 18,744 0.04 362 GATX Corp 11,218 0.02 419 General Cable Corp 9,784 0.02
1,992 General Dynamics Corp 113,325 0.21 67,499 General Electric Co 1,028,684 1.96 3,570 General Maritime Corp 928 0.00
283 Gentex Corp 6,806 0.01 404 Goodrich Corp 48,755 0.09 329 Granite Construction Inc 6,175 0.01 164 Greif Inc 7,034 0.01 561 Harsco Corp 10,878 0.02
3,041 Honeywell International Inc 133,530 0.25 218 Hubbell Inc 10,800 0.02 355 Huntington Ingalls Industries Inc 8,637 0.02
2,049 Illinois Tool Works Inc 85,238 0.16 1,350 Ingersoll-Rand Plc 37,922 0.07
171 Itron, Inc. 5,045 0.01 728 ITT Corporation 30,576 0.06
1,476 Jabil Circuit Inc 26,258 0.05 753 Jacobs Engineering Group Inc 24,314 0.05 283 JB Hunt Transport Services Inc 10,222 0.02 193 Joy Global, Inc. 12,039 0.02 294 Kansas City Southern 14,688 0.03

PowerShares Global Funds Ireland plc
Annual Report and Audited Financial Statements for the year ended 30 September 2011
183
Schedule of Investments
PowerShares FTSE RAFI US 1000 Fund (continued)
Nominal Security Description Fair Value USD
% of Net Assets
Industrial (continued) 832 KBR Inc 19,660 0.04 319 Kennametal Inc 10,444 0.02 164 Kirby Corp 8,633 0.02 815 L-3 Communications Holdings Inc 50,506 0.10
1,065 Leggett & Platt Inc 21,076 0.04 238 Lennox International Inc 6,136 0.01 317 Lincoln Electric Holdings Inc 9,196 0.02
2,246 Lockheed Martin Corp 163,149 0.31 904 Louisiana-Pacific Corp 4,610 0.01 621 Manitowoc Co Inc 4,167 0.01 169 Martin Marietta Materials Inc 10,684 0.02
4,071 Masco Corp 28,986 0.05 1,042 McDermott International Inc 11,212 0.02
55 Mettler-Toledo International Inc 7,698 0.01 290 Molex Inc 5,907 0.01 350 Molex Inc A 5,908 0.01 235 Mueller Industries Inc 9,069 0.02 581 Nalco Holding Co 20,323 0.04
1,558 Norfolk Southern Corp 95,069 0.18 2,183 Northrop Grumman Corp 113,865 0.22
424 Overseas Shipholding Group Inc 5,826 0.01 810 Owens Corning 17,561 0.03
1,283 Owens-Illinois Inc 19,399 0.04 418 Packaging Corp of America 9,739 0.02 269 Pall Corp 11,406 0.02 567 Parker Hannifin Corp 35,795 0.07 468 Pentair Inc 14,981 0.03 430 PerkinElmer Inc 8,260 0.02 261 Precision Castparts Corp 40,575 0.08
2,341 Raytheon Co 95,677 0.18 125 Regal-Beloit Corp 5,673 0.01
1,562 Republic Services Inc 43,830 0.08 241 Rock-Tenn Co 11,732 0.02 347 Rockwell Automation Inc 19,432 0.04 434 Rockwell Collins Inc 22,898 0.04 203 Roper Industries Inc 13,989 0.03 594 Ryder System, Inc. 22,281 0.04
1,366 Sanmina-SCI Corp 9,125 0.02 899 Sealed Air Corp 15,013 0.03 549 Shaw Group Inc 11,935 0.02 435 Ship Finance International Ltd 5,655 0.01 230 Silgan Holdings Inc 8,450 0.02

PowerShares Global Funds Ireland plc
Annual Report and Audited Financial Statements for the year ended 30 September 2011
184
Schedule of Investments
PowerShares FTSE RAFI US 1000 Fund (continued)
Nominal Security Description Fair Value USD
% of Net Assets
Industrial (continued) 255 Snap-on Inc 11,322 0.02 577 Sonoco Products Co 16,289 0.03 534 Spirit Aerosystems Holdings Inc 8,517 0.02 261 SPX Corp 11,826 0.02 547 Stanley Black & Decker Inc 26,858 0.05 94 Stericycle Inc 7,588 0.01
1,953 TE Connectivity Ltd 54,957 0.10 1,178 Tech Data Corp 50,925 0.10
447 Teekay Corp 10,107 0.02 164 Teledyne Technologies Inc 8,013 0.02
1,392 Temple-Inland Inc 43,667 0.08 850 Terex Corp 8,721 0.02
1,872 Textron, Inc. 33,022 0.06 1,528 Thermo Fisher Scientific Inc 77,378 0.15
246 Thomas & Betts Corp 9,818 0.02 240 Tidewater Inc 10,092 0.02 424 Timken Co 13,916 0.03 180 Trimble Navigation Ltd 6,039 0.01 514 Trinity Industries Inc 11,005 0.02 471 Tutor Perini Corp 5,412 0.01
2,776 Tyco International Ltd 113,122 0.21 1,441 Union Pacific Corp 117,686 0.22 2,623 United Parcel Service Inc 165,642 0.31 3,561 United Technologies Corporation 250,551 0.47
689 URS Corp 20,436 0.04 705 USG Corp 4,745 0.01 494 UTi Worldwide Inc 6,442 0.01 741 Vishay Intertechnology Inc 6,195 0.01 349 Waste Connections Inc 11,803 0.02
2,735 Waste Management Inc 89,052 0.17 152 Waters Corporation 11,474 0.02 371 Werner Enterprises Inc 7,728 0.01 565 Worthington Industries Inc 7,893 0.01
8,557 YRC Worldwide Inc 419 0.00 Total Industrial 5,615,869 10.63 Technology
1,691 Accenture Plc 89,082 0.17 2,108 Activision Blizzard, Inc. 25,085 0.05 1,154 Adobe Systems Inc 27,892 0.05 2,493 Advanced Micro Devices Inc 12,664 0.02
371 Altera Corp 11,698 0.02

PowerShares Global Funds Ireland plc
Annual Report and Audited Financial Statements for the year ended 30 September 2011
185
Schedule of Investments
PowerShares FTSE RAFI US 1000 Fund (continued)
Nominal Security Description Fair Value USD
% of Net Assets
Technology (continued) 1,388 Amkor Technology Inc 6,052 0.01
853 Analog Devices, Inc. 26,656 0.05 1,047 Apple Inc 399,095 0.76 4,206 Applied Materials, Inc. 43,532 0.08
550 Atmel Corp 4,439 0.01 211 Autodesk Inc 5,862 0.01 276 Avago Technologies Ltd 9,045 0.02 307 BMC Software, Inc. 11,838 0.02 539 Broadcom Corp 17,943 0.03 447 Broadridge Financial Solutions Inc 9,003 0.02
2,212 Brocade Communications Systems Inc 9,556 0.02 1,052 CA Inc 20,419 0.04
200 CACI International Inc 9,988 0.02 262 Cerner Corp 17,952 0.03 328 Check Point Software Technologies Ltd 17,305 0.03 232 Citrix Systems Inc 12,651 0.02 251 Cognizant Technology Solutions Corp 15,738 0.03
1,762 Computer Sciences Corporation 47,310 0.09 740 Compuware Corp 5,668 0.01 178 Cree, Inc. 4,624 0.01
12,235 Dell Inc 173,125 0.33 383 Diebold, Inc. 10,536 0.02 261 DST Systems Inc 11,440 0.02 118 Dun & Bradstreet Corp 7,229 0.01 873 Electronic Arts Inc 17,853 0.03
4,142 EMC Corp/Massachusetts 86,941 0.16 1,419 Fidelity National Information Services Inc 34,510 0.07
515 Fiserv Inc 26,147 0.05 10,751 Hewlett-Packard Co 241,360 0.46
686 Insight Enterprises Inc 10,386 0.02 23,441 Intel Corp 499,997 0.95 3,510 International Business Machines Corp 614,354 1.16
624 Intersil Corp 6,421 0.01 524 Intuit Inc 24,859 0.05 378 KLA-Tencor Corp 14,470 0.03 288 Lam Research Corp 10,938 0.02 534 Lexmark International Inc 14,434 0.03 537 Linear Technology Corp 14,848 0.03
2,025 LSI Corp 10,490 0.02 1,334 Marvell Technology Group Ltd 19,383 0.04
954 Maxim Integrated Products Inc 22,257 0.04 1,283 MEMC Electronic Materials Inc 6,723 0.01

PowerShares Global Funds Ireland plc
Annual Report and Audited Financial Statements for the year ended 30 September 2011
186
Schedule of Investments
PowerShares FTSE RAFI US 1000 Fund (continued)
Nominal Security Description Fair Value USD
% of Net Assets
Technology (continued) 606 Microchip Technology Inc 18,853 0.04
5,756 Micron Technology Inc 29,010 0.05 26,006 Microsoft Corporation 647,288 1.24
290 MSCI Inc 8,796 0.02 933 NCR Corp 15,758 0.03 391 NetApp Inc 13,271 0.03 247 Novellus Systems, Inc. 6,733 0.01 449 Nuance Communications Inc 9,142 0.02 946 NVIDIA Corp 11,825 0.02
1,008 ON Semiconductor Corp 7,227 0.01 6,579 Oracle Corp 189,080 0.36 1,683 Pitney Bowes Inc 31,640 0.06
706 SanDisk Corp 28,487 0.05 3,990 Seagate Technology Plc 41,017 0.08
225 Skyworks Solutions Inc 4,037 0.01 476 Synopsys Inc 11,595 0.02 226 Teradata Corp 12,098 0.02 489 Teradyne Inc 5,384 0.01
3,324 Texas Instruments Inc 88,585 0.17 447 Unisys Corp 7,013 0.01
1,504 Western Digital Corp 38,683 0.07 8,046 Xerox Corp 56,081 0.11
652 Xilinx Inc 17,891 0.03 Total Technology 4,039,292 7.65 Utilities
7,865 AES Corp 76,762 0.15 551 AGL Resources Inc 22,448 0.04 215 Allete Inc 7,875 0.01 716 Alliant Energy Corp 27,695 0.05
2,946 Ameren Corp 87,702 0.17 3,705 American Electric Power Co Inc 140,864 0.27
908 American Water Works Co Inc 27,403 0.05 471 Aqua America Inc 10,159 0.02 801 Atmos Energy Corp 25,992 0.05 386 Avista Corp 9,206 0.02 300 Black Hills Corp 9,192 0.02
2,504 Calpine Corporation 35,256 0.07 3,334 CenterPoint Energy Inc 65,413 0.12
295 Cleco Corp 10,071 0.02 1,586 CMS Energy Corp 31,387 0.06 2,163 Consolidated Edison Inc 123,334 0.23

PowerShares Global Funds Ireland plc
Annual Report and Audited Financial Statements for the year ended 30 September 2011
187
Schedule of Investments
PowerShares FTSE RAFI US 1000 Fund (continued)
Nominal Security Description Fair Value USD
% of Net Assets
Utilities (continued) 2,775 Constellation Energy Group Inc 105,617 0.20 3,432 Dominion Resources Inc/VA 174,243 0.33
518 DPL Inc 15,613 0.03 1,508 DTE Energy Co 73,922 0.14
10,827 Duke Energy Corp 216,433 0.40 3,869 Dynegy Inc 15,940 0.03 2,785 Edison International 106,526 0.20 1,454 Entergy Corp 96,386 0.18 4,774 Exelon Corp 203,420 0.39 3,210 FirstEnergy Corp 144,161 0.27 9,146 GenOn Energy Inc 25,426 0.05 1,255 Great Plains Energy Inc 24,222 0.05
732 Hawaiian Electric Industries Inc 17,773 0.03 294 IDACORP Inc 11,107 0.02 745 Integrys Energy Group Inc 36,222 0.07 117 ITC Holdings Corp 9,059 0.02
1,281 MDU Resources Group Inc 24,582 0.05 272 National Fuel Gas Co 13,241 0.03 290 New Jersey Resources Corp 12,345 0.02
2,699 NextEra Energy Inc 145,800 0.28 318 Nicor Inc 17,493 0.03
2,875 NiSource Inc 61,468 0.12 1,068 Northeast Utilities 35,938 0.07
300 NorthWestern Corp 9,582 0.02 3,234 NRG Energy Inc 68,593 0.13
609 NSTAR 27,289 0.05 1,623 NV Energy Inc 23,874 0.05
543 OGE Energy Corp 25,950 0.05 2,681 Pepco Holdings Inc 50,725 0.10 2,559 PG&E Corp 108,271 0.20
437 Piedmont Natural Gas Co Inc 12,625 0.02 833 Pinnacle West Capital Corp 35,769 0.07
1,035 PNM Resources Inc 17,005 0.03 577 Portland General Electric Company 13,669 0.03
2,990 PPL Corp 85,335 0.16 2,292 Progress Energy Inc 118,542 0.22 3,499 Public Service Enterprise Group Inc 116,762 0.22 1,746 Questar Corp 30,922 0.06
932 SCANA Corp 37,699 0.07 1,543 Sempra Energy 79,465 0.15 4,943 Southern Co 209,436 0.39
646 Southern Union Co 26,208 0.05

PowerShares Global Funds Ireland plc
Annual Report and Audited Financial Statements for the year ended 30 September 2011
188
Schedule of Investments
PowerShares FTSE RAFI US 1000 Fund (continued)
Nominal Security Description Fair Value USD
% of Net Assets
Utilities (continued) 307 Southwest Gas Corp 11,104 0.02
1,474 TECO Energy Inc 25,250 0.05 785 UGI Corp 20,622 0.04 272 Unisource Energy Corp 9,816 0.02 664 Vectren Corp 17,981 0.03 780 Westar Energy Inc 20,608 0.04 380 WGL Holdings Inc 14,847 0.03 550 Wisconsin Energy Corp 17,210 0.03
3,374 Xcel Energy Inc 83,304 0.16 Total Utilities 3,616,159 6.85
Portfolio of Investments 52,755,942 99.87
Current Assets 339,641 0.64
Total Assets 53,095,583 100.51
Current Liabilities (271,720) (0.51)
Net Assets attributable to Holders of Redeemable Participating Shares 52,823,863 100.00

PowerShares Global Funds Ireland plc
Annual Report and Audited Financial Statements for the year ended 30 September 2011
189
Schedule of Investments
PowerShares Global Clean Energy Fund
Nominal Security Description Fair Value EUR
% of Net Assets
Bermuda 1,516,000 Apollo Solar Energy Technology Holdings Ltd 44,269 0.82
976,625 China WindPower Group Ltd 35,064 0.66 Total Bermuda 79,333 1.48 Brazil
268,256 Brasil Ecodiesel Industria e Comercio de Biocombustiveis e Oleos Vegetais SA
62,472
1.17
6,768 Cosan SA Industria e Comercio 65,220 1.22 2,229 Sao Martinho SA 17,900 0.33
Total Brazil 145,592 2.72 Canada
4,684 Brookfield Renewable Power Fund 86,737 1.62 3,733 Innergex Renewable Energy Inc 24,965 0.47
Total Canada 111,702 2.09 Cayman Islands
266,063 China High Speed Transmission Equipment Group Co Ltd
91,704
1.72
12,212 China Ming Yang Wind Power Group Ltd 24,120 0.45 520,298 GCL-Poly Energy Holdings Ltd 103,114 1.93 18,811 JA Solar Holdings Co Ltd 24,956 0.47
199,794 Neo-Neon Holdings Ltd 23,337 0.44 50,608 Suntech Power Holdings Co Ltd 87,132 1.63 5,476 Trina Solar Ltd 24,815 0.46
236,000 Trony Solar Holdings Co Ltd 29,599 0.55 109,998 Wasion Group Holdings Ltd 24,012 0.45 40,748 Yingli Green Energy Holding Co Ltd 94,148 1.76
Total Cayman Islands 526,937 9.86 China
48,515 Byd Co Ltd 61,220 1.15 835,000 China Datang Corp Renewable Power Co Ltd 95,133 1.78 165,979 China Longyuan Power Group Corp 103,134 1.93 632,000 China Suntien Green Energy Corp Ltd 87,737 1.64 562,000 Huaneng Renewables Corp Ltd 98,466 1.84 266,600 Xinjiang Goldwind Science & Technology Co Ltd 96,228 1.80
Total China 541,918 10.14 Denmark
620 Novozymes A/S 66,198 1.24 1,303 Rockwool International AS 86,327 1.62

PowerShares Global Funds Ireland plc
Annual Report and Audited Financial Statements for the year ended 30 September 2011
190
Schedule of Investments
PowerShares Global Clean Energy Fund (continued)
Nominal Security Description Fair Value EUR
% of Net Assets
Denmark (continued) 7,920 Vestas Wind Systems A/S 96,642 1.80
Total Denmark 249,167 4.66 Euro Countries
4,294 Abengoa SA 68,747 1.29 1,483 Acciona SA 94,393 1.77 1,639 Centrotherm Photovoltaics AG 25,519 0.48
22,239 EDP Renovaveis SA 90,958 1.70 51,975 Enel Green Power SpA 89,241 1.67 3,736 Fortum OYJ 66,127 1.24
29,104 Gamesa Corp Tecnologica SA 98,459 1.84 13,098 Kingspan Group Plc 81,863 1.53 7,070 Nordex SE 26,315 0.49
57,017 Q-Cells SE 33,640 0.63 1,371 Roth & Rau AG 30,162 0.56 2,530 Saft Groupe SA 51,106 0.96 1,481 Sechilienne-Sidec 18,735 0.35 2,349 SMA Solar Technology AG 92,480 1.73
32,383 Solarworld AG 101,358 1.90 4,137 Verbund AG 89,669 1.68
Total Euro Countries 1,058,772 19.82 Germany
6,643 Elster Group SE 74,020 1.38 Total Germany 74,020 1.38 Japan
15,093 GS Yuasa Corporation 53,123 0.99 30,108 Meidensha Corporation 85,010 1.60 4,766 NPC Inc/Japan 31,706 0.59 6,625 Takuma Company Limited 20,691 0.39 3,573 Tanaka Chemical Corporation 18,760 0.35
Total Japan 209,290 3.92 New Zealand
28,198 Contact Energy Limited 87,555 1.64 Total New Zealand 87,555 1.64 Norway
132,989 Renewable Energy Corp ASA 88,382 1.65 Total Norway 88,382 1.65

PowerShares Global Funds Ireland plc
Annual Report and Audited Financial Statements for the year ended 30 September 2011
191
Schedule of Investments
PowerShares Global Clean Energy Fund (continued)
Nominal Security Description Fair Value EUR
% of Net Assets
Philippines 969,466 Energy Development Corp/Philippines 93,368 1.75
Total Philippines 93,368 1.75 Switzerland
80 Gurit Holding AG 26,160 0.49 5,549 Meyer Burger Technology AG 106,548 1.99
Total Switzerland 132,708 2.48 Taiwan
61,157 Epistar Corp 80,918 1.51 48,877 Neo Solar Power Corp 34,666 0.65
Total Taiwan 115,584 2.16 United Kingdom
22,017 PV Crystalox Solar Plc 3,323 0.06 Total United Kingdom 3,323 0.06 United States
4,994 A123 Systems Inc 12,804 0.24 1,034 Aerovironment Inc 21,694 0.41 2,885 Ameresco Inc 21,847 0.41 7,547 American Superconductor Corp 22,106 0.41 4,430 Amyris Inc 66,828 1.25 3,058 AO Smith Corp 73,003 1.37 5,766 Covanta Holding Corporation 65,280 1.22 3,615 Cree, Inc. 69,999 1.31 3,878 Echelon Corp 20,261 0.38 2,838 EnerNOC Inc 19,037 0.36 1,983 First Solar, Inc. 93,423 1.75
841 Fuel Systems Solutions Inc 12,041 0.23 15,523 FuelCell Energy Inc 9,717 0.18 3,706 Gevo Inc 15,385 0.29
18,565 GT Advanced Technologies Inc 97,135 1.81 5,159 International Rectifier Corporation 71,596 1.34 3,073 Itron, Inc. 67,566 1.26 3,817 Johnson Controls Inc 75,020 1.40 4,935 KiOR Inc 76,285 1.43 3,661 LSB Industries Inc 78,230 1.46 1,015 Maxwell Technologies, Inc. 13,927 0.26
23,941 MEMC Electronic Materials Inc 93,501 1.75 1,588 Molycorp Inc 38,904 0.73 7,052 Ormat Technologies, Inc. 84,517 1.58
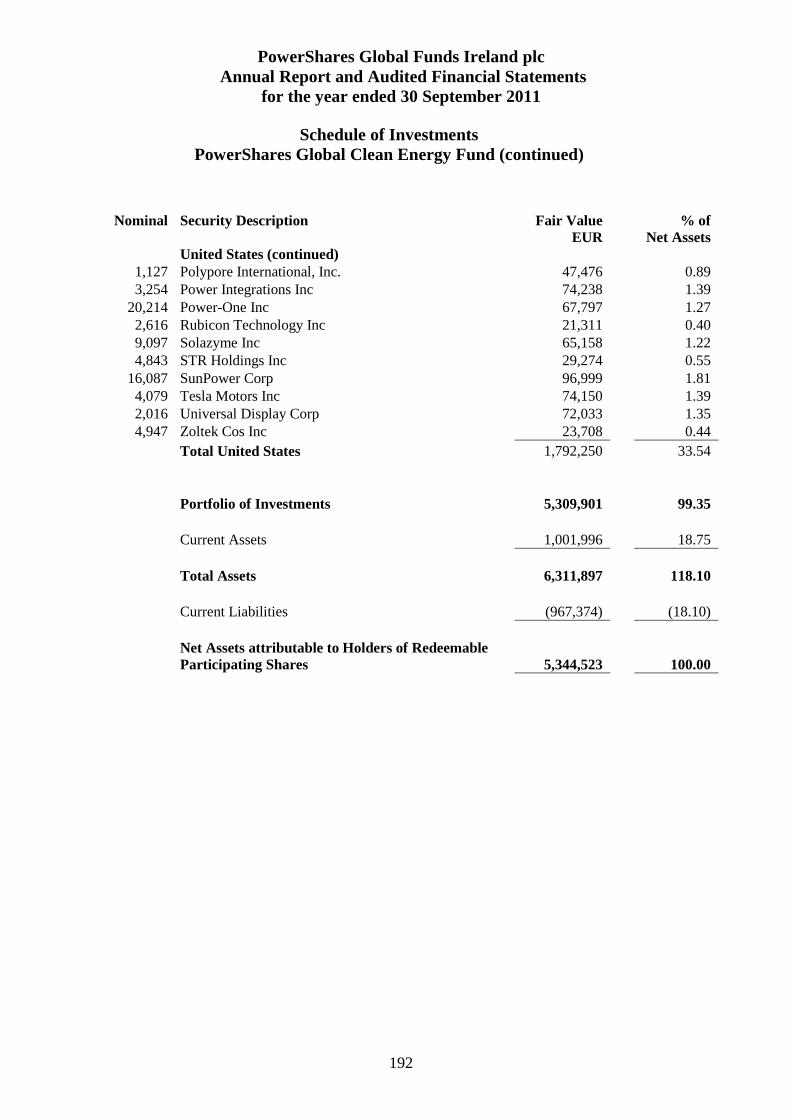
PowerShares Global Funds Ireland plc
Annual Report and Audited Financial Statements for the year ended 30 September 2011
192
Schedule of Investments
PowerShares Global Clean Energy Fund (continued)
Nominal Security Description Fair Value EUR
% of Net Assets
United States (continued) 1,127 Polypore International, Inc. 47,476 0.89 3,254 Power Integrations Inc 74,238 1.39
20,214 Power-One Inc 67,797 1.27 2,616 Rubicon Technology Inc 21,311 0.40 9,097 Solazyme Inc 65,158 1.22 4,843 STR Holdings Inc 29,274 0.55
16,087 SunPower Corp 96,999 1.81 4,079 Tesla Motors Inc 74,150 1.39 2,016 Universal Display Corp 72,033 1.35 4,947 Zoltek Cos Inc 23,708 0.44
Total United States 1,792,250 33.54
Portfolio of Investments 5,309,901 99.35
Current Assets 1,001,996 18.75
Total Assets 6,311,897 118.10
Current Liabilities (967,374) (18.10)
Net Assets attributable to Holders of Redeemable Participating Shares 5,344,523 100.00

PowerShares Global Funds Ireland plc
Annual Report and Audited Financial Statements for the year ended 30 September 2011
193
Schedule of Investments
PowerShares Dynamic US Market Fund
Nominal Security Description Fair Value USD
% of Net Assets
Basic Materials 2,337 CF Industries Holdings Inc 288,363 2.29 6,856 Mercer International Inc 46,621 0.37 2,015 TPC Group Inc 40,461 0.32 1,621 WR Grace & Co 53,979 0.43
Total Basic Materials 429,424 3.41 Communications
4,653 AT&T, Inc. 132,704 1.05 3,909 CenturyLink Inc 129,466 1.03 6,873 DIRECTV 290,385 2.32 1,386 Global Crossing Ltd 33,139 0.26 1,815 IAC/InterActiveCorp 71,783 0.57 3,564 MetroPCS Communications Inc 31,042 0.25 7,221 PAETEC Holding Corp 38,199 0.30 7,507 TeleNav Inc 66,587 0.53
Total Communications 793,305 6.31 Consumer, Cyclical
975 Alaska Air Group Inc 54,883 0.44 2,585 Bravo Brio Restaurant Group Inc 43,014 0.34 1,091 Dillard's Inc 47,437 0.38
28,094 Ford Motor Co 271,669 2.16 2,258 GNC Holdings Inc 45,431 0.36 3,249 McDonald's Corp 285,327 2.26 1,342 Penn National Gaming Inc 44,675 0.36
902 Tempur-Pedic International Inc 47,454 0.38 1,046 Visteon Corp 44,978 0.36
14,653 Walgreen Co 481,937 3.82 9,991 Wet Seal Inc 44,760 0.36 2,082 Wynn Resorts Ltd 239,597 1.90
Total Consumer, Cyclical 1,651,162 13.12 Consumer, Non-cyclical
772 Alliance Data Systems Corp 71,564 0.57 7,006 AmerisourceBergen Corporation 261,114 2.08 1,955 Amsurg Corp 43,988 0.35 4,576 Avis Budget Group, Inc. 44,250 0.35 4,208 B&G Foods Inc 70,189 0.56 2,304 Bridgepoint Education Inc 40,182 0.32 2,922 Cardtronics Inc 66,972 0.53 1,368 Centene Corp 39,221 0.31 2,138 Community Health Systems Inc 35,576 0.28

PowerShares Global Funds Ireland plc
Annual Report and Audited Financial Statements for the year ended 30 September 2011
194
Schedule of Investments
PowerShares Dynamic US Market Fund (continued)
Nominal Security Description Fair Value USD
% of Net Assets
Consumer, Non-cyclical (continued) 848 Hansen Natural Corp 74,022 0.59
3,506 Heartland Payment Systems Inc 69,138 0.55 1,328 Herbalife Ltd 71,181 0.57 3,678 Humana Inc 267,501 2.13 1,803 Huron Consulting Group Inc 56,127 0.45 2,248 Insperity Inc 50,018 0.40
706 ITT Educational Services Inc 40,651 0.32 1,104 Jazz Pharmaceuticals Inc 45,838 0.36 3,760 Kelly Services Inc 42,864 0.34
622 Kinetic Concepts Inc 40,984 0.33 3,185 Kroger Co 69,943 0.56 1,855 Luminex Corp 41,125 0.33 1,094 Mastercard Inc 346,972 2.75 2,289 Molina Healthcare Inc 35,342 0.28 2,527 Momenta Pharmaceuticals Inc 29,061 0.23 7,308 Philip Morris International Inc 455,872 3.61 5,896 UnitedHealth Group Inc 271,924 2.16 4,106 Watson Pharmaceuticals, Inc. 280,234 2.23
955 WellCare Health Plans Inc 36,271 0.29 1,176 Whole Foods Market Inc 76,805 0.61
10,852 Winn-Dixie Stores, Inc. 64,244 0.51 Total Consumer, Non-cyclical 3,139,173 24.95 Diversified
5,265 Primoris Services Corp 55,072 0.44 Total Diversified 55,072 0.44 Energy
4,811 CVR Energy Inc 101,705 0.81 3,688 HollyFrontier Corp 96,699 0.77
23,602 Marathon Oil Corp 509,331 4.05 5,903 Tesoro Corp 114,931 0.91
29,279 Valero Energy Corp 520,581 4.14 7,604 Western Refining, Inc. 94,746 0.75
Total Energy 1,437,993 11.43 Financial
5,746 Aflac Inc 200,823 1.60 4,512 American Equity Investment Life Holding Co 39,480 0.31 1,360 American Financial Group Inc/OH 42,255 0.34 1,915 Amtrust Financial Services Inc 42,628 0.34 4,617 Capital One Financial Corp 182,972 1.45

PowerShares Global Funds Ireland plc
Annual Report and Audited Financial Statements for the year ended 30 September 2011
195
Schedule of Investments
PowerShares Dynamic US Market Fund (continued)
Nominal Security Description Fair Value USD
% of Net Assets
Financial (continued) 7,194 CNO Financial Group Inc 38,920 0.31
878 Cullen Frost Bankers Inc 40,265 0.32 8,238 Discover Financial Services 188,980 1.50 1,539 FBL Financial Group Inc 40,968 0.33
10,587 Lincoln National Corp 165,475 1.32 8,628 Principal Financial Group Inc 195,597 1.55
625 ProAssurance Corp 45,013 0.36 2,443 Protective Life Corp 38,184 0.30 4,294 Prudential Financial, Inc. 201,216 1.59
991 SVB Financial Group 36,667 0.29 4,176 Symetra Financial Corp 34,034 0.27 1,100 WP Carey & Co LLC 40,073 0.32 2,662 Zions Bancorporation 37,454 0.30
Total Financial 1,611,004 12.80 Industrial
4,509 Deere & Co 291,146 2.31 1,906 KBR Inc 45,039 0.36 5,306 L-3 Communications Holdings Inc 328,814 2.61 5,260 Norfolk Southern Corp 320,965 2.55 1,538 Sturm Ruger & Co Inc 39,957 0.32 1,543 Tech Data Corp 66,704 0.53 1,602 URS Corp 47,515 0.38 6,365 Vishay Intertechnology Inc 53,211 0.42
Total Industrial 1,193,351 9.48 Technology
6,909 Accenture Plc 363,966 2.89 2,400 Allscripts Healthcare Solutions Inc 43,248 0.34 7,829 Cadence Design Systems Inc 72,340 0.57
631 Computer Programs & Systems Inc 41,741 0.33 24,267 Dell Inc 343,378 2.73 6,035 GT Advanced Technologies Inc 42,366 0.34 8,028 Kulicke & Soffa Industries Inc 59,889 0.48
10,188 LSI Corp 52,774 0.42 7,324 Teradata Corp 392,053 3.12
12,601 Western Digital Corp 324,098 2.58 Total Technology 1,735,853 13.80 Utilities
3,055 Avista Corp 72,862 0.58 18,999 Duke Energy Corp 379,789 3.02

PowerShares Global Funds Ireland plc
Annual Report and Audited Financial Statements for the year ended 30 September 2011
196
Schedule of Investments
PowerShares Dynamic US Market Fund (continued)
Nominal Security Description Fair Value USD
% of Net Assets
Utilities (continued) 3,211 Portland General Electric Company 76,069 0.60
Total Utilities 528,720 4.20
Portfolio of Investments 12,575,057 99.94
Current Assets 38,460 0.31
Total Assets 12,613,517 100.25
Current Liabilities (31,441) (0.25)
Net Assets attributable to Holders of Redeemable Participating Shares 12,582,076 100.00

PowerShares Global Funds Ireland plc
Annual Report and Audited Financial Statements for the year ended 30 September 2011
197
Schedule of Investments
PowerShares FTSE RAFI Europe Fund
Nominal Security Description Fair Value EUR
% of Net Assets
Bermuda 757 Catlin Group Limited 3,278 0.05 185 Frontline Ltd/Bermuda 670 0.01 652 Hiscox Limited 2,793 0.04 105 Seadrill Ltd 2,191 0.03
Total Bermuda 8,932 0.13 Denmark
3 AP Moller - Maersk A/S B Shares 13,272 0.19 1 AP Moller - Maersk A/S A Shares 4,222 0.06
113 Carlsberg A/S 5,023 0.07 1,726 Danske Bank A/S 18,220 0.26
173 DSV A/S 2,343 0.03 41 FLSmidth & Co A/S 1,546 0.02
107 Jyske Bank A/S 2,383 0.03 140 Novo Nordisk A/S 10,461 0.15 290 Vestas Wind Systems A/S 3,539 0.05
Total Denmark 61,009 0.86 Euro Countries
4,134 A2A SpA 3,871 0.05 456 Abertis Infraestructuras SA 5,290 0.07 67 Acciona SA 4,265 0.06
364 Accor SA 7,335 0.10 401 Acerinox SA 3,398 0.05 447 ACS Actividades de Construccion y Servicios SA 11,886 0.17 214 Adidas AG 9,796 0.14
6,927 Aegon NV 21,224 0.30 9,797 Ageas 12,873 0.18
854 AGFA-Gevaert NV 1,674 0.02 789 Air France-KLM 4,374 0.06 256 Air Liquide SA 22,523 0.32 383 Akzo Nobel NV 12,763 0.18
3,492 Alcatel-Lucent/France 7,668 0.11 1,126 Allianz SE 79,788 1.13 1,977 Alpha Bank AE 2,629 0.04
373 Alstom SA 9,278 0.13 529 Anheuser-Busch InBev NV 21,041 0.30 182 APERAM 1,998 0.03
2,284 ArcelorMittal 27,591 0.39 91 Arkema SA 4,004 0.06
172 ASML Holding NV 4,486 0.06 3,740 Assicurazioni Generali SpA 44,656 0.63

PowerShares Global Funds Ireland plc
Annual Report and Audited Financial Statements for the year ended 30 September 2011
198
Schedule of Investments
PowerShares FTSE RAFI Europe Fund (continued)
Nominal Security Description Fair Value EUR
% of Net Assets
Euro Countries (continued) 557 Atlantia SpA 6,027 0.09 103 Atos Origin SA 3,356 0.05 127 Aurubis AG 4,850 0.07
7,141 AXA SA 70,696 1.00 1,434 Banca Carige SpA 2,085 0.03
12,715 Banca Monte dei Paschi di Siena SpA 5,329 0.08 797 Banca Piccolo Credito Valtellinese Scarl 1,785 0.03 688 Banca Popolare dell'Emilia Romagna Scrl 5,043 0.07
2,212 Banca Popolare di Milano Scarl 4,136 0.06 497 Banca Popolare di Sondrio Scarl 2,719 0.04
9,567 Banco Bilbao Vizcaya Argentaria SA 59,124 0.84 9,567 Banco Bilbao Vizcaya Argentaria SA RTS 1,052 0.01
12,702 Banco Comercial Portugues SA 2,477 0.04 3,852 Banco de Sabadell SA 10,343 0.15 6,267 Banco Popolare SC 7,834 0.11 3,452 Banco Popular Espanol SA 12,013 0.17
18,669 Banco Santander SA 116,195 1.65 846 Bankinter SA 3,464 0.05
1,292 BASF SE 59,542 0.84 907 Bayer AG 37,595 0.53 514 Bayerische Motoren Werke AG 25,682 0.36 66 Beiersdorf AG 2,648 0.04 31 Bekaert SA 957 0.01
352 Belgacom SA 7,976 0.11 73 Bilfinger Berger SE 4,143 0.06
1,949 BNP Paribas 58,567 0.83 81 Bourbon SA 1,394 0.02
705 Bouygues SA 17,579 0.25 656 Brisa Auto-Estradas de Portugal SA 1,744 0.02 249 Buzzi Unicem SpA 1,519 0.02
1,588 CaixaBank 5,271 0.07 1,588 CaixaBank RTS 97 0.00
234 Cap Gemini SA 5,875 0.08 1,665 Carrefour SA 28,538 0.40
122 Casino Guichard Perrachon SA 7,166 0.10 327 Celesio AG 3,237 0.05 90 Christian Dior SA 7,610 0.11
1,035 Cie de St-Gobain 29,880 0.42 206 Cie Generale de Geophysique - Veritas 2,780 0.04 222 Cie Generale des Etablissements Michelin 10,037 0.14 123 Cie Generale d'Optique Essilor International SA 6,641 0.09 617 CNP Assurances 6,821 0.10

PowerShares Global Funds Ireland plc
Annual Report and Audited Financial Statements for the year ended 30 September 2011
199
Schedule of Investments
PowerShares FTSE RAFI Europe Fund (continued)
Nominal Security Description Fair Value EUR
% of Net Assets
Euro Countries (continued) 160 Coca Cola Hellenic Bottling Co SA 2,115 0.03 67 Colruyt SA 2,094 0.03
3,151 Commerzbank AG 5,984 0.08 115 Continental AG 5,019 0.07 90 Corio NV 3,127 0.04
2,679 Credit Agricole SA 14,011 0.20 1,423 CRH Plc 16,571 0.23
112 CSM 1,669 0.02 2,055 Daimler AG 69,110 0.98
162 DCC Plc 3,042 0.04 281 Delhaize Group SA 12,339 0.17 526 Delta Lloyd NV 6,286 0.09
1,816 Deutsche Bank AG 47,797 0.68 750 Deutsche Lufthansa AG 7,317 0.10
2,653 Deutsche Post AG 25,535 0.36 10,658 Deutsche Telekom AG 94,120 1.34 5,056 Dexia SA 7,316 0.10
49 D'ieteren SA/NV 1,838 0.03 1,693 Distribuidora Internacional de Alimentacion SA 5,032 0.07
75 Douglas Holding AG 2,214 0.03 5,104 E.ON AG 83,476 1.18
165 Ebro Foods SA 2,119 0.03 468 EDF SA 10,207 0.14
6,191 EDP - Energias de Portugal SA 14,332 0.20 1,720 EFG Eurobank Ergasias SA 1,600 0.02
171 Eiffage SA 3,982 0.06 286 Elisa OYJ 4,396 0.06 224 Enagas SA 3,093 0.04 270 Endesa SA 4,706 0.07
19,055 Enel SpA 63,301 0.89 7,037 ENI SpA 93,028 1.32
9 Eramet 940 0.01 171 ERG SpA 1,429 0.02 455 Erste Group Bank AG 8,809 0.12 56 Eurazeo 1,780 0.03
598 European Aeronautic Defence and Space Co NV 12,681 0.18 84 Exor SpA 1,244 0.02 54 Exor SpA PFD 766 0.01
137 Faurecia 2,222 0.03 700 Ferrovial SA 6,014 0.08 965 Fiat Industrial SpA 5,467 0.08
3,725 Fiat SpA 15,250 0.22
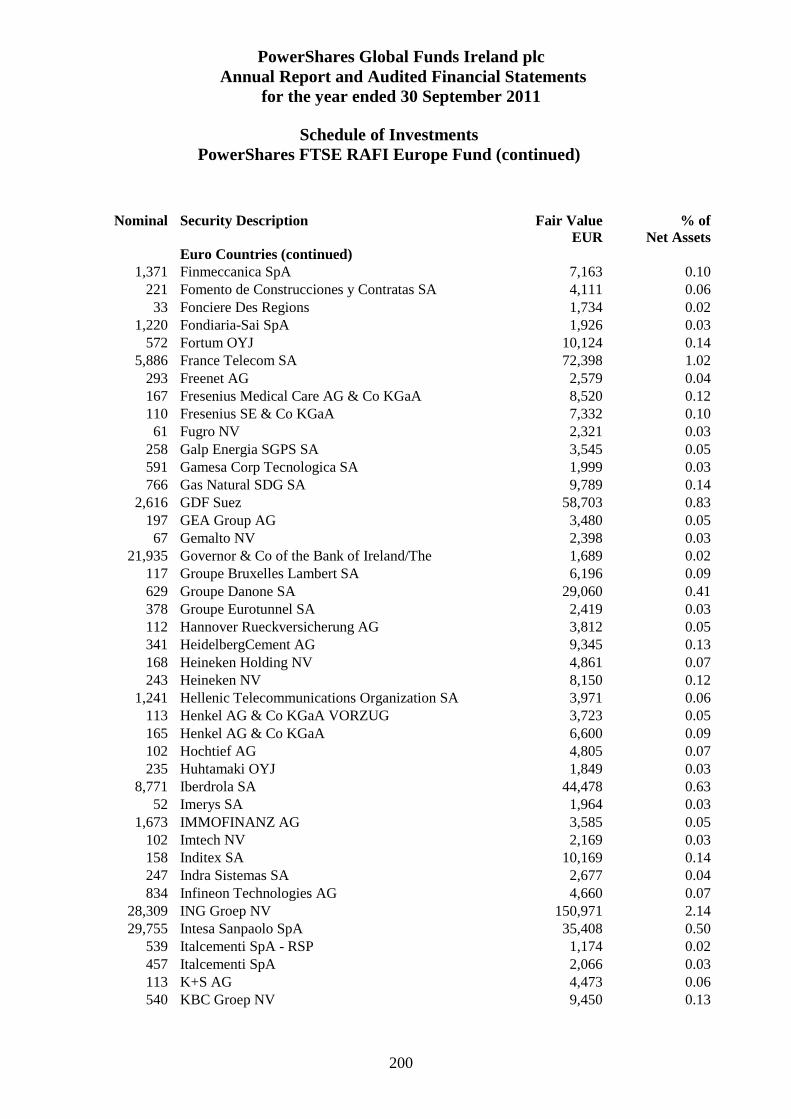
PowerShares Global Funds Ireland plc
Annual Report and Audited Financial Statements for the year ended 30 September 2011
200
Schedule of Investments
PowerShares FTSE RAFI Europe Fund (continued)
Nominal Security Description Fair Value EUR
% of Net Assets
Euro Countries (continued) 1,371 Finmeccanica SpA 7,163 0.10
221 Fomento de Construcciones y Contratas SA 4,111 0.06 33 Fonciere Des Regions 1,734 0.02
1,220 Fondiaria-Sai SpA 1,926 0.03 572 Fortum OYJ 10,124 0.14
5,886 France Telecom SA 72,398 1.02 293 Freenet AG 2,579 0.04 167 Fresenius Medical Care AG & Co KGaA 8,520 0.12 110 Fresenius SE & Co KGaA 7,332 0.10 61 Fugro NV 2,321 0.03
258 Galp Energia SGPS SA 3,545 0.05 591 Gamesa Corp Tecnologica SA 1,999 0.03 766 Gas Natural SDG SA 9,789 0.14
2,616 GDF Suez 58,703 0.83 197 GEA Group AG 3,480 0.05 67 Gemalto NV 2,398 0.03
21,935 Governor & Co of the Bank of Ireland/The 1,689 0.02 117 Groupe Bruxelles Lambert SA 6,196 0.09 629 Groupe Danone SA 29,060 0.41 378 Groupe Eurotunnel SA 2,419 0.03 112 Hannover Rueckversicherung AG 3,812 0.05 341 HeidelbergCement AG 9,345 0.13 168 Heineken Holding NV 4,861 0.07 243 Heineken NV 8,150 0.12
1,241 Hellenic Telecommunications Organization SA 3,971 0.06 113 Henkel AG & Co KGaA VORZUG 3,723 0.05 165 Henkel AG & Co KGaA 6,600 0.09 102 Hochtief AG 4,805 0.07 235 Huhtamaki OYJ 1,849 0.03
8,771 Iberdrola SA 44,478 0.63 52 Imerys SA 1,964 0.03
1,673 IMMOFINANZ AG 3,585 0.05 102 Imtech NV 2,169 0.03 158 Inditex SA 10,169 0.14 247 Indra Sistemas SA 2,677 0.04 834 Infineon Technologies AG 4,660 0.07
28,309 ING Groep NV 150,971 2.14 29,755 Intesa Sanpaolo SpA 35,408 0.50
539 Italcementi SpA - RSP 1,174 0.02 457 Italcementi SpA 2,066 0.03 113 K+S AG 4,473 0.06 540 KBC Groep NV 9,450 0.13

PowerShares Global Funds Ireland plc
Annual Report and Audited Financial Statements for the year ended 30 September 2011
201
Schedule of Investments
PowerShares FTSE RAFI Europe Fund (continued)
Nominal Security Description Fair Value EUR
% of Net Assets
Euro Countries (continued) 127 Kerry Group Plc 3,327 0.05 162 Kesko OYJ 3,749 0.05 115 Klepierre 2,433 0.03 116 Kone OYJ 4,153 0.06
2,263 Koninklijke Ahold NV 19,951 0.28 857 Koninklijke BAM Groep NV 2,602 0.04 71 Koninklijke Boskalis Westminster NV 1,650 0.02
290 Koninklijke DSM NV 9,534 0.13 2,957 Koninklijke KPN NV 29,277 0.41 1,425 Koninklijke Philips Electronics NV 19,309 0.27
573 Lafarge SA 14,898 0.21 325 Lagardere SCA 6,017 0.09 101 Lanxess AG 3,660 0.05 168 Legrand SA 3,954 0.06 126 Linde AG 12,695 0.18 209 L'Oreal SA 15,336 0.22 114 Luxottica Group SpA 2,184 0.03 230 LVMH Moet Hennessy Louis Vuitton SA 22,920 0.32 171 MAN SE 9,985 0.14
1,893 Mapfre SA 4,426 0.06 2,266 Mediaset SpA 5,370 0.08 1,192 Mediobanca SpA 7,051 0.10
65 Merck KGaA 3,998 0.06 385 Metro AG 12,293 0.17 169 Metropole Television SA 2,063 0.03 208 Metso OYJ 4,595 0.06 531 Muenchener Rueckversicherungs AG 49,675 0.70
2,485 National Bank of Greece SA 6,834 0.10 1,756 Natixis 4,183 0.06
42 Neopost SA 2,312 0.03 416 Neste Oil OYJ 2,719 0.04 78 Nexans SA 3,416 0.05
10,479 Nokia OYJ 44,515 0.63 102 Nokian Renkaat OYJ 2,303 0.03 45 Nutreco NV 2,116 0.03
113 Obrascon Huarte Lain SA 2,101 0.03 405 OMV AG 9,121 0.13 637 OPAP SA 4,841 0.07 386 Outokumpu OYJ 1,915 0.03 65 Outotec OYJ 1,755 0.02
392 PagesJaunes Groupe 1,162 0.02 2,753 Parmalat SpA 4,364 0.06

PowerShares Global Funds Ireland plc
Annual Report and Audited Financial Statements for the year ended 30 September 2011
202
Schedule of Investments
PowerShares FTSE RAFI Europe Fund (continued)
Nominal Security Description Fair Value EUR
% of Net Assets
Euro Countries (continued) 238 Pernod-Ricard SA 14,002 0.20
1,077 Peugeot SA 17,410 0.25 3,923 Piraeus Bank SA 1,844 0.03
708 Pirelli & C SpA 3,802 0.05 277 Pohjola Bank Plc 2,198 0.03 166 Porsche Automobil Holding SE 6,012 0.08
2,021 Portugal Telecom SGPS SA 11,116 0.16 667 PostNL NV 2,208 0.03 166 PPR 16,172 0.23 437 Praktiker Bau - Und Heimwerkermaerkte Holding AG 1,408 0.02 547 Promotora de Informaciones SA 60 0.00 271 Prysmian SpA 2,688 0.04 396 Public Power Corp SA 2,376 0.03 126 Publicis Groupe SA 3,958 0.06 78 Raiffeisen Bank International AG 1,728 0.02 90 Rallye SA 1,948 0.03
151 Randstad Holding NV 3,650 0.05 294 Rautaruukki OYJ 2,227 0.03 689 Renault SA 17,273 0.24
2,661 Repsol YPF SA 53,167 0.75 144 Rexel SA 1,619 0.02
1,025 RWE AG 28,413 0.40 782 Ryanair Holdings Plc 2,596 0.04 256 Sacyr Vallehermoso SA 1,083 0.02 210 Safran SA 4,866 0.07 209 Saipem SpA 5,551 0.08 123 Salzgitter AG 4,459 0.06 791 Sampo OYJ 14,974 0.21
2,153 Sanofi - Aventis SA 106,250 1.51 468 SAP AG 17,931 0.25
1,330 Saras SpA 1,353 0.02 198 SBM Offshore NV 2,608 0.04 508 Schneider Electric SA 20,610 0.29 343 SCOR SE 5,572 0.08 314 SES SA 5,737 0.08 903 Siemens AG 61,512 0.87 319 Smurfit Kappa Group Plc 1,436 0.02
1,293 Snam Rete Gas SpA 4,474 0.06 1,518 SNS REAAL NV 2,880 0.04 1,548 Societe Generale SA 30,960 0.44
283 Societe Television Francaise 1 2,655 0.04 179 Sodexo 8,876 0.13

PowerShares Global Funds Ireland plc
Annual Report and Audited Financial Statements for the year ended 30 September 2011
203
Schedule of Investments
PowerShares FTSE RAFI Europe Fund (continued)
Nominal Security Description Fair Value EUR
% of Net Assets
Euro Countries (continued) 73 Solvay SA 5,183 0.07
3,043 Sonae 1,598 0.02 956 STMicroelectronics NV 4,694 0.07
1,164 Stora Enso OYJ 5,147 0.07 678 Suez Environnement Co 7,085 0.10 129 Symrise AG 2,251 0.03 105 Technip SA 6,356 0.09
53,051 Telecom Italia SpA 43,475 0.61 22,730 Telecom Italia SpA - RSP 16,661 0.24 7,401 Telefonica SA 106,758 1.52
858 Telekom Austria AG 6,503 0.09 393 Tenaris SA 3,741 0.05
1,651 Terna Rete Elettrica Nazionale SpA 4,590 0.06 172 Thales SA 4,051 0.06 957 ThyssenKrupp AG 17,748 0.25 667 TNT NV 3,481 0.05
4,796 Total SA 159,394 2.26 1,167 TUI AG 4,524 0.06
217 UCB SA 6,961 0.10 162 Umicore SA 4,449 0.06 115 Unibail-Rodamco SE 15,473 0.22
57,966 UniCredit SpA 46,518 0.66 1,585 Unilever NV 37,652 0.53 2,045 Unione di Banche Italiane SCPA 5,730 0.08 9,710 Unipol Gruppo Finanziario SpA PFD 2,197 0.03 8,214 Unipol Gruppo Finanziario SpA 2,624 0.04 1,088 UPM-Kymmene OYJ 9,275 0.13
175 USG People NV 1,100 0.02 150 Valeo SA 4,778 0.07 162 Vallourec SA 7,047 0.10
1,377 Veolia Environnement SA 15,243 0.22 67 Vienna Insurance Group AG Wiener Versicherung
Gruppe 1,921
0.03
763 Vinci SA 24,736 0.35 2,874 Vivendi SA 44,073 0.62
362 Voestalpine AG 7,944 0.11 54 Volkswagen AG 5,032 0.07
319 Volkswagen AG - PFD 31,916 0.45 118 Wartsila OYJ 2,113 0.03 37 Wendel SA 1,759 0.02 32 Wereldhave NV 1,696 0.02
272 Wienerberger AG 2,400 0.03

PowerShares Global Funds Ireland plc
Annual Report and Audited Financial Statements for the year ended 30 September 2011
204
Schedule of Investments
PowerShares FTSE RAFI Europe Fund (continued)
Nominal Security Description Fair Value EUR
% of Net Assets
Euro Countries (continued) 43 Wincor Nixdorf AG 1,453 0.02
397 Wolters Kluwer NV 4,853 0.07 173 YIT OYJ 1,960 0.03 55 Zodiac Aerospace 3,187 0.05
Total Euro Countries 3,777,216 53.38 Guernsey
2,462 Resolution Ltd 7,072 0.10 Total Guernsey 7,072 0.10 Jersey
511 Experian Plc 4,301 0.06 677 Informa Plc 2,575 0.04 146 Shire Plc 3,407 0.05 625 United Business Media Ltd 3,257 0.05 534 Wolseley Plc 9,964 0.14
1,691 WPP Plc 11,800 0.16 Total Jersey 35,304 0.50 Norway
282 Aker Solutions ASA 2,035 0.03 1,448 DnB NOR ASA 10,919 0.15
282 Kvaerner ASA 278 0.00 3,194 Norsk Hydro ASA 10,976 0.16 1,778 Norske Skogindustrier ASA 950 0.01 1,851 Orkla ASA 10,586 0.15
256 Petroleum Geo-Services ASA 1,947 0.03 2,382 Statoil ASA 38,405 0.54
878 Storebrand ASA 3,339 0.05 1,042 Telenor ASA 12,077 0.17
174 Yara International ASA 5,028 0.07 Total Norway 96,540 1.36 Spain
1,854 International Consolidated Airlines Group SA 3,296 0.05 Total Spain 3,296 0.05 Sweden
281 Alfa Laval AB 3,330 0.05 270 Assa Abloy AB 4,181 0.06 270 Atlas Copco AB - B Shares 3,188 0.05 435 Atlas Copco AB - A Shares 5,811 0.08

PowerShares Global Funds Ireland plc
Annual Report and Audited Financial Statements for the year ended 30 September 2011
205
Schedule of Investments
PowerShares FTSE RAFI Europe Fund (continued)
Nominal Security Description Fair Value EUR
% of Net Assets
Sweden (continued) 89 Axfood AB 2,272 0.03
313 Boliden AB 2,440 0.03 507 Electrolux AB 5,595 0.08 185 Getinge AB 3,029 0.04
1,154 Hennes & Mauritz AB 25,885 0.37 150 Hexagon AB 1,470 0.02 154 Holmen AB 2,876 0.04 150 Husqvarna AB A Shares 456 0.01 498 Husqvarna AB B Shares 1,514 0.02 139 Industrivarden AB - Class C 1,097 0.02 319 Industrivarden AB - Class A 2,652 0.04
1,148 Investor AB 15,186 0.21 234 Kinnevik Investment AB 3,255 0.05 90 Lundbergforetagen AB 1,895 0.03
302 NCC AB 3,703 0.05 5,256 Nordea Bank AB 32,056 0.44
413 Peab AB 1,513 0.02 296 Ratos AB 2,560 0.04 184 Saab AB 2,480 0.04 970 Sandvik AB 8,421 0.12
1,701 SAS AB 2,030 0.03 55 Scania AB A Shares 583 0.01
748 Scania AB B Shares 8,056 0.11 684 Securitas AB 3,748 0.05
2,843 Skandinaviska Enskilda Banken AB 11,532 0.16 797 Skanska AB 8,294 0.12 400 SKF AB 5,682 0.08 461 SSAB AB - A Shares 2,576 0.04 138 SSAB AB - B Shares 690 0.01
1,430 Svenska Cellulosa AB 13,089 0.18 797 Svenska Handelsbanken AB 15,231 0.22
1,237 Swedbank AB 10,283 0.15 125 Swedish Match AB 3,093 0.04 546 Tele2 AB 7,477 0.11
3,769 Telefonaktiebolaget LM Ericsson 27,260 0.38 5,702 TeliaSonera AB 28,242 0.39
379 Trelleborg AB 1,847 0.03 859 Volvo AB - A Shares 6,409 0.09
1,839 Volvo AB - B Shares 13,620 0.19 Total Sweden 306,607 4.33

PowerShares Global Funds Ireland plc
Annual Report and Audited Financial Statements for the year ended 30 September 2011
206
Schedule of Investments
PowerShares FTSE RAFI Europe Fund (continued)
Nominal Security Description Fair Value EUR
% of Net Assets
Switzerland 1,212 ABB Ltd 15,684 0.22
209 Adecco SA 6,203 0.09 79 Aryzta AG 2,567 0.04 97 Baloise Holding AG 5,333 0.08
268 Cie Financiere Richemont SA 9,005 0.13 425 Clariant AG 2,895 0.04
1,797 Credit Suisse Group AG 35,390 0.50 181 GAM Holding AG 1,701 0.02 25 Geberit AG 3,461 0.05 5 Givaudan SA 2,917 0.04
12 Helvetia Holding AG 2,737 0.04 371 Holcim Ltd 14,826 0.21 127 Julius Baer Group Ltd 3,199 0.05 32 Kuehne + Nagel International AG 2,699 0.04 1 Lindt & Spruengli AG 2,175 0.03
59 Lonza Group AG 2,663 0.04 2,761 Nestle SA 113,506 1.60 2,346 Novartis AG 97,793 1.38
48 Pargesa Holding SA 2,466 0.03 464 Petroplus Holdings AG 1,949 0.03 527 Roche Holding AG 63,612 0.90
5 Schindler Holding - Part Cert 398 0.01 12 Schindler Holding AG - REG 982 0.01 4 SGS SA 4,562 0.06
28 Sulzer AG 2,167 0.03 28 Swatch Group AG 1,259 0.02 16 Swatch Group AG/The BR 3,969 0.06
127 Swiss Life Holding AG 10,515 0.15 736 Swiss Reinsurance Co Ltd 25,577 0.36 24 Swisscom AG 7,302 0.10 50 Syngenta AG 9,785 0.14
377 Transocean Ltd 13,738 0.19 3,796 UBS AG 32,831 0.46
274 Zurich Financial Services AG 42,944 0.61 Total Switzerland 548,810 7.76 United Kingdom
1,149 3i Group Plc 2,504 0.04 255 AMEC Plc 2,414 0.03 676 Amlin Plc 2,227 0.03
1,099 Anglo American Plc 28,442 0.40 250 Antofagasta Plc 2,689 0.04
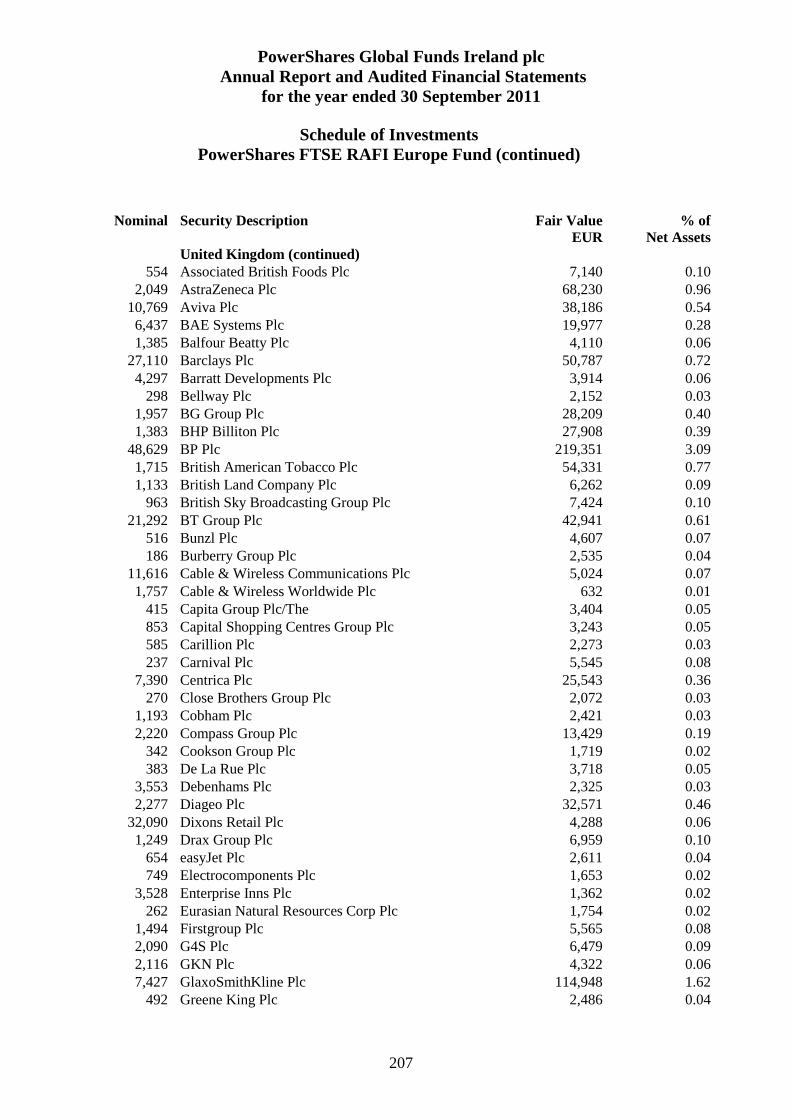
PowerShares Global Funds Ireland plc
Annual Report and Audited Financial Statements for the year ended 30 September 2011
207
Schedule of Investments
PowerShares FTSE RAFI Europe Fund (continued)
Nominal Security Description Fair Value EUR
% of Net Assets
United Kingdom (continued) 554 Associated British Foods Plc 7,140 0.10
2,049 AstraZeneca Plc 68,230 0.96 10,769 Aviva Plc 38,186 0.54 6,437 BAE Systems Plc 19,977 0.28 1,385 Balfour Beatty Plc 4,110 0.06
27,110 Barclays Plc 50,787 0.72 4,297 Barratt Developments Plc 3,914 0.06
298 Bellway Plc 2,152 0.03 1,957 BG Group Plc 28,209 0.40 1,383 BHP Billiton Plc 27,908 0.39
48,629 BP Plc 219,351 3.09 1,715 British American Tobacco Plc 54,331 0.77 1,133 British Land Company Plc 6,262 0.09
963 British Sky Broadcasting Group Plc 7,424 0.10 21,292 BT Group Plc 42,941 0.61
516 Bunzl Plc 4,607 0.07 186 Burberry Group Plc 2,535 0.04
11,616 Cable & Wireless Communications Plc 5,024 0.07 1,757 Cable & Wireless Worldwide Plc 632 0.01
415 Capita Group Plc/The 3,404 0.05 853 Capital Shopping Centres Group Plc 3,243 0.05 585 Carillion Plc 2,273 0.03 237 Carnival Plc 5,545 0.08
7,390 Centrica Plc 25,543 0.36 270 Close Brothers Group Plc 2,072 0.03
1,193 Cobham Plc 2,421 0.03 2,220 Compass Group Plc 13,429 0.19
342 Cookson Group Plc 1,719 0.02 383 De La Rue Plc 3,718 0.05
3,553 Debenhams Plc 2,325 0.03 2,277 Diageo Plc 32,571 0.46
32,090 Dixons Retail Plc 4,288 0.06 1,249 Drax Group Plc 6,959 0.10
654 easyJet Plc 2,611 0.04 749 Electrocomponents Plc 1,653 0.02
3,528 Enterprise Inns Plc 1,362 0.02 262 Eurasian Natural Resources Corp Plc 1,754 0.02
1,494 Firstgroup Plc 5,565 0.08 2,090 G4S Plc 6,479 0.09 2,116 GKN Plc 4,322 0.06 7,427 GlaxoSmithKline Plc 114,948 1.62
492 Greene King Plc 2,486 0.04

PowerShares Global Funds Ireland plc
Annual Report and Audited Financial Statements for the year ended 30 September 2011
208
Schedule of Investments
PowerShares FTSE RAFI Europe Fund (continued)
Nominal Security Description Fair Value EUR
% of Net Assets
United Kingdom (continued) 809 Hammerson Plc 3,552 0.05
1,398 Hays Plc 1,124 0.02 3,270 Home Retail Group Plc 4,267 0.06
27,668 HSBC Holdings Plc 159,626 2.26 722 ICAP Plc 3,457 0.05 310 IMI Plc 2,556 0.04
1,204 Imperial Tobacco Group Plc 30,391 0.43 1,159 Inchcape Plc 3,760 0.05
339 Inmarsat Plc 1,935 0.03 174 Intercontinental Hotels Group Plc 2,123 0.03 630 Intermediate Capital Group Plc 1,570 0.02
2,760 International Power Plc 9,832 0.14 584 Invensys Plc 1,529 0.02 893 Investec Plc 3,625 0.05
4,004 ITV Plc 2,757 0.04 4,134 J Sainsbury Plc 13,190 0.19
276 Johnson Matthey Plc 5,086 0.07 133 Kazakhmys Plc 1,225 0.02
1,896 Kesa Electricals Plc 1,845 0.03 4,438 Kingfisher Plc 12,805 0.18 2,174 Ladbrokes Plc 3,006 0.04 1,309 Land Securities Group Plc 9,757 0.14
12,113 Legal & General Group Plc 13,593 0.19 73,117 Lloyds Banking Group Plc 29,598 0.42 2,173 Logica Plc 1,994 0.03
179 Lonmin Plc 2,184 0.03 3,192 Man Group Plc 6,245 0.09 3,648 Marks & Spencer Group Plc 13,325 0.19
778 Meggitt Plc 3,025 0.04 1,449 Mitchells & Butlers Plc 3,962 0.06
751 Mondi Plc 4,130 0.06 1,255 National Express Group Plc 3,395 0.05 5,360 National Grid Plc 39,736 0.56
263 Next Plc 7,732 0.11 10,365 Old Mutual Plc 12,636 0.18 1,003 Pearson Plc 13,264 0.19
453 Pennon Group Plc 3,553 0.05 987 Persimmon Plc 5,220 0.07
7,468 Premier Foods Plc 896 0.01 239 Provident Financial Plc 2,786 0.04
3,852 Prudential Plc 24,934 0.35 3,743 Punch Taverns Plc 489 0.01

PowerShares Global Funds Ireland plc
Annual Report and Audited Financial Statements for the year ended 30 September 2011
209
Schedule of Investments
PowerShares FTSE RAFI Europe Fund (continued)
Nominal Security Description Fair Value EUR
% of Net Assets
United Kingdom (continued) 493 Reckitt Benckiser Group Plc 18,735 0.26
3,963 Rentokil Initial Plc 3,297 0.05 1,815 Rexam Plc 6,550 0.09
965 Rio Tinto Plc 32,364 0.46 1,684 Rolls-Royce Holdings Plc 11,634 0.16
47,898 Royal Bank of Scotland Group Plc 13,063 0.18 7,315 Royal Dutch Shell Plc - A Shares 169,864 2.40 5,622 Royal Dutch Shell Plc - B Shares 131,333 1.86 8,283 RSA Insurance Group Plc 10,694 0.15
914 SABMiller Plc 22,365 0.32 1,054 Sage Group Plc/The 3,138 0.04
41 Schroders Plc (Non Voting) 497 0.01 118 Schroders Plc 1,752 0.02
1,765 Scottish & Southern Energy Plc 26,538 0.38 1,172 Segro Plc 2,996 0.04
482 Serco Group Plc 2,857 0.04 398 Severn Trent Plc 7,121 0.10
1,840 SIG Plc 1,984 0.03 576 Smith & Nephew Plc 3,892 0.06 400 Smiths Group Plc 4,642 0.07
3,743 Spirit Pub Co Plc 1,543 0.02 1,047 Stagecoach Group Plc 2,984 0.04 1,996 Standard Chartered Plc 29,826 0.42 4,306 Standard Life Plc 9,999 0.14
783 Tate & Lyle Plc 5,691 0.08 11,622 Taylor Wimpey Plc 4,723 0.07 13,300 Tesco Plc 58,371 0.82 3,452 Thomas Cook Group Plc 1,599 0.02
365 Travis Perkins Plc 3,221 0.05 2,403 TUI Travel Plc 4,166 0.06
185 Tullow Oil Plc 2,812 0.04 1,358 Unilever Plc 31,866 0.45 1,590 United Utilities Group Plc 11,520 0.16
162 Vedanta Resources Plc 2,071 0.03 97,334 Vodafone Group Plc 187,881 2.64
261 Whitbread Plc 4,800 0.07 1,141 William Hill Plc 2,997 0.04 4,513 WM Morrison Supermarkets Plc 15,222 0.22 1,620 Xstrata Plc 15,439 0.22
31,111 Yell Group Plc 1,474 0.02 Total United Kingdom 2,227,922 31.48

PowerShares Global Funds Ireland plc
Annual Report and Audited Financial Statements for the year ended 30 September 2011
210
Schedule of Investments
PowerShares FTSE RAFI Europe Fund (continued)
Nominal Security Description Fair Value EUR
% of Net Assets
United States 20 Synthes Inc 2,412 0.03
Total United States 2,412 0.03
Portfolio of Investments 7,075,120 99.98
Current Assets 60,749 0.86
Total Assets 7,135,869 100.84
Current Liabilities (59,078) (0.84)
Net Assets attributable to Holders of Redeemable Participating Shares 7,076,791 100.00

PowerShares Global Funds Ireland plc
Annual Report and Audited Financial Statements for the year ended 30 September 2011
211
Schedule of Investments
PowerShares Global Listed Private Equity Fund
Nominal Security Description Fair Value EUR
% of Net Assets
Bermuda 23,772 GP Investments Ltd 39,230 1.04
Total Bermuda 39,230 1.04 Canada
6,719 Onex Corporation 156,956 4.15 Total Canada 156,956 4.15 Cayman Islands
45,926 ARC Capital Holdings Ltd 25,843 0.68 Total Cayman Islands 25,843 0.68 Denmark
1,983 Schouw & Company 27,582 0.73 Total Denmark 27,582 0.73 Euro Countries
1,947 Ackermans & van Haaren NV 103,308 2.73 4,463 Altamir Amboise 29,188 0.77
18,767 DeA Capital SpA 29,033 0.77 1,919 Deutsche Beteiligungs AG 28,900 0.76
28 Eurazeo RTS 27 0.00 3,914 Eurazeo 124,406 3.29 1,878 Gimv NV 68,998 1.82 1,998 HAL Trust 163,597 4.33 1,605 Paris Orleans et Cie SA 29,051 0.77 8,646 Princess Private Equity Holding Ltd 50,838 1.34 9,708 RHJ International 37,570 0.99 2,734 Wendel SA 129,974 3.43
Total Euro Countries 794,890 21.00 Guernsey
7,618 AP Alternative Assets LP 57,914 1.53 4,765 JZ Capital Partners Ltd 18,700 0.49
Total Guernsey 76,614 2.02 Hong Kong
21,200 China Merchants China Direct Investments Ltd 19,668 0.52 209,000 Fosun International Ltd 79,239 2.09
Total Hong Kong 98,907 2.61

PowerShares Global Funds Ireland plc
Annual Report and Audited Financial Statements for the year ended 30 September 2011
212
Schedule of Investments
PowerShares Global Listed Private Equity Fund (continued)
Nominal Security Description Fair Value EUR
% of Net Assets
Japan 5,005 Jafco Company Ltd 70,513 1.86
Total Japan 70,513 1.86 Luxembourg
29,550 Brait SA 48,218 1.27 Total Luxembourg 48,218 1.27 Singapore
301,160 K1 Ventures Ltd 18,775 0.50 Total Singapore 18,775 0.50 South Africa
8,828 Hosken Consolidated Investments Ltd 67,441 1.78 Total South Africa 67,441 1.78 Sweden
9,346 Bure Equity AB 19,270 0.51 7,642 Hakon Invest AB 79,778 2.11 6,342 Latour Investment AB 65,243 1.72
20,263 Ratos AB 175,253 4.63 Total Sweden 339,544 8.97 Switzerland
1,014 Partners Group Holding AG 124,809 3.30 Total Switzerland 124,809 3.30 United Kingdom
62,452 3i Group Plc 136,103 3.60 3,433 Candover Investments Plc 18,654 0.49 3,683 Electra Private Equity Plc 58,156 1.54 3,298 HgCapital Trust Plc 38,292 1.01
33,448 Intermediate Capital Group Plc 83,379 2.20 28,718 SVG Capital Plc 69,955 1.85
Total United Kingdom 404,539 10.69 United States
22,526 American Capital Ltd 114,502 3.03 13,009 Apollo Global Management LLC 99,286 2.62 15,061 Apollo Investment Corporation 84,414 2.23 12,456 Ares Capital Corporation 127,837 3.38 6,850 BlackRock Kelso Capital Corp 37,270 0.98
17,591 Blackstone Group LP 157,069 4.15

PowerShares Global Funds Ireland plc
Annual Report and Audited Financial Statements for the year ended 30 September 2011
213
Schedule of Investments
PowerShares Global Listed Private Equity Fund (continued)
Nominal Security Description Fair Value EUR
% of Net Assets
United States (continued) 327 Capital Southwest Corporation 18,035 0.48
4,219 Compass Diversified Holdings 38,300 1.01 5,513 Fifth Street Finance Corporation 38,296 1.01
23,862 Fortress Investment Group LLC 53,533 1.41 1,821 Golub Capital BDC Inc 20,155 0.53 4,348 Hercules Technology Growth Capital Inc 27,610 0.73 4,227 ICG Group Inc 29,016 0.77
15,741 KKR & Co LP 122,014 3.22 11,804 KKR Financial Holdings LLC 65,368 1.73 10,003 Leucadia National Corp 169,089 4.48 2,174 Main Street Capital Corporation 28,777 0.76 6,127 MCG Capital Corp 18,084 0.48 2,414 MVC Capital Inc 18,838 0.50 2,715 Otter Tail Corp 37,031 0.98 4,268 PennantPark Investment Corp 28,375 0.75 1,848 Pico Holdings Inc 28,250 0.75 9,013 Prospect Capital Corporation 56,495 1.49 1,803 Safeguard Scientifics Inc 20,157 0.53 3,219 Solar Capital Ltd 48,296 1.28 3,118 TICC Capital Corp 18,986 0.50
Total United States 1,505,083 39.78
Portfolio of Investments 3,798,944 100.38
Current Assets 340,980 9.01
Total Assets 4,139,924 109.39
Current Liabilities (355,190) (9.39)
Net Assets attributable to Holders of Redeemable Participating Shares 3,784,734 100.00
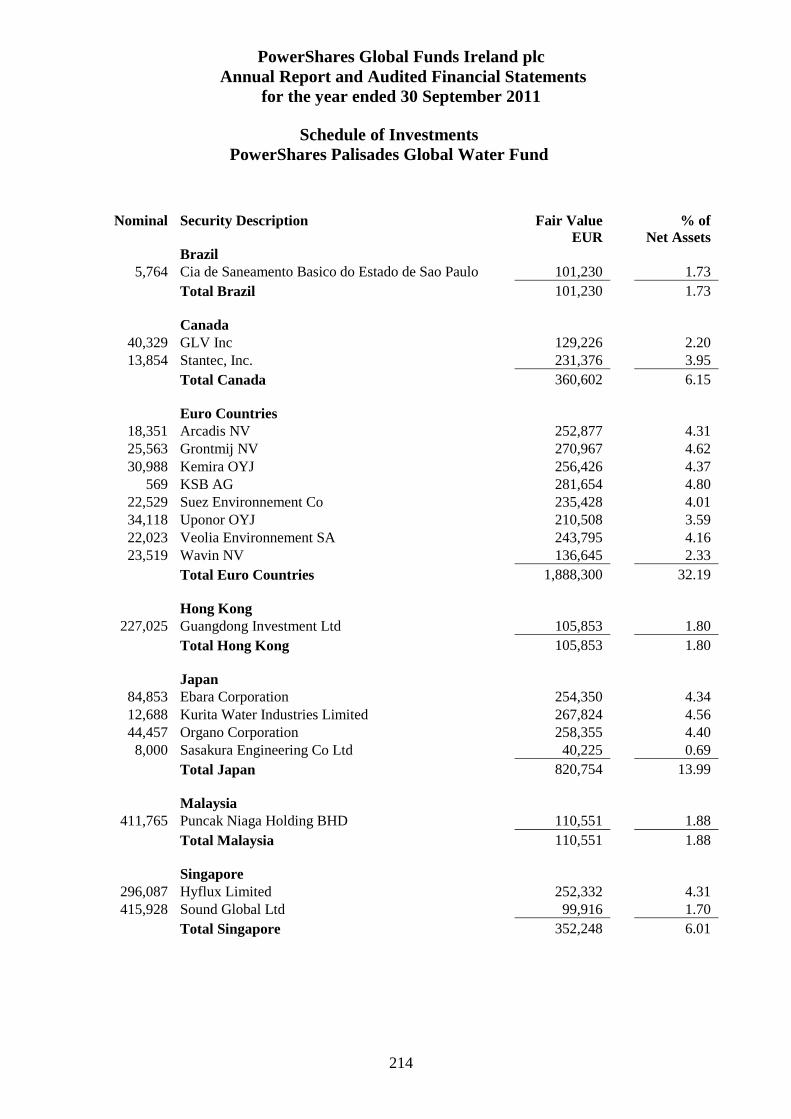
PowerShares Global Funds Ireland plc
Annual Report and Audited Financial Statements for the year ended 30 September 2011
214
Schedule of Investments
PowerShares Palisades Global Water Fund
Nominal Security Description Fair Value EUR
% of Net Assets
Brazil 5,764 Cia de Saneamento Basico do Estado de Sao Paulo 101,230 1.73
Total Brazil 101,230 1.73 Canada
40,329 GLV Inc 129,226 2.20 13,854 Stantec, Inc. 231,376 3.95
Total Canada 360,602 6.15 Euro Countries
18,351 Arcadis NV 252,877 4.31 25,563 Grontmij NV 270,967 4.62 30,988 Kemira OYJ 256,426 4.37
569 KSB AG 281,654 4.80 22,529 Suez Environnement Co 235,428 4.01 34,118 Uponor OYJ 210,508 3.59 22,023 Veolia Environnement SA 243,795 4.16 23,519 Wavin NV 136,645 2.33
Total Euro Countries 1,888,300 32.19 Hong Kong
227,025 Guangdong Investment Ltd 105,853 1.80 Total Hong Kong 105,853 1.80 Japan
84,853 Ebara Corporation 254,350 4.34 12,688 Kurita Water Industries Limited 267,824 4.56 44,457 Organo Corporation 258,355 4.40 8,000 Sasakura Engineering Co Ltd 40,225 0.69
Total Japan 820,754 13.99 Malaysia
411,765 Puncak Niaga Holding BHD 110,551 1.88 Total Malaysia 110,551 1.88 Singapore
296,087 Hyflux Limited 252,332 4.31 415,928 Sound Global Ltd 99,916 1.70
Total Singapore 352,248 6.01

PowerShares Global Funds Ireland plc
Annual Report and Audited Financial Statements for the year ended 30 September 2011
215
Schedule of Investments
PowerShares Palisades Global Water Fund (continued)
Nominal Security Description Fair Value EUR
% of Net Assets
Switzerland 1,778 Geberit AG 246,129 4.20
Total Switzerland 246,129 4.20 United Kingdom
39,318 Halma Plc 144,074 2.46 5,851 Severn Trent Plc 104,686 1.78
14,532 United Utilities Group Plc 105,285 1.80 Total United Kingdom 354,045 6.04 United States
4,490 American Water Works Co Inc 100,997 1.72 6,404 Aqua America Inc 102,955 1.76 5,730 Itron, Inc. 125,986 2.15 7,546 ITT Corporation 236,217 4.03 9,630 Nalco Holding Co 251,068 4.28 9,941 Pentair Inc 237,170 4.04
15,921 Tetra Tech Inc 222,374 3.79 3,758 Valmont Industries Inc 218,304 3.72
Total United States 1,495,071 25.49
Portfolio of Investments 5,834,783 99.48
Current Assets 859,853 14.66
Total Assets 6,694,636 114.14
Current Liabilities (829,242) (14.14)
Net Assets attributable to Holders of Redeemable Participating Shares 5,865,394 100.00

PowerShares Global Funds Ireland plc
Annual Report and Audited Financial Statements for the year ended 30 September 2011
216
Schedule of Investments
PowerShares FTSE RAFI Asia Pacific Ex-Japan Fund
Nominal Security Description Fair Value USD
% of Net Assets
Australia 1,208 AGL Energy Ltd 16,789 0.31 4,616 Amcor Ltd 31,090 0.57 8,604 AMP Ltd 33,031 0.60 6,878 Asciano Ltd 9,693 0.18
324 ASX Ltd 9,551 0.17 8,881 Australia & New Zealand Banking Group Ltd 168,485 3.08 1,014 Bank of Queensland Ltd 7,086 0.13 1,467 Bendigo and Adelaide Bank Ltd 12,105 0.22 6,322 BHP Billiton Ltd 215,173 3.94
15,630 BlueScope Steel Ltd 11,089 0.20 3,091 Boral Ltd 10,514 0.19 4,148 Brambles Ltd 26,083 0.48
995 Caltex Australia Ltd 10,473 0.19 5,546 CFS Retail Property Trust 9,433 0.17 1,333 Coca-Cola Amatil Ltd 15,456 0.28 4,858 Commonwealth Bank of Australia 215,062 3.94 1,064 Computershare Ltd 7,725 0.14
736 CSL Ltd 21,231 0.39 3,591 CSR Ltd 8,132 0.15
19,151 Dexus Property Group 15,262 0.28 4,144 Echo Entertainment Group Ltd 14,700 0.27 5,030 Foster's Group Ltd 25,812 0.47 3,908 Goodman Fielder RTS 190 0.00 9,380 Goodman Fielder Ltd 4,376 0.08
20,249 Goodman Group 11,316 0.21 6,826 GPT Group 20,831 0.38 4,014 Incitec Pivot Ltd 12,757 0.23 9,363 Insurance Australia Group Ltd 27,482 0.50
524 Leighton Holdings Ltd 9,513 0.17 2,612 Lend Lease Group 17,872 0.33 1,590 Macquarie Group Ltd 35,341 0.65 4,300 MAp Group 13,499 0.25 4,637 Metcash Ltd 18,522 0.34
15,627 Mirvac Group 17,466 0.32 9,895 National Australia Bank Ltd 215,129 3.93
455 Newcrest Mining Ltd 15,071 0.28 7,495 OneSteel Ltd 9,033 0.17 1,017 Orica Ltd 23,208 0.42 2,007 Origin Energy Ltd 26,138 0.48 9,569 Qantas Airways Ltd 13,113 0.24 4,088 QBE Insurance Group Ltd 51,174 0.94
611 Rio Tinto Ltd 36,699 0.67

PowerShares Global Funds Ireland plc
Annual Report and Audited Financial Statements for the year ended 30 September 2011
217
Schedule of Investments
PowerShares FTSE RAFI Asia Pacific Ex-Japan Fund (continued)
Nominal Security Description Fair Value USD
% of Net Assets
Australia (continued) 1,946 Santos Ltd 21,504 0.39
954 Sims Metal Management Ltd 11,497 0.21 1,146 Sonic Healthcare Ltd 12,697 0.23
10,231 Stockland 28,935 0.53 7,336 Suncorp-Metway Ltd 56,896 1.04 4,144 TABCORP Holdings Ltd 10,391 0.19 7,637 Tatts Group Ltd 16,552 0.30
28,542 Telstra Corp Ltd 85,994 1.56 2,787 Toll Holdings Ltd 11,945 0.22 2,455 Transurban Group 12,932 0.24 1,677 Treasury Wine Estates Ltd 6,308 0.12 3,203 Wesfarmers Ltd 98,339 1.80
489 Wesfarmers Ltd PPS 15,303 0.28 9,437 Westfield Group 71,081 1.30 9,843 Westpac Banking Corp 194,579 3.56 1,036 Woodside Petroleum Ltd 32,704 0.60 4,076 Woolworths Ltd 98,481 1.80
505 WorleyParsons Ltd 12,908 0.24 Total Australia 2,271,751 41.55 Bermuda
7,048 Esprit Holdings Ltd 8,646 0.16 3,940 Hongkong Land Holdings Ltd 17,651 0.32
656 Jardine Strategic Holdings Ltd 17,259 0.32 2,204 Kerry Properties Ltd 7,092 0.13 7,880 Li & Fung Ltd 13,382 0.24
17,928 Noble Group Ltd 18,298 0.33 1,141 Orient Overseas International Ltd 4,646 0.09 2,752 Yue Yuen Industrial Holdings Ltd 7,159 0.13
Total Bermuda 94,133 1.72 Cayman Islands
15,760 Chaoda Modern Agriculture Holdings Ltd 1,113 0.02 1,970 Kingboard Chemical Holdings Ltd 5,377 0.10
Total Cayman Islands 6,490 0.12 Hong Kong
15,861 Aia Group Ltd 45,435 0.83 4,991 Bank of East Asia Ltd 15,483 0.28
11,881 BOC Hong Kong Holdings Ltd 25,487 0.47 5,910 Cathay Pacific Airways Ltd 9,717 0.18 3,940 Cheung Kong Holdings Ltd 43,324 0.79

PowerShares Global Funds Ireland plc
Annual Report and Audited Financial Statements for the year ended 30 September 2011
218
Schedule of Investments
PowerShares FTSE RAFI Asia Pacific Ex-Japan Fund (continued)
Nominal Security Description Fair Value USD
% of Net Assets
Hong Kong (continued) 6,473 CLP Holdings Ltd 58,661 1.07 2,970 Hang Lung Group Ltd 15,203 0.28 3,409 Hang Lung Properties Ltd 10,247 0.19 2,420 Hang Seng Bank Ltd 28,553 0.52 3,687 Henderson Land Development Co Ltd 16,790 0.31 9,110 Hong Kong & China Gas Co Ltd 20,620 0.38
575 Hong Kong Exchanges and Clearing Ltd 8,472 0.16 4,503 Hongkong Electric Holdings Ltd 34,620 0.63
10,880 Hutchison Whampoa Ltd 81,690 1.50 788 Jardine Matheson Holdings Ltd 36,169 0.66
5,551 Link REIT/The 17,613 0.32 3,581 MTR Corp 10,810 0.20
14,476 New World Development Ltd 14,058 0.26 19,263 Pacific Basin Shipping Ltd 7,547 0.14 45,990 PCCW Ltd 17,250 0.32 7,505 Sino Land Co Ltd 10,046 0.18 5,066 Sun Hung Kai Properties Ltd 58,861 1.08 2,814 Swire Pacific Ltd 29,099 0.53 3,940 Wharf Holdings Ltd 19,688 0.36
Total Hong Kong 635,443 11.64 Korea, Republic of (South Korea)
113 Cheil Industries Inc 8,029 0.15 220 Daelim Industrial Co Ltd 18,021 0.33 743 DGB Financial Group Inc 8,798 0.16 360 Dongbu Insurance Co Ltd 15,738 0.29 421 Dongkuk Steel Mill Co Ltd 8,094 0.15 276 Doosan Corp 31,863 0.58 217 Doosan Heavy Industries and Construction Co Ltd 10,352 0.19 66 E-Mart Co Ltd 16,695 0.31
152 GS Engineering & Construction Corp 12,645 0.23 422 GS Holdings 20,598 0.38 782 Hana Financial Group Inc 23,233 0.43 383 Hankook Tire Co Ltd 13,167 0.24 990 Hanwha Corp 28,405 0.52 35 Honam Petrochemical Corp 8,646 0.16
1,413 Hynix Semiconductor Inc 25,608 0.47 265 Hyosung Corp 12,485 0.23 93 Hyundai Department Store Co Ltd 13,263 0.24
417 Hyundai Development Co 5,947 0.11 188 Hyundai Engineering & Construction Co Ltd 9,751 0.18 136 Hyundai Heavy Industries Co Ltd 32,440 0.58

PowerShares Global Funds Ireland plc
Annual Report and Audited Financial Statements for the year ended 30 September 2011
219
Schedule of Investments
PowerShares FTSE RAFI Asia Pacific Ex-Japan Fund (continued)
Nominal Security Description Fair Value USD
% of Net Assets
Korea, Republic of (South Korea) (continued) 68 Hyundai Mipo Dockyard 6,003 0.11
125 Hyundai Mobis 36,236 0.66 773 Hyundai Motor Co 138,451 2.53 126 Hyundai Steel Co 9,434 0.17 735 Industrial Bank of Korea 8,735 0.16 450 Kangwon Land Inc 10,428 0.19
1,270 KB Financial Group Inc 43,499 0.80 664 Kia Motors Corp 40,526 0.74
2,778 Korea Electric Power Corp 49,639 0.91 2,246 Korea Exchange Bank 13,384 0.24
356 Korea Gas Corp 9,383 0.17 95 Korea Kumho Petrochemical 14,959 0.27
196 Korean Air Lines Co Ltd 7,354 0.13 917 KT Corp 27,906 0.51 90 LG Chem Ltd 24,524 0.45
1,268 LG Corp 65,012 1.19 1,411 LG Display Co Ltd 23,715 0.43
967 LG Electronics Inc 56,557 1.02 433 LG International Corp 16,172 0.30
3 LG Uplus Corp 16 0.00 37 Lotte Shopping Co Ltd 12,626 0.23
248 LS Corp 15,578 0.29 652 Samsung C&T Corp 38,742 0.71 75 Samsung Electro-Mechanics Co Ltd 4,698 0.09
702 Samsung Heavy Industries Co Ltd 16,536 0.30 225 Samsung Life Insurance Co Ltd 17,342 0.32 93 Samsung SDI Co Ltd 9,158 0.17
180 Samsung Securities Co Ltd 7,945 0.15 2,186 Shinhan Financial Group Co Ltd 77,936 1.43 1,221 SK Holdings Co Ltd 139,403 2.56
342 SK Innovation Co Ltd 41,224 0.75 206 SK Telecom Co Ltd 26,142 0.48 457 S-Oil Corp 40,733 0.75 636 STX Corp Co Ltd 7,855 0.14 462 STX Offshore & Shipbuilding Co Ltd 6,412 0.12
2,898 Woori Finance Holdings Co Ltd 25,215 0.46 Total Korea, Republic of (South Korea) 1,413,256 25.86 Mauritius
23,917 Golden Agri-Resources Ltd 11,288 0.21 Total Mauritius 11,288 0.21

PowerShares Global Funds Ireland plc
Annual Report and Audited Financial Statements for the year ended 30 September 2011
220
Schedule of Investments
PowerShares FTSE RAFI Asia Pacific Ex-Japan Fund (continued)
Nominal Security Description Fair Value USD
% of Net Assets
New Zealand 3,286 Fletcher Building Ltd 19,467 0.36
21,377 Telecom Corp of New Zealand Ltd 43,140 0.79 Total New Zealand 62,607 1.15 Papua New Guinea
1,531 Oil Search Ltd 8,422 0.15 Total Papua New Guinea 8,422 0.15 Singapore
9,129 CapitaLand Ltd 17,304 0.32 6,754 CapitaMall Trust 9,485 0.17
656 City Developments Ltd 4,828 0.09 9,131 ComfortDelGro Corp Ltd 9,179 0.17 5,722 DBS Group Holdings Ltd 51,991 0.95 5,254 Fraser and Neave Ltd 23,345 0.43 3,334 Keppel Corp Ltd 19,829 0.36 5,722 Oversea-Chinese Banking Corp Ltd 35,700 0.65 3,096 SembCorp Industries Ltd 8,126 0.15 2,096 Singapore Airlines Ltd 18,385 0.34 6,191 Singapore Press Holdings Ltd 17,864 0.33 2,940 Singapore Technologies Engineering Ltd 6,340 0.12
27,294 Singapore Telecommunications Ltd 66,607 1.22 3,284 United Overseas Bank Ltd 42,843 0.78 1,126 Venture Corp Ltd 5,772 0.11 5,347 Wilmar International Ltd 21,625 0.40
Total Singapore 359,223 6.59 South Korea
328 KT&G Corp 20,464 0.37 399 POSCO 125,656 2.30 453 Samsung Electronics Co Ltd 323,008 5.91 155 Samsung Fire & Marine Insurance Co Ltd 28,486 0.52 24 Shinsegae Co Ltd 5,602 0.10
Total South Korea 503,216 9.20

PowerShares Global Funds Ireland plc
Annual Report and Audited Financial Statements for the year ended 30 September 2011
221
Schedule of Investments
PowerShares FTSE RAFI Asia Pacific Ex-Japan Fund (continued)
Nominal Security Description Fair Value USD
% of Net Assets
Portfolio of Investments 5,365,829 98.19
Current Assets 163,450 2.99
Total Assets 5,529,279 101.18
Current Liabilities (64,651) (1.18)
Net Assets attributable to Holders of Redeemable Participating Shares 5,464,628 100.00

PowerShares Global Funds Ireland plc
Annual Report and Audited Financial Statements for the year ended 30 September 2011
222
Schedule of Investments
PowerShares FTSE RAFI Emerging Markets Fund
Description Maturity
Date Currency Nominal
Value Unrealised
Gain % of Net
Assets Total Return Swaps FTSE RAFI Emerging Markets Index Swap 10/01/2013 USD 13,347,245 274,314 2.04 Total of Total Return Swaps 274,314 2.04
Fair Value % of Net
Assets
Total Return Swaps 274,314 2.04
PowerShares Common Investment Pool* 12,476,795 92.63 Portfolio of Investments 12,751,109 94.67 Current Assets 872,007 6.47 Total Assets 13,623,116 101.14 Current Liabilities (154,698) (1.14) Net Assets attributable to Holders of Redeemable Participating Shares 13,468,418 100.00
* Pledged as Collateral - Nominal 12,440,965 % Ownership of Common Investment Pool – 50% (refer to page 279 for breakdown of Common Investment Pool)

PowerShares Global Funds Ireland plc
Annual Report and Audited Financial Statements for the year ended 30 September 2011
223
Schedule of Investments PowerShares FTSE RAFI UK 100 Fund
Nominal Security Description Fair Value GBP
% of Net Assets
Basic Materials 15,423 Anglo American Plc 343,779 1.35 3,436 Antofagasta Plc 31,835 0.13
19,698 BHP Billiton Plc 342,351 1.35 4,454 Johnson Matthey Plc 70,685 0.28 3,038 Kazakhmys Plc 24,091 0.09 2,468 Lonmin Plc 25,939 0.10
10,347 Mondi Plc 49,014 0.19 13,635 Rio Tinto Plc 393,846 1.56 2,151 Vedanta Resources Plc 23,683 0.09
22,578 Xstrata Plc 185,320 0.73 Total Basic Materials 1,490,543 5.87 Communications
13,380 British Sky Broadcasting Group Plc 88,843 0.35 302,715 BT Group Plc 525,816 2.07 160,460 Cable & Wireless Communications Plc 59,771 0.24 57,516 Cable & Wireless Worldwide Plc 17,830 0.07 55,518 ITV Plc 32,922 0.13 14,868 Pearson Plc 169,347 0.67 8,620 United Business Media Ltd 38,687 0.15
1,374,669 Vodafone Group Plc 2,285,387 9.00 23,139 WPP Plc 139,065 0.55
Total Communications 3,357,668 13.23 Consumer, Cyclical
58,734 Barratt Developments Plc 46,077 0.18 3,277 Carnival Plc 66,032 0.26
32,902 Compass Group Plc 171,418 0.68 441,266 Dixons Retail Plc 50,790 0.20 47,320 Enterprise Inns Plc 15,734 0.06 29,112 GKN Plc 51,208 0.20 44,891 Home Retail Group Plc 50,457 0.20 15,926 Inchcape Plc 44,497 0.18 25,099 International Consolidated Airlines Group SA 38,427 0.15 39,053 Kesa Electricals Plc 32,726 0.13 66,039 Kingfisher Plc 164,107 0.65 53,457 Marks & Spencer Group Plc 168,175 0.66 19,988 Mitchells & Butlers Plc 47,072 0.19 3,654 Next Plc 92,519 0.36
13,648 Persimmon Plc 62,167 0.24 160,393 Taylor Wimpey Plc 56,138 0.22
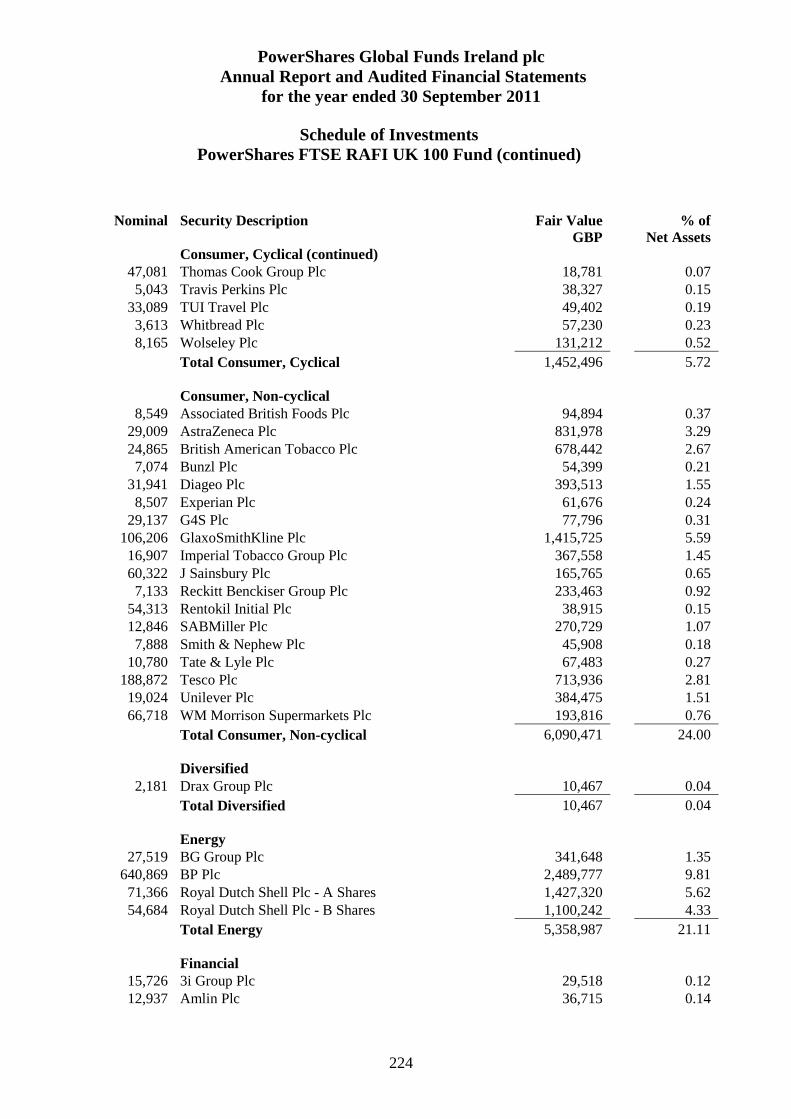
PowerShares Global Funds Ireland plc
Annual Report and Audited Financial Statements for the year ended 30 September 2011
224
Schedule of Investments
PowerShares FTSE RAFI UK 100 Fund (continued)
Nominal Security Description Fair Value GBP
% of Net Assets
Consumer, Cyclical (continued) 47,081 Thomas Cook Group Plc 18,781 0.07 5,043 Travis Perkins Plc 38,327 0.15
33,089 TUI Travel Plc 49,402 0.19 3,613 Whitbread Plc 57,230 0.23 8,165 Wolseley Plc 131,212 0.52
Total Consumer, Cyclical 1,452,496 5.72 Consumer, Non-cyclical
8,549 Associated British Foods Plc 94,894 0.37 29,009 AstraZeneca Plc 831,978 3.29 24,865 British American Tobacco Plc 678,442 2.67 7,074 Bunzl Plc 54,399 0.21
31,941 Diageo Plc 393,513 1.55 8,507 Experian Plc 61,676 0.24
29,137 G4S Plc 77,796 0.31 106,206 GlaxoSmithKline Plc 1,415,725 5.59 16,907 Imperial Tobacco Group Plc 367,558 1.45 60,322 J Sainsbury Plc 165,765 0.65 7,133 Reckitt Benckiser Group Plc 233,463 0.92
54,313 Rentokil Initial Plc 38,915 0.15 12,846 SABMiller Plc 270,729 1.07 7,888 Smith & Nephew Plc 45,908 0.18
10,780 Tate & Lyle Plc 67,483 0.27 188,872 Tesco Plc 713,936 2.81 19,024 Unilever Plc 384,475 1.51 66,718 WM Morrison Supermarkets Plc 193,816 0.76
Total Consumer, Non-cyclical 6,090,471 24.00 Diversified
2,181 Drax Group Plc 10,467 0.04 Total Diversified 10,467 0.04 Energy
27,519 BG Group Plc 341,648 1.35 640,869 BP Plc 2,489,777 9.81 71,366 Royal Dutch Shell Plc - A Shares 1,427,320 5.62 54,684 Royal Dutch Shell Plc - B Shares 1,100,242 4.33
Total Energy 5,358,987 21.11 Financial
15,726 3i Group Plc 29,518 0.12 12,937 Amlin Plc 36,715 0.14

PowerShares Global Funds Ireland plc
Annual Report and Audited Financial Statements for the year ended 30 September 2011
225
Schedule of Investments
PowerShares FTSE RAFI UK 100 Fund (continued)
Nominal Security Description Fair Value GBP
% of Net Assets
Financial (continued) 151,978 Aviva Plc 464,141 1.83 380,519 Barclays Plc 613,967 2.42 15,738 British Land Company Plc 74,913 0.30 11,753 Capital Shopping Centres Group Plc 38,479 0.15 11,147 Hammerson Plc 42,158 0.17
389,774 HSBC Holdings Plc 1,936,788 7.62 9,975 ICAP Plc 41,137 0.16
12,299 Investec Plc 42,997 0.17 18,074 Land Securities Group Plc 116,035 0.46
179,943 Legal & General Group Plc 173,915 0.69 1,030,262 Lloyds Banking Group Plc 359,201 1.41
44,374 Man Group Plc 74,770 0.29 153,800 Old Mutual Plc 161,490 0.64 54,198 Prudential Plc 302,154 1.19 34,254 Resolution Ltd 84,744 0.33
663,447 Royal Bank of Scotland Group Plc 155,844 0.61 114,528 RSA Insurance Group Plc 127,355 0.50 16,184 Segro Plc 35,637 0.14 28,021 Standard Chartered Plc 360,630 1.42 65,378 Standard Life Plc 130,756 0.52
Total Financial 5,403,344 21.28 Industrial
90,161 BAE Systems Plc 241,000 0.94 18,982 Balfour Beatty Plc 48,518 0.19 20,554 Firstgroup Plc 65,937 0.26 17,372 National Express Group Plc 40,477 0.16 25,213 Rexam Plc 78,362 0.31 23,289 Rolls-Royce Holdings Plc 138,570 0.55 5,532 Smiths Group Plc 55,292 0.22
Total Industrial 668,156 2.63 Technology
42,884 Logica Plc 33,900 0.13 18,623 Sage Group Plc/The 47,749 0.19
Total Technology 81,649 0.32 Utilities
103,877 Centrica Plc 309,242 1.22 38,232 International Power Plc 117,296 0.46 77,051 National Grid Plc 491,970 1.93 24,731 Scottish & Southern Energy Plc 320,266 1.26

PowerShares Global Funds Ireland plc
Annual Report and Audited Financial Statements for the year ended 30 September 2011
226
Schedule of Investments
PowerShares FTSE RAFI UK 100 Fund (continued)
Nominal Security Description Fair Value GBP
% of Net Assets
Utilities (continued) 5,533 Severn Trent Plc 85,264 0.34
23,948 United Utilities Group Plc 149,436 0.59 Total Utilities 1,473,474 5.80
Portfolio of Investments 25,387,255 100.00
Current Assets 229,991 0.91
Total Assets 25,617,246 100.91
Current Liabilities (228,945) (0.91)
Net Assets attributable to Holders of Redeemable Participating Shares 25,388,301 100.00

PowerShares Global Funds Ireland plc
Annual Report and Audited Financial Statements for the year ended 30 September 2011
227
Schedule of Investments
PowerShares FTSE RAFI All-World 3000 Fund
Description Maturity
Date Currency Nominal
Value Unrealised
Gain % of Net
Assets Total Return Swaps FTSE RAFI Al-World 3000 Index Swap 10/01/2013 USD 7,524,815 143,210 1.89 Total of Total Return Swaps 143,210 1.89
Fair Value % of Net
Assets
Total Return Swaps 143,210 1.89
PowerShares Common Investment Pool* 7,364,880 97.44 Portfolio of Investments 7,508,090 99.33 Current Assets 55,440 0.73 Total Assets 7,563,530 100.06 Current Liabilities (4,423) (0.06) Net Assets attributable to Holders of Redeemable Participating Shares 7,559,107 100.00
* Pledged as Collateral - Nominal 7,343,731 % Ownership of Common Investment Pool – 29% (refer to page 279 for breakdown of Common Investment Pool)

PowerShares Global Funds Ireland plc
Annual Report and Audited Financial Statements for the year ended 30 September 2011
228
Schedule of Investments
PowerShares FTSE RAFI Developed Europe Mid-Small Fund
Nominal Security Description Fair Value EUR
% of Net Assets
Bermuda 4,074 Aquarius Platinum Limited 8,387 0.12 4,856 BW Offshore Ltd 6,380 0.09
340 Dockwise Limited 3,194 0.05 15,992 Golden Ocean Group Limited 8,206 0.12 4,392 Lancashire Holdings Limited 35,288 0.53
644 Stolt-Nielsen Ltd 8,911 0.13 Total Bermuda 70,366 1.04 British Virgin Islands
1,919 Gem Diamonds Ltd 4,654 0.07 Total British Virgin Islands 4,654 0.07 Cyprus
3,784 ProSafe SE 18,442 0.27 2,932 Songa Offshore SE 6,849 0.10
Total Cyprus 25,291 0.37 Denmark
171 ALK-Abello A/S 7,331 0.11 628 Bang & Olufsen A/S 5,148 0.08 192 Coloplast A/S 20,732 0.31 344 D/S Norden 7,115 0.11 877 East Asiatic Co Ltd A/S 13,377 0.20
1,749 GN Store Nord A/S 8,064 0.12 857 H Lundbeck A/S 12,254 0.18 398 NKT Holding A/S 10,783 0.16 296 Novozymes A/S 31,604 0.46 80 Rockwool International AS 5,300 0.08
109 SimCorp A/S 11,704 0.17 1,517 Sydbank A/S 20,172 0.30
297 Topdanmark A/S 34,845 0.51 3,427 Torm A/S 3,251 0.05
771 Tryg A/S 30,389 0.45 101 William Demant Holding A/S 5,688 0.08
Total Denmark 227,757 3.37 Euro Countries
1,684 Aalberts Industries NV 18,970 0.28 1,104 Aareal Bank AG 12,955 0.19 1,049 Abengoa SA 16,794 0.25 2,698 ACEA SpA 16,255 0.24
376 Ackermans & van Haaren NV 19,951 0.30

PowerShares Global Funds Ireland plc
Annual Report and Audited Financial Statements for the year ended 30 September 2011
229
Schedule of Investments
PowerShares FTSE RAFI Developed Europe Mid-Small Fund (continued)
Nominal Security Description Fair Value EUR
% of Net Assets
Euro Countries (continued) 8,086 Aer Lingus 5,377 0.08
440 Aeroports de Paris 24,926 0.37 3,919 Air Berlin Plc 10,640 0.16
236 Aixtron SE NA 2,589 0.04 1,067 Almirall SA 5,644 0.08
355 Alten Ltd 7,240 0.11 3,846 Altran Technologies SA 12,923 0.19 2,649 Amer Sports OYJ 25,139 0.37
592 AMG Advanced Metallurgical Group NV 4,529 0.07 484 Andritz AG 29,813 0.44
1,206 Ansaldo STS SpA 9,027 0.13 2,087 Antena 3 de Television SA 9,204 0.14
891 Arcadis NV 12,278 0.18 6,326 Arnoldo Mondadori Editore SpA 10,077 0.15
475 ASM International NV 8,930 0.13 1,523 Astaldi SpA 6,366 0.09 3,435 Atrium European Real Estate Limited 12,366 0.18 2,969 Autogrill SpA 22,505 0.33 1,389 Autostrada Torino-Milano SpA 9,924 0.15
756 Axel Springer AG 19,599 0.29 391 Axway Software SA 6,131 0.09
1,109 Azimut Holding SpA 5,783 0.09 18,714 Banco BPI SA 12,763 0.19 4,795 Banco de Valencia SA 3,716 0.05 3,473 Banco Espanol de Credito SA 15,622 0.23
10,139 Banco Espirito Santo SA 20,278 0.30 7,467 BANIF SGPS SA 3,061 0.05
170 Barco NV 5,857 0.09 361 Bauer AG 6,222 0.09 815 BayWa AG 23,888 0.35 399 Bechtle AG 9,993 0.15 305 Befimmo SCA Sicafi 17,120 0.25 485 Beneteau SA 5,202 0.08
4,055 Benetton Group SpA 17,437 0.26 22,706 Beni Stabili SpA 8,967 0.13
979 BinckBank NV 8,131 0.12 170 BioMerieux 11,135 0.16 79 Bollore 13,031 0.19
1,420 Bolsas y Mercados Espanoles SA 28,527 0.42 143 Bonduelle S.C.A. 9,275 0.14 786 Brembo SpA 5,235 0.08 304 Brenntag AG 19,912 0.29

PowerShares Global Funds Ireland plc
Annual Report and Audited Financial Statements for the year ended 30 September 2011
230
Schedule of Investments
PowerShares FTSE RAFI Developed Europe Mid-Small Fund (continued)
Nominal Security Description Fair Value EUR
% of Net Assets
Euro Countries (continued) 2,233 Bull 7,235 0.11
420 Bureau Veritas SA 22,747 0.34 6,479 C&C Group Plc 18,336 0.27 1,761 CA Immobilien Anlagen AG 16,113 0.24 1,759 Caja de Ahorros del Mediterraneo 3,043 0.05
822 Cargotec OYJ 15,067 0.22 2,893 Cementir Holding SpA 4,658 0.07 1,045 CFAO SA 28,099 0.42
271 Cie d'Entreprises CFE 10,867 0.16 397 Cie Maritime Belge SA 6,940 0.10 297 Ciments Francais SA 18,652 0.28
4,509 Cimpor Cimentos de Portugal SGPS SA 22,635 0.33 16,219 CIR-Compagnie Industriali Riunite SpA 22,966 0.34 2,542 Citycon OYJ 6,508 0.10
966 Club Mediterranee 12,534 0.19 283 Cofinimmo 25,000 0.37 45 Construcciones y Auxiliar de Ferrocarriles SA 17,183 0.25
1,540 Conwert Immobilien Invest SE 14,005 0.21 414 Corp Financiera Alba 13,132 0.19 430 Cramo OYJ 2,739 0.04
3,247 Credito Emiliano SpA 9,709 0.14 326 Danieli & C Officine Meccaniche SpA 5,069 0.08 815 Danieli & C Officine Meccaniche Rsp 6,940 0.10 378 Dassault Systemes SA 20,121 0.30
3,115 Davide Campari-Milano SpA 17,086 0.25 3,385 De'Longhi SpA 23,018 0.34
328 Demag Cranes AG 19,136 0.28 2,907 Derichebourg SA 7,980 0.12
378 Deutsche Beteiligungs AG 5,693 0.08 665 Deutsche Euroshop AG 16,758 0.25
1,175 Deutsche Wohnen AG 11,750 0.17 2,773 Deutz AG 11,599 0.17
768 DIC Asset AG 4,416 0.07 139 Draegerwerk AG & Company KGaA 10,008 0.15
1,452 Edenred 26,049 0.39 24,379 Edison SpA 23,075 0.34 5,520 EDP Renovaveis SA 22,577 0.33 1,808 Elan Corp Plc 14,410 0.21 3,743 Ellaktor SA 5,465 0.08
257 ElringKlinger AG 4,531 0.07 1,401 Esprinet SpA 4,382 0.06 1,912 Etablissements Maurel et Prom 23,537 0.35

PowerShares Global Funds Ireland plc
Annual Report and Audited Financial Statements for the year ended 30 September 2011
231
Schedule of Investments
PowerShares FTSE RAFI Developed Europe Mid-Small Fund (continued)
Nominal Security Description Fair Value EUR
% of Net Assets
Euro Countries (continued) 300 Euler Hermes SA 13,572 0.20 635 Eurocommercial Properties NV 18,244 0.27 957 Euronav NV 4,144 0.06 716 Eutelsat Communications SA 21,623 0.32 133 EVS Broadcast Equipment SA 5,194 0.08 204 FFP 7,200 0.11 129 Fielmann AG 9,706 0.14
1,525 Finnair OYJ 4,484 0.07 271 Flughafen Wien AG 8,668 0.13 601 Fraport AG Frankfurt Airport Services Worldwide 26,711 0.40 264 Fuchs Petrolub AG PFD 8,206 0.12 351 Fuchs Petrolub AG 10,609 0.16
1,842 GAGFAH SA 8,412 0.12 367 Gecina SA 24,182 0.36
17,118 Gemina SpA 10,365 0.15 1,828 Geox SpA 5,005 0.07
340 Gerry Weber International AG 7,307 0.11 1,210 Gildemeister AG 11,614 0.17
173 Gimv NV 6,356 0.09 2,657 Glanbia Plc 11,824 0.17 5,727 Grafton Group Plc 15,262 0.23
14,893 Greencore Group Plc 9,651 0.14 1,617 Grifols SA 22,703 0.34
606 Grontmij NV 6,424 0.10 651 Groupe Steria SCA 8,229 0.12
1,311 Grupo Catalana Occidente SA 16,230 0.24 4,196 Grupo Empresarial Ence SA 8,140 0.12 5,114 Gruppo Editoriale L'Espresso SpA 6,152 0.09
440 H&R AG 6,534 0.10 363 Hamburger Hafen und Logistik AG 7,601 0.11
7,144 Havas SA 19,717 0.29 8,397 Heidelberger Druckmaschinen AG 13,183 0.20 1,251 Heijmans NV 12,635 0.19 1,419 Hellenic Exchanges SA Holding Clearing Settlement
and Registry 4,158
0.06
2,334 Hellenic Petroleum SA 13,724 0.20 19,566 Hera SpA 22,305 0.33
167 Hermes International 37,716 0.56 1,566 HKScan OYJ 7,235 0.11
170 Hugo Boss AG 10,248 0.15 3,508 Iberdrola SA 17,789 0.26
352 ICADE 20,712 0.31

PowerShares Global Funds Ireland plc
Annual Report and Audited Financial Statements for the year ended 30 September 2011
232
Schedule of Investments
PowerShares FTSE RAFI Developed Europe Mid-Small Fund (continued)
Nominal Security Description Fair Value EUR
% of Net Assets
Euro Countries (continued) 77 Iliad SA 6,468 0.10
8,032 IMMSI SpA 4,699 0.07 13,746 Impregilo SpA 25,636 0.38 15,250 Independent News & Media Plc 3,660 0.05 1,802 Indesit Co SpA 8,451 0.13
219 Ingenico 6,174 0.09 1,309 Interpump Group SpA 5,576 0.08 5,460 Intralot SA-Integrated Lottery Systems & Services 4,750 0.07
263 Ipsen SA 5,949 0.09 409 IPSOS 9,908 0.15
16,472 Iren SpA 14,438 0.21 680 Italmobiliare Rsp 8,833 0.13 277 Italmobiliare SpA 5,540 0.08
2,613 IVG Immobilien AG 6,877 0.10 735 JCDecaux SA 13,726 0.20
1,212 Jenoptik AG 5,658 0.08 2,280 Jeronimo Martins SGPS SA 26,789 0.40 1,982 JUMBO SA 7,690 0.11
414 Jungheinrich AG 8,290 0.12 618 Kabel Deutschland Holding AG 24,955 0.37
2,045 Kemira OYJ 16,922 0.25 2,346 Kingspan Group Plc 14,663 0.22 1,014 Kloeckner & Co SE 9,450 0.14
846 Konecranes OYJ 12,851 0.19 564 Koninklijke Ten Cate NV 13,096 0.19 467 Koninklijke Vopak NV 16,819 0.25
6,254 Koninklijke Wessanen NV 21,001 0.31 982 Kontron AG 5,350 0.08 272 Krones AG 10,639 0.16 13 KSB AG 5,135 0.08
591 KUKA AG 7,970 0.12 692 Lassila & Tikanoja OYJ 7,301 0.11 800 Leoni AG 19,404 0.29
2,037 Lottomatica SpA 23,975 0.35 2,993 Maire Tecnimont SpA 1,871 0.03
279 Manitou BF SA 3,334 0.05 25,217 Marfin Investment Group SA 6,052 0.09
862 MARR SpA 6,693 0.10 156 Mayr Melnhof Karton AG 10,539 0.16
2,674 Mediaset Espana Comunicacion SA 11,471 0.17 530 Medica SA 7,054 0.10
6,365 Mediolanum SpA 17,504 0.26

PowerShares Global Funds Ireland plc
Annual Report and Audited Financial Statements for the year ended 30 September 2011
233
Schedule of Investments
PowerShares FTSE RAFI Developed Europe Mid-Small Fund (continued)
Nominal Security Description Fair Value EUR
% of Net Assets
Euro Countries (continued) 638 Medion AG 9,570 0.14
1,826 Mediq NV 20,780 0.31 1,496 Melia Hotels International SA 7,405 0.11
431 Mercialys SA 11,503 0.17 346 Mersen 10,309 0.15
33,193 Milano Assicurazioni SPA 11,286 0.17 479 Mobistar SA 20,573 0.30
6,055 Mota-Engil SGPS SA 6,261 0.09 2,660 Motor Oil Hellas Corinth Refineries SA 16,332 0.24 9,387 M-real OYJ 14,644 0.22
684 MTU Aero Engines Holding AG 32,250 0.48 3,162 Mytilineos Holdings SA 10,024 0.15
776 Nexity SA 16,141 0.24 6,064 NH Hoteles SA 19,011 0.28
930 Nieuwe Steen Investments NV 10,402 0.15 2,595 Nyrstar 17,200 0.25 1,116 Oesterreichische Post AG 23,838 0.35
386 Omega Pharma 13,317 0.20 2,178 Ordina NV 3,139 0.05 2,808 Oriola-KD OYJ 4,746 0.07 1,876 Orion OYJ 28,402 0.42
418 Paddy Power Plc 16,093 0.24 286 Pescanova SA 6,767 0.10 84 Pfeiffer Vacuum Technology AG 5,559 0.08
3,836 Piaggio & C SpA 9,245 0.14 146 Pierre & Vacances 4,380 0.06 786 Plastic Omnium SA 14,187 0.21
4,405 Portucel Empresa Produtora de Pasta e Papel SA 7,731 0.11 1,003 Poyry OYJ 5,908 0.09
30,518 Prelios SpA 6,378 0.09 10,639 Promotora de Informaciones SA 8,618 0.13
377 Prosegur Cia de Seguridad SA 12,072 0.18 1,079 ProSiebenSat.1 Media AG 14,361 0.21
85 Puma SE 18,683 0.28 3,745 Q-Cells SE 2,210 0.03 2,041 QIAGEN NV 21,288 0.32 1,075 Ramirent OYJ 4,988 0.07 1,567 Recordati SpA 10,240 0.15
716 Red Electrica Corp SA 24,502 0.36 262 Remy Cointreau SA 13,585 0.20 254 Rheinmetall AG 8,994 0.13 576 RHI AG 8,640 0.13

PowerShares Global Funds Ireland plc
Annual Report and Audited Financial Statements for the year ended 30 September 2011
234
Schedule of Investments
PowerShares FTSE RAFI Developed Europe Mid-Small Fund (continued)
Nominal Security Description Fair Value EUR
% of Net Assets
Euro Countries (continued) 2,871 RHJ International 11,111 0.16 1,215 Rhoen Klinikum AG 18,486 0.27
418 Rubis 15,892 0.24 1,331 S IMMO AG 5,284 0.08
288 Sa des Ciments Vicat 14,096 0.21 1,162 Safilo Group SpA 6,838 0.10
413 Saft Groupe SA 8,343 0.12 1,382 Sanoma OYJ 12,231 0.18
102 Schoeller-Bleckmann Oilfield Equipment AG 5,280 0.08 326 SEB SA 19,769 0.29 95 Seche Environnement SA 3,515 0.05
617 Sechilienne-Sidec 7,805 0.12 1,512 Semapa-Sociedade de Investimento e Gestao 7,923 0.12
272 Semperit AG Holding 8,163 0.12 1,017 Sequana SA 4,677 0.07 1,144 SGL Carbon SE 45,473 0.68
761 Sixt AG 10,840 0.16 830 Sixt AG PFD 10,259 0.15
3,289 Sky Deutschland AG 6,371 0.09 494 Sligro Food Group NV 12,399 0.18
1,232 Societa Cattolica di Assicurazioni SCRL 19,909 0.29 1,393 Societa Iniziative Autostradali e Servizi SpA 8,045 0.12
558 Societe BIC SA 35,694 0.53 137 Societe de la Tour Eiffel 5,851 0.09
1,398 Societe d'Edition de Canal + 6,175 0.09 182 Societe Immobiliere de Location pour l'Industrie et le
Commerce 13,188
0.20
288 Sofina SA 18,023 0.27 468 Software AG 11,110 0.16
1,326 SOITEC 5,392 0.08 1,902 Solarworld AG 5,953 0.09 4,029 Sonae Industria SGPS SA 3,384 0.05 5,292 Sonaecom - SGPS SA 5,969 0.09
96 Sopra Group SA 4,100 0.06 5,407 Sorin SpA 8,878 0.13 5,158 Sponda OYJ 14,546 0.22 1,095 Stada Arzneimittel AG 17,306 0.26
591 Stockmann OYJ Abp 7,447 0.11 1,619 Strabag SE 37,220 0.55 1,440 Suedzucker AG 30,801 0.46 4,582 Technicolor SA 10,222 0.15
351 Tecnicas Reunidas SA 8,456 0.13

PowerShares Global Funds Ireland plc
Annual Report and Audited Financial Statements for the year ended 30 September 2011
235
Schedule of Investments
PowerShares FTSE RAFI Developed Europe Mid-Small Fund (continued)
Nominal Security Description Fair Value EUR
% of Net Assets
Euro Countries (continued) 737 Telenet Group Holding NV 20,338 0.30
1,086 Teleperformance SA 17,360 0.26 1,003 Tessenderlo Chemie NV 20,622 0.31 2,254 Tieto OYJ 21,357 0.32 1,269 Titan Cement Co SA 12,804 0.19
458 TKH Group NV 6,948 0.10 121 Tod's SpA 7,708 0.11
1,735 TomTom NV 4,629 0.07 640 Trevi Finanziaria Industriale SpA 4,925 0.07
2,353 TT Hellenic Postbank SA 1,812 0.03 3,260 Tubacex SA 5,852 0.09 3,208 UBISOFT Entertainment 13,095 0.19
273 Unit 4 NV 5,015 0.07 4,748 United Drug Plc 10,920 0.16 1,038 United Internet AG 13,214 0.20 2,303 Uponor OYJ 14,210 0.21
740 Vastned Offices/Industrial NV 7,245 0.11 486 Vastned Retail NV 17,433 0.26 790 Verbund AG 17,123 0.25 75 Vilmorin & Cie 5,493 0.08
2,316 Viohalco 7,759 0.11 57 Virbac SA 6,948 0.10
476 Viscofan SA 12,866 0.19 151 Vossloh AG 11,182 0.17 200 Wacker Chemie AG 13,450 0.20
2,107 Wavin NV 12,242 0.18 2,460 Zardoya Otis SA 23,518 0.35 6,400 Zon Multimedia Servicos de Telecomunicacoes e
Multimedia SGPS SA 14,566
0.22
Total Euro Countries 3,510,630 51.96 Gibraltar
4,030 Bwin.Party Digital Entertainment Plc 5,783 0.09 Total Gibraltar 5,783 0.09 Guernsey
5,505 Stobart Group Ltd 8,181 0.12 Total Guernsey 8,181 0.12 Jersey
8,100 Beazley Plc 10,956 0.16 3,435 Charter International Plc 34,579 0.52

PowerShares Global Funds Ireland plc
Annual Report and Audited Financial Statements for the year ended 30 September 2011
236
Schedule of Investments
PowerShares FTSE RAFI Developed Europe Mid-Small Fund (continued)
Nominal Security Description Fair Value EUR
% of Net Assets
Jersey (continued) 16,081 Henderson Group Plc 19,175 0.28 1,566 Petrofac Limited 21,782 0.32
286 Randgold Resources Ltd 20,887 0.31 12,531 Regus Plc 10,723 0.16
Total Jersey 118,102 1.75 Liechtenstein
128 Liechtensteinische Landesbank AG 5,420 0.08 75 Verwaltungs- und Privat-Bank AG 5,723 0.08
Total Liechtenstein 11,143 0.16 Luxembourg
6,408 Colt Group SA 7,552 0.11 1,475 Subsea 7 SA 21,234 0.32
Total Luxembourg 28,786 0.43 Norway
1,649 Atea ASA 9,881 0.15 1,048 Austevoll Seafood ASA 2,727 0.04 1,126 Cermaq ASA 9,006 0.13 4,971 DNO International ASA 3,446 0.05
441 Fred Olsen Energy ASA 9,467 0.14 37,102 Marine Harvest ASA 12,143 0.18 4,741 Norwegian Energy Co AS 2,468 0.04 7,518 Norwegian Property ASA 7,521 0.11 8,958 Renewable Energy Corp ASA 5,953 0.09
942 Schibsted ASA 15,187 0.22 1,419 SpareBank 1 SMN 7,080 0.10
901 TGS Nopec Geophysical Co ASA 12,615 0.19 1,637 Tomra Systems ASA 7,939 0.12
Total Norway 105,433 1.56 Sweden
805 AarhusKarlshamn AB 14,283 0.21 456 AF AB 4,948 0.07 233 Avanza Bank Holding AB 4,147 0.06 440 Axis Communications AB 5,431 0.08
1,651 BE Group AB 4,175 0.06 1,702 Billerud AB 8,625 0.13 1,610 Bure Equity AB 3,320 0.05 2,969 Castellum AB 27,177 0.40 1,042 Clas Ohlson AB 8,537 0.13

PowerShares Global Funds Ireland plc
Annual Report and Audited Financial Statements for the year ended 30 September 2011
237
Schedule of Investments
PowerShares FTSE RAFI Developed Europe Mid-Small Fund (continued)
Nominal Security Description Fair Value EUR
% of Net Assets
Sweden (continued) 810 Concentric AB 2,637 0.04 461 Elekta AB 13,012 0.19
9,488 Eniro AB 13,848 0.20 3,345 Fabege AB 18,985 0.28 1,398 Gunnebo AB 4,339 0.06
785 Hakon Invest AB 8,195 0.12 810 Haldex AB 2,294 0.03 511 Hoganas AB 10,231 0.15 138 HQ AB 61 0.00
2,203 Hufvudstaden AB 15,946 0.24 1,183 Intrum Justitia AB 10,880 0.16 1,189 JM AB 11,483 0.17 2,542 KappAhl AB 3,834 0.06 2,481 Klovern AB 6,758 0.10 4,681 Kungsleden AB 23,875 0.35 1,881 Lindab International AB 8,885 0.13 1,547 Loomis AB 13,514 0.20 2,983 Lundin Petroleum AB 38,068 0.56 4,836 Meda AB 33,193 0.49
310 Mekonomen AB 7,216 0.11 1,118 Modern Times Group AB 33,667 0.50
679 Nibe Industrier AB 7,313 0.11 7,794 Niscayah Group AB 14,717 0.22 3,538 Nobia AB 9,138 0.14 1,034 Oresund Investment AB 9,846 0.15
21,766 PA Resources AB 4,630 0.07 2,025 Rezidor Hotel Group AB 4,417 0.07
451 SkiStar AB 4,552 0.07 1,849 Wallenstam AB 12,641 0.19
930 Wihlborgs Fastigheter AB 8,805 0.13 Total Sweden 437,623 6.48 Switzerland
511 Actelion Ltd 12,705 0.19 495 AFG Arbonia-Forster Holding 6,499 0.10 81 Allreal Holding AG 9,332 0.14 85 Autoneum Holding AG 3,829 0.06
448 Bank Sarasin & Cie AG 10,238 0.15 45 Banque Cantonale Vaudoise 17,346 0.26 29 Barry Callebaut AG 18,252 0.27
250 BB Biotech AG 11,067 0.16 287 BKW FMB Energie AG 10,080 0.15

PowerShares Global Funds Ireland plc
Annual Report and Audited Financial Statements for the year ended 30 September 2011
238
Schedule of Investments
PowerShares FTSE RAFI Developed Europe Mid-Small Fund (continued)
Nominal Security Description Fair Value EUR
% of Net Assets
Switzerland (continued) 145 Bucher Industries AG 16,943 0.25 31 Burckhardt Compression Holding AG 4,594 0.07
196 Charles Voegele Holding AG 4,423 0.07 101 Daetwyler Holding AG 4,127 0.06 147 Dufry AG 9,632 0.14 841 EFG International AG 4,658 0.07 41 Emmi AG 6,557 0.10
199 EMS-Chemie Holding AG 25,832 0.37 46 Flughafen Zuerich AG 12,966 0.19 31 Forbo Holding AG 9,132 0.14 47 Galenica AG 18,040 0.27 79 Georg Fischer AG 20,679 0.31
153 Huber & Suhner AG 5,336 0.08 43 Kaba Holding AG 10,938 0.16
726 Kudelski SA 4,849 0.07 58 Kuoni Reisen Holding AG 13,017 0.19
2,008 Logitech International SA 11,699 0.17 54 Mobimo Holding AG 9,691 0.14
1,944 Nobel Biocare Holding AG 14,564 0.22 3,907 OC Oerlikon Corp AG 16,767 0.25
351 Panalpina Welttransport Holding AG 22,480 0.33 61 Partners Group Holding AG 7,508 0.11
468 PSP Swiss Property AG 31,374 0.45 85 Rieter Holding AG 10,148 0.15
3,482 Schmolz + Bickenbach AG 17,629 0.26 14 Sika AG 18,565 0.27
316 Sonova Holding AG 21,457 0.32 32 St Galler Kantonalbank AG 10,589 0.16 48 Straumann Holding AG 5,625 0.08
423 Swiss Prime Site AG 25,408 0.38 200 Valiant Holding 20,170 0.30 69 Valora Holding AG 11,211 0.17 5 Vetropack Holding AG 6,224 0.09
608 Vontobel Holding AG 11,475 0.17 160 Zehnder Group AG 6,676 0.10
Total Switzerland 550,331 8.14 United Kingdom
13,566 Aberdeen Asset Management Plc 27,265 0.40 1,665 Admiral Group Plc 24,416 0.36
17,829 Aegis Group Plc 25,772 0.38 3,729 Afren Plc 3,518 0.05

PowerShares Global Funds Ireland plc
Annual Report and Audited Financial Statements for the year ended 30 September 2011
239
Schedule of Investments
PowerShares FTSE RAFI Developed Europe Mid-Small Fund (continued)
Nominal Security Description Fair Value EUR
% of Net Assets
United Kingdom (continued) 1,725 Aggreko Plc 32,626 0.48 2,665 ARM Holdings Plc 17,451 0.26 2,781 Ashmore Group Plc 10,478 0.16
14,364 Ashtead Group Plc 22,181 0.33 2,586 Atkins WS Plc 16,229 0.24 1,413 Autonomy Corporation Plc 41,834 0.62 3,859 Babcock International Group Plc 29,527 0.44 9,742 BBA Aviation Plc 18,946 0.28 2,495 Berkeley Group Holdings Plc 34,472 0.51 2,350 Big Yellow Group Plc 6,518 0.10 6,860 Bodycote Plc 19,697 0.29
39,511 Booker Group Plc 33,373 0.49 4,032 Bovis Homes Group Plc 18,964 0.28 4,076 Brewin Dolphin Holdings Plc 5,651 0.08 6,215 Britvic Plc 22,730 0.34 4,285 Cairn Energy Plc 13,965 0.21 6,477 Capital & Counties Properties Plc 12,634 0.19
926 Carpetright Plc 5,314 0.08 1,848 Chemring Group Plc 11,340 0.17 1,981 Computacenter Plc 8,501 0.13
988 Croda International Plc 18,928 0.28 3,166 CSR Plc 7,719 0.11 4,794 Daily Mail & General Trust Plc 20,211 0.30 4,936 Dairy Crest Group Plc 20,116 0.30 2,688 Davis Service Group Plc 13,436 0.20
984 Derwent London Plc 16,452 0.24 1,999 Devro Plc 5,457 0.08 1,141 Domino Printing Sciences Plc 6,120 0.09
12,129 DS Smith Plc 24,659 0.36 6,918 Elementis Plc 9,920 0.15
17,178 F&C Asset Management Plc 13,034 0.19 3,082 Fenner Plc 11,165 0.17 3,787 Filtrona Plc 15,301 0.23
425 Fresnillo Plc 7,826 0.12 1,410 Galliford Try Plc 7,203 0.11
26,805 Game Group Plc 7,392 0.11 615 Genus Plc 7,483 0.11
1,407 Go-Ahead Group Plc 21,645 0.32 5,415 Grainger Plc 5,445 0.08 3,516 Great Portland Estates Plc 13,880 0.21 2,390 Greggs Plc 12,840 0.19 5,202 Halfords Group Plc 17,648 0.26

PowerShares Global Funds Ireland plc
Annual Report and Audited Financial Statements for the year ended 30 September 2011
240
Schedule of Investments
PowerShares FTSE RAFI Developed Europe Mid-Small Fund (continued)
Nominal Security Description Fair Value EUR
% of Net Assets
United Kingdom (continued) 4,884 Halma Plc 17,897 0.26
928 Hikma Pharmaceuticals Plc 6,142 0.09 953 Hochschild Mining Plc 4,526 0.07
2,871 Homeserve Plc 15,307 0.23 9,092 Howden Joinery Group Plc 10,820 0.16 2,063 Hunting Plc 14,324 0.21 4,121 IG Group Holdings Plc 21,393 0.32 4,671 International Personal Finance Plc 12,110 0.18 7,946 Interserve Plc 27,770 0.41 1,259 Intertek Group Plc 27,116 0.40 2,280 ITE Group Plc 4,185 0.06 2,363 Jardine Lloyd Thompson Group Plc 17,353 0.26 3,565 JD Wetherspoon Plc 16,130 0.24 3,008 John Wood Group Plc 18,510 0.27 1,087 Keller Group Plc 4,222 0.06
977 Kier Group Plc 14,350 0.21 7,529 Laird Plc 12,081 0.18 2,764 London Stock Exchange Group Plc 26,155 0.39
18,706 Marston's Plc 20,199 0.30 6,818 Mcbride Plc 9,460 0.14 4,721 Melrose Plc 15,951 0.24 3,128 Michael Page International Plc 13,394 0.20 2,729 Micro Focus International Plc 10,263 0.15 2,937 Millennium & Copthorne Hotels Plc 13,698 0.20 5,165 Misys Plc 12,893 0.19 9,692 Mitie Group Plc 26,321 0.39 5,014 Morgan Crucible Co Plc 14,257 0.21 2,049 Mothercare Plc 7,494 0.11 4,457 N Brown Group Plc 13,920 0.21 8,288 Northumbrian Water Group Plc 44,601 0.66 3,146 Pace Plc 3,476 0.05 8,706 Paragon Group of Cos Plc 15,516 0.23 1,029 Petropavlovsk Plc 7,115 0.11 5,398 Premier Farnell Plc 9,683 0.14 3,250 Premier Oil Plc 13,105 0.19 2,334 PZ Cussons Plc 8,913 0.13
20,539 QinetiQ Group Plc 27,830 0.41 6,509 Rank Group Plc 8,525 0.13
726 Rathbone Brothers Plc 8,783 0.13 6,665 Redrow Plc 8,667 0.13 3,877 Restaurant Group Plc 12,392 0.18 1,775 Robert Wiseman Dairies Plc 6,183 0.09

PowerShares Global Funds Ireland plc
Annual Report and Audited Financial Statements for the year ended 30 September 2011
241
Schedule of Investments
PowerShares FTSE RAFI Developed Europe Mid-Small Fund (continued)
Nominal Security Description Fair Value EUR
% of Net Assets
United Kingdom (continued) 641 Rotork Plc 11,558 0.17
4,419 RPS Group Plc 8,409 0.12 1,858 Salamander Energy Plc 4,291 0.06 1,910 Savills Plc 6,327 0.09 6,049 Senior Plc 10,149 0.15 2,669 Shaftesbury Plc 14,438 0.21
11,531 Shanks Group Plc 14,794 0.22 2,012 Soco International Plc 7,658 0.11 1,321 Spectris Plc 17,914 0.27
792 Spirax-Sarco Engineering Plc 16,497 0.24 3,820 Spirent Communications Plc 5,433 0.08 5,097 Sports Direct International Plc 12,948 0.19 2,559 St James's Place Plc 9,214 0.14 1,471 Sthree Plc 3,901 0.06
779 Synergy Health Plc 7,751 0.11 6,734 TalkTalk Telecom Group Plc 9,867 0.15 1,126 Telecity Group Plc 7,302 0.11 4,969 Tullett Prebon Plc 19,564 0.29
668 Ultra Electronics Holdings Plc 11,673 0.17 2,672 Unite Group Plc 5,150 0.08
662 Victrex Plc 8,401 0.12 1,679 Weir Group Plc/The 30,197 0.45 4,235 WH Smith Plc 24,276 0.36 4,126 Wincanton Plc 3,832 0.06 2,411 Workspace Group Plc 6,012 0.09
15,538 Xchanging Plc 13,846 0.20 3,064 Yule Catto & Company Plc 5,717 0.08
Total United Kingdom 1,647,431 24.38
Portfolio of Investments 6,751,511 99.92
Current Assets 49,657 0.73
Total Assets 6,801,168 100.65
Current Liabilities (43,917) (0.65)
Net Assets attributable to Holders of Redeemable Participating Shares 6,757,251 100.00

PowerShares Global Funds Ireland plc
Annual Report and Audited Financial Statements for the year ended 30 September 2011
242
Schedule of Investments
PowerShares FTSE RAFI Developed 1000 Fund
Nominal Security Description Fair Value EUR
% of Net Assets
Australia 493 Amcor Ltd/Australia 2,475 0.05 870 AMP Ltd 2,489 0.05 900 Australia & New Zealand Banking Group Ltd 12,726 0.24 640 BHP Billiton Ltd 16,236 0.30
1,581 BlueScope Steel Ltd 836 0.02 427 Brambles Ltd 2,001 0.04 492 Commonwealth Bank of Australia 16,234 0.30 77 CSL Ltd 1,655 0.03
485 Echo Entertainment Group Ltd 1,282 0.02 545 Foster's Group Ltd 2,084 0.04 690 GPT Group 1,569 0.03 944 Insurance Australia Group Ltd 2,065 0.04 318 Lend Lease Group 1,622 0.03 161 Macquarie Group Ltd 2,667 0.05
1,580 Mirvac Group 1,316 0.02 1,003 National Australia Bank Ltd 16,254 0.29
758 OneSteel Ltd 681 0.01 105 Orica Ltd 1,786 0.03 221 Origin Energy Ltd 2,145 0.04
1,015 Qantas Airways Ltd 1,037 0.02 413 QBE Insurance Group Ltd 3,853 0.07 62 Rio Tinto Ltd 2,776 0.05
197 Santos Ltd 1,623 0.03 1,033 Stockland 2,178 0.04
630 Suncorp-Metway Ltd 3,642 0.07 485 TABCORP Holdings Ltd 906 0.02
2,975 Telstra Corp Ltd 6,681 0.12 181 Treasury Wine Estates Ltd 507 0.01 330 Wesfarmers Ltd 7,551 0.14 54 Wesfarmers Ltd - PPS 1,260 0.02
961 Westfield Group 5,395 0.10 997 Westpac Banking Corp 14,690 0.27 105 Woodside Petroleum Ltd 2,470 0.05 414 Woolworths Ltd 7,455 0.14
Total Australia 150,147 2.78 Bermuda
69 Arch Capital Group Limited 1,680 0.03 62 Axis Capital Holdings Ltd 1,199 0.02 97 Bunge Ltd 4,214 0.08
717 Esprit Holdings Ltd 656 0.01 30 Everest Re Group Ltd 1,775 0.03

PowerShares Global Funds Ireland plc
Annual Report and Audited Financial Statements for the year ended 30 September 2011
243
Schedule of Investments
PowerShares FTSE RAFI Developed 1000 Fund (continued)
Nominal Security Description Fair Value EUR
% of Net Assets
Bermuda (continued) 112 Invesco Limited * 1,295 0.02 133 Nabors Industries Ltd 1,215 0.02
1,854 Noble Group Ltd 1,410 0.03 35 PartnerRe Ltd 1,364 0.03
Total Bermuda 14,808 0.27 Canada
29 Agrium Inc. 1,447 0.03 272 Bank of Montreal 11,414 0.21 300 Bank of Nova Scotia 11,312 0.21 121 Barrick Gold Corp 4,250 0.08 126 BCE, Inc. 3,541 0.07 485 Bombardier Inc 1,273 0.02
6 Bombardier Inc 'A' 16 0.00 155 Brookfield Asset Management Inc 3,213 0.06 119 Canadian Imperial Bank of Commerce/Canada 6,246 0.12 97 Canadian National Railway Co 4,859 0.09
170 Canadian Natural Resources Ltd 3,741 0.07 56 Canadian Pacific Railway Ltd 2,024 0.04 36 Canadian Tire Corp Ltd 1,468 0.03
143 Cenovus Energy Inc 3,301 0.06 184 Enbridge Inc 4,402 0.08 435 Encana Corp 6,276 0.12
9 Fairfax Financial Holdings Ltd 2,586 0.05 37 George Weston Ltd 1,832 0.03 91 Goldcorp, Inc. 3,129 0.06
113 Great-West Lifeco, Inc. 1,666 0.03 107 Husky Energy, Inc. 1,737 0.03 67 Imperial Oil Ltd 1,804 0.03 62 Loblaw Cos Ltd 1,749 0.03
114 Magna International Inc 2,825 0.05 857 Manulife Financial Corp 7,319 0.14 50 Metro Inc 1,639 0.03 57 National Bank of Canada 2,849 0.05
178 Nexen Inc 2,075 0.04 106 Onex Corporation 2,476 0.05 65 Potash Corp of Saskatchewan Inc 2,115 0.04
277 Power Corp of Canada 4,551 0.08 134 Power Financial Corporation 2,459 0.05 76 Research In Motion Ltd 1,161 0.02
130 Rogers Communications - Class B 3,335 0.06 444 Royal Bank of Canada 15,262 0.27

PowerShares Global Funds Ireland plc
Annual Report and Audited Financial Statements for the year ended 30 September 2011
244
Schedule of Investments
PowerShares FTSE RAFI Developed 1000 Fund (continued)
Nominal Security Description Fair Value EUR
% of Net Assets
Canada (continued) 124 Shaw Communications Inc 1,886 0.03 66 Shoppers Drug Mart Corp 1,928 0.04
295 Sun Life Financial Inc 5,281 0.10 239 Suncor Energy Inc 4,574 0.08 272 Talisman Energy Inc 2,506 0.05 110 Teck Resources Ltd 2,433 0.05 22 TELUS Corp 769 0.01 28 Telus Corporation 1,028 0.02 97 Thomson Reuters Corp 1,970 0.04
256 Toronto-Dominion Bank/The 13,658 0.25 106 Transalta Corp 1,729 0.03 223 TransCanada Corp 6,785 0.13
Total Canada 175,899 3.26 Denmark
1 AP Moller - Maersk A/S - B Shares 4,424 0.08 33 Carlsberg A/S 1,467 0.03
484 Danske Bank A/S 5,110 0.09 41 Novo Nordisk A/S 3,063 0.06 85 Vestas Wind Systems A/S 1,037 0.02
Total Denmark 15,101 0.28 Euro Countries
89 Abertis Infraestructuras SA 1,032 0.02 107 Accor SA 2,156 0.04 112 Acerinox SA 949 0.02 131 ACS Actividades de Construccion y Servicios SA 3,483 0.06 62 Adidas AG 2,838 0.05
2,122 Aegon NV 6,502 0.12 2,875 Ageas 3,778 0.07
234 Air France-KLM 1,297 0.02 75 Air Liquide SA 6,599 0.12
112 Akzo Nobel NV 3,732 0.07 1,025 Alcatel-Lucent/France 2,251 0.04
337 Allianz SE 23,880 0.44 580 Alpha Bank AE 771 0.01 109 Alstom SA 2,711 0.05 146 Anheuser-Busch InBev NV 5,807 0.11 54 APERAM 593 0.01
680 ArcelorMittal 8,214 0.15 50 ASML Holding NV 1,304 0.02
1,107 Assicurazioni Generali SpA 13,218 0.25

PowerShares Global Funds Ireland plc
Annual Report and Audited Financial Statements for the year ended 30 September 2011
245
Schedule of Investments
PowerShares FTSE RAFI Developed 1000 Fund (continued)
Nominal Security Description Fair Value EUR
% of Net Assets
Euro Countries (continued) 106 Atlantia SpA 1,147 0.02
2,119 AXA SA 20,978 0.39 3,782 Banca Monte dei Paschi di Siena SpA 1,585 0.03
202 Banca Popolare dell'Emilia Romagna Scarl 1,481 0.03 649 Banca Popolare di Milano Scarl 1,214 0.02
2,831 Banco Bilbao Vizcaya Argentaria SA Argenta 17,496 0.32 2,831 Banco Bilbao Vizcaya Argentaria SA RTS 311 0.01 3,465 Banco Comercial Portugues SA 676 0.01 1,131 Banco de Sabadell SA 3,037 0.06 1,839 Banco Popolare SC 2,299 0.04 1,013 Banco Popular Espanol SA 3,525 0.07 5,369 Banco Santander SA 33,416 0.62
383 BASF SE 17,651 0.33 273 Bayer AG 11,316 0.21 151 Bayerische Motoren Werke AG 7,545 0.14 82 Belgacom SA 1,858 0.03
578 BNP Paribas SA 17,369 0.32 207 Bouygues SA 5,162 0.10 466 CaixaBank 1,547 0.03 466 CaixaBank RTS 28 0.00 68 Cap Gemini SA 1,707 0.03
495 Carrefour SA 8,484 0.16 36 Casino Guichard Perrachon SA 2,115 0.04
100 Celesio AG 990 0.02 28 Christian Dior SA 2,367 0.04
308 Cie de St-Gobain 8,892 0.16 60 Cie Generale de Geophysique - Veritas 810 0.02 65 Cie Generale des Etablissements Michelin 2,939 0.05 36 Cie Generale d'Optique Essilor International SA 1,944 0.04
181 CNP Assurances 2,001 0.04 913 Commerzbank AG 1,734 0.03 34 Continental AG 1,484 0.03
784 Credit Agricole SA 4,100 0.08 418 CRH Plc 4,868 0.09 609 Daimler AG 20,481 0.38 91 Delhaize Group SA 3,996 0.07
154 Delta Lloyd NV 1,840 0.03 538 Deutsche Bank AG 14,160 0.26 57 Deutsche Boerse AG 2,160 0.04
220 Deutsche Lufthansa AG 2,146 0.04 790 Deutsche Post AG 7,604 0.14
3,160 Deutsche Telekom AG 27,906 0.52

PowerShares Global Funds Ireland plc
Annual Report and Audited Financial Statements for the year ended 30 September 2011
246
Schedule of Investments
PowerShares FTSE RAFI Developed 1000 Fund (continued)
Nominal Security Description Fair Value EUR
% of Net Assets
Euro Countries (continued) 1,484 Dexia SA 2,147 0.04
495 Distribuidora Internacional de Alimentacion SA 1,471 0.03 1,513 E.ON AG 24,745 0.46
137 EDF SA 2,988 0.06 1,817 EDP - Energias de Portugal SA 4,206 0.08
505 EFG Eurobank Ergasias SA 470 0.01 48 Eiffage SA 1,118 0.02 80 Endesa SA 1,394 0.03
5,735 Enel SpA 19,052 0.35 2,041 ENI SpA 26,982 0.50
134 Erste Group Bank AG 2,594 0.05 176 European Aeronautic Defence and Space Co NV 3,732 0.07 205 Ferrovial SA 1,761 0.03 283 Fiat Industrial SpA 1,603 0.03
1,162 Fiat SpA 4,757 0.09 402 Finmeccanica SpA 2,100 0.04 66 Fomento de Construcciones y Contratas SA 1,228 0.02
473 Fondiaria-Sai SpA 747 0.01 195 Fortum OYJ 3,452 0.06
1,745 France Telecom SA 21,464 0.40 49 Fresenius Medical Care AG & Co KGaA 2,500 0.05 24 Fresenius SE & Co KGaA 1,600 0.03
225 Gas Natural SDG SA 2,876 0.05 776 GDF Suez 17,413 0.32
6,144 Governor & Co of the Bank of Ireland/The 473 0.01 34 Groupe Bruxelles Lambert SA 1,801 0.03
184 Groupe Danone SA 8,501 0.16 110 HeidelbergCement AG 3,015 0.06 49 Heineken Holding NV 1,418 0.03 73 Heineken NV 2,448 0.05
365 Hellenic Telecommunications Organization SA 1,168 0.02 49 Henkel AG & Co KGaA VORZUG 1,960 0.04 37 Henkel AG & Co KGaA 1,219 0.02 31 Hochtief AG 1,460 0.03
2,624 Iberdrola SA 13,306 0.25 491 IMMOFINANZ AG 1,052 0.02 47 Inditex SA 3,025 0.06
244 Infineon Technologies AG 1,363 0.03 8,192 ING Groep NV 43,687 0.80 8,725 Intesa Sanpaolo SpA 10,383 0.19
247 Italcementi SpA 538 0.01 130 Italcementi SpA RSP 588 0.01

PowerShares Global Funds Ireland plc
Annual Report and Audited Financial Statements for the year ended 30 September 2011
247
Schedule of Investments
PowerShares FTSE RAFI Developed 1000 Fund (continued)
Nominal Security Description Fair Value EUR
% of Net Assets
Euro Countries (continued) 33 K+S AG 1,306 0.02
176 KBC Groep NV 3,080 0.06 61 Kesko OYJ 1,412 0.03
679 Koninklijke Ahold NV 5,986 0.11 85 Koninklijke DSM NV 2,794 0.05
898 Koninklijke KPN NV 8,891 0.16 432 Koninklijke Philips Electronics NV 5,854 0.11 168 Lafarge SA 4,368 0.08 96 Lagardere SCA 1,777 0.03 30 Lanxess AG 1,087 0.02 48 Legrand SA 1,130 0.02 31 Linde AG 3,123 0.06 63 L'Oreal SA 4,623 0.09 67 LVMH Moet Hennessy Louis Vuitton SA 6,677 0.12 50 MAN SE 2,920 0.05
665 Mediaset SpA 1,576 0.03 351 Mediobanca SpA 2,076 0.04 113 Metro AG 3,608 0.07 78 Metso OYJ 1,723 0.03
160 Muenchener Rueckversicherungs AG 14,968 0.28 729 National Bank of Greece SA 2,005 0.04 523 Natixis 1,246 0.02 110 Neste Oil OYJ 719 0.01 23 Nexans SA 1,007 0.02
3,111 Nokia OYJ 13,216 0.25 119 OMV AG 2,680 0.05 187 OPAP SA 1,421 0.03 808 Parmalat SpA 1,281 0.02 72 Pernod-Ricard SA 4,236 0.08
315 Peugeot SA 5,092 0.09 1,143 Piraeus Bank SA 537 0.01
50 Porsche Automobil Holding SE 1,811 0.03 593 Portugal Telecom SGPS SA 3,262 0.06 196 PostNL NV 649 0.01 49 PPR 4,774 0.09 37 Publicis Groupe SA 1,162 0.02 42 Randstad Holding NV 1,015 0.02
202 Renault SA 5,064 0.09 788 Repsol YPF SA 15,744 0.29 305 RWE AG 8,455 0.16 61 Safran SA 1,413 0.03 58 Saipem SpA 1,540 0.03

PowerShares Global Funds Ireland plc
Annual Report and Audited Financial Statements for the year ended 30 September 2011
248
Schedule of Investments
PowerShares FTSE RAFI Developed 1000 Fund (continued)
Nominal Security Description Fair Value EUR
% of Net Assets
Euro Countries (continued) 37 Salzgitter AG 1,341 0.02
232 Sampo OYJ 4,392 0.08 617 Sanofi Aventis SA 30,449 0.56 141 SAP AG 5,402 0.10 148 Schneider Electric SA 6,004 0.11 102 SCOR SE 1,657 0.03 94 SES SA 1,717 0.03
268 Siemens AG 18,256 0.34 456 Snam Rete Gas SpA 1,578 0.03 446 SNS REAAL NV 846 0.02 458 Societe Generale SA 9,160 0.17 54 Sodexo 2,678 0.05 22 Solvay SA 1,562 0.03
279 STMicroelectronics NV 1,377 0.03 342 Stora Enso OYJ 1,512 0.03 199 Suez Environnement Co 2,080 0.04 30 Technip SA 1,816 0.03
15,710 Telecom Italia SpA 12,874 0.24 7,081 Telecom Italia RSP 5,190 0.10 2,196 Telefonica SA 31,677 0.59
259 Telekom Austria AG 1,963 0.04 116 Tenaris SA 1,104 0.02 490 Terna Rete Elettrica Nazionale SpA 1,362 0.03 280 ThyssenKrupp AG 5,193 0.10 196 TNT Express NV 1,023 0.02
1,391 Total SA 46,229 0.85 343 TUI AG 1,330 0.02 64 UCB SA 2,053 0.04 26 Umicore SA 714 0.01 34 Unibail-Rodamco SE 4,575 0.08
17,182 UniCredit SpA 13,789 0.26 477 Unilever NV 11,331 0.21 715 Unione di Banche Italiane SCPA 2,003 0.04
2,415 Unipol Gruppo Finanziario PFD 771 0.01 3,666 Unipol Gruppo Finanziario SpA 830 0.02
319 UPM-Kymmene OYJ 2,719 0.05 44 Valeo SA 1,401 0.03 47 Vallourec SA 2,045 0.04
403 Veolia Environnement SA 4,461 0.08 229 Vinci SA 7,424 0.14 852 Vivendi SA 13,065 0.24 81 Voestalpine AG 1,778 0.03

PowerShares Global Funds Ireland plc
Annual Report and Audited Financial Statements for the year ended 30 September 2011
249
Schedule of Investments
PowerShares FTSE RAFI Developed 1000 Fund (continued)
Nominal Security Description Fair Value EUR
% of Net Assets
Euro Countries (continued) 16 Volkswagen AG 1,491 0.03 94 Volkswagen AG - PFD 9,405 0.17 35 Wartsila OYJ 627 0.01
127 Wolters Kluwer NV 1,553 0.03 Total Euro Countries 1,054,404 19.55 Guernsey
723 Resolution Ltd 2,077 0.04 Total Guernsey 2,077 0.04 Hong Kong
1,600 Aia Group Ltd 3,416 0.06 600 Bank of East Asia Ltd 1,387 0.03
1,218 BOC Hong Kong Holdings Ltd 1,947 0.04 471 CLP Holdings Ltd 3,181 0.06 237 Hang Seng Bank Ltd 2,084 0.04 371 Hongkong Electric Holdings Ltd 2,126 0.04
1,192 Hutchison Whampoa Ltd 6,671 0.12 1,500 New World Development Ltd 1,086 0.02 1,000 Sun Hung Kai Properties Ltd 8,660 0.16
208 Swire Pacific Ltd 1,603 0.03 Total Hong Kong 32,161 0.60 Ireland
133 Accenture Plc 5,222 0.09 40 Cooper Industries Plc 1,375 0.03
108 Covidien Plc 3,550 0.07 97 Ingersoll-Rand Plc 2,031 0.04
288 Seagate Technology Plc 2,207 0.04 192 XL Group Plc 2,690 0.05
Total Ireland 17,075 0.32 Israel
152 Teva Pharmaceutical Industries Ltd 4,016 0.07 Total Israel 4,016 0.07 Japan
507 Aeon Company Ltd 5,143 0.10 120 Aisin Seiki Co Ltd 3,024 0.06 132 Asahi Group Holdings Ltd 2,105 0.04
1,000 Asahi Kasei Corp 4,535 0.08 120 Astellas Pharma, Inc. 3,413 0.06

PowerShares Global Funds Ireland plc
Annual Report and Audited Financial Statements for the year ended 30 September 2011
250
Schedule of Investments
PowerShares FTSE RAFI Developed 1000 Fund (continued)
Nominal Security Description Fair Value EUR
% of Net Assets
Japan (continued) 269 Bridgestone Corporation 4,609 0.09 475 Canon, Inc. 16,305 0.30
1 Central Japan Railway Co 6,546 0.12 395 Chubu Electric Power Company, Inc. 5,584 0.10 132 Chugoku Electric Power Co Inc/The 1,750 0.03
1,200 Cosmo Oil Co Ltd 2,251 0.04 100 Credit Saison Co Ltd 1,459 0.03
5 Dai-ichi Life Insurance Co Ltd/The 3,926 0.07 232 Daiichi Sankyo Company Ltd 3,634 0.07 100 Daikin Industries Ltd 2,162 0.04
1,000 Daiwa Securities Group Inc 2,823 0.05 132 Denso Corporation 3,205 0.06 120 East Japan Railway Co 5,465 0.10 100 Eisai Co Ltd 3,022 0.06 120 Electric Power Development Co Ltd 2,659 0.05 232 Fujifilm Holdings Corporation 4,072 0.08
1,000 Fujitsu Ltd 3,568 0.07 1,000 Hankyu Hanshin Holdings Inc 3,210 0.06 2,700 Hitachi Limited 10,156 0.19
120 Hokkaido Electric Power Co Inc 1,330 0.02 120 Hokuriku Electric Power Co 1,672 0.03 566 Honda Motor Company Ltd 12,582 0.23 120 Hoya Corp 2,092 0.04
1 Inpex Corp 4,680 0.09 200 Isetan Mitsukoshi Holdings Ltd 1,526 0.03 50 Isuzu Motors Ltd 162 0.00
600 ITOCHU Corporation 4,340 0.08 1 Japan Tobacco Inc 3,515 0.07
362 JFE Holdings, Inc. 5,520 0.10 132 JS Group Corp 2,786 0.05 200 JTEKT Corp 1,812 0.03
1,200 Kajima Corp 2,982 0.06 427 Kansai Electric Power Company, Inc. 5,566 0.10 150 Kao Corp 3,139 0.06
1,000 Kawasaki Heavy Industries Ltd 1,934 0.04 1,000 Kawasaki Kisen Kaisha Ltd 1,576 0.03
2 KDDI Corp 10,366 0.19 1,450 Kobe Steel Ltd 1,837 0.03
282 Komatsu Ltd 4,633 0.09 500 Konica Minolta Holdings Inc 2,587 0.05 100 Kyocera Corp 6,324 0.12 249 Kyushu Electric Power Company, Inc. 3,017 0.06

PowerShares Global Funds Ireland plc
Annual Report and Audited Financial Statements for the year ended 30 September 2011
251
Schedule of Investments
PowerShares FTSE RAFI Developed 1000 Fund (continued)
Nominal Security Description Fair Value EUR
% of Net Assets
Japan (continued) 1,200 Marubeni Corporation 5,094 0.09 1,500 Mazda Motor Corporation 2,292 0.04
367 Medipal Holdings Corp 2,793 0.05 851 Mitsubishi Chemical Holdings Corporation 4,353 0.08 529 Mitsubishi Corporation 8,143 0.15
1,000 Mitsubishi Electric Corp 6,720 0.12 2,200 Mitsubishi Heavy Industries Ltd 6,999 0.13 1,200 Mitsubishi Materials Corp 2,216 0.04 2,450 Mitsubishi Motors Corporation 2,440 0.05 6,440 Mitsubishi UFJ Financial Group Inc 22,044 0.40
650 Mitsui & Company Ltd 7,127 0.13 1,200 Mitsui Chemicals Inc 3,028 0.06 1,000 Mitsui OSK Lines Ltd 2,901 0.05 8,930 Mizuho Financial Group Inc 9,844 0.18
220 MS&AD Insurance Group Holdings 3,608 0.07 100 Murata Manufacturing Co Ltd 4,085 0.08
2,900 NEC Corporation 4,459 0.08 1,000 Nippon Express Co Ltd 3,210 0.06
120 Nippon Paper Group Inc 2,400 0.04 2,900 Nippon Steel Corporation 6,281 0.12
314 Nippon Telegraph & Telephone Corporation 11,325 0.21 1,200 Nippon Yusen KK 2,448 0.05 1,366 Nissan Motor Company Ltd 9,153 0.17 1,396 Nomura Holdings Inc 3,861 0.07
8 NTT DoCoMo Inc 10,961 0.20 100 Omron Corp 1,485 0.03 48 ORIX Corp 2,850 0.05
1,200 Osaka Gas Company Ltd 3,736 0.07 100 Otsuka Holdings Co Ltd 2,055 0.04
1,690 Panasonic Corporation 12,321 0.23 100 Secom Co Ltd 3,626 0.07 132 Seiko Epson Corporation 1,264 0.02 369 Seven & I Holdings Company Ltd 7,810 0.14
1,000 Sharp Corp/Japan 6,343 0.12 100 Shikoku Electric Power Co Inc 2,067 0.04
1,000 Shimizu Corp 3,326 0.06 120 Shin-Etsu Chemical Co Ltd 4,444 0.08 120 Softbank Corp 2,659 0.05
3,445 Sojitz Corporation 4,764 0.09 517 Sony Corporation 7,534 0.14
1,000 Sumitomo Chemical Co Ltd 2,911 0.05 519 Sumitomo Corporation 4,853 0.09

PowerShares Global Funds Ireland plc
Annual Report and Audited Financial Statements for the year ended 30 September 2011
252
Schedule of Investments
PowerShares FTSE RAFI Developed 1000 Fund (continued)
Nominal Security Description Fair Value EUR
% of Net Assets
Japan (continued) 313 Sumitomo Electric Industries Ltd 2,775 0.05
2,450 Sumitomo Metal Industries Ltd 3,838 0.07 620 Sumitomo Mitsui Financial Group Inc 13,225 0.25
1,000 Sumitomo Mitsui Trust Holdings Inc 2,504 0.05 276 Suzuki Motor Corporation 4,596 0.09 252 T&D Holdings, Inc. 1,796 0.03
1,200 Taisei Corp 2,495 0.05 206 Takeda Pharmaceutical Co Ltd 7,330 0.14 249 Tohoku Electric Power Company, Inc. 2,600 0.05 232 Tokio Marine Holdings, Inc. 4,451 0.08 645 Tokyo Electric Power Company, Inc. 1,497 0.03 950 Tokyo Gas Co Ltd 3,316 0.06
1,000 Tokyu Corp 3,771 0.07 1,450 Toshiba Corporation 4,487 0.08
100 Toyota Industries Corp 2,205 0.04 1,174 Toyota Motor Corp 30,514 0.56
232 Toyota Tsusho Corporation 3,008 0.06 100 West Japan Railway Co 3,210 0.06 50 Yamada Denki Company Ltd 2,635 0.05
106 Yamaha Motor Co Ltd 1,062 0.02 120 Yamato Holdings Company Ltd 1,647 0.03
Total Japan 515,399 9.56 Jersey
181 Experian Plc 1,524 0.03 183 UBM Plc 954 0.02 173 Wolseley Plc 3,228 0.06 496 WPP Plc 3,460 0.06
Total Jersey 9,166 0.17 Liberia
70 Royal Caribbean Cruises Ltd 1,129 0.02 Total Liberia 1,129 0.02 Netherland Antilles
192 Schlumberger Ltd 8,547 0.16 Total Netherland Antilles 8,547 0.16 New Zealand
2,188 Telecom Corp of New Zealand Ltd 3,291 0.06 Total New Zealand 3,291 0.06

PowerShares Global Funds Ireland plc
Annual Report and Audited Financial Statements for the year ended 30 September 2011
253
Schedule of Investments
PowerShares FTSE RAFI Developed 1000 Fund (continued)
Nominal Security Description Fair Value EUR
% of Net Assets
Norway 425 DnB NOR ASA 3,205 0.06 938 Norsk Hydro ASA 3,223 0.06 544 Orkla ASA 3,111 0.06 708 Statoil ASA 11,415 0.20 258 Storebrand ASA 981 0.02 306 Telenor ASA 3,547 0.07 50 Yara International ASA 1,445 0.03
Total Norway 26,927 0.50 Panama
149 Carnival Corp 3,365 0.06 Total Panama 3,365 0.06 Puerto Rico
655 Popular Inc 732 0.01 Total Puerto Rico 732 0.01 Singapore
1,200 CapitaLand Ltd 1,695 0.03 1,000 DBS Group Holdings Ltd 6,772 0.13
730 Flextronics International Ltd 3,063 0.06 1,000 Oversea-Chinese Banking Corp Ltd 4,650 0.09 2,960 Singapore Telecommunications Ltd 5,384 0.10 1,000 United Overseas Bank Ltd 9,724 0.17 1,000 Wilmar International Ltd 3,014 0.06
Total Singapore 34,302 0.64 Spain
536 International Consolidated Airlines Group SA 953 0.02 Total Spain 953 0.02 Sweden
80 Assa Abloy AB 1,239 0.02 95 Atlas Copco AB - B Shares 1,122 0.02
142 Atlas Copco AB - A Shares 1,897 0.04 157 Electrolux AB 1,733 0.03 352 Hennes & Mauritz AB 7,896 0.15 52 Industrivarden AB - C Class 410 0.01
119 Industrivarden AB - A Class 989 0.02 349 Investor AB 4,617 0.09 88 NCC AB 1,079 0.02
1,589 Nordea Bank AB 9,690 0.19

PowerShares Global Funds Ireland plc
Annual Report and Audited Financial Statements for the year ended 30 September 2011
254
Schedule of Investments
PowerShares FTSE RAFI Developed 1000 Fund (continued)
Nominal Security Description Fair Value EUR
% of Net Assets
Sweden (continued) 285 Sandvik AB 2,474 0.05 219 Scania AB B 2,359 0.04 13 Scania AB A 138 0.00
201 Securitas AB 1,102 0.02 834 Skandinaviska Enskilda Banken AB 3,383 0.06 233 Skanska AB 2,425 0.04 118 SKF AB 1,676 0.03 42 SSAB AB - B Shares 210 0.00
136 SSAB AB - A Shares 760 0.01 421 Svenska Cellulosa AB 3,854 0.07 196 Svenska Handelsbanken AB 3,746 0.07 363 Swedbank AB 3,017 0.06 150 Tele2 AB 2,054 0.04
1,079 Telefonaktiebolaget LM Ericsson 7,804 0.14 1,731 TeliaSonera AB 8,573 0.17
252 Volvo AB - A Shares 1,880 0.03 540 Volvo AB - B Shares 3,999 0.07
Total Sweden 80,126 1.49 Switzerland
375 ABB Ltd 4,853 0.09 136 ACE Ltd 6,143 0.11 63 Adecco SA 1,870 0.03 28 Baloise Holding AG 1,539 0.03 78 Cie Financiere Richemont SA 2,621 0.05
125 Clariant AG 851 0.02 541 Credit Suisse Group AG 10,654 0.20 116 Holcim Ltd 4,636 0.09 819 Nestle SA 33,669 0.63 83 Noble Corporation 1,816 0.03
687 Novartis AG 28,637 0.54 136 Petroplus Holdings AG 571 0.01 160 Roche Holding AG 19,313 0.36
1 SGS SA 1,141 0.02 13 Swatch Group AG 585 0.01 5 Swatch Group AG/The BR 1,240 0.02
40 Swiss Life Holding AG 3,312 0.06 218 Swiss Reinsurance Co Ltd 7,576 0.14
8 Swisscom AG 2,434 0.05 16 Syngenta AG 3,131 0.06
141 TE Connectivity Ltd 2,957 0.05 118 Transocean Ltd 4,300 0.08
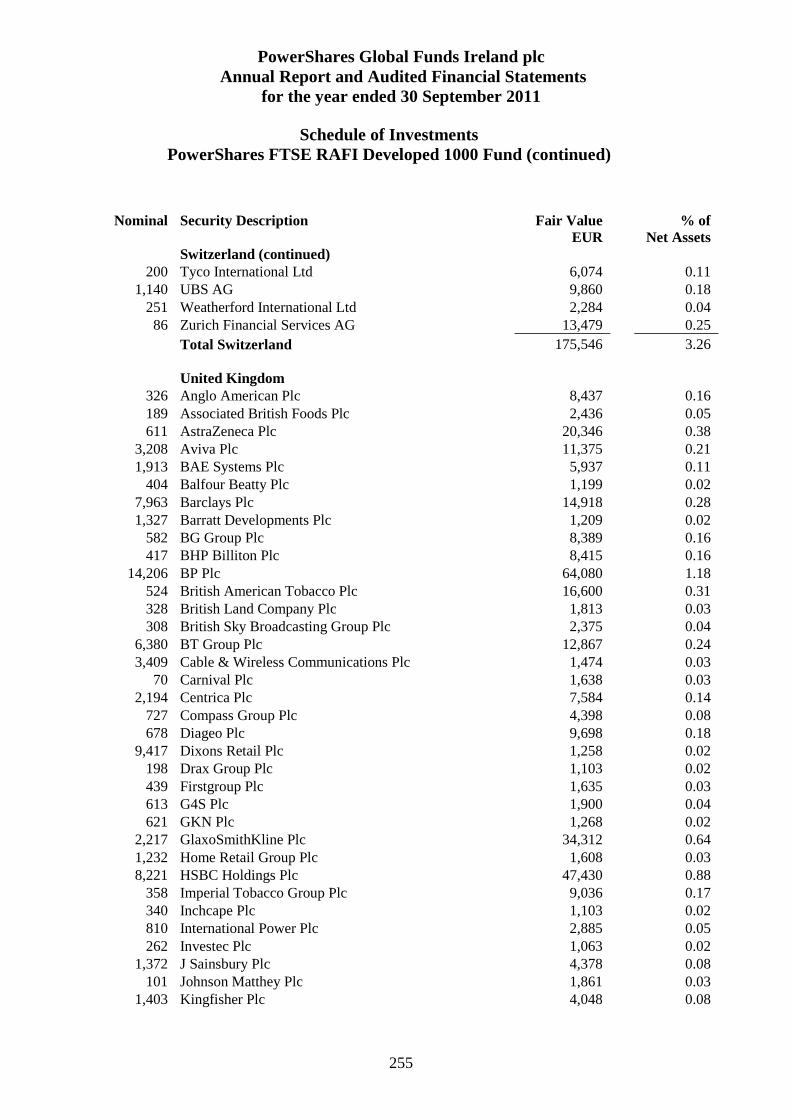
PowerShares Global Funds Ireland plc
Annual Report and Audited Financial Statements for the year ended 30 September 2011
255
Schedule of Investments
PowerShares FTSE RAFI Developed 1000 Fund (continued)
Nominal Security Description Fair Value EUR
% of Net Assets
Switzerland (continued) 200 Tyco International Ltd 6,074 0.11
1,140 UBS AG 9,860 0.18 251 Weatherford International Ltd 2,284 0.04 86 Zurich Financial Services AG 13,479 0.25
Total Switzerland 175,546 3.26 United Kingdom
326 Anglo American Plc 8,437 0.16 189 Associated British Foods Plc 2,436 0.05 611 AstraZeneca Plc 20,346 0.38
3,208 Aviva Plc 11,375 0.21 1,913 BAE Systems Plc 5,937 0.11
404 Balfour Beatty Plc 1,199 0.02 7,963 Barclays Plc 14,918 0.28 1,327 Barratt Developments Plc 1,209 0.02
582 BG Group Plc 8,389 0.16 417 BHP Billiton Plc 8,415 0.16
14,206 BP Plc 64,080 1.18 524 British American Tobacco Plc 16,600 0.31 328 British Land Company Plc 1,813 0.03 308 British Sky Broadcasting Group Plc 2,375 0.04
6,380 BT Group Plc 12,867 0.24 3,409 Cable & Wireless Communications Plc 1,474 0.03
70 Carnival Plc 1,638 0.03 2,194 Centrica Plc 7,584 0.14
727 Compass Group Plc 4,398 0.08 678 Diageo Plc 9,698 0.18
9,417 Dixons Retail Plc 1,258 0.02 198 Drax Group Plc 1,103 0.02 439 Firstgroup Plc 1,635 0.03 613 G4S Plc 1,900 0.04 621 GKN Plc 1,268 0.02
2,217 GlaxoSmithKline Plc 34,312 0.64 1,232 Home Retail Group Plc 1,608 0.03 8,221 HSBC Holdings Plc 47,430 0.88
358 Imperial Tobacco Group Plc 9,036 0.17 340 Inchcape Plc 1,103 0.02 810 International Power Plc 2,885 0.05 262 Investec Plc 1,063 0.02
1,372 J Sainsbury Plc 4,378 0.08 101 Johnson Matthey Plc 1,861 0.03
1,403 Kingfisher Plc 4,048 0.08

PowerShares Global Funds Ireland plc
Annual Report and Audited Financial Statements for the year ended 30 September 2011
256
Schedule of Investments
PowerShares FTSE RAFI Developed 1000 Fund (continued)
Nominal Security Description Fair Value EUR
% of Net Assets
United Kingdom (continued) 389 Land Securities Group Plc 2,900 0.05
3,804 Legal & General Group Plc 4,269 0.08 21,720 Lloyds Banking Group Plc 8,792 0.16
914 Logica Plc 839 0.02 936 Man Group Plc 1,831 0.03
1,142 Marks & Spencer Group Plc 4,171 0.08 457 Mitchells & Butlers Plc 1,250 0.02 221 Mondi Plc 1,215 0.02
1,626 National Grid Plc 12,054 0.22 84 Next Plc 2,469 0.05
3,271 Old Mutual Plc 3,988 0.07 351 Pearson Plc 4,642 0.09 328 Persimmon Plc 1,735 0.03
1,145 Prudential Plc 7,412 0.14 152 Reckitt Benckiser Group Plc 5,776 0.11 572 Rexam Plc 2,064 0.04 289 Rio Tinto Plc 9,692 0.18 437 Rolls-Royce Holdings Plc 3,019 0.06
14,200 Royal Bank of Scotland Group Plc 3,873 0.07 2,177 Royal Dutch Shell Plc A Shares 50,553 0.93 1,667 Royal Dutch Shell Plc B Shares 38,942 0.72 2,820 RSA Insurance Group Plc 3,641 0.07
266 SABMiller Plc 6,509 0.12 530 Scottish & Southern Energy Plc 7,969 0.15 125 Severn Trent Plc 2,237 0.04 131 Smiths Group Plc 1,520 0.03 623 Standard Chartered Plc 9,309 0.17
1,605 Standard Life Plc 3,727 0.07 230 Tate & Lyle Plc 1,672 0.03
4,153 Taylor Wimpey Plc 1,688 0.03 3,979 Tesco Plc 17,463 0.32 1,013 Thomas Cook Group Plc 469 0.01
705 TUI Travel Plc 1,222 0.02 403 Unilever Plc 9,456 0.18 533 United Utilities Group Plc 3,862 0.07
28,965 Vodafone Group Plc 55,910 1.03 77 Whitbread Plc 1,416 0.03
1,567 WM Morrison Supermarkets Plc 5,285 0.10 481 Xstrata Plc 4,584 0.09
Total United Kingdom 629,501 11.67

PowerShares Global Funds Ireland plc
Annual Report and Audited Financial Statements for the year ended 30 September 2011
257
Schedule of Investments
PowerShares FTSE RAFI Developed 1000 Fund (continued)
Nominal Security Description Fair Value EUR
% of Net Assets
United States 180 3M Co 9,631 0.18 450 Abbott Laboratories 17,152 0.32 82 Adobe Systems Inc 1,477 0.03
568 AES Corp/The 4,132 0.08 180 Aetna, Inc. 4,877 0.09 115 Aflac Inc 2,996 0.06 37 AGCO Corp 953 0.02 53 Agilent Technologies, Inc. 1,234 0.02 65 Air Products & Chemicals Inc 3,700 0.07
570 Alcoa Inc 4,066 0.08 30 Allergan Inc/Unitetd States 1,842 0.03 54 Alliant Energy Corp 1,557 0.03
402 Allstate Corp/The 7,098 0.13 1,239 Altria Group Inc 24,758 0.46
26 Amazon.com Inc 4,190 0.08 14 AMC Networks Inc 333 0.01
211 Ameren Corp 4,682 0.09 267 American Electric Power Co Inc 7,566 0.14 376 American Express Co 12,583 0.23 69 American International Group Inc 1,129 0.02 61 Ameriprise Financial, Inc. 1,789 0.03
251 AmerisourceBergen Corporation 6,972 0.13 273 Amgen, Inc. 11,181 0.21 681 AMR Corp 1,502 0.03 114 Anadarko Petroleum Corp 5,357 0.10 61 Analog Devices, Inc. 1,421 0.03
240 Annaly Capital Management Inc 2,975 0.06 148 AOL Inc 1,324 0.02 80 Aon Corp 2,503 0.05 65 Apache Corp 3,887 0.07 75 Apple Inc 21,308 0.40
359 Applied Materials, Inc. 2,769 0.05 344 Archer-Daniels-Midland Co 6,361 0.12 96 Arrow Electronics Inc 1,988 0.04 56 Ashland Inc 1,842 0.03 71 Assurant, Inc. 1,894 0.04
3,492 AT&T Inc 74,227 1.37 61 Atmos Energy Corp 1,475 0.03 28 Autoliv Inc 1,012 0.02
119 Automatic Data Processing Inc 4,182 0.08 82 AutoNation Inc 2,003 0.04 55 Avery Dennison Corp 1,028 0.02

PowerShares Global Funds Ireland plc
Annual Report and Audited Financial Statements for the year ended 30 September 2011
258
Schedule of Investments
PowerShares FTSE RAFI Developed 1000 Fund (continued)
Nominal Security Description Fair Value EUR
% of Net Assets
United States (continued) 179 Avis Budget Group, Inc. 1,290 0.02 121 Avnet Inc 2,352 0.04 134 Avon Products Inc 1,958 0.04 91 Baker Hughes, Inc. 3,131 0.06
7,461 Bank of America Corp 34,032 0.63 413 Bank of New York Mellon Corp/The 5,722 0.11 130 Baxter International Inc 5,440 0.10 362 BB&T Corp 5,755 0.11 66 Beam Inc 2,660 0.05 55 Becton Dickinson and Co 3,006 0.06 61 Bed Bath & Beyond Inc. 2,606 0.05
628 Berkshire Hathaway Inc 33,251 0.62 268 Best Buy Co Inc 4,654 0.09 52 Biogen Idec, Inc. 3,610 0.07 18 BlackRock Inc 1,986 0.04
250 Boeing Co/The 11,275 0.21 41 Boston Properties, Inc. 2,723 0.05
877 Boston Scientific Corp 3,863 0.07 720 Bristol-Myers Squibb Co 16,840 0.31 56 Cablevision Systems Corp 657 0.01
183 Calpine Corporation 1,920 0.04 40 Cameron International Corporation 1,238 0.02
102 Campbell Soup Company 2,461 0.05 244 Capital One Financial Corp 7,207 0.13 331 Cardinal Health, Inc. 10,332 0.19 88 CareFusion Corp 1,571 0.03
149 Caterpillar, Inc. 8,200 0.15 297 CBS Corp 4,511 0.08 240 CenterPoint Energy Inc 3,510 0.07 244 CenturyLink Inc 6,023 0.11 306 Charles Schwab Corp/The 2,570 0.05 175 Chesapeake Energy Corp 3,333 0.06 820 Chevron Corporation 56,544 1.04 146 Chubb Corp 6,528 0.12 107 CIGNA Corp 3,345 0.06 107 Cincinnati Financial Corp 2,100 0.04
1,418 Cisco Systems Inc 16,371 0.30 59 CIT Group Inc 1,335 0.02
1,753 Citigroup Inc 33,474 0.62 36 Clorox Co 1,780 0.03 18 CME Group Inc 3,306 0.06
115 CMS Energy Corp 1,696 0.03

PowerShares Global Funds Ireland plc
Annual Report and Audited Financial Statements for the year ended 30 September 2011
259
Schedule of Investments
PowerShares FTSE RAFI Developed 1000 Fund (continued)
Nominal Security Description Fair Value EUR
% of Net Assets
United States (continued) 313 CNO Financial Group Inc 1,262 0.02 445 Coca-Cola Co/The 22,408 0.42 186 Coca-Cola Enterprises Inc 3,449 0.06 105 Colgate-Palmolive Company 6,940 0.13 604 Comcast Corp - Class A 9,409 0.17 209 Comcast Corp - Special Class A + 3,223 0.06 105 Comerica Inc 1,798 0.03 64 Community Health Systems Inc 794 0.01
129 Computer Sciences Corporation 2,582 0.05 214 ConAgra Foods Inc 3,863 0.07 805 ConocoPhillips 37,991 0.70 163 Consolidated Edison Inc 6,927 0.13 200 Constellation Energy Group Inc 5,673 0.11 303 Corning Inc 2,791 0.05 180 Costco Wholesale Corp 11,017 0.20 122 Coventry Health Care Inc 2,620 0.05 53 Crown Holdings Inc 1,209 0.02
258 CSX Corp 3,590 0.07 33 Cummins Inc 2,008 0.04
591 CVS Caremark Corp 14,792 0.27 118 Danaher Corporation 3,689 0.07 45 Darden Restaurants Inc 1,434 0.03 28 DaVita Inc 1,308 0.02
485 Dean Foods Co 3,206 0.06 91 Deere & Co 4,379 0.08
847 Dell Inc 8,933 0.17 474 Delta Air Lines Inc 2,650 0.05 98 Devon Energy Corp 4,049 0.08 42 Diamond Offshore Drilling Inc 1,714 0.03
151 DIRECTV 4,755 0.09 200 Discover Financial Services 3,420 0.06 116 DISH Network Corp 2,167 0.04 259 Dominion Resources Inc/NA 9,801 0.18 26 Domtar Corporation 1,321 0.02 52 Dover Corp 1,806 0.03
508 Dow Chemical Co /The 8,504 0.16 225 DR Horton Inc 1,516 0.03 76 Dr Pepper Snapple Group Inc 2,197 0.04
109 DTE Energy Co 3,982 0.07 794 Duke Energy Corp 11,830 0.22 25 Eastman Chemical Co 1,277 0.02 47 Eaton Corp 1,244 0.02

PowerShares Global Funds Ireland plc
Annual Report and Audited Financial Statements for the year ended 30 September 2011
260
Schedule of Investments
PowerShares FTSE RAFI Developed 1000 Fund (continued)
Nominal Security Description Fair Value EUR
% of Net Assets
United States (continued) 219 eBay Inc 4,814 0.09 45 Ecolab Inc 1,640 0.03
201 Edison International 5,730 0.11 256 EI du Pont de Nemours & Co 7,626 0.14 143 El Paso Corp 1,863 0.03 486 Eli Lilly & Co 13,392 0.25 299 EMC Corp/Massachusetts 4,678 0.09 202 Emerson Electric Company 6,219 0.12 105 Entergy Corp 5,188 0.10 39 EOG Resources Inc 2,064 0.04 89 Equity Residential 3,441 0.06
345 Exelon Corp 10,957 0.20 91 Express Scripts, Inc. 2,514 0.05
1,623 Exxon Mobil Corporation 87,857 1.62 123 FedEx Corp 6,205 0.12 328 Fidelity National Financial Inc 3,711 0.07 108 Fidelity National Information Services Inc 1,958 0.04 392 Fifth Third Bancorp 2,951 0.05 232 FirstEnergy Corp 7,766 0.14 37 Fiserv Inc 1,400 0.03 55 Fluor Corporation 1,908 0.04
1,631 Ford Motor Co 11,755 0.22 85 Forest Laboratories Inc 1,951 0.04 33 Franklin Resources Inc 2,352 0.04
163 Freeport-McMoRan Copper & Gold Inc 3,699 0.07 307 Frontier Communications Corporation 1,398 0.03 113 GameStop Corp 1,946 0.04 230 Gannett Co Inc 1,634 0.03 174 Gap Inc/The 2,106 0.04 144 General Dynamics Corp 6,106 0.11
4,799 General Electric Co 54,510 1.01 177 General Mills Inc 5,075 0.09 255 General Motors Co 3,835 0.07 651 GenOn Energy Inc 1,349 0.03 71 Genuine Parts Co 2,688 0.05
403 Genworth Financial, Inc. 1,724 0.03 127 Gilead Sciences Inc 3,673 0.07 191 Goldman Sachs Group Inc/The 13,460 0.25 30 Goodrich Corp 2,698 0.05
311 Goodyear Tire & Rubber Co/The 2,339 0.04 27 Google Inc 10,351 0.19
135 H&R Block Inc 1,339 0.02

PowerShares Global Funds Ireland plc
Annual Report and Audited Financial Statements for the year ended 30 September 2011
261
Schedule of Investments
PowerShares FTSE RAFI Developed 1000 Fund (continued)
Nominal Security Description Fair Value EUR
% of Net Assets
United States (continued) 169 Halliburton Co 3,844 0.07 69 Harley-Davidson Inc 1,766 0.03
381 Hartford Financial Services Group Inc 4,583 0.08 78 HCP Inc 2,038 0.04
119 Health Net Inc 2,103 0.04 303 Hertz Global Holdings Inc 2,010 0.04 130 Hess Corporation 5,083 0.09 773 Hewlett-Packard Co 12,934 0.24 97 HJ Heinz Co 3,650 0.07
664 Home Depot Inc 16,267 0.30 220 Honeywell International Inc 7,200 0.13 227 Host Hotels & Resorts, Inc. 1,851 0.03 248 Hudson City Bancorp, Inc. 1,046 0.02 98 Humana Inc 5,312 0.10
388 Huntington Bancshares Inc/OH 1,388 0.03 40 Huntington Ingalls Industries Inc 725 0.01
146 Illinois Tool Works Inc 4,527 0.08 273 Ingram Micro Inc 3,282 0.06 56 Integrys Energy Group Inc 2,029 0.04
1,647 Intel Corp 26,184 0.49 253 International Business Machines Corp 33,005 0.61 300 International Paper Company 5,199 0.10 55 ITT Corporation 1,722 0.03
108 Jabil Circuit Inc 1,432 0.03 59 Jacobs Engineering Group Inc 1,420 0.03
167 JC Penney Co Inc 3,333 0.06 35 JM Smucker Co/The 1,901 0.04
805 Johnson & Johnson 38,225 0.71 211 Johnson Controls Inc 4,147 0.08
1,766 JPMorgan Chase & Co 39,644 0.74 70 Juniper Networks Inc 901 0.02 78 Kellogg Co 3,092 0.06
555 Keycorp 2,453 0.05 141 Kimberly-Clark Corp 7,462 0.14 100 Kimco Realty Corporation 1,120 0.02 118 Kohl's Corp 4,318 0.08 638 Kraft Foods Inc 15,968 0.30 540 Kroger Co/The 8,838 0.16 59 L-3 Communications Holdings Inc 2,725 0.05 23 Laboratory Corp of America Holdings 1,355 0.03 20 Lear Corp 639 0.01 71 Legg Mason Inc 1,361 0.03

PowerShares Global Funds Ireland plc
Annual Report and Audited Financial Statements for the year ended 30 September 2011
262
Schedule of Investments
PowerShares FTSE RAFI Developed 1000 Fund (continued)
Nominal Security Description Fair Value EUR
% of Net Assets
United States (continued) 68 Liberty Global Inc 1,834 0.03 62 Liberty Global, Inc. - Series C 1,599 0.03
260 Liberty Interactive Corp 2,862 0.05 191 Lincoln National Corp 2,225 0.04 162 Lockheed Martin Corp 8,771 0.16 183 Loews Corp 4,712 0.09 69 Lorillard Inc 5,693 0.11
562 Lowe's Cos Inc 8,101 0.15 104 Ltd Brands Inc 2,985 0.06 58 M&T Bank Corp 3,022 0.06
306 Macy's, Inc. 6,003 0.11 52 Manpower Inc 1,303 0.02
384 Marathon Oil Corp 6,176 0.11 192 Marathon Petroleum Corp 3,872 0.07 85 Marriott International Inc/DE 1,726 0.03
164 Marsh & McLennan Cos Inc 3,244 0.06 294 Masco Corp 1,560 0.03 10 Mastercard Inc 2,364 0.04
114 Mattel, Inc. 2,200 0.04 226 McDonald's Corp 14,793 0.27 96 McGraw-Hill Cos Inc/The 2,934 0.05
185 McKesson Corp 10,024 0.19 88 MeadWestvaco Corp 1,611 0.03
175 Medco Health Solutions Inc 6,116 0.11 268 Medtronic, Inc. 6,640 0.12
1,079 Merck & Co Inc 26,306 0.49 262 MetLife Inc 5,470 0.10 223 MGM Resorts International 1,544 0.03 415 Micron Technology Inc 1,559 0.03
1,835 Microsoft Corporation 34,041 0.63 47 Mohawk Industries Inc 1,503 0.03 60 Molson Coors Brewing Co 1,771 0.03 96 Monsanto Company 4,296 0.08
756 Morgan Stanley 7,607 0.14 82 Motorola Mobility Holdings Inc 2,309 0.04
211 Motorola Solutions Inc 6,589 0.12 84 Murphy Oil Corp 2,765 0.05 70 National Oilwell Varco Inc 2,672 0.05 47 Navistar International Corp 1,125 0.02
195 New York Community Bancorp Inc 1,730 0.03 140 Newell Rubbermaid Inc 1,239 0.02 104 Newmont Mining Corp 4,876 0.09

PowerShares Global Funds Ireland plc
Annual Report and Audited Financial Statements for the year ended 30 September 2011
263
Schedule of Investments
PowerShares FTSE RAFI Developed 1000 Fund (continued)
Nominal Security Description Fair Value EUR
% of Net Assets
United States (continued) 559 News Corp Class A 6,445 0.12 181 News Corp Class B 2,103 0.04 199 NextEra Energy Inc 8,012 0.15 52 NIKE Inc 3,314 0.06
205 NiSource Inc 3,267 0.06 33 Noble Energy Inc 1,741 0.03 62 Nordstrom, Inc. 2,111 0.04
112 Norfolk Southern Corp 5,094 0.09 85 Northeast Utilities 2,132 0.04 75 Northern Trust Corp 1,955 0.04
159 Northrop Grumman Corp 6,181 0.11 233 NRG Energy Inc 3,683 0.07 162 Nucor Corp 3,820 0.07 91 NYSE Euronext 1,576 0.03
169 Occidental Petroleum Corp 9,006 0.17 556 Office Depot, Inc. 854 0.02 88 Omnicom Group, Inc. 2,416 0.04 54 Oneok Inc 2,658 0.05
475 Oracle Corp 10,175 0.19 59 Owens Corning 953 0.02 92 Owens-Illinois Inc 1,037 0.02
120 PACCAR, Inc. 3,025 0.06 48 Parker Hannifin Corp 2,259 0.04 88 Paychex Inc 1,730 0.03 42 Peabody Energy Corp 1,061 0.02
197 Pepco Holdings Inc 2,778 0.05 375 PepsiCo Inc/NC 17,301 0.32
3,497 Pfizer, Inc. 46,080 0.85 185 PG&E Corp 5,834 0.11 311 Philip Morris International Inc 14,459 0.27 69 Pinnacle West Capital Corp 2,208 0.04
159 Pitney Bowes Inc 2,228 0.04 100 Plum Creek Timber Co Inc 2,587 0.05 206 PNC Financial Services Group Inc 7,399 0.14 54 PPG Industries Inc 2,844 0.05
216 PPL Corp 4,595 0.09 65 Praxair Inc 4,529 0.08 22 Precision Castparts Corp 2,549 0.05
126 Principal Financial Group Inc 2,129 0.04 841 Procter & Gamble Co/The 39,602 0.73 180 Progress Energy Inc 6,939 0.13 290 Progressive Corp/The 3,839 0.07

PowerShares Global Funds Ireland plc
Annual Report and Audited Financial Statements for the year ended 30 September 2011
264
Schedule of Investments
PowerShares FTSE RAFI Developed 1000 Fund (continued)
Nominal Security Description Fair Value EUR
% of Net Assets
United States (continued) 128 ProLogis Inc 2,313 0.04 204 Prudential Financial, Inc. 7,125 0.13 253 Public Service Enterprise Group Inc 6,292 0.12 22 Public Storage 1,826 0.03
200 QUALCOMM Inc 7,249 0.13 42 Quest Diagnostics Inc/DE 1,545 0.03
128 Questar Corp 1,690 0.03 169 Raytheon Co 5,148 0.10 961 Regions Financial Corp 2,385 0.04 112 Republic Services Inc 2,342 0.04 198 Reynolds American Inc 5,531 0.10 32 Rockwell Automation Inc 1,336 0.02 32 Rockwell Collins Inc 1,258 0.02
196 RR Donnelley & Sons Co 2,063 0.04 43 Ryder System, Inc. 1,202 0.02
370 Safeway Inc 4,586 0.09 165 SAIC Inc 1,452 0.03 51 SanDisk Corp 1,534 0.03
262 Sara Lee Corp 3,193 0.06 71 SCANA Corp 2,141 0.04 73 Sears Holdings Corp 3,130 0.06
115 Sempra Energy 4,414 0.08 35 Sherwin-Williams Co/The 1,939 0.04 54 Simon Property Group, Inc. 4,426 0.08
234 SLM Corp 2,171 0.04 130 Smithfield Foods Inc 1,889 0.04 357 Southern Co 11,274 0.21 65 Southern Copper Corporation 1,211 0.02
280 Southwest Airlines Co 1,678 0.03 233 Spectra Energy Corporation 4,260 0.08
3,460 Sprint Nextel Corp 7,840 0.15 59 St Jude Medical Inc 1,591 0.03 39 Stanley Black & Decker Inc 1,427 0.03
272 Staples Inc 2,696 0.05 110 Starbucks Corp 3,057 0.06 47 Starwood Hotels & Resorts Worldwide Inc 1,360 0.03
170 State Street Corp 4,075 0.08 49 Stryker Corporation 1,721 0.03
157 Sunoco Inc 3,629 0.07 318 SunTrust Banks Inc 4,254 0.08 798 SUPERVALU Inc 3,961 0.07 204 Symantec Corporation 2,478 0.05

PowerShares Global Funds Ireland plc
Annual Report and Audited Financial Statements for the year ended 30 September 2011
265
Schedule of Investments
PowerShares FTSE RAFI Developed 1000 Fund (continued)
Nominal Security Description Fair Value EUR
% of Net Assets
United States (continued) 313 Sysco Corp 6,042 0.11 38 T Rowe Price Group Inc 1,353 0.03
313 Target Corp 11,440 0.21 86 Tech Data Corp 2,771 0.05 64 Telephone & Data Systems Inc 1,014 0.02
101 Temple-Inland Inc 2,361 0.04 292 Tenet Healthcare Corp 899 0.02 62 Terex Corp 474 0.01
163 Tesoro Corp 2,365 0.04 240 Texas Instruments Inc 4,767 0.09 143 Textron, Inc. 1,880 0.03 117 Thermo Fisher Scientific Inc 4,416 0.08 115 Time Warner Cable Inc 5,372 0.10 584 Time Warner Inc 13,045 0.24 94 TJX Cos, Inc. 3,886 0.07 48 Torchmark Corporation 1,247 0.02
303 Travelers Cos Inc/The 11,005 0.20 60 TRW Automotive Holdings Corp 1,464 0.03
242 Tyson Foods Inc 3,131 0.06 104 Union Pacific Corp 6,331 0.12 265 United Continental Holdings Inc 3,828 0.07 189 United Parcel Service Inc 8,896 0.16 71 United States Steel Corp 1,165 0.02
264 United Technologies Corporation 13,844 0.26 477 UnitedHealth Group Inc 16,397 0.30 152 Unum Group 2,375 0.04 50 URS Corp 1,105 0.02
750 US Bancorp 13,159 0.24 647 Valero Energy Corp 8,574 0.16
1,707 Verizon Communications Inc 46,818 0.87 38 VF Corp 3,442 0.06
143 Viacom Inc 4,129 0.08 103 Virgin Media, Inc. 1,869 0.03 81 Visa Inc 5,175 0.10 48 Vornado Realty Trust 2,670 0.05 54 Vulcan Materials Co 1,109 0.02
327 Walgreen Co 8,016 0.15 1,295 Wal-Mart Stores Inc 50,093 0.93
448 Walt Disney Co/The 10,071 0.19 208 Waste Management Inc 5,048 0.09 303 WellPoint, Inc. 14,742 0.27
1,872 Wells Fargo & Co 33,653 0.62

PowerShares Global Funds Ireland plc
Annual Report and Audited Financial Statements for the year ended 30 September 2011
266
Schedule of Investments
PowerShares FTSE RAFI Developed 1000 Fund (continued)
Nominal Security Description Fair Value EUR
% of Net Assets
United States (continued) 108 Western Digital Corp 2,070 0.04 221 Weyerhaeuser Co 2,561 0.05 52 Whirlpool Corp 1,934 0.04 37 Whole Foods Market Inc 1,801 0.03
189 Williams Cos Inc/The 3,429 0.06 235 Windstream Corporation 2,042 0.04 40 Wisconsin Energy Corp 933 0.02 68 WR Berkley Corp 1,505 0.03 18 WW Grainger Inc 2,006 0.04
257 Xcel Energy Inc 4,729 0.09 581 Xerox Corp 3,018 0.06 330 Yahoo! Inc 3,237 0.06 79 Yum! Brands, Inc. 2,908 0.05 56 Zimmer Holdings Inc 2,233 0.04
110 Zions Bancorporation 1,154 0.02 Total United States 2,426,575 45.00
Portfolio of Investments 5,381,247 99.79
Current Assets 56,048 1.04
Total Assets 5,437,295 100.83
Current Liabilities (44,723) (0.83)
Net Assets attributable to Holders of Redeemable Participating Shares 5,392,572 100.00

PowerShares Global Funds Ireland plc
Annual Report and Audited Financial Statements for the year ended 30 September 2011
267
Schedule of Investments
PowerShares FTSE RAFI Italy 30 Fund
Nominal Security Description Fair Value EUR
% of Net Assets
Communications 11,032 Mediaset SpA 26,036 1.13
120,028 Telecom Italia RSP 86,420 3.75 267,756 Telecom Italia SpA 217,953 9.45
Total Communications 330,409 14.33 Consumer, Cyclical
4,716 Fiat Industrial SpA 26,433 1.15 19,676 Fiat SpA 80,475 3.48 3,405 Pirelli & C SpA 17,876 0.78
Total Consumer, Cyclical 124,784 5.41 Consumer, Non-cyclical
2,803 Atlantia SpA 29,796 1.29 13,346 Parmalat SpA 21,153 0.92
Total Consumer, Non-cyclical 50,949 2.21 Energy
33,330 ENI SpA 437,290 18.97 1,017 Saipem SpA 26,849 1.16
Total Energy 464,139 20.13 Financial
18,873 Assicurazioni Generali SpA 221,193 9.60 63,366 Banca Monte dei Paschi di Siena SpA 26,107 1.13 3,652 Banca Piccolo Credito Valtellinese Scarl 8,144 0.35 3,359 Banca Popolare dell'Emilia Romagna Scarl 24,621 1.07
10,586 Banca Popolare di Milano Scarl 19,161 0.83 2,342 Banca Popolare di Sondrio SCARL 12,787 0.55
30,781 Banco Popolare SC 38,384 1.66 5,929 Fondiaria-Sai SpA 9,071 0.39
150,066 Intesa Sanpaolo SpA 177,828 7.71 5,843 Mediobanca SpA 34,474 1.50
292,890 UniCredit SpA 234,459 10.18 11,594 Unione di Banche Italiane SCPA 32,115 1.39 44,870 Unipol Gruppo Finanziario SpA 9,916 0.43 36,741 Unipol Gruppo Finanziario PFD 11,316 0.49
Total Financial 859,576 37.28 Industrial
6,730 Finmeccanica SpA 35,063 1.53 2,044 Italcementi SpA RSP 9,014 0.39 2,265 Italcementi SpA 4,698 0.20

PowerShares Global Funds Ireland plc
Annual Report and Audited Financial Statements for the year ended 30 September 2011
268
Schedule of Investments
PowerShares FTSE RAFI Italy 30 Fund (continued)
Nominal Security Description Fair Value EUR
% of Net Assets
Industrial (continued) 1,287 Prysmian SpA 12,754 0.55 1,973 Tenaris SA 18,507 0.80
Total Industrial 80,036 3.47 Utilities
20,754 A2A SpA 19,301 0.84 97,868 Enel SpA 322,964 14.00 7,569 Snam Rete Gas SpA 25,977 1.13 8,008 Terna Rete Elettrica Nazionale SpA 21,942 0.95
Total Utilities 390,184 16.92
Portfolio of Investments 2,300,077 99.75
Current Assets 23,986 1.04
Total Assets 2,324,063 100.79
Current Liabilities (18,278) (0.79)
Net Assets attributable to Holders of Redeemable Participating Shares 2,305,785 100.00

PowerShares Global Funds Ireland plc
Annual Report and Audited Financial Statements for the year ended 30 September 2011
269
Schedule of Investments
PowerShares FTSE RAFI Switzerland Fund
Nominal Security Description Fair Value CHF
% of Net Assets
Basic Materials 1,414 Clariant AG 11,736 0.49
19 Givaudan SA 13,509 0.56 206 Lonza Group AG 11,330 0.47 184 Syngenta AG 43,884 1.84
Total Basic Materials 80,459 3.36 Communications
90 Swisscom AG 33,372 1.39 Total Communications 33,372 1.39 Consumer, Cyclical
903 Cie Financiere Richemont SA 36,978 1.54 95 Swatch Group AG 5,206 0.22 60 Swatch Group AG-BR 18,138 0.76
Total Consumer, Cyclical 60,322 2.52 Consumer, Non-cyclical
700 Adecco SA 25,319 1.06 278 Aryzta AG 11,009 0.46
2 Lindt & Spruengli AG 5,300 0.22 9,445 Nestle SA 473,195 19.78 8,002 Novartis AG 406,502 16.98 1,854 Roche Holding AG 272,723 11.39
15 SGS SA 20,850 0.87 85 Synthes Inc 12,495 0.52
Total Consumer, Non-cyclical 1,227,393 51.28 Energy
1,610 Petroplus Holdings AG 8,243 0.34 1,364 Transocean Ltd 60,575 2.53
Total Energy 68,818 2.87 Financial
319 Baloise Holding AG 21,373 0.89 6,228 Credit Suisse Group AG 149,472 6.24
633 GAM Holding AG 7,248 0.30 38 Helvetia Holding AG 10,564 0.44
444 Julius Baer Group Ltd 13,631 0.57 209 Pargesa Holding SA 13,083 0.55 469 Swiss Life Holding AG 47,322 1.98
2,529 Swiss Reinsurance Co Ltd 107,103 4.47 13,122 UBS AG 138,306 5.78
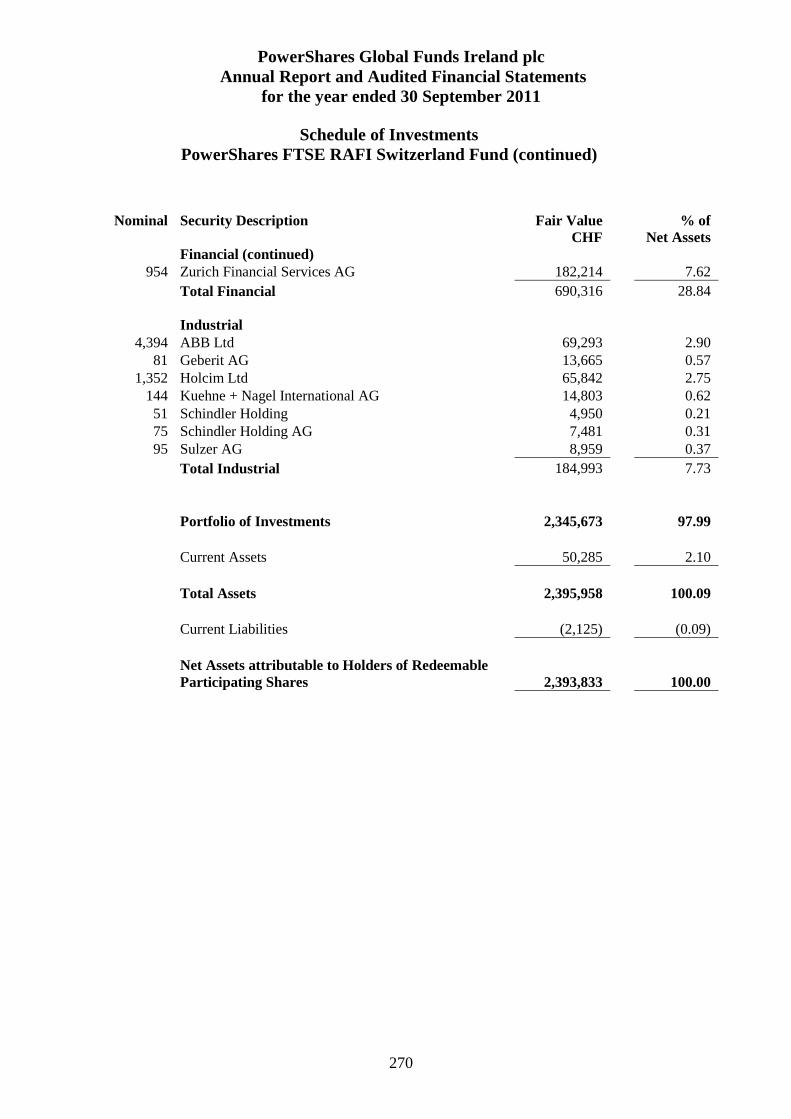
PowerShares Global Funds Ireland plc
Annual Report and Audited Financial Statements for the year ended 30 September 2011
270
Schedule of Investments
PowerShares FTSE RAFI Switzerland Fund (continued)
Nominal Security Description Fair Value CHF
% of Net Assets
Financial (continued) 954 Zurich Financial Services AG 182,214 7.62
Total Financial 690,316 28.84 Industrial
4,394 ABB Ltd 69,293 2.90 81 Geberit AG 13,665 0.57
1,352 Holcim Ltd 65,842 2.75 144 Kuehne + Nagel International AG 14,803 0.62 51 Schindler Holding 4,950 0.21 75 Schindler Holding AG 7,481 0.31 95 Sulzer AG 8,959 0.37
Total Industrial 184,993 7.73
Portfolio of Investments 2,345,673 97.99
Current Assets 50,285 2.10
Total Assets 2,395,958 100.09
Current Liabilities (2,125) (0.09)
Net Assets attributable to Holders of Redeemable Participating Shares 2,393,833 100.00

PowerShares Global Funds Ireland plc
Annual Report and Audited Financial Statements for the year ended 30 September 2011
271
Schedule of Investments
PowerShares FTSE RAFI Hong Kong China Fund
Nominal Security Description Fair Value USD
% of Net Assets
Basic Materials 5,000 Kingboard Chemical Holdings Ltd 13,648 0.87
Total Basic Materials 13,648 0.87 Communications
100,000 PCCW Ltd 37,509 2.38 Total Communications 37,509 2.38 Consumer, Cyclical
14,000 Cathay Pacific Airways Ltd 23,019 1.47 16,100 Esprit Holdings Ltd 19,751 1.25 17,000 Li & Fung Ltd 28,869 1.84 8,500 Yue Yuen Industrial Holdings Ltd 22,111 1.40
Total Consumer, Cyclical 93,750 5.96 Consumer, Non-cyclical
36,000 Chaoda Modern Agriculture Holdings Ltd 2,543 0.16 Total Consumer, Non-cyclical 2,543 0.16 Diversified
18,000 Hutchison Whampoa Ltd 135,148 8.59 818 Jardine Strategic Holdings Ltd 21,522 1.37
6,500 Swire Pacific Ltd 67,215 4.27 Total Diversified 223,885 14.23 Financial
35,400 Aia Group Ltd 101,407 6.44 12,000 Bank of East Asia Ltd 37,227 2.37 26,500 BOC Hong Kong Holdings Ltd 56,848 3.61 9,000 Cheung Kong Holdings Ltd 98,963 6.29 6,000 Hang Lung Group Ltd 30,714 1.95 9,200 Hang Lung Properties Ltd 27,654 1.76 5,200 Hang Seng Bank Ltd 61,353 3.90 7,800 Henderson Land Development Co Ltd 35,519 2.26 1,400 Hong Kong Exchanges and Clearing Ltd 20,627 1.31 9,000 Hongkong Land Holdings Ltd 40,320 2.56 1,200 Jardine Matheson Holdings Ltd 55,080 3.50 5,500 Kerry Properties Ltd 17,698 1.12
13,000 Link REIT 41,247 2.62 32,000 New World Development Ltd 31,076 1.97 18,000 Sino Land Co Ltd 24,093 1.53 11,000 Sun Hung Kai Properties Ltd 127,808 8.11

PowerShares Global Funds Ireland plc
Annual Report and Audited Financial Statements for the year ended 30 September 2011
272
Schedule of Investments
PowerShares FTSE RAFI Hong Kong China Fund (continued)
Nominal Security Description Fair Value USD
% of Net Assets
Financial (continued) 8,400 Wharf Holdings Ltd 41,974 2.67
Total Financial 849,608 53.97 Industrial
8,500 MTR Corp 25,659 1.63 3,500 Orient Overseas International Ltd 14,252 0.91
45,000 Pacific Basin Shipping Ltd 17,631 1.12 Total Industrial 57,542 3.66 Utilities
14,500 CLP Holdings Ltd 131,407 8.36 20,660 Hong Kong & China Gas Co Ltd 46,762 2.97 10,000 Hongkong Electric Holdings Ltd 76,881 4.88
Total Utilities 255,050 16.21
Portfolio of Investments 1,533,535 97.44
Current Assets 51,506 3.27
Total Assets 1,585,041 100.71
Current Liabilities (11,213) (0.71)
Net Assets attributable to Holders of Redeemable Participating Shares 1,573,828 100.00

PowerShares Global Funds Ireland plc
Annual Report and Audited Financial Statements for the year ended 30 September 2011
273
Schedule of Investments
PowerShares Global Agriculture NASDAQ OMX Fund
Nominal Security Description Fair Value USD
% of Net Assets
Australia 19,459 GrainCorp Ltd 136,168 0.47
160,562 Incitec Pivot Ltd 510,284 1.75 25,623 Nufarm Ltd/Australia 106,585 0.37
Total Australia 753,037 2.59 Bermuda
120,000 Asian Citrus Holdings Ltd 55,801 0.19 14,510 Bunge Ltd 845,789 2.91
694,389 Sinofert Holdings Ltd 180,181 0.62 Total Bermuda 1,081,771 3.72 Brazil
40,193 Cosan SA Industria e Comercio 519,667 1.78 9,800 SLC Agricola SA 83,046 0.29
Total Brazil 602,713 2.07 Canada
15,560 Agrium Inc. 1,041,514 3.58 46,976 Potash Corp of Saskatchewan Inc 2,051,158 7.06 36,618 Viterra, Inc. 362,297 1.25
Total Canada 3,454,969 11.89 Cayman Islands
325,151 Chaoda Modern Agriculture Holdings Ltd 22,972 0.08 474,000 China Modern Dairy Holdings Ltd 100,466 0.35
5,832 Fresh Del Monte Produce Inc 135,302 0.46 322,000 Global Bio-Chem Technology Group Co Ltd 58,322 0.20
Total Cayman Islands 317,062 1.09 Chile
22,514 Sociedad Quimica y Minera de Chile SA 1,082,573 3.73 Total Chile 1,082,573 3.73 China
455,848 China BlueChemical Ltd 352,510 1.21 Total China 352,510 1.21 Euro Countries
18,882 K+S AG 1,002,719 3.45 3,435 Nutreco NV 216,703 0.75
872 Sipef SA 68,010 0.23

PowerShares Global Funds Ireland plc
Annual Report and Audited Financial Statements for the year ended 30 September 2011
274
Schedule of Investments
PowerShares Global Agriculture NASDAQ OMX Fund (continued)
Nominal Security Description Fair Value USD
% of Net Assets
Euro Countries (continued) 18,672 Suedzucker AG 535,867 1.84
Total Euro Countries 1,823,299 6.27 Hong Kong
398,463 China Agri-Industries Holdings Ltd 253,366 0.87 Total Hong Kong 253,366 0.87 Indonesia
155,517 Astra Agro Lestari Tbk PT 341,465 1.18 1,339,500 Bakrie Sumatera Plantations Tbk PT 43,431 0.15 1,622,000 Charoen Pokphand Indonesia Tbk PT 442,867 1.52
674,000 Perusahaan Perkebunan London Sumatra Indonesia Tbk PT
157,190
0.54
Total Indonesia 984,953 3.39 Israel
118,178 Israel Chemicals Ltd 1,400,698 4.82 760 Israel Corp Ltd/The 510,918 1.76
45,390 Makhteshim-Agan Industries Ltd 248,076 0.85 Total Israel 2,159,692 7.43 Malaysia
74,928 Genting Plantations Bhd 164,290 0.57 659,350 IOI Corp Bhd 960,368 3.29 105,442 Kuala Lumpur Kepong Bhd 696,892 2.40 125,900 Kulim Malaysia BHD 132,506 0.46
Total Malaysia 1,954,056 6.72 Mauritius
1,199,423 Golden Agri-Resources Ltd 566,069 1.95 Total Mauritius 566,069 1.95 Norway
25,579 Yara International ASA 991,616 3.41 Total Norway 991,616 3.41 Papua New Guinea
14,302 New Britain Palm Oil Ltd 181,022 0.62 Total Papua New Guinea 181,022 0.62

PowerShares Global Funds Ireland plc
Annual Report and Audited Financial Statements for the year ended 30 September 2011
275
Schedule of Investments
PowerShares Global Agriculture NASDAQ OMX Fund (continued)
Nominal Security Description Fair Value USD
% of Net Assets
Singapore 605,114 Wilmar International Ltd 2,447,204 8.42
Total Singapore 2,447,204 8.42 South Africa
4,164 Astral Foods Ltd 60,602 0.21 Total South Africa 60,602 0.21 Switzerland
8,940 Syngenta AG 2,347,451 8.08 Total Switzerland 2,347,451 8.08 Taiwan
96,534 Taiwan Fertilizer Co Ltd 237,890 0.82 Total Taiwan 237,890 0.82 United States
49,910 Archer-Daniels-Midland Co 1,238,267 4.26 7,072 CF Industries Holdings Inc 872,614 3.00 7,531 Corn Products International Inc 295,516 1.02
11,413 Darling International Inc 143,690 0.49 7,361 Intrepid Potash Inc 183,068 0.63
41,086 Monsanto Company 2,466,804 8.50 39,218 Mosaic Co 1,920,506 6.61 6,165 Scotts Miracle-Gro Co/The 274,959 0.95
Total United States 7,395,424 25.46
Portfolio of Investments 29,047,279 99.95
Current Assets 68,795 0.24
Total Assets 29,116,074 100.19
Current Liabilities (55,290) (0.19)
Net Assets attributable to Holders of Redeemable Participating Shares 29,060,784 100.00

PowerShares Global Funds Ireland plc
Annual Report and Audited Financial Statements for the year ended 30 September 2011
276
Schedule of Investments
PowerShares Middle East North Africa NASDAQ OMX Fund
Description Maturity
Date Currency Nominal
Value Unrealised
Loss % of Net
Assets Total Return Swaps Middle East North Africa NASDAQ OMX Index Swap 10/01/2013 USD 5,168,765 (48,529) (0.94) Total of Total Return Swaps (48,529) (0.94)
Fair Value % of Net
Assets
PowerShares Cash Pool Fund 5,321,151 102.56 Portfolio of Investments 5,321,151 102.56 Current Assets 108,087 2.08 Total Assets 5,429,238 104.64
ITotal Return Swaps (48,529) (0.93) Current Liabilities (192,461) (3.71) Total Liabilities (240,990) (4.64) Net Assets attributable to Holders of Redeemable Participating Shares 5,188,248 100.00
* Pledged as Collateral - Nominal 5,305,870 % Ownership of Common Investment Pool – 21% (refer to page 279 for breakdown of Common Investment Pool)

PowerShares Global Funds Ireland plc
Annual Report and Audited Financial Statements for the year ended 30 September 2011
277
Schedule of Investments
PowerShares EuroMTS Cash 3 Months Fund
Nominal Security Description Fair Value EUR
% of Net Assets
Euro Countries 500,000 Belgium Treasury Bill 20/10/2011 499,825 0.69
2,200,000 Belgium Treasury Bill 15/12/2011 2,196,304 3.05 1,710,000 Belgium Treasury Bill 19/01/2012 1,705,451 2.37
500,000 Belgium Treasury Bill 15/03/2012 497,985 0.69 1,300,000 Dutch Treasury Certificate 31/10/2011 1,299,877 1.80 1,665,000 Dutch Treasury Certificate 30/11/2011 1,664,609 2.31 1,500,000 Dutch Treasury Certificate 31/01/2012 1,499,475 2.08 1,025,000 Dutch Treasury Certificate 29/02/2012 1,025,164 1.42 4,050,000 France Treasury Bill BTF 20/10/2011 4,049,351 5.62 1,500,000 France Treasury Bill BTF 17/11/2011 1,499,280 2.08 2,750,000 France Treasury Bill BTF 12/01/2011 2,748,185 3.82 2,500,000 France Treasury Bill BTF 15/12/2011 2,498,138 3.47 2,000,000 France Treasury Bill BTF 29/12/2011 1,998,160 2.77 2,760,000 France Treasury Bill BTF 01/12/2012 2,756,992 3.83 3,500,000 France Treasury Bill BTF 26/01/2012 3,495,957 4.85 3,350,000 France Treasury Bill BTF 02/09/2012 3,345,125 4.64 2,410,000 France Treasury Bill BTF 23/02/2012 2,405,758 3.34 2,500,000 German Treasury Bill 26/10/2011 2,500,100 3.47
600,000 German Treasury Bill 23/11/2011 599,829 0.83 1,100,000 German Treasury Bill 14/12/2011 1,099,764 1.53
750,000 German Treasury Bill 25/01/2012 749,415 1.04 1,700,000 German Treasury Bill 15/02/2012 1,698,844 2.36 1,100,000 German Treasury Bill 29/02/2012 1,099,472 1.53 2,000,000 Italy Buoni Ordinari del Tesoro BOT 14/10/2011 1,999,320 2.78 2,500,000 Italy Buoni Ordinari del Tesoro BOT 15/12/2011 2,492,150 3.46 3,200,000 Italy Buoni Ordinari del Tesoro BOT 30/12/2011 3,188,288 4.43 2,700,000 Italy Buoni Ordinari del Tesoro BOT 16/01/2012 2,684,151 3.73 1,500,000 Italy Buoni Ordinari del Tesoro BOT 31/01/2012 1,491,165 2.07 3,165,000 Italy Buoni Ordinari del Tesoro BOT 15/02/2012 3,139,332 4.36 3,950,000 Italy Buoni Ordinari del Tesoro BOT 15/03/2012 3,904,238 5.42
750,000 Portugal Treasury Bill 21/10/2011 748,538 1.04 400,000 Portugal Treasury Bill 23/12/2011 395,586 0.55
1,100,000 Portugal Treasury Bill 0% 20/01/2012 20/01/2012 1,081,432 1.50 2,500,000 Spain Letras del Tesoro 21/10/2011 2,498,388 3.47
750,000 Spain Letras del Tesoro 18/11/2011 748,523 1.04 500,000 Spain Letras del Tesoro 16/12/2011 498,243 0.69
2,000,000 Spain Letras del Tesoro 20/01/2012 1,987,140 2.76 2,250,000 Spain Letras del Tesoro 17/02/2012 2,228,895 3.09
Total Euro Countries 72,018,449 99.98

PowerShares Global Funds Ireland plc
Annual Report and Audited Financial Statements for the year ended 30 September 2011
278
Schedule of Investments
PowerShares EuroMTS Cash 3 Months Fund (continued)
Nominal Security Description Fair Value EUR
% of Net Assets
Portfolio of Investments 72,018,449 99.98
Current Assets 1,886,385 2.62
Total Assets 73,904,834 102.60
Current Liabilities (1,870,952) (2.60)
Net Assets attributable to Holders of Redeemable Participating Shares 72,033,882 100.00

PowerShares Global Funds Ireland plc
Annual Report and Audited Financial Statements for the year ended 30 September 2011
279
Schedule of Investments
Common Investment Pool
Fair Value Nominal Security Description USD 1,500,000 Anz National Int C/P Jan 31 12 1,498,000 1,000,000 Asb Finance Ltd C/P Oct 12 11 1,000,000 1,500,000 Bcee C/P Nov 25 11 1,499,000 1,000,000 Bk Of Tokyo Mit C/D 0.000 Oct 26 11 1,000,000 2,470,438 Bnp T/D 0.190 Oct 06 11 2,470,000 2,000,000 Bnp Paribas Syd C/P Oct 18 11 2,000,000 1,300,000 Caisse Des Depot C/P Dec 21 11 1,299,000 1,500,000 Credit Suisse C/P Nov 08 11 1,500,000 1,000,000 Fms Wertman C/P Dec 08 11 999,000 1,500,000 Nederlanse Water C/P Nov 30 11 1,499,000 4,500,000 Societe Generale T/D 0.250 Oct 03 11 4,500,000 1,000,000 Sumitomo Mit Bk C/D 0.000 Oct 31 11 1,000,000 1,955,002 Ubs T/D 0.040 Oct 04 11 1,955,000 (997,466) US Dollar Overdraft (997,000) 2,000,000 Svenska Handelsbanken 0 11/08/12 2,000,000 1,000,000 Westpac Banking Corp Ny 0 06/15/12 1,007,000 932,987 Short-Term Inv-Usd Liq Pt-In Mf 933,000
25,162,000

PowerShares Global Funds Ireland plc
Annual Report and Audited Financial Statements for the year ended 30 September 2011
Statement of Changes in Composition of Portfolio
280
PowerShares EQQQ Fund
Purchases Security Description Nominal Cost USD Microsoft Corp 2,672,329 69,556,178 Apple Inc 180,604 61,368,192 Oracle Corp 1,456,914 50,862,201 Intel Corp 1,725,620 39,296,179 Google Inc 55,484 31,026,391 Cisco Systems Inc 1,710,946 30,417,699 Amazon.com Inc 88,639 16,817,893 QUALCOMM Inc 303,581 16,155,187 Amgen Inc 252,250 14,279,801 Dell Inc 611,677 9,418,099 Comcast Corp 380,991 9,352,190 Costco Wholesale Corp 108,397 8,517,349 eBay Inc 215,459 6,855,991 DIRECTV 148,638 6,840,470 Yahoo! Inc 360,035 6,170,269 F5 Networks Inc 43,712 5,686,730 Green Mountain Coffee Roasters Inc 67,416 5,606,457 Teva Pharmaceutical Industries Ltd 106,737 5,419,978 Whole Foods Market Inc 102,660 5,403,950 Netflix Inc 28,264 5,383,643

PowerShares Global Funds Ireland plc
Annual Report and Audited Financial Statements for the year ended 30 September 2011
Statement of Changes in Composition of Portfolio
281
PowerShares EQQQ Fund
Sales Security Description
Nominal Proceeds USD
Apple Inc 362,332 125,536,555 QUALCOMM Inc 474,950 25,949,976 Microsoft Corp 609,272 15,577,864 Genzyme Corp 167,296 12,676,391 Google Inc 19,689 10,820,141 Starbucks Corp 293,648 10,448,770 Oracle Corp 351,838 10,359,194 Intel Corp 462,056 9,630,649 Amazon.com Inc 37,366 7,158,714 Baidu Inc 52,889 7,148,948 Cisco Systems Inc 408,050 6,813,153 Teva Pharmaceutical Industries Ltd 143,479 6,624,770 Gilead Sciences Inc 166,886 6,479,970 Millicom International Cellular SA 59,398 6,200,072 Altera Corp 126,334 5,747,284 Intuit Inc 105,943 5,606,881 Bed Bath & Beyond Inc 102,531 5,519,614 priceline.com Inc 10,180 5,182,719 DIRECTV 116,079 5,057,751 Biogen Idec Inc 56,873 5,004,751

PowerShares Global Funds Ireland plc
Annual Report and Audited Financial Statements for the year ended 30 September 2011
Statement of Changes in Composition of Portfolio
282
PowerShares FTSE RAFI US 1000 Fund
Purchases Security Description Nominal Cost USD Bank of America Corp 84,104 1,108,011 Exxon Mobil Corp 13,571 1,071,771 AT&T Inc 30,824 903,733 General Electric Co 43,097 819,399 Wal-Mart Stores Inc 15,028 790,860 JPMorgan Chase & Co 16,938 739,989 Chevron Corp 6,990 688,698 Citigroup Inc 137,315 626,151 Pfizer Inc 31,467 609,825 Procter & Gamble Co 8,962 558,268 Berkshire Hathaway Inc 6,795 556,068 Verizon Communications Inc 15,306 554,782 Johnson & Johnson 8,761 531,444 ConocoPhillips 7,212 521,074 Wells Fargo & Co 15,676 467,245 Merck & Co Inc 12,978 430,662 Microsoft Corp 15,871 416,168 Hewlett-Packard Co 9,159 371,826 International Business Machines Corp 2,258 358,511 Goldman Sachs Group Inc 2,093 325,295

PowerShares Global Funds Ireland plc
Annual Report and Audited Financial Statements for the year ended 30 September 2011
Statement of Changes in Composition of Portfolio
283
PowerShares FTSE RAFI US 1000 Fund
Sales Security Description
Nominal Proceeds USD
Exxon Mobil Corp 10,072 813,299 General Electric Co 33,755 649,108 Chevron Corp 5,357 549,503 American International Group Inc 15,420 540,061 AT&T Inc 16,171 497,591 ConocoPhillips 6,721 494,169 Verizon Communications Inc 12,721 463,872 Bank of America Corp 34,288 388,622 JPMorgan Chase & Co 8,373 357,888 Wal-Mart Stores Inc 6,372 346,802 Microsoft Corp 13,641 344,765 Pfizer Inc 16,400 331,271 Altria Group Inc 12,273 317,405 Citigroup Inc 7,677 314,845 Wells Fargo & Co 9,170 254,591 Procter & Gamble Co 3,914 254,092 Johnson & Johnson 3,776 246,199 Time Warner Cable Inc 3,444 237,069 Berkshire Hathaway Inc 2,827 222,155 International Business Machines Corp 1,205 202,103

PowerShares Global Funds Ireland plc
Annual Report and Audited Financial Statements for the year ended 30 September 2011
Statement of Changes in Composition of Portfolio
284
PowerShares Global Clean Energy Fund
Purchases Security Description Nominal Cost EUR Xinjiang Goldwind Science & Technology Co Ltd 267,000 241,507 China Ming Yang Wind Power Group Ltd 34,756 212,902 Trony Solar Holdings Co Ltd 358,000 172,916 China Datang Corp Renewable Power Co Ltd 835,000 164,815 STR Holdings Inc 12,389 164,444 Enel Green Power SpA 95,326 153,273 China Suntien Green Energy Corp Ltd 689,000 146,492 Amyris Inc 7,048 139,724 Brookfield Renewable Power Fund 8,068 134,427 Huaneng Renewables Corp Ltd 564,000 125,705 LSB Industries Inc 4,849 121,943 Solazyme Inc 9,097 116,431 Universal Display Corp 4,722 113,295 Elster Group SE 9,190 108,310 Molycorp Inc 2,646 105,918 China High Speed Transmission Equipment Group Co Ltd 176,000 102,635 Renewable Energy Corp ASA 87,971 96,435 Solarworld AG 23,506 95,915 Yingli Green Energy Holding Co Ltd 29,050 95,900 Suntech Power Holdings Co Ltd 34,799 83,657

PowerShares Global Funds Ireland plc
Annual Report and Audited Financial Statements for the year ended 30 September 2011
Statement of Changes in Composition of Portfolio
285
PowerShares Global Clean Energy Fund
Sales Security Description
Nominal Proceeds EUR
EDF Energies Nouvelles SA 5,480 202,129 Baldor Electric Company 4,013 190,586 Universal Display Corp 4,627 169,582 Polypore International Inc 4,308 157,368 Iberdrola Renovables SA 24,372 118,909 GT Solar International Inc 11,706 113,208 EDP Renovaveis SA 22,780 99,625 Tesla Motors Inc 5,108 98,995 Acciona SA 1,440 98,003 Novozymes A/S 877 94,117 China WindPower Group Ltd 1,430,000 92,880 Centrotherm Photovoltaics AG 3,412 86,041 Covanta Holding Corp 6,801 82,024 Enel Green Power SpA 43,351 81,840 Hansen Transmissions International NV 111,289 81,762 Gamesa Corp Tecnologica SA 13,265 79,870 A123 Systems Inc 20,488 79,471 Fortum OYJ 3,678 78,921 STR Holdings Inc 7,546 76,350 SechilienneSidec 4,495 75,353

PowerShares Global Funds Ireland plc
Annual Report and Audited Financial Statements for the year ended 30 September 2011
Statement of Changes in Composition of Portfolio
286
PowerShares Dynamic US Market Fund
Purchases Security Description Nominal Cost USD
Walgreen Co 34,051 1,348,880 Valero Energy Corp 44,674 1,200,590 Exxon Mobil Corp 13,748 1,165,968 Chevron Corp 11,155 1,143,276 National Oilwell Varco Inc 14,696 1,132,180 Halliburton Co 29,848 1,130,320 ConocoPhillips 17,948 1,080,701 Reynolds American Inc 30,001 928,818 Philip Morris International Inc 12,328 876,170 Ball Corp 13,014 855,946 Costco Wholesale Corp 10,668 855,877 Travelers Cos Inc 14,776 845,990 Estee Lauder Cos Inc 8,735 801,262 Mosaic Company 9,275 788,097 Cliffs Natural Resources Inc 8,896 782,303 United Parcel Service Inc 10,573 742,739 BMC Software Inc 16,707 742,237 Oracle Corp 27,012 731,112 International Business Machines Corp 5,153 729,281 Fiserv Inc 13,168 728,596

PowerShares Global Funds Ireland plc
Annual Report and Audited Financial Statements for the year ended 30 September 2011
Statement of Changes in Composition of Portfolio
287
PowerShares Dynamic US Market Fund
Sales Security Description
Nominal Proceeds USD
Chevron Corp 21,830 1,979,270 ConocoPhillips 17,948 1,360,161 Halliburton Co 29,848 1,354,440 Western Union Co 69,887 1,235,308 Exxon Mobil Corp 13,748 1,127,652 Peabody Energy Corp 18,541 1,090,192 National Oilwell Varco Inc 14,696 1,052,309 Coca-Cola Enterprises Inc 42,457 1,024,895 Reynolds American Inc 30,001 1,011,513 Altria Group Inc 38,933 973,282 Ball Corp 23,977 917,161 Estee Lauder Cos Inc 8,735 875,454 Costco Wholesale Corp 10,668 844,828 Oracle Corp 27,012 844,610 Walgreen Co 19,398 839,329 International Business Machines Corp 5,153 839,134 Travelers Cos Inc 14,776 829,106 Fiserv Inc 13,168 827,031 PPG Industries Inc 10,448 814,408 AMETEK Inc 13,733 812,431

PowerShares Global Funds Ireland plc
Annual Report and Audited Financial Statements for the year ended 30 September 2011
Statement of Changes in Composition of Portfolio
288
PowerShares FTSE RAFI Europe Fund
Purchases Security Description Nominal Cost USD BP Plc 14,618 77,192 Sanofi 1,261 59,834 Vodafone Group Plc 26,071 51,633 HSBC Holdings Plc 6,259 45,325 E.ON AG 2,173 45,049 Nokia OYJ 6,236 36,563 Telefonica SA 2,122 36,374 BNP Paribas SA 630 32,644 Banco Santander SA 3,739 30,045 AP Moller - Maersk A/S 4 28,485 Transocean Ltd/Switzerland 501 28,275 UniCredit SpA 16,191 26,675 Nestle SA 630 25,058 AXA SA 1,771 24,552 Novartis AG 600 23,328 Hennes & Mauritz AB 1,004 23,287 GDF Suez 891 23,179 Deutsche Telekom AG 2,221 21,551 Intesa Sanpaolo SpA 10,379 20,417 Banco Bilbao Vizcaya Argentaria SA 2,419 20,046
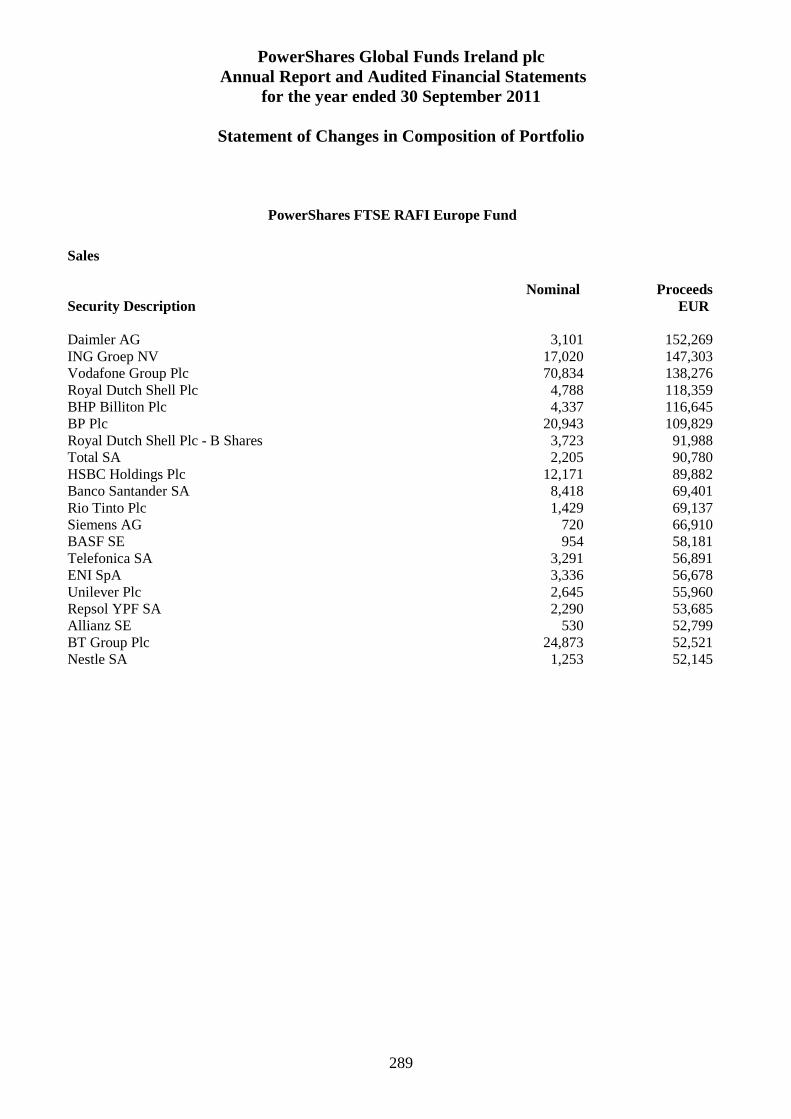
PowerShares Global Funds Ireland plc
Annual Report and Audited Financial Statements for the year ended 30 September 2011
Statement of Changes in Composition of Portfolio
289
PowerShares FTSE RAFI Europe Fund
Sales Security Description
Nominal Proceeds EUR
Daimler AG 3,101 152,269 ING Groep NV 17,020 147,303 Vodafone Group Plc 70,834 138,276 Royal Dutch Shell Plc 4,788 118,359 BHP Billiton Plc 4,337 116,645 BP Plc 20,943 109,829 Royal Dutch Shell Plc - B Shares 3,723 91,988 Total SA 2,205 90,780 HSBC Holdings Plc 12,171 89,882 Banco Santander SA 8,418 69,401 Rio Tinto Plc 1,429 69,137 Siemens AG 720 66,910 BASF SE 954 58,181 Telefonica SA 3,291 56,891 ENI SpA 3,336 56,678 Unilever Plc 2,645 55,960 Repsol YPF SA 2,290 53,685 Allianz SE 530 52,799 BT Group Plc 24,873 52,521 Nestle SA 1,253 52,145
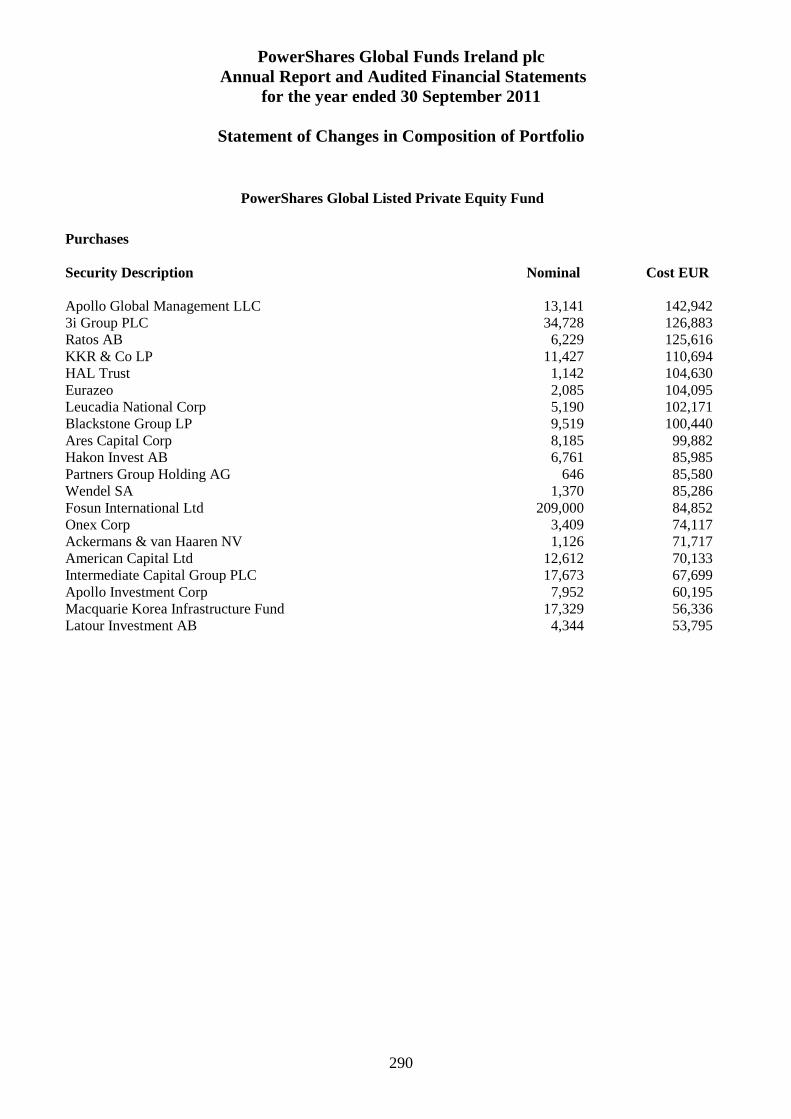
PowerShares Global Funds Ireland plc
Annual Report and Audited Financial Statements for the year ended 30 September 2011
Statement of Changes in Composition of Portfolio
290
PowerShares Global Listed Private Equity Fund
Purchases Security Description Nominal Cost EUR Apollo Global Management LLC 13,141 142,942 3i Group PLC 34,728 126,883 Ratos AB 6,229 125,616 KKR & Co LP 11,427 110,694 HAL Trust 1,142 104,630 Eurazeo 2,085 104,095 Leucadia National Corp 5,190 102,171 Blackstone Group LP 9,519 100,440 Ares Capital Corp 8,185 99,882 Hakon Invest AB 6,761 85,985 Partners Group Holding AG 646 85,580 Wendel SA 1,370 85,286 Fosun International Ltd 209,000 84,852 Onex Corp 3,409 74,117 Ackermans & van Haaren NV 1,126 71,717 American Capital Ltd 12,612 70,133 Intermediate Capital Group PLC 17,673 67,699 Apollo Investment Corp 7,952 60,195 Macquarie Korea Infrastructure Fund 17,329 56,336 Latour Investment AB 4,344 53,795

PowerShares Global Funds Ireland plc
Annual Report and Audited Financial Statements for the year ended 30 September 2011
Statement of Changes in Composition of Portfolio
291
PowerShares Global Listed Private Equity Fund
Sales Security Description
Nominal Proceeds EUR
KKR & Co LP 11,932 140,903 Macquarie Korea Infrastructure Fund 39,569 124,249 Leucadia National Corp 2,900 72,567 HAL Trust 672 61,507 Blackstone Group LP 4,449 60,630 Partners Group Holding AG 416 52,177 Hakon Invest AB 4,683 49,579 Southern Cross Media Group Ltd 24,624 38,466 Latour Investment AB 2,854 38,286 American Capital Ltd 5,750 38,259 Ares Capital Corp 3,408 37,265 Graphite Enterprise Trust PLC 9,713 34,328 Ackermans & van Haaren NV 442 26,326 Kayne Anderson Energy Development Co 1,958 24,478 DeA Capital SpA 15,962 24,203 JZ Capital Partners Ltd 5,529 24,149 Fortress Investment Group LLC 7,225 24,020 Jafco Co Ltd 1,400 22,717 Harris & Harris Group Inc 6,975 22,528 Onex Corp 893 21,712

PowerShares Global Funds Ireland plc
Annual Report and Audited Financial Statements for the year ended 30 September 2011
Statement of Changes in Composition of Portfolio
292
PowerShares Palisades Global Water Fund
Purchases Security Description Nominal Cost EUR Grontmij NV 25,563 271,553 Uponor OYJ 17,316 165,984 Veolia Environnement SA 9,834 134,265 Wavin NV 17,919 125,081 GLV Inc 29,957 120,092 KSB AG 208 113,832 Puncak Niaga Holding BHD 263,120 112,446 Hyflux Ltd 87,893 103,449 Itron Inc 2,551 102,335 Nalco Holding Co 4,790 90,685 Kemira OYJ 9,075 89,055 Ebara Corp 27,395 88,161 Organo Corp 16,245 80,814 ITT Corp 2,112 76,248 Kurita Water Industries Ltd 3,548 72,900 Geberit AG 488 71,183 Pentair Inc 2,600 68,084 Sound Global Ltd 150,928 63,490 Arcadis NV 3,694 59,566 Tetra Tech Inc 3,680 59,318

PowerShares Global Funds Ireland plc
Annual Report and Audited Financial Statements for the year ended 30 September 2011
Statement of Changes in Composition of Portfolio
293
PowerShares Palisades Global Water Fund
Sales Security Description
Nominal Proceeds EUR
Severn Trent PLC 11,846 207,290 Nalco Holding Co 7,640 191,883 Valmont Industries Inc 2,376 156,526 Halma PLC 35,697 142,507 Organo Corp 22,000 122,115 Tetra Tech Inc 6,613 114,103 American Water Works Co Inc 4,985 104,449 Guangdong Investment Ltd 244,000 99,704 Cia de Saneamento Basico do Estado de Sao Paulo 4,600 89,315 United Utilities Group PLC 11,940 83,389 Aqua America Inc 4,479 71,539 Itron Inc 2,196 62,941 Kurita Water Industries Ltd 2,500 51,121 Stantec Inc 2,426 47,463 Geberit AG 213 44,641 Veolia Environnement SA 2,039 43,725 Arcadis NV 2,295 38,392 Puncak Niaga Holding BHD 66,200 35,783 Suez Environnement Co 2,375 35,138 Sound Global Ltd 48,000 18,909

PowerShares Global Funds Ireland plc
Annual Report and Audited Financial Statements for the year ended 30 September 2011
Statement of Changes in Composition of Portfolio
294
PowerShares FTSE RAFI Asia Pacific Ex-Japan Fund
Purchases Security Description Nominal Cost USD Samsung Electronics Co Ltd 153 122,138 BHP Billiton Ltd 2,717 119,381 Westpac Banking Corp 5,296 117,713 Commonwealth Bank of Australia 2,282 115,579 National Australia Bank Ltd 4,312 105,700 POSCO 211 91,751 Australia & New Zealand Banking Group Ltd 4,015 90,769 SK Holdings Co Ltd 480 67,069 Hutchison Whampoa Ltd 4,882 56,210 Woolworths Ltd 1,985 53,865 Hyundai Motor Co 304 53,548 Rio Tinto Ltd 585 49,966 Westfield Group 5,184 49,913 AIA Group Ltd 16,661 49,713 Wesfarmers Ltd 1,361 43,743 LG Electronics Inc 450 39,608 Shinhan Financial Group Co Ltd 864 37,559 QBE Insurance Group Ltd 2,195 37,220 Korea Electric Power Corp 1,528 36,702 SK Innovation Co Ltd 194 35,436

PowerShares Global Funds Ireland plc
Annual Report and Audited Financial Statements for the year ended 30 September 2011
Statement of Changes in Composition of Portfolio
295
PowerShares FTSE RAFI Asia Pacific Ex-Japan Fund
Sales Security Description
Nominal Proceeds USD
Rio Tinto Ltd 1,485 118,849 BHP Billiton Ltd 2,343 103,618 Korea Kumho Petrochemical 530 63,455 Hutchison Whampoa Ltd 4,000 43,539 SK Holdings Co Ltd 289 39,160 S-Oil Corp 300 37,111 Kia Motors Corp 606 32,547 Swire Pacific Ltd 2,000 27,625 Hyundai Motor Co 168 27,099 Hyundai Heavy Industries Co Ltd 50 20,897 Westfield Retail Trust 8,061 20,442 Alumina Ltd 7,357 16,315 City Developments Ltd 2,000 16,089 SJM Holdings Ltd 9,748 15,971 Intoll Group 10,217 15,411 Cheung Kong Holdings Ltd 1,000 14,925 Keppel Corp Ltd 2,000 14,493 Hanwha Chem Corp 400 14,420 Oversea-Chinese Banking Corp Ltd 2,000 13,799 Neptune Orient Lines Ltd 8,083 12,859
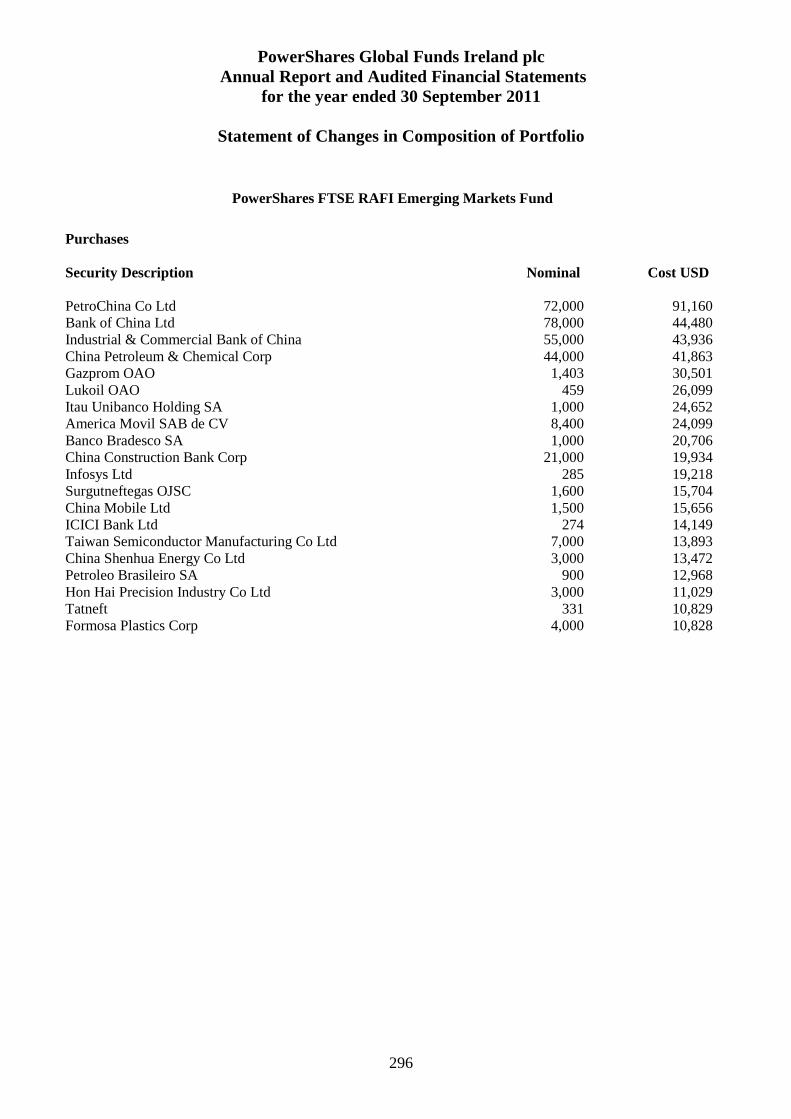
PowerShares Global Funds Ireland plc
Annual Report and Audited Financial Statements for the year ended 30 September 2011
Statement of Changes in Composition of Portfolio
296
PowerShares FTSE RAFI Emerging Markets Fund
Purchases Security Description Nominal Cost USD PetroChina Co Ltd 72,000 91,160 Bank of China Ltd 78,000 44,480 Industrial & Commercial Bank of China 55,000 43,936 China Petroleum & Chemical Corp 44,000 41,863 Gazprom OAO 1,403 30,501 Lukoil OAO 459 26,099 Itau Unibanco Holding SA 1,000 24,652 America Movil SAB de CV 8,400 24,099 Banco Bradesco SA 1,000 20,706 China Construction Bank Corp 21,000 19,934 Infosys Ltd 285 19,218 Surgutneftegas OJSC 1,600 15,704 China Mobile Ltd 1,500 15,656 ICICI Bank Ltd 274 14,149 Taiwan Semiconductor Manufacturing Co Ltd 7,000 13,893 China Shenhua Energy Co Ltd 3,000 13,472 Petroleo Brasileiro SA 900 12,968 Hon Hai Precision Industry Co Ltd 3,000 11,029 Tatneft 331 10,829 Formosa Plastics Corp 4,000 10,828

PowerShares Global Funds Ireland plc
Annual Report and Audited Financial Statements for the year ended 30 September 2011
Statement of Changes in Composition of Portfolio
297
PowerShares FTSE RAFI Emerging Markets Fund
Sales Security Description
Nominal Proceeds USD
PetroChina Co Ltd 970,000 1,276,110 China Petroleum & Chemical Corp 578,000 574,049 Gazprom OAO 18,328 489,166 Industrial & Commercial Bank of China 592,000 452,565 Bank of China Ltd 702,000 374,306 Lukoil OAO 5,626 333,794 America Movil SAB de CV 110,600 325,508 Itau Unibanco Holding SA 12,600 305,539 Infosys Ltd 3,816 294,030 Surgutneftegas OJSC 26,202 291,620 Banco Bradesco SA 12,430 252,045 Taiwan Semiconductor Manufacturing Co Ltd 101,000 240,551 ICICI Bank Ltd 4,610 219,452 Petroleo Brasileiro SA 12,500 203,221 China Construction Bank Corp 194,000 177,719 China Shenhua Energy Co Ltd 40,000 174,699 China Mobile Ltd 16,500 163,872 Formosa Plastics Corp 49,000 160,007 Petroleo Brasileiro SA 8,600 157,331 Cemex SAB de CV 124,108 135,490

PowerShares Global Funds Ireland plc
Annual Report and Audited Financial Statements for the year ended 30 September 2011
Statement of Changes in Composition of Portfolio
298
PowerShares FTSE RAFI UK 100 Fund
Purchases Security Description Nominal Cost GBP BP Plc 605,057 2,772,923 HSBC Holdings Plc 356,060 2,192,121 Vodafone Group Plc 1,239,244 2,065,166 Royal Dutch Shell Plc - A Shares 73,034 1,634,858 Royal Dutch Shell Plc - B Shares 60,403 1,351,043 GlaxoSmithKline Plc 96,294 1,295,024 Barclays Plc 348,041 822,876 AstraZeneca Plc 26,511 817,272 Tesco Plc 174,162 706,711 British American Tobacco Plc 22,531 632,724 Aviva Plc 138,416 575,273 BT Group Plc 275,644 538,749 Rio Tinto Plc 12,179 535,450 National Grid Plc 70,701 433,769 Lloyds Banking Group Plc 934,922 431,413 Anglo American Plc 13,814 418,818 BHP Billiton Plc 17,209 416,027 Standard Chartered Plc 25,572 414,524 Diageo Plc 28,460 364,270 BG Group Plc 24,488 347,808

PowerShares Global Funds Ireland plc
Annual Report and Audited Financial Statements for the year ended 30 September 2011
Statement of Changes in Composition of Portfolio
299
PowerShares FTSE RAFI UK 100 Fund
Sales Security Description
Nominal Proceeds GBP
Royal Dutch Shell Plc - B Shares 13,926 299,622 Royal Dutch Shell Plc - A Shares 13,575 290,192 BP Plc 32,869 139,199 Vodafone Group Plc 68,838 116,187 BHP Billiton Plc 4,368 99,800 Rio Tinto Plc 1,471 56,847 BT Group Plc 28,856 51,283 HSBC Holdings Plc 8,246 48,928 Unilever Plc 2,547 46,431 Royal Bank of Scotland Group Plc 95,341 38,741 Anglo American Plc 1,230 37,358 Carnival Plc 1,437 35,047 GlaxoSmithKline Plc 2,588 34,824 Aviva Plc 7,454 28,400 AstraZeneca Plc 842 24,695 Barclays Plc 11,903 24,010 Xstrata Plc 1,678 23,045 British American Tobacco Plc 837 22,062 Tesco Plc 5,052 19,548 International Consolidated Airlines Group SA 8,715 18,796

PowerShares Global Funds Ireland plc
Annual Report and Audited Financial Statements for the year ended 30 September 2011
Statement of Changes in Composition of Portfolio
300
PowerShares FTSE RAFI All-World 3000 Fund
Purchases Security Description Nominal Cost USD Genuine Parts Co 2,000 102,260 International Flavors & Fragrances Inc 995 54,834 Torchmark Corp 843 50,926 ConAgra Foods Inc 2,135 48,038 Terna Rete Elettrica Nazionale SpA 9,943 41,076 United Microelectronics Corp 62,000 34,738 Flextronics International Ltd 4,355 33,359 Henry Schein Inc 531 32,836 Far EasTone Telecommunications Co Ltd 22,000 30,985 Technip SA 322 29,422 Secom Co Ltd 600 27,719 PostNL NV 1,077 27,099 Weyerhaeuser Co 1,460 26,528 3i Group Plc 5,109 26,106 Goodyear Tire & Rubber Co 2,240 26,096 Toyota Motor Corp 628 23,933 Computer Sciences Corp 481 23,306 CNO Financial Group Inc 3,490 23,243 Royal Dutch Shell Plc 719 22,943 Fifth Third Bancorp 1,517 21,359

PowerShares Global Funds Ireland plc
Annual Report and Audited Financial Statements for the year ended 30 September 2011
Statement of Changes in Composition of Portfolio
301
PowerShares FTSE RAFI All-World 3000 Fund
Sales Security Description
Nominal Proceeds USD
Exxon Mobil Corp 4,059 302,484 General Electric Co 10,763 200,511 Chevron Corp 1,998 182,674 PetroChina Co Ltd 133,628 175,808 AT&T Inc 5,639 168,998 BP Plc 21,843 168,545 ING Groep NV 15,490 151,999 HSBC Holdings Plc 13,921 148,244 Vodafone Group Plc 54,493 147,642 Daimler AG 2,082 146,613 Bank of America Corp 9,607 139,203 Citigroup, Inc. 27,716 137,469 Royal Dutch Shell Plc 4,044 134,193 Verizon Communications Inc 3,552 133,766 JPMorgan Chase & Co 2,696 120,482 Total SA 2,122 115,111 ConocoPhillips 1,652 111,574 Wells Fargo & Co 3,384 109,504 Royal Dutch Shell Plc-B SHS 3,227 106,807 Microsoft Corp 3,758 105,185

PowerShares Global Funds Ireland plc
Annual Report and Audited Financial Statements for the year ended 30 September 2011
Statement of Changes in Composition of Portfolio
302
PowerShares FTSE RAFI Developed Europe Mid-Small Fund
Purchases Security Description Nominal Cost EUR Banco Espirito Santo SA 37,148 118,387 OC Oerlikon Corp AG 17,895 75,059 Iberdrola Renovables SA 24,661 74,652 Gecina SA 767 71,916 Strabag SE 3,391 71,111 QIAGEN NV 4,704 68,437 Weir Group Plc 3,132 67,947 Hera SpA 41,638 66,171 Tryg A/S 1,641 65,564 Wacker Chemie AG 420 65,021 Fraport AG Frankfurt Airport Services Worldwide 1,279 64,478 Immofinanz AG 21,280 64,360 ICADE 742 62,788 DS Smith Plc 25,749 61,515 Georg Fischer AG 146 61,296 Suedzucker AG 3,080 61,216 CFAO SA 2,225 61,043 Eniro AB 391,140 60,190 Red Electrica Corp SA 1,524 60,163 Milano Assicurazioni SPA 63,468 60,020

PowerShares Global Funds Ireland plc
Annual Report and Audited Financial Statements for the year ended 30 September 2011
Statement of Changes in Composition of Portfolio
303
PowerShares FTSE RAFI Developed Europe Mid-Small Fund
Sales Security Description
Nominal Proceeds EUR
Immofinanz AG 39,744 119,711 OC Oerlikon Corp AG 24,114 113,270 Norske Skogindustrier ASA 45,576 96,094 IMI Plc 7,977 87,073 Nokian Renkaat OYJ 2,637 76,514 Banco Espirito Santo SA 27,009 74,684 DS Smith Plc 28,930 70,319 Trelleborg AB 10,143 70,235 Burberry Group Plc 5,509 70,163 Rhodia SA 3,452 68,783 Carillion Plc 16,181 68,691 Weir Group Plc 3,218 68,114 Bekaert SA 901 67,433 Prysmian SpA 4,598 67,421 Fugro NV 1,147 66,697 Sulzer AG 626 66,146 Meggitt Plc 17,184 66,112 Ashtead Group Plc 32,688 65,136 Brit Insurance Holdings NV 5,194 65,069 Electrocomponents Plc 20,383 62,191

PowerShares Global Funds Ireland plc
Annual Report and Audited Financial Statements for the year ended 30 September 2011
Statement of Changes in Composition of Portfolio
304
PowerShares FTSE RAFI Developed 1000 Fund
Purchases Security Description Nominal Cost EUR Bank of America Corp 2,812 28,438 BP Plc 4,271 23,671 Exxon Mobil Corp 357 21,553 United Overseas Bank Ltd 2,000 21,316 Berkshire Hathaway Inc 351 21,190 Wal-Mart Stores Inc 501 18,829 HSBC Holdings Plc 2,091 16,670 ING Groep NV 1,865 16,014 General Electric Co 1,038 15,984 Sanofi 320 15,359 AT&T Inc 687 14,578 Chevron Corp 200 13,935 JPMorgan Chase & Co 385 13,072 Vodafone Group Plc 6,038 13,022 Procter & Gamble Co 287 12,925 E.ON AG 549 12,072 Sun Hung Kai Properties Ltd 1,000 11,841 Daimler AG 221 11,559 Cheung Kong Holdings Ltd 1,000 11,556 American International Group Inc 355 11,411

PowerShares Global Funds Ireland plc
Annual Report and Audited Financial Statements for the year ended 30 September 2011
Statement of Changes in Composition of Portfolio
305
PowerShares FTSE RAFI Developed 1000 Fund
Sales Security Description
Nominal Proceeds EUR
Exxon Mobil Corp 905 50,372 General Electric Co 2,980 40,130 American International Group Inc 1,415 39,139 Daimler AG 789 38,783 ING Groep NV 4,457 34,718 Vodafone Group Plc 17,330 34,060 Chevron Corp 479 33,365 BHP Billiton Plc 1,140 31,171 ConocoPhillips 605 31,146 Verizon Communications Inc 1,167 30,259 Royal Dutch Shell Plc - A Shares 1,151 28,171 Microsoft Corp 1,326 25,867 AT&T Inc 1,072 23,559 Altria Group Inc 1,208 21,960 Royal Dutch Shell Plc - B Shares 881 21,468 BP Plc 3,600 19,783 Total SA 499 19,717 BHP Billiton Ltd 604 19,616 Wells Fargo & Co 828 18,577 Rio Tinto Plc 377 18,225

PowerShares Global Funds Ireland plc
Annual Report and Audited Financial Statements for the year ended 30 September 2011
Statement of Changes in Composition of Portfolio
306
PowerShares FTSE RAFI Italy 30 Fund
Purchases Security Description Nominal Cost EUR Telecom Italia SpA 324,320 297,871 ENI SpA 8,220 136,831 UniCredit SpA 76,972 121,918 Enel SpA 25,566 104,341 Intesa Sanpaolo SpA 49,072 96,981 Banco Popolare SC 39,487 95,384 Assicurazioni Generali SpA 4,944 71,951 Parmalat SpA 18,928 48,134 Banca Popolare dell'Emilia Romagna Scarl 4,692 42,669 Unipol Gruppo Finanziario SpA 103,090 39,591 Unione di Banche Italiane SCPA 5,768 34,694 Fiat SpA 5,358 32,772 FondiariaSai SpA 8,546 31,750 Pirelli & C SpA 4,866 29,089 Prysmian SpA 1,845 26,903 Telecom Italia SpA 27,050 25,154 Banca Popolare di Sondrio Scarl 3,362 20,567 FondiariaSai SpA 5,804 20,530 Unipol Gruppo Finanziario SpA 43,779 20,501 Italcementi SpA 5,131 19,776

PowerShares Global Funds Ireland plc
Annual Report and Audited Financial Statements for the year ended 30 September 2011
Statement of Changes in Composition of Portfolio
307
PowerShares FTSE RAFI Italy 30 Fund
Sales Security Description
Nominal Proceeds EUR
ENI SpA 40,200 642,908 Telecom Italia SpA 441,453 399,412 Enel SpA 82,417 309,903 UniCredit SpA 224,342 300,821 Telecom Italia SpA 285,439 274,978 Fiat Industrial SpA 26,696 253,856 Intesa Sanpaolo SpA 113,865 196,507 Assicurazioni Generali SpA 12,984 178,679 Fiat SpA 15,975 91,586 Banco Popolare SC 28,290 53,169 Unipol Gruppo Finanziario SpA 131,409 47,601 Saipem SpA 1,227 41,339 Mediobanca SpA 5,416 37,690 Unione di Banche Italiane SCPA 7,520 32,449 Finmeccanica SpA 4,637 31,855 Banca Monte dei Paschi di Siena SpA 47,244 31,598 Tenaris SA 2,104 30,710 FondiariaSai SpA 10,818 30,492 Unipol Gruppo Finanziario SpA 66,449 29,345 Atlantia SpA 2,061 27,752

PowerShares Global Funds Ireland plc
Annual Report and Audited Financial Statements for the year ended 30 September 2011
Statement of Changes in Composition of Portfolio
308
PowerShares FTSE RAFI Switzerland Fund
Purchases Security Description Nominal Cost CHF Nestle SA 3,728 194,388 Novartis AG 3,253 160,981 Credit Suisse Group AG 2,590 103,100 Transocean Ltd 1,375 99,004 Roche Holding AG 617 82,472 Zurich Financial Services AG 319 77,045 UBS AG 4,386 73,327 Swiss Reinsurance Co Ltd 847 46,142 Holcim Ltd 557 38,844 ABB Ltd 1,600 34,625 Swiss Life Holding AG 153 24,247 Syngenta AG 60 18,099 Cie Financiere Richemont SA 309 15,829 Lonza Group AG 206 15,236 Adecco SA 241 14,069 Sulzer AG 95 13,183 Swisscom AG 30 12,129 Aryzta AG 278 12,091 Petroplus Holdings AG 821 11,340 Baloise Holding AG 111 10,223

PowerShares Global Funds Ireland plc
Annual Report and Audited Financial Statements for the year ended 30 September 2011
Statement of Changes in Composition of Portfolio
309
PowerShares FTSE RAFI Switzerland Fund
Sales Security Description
Nominal Proceeds CHF
UBS AG 3,796 61,293 Swiss Reinsurance Co Ltd 419 27,911 Roche Holding AG 161 20,329 Zurich Financial Services AG 31 18,164 GAM Holding AG 1,068 17,983 Credit Suisse Group AG 80 10,538 Swiss Life Holding AG 54 9,932 Cie Financiere Richemont SA 179 8,786 Adecco SA 112 7,151 Clariant AG 418 6,361 Syngenta AG 17 6,207 Nestle SA 105 5,403 Swatch Group AG 64 4,318 Givaudan SA 4 3,828 Swisscom AG 7 3,567 BKW FMB Energie AG 44 2,918 Helvetia Holding AG 5 2,118 Novartis AG 40 2,029 Paryesa Holding SA 23 1,724 Kuehne & Nagel Intl AG 12 1,684

PowerShares Global Funds Ireland plc
Annual Report and Audited Financial Statements for the year ended 30 September 2011
Statement of Changes in Composition of Portfolio
310
PowerShares FTSE RAFI Hong Kong China Fund
Purchases Security Description Nominal Cost USD AIA Group Ltd 38,000 110,478 Esprit Holdings Ltd 7,700 34,139 Sun Hung Kai Properties Ltd 2,000 31,421 Hong Kong Exchanges and Clearing Ltd 1,400 28,727 Pacific Basin Shipping Ltd 45,000 26,869 Swire Pacific Ltd 1,500 19,554 Chaoda Modern Agriculture Holdings Ltd 36,000 18,953 New World Development Ltd 10,000 17,386 Hutchison Whampoa Ltd 2,000 17,321 Shangri-La Asia Ltd 6,000 16,037 Henderson Land Development Co Ltd 2,000 13,451 Guoco Group Ltd 1,000 13,116 Hang Lung Properties Ltd 3,000 12,648 Hang Seng Bank Ltd 800 12,457 Li & Fung Ltd 2,000 11,423 Hong Kong & China Gas Co Ltd 4,000 9,498 MTR Corp 2,500 9,038 BOC Hong Kong Holdings Ltd 2,500 8,233 CLP Holdings Ltd 1,000 7,955 Kerry Properties Ltd 1,500 7,184

PowerShares Global Funds Ireland plc
Annual Report and Audited Financial Statements for the year ended 30 September 2011
Statement of Changes in Composition of Portfolio
311
PowerShares FTSE RAFI Hong Kong China Fund
Sales Security Description
Nominal Proceeds USD
Swire Pacific Ltd 5,500 78,460 Hutchison Whampoa Ltd 6,000 65,581 SJM Holdings Ltd 25,000 40,960 Guoco Group Ltd 3,000 36,506 Shangri-La Asia Ltd 13,500 33,576 Lenovo Group Ltd 52,000 26,676 PCCW Ltd 54,000 22,916 Semiconductor Manufacturing International Corp 247,000 18,382 BOC Hong Kong Holdings Ltd 5,500 17,669 Jardine Matheson Holdings Ltd 400 17,424 Wheelock & Co Ltd 5,000 16,820 TPV Technology Ltd 30,000 15,681 Sun Hung Kai Properties Ltd 1,000 13,219 Great Eagle Holdings Ltd 4,000 12,609 NWS Holdings Ltd 8,500 12,550 Tingyi Cayman Islands Holding Corp 4,000 9,637 Cheung Kong Infrastructure Holdings Ltd 2,000 9,062 CLP Holdings Ltd 1,000 8,713 AIA Group Ltd 2,600 8,561 Foxconn International Holdings Ltd 14,000 8,542

PowerShares Global Funds Ireland plc
Annual Report and Audited Financial Statements for the year ended 30 September 2011
Statement of Changes in Composition of Portfolio
312
PowerShares Global Agriculture NASDAQ OMX Fund
Purchases Security Description Nominal Cost USD Potash Corp of Saskatchewan Inc 23,213 2,059,424 Wilmar International Ltd 428,803 1,926,622 Monsanto Co 28,518 1,871,364 Syngenta AG 5,852 1,800,691 Mosaic Company 22,476 1,668,815 Israel Chemicals Ltd 103,334 1,594,385 ArcherDanielsMidland Co 42,657 1,386,135 Yara International ASA 21,548 1,112,324 Sociedad Quimica y Minera de Chile SA 17,038 922,784 Agrium Inc 10,022 882,832 K+S AG 12,214 877,525 IOI Corp Bhd 420,746 781,067 Bunge Ltd 10,666 723,345 Israel Corp Ltd 602 702,879 CF Industries Holdings Inc 4,768 626,659 Mosaic Company 7,284 458,199 Kuala Lumpur Kepong Bhd 66,688 454,984 Incitec Pivot Ltd 103,193 423,475 Golden AgriResources Ltd 759,206 408,705 Cosan SA Industria e Comercio 25,435 395,445

PowerShares Global Funds Ireland plc
Annual Report and Audited Financial Statements for the year ended 30 September 2011
Statement of Changes in Composition of Portfolio
313
PowerShares Global Agriculture NASDAQ OMX Fund
Sales Security Description
Nominal Proceeds USD
Potash Corp of Saskatchewan Inc 16,738 933,261 PPB Group Bhd 125,508 700,558 Monsanto Co 9,768 672,473 Danisco A/S 5,047 666,738 Yara International ASA 10,695 577,934 Syngenta AG 1,494 525,579 Mosaic Company 6,235 464,434 Sociedad Quimica y Minera de Chile SA 7,970 459,515 ArcherDanielsMidland Co 12,225 398,828 Wilmar International Ltd 85,000 366,202 Mosaic Company 5,116 350,501 Israel Chemicals Ltd 20,444 311,948 Bunge Ltd 3,683 245,281 Agrium Inc 2,665 222,040 CF Industries Holdings Inc 1,407 207,198 IOI Corp Bhd 108,800 183,736 K+S AG 3,306 234,945 Kuala Lumpur Kepong Bhd 17,000 119,198 Golden AgriResources Ltd 194,000 109,520 Incitec Pivot Ltd 26,083 102,123

PowerShares Global Funds Ireland plc
Annual Report and Audited Financial Statements for the year ended 30 September 2011
Statement of Changes in Composition of Portfolio
314
PowerShares Middle East North Africa NASDAQ OMX Fund
Purchases Security Description Nominal Cost USD Arab Bank PLC 20,970 335,405 National Bank of Kuwait 64,960 261,767 Qatar National Bank SAQ 5,924 260,493 Emaar Properties PJSC 240,752 206,309 Mobile Telecommunications Co KSC 47,500 187,228 Maroc Telecom SA 8,581 158,969 Orascom Construction Industries 4,149 152,329 Qatar Islamic Bank 6,228 135,060 Commercial International Bank Egypt SAE 25,829 132,031 National Bank of Abu Dhabi 40,538 123,733 Banque Audi sal Audi Saradar Group 12,853 115,735 Commercial Bank of Qatar QSC 5,570 115,635 Solidere 5,008 106,397 Orascom Telecom Holding SAE 114,718 100,578 ONA SA 496 99,720 Kuwait Finance House 24,748 94,003 Masraf Al Rayan 21,563 88,465 Douja Promotion Groupe Addoha SA 6,920 85,338 Aldar Properties PJSC 110,330 82,385 Doha Bank QSC 5,734 81,978

PowerShares Global Funds Ireland plc
Annual Report and Audited Financial Statements for the year ended 30 September 2011
Statement of Changes in Composition of Portfolio
315
PowerShares Middle East North Africa NASDAQ OMX Fund
Sales Security Description
Nominal Proceeds USD
National Bank of Kuwait 64,960 330,099 Qatar National Bank SAQ 5,924 317,615 Arab Bank PLC 20,970 294,690 Mobile Telecommunications Co KSC 47,500 248,220 Emaar Properties PJSC 240,752 229,365 Orascom Construction Industries 4,149 207,779 Commercial International Bank Egypt SAE 25,829 204,709 Maroc Telecom SA 8,581 155,063 Qatar Islamic Bank 6,228 142,955 Commercial Bank of Qatar QSC 5,570 139,418 National Bank of Abu Dhabi 40,538 129,322 DP World Ltd 191,220 122,166 Masraf Al Rayan 21,563 113,055 Banque Audi sal Audi Saradar Group 12,853 113,050 Kuwait Finance House 24,748 105,891 BankMuscat SAOG 41,097 105,703 Doha Bank QSC 5,734 103,670 Societe Nationale D'Investissement 429 99,333 Solidere 5,008 90,348 Banque Centrale Populaire 1,877 90,097

PowerShares Global Funds Ireland plc
Annual Report and Audited Financial Statements for the year ended 30 September 2011
Statement of Changes in Composition of Portfolio
316
PowerShares EuroMTS Cash 3 Months Fund
Purchases Security Description Nominal Cost EUR Italy Buoni Ordinari del Tesoro BOT 28/02/2011 5,500,000 5,482,971 Italy Buoni Ordinari del Tesoro BOT 15/08/2011 5,500,000 5,468,483 France Treasury Bill BTF 13/01/2011 5,000,000 4,995,894 France Treasury Bill BTF 30/06/2011 5,000,000 4,985,767 Italy Buoni Ordinari del Tesoro BOT 15/04/2011 5,000,000 4,974,739 German Treasury Bill 28/09/2011 4,500,000 4,479,356 France Treasury Bill BTF 24/03/2011 4,100,000 4,090,824 France Treasury Bill BTF 20/10/2011 4,050,000 4,026,275 France Treasury Bill BTF 27/01/2011 4,000,000 3,996,010 German Treasury Bill 30/03/2011 4,000,000 3,990,285 France Treasury Bill BTF 05/05/2011 4,000,000 3,986,850 Italy Buoni Ordinari del Tesoro BOT 31/03/2011 4,000,000 3,982,331 Italy Buoni Ordinari del Tesoro BOT 15/09/2011 4,000,000 3,974,611 Italy Buoni Ordinari del Tesoro BOT 15/03/2012 3,950,000 3,903,963 France Treasury Bill BTF 02/09/2012 3,850,000 3,838,416 France Treasury Bill BTF 25/08/2011 3,850,000 3,834,192 France Treasury Bill BTF 24/02/2011 3,800,000 3,792,237 Italy Buoni Ordinari del Tesoro BOT 16/05/2011 3,800,000 3,773,772 Italy Buoni Ordinari del Tesoro BOT 16/05/2011 3,800,000 3,773,772 France Treasury Bill BTF 07/04/2011 3,575,000 3,562,967

PowerShares Global Funds Ireland plc
Annual Report and Audited Financial Statements for the year ended 30 September 2011
Statement of Changes in Composition of Portfolio
317
PowerShares EuroMTS Cash 3 Months Fund
Sales Security Description
Nominal Proceeds EUR
Italy Buoni Ordinari del Tesoro BOT 15/11/2010 8,770,000 8,770,000 France Treasury Bill BTF 18/11/2010 7,590,000 7,590,000 Italy Buoni Ordinari del Tesoro BOT 15/10/2010 6,520,000 6,520,000 Italy Buoni Ordinari del Tesoro BOT 28/02/2011 5,500,000 5,500,000 Italy Buoni Ordinari del Tesoro BOT 15/08/2011 5,500,000 5,495,812 France Treasury Bill BTF 13/01/2011 5,000,000 5,000,000 France Treasury Bill BTF 30/06/2011 5,000,000 5,000,000 Italy Buoni Ordinari del Tesoro BOT 15/04/2011 5,000,000 5,000,000 Dutch Treasury Certificate 31/03/2011 4,500,000 4,500,000 France Treasury Bill BTF 21/10/2010 4,500,000 4,500,000 German Treasury Bill 30/03/2011 4,500,000 4,500,000 German Treasury Bill 28/09/2011 4,500,000 4,489,982 France Treasury Bill BTF 24/03/2011 4,100,000 4,100,000 France Treasury Bill BTF 10/02/2011 4,000,000 4,000,000 France Treasury Bill BTF 27/01/2011 4,000,000 4,000,000 German Treasury Bill 13/10/2010 4,000,000 4,000,000 Italy Buoni Ordinari del Tesoro BOT 15/09/2011 4,000,000 4,000,000 Italy Buoni Ordinari del Tesoro BOT 31/03/2011 4,000,000 4,000,000 France Treasury Bill BTF 05/05/2011 4,000,000 3,996,276 France Treasury Bill BTF 25/08/2011 3,850,000 3,850,000

PowerShares Global Funds Ireland plc
Annual Report and Audited Financial Statements for the year ended 30 September 2011
318
UK Distributor Status
Certification as a “distributing fund” under the United Kingdom Income and Corporation Taxes Act 1988 for the purposes of UK taxation was sought and gained for the year ended 30 September 2010.
Fund
PowerShares EQQQ Fund
PowerShares FTSE RAFI Emerging Markets Fund
PowerShares FTSE RAFI Asia Pacific Ex-Japan Fund
PowerShares FTSE RAFI Switzerland Fund
PowerShares FTSE RAFI All-World 3000 Fund
PowerShares Dynamic US Market Fund
PowerShares FTSE RAFI Developed 1000 Fund
PowerShares FTSE RAFI Europe Fund
PowerShares FTSE RAFI Developed Europe Mid-Small Fund
PowerShares FTSE RAFI Italy 30 Fund
PowerShares FTSE RAFI UK 100 Fund
PowerShares FTSE RAFI US 1000 Fund
PowerShares Global Clean Energy Fund
PowerShares Global Listed Private Equity Fund
PowerShares Palisades Global Water Fund
PowerShares FTSE RAFI Hong Kong China Fund
PowerShares Global Agriculture NASDAQ OMX Fund
PowerShares Middle East North Africa NASDAQ OMX Fund

PowerShares Global Funds Ireland plc
Annual Report and Audited Financial Statements for the year ended 30 September 2011
319
UK Reporting Regime
The following funds have been accepted into the Reporting Regime and will apply for Reporting Status for the purposes of UK taxation, for the year ended 30 September 2011. The reportable income per share will be published on www.invescopowershares.net on or before 31 March 2012.
Fund
PowerShares EQQQ Fund
PowerShares FTSE RAFI Emerging Markets Fund
PowerShares FTSE RAFI Asia Pacific Ex-Japan Fund
PowerShares FTSE RAFI Switzerland Fund
PowerShares FTSE RAFI All World 3000 Fund
PowerShares Dynamic US Market Fund
PowerShares FTSE RAFI Developed 1000 Fund
PowerShares FTSE RAFI Europe Fund
PowerShares FTSE RAFI Developed Europe Mid-Small Fund
PowerShares FTSE RAFI Italy 30 Fund
PowerShares FTSE RAFI UK 100 Fund
PowerShares FTSE RAFI US 1000 Fund
PowerShares Global Clean Energy Fund
PowerShares Global Listed Private Equity Fund
PowerShares Palisades Global Water Fund
PowerShares FTSE RAFI Hong Kong China Fund
PowerShares Global Agriculture NASDAQ OMX Fund
PowerShares EuroMTS Cash 3 Months Fund
PowerShares Middle East North Africa NASDAQ OMX Fund