Poverty traps: instabilities do matter
26
Poverty traps: instabilities do matter Vincent GERONIMI ECONOMIX, University Paris 10, France Laurent MATHIEU ECONOMIX, University Paris 10, France Patrick SCHEMBRI C3ED, University Versailles St Quentin en Yvelines, France Armand TARANCO University Aix-Marseille, France March 12, 2006 Abstract This paper investigates both empirical aspects and theoretical mecha- nisms that support the poverty trap view for Sub Saharan Africa countries. The controversies about stylised facts of poverty traps are revisited in the rst part of this contribution. Whereas long-term instability of growth appears as a virtually universal feature of trapped countries, it remains largely unexplained in the literature. We therefore draw special attention to the link between shocks (such as instabilities in time series commodity prices) and low growth of Sub Saharan African countries. The second part of this contribution presents a macroeconomic model to explore the links between instabilities and poverty trap. With a complementary a/ecting global returns, the modied standard optimal growth model (Collier and Gunning, 1995) used for the analysis of shocks management leads to mul- tiple equilibriums. One striking result of this model is that the standard policy of sterilisation of positive external shocks can lock an economy in a poverty trap. This is a situation where instabilities do matter in long run dynamics. It has strong policy implications for African trapped countries. Keywords : Poverty traps - optimal growth model - JEL classication : O11, O47 Corresponding author. email: [email protected] 1
-
Upload
independent -
Category
Documents
-
view
0 -
download
0
Transcript of Poverty traps: instabilities do matter

Poverty traps: instabilities do matter
Vincent GERONIMI�
ECONOMIX, University Paris 10, France
Laurent MATHIEUECONOMIX, University Paris 10, France
Patrick SCHEMBRIC3ED, University Versailles St Quentin en Yvelines, France
Armand TARANCOUniversity Aix-Marseille, France
March 12, 2006
Abstract
This paper investigates both empirical aspects and theoretical mecha-nisms that support the poverty trap view for Sub Saharan Africa countries.The controversies about stylised facts of poverty traps are revisited in the�rst part of this contribution. Whereas long-term instability of growthappears as a virtually universal feature of trapped countries, it remainslargely unexplained in the literature. We therefore draw special attentionto the link between shocks (such as instabilities in time series commodityprices) and low growth of Sub Saharan African countries. The second partof this contribution presents a macroeconomic model to explore the linksbetween instabilities and poverty trap. With a complementary a¤ectingglobal returns, the modi�ed standard optimal growth model (Collier andGunning, 1995) used for the analysis of shocks management leads to mul-tiple equilibriums. One striking result of this model is that the standardpolicy of sterilisation of positive external shocks can lock an economy in apoverty trap. This is a situation where instabilities do matter in long rundynamics. It has strong policy implications for African trapped countries.
Keywords : Poverty traps - optimal growth model -JEL classi�cation : O11, O47
�Corresponding author. email: [email protected]
1

1 Introduction
The analysis of poverty traps in which developing countries would be stuck doknow a renewed attraction, both on theoretical and empirical grounds.Thus, Azariadis and Stachurski [2004] in their article make an exhaustive
review of the literature on the subject putting forward the theoretical explana-tory factors contributing to the existence of a poverty trap. In the same way,Sachs [2004] advocates for a "big push" to escape from poverty traps. More-over, recent UN�s overview report about Millenium Project [2005] echoes Sachs�conclusions as one reads:
"...Tropical africa even in well governed parts is stuck in a povertytrap, too poor to achieve an high level of economic growth, and inmany places simply too poor to grow at all...(Chap 10)...Consistent with the poverty maps, countries should undertake
a needs assessment to identify the speci�c public investments nec-essary to achieve the goal, including faster overall economic growthsupported by major public investments in infrastructure and privatesector promotion" (chap 17)
Eventually, even IMF and World Bank in their "Global Monitoring Report"in 2005 conclude with the need of a big push for the developing countries toescape the poverty trap:
"...O¢ cial development assistance must at least double in thenext �ve years to support the MDGs, particularly in low-incomecountries and Sub-Saharan Africa"
Nevertheless, the question of the existence of poverty traps is not a new one,as one �nds it in the early writings on development economics. Thus, the needof a "Big Push" allowing the Eastern European Industry to emerge is found inRosenstein Rodan. In the same way, the "Take o¤" is found in the well knownRostow�s book "Stages of Economic Growth".However, even the existence of poverty trap with its corollaries -Big Push
and Take o¤- appears to be disputed by some authors. The more emblematicone is Easterly [2005] who in its critical assessment of the � poverty trap /big-push / take-o¤ �narrative rejects the poverty trap hypothesis following twolines of argumentation:1-There are very few zero growth (of per capita income) countries over the
whole period 1950-2000;2-Log per capita incomes are not stationary.Concerning the �rst point, the "zero growth" speci�cation of poverty traps
con�guration seems very restrictive. . . Easterly himself soften this condition inthe second part of its paper where the growth lays in the [-0.5; 0.5] interval.Moreover, a relative de�nition of poverty traps (growth signi�cantly weakerfor trapped countries) leads to the opposite conclusion considering the wholeperiod 1961-2000 (and for the 1985-2001 period as stated by Easterly). Its
2

empirical statement that there are no general poverty traps con�gurations ishighly dependent upon its choice over the period and sub-period as well as thegrouping of countries.The second empirical statement, "log per capita incomes are non station-
nary", is highly coherent with the fact we emphasise below, which is the exis-tence of an inverted relation between volatility in the output and output growth.Indeed, if poverty traps exist they are not of the �macro inertia� kind. Highinstability of growth, and low persistence in output growth, has been widelyanalysed in the literature (e.g. Easterly and alii [1993], Acemoglu and Zilibotti[1997], Easterly and Levine [2002]). SSA countries have experienced severalstructural breaks over the 1960-2000 period, a �nding that di¤erentiate stronglydeveloping countries from developed countries, most of the latter having expe-rienced no break at all since the end of world war II.Poverty traps skepticism seems to be justi�ed by the contradictions between
the conclusions of theoretical models and stylised facts.On one side, Azariadis and Stachurski [2004] underline that in standard neo-
classical models, poverty trap is de�ned by opposite equilibrium, low level to ahigher one. In this context, low growth is linked to limited �uctuations of percapita growth rates (an �inertia hypothesis�). As noted by the authors (pp.27):
�Under our assumption of unbounded shocks there is always thepotential �however small- to escape any basin of attraction. So inthe long run initial conditions do not matter�
Thus, instabilities (considered here as a succession of exogenous shocks) mayovercome initial di¤erences and lead to convergence, pulling economies out ofmacroeconomic poverty traps. As a consequence, with non convex technology,low level of instability (�low noise�) is associated with low equilibrium. Nearthe steady state �the growth rate would just represent �uctuations around asteady state income� (Easterly and alii [1993]). Thus, high instability of theGDP per capita growth rate is associated with �take-o¤�.On the other side, the macroeconomic �inertia�of poverty traps featured in
these models is not consistent with empirical evidence.Since Barro [1991] introduced a dummy variable for SSA countries in its
analysis of the factors of international growth, several studies have attemptedto explain the weak performance of these economies the main symptom beinga limited GDP per capita together with a low growth rate of per capita GDPover a signi�cant period of time (a 1% loss in per capita growth rate comparedto other countries according to Barro). A symptom which in turn leads to agrowing proportion of people living with less than 1 dollar per day1 . A widearray of factors have been successively emphasized in this literature as the mainexplanation of this divergence between economies �from lack of human capitalto lack of social capital, through bad institutions, bad governance and con�icts
1From 163.6 in 1981 to 312.7 million of people in 2001 in SSA countries (source Chen andRavallion [2004] Table 4)
3

(e.g. Collier [1999]. At the global level, none of these factors alone explain theempirical evidence of low GDP per capita growth rates and high instability ofthese rates.For SSA countries, instability of growth is mainly due to large exogenous
shocks, external or internal, related to commodity price �uctuations, con�icts,or climate changes. All these shocks are far from being of a white noise kind.Most of commodity prices shocks have a weak transitory component, and seriesof prices exhibit multiple structural breaks (Géronimi, Mathieu, Taranco [2003]).From a time series analysis perspective, climate �uctuations and con�icts appearalso as structural breaks.On the basis of this contradiction between theory and empirics over macro-
economic poverty traps, we address two questions in this paper.The �rst question is about the empirical link between macroeconomic volatil-
ity (as measured by standard deviation of output growth) and the outputgrowth. In the next section, our study documents that among the develop-ing countries, SSA countries are a strong example of the negative correlationbetween volatility of output and output growth since the region had known overthe past fourty years the slowest output growth with the highest volatility. Thisempirical link comes into contradiction with neo classical models who concludedin the minor impact of volatility on growth and welfare. Moreover it reinforcesthe idea that SSA countries remain to a large extent stuck in poverty trapsbecause of the instabilities mentionned above. Should there be a stylised factof poverty traps to be stated concerning instability, it would be a high degreeof instability rather than macroeconomic �inertia�.The second question we address concern the theoretical link between medium-
term shocks and poverty trap. In the last section we build upon a modi�ed stan-dard optimal growth model (Collier and Gunning [1995]) to show that povertytraps situation can be a consequence of shocks. In this model which featuresan endogenous (structural) instability, even a temporary positive endogenousshock may lead to a lower equilibrium.
2 Data sets and stylised facts
In this section we �rst present the data used in the empirical analysis. Aftera discussion of the main properties of instabilites and shocks for SSA growth,we describe some stylised factsconcerning the link between output growth andinstability. We �rst use standard statistical de�nitions of volatility to character-ize instabilities in the growth rates. Then we turn to an analysis of dispersionof growth rates in the phase space to capture more exhaustively the dynamicproperties of these instabilities.Data setsIn the descriptive analysis that follows, we use the data set coming from
the World Penn Tables ( Heston et al. [2002]). The data are annual andspan the period 1960-2000. We consider a sample of 80 countries: 21 highincome countries, 21 emerging countries and 33 Sub Saharian African countries.
4

The former group is a subsample of OECD economies. The second group isconsidered as More Financially Integrated Economies according to Kose et al.[2003]. The third group comprises all the SSA countries less four countries forwhich no data were avalaible (Djibouti, Soudan, Erythre and Swaziland).To measure the output growth we use the per capita real GDP series. We
calculate the medians for each group of countries on the full sample and thesubsamples corresponding to decades. Traditionally (e.g. Ramey and Ramey[1995]) the macroeconomic volatility is measured by considering an indicatorof output volatility: the standard deviation of per capita GDP growth whichmedian is calculated on each group of countries. But this volatility measure, asall descriptive statistics assumes a smooth growth process with no sharp upwardor downward trend to deliver an unbiaised message. This is not what we observefor SSA countries.So we consider a second volatility measure as proposed in Hnatkovska et
al. [2003]. Using the band-pass �lter proposed by Baxter and King [1999] weestimate the trend of the per capita real GDP for each series.Then we computethe standard deviation of the output gap series which is the di¤erence betweenthe real GDP series and the trend GDP.Table 1 compares the volatility in per capita real GDP for the three group of
countries, using the two measures of volatility. We observe two common char-acteristics to the SSA countries compare to high income countries and otherdeveloping countries. Firstly, the divergence in the macroeconomic perfor-mances as measured by output growth between SSA countries and the othergroup countries is deep, getting even more accentuated the last two decades.This means that economic conditions allowing to increase the standard level oflife of the populations are not met in these countries: more people live belowthe 1$ line of extreme poverty. This result moderates the �ndings of Easterly[2005]. Secondly, SSA countries do know a high degree of instability in outputgrowth, about 3 times the ones of industrialised countries and 1.5 times theother developing countries. This result applies on the whole sample as well asthe sub-samples with an increase during the 70�s corresponding to the shocksin commodity prices and a decrease in the 90�s below the level observed in thecalm 60�s.
Insert Table 1
We computed too a rolling volatility using the standard deviation measureover a 5 years rolling window to insure that the average measures on the wholesample as the cut into decades did not in�uence the results. We represent thismoving volatility in Figure 1.
Insert Figure 1
We conclude this descriptive section by presenting the cross-countries rela-tion between output growth and volatility in �gure 2. As observed, there is anegative correlation between output growth and volatility of growth for SSAcountries.
5

Insert Figure 2
We propose in the following part an exploratory analysis of the dynamicsof international growth rates which gives additional support to this invertedrelation between growth and instability of growth.Growth and instability: an explanatory analysis of international
growth dynamicsAs we underlined in the introduction, one of the most characteristic stylised
facts of countries stuck in poverty traps is the high instability in their growthrates. Through an exploratory analysis of the dynamics of international growthrates (Annex, Box n�1) we �nd some additional empirical support to this al-ternative hypothesis (Annex, �gures 3, 4, 5, 6). The phase diagram of delayedgrowth illustrates the high dispersion of SSA growth together with its lowerperformance over the 1961-2000 period. The con�dence ellipses drawn for someSSA countries, USA and France clearly demonstrate the higher dispersion ofthe former compared to the latter, together with a lower rate of growth.
Insert Figure2 3
The same ellipses drawn across all SSA countries and years reinforce theabove conclusion: the mean performance is lower and dispersion is higher forSSA countries
Insert Figure 4
Moreover, most SSA countries with poor economic performance over the last40 years appear to share a high degree of instability compared to the rest of theworld. Following the criteria of performance and instability those countries aresigni�cantly di¤erent. In the dispersion-distance dimensions, SSA countries aredi¤erent from other countries
Insert Figure3 5
A cluster analysis di¤erentiates three clusters, the �stability and growth�cluster grouping almost all developed countries and only two African countries(Botswana and Mauritius). All other SSA countries are distributed between an�instability� cluster and a �instability and stagnation� cluster (Annex for thedescriptive statistics of clusters).
Insert Figure4 6
2Source: Authors calculation from PWT 6.2, using GRGDPCH variable, real GDP percapita growth rate.Note : The ellipse, for a given value of �, describes the area in which a single new observation
can be expected to fall with a certain probability � (95%), given that the new observationcomes from a bivariate normal distribution with the parameters (means, standard deviations,covariance) as estimated from the observed points shown in the plot.
3Source: Authors calculation from PWT 6.2, using GRGDPCH variable.Note : a = 70%4Source: Authors calculation from PWT 6.2, using GRGDPCH variable.
6
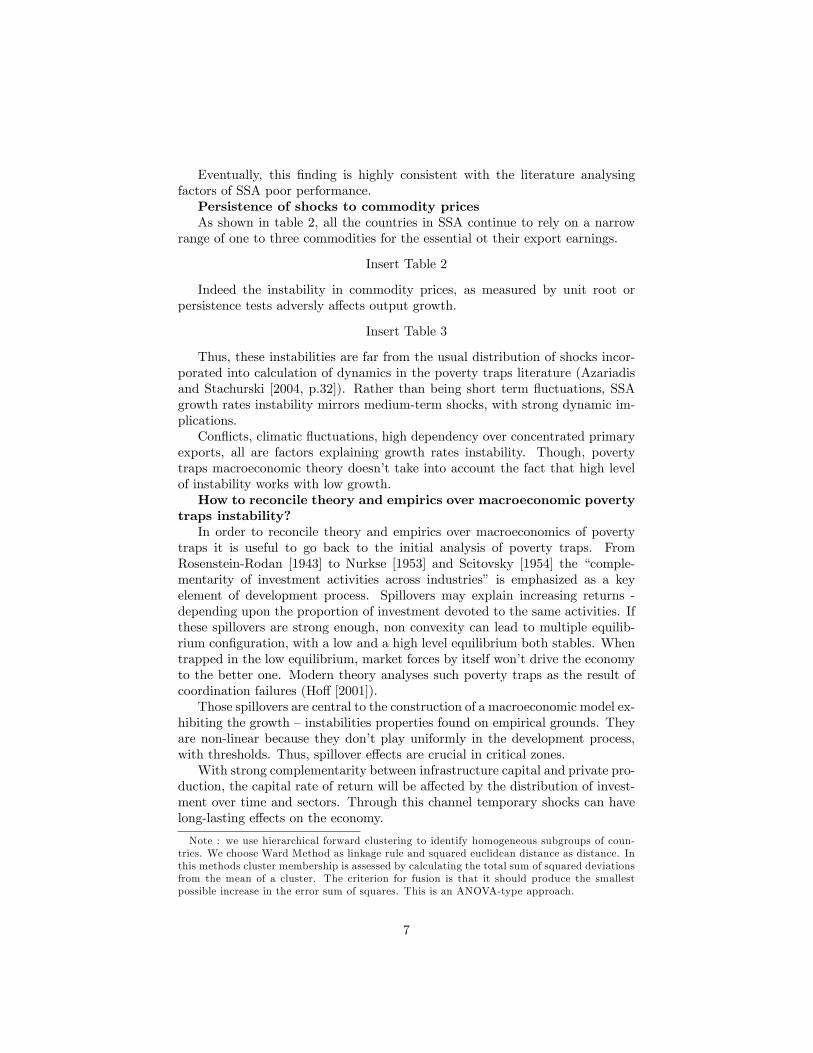
Eventually, this �nding is highly consistent with the literature analysingfactors of SSA poor performance.Persistence of shocks to commodity pricesAs shown in table 2, all the countries in SSA continue to rely on a narrow
range of one to three commodities for the essential ot their export earnings.
Insert Table 2
Indeed the instability in commodity prices, as measured by unit root orpersistence tests adversly a¤ects output growth.
Insert Table 3
Thus, these instabilities are far from the usual distribution of shocks incor-porated into calculation of dynamics in the poverty traps literature (Azariadisand Stachurski [2004, p.32]). Rather than being short term �uctuations, SSAgrowth rates instability mirrors medium-term shocks, with strong dynamic im-plications.Con�icts, climatic �uctuations, high dependency over concentrated primary
exports, all are factors explaining growth rates instability. Though, povertytraps macroeconomic theory doesn�t take into account the fact that high levelof instability works with low growth.How to reconcile theory and empirics over macroeconomic poverty
traps instability?In order to reconcile theory and empirics over macroeconomics of poverty
traps it is useful to go back to the initial analysis of poverty traps. FromRosenstein-Rodan [1943] to Nurkse [1953] and Scitovsky [1954] the �comple-mentarity of investment activities across industries� is emphasized as a keyelement of development process. Spillovers may explain increasing returns -depending upon the proportion of investment devoted to the same activities. Ifthese spillovers are strong enough, non convexity can lead to multiple equilib-rium con�guration, with a low and a high level equilibrium both stables. Whentrapped in the low equilibrium, market forces by itself won�t drive the economyto the better one. Modern theory analyses such poverty traps as the result ofcoordination failures (Ho¤ [2001]).Those spillovers are central to the construction of a macroeconomic model ex-
hibiting the growth �instabilities properties found on empirical grounds. Theyare non-linear because they don�t play uniformly in the development process,with thresholds. Thus, spillover e¤ects are crucial in critical zones.With strong complementarity between infrastructure capital and private pro-
duction, the capital rate of return will be a¤ected by the distribution of invest-ment over time and sectors. Through this channel temporary shocks can havelong-lasting e¤ects on the economy.
Note : we use hierarchical forward clustering to identify homogeneous subgroups of coun-tries. We choose Ward Method as linkage rule and squared euclidean distance as distance. Inthis methods cluster membership is assessed by calculating the total sum of squared deviationsfrom the mean of a cluster. The criterion for fusion is that it should produce the smallestpossible increase in the error sum of squares. This is an ANOVA-type approach.
7

Assuming this complementarity, there is a macroeconomic channel from ex-ternal shocks to growth. We have emphasised in previous studies (Géronimi,Schembri, Taranco [2002]) that a primary commodity specialisation meant ahigh degree of instabilities which could led to low growth. For most SSA coun-tries exporting primary commodities, there is high concentration of exports onfew primary commodities (commodity prices��uctuations have a strong impacton export earnings). These export earnings in turn constitute an essential sourceof government income, and public investment is highly correlated to governmentincome. Thus, external shocks (e.g. commodity prices �uctuations) have a di-rect e¤ect over returns to capital through the complementarity e¤ect of publiccapital.An optimisation model, based on Collier and Gunning [1995], featuring those
spillovers and complementary e¤ects, is discussed in the next section. It demon-strates that poverty traps situation can be a consequence of shocks.
3 The Model
Assuming that these spillovers reveal their forces in a non-linear way and cangenerate multiple equilibria, we argue in this paper that:
� spillovers do not play their role uniformely in the development process,even though their e¤ects can be limited by productivity constraints af-fecting capital. They are characterised by thresholds. Spillover e¤ects canbe signi�cant in critical zones where they can lead to higher developmentstages or poverty traps.
� There is a strong complementarity between infrastructure capital and pri-vate production. This complementarity is attached to the capital-shareparameter and thus a¤ects the rate of return to capital. The individualshave to choose the timing and the volume of durable-goods purchases overtime. This constraint can lead to large intertemporal substitutions andmake economic outcomes subject to path dependence. In other words,temporary shocks can have long-lasting e¤ects on the economy.
These ideas will be illustrated with an optimisation model, based on Collier& Gunning [1995]. The model describes the problem faced by a small openeconomy which has to adjust to a temporary positive trade shock, a primarycommodity boom. Consider the following optimisation problem:
maxW =
Z 1
t=0
e��tu (c) dt
�k = q � �k � c+ b
Here c denotes consumption, u(c) the instantaneous utility function, � thetime preference rate, q output and �k the depreciation of the capital stock, perunit of time. We assume the function u to be strictly concave. Boom income b
8

is a positive constant over the period [0; T ) and is otherwise equal to zero. Inthis model the same good can be used for consumption and investment. Thetechnical constraint is de�ned by the following production function:
q = g (k) = Ak�+v(')(1��); assuming that k = k (kT ; kG) :
We de�ne k, the state variable of the economy, as a composite good with aphysical component (kT ) and an infrastructure component (kG). The latter isthought of as a pure public good as de�ned by Samuelson (1954). In the model,instabilities are indirectly considered through the elasticity applied to capital, ',which depends upon public externalities. With reference to our �rst assumption,we do consider that this elasticity acts on the economy in a non-linear manner :
v (') : v (0) = 0; v (') = 1, lim'!1
v (') = d, with d > 1:
These conditions stress the main role played by infrastructure capital forprivate production and the existence of a limit to increasing returns in capital.They imply speci�c properties on the structure of the economy:
g(k)
8<:= Ak� for 0 < ' < '= Ak for ' = '= Ak�+v(')(1��) for ' < ' � d
Contrary to Murphy, Shleifer & Vishny [1989], Azariadis & Drazen [1990],d�Autume & Michel [1993] & Vellutini [2003], threshold e¤ects ar not relatedto the level of capital stock, but to public externalities. With reference toKrugman [1991] and Matsuyama [1990], the presence of thresholds point outthe critical role expectations can play in de�ning the long run performance ofan economy. Moreover, this approach allows us to consider both endogenousand exogenous growth situations in the same analytical framework, assumingthat the multiplicity of these situations might reveal a structural instabilityconcerning the dynamical regimes in which the economy evolves:
� when 0 < ' < ', returns are globally decreasing with respect to anyaccumulable factors of production. The reduced form aggregate produc-tion function has the standard neoclassical properties. The economy ishence in the Solow regime. We �nd here the model of Collier & Gunning[1995].Only one feasible path is compatible with this dynamical regime.
� When ' � ' � d, returns can globally increase (or remain constant) withrespect to accumulable factors of production. Consequently, the dynamicregime is generated by the complementarity between private and publiccapital. We de�ne the latter as the endogenous growth regime. A multi-plicity of feasible paths are compatible with this dynamical regime. Notethat for a speci�c value of the complementarity coe¢ cient, the reducedform aggregate production function becomes linear in capital. In this case,we shall say that the economy follows a speci�c path, the Romer path.
9

3.1 Instabilities and multiple equilibria
An accurate analysis of the dynamical properties of the model is now necessaryin order to isolate situations where the economy faces a kind of structural in-stability. The problem at time t = 0 is to choose an optimal consumption pathtaking into account that the boom will be over at time T . The solution for thelatter is well-known and follows:8<:
�k = q � �k � c+ b�c = � u0(c)
u00(c)
�� g(k)k � (�+ �)
�, with � = �+ v (') (1� �)
where � u0(c)u00(c) is the intertemporal elasticity of substitution. Initially the
economy is in steady state equilibrium with the capital stock equal to k. Westudy the local dynamics of the feasible paths using the characteristic roots ofthe linearisation of this (non-linear) di¤erential-equation system. We �rst formthe Jacobian matrix and evaluate it at the steady state point
�k; c�:
JE =
"@�k@k
@�k@c
@�c@k
@�c@c
#(k;c)
The four partial derivatives, when evaluated at the steady state, E, turn outto be:
@�k@k
����E
= �g(k)k� �
@�k@c
����E
= �1
@�c@k
���E= � u0(c)
u00(c)�g0(k)�g(k)
k2
@�c@k
���E=
�[u00(c)]2+u000(c)u0(c)
[u00(c)]2
��g(k)k� (� + �)
�= 0:
It follows that the Jacobian matrix takes the following form:
JE =
24 �g(k)k� � �1
� u0(c)u00(c)�
g0(k)�g(k)k2 0
35(k;c)
The qualitative information we need to assess the dynamical propertiesaround the steady state can be extracted from the following equation, P (x) =
x2 � Tx + D, with T = � g(k)k� � and D = � u0(c)
u00(c)�g0(k)�g(k)
k2 . Our analysis
identi�es two stylised dynamical regimes: the Solow regime and the endogenousgrowth regime. The �rst one describes a world without any memory. The sec-ond one describes a world subject to history or/and expectations. We illustratetheir speci�c stability properties by using the graphical tool of potential func-tions commonly used in physics, which consists of describing a steady state asthe minimum of a curve of potential. This curve is drawn by the solutions of a
10

dynamical system5 . The advantage of the potential function in explaining therules governing the evolution of the economy lies in the fact that it makes thedynamics of an economy inside as well as outside its steady state explicit. Thebehaviour (or arbitrage) of the individuals trying to maximise pro�ts and utilitycan push the economy to the minimum of its potential curve. If the slope ofthe potential curve is steep for some volume of capital stock, it indicates thatthe steady state is stable. By contrast, in situations where the slope is rela-tively small, the adaptative dynamics will probably change the economy ratherslugishly in the direction of the initial steady state and there is some likelihoodof observing the stock of capital in such con�gurations outside the equilibrium.
3.1.1 The Solow regime
Proposition 1 When 0 < ' < ' or 0 < � < 1, the steady state is a neoclassicalstationary path. For any initial condition, the economy is trapped in the Solowregime. Once trapped, the economy grows on private capital accumulation, andgrowth might eventually peter out without any exogenous sources. The positivetrade shock does not have signi�cant impact on the long run path of the economy.The transition path does not modify the properties of the steady state.Proof. If D < 0 and T > 0 or � g(k)k > �, the two eigen values are real withopposite signs. the dynamical system has a unique steady state which is saddle-path stable. We observe such a situation when capital is subject to diminishing
returns, �g0(k)�g(k)
k2 < 0.
Insert Figure 7
In the Solow regime, any response to a temporary positive trade shock in-volves two phases. During the �rst one, the capital stock increases as part ofthe boom income is invested. During the second phase, a barrier of potentialemerges between the two equilibria (the one before the shock, the one after theshock) as investment is reversed enabling a higher consumption level. Invest-ment smoothes consumption, the latter jumping up at time t = 0 and thendeclining monotonically towards its pre-shock level. In this case, neither historynor expectations can in�uence the long-run feasible path of the economy. Thedynamical regime mainly results from technical constraints imposed to capitaland resumed in the so-called Inada conditions. Any positive trade shock willmodify only temporarily the motion of the main aggregates, without howeverpreventing their convergence towards the initial equilibrium. In this ergodicworld, the notion of instability expresses here only a temporary irregularity inthe dynamics of the state variable. In other words, the economy cannot be af-fected by this irregularity, its dynamical properties deeply rest on an invariancecondition.
5A dynamic system with negative roots engenders a shaft with an incurved bottom, re-�ecting the existence of a unique steady state. Moreover, a dynamic system having one of theroots being nil, produces a shaft with a �at bottom, re�ecting a multiplicity of equilibria.
11

3.1.2 The endogenous growth regime
Proposition 2 When ' � ' � d or � � 1, and � [g0 (k)� g (k)] =k2 � 0 thesteady state is fundamentally unstable. The economy faces structural instabilitywith reference to the muliplicity of paths it can follow. Because of this structuralinstability, a temporary positive trade shock can induce a durable change inboth the dynamical paths and states of the economy. More particularly, theadjustment path, by the reversibility of investment, can lead to expectationalundeterminacy. Three di¤erent con�gurations are now possible: the Romer path,the con�ned path, the limit-cycle.
The Romer path Proof. when D = 0 and T > 0, one eigen value is realand positive, while the other is nil. In this case, the system is unstable. TheRomer path is characterised by particular conditions: g(k)
k = A and � = 1,which implies that A > �. Along this path capital is subject to constant returns� [g0 (k)� g (k)] =k2 = 0:In this case, the potential curve is �at. Only history matters in this econ-
omy and any shock is totally consumed. This path is mainly based on a criticalamount of domestic capital which allows spillovers impacts to be under "con-trol". We do consider that this path is not really attainable for the kind ofeconomies we deal with in the present paper. We refer here to our assumptionthat spillovers e¤ects vary according to the development stage.
The con�ned path Proof. When D > 0, T > 0 and D > T 2
4 , the twoeigen values are complex with negative real parts. The economy converges tothe steady state in an oscillating manner.We note that the trade shock does not initiate the transition from one equilib-
rium to the other, it is rather a structural change resulting from the adjustmentprocess which distorts the form of the curve of potential. In this respect, theoscillation of the state variable makes the possible ex-ante equilibria disappear,leaving only one ponctual attractor assimilated as a poverty trap.
The limit-cycle Proof. When T = 0 and D > 0, the eigen values arecomplex with 0 real parts. Then the trajectories are ellipses around the steadystate. This system neither converges nor diverges. The type of equilibrium iscalled a limit-cycle. In this case, the adjustment process leads to the formationof a periodic attractor.In response to a trade shock, the transition paths oscillate around the steady
state. The economy faces greater volatility in its main aggregates without re-vealing any long run growth perspective. This particular dynamical property isanother expression of what we can call a poverty trap.
Insert Figure 8
In these last two cases, only expectations matter. For given initial conditions,the equilibrium condition may not uniquely pin down the initial value. There
12

may be multiple equilibrium paths, with self-ful�lling expectations. The post-shock steady state is no longer neutral with respect to the pre-shock steady state(the Solow regime). Moreover, it is no longer dependent upon this pre-shocksteady state (the Romer path). The post-shock steady state is now de�ned bythe path which has been taken (the con�ned path or limit-cycle). It is mainly in-dividual expectations, whether pessimistic or optimistic, which determine whatthe impact of a positive shock would be on the economy. In this respect, itis important to note that the shock-response dynamics is distorted when thestructural parameters move away from their reference value6 . In other words,instabilities can irreversibly modify the structure of the economy, in parallelwith the sole motion of the state variable. Consequently, two systems startingwith the same initial conditions can end up in two di¤erent equilibria.In these situations where nonconvexities and feedbacks are important, forces
re�ecting individual expectational behaviours can generate an equilibrium con-stellation in which they play a decisive role in determining the future evolutionof the economy, namely the unstable steady state. In the absence of theseforces, the equilibrium
�k; c�would not change. But an in�uence acting in the
economic situation described by the potential function - or a �uctuation, in theterminology of dynamic systems theory - will necessarily move the economy toa multiplicity of equilibria.
3.2 Structural change, path-dependence and shock-responsestrategies
In the Solow regime, it is rather the ex-ante nature of the shock which allows thetransition from one attraction basin to the other. By contrast, on the Romerpath, any shock leads the system to a new equilibrium. We observe, however,that in both cases, the structure of the global dynamics, that is to say the formof the curve of potential, is not a¤ected by the shock. Consequently, shocksmake the equilibrium to move along a curve or a �at line, place of feasiblegrowth paths, without modifying the con�ict between the di¤erent attractors.However, When � > 1 a temporary positive shock can generate a structural
shift in terms of a notable change in the growth potential of the economy, (in theform of the potential curve). Some authors showed that shock e¤ects can leadto this remanence property of dynamical systems (Amable & al., [1992]). Thisproperty suggests that a control parameter subject to a �rst variation, then an-other one of identical amplitude and opposite way, leads the system to anothersteady state. We consider that this property is interesting when we address at-tention to shoch-response strategies applied in Sub-Saharan countries which areprone to trade shocks. Analytically, we admit that generally dynamical systemsunder hysteresis questions the multiplicity of potential equilibria and the asso-ciated undeterminacy. In dynamic systems theory, a structurally shifting shapeof the potential curve is called a phase transition and it occurs if the parame-
6This speci�c property leads to extend the concept of punctuated steady state to equilib-rium dynamics, substituting the notion of equilibrium for the one of attractor.
13

ters describing the relevant in�uences and forces acting upon the system underconcern pass across some critical borders. A special case is shown in Figure4, where the transition drawing, �rst from the left to the right (shock), secondfrom the right to the lelft (post-shock), can be called a bifurcation. The econ-omy, which �rst is located in its initial steady state, is later to be found far fromthe latter. In this situation there are di¤erent directions open for the furthereconomic evolution, and without any detailed knowledge about the �uctuationsresulting from individually expectations behaviour, the further direction of theeconomy cannot be predicted ex ante.In this respect, the issue of the multiplicity of equilibria is important when
one of the roots of a dynamical system is nil. This is the case in the endogenousgrowth regime. The corresponding solutions consist of locating one stationaryequilibrium whose stability would express a loss of memory with reference toinitial conditions, and a non stationary one whose instability would result in astrong submission with historical data. However, the latter also depends uponadjustment parameters that trace the curve of the transition paths. In a deter-ministic framework, we must concede that these paths are fundamentally linkedto a given initial point. Consequently, the path dependence of the equilibriumis only a joint product of the sole property of dependency on initial conditions.Nevertheless, in an uncertain framework, any dynamical system would evolveaccording to the series of random shocks to which it is submitted. Thus, theproperty of path dependence not only concerns transition paths, but also thechronic of shocks. In this last case, it does not seem improper to evoke such aproperty. Finally, we retain that the previously quoted divergence results in theway we conceive the shock. If the invariance of the system�s dynamical struc-ture must be preserved, the nature of the shock would have to be such that thegap between the current state and the deterministic-equivalent equilibrium oneremains statistically stationary. If it is not the case, we would talk of structuralinstability.The impact of instabilities on the adjustment process can easily be stressed
using the following logarithm proxy of the adjustment equation:
hf�g u lnA+ �k:
Thus, instabilities are taken into account by observing the adjustments-sequence fhgthrough the one of the capital fkg. This analysis leads us to studythe path-solution fpgaccording to its proper variance, the one that should revealan additional instability in the model. Suppose that V h u f
�R(k � Ek)2 p (k) dk
�exists, then we can deduce the following de�nition V h u V �k. Knowing that� and k are independent and the mean value of returns to capital remain con-stant, we conclude that E�2k2 = �2k2 with �2 = E�2. Consequently, for giveninitial conditions, the growth potential of the economy might lead to a growinginstability of the adjustment path : V h u v
��2V k
�. This last expression points
out that the variability of the adjustment path is strictly proportional to theone of the capital stock. However, the variance of the capital stock positivelydepends upon the variability of the corresponding returns.
14

Moreover, adjustment to a temporary positive shock might be subject toindividual strategic behaviours. The resulting transition path can then be theresult of individual activities that create an impulse strong enough to force theeconomy irreversibly into the convergence basin of one of the multiple equilibria.To illustrate that point, consider a developing country which has an imperfectaccess to the world capital market: the latter can hold foreign assets, k�;butit cannot borrow (k � k�). At time t = 0 the world interest rate is lower thanthe time preference rate (� > r�). Before the shock, the domestic rate of returnexceeds the world rate of interest: there is an incentive to borrow. In this opencapital account model, the shock-response strategy depends upon two activi-ties: investing abroad or investing in the domestic economy. Initially windfallsavings are invested domestically until k� is reached. For the remainder of theboom period investment is in foreign assets. These two activities are linked, be-cause the individuals can substitute their e¤orts across the two. In this country,the presence of nonconvexities combined with a wealth-dependent borrowingconstraint, can imply a competition between these activities. Formally, an in-dividual chooses k = (k; k�) to maximise the payo¤: V (k). The best responseof each individual can be given by the following �rst-order condition:
@Vf�g
@k= r(k)�
��
2(k � k�)
�, with 0 � � � 1
The second term of this �rst order condition represents the marginal costof investing in the country, where � measures the substitutability of the indi-vidual�s e¤orts across the two activities. When � = 0 the latter chooses thee¤orts in the two activities independently, and their best responses are given by@Vf�g@k = r(k) when k < k� and by @Vf�g
@k� = r(k�) when k � k�:Wealth increasesin the boom period and then returns to its pre-boom level, foreign assets beingrapatriated and domestic investment reversed. By contrast, when 0 < � � 1each individual�s e¤orts in the two activities are substitutes. This interdepen-dence makes the individual�s marginal cost of investment in the economy in-creases with the e¤ort of holding foreign assets. In this case, such an activityis self-reinforcing since it contributes to decreasing the domestic rate of returnto capital. Then, foreign assets won�t be rapatriated. This self-reinforcingmechanism, which rests on agglomeration economies, is an illustration of thepath-dependence property and can explain why the economy can be trapped onthe con�ned path or a limit cycle; two representations of the so-called povertytrap.To illustrate this last point, consider that Vf�g can be de�ned on the set
D =�0; k�. Then, D0 := (�1; 0][ [B; 1) and Vf�g (k; k�) = 0 for all k 2 D0.
If � < 1, the relation has a maximum level on the set�0; k
�and all distributions
of the capital stock should remain in the following zone of the phase diagramme�V�k�; k�. However, we note that
���V 0f�g (k)��� = � g(k)k 6= � g(k�)
k� for all � � 1. If
� > 1 we de�ne the sets D1 := [0; k�[ and D2 :=hk�; ekh, then there exists two
points �k� 2 D1 and�ek � �k�� 2 D2; such that V (E) := [1; �] � D1 [ D2
15

for E :=h�k�;
�ek � �k��i. As a result, any transition path penetrating theregion E from the phase diagramme will be orientated to one of the previouslyde�ned sets D1 and D2, or oscillate between the latter. In both cases, theadjustment path is fundamentally non deterministic with regards to its arrivalpoint, considering the presence of this switching regime zone results from theunstable nature of the returns to capital.
4 Conclusion
The validity of the poverty trap view on SSA countries su¤ers from the lowinstability �low growth relation imbedded in it. As analysed in the �rst partof this communication, several empirical evidences support an inverted relation.Featuring complementarity e¤ects an optimal growth model - presented in Sec-tion 3 - emphasizes that even a temporary positive shocks can lead to povertytraps equilibrium. Thus instability matters for long term growth.Policy implications are far reaching. Management of shocks is no longer a
question of the short run. Stabilisation mechanisms as well as compensatorypayments play a crucial role for long run equilibrium. In the long run, it be-comes crucial to consider the structural features that make low developed coun-tries more prone to shocks. Concerning the allegedly positive relation betweenopenness and growth, it appears that this relation is highly dependent uponthe sectoral orientation. Primary exporting countries experiencing structuralbreaks in their export earnings are trapped. As such, shocks are rather cursesthan opportunities. Morevoer, shocks (commodity prices, con�icts, climate,...)experienced by low developed countries are of a "structural break" kind ratherthan being smoothed �uctuations around a well de�ned trend. Poverty trapsmacroeconomics should take into consideration those speci�c features of SSAcountries.
References
[1] Aghion P. and P. Howitt, Endogenous Growth Theory, The MIT Press,Cambridge MA, 1998.
[2] Amable B., J. Henry, F. Lordon and R. Topol, "Un commentaire suscitépar l�article de Jean-Marie Lepage : de l�hystérésis en économie", Revued�économie Politique, 102, 1992, pp. 123-37.
[3] Azariadis C. and A. Drazen, "Threshold externalities in economic develop-ment", Quarterly Journal of Economics, 104, 1990, pp. 501-26.
[4] Azariadis C. and J. Stachurski, "Poverty traps", Working Paper UCLA,2004.
[5] Barro R.J., "Economic Growth in a Cross Section of Countries", QuarterlyJournal of Economics, 56, 1991.
16

[6] Basu P. and D. Mc Leod, "Terms of trade �uctuations and economic growthin developing economies", Journal of Development Economics, 37, 1992, pp89-110.
[7] Baxter M. and R. G. King, "Measuring Business Cycles: ApproximateBand pass �lters for economic time series", The Review of Economics andStatistics 81, 1999.
[8] Bevan D.L., P. Collier and J.W. Gunning, "Consequences of a CommodityBoom in a Controlled Economy", World Bank Economic Review, 1, 1987,pp 489-513.
[9] Cashin P., H. Liang, C.J. MCDermott, �How persistent are shocks to worldcommodity prices?, IMF Working Paper, 1999.
[10] Collier P. and J.W. Gunning, "Trade Shocks - Consequences and PolicyResponses in Developing Countries", International Center for EconomicGrowth Occasional Papers, 51, 1994.
[11] Collier P. and J.W. Gunning, "Trade Shocks: Theory and Experience",mimeo, 55 pp, 1995.
[12] Collier P. and J.W. Gunning, "Explaining African Economic Performance",Journal of Economic Literature, 37, 1999, mars.
[13] Corden M.W. and J.P. Neary, "Booming Sector and De-industrializationin a Small Open Economy", The Economic Journal, 1982.
[14] Cuddington J.T., H. Liang and S. Lu, "Uncertainty, Trade, and CapitalFlows in Sub-Saharan Africa", WorkingPapern�6 , Georgetown University,Washington DC, 1995.
[15] D�Autume A. and P. Michel, "Hystérésis et piège du sous-développementdans un modèle de croissance endogène", Revue Economique, 2, 1993, pp.431-50.
[16] Day R., Complex Economic Dynamics, Vol. 1, The MIT Press, CambridgeMA, 1994.
[17] Deaton A.S., "Commodity prices, stabilization, and growth in Africa", Dis-cussion Paper n�166, Princeton University, 35 pp, 1992.
[18] Easterly W.,"Reviving the 50s�: the big push, poverty traps, and takeo¤sin Economic development, Center for Global Development Working Paper,2005.
[19] Easterly W., R. Levine, "It�s Not Factor Accumulation: Stylized Facts andGrowth Models,"Working Papers Central Bank of Chile 164, Central Bankof Chile, 2002.
17

[20] Easterly, W. , Kremer M., Pritchett L., Summers L. H., "Good policy orgood luck?: Country growth performance and temporary shocks," Journalof Monetary Economics, Elsevier, vol. 32(3), pages 459-483, 1993.
[21] Géronimi V. and Ph. Hugon, "Instabilité des recettes d�exportation, etchangements de trajectoires des économies africaines", dans l�Afrique desIncertitudes, Ph. Hugon, G. Pourcet and S. Quiers-Valette (éds), IEDESCollection tiers Monde PUF, 1995, pp 17-39.
[22] Géronimi V., P. Schembri and A. Taranco, "Instabilités et développement: implications pour les politiques de coopération. Une ré�exion à partir del�expérience de l�Afrique sub-saharienne sur les trois dernières décennies",dans L�Europe et le Sud à l�aube du XXIème siècle : enjeux et renouvelle-ment de la coopération, EADI � GEMDEV (éds), Karthala (CD-Rom),2002.
[23] Géronimi V., L. Mathieu and A. Taranco, "La nature des �uctuationsdes cours de matières premières: implication des résultats des analyses enséries temporelles pour la stabilisation et le développement économique", inEconomie et Sociétés, Série Relations Economiques Internationales, n�37,2003.
[24] Grilli E.M. and M.C. Yang, "Primary Commodity Prices, ManufacturedGoods Prices, and the Terms of trade of Developing Countries: What thLong Run Shows", The World Bank Economic Review, 9, n�3, 1988.
[25] Guillaumont P. and M. Demeocq, "Export Instability and Development: Asummary Review of the Literature", CERDI, 1983, juin.
[26] Hnatkovska V., Loayza N., "Volatility and Growth", World Bank WorkingPaper, 2003
[27] Ho¤ K.,"Beyond Rosenstein-Rodan: The Modern Theory of CoordinationProblems in Development", Proceedings of the Annual World Bank Con-ference on Development Economics 2000,Washington, D.C.: World Bank,2001, 145-188.
[28] IMF and World Bank, Global Monitaring report 2005: Millenium Devel-opment Goals: from Consensus to Momentum, Washington DC, 2005.
[29] Kose M.A., Prasad S.E. and Terrones M.E., "Financial Integration andMacoeconomic Volatility", IMF Working Paper, 2003.
[30] Krugman P., "The Narrow Moving Band, The Dutch Disease, and TheCompetitive Consequences of Mrs Thatcher", Journal of Development Eco-nomics, 27, 1987, pp 41-55.
[31] Krugman P., "History versus Expectations", Quarterly Journal of Eco-nomics, 106, 1991, pp. 651-67.
18

[32] Love J., "Export Instability and the Domestic Economy: Questions ofCausality", The Journal of Development Studies, 28, n�4, 1992, July.
[33] Matsuyama K., "Increasing returns, Industrialisation, and indeterminacyof Equilibrium", Quarterly Journal of Economics, 106, pp. 617-50, 1990.
[34] Murphy K., A. Shleifer et R. Vishny, Industrialisation and the Big Push,Journal of Political Economy, 97, pp. 1003-24, 1989.
[35] Nurske R, Problems of capital formation in underdevelopped countries, Ox-ford, Basil Blackwell, 1953.
[36] Ramey G., V. A. Ramey, "Cross country evidence of the link betweenvolatility and growth", American Economic Review, vol. 85, 1995.
[37] Rosenstein-Rodan P.N., "Problems of Industrialization of Eastern andSouth-eastern Europe", Economic Journal, June-sept. 1943.
[38] Sachs, J.D., McArthur J.W., Schmid-Traub G., Kruk M., Bahadur C., FayeM., McCord G., "Ending Africa�s poverty trap", Mimeo, 2004.
[39] Scitovsky T., "Two concepts of external economics", The journal of Polit-ical Economy, april, 1954.
[40] UN Millenium Project, Investing in development: A practical Plan toachieve the Millenium Development Goals, Overview report, U.N., NewYork, 2005.
[41] Vellutini C., Capital mobility and underdevelopment traps, Journal of De-velopment Economics, 71, pp. 435-4, 2003.
19

5 Annexes
1960-2000 1960s 1970s 1980s 1990sOutput GrowthIndustrial Countries 2.80 3.75 2.75 2.09 1.88Developing Countries 1.57 2.46 2.06 0.32 1.39Sub Saharan Countries 0.31 1.73 1.58 -0.034 -0.49
Output Volatility (standard deviation)Industrial Countries 2.59 2.18 2.78 2.12 1.79Developing Countries 4.90 4.62 4.83 3.89 3.39Sub Saharan Countries 7.42 5.64 6.92 5.5 5.04
Output Volatility (standard deviation of output gap)Industrial Countries 1.27 1.14 2.02 1.18 1.05Developing Countries 2.08 2.13 2.23 1.76 1.65Sub Saharan Countries 4.02 3.13 4.35 3.06 3.10Source: Author�s calculations and Kose, Prasad and Terrones [2003]
Table 1: Growth and Volatility Statistics
Box n�1: Delayed coordinates representation
An observable time series is the realization of some dynamical process (growthhere).To recreate a phase space portrait of the dynamical system under study from
a scalar time series, we use delay coordinatesTo expand a one dimensional time series into an M dimensional phase space,
one substitutes each observation in the original time series T(t) (the growthrate) with vector :Y(i) = (T(i), T(i+d), T(i+2d),. . . , T(i+(m-1)d),where i is the index time, m is the embedding dimension and d the delay
time. As a result, we have a series of vectors:Y={Y(1),Y(2),. . . ,Y(N-(m-1)d)}where N is the length of the original time series.Mutual information can be used to determine optimal value of the time delay
d. False nearest neighbours method can be used for choosing the minimumembedding dimension m.
20

0
1
2
34
5
6
7
8
1960 1970 1980 1990 2000
Sta
ndard
devia
tion
SSA
industrial countries
developing countries
Figure 1: Moving volatility: 5 years window 1960-2000
4
2
0
2
4
6
8
0 5 10 15 20
volatility
Out
put g
row
th
Figure 2: Growth vs Volatility in SSA (1960-2000)
21

Confidence ellipses in delayed GDP per capita g rowth rates(1961 2000)
15 10 5 0 5 10 15
Growth rate at t1
15
10
5
0
5
10
15
Grow
th rate at t
FranceUSA
Benin
Guinea
Burkina Faso
Niger
Mali
Kenya
Ethiopia
Figure 3: Con�dence ellipses in delayed GDP per capita growth rates
Countries/products >50% earnings [20%,49%] earnings <20% earnings
Alumina GuineaCrude petroleum Angola, Gabon,
Rep. Congo, Nige-ria
Cameroon, E.Guinea
Copper Zambia R. D. CongoCotton Benin,Tchad,MaliCo¤ee Burundi, Ethiopia,
UgandaCocoa Ivory CoastGold Ghana MaliTimber Equatorial Guinea C. A. Rep.
Source: Cashin et al.[1999]
Table 2: Countries dependence export earnings
22

Scatterplot GDP per capita delayed growth ratesand confidence ellipses (1961 2000)
Gt1
Gt
20 10 0 10 20
20
10
0
10
20
SSAOthers
+
Figure 4: Scatterplot in delayed GDP per capita growth rates
Period 1957:01-1998:12 (monthly data)Raw commodities index (log) TS/DS Persistence Structural Breaks
Coco oil TS (Break) 70 months>5 years 82-86Sugar DS 116 months>5 years 64-74-82-93Banana TS (LSTAR) 2 months<5 years 75-85-93Co¤ee DS 150 months>5 years 65-75-81-86-93Cacao DS 1 >5 years 75-88-93Tea TS (LSTAR) 10.5 months<5 years 74Cotton TS (LSTAR) 152 months>5 years 62-73-86Alumina DS 29 months<5 years 61-73-88Copper TS (LSTAR) 81 mois>5 ans 63-75-80Petroleum TS (LSTAR) 1 >5 years 61-74-86
Source: Author�s calculation and Cashin et al.[1999]
Table 3: Unit root tests and persistance measures
23

Distance dispersion scatterplot(GDP per capita growth rate, 1961 2000)
DISTANCE
DISPER
SION
2 0 2 4 6 8 10 120
2
4
6
8
10
12
14
16
18
20
22
24
26
28
30
SSA countriesOthers countries
Figure 5: Distance dispersion scatterplot
24

Distance dispersion scatterplot(GDP per capita growth rate, 1961 2000)
DISTANCE
DISPER
SION
2 0 2 4 6 8 10 120
2
4
6
8
10
12
14
16
18
20
22
24
26
28
30
Instability and StagnationInstabilityStability and Growth
Figure 6: Distance-dispersion scatterplot only SSA countries
25

k
c
k*
Figure 7: The Solow regime
k
c
k*
c
k
Confined Path Limit Cycle Romer Path
k
c
Figure 8: Endogenous growth
26