
Potential hazards of explosive volcanic activity from Mount Ngauruhoe on surrounding infrastructure...
70
Potential hazards of explosive volcanic activity from Mount Ngauruhoe on surrounding infrastructure and property A thesis submitted in partial fulfilment of the requirements for the degree of Bachelor of Science with Honours in Geology at the University of Canterbury by Andrew Jonathon Cantwell 2011 Department of Geological Sciences
-
Upload
canterbury-nz -
Category
Documents
-
view
0 -
download
0
Transcript of Potential hazards of explosive volcanic activity from Mount Ngauruhoe on surrounding infrastructure...
Potential hazards of explosive volcanic
activity from Mount Ngauruhoe on
surrounding infrastructure and property
A thesis submitted in partial fulfilment of the requirements for the degree of Bachelor of Science with Honours in Geology
at the University of Canterbury
by
Andrew Jonathon Cantwell 2011
Department of Geological Sciences

i
Frontispiece
View of Mt. Ngauruhoe looking towards the southwest, with Red Crater in the foreground.
ii
Abstract
Explosive eruptions from Mt. Ngauruhoe cause a number of hazards including tephra fall
and the deposition of bombs and blocks. These pose a risk to infrastructure and property in
the central North Island of New Zealand. Mt. Ngauruhoe erupted on average every two to
three years between the years 1841 and 1975, but has not erupted since. Prehistoric
deposits from Mt. Ngauruhoe, including the Mangatawai Formation, have been mapped and
described by previous studies. The overall prehistoric record is incomplete, making it
difficult to understand the full eruptive history.
Historic and prehistoric eruptions from Mt. Ngauruhoe have been used to create a set of
parameters based around two eruption scenarios. The first scenario is the most likely
eruption, which is based around the 1975 eruption from Mt. Ngauruhoe. This is the largest
historic event, and was chosen because it is expected that following a longer than usual
period of low activity, a more substantial eruption will occur. The second scenario is the
maximum plausible eruption, which is based around the Mangatawai Formation, which was
deposited between 2,568 ± 508 cal. years BP and 1,717 ± 13 cal. years BP. Models of both
the most likely and the maximum plausible eruption from Mt. Ngauruhoe have been
created with these parameters using Tephra2, which gives resulting isopach maps of tephra
dispersal in the surrounding area.
Both eruption scenarios will be significantly affected by changing wind conditions, which
have the potential to disperse tephra across a large portion of the North Island of New
Zealand.
The model created using Tephra2 for a likely eruption scenario shows a number of impacts
on infrastructure and property. The most significant of these impacts is on electricity
production, particularly on the Tongariro Power Scheme. Electricity transmission lines to the
east of Mt. Ngauruhoe will be coated in up to 1 cm of tephra, so will be affected by insulator
flashover if the tephra is moist and of fine grainsize. A 14 km section of State Highway 1 will
be covered in more than 5 mm of tephra, causing hazardous driving conditions.
The model created using Tephra2 for the maximum plausible eruption scenario shows more
widespread damage to infrastructure and property. An area of more than 5,000 km2 will

iii
receive up to 50 cm of tephra, which will have a large impact on electricity production,
electricity transmission, transport and telecommunications. The area which the majority of
the tephra will fall is remote, with no major townships receiving significant levels of tephra.

iv
Acknowledgements
Firstly I wish to thank my supervisor, Professor Jim Cole for encouraging me to write this
thesis. Without his support and knowledge I would not have been able to achieve as much
as I have. I also thank Jim for the tour of the Taupo Volcanic Zone. It was the most
interesting, informative and valuable few hours in my entire time studying.
I would also like to thank my co-supervisor, Dr Tom Wilson for providing valuable advice on
the modelling of tephra, and for always being able to find relevant and appropriate sources.
To all the lecturers and technical staff in the Geology Department at the University of
Canterbury, you have been the most helpful, inspirational people I can imagine, and I thank
you for the time you have spent sharing your knowledge with me.
I thank Brian Mason and the Mason Trust for providing me with initial funding, which
allowed me to travel to GNS Wairakei. Without this I would not have met Dr Gill Jolly, who I
am grateful to for suggesting the topic of my thesis.
Finally I would like to thank my friends and family. I would not have got through this without
you. Thank you Mum, Dad, Nicole, Emma, Matthew, all the Geology students at the
University of Canterbury and everyone else that has helped me along the way.

v
Table of Contents
Abstract...................................................................................................................................... ii
Acknowledgements .................................................................................................................. iv
Table of Contents ...................................................................................................................... v
List of Figures .......................................................................................................................... viii
List of Tables .............................................................................................................................. x
Chapter One – Introduction ...................................................................................................... 1
1.1 Geological Setting ............................................................................................................ 1
1.1.1 The Taupo Volcanic Zone .......................................................................................... 1
1.1.2 Tongariro Volcanic Centre ........................................................................................ 2
1.1.2.1 Tongariro Volcanic Complex ............................................................................. 2
1.1.2.2 Mount Ngauruhoe ............................................................................................ 3
1.2 Volcanic Risk Assessment ................................................................................................ 3
1.3 Objectives ........................................................................................................................ 5
1.4 Methods........................................................................................................................... 5
Chapter Two – Mt. Ngauruhoe Eruptive History ..................................................................... 7
2.1 Prehistoric Activity .......................................................................................................... 7
2.2 Historic Activity................................................................................................................ 7
2.2.1 Pre 1900’s Eruptive Activity ...................................................................................... 8
2.2.2 1948 – 1949 Eruptive Activity ................................................................................... 8
2.2.3 1954 – 1955 Eruptive Activity ................................................................................. 10
2.2.4 1973 – 1975 Eruptive Activity ................................................................................. 11
Chapter Three – Comparisons with Similar Volcanoes .......................................................... 13
3.1 Introduction ................................................................................................................... 13
3.2 Paricutin Volcano........................................................................................................... 13
3.2.1 Initial Observations at Paricutin ............................................................................. 13
vi
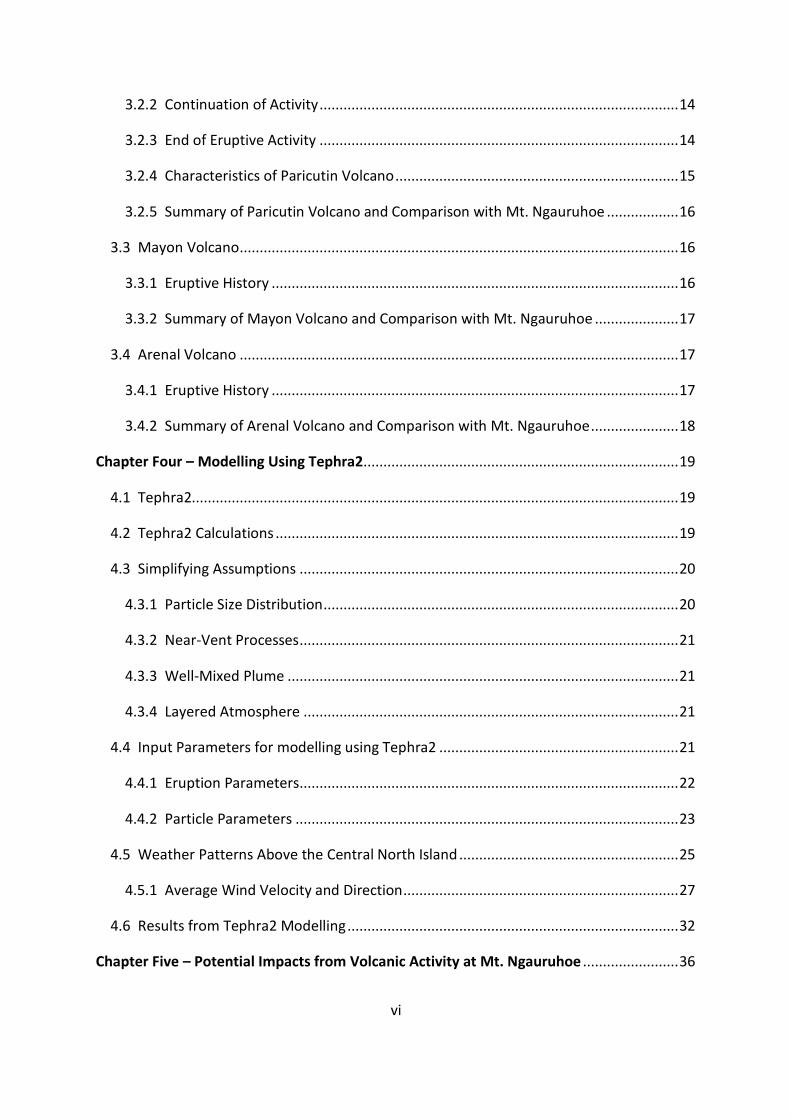
3.2.2 Continuation of Activity .......................................................................................... 14
3.2.3 End of Eruptive Activity .......................................................................................... 14
3.2.4 Characteristics of Paricutin Volcano ....................................................................... 15
3.2.5 Summary of Paricutin Volcano and Comparison with Mt. Ngauruhoe .................. 16
3.3 Mayon Volcano .............................................................................................................. 16
3.3.1 Eruptive History ...................................................................................................... 16
3.3.2 Summary of Mayon Volcano and Comparison with Mt. Ngauruhoe ..................... 17
3.4 Arenal Volcano .............................................................................................................. 17
3.4.1 Eruptive History ...................................................................................................... 17
3.4.2 Summary of Arenal Volcano and Comparison with Mt. Ngauruhoe ...................... 18
Chapter Four – Modelling Using Tephra2............................................................................... 19
4.1 Tephra2.......................................................................................................................... 19
4.2 Tephra2 Calculations ..................................................................................................... 19
4.3 Simplifying Assumptions ............................................................................................... 20
4.3.1 Particle Size Distribution ......................................................................................... 20
4.3.2 Near-Vent Processes ............................................................................................... 21
4.3.3 Well-Mixed Plume .................................................................................................. 21
4.3.4 Layered Atmosphere .............................................................................................. 21
4.4 Input Parameters for modelling using Tephra2 ............................................................ 21
4.4.1 Eruption Parameters ............................................................................................... 22
4.4.2 Particle Parameters ................................................................................................ 23
4.5 Weather Patterns Above the Central North Island ....................................................... 25
4.5.1 Average Wind Velocity and Direction ..................................................................... 27
4.6 Results from Tephra2 Modelling ................................................................................... 32
Chapter Five – Potential Impacts from Volcanic Activity at Mt. Ngauruhoe ........................ 36
vii
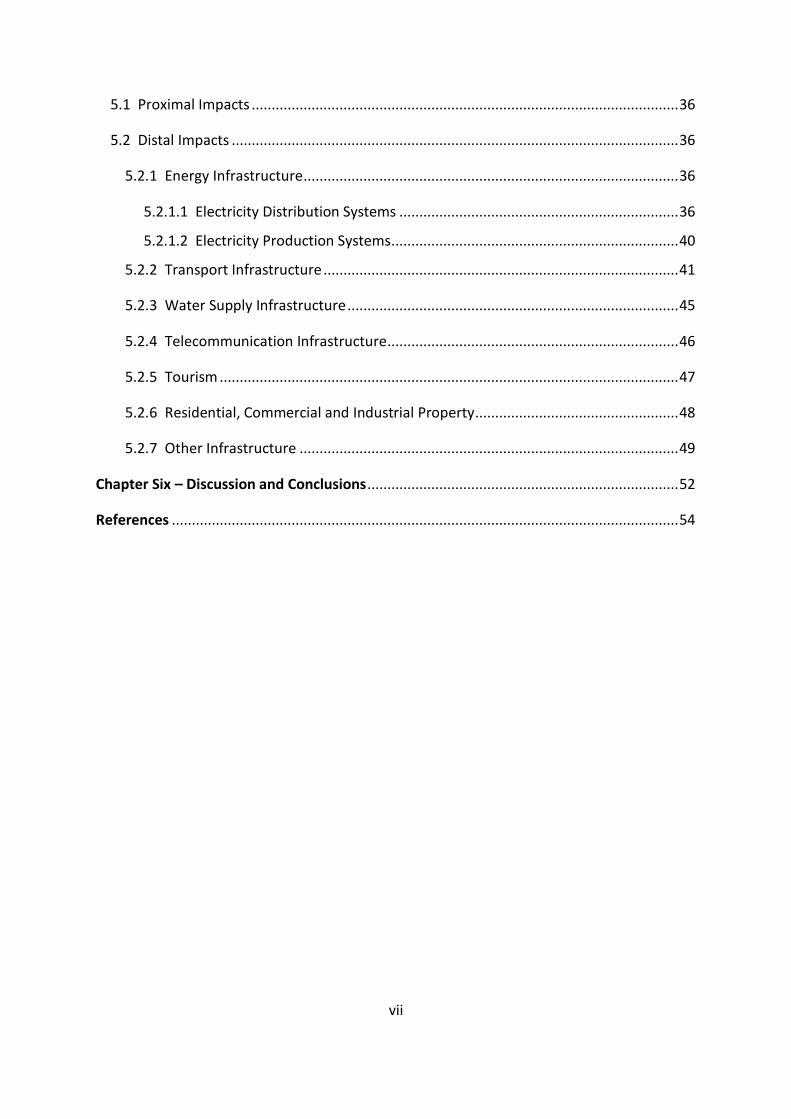
5.1 Proximal Impacts ........................................................................................................... 36
5.2 Distal Impacts ................................................................................................................ 36
5.2.1 Energy Infrastructure .............................................................................................. 36
5.2.1.1 Electricity Distribution Systems ...................................................................... 36
5.2.1.2 Electricity Production Systems ........................................................................ 40
5.2.2 Transport Infrastructure ......................................................................................... 41
5.2.3 Water Supply Infrastructure ................................................................................... 45
5.2.4 Telecommunication Infrastructure ......................................................................... 46
5.2.5 Tourism ................................................................................................................... 47
5.2.6 Residential, Commercial and Industrial Property ................................................... 48
5.2.7 Other Infrastructure ............................................................................................... 49
Chapter Six – Discussion and Conclusions .............................................................................. 52
References ............................................................................................................................... 54

viii
List of Figures
Figure 1: (A) Geological setting of the Taupo Volcanic Zone, showing location within the
North Island of New Zealand and relation to the Kermadec Trench. The extent of the
modern Taupo Volcanic Zone is shown by dashed lines. (B) Map of the Taupo Volcanic Zone
showing location of calderas and compositional changes between andesite and rhyolite
across the area. Calderas: (1) Rotorua; (2) Okataina; (3) Kapenga; (4) Reporoa; (5)
Mangakino; (6) Maroa; (7) Whakamaru; (8) Taupo (Spinks et al. 2005). .................................. 1
Figure 2: Overview of the Tongariro Volcanic Centre showing major topographical features
in relation to Mount Ngauruhoe (GeoMapApp 2011). .............................................................. 4
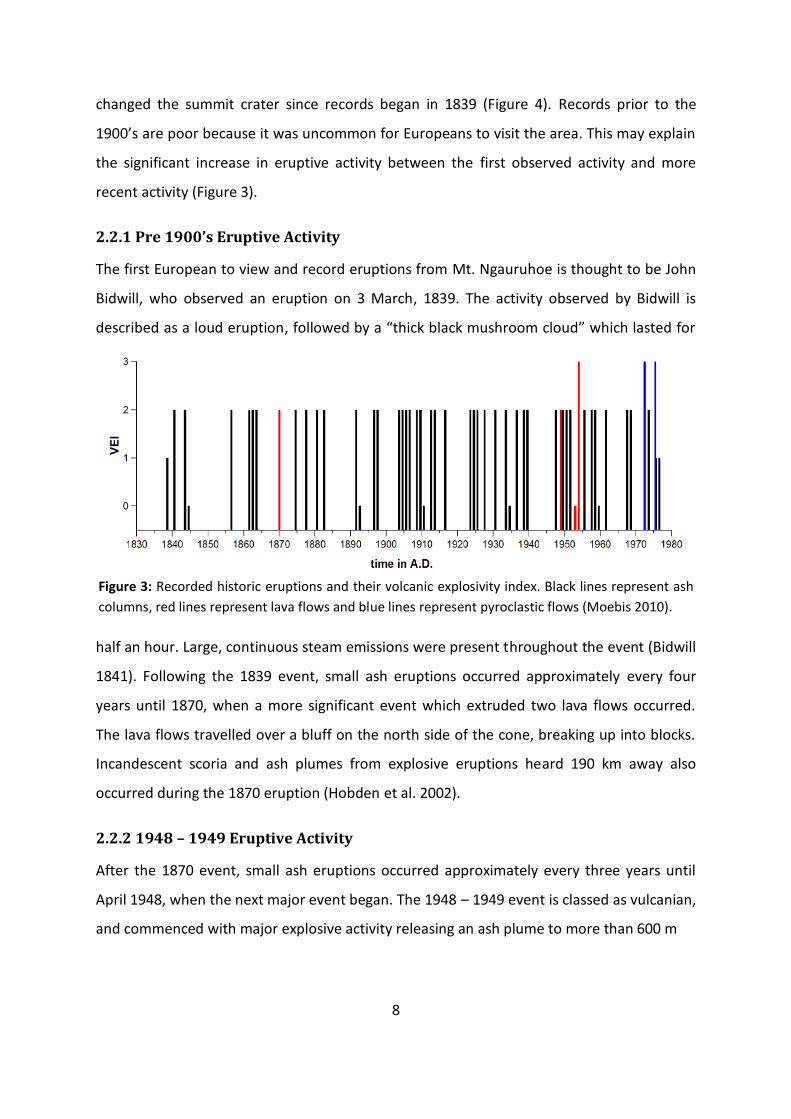
Figure 3: Recorded historic eruptions and their volcanic explosivity index. Black lines
represent ash columns, red lines represent lava flows and blue lines represent pyroclastic
flows (Moebis 2010). ................................................................................................................. 8
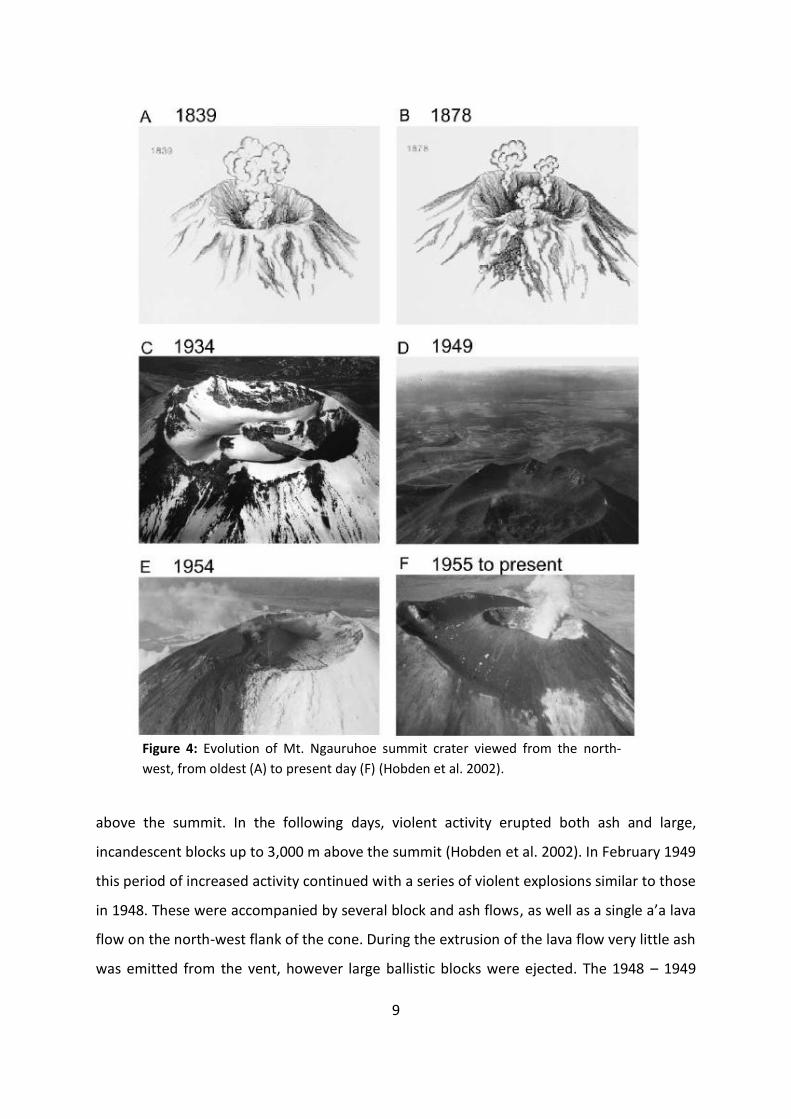
Figure 4: Evolution of Mt. Ngauruhoe summit crater viewed from the north- west, from
oldest (A) to present day (F) (Hobden et al. 2002). ................................................................... 9
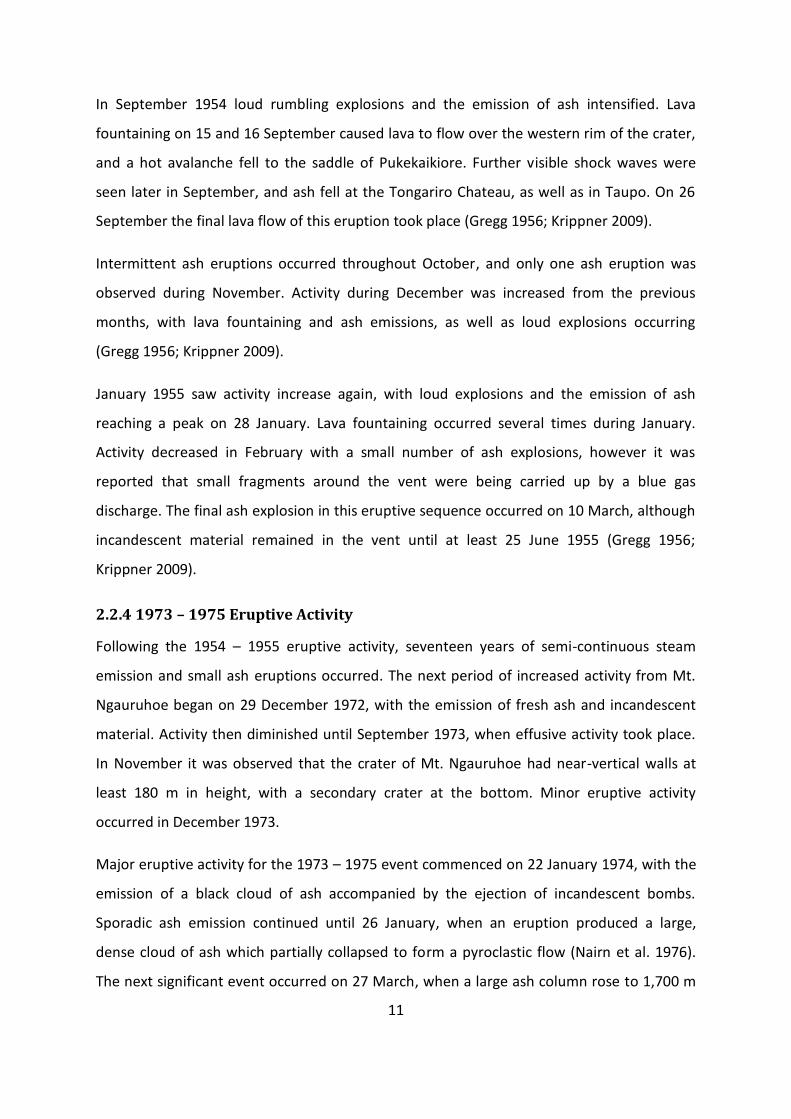
Figure 5: Pyroclastic avalanche flowing down the northern slope of Mt. Ngauruhoe on
February 19, 1975. Ejecta in eruption column and at base of flow were incandescent at the
time of photograph (Nairn and Self 1977). .............................................................................. 12
Figure 6: Total energy of the Paricutin volcano, showing a decline in energy over time (y-axis
measured in ‘ergs’ – one erg is equivalent to 10-7 Joules) (Scandone 1979). ......................... 15
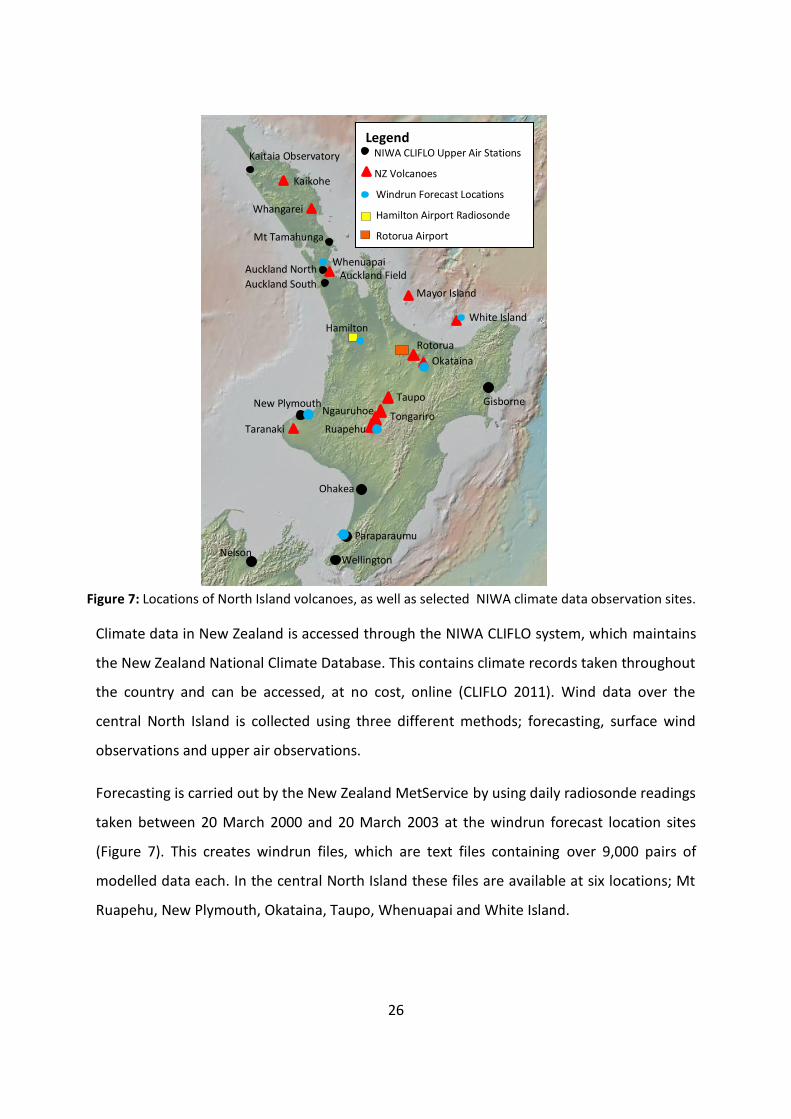
Figure 7: Locations of North Island volcanoes, as well as selected NIWA climate data
observation sites. ..................................................................................................................... 26
Figure 8: Frequency distribution of annual surface winds in azimuth bins, from selected
Windrun and CLIFLO datasets. ................................................................................................. 27
Figure 9: Frequency distribution of annual winds at approximately 2,000 m in height in
azimuth bins, from selected Windrun and CLIFLO datasets. ................................................... 28
Figure 10: Frequency distribution of annual winds at approximately 4,000 m in height in
azimuth bins, from selected Windrun and CLIFLO datasets. ................................................... 28
Figure 11: Frequency distribution of annual winds at approximately 5,500 m in height in
azimuth bins, from selected Windrun and CLIFLO datasets. ................................................... 28
Figure 12: Frequency distribution of annual winds at approximately 7,000 m in height in
azimuth bins, from selected Windrun and CLIFLO datasets. ................................................... 29
Figure 13: Frequency distributions of annual winds at above 9,000 m in height in azimuth
bins, from selected Windrun and CLIFLO datasets. ................................................................. 29
ix
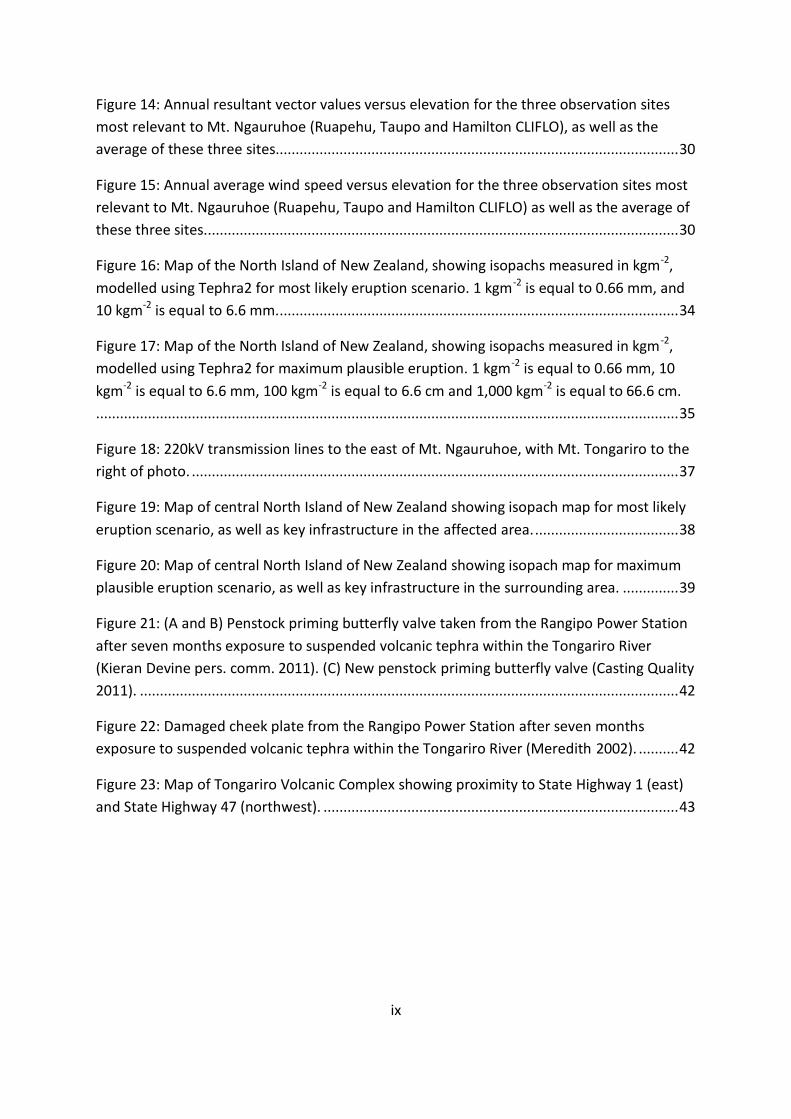
Figure 14: Annual resultant vector values versus elevation for the three observation sites
most relevant to Mt. Ngauruhoe (Ruapehu, Taupo and Hamilton CLIFLO), as well as the
average of these three sites..................................................................................................... 30
Figure 15: Annual average wind speed versus elevation for the three observation sites most
relevant to Mt. Ngauruhoe (Ruapehu, Taupo and Hamilton CLIFLO) as well as the average of
these three sites....................................................................................................................... 30
Figure 16: Map of the North Island of New Zealand, showing isopachs measured in kgm-2,
modelled using Tephra2 for most likely eruption scenario. 1 kgm-2 is equal to 0.66 mm, and
10 kgm-2 is equal to 6.6 mm..................................................................................................... 34
Figure 17: Map of the North Island of New Zealand, showing isopachs measured in kgm -2,
modelled using Tephra2 for maximum plausible eruption. 1 kgm-2 is equal to 0.66 mm, 10
kgm-2 is equal to 6.6 mm, 100 kgm-2 is equal to 6.6 cm and 1,000 kgm-2 is equal to 66.6 cm.
.................................................................................................................................................. 35
Figure 18: 220kV transmission lines to the east of Mt. Ngauruhoe, with Mt. Tongariro to the
right of photo. .......................................................................................................................... 37
Figure 19: Map of central North Island of New Zealand showing isopach map for most likely
eruption scenario, as well as key infrastructure in the affected area. .................................... 38
Figure 20: Map of central North Island of New Zealand showing isopach map for maximum
plausible eruption scenario, as well as key infrastructure in the surrounding area. .............. 39
Figure 21: (A and B) Penstock priming butterfly valve taken from the Rangipo Power Station
after seven months exposure to suspended volcanic tephra within the Tongariro River
(Kieran Devine pers. comm. 2011). (C) New penstock priming butterfly valve (Casting Quality
2011). ....................................................................................................................................... 42
Figure 22: Damaged cheek plate from the Rangipo Power Station after seven months
exposure to suspended volcanic tephra within the Tongariro River (Meredith 2002). .......... 42
Figure 23: Map of Tongariro Volcanic Complex showing proximity to State Highway 1 (east)
and State Highway 47 (northwest). ......................................................................................... 43

x
List of Tables
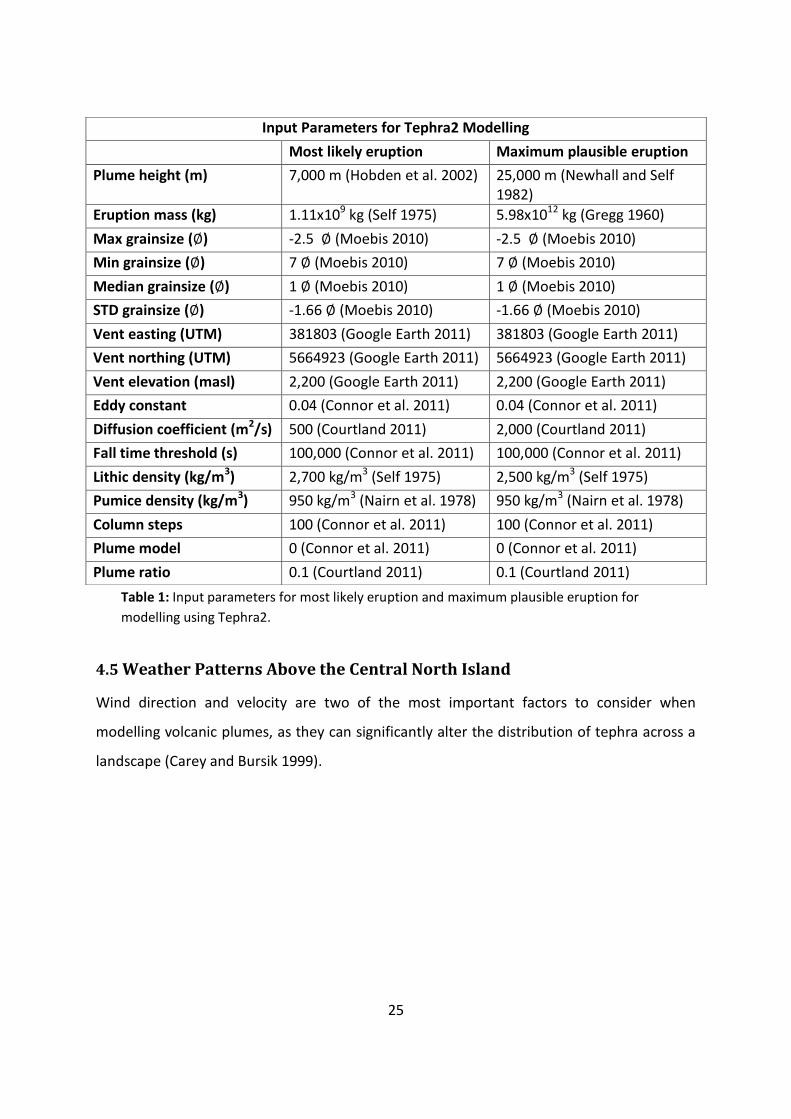
Table 1: Input parameters for most likely eruption and maximum plausible eruption for
modelling using Tephra2.......................................................................................................... 25
Table 2: Average wind speed and direction at different elevations around the central North
Island, using data taken from sites in Ruapehu, Taupo and Hamilton. ................................... 31
Table 3: Average wind speed and direction at different elevations around the central North
Island, using data taken from sites in Ruapehu, Taupo and Hamilton, including estimations
for elevations above 9,114 m. ................................................................................................. 32
Table 4: Conversion between mass per unit area of tephra and tephra thickness, using an
average tephra density of 1,500 kgm-3. ................................................................................... 33
Table 5: Overview of risk to each type of infrastructure from tephra fall. ............................. 51

1
Chapter One – Introduction
1.1 Geological Setting
New Zealand is situated on the boundary between the Pacific and Australian Plates, which
are moving between 42 mm and 50 mm/year (Bibby et al. 1995). Stress between these
plates in the South Island is released mostly as dextral movement through earthquakes
along the Alpine Fault. In the North Island, the westward subduction of the Pacific Plate
beneath the Australian Plate forms a volcanic arc and back arc basin, which is represented
by the Taupo Volcanic Zone (Cole 1990). The subduction of the Pacific Plate in this manner
has formed the Taupo-Hikurangi trench system (Cole and Lewis 1981).
1.1.1 The Taupo Volcanic Zone
The Taupo Volcanic Zone is located in the central North Island, and is the main area of active
volcanism in New Zealand at the present time (Figure 1). Initial volcanic activity in this area
Figure 1: (A) Geological setting of the Taupo Volcanic Zone, showing location within the North Island of
New Zealand and relation to the Kermadec Trench. The extent of the modern Taupo Volcanic Zone is
shown by dashed lines. (B) Map of the Taupo Volcanic Zone showing location of calderas and
compositional changes between andesite and rhyolite across the area. Calderas: (1) Rotorua; (2) Okataina;
(3) Kapenga; (4) Reporoa; (5) Mangakino; (6) Maroa; (7) Whakamaru; (8) Taupo (Spinks et al. 2005).

2
is thought to have occurred around 2 million years ago with andesite volcanism, while
rhyolitic activity commenced around 1.6 million years ago (Wilson et al. 1995). The present
day Taupo Volcanic Zone is around 300 km long and up to 60 km wide, and is defined by the
positions of structural boundaries of calderas as well as vent locations (Wilson et al. 1995).
The central part of the Taupo Volcanic zone consists predominantly of calderas associated
with rhyolite volcanism, while the northern (Whakatane – White Island) and southern
(Ruapehu – Tongariro) ends consist of andesite to dacite stratovolcanoes (Spinks et al 2005).
The Taupo Volcanic Zone has an average magma production rate of 0.3 m3s-1 over the last 2
million years, with a total volume of over 15,000 km3 rhyolitic material erupted in this time.
The most recently active volcanoes of the Taupo Volcanic Zone are White Island, which last
erupted in 2000 (GNS Science 2011), Mt. Ruapehu, which last erupted in 2007 (Jolly et al.
2007), and Mt. Ngauruhoe, which last erupted in 1975 and is part of the Tongariro Volcanic
Centre (Hobden et al. 2002).
1.1.2 Tongariro Volcanic Centre
The Tongariro Volcanic Centre is located at the southern end of the Taupo Volcanic Zone. It
consists of two major andesite stratovolcanoes; Tongariro (the Tongariro Volcanic Complex
including Mt. Ngauruhoe) and Ruapehu, as well as Kakaramea, Pihanga, Maungakatote,
Pukeonake, Hauhungatahi and Ohakune, which are smaller centres (Cole 1978). The
Tongariro Volcanic Centre is underlain by Tertiary mudstone and sandstone (Grant 2006),
above Mesozoic greywacke basement (Graham et al. 1995).
1.1.2.1 Tongariro Volcanic Complex
The Tongariro Volcanic Complex has been active for approximately 275 ka, showing rapid
growth from 210 ka – 200 ka, 130 ka – 70 ka and 25 ka to the present day (Hobden et al.
1996). During this time, the predominant product has been basaltic andesite to andesite
lavas and pyroclastic deposits.
The Tongariro Volcanic Complex has been divided into an older (>20,000 years) and younger
group (<20,000 years). The older group consists of lavas which have been strongly eroded
and show little topographic expression. These lavas were erupted in a NW-SE trending line,
and include eruptions from the Tama Lakes. The younger group exhibits clearly visible

3
topographic features such as levees and troughs, and are sourced from vents aligned in a
NNE-SSW orientation. Vents include North Crater, Red Crater and Mt. Ngauruhoe (Cole
1977).
The postglacial history of the Tongariro Volcanic Complex is well understood through
tephrostratigraphy, as well as by 14C dating. The Tongariro Volcanic Complex covers an area
of c. 200 km2, and a volume of c. 60 km3 with an additional 15 km3 in the surrounding ring
plain (Hobden 1997).
1.1.2.2 Mount Ngauruhoe
Mount Ngauruhoe is an active andesite stratovolcano located within the Tongariro Volcanic
Complex (Figure 2) (GeoMapApp 2011). Volcanic activity commenced approximately 7,000
years B.P. and has alternated between effusive strombolian, vulcanian and subplinian
eruption styles since then (Moebis 2010). Historical volcanic activity in general lasts days to
months, with years to decades between events (Hobden et al. 2002). Major historical
eruptions occurred in 1870, 1949, 1954 and 1975. No major volcanic activity has occurred
since the 1975 event, meaning Mt. Ngauruhoe is currently undergoing its longest quiescent
period in historical times (Hobden et al. 2002).
1.2 Volcanic Risk Assessment
Volcanic risk can be assessed by combining potential hazards, the exposure to these hazards
and the vulnerability of infrastructure and property. To allow volcanic risk to be calculated, a
number of areas must be investigated. These include the type of volcano, its eruptive
history, hazards from previous eruptions and similarities to other volcanoes.
The modelling of potential future eruptions using the program Tephra2 requires information
gathered from the eruptive history, as well as wind data to create two eruption scenarios;
the maximum plausible event and the most likely event. Resulting isopachs can then be
overlain on maps to determine areas which may be exposed to tephra fall. The vulnerability
of these areas can then be determined.

4
N
Hauhangatahi
Tongariro Volcanic Centre
Pihanga
Kakaramea
Ohakune
Mount Ruapehu
Central North Island, New Zealand
Mount Ngauruhoe
Mount Tongariro
Figure 2: Overview of the Tongariro Volcanic Centre showing major topographical features in
relation to Mount Ngauruhoe (GeoMapApp 2011).
5
Two approaches can be undertaken for volcanic risk assessment; deterministic and
probabilistic. Deterministic hazard assessment focuses on a single hazard event, which
ensures that the event is realistic. A most likely scenario as well as a maximum plausible
event are often used in deterministic hazard assessments. The major limitation of this
approach is that the chosen scenarios may not be realistic, meaning results may not be
representative of events which may occur in the future. Probabilistic hazard assessments
model all possible scenarios to determine the most likely event. This takes into account the
uncertainty involved with creating likely scenarios. Limitations of this approach are that it
excludes scenarios which are unexpected, and does not allow for complexities in systems.
This study takes a deterministic approach. It uses information from historic events as a basis
for developing two scenarios (most likely eruption and maximum plausible eruption) for
modelling, as no eruptive activity has occurred from Mt. Ngauruhoe since 1975. Modern
wind data is required to produce average wind speed and directions for the affected area,
however this is highly variable.
1.3 Objectives
There are three main objectives that this study aims to achieve: (1) To identify areas
vulnerable to volcanic hazards from Mt. Ngauruhoe using information from past events; (2)
To model the potential dispersal of tephra for the most likely eruption, and the maximum
credible eruption, from Mt. Ngauruhoe across the North Island of New Zealand using the
program ‘Tephra2’; and (3) To analyse the impact of tephra on infrastructure using results
from modelling with Tephra2.
1.4 Methods
A literature review of Mt. Ngauruhoe and the surrounding area has been carried out in
chapters one and two. Paricutin Volcano, Mayon Volcano and Arenal Volcano have been
reviewed in chapter three to give a comparison of similar volcanoes to Mt. Ngauruhoe.
Tephra2 is a computer program which uses the advection-diffusion method to calculate
dispersal of tephra across an area. This has been used in chapter 4 to model two eruption
scenarios from Mt. Ngauruhoe; the most likely eruption and the maximum plausible event.
6
Tephra2 requires a number of input parameters, including variables relating to the eruption,
particles and wind.
The variability of wind is one of the most important aspects of carrying out accurate
modelling of volcanic tephra dispersal. This study uses the calculated average wind direction
and speed at different elevations from three measuring stations in the central North Island.
Any number of weather patterns could cause tephra to be deposited in different locations,
however only the most common weather pattern has been modelled due to the limited
time available.
Volcanic hazards which pose a threat to life and property from Mt. Ngauruhoe have been
recognised in chapter 5. The vulnerability of different types of infrastructure and property
have been also been assessed using results from modelling. Volcanic hazards have been
combined with vulnerability of each type of infrastructure to allow the risk of damage to be
identified.
7
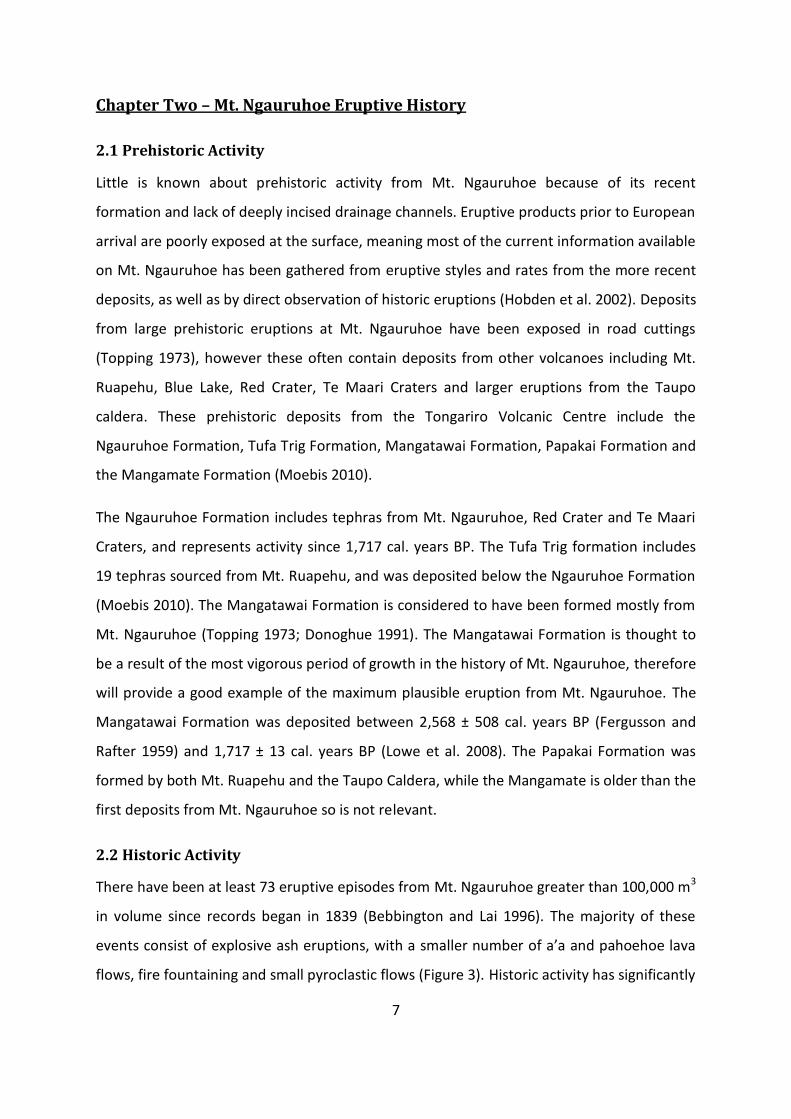
Chapter Two – Mt. Ngauruhoe Eruptive History
2.1 Prehistoric Activity
Little is known about prehistoric activity from Mt. Ngauruhoe because of its recent
formation and lack of deeply incised drainage channels. Eruptive products prior to European
arrival are poorly exposed at the surface, meaning most of the current information available
on Mt. Ngauruhoe has been gathered from eruptive styles and rates from the more recent
deposits, as well as by direct observation of historic eruptions (Hobden et al. 2002). Deposits
from large prehistoric eruptions at Mt. Ngauruhoe have been exposed in road cuttings
(Topping 1973), however these often contain deposits from other volcanoes including Mt.
Ruapehu, Blue Lake, Red Crater, Te Maari Craters and larger eruptions from the Taupo
caldera. These prehistoric deposits from the Tongariro Volcanic Centre include the
Ngauruhoe Formation, Tufa Trig Formation, Mangatawai Formation, Papakai Formation and
the Mangamate Formation (Moebis 2010).
The Ngauruhoe Formation includes tephras from Mt. Ngauruhoe, Red Crater and Te Maari
Craters, and represents activity since 1,717 cal. years BP. The Tufa Trig formation includes
19 tephras sourced from Mt. Ruapehu, and was deposited below the Ngauruhoe Formation
(Moebis 2010). The Mangatawai Formation is considered to have been formed mostly from
Mt. Ngauruhoe (Topping 1973; Donoghue 1991). The Mangatawai Formation is thought to
be a result of the most vigorous period of growth in the history of Mt. Ngauruhoe, therefore
will provide a good example of the maximum plausible eruption from Mt. Ngauruhoe. The
Mangatawai Formation was deposited between 2,568 ± 508 cal. years BP (Fergusson and
Rafter 1959) and 1,717 ± 13 cal. years BP (Lowe et al. 2008). The Papakai Formation was
formed by both Mt. Ruapehu and the Taupo Caldera, while the Mangamate is older than the
first deposits from Mt. Ngauruhoe so is not relevant.
2.2 Historic Activity
There have been at least 73 eruptive episodes from Mt. Ngauruhoe greater than 100,000 m3
in volume since records began in 1839 (Bebbington and Lai 1996). The majority of these
events consist of explosive ash eruptions, with a smaller number of a’a and pahoehoe lava
flows, fire fountaining and small pyroclastic flows (Figure 3). Historic activity has significantly
8
changed the summit crater since records began in 1839 (Figure 4). Records prior to the
1900’s are poor because it was uncommon for Europeans to visit the area. This may explain
the significant increase in eruptive activity between the first observed activity and more
recent activity (Figure 3).
2.2.1 Pre 1900’s Eruptive Activity
The first European to view and record eruptions from Mt. Ngauruhoe is thought to be John
Bidwill, who observed an eruption on 3 March, 1839. The activity observed by Bidwill is
described as a loud eruption, followed by a “thick black mushroom cloud” which lasted for
half an hour. Large, continuous steam emissions were present throughout the event (Bidwill
1841). Following the 1839 event, small ash eruptions occurred approximately every four
years until 1870, when a more significant event which extruded two lava flows occurred.
The lava flows travelled over a bluff on the north side of the cone, breaking up into blocks.
Incandescent scoria and ash plumes from explosive eruptions heard 190 km away also
occurred during the 1870 eruption (Hobden et al. 2002).
2.2.2 1948 – 1949 Eruptive Activity
After the 1870 event, small ash eruptions occurred approximately every three years until
April 1948, when the next major event began. The 1948 – 1949 event is classed as vulcanian,
and commenced with major explosive activity releasing an ash plume to more than 600 m
Figure 3: Recorded historic eruptions and their volcanic explosivity index. Black lines represent ash
columns, red lines represent lava flows and blue lines represent pyroclastic flows (Moebis 2010).
9
above the summit. In the following days, violent activity erupted both ash and large,
incandescent blocks up to 3,000 m above the summit (Hobden et al. 2002). In February 1949
this period of increased activity continued with a series of violent explosions similar to those
in 1948. These were accompanied by several block and ash flows, as well as a single a’a lava
flow on the north-west flank of the cone. During the extrusion of the lava flow very little ash
was emitted from the vent, however large ballistic blocks were ejected. The 1948 – 1949
Figure 4: Evolution of Mt. Ngauruhoe summit crater viewed from the north-
west, from oldest (A) to present day (F) (Hobden et al. 2002).

10
eruption series ended in February 1949, culminating with explosive ash, volcano-tectonic
tremors, loud explosions and the formation of ash plumes up to 6,000 m above the summit
(Hobden 2002).
2.2.3 1954 – 1955 Eruptive Activity
The next major event in the history of Mt. Ngauruhoe occurred between 1954 and 1955.
This event was comprehensively reviewed by Gregg (1956) and Krippner (2009). The
eruption began in May 1954 with an ash plume rising to around 4,000 m above the summit.
Minor ash eruptions continued until the end of May, and during this time red-hot lava was
seen in the crater. On 2 June 1954 lava fountaining to c. 300 m above the summit was
observed. This could also be seen in Taupo, located c. 60 km to the north-east of Mt.
Ngauruhoe. The lava fountaining continued until 4 June, and formed two lava flows down
the north-west flank of the cone. The most westerly of these flows covered a hot avalanche
which was deposited earlier in the day. On 6 June 1954 a number of sharp explosions were
heard from Mt. Ngauruhoe, and ash clouds rising to several hundred metres above the
summit were observed. Explosions and ash clouds continued intermittently until the end of
June, along with occasional lava fountaining which reached a maximum for the 1954 – 1955
eruption period on 30 June 1954. Near-continuous fountaining to a height of approximately
300 m above the summit, as well as the formation of another lava flow down the north-west
flank of the cone occurred on this day (Gregg 1956; Krippner 2009).
Lava fountaining and the emission of ash continued throughout July, and on 8 and 9 July two
further lava flows were extruded down the western flanks. These continued to flow until 13
July 1954. On 29 July 1954 a new lava flow was extruded, accompanied by explosions that
produced both shock waves (seen as bright arcs of light moving away from the vent) and
vortex rings (circular puffs of ash). Three lava flows were extruded in August, the first
reaching Pukekaikiore on 15 August and the second on 18 August. The second flow was 183
m wide and 15 m high, and moved at around 15 cm per minute. The third flow travelled
around the southern end of Pukekaikiore, also at around 15 cm per minute (Gregg 1956;
Krippner 2009).
11
In September 1954 loud rumbling explosions and the emission of ash intensified. Lava
fountaining on 15 and 16 September caused lava to flow over the western rim of the crater,
and a hot avalanche fell to the saddle of Pukekaikiore. Further visible shock waves were
seen later in September, and ash fell at the Tongariro Chateau, as well as in Taupo. On 26
September the final lava flow of this eruption took place (Gregg 1956; Krippner 2009).
Intermittent ash eruptions occurred throughout October, and only one ash eruption was
observed during November. Activity during December was increased from the previous
months, with lava fountaining and ash emissions, as well as loud explosions occurring
(Gregg 1956; Krippner 2009).
January 1955 saw activity increase again, with loud explosions and the emission of ash
reaching a peak on 28 January. Lava fountaining occurred several times during January.
Activity decreased in February with a small number of ash explosions, however it was
reported that small fragments around the vent were being carried up by a blue gas
discharge. The final ash explosion in this eruptive sequence occurred on 10 March, although
incandescent material remained in the vent until at least 25 June 1955 (Gregg 1956;
Krippner 2009).
2.2.4 1973 – 1975 Eruptive Activity
Following the 1954 – 1955 eruptive activity, seventeen years of semi-continuous steam
emission and small ash eruptions occurred. The next period of increased activity from Mt.
Ngauruhoe began on 29 December 1972, with the emission of fresh ash and incandescent
material. Activity then diminished until September 1973, when effusive activity took place.
In November it was observed that the crater of Mt. Ngauruhoe had near-vertical walls at
least 180 m in height, with a secondary crater at the bottom. Minor eruptive activity
occurred in December 1973.
Major eruptive activity for the 1973 – 1975 event commenced on 22 January 1974, with the
emission of a black cloud of ash accompanied by the ejection of incandescent bombs.
Sporadic ash emission continued until 26 January, when an eruption produced a large,
dense cloud of ash which partially collapsed to form a pyroclastic flow (Nairn et al. 1976).
The next significant event occurred on 27 March, when a large ash column rose to 1,700 m
12
above the vent. This was followed on 28 March by rapid degassing of Mt. Ngauruhoe,
producing ash columns and associated pyroclastic flows. Bombs and blocks up to 5 m in
diameter were ejected onto the slopes of Mt. Ngauruhoe, with shock waves from these
events reaching as far as Chateau Tongariro. The most explosive eruptions occurred from 28
to 29 March, throwing bombs and blocks 40 m above the crater rim. An ash cloud with
internal lightning extended to 2,500 m above the vent (Nairn et al. 1976).
An 11 month lull in activity was broken on 12 February 1975, with the emission of ash
followed by intermittent ash eruptions until 17 February. The largest explosion of the 1973 –
1975 eruption sequence occurred on 19 February, creating a 6,000 m high ash cloud which
collapsed to form a pyroclastic flow. This was accompanied by the continuous emission of
gas, and volcanic tremor. A block and ash flow was caused by the collapse of a build-up of
bombs and blocks between the inner and outer craters. This produced a co-ignimbrite
plume that rose to 500 m above the block and ash flow. By the afternoon of 19 February
1975, the eruption column had risen to 10,000 m above the crater rim, depositing ash 170
km from the vent. Pyroclastic flows caused by column collapse continued until the
afternoon, when the ash column declined to 4,000 m (Figure 5). The eruption ended during
the night of 19 February, 1975.
Figure 5: Pyroclastic avalanche flowing down the northern slope of Mt. Ngauruhoe
on February 19, 1975. Ejecta in eruption column and at base of flow were
incandescent at the time of photograph (Nairn and Self 1977).
13
Chapter Three – Comparisons with Similar Volcanoes
3.1 Introduction
Mt. Ngauruhoe has been compared with three other volcanoes using a literature review, in
order to identify similarities and differences in the eruptive history and potential future
activity from each volcano. The volcanoes used to compare to Mt. Ngauruhoe are Paricutin
Volcano in Mexico, Mayon Volcano in the Philippines and Arenal Volcano in Costa Rica.
These volcanoes are similar in composition and size, and are all younger than c. 25,000
years.
3.2 Paricutin Volcano
Paricutin is an andesite stratovolcano located in the state of Michoacán, Mexico. Paricutin
was born in 1943 with intensely explosive emission of magma during the first year of
activity. Paricutin is situated in the monogenetic Michoacán-Guanajuato volcanic field,
which contains more than 1,000 volcanoes as well as flood basalts (Pioli et al. 2008). The
normal eruptive style of Paricutin was strombolian, however effusive activity from the base
of the volcano also occurred frequently. Eruptions declined in explosivity and volume from
birth until 1952, when activity ceased (Bullard 1962, Pioli et al. 2008).
3.2.1 Initial Observations at Paricutin
Paricutin Volcano was the first volcanic eruption to be witnessed by humans in the
Michoacán area of Mexico. Events were recorded by locals as well as at least two scientists,
who collated descriptions from the local farmers. The first signs of eruption occurred on 5
February, 1943, with a series of earthquakes which increased in number and intensity until
the start of eruption on the morning of 20 February. The initial activity was witnessed by
four farmers in the area, who noticed a small fissure extending across a paddock. The fissure
began emitting sparks and smoke, and the surrounding ground swelled upwards by two
metres. Blocks were initially thrown to a height of around five metres, until the early
evening when the volcano started erupting larger bombs and blocks which could be seen
several kilometres away in Parangaricutiro. During the night of 20 February, large
incandescent bombs were ejected from the volcano and a large ash column was produced.
By the morning of 21 February, the volcano had grown to around 10 m high and continued

14
emitting rocks and ash. By midday the ejection of bombs and ash was significant enough to
have grown the cone to 50 m high. The first lava flow was emitted on 21 February and was
sourced from the base of the cone, flowing at approximately 5 m per hour (Bullard 1962).
3.2.2 Continuation of Activity
By the end of the first week of the eruption, Paricutin had grown to over 140 m high. The
noise of explosions could be heard 350 km away, and material was frequently ejected to
over 1,000 m above the vent. Eruptions were normally strombolian in style, however
hawaiian-style eruptions also occurred. Alternating lava flows, pyroclastic activity and ash
columns built the cone to 325 m above ground level by the end of the first year of activity. It
was during the first year that cone building was at its greatest. Following the first year, the
effusion of lava was the dominant process. Paricutin grew only 73 m in the following 6 years
(Bullard 1962).
During the second year of eruption the main activity was from bocas, which are lava flows
sourced from the base of the crater. By the end of 1944 the general outline of the Paricutin
lava field had been defined. A large parasitic cone developed in 1943, quickly growing to
over 100 m in height. Subsequent flows were deposited on top of existing material, but the
lateral extent of deposits did not increase (Bullard 1962). Total energy of the Paricutin
eruption declined each year (Figure 6).
3.2.3 End of Eruptive Activity
The final activity from Paricutin came suddenly, rather than a more gradual decline as may
have been expected. During the evening of 22 February 1952 a lava flow on the north-
eastern side of the volcano slowed, and by 25 February 1952 it had stopped completely. The
last day of continuous eruptive activity from the vent was 24 February 1952, when large
quantities of ash were deposited from the volcano. During the night of 24 February 1952,
the deposition of ash stopped. Several intense explosions the next day occurred, and
smaller eruptions until March occurred until 4 March 1952 when activity ceased entirely,
nine years and twelve days after the first activity was observed (Bullard 1962).

15
3.2.4 Characteristics of Paricutin Volcano
Lavas from Paricutin Volcano are similar to those from Mt. Ngauruhoe, consisting mainly of
andesites. The 1943 lavas are classed as olivine-bearing andesites and have an SiO2 content
of approximately 55 wt%. They contain phenocrysts of olivine and plagioclase feldspar
within a fine groundmass. As the eruption progressed, the SiO2 content increased to
approximately 60 wt% for the 1952 lavas. The later lavas contain fewer olivine phenocrysts
and no plagioclase feldspar phenocrysts, and are classed as orthopyroxene andesites
(Bullard 1962). This change is believed to be due to a combination of crystal fractionation
and assimilation of the country rock by the original melt (Scandone 1979).
The age of Paricutin is accurately known, as it relies on direct human observation rather
than the dating of material. Paricutin was born on 20 February 1943 and its eruptive period
ended on 24 February 1952. The total volume of Paricutin is around 1.3 km3.This means the
long term growth rate of Paricutin is approximately 0.14 km3 y-1 (Yokoyama and de la Cruz-
Reyna 1990).
Figure 6: Total energy of the Paricutin volcano, showing a decline in energy over time (y-axis
measured in ‘ergs’ – one erg is equivalent to 10-7 Joules) (Scandone 1979).

16
3.2.5 Summary of Paricutin Volcano and Comparison with Mt. Ngauruhoe
Paricutin Volcano appears to show similar characteristics to Mt. Ngauruhoe, however
following the first year of activity, the effusion of lava was the dominant process. Mt.
Ngauruhoe has emitted both effusive material and explosive material since historic records
began, and it is likely that both eruptive styles also occurred in prehistoric times. The total
energy released from Paricutin Volcano decreased over time, rather than remaining similar.
Paricutin Volcano is unusual in that it had an extremely short life of nine years, after which
no further volcanic activity has occurred. Mt. Ngauruhoe has been active over a much
longer period of time, making it significantly different to Paricutin Volcano.
3.3 Mayon Volcano
Mayon Volcano is an active andesite volcano, located in the Bicol volcanic chain which is
formed through subduction associated with the Philippine Trench (Ramos-Villarta et al.
1985). Mayon Volcano has a summit elevation of 2,462 m above sea level, and covers an
area of 314.1 km2. Lavas erupted from Mayon Volcano are typically basalt to olivine-bearing
pyroxene andesite, ranging from strombolian to plinian in style (Philippine Institute of
Volcanology and Seismology 2011).
3.3.1 Eruptive History
The first recorded eruption from Mayon Volcano occurred in February 1616, with the
production of pyroclastic flows, lava flows and ash fall, as well as associated lahars. Around
150 years passed until the next eruption was recorded. In 1766 a series of vulcanian
eruptions, lava flows, pyroclastic flows and ash falls were emitted from Mayon Volcano.
Heavy rain followed these eruptions, causing lahars which damaged six small townships as
well as causing 39 fatalities. In 1800 and 1811 further vulcanian eruptions, lava flows,
pyroclastic flows and ash falls occurred. The largest historical eruption from Mayon Volcano
occurred in 1814, causing up to 1,200 deaths. This was plinian in style, and had associated
pyroclastic flows, volcanic lightning, bombs and blocks (Ramos-Villarta et al. 1985).
Between the years 1827 and 2006, vulcanian eruptions, pyroclastic flows and ash fall were
produced on average every three to four years, with a maximum gap between events of 26
years. No activity was recorded from 1902 until 1928, when another vulcanian eruption with

17
associated pyroclastic flows, lava flows and ash fall occurred. This was followed by a ten
year gap until 1938, after which regular eruptions every three to four years recommenced
(Philippine Institute of Volcanology and Seismology 2011).
The most recent eruption from Mayon ceased on the first of January 2010, and little activity
has been observed since (Philippine Institute of Volcanology and Seismology 2011).
3.3.2 Summary of Mayon Volcano and Comparison with Mt. Ngauruhoe
Mayon Volcano is c. 25,000 years old, so is significantly older than Mt. Ngauruhoe. Despite
this, eruption styles and sequences are similar to Mt. Ngauruhoe, with vulcanian eruptions
occurring on average every three to four years. This gives an indication that Mt. Ngauruhoe
may follow a similar trend to Mayon Volcano over the next several thousand years.
3.4 Arenal Volcano
Arenal Volcano is the youngest volcano in the Tilarán Ranges, which are located in the
volcanic arc of Costa Rica. Arenal Volcano is an active andesite stratovolcano which has an
elevation of 1,680 m above sea level. The slopes of Arenal Volcano consist of blocky lava
fields of basaltic andesites (Soto et al. 2006). Arenal Volcano has been continuously
erupting lava for more than 37 years, making it the longest running lava eruption on Earth at
present (Gill J et al. 2006). During its c. 7,000 year history, there have been four plinian,
eight subplinian, seven violent strombolian and two vulcanian eruptions recognised in the
tephra sequence, with many others too small to be apparent. Tephra volumes of up to 0.44
km3 per event have been recognised from these deposits (Soto et al. 2006).
3.4.1 Eruptive History
Arenal Volcano has produced four plinian eruptions which have been recognised in the
tephra sequence. These were c. 3,200 BP, 2,120 BP, 1,300 BP and 550 BP. Between each of
these events, eruptions large enough to be preserved in the tephra sequence occurred on
average every 300 years. Minor events almost certainly occurred between the larger
eruptions (Soto et al. 2006).

18
3.4.2 Summary of Arenal Volcano and Comparison with Mt. Ngauruhoe
Arenal Volcano has been active for c. 7,000 years, which is similar to the age of Mt.
Ngauruhoe. Arenal Volcano has had several plinian eruptions which have been recorded in
the tephra sequence. This may have also occurred at Mt. Ngauruhoe, but due to poorly
exposed deposits these cannot be seen.

19
Chapter Four – Modelling Using Tephra2
4.1 Tephra2
Modelling of two eruption scenarios has been carried out using data collected both from
past eruptions at Mt. Ngauruhoe, and from a general literature review. Modelling was
carried out using Tephra2, which is a computer program that uses an advection-diffusion
model to calculate the dispersal of tephra across an area, under a particular set of
conditions. This uses a deterministic approach to investigate how a given scenario will
impact the surrounding area. Tephra2 has been used to model two eruption scenarios; the
most likely eruption and the maximum plausible eruption.
4.2 Tephra2 Calculations
Tephra2 was designed to allow modelling of tephra accumulation around a volcano based
on a set of eruption parameters. Tephra2 uses an advection-diffusion model, which
describes the solution of the equations of particle diffusion, transport and sedimentation,
and can estimate tephra accumulation relative to the source vent. The numerical simulation
of tephra accumulation is based on an advection – diffusion equation (Suzuki 1983, Connor
et al. 2001), which is expressed by a simplified mass-conservation equation:
Where x, y and z are spatial coordinates expressed in metres (downwind, crosswind and
vertical respectively); Cj is the mass concentration of particles (kgm-3) of a given particle size
class, j; wx and wy are the x and y components of the wind velocity (ms-1) and vertical wind
velocity is assumed to be negligible; K is a horizontal diffusion coefficient for tephra in the
atmosphere (m2s-1); vt,j is the terminal settling velocity (ms-1) for particles of size class j, as
these particles fall through a level in the atmosphere; is the change in particle
concentration at the source with time, t (kg m-3 s-1). The algorithm implemented in Tephra2
assumes negligible vertical wind velocity and diffusion, and assumes a constant and
isotropic horizontal diffusion coefficient (K = Kx = Ky). The terminal settling velocity, v, is
calculated for each particle size, j, at each atmospheric level, l, as a function of the particle’s
Reynolds number, which varies with atmospheric density. Wind velocity is allowed to vary

20
as a function of height in the atmosphere, but it is assumed to remain constant within each
specific atmospheric level.
Tephra2 allows mass accumulation, M (kg m-2), at each location (x, y) surrounding the
source vent to be calculated;
( ) ∑ ∑
( )
Where ml,j (x, y) is the mass fraction of the particle size, j, released from atmospheric level, l,
accumulated at location, (x, y). Hmax is the maximum height of the erupting column, and dmin
and dmax are, respectively, the minimum and maximum particle diameters. This means the
distribution of tephra mass following an eruption depends on both the distribution of mass
in the eruption column and the distribution of mass by grain size. The algorithm used in
Tephra2 assumes that mass is uniformly distributed in the eruption column, or can be
specified to be uniformly distributed in some fraction of the uppermost column, to be
consistent with observations of past volcanic plumes. Grain size distribution is assumed to
be log-normal, and is deduced from comparison with studies of well-preserved past deposits
(Connor et al. 2001).
4.3 Simplifying Assumptions
Several assumptions are made during modelling with Tephra2. These include particle size
distribution, near-vent processes, mixing of the plume and layering of the atmosphere.
4.3.1 Particle Size Distribution
Many volcanic deposits show a bimodal rather than Gaussian distribution of particle sizes,
however these distributions are often characterised by a dominant peak, with a much
smaller secondary maximum. Although distributions are often bimodal, the dominant peak
of grain size fits a Gaussian distribution, making the use of Gaussian distribution in the
Tephra2 model adequate (Connor et al. 2001). Particle sizes in deposits from Mt. Ngauruhoe
also show bimodal distribution, with a dominant peak which fits a Gaussian distribution
(Moebis 2010).

21
4.3.2 Near-Vent Processes
Tephra2 does not account for near-vent processes such as pyroclastic flows, meaning it
cannot accurately predict tephra deposition in areas close to the vent. Results from the
current version of Tephra2 have been compared with deposits from Cerro Negro Volcano, in
Nicaragua, showing that Tephra2 significantly underestimates tephra accumulation on the
flanks of the volcano (Connor et al. 2001).
4.3.3 Well-Mixed Plume
The Tephra2 model assumes all particle sizes are evenly spread throughout the entire
plume. It is more likely that larger particles fall out of the plume at lower elevations, and
smaller particles at higher elevations. This assumption is made in order to simplify the
mathematics of the model. Additionally, it is not known exactly how tephra is dispersed
within the plume, so the use of a different model may prove to be inaccurate. The current
version of Tephra2 has been shown to accurately display the distribution of tephra on the
ground, suggesting that the majority of each deposit is not sensitive to the mass distribution
of tephra in the plume. This assumption is allowed because the model compares well with
actual deposits (Connor et al. 2001).
4.3.4 Layered Atmosphere
Tephra2 divides the atmosphere into horizontal layers, which each have uniform wind speed
and direction. The real atmosphere consists of updrafts, downdrafts and eddies which
change over time. The approximation of the atmosphere as static and of constant value
within each horizontal layer simplifies the model and works well for smaller eruptions that
do not spread out over larger areas or last for prolonged periods of time. Larger eruptions,
or those which occur during highly variable weather conditions are likely to be poorly
modelled, with an inaccurate prediction of tephra dispersal on the ground (Connor et al.
2001).
4.4 Input Parameters for modelling using Tephra2
The input parameters for Tephra2 fall into two main categories; eruption parameters and
particle parameters. Atmospheric conditions at the time of eruption are also required.
22
These include the eddy constant of the Earth’s atmosphere, which is 0.04 (Courtland 2011),
as well as wind speed and direction.
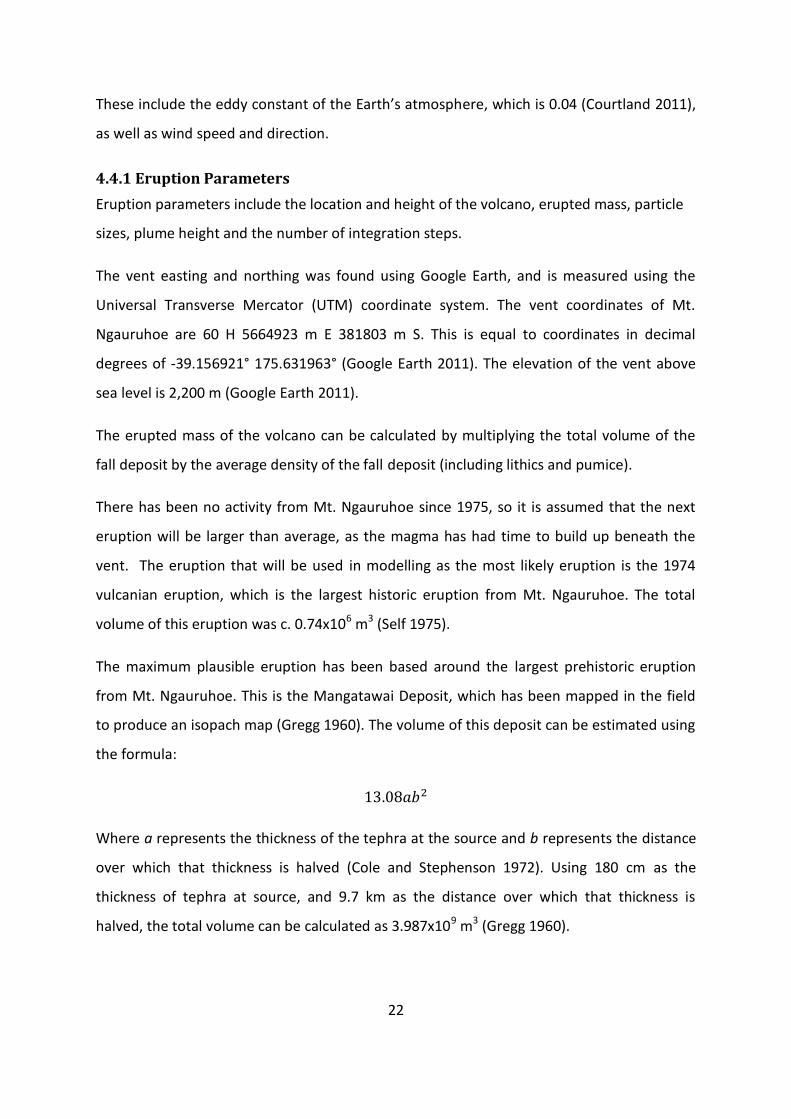
4.4.1 Eruption Parameters
Eruption parameters include the location and height of the volcano, erupted mass, particle
sizes, plume height and the number of integration steps.
The vent easting and northing was found using Google Earth, and is measured using the
Universal Transverse Mercator (UTM) coordinate system. The vent coordinates of Mt.
Ngauruhoe are 60 H 5664923 m E 381803 m S. This is equal to coordinates in decimal
degrees of -39.156921° 175.631963° (Google Earth 2011). The elevation of the vent above
sea level is 2,200 m (Google Earth 2011).
The erupted mass of the volcano can be calculated by multiplying the total volume of the
fall deposit by the average density of the fall deposit (including lithics and pumice).
There has been no activity from Mt. Ngauruhoe since 1975, so it is assumed that the next
eruption will be larger than average, as the magma has had time to build up beneath the
vent. The eruption that will be used in modelling as the most likely eruption is the 1974
vulcanian eruption, which is the largest historic eruption from Mt. Ngauruhoe. The total
volume of this eruption was c. 0.74x10⁶ m3 (Self 1975).
The maximum plausible eruption has been based around the largest prehistoric eruption
from Mt. Ngauruhoe. This is the Mangatawai Deposit, which has been mapped in the field
to produce an isopach map (Gregg 1960). The volume of this deposit can be estimated using
the formula:
Where a represents the thickness of the tephra at the source and b represents the distance
over which that thickness is halved (Cole and Stephenson 1972). Using 180 cm as the
thickness of tephra at source, and 9.7 km as the distance over which that thickness is
halved, the total volume can be calculated as 3.987x10⁹ m3 (Gregg 1960).

23
The average density of a fresh fall deposit from Mt. Ngauruhoe was calculated for the 1974
vulcanian eruption (Self 1975). One other density was found from literature review,
however this was for the pyroclastic flow which occurred during the 1975 eruption, which is
not included in the modelling carried out using Tephra2 (Nairn and Self 1978). The average
density of the 1974 tephra deposit was calculated to be 1.5 g/cm3, or 1,500 kg/m3. This
takes into account the different densities of each component of the deposit, including
lithics, vitrics and crystals (Self 1975).
Using the densities and volumes above, the erupted mass can be calculated. For the smaller
Mt. Ngauruhoe event, this is calculated as (0.74x10⁶ m3) x (1,500 kg/m3), giving an erupted
mass of 1.11x10⁹ kg. For the maximum plausible eruption from Mt. Ngauruhoe, this is
calculated as (3.987x10⁹ m3) x (1,500 kg/m3), giving an erupted mass of 5.98x10¹² kg.
Particle sizes for airfall from previous Mt. Ngauruhoe eruptions range from c. 6 mm
diameter (-2.5 ) to c. 7.8x103 mm (7 ), with a median diameter of c. 0.5 mm (1 ) (Moebis
2010). These values give a standard deviation of c. 3.3 mm (-1.66 ).
The maximum plume height from historic eruptions at Mt. Ngauruhoe is c. 7,000 m, which
occurred during the 1975 eruption (Hobden et al. 2002). The maximum plausible plume
height from an eruption at Mt. Ngauruhoe is 25,000 m. This was calculated using averages
for the estimated volume from the maximum plausible eruption, which correspond to
plume heights listed in the volcanic explosivity index (Newhall and Self 1982).
The number of integration steps for both the most likely eruption and the maximum
plausible eruption is 100. This gives an accurate dispersal of tephra for the given
parameters. A higher number of integration steps will give more accurate results, however
this is unnecessary as the input parameters are not precise (Connor et al. 2011).
4.4.2 Particle Parameters
Particle parameters include the fall time threshold, diffusion coefficient, lithic and pumice
densities, the number of integration steps, plume dispersal model and the plume ratio.
The fall time threshold is the maximum time allowed for particles to land. If particles have
not landed by this time, Tephra2 will stop calculations, meaning subsequent particles will

24
not be added to the accumulated mass of tephra on the ground. It is assumed that the
majority of tephra from a single eruption will have fallen to the ground within 24 hours of
that eruption, so a value of 100,000 seconds (c. 27 hours) is used (Connor et al. 2011).
The diffusion coefficient describes the advection and diffusion of particles through the
atmosphere. This parameter has little effect on the resultant tephra dispersal map. A larger
value allows for variations in the eruption column over time, as well as atmospheric
variations that occur during the time the eruption is occurring. The most likely eruption
from Mt. Ngauruhoe will occur over a short period of time, so the diffusion coefficient will
be 500. The maximum plausible eruption from Mt. Ngauruhoe will occur over a longer
period of time, giving a larger diffusion coefficient of 2,000 (Courtland 2011).
Lithic and pumice densities are taken from deposits of past eruptions at Mt. Ngauruhoe. The
density of lithics is c. 2,700 kg/m3 (Self 1975), and the density of pumice is c. 950 kg/m3
(Nairn et al. 1978) for the most likely eruption scenario. Larger, more explosive eruptions
often have a higher vesicle content, so the density of lithics will decrease to c. 2,500 kg/m3
(Nairn and Self 1978). The density of pumice for the maximum plausible eruption will
remain at c. 950 kg/m3.
The plume dispersal model for both the most likely eruption and the maximum plausible
eruption is zero. This assumes the plume is well mixed, meaning that particles of all sizes are
released from all points of the eruption column (Connor et al. 2011).
The plume ratio describes the minimum particle fallout height during the eruption. A value
of 0 indicates that particles are released from the entire eruption column, while a value of
0.9 indicates that particles are released from the upper 10% of the eruption column (Connor
et al. 2011). Plinian columns often contain umbrella regions, meaning the majority of mass
is released from the upper 10% of the column (Courtland 2011). Smaller columns, such as
those present during historic Mt. Ngauruhoe eruptions, do not contain umbrella regions.
This means the mass is released from the entire column, giving a lower plume ratio.
The maximum plausible eruption and the most likely eruption are unlikely to contain a
significant umbrella region, meaning particles will be released from the majority of the
column. This gives a plume ratio for both scenarios of 0.1 (Courtland 2011).
25
4.5 Weather Patterns Above the Central North Island
Wind direction and velocity are two of the most important factors to consider when
modelling volcanic plumes, as they can significantly alter the distribution of tephra across a
landscape (Carey and Bursik 1999).
Input Parameters for Tephra2 Modelling
Most likely eruption Maximum plausible eruption
Plume height (m) 7,000 m (Hobden et al. 2002) 25,000 m (Newhall and Self 1982)
Eruption mass (kg) 1.11x10⁹ kg (Self 1975) 5.98x10¹² kg (Gregg 1960)
Max grainsize ( ) -2.5 (Moebis 2010) -2.5 (Moebis 2010)
Min grainsize ( ) 7 (Moebis 2010) 7 (Moebis 2010)
Median grainsize ( ) 1 (Moebis 2010) 1 (Moebis 2010)
STD grainsize ( ) -1.66 (Moebis 2010) -1.66 (Moebis 2010)
Vent easting (UTM) 381803 (Google Earth 2011) 381803 (Google Earth 2011)
Vent northing (UTM) 5664923 (Google Earth 2011) 5664923 (Google Earth 2011)
Vent elevation (masl) 2,200 (Google Earth 2011) 2,200 (Google Earth 2011)
Eddy constant 0.04 (Connor et al. 2011) 0.04 (Connor et al. 2011)
Diffusion coefficient (m2/s) 500 (Courtland 2011) 2,000 (Courtland 2011)
Fall time threshold (s) 100,000 (Connor et al. 2011) 100,000 (Connor et al. 2011)
Lithic density (kg/m3) 2,700 kg/m3 (Self 1975) 2,500 kg/m3 (Self 1975)
Pumice density (kg/m3) 950 kg/m3 (Nairn et al. 1978) 950 kg/m3 (Nairn et al. 1978)
Column steps 100 (Connor et al. 2011) 100 (Connor et al. 2011)
Plume model 0 (Connor et al. 2011) 0 (Connor et al. 2011)
Plume ratio 0.1 (Courtland 2011) 0.1 (Courtland 2011)
Table 1: Input parameters for most likely eruption and maximum plausible eruption for
modelling using Tephra2.
26
Climate data in New Zealand is accessed through the NIWA CLIFLO system, which maintains
the New Zealand National Climate Database. This contains climate records taken throughout
the country and can be accessed, at no cost, online (CLIFLO 2011). Wind data over the
central North Island is collected using three different methods; forecasting, surface wind
observations and upper air observations.
Forecasting is carried out by the New Zealand MetService by using daily radiosonde readings
taken between 20 March 2000 and 20 March 2003 at the windrun forecast location sites
(Figure 7). This creates windrun files, which are text files containing over 9,000 pairs of
modelled data each. In the central North Island these files are available at six locations; Mt
Ruapehu, New Plymouth, Okataina, Taupo, Whenuapai and White Island.
Legend NIWA CLIFLO Upper Air Stations
NZ Volcanoes
Windrun Forecast Locations
Hamilton Airport Radiosonde
Rotorua Airport
Kaitaia Observatory
Kaikohe
Whangarei
Auckland North Whenuapai
Mt Tamahunga
Auckland Field Auckland South
Hamilton White Island
Mayor Island
Rotorua
Paraparaumu
Taupo
Ohakea
New Plymouth
Taranaki Ruapehu
Ngauruhoe Tongariro
Wellington Nelson
Gisborne
Figure 7: Locations of North Island volcanoes, as well as selected NIWA climate data observation sites.
Okataina
27
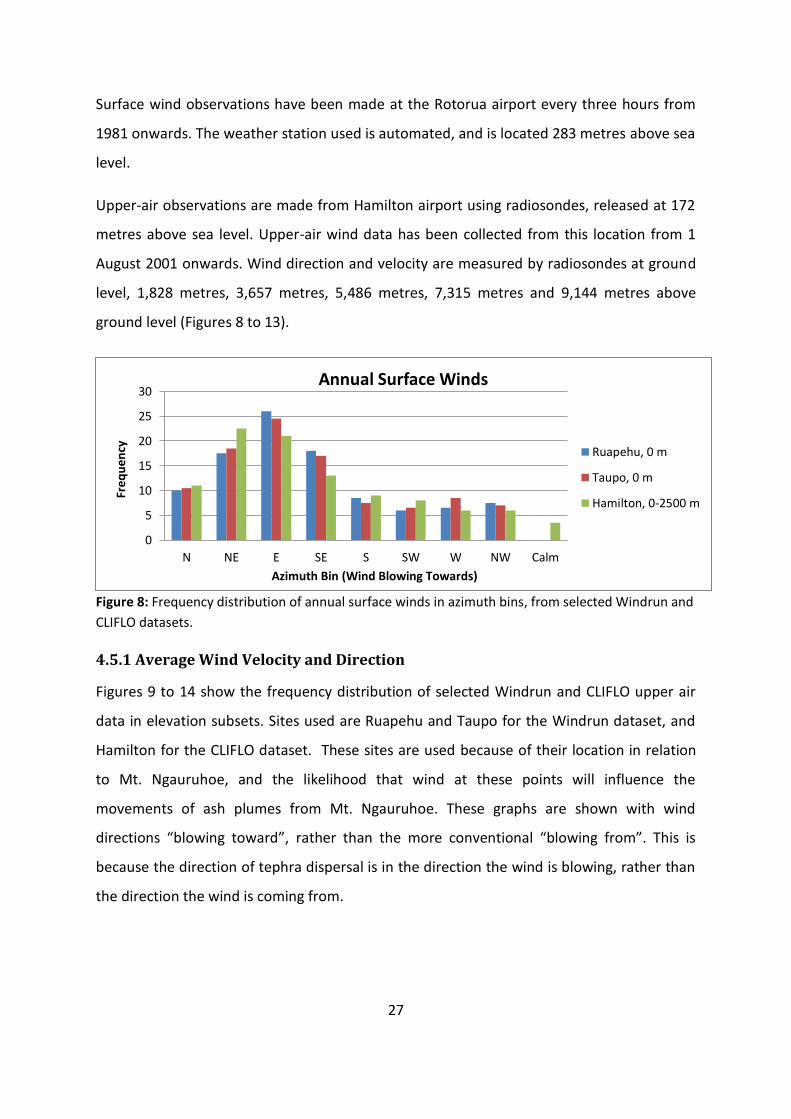
Surface wind observations have been made at the Rotorua airport every three hours from
1981 onwards. The weather station used is automated, and is located 283 metres above sea
level.
Upper-air observations are made from Hamilton airport using radiosondes, released at 172
metres above sea level. Upper-air wind data has been collected from this location from 1
August 2001 onwards. Wind direction and velocity are measured by radiosondes at ground
level, 1,828 metres, 3,657 metres, 5,486 metres, 7,315 metres and 9,144 metres above
ground level (Figures 8 to 13).
Figure 8: Frequency distribution of annual surface winds in azimuth bins, from selected Windrun and
CLIFLO datasets.
4.5.1 Average Wind Velocity and Direction
Figures 9 to 14 show the frequency distribution of selected Windrun and CLIFLO upper air
data in elevation subsets. Sites used are Ruapehu and Taupo for the Windrun dataset, and
Hamilton for the CLIFLO dataset. These sites are used because of their location in relation
to Mt. Ngauruhoe, and the likelihood that wind at these points will influence the
movements of ash plumes from Mt. Ngauruhoe. These graphs are shown with wind
directions “blowing toward”, rather than the more conventional “blowing from”. This is
because the direction of tephra dispersal is in the direction the wind is blowing, rather than
the direction the wind is coming from.
0
5
10
15
20
25
30
N NE E SE S SW W NW Calm
Freq
uen
cy
Azimuth Bin (Wind Blowing Towards)
Annual Surface Winds
Ruapehu, 0 m
Taupo, 0 m
Hamilton, 0-2500 m

28
Figure 9: Frequency distribution of annual winds at approximately 2,000 m in height in azimuth bins, from selected Windrun and CLIFLO datasets.
Figure 10: Frequency distribution of annual winds at approximately 4,000 m in height in azimuth bins, from selected Windrun and CLIFLO datasets.
Figure 11: Frequency distribution of annual winds at approximately 5,500 m in height in azimuth
bins, from selected Windrun and CLIFLO datasets.
0
5
10
15
20
25
30
35
N NE E SE S SW W NW Calm
Freq
uen
cy
Azimuth Bin (Wind Blowing Towards)
Annual ~2,000 m Winds
Ruapehu, 1828 m
Taupo, 1828 m
Hamilton, 2501-5000 m
0
5
10
15
20
25
30
35
N NE E SE S SW W NW Calm
Freq
uen
cy
Azimuth Bin (Wind Blowing Towards)
Annual ~4,000 m Winds
Ruapehu, 3657 m
Taupo, 3657 m
Hamilton, 2501-5000 m
0
10
20
30
40
N NE E SE S SW W NW Calm
Freq
uen
cy
Azimuth Bin (Wind Blowing Towards)
Annual ~5,500 m Winds
Ruapehu, 5486 m
Taupo, 5486 m
Hamilton, 5001-7500 m

29
Figure 12: Frequency distribution of annual winds at approximately 7,000 m in height in azimuth
bins, from selected Windrun and CLIFLO datasets.
Figure 13: Frequency distributions of annual winds at above 9,000 m in height in azimuth bins, from
selected Windrun and CLIFLO datasets.
The wind values from figures 8 to 13 were averaged, producing a series of resultant vector
(RV) values. These represent the vector mean direction the wind is blowing towards within
each dataset. The RV value gives the direction that has the greatest likelihood at any one
time during the year. This also gives the direction that tephra is most likely to be carried
towards (see Figure 14). The Hamilton CLIFLO site values were adjusted because the
elevation of the measuring location is different to that of the Windrun sites. This simplifies
the process of creating an average value at each height for the three sites.
0
5
10
15
20
25
30
35
40
N NE E SE S SW W NW Calm
Freq
uen
cy
Azimuth Bin (Wind Blowing Towards)
Annual ~7,000 m Winds
Ruapehu, 7315 m
Taupo, 7315 m
Hamilton, 7501-10000 m
0
10
20
30
40
50
N NE E SE S SW W NW Calm
Freq
uen
cy
Azimuth Bin (Wind Blowing Towards)
Annual >9,000 m Winds
Ruapehu, 9144 m
Taupo, 9144 m
Hamilton, 7501 - 10000 m

30
Figure 14: Annual resultant vector values versus elevation for the three observation sites most
relevant to Mt. Ngauruhoe (Ruapehu, Taupo and Hamilton CLIFLO), as well as the average of these
three sites.
Wind speed varies with elevation above ground level (figure 15). These values were
calculated using two selected windrun datasets (Ruapehu and Taupo) as well as the
Hamilton CLIFLO dataset. Although values from the Hamilton CLIFLO dataset vary
significantly from both the Ruapehu and Taupo Windrun sites, they are retained in the
graphs and calculations. The Hamilton CLIFLO dataset is important because it involves the
physical collection of data. Sites at Ruapehu and Taupo use forecasts, which decrease the
accuracy of the data (CLIFLO 2011).
Figure 15: Annual average wind speed versus elevation for the three observation sites most relevant
to Mt. Ngauruhoe (Ruapehu, Taupo and Hamilton CLIFLO) as well as the average of these three sites.
0100020003000400050006000700080009000
10000
45 67.5 90 112.5 135
Elev
atio
n (
m)
RV Azimuth (Wind Blowing Towards)
Annual Resultant Vector Values
Ruapehu
Taupo
Hamilton adjusted
Average of three sites
0100020003000400050006000700080009000
10000
0 5 10 15 20 25
Elev
atio
n (
m)
Wind speed (ms-1)
Annual Average Wind Speed vs Elevation
Ruapehu
Taupo
Hamilton adjusted
Average of three sites
31
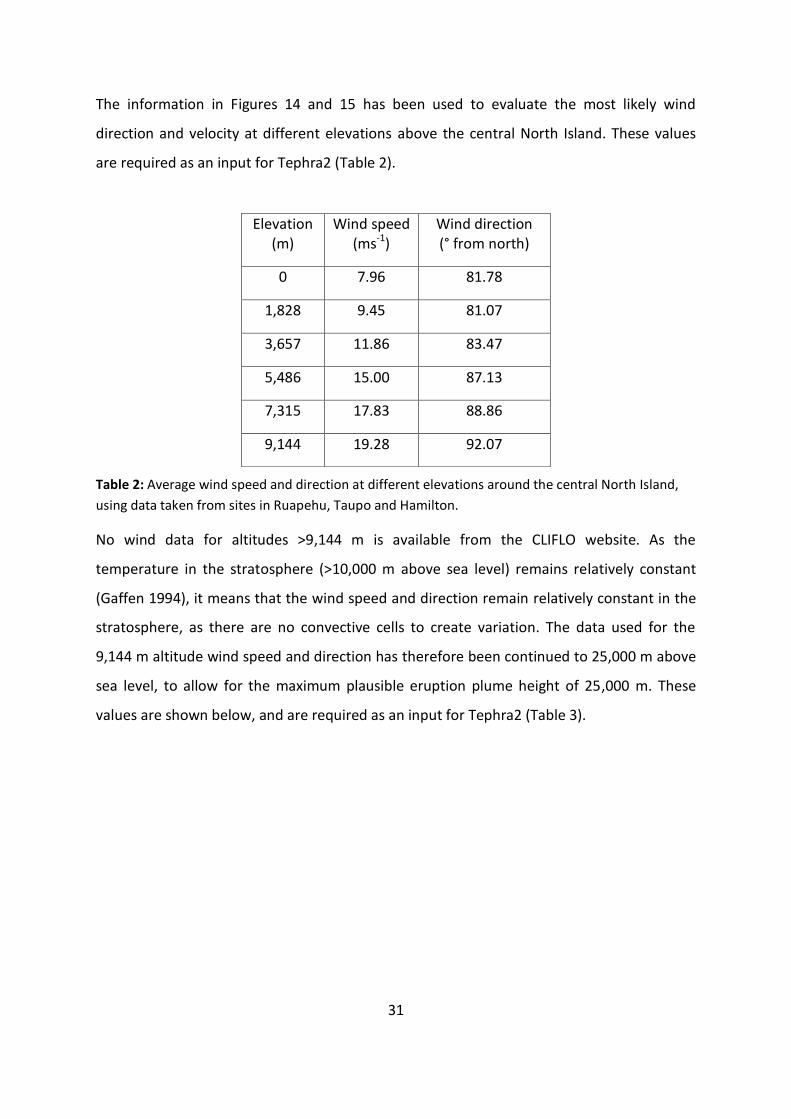
The information in Figures 14 and 15 has been used to evaluate the most likely wind
direction and velocity at different elevations above the central North Island. These values
are required as an input for Tephra2 (Table 2).
Table 2: Average wind speed and direction at different elevations around the central North Island,
using data taken from sites in Ruapehu, Taupo and Hamilton.
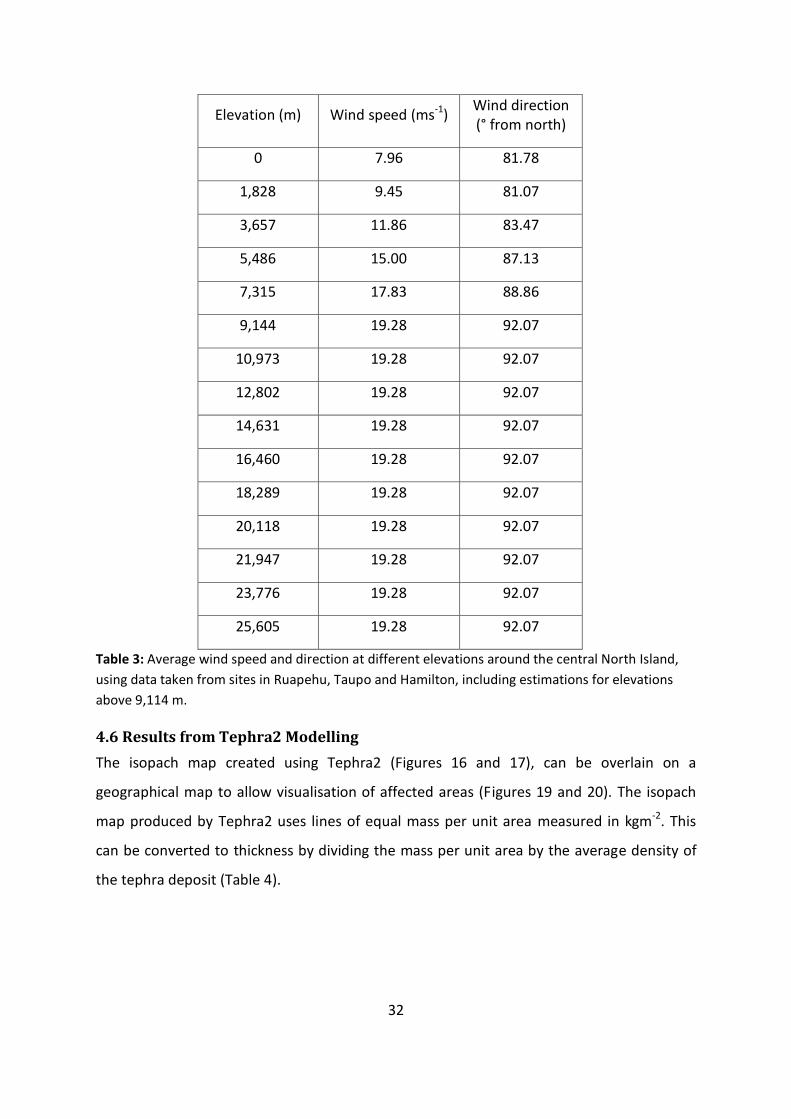
No wind data for altitudes >9,144 m is available from the CLIFLO website. As the
temperature in the stratosphere (>10,000 m above sea level) remains relatively constant
(Gaffen 1994), it means that the wind speed and direction remain relatively constant in the
stratosphere, as there are no convective cells to create variation. The data used for the
9,144 m altitude wind speed and direction has therefore been continued to 25,000 m above
sea level, to allow for the maximum plausible eruption plume height of 25,000 m. These
values are shown below, and are required as an input for Tephra2 (Table 3).
Elevation (m)
Wind speed (ms-1)
Wind direction (° from north)
0 7.96 81.78
1,828 9.45 81.07
3,657 11.86 83.47
5,486 15.00 87.13
7,315 17.83 88.86
9,144 19.28 92.07
32
Elevation (m) Wind speed (ms-1) Wind direction (° from north)
0 7.96 81.78
1,828 9.45 81.07
3,657 11.86 83.47
5,486 15.00 87.13
7,315 17.83 88.86
9,144 19.28 92.07
10,973 19.28 92.07
12,802 19.28 92.07
14,631 19.28 92.07
16,460 19.28 92.07
18,289 19.28 92.07
20,118 19.28 92.07
21,947 19.28 92.07
23,776 19.28 92.07
25,605 19.28 92.07
Table 3: Average wind speed and direction at different elevations around the central North Island,
using data taken from sites in Ruapehu, Taupo and Hamilton, including estimations for elevations
above 9,114 m.
4.6 Results from Tephra2 Modelling
The isopach map created using Tephra2 (Figures 16 and 17), can be overlain on a
geographical map to allow visualisation of affected areas (Figures 19 and 20). The isopach
map produced by Tephra2 uses lines of equal mass per unit area measured in kgm-2. This
can be converted to thickness by dividing the mass per unit area by the average density of
the tephra deposit (Table 4).

33
Tephra mass per unit area
Average tephra density
Tephra thickness
1 kgm-2 1,500 kgm-3 6.6x10⁻⁴ m (0.66 mm)
10 kgm-2 1,500 kgm-3 6.6x10⁻³ m (6.6 mm)
100 kgm-2 1,500 kgm-3 0.066 m (6.6 cm)
1,000 kgm-2 1,500 kgm-3 0.66 m (66 cm)
Table 4: Conversion between mass per unit area of tephra and tephra thickness, using an average
tephra density of 1,500 kgm-3.
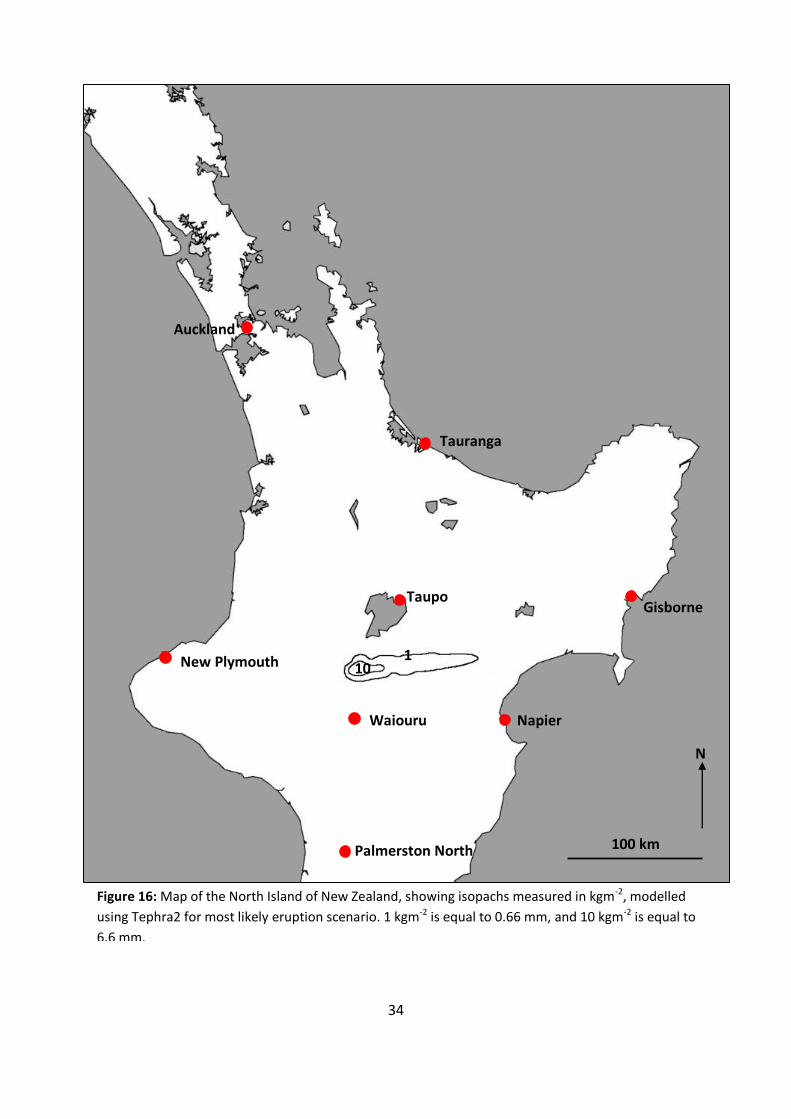
34
10 1
Figure 16: Map of the North Island of New Zealand, showing isopachs measured in kgm-2, modelled
using Tephra2 for most likely eruption scenario. 1 kgm-2 is equal to 0.66 mm, and 10 kgm-2 is equal to
6.6 mm.
100 km
N
Auckland
New Plymouth
Tauranga
Gisborne
Palmerston North
Napier
Taupo
Waiouru

35
Figure 17: Map of the North Island of New Zealand, showing isopachs measured in kgm-2, modelled
using Tephra2 for maximum plausible eruption. 1 kgm-2 is equal to 0.66 mm, 10 kgm-2 is equal to 6.6
mm, 100 kgm-2 is equal to 6.6 cm and 1,000 kgm-2 is equal to 66.6 cm.
100 km
N
Auckland
New Plymouth
Tauranga
Gisborne
Palmerston North
Napier
Taupo
1 10
100
1000
Waiouru
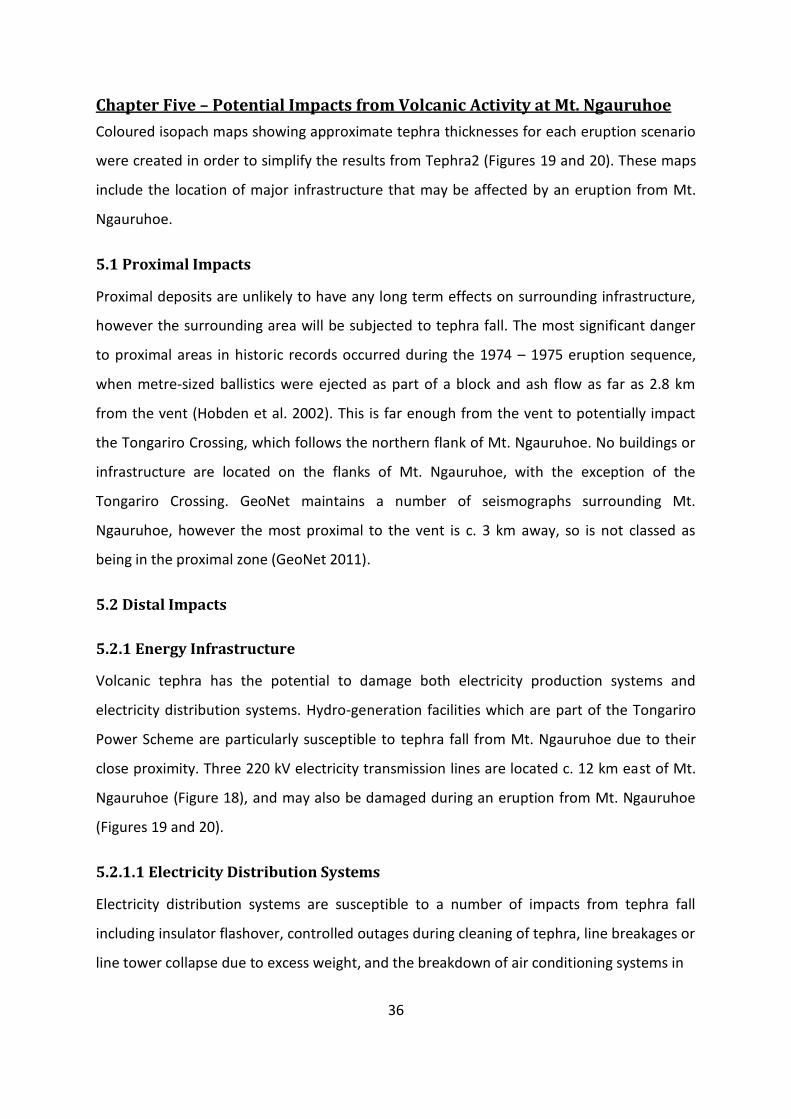
36
Chapter Five – Potential Impacts from Volcanic Activity at Mt. Ngauruhoe
Coloured isopach maps showing approximate tephra thicknesses for each eruption scenario
were created in order to simplify the results from Tephra2 (Figures 19 and 20). These maps
include the location of major infrastructure that may be affected by an eruption from Mt.
Ngauruhoe.
5.1 Proximal Impacts
Proximal deposits are unlikely to have any long term effects on surrounding infrastructure,
however the surrounding area will be subjected to tephra fall. The most significant danger
to proximal areas in historic records occurred during the 1974 – 1975 eruption sequence,
when metre-sized ballistics were ejected as part of a block and ash flow as far as 2.8 km
from the vent (Hobden et al. 2002). This is far enough from the vent to potentially impact
the Tongariro Crossing, which follows the northern flank of Mt. Ngauruhoe. No buildings or
infrastructure are located on the flanks of Mt. Ngauruhoe, with the exception of the
Tongariro Crossing. GeoNet maintains a number of seismographs surrounding Mt.
Ngauruhoe, however the most proximal to the vent is c. 3 km away, so is not classed as
being in the proximal zone (GeoNet 2011).
5.2 Distal Impacts
5.2.1 Energy Infrastructure
Volcanic tephra has the potential to damage both electricity production systems and
electricity distribution systems. Hydro-generation facilities which are part of the Tongariro
Power Scheme are particularly susceptible to tephra fall from Mt. Ngauruhoe due to their
close proximity. Three 220 kV electricity transmission lines are located c. 12 km east of Mt.
Ngauruhoe (Figure 18), and may also be damaged during an eruption from Mt. Ngauruhoe
(Figures 19 and 20).
5.2.1.1 Electricity Distribution Systems
Electricity distribution systems are susceptible to a number of impacts from tephra fall
including insulator flashover, controlled outages during cleaning of tephra, line breakages or
line tower collapse due to excess weight, and the breakdown of air conditioning systems in

37
substations, caused by the blockage of air intakes. The most common volcanic impacts to
electrical distribution systems are insulator flashover and the breakdown of air conditioning
systems in electricity substations (Wardman et al. 2010).
A number of factors contribute to insulator flashover potential. These include the adherence
of tephra to insulators, the conductivity of the tephra and the insulator dimensions. Tephra
adherence is dependent on insulator orientation and condition, electrostatic charge,
grainsize and moisture content of the tephra, in addition to the weather conditions at the
time of eruption. The conductivity of tephra depends on its moisture content and grainsize,
as well as the concentration of soluble components within the tephra (Wilson et al. 2009). In
general, fine grained, moist or wet tephra falling at thicknesses greater than 5 mm causes
the highest flashover potential. Flashover causes the failure of insulators, which leads to
transmission line failures (Amarh 2001). Three 220 kV transmission lines are located c. 12
km to the east of Mt. Ngauruhoe (Transpower 2010). These contain a number of insulators
which are susceptible to flashover, potentially causing electricity transmission failure to
large areas of the North Island during both the most likely eruption and the maximum
plausible eruption.
Figure 18: 220kV transmission lines to the east of Mt. Ngauruhoe, with Mt. Tongariro to the right of
photo.
N

38
Figu
re 1
9: M
ap o
f ce
ntr
al N
ort
h Is
lan
d o
f N
ew
Zea
lan
d s
ho
win
g is
op
ach
map
fo
r m
ost
like
ly e
rup
tio
n s
cen
ario
, as
wel
l as
key
infr
astr
uct
ure
in t
he
affe
cted
are
a.
1 cm
0.5
cm
<0.5
cm
Tep
hra
th
ickn
ess
N
25 k
m
LEG
END
Sta
te H
igh
way
s
To
nga
riro
Cro
ssin
g
Ele
ctri
city
Tra
nsp
ort
Net
wo
rk
Dam
str
uct
ure
s as
soci
ates
wit
h
the
Ton
gari
ro P
ow
er S
chem
e
Cat
chm
ent
area
fo
r th
e To
nga
riro
Po
we
r Sc
hem
e
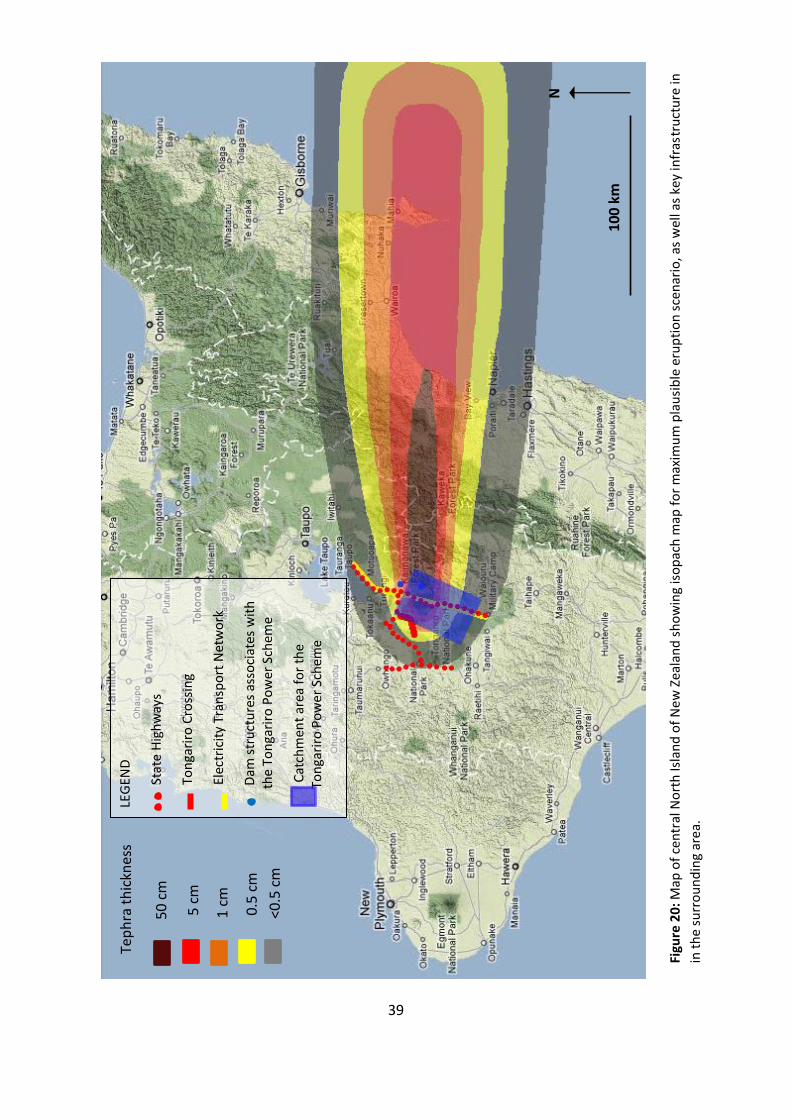
39
50 c
m
5 cm
1 cm
0.5
cm
<0.5
cm
Tep
hra
th
ickn
ess
N
100
km
Figu
re 2
0: M
ap o
f ce
ntr
al N
ort
h Is
lan
d o
f N
ew
Zea
lan
d s
ho
win
g is
op
ach
map
fo
r m
axim
um
pla
usi
ble
eru
pti
on
sce
nar
io, a
s w
ell a
s ke
y in
fras
tru
ctu
re in
in t
he
surr
ou
nd
ing
are
a.
LEG
END
Sta
te H
igh
way
s
To
nga
riro
Cro
ssin
g
Ele
ctri
city
Tra
nsp
ort
Net
wo
rk
Dam
str
uct
ure
s as
soci
ates
wit
h
the
Ton
gari
ro P
ow
er S
chem
e
Cat
chm
ent
area
fo
r th
e To
nga
riro
Po
we
r Sc
hem
e
40
Based on modelling using Tephra2, the most likely eruption scenario will coat c. 7 km of
transmission lines with more than 5 mm of tephra, affecting c. 23 insulator sites. The
maximum plausible eruption will coat c. 25 km with more than 5 mm of tephra, affecting c.
83 insulator sites.
Air conditioning systems are used extensively to keep electrical equipment cool at electricity
distribution points such as substations. These systems are vulnerable to damage during
tephra fall, through corrosion and the blockage of air filters. Increased air speed through the
condenser reduces susceptibility to blockage from tephra, however modern systems use
slower air speed in order to reduce noise pollution, which increases the potential for
blockage (Wilson et al. 2009). The most likely eruption scenario will cause tephra to fall on
at least 200 km2 of land, and the maximum plausible eruption at least 5,000 km2 of land,
both affecting large numbers of substations in the rural central North Island.
5.2.1.2 Electricity Production Systems
The Tongariro Power Scheme uses a series of lakes, canals and tunnels to bring water from
the catchment area to the Tongariro River, which provides flow for the Rangipo and
Tokaanu Power Stations, before discharging into Lake Taupo. The Tongariro Power Scheme
supplies c. 4% of the electricity production capacity of New Zealand (Genesis Energy 2010).
During the 1995-1996 eruption from Mt. Ruapehu, which is located 16 km SSW of Mt.
Ngauruhoe, c. 7.6 million cubic metres of tephra was deposited on the Tongariro Power
Scheme catchment. It has been estimated that 40% of the minerals from these eruptions
had a hardness between 5 and 6.5 on the Mohs scale of hardness, which is equivalent to
between glass and a steel working file. The tephra moved down the catchment, and the
grain size was small enough to become suspended sediment within the Tongariro River.
Because of its hard nature, this caused substantial abrasion to components of the Tongariro
Power Scheme, in particular the Rangipo Power Station.
In the seven months between September 1995 and April 1996, c. 15 years of normal life was
worn from the two 60 megawatt turbines in the Rangipo Power Station. A number of other
components, including penstock priming butterfly valves, were also damaged following this
eruption as a result of abrasion by tephra suspended in water (Figures 21 and 22).
41
Similar volumes of tephra can be expected from a large eruption from Mt. Ngauruhoe,
which may cause damage to the Tongariro Power Scheme similar to that seen during the
Mt. Ruapehu eruption. The most likely eruption modelled using Tephra2 will deposit c.
0.62x10⁶ m3 of tephra on the Tongariro Power Scheme catchment, and the maximum
plausible eruption will deposit c. 9.97x10⁸ m3 of tephra on the Tongariro Power Scheme
catchment. These were calculated using the Rangipo catchment area (Figures 19 and 20),
and by determining the volume of tephra deposited in this area (Section 4.4.1). Either of
these deposits have the potential to cause damage to a similar scale as seen following the
1995 – 1996 Mt. Ruapehu eruption.
Following the 1995-1996 eruption from Mt. Ruapehu, Genesis Energy initiated a number of
mitigation measures to protect against damage from further eruptions. These include
shutting down power generation when the amount of suspended volcanic tephra in the
Tongariro River causes excessive wear to components, retaining the tephra close to source
by using sediment traps and retention dams, diverting the water sources which are carrying
suspended volcanic material, separating the tephra before it reaches the Rangipo Dam, and
creating a sediment trap in the Waihaha pipe bridge (Malcolm et al. 1997). Damage caused
by potential further eruptions from either Mt. Ngauruhoe or Mt. Ruapehu will take longer to
occur because of the permanent mitigation measures carried out by Genesis Energy.
5.2.2 Transport Infrastructure
A number of transport networks including roads, railways and air transport may be
adversely affected by distal impacts from an eruption at Mt. Ngauruhoe.
The road network through the central North Island provides important transport links for
both economic and social activities. During natural disasters, such as volcanic eruptions,
road networks are vital for allowing rapid evacuation, access to important infrastructure and
the movement of emergency services. State Highway (SH) 1 travels the length of New
Zealand. The Desert Road is the section of SH1 between Rangipo and Waiouru, which is
located approximately ten kilometres east of the Tongariro Volcanic Complex (Figure 23).

42
Figure 22: Damaged cheek plate from
the Rangipo Power Station after seven
months exposure to suspended volcanic
tephra within the Tongariro River
(Meredith 2002).
A C
Figure 21: (A and B) Penstock priming
butterfly valve taken from the Rangipo
Power Station after seven months exposure
to suspended volcanic tephra within the
Tongariro River (Kieran Devine pers. comm.
2011). (C) New penstock priming butterfly
valve (Casting Quality 2011).
B
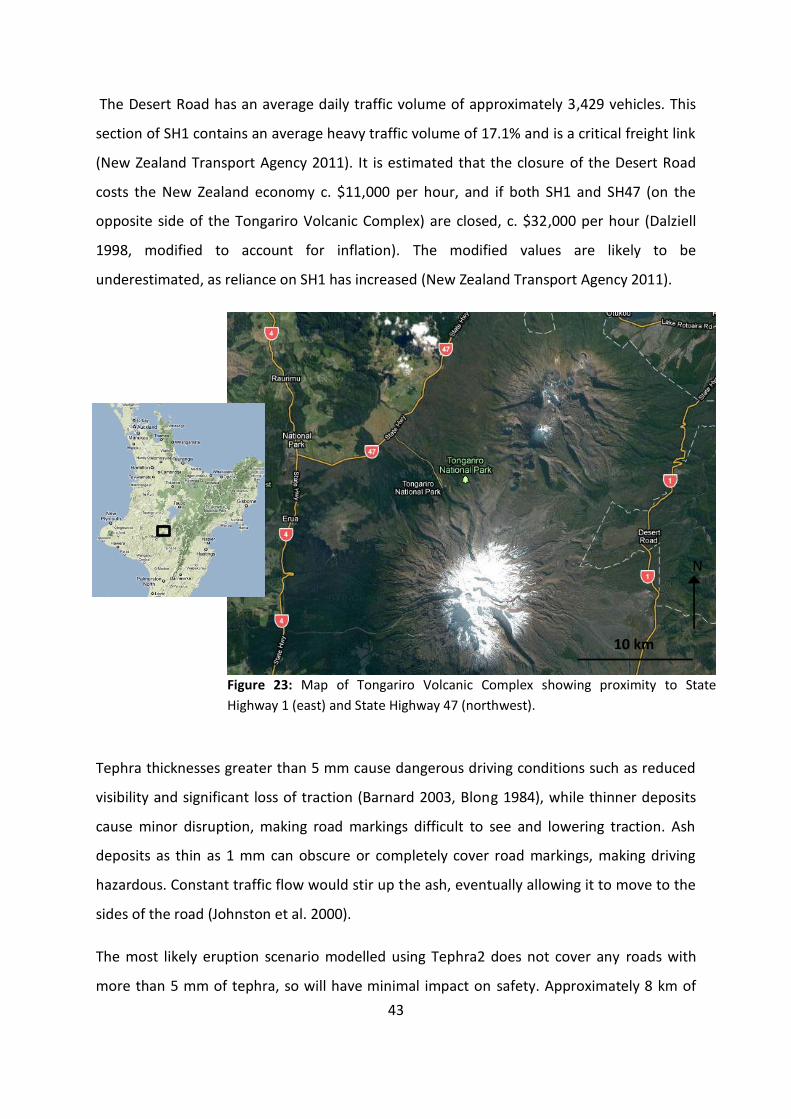
43
The Desert Road has an average daily traffic volume of approximately 3,429 vehicles. This
section of SH1 contains an average heavy traffic volume of 17.1% and is a critical freight link
(New Zealand Transport Agency 2011). It is estimated that the closure of the Desert Road
costs the New Zealand economy c. $11,000 per hour, and if both SH1 and SH47 (on the
opposite side of the Tongariro Volcanic Complex) are closed, c. $32,000 per hour (Dalziell
1998, modified to account for inflation). The modified values are likely to be
underestimated, as reliance on SH1 has increased (New Zealand Transport Agency 2011).
Tephra thicknesses greater than 5 mm cause dangerous driving conditions such as reduced
visibility and significant loss of traction (Barnard 2003, Blong 1984), while thinner deposits
cause minor disruption, making road markings difficult to see and lowering traction. Ash
deposits as thin as 1 mm can obscure or completely cover road markings, making driving
hazardous. Constant traffic flow would stir up the ash, eventually allowing it to move to the
sides of the road (Johnston et al. 2000).
The most likely eruption scenario modelled using Tephra2 does not cover any roads with
more than 5 mm of tephra, so will have minimal impact on safety. Approximately 8 km of
Figure 23: Map of Tongariro Volcanic Complex showing proximity to State
Highway 1 (east) and State Highway 47 (northwest).
10 km
N

44
State Highway 1 will be covered by <5 mm of tephra, which may obscure road markings
along this section. The thin deposit means this will be easily cleared, causing only minor
disruption to motorists. The maximum plausible eruption scenario modelled using Tephra2
has a more significant impact to roads. Approximately 14 km of SH 1 will be covered by
more than 5 mm of tephra, reducing visibility and causing loss of traction, as well as
covering road markings. This is the only major road which will be affected to this level
following an eruption from Mt. Ngauruhoe under the conditions used in modelling.
Approximately 300 km of major roads, including SH1, SH2 and SH5 will be covered with
<5mm of tephra, which may obscure road markings.
Volcanic tephra can also cause physical damage to vehicles. Because it is often very fine,
tephra is able to infiltrate into vehicles, causing abrasion and scratching of surfaces and
moving parts. Air filters become clogged easily, leading to overheating of engines and
eventually engine failure. Regular oil changes, cleaning of filters and removal of tephra helps
protect vehicles from long term damage (Federal Emergency Management Agency 2011).
Rail networks are less susceptible to volcanic tephra fall than road networks. No significant
hazard exists, however poor visibility and breathing problems for train crews can occur.
Tephra can also cause damage to train engines and other equipment, leading to increased
wear, and can occasionally cause the shutdown of rail services. Volcanic tephra can also lead
to short circuiting of signal equipment, causing additional danger. Following the Mount St.
Helens eruption in 1980, ten trains in western Montana, 625 km north of Mt St. Helens,
were shut down for nearly 24 hours due to tephra fall on the railway tracks (Blong 1984).
Major rail lines in the central North Island run to the west of Mt. Ngauruhoe, following SH4
(Figure 23). Under the conditions used for modelling with Tephra2, this section of rail will
not receive any tephra fall. Minor rail lines are located on the eastern coast of the central
North Island, however these will receive <1 mm of tephra so are unlikely to be impacted.
Air transport networks are at significant risk from volcanic eruptions. Potential effects
include disruption of flights, physical damage to aircraft and damage to facilities. The most
common effect is temporary shutdown of operations while the ash cloud disperses.
45
Disruption to flights may occur either because of tephra on the runway and surrounding
area, or because of the location of the ash plume in the atmosphere. Tephra on the runway
may cause difficult landings due to reduced runway friction, as well as loss of visibility when
engines stir up the tephra (Barnard 2009). Aircraft are unable to fly through ash
concentrations greater than 2x10⁻³ g/m3, as it begins to melt in the combustor and redeposit
in the high pressure turbine. This increases pressure on the engine, leading to an engine
surge or blockage (Sixsmith 2010). As a result of the potential danger to aircraft flying
through ash clouds, most airlines choose not to fly in the vicinity of volcanic ash.
During the 1995 – 1996 Mt. Ruapehu eruption at least thirteen airports were disrupted,
even though only eight of these received any tephra fall. This was because of the closure of
airspace by the Wellington Volcanic Ash Advisory Centre, causing the cancellation or re-
routing of a number of flights (Barnard 2009).
The only airport which will be exposed to tephra fall during an eruption from Mt. Ngauruhoe
is Napier airport, which has an average daily schedule exceeding 40 aircraft movements.
Airspace across the central western North Island will be restricted by both the most likely
eruption and the maximum plausible eruption under the wind conditions used for modelling
with Tephra2.
5.2.3 Water Supply Infrastructure
Volcanic tephra has three main impacts on water supply infrastructure. Firstly, tephra can
physically disrupt or damage water sources, as well as treatment and distribution systems.
Secondly, tephra can change the physical and chemical characteristics of surface water. And
thirdly, a high demand for water resources for clean-up following an ash fall may lead to
water shortages (Wilson et al. 2011).
Tephra can block filters at water intakes, reducing the supply of water to affected
communities. During the 1945 eruption from Mt. Ruapehu, several millimetres of tephra
was deposited across the North Island. The Whanganui River is the source of drinking water
in the town of Taumarunui. Filters at the water supply intakes became blocked, reducing
pumping rates from 90,000 litres per hour to 31,500 litres per hour (Johnston 1997). Ash can
46
also damage components of water distribution systems such as pumps, switchboards, filters
and motors (Wilson et al. 2011).
The contamination of water supplies by tephra generally breaches drinking New Zealand
drinking water standards for aesthetic determinands before breaching the equivalent
standards for health determinands (Johnston et al. 2004). This means that water will
become undrinkable because of its taste prior to becoming unsafe to drink. Volcanic tephra
is known to leach over 55 soluble components into surface waters (Delmelle et al. 2007). A
number of leachates can cause health issues, however the main toxic element adsorbed on
volcanic ash is fluoride. Fluoride levels in water higher than the recommended guidelines of
1.5 mg/l are associated with an increased risk of dental fluorosis, and levels greater than 10
mg/l can lead to skeletal fluorosis (Ministry of Health 2005; Witham et al. 2005).
Acidification of water may also occur, due to the presence of acids such as H2SO4, HCl and
HF. Most surface waters contain sufficient alkalinity to buffer against significant pH change
so acidification does not often occur (Wilson et al. 2011).
Water resources are often placed under heavy demand for clean-up purposes following an
ash fall. This has follow on effects on services such as fire fighting, and can also lead to
shortages of water for hygiene, sanitation and drinking (Wilson et al. 2011).
The most likely eruption scenario will deposit tephra across at least 200 km2 of land, and the
maximum plausible eruption at least 5,000 km2 of land. These events could potentially
impact water supply infrastructure in a number of small towns, each of which have fewer
than 100 residents. The quantity of tephra deposited is not likely to be great enough to lead
to significant health issues in most areas. Towns which source drinking water from the
surface may be susceptible to increased contamination, especially in areas with significant
tephra fall, such as Te Haroto (population 60), Putorino (population 57) and Tutira
(population 87) (Statistics New Zealand 2006). It is not known whether these areas source
drinking water from the surface or from ground water.
5.2.4 Telecommunication Infrastructure
In the event of a volcanic eruption causing tephra fall, the ability to communicate is
extremely important to risk managers, such as Civil Defence and GNS Science. The

47
telecommunication network in New Zealand includes radio, television, mobile phones and
landlines for both voice and data. Methods of transmission include hard wiring, radio waves,
microwaves, fibre optics, the internet and satellites.
The most common impact of volcanic tephra on telecommunications is overloading of the
network. This is because of the large number of people trying to contact each other at the
same time due to widespread alarm. Physical damage to infrastructure through the
overloading of tephra is uncommon, with the exception of telephone lines which may
collapse under excess weight. All telecommunications equipment has the potential to be
damaged by falling trees and branches due to tephra overloading (Barnard 2009).
Roadside exchange cabinets and cellphone exchanges are unlikely to be damaged by tephra
overloading, however the attached air conditioning units are susceptible to damage by
tephra fall, which may lead to failure of the exchange cabinet. This occurs when the
compressor of the air conditioning unit fails, causing the internal temperature of cabinets to
rise above 30°C within minutes. Once 30°C is reached, automatic fans begin drawing in
cooler air from outside. These fans cannot be controlled remotely, so must be switched off
on site. The outside air which is sucked into the cabinets brings fresh tephra, which can
cause bridged connections, short circuits and the eventual corrosion of internal
componentry (Barnard 2009).
The most likely eruption scenario modelled using Tephra2 is unlikely to have any impact on
telecommunications, with the exception of overloading of the network because of
widespread panic. The maximum plausible eruption scenario modelled using Tephra2 is
likely to deposit tephra to a sufficient thickness to cause air conditioning units to fail.
5.2.5 Tourism
Impacts to tourism from a volcanic eruption are wide ranging. Tourists are unlikely to want
to travel to an area which is being subjected to a volcanic eruption, meaning a lower
number of tourists will visit. Even if tourists still chose to travel, the presence of an ash
plume in the air and tephra on the ground may limit the transport options available. Impacts
to actual tourist destinations may also occur.

48
The most significant tourist destination which is likely to be affected following an eruption
from Mt. Ngauruhoe is the Tongariro Crossing. Up to 12,000 people walk this track each
month (Martelli 2007). A number of other tourist activities are located in the vicinity of Mt.
Ngauruhoe including fishing, jet boating, hunting, mountain biking and rafting.
Modelling carried out using Tephra2 shows that for the most likely eruption scenario, parts
of the Tongariro Crossing will receive less than 1 cm of tephra. For the maximum plausible
eruption scenario, some parts of the Tongariro Crossing will receive between 5 cm and 50
cm of tephra while others will receive only trace levels.
5.2.6 Residential, Commercial and Industrial Property
No significant residential, commercial or industrial property exists to the east of Mt.
Ngauruhoe. Several small townships (<100 residents) are located on SH 5, c. 80 km east of
Mt. Ngauruhoe.
Roof collapse occurs when the weight of tephra is great enough to cause structural failure.
Flat, long span roofs are most vulnerable to collapse through tephra overloading. Weak
structures such as barns and sheds may collapse under less than 100 mm of tephra,
especially if the tephra becomes moist during or following deposition (GNS Science 2010).
Between 100 mm and 300 mm of moist tephra may cause the buckling or collapse of flat
roofed buildings (Wilson et al. 2009). Major roof collapse occurs with the deposition of over
300 mm of moist tephra (GNS Science 2010).
The modelling carried out using Tephra2 shows that the most likely eruption scenario will
not deposit a sufficient thickness of tephra to cause roof collapse. The maximum plausible
eruption will deposit a tephra thickness greater than 100 mm across c. 1,000 km2, however
no buildings of any significance exist in the area which will receive this thickness of tephra.
Clean-up of urban areas following tephra fall is important in order to minimise damage to
infrastructure and property. Tephra must be removed from roofs as soon as possible to
avoid the potential for roof collapse. By moistening thick tephra deposits, the likelihood of
remobilisation by wind reduces, decreasing the time required for clean-up.

49
5.2.7 Other Infrastructure
Other areas of infrastructure include recreational, social, economic, solid waste
management and governance. An eruption from Mt. Ngauruhoe is likely to have little
impact on the majority of these facilities, with the exception of the Rangipo Prison.
The Rangipo Prison is located c. 18 km northeast of Mt. Ngauruhoe, and has a capacity of
600 minimum to low-medium security prisoners as well as 251 staff members. During a
significant eruption from Mt. Ngauruhoe this facility may need to be evacuated, as there is
potential for roof collapse if more than 100 mm of moist tephra is deposited.
The maximum plausible eruption will deposit between 1 cm and 0.5 cm of tephra on the
Rangipo Prison, which is not a great enough thickness to cause roof collapse. If the wind
direction used for modelling was towards the north-east rather than towards the east, the
Rangipo Prison would receive between 5 cm and 50 cm of tephra. If enough water was
contained within the tephra, the thickness would be great enough to potentially cause roof
collapse. Details on the engineering of the Rangipo Prison are unavailable, however it is
assumed in this study that it was engineered to a higher level than normal residential
buildings to assist in the prevention of prisoners escaping.
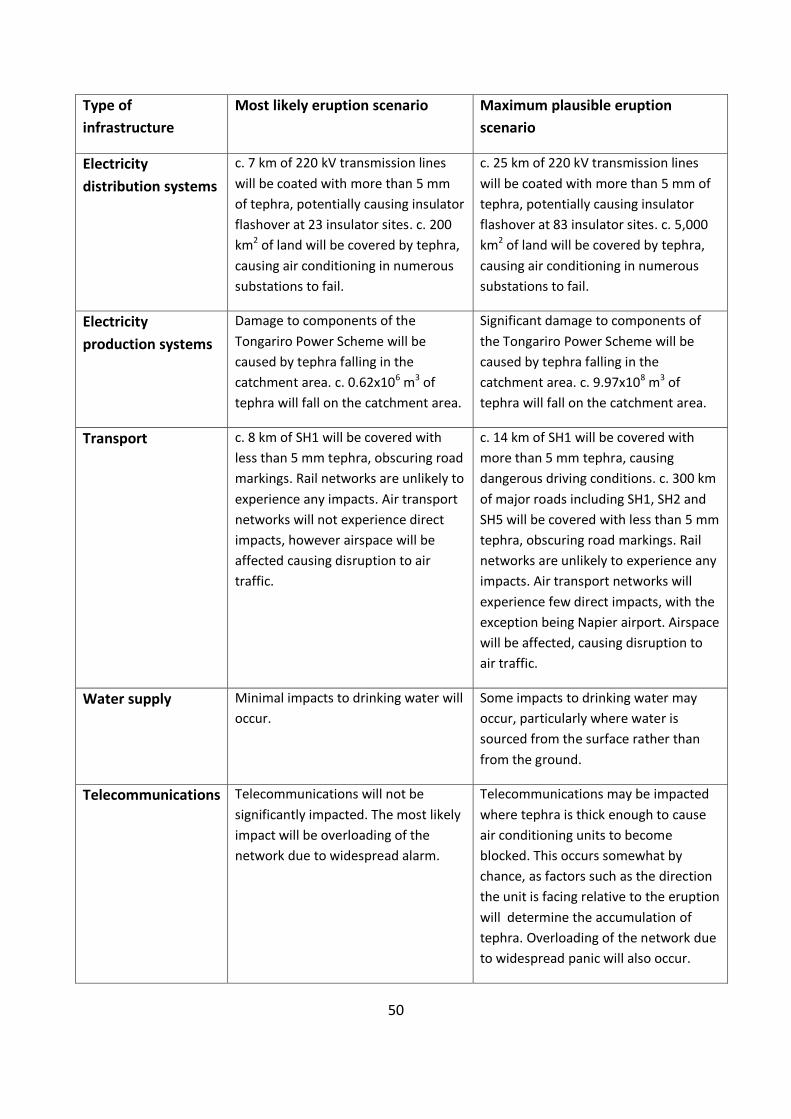
50
Type of
infrastructure
Most likely eruption scenario Maximum plausible eruption
scenario
Electricity
distribution systems
c. 7 km of 220 kV transmission lines
will be coated with more than 5 mm
of tephra, potentially causing insulator
flashover at 23 insulator sites. c. 200
km2 of land will be covered by tephra,
causing air conditioning in numerous
substations to fail.
c. 25 km of 220 kV transmission lines
will be coated with more than 5 mm of
tephra, potentially causing insulator
flashover at 83 insulator sites. c. 5,000
km2 of land will be covered by tephra,
causing air conditioning in numerous
substations to fail.
Electricity
production systems
Damage to components of the
Tongariro Power Scheme will be
caused by tephra falling in the
catchment area. c. 0.62x10⁶ m3 of
tephra will fall on the catchment area.
Significant damage to components of
the Tongariro Power Scheme will be
caused by tephra falling in the
catchment area. c. 9.97x10⁸ m3 of
tephra will fall on the catchment area.
Transport c. 8 km of SH1 will be covered with
less than 5 mm tephra, obscuring road
markings. Rail networks are unlikely to
experience any impacts. Air transport
networks will not experience direct
impacts, however airspace will be
affected causing disruption to air
traffic.
c. 14 km of SH1 will be covered with
more than 5 mm tephra, causing
dangerous driving conditions. c. 300 km
of major roads including SH1, SH2 and
SH5 will be covered with less than 5 mm
tephra, obscuring road markings. Rail
networks are unlikely to experience any
impacts. Air transport networks will
experience few direct impacts, with the
exception being Napier airport. Airspace
will be affected, causing disruption to
air traffic.
Water supply Minimal impacts to drinking water will
occur.
Some impacts to drinking water may
occur, particularly where water is
sourced from the surface rather than
from the ground.
Telecommunications Telecommunications will not be
significantly impacted. The most likely
impact will be overloading of the
network due to widespread alarm.
Telecommunications may be impacted
where tephra is thick enough to cause
air conditioning units to become
blocked. This occurs somewhat by
chance, as factors such as the direction
the unit is facing relative to the eruption
will determine the accumulation of
tephra. Overloading of the network due
to widespread panic will also occur.

51
Tourism The Tongariro Crossing will have up to
1 cm of tephra fall on some sections. It
is difficult to assess other areas of
tourism, as they are dependent on
other factors such as transport
availability.
The Tongariro Crossing will have
between 0.5 cm and 50 cm of tephra
along its entire length. Other areas of
tourism will be significantly impacted,
as transport around the region will be
substantially decreased.
Residential,
commercial and
industrial
Tephra thickness will not be great
enough to cause roof collapse. Clean-
up of tephra from urban areas will be
required in some cases.
No buildings of any significance are
located within the area receiving the
greatest thickness of tephra. Buildings
in a 1,000 km2 area will receive tephra
thicknesses greater than 100 mm,
which, when moist, is thick enough to
cause roof collapse in poorly
constructed buildings.
Other Other areas of infrastructure will
receive little impact from tephra fall.
The Rangipo Prison will receive
between 0.5 cm and 1 cm of tephra,
which is not a great enough thickness to
cause roof collapse. A change in wind
direction may significantly alter the
dispersal of tephra over the Rangipo
Prison. Up to 50 cm of tephra may be
deposited if the wind direction was
towards the north-east rather than
east.
Table 5: Overview of risk to each type of infrastructure from tephra fall.

52
Chapter Six – Discussion and Conclusions
Impacts from a future volcanic eruption at Mt. Ngauruhoe have the potential to affect a
widespread area and a number of corridor infrastructure networks and urban areas across
the central North Island. The most likely eruption scenario modelled using Tephra2 will
deposit up to 1 cm of tephra over an area of >200 km2. This will have a noticeable impact on
electricity production, electricity transmission and transport. There will be lesser effects on
the tourism industry and water supply, as well as residential, commercial and industrial
property including agriculture and forestry. The maximum plausible eruption scenario
modelled using Tephra2 will have a more widespread impact on a number of different
areas. An area of >5,000 km2 will receive between 0.5 mm and 50 cm of tephra. This will
have a large impact on electricity production, electricity transmission, transport,
telecommunications and tourism. There will be smaller but still noticeable impacts on water
supplies, as well as residential, commercial and industrial property.
Modelling using Tephra2 was carried out using the most likely wind direction and speed. The
values used occur on average between 26% and 48% of the time, based on data collected at
the Ruapehu, Taupo and Hamilton weather monitoring sites. If an eruption from Mt.
Ngauruhoe occurred under different weather conditions, results from Tephra2 would
change. The plume would remain of a similar size, however the direction of the plume from
the vent would vary along with areas affected by ash fall.
The most likely eruption scenario has the potential to distribute >0.5 mm tephra thickness
up to 50 km from the vent in any direction. This would impact a number of towns including
Waiouru (population 1,383), Ohakune (population 1,101), Taumarunui (population 5,055)
and Turangi (population 3,240) (Statistics New Zealand 2006). Trace levels of tephra would
be distributed up to 100 km from the vent. Taupo (population 22,300) (Statistics New
Zealand 2006) is the only main centre that may receive trace levels of tephra from the most
likely eruption scenario under different weather conditions to those modelled.
The maximum plausible eruption scenario has the potential to distribute tephra at
thicknesses between 0.5 cm and 0.5 m up to 250 km from the vent in any direction. This
would impact several major towns and cities, including Taupo (population 22,300), Gisborne
(population 34,000), Rotorua (population 65,900), Hamilton (population 143,000), Tauranga

53
(population 120,000), New Plymouth (population 69,000), and Wellington (population
195,000) (Statistics New Zealand 2006).
Historic records from Mt. Ngauruhoe are only c. 170 years old, out of a total age of c. 7,000
years. Prehistoric records from Mt. Ngauruhoe are poorly constrained because of its recent
formation and lack of deeply incised drainage channels. Some deposits from prehistoric
eruptions have been identified in road cuttings, although many of these also contain
deposits from other volcanoes. The Mangatawai Formation is one of these deposits, and is
thought to have occurred during the period of most vigorous growth in the history of Mt.
Ngauruhoe. This deposit was used as a basis for the maximum plausible eruption from Mt.
Ngauruhoe. The Mangatawai Formation was deposited between 2,568 ± 508 cal. years BP
(Fergusson and Rafter 1959) and 1,717 ± 13 cal. years BP (Lowe et al. 2008). The Papakai
Formation was formed from by both Mt. Ruapehu and Taupo Caldera, and the Mangamate
is older than the first deposits from Mt. Ngauruhoe.
Future research on hazards from Mt. Ngauruhoe should look at increasing the number of
wind directions and other variables used for modelling, perhaps by using the Monte Carlo
method. This will give a more accurate representation of the eruption which is most likely to
occur. The limited time available meant only two eruption scenarios could be modelled.
Future work should expand on this, with a particular focus on better understanding the
potential dispersal of tephra in relation to wind speed and direction. This study was only
able to use the most common wind values, rather than looking at a number of different
wind speed and directions.

54
References
Allan A S R, Baker J A, Carter L and Wysoczanski R J 2008. Reconstructing the Quaternary
evolution of the world’s most active silicic volcanic system: insights from a 1.65 Ma
deep ocean tephra record sourced from Taupo Volcanic Zone, New Zealand.
Quaternary Science Reviews 27: 2341 – 2360.
Amarh F 2001. Electric Transmission Line Flashover Prediction System. Unpublished PhD
Thesis, Arizona State University, Arizona, United States of America.
Barnard S T 2009. The Vulnerability of New Zealand Lifelines Infrastructure to Ashfall.
Unpublished PhD thesis, University of Canterbury, Christchurch, New Zealand.
Bebbington M S and Lai C D 1996. Statistical analysis of New Zealand volcanic occurrence
data. Journal of Volcanology and Geothermal Research 74: 101 – 110.
Bibby H M, Caldwell T G, Davey F J and Webb T H 1995. Geophysical evidence on the
structure of the Taupo Volcanic Zone and its hydrothermal circulation. Journal of
Volcanology and Geothermal Research 68: 29 – 58.
Bidwill J C 1841. Rambles in New Zealand. 1st ed. London.
Blong R J 1984. Volcanic hazards: a sourcebook on the effects of eruptions. Academic Press,
Australia p. 424.
Bullard F M 1962. Birth of New Volcanoes. In: Bullard F M. Volcanoes: In history, In Theory,
In Eruption. University of Texas Press, Austin.
Carey S and Bursik M 1999. Volcanic Plumes. In: Encyclopaedia of Volcanoes. Academic
Press, San Diego, CA, 495 – 511.
Casting Quality 2011. Lug Style Butterfly Valve. Viewed 17 September 2011. Retrieved from
http://www.castingquality.com/casting-products/casted-iron-valve/lug-style-
butterfly-valve.html.
CLIFLO 2011. The National Climate Database. First viewed 20 May 2011. Accessed from
http://cliflo.niwa.co.nz/.
Cole J W 1990. Structural control and origin of volcanism in the Taupo volcanic zone, New
Zealand. Bulletin of Volcanology 52: 445 – 459.
Cole J W and Lewis K B 1981. Evolution of the Taupo-Hikurangi subduction system.
Tectonophysics 72: 1 – 21.
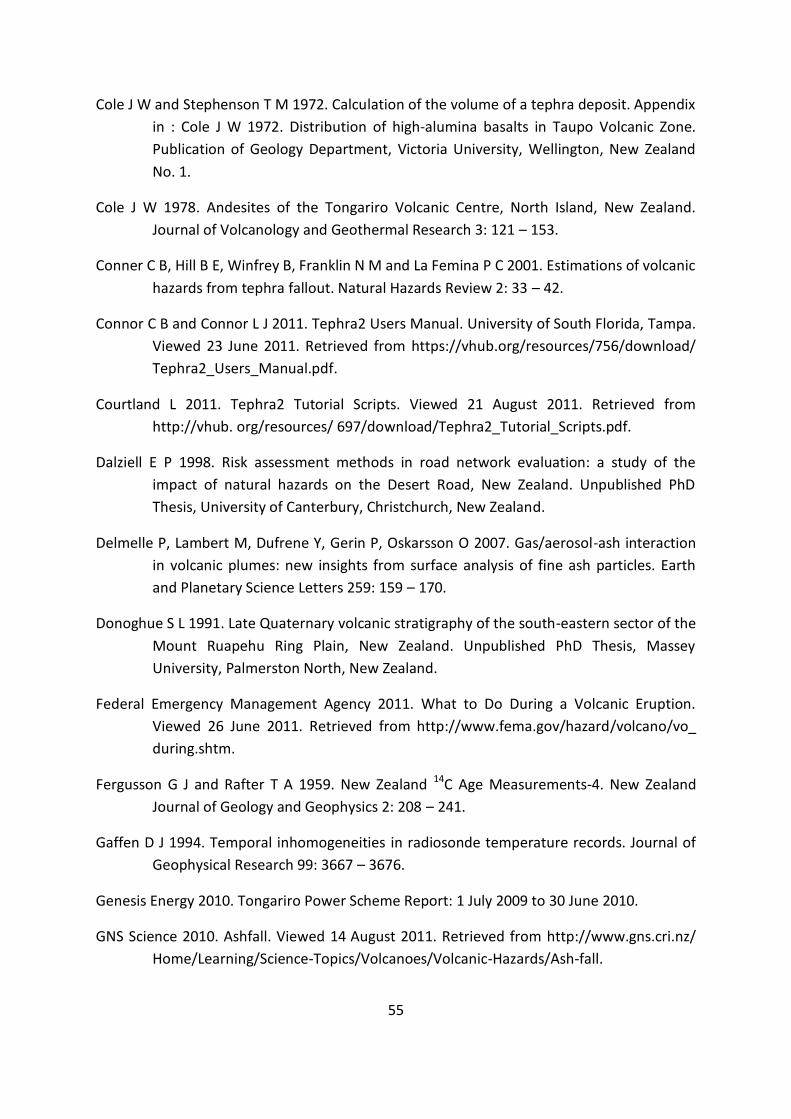
55
Cole J W and Stephenson T M 1972. Calculation of the volume of a tephra deposit. Appendix
in : Cole J W 1972. Distribution of high-alumina basalts in Taupo Volcanic Zone.
Publication of Geology Department, Victoria University, Wellington, New Zealand
No. 1.
Cole J W 1978. Andesites of the Tongariro Volcanic Centre, North Island, New Zealand.
Journal of Volcanology and Geothermal Research 3: 121 – 153.
Conner C B, Hill B E, Winfrey B, Franklin N M and La Femina P C 2001. Estimations of volcanic
hazards from tephra fallout. Natural Hazards Review 2: 33 – 42.
Connor C B and Connor L J 2011. Tephra2 Users Manual. University of South Florida, Tampa.
Viewed 23 June 2011. Retrieved from https://vhub.org/resources/756/download/
Tephra2_Users_Manual.pdf.
Courtland L 2011. Tephra2 Tutorial Scripts. Viewed 21 August 2011. Retrieved from
http://vhub. org/resources/ 697/download/Tephra2_Tutorial_Scripts.pdf.
Dalziell E P 1998. Risk assessment methods in road network evaluation: a study of the
impact of natural hazards on the Desert Road, New Zealand. Unpublished PhD
Thesis, University of Canterbury, Christchurch, New Zealand.
Delmelle P, Lambert M, Dufrene Y, Gerin P, Oskarsson O 2007. Gas/aerosol-ash interaction
in volcanic plumes: new insights from surface analysis of fine ash particles. Earth
and Planetary Science Letters 259: 159 – 170.
Donoghue S L 1991. Late Quaternary volcanic stratigraphy of the south-eastern sector of the
Mount Ruapehu Ring Plain, New Zealand. Unpublished PhD Thesis, Massey
University, Palmerston North, New Zealand.
Federal Emergency Management Agency 2011. What to Do During a Volcanic Eruption.
Viewed 26 June 2011. Retrieved from http://www.fema.gov/hazard/volcano/vo_
during.shtm.
Fergusson G J and Rafter T A 1959. New Zealand 14C Age Measurements-4. New Zealand
Journal of Geology and Geophysics 2: 208 – 241.
Gaffen D J 1994. Temporal inhomogeneities in radiosonde temperature records. Journal of
Geophysical Research 99: 3667 – 3676.
Genesis Energy 2010. Tongariro Power Scheme Report: 1 July 2009 to 30 June 2010.
GNS Science 2010. Ashfall. Viewed 14 August 2011. Retrieved from http://www.gns.cri.nz/
Home/Learning/Science-Topics/Volcanoes/Volcanic-Hazards/Ash-fall.

56
GNS Science 2011. White Island Volcano Fact Sheet. Viewed 8 September 2011. Retrieved
from http://www.gns.cri.nz/Home/Learning/Science-Topics/Volcanoes/New-
Zealand -Volcanoes/White-Island.
GeoMapApp 2011. North Island, New Zealand. Viewed 21 May 2011. Retrieved from
http://www.geomapapp.org.
GeoNet 2011. Ngauruhoe. Viewed 1 September 2011. Retrieved from http://www.geonet.
org.nz/volcano/activity/ngauruhoe/about.html.
Gill J, Reagan M, Tepley F and Malavassi E 2006. Special Issue Editorial (Arenal Volcano).
Journal of Volcanology and Geothermal Research 157: 1 – 8.
Google Earth 2011. Central North Island, New Zealand.
Graham I J, Cole J W, Briggs R M, Gamble J A and Smith I E M 1995. Petrology and
petrogenesis of volcanic rocks from the Taupo Volcanic Zone: A review. Journal of
Volcanology and Geothermal Research 68: 59 – 87.
Grant S 2006. Tertiary and Quaternary volcanics interface at Mt. Ruapehu, North Island,
New Zealand. Unpublished BSc Honours Thesis, Massey University, Palmerston
North, New Zealand.
Gregg D R 1960. The geology of Tongariro Subdivision. New Zealand Geological Survey
Bulletin 40: 9 – 152.
Hobden B J, Houghton B F, Lanphere M A, Nairn I A 1996. Growth of the Tongariro volcanic
complex: new evidence from K-Ar age determinations. New Zealand Journal of
Geology and Geophysics 39: 151 – 154.
Hobden B J 1997. Modelling magmatic trends in time and space: eruptive and magmatic
history of Tongariro volcanic complex, New Zealand. PhD thesis, University of
Canterbury, Christchurch, New Zealand.
Hobden B J, Houghton B F and Nairn I A 2002. Growth of a young, frequently active
composite cone: Ngauruhoe volcano, New Zealand. Bulletin of Volcanology 64: 392
– 409.
Johnston D M 1997. Physical and Social Impacts of Past and Future Volcanic Eruptions in
New Zealand. Unpublished PhD thesis, University of Canterbury, Christchurch, New
Zealand.
Johnston D M, Houghton B F, Neall V E, Ronan K R and Paton D 2000. Impacts of the 1945
and 1995-1996 Ruapehu eruptions, New Zealand; an example of increasing societal
vulnerability. Geological Society of America Bulletin 112: 720 – 726.

57
Jolly A D, Sherburn S, Jousset P and Kilgour G 2010. Eruption source processes derived from
seismic and acoustic observations of the 25 September 2007 Ruapehu eruption –
North Island, New Zealand. Journal of Volcanology and Geothermal Research 191:
33 – 45.
Kaye G D 2007. Examining wind patterns above the central North Island for ASHFALL tephra
dispersion modelling in RiskScape. GNS Science Report 2007: 36 – 40.
Krippner J B 2009. Ngauruhoe Inner Crater Volcanic Processes of the 1954-1955 and 1974-
1975 Eruptions. Unpublished MSc thesis, Waikato University, Hamilton, New
Zealand.
Lowe D J, Shane P A R, Alloway B V and Newnham R M 2008. Fingerprints and age models
for widespread New Zealand tephra marker beds erupted since 30,000 years ago: a
framework for NZ-INTIMATE Quaternary Science Reviews 27: 95 – 126.
Malcolm L and van Rossen A 1997. Ashes to ashes? Rangipo rebuild. International Water
Power and Dam Construction. February: 22 – 24.
Martelli K M 2007. Computer Modelling of the potential hazard from scoria and ash flows on
Mt. Ngauruhoe, Tongariro Volcanic Centre, New Zealand. Unpublished PhD Thesis,
Massey University, Palmerston North, New Zealand.
Meredith I 2002. The Wear Resistant Design and Rebuild of the Rangipo Francis Turbines.
10th HPEE Conference, Snowy Hydro, Australia.
Ministry of Health 2005. Drinking-water Standards for New Zealand. Wellington: Ministry of
Health.
Moebis A 2010. Understanding the Holocene explosive eruption record of the Tongariro
Volcanic Centre, New Zealand. Unpublished PhD thesis, Massey University,
Palmerston North, New Zealand.
Nairn I A and Cole J W 1965. Ngauruhoe. In: Catalogue of the Active Volcanoes of the World
Including Solfatara Fields. International Association of Volcanology.
Nairn I A, Hewson C A Y, Latter J H and Wood C P 1976. Pyroclastic eruptions of Ngauruhoe
Volcano, central North Island, New Zealand, 1974 January and March. In: Johnson R
W ed. Volcanism in Australasia. Elsevier, Amsterdam, pp. 385 – 405.
Nairn I A and Self S 1978. Explosive eruptions and pyroclastic avalanches from Ngauruhoe in
February 1975. Journal of Volcanology and Geothermal Research 3: 39 – 60.
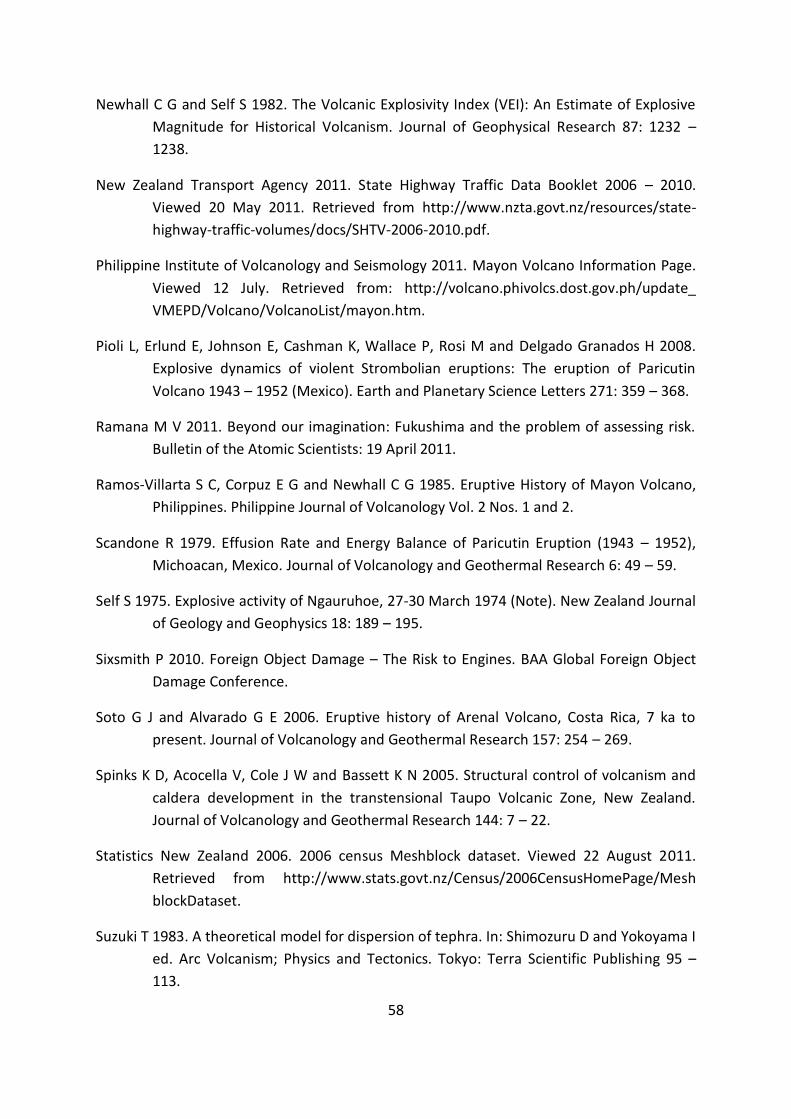
58
Newhall C G and Self S 1982. The Volcanic Explosivity Index (VEI): An Estimate of Explosive
Magnitude for Historical Volcanism. Journal of Geophysical Research 87: 1232 –
1238.
New Zealand Transport Agency 2011. State Highway Traffic Data Booklet 2006 – 2010.
Viewed 20 May 2011. Retrieved from http://www.nzta.govt.nz/resources/state-
highway-traffic-volumes/docs/SHTV-2006-2010.pdf.
Philippine Institute of Volcanology and Seismology 2011. Mayon Volcano Information Page.
Viewed 12 July. Retrieved from: http://volcano.phivolcs.dost.gov.ph/update_
VMEPD/Volcano/VolcanoList/mayon.htm.
Pioli L, Erlund E, Johnson E, Cashman K, Wallace P, Rosi M and Delgado Granados H 2008.
Explosive dynamics of violent Strombolian eruptions: The eruption of Paricutin
Volcano 1943 – 1952 (Mexico). Earth and Planetary Science Letters 271: 359 – 368.
Ramana M V 2011. Beyond our imagination: Fukushima and the problem of assessing risk.
Bulletin of the Atomic Scientists: 19 April 2011.
Ramos-Villarta S C, Corpuz E G and Newhall C G 1985. Eruptive History of Mayon Volcano,
Philippines. Philippine Journal of Volcanology Vol. 2 Nos. 1 and 2.
Scandone R 1979. Effusion Rate and Energy Balance of Paricutin Eruption (1943 – 1952),
Michoacan, Mexico. Journal of Volcanology and Geothermal Research 6: 49 – 59.
Self S 1975. Explosive activity of Ngauruhoe, 27-30 March 1974 (Note). New Zealand Journal
of Geology and Geophysics 18: 189 – 195.
Sixsmith P 2010. Foreign Object Damage – The Risk to Engines. BAA Global Foreign Object
Damage Conference.
Soto G J and Alvarado G E 2006. Eruptive history of Arenal Volcano, Costa Rica, 7 ka to
present. Journal of Volcanology and Geothermal Research 157: 254 – 269.
Spinks K D, Acocella V, Cole J W and Bassett K N 2005. Structural control of volcanism and
caldera development in the transtensional Taupo Volcanic Zone, New Zealand.
Journal of Volcanology and Geothermal Research 144: 7 – 22.
Statistics New Zealand 2006. 2006 census Meshblock dataset. Viewed 22 August 2011.
Retrieved from http://www.stats.govt.nz/Census/2006CensusHomePage/Mesh
blockDataset.
Suzuki T 1983. A theoretical model for dispersion of tephra. In: Shimozuru D and Yokoyama I
ed. Arc Volcanism; Physics and Tectonics. Tokyo: Terra Scientific Publishing 95 –
113.
N
500 km

59
Topping W W 1973. Tephrostratigraphy and chronology of late Quaternary eruptives from
the Tongariro Volcanic Centre, New Zealand. New Zealand Journal of Geology and
Geophysics 16: 397 – 423.
Transpower 2010. Transpower Transmission Network: North Island. Viewed 13 July 2011.
Retrieved from http://www.transpower.co.nz/f1010,2139700/transmission-map-
north-island.pdf.
Wardman J B, Wilson T M, Cole J W, Bodger P S, Johnston D M 2010. Quantifying the
vulnerability of high voltage power transmission systems to volcanic Ashfall
hazards. Christchurch, New Zealand: 2010 Electricity Engineers’ Association (EEA)
Conference, 17 – 18 June 2010.
Whitham C S, Oppenheimer C and Horwell C J 2005. Volcanic ash leachates: a review and
recommendations for sampling methods. Journal of Volcanology and Geothermal
Research 141: 299 - 326
Wilson C J N, Houghton B F, McWilliams M O, Lanphere M A, Weaver S D and Briggs R M
1995. Volcanic and structural evolution of Taupo Volcanic Zone, New Zealand: a
review. Journal of Volcanology and Geothermal Research 68: 1 – 28.
Wilson T, Daly M and Johnston D 2009. Review of Impacts of Volcanic Ash on Electricity
Distribution Systems, Broadcasting and Communications Networks. Auckland
Engineering Lifelines Group. Auckland Regional Council Technical Publication No.
051, April 2009.
Wilson T M, Stewart C, Sword-Daniels V, Leonard G S, Johnston D M, Cole J W, Wardman J,
Wilson G and Barnard S T 2011. Volcanic ash impacts on critical infrastructure.
Physics and Chemistry of the Earth 2011.
Yokoyama I and de la Cruz-Reyna S 1990. Precursory earthquakes of the 1943 eruption of
Paricutin volcano, Michoacan, Mexico. Journal of Volcanology and Geothermal
Research 44: 265 – 281.