Charge injection into the atmosphere by explosive volcanic ...
33
Charge injection into the atmosphere by explosive volcanic eruptions through triboelectrification and fragmentation charging Joshua M´ endez Harper a , Corrado Cimarelli b , Valeria Cigala b , Ulrich Kueppers b , Josef Dufek a a Department of Earth Science, University of Oregon, Eugene OR, 97403, USA b Department f¨ ur Geo- und Umweltwissenschaften, Ludwig-Maximilians-Universit¨at M¨ unchen, Munich BY, 80333, Germany Abstract Volcanic eruptions are associated with a wide range of electrostatic ef- fects. Increasing evidence suggests that high-altitude discharges (lightning) in maturing plumes are driven by electrification processes that require the formation of ice (analogous to processes underpinning meteorological thun- derstorms). However, electrical discharges are also common at or near the volcanic vent. A number of “ice-free” electrification mechanisms have been proposed to account for this activity: fractocharging, triboelectric charging, radioactive charging, and charging through induction. Yet, the degree to which each mechanism contributes to a jet’s total electrification and how electrification in the gas-thrust region influences electrostatic processes aloft remains poorly constrained. Here, we use a shock-tube to simulate overpres- sured volcanic jets capable of producing spark discharges in the absence of ice. These discharges may be representative of the continual radio frequency (CRF) emissions observed at a number of eruptions. Using a suite of electro- static sensors, we demonstrate the presence of size-dependent bipolar charg- ing (SDBC) in a discharge-bearing flow for the first time. SDBC has been readily associated with triboelectric charging in other contexts and provides direct evidence that contact and frictional electrification play significant roles in electrostatic processes in the vent and near-vent regions of an eruption. Additionally, we find that particles leaving the region where discharges occur remain moderately electrified. This degree of electrification may be sufficient to drive near-vent lightning higher in the column. Thus, near-vent discharges may be underpinned by the same electrification mechanisms driving CRF, Preprint submitted to XXXXXXX August 11, 2021 arXiv:2105.14400v2 [physics.geo-ph] 10 Aug 2021
-
Upload
khangminh22 -
Category
Documents
-
view
0 -
download
0
Transcript of Charge injection into the atmosphere by explosive volcanic ...

Charge injection into the atmosphere by explosive
volcanic eruptions through triboelectrification and
fragmentation charging
Joshua Mendez Harpera, Corrado Cimarellib, Valeria Cigalab, UlrichKueppersb, Josef Dufeka
aDepartment of Earth Science, University of Oregon, Eugene OR, 97403, USAbDepartment fur Geo- und Umweltwissenschaften, Ludwig-Maximilians-Universitat
Munchen, Munich BY, 80333, Germany
Abstract
Volcanic eruptions are associated with a wide range of electrostatic ef-fects. Increasing evidence suggests that high-altitude discharges (lightning)in maturing plumes are driven by electrification processes that require theformation of ice (analogous to processes underpinning meteorological thun-derstorms). However, electrical discharges are also common at or near thevolcanic vent. A number of “ice-free” electrification mechanisms have beenproposed to account for this activity: fractocharging, triboelectric charging,radioactive charging, and charging through induction. Yet, the degree towhich each mechanism contributes to a jet’s total electrification and howelectrification in the gas-thrust region influences electrostatic processes aloftremains poorly constrained. Here, we use a shock-tube to simulate overpres-sured volcanic jets capable of producing spark discharges in the absence ofice. These discharges may be representative of the continual radio frequency(CRF) emissions observed at a number of eruptions. Using a suite of electro-static sensors, we demonstrate the presence of size-dependent bipolar charg-ing (SDBC) in a discharge-bearing flow for the first time. SDBC has beenreadily associated with triboelectric charging in other contexts and providesdirect evidence that contact and frictional electrification play significant rolesin electrostatic processes in the vent and near-vent regions of an eruption.Additionally, we find that particles leaving the region where discharges occurremain moderately electrified. This degree of electrification may be sufficientto drive near-vent lightning higher in the column. Thus, near-vent dischargesmay be underpinned by the same electrification mechanisms driving CRF,
Preprint submitted to XXXXXXX August 11, 2021
arX
iv:2
105.
1440
0v2
[ph
ysic
s.ge
o-ph
] 1
0 A
ug 2
021

albeit involving greater degrees of charge separation.
Keywords: Tribocharging, Volcanic lightning, Size-dependent bipolarcharging
1. Introduction
1.1. Plume lightning and proximal discharges
Investigations over the last two decades reveal that electrical activityin volcanic columns may be broadly characterized into plume lightning andvent/near-vent discharges (Thomas et al., 2007; Behnke et al., 2013; Cimarelliet al., 2016; Aizawa et al., 2016; Van Eaton et al., 2020). The first modal-ity comprises large-scale discharges at elevation in maturing plumes and, inmany regards, is analogous to meteorological lightning (Prata et al., 2020;Van Eaton et al., 2020). Because of the large energies involved, plume light-ning can often be detected with wide-range lightning networks (Van Eatonet al. (2020); Prata et al. (2020)). The second category, vent and near-ventdischarges, are electrical events that neutralize lower amounts of charge perevent and, as their names suggest, occur closer to the volcanic vent (Thomaset al., 2007; Behnke et al., 2013, 2018). Although often lumped together,Behnke et al. (2018) showed that vent and near-vent discharges originatefrom fundamentally distinct breakdown processes. Vent discharges are innu-merable streamer discharges that occur within or directly above the vent andare no more than a few tens of meters in length (Thomas et al., 2007; Behnkeet al., 2013, 2018). With current measurement techniques, these minute dis-charges cannot be detected individually (either at optical or RF wavelengths)or at very great distances. Collectively, however, vent discharges produce acontinuous electromagnetic “hum” (commonly referred to as continual radiofrequency or CRF) that can be observed with instruments like the light-ning mapping array (Thomas et al., 2007; Behnke et al., 2013; Behnke &Bruning, 2015; Behnke et al., 2018). CRF is often detected together withseismic and acoustic signals implying a relationship with explosions and over-pressure conditions at the vent (Note: we will use vent-discharges and CRFsources interchangeably) (Smith et al., 2020). Occurring somewhat higherin the column and later in the eruption, near-vent lightning involves leaderdischarges that can have lengths between a few hundred meters to severalkilometers and can be detected individually (Aizawa et al., 2016; Cimarelliet al., 2016; Behnke et al., 2018). Although larger than vent discharges,
2

near-vent lightning still moves smaller amounts of charge per event thanmeteorological lightning and, thus, may be invisible to global detection net-works (Vossen et al., 2021). Locally, however, it may produce changes to theambient electric field (Behnke et al., 2018). Aizawa et al. (2016) notes thatmeteorological/plume lightning shares many characteristics with near-ventlightning, hinting that separating both into two categories may be unneces-sary. Nonetheless, an explicit distinction between the two (which we make inthe present work) may be warranted given the likely differences in electrifica-tion mechanisms underlying near-vent and plume/meteorological lightning.
Air flow ~2 m/s
supersonicjet
shock tu
be
nozzleD = 2.8 cm
24
.5 c
m
diverted "plume"
+-
electrostaticseparator
through-typeFaraday sensor
falli
ng
gra
ins
(see Fig. 2b) a(see Fig. 2a)
sparkdischarges
size [mm]
rela
tive f
requency
10 1
1
2
3
100
0.00
0.05
0.10
0.15
0.20
0.25
b
2 m
Figure 1: Experimental setup. a) We generate granular jets with the shock-tube setupdescribed previously in Cimarelli et al. (2014). The jet’s dynamics approximate those in thegas-thrust region of volcanic columns and produce spark discharges. Venting into free air,the “column” is then diverted away from the shock-tube by an air stream. Particles fallingout of the “plume” are then characterized by two electrostatic measurement systems: 1)an electrostatic separator and 2) a through-type Faraday sensor (described in Figure 2aand b, respectively). b) Size distributions for the three samples used in these experimentsas measured by a diffraction analyzer with the following nominal ranges: 1) 90-300 µm,2) 50% 90-300 and 50% 300-1000 mixture µm (by volume), and 3) 300-1000 µm.
An ever growing number of observations suggests that vent and near-ventdischarges –what we will collectively call proximal discharges– are commonduring explosive eruptions (Thomas et al., 2007; Behnke et al., 2013; Aizawaet al., 2016; Cimarelli et al., 2016; Behnke et al., 2018; Smith et al., 2020;Vossen et al., 2021). These observations imply that erupted material charges
3

negative grains
positivegrains
10 kV
-10 kV
Fg
Fd
Fe
a
LMC6081
100 pF
-+
guard
reset switch
falling particle
through-type Fardaday cage
b
Figure 2: Detail of charge characterization subsystems referred to in Figure 1. a) Elec-trostatic separator to asses the charge polarity on particles as a function of size. Settlinggrains fall between two plates with a potential difference of 20 kV between them. Theelectric field separates negative and positive particles and these are collected in two binsat the bottom of the separator. Grains in the bins are then sized using an optical micro-scope and ImageJ. In this manner, we can investigate how negative and positive chargeis partitioned on particles based on size. b) Charge magnitude measurement subsystem.The charge on particles falling out of the “plume” are measured by an array of 8 miniaturethrough-type Faraday cups (TTFC). Each sensor is capable of resolving charges as smallas <10 femto-Coulombs (fC). See (Mendez Harper & Dufek, 2016; Mendez Harper et al.,2018b) for more details.
4

efficiently within the conduit and in the jet-thrust region. Furthermore, thereis evidence that proximal discharges contain valuable information about thesource of the eruption. For instance, CRF is only detected with forcingat the vent and occurs within the gas-thrust region (Behnke et al., 2018;Smith et al., 2020). Smith et al. (2020) demonstrated this fact by showingthat CRF can be correlated with the acoustic and seismic signals associatedwith active fragmentation. Experimentally, Mendez Harper et al. (2018a)showed that the location and timing CRF emissions reflect the geometryand temporal evolution of barrel shock structures in supersonic jets. Thesespatiotemporal constraints suggest CRF is a valuable tool to detect incipienteruptions (Behnke et al., 2018). Regarding near-vent lightning, Cimarelliet al. (2016) indicate that the number of discharges is proportional to theover-pressure at the vent. These authors conclude that the intensity of near-vent electrical activity scales with the energy of eruptions. Furthermore,Aizawa et al. (2016) argue that the volumetric charge density in proximal jetsmay be much larger than that in thunderstorms. Because of these elevatedcharged loadings, the proximal regions of the volcanic system may also beinterrogated using active methods such as GNSS occultation (Mendez Harperet al., 2019). Using an array of electrostatic instruments, Behnke et al. (2018)report complex feedback mechanisms between CRF sources and larger near-vent discharges, suggesting that both forms of discharge may depend on ashared charge budget.
Nonetheless, the physical, chemical, and dynamical processes that chargepyroclasts within the conduit and the gas-thrust region remain poorly con-strained. Ice and graupel are generally absent in any large quantities (Cimarelliet al., 2016; Vossen et al., 2021). Thus, in contrast to volcanic lightning at al-titude (Van Eaton et al., 2020; Prata et al., 2020), electrification mechanismscomparable to those in thunderclouds cannot account for electrical activitynear the vent. Instead, proximal discharges likely reflect “dry” charging pro-cesses operating with varying degrees of efficiency within the conduit and anexpanding jet.
Starting at depth, material possibly charges during the brittle failure ofthe magmatic column and subsequent disruptive clast-clast collisions (Jameset al., 2000). Fractocharging may involve a number of pathways, includingpiezoelectricity, pyroelectricity, atomic dislocations, positive-hole activation,and the release and capture of positive and negative ions as new surfaces arecreated (Dickinson et al., 1981; Xie & Li, 2018). James et al. (2000) fracturedpumice through repeated impacts and abrasion and found that fragments
5

carried elevated surface charge densities. Quite recently, Smith et al. (2018)found that eruptions producing more equant grains were associated withCRF, perhaps suggesting that milling (secondary fragmentation) plays a rolein vent-discharges. It is worth noting that, although the fracture mechanismis often invoked to account for electrification in the near-vent region, not asingle experimental follow up work has been conducted on the matter usingnatural materials (pumice) in the last 20 years. As such, fractochargingis perhaps the least-well understood “major” charging mechanism in thevolcanic context.
Non-disruptive collisions may too lead to electrification through the well-known (but imperfectly understood) triboelectric effect (Hatakeyama & Uchikawa,1951; Kikuchi & Endoh, 1982; Aplin et al., 2014; Mendez Harper & Dufek,2016; Mendez Harper et al., 2017, 2020, 2021). Importantly, not only doestriboelectricity have the ability to produce efficient charging in a granular ma-terial, but may separate charges of opposite polarity based on particle size(Hatakeyama & Uchikawa, 1951; Kikuchi & Endoh, 1982; Zhao et al., 2003;Forward et al., 2009; Waitukaitis et al., 2014). Indeed, triboelectric charg-ing often results in smaller, negatively-charged grains and larger grains withgenerally positive charges. This phenomenological feature, size-dependentbipolar charging (SDBC), may be critical in the production of discharges inproximal volcanic jets (and other dusty planetary environments) as particlesof different sizes and opposite charge become separated through hydrody-namics (Cimarelli et al., 2014) or sedimentation (Harrison et al., 2016).
A handful of studies have been explicitly designed to investigate tribo-electric SDBC using volcanic materials. Forward et al. (2009) employed afluidized bed to electrify basalt particles under partial vacuum. This study,however, used heavily altered materials to approximate Martian regolithsrather than recently erupted ash. Nonetheless, serendipitous reports of size-dependent bipolar charging in chemically-unmodified volcanic ash exist inthe literature. Many of these observations were not placed within the mod-ern framework of triboelectrification simply because the models had not yetbeen formulated. Hatakeyama & Uchikawa (1951) studied the frictional elec-trification of Aso and Asama ash samples. Those investigators reported stan-dard SDBC –that is positive large grains, negative small grains– in Aso ash.However, the Asama ash samples displayed inverse SDBC (negative largegrains, positive small grains). In these experiments, particles were allowedto contact foreign objects (an aluminum plate, for example), possibly bias-ing the polarity of the charge in manners that would not be encountered
6

in natural systems. Thirty years later, Kikuchi & Endoh (1982) conductedsimilar experiments and found standard SDBC in ash particles from the1977 Usu eruption. At Sakurajima, Miura et al. (2002) measured changesin the atmospheric potential gradient associated with small explosive eventsand estimated the surface charge density and polarity of ash falling out ofplumes using an electrostatic separator (a method similar to the one we de-scribe below). Those authors report particles with surface charge densitiesapproaching the ionization limit (10-6 - 10-5 Cm-2) and standard SDBC.
In addition to tribo- and fractoelectric processes, other mechanisms havebeen proposed to account for proximal discharges. Pahtz et al. (2010) sug-gests that materials like volcanic ash and mineral dust could charge throughthe polarizing effects of an ambient electric field. Aplin et al. (2014) provideevidence that the decay of radioactive elements in the magma may lead to“self-charging” of ash. Very recently, Nicoll et al. (2019) deployed sensorsinto a plume at Stromboli, finding that the gas phase itself is charged.
Building monitoring tools that effectively leverage proximal electrical ef-fects requires a better understanding of the mechanisms that charge py-roclasts. Accomplishing such a feat, however, is complicated by the factthat much uncertainty remains regarding proposed electrification mecha-nisms themselves. For instance, while triboelectrification has been describedsince the time of the ancient Greeks, we have yet to unequivocally identifythe charge carriers being exchanged during frictional interactions (Lacks &Sankaran, 2011; Lacks & Shinbrot, 2019). These charge carriers could beelectrons, ions, or both. Similarly, some authors have presented evidencethat triboelectrification arises from surface damage at minute spatial scales,implying that contact and frictional electrification are ultimately forms offragmentation charging (Pan & Zhang, 2019; Lacks & Shinbrot, 2019).
Beyond questions surrounding the charging mechanisms that putativelydrive vent and near-vent discharges, little is known about how proximal elec-trification influences the long term electrostatic evolution of the eruptive col-umn. One possibility is that pyroclasts advected high into the atmosphereretain charge generated in the conduit and the gas-thrust region. This “pre-charging” may have important consequences for subsequent electrical effects,as some work indicates that charging in a granular material depends on pre-existing electric fields (e.g. Pahtz et al. (2010)). A second possibility is thatthe abundance of proximal discharges effectively neutralizes charge gained ator near the vent. Recombination in the gas-thrust region would imply that“downstream” lightning storms in mature plumes generally necessitate addi-
7

groundednozzle
intra-jetdischarge jet to
nozzle discharge
negative grainspositive grains
a c
2.8 cm
b
jet tonozzle discharge
intra-jetdischarges
2.8 cm
Figure 3: a) Schematic showing two kinds of discharge in the experiments. 1) Intra-jetdischarges occur between grains or clusters of grains of opposite polarity. 2) Jet to nozzledischarges occur between the charged grains and grounded metallic nozzle. b) Typicalintra-jet discharges in an experiment with the 90-300 µm particle size distribution. c) Jetto nozzle discharge in the same experiment as b).
tional cycles of electrification (perhaps driven by ice) and reflect little abouteruption dynamics at the source. Evidence for this second hypothesis ex-ists in field data collected at Augustine (Thomas et al., 2007) and Redoubt(Behnke et al., 2013), which show that electrical activity waned after theinitial explosive phases. These periods of electrical inactivity could signifythat volcanic columns emerge from the gas-thrust region with weak degreesof charging. The resumption of electrical activity in mature plumes couldindicate activation of water-based electrification mechanisms (Prata et al.,2020; Van Eaton et al., 2020).
Here, we use a shock-tube to simulate explosive, overpressured volcanicjets and address a subset of the questions posed above. Our setup allowsus to investigate the charge mechanisms that drive CRF sources and makeinferences regarding subsequent near-vent lightning. For the first time, weidentify nominal size-dependent bipolar charging in a simulated volcanic jetbearing streamer discharges. SDBC in our shock-tube experiments providesdirect evidence that tribocharging is a dominant electrification mechanismin the gas-thrust region. Additionally, we find that particles emerging fromthe supersonic flow carry charge densities comparable to those measured on
8

grains falling out of proximal volcanic columns (e.g. Gilbert et al. (1991);Miura et al. (2002)). Further analysis shows that this amount of chargemay be sufficient to drive near-vent lightning. As such, our results indicatethat near-vent lightning is likely underpinned by the same electrificationmechanisms as CRF sources, but reflects larger scale charge separation incolumns.
2. Methodology
We use the shock-tube setup described previously by Cimarelli et al.(2014) to produce artificial volcanic discharges (Figure 1a). The shock-tube(24.5 cm in length, 2.8 cm in diameter) was loaded with approximately 75 mlof volcanic ash and then pressurized to 10 MPa with argon gas. Exceedingthis pressure ruptures a set of two diaphragms, causing the granular mate-rial to be ejected from the tube by explosive decompression. The dynamicsof the decompression event and the resulting supersonic jet simulate thoseexpected in the conduit and gas-thrust region of a volcanic jet (Cimarelliet al., 2014; Gaudin & Cimarelli, 2019). This apparatus has the abilityto charge pyroclasts through two principal mechanisms: fractoelectrifica-tion and tribocharging. The contributions from other putative electrificationmechanisms such as radioactive decay or induction are excluded.
Unlike previous efforts in which the shock-tube vented into a metallic col-lection chamber, we allowed the jet to expand into a large room to minimizecollisions between grains and foreign surfaces. A low-powered air stream witha velocity of 2 m/s was generated perpendicular to the flow at a height of 1 mabove the nozzle (∼80 cm above the Mach disk). This artificial “wind” wasused to deflect lofted particles away from the ejection axis (see schematicin Figure 1a). Pushed away from the shock-tube and falling under theaction of gravity, grains were sampled by two devices: 1) an electrostaticseparator (ESS) and 2) an array of eight miniature through-type Faradaycages (TTFC) capable of measuring the charge on individual grains . Boththe ESS and TTFC array were placed 1.5 m downwind of the nozzle. Wenote that a principal source of error associated with this methodology is thatthe size distribution of sampled particles may be different from that of theoriginal sample. As discussed in Cimarelli et al. (2014), experimental flowscomposed of larger particles are dominated by inertia. Thus, these particleswere difficult to deflect using the artificial wind. Additionally, if success-fully deflected, larger particles may fall out of the plume before they reach
9

the sensors. We attempted to compensate for these effects by strategicallyplacing the sensors in the proximity of the shock-tube, but we note thatthe constraints of the laboratory environment could not completely alleviatethem. The overall result is that our measurement technique is better suitedto characterize samples with fine grain size distributions.
The ESS consists of two vertical, sub-parallel, 1 m-long copper plateswith a potential difference of 20 kV between them (See Figure 2a). Whena charged particle passes between these plates, its trajectory is modified bythe imposed electric field. Negatively-charged grains are diverted towardthe positive plate, whereas grains carrying positive charge drift toward thenegative plate. Thus, particles were separated by polarity and collectedin two bins placed at the base of the separator. We then characterized theparticles with an optical microscope to obtain spherical-equivalent diameters.
The TTFC array was micromachined directly onto a printed circuit board.Each Faraday cup has an aperture of 1 mm and is capable of measuringcharges <10 fC. A simplified schematic for a single channel of the TTFC isshown in Figure 2b. When a particle traverses the sensing volume of oneof the TTFC channels, an amplifying stage produces a voltage pulse whosemagnitude is proportional to the charge on the particles. This output voltagewas digitized by a National Instruments NI-6008 data acquisition unit and aPC running LabVIEW.
Each shock-tube decompression event was recorded with a high-speedcamera at a frame rate of 36,000 fps, allowing us to capture discrete sparkdischarges in the flow. We employed washed and sieved pumice quarriedfrom deposits of the 13 ka Laacher See maar eruption in the Eifel VolcanicField (Germany) with three different granulometries: fine (nominally 90-300µm), coarse (nominally 300-1000 µm), and medium (a 50/50 mixture byvolume of the fine and coarse samples). Particle size distributions beforethe experiments were obtained with a Coulter LS230 laser sizer. Becausethe number of particles sampled per experiment by both the ESS and theTTFC is relatively low, we repeated each experiment four times with eachgranulometry.
3. Results and discussion
3.0.1. Electrical discharges
All experimental jets produced electrical discharges. A typical electricalspark in an experiment using the 90-300 µm sample is rendered in Figure 3.
10

10 1 1000.00
0.05
0.10
0.15
0.20
0.25
0.30
10 1 100
size [mm]
0.00
0.05
0.10
0.15
0.20
0.25
0.30
10 1 1000.00
0.05
0.10
0.15
0.20
0.25
0.30
collected
original
original
collected
collected
original
90-300/300-1000 μm
300-1000 μm
90-300 μm a
b
c
rela
tive f
requency
rela
tive f
requency
rela
tive f
requency
n = 4923
n = 1970
n = 356
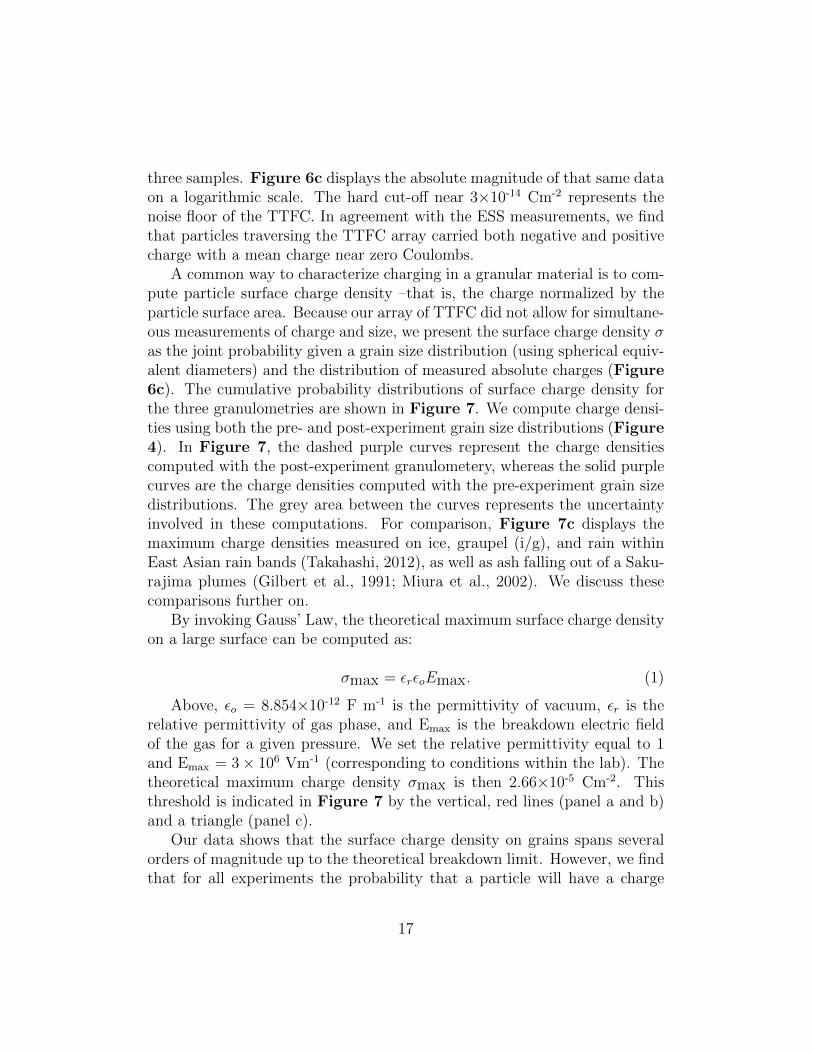
Figure 4: Particle size distributions for particles collected in the electrostatic separator(dotted green, filled) and original sample (solid black, unfilled); a) 90-300 µm; b) 90-300and 300-1000 µm (at 1:1 weight ratio); and c) 300-1000 µm. The number of particlescharacterized per collected sample is indicated in the top right of each panel.
11

We observed discharges exclusively within the region of rarefying jet expan-sion as described by Mendez Harper et al. (2018a) (we note that dischargescould have also occurred within the shock-tube itself, but we were unable toimage these). As reported by Cimarelli et al. (2014) and Gaudin & Cimarelli(2019), we find that the number of discharges generally increased with theproportion of fines. Experiments with the fine granulometry displayed in-numerable small discharges, whereas jets with coarse particles produced nomore than a dozen discharges events per experiment. Cimarelli et al. (2014)suggest that these distinct behaviors underscore differences in gas-particlecoupling between experiments. Specifically, in jets with abundant fines par-ticles cluster in turbulent eddies. Conversely, in experiments with coarsegrains, the motion of particles remains collimated by inertia. These dynam-ics depend on SDBC.
We clarify that the discharges we observe in our experiments are notrepresentative of large scale lightning, volcanic or otherwise. The small sparksdescribed here and in previous works (e.g. Gaudin & Cimarelli (2019); Sternet al. (2019)) are cold plasma channels or corona streamers, rather thanhighly conductive, hot leaders. Many of us have experienced the (startling)effects of streamers when reaching for a doorknob after scuffing our shoes ona carpeted floor. As noted above, Behnke et al. (2018) hypothesize that CRFmay be the collective manifestation of many streamers occurring at the ventof an erupting volcano. We consider the discharges in our experiments to belaboratory analogs of these CRF-generating streamers.
3.1. Grain size distributions
Particles in the jet were diverted by a horizontal air stream toward anelectrostatic separator and a Faraday cup array. We sized the grains thatfell into the ESS using an optical microscope. The size distributions for eachsample are rendered in Figure 4 (green, filled curves). These histogramsaggregate data from four shock-tube experiments. For reference, the pre-experiment size distributions as measured by a diffraction-based size analyzerare also displayed in Figure 4 (unfilled, solid curves).
By comparing the pre- and post-experiment histograms in Figure 4, wesee that the experimental process modified the original size distributions intwo principal ways. Firstly, as discussed above, smaller particles were di-verted in greater number than larger ones by the stream of air. Thus, thematerial collected in the ESS was biased toward the smaller grains. Sucheffect was more noticeable for samples containing particles in the 300-1000
12

µm size range (Figure 4c and b). Furthermore, the total number of parti-cles collected by the separator decreased as the abundance of large particlesincreased (we report the total number of particles sampled in the upper rightcorners of panels in Figure 4c). A second effect, evident in Figure 4,was the presence of particles smaller than the smallest grain in the originalsample. This implies that some amount of material was disrupted duringthe decompression event and/or subsequent transport (Dufek et al., 2012).These two effects are worth considering as we discuss the possible electrifi-cation mechanisms present in our experiments.
3.2. Size-dependent bipolar charging
Grains leaving the spark-bearing jet fell through the ESS (Figure 1b),where they passed through a strong electric field and were separated bycharge polarity. The size distributions for the negative and positive samplesfor each granulometry as measured using an optical microscope are shown inFigure 5 (negative: unfilled, blue curves; positive: filled, red dotted curves).Again, each histogram aggregates data from four separate experiments. Thesums of these histograms result in the total post-experiment histograms inFigure 4. For both the small and medium distributions, we observe clearsize-dependent bipolar charging. Negatively charged particles (blue, unfilledhistograms in Figure 5) were more likely to have smaller diameters thanpositively charged grains (red, filled histograms). We did not detect statis-tically significant SDBC in the large sample. We suspect that this absencestems from the sampling limitations discussed above rather than the chargingcharacteristics of the granular sample itself.
This partitioning of charge polarity among particles of different sizes inthe small and medium samples is consistent with previous descriptions oftriboelectricity in granular materials (Zhao et al., 2003; Forward et al., 2009;Waitukaitis et al., 2014; Toth III et al., 2017). As noted by Forward et al.(2009), such size effect appears to be a universal characteristic of chemically-homogeneous triboelectrification. Yet, despite the large number of worksthat report SDBC, the microphysical processes that cause particles of differ-ent sizes to concentrate charge of opposite polarities remain obscure. Someauthors have invoked an exchange of trapped electrons between surfaces toaccount for SDBC (Lacks & Levandovsky, 2007; Forward et al., 2009). Thetrapped electron model proposes that all material surfaces have electronscaught in unfavorable high-energy states. Surfaces are also assumed to havean even larger number of empty, low-energy states. For insulating particles,
13

a
10 1 100
size [mm]
0.00
0.05
0.10
0.15
0.20
0.25
0.30
rela
tive f
requency
10 1 1000.00
0.05
0.10
0.15
0.20
0.25
0.30
rela
tive f
requency
10 1 1000.00
0.05
0.10
0.15
0.20
0.25
0.30
rela
tive f
requency
90-300 μm
90-300/300-1000 μm
300-1000 μm
nneg = 880npos = 1663
nneg = 383npos = 561
nneg = 86npos = 66
b
c
Figure 5: Particle size distributions for positive (red, filled) and negative (blue, empty)particles collected by the electrostatic separator; a) 90-300 µm; b) 90-300 and 300-1000 µm(at 1:1 weight ratio); and c) 300-1000 µm. Number of positive (npos) and negative (nneg)particles analyzed are reported in the red and blue text respectively. Charge partitioningamong particles of different sizes occurs for all granulometries, but is more pronounced forthe samples containing small particles (90-300 µm).
14

high- and low-energy states on the same particle surface cannot readily re-combine because of the material’s low conductivity. When two particles arebrought into contact, however, there is a finite probability that a trappedelectron on one surface will transfer to a low-energy state on another. Al-though particles of different sizes have the same density of trapped electrons,the net number of trapped electrons should scale with particle size. Thus,after a comparatively low number of contacts, smaller particles may becomedepleted in high-energy, donor electrons. Yet, small particles may continueto fill vacant, low-energy states with electrons transferred from large parti-cles. Over time, there is a net transfer of negative charge from electron-rich,large particles to smaller ones (Lacks & Levandovsky, 2007; Forward et al.,2009).
Despite the trapped electron model’s ability to account for the generalfeatures of same-material tribocharging, Waitukaitis et al. (2014) have arguedthat the density of trapped, donor electrons on surfaces may be insufficientto produce the degrees of charging observed in granular media. Recent workposits that, rather than electrons, the main charge carriers exchanged duringparticle-particle collisions are water ions (Gu et al., 2013). This water ionpartitioning model brings attention to water films that naturally exist onmost surfaces in atmosphere. Within these films, water molecules undergoself-ionization to produce OH- and H+. During grain-grain collisions, somemechanical energy is converted to heat. The temperature of smaller particlesclimbs faster than that of larger grains. Because H+ has a higher mobil-ity than the heavier OH-, positive charge is able to efficiently migrate froma warm, small grain to a large, cool grain. Thus, the water ion partition-ing model leads to the same qualitative conclusion as the trapped electronmodel: small, negative particles and large, positive particles. Ultimately, themechanisms that bring about SDBC in granular media are an area of activeresearch and it is difficult to point to a single mechanism with any certaintyat this time.
While SDBC may be a diagnostic property of triboelectrification, we con-sider whether such phenomenon occurs in other electrification mechanismsas well. Such attention is warranted because the ESS collected particlessmaller than the smallest grains in the original sample (this effect is partic-ularly evident in the experiments with the large granulometry; see Figure5c). The presence of these fine particles –presumably produced by the dis-ruption of larger particles during the decompression events– suggests thatsome amount of fragmentation charging was active during each experiment.
15

In the context of fractocharging, charge partitioning based on size has beenreported at least once. By breaking a variety of pumice samples, Jameset al. (2000) found that larger and smaller fragments gained opposite chargepolarities. This fracto-SDBC, however, varied significantly from that gen-erally observed in frictional electrification. Foremost, James et al. (2000)found that (in general) larger fragments carried negative charge, whereassmall particles charged positively–opposite to that associated with triboelec-tricity. Additionally, the authors deduced that fracto-SDBC reflects longer,secondary processes –namely, the asymmetric capture of positive ions byparticles settling at different velocities– rather than charge rearrangementsoccurring during the fracture process itself. James et al. (2000) themselvesnoted that charge polarity segregation is not likely to occur during fragmen-tation because “any section of fracture surface has no knowledge of the size ofparticle to which it is attached.” Thus, while fractocharging may efficientlyproduce elevated charge densities on newly-formed surfaces, the polarity ofany given fragment immediately after fracture may involve greater stochas-ticity. Such behavior stands in contrast to tribo-SDBC, where charge parti-tioning is believed to occur at the moment two surfaces touch and separate.The expedient nature of SDBC has been demonstrated explicitly in free-fallexperiments using high-speed videography (Waitukaitis et al., 2014). Thoseinvestigations reveal charge and charge separation processes occurring onmillisecond timescales and imply faster rates for granular media with highergranular temperatures. Conversely, charge partitioning in the fracture mech-anism seems to depend on how fast fragments can scavenge ions. James et al.(2000) report minute-long timescales for this process. Ultimately, whetheror not SDBC is an inherent property of fractoelectric charging (or any othermechanism), as it appears to be in triboelectric ones, remains an open ques-tion and should be the focus of future dedicated studies.
3.3. Charge density on fallout
The ESS allowed us to determine the distribution of charge polarity ongrains falling out of the diverted jet, but not charge magnitude. We usedan array of 8 through-type Faraday cups to assess the charge magnitudeon particles (Figures 1a and 2b). Particles traversing the sensing volumeof a cup produced voltage pulses at the output of an amplification circuit(exemplified in Figure 6a). The amplitudes of the pulses were proportionalto the charge on the sampled particles. The histograms in Figure 6b showthe distributions of charge on particles in four experiments for each of the
16
three samples. Figure 6c displays the absolute magnitude of that same dataon a logarithmic scale. The hard cut-off near 3×10-14 Cm-2 represents thenoise floor of the TTFC. In agreement with the ESS measurements, we findthat particles traversing the TTFC array carried both negative and positivecharge with a mean charge near zero Coulombs.
A common way to characterize charging in a granular material is to com-pute particle surface charge density –that is, the charge normalized by theparticle surface area. Because our array of TTFC did not allow for simultane-ous measurements of charge and size, we present the surface charge density σas the joint probability given a grain size distribution (using spherical equiv-alent diameters) and the distribution of measured absolute charges (Figure6c). The cumulative probability distributions of surface charge density forthe three granulometries are shown in Figure 7. We compute charge densi-ties using both the pre- and post-experiment grain size distributions (Figure4). In Figure 7, the dashed purple curves represent the charge densitiescomputed with the post-experiment granulometery, whereas the solid purplecurves are the charge densities computed with the pre-experiment grain sizedistributions. The grey area between the curves represents the uncertaintyinvolved in these computations. For comparison, Figure 7c displays themaximum charge densities measured on ice, graupel (i/g), and rain withinEast Asian rain bands (Takahashi, 2012), as well as ash falling out of a Saku-rajima plumes (Gilbert et al., 1991; Miura et al., 2002). We discuss thesecomparisons further on.
By invoking Gauss’ Law, the theoretical maximum surface charge densityon a large surface can be computed as:
σmax = εrεoEmax. (1)
Above, εo = 8.854×10⁻¹² F m-1 is the permittivity of vacuum, εr is therelative permittivity of gas phase, and Emax is the breakdown electric fieldof the gas for a given pressure. We set the relative permittivity equal to 1and Emax = 3 × 10⁶ Vm-1 (corresponding to conditions within the lab). Thetheoretical maximum charge density σmax is then 2.66×10⁻⁵ Cm-2. Thisthreshold is indicated in Figure 7 by the vertical, red lines (panel a and b)and a triangle (panel c).
Our data shows that the surface charge density on grains spans severalorders of magnitude up to the theoretical breakdown limit. However, we findthat for all experiments the probability that a particle will have a charge
17

0 0.5 1 1.5 2 2.5 3 3.5
time [s]
-0.6
-0.4
-0.2
0
0.2
0.4
char
ge [p
C]
0.6
individual particles
90-300/300-1000 μm300-1000 μm
90-1000 μmb c
6 4 2 0 2 4 6
charge [pC]
0.0
0.1
0.2
0.3
0.4
rela
tive f
requency
charge [C]10 14 10 13 10 12
0.000
0.025
0.050
0.075
0.100
0.125
0.150
0.17590-300/300-1000 μm300-1000 μm
90-1000 μm
a
Figure 6: a) Output from one TTFC amplifying stage. Each pulse is representative ofthe charge on an individual grain traversing the sensing volume. b) The distribution ofsurface charge on individual particles for each granulometry (dashed blue: 90-300 µm;solid grey: 90-300/300-1000 µm; dotted red: 300-1000 µm). The distributions representthe aggregation of data collected across four experiments. Particles charge both positivelyand negatively and had mean charges near 0 Coulombs. c) Same as b) but plotted on alogarithmic scale (absolute charge).
18

charge density [Cm 2]
10 8 10 7 10 6 10 5 10 4 10 3
0.0
0.2
0.4
0.6
0.8
1.0
pro
babili
ty
10 8 10 7 10 6 10 5 10 4 10 3
0.0
0.2
0.4
0.6
0.8
1.0
pro
babili
ty
a
b
pre-exp.post-exp.
bre
akd
ow
n lim
it
c10 8 10 7 10 6 10 5 10 4 10 3
0.0
0.2
0.4
0.6
0.8
1.0
pro
babili
ty
ashb,craina
i/ga
Figure 7: Cumulative probability distributions of surface charge density for the threesamples as inferred from the size distributions in Figure 4 and charge distributions inFigure 6. Note that this surface charge density calculation was done for both the pre-and post-experiment size distributions. a) 90-300 µm; b) 90-300 and 300-1000 µm (at1:1 weight ratio); and c) 300-1000 µm. The vertical red lines in panels a) and b) andthe triangle in panel c) indicate the theoretical maximum surface charge density for largesurfaces (Equation 1). The horizontal bars in panel c) indicate the ranges of surfacecharge densities measured on particles in the field: ice and graupel (abbreviated i/g)(Takahashi, 2012), rain (Takahashi, 2012), and volcanic ash (Gilbert et al., 1991; Miuraet al., 2002).
19

density exceeding this threshold ranges between 2% and 13% depending onthe grain size distribution (pre- or post-experiment) used to compute thesurface charge density distributions. In other words, particles falling out ofthe diverted plume are overwhelmingly under-saturated in charge accordingto Equation 1. This apparent under-saturation may result from the factthat we characterized the charge on grains after they transited the region ofthe jet where discharges occur. As such, we may be measuring only a fractionof the initial charge generated during the decompression event. Indeed, asdescribed in Mendez Harper et al. (2018a), the compressible gas dynamicswithin the barrel shock may lead to a region of weakened dielectric strengthin which particles are forced to shed charge. However, as noted in Gilbertet al. (1991), particles in dry granular media are rarely observed to carrysurface charge densities exceeding 10-5 Cm-2. Apparent low surface chargedensities on individual grains may simply result from how charge carriers ar-range themselves on dielectric surfaces. Baytekin et al. (2011) demonstratedthat charge may not be distributed uniformly on insulating surfaces. Owingto their high surface resistivities, charged dielectrics can display coexistingregions of high and low surface charge density. Furthermore, these areas neednot be of the same polarity. Because a TTFC measures the net charge ona particle passing through its sensing volume, the sensor cannot resolve dis-tinct regions of negative and positive charge on grains even if those individualareas have charge densities close to the breakdown limit.
Interestingly (and for comparison), measurements of charge on hydrome-teors in thunderclouds reveal that ice, graupel, and rain may carry net chargedensities substantially higher than those carried by silicate grains (Figure7c). Takahashi (2012), for instance, revealed that 500 µm ice and graupelparticles in East Asian rainbands had charges as high as 100 pC, implyingsurface charge densities in excess of 10-4 Cm-2. These elevated particle chargedensities indicate that ice-based charging mechanisms in thunderstorms maybe more efficient than dusty triboelectrification.
4. Implications for electrical processes in volcanic jets
4.1. Charging mechanisms in the near vent region
Although size-dependent bipolar charging has been described before inmobilized volcanic ash (Hatakeyama & Uchikawa, 1951; Kikuchi & Endoh,1982; Miura et al., 2002), our experiments are the first (as far as we are aware)to detect this charge partitioning in spark discharge-bearing granular flows.
20

The presence of SDBC in our shock-tube experiments, designed to replicatethe dynamical conditions in the conduit and gas-thrust region, provides di-rect evidence that tribocharging is a primary electrification mechanism innear-vent volcanic jets and may be responsible for proximal discharges. Al-though, Behnke et al. (2018) found that changes to ambient electric fieldsare absent during continual RF emissions (indicating that overall negativeand positive regions in a jet have not yet formed), Cimarelli et al. (2014)suggest that centimeter to meter long filamentary discharges would still re-quire some amount of charge separation on small spatial scales. Such chargeseparation may be driven by turbulent eddies in the flow. Furthermore, thisclustering needs to occur on relatively short timescales (a few milliseconds inthe case of our shock-tube). Size-dependent triboelectrification meets thesecriteria given that collisions simultaneously generate charge and distributecharges of opposite polarities among grains of different size (Waitukaitis et al.,2014). Simulations of triboelectricity in granular materials (e.g. Duff & Lacks(2008)) imply that the speed at which these co-joined processes occur scaleswith collision frequency. Because of the high particle loading and turbulentkinematics in the gas-thrust region, we suspect that tribocharging and chargeseparation rates may be very efficient in incipient jets.
Other proposed “ice-free” mechanisms may also generate high levels ofcharge on short timescales within the gas-thrust region. The fragmentationof the magma column or disruptive clast-clast collisions, for example, likelyelectrify fragments across periods of micro- or even nanoseconds (the durationof active crack propagation). Yet, available experimental data indicates thatthe segregation of negative from positive fragments happens independentlyof the fragmentation process and may require substantially longer periodsto manifest (James et al., 2000). Thus, the rapid clustering of negative andpositive particles based on size described above may not occur. However,CRF could also be produced by smaller discharges than the proposed 1-10m sparks in volcanic columns or even the cm-scale discharges in our shock-tube jets. Indeed, Mendez Harper et al. (2021) have electronically observedspark discharges in granular basalt flows with poor sorting. Unlike the sparkdischarges in our shock-tube which can be observed directly with an antennaconnected to an oscilloscope, the discharges reported in Mendez Harper et al.(2021) require an amplification stage to be detected. Wurm et al. (2019),working in the context of discharges in Martian dust storms, hypothesizethe existence of micro-scale discharges between individual grains or glowdischarge between a grain’s surface and the atmosphere. These grain-grain
21

discharges would require very little clustering and could be driven directly bythe high levels of charging associated with fractoelectrification. Whether ornot the collective action of such minute discharges could produce or enhanceCRF would be an interesting topic for future research.
Because our shock-tube does not simulate dynamics beyond the gas-thrustregion and each experiment lasts a few milliseconds, we cannot directly com-ment on any longer charge segregation processes. Nonetheless, field data sug-gests that these may become important as jets evolve into buoyant plumes.Miura et al. (2002) characterized changes in the local electric field duringsmall explosions at Sakurajima. Based on these measurements and assess-ment of charged fallout, they conclude that Sakurajima plumes consistedof a principal negative charge layer sandwiched between two positive layers.Miura et al. (2002) suggest that this positive-negative-positive arrangementcomprises a lower region of coarse, positive particles, a middle section of fine,negatively-charged ash, and a top layer of positive gas or aerosols. The chargeseparation in the two lowermost layers is consistent with standard SDBC as-sociated with triboelectrification. However, current triboelectric models andour data cannot account for the topmost layer. Such layer may originate frommaterial fracture, as described by James et al. (2000), or the decay of radongas (Nicoll et al., 2019). The low elevations of Sakurajima plumes (< 4 km),as also observed by more recent studies (Cimarelli et al., 2016; Vossen et al.,2021), make it unlikely that ice-based charging mechanisms were responsiblefor observations made by Miura et al. (2002). Together, our experimentaldata, that of James et al. (2000), and field observations suggest that proxi-mal discharges are driven by triboelectrification in conjunction with anothermechanism–likely fractoelectrification.
4.2. Electrical effects beyond the gas thrust region
Although our shock-tube experiment does not replicate the physics un-derlying the generation of near-vent lightning, the measurements of chargedparticles falling out of a simulated jet allow us to make basic inferences aboutthe electrostatic conditions downstream of the gas-thrust region. Given thatnear-vent lightning tends to occur immediately after or even concurrentlywith CRF discharges (Behnke et al., 2018), it may be reasonable to assumethat both electrical phenomena are driven by the same electrification mech-anisms.
Observations at Sakurajima reveal that near-vent discharges, with lengthsranging between 10-400 m, are essentially scaled-down equivalents of thun-
22

106 10710 6
10 5
10 4
10 3
part
icle
siz
e [
mm
]
mass loading
106 10710 6
10 5
10 4
10 3σp = 10-6 Cm-2
106 107
number density [m 3]
10 6
10 5
10 4
10 3
part
icle
siz
e [
mm
]
Rc = 5 m, 3 MVm-1
106 107
number density [m 3]
10 6
10 5
10 4
10 3Rc = 50 m, 3 MVm-1
13
11
9
7
5
3
1
log
volu
me fra
ction
12.0
10.4
8.8
7.2
5.6
4.0
8
7
6
5
4
3
2
1
0
1 log
charg
e d
ensity
[Cm
-2]
8
7
6
5
4
3
2
1
0
1
log
vol. ch
arg
e d
ensity
[Cm
-3]log
charg
e d
ensity
[Cm
-2]
Takahashi 2012
σp = 10-5 Cm-2
σp = 10-5 Cm-2
ϕp = 10-6
ϕp = 10-2
ϕmin
ϕmin
ϕmax
ϕminϕmax
ϕmin
ϕmax
a b
c d
thunderclouds
near-vent columnsaway from
vent
Figure 8: Breakdown criteria for a volcanic ash cloud. a) Mass loading as a function of par-ticle size and particle number density. Shaded region denotes mass loadings expected forproximal columns (see references within text). b) Volumetric charge density as a functionof particle size and number density assuming grains with surface charge densities on theorder of 10-6 Cm-2. Shaded upper region indicates expected volumetric charge densities forproximal columns. Shaded lower area indicates range of volume charge densities measuredin thunderclouds (Takahashi, 2012). c) Surface charge densities required to produce anelectric field at the edge of the region of 3 MVm-1 as function of particle size and numberdensity. Region radius set to 5 m. d) Same as c) but for a radius of 50 m.
23

derstorm lightning (Aizawa et al., 2016; Cimarelli et al., 2016) (we note that,in general, vent-discharges can be longer than those observed at Sakurajima).Unlike CRF sources, near-vent discharges appear to rely on the presence ofmeso-scale electric fields, indicating the formation of negative and positiveregions in a convectively rising column (Behnke & Bruning, 2015; Behnkeet al., 2018). In their report on Sakurajima near-vent lightning, Aizawaet al. (2016) present a simple model to describe the relationship betweenflash length and volumetric charge density in these regions. Those authorsconclude that near-vent lightning requires small regions of high volumetriccharge density. Here, we take this analysis further using the data from ourexperiments. Assuming each of the charged regions is spherical (radius: Rr,radius: Ar, volume: Vr), we can place first-order constraints on the break-down conditions given the surface charge densities rendered in Figure 7.The electric field Es at the surface of the region must satisfy Gauss’s Law:
Es
∮dAr =
Q(n,Ap, σp)
εrεo. (2)
Above, Q is the total charge in the region, which depends on the numberdensity of grains n, the total particle surface area Ap, and the particle surfacecharge density σp:
Q = σpApVrn. (3)
Let us consider a region where n is in the range of 106-108 m-3 and theparticle diameter is Dp = 10-3-10-6 m. This results in volume fractions span-ning φ = 10-13 - 10-1, the higher portion of which (φmin = 10-5, φmax = 10-2)applies to near-vent volcanic columns (Suzuki et al. (2016); Del Bello et al.(2017); see shaded area in Figure 8a). Assuming any given particle in theregion has a charge density on the order of 10-6 Cm-2 (the typical chargedensity per particle measured on grains falling out of our experimental jetsand that measured on from Sakurajima plumes by Miura et al. (2002)), wecan compute the region’s volumetric charge density as:
ρ = πσpD2pn (4)
This calculation is shown in Figure 8b, where, for comparison, we havealso plotted the volumentric charge densities in conventional thundercloudsas measured by radiosondes (Takahashi (2012) and references therein; shaded
24

area). Despite its simplicity, this analytical model is consistent with infer-ences made by Aizawa et al. (2016) regarding the charge content of Saku-rajima columns. Specifically, we expect the volumetric charge density to bemuch larger in nascent columns (ranging between 10-4 Cm-3 near the ventand 10-7 Cm-3 toward the edge of the gas thrust region) than in conventionalthunderstorms (ranging between 10-10 and 10-8 Cm-3; Takahashi (2012)), de-spite the fact that individual hydrometeors may carry substantially highersurface charge densities than pyroclasts.
We can also estimate the surface charge density per particle required toproduce the breakdown field ES at the surface of the region for given regionsize, particle size, and volume fraction. Solving Equation 2 for the particlecharge density yields:
σp =3EsεrεoπD2
pnRr
. (5)
For demonstration purposes, let us set the surface breakdown field to theclassical ionization limit of Es = 3 MVm-1 (this value would be halved if weare considering two adjacent, oppositely charged regions). We perform thesecalculations for regions with radii of 5 and 50 m (displayed, respectively, inFigure 8c and d), based on the characteristic length of near-vent lightningevents described in Cimarelli et al. (2016) (10s - 100s m). Figure 8c andd show that for jets with volume fractions in the range of φ = 10-6 - 10-2,the particle charge densities measured in our experiments (10-8 - 10-5 Cm-2)would be sufficient to produce edge electric fields on the order of MVm-1. Wenote that maximum electric fields measured in thunderclouds are generallyan order of magnitude smaller than the classical limit, suggesting that light-ning initiation is controlled by processes other than conventional dielectricbreakdown (Petersen et al., 2008). Assuming similar initiation processes injets, individual pyroclasts may not need to carry very high net charge den-sities to meet the lightning initiation criteria if the flow is dense enough (i.e.high mass loading). Additionally, abundant particles may serve to locally en-hance a background field, as has been modelled by a number of authors in thecontext of thunderclouds, reducing the need for extensive, high-magnitudeelectric fields (Dwyer & Uman, 2014).
As a column matures into a plume, the fate of charge gained in gas thrustregion becomes less certain. As noted above, observations at Augustine andRedoubt revealed periods of electrical inactivity following decreases in ratesof vent discharges and near-vent lightning (Thomas et al., 2007; Behnke
25

et al., 2013, 2018). One possibility is that as the column entrains air andexpands, the volumetric charge density decreases to the point where break-down conditions are no longer satisfied. Additionally, eruption columns mayhave be relatively dry during their initial phases. As they cool, however,condensing water, either magmatic or environmental, may promote chargeleakage. Although, the partitioning of ions in water monolayers may be re-quired for size-dependent bipolar charging in homogeneous materials (as wehave discussed above), too much water may have detrimental effects on tri-boelectrification. Indeed, Stern et al. (2019) have shown that the numberof discharges in a simulated, oversaturated volcanic granular flow decreasewith water content (up to 27 wt%). More recently, Mendez Harper et al.(2020) showed that even smaller amounts of water (below the saturationlimit) can reduce the magnitude of triboelectric charging if pyroclasts havehigh residence times in humid environments. Using a fludizied bed, Toth IIIet al. (2017) showed that granular materials still charge at high humidities,but that these conditions effectively nullify SDBC (i.e. a large particle isequally likely to be charged negatively as a small particle). Taking theseresults into consideration, our work suggests that ice-free charging may beextremely efficient at producing charged grains and separating positive andnegative particles from each other in relatively dry flows (that is, during theinitial, hot phase of an eruption or non-hydromagmatic eruptions). However,the condensation of water may rapidly shut off triboelectric or fractoelectricprocesses in volcanic columns by reducing both the magnitude of chargingand the degree to which charge polarity is separated by size. In this respect,further experimental constraints are needed to better determine the role ofwater (and other volatiles) on the size-dependent bipolar charging of volcanicmaterials.
5. Conclusions
We have simulated volcanic jets and proximal electrical phenomena us-ing a shock-tube. To the best of our knowledge, this work demonstrates thepresence of size-dependent bipolar charging in a spark-bearing granular flowfor the first time. The segregation of charge based on particle size has beenassociated with triboelectric charging in numerous granular flows over thelast 30 years. The detection of SDBC in our experiments, together with in-vestigations at Sakurajima, suggests that frictional electrification may playa significant role in driving electrostatic phenomena within the proximal re-
26

gion of a volcanic column. Specifically, triboelectrification, through SDBC,can both efficiently electrify pyroclasts and drive charge separation to setup the electric fields needed for the production of lightning. Our analysis,however, does not rule out other synergistic electrification mechanisms suchas fractocharging or radioactive decay. In fact, field measurements suggestthat triboelectrification alone cannot account for observed charge structuresin small volcanic columns. Additionally, we showed that particles emergingfrom the region where filamentary discharges occur still carry some charge.A first order assessment indicates that particles exiting the gas-thrust re-gion with only a fraction of the theoretical maximum surface charge densitywould still produce regions with volumetric charge densities capable of sus-taining meso-scale lightning. Thus, both vent discharges and larger near-ventlightning may be underpinned by the same electrification mechanisms.
6. Acknowledgments
Joshua Mendez Harper: Conceptualization, Conducted experiments, Hard-ware, Data Analysis, Writing. Corrado Cimarelli: Conceptualization, Con-ducted experiments, Reviewing and Editing. Valeria Cigala: Conducted ex-periments. Ulrich Kueppers: Conducted experiments. Josef Dufek: Concep-tualization, Writing- Reviewing, and Editing.
C.C. acknowledges the support of Deutsche Forschungsgemeinschaft projectCI 254/2-1. J.M.H and J.D. acknowledge the support of NASA SSW 80NSSC19K1211and NASA IDS 1911057Z4.
References
Aizawa, K., Cimarelli, C., Alatorre-Ibarguengoitia, M. A., Yokoo, A.,Dingwell, D. B., & Iguchi, M. (2016). Physical properties of volcaniclightning: Constraints from magnetotelluric and video observations atSakurajima volcano, Japan. Earth and Planetary Science Letters , 444 ,45–55. URL: http://www.sciencedirect.com/science/article/pii/
S0012821X1630111X. doi:10.1016/j.epsl.2016.03.024.
Aplin, K. L., Houghton, I. M. P., & Nicoll, K. A. (2014). Electrical chargingof ash in Icelandic volcanic plumes. arXiv:1404.6905 [physics] , . URL:http://arxiv.org/abs/1404.6905. ArXiv: 1404.6905.
27

Baytekin, H. T., Patashinski, A. Z., Branicki, M., Baytekin, B., Soh, S., &Grzybowski, B. A. (2011). The Mosaic of Surface Charge in Contact Elec-trification. Science, 333 , 308–312. URL: http://science.sciencemag.org/content/333/6040/308. doi:10.1126/science.1201512.
Behnke, S. A., & Bruning, E. C. (2015). Changes to the turbulent kinematicsof a volcanic plume inferred from lightning data. Geophysical ResearchLetters , 42 , 2015GL064199. URL: http://onlinelibrary.wiley.com/
doi/10.1002/2015GL064199/abstract. doi:10.1002/2015GL064199.
Behnke, S. A., Edens, H. E., Thomas, R. J., Smith, C. M., McNutt, S. R.,Van Eaton, A., Cimarelli, C., & Cigala, V. (2018). Investigating the originof continual radio frequency impulses during explosive volcanic eruptions.Journal of Geophysical Research: Atmospheres , 123 , 4157–4174.
Behnke, S. A., Thomas, R. J., McNutt, S. R., Schneider, D. J., Krehbiel,P. R., Rison, W., & Edens, H. E. (2013). Observations of volcaniclightning during the 2009 eruption of Redoubt Volcano. Journal ofVolcanology and Geothermal Research, 259 , 214–234. URL: http://
www.sciencedirect.com/science/article/pii/S0377027311003325.doi:10.1016/j.jvolgeores.2011.12.010.
Cimarelli, C., Alatorre-Ibarguengoitia, M. A., Aizawa, K., Yokoo, A.,Diaz-Marina, A., Iguchi, M., & Dingwell, D. B. (2016). Mul-tiparametric observation of volcanic lightning: Sakurajima Vol-cano, Japan. Geophysical Research Letters , 43 , 2015GL067445.URL: http://onlinelibrary.wiley.com/doi/10.1002/2015GL067445/abstract. doi:10.1002/2015GL067445.
Cimarelli, C., Alatorre-Ibarguengoitia, M. A., Kueppers, U., Scheu, B., &Dingwell, D. B. (2014). Experimental generation of volcanic lightning.Geology , 42 , 79–82. URL: http://geology.gsapubs.org/content/42/
1/79. doi:10.1130/G34802.1.
Del Bello, E., Taddeucci, J., Vitturi, M. d., Scarlato, P., Andronico, D.,Scollo, S., Kueppers, U., & Ricci, T. (2017). Effect of particle volumefraction on the settling velocity of volcanic ash particles: insights fromjoint experimental and numerical simulations. Scientific reports , 7 , 1–11.
28

Dickinson, J., Donaldson, E., & Park, M. (1981). The emission of electronsand positive ions from fracture of materials. Journal of Materials Science,16 , 2897–2908.
Dufek, J., Manga, M., & Patel, A. (2012). Granular disruption during ex-plosive volcanic eruptions. Nature Geoscience, 5 , 561–564. URL: http://www.nature.com/ngeo/journal/v5/n8/abs/ngeo1524.html. doi:10.1038/ngeo1524.
Duff, N., & Lacks, D. J. (2008). Particle dynamics simulations of tribo-electric charging in granular insulator systems. Journal of Electrostatics ,66 , 51–57. URL: http://www.sciencedirect.com/science/article/
pii/S0304388607000952. doi:10.1016/j.elstat.2007.08.005.
Dwyer, J. R., & Uman, M. A. (2014). The physics of lightning. PhysicsReports , 534 , 147–241.
Forward, K. M., Lacks, D. J., & Sankaran, R. M. (2009). Particle-size depen-dent bipolar charging of Martian regolith simulant. Geophysical ResearchLetters , 36 , L13201. URL: http://onlinelibrary.wiley.com/doi/10.1029/2009GL038589/abstract. doi:10.1029/2009GL038589.
Gaudin, D., & Cimarelli, C. (2019). The electrification of volcanic jets andcontrolling parameters: A laboratory study. Earth and Planetary ScienceLetters , 513 , 69–80.
Gilbert, J. S., Lane, S. J., Sparks, R. S. J., & Koyaguchi, T. (1991). Chargemeasurements on particle fallout from a volcanic plume. Nature, 349 , 598–600. URL: http://www.nature.com/nature/journal/v349/n6310/abs/349598a0.html. doi:10.1038/349598a0.
Gu, Z., Wei, W., Su, J., & Yu, C. W. (2013). The role of water con-tent in triboelectric charging of wind-blown sand. Scientific Reports ,3 , 1337. URL: http://www.nature.com/srep/2013/130225/srep01337/full/srep01337.html. doi:10.1038/srep01337.
Harrison, R. G., Barth, E., Esposito, F., Merrison, J., Montmessin, F., Aplin,K. L., Borlina, C., Berthelier, J.-J., Deprez, G., Farrell, W. M. et al. (2016).Applications of electrified dust and dust devil electrodynamics to martianatmospheric electricity. Space Science Reviews , 203 , 299–345.
29

Hatakeyama, H., & Uchikawa, K. (1951). On the disturbance of the atmo-spheric potential gradient caused by the eruption-smoke of the volcano aso.Papers in Meteorology and Geophysics , 2 , 85–89.
James, M., Lane, S., & Gilbert, J. S. (2000). Volcanic plume electrification:Experimental investigation of a fracture-charging mechanism. Journal ofGeophysical Research: Solid Earth, 105 , 16641–16649.
Kikuchi, K., & Endoh, T. (1982). Atmospheric electrical properties of vol-canic ash particles in the eruption of Mt. Usu Volcano, 1977. Journal ofthe Meteorological Society of Japan, 1 , 548–561.
Lacks, D. J., & Levandovsky, A. (2007). Effect of particle size distri-bution on the polarity of triboelectric charging in granular insulatorsystems. Journal of Electrostatics , 65 , 107–112. URL: http://
www.sciencedirect.com/science/article/pii/S0304388606000866.doi:10.1016/j.elstat.2006.07.010.
Lacks, D. J., & Sankaran, R. M. (2011). Contact electrification of insu-lating materials. Journal of Physics D: Applied Physics , 44 , 453001.URL: http://stacks.iop.org/0022-3727/44/i=45/a=453001. doi:10.1088/0022-3727/44/45/453001.
Lacks, D. J., & Shinbrot, T. (2019). Long-standing and unresolved issues intriboelectric charging. Nature Reviews Chemistry , 3 , 465–476.
Mendez Harper, J., & Dufek, J. (2016). The effects of dynamics on the tri-boelectrification of volcanic ash. Journal of Geophysical Research: Atmo-spheres , (p. 2015JD024275). URL: http://onlinelibrary.wiley.com/
doi/10.1002/2015JD024275/abstract. doi:10.1002/2015JD024275.
Mendez Harper, J., McDonald, G., Dufek, J., Malaska, M., Burr, D., Hayes,A., McAdams, J., & Wray, J. (2017). Electrification of sand on titan andits influence on sediment transport. Nature Geoscience, 10 , 260–265. URL:https://doi.org/10.1038/ngeo2921. doi:10.1038/ngeo2921.
Mendez Harper, J., Cimarelli, C., Dufek, J., Gaudin, D., & Thomas, R. J.(2018a). Inferring compressible fluid dynamics from vent discharges duringvolcanic eruptions. Geophys. Res. Lett., 45 , 7226–7235. URL: https:
//doi.org/10.1029/2018GL078286 doi:10.1029/2018GL078286.
30

Mendez Harper, J., Helling, C., & Dufek, J. (2018b). Triboelectrifica-tion of kcl and zns particles in approximated exoplanet environments.The Astrophysical Journal , 867 , 123. URL: https://doi.org/10.3847/1538-4357/aadf36. doi:10.3847/1538-4357/aadf36.
Mendez Harper, J., Steffes, P., Dufek, J., & Akins, A. (2019). The effect ofelectrostatic charge on the propagation of gps (l-band) signals through vol-canic plumes. Journal of Geophysical Research: Atmospheres , 124 , 2260–2275. URL: https://doi.org/10.1029/2018JD029076. doi:10.1029/2018JD029076.
Mendez Harper, J., Courtland, L., Dufek, J., & McAdams, J. (2020). Mi-crophysical effects of water content and temperature on the triboelectri-fication of volcanic ash on long timescales. Journal of Geophysical Re-search: Atmospheres , 125 , e2019JD031498. URL: https://doi.org/10.1029/2019JD031498. doi:10.1029/2019JD031498.
Mendez Harper, J., Dufek, J., & McDonald, G. D. (2021). Detection of sparkdischarges in an agitated mars dust simulant isolated from foreign surfaces.Icarus , 357 , 114268. https://doi.org/10.1016/j.icarus.2020.114268doi:10.1029/10.1016/j.icarus.2020.114268.
Miura, T., Koyaguchi, T., & Tanaka, Y. (2002). Measurements of electriccharge distribution in volcanic plumes at sakurajima volcano, japan. Bul-letin of volcanology , 64 , 75–93.
Nicoll, K., Airey, M., Cimarelli, C., Bennett, A., Harrison, G., Gaudin, D.,Aplin, K., Koh, K. L., Knuever, M., & Marlton, G. (2019). First in situ ob-servations of gaseous volcanic plume electrification. Geophysical ResearchLetters , 46 , 3532–3539.
Pahtz, T., Herrmann, H. J., & Shinbrot, T. (2010). Why do particle cloudsgenerate electric charges? Nature Physics , 6 , 364–368. URL: http://www.nature.com/nphys/journal/v6/n5/abs/nphys1631.html. doi:10.1038/nphys1631.
Pan, S., & Zhang, Z. (2019). Fundamental theories and basic principles oftriboelectric effect: A review. Friction, 7 , 2–17.
31

Petersen, D., Bailey, M., Beasley, W. H., & Hallett, J. (2008). A brief reviewof the problem of lightning initiation and a hypothesis of initial lightningleader formation. Journal of Geophysical Research: Atmospheres , 113 .
Prata, A., Folch, A., Prata, A., Biondi, R., Brenot, H., Cimarelli, C., Corra-dini, S., Lapierre, J., & Costa, A. (2020). Anak krakatau triggers volcanicfreezer in the upper troposphere. Scientific reports , 10 , 1–13.
Smith, C. M., Van Eaton, A. R., Charbonnier, S., McNutt, S. R., Behnke,S. A., Thomas, R. J., Edens, H. E., & Thompson, G. (2018). Correlatingthe electrification of volcanic plumes with ashfall textures at sakurajimavolcano, japan. Earth and Planetary Science Letters , 492 , 47–58.
Smith, C. M., Thompson, G., Reader, S., Behnke, S. A., McNutt, S. R.,Thomas, R., & Edens, H. (2020). Examining the statistical relationshipsbetween volcanic seismic, infrasound, and electrical signals: A case studyof sakurajima volcano, 2015. Journal of Volcanology and Geothermal Re-search, 402 , 106996.
Stern, S., Cimarelli, C., Gaudin, D., Scheu, B., & Dingwell, D. (2019). Elec-trification of experimental volcanic jets with varying water content andtemperature. Geophysical Research Letters , 46 , 11136–11145.
Suzuki, Y., Costa, A., Cerminara, M., Ongaro, T. E., Herzog, M., Van Eaton,A. R., & Denby, L. (2016). Inter-comparison of three-dimensional modelsof volcanic plumes. Journal of Volcanology and Geothermal Research, 326 ,26–42.
Takahashi, T. (2012). Precipitation particle charge distribution and evolutionof east asian rainbands. Atmospheric research, 118 , 304–323.
Thomas, R. J., Krehbiel, P. R., Rison, W., Edens, H. E., Aulich, G. D., Winn,W. P., McNutt, S. R., Tytgat, G., & Clark, E. (2007). Electrical Activ-ity During the 2006 Mount St. Augustine Volcanic Eruptions. Science,315 , 1097–1097. URL: http://science.sciencemag.org/content/315/5815/1097. doi:10.1126/science.1136091.
Toth III, J. R., Phillips, A. K., Rajupet, S., Sankaran, R. M., & Lacks, D. J.(2017). Particle-size-dependent triboelectric charging in single-componentgranular materials: role of humidity. Industrial & Engineering ChemistryResearch, 56 , 9839–9845.
32

Van Eaton, A. R., Schneider, D. J., Smith, C. M., Haney, M. M., Lyons,J. J., Said, R., Fee, D., Holzworth, R. H., & Mastin, L. G. (2020). Didice-charging generate volcanic lightning during the 2016–2017 eruption ofbogoslof volcano, alaska? Bulletin of Volcanology , 82 , 24.
Vossen, C. E., Cimarelli, C., Bennett, A. J., Geisler, A., Gaudin, D., Miki,D., Iguchi, M., & Dingwell, D. B. (2021). Long-term observation of elec-trical discharges during persistent vulcanian activity. Earth and PlanetaryScience Letters , 570 , 117084.
Waitukaitis, S. R., Lee, V., Pierson, J. M., Forman, S. L., & Jaeger, H. M.(2014). Size-dependent same-material tribocharging in insulating grains.Physical Review Letters , 112 , 218001.
Wurm, G., Schmidt, L., Steinpilz, T., Boden, L., & Teiser, J. (2019). A chal-lenge for martian lightning: Limits of collisional charging at low pressure.Icarus , 331 , 103–109.
Xie, Y., & Li, Z. (2018). Triboluminescence: recalling interest and newaspects. Chem, 4 , 943–971.
Zhao, H., Castle, G. P., Inculet, I. I., & Bailey, A. G. (2003). Bipolar chargingof poly-disperse polymer powders in fluidized beds. IEEE Transactions onIndustry Applications , 39 , 612–618.
33