
Potential climate change impacts on groundwater resources of south-western Australia
18
This article appeared in a journal published by Elsevier. The attached copy is furnished to the author for internal non-commercial research and education use, including for instruction at the authors institution and sharing with colleagues. Other uses, including reproduction and distribution, or selling or licensing copies, or posting to personal, institutional or third party websites are prohibited. In most cases authors are permitted to post their version of the article (e.g. in Word or Tex form) to their personal website or institutional repository. Authors requiring further information regarding Elsevier’s archiving and manuscript policies are encouraged to visit: http://www.elsevier.com/copyright
Transcript of Potential climate change impacts on groundwater resources of south-western Australia

This article appeared in a journal published by Elsevier. The attachedcopy is furnished to the author for internal non-commercial researchand education use, including for instruction at the authors institution
and sharing with colleagues.
Other uses, including reproduction and distribution, or selling orlicensing copies, or posting to personal, institutional or third party
websites are prohibited.
In most cases authors are permitted to post their version of thearticle (e.g. in Word or Tex form) to their personal website orinstitutional repository. Authors requiring further information
regarding Elsevier’s archiving and manuscript policies areencouraged to visit:
http://www.elsevier.com/copyright

Author's personal copy
Potential climate change impacts on groundwater resourcesof south-western Australia
Riasat Ali a,⇑, Don McFarlane a, Sunil Varma b, Warrick Dawes a, Irina Emelyanova a, Geoff Hodgson a,Steve Charles a
a CSIRO Floreat Laboratories, Private Bag 5, Wembley, WA 6913, Australiab CSIRO Earth Science and Resource Engineering, 26 Dick Parry Avenue, Kensington, WA 6151, Australia
a r t i c l e i n f o
Article history:Available online 4 May 2012
Keywords:Groundwater modellingClimate change impactsGroundwater levelsGroundwater resourcesSouth-western AustraliaVertical Flux Model
s u m m a r y
About three – quarters of all water used in the south-western Australia is from groundwater. A decline inrainfall since about 1975 and increased abstraction has resulted in some groundwater levels decliningand groundwater dependent ecosystems decreasing in health and extent. Levels are rising under someareas used for dryland (rainfed) agriculture because crops and pastures are shallow rooted. Almost allglobal climate models (GCMs) project a drier and hotter climate for the region by 2030. In this project,five climate scenarios were applied to groundwater models to estimate groundwater levels in the regionin 2030. The climate scenarios were (i) a continuation of the historical climate of 1975–2007; (ii) a con-tinuation of the more recent climate of 1997–2007 until 2030; and (iii–v) three climate scenarios derivedby applying the GCM projected climate under three global warming scenarios of 0.7, 1.0 and 1.3 �C by2030. A sixth scenario considered increasing abstraction levels to maximum allowed levels under a med-ian future climate (1.0 �C warming).
Groundwater levels were found to be much less affected than surface water resources by a future drierclimate as well as for a continuation of the climate experienced since 1975. For a fixed rainfall, rechargewas highest where soils were sandy, there was little or no perennial vegetation and the watertable wasneither very shallow nor very deep. A feature of the project area is that about half has a watertable within10 m of the soil surface, and about a quarter within 3 m. Levels were not as affected by a decline in rain-fall when reduced groundwater drainage and evapotranspiration losses offset the reduced rainfallamounts. However once a threshold groundwater level is exceeded, the rainfall fails to refill the availableseasonal storage and groundwater levels decline. Projected watertables declined in all areas under a drierclimate where perennial vegetation was present and able to intercept recharge or use groundwaterdirectly. In areas under dryland agriculture, projected groundwater levels continue to rise even undera drier future climate. The climate change effects on confined groundwater systems are expected to bemodest. This is due to the longer times required for the changed recharge and water level conditionsin the overlying aquifers to propagate to the confined aquifers. All water balance components are pro-jected to be impacted by climate change to a greater or lesser extent. This has consequences for theamount of extractable water from both the unconfined and confined aquifers, changes the risk of sea-water intrusion, and has implications for the groundwater dependent ecosystems.
Crown Copyright � 2012 Published by Elsevier B.V. All rights reserved.
1. Introduction
Climate change due to global warming is occurring in variousregions of the world. The International Panel on Climate Change(IPCC, 2007) suggests a probability greater than 90% that climatechange due to global warming is caused by anthropogenic factors,while others (de Jager and Usoskin, 2006; Stanhill, 2007;Svensmark, 2007) raise some doubts about the role of greenhouse
gas emissions in climate change. A small number of scientists be-lieve that the main reason for the present climate behaviour is nat-ural and future variability in climate is likely to be moderate(Santer et al., 2004; Michaels, 2005; Singer and Avery, 2006;Scafetta and West, 2006). There is however wide agreement thatthe trend of increasing global warming will continue for decades.The consequences of present trends are likely to continue beyondthe twenty-first century even if a drastic reduction in the green-house emissions occurs now (Seiler et al., 2008). A growing bodyof literature also points to a peak and decline in the productionof fossil fuel during the twenty-first century (Ward et al., 2011).
0022-1694/$ - see front matter Crown Copyright � 2012 Published by Elsevier B.V. All rights reserved.http://dx.doi.org/10.1016/j.jhydrol.2012.04.043
⇑ Corresponding author. Tel.: +61 893336329; fax: +61 893336499.E-mail address: [email protected] (R. Ali).
Journal of Hydrology 475 (2012) 456–472
Contents lists available at SciVerse ScienceDirect
Journal of Hydrology
journal homepage: www.elsevier .com/locate / jhydrol

Author's personal copy
Global Circulation Models (GCMs) use greenhouse emissions toproject future climates at global and regional scales. Due to uncer-tainty in future greenhouse gas emissions the outputs from GCMsare approximate and provide, at best, a rough approximation ofwhat could happen (Covey, 2003; Hegerl et al., 2006; Schmidtet al., 2004; IPCC, 2007). While there is some uncertainty, and awide range in predictions of future climate trends, GCMs that pro-vide good approximations of present and past climates may also bebest for estimating future climates (Bell et al., 2003; Dearing, 2006;Sloan, 2006).
Water availability will be limited in many regions of the worldbecause of climate change according to Findlay (2003). These im-pacts can be investigated by using climate data from GCMs as sce-nario inputs to rainfall-recharge models and then as inputs togroundwater models that contain flow mechanisms to distributethe water into various parts of the hydrologic cycle (Oldfield,2005).
Changes in temperature and precipitation alter groundwater re-charge and cause shifts in watertables as a first response to climatechange (Changnon et al., 1988; Zektser and Loaiciga, 1993). Ducciand Tranfaglia (2008) used Geographical Information System(GIS) techniques to calculate water budgets of the hydrogeologicalstructures of the Campania region in southern Italy and showed amean decrease of 30% of average infiltration within the present cli-mate scenario. This was mainly due to a marked reduction in pre-cipitation in many parts of the Campania region within the last20 years. Scibek and Allen (2006) used a three-dimensional tran-sient groundwater flow model, implemented in MODFLOW, toquantify the impacts of climate change on groundwater in anunconfined aquifer in a semi arid region of south-central BritishColumbia. GCMs were used to scale the historical data for futureprojections. They reported an increase in groundwater rechargeby a factor of three or more in late spring, a 50% increase in sum-mer, a 10–25% increase in autumn and a decrease in winter by2050 relative to present values. Eckhardt and Ulbrich (2003) useda revised version of the Soil and Water Assessment Tool (SWAT) toassess the impacts of climate change on groundwater recharge andstreamflow in a central European low mountain range. They foundonly small effects of climate change on mean annual groundwaterrecharge and streamflow. Rosenberg et al. (1999) used HUMUS(the Hydrologic Unit Model of the US) to assess the possible im-pacts of global warming on the hydrology of the Ogallala aquiferregion. They imposed three GCMs projections of future climatechange and projected a reduction in groundwater recharge underall three GCMs. Jyrkama and Sykes (2007) project an increase ingroundwater recharge in the Grand River watershed (Ontario) asa result of likely future changes in climate conditions.
Variation in recharge can also affect evapotranspiration,groundwater flow direction, surface water – groundwater interac-tions and leakage to deeper confined systems. A reduction in re-charge usually causes a direct and immediate decline ingroundwater levels. Goderniaux et al. (2009) used six regional cli-mate model scenarios assuming the SRES A2 (medium–high) sce-nario and projected up to 8 m decline in the groundwater levelsin the Geer Basin, Belgium by 2080. Woldeamlak et al. (2007) con-cluded that the groundwater levels in the Grote-Nete catchment,Belgium under a dry future climate were likely to decline by asmuch as 3 m by 2100. Croley and Luukkonen (2003) found thatdue to 19.7% reduction in the recharge rates assessed by usingCCCMA GCM the future groundwater levels in both the glacialand Saginaw aquifers in Lansing, Michigan were projected to de-cline over time.
Statistical, analytical and GIS techniques were used by Polemioand Casarano (2008) to study the impact of climate change anddrought on groundwater availability in southern Italy, where about97% of the study region has had a decreasing trend in annual
rainfall. Their study concluded climate change reduces groundwa-ter availability due to the decrease in recharge and an over-exploi-tation of groundwater to compensate for reducing surface water.Salgot and Torrens (2008) highlight the importance of groundwa-ter recharge with reclaimed water in order to survive the impactsof climate change in southern Europe. Sukhija (2008) mentions theanticipated extreme vulnerability of Asia and Africa to droughts.
Groundwater is a critical resource in south-western Australia(SWA; Fig. 1) and mainly used for domestic water supplies, mining,horticulture, irrigation of parks and gardens and industry. Before1960, groundwater was a small proportion of total use but by1985 it was equivalent to surface water in importance. Rapid eco-nomic development has resulted in total water use rising dramati-cally with most new growth in water use being from groundwater.About 75% of total water use in the region is now from groundwater.Given the sandy nature of soils on the coastal plains, aquifer replen-ishment is mainly through diffuse recharge from rainfall infiltration.
The rainfall in SWA was previously considered the most consis-tent and reliable in Australia: plentiful and with low inter-annualvariability compared to other regions of the continent (Nichollset al., 1997). However, SWA has experienced a regional average de-cline of 10–15% in rainfall since about 1975 (Fig. 2). A furtherreduction in the mean annual rainfall has also occurred since1997 (Fig. 2). Most coastal areas show a decline in rainfall between1980 and 2007 (Fig. 3). About half of this rainfall decline is attrib-utable to changes in large-scale circulation and synoptic activity asa result of greenhouse forcing (Cai and Cowan, 2007; Bates et al.,2008). Hope et al. (2006) concluded that both decreases in the fre-quencies and intensities of early winter rain-bearing synoptic sys-tems in SWA account for 80% of the observed rainfall declines.Frederiksen and Frederiksen (2008) concluded that the post-1974rainfall reduction over SWA has been caused by large-scalechanges to southern hemisphere circulation resulting in a reduc-tion in the intensity of cyclongenesis (i.e. fewer and weaker coldfronts), with storms being deflected southward. They suggest theseobserved changes are physically consistent with expected changesdue to increased anthropogenic greenhouse forcing.
There is no expectation of a return to wetter or cooler condi-tions of pre-1975 in the literature.
Since 1980 historical groundwater levels have either remainedstable or declined in most of the Perth Basin, except the Dandara-gan Plateau in the north-east and a small area to the north of Lanc-elin where they have risen over time (Fig. 3). It is important toknow how the groundwater levels may respond to a future drierclimate which has been predicted by almost all daily Global Cli-mate Models (GCMs) for SWA.
This paper describes an assessment of the impacts of projectedclimate change on the groundwater resources of SWA where thereis already increasing pressure on groundwater resources and a rap-idly growing population and economy. This groundwater assess-ment was carried out over a 37,200 km2 area in SWA (Fig. 1). Theobjectives were to: (a) project groundwater levels in 2030 underfuture climate and development scenarios; and (b) understandwhy some areas and aquifers may be less sensitive to climatechange than others.
2. Project area and climate
The project area spans between Geraldton in the north and Au-gusta in the south of Perth (Fig. 1) and contains over 1.9 millionpeople or 89% of the population of the state of Western Australia.Fresh and brackish water resources are only available in coastalareas; the inland surface and groundwater resources being eitherlimited in storage volume or too saline for most uses. The projectarea has a Mediterranean type climate with a Köppen Classification
R. Ali et al. / Journal of Hydrology 475 (2012) 456–472 457

Author's personal copy
as temperate in the south and sub-tropical in the north (BoM,2009). Up to 80% of mean annual rainfall occurs from May to Octo-ber. Fig. 3 shows the spatial distribution in mean annual rainfallacross the project area for the historical (1975–2007) period. Rain-fall is highest both in south-west coastal parts of the project areaand along the Darling Ranges and lowest in the north-east. Themean annual areal potential evaporation (APET) varies from1650 mm in the north to 1180 mm in the south.
3. Geographic scope
3.1. Geology
The SWA has some of the oldest rocks in the world and has acomplex geology which affects the topography, soils and therefore
the hydrology of the project area. The main geological subdivisionsin the project area are, in order of oldest to youngest, the South-West and Murchison terranes of the Yilgarn Craton; the Albany–Fraser Orogen; the Northampton, Mullingarra and Leeuwin com-plexes of the Pinjarra Orogen; and the Perth and Bremer basins(Myers and Hocking, 1998). Major faults are the Darling, Urella,Busselton and Dunsborough (Fig. 4).
The South-West and Murchison Terranes are part of the Pre-cambrian Yilgarn Craton which forms the Darling Plateau (Fig. 1).The Craton has been remarkably stable for hundreds of millionsof years and therefore any mountain ranges have been erodedand the plateau often has a deep clayey weathering profile, tensof metres thick, associated with gravel and siliceous weatheredremnants (Hocking and Cockbain, 1990; Tille, 2006). The youngerAlbany-Fraser Orogen is exposed along the southern and
Fig. 1. Map of the project area showing various regions and model domains.
400
600
800
1000
1900 1920 1940 1960 1980 2000
Rai
nfal
l (m
m/y
)
Annual Annual trend
Fig. 2. Mean annual rainfall across SWA between 1900 and 2007. Means for the periods 1900–1974, 1975–1997, and 1997–2007 are represented by horizontal lines (Bureauof Meteorology data for the region south-west of a line joining 30�S, 115�E and 35�S, 120�E).
458 R. Ali et al. / Journal of Hydrology 475 (2012) 456–472

Author's personal copy
south-eastern margin of the Yilgarn Craton (Myers, 1990). It alsohas been weathered but generally not as deeply as the westernand central parts of the Yilgarn Craton.
The project area contains the onshore Perth Basin which is a 30–100 km wide and 1000 km long strip from Geraldton along thewestern coastline down to the south-west corner of Western
Australia. The Perth Basin is a sedimentary trough up to 15 kmthick containing sediments of Silurian to Pleistocene age (Iaskyand Mory, 1993). It was formed during periods of rifting and sag-ging along the continental margin of SWA which culminated inits separation from the rest of Gondwana during the early Creta-ceous period. This resulted in a faulted sedimentary sequence
Fig. 3. Spatial distribution of mean annual rainfall (1975–2007), trends in mean annual rainfall across the project area (south-west of a line joining 30�S, 115�E and 35�S,120�E), and trends in groundwater levels across the southern half of the Perth Basin between 1980 and 2007.
Fig. 4. Main tectonic subdivisions and topography of the project area.
R. Ali et al. / Journal of Hydrology 475 (2012) 456–472 459

Author's personal copy
which is bounded to the east by the Darling Fault and overlain bycomparatively undeformed sediments deposited during the tec-tonically quiet period following separation (Davidson, 1995).
Several outliers of Permian strata of the Perth Basin sedimentslie within the Yilgarn Craton, with the largest being the Collie Basin(Fig. 1). This basin has a maximum sediment thickness of 1.4 km(Varma, 2002). The onshore Bremer Basin lies along the south-eastern margin of the project area and consists of numerous smallsediment-filled depressions of Eocene age with a thickness of lessthan 200 m (Hocking, 1990).
3.2. Topography
The main topographic features of SWA are the coastal plainswith elevations below 150 m AHD (often less than 100 m AHD(Australian Height Datum; Fig. 4) and escarpments which separatethe plains from the inland Darling Plateau (Fig. 1) with an averageelevation of about 350 m AHD. The western edge of the DarlingPlateau is the Darling Scarp (Fig. 4) which marks the easternboundary of the deep sedimentary Perth Basin. In the south-westof the project area the plateau becomes more dissected. Fresh rockis exposed on the slopes of major valleys but extensive areas of lat-eritic duricrust remain between the valleys. The Leeuwin–Natural-iste Ridge, like the Darling Plateau, is also underlain by crystallinebasement rocks and abuts the Perth Basin. Elevation of the Leeu-win–Naturaliste Ridge ranges from 60 to 150 m AHD. Uplifted sed-imentary rocks form the Blackwood Plateau in the south-west ofthe project area between Swan and Scott coastal plains. Elevationof the Blackwood Plateau ranges from 60 to 200 m AHD. The CollieBasin occurs as a north-westerly trending valley within the Pre-cambrian rocks of the Yilgarn Craton (Fig. 1) with a length of about27 km and a width of about 13 km (Varma, 2002).
Three smaller plateaux of uplifted sedimentary rocks occur inthe north-east of the project area: the Yarra Yarra region, theDandaragan Plateau and the Arrowsmith region. The Yarra Yarraregion is a small plateau separated from surrounding areas bythe Darling and Urella faults (Fig. 1). The Arrowsmith Region is alaterite-capped plateau, dissected by active drainages. The landsurface is gently undulating with elevations ranging between 100and 200 m AHD. The Dandaragan Plateau contains Quaternarysand and consists of laterite overlying Cretaceous sediments ofthe Perth Basin (DoW, 2008b). The plateau has an elevation of upto 300 m AHD. It is relatively flat with older alluvial channels in-filled with eolian sediments and dissected by the Arrowsmith Riverto the south (Irwin, 2007).
3.3. Land use
Over 92% of the 62,500 km2 in the project area is covered byeither native vegetation (52%) or dryland agriculture (40%)(Fig. 5). Plantations cover 3% of the area (70% hardwood and 30%softwood). Areas which remain wet in summer (producing a strongvegetation reflectance) occupy about 2% of the area, of which aboutone-third is irrigated land. Intensive urban and commercial landuse occurs in the Perth region and, to a lesser extent, around Bun-bury and Busselton. When urban areas are built on sandy soils, roofand road runoff are commonly directed into the unconfined Super-ficial Aquifer so this land use can enhance both recharge and runoff(stormwater).
The main areas under native vegetation occur east of the Dar-ling Fault in the Darling Ranges (mainly Jarrah–Marri forest), alongthe South Coast (mainly Karri and Jarrah forests), north of Perth(mainly Banksia woodlands) and in the coastal parts of the North-ern Perth Basin (mainly sandplain heaths). Pine plantations occurin the Gnangara area north of Perth, south of Mandurah, on theBlackwood Plateau and scattered throughout the Jarrah forest in
some coastal catchments. Cleared areas used for dryland croppingand grazing are extensive on the Swan Coastal Plain and in theNorthern Perth Basin. Self-supplied groundwater irrigationschemes are around the Gingin area, in peri-urban parts of Perth,and in coastal areas between Perth and Busselton.
4. Hydrogeology
The hydrogeology is described by subdividing the project areainto three regions: Perth Basin (Fig. 4), Collie Basin and Albany Area(Fig. 1). The main sedimentary aquifers in the Perth Basin are theTertiary–Quaternary Superficial, the Cretaceous Leederville, andthe Jurassic Yarragadee. The Superficial Aquifer, extending to about30 km inland with an average thickness of about 30 m (Rutherfordet al., 2005), is a multi-layered unconfined aquifer system whichcovers the Swan Coastal Plain and Scott Coastal Plain (Fig. 1). Re-charge to the Superficial Aquifer is via direct rainfall infiltrationand decreases from the coast to the east because of decreasingrainfall and the sediments becoming more clayey in the east(DoW, 2008b). Discharge is into the Indian Ocean, rivers, lakes,springs, and artificial and natural drains as well as by evaporationfrom wetlands, bare soil and transpiration from groundwaterdependent vegetation. Hydraulic conductivities range from lessthan 10�6 m/day for clayey sediments to 50 m/day for sandydeposits particularly in the Tamala Limestone (DoW, 2008b;Davidson, 1995).
The Leederville Aquifer is a multi-layered confined aquifer andoccurs throughout most of the Perth Basin. It consists of discontin-uous inter-bedded sandstone, siltstone and shale (Davidson, 1995).The Quindalup and Mowen Members of the Leederville Aquiferoutcrop over the Blackwood Plateau except where they are eroded(Strategen, 2005). Recharge into the Leederville Aquifer occurs
Fig. 5. Map showing land cover classes within the project area in 2007.
460 R. Ali et al. / Journal of Hydrology 475 (2012) 456–472

Author's personal copy
from overlying aquifers where confining beds are absent andhydraulic gradients are downward. Direct infiltration into the aqui-fer occurs in deep valleys on the Dandaragan Plateau. The aquiferdischarges offshore to the ocean through the Leederville Aquifer.
The Yarragadee Formation is present under the Swan CoastalPlain, the Arrowsmith Region and the Dandaragan Plateau (Fig. 1,Davidson, 1995). The Yarragadee Aquifer is a very important mul-ti-layered confined aquifer made up of sandstones and interbeddedsiltstone and shale, reaching a thickness of more than 2000 m. Theaquifer is recharged through downward leakage from the Leeder-ville and Superficial aquifers where confining beds are absentand where there is a downward hydraulic gradient (DoW, 2008b;Strategen, 2004).
The Collie Basin (Fig. 1) consists of Permian to Cretaceousdeposits and lies within the Precambrian Yilgarn Craton (Varma,2002). The basin consists of the Cardiff and Premier sub-basinsseparated by the Precambrian Stockton Ridge. All geological unitsof the Collie Group outcrop. The geology of the two sub-basins issimilar in stratigraphic sequence but the maximum thickness ofthe Permian sediments is about 1400 m in the Cardiff sub-basinand about 750 m in the Premier sub-basin. The major aquifers ofthe Collie Basin are separated by extensive confining beds consist-ing of coal seams or shale. Several north-westerly trending faultstraverse the Collie Basin.
The Albany Area (Fig. 1) extends over the water supply wellfieldserving the City of Albany and surrounding areas. The Albany-Fra-ser Orogen (Fig. 4) is a basement of granitic rocks which are over-lain by a weathering zone of sandy clays which act as an aquitardwhere present. The Superficial formation consists of dunal sandsand Tamala Limestone. The thickness of the formation which is amajor aquifer ranges between about 190 m at the coast to only10 m inland (Water Corporation, 2000).
5. Methods
5.1. Vertical Flux Model
Recharge is a very important input into any groundwater modeland can be provided as a simple input or via a complex VerticalFlux Model (VFM, Barr et al., 2003), used for recharge estimationin this project. The VFM was dynamically linked with MODFLOW(McDonald and Harbaugh, 1996) based groundwater models:PRAMS (Perth Regional Aquifer Modelling System), SWAMS (SouthWest Aquifer Modelling System) and the Collie Basin. The VFM wasnot linked with the PHRAMS (Peel–Harvey Regional Aquifer Mod-elling System). Instead the maximum potential recharge rates wereprovided as input and the net recharge rate was estimated inter-nally using the EVT (evapotranspiration) package of MODFLOW.
The VFM incorporates a number of different recharge modelssuch as WAVES (Zhang and Dawes, 1998), which is used for thevegetated areas, and some simpler models for urban areas, irri-gated areas, wetlands and areas where the watertable is close tothe ground surface. The VFM performs five key tasks: (i) managesthe generation of Recharge Response Units (RRUs) from raw cellattributes; (ii) manages the spatial selection of which rechargemodel to run in each cell or grid; (iii) manages data input to the re-charge models; (iv) runs the recharge models; and (v) passes thecalculated recharge to the groundwater model or an output file.
The VFM estimates aquifer recharge from input of climate, soil,land cover and watertable depth. The grid cells with similar attri-butes were grouped together into various climate, soil, and landcover zones and defined as Recharge Response Units (RRUs). Theproject area was divided into 15 climate zones based on averagesof the last 33 years (1975–2007) of rainfall, air moisture indexand pan evaporation. The climate data from one climate station
within each climate zone was used as input to the VFM. The projectarea was also classified into 14 land cover classes on 2 year inter-vals on the basis of analysis of Landsat-TM images available from1988. Fig. 5 shows land cover during 2007, which consisted mainlyof dryland agriculture and perennial vegetation within the ground-water assessment area. Soil units of similar hydrological propertiesin the project area were grouped together into 14 soil classessourced from Australian Soils Resource Information System (AS-RIS). The RRUs were created automatically at each stress periodand recharge was estimated based on the watertable depth pro-vided through a software link between the VFM and groundwatermodels. The coupling facilitated an automatic input of VFM-esti-mated recharge to the groundwater models at each stress period.The groundwater models distributed this recharge into variouscomponents of the water balance. A similar methodology was usedby Scibek and Allen (2006) for recharge estimation in a study tomodel the impacts of predicted climate change on recharge andgroundwater levels. They used a quasi-two-dimensional modelHELP (Hydrologic Evaluation of Landfill Performance; Schroederet al., 1994) for recharge estimation that takes into account the ef-fects of surface storage, snowmelt, runoff, infiltration, evapotrans-piration, vegetative growth, soil moisture storage, and variousengineering parameters (e.g., lateral subsurface drainage). Theyused high-resolution GIS (Geographical Information System) mapsto define the recharge zones. The recharge zones were linked toMODFLOW grid cells. Allen et al. (2004) also used Visual HELP(WHI, 1999) within the UnSat Suite for estimating recharge. VisualHELP estimates recharge rates using a weather generator and aqui-fer properties.
The recharge rates were estimated using the WAVES model un-der a defined set of climate, soil and land cover conditions in theNorthern Perth Basin and the Albany Area, where no groundwatermodels were available. The future groundwater levels under differ-ent scenarios were projected using the HARTT (Hydrograph Analy-sis and Rainfall Time Trends) method of Ferdowsian and McCarron(2001) which is an automated derivation of CDFM (CumulativeDeviation from the Mean). HARTT uses a relationship betweenthe historical rainfall and observed groundwater levels at a moni-toring bore location to project future groundwater levels from fu-ture rainfall data at that location. HARTT was applied to theselected groundwater monitoring bores and relationships devel-oped between the historical groundwater levels and rainfall. Theserelationships were then used to project future groundwater levelsfrom an input of future rainfall. This technique was validated bycomparing the groundwater modelled hydrographs with theHARTT projected hydrographs in the groundwater modelled areas.After its validation the HARTT technique was applied to project fu-ture hydrographs in the Northern Perth Basin and Albany areawhere groundwater models were not available.
5.2. Groundwater models – description and calibration
One unlinked and three fully VFM-linked groundwater modelswere used to estimate groundwater levels in 2030 under the fiveclimate scenarios and one development scenario. An alreadyVFM-coupled and calibrated PRAMS was used for the Central PerthBasin (Cymod, 2009a). The PRAMS domain covers an area of about10,000 km2 between Mandurah in the south and Gingin in thenorth (Fig. 1). The model is a finite difference MODFLOW-based(McDonald and Harbaugh, 1996) with a grid size of 500 by500 m (25 ha cells). The aquifers and confining beds are repre-sented by 13 layers. The PRAMS was calibrated to observedgroundwater levels by manually adjusting vertical and horizontalhydraulic conductivities, and specific yields. The model wascalibrated from 1985 to 2003 and validated from 2004 to 2008(Cymod, 2009a). For calibration the model used 664, 46, 91 and
R. Ali et al. / Journal of Hydrology 475 (2012) 456–472 461

Author's personal copy
94 monitoring bores in the Superficial, Mirrabooka, Leederville andYarragadee aquifers, respectively. The model calibration error(Root Mean Squared Error, RMSE) for the Superficial, Leederville,and Yarragadee aquifers was 2.1 m, 4.6 m and 3.8 m, respectively.
After its dynamic linking with the VFM and calibration update,the SWAMS model was used for the groundwater systems of theSouthern Perth Basin (Cymod, 2009b). The model covers an on-shore area of approximately 6000 km2 from the Brunswick Rivernorth of Bunbury to the Warren River south of Pemberton, andfrom the Dunsborough Fault in the west to the Darling Scarp inthe east (Fig. 1). This MODFLOW-based model has a variable meshfinite difference grid with a cell size varying from 250 by 250 m upto 1000 by 1000 m. The model has 8 layers to represent the majoraquifers and aquitards in the region. SWAMS was calibrated for theperiod 1990–2000, and subsequently validated from 2001 to 2008.The model used 54 calibration bores in the Superficial Aquifer withan RMSE of 3.3 m, 98 calibration bores in the Leederville Aquiferwith an RMSE of 8.2 m, and 88 calibration bores in the YarragadeeAquifer with an RMSE of 3.8 m.
The MODFLOW-based Collie Basin model was used for the Col-lie Basin after its dynamic linking with the VFM and calibration up-date in this project. The model covers both the sedimentarydeposits (about 228 km2) and a surrounding 308 km2 of graniticYilgarn Craton (Fig. 1). The Collie Basin model uses a variable finitedifference grid, with 104 rows and 131 columns, rotated 45� anti-clockwise from north to align with the major streams and faults inthe area. Its cell size varies from 50 by 100 m to 400 by 400 m. Themodel has 10 layers to represent the sedimentary and bedrock lay-ers. Using 443 bores the model was calibrated on water levels from1984 to 2000 with an RMSE of 8.4 m and the absolute average errorof about 10% of the water level range. The range of errors producedin the model indicates poor calibration which needs furtherimprovements. The validation period was from 2001 to 2008.
A new groundwater model called PHRAMS was developed forthe Peel Harvey Area (Fig. 1) as part of this project. PHRAMS wasconstructed using Visual MODFLOW Version 2009.1 Pro and runwith MODFLOW-SURFACT Version 3.0. PHRAMS covers an area of4095 km2 between the Peel Inlet and Bunbury. The active modelis bound by the Darling Fault to the east, the Murray River and PeelInlet to the north, and the Collie River to the south. The model has 6layers with a uniform grid of 500 by 500 m (25 ha cells) as detailedin URS (2009a, 2009b). This model was calibrated from 1980 to2002 using land cover, historical climate, monitoring and ground-water abstraction data. All together 198 bores were used for cali-bration. The calibrated model had an RMSE of 1.83 m, with amean absolute error of –0.22 m and a mean residual error of1.27 m. The model was validated from 2003 to 2007.
5.3. Modelling scenarios
Using the calibrated and validated models the assessment ofgroundwater resources across the project area was conductedusing the following six scenarios.
(i) Historical climate: The historical climate scenario used the cli-mate of the 1975–2007 period; it is assumed that the subsequent33 years climate would have the same climate. The 33 years of his-torical climate (1975–2007 inclusive) was used to make 11 se-quences of 23 years duration. For example, the first 23-yearsequence included the climate data between 1975 and 1997 andthe second between 1976 and 1998, and so on. The climate datafrom these 11 sequences were used to estimate recharge ratesusing the WAVES model. The WAVES model estimated the re-charge rates in each of the 15 climates zones for major soil typesassuming bare ground and a fixed watertable depth. Theserecharge results from each climate sequence for each climatezone were ranked from lowest to highest recharge and the 50th
percentile sequence selected. Ranking of sequences in this mannerproduced a consistent climates series applicable to the wholeproject area, rather than different sequences for different modeldomains. Once the 50th percentile sequence was selected, theremaining 10 years of the climate data for that sequence wereadded to make 33 years and this constituted the historical climate.This scenario was used as the baseline against which other scenar-ios were compared.
(ii) Recent Climate: The recent climate scenario was a 33-yearclimate series with the rainfall and APET (areal potential evapora-tion) of the past 11 years (January 1997 to December 2007) sincethis climate has been drier than that of the 22 years preceding1997 (Fig. 2). Climate data for 11 years (1997–2007 inclusive) wererepeated three times to simulate groundwater levels until 2040with the conditions in 2030 being reported. The recent climate sce-nario was used to assess water yields should the climate between2008 and 2030 prove to be similar to that of the recent past.
(iii–v) Future climates: The Intergovernmental Panel on ClimateChange (IPCC) Fourth Assessment Report (AR4, IPCC, 2007) projec-tions were used to derive the future climate scenarios. The IPCCAR4 Working Group 1 Summary for Policymakers (IPCC, 2007) pro-vides estimates of global warming for the year 2100 for six emis-sion scenarios. The IPCC projected global warming range was1.1–6.4 �C by 2100 based on results from 23 global climate models(GCMs). Equivalent global warming values for 2030, not providedby the IPCC, were derived in a way consistent with the approachused by the IPCC for 2100. Encompassing the full range of projec-tions, three representative 2030 temperature changes (relative to1990) were determined: a low global warming of 0.7 �C (low endof SRES B1), medium global warming of 1 �C (average of the lowand high global warming scenarios) and high global warming of1.3 �C (high end of SRES A1T).
Of the 23 IPCC AR4 GCMs, 15 had already accessible daily cli-mate data which were used to scale daily rainfall series. All 15were used (Loáiciga et al. (2000) used 6 GCMs to scale precipitationand temperature) to preserve a representation of the range ofuncertainty in future climate projections. The monthly GCM timeseries were used to calculate ‘seasonal scaling’ factors for changesin mean seasonal rainfall and other climate variables per degreeglobal warming. This was achieved by regressing the mean sea-sonal climate variables against global average temperature simu-lated by the GCM, where the gradient of the linear relationshipgave the change in the climate variable per degree global warming(Mitchell et al., 1999, 2003; Suppiah et al., 2007; Watterson, 2008).In addition, for rainfall, distributional differences between 2046–2065 and 1981–2000 GCM daily rainfall were used to calculate‘daily scaling’ factors (percentage change in daily rainfall percentileper degree of global warming) for each rainfall percentile class on aseasonal basis. Further details of this method can be found in Mpe-lasoka and Chiew (2009) and in Silberstein et al. (2012).
The percent changes in the climate variables per degree globalwarming for each of the four seasons for each cell of the 15 GCMswere multiplied by the change in temperature for each of the threeglobal warming scenarios (0.7, 1.0 and 1.3 �C) to obtain 45 sets ofseasonal scaling factors, together with daily scaling factors for rain-fall. These were used to scale the historical 1975–2007 sequence toproduce 45 scenarios of daily rainfall and APET of 33 years length.
For each of 15 low, medium and high global warming scenarios,the projected mean annual recharge over the region wasdetermined by running the WAVES model. The resulting rechargefrom each of the 15 scenarios was ranked separately for the low,medium and high global warming scenarios. GCMs that did notperform well, according to an analysis of their performance inreproducing the historical climate (using the methodology asoutlined in Smith and Chandler, 2010) were eliminated at thisstage. From the full set of selected GCM derived scenarios ranked
462 R. Ali et al. / Journal of Hydrology 475 (2012) 456–472
Author's personal copy
according to potential recharge, only three scenarios were chosenfor fully coupled modelling to capture the envelope of response,i.e., a wet, dry, and the median future projection. Based on theresulting recharge rankings, GFDL + 1.3� was selected to representa dry future climate, MIROC + 1 �C for the median future climateand INMCM + 1.3 �C for the wet future climate. The multiplicativescaling method implicitly captures the full range of projected re-sponse for the selected global warming scenarios. As is generallythe case, the dry and wet scenarios come from the high globalwarming scenario (Crosbie et al., 2010). If the actual level of globalwarming by 2030 is less than that used to generate these scenarios,the future recharge response will be less than projected for allthree cases (wet, dry and median). It is beyond the scope of this pa-per to assess the likelihood of these scenarios given the uncertain-ties in the projected global warming scenarios.
From the WAVES results, the mean annual recharge from 23 se-quences of historical climate were ranked and the historical cli-mate sequence from 1984 to 2006 was chosen as the commonrepresentative period for simulation of 2008–2030. The future cli-mates were derived by multiplying the historical climate data ofthe selected sequence (1984–2006) with the scaling factors ofthe above selected GCMs. Thus the GFDL + 1.3 �C, MIROC + 1 �Cand INMCM + 1.3 �C derived scenarios for this 23-year period arethe respective (iii) dry future climate, (iv) median future climate,and (v) wet future climate used for groundwater modelling. Cur-rent levels of groundwater development were assumed to continuefor all future climate scenarios.
(vi) Development scenario: The climate data used for this sce-nario was from the median future climate scenario (iv). Since nosignificant plantations and irrigation changes between 2008 and2030, except in the Gnangara Mound area, future land develop-ment only included increased groundwater abstractions. In thegroundwater management areas where current groundwaterabstraction was below 2009-set allocation limits it was increasedto full allocation levels from the start of 2008. An exception to thisrule was applied to the Gnangara Mound area where the scheduledremoval of the pine plantations and expansion of the urban areawas accounted for between 2008 and 2030.
6. Results
6.1. Observed and modelled hydrographs
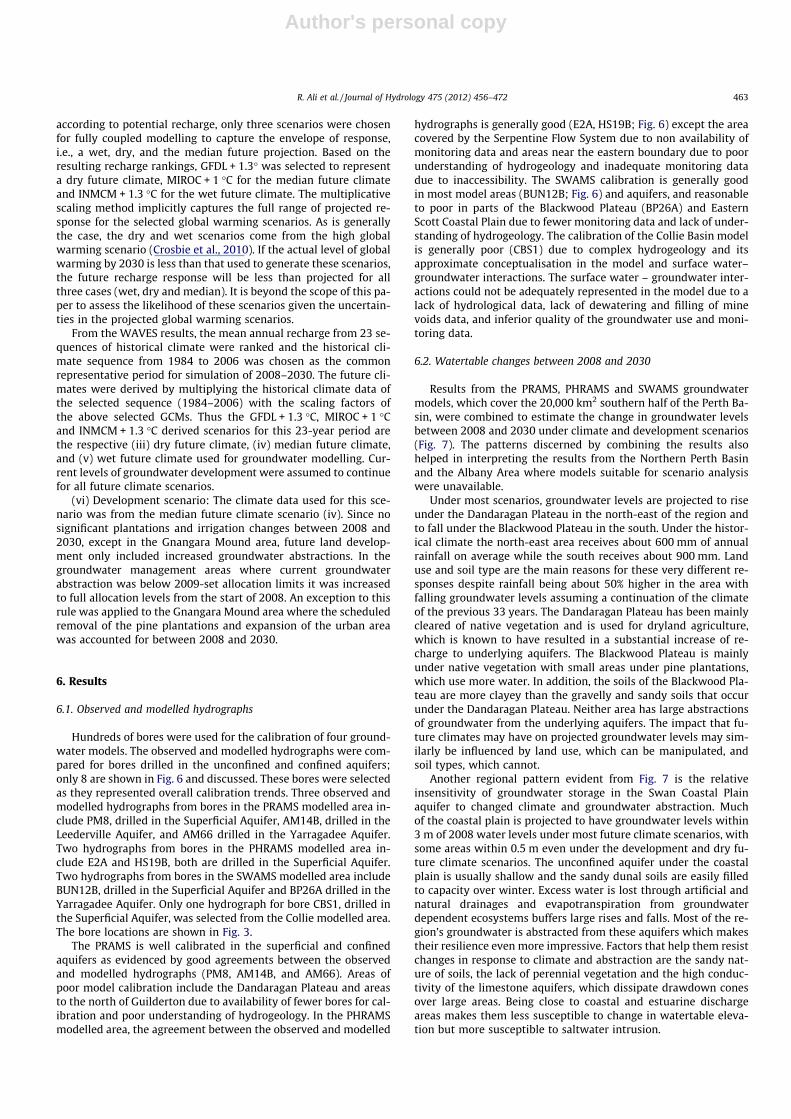
Hundreds of bores were used for the calibration of four ground-water models. The observed and modelled hydrographs were com-pared for bores drilled in the unconfined and confined aquifers;only 8 are shown in Fig. 6 and discussed. These bores were selectedas they represented overall calibration trends. Three observed andmodelled hydrographs from bores in the PRAMS modelled area in-clude PM8, drilled in the Superficial Aquifer, AM14B, drilled in theLeederville Aquifer, and AM66 drilled in the Yarragadee Aquifer.Two hydrographs from bores in the PHRAMS modelled area in-clude E2A and HS19B, both are drilled in the Superficial Aquifer.Two hydrographs from bores in the SWAMS modelled area includeBUN12B, drilled in the Superficial Aquifer and BP26A drilled in theYarragadee Aquifer. Only one hydrograph for bore CBS1, drilled inthe Superficial Aquifer, was selected from the Collie modelled area.The bore locations are shown in Fig. 3.
The PRAMS is well calibrated in the superficial and confinedaquifers as evidenced by good agreements between the observedand modelled hydrographs (PM8, AM14B, and AM66). Areas ofpoor model calibration include the Dandaragan Plateau and areasto the north of Guilderton due to availability of fewer bores for cal-ibration and poor understanding of hydrogeology. In the PHRAMSmodelled area, the agreement between the observed and modelled
hydrographs is generally good (E2A, HS19B; Fig. 6) except the areacovered by the Serpentine Flow System due to non availability ofmonitoring data and areas near the eastern boundary due to poorunderstanding of hydrogeology and inadequate monitoring datadue to inaccessibility. The SWAMS calibration is generally goodin most model areas (BUN12B; Fig. 6) and aquifers, and reasonableto poor in parts of the Blackwood Plateau (BP26A) and EasternScott Coastal Plain due to fewer monitoring data and lack of under-standing of hydrogeology. The calibration of the Collie Basin modelis generally poor (CBS1) due to complex hydrogeology and itsapproximate conceptualisation in the model and surface water–groundwater interactions. The surface water – groundwater inter-actions could not be adequately represented in the model due to alack of hydrological data, lack of dewatering and filling of minevoids data, and inferior quality of the groundwater use and moni-toring data.
6.2. Watertable changes between 2008 and 2030
Results from the PRAMS, PHRAMS and SWAMS groundwatermodels, which cover the 20,000 km2 southern half of the Perth Ba-sin, were combined to estimate the change in groundwater levelsbetween 2008 and 2030 under climate and development scenarios(Fig. 7). The patterns discerned by combining the results alsohelped in interpreting the results from the Northern Perth Basinand the Albany Area where models suitable for scenario analysiswere unavailable.
Under most scenarios, groundwater levels are projected to riseunder the Dandaragan Plateau in the north-east of the region andto fall under the Blackwood Plateau in the south. Under the histor-ical climate the north-east area receives about 600 mm of annualrainfall on average while the south receives about 900 mm. Landuse and soil type are the main reasons for these very different re-sponses despite rainfall being about 50% higher in the area withfalling groundwater levels assuming a continuation of the climateof the previous 33 years. The Dandaragan Plateau has been mainlycleared of native vegetation and is used for dryland agriculture,which is known to have resulted in a substantial increase of re-charge to underlying aquifers. The Blackwood Plateau is mainlyunder native vegetation with small areas under pine plantations,which use more water. In addition, the soils of the Blackwood Pla-teau are more clayey than the gravelly and sandy soils that occurunder the Dandaragan Plateau. Neither area has large abstractionsof groundwater from the underlying aquifers. The impact that fu-ture climates may have on projected groundwater levels may sim-ilarly be influenced by land use, which can be manipulated, andsoil types, which cannot.
Another regional pattern evident from Fig. 7 is the relativeinsensitivity of groundwater storage in the Swan Coastal Plainaquifer to changed climate and groundwater abstraction. Muchof the coastal plain is projected to have groundwater levels within3 m of 2008 water levels under most future climate scenarios, withsome areas within 0.5 m even under the development and dry fu-ture climate scenarios. The unconfined aquifer under the coastalplain is usually shallow and the sandy dunal soils are easily filledto capacity over winter. Excess water is lost through artificial andnatural drainages and evapotranspiration from groundwaterdependent ecosystems buffers large rises and falls. Most of the re-gion’s groundwater is abstracted from these aquifers which makestheir resilience even more impressive. Factors that help them resistchanges in response to climate and abstraction are the sandy nat-ure of soils, the lack of perennial vegetation and the high conduc-tivity of the limestone aquifers, which dissipate drawdown conesover large areas. Being close to coastal and estuarine dischargeareas makes them less susceptible to change in watertable eleva-tion but more susceptible to saltwater intrusion.
R. Ali et al. / Journal of Hydrology 475 (2012) 456–472 463

Author's personal copy
The coastal plain areas that might experience a projected water-table decline greater than 3 m are the Gnangara Mound north ofPerth, a small area near the Serpentine flow system in the Peel–Harvey Area, and the Scott Coastal Plain under a dry future climate.Gnangara has a thick aquifer that is mainly covered by native veg-etation and pines which reduce recharge rates. In addition, extrac-tion rates are very large. The Gnangara Mound has been in declinesince the late 1960s and this is expected to continue without pineremoval. The staged replacement of the pines with parklands, ap-proved by the State Government and implemented in the model,is expected to result in greater recharge and rising water levels un-der parts of the Mound under all scenarios except a dry futureclimate.
The area to the north of Waroona is indicative of the easternpart of the Swan Coastal Plain that is both distant from discharge
areas and underlain by the clayey Guildford Formation. Whetherthe projected watertable declines will eventuate is uncertain be-cause the aquifers are complex, the models are poorly calibratednear the no-flow boundary, and there may be additional watercoming from the Darling Plateau that is not accounted for due tono-flow boundary assumed in modelling.
The Scott Coastal Plain is projected to experience lower ground-water levels under a dry future climate and under the developmentscenario with a median future climate. Recharge in this area ispartly due to overland flow and winter ponding and therefore esti-mates of watertable made using a regional groundwater modelmay not be robust. An area in the west of the Scott Coastal Plainand the Vasse Shelf is expected to have rising levels under all sce-narios except under a dry future climate. This area has high rainfalland sandy soils, and parts are cleared of native vegetation, which
Fig. 6. Observed and modelled hydrographs for selected bores drilled in unconfined and confined aquifer systems of PRAMS, SWAMS, PHRAMS and Collie Basin model areas.
464 R. Ali et al. / Journal of Hydrology 475 (2012) 456–472

Author's personal copy
increases recharge. Areas under native vegetation in the easternScott Coastal Plain are projected to have falling groundwater levelsunder a dry future climate.
There is a continuum of projected climate impacts on the SwanCoastal Plain with expected watertable rises in the south, stable orslightly falling groundwater levels under dry and development sce-narios in the Peel–Harvey Area, and slightly greater falls in thenorth. This reflects the rainfall gradient.
Having noted these patterns in the southern half of the PerthBasin, the situation in the Northern Perth Basin, which was evalu-ated using WAVES modelling and hydrograph analyses (CSIRO,2009a) may be better assessed. It is likely that groundwater levelin the Northern Perth Basin will continue to rise in areas with
sandy soils and under cleared agricultural land, especially in thesouth of this region (OB1-75, Fig. 8). However, under median anddry future climates groundwater levels may not continue to risein northern parts of the Northern Perth Basin unless increasedsummer rainfall offsets the reductions in winter recharge. Underperennial vegetation, projected groundwater levels decline by upto 2 m under all future climate scenarios irrespective of soil types(GS1B, Fig. 8).
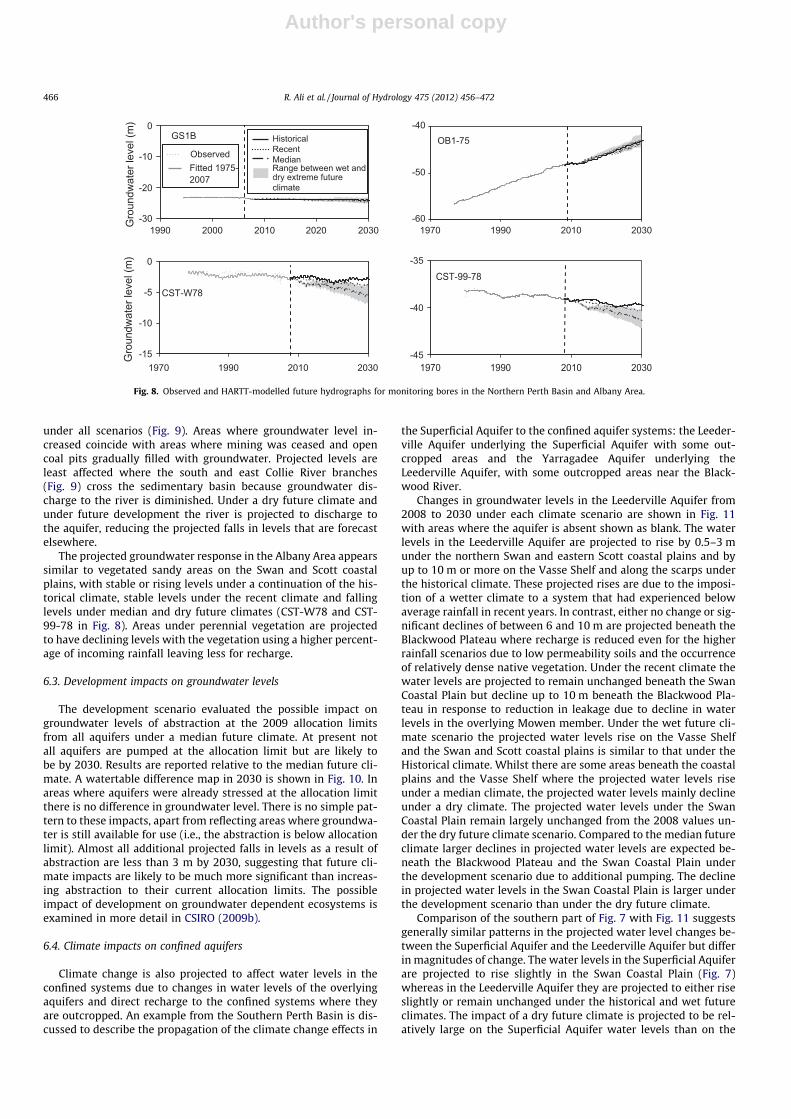
Understanding the future water level patterns emerging in thePerth Basin also helps interpret future projected water levels inthe Collie Basin because the area is greatly influenced by mining,abstraction and water exchanges with the Collie River. Groundwa-ter level in the Collie Basin is projected to fall over most of the area
Fig. 7. Spatial distribution of change in groundwater levels over the period 2008–2030 in the southern half of the Perth Basin under climate and development scenarios.
R. Ali et al. / Journal of Hydrology 475 (2012) 456–472 465
Author's personal copy
under all scenarios (Fig. 9). Areas where groundwater level in-creased coincide with areas where mining was ceased and opencoal pits gradually filled with groundwater. Projected levels areleast affected where the south and east Collie River branches(Fig. 9) cross the sedimentary basin because groundwater dis-charge to the river is diminished. Under a dry future climate andunder future development the river is projected to discharge tothe aquifer, reducing the projected falls in levels that are forecastelsewhere.
The projected groundwater response in the Albany Area appearssimilar to vegetated sandy areas on the Swan and Scott coastalplains, with stable or rising levels under a continuation of the his-torical climate, stable levels under the recent climate and fallinglevels under median and dry future climates (CST-W78 and CST-99-78 in Fig. 8). Areas under perennial vegetation are projectedto have declining levels with the vegetation using a higher percent-age of incoming rainfall leaving less for recharge.
6.3. Development impacts on groundwater levels
The development scenario evaluated the possible impact ongroundwater levels of abstraction at the 2009 allocation limitsfrom all aquifers under a median future climate. At present notall aquifers are pumped at the allocation limit but are likely tobe by 2030. Results are reported relative to the median future cli-mate. A watertable difference map in 2030 is shown in Fig. 10. Inareas where aquifers were already stressed at the allocation limitthere is no difference in groundwater level. There is no simple pat-tern to these impacts, apart from reflecting areas where groundwa-ter is still available for use (i.e., the abstraction is below allocationlimit). Almost all additional projected falls in levels as a result ofabstraction are less than 3 m by 2030, suggesting that future cli-mate impacts are likely to be much more significant than increas-ing abstraction to their current allocation limits. The possibleimpact of development on groundwater dependent ecosystems isexamined in more detail in CSIRO (2009b).
6.4. Climate impacts on confined aquifers
Climate change is also projected to affect water levels in theconfined systems due to changes in water levels of the overlyingaquifers and direct recharge to the confined systems where theyare outcropped. An example from the Southern Perth Basin is dis-cussed to describe the propagation of the climate change effects in
the Superficial Aquifer to the confined aquifer systems: the Leeder-ville Aquifer underlying the Superficial Aquifer with some out-cropped areas and the Yarragadee Aquifer underlying theLeederville Aquifer, with some outcropped areas near the Black-wood River.
Changes in groundwater levels in the Leederville Aquifer from2008 to 2030 under each climate scenario are shown in Fig. 11with areas where the aquifer is absent shown as blank. The waterlevels in the Leederville Aquifer are projected to rise by 0.5–3 munder the northern Swan and eastern Scott coastal plains and byup to 10 m or more on the Vasse Shelf and along the scarps underthe historical climate. These projected rises are due to the imposi-tion of a wetter climate to a system that had experienced belowaverage rainfall in recent years. In contrast, either no change or sig-nificant declines of between 6 and 10 m are projected beneath theBlackwood Plateau where recharge is reduced even for the higherrainfall scenarios due to low permeability soils and the occurrenceof relatively dense native vegetation. Under the recent climate thewater levels are projected to remain unchanged beneath the SwanCoastal Plain but decline up to 10 m beneath the Blackwood Pla-teau in response to reduction in leakage due to decline in waterlevels in the overlying Mowen member. Under the wet future cli-mate scenario the projected water levels rise on the Vasse Shelfand the Swan and Scott coastal plains is similar to that under theHistorical climate. Whilst there are some areas beneath the coastalplains and the Vasse Shelf where the projected water levels riseunder a median climate, the projected water levels mainly declineunder a dry climate. The projected water levels under the SwanCoastal Plain remain largely unchanged from the 2008 values un-der the dry future climate scenario. Compared to the median futureclimate larger declines in projected water levels are expected be-neath the Blackwood Plateau and the Swan Coastal Plain underthe development scenario due to additional pumping. The declinein projected water levels in the Swan Coastal Plain is larger underthe development scenario than under the dry future climate.
Comparison of the southern part of Fig. 7 with Fig. 11 suggestsgenerally similar patterns in the projected water level changes be-tween the Superficial Aquifer and the Leederville Aquifer but differin magnitudes of change. The water levels in the Superficial Aquiferare projected to rise slightly in the Swan Coastal Plain (Fig. 7)whereas in the Leederville Aquifer they are projected to either riseslightly or remain unchanged under the historical and wet futureclimates. The impact of a dry future climate is projected to be rel-atively large on the Superficial Aquifer water levels than on the
GS1B
-30
-20
-10
0G
roun
dwat
er le
vel (
m)
Historical
Range between wet and dry extreme future climate
Recent Median Observed
Fitted 1975-2007
CST-W78
-15
-10
-5
0
Gro
undw
ater
leve
l (m
)
CST-99-78
-45
-40
-35
OB1-75
-60
-50
-40
1990 2000 2010 2020 2030
1970 1990 2010 2030 1970 1990 2010 2030
1970 1990 2010 2030
Fig. 8. Observed and HARTT-modelled future hydrographs for monitoring bores in the Northern Perth Basin and Albany Area.
466 R. Ali et al. / Journal of Hydrology 475 (2012) 456–472
Author's personal copy
Leederville Aquifer water levels but trends are generally main-tained. This is true under most of the scenarios. The climate changeis expected to impact water levels in the Leederville Aquifer butnot in the same magnitude as in the Superficial Aquifer. The moresubdued response to climate change in the Leederville Aquifer thanin the Superficial Aquifer is mainly due to low permeability of theaquitard that separates the Leederville from the Superficial and re-sults in a slow propagation of the climate change effects. Larger im-pacts under the development scenario, in addition to those underthe median future climate, are due to additional pumping fromthe Leederville Aquifer under this scenario.
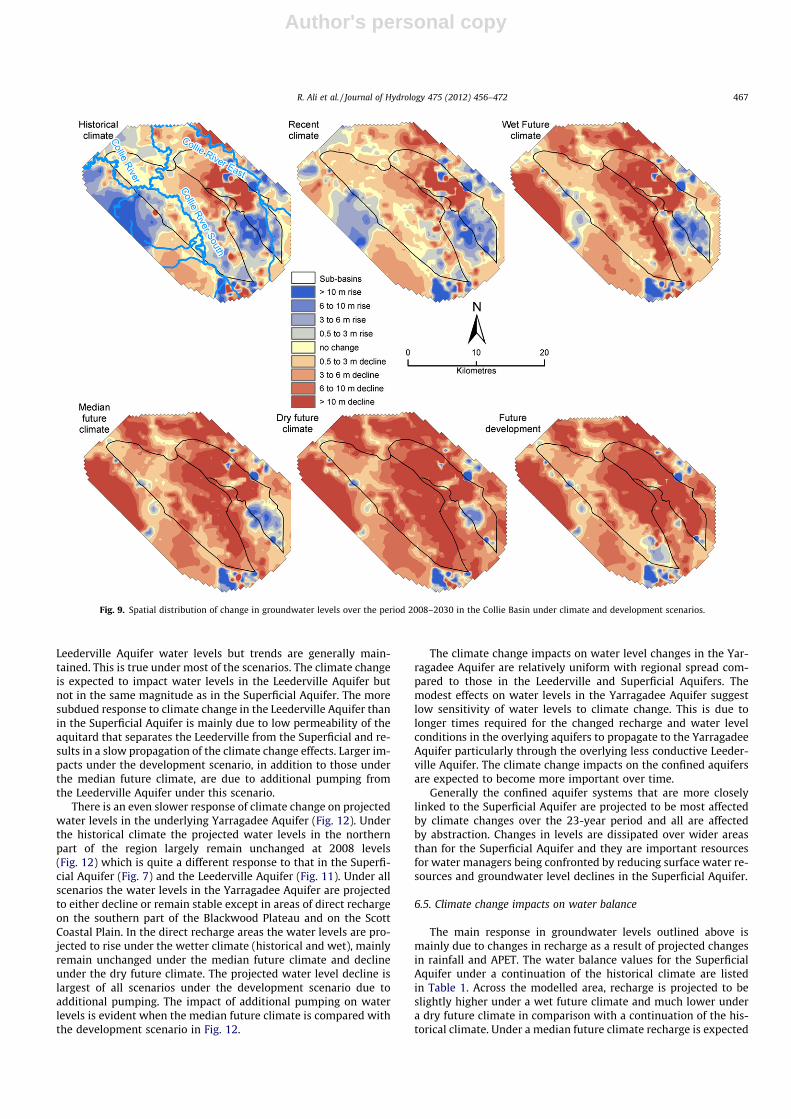
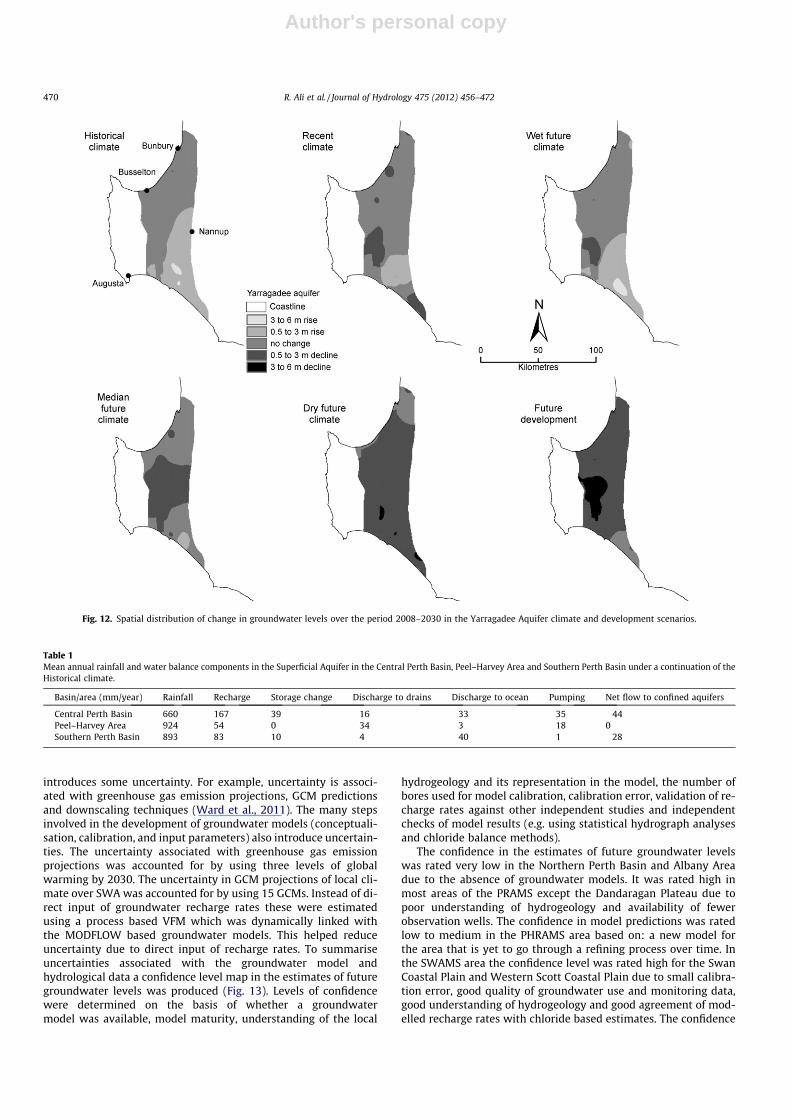
There is an even slower response of climate change on projectedwater levels in the underlying Yarragadee Aquifer (Fig. 12). Underthe historical climate the projected water levels in the northernpart of the region largely remain unchanged at 2008 levels(Fig. 12) which is quite a different response to that in the Superfi-cial Aquifer (Fig. 7) and the Leederville Aquifer (Fig. 11). Under allscenarios the water levels in the Yarragadee Aquifer are projectedto either decline or remain stable except in areas of direct rechargeon the southern part of the Blackwood Plateau and on the ScottCoastal Plain. In the direct recharge areas the water levels are pro-jected to rise under the wetter climate (historical and wet), mainlyremain unchanged under the median future climate and declineunder the dry future climate. The projected water level decline islargest of all scenarios under the development scenario due toadditional pumping. The impact of additional pumping on waterlevels is evident when the median future climate is compared withthe development scenario in Fig. 12.
The climate change impacts on water level changes in the Yar-ragadee Aquifer are relatively uniform with regional spread com-pared to those in the Leederville and Superficial Aquifers. Themodest effects on water levels in the Yarragadee Aquifer suggestlow sensitivity of water levels to climate change. This is due tolonger times required for the changed recharge and water levelconditions in the overlying aquifers to propagate to the YarragadeeAquifer particularly through the overlying less conductive Leeder-ville Aquifer. The climate change impacts on the confined aquifersare expected to become more important over time.
Generally the confined aquifer systems that are more closelylinked to the Superficial Aquifer are projected to be most affectedby climate changes over the 23-year period and all are affectedby abstraction. Changes in levels are dissipated over wider areasthan for the Superficial Aquifer and they are important resourcesfor water managers being confronted by reducing surface water re-sources and groundwater level declines in the Superficial Aquifer.
6.5. Climate change impacts on water balance
The main response in groundwater levels outlined above ismainly due to changes in recharge as a result of projected changesin rainfall and APET. The water balance values for the SuperficialAquifer under a continuation of the historical climate are listedin Table 1. Across the modelled area, recharge is projected to beslightly higher under a wet future climate and much lower undera dry future climate in comparison with a continuation of the his-torical climate. Under a median future climate recharge is expected
Fig. 9. Spatial distribution of change in groundwater levels over the period 2008–2030 in the Collie Basin under climate and development scenarios.
R. Ali et al. / Journal of Hydrology 475 (2012) 456–472 467

Author's personal copy
to reduce by about 20% in response to an 8% reduction in rainfall.The projected recharge reduction is regionally varied however,being 18%, 15% and 27% in the Central Perth Basin, Peel HarveyArea and Southern Perth Basin respective. Despite a projected10% reduction in Peel–Harvey Area rainfall, the resultant reductionin recharge is only 15% because of widespread shallow watertableswhich reject recharge after the aquifer has filled over winter. Thehighest projected reduction in recharge is in the Southern Perth Ba-sin because of clayey soils and deep rooted vegetation in much ofthis region.
Projected climate change is also likely to impact the rate of an-nual discharges from the Superficial Aquifer to natural and engi-neered surface drainages, the ocean, and to confined aquifers.Groundwater discharge to surface drains is expected to be highestin the irrigated Peel–Harvey Area which has extensive areas ofshallow watertables and numerous drains, and lowest in the lessdeveloped Southern Perth Basin where watertables are generallydeep. Under a dry future climate, groundwater discharge to surfacedrainages is expected to reduce by 48%, 32% and 40% in the CentralPerth Basin, Southern Perth Basin and Peel–Harvey Arearespectively.
Groundwater discharge to the ocean is projected to be highestunder a continuation of the historical climate and lowest underthe dry future climate as hydraulic gradients towards the oceanchange. Under a dry future climate, ocean discharge is projectedto reduce by 27% in the Central Perth Basin and by 38% in theSouthern Perth Basin. In the Peel–Harvey Area, sea-water intrusionrisks are projected to be high under a dry future climate due to lowhydraulic gradients towards the ocean.
The mean annual discharge (leakage) from the Superficial Aqui-fer to underlying confined aquifers is projected to reduce by 16% inthe Central Perth Basin and by 34% in the Southern Perth Basin un-der a dry future climate as hydraulic gradients reduce. There is nonet leakage to confined aquifers in the Peel–Harvey Area due to therelative paucity of inter-connections with the underlying aquifers.
Additional pumping under the development scenario createsadditional storage in areas with shallow watertables accommodat-ing more recharge. This is especially true in the Peel–Harvey Areawhere recharge under the development scenario is highest for allof the scenarios indicating that available storage is more limitingthan climate where watertables are high.
In the Central Perth Basin, an increase in groundwater storage of39 mm per year is projected to occur under a continuation of thehistorical climate but under a dry future climate this increase willbe 88% less. Some parts of the Central Perth basin are projected toexperience large decreases in storage as shown in Fig. 7 while otherareas are projected to rise, so these averages hide important localdifferences. Net groundwater storage losses are expected underboth the median and dry future climates in the Peel–Harvey Areaand under a dry future climate in the Southern Perth Basin.
The above analysis reveals that modelled future climate changenot only affects projected groundwater levels and storage but alsohas substantial effects on projected discharge from unconfinedaquifers to surface water bodies and confined aquifers. It will likelyaffect the amount of groundwater available for extraction fromboth the unconfined and confined aquifers, depending on the cli-mate scenario (e.g., wet versus dry). Any reduction in dischargesto surface water bodies would have implications for groundwaterdependent ecosystems and salt water intrusion risks. Importantsurface water bodies such as Collie River (Fig. 9) may change froma net gaining to a net losing stream under the median and dry fu-ture climate due to falling water levels if the drier climate scenar-ios eventuate.
7. Discussion
Groundwater levels in the project area respond in a complexbut understandable manner to climate and development scenarios.This has enabled identification of areas which are sensitive to themedian and dry future climates in particular as well as areas thatmay be comparatively insensitive. The main factors that affect sen-sitivity are climate, soil texture, vegetation cover, depth to thewatertable, proximity to a discharge point, and aquifer hydraulicproperties. Areas with clayey soils appear more sensitive, as dovegetated areas on the Blackwood Plateau and Gnangara Mound,as well as areas with a deep watertable and increasing distancefrom a discharge area.
The observed groundwater level trends between 1980 and 2007(Fig. 3) are likely to continue into the 2008–2030 period if the fu-ture climate is similar to either the historical or recent climates.The stable trends are likely to change to falling trends in water lev-els if future climates are drier than the 1980–2007 climate such ason the Swan Coastal Plain. Where water levels have been falling inareas such as under the Blackwood Plateau, these areas are pro-jected to greatly expand and intensify under a drier future climate.Areas with recorded rising groundwater levels are projected tomaintain these trends in the future if the future climate is similarto the observed climate (i.e. historical and wet future scenarios)and shrink under the median and dry future climates. Under thedevelopment scenario when pumping was increased to allocationlimits, where it was below these limits, it resulted in larger waterlevel declines in the unconfined and confined aquifer systems. Theconfined aquifers in the PRAMS and SWAMS areas responded tolarge changes in groundwater levels in the Superficial Aquifer
Fig. 10. Changes in groundwater levels in the southern half of Perth Basin underfuture development relative to the median future climate.
468 R. Ali et al. / Journal of Hydrology 475 (2012) 456–472

Author's personal copy
where they were closely connected. Any changes were, however,muted and delayed than in the Superficial Aquifer unless the levelswere being directly affected by confined groundwater abstraction.By being less sensitive to climate change, the confined aquifersprovide a very valuable resource and it is apparent that areas with-out them (e.g. the Peel–Harvey Area) have a much smaller waterresource available for use.
The soil and vegetation cover type also affects water levels. TheSwan Coastal Plain, especially in southern areas where soils aresandy and cleared and watertables are close to the soil surface ap-pears much less sensitive. In sandy dryland agriculture areas, suchas the Dandaragan Plateau, groundwater levels are less sensitive toclimate change. In clayey perennial vegetation areas, such as theBlackwood Plateau, groundwater levels are projected to declinemuch more under future climates than has occurred between1980 and 2007 (Fig. 3). In the Northern Perth Basin and AlbanyArea, HARTT also projects declining water levels at sites withclayey soils and native vegetation and rising water levels at siteswith sandy soils and dryland agriculture. Deep rooted vegetationin uncleared areas consumes more water than shallow rooted win-ter cropping in cleared areas. Thus, under the same rainfall morerecharge occurs in areas under dryland agriculture than areas un-der native vegetation. When rainfall reduces under the medianand dry future climates native vegetation will retain a similarwater use and recharge will decline more than under drylandagriculture.
Areas with shallow watertables are least sensitive to the med-ian and dry future climates as long as the recharge from rainfallis enough to saturate the soil between the ground surface andthe watertable. After filling, subsequent rainfall is discharged vianatural and engineered drainage. These areas become sensitive toa drier climate when the winter filling is unable to fill the unsatu-rated depth.
Net recharge rates vary substantially between climate changescenarios in the project area because they depend on land cover,soil, and watertable depth (Crosbie et al., 2010). Changes in re-charge in turn affect the other water balance components. Ground-water discharge to surface drainages in the modelled area isprojected to reduce substantially under all drier future climateswhich would have implications for groundwater dependent eco-systems and the environment. Recharge and consequential waterfluxes in the Peel–Harvey Area is less sensitive to climate changesbecause of buffering cause of its shallow watertable. However thisarea has an increased sea-water intrusion risk under the dry futureclimate because hydraulic gradients are already very low and anyfurther reduction can allow sea-water to enter the aquifer. Ground-water storage is usually very sensitive to climate change and insouth-western Australia it is expected to reduce due to lower netrecharge under drier future climates as is the case in many regionsof the world (Green et al., 2011).
There is a considerable uncertainty in the results of climatechange impacts studies because many steps are involved and each
Fig. 11. Spatial distribution of change in groundwater levels over the period 2008–2030 in the Leederville Aquifer under climate and development scenarios.
R. Ali et al. / Journal of Hydrology 475 (2012) 456–472 469
Author's personal copy
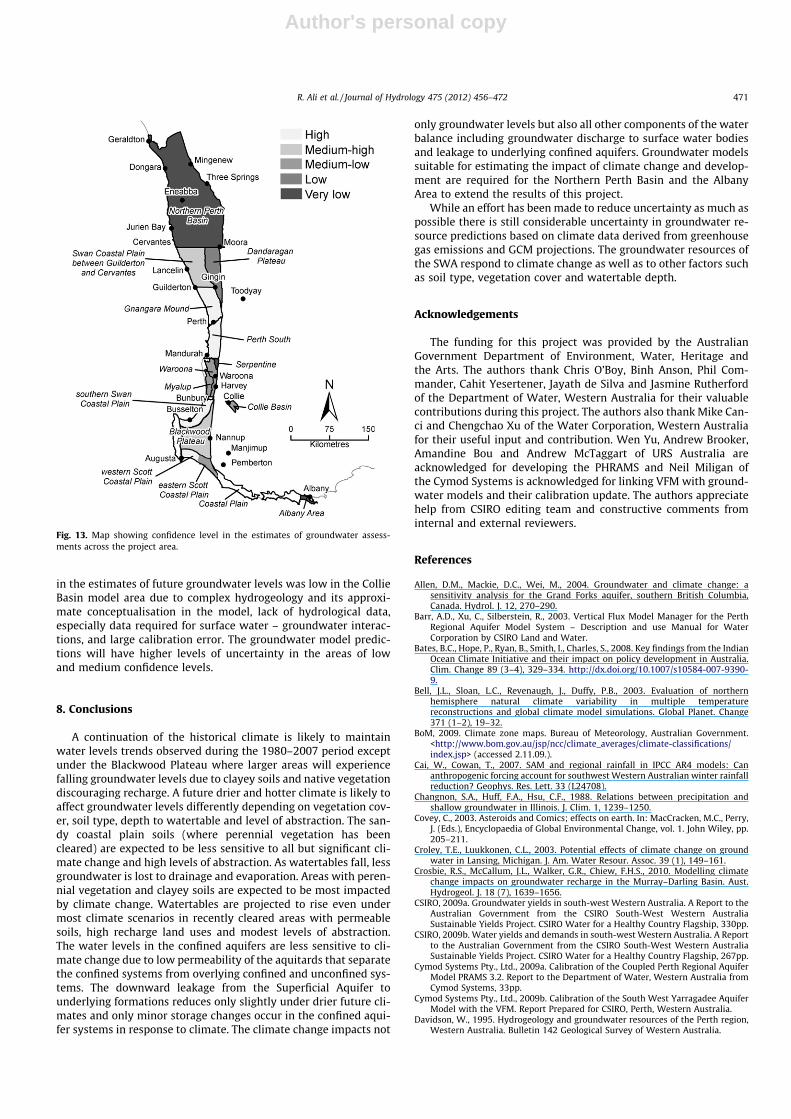
introduces some uncertainty. For example, uncertainty is associ-ated with greenhouse gas emission projections, GCM predictionsand downscaling techniques (Ward et al., 2011). The many stepsinvolved in the development of groundwater models (conceptuali-sation, calibration, and input parameters) also introduce uncertain-ties. The uncertainty associated with greenhouse gas emissionprojections was accounted for by using three levels of globalwarming by 2030. The uncertainty in GCM projections of local cli-mate over SWA was accounted for by using 15 GCMs. Instead of di-rect input of groundwater recharge rates these were estimatedusing a process based VFM which was dynamically linked withthe MODFLOW based groundwater models. This helped reduceuncertainty due to direct input of recharge rates. To summariseuncertainties associated with the groundwater model andhydrological data a confidence level map in the estimates of futuregroundwater levels was produced (Fig. 13). Levels of confidencewere determined on the basis of whether a groundwatermodel was available, model maturity, understanding of the local
hydrogeology and its representation in the model, the number ofbores used for model calibration, calibration error, validation of re-charge rates against other independent studies and independentchecks of model results (e.g. using statistical hydrograph analysesand chloride balance methods).
The confidence in the estimates of future groundwater levelswas rated very low in the Northern Perth Basin and Albany Areadue to the absence of groundwater models. It was rated high inmost areas of the PRAMS except the Dandaragan Plateau due topoor understanding of hydrogeology and availability of fewerobservation wells. The confidence in model predictions was ratedlow to medium in the PHRAMS area based on: a new model forthe area that is yet to go through a refining process over time. Inthe SWAMS area the confidence level was rated high for the SwanCoastal Plain and Western Scott Coastal Plain due to small calibra-tion error, good quality of groundwater use and monitoring data,good understanding of hydrogeology and good agreement of mod-elled recharge rates with chloride based estimates. The confidence
Fig. 12. Spatial distribution of change in groundwater levels over the period 2008–2030 in the Yarragadee Aquifer climate and development scenarios.
Table 1Mean annual rainfall and water balance components in the Superficial Aquifer in the Central Perth Basin, Peel–Harvey Area and Southern Perth Basin under a continuation of theHistorical climate.
Basin/area (mm/year) Rainfall Recharge Storage change Discharge to drains Discharge to ocean Pumping Net flow to confined aquifers
Central Perth Basin 660 167 39 �16 �33 �35 �44Peel–Harvey Area 924 54 0 �34 �3 �18 0Southern Perth Basin 893 83 10 �4 �40 �1 �28
470 R. Ali et al. / Journal of Hydrology 475 (2012) 456–472
Author's personal copy
in the estimates of future groundwater levels was low in the CollieBasin model area due to complex hydrogeology and its approxi-mate conceptualisation in the model, lack of hydrological data,especially data required for surface water – groundwater interac-tions, and large calibration error. The groundwater model predic-tions will have higher levels of uncertainty in the areas of lowand medium confidence levels.
8. Conclusions
A continuation of the historical climate is likely to maintainwater levels trends observed during the 1980–2007 period exceptunder the Blackwood Plateau where larger areas will experiencefalling groundwater levels due to clayey soils and native vegetationdiscouraging recharge. A future drier and hotter climate is likely toaffect groundwater levels differently depending on vegetation cov-er, soil type, depth to watertable and level of abstraction. The san-dy coastal plain soils (where perennial vegetation has beencleared) are expected to be less sensitive to all but significant cli-mate change and high levels of abstraction. As watertables fall, lessgroundwater is lost to drainage and evaporation. Areas with peren-nial vegetation and clayey soils are expected to be most impactedby climate change. Watertables are projected to rise even undermost climate scenarios in recently cleared areas with permeablesoils, high recharge land uses and modest levels of abstraction.The water levels in the confined aquifers are less sensitive to cli-mate change due to low permeability of the aquitards that separatethe confined systems from overlying confined and unconfined sys-tems. The downward leakage from the Superficial Aquifer tounderlying formations reduces only slightly under drier future cli-mates and only minor storage changes occur in the confined aqui-fer systems in response to climate. The climate change impacts not
only groundwater levels but also all other components of the waterbalance including groundwater discharge to surface water bodiesand leakage to underlying confined aquifers. Groundwater modelssuitable for estimating the impact of climate change and develop-ment are required for the Northern Perth Basin and the AlbanyArea to extend the results of this project.
While an effort has been made to reduce uncertainty as much aspossible there is still considerable uncertainty in groundwater re-source predictions based on climate data derived from greenhousegas emissions and GCM projections. The groundwater resources ofthe SWA respond to climate change as well as to other factors suchas soil type, vegetation cover and watertable depth.
Acknowledgements
The funding for this project was provided by the AustralianGovernment Department of Environment, Water, Heritage andthe Arts. The authors thank Chris O’Boy, Binh Anson, Phil Com-mander, Cahit Yesertener, Jayath de Silva and Jasmine Rutherfordof the Department of Water, Western Australia for their valuablecontributions during this project. The authors also thank Mike Can-ci and Chengchao Xu of the Water Corporation, Western Australiafor their useful input and contribution. Wen Yu, Andrew Brooker,Amandine Bou and Andrew McTaggart of URS Australia areacknowledged for developing the PHRAMS and Neil Miligan ofthe Cymod Systems is acknowledged for linking VFM with ground-water models and their calibration update. The authors appreciatehelp from CSIRO editing team and constructive comments frominternal and external reviewers.
References
Allen, D.M., Mackie, D.C., Wei, M., 2004. Groundwater and climate change: asensitivity analysis for the Grand Forks aquifer, southern British Columbia,Canada. Hydrol. J. 12, 270–290.
Barr, A.D., Xu, C., Silberstein, R., 2003. Vertical Flux Model Manager for the PerthRegional Aquifer Model System – Description and use Manual for WaterCorporation by CSIRO Land and Water.
Bates, B.C., Hope, P., Ryan, B., Smith, I., Charles, S., 2008. Key findings from the IndianOcean Climate Initiative and their impact on policy development in Australia.Clim. Change 89 (3–4), 329–334. http://dx.doi.org/10.1007/s10584-007-9390-9.
Bell, J.L., Sloan, L.C., Revenaugh, J., Duffy, P.B., 2003. Evaluation of northernhemisphere natural climate variability in multiple temperaturereconstructions and global climate model simulations. Global Planet. Change371 (1–2), 19–32.
BoM, 2009. Climate zone maps. Bureau of Meteorology, Australian Government.<http://www.bom.gov.au/jsp/ncc/climate_averages/climate-classifications/index.jsp> (accessed 2.11.09.).
Cai, W., Cowan, T., 2007. SAM and regional rainfall in IPCC AR4 models: Cananthropogenic forcing account for southwest Western Australian winter rainfallreduction? Geophys. Res. Lett. 33 (L24708).
Changnon, S.A., Huff, F.A., Hsu, C.F., 1988. Relations between precipitation andshallow groundwater in Illinois. J. Clim. 1, 1239–1250.
Covey, C., 2003. Asteroids and Comics; effects on earth. In: MacCracken, M.C., Perry,J. (Eds.), Encyclopaedia of Global Environmental Change, vol. 1. John Wiley, pp.205–211.
Croley, T.E., Luukkonen, C.L., 2003. Potential effects of climate change on groundwater in Lansing, Michigan. J. Am. Water Resour. Assoc. 39 (1), 149–161.
Crosbie, R.S., McCallum, J.L., Walker, G.R., Chiew, F.H.S., 2010. Modelling climatechange impacts on groundwater recharge in the Murray–Darling Basin. Aust.Hydrogeol. J. 18 (7), 1639–1656.
CSIRO, 2009a. Groundwater yields in south-west Western Australia. A Report to theAustralian Government from the CSIRO South-West Western AustraliaSustainable Yields Project. CSIRO Water for a Healthy Country Flagship, 330pp.
CSIRO, 2009b. Water yields and demands in south-west Western Australia. A Reportto the Australian Government from the CSIRO South-West Western AustraliaSustainable Yields Project. CSIRO Water for a Healthy Country Flagship, 267pp.
Cymod Systems Pty., Ltd., 2009a. Calibration of the Coupled Perth Regional AquiferModel PRAMS 3.2. Report to the Department of Water, Western Australia fromCymod Systems, 33pp.
Cymod Systems Pty., Ltd., 2009b. Calibration of the South West Yarragadee AquiferModel with the VFM. Report Prepared for CSIRO, Perth, Western Australia.
Davidson, W., 1995. Hydrogeology and groundwater resources of the Perth region,Western Australia. Bulletin 142 Geological Survey of Western Australia.
Fig. 13. Map showing confidence level in the estimates of groundwater assess-ments across the project area.
R. Ali et al. / Journal of Hydrology 475 (2012) 456–472 471

Author's personal copy
Dearing, J.A., 2006. Climate–human–environmental interactions: resolving our past.Clim. Past 2, 187–203.
de Jager, C., Usoskin, I.G., 2006. On possible drivers of sun-induced climate change. J.Atmos. Solar-Terres. Phys. 68, 2053–2060.
DoW, 2008b. Perth Regional Aquifer Modelling System (PRAMS) modeldevelopment: Hydrogeology and groundwater modelling. HydrogeologicalRecord Series, Report No. HG 20. Department of Water, Perth, WesternAustralia.
Ducci, D., Tranfaglia, G., 2008. Effects of climate change on groundwater resourcesin Campania (southern Italy). In: Dragoni, W., Sukhija, B.S. (Eds.), ClimateChange and Groundwater. London, Special Publication, Geological Society, pp.25–38.
Eckhardt, K., Ulbrich, U., 2003. Potential impacts of climate change on groundwaterrecharge and streamflow in a central European low mountain range. J. Hydrol.284, 244–252.
Ferdowsian, R., McCarron, C., 2001. HARTT-XLS Instruction Manual, HydrographAnalysis: Rainfall and Time Trend. Department of Agriculture, WesternAustralia, and Lote-Tree Software.
Findlay, R., 2003. Global climate change: implications for water quality andquantity. J. Am. Water Resour. Assoc. 95, 36–41.
Frederiksen, J., Frederiksen, C., 2008. Calibrating climate – d18O regression modelsfor the interpretation of high-resolution speleothem d18O time series. J.Geophys. Res. 113, D17103. http://dx.doi.org/10.1029/2007JD009694.
Goderniaux, P., Brouyere, S., Fowler, H.J., Blenkinsop, S., Therrien, R., Orban, P.,Dassargues, A., 2009. Large scale surface–subsurface hydrological model toassess climate change impacts on groundwater reserves. J. Hydrol. 373, 122–138.
Green, T.R., Taniguchi, M., Kooi, H., Gurdak, J.J., Allen, D.M., Hiscock, K.M., Treidel, H.,Aureli, A., 2011. Beneath the surface of global change: impacts of climatechange on groundwater. J. Hydrol. 405, 532–560.
Hegerl, G.C., Crowley, T.J., Hyde, W.T., Frame, D.J., 2006. Climate sensitivityconstrained by temperature reconstructions over the past seven centuries.Nature 440, 1029–1032.
Hocking, R., 1990. Bremer Basin. In: Geology and Mineral Resources of WesternAustralia. Western Australia Geological Survey, Memoir 3, pp. 827.
Hocking, R., Cockbain, A., 1990. Regolith. In: Geology and Mineral Resources ofWestern Australia. Western Australia Geological Survey, Memoir 3, pp. 827.
Hope, P., Drosdowsky, W., Nicholls, N., 2006. Shifts in synoptic systems influencingWestern Australia. Clim. Dyn. 26, 751–764.
Iasky, R., Mory, A., 1993. Structural and tectonic framework of the onshore NorthernPerth Basin. Explor. Geophys. 24, 585–592.
IPCC 2007. The physical science basis – summary for policymakers. Contribution ofWGI to the Fourth Assessment Report of the Intergovernmental Panel onClimate Change. <http://www.ipcc.ch/ipccreports/ar4-wg1.htm>.
Irwin, R., 2007. Hydrogeology of the eastern Scott Coastal Plain. HydrogeologicalRecord Series HG 19 Department of Water, Perth, Western Australia.
Jyrkama, M.I., Sykes, J.F., 2007. The impact of climate change on spatially varyinggroundwater recharge in the grand river watershed (Ontario). J. Hydrol. 338,237–250.
Loáiciga, H.A., Maidment, D.R., Valdes, J.B., 2000. Climate-change impacts in aregional karst aquifer, Texas, USA. J. Hydrol. 227, 173–194.
McDonald, M., Harbaugh, A., 1996. User’s documentation for MODFLOW-96, anupdate to the US GeologicaL Survey Modular finite-difference GroundwaterFlow Model. US Geological Survey, Open-File, Report 96–485.
Michaels, P.J., 2005. The Prediction of Distortion of Global Warming by Scientists,Politicians and the Media. Cato Institute.
Mitchell, D., Williams, K., Desmond, A., 2003. Swan Coastal Plain 2 (SWA 2 – SwanCoastal Plain Sub-region). In: A biodiversity audit of Western Australia’s 53Biogeographical Subregions (eds May JE and McKenzie N). Department ofConservation and Land Management, Perth, pp. 606–623.
Mitchell, J., Johns, T., Eagles, M., Ingram, W., Davis, R., 1999. Towards theconstruction of climate change scenarios. Clim. Change 41, 547–581.
Mpelasoka, F.S., Chiew, F.H.S., 2009. Influence of rainfall scenario constructionmethods on runoff projections. J. Hydrometeorol. 10 (5), 1168–1183.
Myers, J., 1990. Albany–Fraser Orogen. In: Geology and Mineral Resources ofWestern Australia. Western Australia Geological Survey, Memoir 3, pp. 255–265.
Myers, J., Hocking, R., 1998. Geological Map of Western Australia, 1:2500,000, 13thed. Geological Survey of Western Australia, Perth.
Nicholls, N., Drosdowsky, W., Lavery, B., 1997. Australian rainfall variability andchange. Weather 52, 66–72.
Oldfield, F., 2005. Environmental Change: Key Issues and Alternative Approaches.Cambridge University Press, New York.
Polemio, M., Casarano, D., 2008. Climate change, drought and groundwateravailability in southern Italy. In: Dragoni, W., Sukhija, B.S. (Eds.), ClimateChange and Groundwater. London, Special Publication, Geological Society, pp.39–51.
Rosenberg, N.J., Epstein, D.J., Wang, D., Vail, L., Srinivasan, R., Arnold, J., 1999.Possible impacts of global warming on the hydrology of the Ogallala aquiferregion. Clim. Change 42, 677–692.
Rutherford, J., Roy, V., Johnson, S., 2005. The Hydrogeology of GroundwaterDependent Ecosystems in the Northern Perth Basin. Hydrogeological RecordSeries, HG11 Department of Environment, Perth, Western Australia.
Salgot, M, Torrens, A. 2008. Impacts of climate change on water resources: thefutures of groundwater recharge with reclaimed water in the south of Europe.In: Dragoni, W., Sukhija, B.S. (Eds.), Climate Change and Groundwater. SpecialPublication – Geological Society of London, No. 288, pp. 145–168.
Santer, B.D., Wigley, T.M.L., Simmons, A.J., 2004. Identification of anthropogenicclimatic change using a second-generation reanalysis. J. Geophys. Res.-Atmos.109, D21104.
Scafetta, N., West, B.J., 2006. Phenomenological solar contribution to the 1900–2000global surface warming. Geophys. Res. Lett. 33. http://dx.doi.org/10.1029/2005GL025539.
Schmidt, G.A., Shindell, D.T., Miller, R.T., Mann, M.E., Rind, D., 2004. Generalcirculation modelling of Holocene climate variability. Quatern. Sci. Rev. 23,2167–2181.
Schroeder, P.R., Dozier, T.S., Zappi, P.A., McEnroe, B.M., Sjostrom, J.W., Peyton, R.L.,1994. The Hydrologic Evaluation of Landfill Performance (HELP) model:Engineering documentation for Version 3, Report EPA/600/R-94/168b, USEnvironmental Protection Agency, Washington, DC.
Scibek, J., Allen, D.M., 2006. Modeled impacts of predicted climate change onrecharge and groundwater levels. Water Resour. Res. 42, 1–18. http://dx.doi.org/10.1029/2005WR004742.
Seiler, K.P., GU, W.Z., Stichler, W., 2008. Transient response of groundwater systemsto climate changes. In: Dragoni, W., Sukhija, B.S. (Eds.), Climate Change andGroundwater. Geological Society, London, Special Publication, pp. 288.
Silberstein, R.P., Aryal, S.K., Durrant, J., Pearcey, M., Braccia, M., Charles, S., Boniecka,L., Hodgson, G., Bari, M., McFarlane, D.J., 2012. Climate change and runoff insouth-western Australia. Journal of Hydrology, http://dx.doi.org/1016/j.jhydrol.2012.02.009.
Singer, S.F., Avery, D.T., 2006. Unstoppable Global Warming: Every 1500 Years.Rowman and Littlefield Publishers, Inc., Lanham MD.
Sloan, L.C., 2006. A framework for regional modelling of past climates. Theoret.Appl. Climatol. 86, 271–279.
Smith, I., Chandler, E., 2010. Refining rainfall projections for the Murray DarlingBasin of south-east Australia – the effect of sampling model results based onperformance. Clim. Change 102 (3), 377–393.
Stanhill, G., 2007. A perspective on global warming, dimming and brightening. EOS88, 58–59.
Strategen, 2004. South West Yarragadee-Blackwood Groundwater Water SupplyReport. Report Prepared for the Water and Rivers Commission, WesternAustralia.
Strategen, 2005. Hydrogeology of the Southern Perth Basin. South West YarragadeeSupply Development. Information Series Report No. 1, Prepared for WaterCorporation, Western Australia.
Sukhija, B.S., 2008. Adaptation to climate change: strategies for sustaininggroundwater resources during droughts. In: Dragoni, W., Sukhija, B.S. (Eds.),Climate Change and Groundwater. London, Special Publication, GeologicalSociety, pp. 169–181.
Suppiah, R., Hennessy, J., Whetton, P., McInnes, K., Macadam, I., Bathols, J., Ricketts,J., Page, C., 2007. Australian climate change projections derived fromsimulations performed for the IPCC 4th assessment report. Aust. Meteorol.Mag. 56, 131–152.
Svensmark, H., 2007. Cosmoclimatology: a new theory emerges. Astronom.Geophys. 48, 1.18–1.24.
Tille, P., 2006. Soil-landscapes of Western Australia’s Rangelands and Arid Interior.Department of Agriculture and Food, Government of Western Australia.
URS, 2009a. Peel–Harvey Coastal Groundwater Model WA – Calibration andValidation. Consultancy Report Prepared for CSIRO.
URS, 2009b. Peel–Harvey Coastal Groundwater Model WA. Conceptual Model.Prepared for CSIRO, Perth, Western Australia.
Varma, S., 2002. Hydrogeology and Groundwater Resources of the Collie Basin,Western Australia. Water and Rivers Commission, Perth, Western Australia.
Ward, J.D., Werner, A.D., Nel, W.P., Beecham, S., 2011. The influence of constrainedfossil fuel emissions scenarios on climate and water resource projections.Hydrol. Earth Syst. Sci. Discuss. 8, 2627–2665.
Water Corporation, 2000. Albany source modelling approach in estimating availablegroundwater resources. Prepared for Water Corporation by URS/Dames &Moore. Unpublished.
Watterson, I., 2008. Calculation of probability density functions for temperature andprecipitation change under global warming. J. Geophys. Res. 110.
Waterloo Hydrogeologic Inc. (WHI) 1999. UnSat Suit with Visual HELP, Version2.1.03.
Woldeamlak, S.T., Batelaan, O., De Smedt, F., 2007. Effects of climate change on thegroundwater system in the Grote-Nete catchment, Belgium. Hydrogeol. J. 15,891–901.
Zhang, L., Dawes, W., 1998. WAVES – An integrated energy and water balancemodel. CSIRO Land and Water Technical, Report No. 31/98.
Zektser, I.S., Loaiciga, H.A., 1993. Groundwater fluxes in global hydrologic cycle:past, present, and future. J. Hydrol. 144, 405–427.
472 R. Ali et al. / Journal of Hydrology 475 (2012) 456–472