Postimplant Dosimetry Using a Monte Carlo Dose Calculation Engine: A New Clinical Standard
9
doi:10.1016/j.ijrobp.2007.02.036 PHYSICS CONTRIBUTION POSTIMPLANT DOSIMETRY USING A MONTE CARLO DOSE CALCULATION ENGINE: A NEW CLINICAL STANDARD JEAN-FRANÇOIS CARRIER,PH.D.,* † MICHEL D’AMOURS, M.SC., † FRANK VERHAEGEN,PH.D., ‡ BRIGITTE RENIERS,PH.D., ‡ ANDRÉ-GUY MARTIN, M.D., M.SC., † ÉRIC VIGNEAULT, M.D., M.SC., † AND LUC BEAULIEU,PH.D. † *Département de Radio-Oncologie, et Centre de Recherche du CHUM, Hôpital Notre-Dame du CHUM, Montréal, Québec, Canada; † Département de Radio-Oncologie et Centre de Recherche en Cancérologie de Université Laval, CHUQ Pavillon Hôtel-Dieu de Québec, Québec, Canada; and ‡ Medical Physics Unit, McGill University, Montréal, Québec, Canada Purpose: To use the Monte Carlo (MC) method as a dose calculation engine for postimplant dosimetry. To compare the results with clinically approved data for a sample of 28 patients. Two effects not taken into account by the clinical calculation, interseed attenuation and tissue composition, are being specifically investigated. Methods and Materials: An automated MC program was developed. The dose distributions were calculated for the target volume and organs at risk (OAR) for 28 patients. Additional MC techniques were developed to focus specifically on the interseed attenuation and tissue effects. Results: For the clinical target volume (CTV) D 90 parameter, the mean difference between the clinical technique and the complete MC method is 10.7 Gy, with cases reaching up to 17 Gy. For all cases, the clinical technique overestimates the deposited dose in the CTV. This overestimation is mainly from a combination of two effects: the interseed attenuation (average, 6.8 Gy) and tissue composition (average, 4.1 Gy). The deposited dose in the OARs is also overestimated in the clinical calculation. Conclusions: The clinical technique systematically overestimates the deposited dose in the prostate and in the OARs. To reduce this systematic inaccuracy, the MC method should be considered in establishing a new standard for clinical postimplant dosimetry and dose-outcome studies in a near future. © 2007 Elsevier Inc. Prostate cancer, Low-dose-rate brachytherapy, Permanent seed implants, Iodine-125, Postimplant dosimetry, Monte Carlo. INTRODUCTION Permanent prostate brachytherapy is a procedure for treat- ing early-stage prostate cancers (1, 2). The purpose is to implant radioactive seeds in the prostate under transrectal ultrasound guidance. The positions and number of seeds are selected using a treatment planning system to optimize the target-volume dose coverage and to minimize the dose to organs at risk (OARs). The calculation formalism established by the AAPM Task Group No. 43 (3) (TG-43) is used in clinical prac- tice and offers a fast method to evaluate the dose depos- ited for both the treatment planning and postimplant phases. Postimplant studies, usually performed about 1 month after the implantation procedure, assess the quality of the implant. A quantitative postimplant study is especially important, because permanent prostate implant is a treatment for which there is a dose-outcome corre- lation (4). Recent studies from Chibani and Williamson (5, 6) and from Carrier et al. (7) showed differences in the calculated dose between the clinically approved TG-43 calculation technique and a more accurate Monte Carlo (MC) tech- nique. The studies considered a few realistic anatomies and quantified the effect of two issues originally raised by the Reprint requests to: Jean-François Carrier, Ph.D., Département de Radio-Oncologie, Hôpital Notre-Dame du CHUM, 1560 rue Sherbrooke Est, Montréal, Québec, Canada, H2L 4M1. Tel: (514) 890-8000, ext. 24682; Fax: (514) 412-7537; E-mail: jean-francois. [email protected] Selected for oral presentation at the Forty Eighth Annual Meet- ing of the American Society for Therapeutic Radiology and On- cology (ASTRO), November 5–9, Philadelphia, PA. Supported by the National Cancer Institute of Canada (NCIC) with funds from the Canadian Cancer Society (CCS). JFC ac- knowledges financial support from the Fonds Québécois de la Recherche sur la Nature et les Technologies (FQRNT). FV is partially supported by the Fonds de Recherche en Santé du Québec (FRSQ). L.B. and E.V. have an on going collaboration with Nucletron. No other conflict of interest. Acknowledgment—The authors would like to acknowledge Nucle- tron for providing a DICOMRT export module to the SPOT planning system. Received Dec 19, 2006, and in revised form Feb 14, 2007. Accepted for publication Feb 27, 2007. Int. J. Radiation Oncology Biol. Phys., Vol. 68, No. 4, pp. 1190 –1198, 2007 Copyright © 2007 Elsevier Inc. Printed in the USA. All rights reserved 0360-3016/07/$–see front matter 1190
-
Upload
independent -
Category
Documents
-
view
4 -
download
0
Transcript of Postimplant Dosimetry Using a Monte Carlo Dose Calculation Engine: A New Clinical Standard
P
Piiusto
Tti
dS8c
ic
wk
Int. J. Radiation Oncology Biol. Phys., Vol. 68, No. 4, pp. 1190–1198, 2007Copyright © 2007 Elsevier Inc.
Printed in the USA. All rights reserved0360-3016/07/$–see front matter
doi:10.1016/j.ijrobp.2007.02.036
HYSICS CONTRIBUTION
POSTIMPLANT DOSIMETRY USING A MONTE CARLO DOSECALCULATION ENGINE: A NEW CLINICAL STANDARD
JEAN-FRANÇOIS CARRIER, PH.D.,*† MICHEL D’AMOURS, M.SC.,† FRANK VERHAEGEN, PH.D.,‡
BRIGITTE RENIERS, PH.D.,‡ ANDRÉ-GUY MARTIN, M.D., M.SC.,† ÉRIC VIGNEAULT, M.D., M.SC.,†
AND LUC BEAULIEU, PH.D.†
*Département de Radio-Oncologie, et Centre de Recherche du CHUM, Hôpital Notre-Dame du CHUM, Montréal, Québec,Canada; †Département de Radio-Oncologie et Centre de Recherche en Cancérologie de Université Laval, CHUQ Pavillon
Hôtel-Dieu de Québec, Québec, Canada; and ‡Medical Physics Unit, McGill University, Montréal,Québec, Canada
Purpose: To use the Monte Carlo (MC) method as a dose calculation engine for postimplant dosimetry. Tocompare the results with clinically approved data for a sample of 28 patients. Two effects not taken into accountby the clinical calculation, interseed attenuation and tissue composition, are being specifically investigated.Methods and Materials: An automated MC program was developed. The dose distributions were calculated forthe target volume and organs at risk (OAR) for 28 patients. Additional MC techniques were developed to focusspecifically on the interseed attenuation and tissue effects.Results: For the clinical target volume (CTV) D90 parameter, the mean difference between the clinical techniqueand the complete MC method is 10.7 Gy, with cases reaching up to 17 Gy. For all cases, the clinical techniqueoverestimates the deposited dose in the CTV. This overestimation is mainly from a combination of two effects:the interseed attenuation (average, 6.8 Gy) and tissue composition (average, 4.1 Gy). The deposited dose in theOARs is also overestimated in the clinical calculation.Conclusions: The clinical technique systematically overestimates the deposited dose in the prostate and in theOARs. To reduce this systematic inaccuracy, the MC method should be considered in establishing a new standardfor clinical postimplant dosimetry and dose-outcome studies in a near future. © 2007 Elsevier Inc.
Prostate cancer, Low-dose-rate brachytherapy, Permanent seed implants, Iodine-125, Postimplant dosimetry,
Monte Carlo.p1qeil
fdtnq
Rp(
NAtp
A
INTRODUCTION
ermanent prostate brachytherapy is a procedure for treat-ng early-stage prostate cancers (1, 2). The purpose is tomplant radioactive seeds in the prostate under transrectalltrasound guidance. The positions and number of seeds areelected using a treatment planning system to optimize thearget-volume dose coverage and to minimize the dose torgans at risk (OARs).The calculation formalism established by the AAPM
ask Group No. 43 (3) (TG-43) is used in clinical prac-ice and offers a fast method to evaluate the dose depos-ted for both the treatment planning and postimplant
Reprint requests to: Jean-François Carrier, Ph.D., Départemente Radio-Oncologie, Hôpital Notre-Dame du CHUM, 1560 rueherbrooke Est, Montréal, Québec, Canada, H2L 4M1. Tel: (514)90-8000, ext. 24682; Fax: (514) 412-7537; E-mail: [email protected]
Selected for oral presentation at the Forty Eighth Annual Meet-ng of the American Society for Therapeutic Radiology and On-ology (ASTRO), November 5–9, Philadelphia, PA.
Supported by the National Cancer Institute of Canada (NCIC)ith funds from the Canadian Cancer Society (CCS). JFC ac-
nowledges financial support from the Fonds Québécois de la1190
hases. Postimplant studies, usually performed aboutmonth after the implantation procedure, assess the
uality of the implant. A quantitative postimplant study isspecially important, because permanent prostate implants a treatment for which there is a dose-outcome corre-ation (4).
Recent studies from Chibani and Williamson (5, 6) androm Carrier et al. (7) showed differences in the calculatedose between the clinically approved TG-43 calculationechnique and a more accurate Monte Carlo (MC) tech-ique. The studies considered a few realistic anatomies anduantified the effect of two issues originally raised by the
echerche sur la Nature et les Technologies (FQRNT). FV isartially supported by the Fonds de Recherche en Santé du QuébecFRSQ).
L.B. and E.V. have an on going collaboration with Nucletron.o other conflict of interest.cknowledgment—The authors would like to acknowledge Nucle-
ron for providing a DICOMRT export module to the SPOTlanning system.Received Dec 19, 2006, and in revised form Feb 14, 2007.
ccepted for publication Feb 27, 2007.
Atabd
tmscacM
nscdbtdieta
ttciiisio
cbwpisTM
T
FT((uiot7u
tadcCw
Srdp
T
mMtaTs
(vw1tdTi
apmtdIpsd
1191Postimplant dosimetry using Monte Carlo ● J.-F. CARRIER et al.
APM Task Group No. 64 (8): interseed attenuation andissue composition. These two effects are not taken intoccount by TG-43 based calculations. Earlier work by Mo-it et al. (9) drew similar conclusions from a uniform seedistribution study.The present article introduces an automated MC calcula-
ion system that allows for an extensive clinical study onany postimplant cases. For each patient, the clinical do-
imetry calculation is compared to a more accurate MCalculation. The two specific effects, interseed attenuationnd tissue composition, are studied independently and thenombined for an overall comparison between a completeC computation and the TG-43 based calculation.The interseed attenuation, or mutual attenuation by
eighboring seeds, is due to the proximity of neighboringeeds in a typical implant. The photons created in a seed Aan interact with an adjacent seed B. In such a case, the energyeposited in seed B does not contribute to the treatmentecause it is not deposited in a tissue. The dose deposited inhe seeds is not included in the dose–volume histograms orose distributions. Globally, the calculated dose depositedn the prostate tissue is diminished if such an attenuationffect is considered. The dose to OARs is also modified. Inhe TG-43–based calculation, this decrease is not taken intoccount.
The clinical dose calculations assume a homogeneousissue equivalent to water for all the organ and interorganissues. The tissue composition effect can be studied byomparing the dose calculated in water with that calculatedn a realistic multitissue patient. This effect is potentiallymportant for low-energy photon sources such as those usedn low-energy prostate brachytherapy (125I and 103Pd). Atuch a low-energy regime, the photoelectric effect plays anmportant role and is very dependent on the atomic numberf the irradiated tissue.
METHODS AND MATERIALS
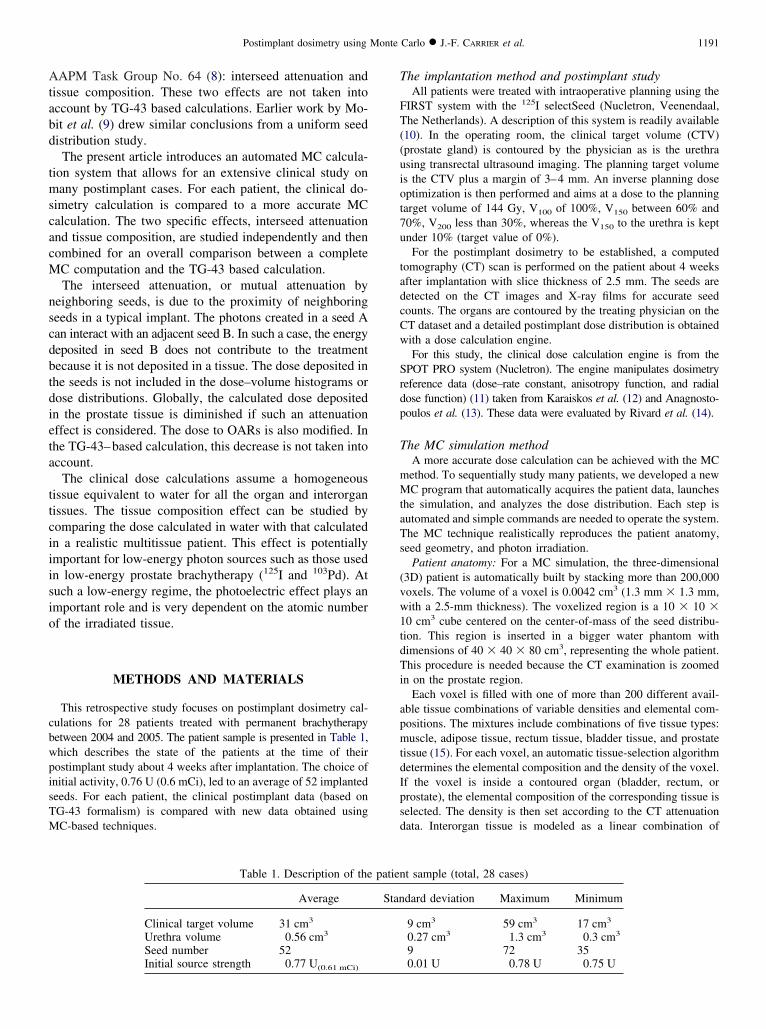
This retrospective study focuses on postimplant dosimetry cal-ulations for 28 patients treated with permanent brachytherapyetween 2004 and 2005. The patient sample is presented in Table 1,hich describes the state of the patients at the time of theirostimplant study about 4 weeks after implantation. The choice ofnitial activity, 0.76 U (0.6 mCi), led to an average of 52 implantedeeds. For each patient, the clinical postimplant data (based onG-43 formalism) is compared with new data obtained usingC-based techniques.
Table 1. Description of the
Average
Clinical target volume 31 cm3
Urethra volume 0.56 cm3
Seed number 52
Initial source strength 0.77 U(0.61 mCi)he implantation method and postimplant studyAll patients were treated with intraoperative planning using the
IRST system with the 125I selectSeed (Nucletron, Veenendaal,he Netherlands). A description of this system is readily available
10). In the operating room, the clinical target volume (CTV)prostate gland) is contoured by the physician as is the urethrasing transrectal ultrasound imaging. The planning target volumes the CTV plus a margin of 3–4 mm. An inverse planning doseptimization is then performed and aims at a dose to the planningarget volume of 144 Gy, V100 of 100%, V150 between 60% and0%, V200 less than 30%, whereas the V150 to the urethra is keptnder 10% (target value of 0%).For the postimplant dosimetry to be established, a computed
omography (CT) scan is performed on the patient about 4 weeksfter implantation with slice thickness of 2.5 mm. The seeds areetected on the CT images and X-ray films for accurate seedounts. The organs are contoured by the treating physician on theT dataset and a detailed postimplant dose distribution is obtainedith a dose calculation engine.For this study, the clinical dose calculation engine is from the
POT PRO system (Nucletron). The engine manipulates dosimetryeference data (dose–rate constant, anisotropy function, and radialose function) (11) taken from Karaiskos et al. (12) and Anagnosto-oulos et al. (13). These data were evaluated by Rivard et al. (14).
he MC simulation methodA more accurate dose calculation can be achieved with the MCethod. To sequentially study many patients, we developed a newC program that automatically acquires the patient data, launches
he simulation, and analyzes the dose distribution. Each step isutomated and simple commands are needed to operate the system.he MC technique realistically reproduces the patient anatomy,eed geometry, and photon irradiation.
Patient anatomy: For a MC simulation, the three-dimensional3D) patient is automatically built by stacking more than 200,000oxels. The volume of a voxel is 0.0042 cm3 (1.3 mm � 1.3 mm,ith a 2.5-mm thickness). The voxelized region is a 10 � 10 �0 cm3 cube centered on the center-of-mass of the seed distribu-ion. This region is inserted in a bigger water phantom withimensions of 40 � 40 � 80 cm3, representing the whole patient.his procedure is needed because the CT examination is zoomed
n on the prostate region.Each voxel is filled with one of more than 200 different avail-
ble tissue combinations of variable densities and elemental com-ositions. The mixtures include combinations of five tissue types:uscle, adipose tissue, rectum tissue, bladder tissue, and prostate
issue (15). For each voxel, an automatic tissue-selection algorithmetermines the elemental composition and the density of the voxel.f the voxel is inside a contoured organ (bladder, rectum, orrostate), the elemental composition of the corresponding tissue iselected. The density is then set according to the CT attenuationata. Interorgan tissue is modeled as a linear combination of
t sample (total, 28 cases)
dard deviation Maximum Minimum
9 cm3 59 cm3 17 cm3
0.27 cm3 1.3 cm3 0.3 cm3
9 72 35
patien
Stan
0.01 U 0.78 U 0.75 U
awcDPit
cccibansdt
cascNd0dcav0
vttaddrft
Gm
pit(Datoinl
cmatp
T
fcg
npmctss
oTtn
tbatNsssa
aeppdT
etTscnTF
a
1192 I. J. Radiation Oncology ● Biology ● Physics Volume 68, Number 4, 2007
dipose and muscle tissues. For each interorgan voxel, the relativeeights of the linear combination depend on the CT data. Both the
ontours and the CT data are available to the MC engine inICOMRT format through the export module from the SPOTRO system. The seeds are inserted parallel to the axis of insertion
n our 3D patients according to the exported seed positions fromhe SPOT PRO system.
Seed geometry and model benchmark: The selectSeed sourceonsists of an active silver rod encapsulated in a titanium hollowylinder. The specific details of the seed geometry, with a 3 �moating thickness, can be found elsewhere (12). The selectSeeds comparable to the Amersham 6711 source that we extensivelyenchmarked (7). We reproduced the selectSeed geometry to cre-te a full 3D seed model and we benchmarked the model. Becauseo consensus data were reported in the revised TG-43 (11) for theelectSeed, our data were compared with published values: MCata by Karaiskos et al. (12) and experimental data by Anagnos-opoulos et al. (13).
The dose–rate constant � is used in the TG-43 formalism andorresponds to the dose rate at a distance of 1 cm on the transversexis for a source with 1 unit of air kerma strength. In the air kermatrength MC calculation, the characteristic X-rays from the Tiapsule were systematically suppressed to comply with the 1999ational Institute of Standards and Technology standard. Theose–rate constant calculated with our model is � � 0.947 �.006 cGy h–1 U–1. The given uncertainty is the statistical standardeviation. Other sources of uncertainty exist—geometry andross-section, for example. According to the revised TG-43 (11),ssuming an uncertainty of 3% seems reasonable. The referencealues are MC�ref � 0.954 � 0.005 (12) and exp�
ref � 0.938 �.065 (13). All three values agree within uncertainty limits.The radial dose function g(r) is evaluated using 1-�m thick
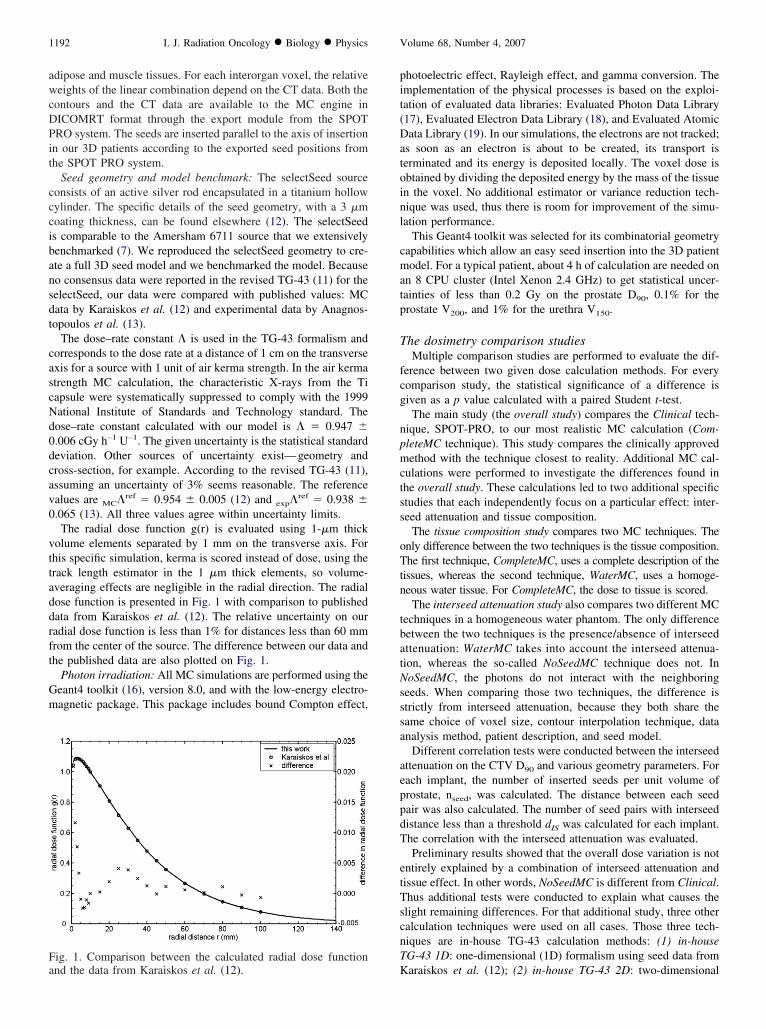
olume elements separated by 1 mm on the transverse axis. Forhis specific simulation, kerma is scored instead of dose, using therack length estimator in the 1 �m thick elements, so volume-veraging effects are negligible in the radial direction. The radialose function is presented in Fig. 1 with comparison to publishedata from Karaiskos et al. (12). The relative uncertainty on ouradial dose function is less than 1% for distances less than 60 mmrom the center of the source. The difference between our data andhe published data are also plotted on Fig. 1.
Photon irradiation: All MC simulations are performed using theeant4 toolkit (16), version 8.0, and with the low-energy electro-agnetic package. This package includes bound Compton effect,
ig. 1. Comparison between the calculated radial dose function
Knd the data from Karaiskos et al. (12).hotoelectric effect, Rayleigh effect, and gamma conversion. Themplementation of the physical processes is based on the exploi-ation of evaluated data libraries: Evaluated Photon Data Library17), Evaluated Electron Data Library (18), and Evaluated Atomicata Library (19). In our simulations, the electrons are not tracked;
s soon as an electron is about to be created, its transport iserminated and its energy is deposited locally. The voxel dose isbtained by dividing the deposited energy by the mass of the tissuen the voxel. No additional estimator or variance reduction tech-ique was used, thus there is room for improvement of the simu-ation performance.
This Geant4 toolkit was selected for its combinatorial geometryapabilities which allow an easy seed insertion into the 3D patientodel. For a typical patient, about 4 h of calculation are needed on
n 8 CPU cluster (Intel Xenon 2.4 GHz) to get statistical uncer-ainties of less than 0.2 Gy on the prostate D90, 0.1% for therostate V200, and 1% for the urethra V150.
he dosimetry comparison studiesMultiple comparison studies are performed to evaluate the dif-
erence between two given dose calculation methods. For everyomparison study, the statistical significance of a difference isiven as a p value calculated with a paired Student t-test.The main study (the overall study) compares the Clinical tech-
ique, SPOT-PRO, to our most realistic MC calculation (Com-leteMC technique). This study compares the clinically approvedethod with the technique closest to reality. Additional MC cal-
ulations were performed to investigate the differences found inhe overall study. These calculations led to two additional specifictudies that each independently focus on a particular effect: inter-eed attenuation and tissue composition.
The tissue composition study compares two MC techniques. Thenly difference between the two techniques is the tissue composition.he first technique, CompleteMC, uses a complete description of the
issues, whereas the second technique, WaterMC, uses a homoge-eous water tissue. For CompleteMC, the dose to tissue is scored.
The interseed attenuation study also compares two different MCechniques in a homogeneous water phantom. The only differenceetween the two techniques is the presence/absence of interseedttenuation: WaterMC takes into account the interseed attenua-ion, whereas the so-called NoSeedMC technique does not. InoSeedMC, the photons do not interact with the neighboring
eeds. When comparing those two techniques, the difference istrictly from interseed attenuation, because they both share theame choice of voxel size, contour interpolation technique, datanalysis method, patient description, and seed model.
Different correlation tests were conducted between the interseedttenuation on the CTV D90 and various geometry parameters. Forach implant, the number of inserted seeds per unit volume ofrostate, nseed, was calculated. The distance between each seedair was also calculated. The number of seed pairs with interseedistance less than a threshold dIS was calculated for each implant.he correlation with the interseed attenuation was evaluated.Preliminary results showed that the overall dose variation is not
ntirely explained by a combination of interseed attenuation andissue effect. In other words, NoSeedMC is different from Clinical.hus additional tests were conducted to explain what causes thelight remaining differences. For that additional study, three otheralculation techniques were used on all cases. Those three tech-iques are in-house TG-43 calculation methods: (1) in-houseG-43 1D: one-dimensional (1D) formalism using seed data from
araiskos et al. (12); (2) in-house TG-43 2D: two-dimensional
((d
T
tcaT(ttooetpbCtma
T
CcsosCe
T
Neataca
nt0iFcicc
O
tssa(
T
n
F
CCUURB
ell as
1193Postimplant dosimetry using Monte Carlo ● J.-F. CARRIER et al.
2D) formalism using seed data from Karaiskos et al. (12); and3) in-house TG-43 2D our data: 2D formalism using seed dataerived from our own seed model based on MC calculations.
RESULTS
he overall studyTable 2 presents a first comparison between two datasets;
he overall study. It is the most important comparison be-ause it includes the technique used in the clinic (Clinical)nd the most realistic calculation method (CompleteMC).he difference between the two datasets is given as
mean � standard deviation). Results from Table 2 showhat all dosimetry parameters are overestimated when usinghe clinically approved technique. In clinical practice, theverestimation of the D90 parameter for the CTV is 10.7 Gyn average, corresponding to a mean of 6.4% of the param-ter value. It reaches 17 Gy in extreme cases. The distribu-ion of the overall difference on the CTV D90 values isresented in Fig. 2. A comparison between isodose distri-utions is presented in Fig. 3 for five typical patients. TheompleteMC and Clinical isodoses are drawn along with
he organ contours. The slices were chosen as the apex-baseidline cut for consistency. No smoothing algorithm was
pplied on the isodoses.
he tissue effect studyThe summary is presented in Table 3, in which the
ompleteMC is compared with WaterMC. The effect ofonsidering realistic heterogeneous compositions and den-ities for the patient anatomy leads to a systematic decreasef the deposited dose in the urethra and CTV. When con-idering dose to tissue, the average decrease is 4.1 Gy forTV D90 parameter. Figure 4 shows the tissue effect forach individual patient in a histogram form.
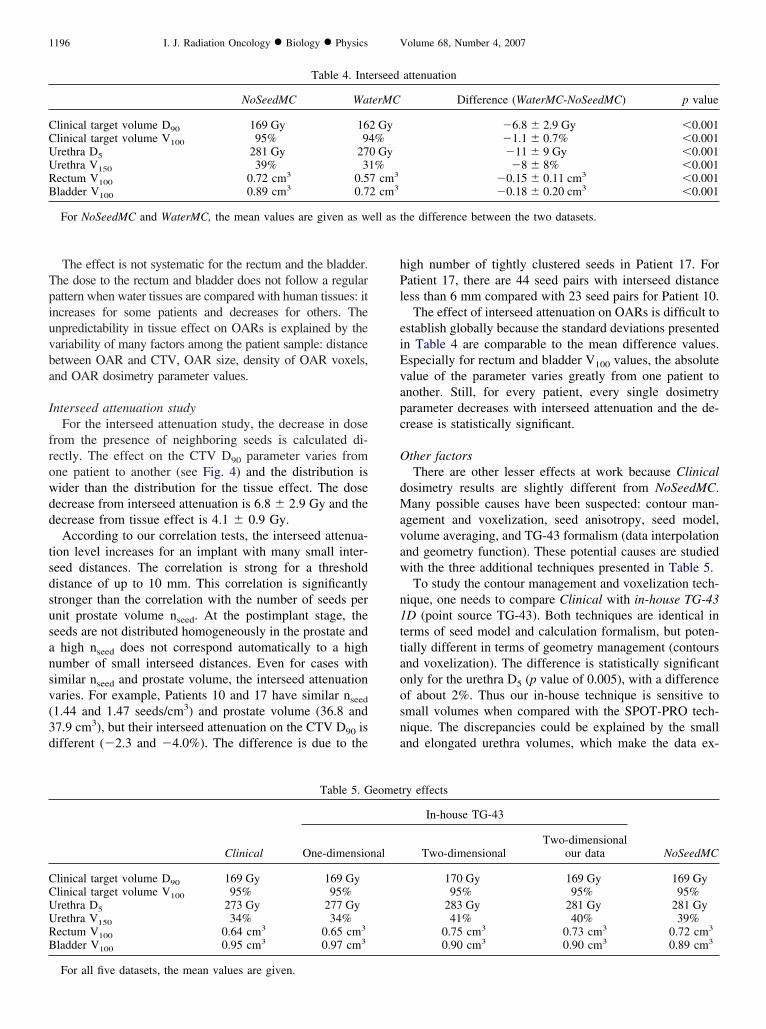
he interseed attenuation studyThe interseed attenuation (WaterMC compared with
oSeedMC) effect is presented in Table 4. Globally, theffect is similar for all dosimetry parameters: the interseedttenuation reduces the deposited dose in the CTV and in allhe OARs. All the decreases are statistically significant. Theverage decrease for the CTV D90 parameter is 6.8 Gy,orresponding to 4.1% of the parameter value. The interseed
Table 2.
Clinical Compl
linical target volume D90 169 Gy 158linical target volume V100 95% 93rethra D5 273 Gy 267rethra V150 34% 28ectum V100 0.64 cm3 0.57ladder V100 0.95 cm3 0.80
For Clinical and CompleteMC, the mean values are given as w
ttenuation effect for all patients is also presented in Fig. 4. v
The number of inserted seeds per unit volume of prostate,
seed, correlates weakly with the interseed attenuation forhe CTV D90 parameter (rank correlation coefficient R �.24). For each implant, the number of seed pairs withnterseed distance less than a threshold dIS was calculated.or all dIS values between 3 mm and 10 mm inclusively, theorrelation is strong (R between 0.71 and 0.80) with thenterseed attenuation for the CTV D90 parameter. Such aorrelation is significantly stronger (p � 0.01) than theorrelation with nseed.
ther effectsTo explain the difference between Clinical and NoSeedMC,
hree intermediate methods were used; the results are pre-ented in Table 5. Generally, the differences shown are lessignificant than those presented in Tables 2–4, but still therere statistically significant disparities, especially for OARssee Discussion).
DISCUSSION
he overall studyThe differences between the clinically approved TG-43 tech-
ique (Clinical) and the most realistic method (CompleteMC)
ig. 2. Histogram of the overall effect for the clinical target
ll effect
Difference (CompleteMC-Clinical) p value
�10.7 � 3.3 Gy �0.001�2.1 � 1.1% �0.001
�6 � 11 Gy 0.015�7 � 6% �0.001
�0.07 � 0.10 cm3 0.002�0.16 � 0.19 cm3 �0.001
the difference between the two datasets.
Overa
eteMC
Gy%Gy
%cm3
cm3
olume D90 value (CompleteMC-Clinical).

ag4dC
fipe
1194 I. J. Radiation Oncology ● Biology ● Physics Volume 68, Number 4, 2007
re statistically significant. The CompleteMC techniqueives dosimetry parameters systematically lower than TG-3. The clinically approved technique overestimates theose deposition in all organs and for all patients. For the
Fig. 3. Typical examples of isodose comparison betweePatient 12. (d) Patient 16. (e) Patient 22.
TV D90 parameter, this systematic overestimation varies 6
rom one patient to another. The overestimation distributions wide, ranging from 5 to 17 Gy (Fig. 2). For 64% of theatients, the overestimation reaches more than 10 Gy. Whenxpressed in relative value, the decrease is more than 6% for
43 and CompleteMC. (a) Patient 7. (b) Patient 11. (c)
n TG-8% of the patients.

wp((gtmtf
dCtaof
eai
T
epoopdaspwc
CCUURB
well a
1195Postimplant dosimetry using Monte Carlo ● J.-F. CARRIER et al.
For the OARs, the analysis of the overall effect for thehole sample is difficult for two reasons: (1) the individualarameter values vary greatly from one patient to anothere.g., two orders of magnitude for the rectum V150) and2) the overall absolute effect on a specific parameter variesreatly from one patient to another. Thus for OARs in Table 2,he standard deviation of the difference is comparable to theean values of the difference. The positions and shapes of
he OARs are patient-dependant and no specific predictiveactors were established.
The isodose comparisons (Fig. 3) show how different theose conformality and uniformity are between Clinical andompleteMC for typical patients. The distance between the
wo isodose lines varies from one patient to another and, forny given patient, varies from one prostate section to an-ther. For many typical CT slices, the difference is minimalor prostate coverage (see 100% isodose in Fig. 3e for
Table 3.
WaterMC Comple
linical target volume D90 162 Gy 158linical target volume V100 94% 93%rethra D5 270 Gy 267rethra V150 31% 28%ectum V100 0.57 cm3 0.57ladder V100 0.72 cm3 0.80
For WaterMC and CompleteMC, the mean values are given as
Fig. 4. Overview of the tissue effect and intersee
xample). Many slices show increases in cold spot areas thatre missed when TG-43–based methods are used (see 150%sodose in Fig. 3c, for example).
issue effect studyWhen the 28 patients are considered collectively, the
ffect of taking the tissue compositions into account com-ared with homogeneous water leads to a mean differencef 4.1 Gy on the CTV D90, with a small standard deviationf 0.9 Gy. Because the CTV D90 value varies from oneatient to another, the tissue effect distribution is slightlyifferent when the dose decrease is expressed as a percent-ge of the CTV D90 value instead of in Gy. This studyhows a systematic effect of 2.6 � 0.4% on the CTV D90
arameter. This decrease is due to the difference betweenater and prostate tissue, in terms of density and elemental
omposition.
e effect
Difference (CompleteMC-WaterMC) p value
�4.1 � 0.9 Gy �0.001�0.8 � 0.4% �0.001
�3 � 4 Gy 0.003�3 � 4% �0.001
0.00 � 0.03 cm3 0.60.08 � 0.07 cm3 �0.001
s the difference between the two datasets.
Tissu
teMC
Gy
Gy
cm3
cm3
d attenuation effect on all clinical cases.
Tpiuvba
I
frowdd
tsdsusansv(3d
hPl
eiEvapc
O
dMavaw
n1ttaoosna
CCUURB
ell as t
CCUURB
1196 I. J. Radiation Oncology ● Biology ● Physics Volume 68, Number 4, 2007
The effect is not systematic for the rectum and the bladder.he dose to the rectum and bladder does not follow a regularattern when water tissues are compared with human tissues: itncreases for some patients and decreases for others. Thenpredictability in tissue effect on OARs is explained by theariability of many factors among the patient sample: distanceetween OAR and CTV, OAR size, density of OAR voxels,nd OAR dosimetry parameter values.
nterseed attenuation studyFor the interseed attenuation study, the decrease in dose
rom the presence of neighboring seeds is calculated di-ectly. The effect on the CTV D90 parameter varies fromne patient to another (see Fig. 4) and the distribution isider than the distribution for the tissue effect. The doseecrease from interseed attenuation is 6.8 � 2.9 Gy and theecrease from tissue effect is 4.1 � 0.9 Gy.According to our correlation tests, the interseed attenua-
ion level increases for an implant with many small inter-eed distances. The correlation is strong for a thresholdistance of up to 10 mm. This correlation is significantlytronger than the correlation with the number of seeds pernit prostate volume nseed. At the postimplant stage, theeeds are not distributed homogeneously in the prostate andhigh nseed does not correspond automatically to a high
umber of small interseed distances. Even for cases withimilar nseed and prostate volume, the interseed attenuationaries. For example, Patients 10 and 17 have similar nseed
1.44 and 1.47 seeds/cm3) and prostate volume (36.8 and7.9 cm3), but their interseed attenuation on the CTV D90 isifferent (�2.3 and �4.0%). The difference is due to the
Table 4. Int
NoSeedMC Wa
linical target volume D90 169 Gy 16linical target volume V100 95% 9rethra D5 281 Gy 27rethra V150 39% 3ectum V100 0.72 cm3 0.5ladder V100 0.89 cm3 0.7
For NoSeedMC and WaterMC, the mean values are given as w
Table 5. G
Clinical One-dimensio
linical target volume D90 169 Gy 169 Gylinical target volume V100 95% 95%rethra D5 273 Gy 277 Gyrethra V150 34% 34%ectum V100 0.64 cm3 0.65 cm3
ladder V100 0.95 cm3 0.97 cm3
For all five datasets, the mean values are given.
igh number of tightly clustered seeds in Patient 17. Foratient 17, there are 44 seed pairs with interseed distance
ess than 6 mm compared with 23 seed pairs for Patient 10.The effect of interseed attenuation on OARs is difficult to
stablish globally because the standard deviations presentedn Table 4 are comparable to the mean difference values.specially for rectum and bladder V100 values, the absolutealue of the parameter varies greatly from one patient tonother. Still, for every patient, every single dosimetryarameter decreases with interseed attenuation and the de-rease is statistically significant.
ther factorsThere are other lesser effects at work because Clinical
osimetry results are slightly different from NoSeedMC.any possible causes have been suspected: contour man-
gement and voxelization, seed anisotropy, seed model,olume averaging, and TG-43 formalism (data interpolationnd geometry function). These potential causes are studiedith the three additional techniques presented in Table 5.To study the contour management and voxelization tech-
ique, one needs to compare Clinical with in-house TG-43D (point source TG-43). Both techniques are identical inerms of seed model and calculation formalism, but poten-ially different in terms of geometry management (contoursnd voxelization). The difference is statistically significantnly for the urethra D5 (p value of 0.005), with a differencef about 2%. Thus our in-house technique is sensitive tomall volumes when compared with the SPOT-PRO tech-ique. The discrepancies could be explained by the smallnd elongated urethra volumes, which make the data ex-
attenuation
Difference (WaterMC-NoSeedMC) p value
�6.8 � 2.9 Gy �0.001�1.1 � 0.7% �0.001�11 � 9 Gy �0.001�8 � 8% �0.001
�0.15 � 0.11 cm3 �0.001�0.18 � 0.20 cm3 �0.001
he difference between the two datasets.
ry effects
In-house TG-43
Two-dimensionalTwo-dimensional
our data NoSeedMC
170 Gy 169 Gy 169 Gy95% 95% 95%
283 Gy 281 Gy 281 Gy41% 40% 39%
0.75 cm3 0.73 cm3 0.72 cm3
0.90 cm3 0.90 cm3 0.89 cm3
erseed
terMC
2 Gy4%0 Gy1%7 cm3
2 cm3
eomet
nal
te
iaTaBtissprtpdTf
(atdcca
2rnsacitaGtrstiV(3gi
T
isavfia
UedvMdsmmT
P
pbutroivTt
ipmseabtiwsmppbti
C
tFactriHicmt
1197Postimplant dosimetry using Monte Carlo ● J.-F. CARRIER et al.
remely sensitive to position and to contour interpolation/xtrapolation methods.
The comparison between the in-house 1D and 2D shows themportance of anisotropy for the OARs. In fact, the differencesre statistically significant for all OAR parameters presented inable 5. The effect shown was explained by Leclerc et al. (22)nd is due to all seeds being parallel to the axis of implantation.ecause of the anisotropy effect of all inserted seeds, the dose
o the bladder is lower for the 2D� cases because the bladders usually located outside the seed cluster on the end of theeeds. The effect is reversed for the rectum and urethra. Aimilar effect was presented by Chibani et al. (23) for 2atients. Additional differences are obtained when other pa-ameters are studied, especially the parameters that are sensi-ive to small volumes of high doses near the seeds. For exam-le, the CTV D10 (results not shown) shows an averageecrease of 5% when the 2D is compared with the 1D model.his is due to the difficult modeling of the dose near the seed
or a 1D model.Our seed model is compared to the published seed model
12, 13) when 2D and 2D our data are considered. We seesystematic decrease of less than 1% on three parameters:
he CTV D90, urethra D5, and urethra V150. The meanecrease for the rectum V100 is 0.02 cm3. These de-reases, although systematic, are minimal and not clini-ally significant. Both seed models are considered equiv-lent within 1%.
The comparison between NoSeedMC and in-house TG-43D our data underlines the success with which TG-43ealistically reproduces dose deposition. Because both tech-iques are similar in many ways (water phantom, no inter-eed attenuation, same contour management, same datanalysis procedure, same seed model), the small differencesould only be explained by volume averaging in MC andmperfect TG-43 formalism: data interpolation/extrapola-ion and geometry function. The differences are minimal forll organs, especially for the CTV (average difference of 0.7y for the CTV D90). The differences are systematic, but in
his case not significant. However for extracting parameterselated to small volumes receiving high doses, thus close toeeds, a 2D (line source TG-43) or 3D (MC techniques)echnique is more appropriate than a 1D approach. Thempact is clearly seen for the urethra with an increase of
150 and D5. It is also observable on the CTV D10 parameterresults not shown) for which there is an average increase of% for the 3D model compared with the 2D model. Thiseometry effect is independent of tissue composition andnterseed attenuation.
issue descriptionThe realistic description of the prostate tissue could be
mproved by allowing heterogeneous composition. In ourtudy, the elemental composition of the prostate tissue wasssumed constant, but the density was variable from oneoxel to the other. Taking into account the localized calci-cations could lead to heterogeneous compositions and
dditional discrepancies between our model and the reality.nfortunately, the CT images do not give information onlemental composition, it is thus impossible to use realisticescriptions for the voxel compositions. We investigatedarious models of calcifications, localized or diffuse, in ourC method (results not shown) and the impact on the
osimetry varies greatly from one model to the other, byometimes more than 10 Gy on the CTV D90 for extremeodels. A study on a preliminary localized calcificationodel is also presented by Chibani and Williamson (5).his aspect will need further investigation.
reimplant, intraoperative, or postimplantRecently, Potters et al. (20) questioned the role for
ostimplant dosimetry in real-time dynamic permanentrachytherapy. The two effects under study, interseed atten-ation and tissue composition, are present at any stages ofhe implantation. Thus the results presented here are stillelevant for any dosimetry study, be it postimplant, intra-perative, or preimplant. However, with the motion of seedsn time, the quantitative consequences of both effects canary depending on the time elapsed since implantation.hus an operating room–based dosimetry study could lead
o results slightly different from those presented here.A recent study by Carrier et al. (7) calculated the effect of
nterseed attenuation and tissue composition for preimplantlanning dosimetry instead of postimplant dosimetry. The seedodel used in that study, 6711 from Amersham (21), is very
imilar to the selectSeed. The conclusions were slightly differ-nt from the results given here for both the tissue and interseedttenuation effects. The tissue composition effect was differentecause they solely modeled homogeneous tissues. Accordingo our results, the interseed attenuation effect is more importantn postimplant distributions than for planning distributions,here all seeds are positioned according to a 5-mm grid. For
imilar prostate sizes and initial activities of about 0.76 U (0.6Ci), the interseed attenuation causes a decrease of 2% at the
lanning stage, whereas it reaches averages of 4.1% at postim-lant. The attenuation is greater for postimplant distributionsecause seeds tend to create clusters after they are implanted;he closest neighbors tend to get closer after the seeds aremplanted (24).
linical significanceOur MC dose calculation technique is closer to reality
han TG-43–based methods, especially the 1D approach.or some patients, the combination of interseed attenuationnd tissue composition effects leads to differences that arelinically significant on dosimetry parameters for whichhere is a dose-outcome correlation (4) (e.g., D90). Theesults from previous dose-outcome studies should be mod-fied now that a new calculation technique is available.owever, as long as the TG-43–based techniques are used
n treatment planning, the prescription dose should not behanged. Besides, the variability among the patient sampleakes it difficult to suggest a modification to the prescrip-
ion dose that would be based on a simple scaling factor.
Using the new MC calculation technique for postimplant
dmwTtera
S
tmisauihb
spTaCvto�V
awUade
1
1
1
1
1198 I. J. Radiation Oncology ● Biology ● Physics Volume 68, Number 4, 2007
osimetry study might allow a better understanding of treat-ent failure causes, such as cold spots in the prostate thatere not suspected with the usual calculation technique.his effect is especially important for implants that are near
he dose–response cutoff of 140 Gy described by Stockt al. (4). To clearly assess the clinical significance of ouresults, a follow-up study with more patients is needed,long with a dose–outcome correlation investigation.
tudy limitationsThe quantitative results given here are valid for specific
reatment conditions: initial activities of about 0.76 U (0.6Ci) and a seed model corresponding to the selectSeed. Mod-
fying one of the conditions might lead to different results. Thetudy by Carrier et al. (7) shows how a lower initial activitynd a higher number of seeds leads to higher interseed atten-ation in treatment planning. For a postimplant study, lowernitial activities (e.g., 0.4–0.5 U or 0.3–0.4 mCi) would lead toigher interseed attenuation effects and thus larger differences
etween clinical and realistic calculations. pREFEREN
3. Anagnostopoulos G, Baltas D, Karaiskos P, et al. Thermolu-
1
1
1
1
1
1
2
2
2
2
2
CONCLUSION
A versatile and automated MC program was developed totudy specific effects on the postimplant dosimetry of 28atients. A global comparison between clinically approvedG-43–based calculation and a complete MC technique showssystematic dose overestimation of 10.7 � 3.3 Gy for theTV D90 from interseed and tissue effects. For the OARs, theariability among patients is significant and no predictive fac-ors can be established to take into account the two effects. Theverestimation was calculated for different dose parameters: 6
11 Gy for the urethra D5, 0.07 � 0.10 cm3 for the rectum
100, and 0.16 � 0.19 cm3 for the bladder V100.Because of the significant overestimation and the vari-
bility among the patients, dose–outcome studies generatedith TG-43–based dosimetry are potentially problematic.sing the MC technique, one can take into account two
dditional effects and bring the dosimetry closer to the doseelivered to the patient. The MC method should be consid-red for the creation of a new standard for clinical postim-
lant dosimetry and dose–outcome studies in a near future.CES
1. Holm HH, Gammelgaard J. Ultrasonically guided precise nee-dle placement in the prostate and the seminal vesicles. J Urol1981;125:385–387.
2. Holm HH, Pederson JF, Hansen H, et al. Transperineal 125Iiodine seed implantation in prostatic cancer guided by trans-rectal ultrasonography. J Urol 1983;130:283–286.
3. Nath R, Anderson LL, Luxton G, et al. Dosimetry of intersti-tial brachytherapy sources: Recommendations of the AAPMRadiation Therapy Committee Task Group No. 43. Med Phys1995;22:209–230.
4. Stock RG, Stone NN, Tabert A, et al. A dose-response studyfor 125I prostate implants. Int J Radiat Oncol Biol Phys 1998;41:101–108.
5. Chibani O, Williamson JF. MCPIC: A sub-minute MonteCarlo dose calculation engine for prostate implants. Med Phys2005;32:3688–3698.
6. Chibani O, Williamson JF, Todor D. Dosimetric effects ofseed anisotropy and interseed attenuation for 103Pd and 125Iprostate implants. Med Phys 2005;32:2557–2566.
7. Carrier J-F, Beaulieu L, Therriault-Proulx F, et al. Impact ofinterseed attenuation and tissue composition on permanentseed implant dosimetry: A Monte Carlo study. Med Phys2006;33:595–604.
8. Yu Y, Anderson LL, Li Z, et al. Permanent prostate seedimplant brachytherapy: Report of the American Association ofPhysicists in Medicine Task Group No. 64. Med Phys 1999;26:2054–2076.
9. Mobit P, Badragan I. Dose perturbation effects in prostateseed implant brachytherapy with I-125. Phys Med Biol 2004;49:3171–3178.
0. Beaulieu L, Radford Evans D, Aubin S, et al. Bypassing thelearning curve in permanent seed implants using state-of-the-arttechnology. Int J Radiat Oncol Biol Phys 2007;67:71–77.
1. Rivard MJ, Coursey BM, DeWerd LA, et al. Update of the AAPMTask Group No. 43 Report: A revised AAPM protocol for brachy-therapy dose calculations. Med Phys 2004;31:633–674.
2. Karaiskos P, Papagiannis P, Sakelliou L, et al. Monte Carlodosimetry of the selectSeed 125I interstitial brachytherapyseed. Med Phys 2001;28:1753–1760.
minescent dosimetry of the selectSeed 125I interstitialbrachytherapy seed. Med Phys 2002;29:709–716.
4. Rivard MJ, Radford-Evans DA, Kay I. A technical evaluationof the Nucletron FIRST system: Conformance of a remoteafterloading brachytherapy seed implantation system to man-ufacturer specifications and AAPM Task Group report recom-mendations. J Appl Clin Med Phys 2005;6:22–50.
5. Snyder WS, Cook MJ, Nasset ES, et al. Report of the task groupon reference man. International Commission on RadiologicalProtection, Report 23. New York: Pergamon Press; 1974.
6. Agostinelli S, Allison J, Amako K, et al. Geant4—a simula-tion toolkit. Nucl Instr Meth Phys Res A 2003;506:250–303.
7. Cullen DE, Hubbel JH, Kissel L. The Evaluated Photon DataLibrary, ‘97 version, 1997. UCRL-50400, vol. 6, rev 5.
8. Perkins ST, Cullen DE, Seltzer SE. Table and graphs ofelectron interaction cross sections from 10 eV to 100 GeVderived from the LLNL Evaluated Electron Data Library(EEDL), 1997. UCRL-50400, Vol. 31.
9. Perkins ST, Cullen DE, Chen MH, et al. Table and graphs ofatomic subshells and relaxation data derived from the LLNLEvaluated Atomic Data Library (EADL), Z�1-100, 1997.UCRL-50400, Vol. 30.
0. Potters L, Calugaru E, Jassal A, et al. Is there a role for postimplantdosimetry after real-time dynamic permanent prostate brachyther-apy? Int J Radiat Oncol Biol Phys 2006;65:1014–1019.
1. Williamson JF, Coursey BM, DeWerd LA, et al. Guidance to usersof Nycomed Amersham and North American Scientific, Inc.,125IInterstitial Sources: Dosimetry and calibration changes: recommen-dations of the American Association of Physicists in Medicine Ra-diation Therapy Committee Ad Hoc Subcommittee on Low-EnergySeed Dosimetry. Med Phys 1999;26:570–573.
2. Leclerc G, Lavallée M-C, Tubic D, et al. Idealized line sourceconfiguration for permanent 125I prostate implants. RadiotherOncol 2004;72:213–220.
3. Chibani O, Williamson JF, Todor D. Dosimetric effects ofseed anisotropy and interseed attenuation for 103Pd and 125Iprostate implants. Med Phys 2005;32:2557–2566.
4. Taschereau R, Roy J, Pouliot J. Monte Carlo simulations ofprostate implants to improve dosimetry and compare planning
methods. Med Phys 1999;26:1952–1959.