
Respiration-Averaged CT for Attenuation Correction in Canine Cardiac PET/CT
Upload
jknlvaboubrCategory
view
1download
0
Optical-CT Gel-Dosimetry I: Basic Investigations
Mark Oldhama) and Jeffrey H. Siewerdsenb)William Beaumont Hospital, Royal Oak, Michigan 48073-6769
Sai KumarEastern Michigan University, Michigan
John Wong and David A. Jaffrayb)William Beaumont Hospital, Royal Oak, Michigan 48073-6769
AbstractComprehensive verification of the intricate dose distributions associated with advanced radiationtreatments is now an immediate and substantial problem. The task is challenging using traditionaldosimeters because of restrictions to point measurements (ion chambers, diodes, TLD, etc.) or planarmeasurements (film). In essence, rapid advances in the technology to deliver radiation treatmentshave not been paralleled by corresponding advances in the ability to verify these treatments. Apotential solution has emerged in the form of water equivalent three dimensional (3D) gel-dosimetry.In this paper we present basic characterization and performance studies of a prototype optical-CTscanning system developed in our laboratory. An analysis of the potential role or scope of geldosimetry, in relation to other dosimeters, and to verification across the spectrum of therapeutictechniques is also given. The characterization studies enabled the determination of nominal operatingconditions for optical-CT scanning. “Finger” phantoms are introduced as a powerful and flexibletool for the investigation of optical-CT performance. The modulation-transfer function (MTF) of thesystem is determined to be better than 10% out to 1 mm-1, confirming sub-mm imaging ability.System performance is demonstrated by the acquisition of a 1×1×1 mm3 dataset through the dosedistribution delivered by an x-ray lens that focuses x rays in the energy range 40-80 KeV. This 3Dmeasurement would be extremely difficult to achieve with other dosimetry techniques and highlightssome of the strengths of gel dosimetry. Finally, an optical Monte Carlo model is introduced andshown to have potential to model light transport through gel-dosimetry systems, and to provide atool for the study and optimization of optical-CT gel dosimetry. The model utilizes Mie scatteringtheory and requires knowledge of the variation of the particle size distribution with dose. The latterwas determined here using the technique of dynamic-light-scattering.
Keywordsgel dosimetry; optical CT; polymer gel; optical Monte Carlo; 3D dosimetry; Mie scattering; dynamiclight scattering
I. INTRODUCTIONModern radiation therapy is characterized by treatment planning that is more elaborate andcustomized, and treatment delivery that is more precise and complex. These trends arediscernable in new treatment techniques in the areas of Intensity-Modulated-Radiation-Therapy(iMRT),1 brachytherapy,2 and radiosurgery.3 The potential benefits are greatly
a)Electronic mail: [email protected])Currently at Ontario Cancer Institute, Princess Margaret Hospital and the Departments of Medical Biophysics and Radiation Oncology,University of Toronto.
NIH Public AccessAuthor ManuscriptMed Phys. Author manuscript; available in PMC 2006 October 18.
Published in final edited form as:Med Phys. 2003 April ; 30(4): 623–634.
NIH
-PA Author Manuscript
NIH
-PA Author Manuscript
NIH
-PA Author Manuscript
desirable, including the reduction of side effects in normal tissue and the possibility of doseescalation to the tumor with an associated higher probability of cure.4 A significant challengehas arisen, however, because the rapid advances in the technology to deliver radiationtreatments have not been paralleled by corresponding advances in the ability to verify thesetreatments. At present, clinics use traditional dosimeters to verify and commission complexnew 3D delivery techniques. Typically in IMRT, the absolute dose is verified at a central pointusing an accurate dosimeter(e.g., an ion chamber), and the relative distribution is verified inselected planes utilizing less accurate film measurement. The imperfections of this method aresignificant. A comprehensive verification demands a laborious number of film measurements,which present, at best, a partial sampling of the distribution. Such effort is rarely maintainedin practice. Furthermore, accuracy is compromised because of the nonlinear response of filmto energy and orientation of irradiation.5 Radiochromic film6 has better energy responsecharacteristics but also has low sensitivity and still presents a partial sampling. Comprehensivetreatment verification is a key factor enhancing the quality and accuracy of clinical treatment,articulating the urgent need for a truly 3-D dosimetry system.
The challenge to clinical dosimetry is more fundamental than outlined above. A core issue isthat different clinical treatments demand different specifications from a dosimeter.Brachytherapy, utilizing low-energy gamma sources, demands high water equivalence andhigh spatial resolution. IMRT often requires high spatial resolution over larger volumes.Radiosurgery demands still higher spatial resolution, and a higher dynamic range, but oftenover much smaller volumes. Many such examples are possible. To summarize, a dosimetermust satisfy a multifaceted web of specifications to be applicable across the spectrum of clinicaltreatments. This web is illustrated in Fig. 1. A rating of zero indicates that a dosimeter has nofunctionality for that specification; a rating of 5 indicates highest relative functionality. Anideal dosimeter with global application would rate 5 on all radial axes. A welter of traditionaldosimeters stretch to different parts of the web, but none covers all. Present optical-CT geldosimetry (labeled gel) comes closest to the ideal, and it is the belief of many gel-dosimetryresearchers that the optimized technique (labeled gel_*) can come closer still.
The axes of Fig. 1 are relative, and the question arises as to what performance characteristicsa 3-D dosimetry system must exhibit to enable comprehensive verification across the spectrumof treatments outlined above. That is, how to define the outer “5” spider track. Van Dyke7recommended a 5% overall accuracy in dose delivered to a patient, derived from observationsthat clinically detectable changes accompany variations in an absorbed patient dose of >7%.This goal is consistent with the International Commission on Radiation Units andMeasurements(iCRU) Report No. 24.8 Further recommendations were that the relative dosedistribution should be determined to within 2.5%. A spatial accuracy of 5 mm wasrecommended for conventional radical radiation treatments, although this was reduced forstereotactic procedures. Jordan9 included the comment that the ideal 3-D do-simeter shouldhave sufficient accuracy and resolution to provide a gold standard for comparison with the bestavailable dose calculation algorithms. While this concept has clear merit it is hard to achievebecause the algorithms continually evolve. The advent of accurate and fast Monte Carlo dosecalculation algorithms have prompted discussions on whether a new 3-D measurement tool isrequired at all.10 In reality, no matter how accurately one can simulate a virtual world, the realworld contains factors and variables impossible to fully implement in a model(e.g., mechanicalimperfections and implementation errors).
Given the trend for increasing conformity and smaller margins, it is likely that the criteriaoutlined above will become ever more stringent. This led Oldham et al.11 to propose the ideal3-D dosimetry system should meet the RTAP(1,60,3,1) criteria (Resolution 1×1×1 nm, Time60 min imaging, Accuracy within 3%, and Precision within 1%). The RTAP(1,60,3,1) wasdeveloped with reference to the verification of radiosurgery dose distributions, where the
Oldham et al. Page 2
Med Phys. Author manuscript; available in PMC 2006 October 18.
NIH
-PA Author Manuscript
NIH
-PA Author Manuscript
NIH
-PA Author Manuscript
resolution requirements are most challenging. The RTAP concept is broadly consistent withthose of Jordan and Van Dyke, but has limitations in a wider context, as the time constraint isarbitrary and there is no explicit account of water equivalence or the other parameters in Fig.1. Water equivalence is a critical specification for a dosimetry system to have wideapplicability, particularly at lower photon energies where photoelectric effects are significant.Here we maintain the RTAP is a convenient approximation for the ideal specification of a 3-D gel dosimeter with the addition of water equivalence. At present, a relative dosimetry systemthat can achieve RTAP(1,60,3,1) across the spectrum of treatments is not available. However,recent gel dosimetry systems (discussed below) show real promise.
Three principle categories of gel dosimeters exist, polyacrylamide (PAG) gels,12 Fricke gels,13 and radiochromic gels,14 and two methods of scanning the gels, magnetic-resonance (MR)imaging,15 and optical-computer-tomography(optical CT).16,14,11 To date, most geldosimetry has utilized MR scanning, which is expensive and can be susceptible to subtlesources of error (De Deene et al.17-19). These errors originate largely in the technicalchallenges of controlling magnetic field uniformity and gradients with sufficient precision, andin temperature control associated with rf energy deposited in the gel during MR imaging.17For MR measurements requiring high accuracy and high spatial resolution, these errors remainproblematic to achieving the low uncertainty associated with standard dosimeters(e.g., ionchambers at 3%). Great interest was therefore generated by the introduction of an alternativemethod of imaging gel dosimeters. Gore et al.20 proposed optical-CT scanning of PAG gels,an approach analogous to first-generation x-ray CT with the x-ray source replaced by a visiblelaser and the x-ray detector replaced with a light-sensitive photodiode. This approach exploitsthe fact that polymerized regions of gel contain polymer microparticles that scatter light. Theeffect is that PAGs becoming increasingly opaque with increasing polymerization and thereforeincreasing dose. Maryanski et al.21 demonstrated that this opaqueness is due to scattering oflight in the PAG rather than to absorption. As the laser is stepped across the waterbathĉontaining the PAG dosimeter), the photodiode measures the amount of transmitted light,which varies in relation to the line integral of the polymerized gel in the laser beam. Asuccession of line integral light transmission measurements are made corresponding toprojections of multiple views through the gel. Standard inverse radon CT reconstructionalgorithms can then reconstruct the projected transmission profiles to generate maps of opticalattenuation coefficients inside the gel dosimeter. Gore et al.22 reported that doses in the range0-10 Gy could be measured with an accuracy of better than 5% with a spatial resolution of2×2×1 mm.
First generation optical-CT scanners were also constructed by Kelly et al.,14 utilizingradiochromic gel, and Oldham et al.11 These works have demonstrated that optical-CT hasthe potential to propel the accuracy of gel dosimetry to meet the RTAP(1,60,3,1) criteria aswell as the other factors in the spider plot. Many questions concerning optical-CT gel dosimetryremain unanswered. These include the following: can an optimized optical-CT gel-dosimetrysystem achieve the RTAP(1,60,3,1) criteria across the spectrum of treatments(i.e., the outer“5” track in Fig. 1), and what are the optimum acquisition parameters, dose-level, scanningtechnique, wavelength, etc. At the heart of these questions is the issue of how to optimize theoptical-CT technique for accuracy and efficiency while maintaining high spatial resolution inthree dimensions. In this paper we begin to address this question by conducting basicinvestigations into the influence of a variety of acquisition parameters on optical-CTperformance. Global system performance is demonstrated by the acquisition of a 1×1×1mm3 dataset through the distribution delivered by an x-ray lens that focuses x rays in the energyrange 40-80 KeV. Characterization of the lens was performed for incorporation into a small-animal-radiation-research platform.23 Effective optimization of optical-CT ultimately requiresthe development and utilization of a model to study the fundamentals of light transport throughthe gel and scanning system and the transfer of signal and noise through to the reconstructed
Oldham et al. Page 3
Med Phys. Author manuscript; available in PMC 2006 October 18.
NIH
-PA Author Manuscript
NIH
-PA Author Manuscript
NIH
-PA Author Manuscript
3-D image. As a preliminary step in this direction, an optical Monte Carlo model is introducedand preliminary simulations are presented to indicate potential to model and optimize optical-CT gel dosimetry.
II. MATERIALS AND METHODSInitial investigations focused on fundamental characterization of system performanceincluding the influence on image quality of key acquisition parameters(Sec. III A).Measurements were made with our prototype optical-CT scanner presented in Oldham et al.,11 but significantly modified and rebuilt to enable automated acquisition for multiple slicesthrough the gel dosimeter (Fig. 2). This was achieved utilizing X-95 structural mountssupporting a vertical translation stage that transports the entire rotation stage suspending thegel dosimeter vertically in the optical bath(Newport Corp., 1791 Deere Ave., Irvine CA 92606).Motion control was achieved utilizing NI-DAQ PC-LPM-16 ADC hardware(NationalInstruments Corp., 6504 Bridge Point Parkway, Austin, TX 78730). Customized amplificationelectronics were built utilizing the LT1055 operational amplifier. A typical optical-CT scanwas performed as follows(a more elaborate description is given in Ref. 11). First opticalmatching between the fluid in the water bath and the unirradiated gel was achieved by varyingthe refractive index to minimize the deflection of the laser beam under translation across thedo-simeter. This procedure was performed in about 10 min by adding progressive amounts ofwater-soluble immersion liquid with a high refractive index (n=1.45 at 25 °C at 589 nm)(Cargille Laboratories Inc., 55 Commerce Rd. Cedar Grove, NJ 07009-1205). A projectionscan was then taken where the laser was incrementally stepped(e.g., 1 mm increments) acrossthe dosimeter. The dosimeter was incrementally rotated between projections(e.g., by 1.8°) andthe procedure repeated until projection data was acquired over 180°. The total scanning timewas typically 6 min per plane for an 8 cm diam dosimeter. The optical-CT acquisition software(inhouse C++ code) was configured to return the ratio of the laser intensity at the referencediode to the field diode to enable correction for laser drift. Two-dimensional images of theoptical attenuation coefficients (μ) in the gel were obtained from the projection data utilizingthe inverse-radon transform algorithm implemented in MATLAB (The Math-Works, Inc., 3-Apple Hill Drive, Natick, MA 01760-2098).
The characterization of the influence of key acquisition parameters on system performancewas performed by comparing repeat optical-CT scans of special “finger-phantoms,” where therelevant acquisition parameters was varied. Finger phantoms (Fig. 3) consisted of clear gelatingel containing variably attenuating “fingers” formed by setting test tubes in the gel and thencarefully removing them to leave a finger depression mold that was then filled with theremainder of gelatin doped with controlled amounts of (blue) attenuating dye. The flask itselfwas made of PET plastic. The key to obtaining seamless fingers(important for sensitive opticalscanning) was to add hot water to the test tubes for ∼20 s prior to removal, to melt and lubricatethe gel immediately in contact with the test tube. In addition, the depressions were filled withgel that was just warm enough to maintain a liquid phase to create a seamless join. Care wastaken to avoid adding gel that was too hot, as the finger depression would then distort due tomelting.
The modified optical-CT scanner provides greater flexibility in image acquisition parameterscompared to the previous prototype. Key acquisition or operational parameters include(i) thenumber of ADC samples, NADC read , averaged for each line integral of laser attenuation;(ii)the spatial increment, dx, between line integrals in each projection; and (iii) the angularincrement, dθ , between projections. Each of these parameters affects acquisition time as wellas image quality. Images of the finger phantoms were acquired at various settings of theseacquisition parameters to examine the effect on image noise, accuracy, spatial resolution, and
Oldham et al. Page 4
Med Phys. Author manuscript; available in PMC 2006 October 18.
NIH
-PA Author Manuscript
NIH
-PA Author Manuscript
NIH
-PA Author Manuscript
artifacts. In this manner a nominal set of operating conditions was determined for subsequentinvestigations.
The accuracy of optical-CT reconstructed attenuation coefficients was determined by creatingtwo finger phantoms, each containing four fingers of varying optical attenuation achieved byadding small amounts of blue food coloring dye (Sec. III B). The optical attenuation of thefingers were then measured by optical-CT scanning using the nominal operating conditions.An independent measurement of the optical attenuation coefficient was made by placing excessgel from each finger into 1 cm pathlength optical cuvettes that were then placed in aspectrophotometer [Shimadzu UV-265(Shimadzu America, 7102 Riverwood Drive,Columbia, MD 21046]. Spectrophotometric measurements of attenuation coefficient were thendirectly compared with the mean pixel value within each finger determined from optical-CT.
The spatial-frequency response characteristics of the optical-CT system was objectivelyquantified by measurement of the modulation transfer function (MTF)12,13(Sec. III C). Auniform, unirradiated, cylindrical gelatin gelphantom (diameter 8 cm) was prepared in whicha 0.25 mm diam steel wire was suspended longitudinally. Images of the phantom were acquiredin which the laser was stepped at 0.1 mm increments between each line integral, and the angularincrement between projections was 1°. A Hanning window was employed in the reconstruction.
Global system performance is demonstrated by application to diffusion measurement(Sec. IIID) and the 3-D measurement of dose delivered by an x-ray lens(Sec. III E). It is well knownthat small molecules can diffuse through the gelatin over time.24 The diffusion of attenuatingdye molecules from regions of high concentration(i.e., the fingers in Fig. 3) into regions of lowconcentration(surrounding undyed gel) was studied by taking repeat optical-CT scans of asingle finger phantom over a 4 h period. The x-ray lens is illustrated in Fig. 4 [OSMIC Inc.,1900 Taylor Rd., Auburn Hills, MI 48326(www.osmic.com]. For correct operation, the lensis positioned 17 cm from the x-ray source (dependent on the energy of the beam). The lens isdesigned to produce a full-width-half-maximum (FWHM) of 1 mm at the focus with a depthof field of 5 cm. It had been sent to several laboratories for evaluation during which time it hadsustained some damage, resulting in suboptimal focus. The lens was used to irradiate acylindrical BANG gel dosimeter of diameter and height ∼8 cm (MGS Research, P.O. Box 581Guildford, CT 06437). Optical-CT scans were then taken using the nominal operatingconditions that produced a 3-D image dataset with a resolution of 1×1×1 mm3 through thescanned region of the gel dosimeter. A second irradiation was given without the lens, with theunfocused beam collimated to a 5 mm circular field utilizing a lead absorber.
The desire to further optimize optical-CT gel dosimetry led to the consideration of how tosimulate and model the entire process, which would enable the efficient study of permutationsof a large number of variables(Sec. III F). The construction of such a model is a significantundertaking, and so a commercial optical Monte Carlo software “LightTools” was used,manufactured by Optical-Research-Associates (optical Research Associates, Pasadena, CA).LightTools contains functionality for creating arbitrary geometrical arrangements of objects(including immersion and cementing operations) and simulating large numbers of photontracks through an optical system (histories). Each photon track is “nonsequential,” in that theprobability of a certain interaction is applied to the history at each interaction point in thestandard Monte Carlo manner. The LightTools software was used to simulate light transportin a simple configuration [Fig. 5(a)], where a laser was incident on a 32 mm thick slab of PAGgel irradiated with a 5×5 cm square field with 6 MV radiation. Judicious placement of buildupmaterial around the flask during irradiation yielded a near-uniform dose along the central axisacross the flask. The laser spot size exiting the gel is significantly broadened by light scatteringwithin the gel. An identical physical geometry was implemented on an optical bench to allowindependent verification by physical measurement [Fig. 5(b)]. The measurement was
Oldham et al. Page 5
Med Phys. Author manuscript; available in PMC 2006 October 18.
NIH
-PA Author Manuscript
NIH
-PA Author Manuscript
NIH
-PA Author Manuscript
performed by stepping a highly collimated photodiode (representing a point detector) acrossthe flask to record the profile of the laser beam on exit of the gel at the measurement plane. Asensitive comparison was therefore possible between the modeled and measured exit laserprofile after scattering.
Monte Carlo simulations and corresponding physical measurements were made of the laserprofile exiting three identical gel dosimeters irradiated to different doses: 1.5, 4, and 6 Gy,representing low, medium, and high dose, respectively. The aim was to investigate whetherLightTools could accurately model laser broadening and scattering in a simple gel-dosimetryconfiguration. The default scattering model in LightTools is Mie theory,25 which providesanalytic solutions for scattering in a medium containing isotropic, homogenous, and sphericalparticles. This is a first-order approximation for PAG dosimeters, where the input parametersfor the Mie model are the radius of the particles, the number density and refractive index.Polymer particle size distributions for PAG gel (BANG1 formulation) given different doseswere measured by dynamic-light scattering (DLS). The DLS measurement was made asfollows. 5 g of the irradiated gel were added to 20 g of deionized water and the mixture heatedto 50 °C with stirring. After the sample had completely dispersed/suspended, several drops ofthe dispersed sample were again diluted with 20 g of deionized water in a 30 ml beaker, whichwas then sonicated (Bronsonic 200) for 10 min. This sample was then placed into a MicrotracUPA Particle Size Analyzer(UPA 150, Model # 9240-4-10-1, 0592-33992-001-U1089). Thesample concentration was adjusted to give a loading index of 0.5-1.0 (the loading index is aninstrumental parameter used to obtain measurable scattering signal from the sample). Anaverage value from three runs of 300 s was used to estimate the particle size distribution. Therefractive index of polymer particles is taken as acrylic at 1.53 (the default value in LightToolssoftware at 632 nm) and that of the BANG gel as 1.36.26 An estimation of number densityrequires the calibration of the DLS technique using monodisperse particles of known size. Thistechnique was beyond the scope of these preliminary measurements, and so number densityvalues were determined by trial and error to match the observed scattered laser-light profileson exit of the gel-dosimeters. For each of the measured exit laser profiles from gel at 1.5, 4,and 6 Gy, the corresponding Monte Carlo simulations were run using the effective maximumscattering particle size and a range of number density values until the modeled profile mostclosely matched the measured profile. The laser was simulated as a cylindrical cavity [Fig. 5(a)], where the flat end of the cylindrical source farthest from the gel emits parallel rays in-wardly that traverse the laser cavity, passing through the other flat end, en route to strike thegel dosimeter. The latter flat end is 100% transmissive but applies a Gaussian scatteringfunction to model the divergence and scattering of the laser light emitted from the cavity.
III. RESULTS AND DISCUSSIONA. Fundamental characterization of system performance
The influence of key acquisition parameters on image quality, and susceptibility to imageartifacts, is demonstrated in Fig. 6. Figure 6 contains a selection from many optical-CT scanstaken of the same finger phantom, where key acquisition parameters were varied. The phantomcontained a highly attenuating finger to enable the investigation of susceptibility to “missingdata” streak and sampling artifacts. Each pair of images(a,b; c,d; and e,f) correspond to thelowest and highest quality images for a particular acquisition parameter, dΘ , dx, andNADC read , respectively (described in Sec. II). A comparison of the three image-pairs yieldsinteresting observations. First, image quality is seen to be most significantly compromised byinadequate sampling of the ADC (NADC read). In Fig. 6(e)) excessive streak artifacts and con-tour distortion is observed, with dramatic improvement when NADC read was increased to 100.Figures 6(a)) and 6(b) show the least difference, indicating image quality to be relativelyinsensitive to the rotational increment or the number of projections (Nproj). A slight reductionin streak artifacts and lower image noise is observable. Perhaps the cleanest image is Fig. 6ĉ),
Oldham et al. Page 6
Med Phys. Author manuscript; available in PMC 2006 October 18.
NIH
-PA Author Manuscript
NIH
-PA Author Manuscript
NIH
-PA Author Manuscript
where a low noise, artifact-free image is apparently achieved, despite a very course (dx=2 mm)stepping of the laser across each projection. This interpretation is mis-leading, however, ascloser inspection reveals that the reconstructed finger sizes are too small, and the lack of streakartifacts is a result of the laser steps failing to intersect the most attenuating paths. The latterpoint is also the reason that the fine detail of the circular walls of the flask is almost completelylost. In contrast, Fig. 6(d), incorporating very fine stepping (dx=0.5 mm) shows the clearestview of the walls of the flask. Slight streak artifacts are also apparent where the laser doesreach the lines of highest attenuation. The effect of translation and rotation sampling on noiseand spatial resolution can be understood from basic considerations of signal and noise transferin CT reconstruction.27
A more quantitative analysis of the images in Fig. 6, and other optical-CT runs, is shown inFig. 7, where fingers are numbered according to increasing attenuation. Figures 7(i)-(iii) showthe standard deviations(stdev) on mean pixel values in the central regions of each finger, andFigs. 7(iv)-(vi) show the mean values. In Figs. 7(i)-(iii) lower stdev’s, corresponding to lowerimage noise, is generally consistent with higher values for NADC read, smaller dθ , and smallerdx. Consistent with the interpretation above, the greatest improvement in stdev was observedfor even modest increases of NADC read . A reduction in stdev of nearly a factor of 10 is observedbetween NADC read=1 and NADC read=100. Figure 7(iv) suggests that part of this error is causedby artificial depression of the photodiode response for the first few samplings, leading toartificially high attenuation coefficient pixel values. Aside from the gross influence of artifacts,Figs. 7(iv)-(vi) indicates the accuracy of mean pixel values was independent of the keyacquisition or operational parameters. The conclusion from multiple acquisitions was theselection of a nominal set of operating conditions consisting of NADC read=50, dx=1 mm, anddΘ =1.5°, which represented an optimal trade-off between time and image quality. The nominaloperating condition was adopted for subsequent studies unless otherwise noted.
Characterization of the photodiode detection hardware included signal linearity, signal-to-noise ratio(SNR), temporal response, and temporal stability. Using a graded neutral densityfilter, photodiode response was measured as a function of laser intensity and found to be linearwithin a few percent. The response at the upper end of the signal range is limited by the amplifierelectronics and (12-bit) ADC. The SNR of photodiode response depended on RF noise, whichwas minimized by good motor control software, and inherent noise introduced by fluid in thewater-bath. The dynamic range of the system both with and without the water-bath was (1020±15):1 and 4000:1, respectively. System temporal response was found to be reasonably fast,with less than 1% residual signal measured on the falling edge(and better than 99% full signalon the rising edge) of a step input function as the laser beam was switched off and on using ashutter. Finally, following a 30-40 min warm-up period, the system exhibits temporal stabilityof ∼1% drift over a period of at least 1 h.
B. Verification of optical-CT reconstructed attenuation coefficientsThe optical-CT image of a finger phantom, with finger regions ranging in attenuation from∼0.21 to ∼0.04 mm-1, is shown in Fig. 8(a)). Optical-CT determined attenuation coefficientsin the fingers are compared with those measured by the spectrophotometer in Fig. 8(b). Resultsagreed well, with a linear fit between the two, showing a slope of ∼0.97 ± 0.03. The optical-CT system appears capable of measuring absolute attenuation coefficient within 3%-4%. Thenoise in these measurements may be inflated by slight dilutions of the gel comprising the fingerwhen it is poured into the finger depression, and uncertainties in the spectrophotometricreadings.
Oldham et al. Page 7
Med Phys. Author manuscript; available in PMC 2006 October 18.
NIH
-PA Author Manuscript
NIH
-PA Author Manuscript
NIH
-PA Author Manuscript
C. Spatial resolution of the optical-CT systemThe high-resolution optical-CT scan of the wire phantom is shown magnified in the regionabout the 0.254 mm wire in Fig. 9(a)). The full-width at half-maximum of the reconstructedwire was 0.66 mm, which corresponds to the manufacturer-specified width of the laser beam(0.7 mm). The MTF was computed by Fourier transform of the area-normalized Radontransform of the images, and the results are shown in Fig. 9(b). There is very little appreciable“low-frequency drop”(associated with long-range scatter), since the measurement wasperformed in a clear gel. The MTF is greater than 10% out to approximately 1 mm-1, consistentwith the notion that the system provides images with sub-mm spatial resolution.
D. Investigation of temporal stability (diffusion) in gel phantomsThe results of the 4 h repeat optical-CT study of a finger phantom is illustrated in Fig. 10. InFig. 10(a), the defining edge of each finger(or cell) region is observed to become blurred overtime as the dye diffuses into the surrounding gel. In Fig. 10(b), the pixel value in three regionsof Cell #1 are shown(Nominal attenuation ∼0.21 mm-1). Pixel values in the first region, nearthe center of the cell, are observed to be stable to within 0.6% over 4 h. Values in the second“shoulder” region are at 90% of the central value at time zero and are found to decay by ∼16%over 4 h. In the toe region corresponding to 10% of the central value at time zero, values increaseby ∼62% as dye diffuses into surrounding regions over the 4 hours. From these observationsthe diffusion of dye concentration was estimated at a rate of ∼0.2-0.5 mm per hour at roomtemperature. These measurements demonstrate the sensitivity of the optical-CT system inexamining such subtle effects and highlight a possible time-critical aspect of using optical-CTfor accurate dosimetry with high spatial resolution. Small negative pixel values in Fig. 10 areattributed to light scattering in the water-bath and gel-dosimetry system.
E. Application of gel dosimetry to study dose from an x-ray-lensMultiple axial planes at 1 mm separation through the 8 cm diameter gel dosimeter afterirradiation with the x-ray lens (Fig. 4) are shown in Fig. 11. The lens irradiation is incident inthe upper right of the flask and is observed to focus as it penetrates the gel. The degree offocusing is illustrated by the comparison of the high-resolution optical-CT scans in Fig. 12,where the lens distribution is compared with the unfocused kV beam collimated to 5 mmdiameter. Three optical orientation marks (three lines drawn with a black pen) are visible inthe transaxial images as three dots located on the perimeter of the flask. The images shown arein units of an optical-attenuation coefficient (mm-1) and are proportional to dose. Theconversion to dose could be made through utilization of a calibration curve determined at thisenergy. Although not performed in this work(a relative distribution was adequate for ourcharacterization of the lens), such calibrations have been reported in the literature.28 The 3-Dmeasurement of the focused lens distribution would be extremely difficult to achieve with anyother dosimetry technique and highlights some of the strengths of gel dosimetry.
F. Model to simulate light transport through gel dosimetersThe Monte Carlo modeled and measured “in-air” laser profiles(Not shown here) showed almostperfect agreement utilizing the Gaussian scattering surface model in the Monte Carlo sourcemodel. The particle-size distribution of light-scattering polymer microparticles determined bythe dynamic-light-scattering (DLS) technique is shown in Fig. 13. As the dose to gel increases,the particle size distribution is observed to broaden such that that the mean and maximumparticle size increases. Less change is observed in the minimum particle size, although that tooincreases slightly. At present, the LightTools model supports monodispersive Mie particlesonly, so effective maximum scattering particle radii were estimated for each dose level. Theseradii were 243, 289, and 575 nm, respectively, for dose levels of 1.5, 4, and 6 Gy. The measuredlaser profiles exiting the three gel flasks (irradiated to 1.5, 4, and 6 Gy, respectively) are
Oldham et al. Page 8
Med Phys. Author manuscript; available in PMC 2006 October 18.
NIH
-PA Author Manuscript
NIH
-PA Author Manuscript
NIH
-PA Author Manuscript
illustrated in Fig. 14(a). As the gel receives more dose, and thus contains more, and larger,light scattering polymer particles, the central laser peak is observed to diminish relative to theback-ground scatter signal. The width of the laser peak appears to maintain its shape, exceptfor an increased broadening observed in the low-intensity tails(Note the log scale). At highdoses (6 Gy gel) significant broad scattering is observed manifesting as a “scattering offset”to the laser peak. Normalized, Monte-Carlo simulated laser profiles are illustrated in Fig. 14(b). These simulations were-obtained using the effective maximum particle sizes for each doselevel and an estimated number density of 5×104 mm-3. In practice, the shape of the profile wasfound to be more sensitive to the particle size than to the number density. The general behaviorof the measured profiles is seen in the simulated profiles, with the exception of the fine detailof the tapering of the spot width at low-intensity levels for the 1.5 and 4 Gy gels. This isinterpreted as the breakdown of the mono-dispersive Mie scattering approximation.
IV. CONCLUSIONSThe role and potential of optical-CT gel dosimetry is discussed in relation to other dosimetersand the spectrum of modern radiation treatments in the spider plot of Fig. 1. Optical-CT gel-dosimetry is shown to approach(e.g., Fig. 11) a long-term key goal of radiation dosimetry asapproximated by the RTAP (1,60,3,1) criteria(i.e., Resolution 1 mm, Time 60 mins, Accuracywithin 3%, Precision 1%). These criteria, in conjunction with the tissue equivalence of presentgel-dosimeters, renders gel-dosimetry a potent tool with wide applicability across the spectrumof photon and electron therapies. The sensitivity of image quality to key acquisition parameterswas investigated and nominal operating conditions (laser step size=1 mm, angular rotationincrement =1.5 degrees, number of ADC averages=100) were established. The need wasarticulated for the development of a model to simulate the optical-CT process to enableeffective optimization of the technique. As a preliminary step in this direction, a commerciallyavailable optical Monte Carlo soft-ware was investigated and demonstrated to have potentialto model light transport through simple gel-dosimetry systems. Limitations of the Miescattering model were identified and are the subject of continued investigations.
ACKNOWLEDGMENTS
We are very grateful to Michael Sharpe and Daniel Letourneau for comments and helpful discussions. Also to WoodyArmour for assistance with the x-ray lens delivery, and Leonard Kim for assistance with figures and to Paul Ziemerfor assistance with the dynamic-light-scattering measurements.
References1. Webb, S. Intensity-Modulated Radiation Therapy. (institute of Physics Publishing; Bristol, UK: 2001.2. Perez CA, Michalski JM, Purdy JA, Lockett MA. “New trends in prostatic cancer research. Three-
dimensional conformal radiation therapy 3-D CRT, brachytherapy, and new therapeutic modalities,”.Rays 2000;25:331–343. [PubMed: 11367899]
3. Schell, MC.; Bova, FJ.; Larsson, D.; Leavitt, DL. Stereotactic radiosurgery, Report of Task Group 42Radiation Therapy Committee. American Association of Physicists in Medicine; New York: 1995.AAPM Report #54 (aIP
4. Leibel SA, et al. “Intensity-modulated radiotherapy,”. Cancer 2002;8:164–176.5. Oldham, M. “Radiation sensitive film and gels,”. In: Mayles, PM.; Nahum, AE.; Rosenwald, JC.,
editors. Handbook of Radiotherapy Physics: Theory and Practice. (institute of Physics; Bristol UK:2002.
6. Niroomand-Rad A, et al. “Radiochromic film dosimetry: recommendations of AAPM RadiationTherapy Committee Task Group 55. American Association of Physicists in Medicine,”. Med. Phys1998;25:2093–2115. [PubMed: 9829234]
7. Van Dyke, J. The Modern Technology of Radiation Oncology. Medical Physics Publishing; Madison,WI: 1999.
Oldham et al. Page 9
Med Phys. Author manuscript; available in PMC 2006 October 18.
NIH
-PA Author Manuscript
NIH
-PA Author Manuscript
NIH
-PA Author Manuscript

8. International Commission on Radiation Units and Measurements(iCRU, ICRU Report 24. Washington,DC: 1976. “Determination of absorbed dose in a patient irradiated by beams of X or gamma rays inradiotherapy procedures,”.
9. Jordan, KJ. “Developmental issues for optical-CT and gel-dosimetry,”; Proceedings of the 1stInternational Conference on Gel Dosimetry; DOSEGEL, 1999 Queens University Printing Service,Kingston, ON, Canada. 1999; p. 91-96.
10. Kron, T. “Radiation therapy requirements: what do we expect from gel-dosimetry,”; Proceedings ofthe 2nd International Conference on Gel Do-simetry; DOSEGEL, 2001 Queensland University ofTechnology, Brisbane, Australia. 2002; p. 2-9.
11. Oldham M, Siewerdsen JH, Shetty A, Jaffray DA. “High resolution gel-dosimetry by optical-CT andMR scanning,”. Med. Phys 2001;28:1436–1445. [PubMed: 11488576]
12. Maryanski MJ, Gore JC, Kennan RP, Schulz RJ. “NMR relaxation enhancement in gels polymerizedand cross-linked by ionizing radiation: a new approach to 3D dosimetry by MRI,”. Magn. Reson.Imaging 1993;11:253–258. [PubMed: 8455435]
13. Schreiner, LJ. “Fricke gel dosimetry,”. p. 15-22.in Ref. 1014. Kelly BG, Jordan KJ, Battista JJ. “Optical CT reconstruction of 3D dose distributions using the
ferrous-benzoic-xylenol FBX gel dosimeter,”. Med. Phys 1998;25:1741–1750. [PubMed: 9775382]15. Baustert IC, Oldham M, Smith TA, Hayes C, Webb S, Leach MO. “Optimized MR imaging for
polyacrylamide gel dosimetry,”. Phys. Med. Biol 2000;45:847–858. [PubMed: 10795976]16. Gore JC, Ranade M, Maryanski MJ, Schulz RJ. “Radiation dose distributions in three dimensions
from tomographic optical density scanning of polymer gels: I. Development of an optical scanner,”.Phys. Med. Biol 1996;41:2695–2704. [PubMed: 8971963]
17. De Deene Y, De Wagter C. “Artefacts in multi-echo T2 imaging for high-precision gel dosimetry:III. Effects of temperature drift during scanning,”. Phys. Med. Biol 2001;46:2697–2711. [PubMed:11686283]
18. De Deene Y, De Wagter C, De Neve W, Achten E. “Artefacts in multi-echo T2 imaging for high-precision gel dosimetry: I. Analysis and compensation of eddy currents,”. Phys. Med. Biol2000;45:1807–1823. [PubMed: 10943920]
19. De Deene Y, De Wagter C, De Neve W, Achten E. “Artefacts in multi-echo T2 imaging for high-precision gel dosimetry: II. Analysis of B1-field inhomogeneity,”. Phys. Med. Biol 2000;45:1825–1839. [PubMed: 10943921]
20. Gore JC, Ranade M, Maryanski MJ, Schulz RJ. “Radiation dose distributions in three dimensionsfrom tomographic optical density scanning of polymer gels: I. Development of an optical scanner,”.Phys. Med. Biol 1996;41:2695–2704. [PubMed: 8971963]
21. Maryanski MJ, Zastavker YZ, Gore JC. “Radiation dose distributions in three dimensions fromtomographic optical density scanning of polymer gels: II. Optical properties of the BANG polymergel,”. Phys. Med. Biol 1996;41:2705–2717. [PubMed: 8971964]
22. Gore JC, Ranade M, Maryanski MJ, Schulz RJ. “Radiation dose distributions in three dimensionsfrom tomographic optical density scanning of polymer gels: I. Development of an optical scanner,”.Phys. Med. Biol 1996;41:2695–2704. [PubMed: 8971963]
23. Wong, J.; Jaffray, DA.; Siewerdsen, JH.; Oldham, M.; Laub, W.; Armour, E. “An image guided smallanimal conformal radiation research platform,”; 49th Annual Meeting of the Radiation ResearchSociety; Reno, Nevada. 2002; p. 312-313.
24. Baldock C, Harris PJ, Piercy AR, Healy B. “Experimental determination of the diffusion coefficientin two-dimensions in ferrous sulphate gels using the finite element method,”. Australas. Phys. Eng.Sci. Med 2001;24:19–30. [PubMed: 11458569]
25. Bass, M.; the Optical Society of America. Handbook of Optics. 2nd ed.. McGraw-Hill; New York:1995.
26. Maryanski MJ, Zastavker YZ, Gore JC. “Radiation dose distributions in three dimensions fromtomographic optical density scanning of polymer gels: II. Optical properties of the BANG polymergel,”. Phys. Med. Biol 1996;41:2705–2717. [PubMed: 8971964]
27. Kak, AC.; Slaney, M.; the IEEE Engineering in Medicine and Biology Society. Principles ofComputerized Tomographic Imaging. (iEEE Press; New York: 1988.
Oldham et al. Page 10
Med Phys. Author manuscript; available in PMC 2006 October 18.
NIH
-PA Author Manuscript
NIH
-PA Author Manuscript
NIH
-PA Author Manuscript

28. Maryanski, M. “Radiation-sensitive polymer-gels: properties and manufacturing,”. p. 63-73.in Ref.9
Oldham et al. Page 11
Med Phys. Author manuscript; available in PMC 2006 October 18.
NIH
-PA Author Manuscript
NIH
-PA Author Manuscript
NIH
-PA Author Manuscript

FIG. 1.Spider plot of prominent dosimetry specifications common to all radiation therapies. Radialaxes correspond to the different specifications and exhibit a scale from 0-5. The performanceof a dosimeter(or the requirements of a particular treatment technique)is rated for eachspecification by a number 0-5 (0=poor and 5=high). An ideal dosimeter would thus track alongthe outside “5” spider track.
Oldham et al. Page 12
Med Phys. Author manuscript; available in PMC 2006 October 18.
NIH
-PA Author Manuscript
NIH
-PA Author Manuscript
NIH
-PA Author Manuscript
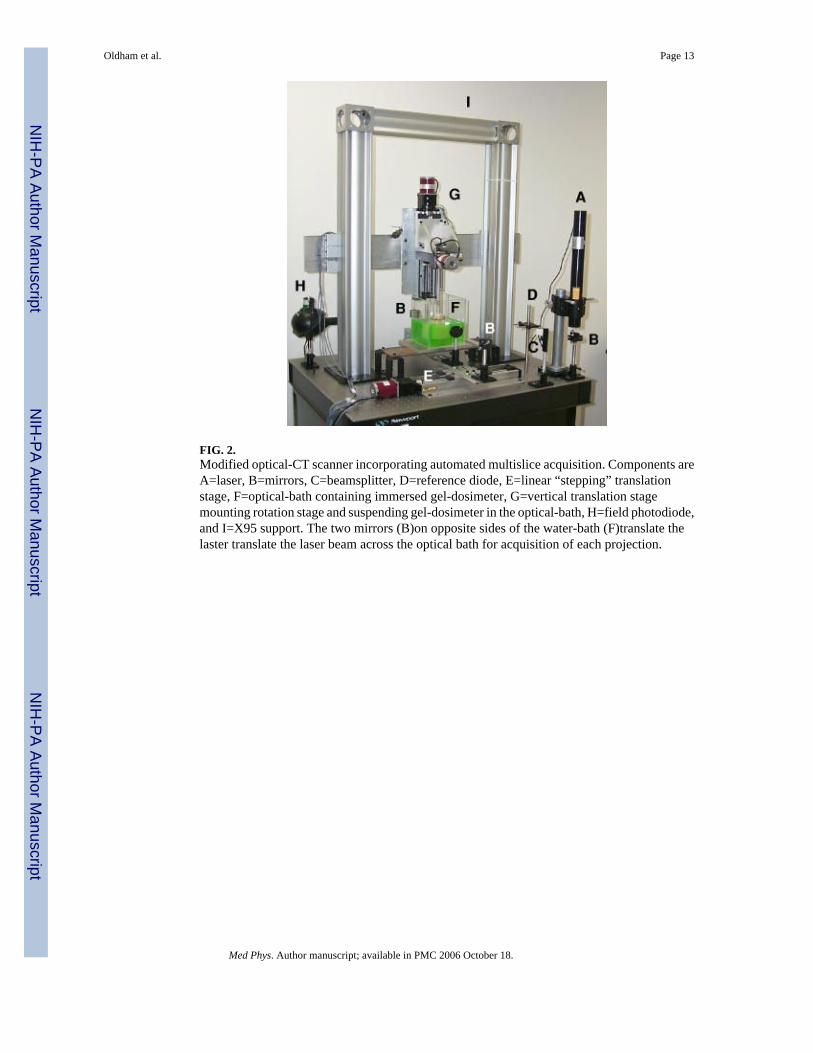
FIG. 2.Modified optical-CT scanner incorporating automated multislice acquisition. Components areA=laser, B=mirrors, C=beamsplitter, D=reference diode, E=linear “stepping” translationstage, F=optical-bath containing immersed gel-dosimeter, G=vertical translation stagemounting rotation stage and suspending gel-dosimeter in the optical-bath, H=field photodiode,and I=X95 support. The two mirrors (B)on opposite sides of the water-bath (F)translate thelaster translate the laser beam across the optical bath for acquisition of each projection.
Oldham et al. Page 13
Med Phys. Author manuscript; available in PMC 2006 October 18.
NIH
-PA Author Manuscript
NIH
-PA Author Manuscript
NIH
-PA Author Manuscript
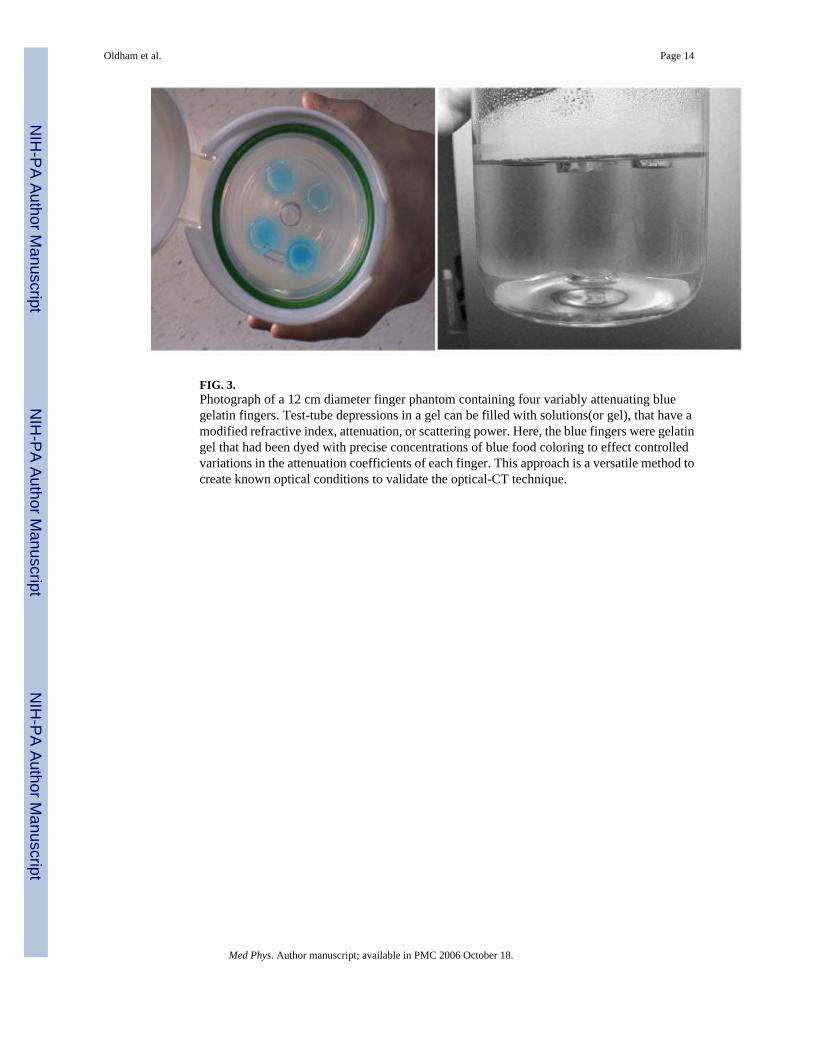
FIG. 3.Photograph of a 12 cm diameter finger phantom containing four variably attenuating bluegelatin fingers. Test-tube depressions in a gel can be filled with solutions(or gel), that have amodified refractive index, attenuation, or scattering power. Here, the blue fingers were gelatingel that had been dyed with precise concentrations of blue food coloring to effect controlledvariations in the attenuation coefficients of each finger. This approach is a versatile method tocreate known optical conditions to validate the optical-CT technique.
Oldham et al. Page 14
Med Phys. Author manuscript; available in PMC 2006 October 18.
NIH
-PA Author Manuscript
NIH
-PA Author Manuscript
NIH
-PA Author Manuscript
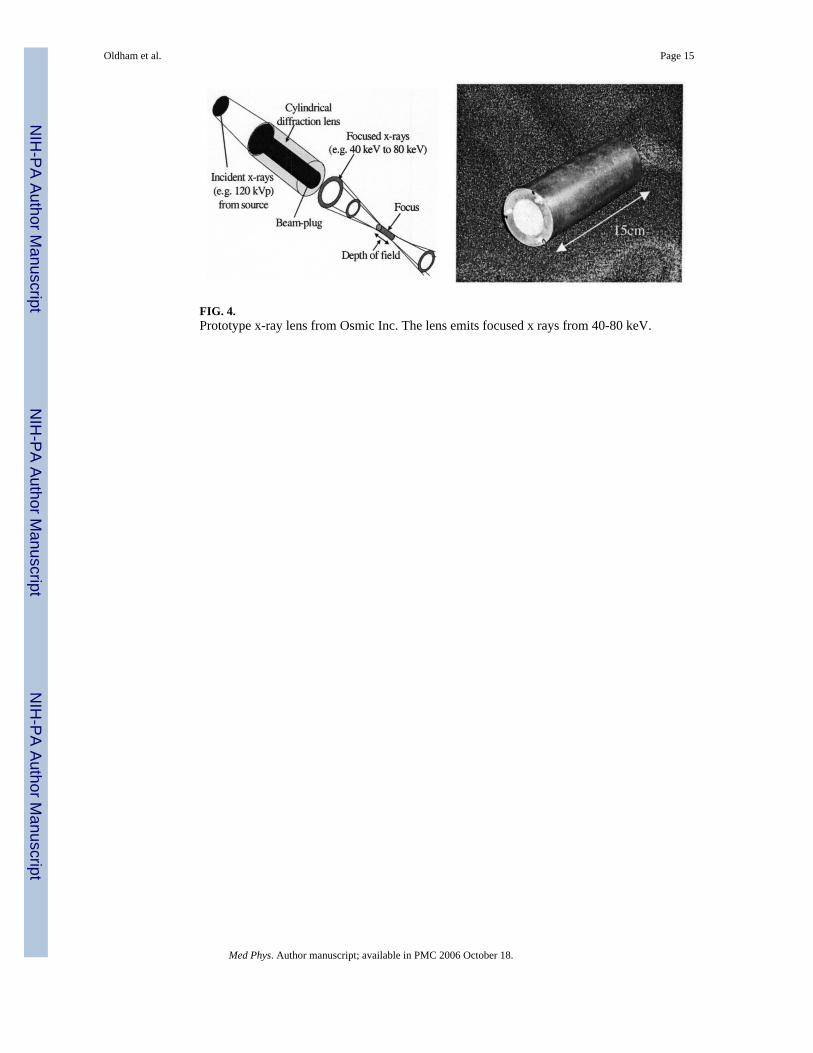
FIG. 4.Prototype x-ray lens from Osmic Inc. The lens emits focused x rays from 40-80 keV.
Oldham et al. Page 15
Med Phys. Author manuscript; available in PMC 2006 October 18.
NIH
-PA Author Manuscript
NIH
-PA Author Manuscript
NIH
-PA Author Manuscript
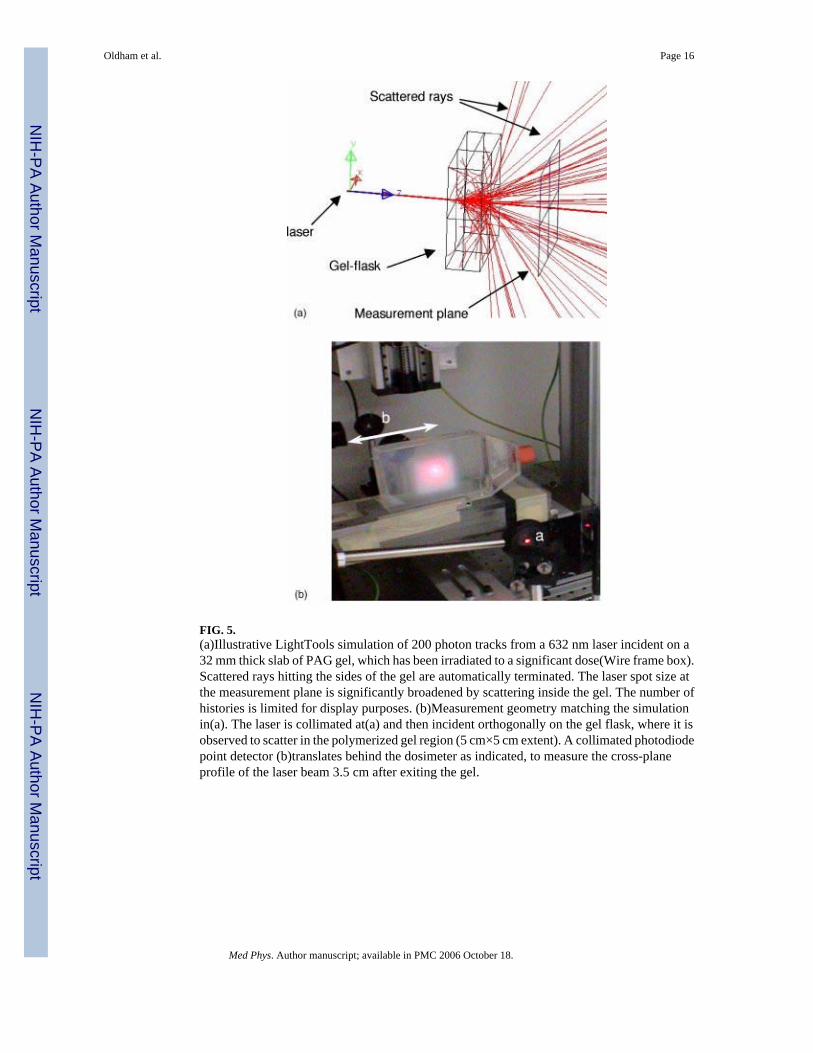
FIG. 5.(a)Illustrative LightTools simulation of 200 photon tracks from a 632 nm laser incident on a32 mm thick slab of PAG gel, which has been irradiated to a significant dose(Wire frame box).Scattered rays hitting the sides of the gel are automatically terminated. The laser spot size atthe measurement plane is significantly broadened by scattering inside the gel. The number ofhistories is limited for display purposes. (b)Measurement geometry matching the simulationin(a). The laser is collimated at(a) and then incident orthogonally on the gel flask, where it isobserved to scatter in the polymerized gel region (5 cm×5 cm extent). A collimated photodiodepoint detector (b)translates behind the dosimeter as indicated, to measure the cross-planeprofile of the laser beam 3.5 cm after exiting the gel.
Oldham et al. Page 16
Med Phys. Author manuscript; available in PMC 2006 October 18.
NIH
-PA Author Manuscript
NIH
-PA Author Manuscript
NIH
-PA Author Manuscript
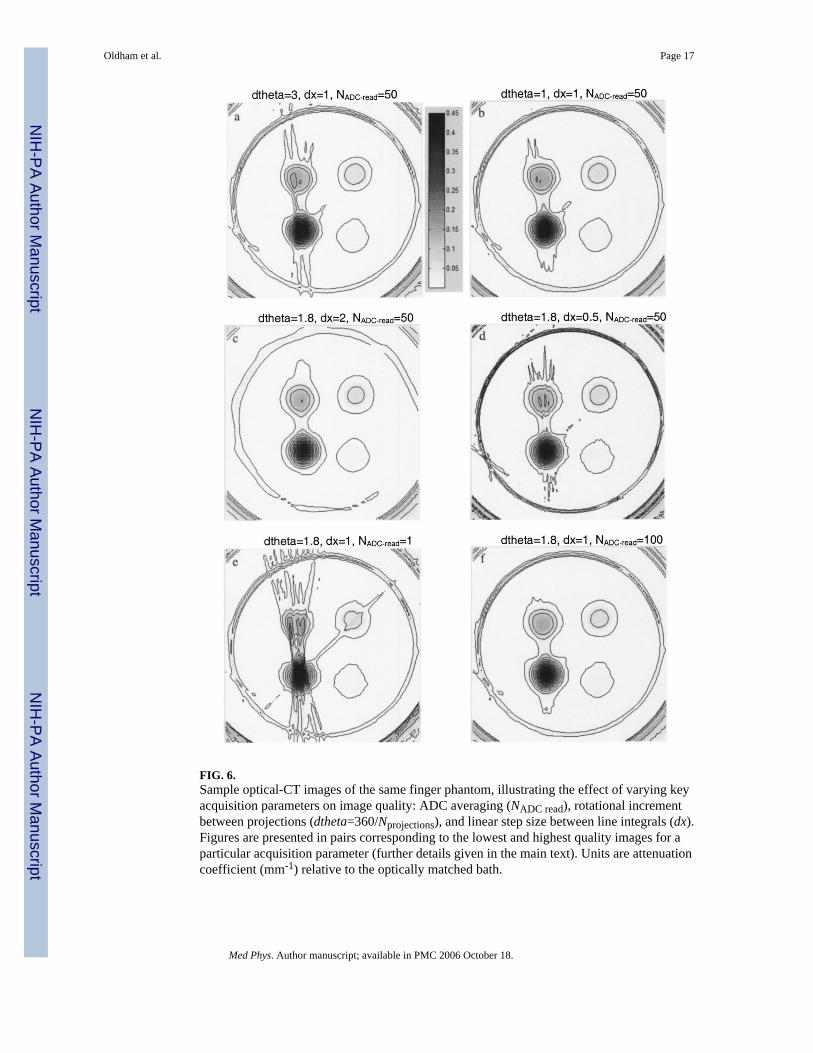
FIG. 6.Sample optical-CT images of the same finger phantom, illustrating the effect of varying keyacquisition parameters on image quality: ADC averaging (NADC read), rotational incrementbetween projections (dtheta=360/Nprojections), and linear step size between line integrals (dx).Figures are presented in pairs corresponding to the lowest and highest quality images for aparticular acquisition parameter (further details given in the main text). Units are attenuationcoefficient (mm-1) relative to the optically matched bath.
Oldham et al. Page 17
Med Phys. Author manuscript; available in PMC 2006 October 18.
NIH
-PA Author Manuscript
NIH
-PA Author Manuscript
NIH
-PA Author Manuscript
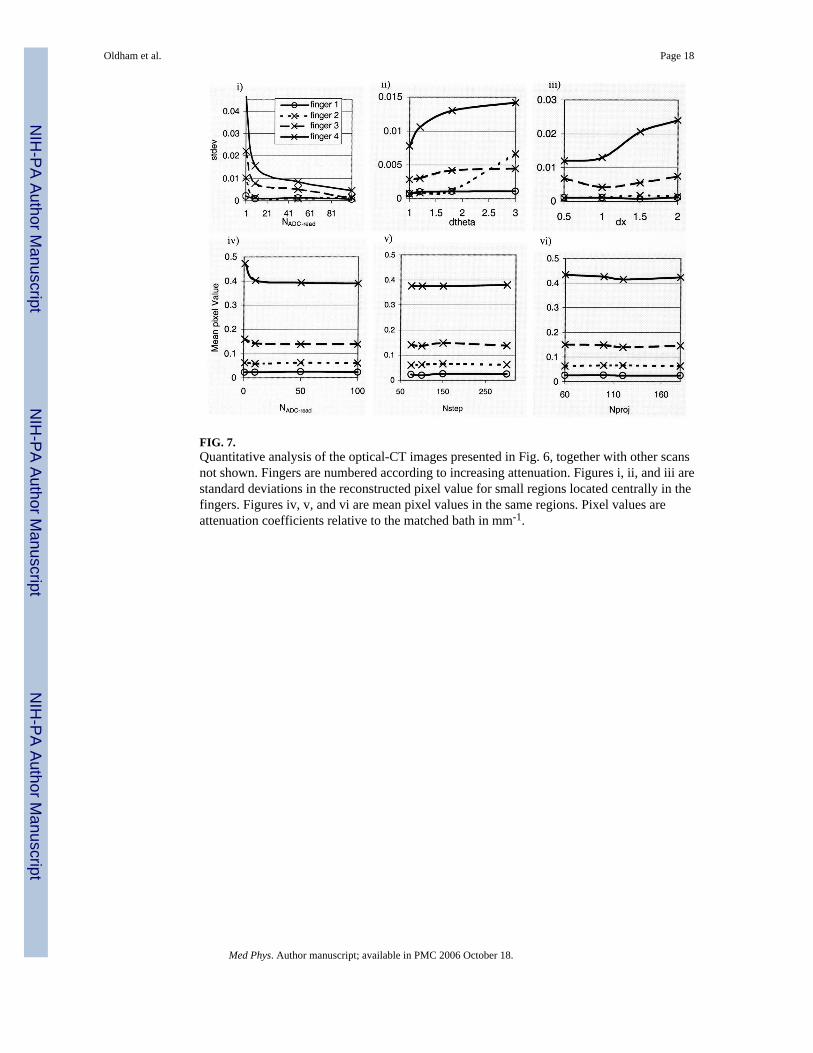
FIG. 7.Quantitative analysis of the optical-CT images presented in Fig. 6, together with other scansnot shown. Fingers are numbered according to increasing attenuation. Figures i, ii, and iii arestandard deviations in the reconstructed pixel value for small regions located centrally in thefingers. Figures iv, v, and vi are mean pixel values in the same regions. Pixel values areattenuation coefficients relative to the matched bath in mm-1.
Oldham et al. Page 18
Med Phys. Author manuscript; available in PMC 2006 October 18.
NIH
-PA Author Manuscript
NIH
-PA Author Manuscript
NIH
-PA Author Manuscript
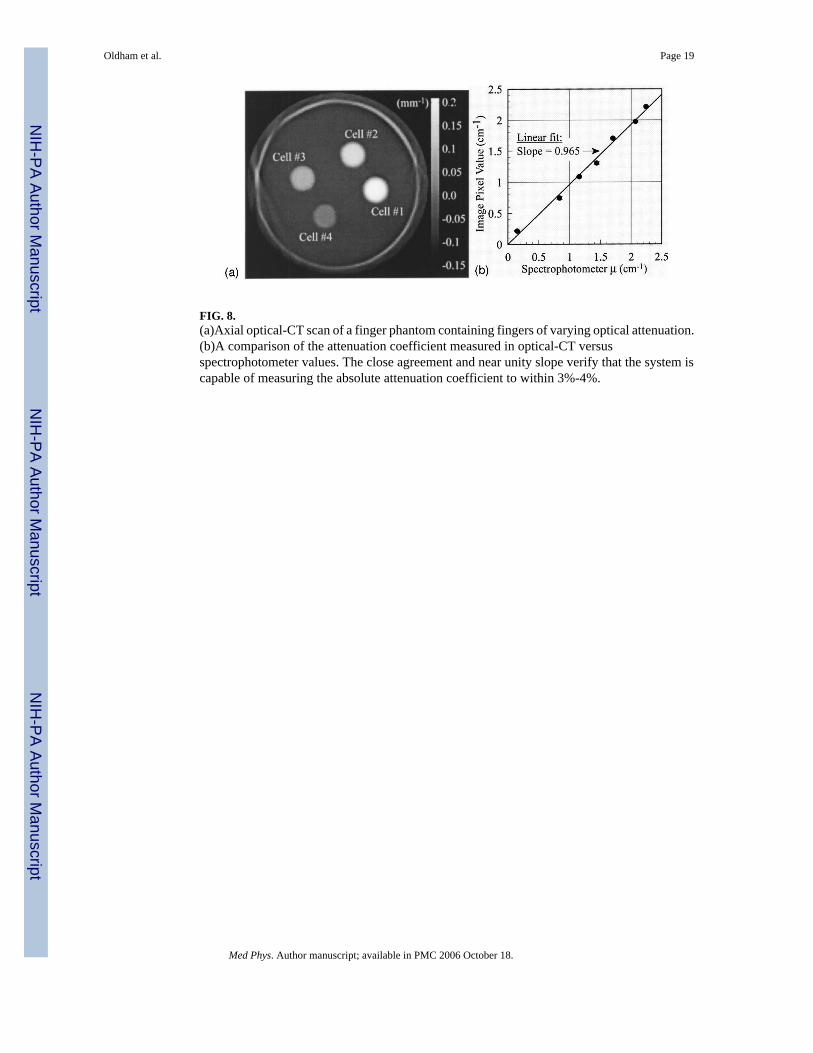
FIG. 8.(a)Axial optical-CT scan of a finger phantom containing fingers of varying optical attenuation.(b)A comparison of the attenuation coefficient measured in optical-CT versusspectrophotometer values. The close agreement and near unity slope verify that the system iscapable of measuring the absolute attenuation coefficient to within 3%-4%.
Oldham et al. Page 19
Med Phys. Author manuscript; available in PMC 2006 October 18.
NIH
-PA Author Manuscript
NIH
-PA Author Manuscript
NIH
-PA Author Manuscript
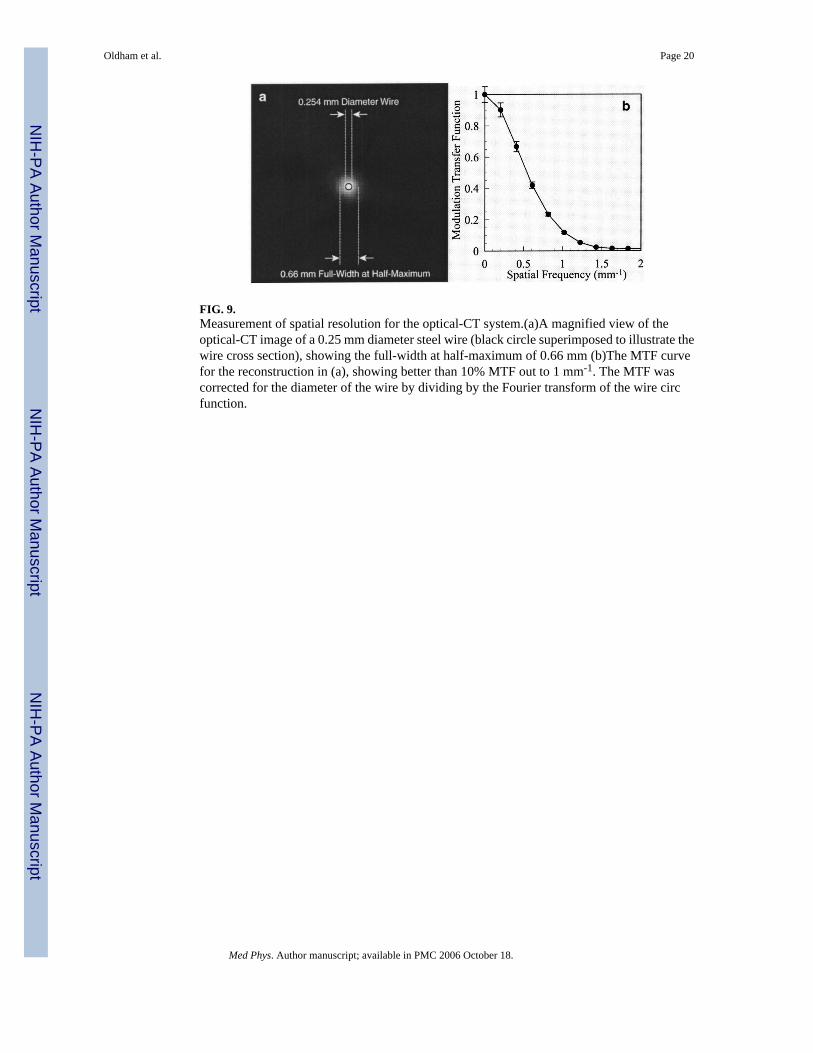
FIG. 9.Measurement of spatial resolution for the optical-CT system.(a)A magnified view of theoptical-CT image of a 0.25 mm diameter steel wire (black circle superimposed to illustrate thewire cross section), showing the full-width at half-maximum of 0.66 mm (b)The MTF curvefor the reconstruction in (a), showing better than 10% MTF out to 1 mm-1. The MTF wascorrected for the diameter of the wire by dividing by the Fourier transform of the wire circfunction.
Oldham et al. Page 20
Med Phys. Author manuscript; available in PMC 2006 October 18.
NIH
-PA Author Manuscript
NIH
-PA Author Manuscript
NIH
-PA Author Manuscript
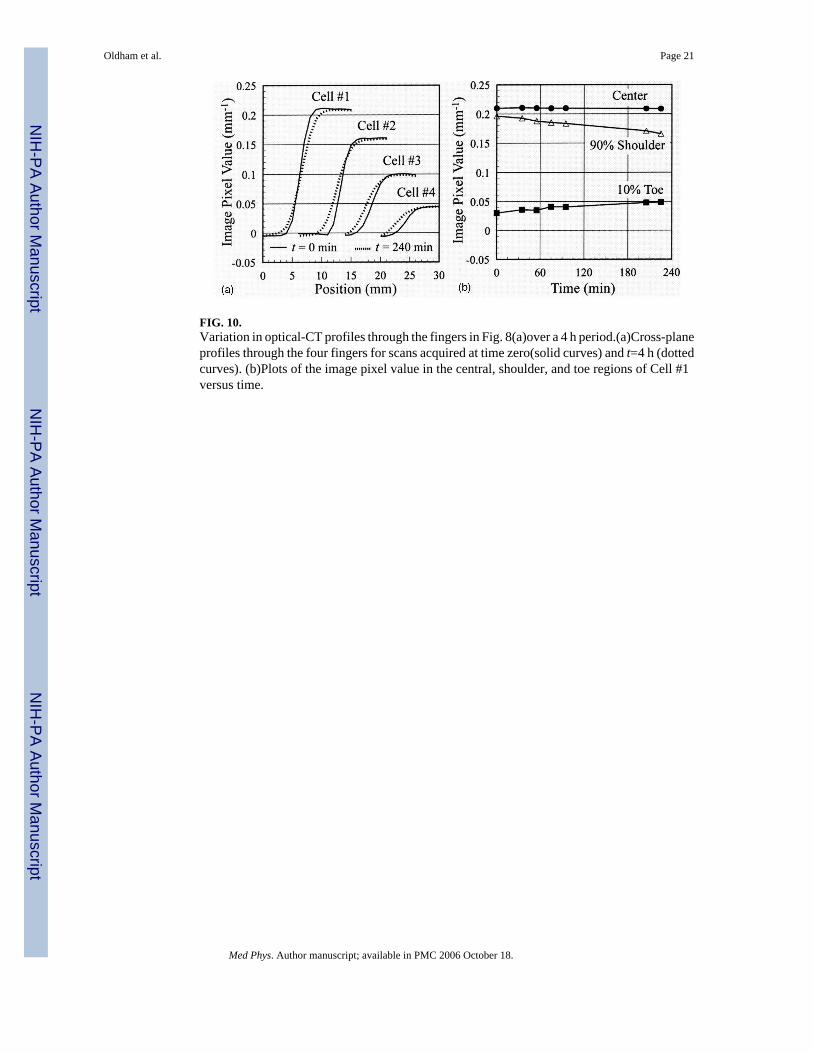
FIG. 10.Variation in optical-CT profiles through the fingers in Fig. 8(a)over a 4 h period.(a)Cross-planeprofiles through the four fingers for scans acquired at time zero(solid curves) and t=4 h (dottedcurves). (b)Plots of the image pixel value in the central, shoulder, and toe regions of Cell #1versus time.
Oldham et al. Page 21
Med Phys. Author manuscript; available in PMC 2006 October 18.
NIH
-PA Author Manuscript
NIH
-PA Author Manuscript
NIH
-PA Author Manuscript
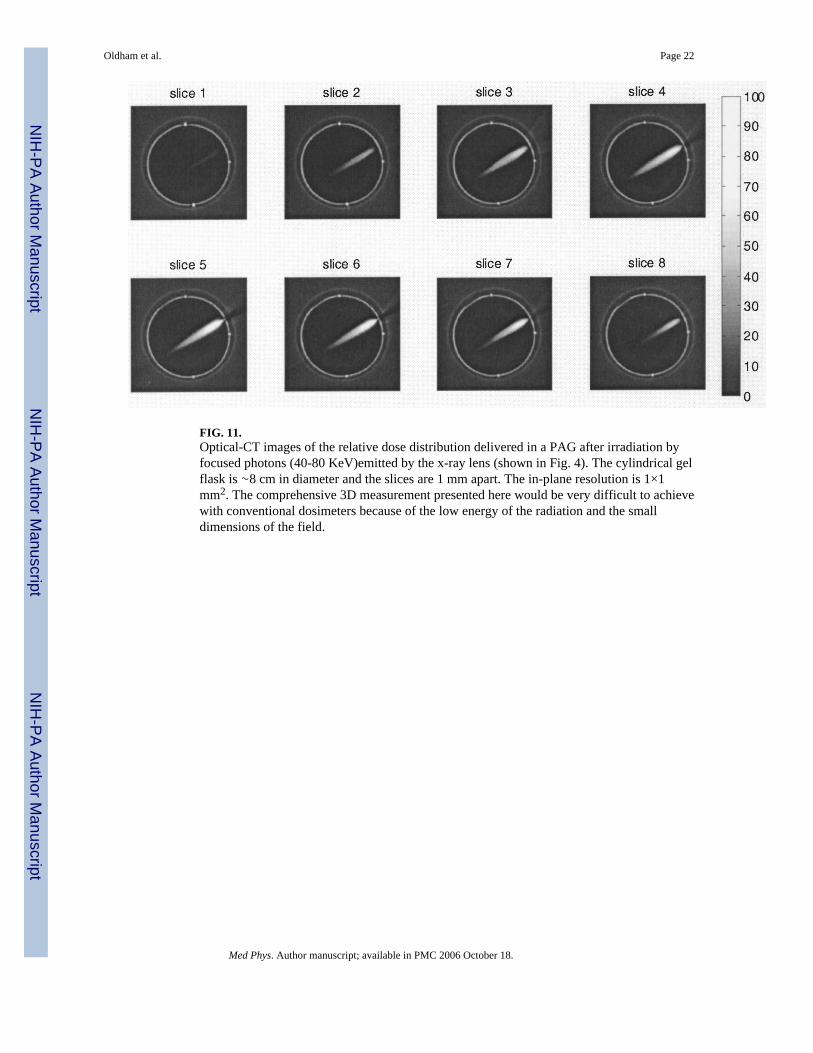
FIG. 11.Optical-CT images of the relative dose distribution delivered in a PAG after irradiation byfocused photons (40-80 KeV)emitted by the x-ray lens (shown in Fig. 4). The cylindrical gelflask is ∼8 cm in diameter and the slices are 1 mm apart. The in-plane resolution is 1×1mm2. The comprehensive 3D measurement presented here would be very difficult to achievewith conventional dosimeters because of the low energy of the radiation and the smalldimensions of the field.
Oldham et al. Page 22
Med Phys. Author manuscript; available in PMC 2006 October 18.
NIH
-PA Author Manuscript
NIH
-PA Author Manuscript
NIH
-PA Author Manuscript
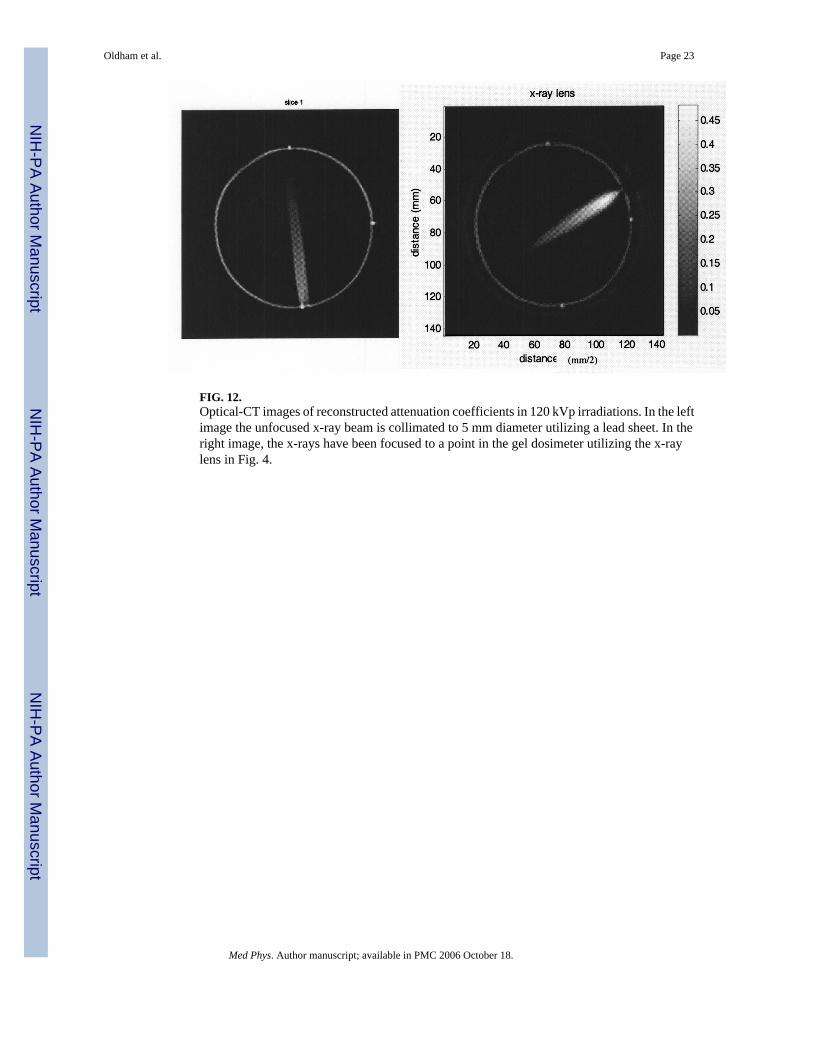
FIG. 12.Optical-CT images of reconstructed attenuation coefficients in 120 kVp irradiations. In the leftimage the unfocused x-ray beam is collimated to 5 mm diameter utilizing a lead sheet. In theright image, the x-rays have been focused to a point in the gel dosimeter utilizing the x-raylens in Fig. 4.
Oldham et al. Page 23
Med Phys. Author manuscript; available in PMC 2006 October 18.
NIH
-PA Author Manuscript
NIH
-PA Author Manuscript
NIH
-PA Author Manuscript
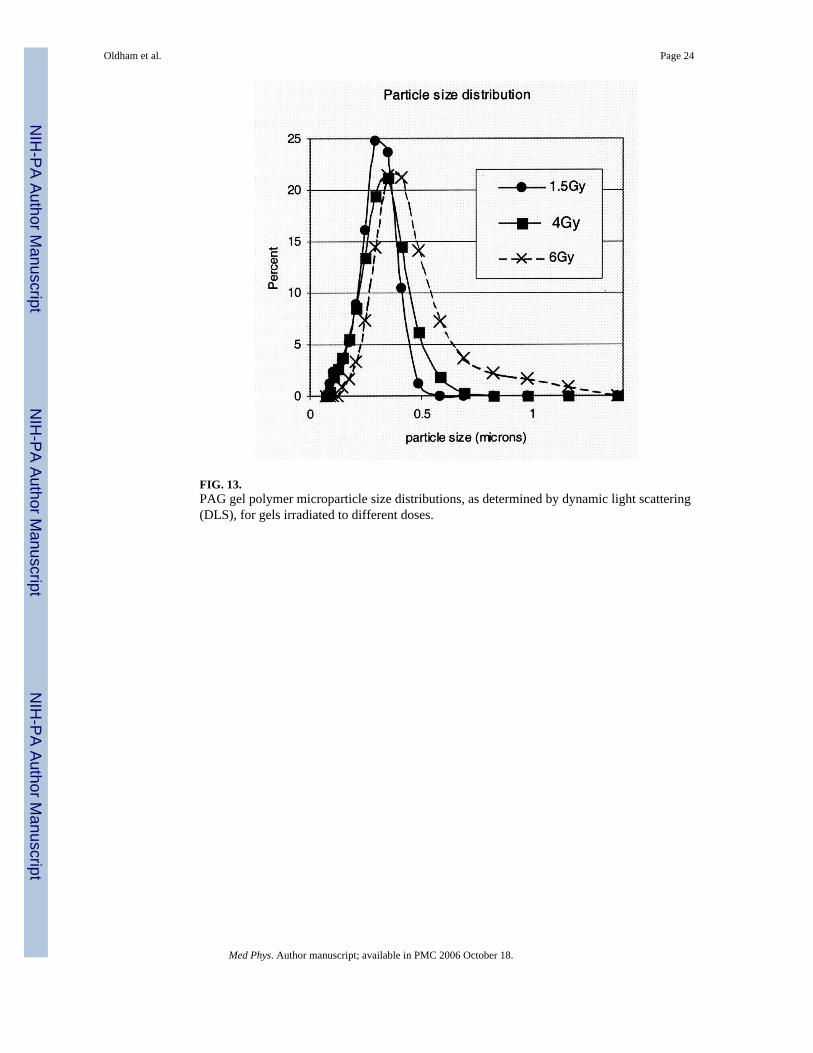
FIG. 13.PAG gel polymer microparticle size distributions, as determined by dynamic light scattering(DLS), for gels irradiated to different doses.
Oldham et al. Page 24
Med Phys. Author manuscript; available in PMC 2006 October 18.
NIH
-PA Author Manuscript
NIH
-PA Author Manuscript
NIH
-PA Author Manuscript
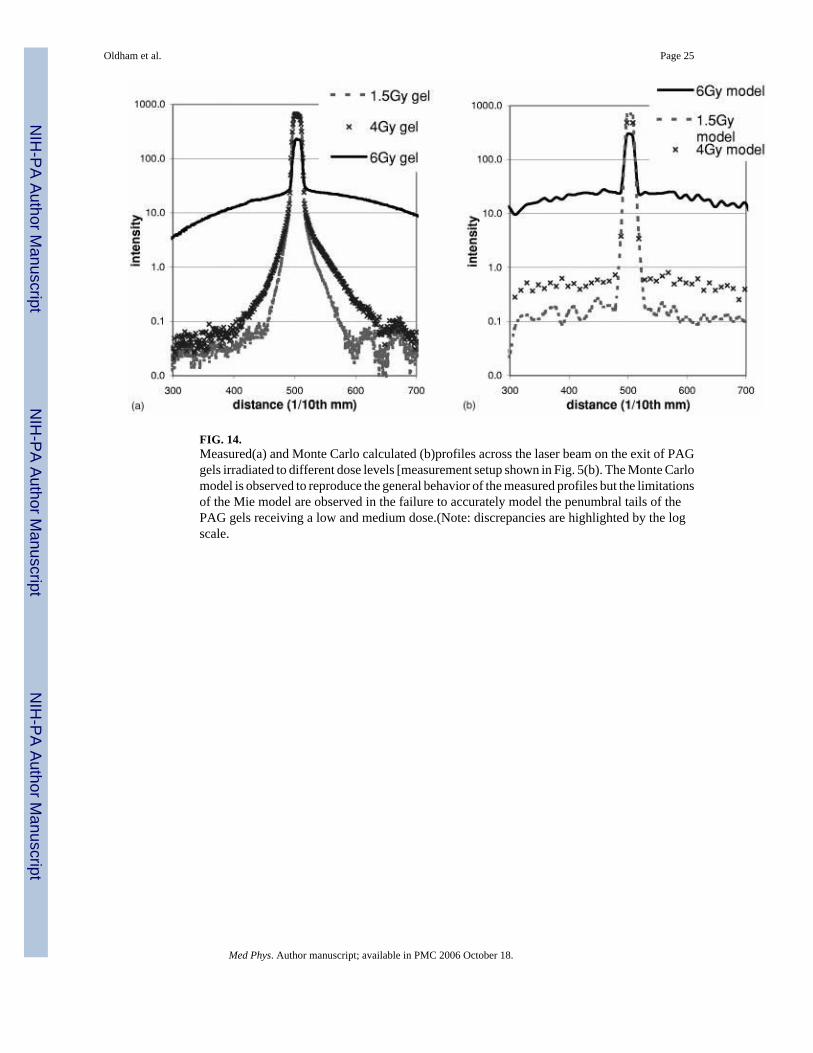
FIG. 14.Measured(a) and Monte Carlo calculated (b)profiles across the laser beam on the exit of PAGgels irradiated to different dose levels [measurement setup shown in Fig. 5(b). The Monte Carlomodel is observed to reproduce the general behavior of the measured profiles but the limitationsof the Mie model are observed in the failure to accurately model the penumbral tails of thePAG gels receiving a low and medium dose.(Note: discrepancies are highlighted by the logscale.
Oldham et al. Page 25
Med Phys. Author manuscript; available in PMC 2006 October 18.
NIH
-PA Author Manuscript
NIH
-PA Author Manuscript
NIH
-PA Author Manuscript
Copyright © 2022 FDOKUMEN