Evaluation of the first commercial Monte Carlo dose calculation engine for electron beam treatment...
12
Evaluation of the first commercial Monte Carlo dose calculation engine for electron beam treatment planning J. E. Cygler, a) G. M. Daskalov, and G. H. Chan b) Medical Physics Department, Ottawa Regional Cancer Centre, 503 Smyth Road, Ottawa, Ontario K1H 1C4, Canada G. X. Ding Clinical Physics, Fraser Valley Cancer Centre, British Columbia Cancer Agency, 13750-96th Avenue, Surrey, British Columbia V3V 1Z2, Canada ~Received 7 August 2003; revised 17 October 2003; accepted for publication 21 October 2003; published 22 December 2003! The purpose of this study is to perform a clinical evaluation of the first commercial ~MDS Nordion, now Nucletron! treatment planning system for electron beams incorporating Monte Carlo dose calculation module. This software implements Kawrakow’s VMC 11 voxel-based Monte Carlo cal- culation algorithm. The accuracy of the dose distribution calculations is evaluated by direct com- parisons with extensive sets of measured data in homogeneous and heterogeneous phantoms at different source-to-surface distances ~SSDs! and gantry angles. We also verify the accuracy of the Monte Carlo module for monitor unit calculations in comparison with independent hand calcula- tions for homogeneous water phantom at two different SSDs. All electron beams in the range 6 –20 MeV are from a Siemens KD-2 linear accelerator. We used 10 000 or 50 000 histories/cm 2 in our Monte Carlo calculations, which led to about 2.5% and 1% relative standard error of the mean of the calculated dose. The dose calculation time depends on the number of histories, the number of voxels used to map the patient anatomy, the field size, and the beam energy. The typical run time of the Monte Carlo calculations (10 000 histories/cm 2 ) is 1.02 min on a 2.2 GHz Pentium 4 Xeon computer for a 9 MeV beam, 10310 cm 2 field size, incident on the phantom 15315310 cm 3 consisting of 31 CT slices and voxels size of 3 33 33 mm 3 ~total of 486 720 voxels!. We find good agreement ~discrepancies smaller than 5%! for most of the tested dose distributions. We also find excellent agreement ~discrepancies of 2.5% or less! for the monitor unit calculations relative to the independent manual calculations. The accuracy of monitor unit calculations does not depend on the SSD used, which allows the use of one virtual machine for each beam energy for all arbitrary SSDs. In some cases the test results are found to be sensitive to the voxel size applied such that bigger systematic errors ( .5%) occur when large voxel sizes interfere with the extensions of heteroge- neities or dose gradients because of differences between the experimental and calculated geom- etries. Therefore, user control over voxelization is important for high accuracy electron dose calculations. © 2004 American Association of Physicists in Medicine. @DOI: 10.1118/1.1633105# Key words: electron beam, Monte Carlo treatment planning, inhomogeneous phantoms, monitor unit calculations I. INTRODUCTION Recently, a Monte Carlo dose calculation for electron beams has been released commercially to cancer clinics and is be- coming a routine tool used for radiotherapy patients. This is a significant advance in radiotherapy, since it is widely ac- cepted that Monte Carlo simulation of the radiation transport is one of the most accurate methods for calculating absorbed dose distributions in radiation therapy. 1–4 No other existing algorithm can handle accurately the dose from electron beams in a variety of frequently met clinical situations such as scatter perturbations by air cavities or other heterogene- ities, as well as the backscatter from high-density materials such as bone. 1–7 Some of the current computational algo- rithms used in commercial planning systems can give errors in calculated dose as high as 20%. 5–7 Calculations of monitor units for nonstandard situations such as at extended source- to-surface distances ~SSDs! require the user to create a sepa- rate virtual machine for each SSD to get reasonable results. Application of custom-made cutouts or other beam field- shaping devices often require extensive and time-consuming measurements of the output factors in order to confirm the estimates of the treatment planning system. In the present study we have followed the guidelines of Van Dyk et al. 8 and have evaluated the accuracy of the dose calculations by the new commercial Monte Carlo based treatment planning sys- tem for electron beams, recently released by MDS Nordion, now Nucletron. We have also verified the monitor unit cal- culations of the new system at two SSDs and benchmarked the speed of dose calculations under various conditions. II. MATERIALS AND METHODS II.A. Electron beam calculation algorithm The new Monte Carlo algorithm for electron beams is implemented in the Dose Calculation Module ~DCM!, which 142 142 Med. Phys. 31 „1…, January 2004 0094-2405Õ2004Õ31„1…Õ142Õ12Õ$22.00 © 2004 Am. Assoc. Phys. Med.
-
Upload
ottawahospital -
Category
Documents
-
view
0 -
download
0
Transcript of Evaluation of the first commercial Monte Carlo dose calculation engine for electron beam treatment...

Evaluation of the first commercial Monte Carlo dose calculation enginefor electron beam treatment planning
J. E. Cygler,a) G. M. Daskalov, and G. H. Chanb)
Medical Physics Department, Ottawa Regional Cancer Centre, 503 Smyth Road, Ottawa, Ontario K1H 1C4,Canada
G. X. DingClinical Physics, Fraser Valley Cancer Centre, British Columbia Cancer Agency, 13750-96th Avenue,Surrey, British Columbia V3V 1Z2, Canada
~Received 7 August 2003; revised 17 October 2003; accepted for publication 21 October 2003;published 22 December 2003!
The purpose of this study is to perform a clinical evaluation of the first commercial~MDS Nordion,now Nucletron! treatment planning system for electron beams incorporating Monte Carlo dosecalculation module. This software implements Kawrakow’sVMC11 voxel-based Monte Carlo cal-culation algorithm. The accuracy of the dose distribution calculations is evaluated by direct com-parisons with extensive sets of measured data in homogeneous and heterogeneous phantoms atdifferent source-to-surface distances~SSDs! and gantry angles. We also verify the accuracy of theMonte Carlo module for monitor unit calculations in comparison with independent hand calcula-tions for homogeneous water phantom at two different SSDs. All electron beams in the range 6–20MeV are from a Siemens KD-2 linear accelerator. We used 10 000 or 50 000 histories/cm2 in ourMonte Carlo calculations, which led to about 2.5% and 1% relative standard error of the mean ofthe calculated dose. The dose calculation time depends on the number of histories, the number ofvoxels used to map the patient anatomy, the field size, and the beam energy. The typical run time ofthe Monte Carlo calculations (10 000 histories/cm2) is 1.02 min on a 2.2 GHz Pentium 4 Xeoncomputer for a 9 MeV beam, 10310 cm2 field size, incident on the phantom 15315310 cm3
consisting of 31 CT slices and voxels size of 33333 mm3 ~total of 486 720 voxels!. We find goodagreement~discrepancies smaller than 5%! for most of the tested dose distributions. We also findexcellent agreement~discrepancies of 2.5% or less! for the monitor unit calculations relative to theindependent manual calculations. The accuracy of monitor unit calculations does not depend on theSSD used, which allows the use of one virtual machine for each beam energy for all arbitrary SSDs.In some cases the test results are found to be sensitive to the voxel size applied such that biggersystematic errors (.5%) occur when large voxel sizes interfere with the extensions of heteroge-neities or dose gradients because of differences between the experimental and calculated geom-etries. Therefore, user control over voxelization is important for high accuracy electron dosecalculations. ©2004 American Association of Physicists in Medicine.@DOI: 10.1118/1.1633105#
Key words: electron beam, Monte Carlo treatment planning, inhomogeneous phantoms, monitorunit calculations
mb
aco
rb
roc
eniao-ro
ra
ults.ld-ing
thesent
theys-on,al-ked
is
I. INTRODUCTION
Recently, a Monte Carlo dose calculation for electron beahas been released commercially to cancer clinics and iscoming a routine tool used for radiotherapy patients. Thisa significant advance in radiotherapy, since it is widelycepted that Monte Carlo simulation of the radiation transpis one of the most accurate methods for calculating absodose distributions in radiation therapy.1–4 No other existingalgorithm can handle accurately the dose from electbeams in a variety of frequently met clinical situations suas scatter perturbations by air cavities or other heterogities, as well as the backscatter from high-density matersuch as bone.1–7 Some of the current computational algrithms used in commercial planning systems can give erin calculated dose as high as 20%.5–7 Calculations of monitorunits for nonstandard situations such as at extended souto-surface distances~SSDs! require the user to create a sep
142 Med. Phys. 31 „1…, January 2004 0094-2405 Õ2004Õ31
se-
is-rted
nhe-ls
rs
ce--
rate virtual machine for each SSD to get reasonable resApplication of custom-made cutouts or other beam fieshaping devices often require extensive and time-consummeasurements of the output factors in order to confirmestimates of the treatment planning system. In the prestudy we have followed the guidelines of Van Dyket al.8 andhave evaluated the accuracy of the dose calculations bynew commercial Monte Carlo based treatment planning stem for electron beams, recently released by MDS Nordinow Nucletron. We have also verified the monitor unit cculations of the new system at two SSDs and benchmarthe speed of dose calculations under various conditions.
II. MATERIALS AND METHODS
II.A. Electron beam calculation algorithm
The new Monte Carlo algorithm for electron beamsimplemented in the Dose Calculation Module~DCM!, which
142„1…Õ142Õ12Õ$22.00 © 2004 Am. Assoc. Phys. Med.
em
tht
e
ara
src
lefialli-
l
nem
ep
snm
-
-
ne
m
edr
am
thura
thi
in airce
innitoraree
arelestry
ofn-
el-ftoldusionre-
he
sityn-81
etry.
erepthtorsnd.
for
ne-o-
om-:
ibedisan-
143 Cygler et al. : Evaluation of commercial Monte Carlo electron treatment planning 143
can be accessed from theTHERAPLAN PLUS™ or ONCENTRA
treatment planning systems. In the present study weployed THERAPLAN PLUS v.3.8 and DCM v.2.0. All resultsobtained with this treatment planning system and usingMonte Carlo algorithm for electron beams are referredthroughout as theDCM. The electron Monte Carlo softwarcombines the following two major components:
~1! A new, coupled multisource electron phase space bemodel, for electron transport through the linear acceletor treatment head.9–11
~2! VMC11 Monte Carlo electron and photon transport docalculation code developed at the National ReseaCouncil of Canada.12–14
The coupled multisource beam model deals with the etron transport through the accelerator head. It is based onparameters and requires a limited set of clinic-measured dThis beam model is flexible enough to support current comation types~applicators with optional inserts, variable trimmer machines! and potential multileaf collimator~MLC! ap-plications in the future.9–11 Key features of the beam modeare:
~1! A source phase spacethat describes the beam at a planear the secondary scattering foil using only five paraeters. These parameters are obtained from open field~noapplicator! fluence ~profiles in air! measurements. Thbeam energy spectrum is derived from a large field dedose measurements.
~2! An exit phase spacethat describes the beam at the lowevariable collimator in the linear accelerator treatmehead. The exit phase space is divided into a direct coponent~no collimator interactions! and a multiple sub-source indirect component~at least one collimator interaction!
~3! The sourceandexit phase spacesare coupled by transporting thesource phase spaceto the exit plane using adedicated MC code that scores information that defivarious sub-sources of theexit phase space.
The VMC11 dose calculation engine12–14 solves the prob-lem of the electron transport through the patient anatoThe electrons to be transported are sampled from theexitphase space, with the indirect electron component samplfrom precalculated collimator scatter kernels. The geneconcept of the applicator scatter kernels for electron bewas proposed earlier by Ebert and Hoban.15,16
II.A.1. User input
II.A.1.a. Treatment unit specification.The user has toprovide geometrical details of the treatment unit such asposition and thickness of jaws, collimators, and MLC. Fther, for each applicator scraper layer the following informtion is needed: thickness, position, shape~perimeter andedge!, and material composition. The user also specifiesthickness, shape, and composition of any custom-madeserts that are used in the treatment.
II.A.1.b. Dosimetric data for beam characterization.For
Medical Physics, Vol. 31, No. 1, January 2004
-
eo
m-
eh
c-veta.-
-
th
tt-
s
y.
als
e--
en-
each beam energy, the user needs to measure profilesand water, both without and with the applicators on. Sinthe system calculates the absolute dose to the mediumcGy, one also needs to provide the absolute dose per mounit ~MU! value for the reference field size. The beams‘‘fitted’’ by the vendor and the user is provided with thready-to-use virtual treatment units.
II.A.2. Incident beams and detectorsThe incident electron beams of energies 6–20 MeV
from a Siemens KD-2 linear accelerator. The dose profiwere measured using a Scanditronix RFA300 dosimescanning system and a Scanditronix electronp-type diodedetector. The diode signal was normalized at the pointdmax for 10310 cm2 field size in a homogeneous water phatom. All scans were performed with a 1 mmresolution. Thebeam calibration was carried out with an NACP parallplane chamber for 10310 cm2 field size at the depth omaximum dose,dmax, for a given beam energy accordingTG-21 protocol. All beam outputs for the reference fiewere set to 1 cGy per monitor unit. Dose outputs for variocerrobend cutouts were measured with an RK ionizatchamber. Estimated overall uncertainties of our measuments are under 2%.
II.B. Dose distribution evaluation tests
All phantoms used in this study are modeled in tAnatomy Modeling module ofTHERAPLAN PLUSusing vectoranatomy approach for each slice. The actual electron denfor each material is applied. All solid water parts of the phatoms are approximated as liquid water. Between 31 andslices were modeled depending on the phantom geomGenerally one- and two-dimensional~1D and 2D! type ge-ometries required fewer slices than three-dimensional~3D!type geometries to accurately model their shapes.
II.B.1. Homogeneous water phantomMeasurements and calculations of dose distribution w
performed for SSD of 100 and 110 cm. Central axis dedose and lateral profiles were evaluated for open applicaas well as square and circular cutouts made of cerrobeDose distribution for oblique incidence was evaluatedgantry angles of 15° and 30°.
II.B.2. Dose distribution in inhomogeneousphantoms
Phantoms containing low and high density inhomogeities were used in this study. The complexity of the inhomgeneities ranged from the simplest one-dimensional to cplicated three-dimensional ones, as listed in the following
~1! One-dimensional~slab! geometry.~2! Two-dimensional~ribs! geometry.~3! Three-dimensional~small cylindrical! geometry.~4! Complex~trachea and spine! geometry.
Some of the phantoms used here were also descrelsewhere.6,7,17 The inhomogeneity materials used in thstudy range from air to aluminum. Our heterogeneous ph
omloaouD
oveipom
th
rdoo
cmriha
Ai
alhto
ickomhe
ngi
reamur
d-xio
amah
mo
th
ing
dor-han--d
and
tout
.ndof
amnter
ind inivetter,ng
ofed
ryrs
rin-
it
tionSD
144 Cygler et al. : Evaluation of commercial Monte Carlo electron treatment planning 144
toms are similar to those used in the study by Shiuet al.18
However, some of the present 3D inhomogeneous geetries are smaller in size and also combine high anddensity materials together, such as the phantom ‘‘TracheSpine’’ described in Sec. II.B.2.d. For some inhomogenephantoms we have performed measurements at both SS100 and 110 cm.
The measurements for inhomogeneous phantoms cthe distance from less than 1 mm behind the inhomogento the practical range of the beam. The measurement deof the lateral profiles are quoted in absolute terms, i.e., frthe water surface.
II.B.2.a. Aluminum slab.The phantom is a 1-cm-thickaluminum slab in water~see Fig. 5!. It is positioned 1 cmlaterally off the central axis. There is 1 cm of water aboveslab. This slab serves both as an example of 1D type~behindthe center of the aluminum slab! and 2D type~near the edgeof aluminum slab! of inhomogeneity.
II.B.2.b. Two-dimensional type of inhomogeneity: Habone ribs.The geometry of hard bone ribs consists of twlong hard bone rods with a diameter of 1 cm and a length15 cm. They are inserted in a 15 cm315 cm solid water slabthat is 1.4 cm thick. Center-to-center rib separation is 1.5The axis of the beam is centered between the ribs. Thecenters are at 1.5 cm depth from the water surface. The ptom geometry is shown in Fig. 6.
II.B.2.c. Three-dimensional type of inhomogeneity.cylinder. The phantom is a 15 cm315 cm and 2-cm-thicksolid water slab with a 1-cm-diam, 1.8-cm-long cylindrichole in the center. The axis of the cylinder is parallel to tbeam axis and the top of the cylinder is recessed from theof the slab by 2 mm. For this phantom, a 0.05-mm-thkapton film was glued to the bottom surface of the phantto prevent water from filling the hole. Figure 8 shows tgeometry of this phantom.
Hard bone cylinder. The phantom is a 15 cm315 cm and1.2-cm-thick solid water slab with a 1-cm-diam, 1-cm-locylindrical shaped hole in the center. The cylinder’s axisparallel to the beam axis and the top of the cylinder iscessed from the top of the slab by 2 mm. A solid 1-cm-dirod of hard bone material was inserted into the hole. Fig10 shows the geometry of this phantom.
II.B.2.d. Trachea and spine.The base is a slab of soliwater that is 15 cm315 cm and 4.7 cm thick. A long cylindrical hole with its long axis perpendicular to the central aof the beam is made 2 mm below the top surface. The hhas a diameter of 2.6 cm. Four 1.4-cm-thick, 2.5-cm-dihard bone material disks are set 0.5 cm below the tracheatheir long axes are parallel to the radiation beam axis. Tdisks are separated 0.5 cm edge to edge. The phantopositioned in the water tank such that there is 1.5 cmwater above the top of the phantom. The geometry ofphantom is shown in Fig. 11.
II.C. Monitor unit calculations
Verification of monitor unit~MU! calculations is an im-portant part of commissioning of any treatment plann
Medical Physics, Vol. 31, No. 1, January 2004
-w&sof
ertyths
e
f
.bsn-
r
ep
s-
e
sle
ndeis
fis
system.8 For the purpose of this verification we performeDCM calculations of dose and monitor units for beams nmal to the surface of a homogeneous rectangular water ptom (40340315 cm3) for SSDs of 100 and 115 cm, commonly used in our clinic. A wide range of square anrectangular field sizes as defined by open applicatorscerrobend cutouts~17 square and 8 rectangular fields! wereemployed for each energy and SSD. The cerrobend cusizes are defined at the level of SSD595 cm while the ap-plicator sizes are defined at the reference SSD of 100 cm
DCM was applied to calculate the dose distribution amachine settings for a single fraction prescription dose200 cGy at the depth of maximum dose along the becentral axis. All beams at the Ottawa Regional Cancer Ceare calibrated to produce 1 cGy/MU atdmax for an open 10310 cm2 applicator, and this value is used in theDCM beammodels. TheVMC11 voxel size~in terms of the length of thevoxel side in each direction!, is automatically set by DCM inall calculations. No user control on this feature is allowedthe current DCM release. For the phantom size we useMU testing, the voxel size was 0.49 cm. To achieve relatstandard deviation on the calculated doses of 1% or be50 000 histories/cm2 were used in each case. No smoothiof the Monte Carlo results was done.19
The simplified geometry allowed easy comparisonMonte Carlo calculated monitor units with hand-calculatvalues20 according to
Ttime5D
RDR3K13K23GF, ~1!
whereTtime is hand-calculated monitor units~MU!, D is theprescription dose (5200 cGy here! at dmax, RDR is the ref-erence dose rate (51 cGy/MU), andK1 andK2 are the ap-plicator and cutout factors,20 respectively. For rectangulacutouts of dimensionsa3b, K2 was either measured directl~see Tables III and IV! or calculated based on cutout factoK2 for square fields according to5
K2~a3b!5AK2~a3a!3K2~b3b!. ~2!
Since Eq.~2! does not provide a good estimate forK2 if theelongation ratioa/b ~or b/a, whichever is bigger! is about 3or larger,5 we have applied it only for cutouts with smalleelongations. Cutouts with elongations larger than 3 arecluded in Tables III and IV only if the associatedK2 havebeen measured directly. Finally, GF denotes the gap~or in-verse square correction! factor21—measured for SSD5115 cm for each open applicator~for SSD5100 cm, GF51.000 by definition20,21!. All parameters in Eq.~1! are mea-sured and valid atdmax along the beam axis. The monitor unresults of Eq.~1! are compared point-by-point to theDCMcalculated values. In addition, the root mean square deviais evaluated over all field sizes for each energy and Saccording to
rms5A 1
Nx(i 51
Nx F12DCMi
TtimeiG2
, ~3!
n
te
se
s
taar
bta
th-
tr
r
nd
ws,ated
ef en-e-
alcu-ientof-
llerthe
pro-t
mtheep-
ber
openof
-
145 Cygler et al. : Evaluation of commercial Monte Carlo electron treatment planning 145
whereNx is the number of field sizes analyzed for each eergy and SSD (Nx525 in this work!. We have identified thefollowing sources of uncertainties:
~1! Uncertainties in theK1 , K2 , and GF measurements~upto 2.0%!
~2! Statistical uncertainties in the underlying electron MonCarlo simulations (;1.0%).
Noting that the major sources of discrepancies are stochawe hypothesize that the discrepancies observed betwDCM andTtime are purely statistical in nature. Letp(y,N) bethe probability to find at least one data point out ofN thatdeviates by at leasty standard deviations. If the differenceobserved are purely statistical, then
p~y,N!512FerfS y
&D GN
, erf~x!52
ApE
0
x
exp~2t2!dt.
~4!
For N5300 as in our casep(3,300)50.56, i.e., the probabil-ity to observe at least one data point with at least three sdard deviations difference is 56%. Even for four standdeviations this probability is non-vanishing sincep(4,300)50.019.
To quantify the hypothesis of statistical nature of the oserved discrepancies, we analyze the empirical relative sdard deviation of our data according to
s5A 1
N21 (i 51
N FDCMi
Ttimei
21
N (j 51
NDCMj
Ttimej
G 2
. ~5!
Further, we focus our attention on the quantity
xi512DCMi
Ttimei
, ~6!
which represents the relative difference betweenDCM andTtime centered at zero. We compare the distribution ofquantityxi Eq. ~6!, derived from our data set, with the theoretical normal distribution
p~x!51
A2pexpS 2
x2
2 D . ~7!
We demonstrate the similarity between the theoretical disbution Eq.~7! and our data Eq.~6! by comparing the meanand variance as well as the probabilityp(m<y<n) for adata entryxi to lie within the interval@m,n# over the inter-vals @21SD,1SD#, @22SD,2SD#, and @23SD,3SD#,where SD denotes a unit standard deviation. For the theoical normal distribution Eq.~7!
p~m<y<n!51
A2pE
m
n
expS 2t2
2 Ddt5erfS n2m
&D , ~8!
where erf is again the error function Eq.~4!.
III. RESULTS AND DISCUSSION
100 MU were used for each calculation. This correspoto the dose 100 cGy for 10310 cm2 applicator at thedmax in
Medical Physics, Vol. 31, No. 1, January 2004
-
tic,en
n-d
-n-
e
i-
et-
s
a homogeneous water phantom. In the analysis that folloall cited differences between the measured and calculvalues are in percentage points of the dose at thedmax in ahomogeneous water phantom.
III.A. Dose distribution and central axis depth dosecalculations
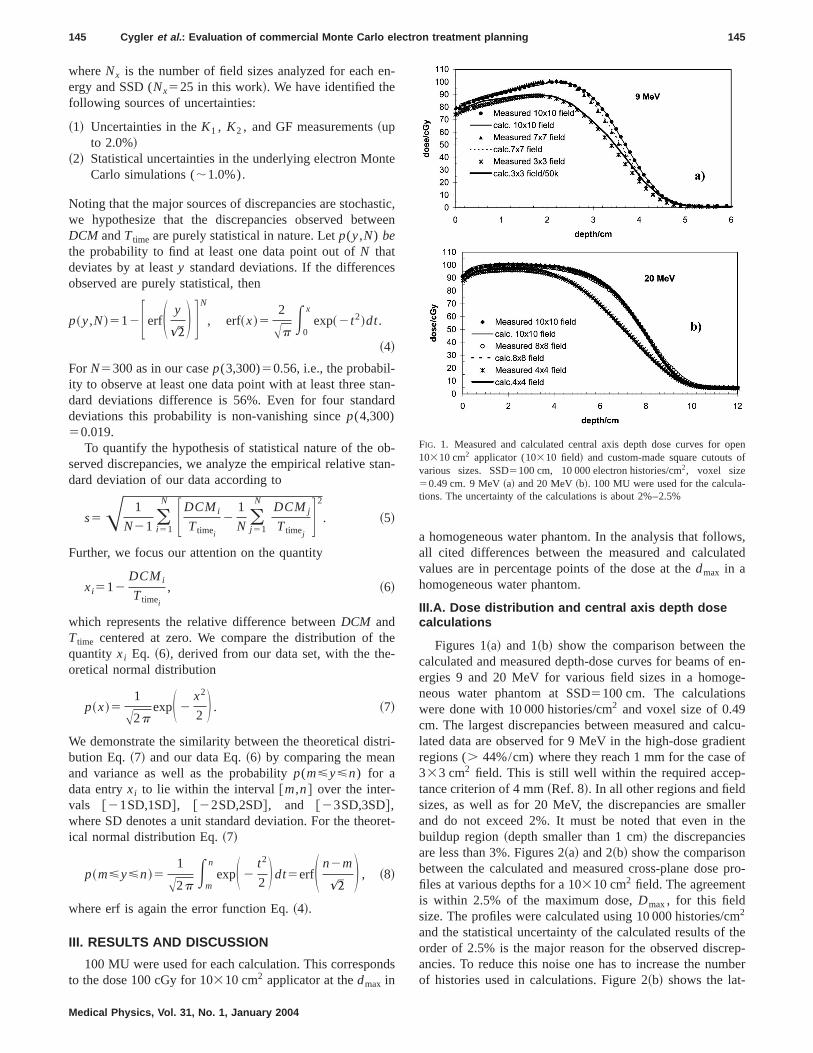
Figures 1~a! and 1~b! show the comparison between thcalculated and measured depth-dose curves for beams oergies 9 and 20 MeV for various field sizes in a homogneous water phantom at SSD5100 cm. The calculationswere done with 10 000 histories/cm2 and voxel size of 0.49cm. The largest discrepancies between measured and clated data are observed for 9 MeV in the high-dose gradregions (. 44%/cm) where they reach 1 mm for the case333 cm2 field. This is still well within the required acceptance criterion of 4 mm~Ref. 8!. In all other regions and fieldsizes, as well as for 20 MeV, the discrepancies are smaand do not exceed 2%. It must be noted that even inbuildup region~depth smaller than 1 cm! the discrepanciesare less than 3%. Figures 2~a! and 2~b! show the comparisonbetween the calculated and measured cross-plane dosefiles at various depths for a 10310 cm2 field. The agreemenis within 2.5% of the maximum dose,Dmax, for this fieldsize. The profiles were calculated using 10 000 histories/c2
and the statistical uncertainty of the calculated results oforder of 2.5% is the major reason for the observed discrancies. To reduce this noise one has to increase the numof histories used in calculations. Figure 2~b! shows the lat-
FIG. 1. Measured and calculated central axis depth dose curves for10310 cm2 applicator (10310 field! and custom-made square cutoutsvarious sizes. SSD5100 cm, 10 000 electron histories/cm2, voxel size50.49 cm. 9 MeV~a! and 20 MeV~b!. 100 MU were used for the calculations. The uncertainty of the calculations is about 2%–2.5%

n-
m
t 9,aw
eeofoti
uc
aum
e.
d
th.et
ms
nsc-tos-cal-ereolu-
xelhehe
eds,
xelme-.theak.and
ailsthet isair
.5
er-
146 Cygler et al. : Evaluation of commercial Monte Carlo electron treatment planning 146
eral profiles for 20 MeV beam, calculated using 10 000 a50 000 histories/cm2. In case of the larger number of histories, the calculated curves are very smooth and the agreeis well within 1%.
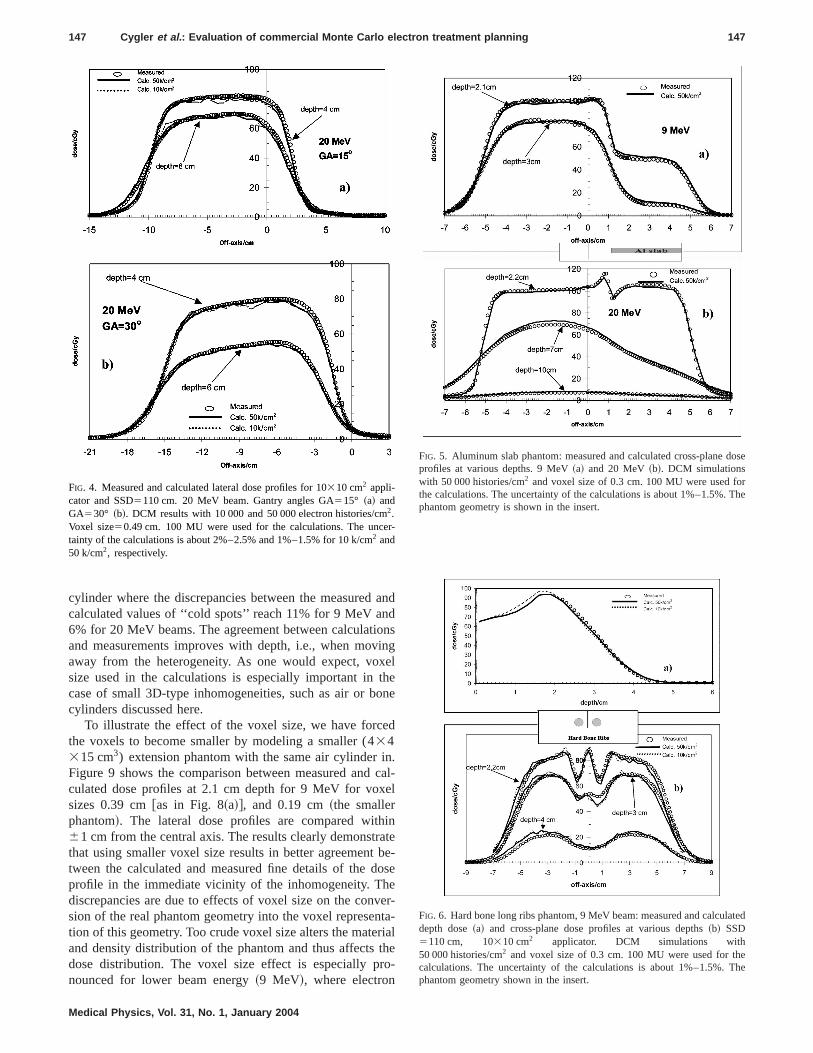
Figure 3 shows a comparison for the obliquely incidenMeV beam. Figure 3~a! shows the lateral profiles for 15°and Fig. 3~b! for 30° angle. The agreement between the cculated and measured data is within 3%. Figure 4 shosimilar results for the 20 MeV beam. The agreement betwthe calculated and measured data is within 3.5% for bangles. The calculation voxel size was set to 0.49 cmeach energy. The observed disagreements can be at leastially attributed to the systematic uncertainties introducedthe calculations by the beam model, as observed by Doet al.22
Figure 5 shows a comparison between the measuredthe Monte Carlo calculated dose profiles for an aluminslab phantom irradiated by 9@Fig. 5~a!# and 20 [email protected]~b!# electron beam. In these calculations we us50 000 histories/cm2, and the voxel size was set to 0.3 cmThe agreement between the measured and calculatedprofiles is within 3%.
The effect of a larger statistical uncertainty is seen fortwo-dimensional hard bone ribs phantom shown in Figsand 7 for 9 and 20 MeV beams, respectively. The largdiscrepancies observed are;1 mm in the high-dose gradienregion@Fig. 6~a!# and reach 6% at depth 3 cm in Fig. 6~b! for
FIG. 2. Measured and calculated cross-plane dose profiles for 10310 cm2
applicator (10310 field! for various depths and SSD5100 cm. 9 MeV~a!and 20 MeV ~b!. 10 k/cm2 denotes 10 000 electron histories/cm2,50 k/cm2– 50 000 histories/cm2. Voxel size50.49 cm. 100 MU were usedfor the calculations. The uncertainty of the calculations is about 2%–2and 1%–1.5% for 10 k/cm2 and 50 k/cm2, respectively.
Medical Physics, Vol. 31, No. 1, January 2004
d
ent
l-sn
thr
par-net
nd
d
ose
e6st
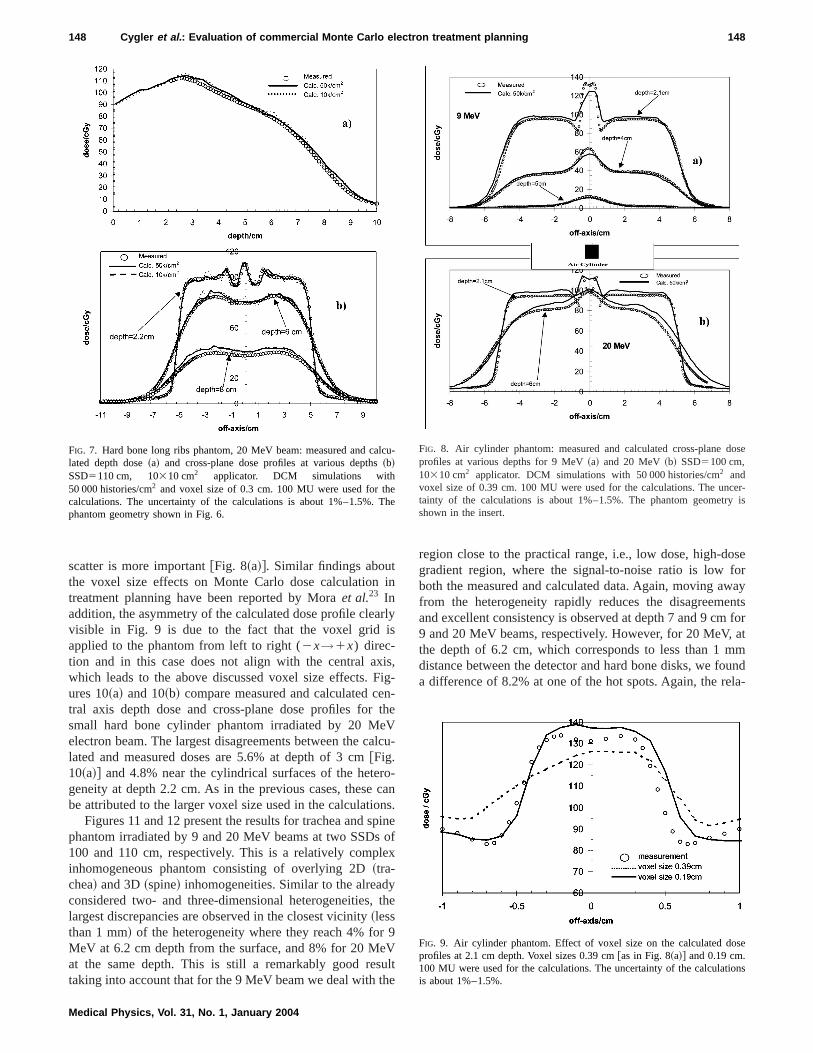
9 MeV. The corresponding differences for the 20 MeV beaare;3 mm @Fig. 7~a!# and 4.5% at depths of 6 and 8 cm ashown in Fig. 7~b!. Figures 6 and 7 show that the simulatiowith 50 000 histories/cm2 are much smoother due to the fator of 2 smaller statistical uncertainty relative10 000 histories/cm2. However, the increased number of hitories does not necessarily improve the accuracy of theculations, thus indicating that a voxel size of 3 mm used hmay be too large as compared to 1 mm measurement restion, since the material density applied to the entire vovolume is equal to the density found in the center of tvoxel. In spite of this problem, the calculations meet tcriteria of acceptability set by Van Dyket al.8
Figures 8~a! and 8~b! show the calculated and measurresults for the air cylinder phantom for 9 and 20 MeV beamrespectively, at various depths. Calculations done with vosize equal to 0.39 cm predict over 25% dose increase imdiately behind the small air cavity for the 9 MeV beamHowever, the measured hot spot is about 10% higher thancalculated one and reveals a fine structure within the peFor the 20 MeV beam the agreement between measuredcalculated doses is much better including the very fine detof the dose near the interface of the inhomogeneity fordose profiles at the depth of 2.1 cm. The worst agreemenseen in the immediate vicinity of the edges and under the
%FIG. 3. Measured and calculated lateral dose profiles for 10310 cm2 appli-cator and SSD5110 cm. 9 MeV beam. Gantry angles GA515° ~a! andGA530° ~b!. DCM results with 10 000 and 50 000 electron histories/cm2.Voxel size50.49 cm. 100 MU were used for the calculations. The unctainty of the calculations is about 2%–2.5% and 1%–1.5% for 10 k/cm2 and50 k/cm2, respectively.
ad
ioinxethon
ed
ince
inaboeventriathro
er
dose
rThe
lated
eThe
147 Cygler et al. : Evaluation of commercial Monte Carlo electron treatment planning 147
cylinder where the discrepancies between the measuredcalculated values of ‘‘cold spots’’ reach 11% for 9 MeV an6% for 20 MeV beams. The agreement between calculatand measurements improves with depth, i.e., when movaway from the heterogeneity. As one would expect, vosize used in the calculations is especially important incase of small 3D-type inhomogeneities, such as air or bcylinders discussed here.
To illustrate the effect of the voxel size, we have forcthe voxels to become smaller by modeling a smaller (434315 cm3) extension phantom with the same air cylinderFigure 9 shows the comparison between measured andculated dose profiles at 2.1 cm depth for 9 MeV for voxsizes 0.39 cm@as in Fig. 8~a!#, and 0.19 cm~the smallerphantom!. The lateral dose profiles are compared with61 cm from the central axis. The results clearly demonstrthat using smaller voxel size results in better agreementtween the calculated and measured fine details of the dprofile in the immediate vicinity of the inhomogeneity. Thdiscrepancies are due to effects of voxel size on the consion of the real phantom geometry into the voxel represetion of this geometry. Too crude voxel size alters the mateand density distribution of the phantom and thus affectsdose distribution. The voxel size effect is especially pnounced for lower beam energy~9 MeV!, where electron
FIG. 4. Measured and calculated lateral dose profiles for 10310 cm2 appli-cator and SSD5110 cm. 20 MeV beam. Gantry angles GA515° ~a! andGA530° ~b!. DCM results with 10 000 and 50 000 electron histories/cm2.Voxel size50.49 cm. 100 MU were used for the calculations. The unctainty of the calculations is about 2%–2.5% and 1%–1.5% for 10 k/cm2 and50 k/cm2, respectively.
Medical Physics, Vol. 31, No. 1, January 2004
nd
nsglee
.al-l
tee-se
r-a-le-
-
FIG. 5. Aluminum slab phantom: measured and calculated cross-planeprofiles at various depths. 9 MeV~a! and 20 MeV~b!. DCM simulationswith 50 000 histories/cm2 and voxel size of 0.3 cm. 100 MU were used fothe calculations. The uncertainty of the calculations is about 1%–1.5%.phantom geometry is shown in the insert.
FIG. 6. Hard bone long ribs phantom, 9 MeV beam: measured and calcudepth dose~a! and cross-plane dose profiles at various depths~b! SSD5110 cm, 10310 cm2 applicator. DCM simulations with50 000 histories/cm2 and voxel size of 0.3 cm. 100 MU were used for thcalculations. The uncertainty of the calculations is about 1%–1.5%.phantom geometry shown in the insert.
i
ris
isFienth
eVal
rocnpo
le
yt
r 9eVuhe
oseforwayents
forat
mmundla-
lc
eTh
ose
cer-y is
se
ons
148 Cygler et al. : Evaluation of commercial Monte Carlo electron treatment planning 148
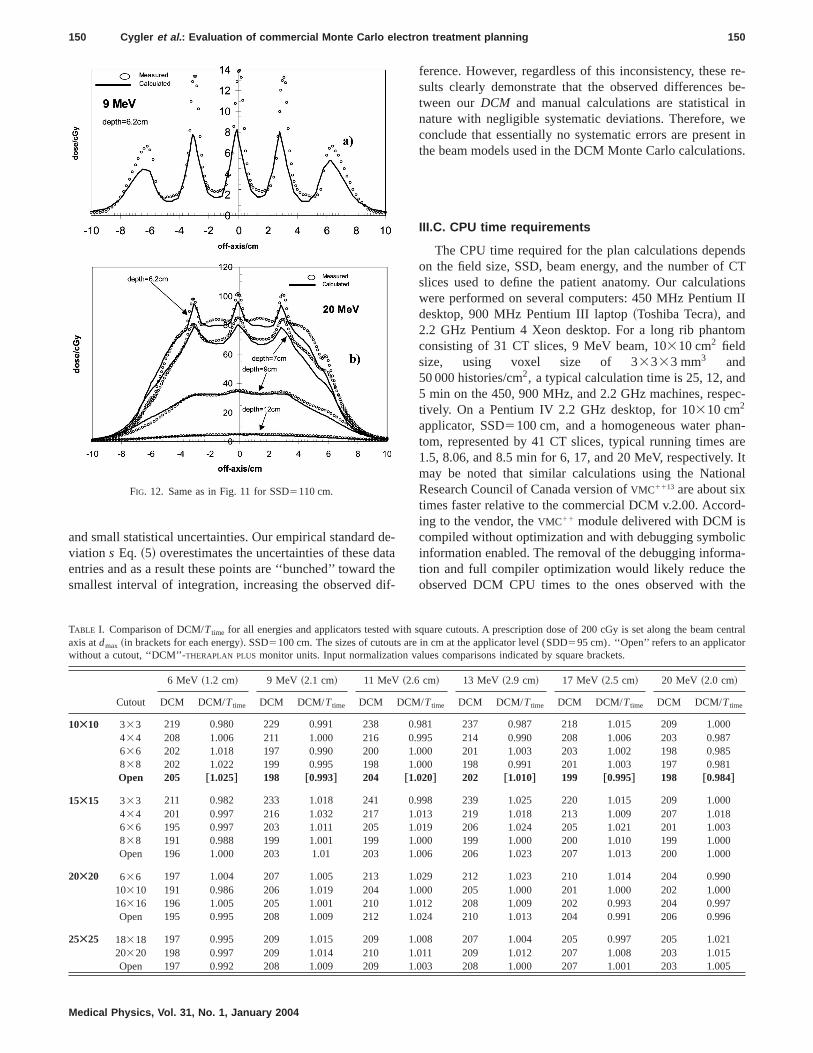
scatter is more important@Fig. 8~a!#. Similar findings aboutthe voxel size effects on Monte Carlo dose calculationtreatment planning have been reported by Moraet al.23 Inaddition, the asymmetry of the calculated dose profile cleavisible in Fig. 9 is due to the fact that the voxel gridapplied to the phantom from left to right (2x→1x) direc-tion and in this case does not align with the central axwhich leads to the above discussed voxel size effects.ures 10~a! and 10~b! compare measured and calculated ctral axis depth dose and cross-plane dose profiles forsmall hard bone cylinder phantom irradiated by 20 Melectron beam. The largest disagreements between the clated and measured doses are 5.6% at depth of 3 [email protected]~a!# and 4.8% near the cylindrical surfaces of the hetegeneity at depth 2.2 cm. As in the previous cases, thesebe attributed to the larger voxel size used in the calculatio
Figures 11 and 12 present the results for trachea and sphantom irradiated by 9 and 20 MeV beams at two SSDs100 and 110 cm, respectively. This is a relatively compinhomogeneous phantom consisting of overlying 2D~tra-chea! and 3D~spine! inhomogeneities. Similar to the alreadconsidered two- and three-dimensional heterogeneities,largest discrepancies are observed in the closest vicinity~lessthan 1 mm! of the heterogeneity where they reach 4% foMeV at 6.2 cm depth from the surface, and 8% for 20 Mat the same depth. This is still a remarkably good restaking into account that for the 9 MeV beam we deal with t
FIG. 7. Hard bone long ribs phantom, 20 MeV beam: measured and calated depth dose~a! and cross-plane dose profiles at various depths~b!SSD5110 cm, 10310 cm2 applicator. DCM simulations with50 000 histories/cm2 and voxel size of 0.3 cm. 100 MU were used for thcalculations. The uncertainty of the calculations is about 1%–1.5%.phantom geometry shown in Fig. 6.
Medical Physics, Vol. 31, No. 1, January 2004
n
ly
,g--e
cu-
-ans.inef
x
he
lt
region close to the practical range, i.e., low dose, high-dgradient region, where the signal-to-noise ratio is lowboth the measured and calculated data. Again, moving afrom the heterogeneity rapidly reduces the disagreemand excellent consistency is observed at depth 7 and 9 cm9 and 20 MeV beams, respectively. However, for 20 MeV,the depth of 6.2 cm, which corresponds to less than 1distance between the detector and hard bone disks, we foa difference of 8.2% at one of the hot spots. Again, the re
u-
e
FIG. 8. Air cylinder phantom: measured and calculated cross-plane dprofiles at various depths for 9 MeV~a! and 20 MeV~b! SSD5100 cm,10310 cm2 applicator. DCM simulations with 50 000 histories/cm2 andvoxel size of 0.39 cm. 100 MU were used for the calculations. The untainty of the calculations is about 1%–1.5%. The phantom geometrshown in the insert.
FIG. 9. Air cylinder phantom. Effect of voxel size on the calculated doprofiles at 2.1 cm depth. Voxel sizes 0.39 cm@as in Fig. 8~a!# and 0.19 cm.100 MU were used for the calculations. The uncertainty of the calculatiis about 1%–1.5%.

ist
l-oni
n
isneth
bin.tso
lle
nant
5%pen
th-es isveia-n,
rd
alla
and
icality
hee-
is-alises
s
ross-
heThe
149 Cygler et al. : Evaluation of commercial Monte Carlo electron treatment planning 149
tively large voxel size of 0.491 cm used in this calculationresponsible for the systematic difference, which exceedsrecommended acceptance criterion of 7%.8 However, thissituation is not clinically relevant due to the very small voume involved. The longer range of the secondary electrcreated by the 20 MeV beam results in slower reductionthe magnitude of the systematic discrepancies with distabehind the inhomogeneity, clearly seen in Figs. 11~b! and12~b!. Regardless of these inconsistencies, the comparbetween Figs. 11 and 12 shows the remarkable robustand accuracy of the Monte Carlo results regardless ofSSD.
III.B. Monitor units calculations
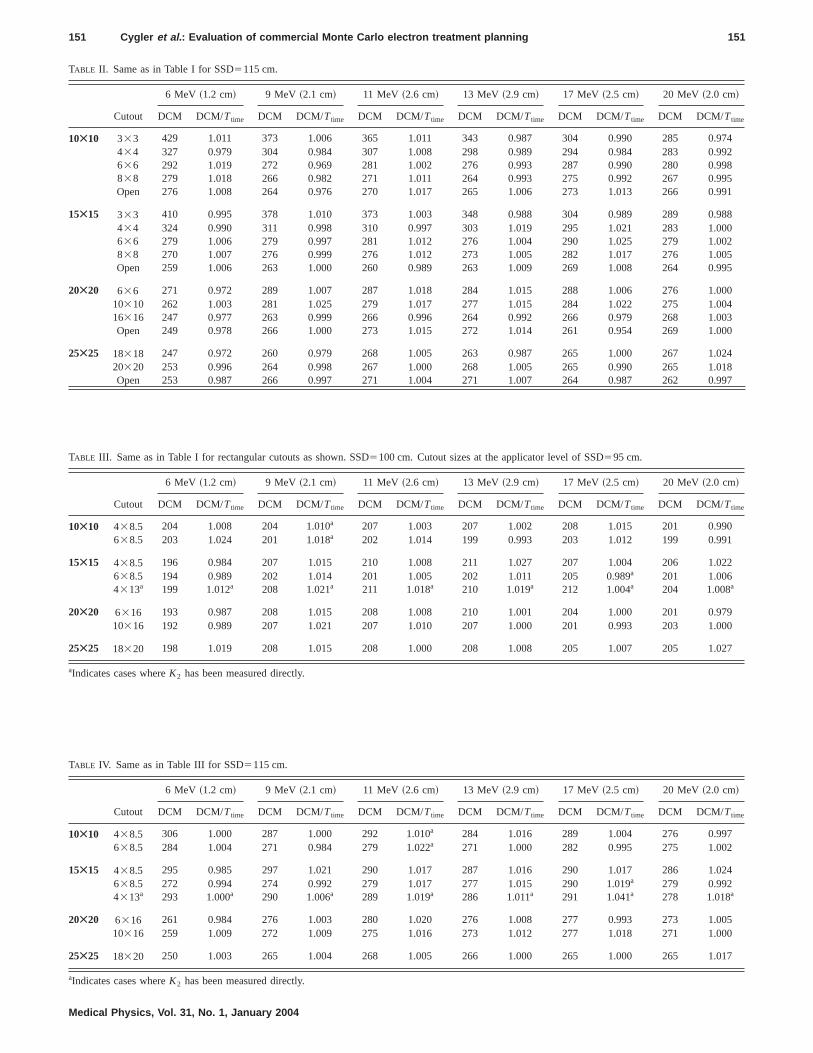
The results of our calculations and the comparisonstween DCM and Ttime for square cutouts are includedTables I and II for SSD5100 and 115 cm, respectivelyTables III and IV contain similar data for rectangular cutouof various sizes for the two SSDs analyzed. The tables ctain a total of 300 comparisons and demonstrate exceconsistency betweenDCM andTtime ~hand! monitor unit cal-culations, with a mean value of theDCM/Ttime ratio of0.997. The rms values calculated from Eq.~3! vary from0.009 to 0.018 depending on the energy, and are showTable V. The data presented in Table V show good accurof theDCM calculations, independent of the SSD. Our poi
FIG. 10. Hard bone cylinder phantom: 20 MeV, 10310 cm2 applicator,SSD5100 cm depth dose~a!, cross-plane dose profiles at various depths~b!.DCM simulation with 50 000 histories/cm2 and voxel size of 0.39 cm. 100MU were used for the calculations. The uncertainty of the calculationabout 1%–1.5%. The phantom geometry is shown in the insert.
Medical Physics, Vol. 31, No. 1, January 2004
he
snce
onsse
e-
n-nt
incy-
to-point comparisons show that discrepancies of up to 2.can be observed for the normalization values for the o10310 cm2 applicator~Table I!. In addition, point-by-pointdifferences larger than 2.5% are observed in 10 cases.
The small magnitude of the rms values led us to hypoesize that the major cause for the observed discrepancipurely statistical. Figure 13 shows the plot of the relatifraction of data entries versus the magnitude of their devtion xi Eq. ~6!, depicted by the histogram. For comparisoFig. 13 also shows the theoretical normal distribution Eq.~7!~the smooth dashed curve! with the same mean and standadeviation ~half-width of the curve at half maximum! of20.003 and 0.0129, respectively. The presence of a smnonzero mean of20.003 for our data indicates that there is0.3% systematic discrepancy between our Monte Carlomanual (Ttime) calculations, which is clinically irrelevant. Toquantify further the discrepancies between the theoretand our empirical distribution, we calculated the probabilp(m<y<n) Eq. ~8! when: ~i! the theoretical distribution isused; and~ii ! when the Gaussian kernel Eq.~7! is replacedby the empirical probability density function depicted by thistogram in Fig. 13. Table VI shows the result of this intgration. For the intervals@23SD,3SD# and @22SD,2SD#the two probabilities are indistinguishable. The observed dcrepancy of 6.9% in the value of the result in the interv@21SD,1SD# is predominantly due to the fact that in thinterval there are many points with very small differenc
is
FIG. 11. Trachea and spine phantom: measured and DCM calculated cplane dose profiles at various depths for 9 MeV~a! and 20 MeV~b!. SSD5100 cm, 10310 cm2 applicator. DCM simulations with50 000 histories/cm2 and a voxel size of 0.49 cm. 100 MU were used for tcalculations. The uncertainty of the calculations is about 1%–1.5%.phantom geometry is shown in the insert.
datth
di
re-be-
inwent inns.
dsCTons
II
om
dec-
n-are. Itnal
d-
lica-
ethe
150 Cygler et al. : Evaluation of commercial Monte Carlo electron treatment planning 150
and small statistical uncertainties. Our empirical standardviation s Eq. ~5! overestimates the uncertainties of these dentries and as a result these points are ‘‘bunched’’ towardsmallest interval of integration, increasing the observed
FIG. 12. Same as in Fig. 11 for SSD5110 cm.
Medical Physics, Vol. 31, No. 1, January 2004
e-ae
f-
ference. However, regardless of this inconsistency, thesesults clearly demonstrate that the observed differencestween ourDCM and manual calculations are statisticalnature with negligible systematic deviations. Therefore,conclude that essentially no systematic errors are presethe beam models used in the DCM Monte Carlo calculatio
III.C. CPU time requirements
The CPU time required for the plan calculations depenon the field size, SSD, beam energy, and the number ofslices used to define the patient anatomy. Our calculatiwere performed on several computers: 450 MHz Pentiumdesktop, 900 MHz Pentium III laptop~Toshiba Tecra!, and2.2 GHz Pentium 4 Xeon desktop. For a long rib phantconsisting of 31 CT slices, 9 MeV beam, 10310 cm2 fieldsize, using voxel size of 33333 mm3 and50 000 histories/cm2, a typical calculation time is 25, 12, an5 min on the 450, 900 MHz, and 2.2 GHz machines, resptively. On a Pentium IV 2.2 GHz desktop, for 10310 cm2
applicator, SSD5100 cm, and a homogeneous water phatom, represented by 41 CT slices, typical running times1.5, 8.06, and 8.5 min for 6, 17, and 20 MeV, respectivelymay be noted that similar calculations using the NatioResearch Council of Canada version ofVMC1113 are about sixtimes faster relative to the commercial DCM v.2.00. Accoring to the vendor, theVMC11 module delivered with DCM iscompiled without optimization and with debugging symboinformation enabled. The removal of the debugging informtion and full compiler optimization would likely reduce thobserved DCM CPU times to the ones observed with
central
0
6
5
TABLE I. Comparison of DCM/Ttime for all energies and applicators tested with square cutouts. A prescription dose of 200 cGy is set along the beamaxis atdmax ~in brackets for each energy!. SSD5100 cm. The sizes of cutouts are in cm at the applicator level (SDD595 cm). ‘‘Open’’ refers to an applicatorwithout a cutout, ‘‘DCM’’-THERAPLAN PLUS monitor units. Input normalization values comparisons indicated by square brackets.
6 MeV ~1.2 cm! 9 MeV ~2.1 cm! 11 MeV ~2.6 cm! 13 MeV ~2.9 cm! 17 MeV ~2.5 cm! 20 MeV ~2.0 cm!
Cutout DCM DCM/Ttime DCM DCM/Ttime DCM DCM/Ttime DCM DCM/Ttime DCM DCM/Ttime DCM DCM/Ttime
10Ã10 333 219 0.980 229 0.991 238 0.981 237 0.987 218 1.015 209 1.000434 208 1.006 211 1.000 216 0.995 214 0.990 208 1.006 203 0.987636 202 1.018 197 0.990 200 1.000 201 1.003 203 1.002 198 0.985838 202 1.022 199 0.995 198 1.000 198 0.991 201 1.003 197 0.981Open 205 †1.025‡ 198 †0.993‡ 204 †1.020‡ 202 †1.010‡ 199 †0.995‡ 198 †0.984‡
15Ã15 333 211 0.982 233 1.018 241 0.998 239 1.025 220 1.015 209 1.000434 201 0.997 216 1.032 217 1.013 219 1.018 213 1.009 207 1.018636 195 0.997 203 1.011 205 1.019 206 1.024 205 1.021 201 1.003838 191 0.988 199 1.001 199 1.000 199 1.000 200 1.010 199 1.000Open 196 1.000 203 1.01 203 1.006 206 1.023 207 1.013 200 1.00
20Ã20 636 197 1.004 207 1.005 213 1.029 212 1.023 210 1.014 204 0.99010310 191 0.986 206 1.019 204 1.000 205 1.000 201 1.000 202 1.00016316 196 1.005 205 1.001 210 1.012 208 1.009 202 0.993 204 0.997Open 195 0.995 208 1.009 212 1.024 210 1.013 204 0.991 206 0.99
25Ã25 18318 197 0.995 209 1.015 209 1.008 207 1.004 205 0.997 205 1.02120320 198 0.997 209 1.014 210 1.011 209 1.012 207 1.008 203 1.015Open 197 0.992 208 1.009 209 1.003 208 1.000 207 1.001 203 1.00
42851
80255
0430
487
2
90
7
4
50
7
151 Cygler et al. : Evaluation of commercial Monte Carlo electron treatment planning 151
TABLE II. Same as in Table I for SSD5115 cm.
6 MeV ~1.2 cm! 9 MeV ~2.1 cm! 11 MeV ~2.6 cm! 13 MeV ~2.9 cm! 17 MeV ~2.5 cm! 20 MeV ~2.0 cm!
Cutout DCM DCM/Ttime DCM DCM/Ttime DCM DCM/Ttime DCM DCM/Ttime DCM DCM/Ttime DCM DCM/Ttime
10Ã10 333 429 1.011 373 1.006 365 1.011 343 0.987 304 0.990 285 0.97434 327 0.979 304 0.984 307 1.008 298 0.989 294 0.984 283 0.99636 292 1.019 272 0.969 281 1.002 276 0.993 287 0.990 280 0.99838 279 1.018 266 0.982 271 1.011 264 0.993 275 0.992 267 0.99Open 276 1.008 264 0.976 270 1.017 265 1.006 273 1.013 266 0.99
15Ã15 333 410 0.995 378 1.010 373 1.003 348 0.988 304 0.989 289 0.98434 324 0.990 311 0.998 310 0.997 303 1.019 295 1.021 283 1.00636 279 1.006 279 0.997 281 1.012 276 1.004 290 1.025 279 1.00838 270 1.007 276 0.999 276 1.012 273 1.005 282 1.017 276 1.00Open 259 1.006 263 1.000 260 0.989 263 1.009 269 1.008 264 0.99
20Ã20 636 271 0.972 289 1.007 287 1.018 284 1.015 288 1.006 276 1.0010310 262 1.003 281 1.025 279 1.017 277 1.015 284 1.022 275 1.0016316 247 0.977 263 0.999 266 0.996 264 0.992 266 0.979 268 1.00Open 249 0.978 266 1.000 273 1.015 272 1.014 261 0.954 269 1.00
25Ã25 18318 247 0.972 260 0.979 268 1.005 263 0.987 265 1.000 267 1.0220320 253 0.996 264 0.998 267 1.000 268 1.005 265 0.990 265 1.01Open 253 0.987 266 0.997 271 1.004 271 1.007 264 0.987 262 0.99
TABLE III. Same as in Table I for rectangular cutouts as shown. SSD5100 cm. Cutout sizes at the applicator level of SSD595 cm.
6 MeV ~1.2 cm! 9 MeV ~2.1 cm! 11 MeV ~2.6 cm! 13 MeV ~2.9 cm! 17 MeV ~2.5 cm! 20 MeV ~2.0 cm!
Cutout DCM DCM/Ttime DCM DCM/Ttime DCM DCM/Ttime DCM DCM/Ttime DCM DCM/Ttime DCM DCM/Ttime
10Ã10 438.5 204 1.008 204 1.010a 207 1.003 207 1.002 208 1.015 201 0.990638.5 203 1.024 201 1.018a 202 1.014 199 0.993 203 1.012 199 0.991
15Ã15 438.5 196 0.984 207 1.015 210 1.008 211 1.027 207 1.004 206 1.02638.5 194 0.989 202 1.014 201 1.005 202 1.011 205 0.989a 201 1.0064313a 199 1.012a 208 1.021a 211 1.018a 210 1.019a 212 1.004a 204 1.008a
20Ã20 6316 193 0.987 208 1.015 208 1.008 210 1.001 204 1.000 201 0.9710316 192 0.989 207 1.021 207 1.010 207 1.000 201 0.993 203 1.00
25Ã25 18320 198 1.019 208 1.015 208 1.000 208 1.008 205 1.007 205 1.02
aIndicates cases whereK2 has been measured directly.
TABLE IV. Same as in Table III for SSD5115 cm.
6 MeV ~1.2 cm! 9 MeV ~2.1 cm! 11 MeV ~2.6 cm! 13 MeV ~2.9 cm! 17 MeV ~2.5 cm! 20 MeV ~2.0 cm!
Cutout DCM DCM/Ttime DCM DCM/Ttime DCM DCM/Ttime DCM DCM/Ttime DCM DCM/Ttime DCM DCM/Ttime
10Ã10 438.5 306 1.000 287 1.000 292 1.010a 284 1.016 289 1.004 276 0.997638.5 284 1.004 271 0.984 279 1.022a 271 1.000 282 0.995 275 1.002
15Ã15 438.5 295 0.985 297 1.021 290 1.017 287 1.016 290 1.017 286 1.02638.5 272 0.994 274 0.992 279 1.017 277 1.015 290 1.019a 279 0.9924313a 293 1.000a 290 1.006a 289 1.019a 286 1.011a 291 1.041a 278 1.018a
20Ã20 6316 261 0.984 276 1.003 280 1.020 276 1.008 277 0.993 273 1.0010316 259 1.009 272 1.009 275 1.016 273 1.012 277 1.018 271 1.00
25Ã25 18320 250 1.003 265 1.004 268 1.005 266 1.000 265 1.000 265 1.01
aIndicates cases whereK2 has been measured directly.
Medical Physics, Vol. 31, No. 1, January 2004

-am
isenth
esisp
t 1n
osth
Vageimsiz
ren
eruld
anden-
theee-cee.ingachf theed
allycies
byaspen-
de-e
-rCTectop-helencil-
best
re-sys-nd
ts
ofntsby
ur
nd
ta
152 Cygler et al. : Evaluation of commercial Monte Carlo electron treatment planning 152
NRC VMC11 code. It is also worth noting that DCM calculation times are much shorter than a typical pencil bealgorithm.6
IV. CONCLUSIONS
In the present paper we describe our work on commsioning the first commercial Monte Carlo based treatmplanning system for electron beams. We have found thatuse of 50 000 histories/cm2 for the DCM Monte Carlo calcu-lations achieves statistical uncertainty of about 1.5% or lwith negligible statistical noise for almost all cases. With thnumber of histories, the DCM dose distributions closely aproximate the measured ones with discrepancies of aboufor central ray data and low-dose/low-dose gradient regioThe observed differences were less than 3% for high-dlow-dose gradient regions and less than or about 2 mm inlarge-dose gradient (.40%) regions. The accuracy of DCMclearly met or exceeded the recommended limits set byDyk et al.8 in almost all cases regardless of the SSD. Lardiscrepancies can be observed in isolated regions in themediate vicinity of high-/low-density material interfacewhere they can exceed 5%. This is due to large voxel sautomatically set by the DCM for the calculations. Thefore, the vendor should provide the capability for user co
FIG. 13. Analysis of the accuracy of MU calculations. Distribution of odata as a function of the quantityxi @Eq. ~6!# ~histogram! and the theoreticalnormal distribution~dashed curve!. Both curves have the same mean avariance of20.003 and 0.0129, respectively.
TABLE V. Root mean square errors calculated according to Eq.~3! over alldata entries in Tables I–IV (N525) for each SSD and energy.
Beam energy~MeV! SSD5100 cm SSD5115 cm
6 0.013 0.0149 0.014 0.013
11 0.012 0.01313 0.014 0.01117 0.009 0.01820 0.013 0.011
Medical Physics, Vol. 31, No. 1, January 2004
-te
s
-%s.e/e
nr-
e--
trol over the voxel size in order to avoid larger errors undsuch circumstances. In particular, smaller voxel sizes shobe used for calculations of dose distribution for the headneck sites, where 3D type heterogeneities are frequentlycountered.
Using a single virtual machine for each beam energy,DCM monitor unit calculations demonstrate excellent agrment with the measurements not only for the referenSSD5100 cm, but for any arbitrary extended SSD valuThis is a big advantage over the other commercial plannsystems, which require separate virtual machines for eextended SSD in order to achieve reasonable accuracy ocalculated monitor units needed to deliver the prescribdose. The extensive comparisons of the DCM and manucalculated monitor unit settings show that the discrepanare within 2.5% or better. These discrepancies are driventhe statistical uncertainty of the DCM calculations as wellthe uncertainties in our measured data used for the indedent manual calculations.
Depending on the beam quality, voxel resolution, andsired accuracy,VMC11 can be up to two orders of magnitudfaster than typical Monte Carlo codes such asEGS424 orEGSNRC.25 The typical run time of the Monte Carlo calculations (50 000 histories/cm2) is between 1.5 and 8.5 min fo10310 cm2 applicator and anatomy represented by 41slices on a Pentium 4 Xenon 2.2 GHz computer. We expthese times to be reduced further by applying additionaltimization to the executable DCM code. Even without tadditional optimization, the DCM calculations, as availabtoday, are much faster than calculations using a typical pebeam algorithm.6 This factor, combined with the better accuracy of the DCM than pencil beam algorithms,6,14 under-scores that Monte Carlo based dose calculations are theapproach for modern clinical treatment planning.
In addition, our results clearly demonstrate that thecently released Monte Carlo based treatment planningtem for electron beams as implemented in DCM v.2.0 aaccessed by theTHERAPLAN PLUS v.3.8 can be used reliablyfor clinical treatment planning.
ACKNOWLEDGMENTS
The authors wish to thank Dr. Erik Traneus and Dr. MaAsell of MDS Nordion~presently Nucletron! for helpful dis-cussions and Dr. Iwan Kawrakow and Dr. D.W.O. RogersNational Research Council of Canada for valuable commeon the manuscript. This work was partially supportedMDS Nordion.
TABLE VI. Probability p(m<y<n) calculated according to Eq.~8! ~column‘‘Theory’’ ! and with the probability density function obtained from our da~column ‘‘Histogram’’! for variousm,n. The empirical standard deviationEq. ~5! s50.0129.
M m/s n n/s Theory Histogram
20.013 21 0.013 1 0.683 0.73020.026 22 0.026 2 0.955 0.95820.039 23 0.039 3 0.997 0.995
lin
om
s-
on
x
-
asy
roen
ionRa
tao
t-de
ea
s
sing
yce,
ng
or
n-
a-ew,rontec-
on
ri-
to
J.oses,’’
’’ in
ys-rd,
of
153 Cygler et al. : Evaluation of commercial Monte Carlo electron treatment planning 153
a!Electronic mail: [email protected]!Present address: Department of Radiation Oncology, Cleveland C
Foundation, 9500 Euclid Ave., Cleveland, OH 44195.1C.H. Ma and S. B. Jiang, ‘‘Monte Carlo modeling of electron beams frmedical accelerators,’’ Phys. Med. Biol.44, R157–R189~1999!.
2D.W.O. Rogers, ‘‘The role of Monte Carlo simulation of electron tranport in radiation dosimetry,’’ Int. J. Appl. Radiat. Isot.42, 965–974~1991!.
3D.W.O. Rogers and A.F. Bielajew, ‘‘Monte Carlo techniques of electrand photon transport for radiation dosimetry,’’ inThe Dosimetry of Ion-izing Radiation, Vol. 3, edited by K. Kase, B. Bjarngard, and F. Atti~Academic, San Diego, 1990!, pp. 427–539.
4T.R. Mackie, ‘‘Applications of the Monte Carlo Method in Radiotherapy,’’ in Ref. 3, pp. 541–620.
5D. Jette, ‘‘Electron beam dose calculations,’’ inRadiation Therapy Phys-ics, edited by A.R. Smith~Springer, Berlin, 1995!, pp. 95–121.
6G.X. Ding, J.E. Cygler, G.G. Zhang, and M.K. Yu, ‘‘Evaluation ofcommercial three-dimensional electron beam treatment planningtem,’’ Med. Phys.26, 2571–2580~1999!.
7J. Cygler, J.J. Battista, J.W. Scrimger, E. Mah, and J. Antolak, ‘‘Electdose distributions in experimental phantoms: A comparison with 2D pcil beam calculations,’’ Phys. Med. Biol.32, 1073~1987!.
8J. Van Dyk, R.B. Barnett, J.E. Cygler, and P.C. Shragge, ‘‘Commissing and quality assurance of treatment planning computers,’’ Int. J.diat. Oncol., Biol., Phys.26, 261–273~1993!.
9A. Ahnesjo, E. Traneus, and M. A˚ sell, ‘‘Generation of phase space dafor electron beam Monte Carlo treatment planning,’’ Radiother. Onc56, S79~2000!.
10M. Asell, A. Ahnesjo¨, and E. Traneus, ‘‘Qualification of collimator scatering radiation in a coupled multi-source electron phase space moRadiother. Oncol.61, S27~2001!.
11E. Traneus, A. Ahnesjo¨, and M. Asell, ‘‘Application and verification of acoupled multi-source electron beam model for Monte Carlo based trment planning,’’ Radiother. Oncol.61, S102~2001!.
12I. Kawrakow, ‘‘VMC11, electron and photon Monte Carlo calculationoptimized for radiation treatment planning,’’ inAdvanced Monte Carlofor Radiation Physics, Particle Transport Simulation and Application,Proceedings of the Monte Carlo 2000 Meeting Lisbon, edited by A. Klet al. ~Springer, Berlin, 2001!, pp. 229–236.
Medical Physics, Vol. 31, No. 1, January 2004
ic
s-
n-
--
l.
l,’’
t-
13I. Kawrakow and M. Fippel, ‘‘VMC11, a fast Monte Carlo algorithm forradiation treatment planning,’’ inThe Use of Computers in Radiotherap,edited by W. Schlegel and T. Bortfeld, 13th International ConferenHeidelberg~Springer, Berlin, 2000!, pp. 126–128.
14M. Fippel, I. Kawrakow, and K. Friedrich, ‘‘Electron dose calculatiowith the VMC algorithm and the verification data of the NCI WorkinGroup,’’ Phys. Med. Biol.42, 501–520~1997!.
15M.A. Ebert and P.W. Hoban, ‘‘A model for electron beam applicatscatter,’’ Med. Phys.22, 1419–1429~1995!.
16M.A. Ebert and P.W. Hoban, ‘‘A Monte Carlo investigation of electrobeam applicator scatter,’’ Med. Phys.22, 1431–1435~1995!.
17C.M. Meger Wells, T.R. Mackie, M.B. Podgorsak, M.A. Holmes, N. Ppanikolau, P.J. Reckwerdt, J.E. Cygler, D.W.O. Rogers, A.F. BielajD.S. Schmidt, and J.K. Muehlenkamp, ‘‘Measurements of the electdose distribution near inhomogeneities using a plastic scintillator detor,’’ Int. J. Radiat. Oncol., Biol., Phys.29, 1157–1165~1994!.
18A.S. Shiu, S. Tung, and K.R. Hogstrom, ‘‘Verification data for electrbeam dose algorithms,’’ Med. Phys.19, 623–636~1992!.
19I. Kawrakow, ‘‘On the de-noising of Monte Carlo calculated dose distbutions,’’ Phys. Med. Biol.47, 3087–3104~2002!.
20J. Cygler, X.A. Li, G.X. Ding, and E. Lawrence, ‘‘Practical approachelectron beam dosimetry at extended SSD,’’ Phys. Med. Biol.42, 1505–1514 ~1997!.
21F.M. Khan,The Physics of Radiation Therapy, 2nd ed.~Lippincott Will-iams & Wilkins, Baltimore, 1994!, p. 373.
22R. Doucet, M. Olivares, F. DeBlois, E.B. Podgorsak, I. Kawrakow, andSeutjens, ‘‘Comparison of measured and Monte Carlo calculated ddistributions in inhomogeneous phantoms in clinical electron beamPhys. Med. Biol.48, 2339–2354~2003!.
23G. Mora, T. Pawlicki, A. Maio, and C.-M. Ma, ‘‘Effect of voxel size onMonte Carlo dose calculations for radiotherapy treatment planning,Ref. 13, pp. 549–554.
24W.R. Nelson, A. Hirayama, and D.W.O. Rogers, ‘‘The EGS4 code stem,’’ Stanford Linear Accelerator Center Report SLAC-265, StanfoCA 1985.
25I. Kawrakow, ‘‘Accurate condensed history Monte Carlo simulationelectron transport. EGSnrc, the New EGS4 Version,’’ Med. Phys.27,485–498~2000!.