Post Harvesting Loss Reduction Study Report.
90
SUSTAINABLE FISHERIES MANAGEMENT PROJECT (SFMP) Post Harvest Loss Reduction Study October 2015
-
Upload
khangminh22 -
Category
Documents
-
view
0 -
download
0
Transcript of Post Harvesting Loss Reduction Study Report.
SUSTAINABLE FISHERIES
MANAGEMENT PROJECT (SFMP)
Post Harvest Loss Reduction
Study
October 2015

i
This publication is available electronically on the Coastal Resources Center’s website at
http://www.crc.uri.edu/projects_page/ghanasfmp/
For more information on the Ghana Sustainable Fisheries Management Project, contact:
USAID/Ghana Sustainable Fisheries Management Project
Coastal Resources Center
Graduate School of Oceanography
University of Rhode Island
220 South Ferry Rd.
Narragansett, RI 02882 USA
Tel: 401-874-6224 Fax: 401-874-6920 Email: [email protected]
Citation: Dapaah, G., Samey, B. (2015). Post Harvesting Loss Reduction Study Report.
The USAID/Ghana Sustainable Fisheries Management Project (SFMP). Narragansett, RI:
Coastal Resources Center, Graduate School of Oceanography, University of Rhode Island
and SNV Netherlands Development Organization. GH2014_ACT016_SNV. 90 pp.
Authority/Disclaimer:
Prepared for USAID/Ghana under Cooperative Agreement (AID-641-A-15-00001) awarded
on October 22, 2014 to the University of Rhode Island and entitled; the USAID/Ghana
Sustainable Fisheries Management Project (SFMP).
This document is made possible by the support of the American People through the United
States Agency for International Development (USAID). The views expressed and opinions
contained in this report are those of the SFMP team and are not intended as statements of
policy of either USAID or the cooperating organizations. As such, the contents of this report
are the sole responsibility of the SFMP Project team and do not necessarily reflect the views
of USAID or the United States Government.
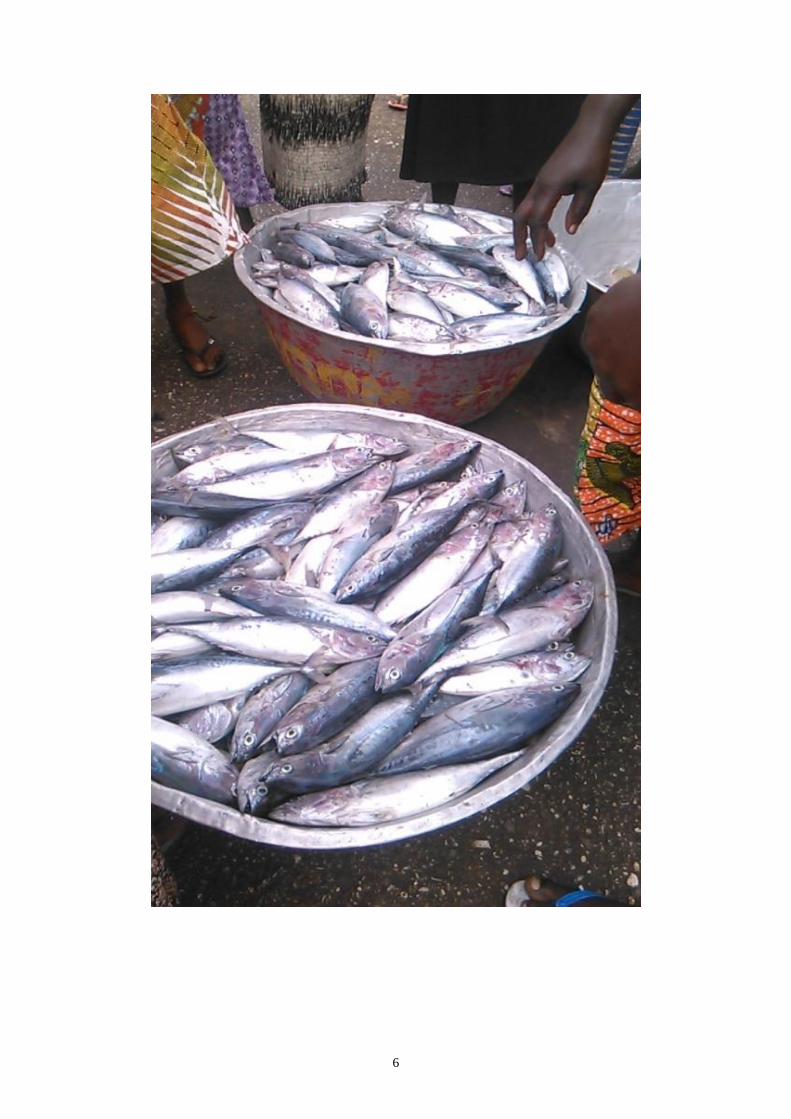
Cover photo: Packaging processed fish for market –L: G. Darpaah, 2015; R: MS Juliet
Okyere, 2015

ii
Detailed Partner Contact Information:
USAID/Ghana Sustainable Fisheries Management Project (SFMP)
10 Obodai St., Mempeasem, East Legon, Accra, Ghana
Brian Crawford Chief of Party [email protected]
Najih Lazar Senior Fisheries Advisor [email protected]
Patricia Mensah Communications Officer [email protected]
Bakari Nyari Monitoring and Evaluation Specialist [email protected]
Don Robadue, Jr. Program Manager, CRC [email protected]
Justice Odoi USAID Administrative Officer Representative [email protected]
Kofi.Agbogah
StephenKankam
Hen Mpoano
38 J. Cross Cole St. Windy Ridge
Takoradi, Ghana
233 312 020 701
Andre de Jager
SNV Netherlands Development Oganization
#161, 10 Maseru Road,
E. Legon, Accra, Ghana
233 30 701 2440
Donkris Mevuta
Kyei Yamoah
Friends of the Nation
Parks and Gardens
Adiembra-Sekondi, Ghana
233 312 046 180
Peter Owusu Donkor
Spatial Solutions
#3 Third Nautical Close,
Nungua, Accra, Ghana
233 020 463 4488
Thomas Buck
SSG Advisors
182 Main Street
Burlington, VT 05401
(802) 735-1162
Victoria C. Koomson
CEWEFIA
B342 Bronyibima Estate
Elmina, Ghana
233 024 427 8377
Lydia Sasu
DAA
Darkuman Junction, Kaneshie Odokor
Highway
Accra, Ghana
233 302 315894
Gifty Asmah
Daasgift Quality Foundation
Headmaster residence, Sekondi College
Sekondi, Western Region, Ghana
233 243 326 178
For additional information on partner activities:
CRC/URI: http://www.crc.uri.edu
CEWEFIA: http://cewefia.weebly.com/
DAA: http://womenthrive.org/development-action-association-daa
Daasgift: https://www.facebook.com/pages/Daasgift-Quality-Foundation-
FNGO/135372649846101
Friends of the Nation: http://www.fonghana.org
Hen Mpoano: http://www.henmpoano.org
SNV: http://www.snvworld.org/en/countries/ghana
SSG Advisors: http://ssg-advisors.com/
Spatial Solutions: http://www.spatialsolutions.co/id1.html
ii
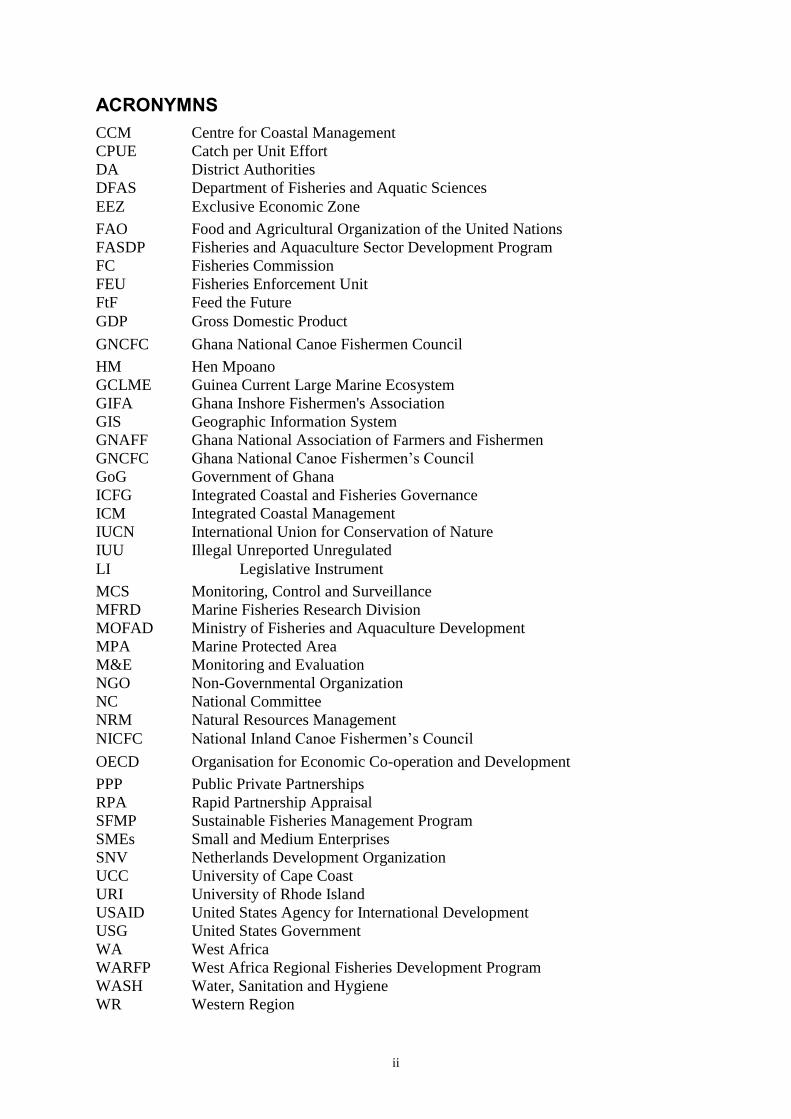
ACRONYMNS
CCM Centre for Coastal Management
CPUE Catch per Unit Effort
DA District Authorities
DFAS Department of Fisheries and Aquatic Sciences
EEZ Exclusive Economic Zone
FAO Food and Agricultural Organization of the United Nations
FASDP Fisheries and Aquaculture Sector Development Program
FC Fisheries Commission
FEU Fisheries Enforcement Unit
FtF Feed the Future
GDP Gross Domestic Product
GNCFC Ghana National Canoe Fishermen Council
HM Hen Mpoano
GCLME Guinea Current Large Marine Ecosystem
GIFA Ghana Inshore Fishermen's Association
GIS Geographic Information System
GNAFF Ghana National Association of Farmers and Fishermen
GNCFC Ghana National Canoe Fishermen’s Council
GoG Government of Ghana
ICFG Integrated Coastal and Fisheries Governance
ICM Integrated Coastal Management
IUCN International Union for Conservation of Nature
IUU Illegal Unreported Unregulated
LI Legislative Instrument
MCS Monitoring, Control and Surveillance
MFRD Marine Fisheries Research Division
MOFAD Ministry of Fisheries and Aquaculture Development
MPA Marine Protected Area
M&E Monitoring and Evaluation
NGO Non-Governmental Organization
NC National Committee
NRM Natural Resources Management
NICFC National Inland Canoe Fishermen’s Council
OECD Organisation for Economic Co-operation and Development
PPP Public Private Partnerships
RPA Rapid Partnership Appraisal
SFMP Sustainable Fisheries Management Program
SMEs Small and Medium Enterprises
SNV Netherlands Development Organization
UCC University of Cape Coast
URI University of Rhode Island
USAID United States Agency for International Development
USG United States Government
WA West Africa
WARFP West Africa Regional Fisheries Development Program
WASH Water, Sanitation and Hygiene
WR Western Region
iii
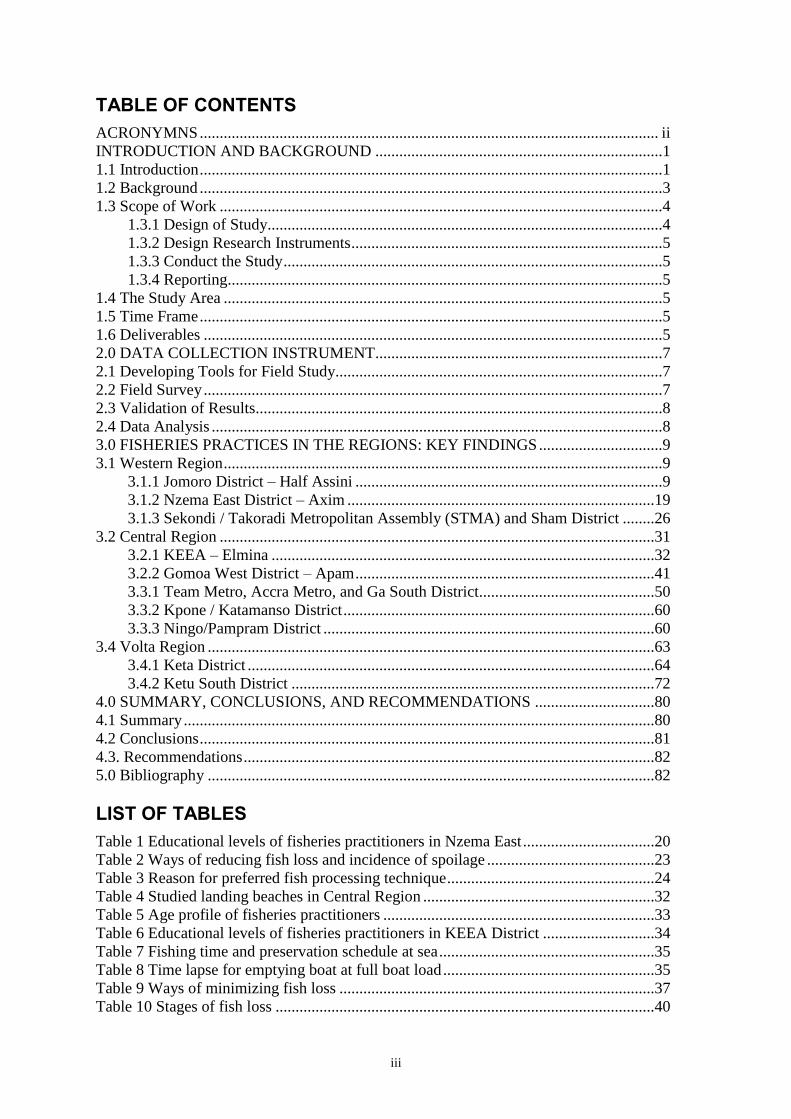
TABLE OF CONTENTS
ACRONYMNS ................................................................................................................... ii INTRODUCTION AND BACKGROUND ........................................................................1 1.1 Introduction ....................................................................................................................1 1.2 Background ....................................................................................................................3 1.3 Scope of Work ...............................................................................................................4
1.3.1 Design of Study...................................................................................................4 1.3.2 Design Research Instruments ..............................................................................5 1.3.3 Conduct the Study ...............................................................................................5 1.3.4 Reporting.............................................................................................................5
1.4 The Study Area ..............................................................................................................5 1.5 Time Frame ....................................................................................................................5 1.6 Deliverables ...................................................................................................................5 2.0 DATA COLLECTION INSTRUMENT........................................................................7 2.1 Developing Tools for Field Study..................................................................................7 2.2 Field Survey ...................................................................................................................7 2.3 Validation of Results......................................................................................................8 2.4 Data Analysis .................................................................................................................8 3.0 FISHERIES PRACTICES IN THE REGIONS: KEY FINDINGS ...............................9 3.1 Western Region ..............................................................................................................9
3.1.1 Jomoro District – Half Assini .............................................................................9 3.1.2 Nzema East District – Axim .............................................................................19 3.1.3 Sekondi / Takoradi Metropolitan Assembly (STMA) and Sham District ........26
3.2 Central Region .............................................................................................................31 3.2.1 KEEA – Elmina ................................................................................................32 3.2.2 Gomoa West District – Apam ...........................................................................41 3.3.1 Team Metro, Accra Metro, and Ga South District............................................50 3.3.2 Kpone / Katamanso District ..............................................................................60 3.3.3 Ningo/Pampram District ...................................................................................60
3.4 Volta Region ................................................................................................................63 3.4.1 Keta District ......................................................................................................64 3.4.2 Ketu South District ...........................................................................................72
4.0 SUMMARY, CONCLUSIONS, AND RECOMMENDATIONS ..............................80 4.1 Summary ......................................................................................................................80 4.2 Conclusions ..................................................................................................................81 4.3. Recommendations .......................................................................................................82 5.0 Bibliography ................................................................................................................82
LIST OF TABLES
Table 1 Educational levels of fisheries practitioners in Nzema East .................................20
Table 2 Ways of reducing fish loss and incidence of spoilage ..........................................23
Table 3 Reason for preferred fish processing technique ....................................................24
Table 4 Studied landing beaches in Central Region ..........................................................32
Table 5 Age profile of fisheries practitioners ....................................................................33
Table 6 Educational levels of fisheries practitioners in KEEA District ............................34
Table 7 Fishing time and preservation schedule at sea ......................................................35
Table 8 Time lapse for emptying boat at full boat load .....................................................35
Table 9 Ways of minimizing fish loss ...............................................................................37
Table 10 Stages of fish loss ...............................................................................................40

iv
Table 11 Fishermen duration at sea ad fish preservation whilst at sea ..............................44
Table 12 Causes of processed fish loss in STMA / Shama District ...................................47
Table 13 Location of landing beaches ...............................................................................49
Table 14 Age profile of fishermen, fish mongers and drivers ...........................................50
Table 15 Educational level of respondents ........................................................................51
Table 16 Preservation of fish at sea ...................................................................................52
Table 17 Duration of stay at sea and fish preservation time ..............................................53
Table 18 Relative cost of preserving fish at sea ................................................................53
Table 19 Time lapse between landing fish and selling out ................................................54
Table 20 Reduction of fish loss and incidence of spoilage by fishermen ..........................56
Table 21 Reason for preferred fish processing technique ..................................................56
Table 22 Fish species difficult to process ..........................................................................56
Table 23 Fish processing techniques which result in losses ..............................................57
Table 24 Stages of fish loss ...............................................................................................58
Table 25 Dominant form of fish loss .................................................................................58
Table 26 Types of packaging techniques ...........................................................................59
Table 27 Fish landing beaches in Keta Metro and Ketu South District .............................63
Table 28 Age distribution of respondents ..........................................................................65
Table 29 Educational level of respondents ........................................................................65
Table 30 Fishermen duration at sea and fish preservation at sea .......................................66
Table 31 Duration of fish when landed before it is sold ....................................................67
Table 32 Reduction of fish loss by fishermen ...................................................................68
Table 33 Reason for preferred fish processing technique ..................................................69
Table 34 Effort level of fish species’ processing ...............................................................70
Table 35 Packaging types for processed fish .....................................................................71
Table 36 Age structure of fisheries practitioners in Ketu South ........................................73
LIST OF FIGURES
Figure 1 Age structure of fishermen in Jomoro District ....................................................10 Figure 2 Period of peak fish harvest in Half Assini – Jomoro District ..............................11
Figure 3 Period of stay at sea harvesting fish ....................................................................12 Figure 4 Time lapse on fish discharge at beach before it is sold out .................................12
Figure 5 Instrument of measure of fish at landing beaches in Jomoro ..............................13 Figure 6 Way of dealing with fish by-catch in Jomoro District ........................................14
Figure 7 Preferred fish for processing in Jomoro District .................................................15 Figure 8 Processing / preservation – type associated losses in Jomoro District ................16 Figure 9 Preferred fish for salting / drying (momoi) processing in Jomoro District .........17 Figure 10 Fish dominance during the bumper harvest season ...........................................21 Figure 11 Dominant fish landings at bumper harvest in Axim ..........................................21
Figure 12 Duration of landed fish at beach prior to selling off .........................................22 Figure 13 Potential causes of fish loss at sea in Nzema East.............................................23 Figure 14 Stages of fish loss in Nzema East District .........................................................24 Figure 15 Dominant stage of fish loss ...............................................................................26 Figure 16 Age profile of fisheries practitioners in STMA and Shama District .................27
Figure 17 Educational levels of fisheries practitioners in STMA and Shama District ......28 Figure 18 Period of peak fish harvest in STMA and Shama District ................................29
Figure 19 Processed fish packaging vessels in us at STMA and Shama District ..............30 Figure 20 Causes of fish loss .............................................................................................36 Figure 21 Time lapse for offloading landed fish at beach .................................................37

v
Figure 22 Fish processing techniques in KEEA ................................................................38 Figure 23 Profitability of differently processed fish ..........................................................39 Figure 24 Type of processed fish loss at KEEA ................................................................39 Figure 25 Educational level of respondents in Gomoa West District ................................42 Figure 26 Fishing gear type used at Gomoa West District ................................................43
Figure 27 Period of bumper harvest in Gomoa West District ...........................................43 Figure 28 Time lapse between landing fish ad selling out at landing beaches ..................45 Figure 29 Ways of fish loss at sea .....................................................................................45 Figure 30 Fish processing types and their relative importance..........................................46 Figure 31 Months in which most fish is marketed .............................................................52
Figure 32 Major fish landings during the bumper harvest .................................................55 Figure 33 Causes of fish loss at sea ...................................................................................55
Figure 34 Major market destinations .................................................................................59 Figure 35 Period of bumper harvest and most fish transport .............................................66 Figure 36 Fishery at the time of bumper harvest ...............................................................67 Figure 37 Sources of fish loss at sea ..................................................................................68 Figure 38 Fish processing and preservation techniques ....................................................69
Figure 39 Dominant forms of fish loss ..............................................................................70 Figure 40 Major market destinations for processed fish ....................................................72
Figure 41 Education level of fisheries practitioners ..........................................................75 Figure 42 Catch analysis of fish species (in terms of cost)................................................76
Figure 43 Modes of fish loss at sea ....................................................................................77
LIST OF PLATES
Plate 1 Treatment of mixed small pelagics for smoking in Jomoro District .....................15
Plate 2 Packaged processing fish displayed for marketing ................................................18 Plate 3 Packaged fish for haulage to commercial centers ..................................................47 Plate 4 Mixed gender fish processors in the Ketu South district .......................................74
Plate 5 Drag net (Yevodor) operation at landing beach .....................................................75 Plate 6 Salted / dried Jack Mackerel (Momoni).................................................................78
Plate 7 Sack covered packaged fish for long tem storage ..................................................79 Plate 8 Packaged processed fish for road trucking ............................................................79

vi

1
INTRODUCTION AND BACKGROUND
1.1 Introduction
Ghana has significant and valuable fish stocks and a strong tradition and culture of fishing.
As many as 2.2 million people are dependent on the fisheries sector for their livelihoods,
including 135,000 fishers in the marine sector, of which 92 percent (124,200) are artisanal
fishers. However, most of Ghana’s fish resources are heavily overexploited and the sector’s
profitability is declining to the extent that fish production costs is approaching or even
exceeding income in all inshore marine capture fisheries. The root cause of the loss of value
seems to be too many vessels competing to catch too few fish, with little or no incentive to
invest in management and value addition.
The United States Agency for International Development (USAID) has committed funds for
the implementation of a Sustainable Fisheries Management Project (SFMP) in Ghana for five
years with the objective of complementing Government’s efforts at rebuilding the marine
fisheries stocks and catches through adoption of responsible fishing practices.
USAID/Ghana’s SFMP aims to end overfishing of key stocks important to local food security
through a multi-pronged approach. One of such approaches is to tackle handling of post
harvested fish in a manner that the little that is taken off from the overharvested fishery can
be handled cost-effectively by reducing losses emanating from post- harvest handing and in
clean environment. One of the organizations selected by the USAID to handle this aspect of
the fishery development, working through the SFMP, is the SNV Netherlands Development
Organization.
SNV is an International Development Organization that provides Capacity Development
Services to local institutions and organizations in Renewable Energy, WASH and
Agriculture. As part of SNV responsibilities to the USAID’s project on Sustainable Fisheries
Management Project (SFMP) a Post-harvest loss reduction study must be carried out. In line
with this broad objective, SNV instituted a short term study in August 2015 to design and
carry out the post-harvest loss reduction assessment in the four coastal regions of Ghana;
Western, Central, Greater Accra and Volta.
As part of SNV responsibilities to the USAID’s project on Sustainable Fisheries Management
Project (SFMP) a post-harvest loss reduction study must be carried out. In line with this
broad objective, SNV instituted a short term study in August 2015 to design and carry out the
post-harvest loss reduction assessment in the four coastal regions of Ghana: Western, Central,
Greater Accra and Volta Regions to work towards fostering of the existing issues concerned
with post-harvest losses and to explore opportunities to reduce the extent of losses, if any,
along the fisheries value chain but emphasizing on all the processes fish undergoes from the
time it arrives at the landing site to the stage it exchanges hands with the end user/consumer.
This report outlines, among others, the issues relating to fishing, fish handling, processing
and post-harvest losses in the four coastal regions of Ghana.
Fisheries practitioners were interrogated in six major areas using the assistance of eight
research assistants in the following area: demographics; fishing techniques and methods;
post-harvest handling of fish, transportation (load trucking); stages, types and nature of losses
along the value chain and marketing. In all 48 landing beaches were studied in 13 districts of
the four coastal regions.

2
The marine artisanal fisheries along the coast line of Ghana are practiced largely by the tribes
along the coastal zone. There is no noticeable restriction to movement of the patrons of the
trade so long as fisheries activities are concerned. Notwithstanding, because the various
methods of fishing are heavily culture-linked, there are clear footprints in all the regions
wherever non-regional tribes occur.
The demographic characteristics of the fisheries practitioners show aging male fishermen and
equally aging but predominantly female fish processors with largely very low classroom
educational background. Children of school going age get involved in the fisheries business
at various points along the value chain with the boy-child activity skewed towards fishing
while the girl-child straddles the beach activities and the processing chores. Activities of
porters are evenly split between young to middle age men and women. While the males tend
to push towards the physical aspect of boating activities and maintenance (e.g., carrying
outboard engines, assisting in carrying and mending fishing nets, pushing trolleys etc.), the
young women focus more on moving landed fish from the landing beaches to the processing
plant, the in-town markets and beach fish mongering.
Fishing is done throughout the year but high fishing outputs are localized and linked to times
of the year. The main fishing practices are the Ali, Poli, and Watsa (APW), beach seine and
hook and line. In addition to these methods, light is used as a fish aggregating devise (FAD)
to attract fish for capture. While use of other unorthodox methods of fishing like dynamite
and chemical fishing did not appear on any of the administered questionnaires, focus group
discussion during the validation clearly established the usage.
Post-harvest fish loss from the inshore fishing is not considered an issue as very little or no
problems are encountered routinely. Any periodic occurrences are often attributed to attacks
on fishing nets by dolphins and sharks and sometimes the activities of the industrial trawling
fleet. Losses at the landing beaches are equally small and are perpetuated by the beach porters
through pilfering. In rare instances, quality of fish catch may begin to deteriorate when the
fishermen run out of ice or they encounter mechanical problems with their outboard engines
while at sea. Losses arising from these occurrences manifest in only reduced ex-shore selling
price with no additional difficulties of offloading them to the female salting/drying processor
patrons.
Three major processing groups are involved in the value addition of the fish catches. These
are the fish smokers, salting/drying processors and those that fry them. Fish frying is also
practiced but on a comparatively small scale. Cold storage operation as a post-harvest value
addition runs from very minimal to non-existent in all the landing beaches. The regional
capitals may, in periods of bumper harvest, cold-store excess fish.
Haulage of processed fish is by relatively younger aged drivers using a variety of vehicles
ranging from saloon car taxis to heavy duty trucks. Major destinations of processed fish are
specialized markets scattered throughout the country and sometime, the neighboring
countries like the Republics of Togo, Burkina Faso and La Cote d'Ivoire. Practitioners are
generally pleased with the haulage arrangements made with the transporting drivers.
Marketing of fish, both fresh and processed, is done by largely female practitioners. Adequate
arrangements are made for the hauled fish to be received by agents and kept in good storage
facilities prior to the arrival of the owners or under some circumstances, the fish could be sent
to some designated regular buyers, known as 'customers' for sales on behalf on the owners.

3
Losses occurring at the post-harvest handling and processing stages and other points along
the value chain are difficult to quantify due largely to the inability of the practitioners to tie
losses of specific activities to the generational costs. Notwithstanding, post-harvest losses are
not regarded as major issue in the operations of the fisheries and if they do occur at all they
are considered generally minimal and vary from district to district.
The main problem encountered by the artisanal fishers and the fish processors lean more
towards poor fish catches and inadequate fish supply respectively. Secondly, the operations
are too much tied up to knowledge bequeathed to practitioners by departing relatives and
other peers. This practice does not lend itself to innovativeness. Some type of training for all
the fisheries practitioners along the value chain will therefore be very helpful to getting them
to ply their trade in a more cost effective and sustainable manner in a clean environment.
1.2 Background
The fishery resources of Ghana has been the economic backbone of the many fishing
communities for centuries, especially the artisanal fishermen and fish processors and will
continue to remain so as long as the fishery resources are managed sustainably (National
Fisheries and Aquaculture Policy, 2008).
It is also noted that the fishing sector is relatively well organized with an increasing desire
among Ghanaian fishers to play a role in managing their local fisheries. However, historic
fisheries management settings have led to a situation where local fishers and communities
have no real stake in the fishery. The Fisheries and Aquaculture Sector Development Plan
seeks to rectify this by providing incumbent fishers with a genuine stake in their local
fisheries through the issuance of long-term and transferable licensing and effort control. The
Ministry of Fisheries and Aquaculture Development believes that once the number and
identity of fishers at a particular site is stabilized, conditions are ripe for development of local
rules governing fishing places, times and methods, as well as the potential for collective
investments in added value (processing), fish handling and marketing.
Ghana’s artisanal fishing sector includes 10,000 small, mechanized wooden boats that harvest
60–70% of the marine catches. About 170 larger semi-industrial ships with inboard motors
are used for trawling in shallow waters during the offseason; and purse seining during
upwelling seasons. Approximately 90 industrial vessels are used for shrimping, tuna lines and
poles, purse seining and demersal pair trawling. The Ghanaian government has sought to
expand the industrial sector in an effort to diversify exports since 1984. Inland fisheries exist
on major rivers and lakes, and there is also some freshwater aquaculture of tilapia and other
endemic species (FAO, 2008).
Ghana has significant and valuable fish stocks and a strong tradition and culture of fishing.
The country produces around 440,000 tons of fish a year (worth in excess of US$1 billion
annually) from its marine fisheries, inland waters and aquaculture. As many as 2.2 million
people are dependent on the fisheries sector for their livelihoods, including 135,000 fishers in
the marine sector, of which 92 percent (124,200) are artisanal fishers. However, most of
Ghana’s fish resources are overexploited and the sector’s profitability is declining. In recent
years, fish production costs approached or exceeded income in all inshore marine capture
fisheries (the industrial, semi-industrial and artisanal canoe fisheries) and any remaining
profitability in inland fisheries is being rapidly dissipated. The root cause of the losses stems
4
from too many vessels competing to catch the few fish, with no incentive to invest in
management and value addition.
The fishing industry of Ghana is regulated by the Fisheries Act 2002 (Act 625 of 2002) which
provides for, inter alia, regulations and management of fisheries resources, development of
the fishing industry and sustainable development of the fishery. Furthermore, Sections 77 and
139 of the Act makes it possible to draw on other laws that address any inadequacies in the
management of the fisheries. Thus the Government of Ghana’s most urgent priority of putting
in place a comprehensive Fisheries management and compliance systems are in place to
allow for effective control of all commercial fishing effort including the artisanal fishery in
Ghanaian waters. Government’s proposed approach taken in the Plan is as follows:
To freeze the capacity of the artisanal sector at current levels
To reduce vessel capacity in the industrial and semi-industrial sectors
Once the capacity reductions are introduced and effective management systems are operating,
value added investments can then be targeted at the artisanal sector and remaining industrial
sectors. The ultimate objective of having benefits accruing primarily to the artisanal sector
and local communities as a result of the phased effort reductions, allocation of long-term and
transferable licenses and development of community based fisheries management programs
will thus be on course and hopefully impact positively on post-harvest handling of fishes in
the coastal communities.
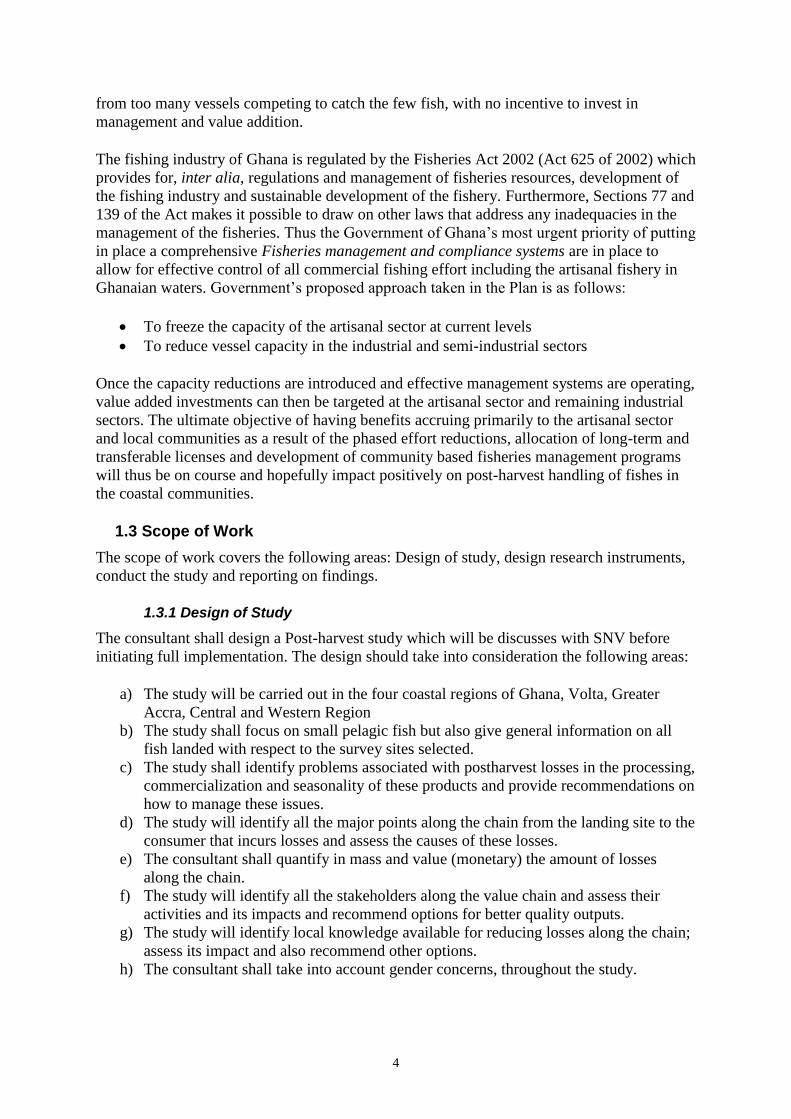
1.3 Scope of Work
The scope of work covers the following areas: Design of study, design research instruments,
conduct the study and reporting on findings.
1.3.1 Design of Study
The consultant shall design a Post-harvest study which will be discusses with SNV before
initiating full implementation. The design should take into consideration the following areas:
a) The study will be carried out in the four coastal regions of Ghana, Volta, Greater
Accra, Central and Western Region
b) The study shall focus on small pelagic fish but also give general information on all
fish landed with respect to the survey sites selected.
c) The study shall identify problems associated with postharvest losses in the processing,
commercialization and seasonality of these products and provide recommendations on
how to manage these issues.
d) The study will identify all the major points along the chain from the landing site to the
consumer that incurs losses and assess the causes of these losses.
e) The consultant shall quantify in mass and value (monetary) the amount of losses
along the chain.
f) The study will identify all the stakeholders along the value chain and assess their
activities and its impacts and recommend options for better quality outputs.
g) The study will identify local knowledge available for reducing losses along the chain;
assess its impact and also recommend other options.
h) The consultant shall take into account gender concerns, throughout the study.
5
1.3.2 Design Research Instruments
The consultant will design questionnaires or necessary research instruments to undertake the
survey. The research instruments shall be reviewed by SNV before active field work begins.
1.3.3 Conduct the Study
The consultant shall conduct this study along the coastal basin of Ghana (The Volta, Greater
Accra, Central and Western regions). Eight field assistants will be provided by SNV to assist
in the gathering of field data in all four regions. The consultant shall train the field assistants
and coordinate their activities on the field.
1.3.4 Reporting
A draft and final report will be prepared by the consultant with outputs of the field survey.
The report shall encompass every activity that has been carried out under the survey process
including design, research instruments etc.
1.4 The Study Area
The study area is the four coastal regions of Ghana; Western, Central, Greater Accra and
Volta regions. The consultant shall select at least two communities in each region for the
study based on prior knowledge of these areas. This must be justified.
1.5 Time Frame
This assignment will be carried out between July and September 2015 and shall be conducted
in close consultation with the Renewable Energy Sector of SNV.
1.6 Deliverables
The consultant shall produce the following deliverables:
1) A study design
2) Research instruments
3) Field assistant training report
4) First draft report
5) Final report
6) A summary PPT of the final report
6

7
2.0 DATA COLLECTION INSTRUMENT
2.1 Developing Tools for Field Study
The main instrument used in the data gathering was a structured questionnaire aimed at
capturing the practitioners along the fisheries value chain in 3 major areas: the fishermen; the
fish processors/fish mongers; and the drivers conveying fresh and processed fish to the
marketing and consuming centers. A copy of the questionnaire is presented in Annex 1.
2.2 Field Survey
Field survey was conducted in 48 landing beaches belonging to 13 Districts spread across the
four coastal regions of Ghana (information on vessel volume per district at this juncture may
be unreliable as registration of fishing vessels is currently underway nationwide). Interviews
started in all the four regions by eight Research Assistants (RA’s) on Wednesday August 12,
2015 and lasted for 15 day. This was followed by focus group discussion by the Consultant.
The survey involved the collection of data using a structured questionnaire. For each RA, a
minimum of 20 fishermen, 15 fish processors and 5 transporters were to be contacted. Slight
variations in the administration of the questionnaires were introduced in a few locations with
the approval of the Consultant. The summary of methodology used as applied to the three
major areas (vessel owners; fish mongers, transporters) is presented in seven categories of
Practitioners along the value chain. Choice of categories of fishing craft was informed by the
major operating fishing vessels plying their trade in the four regions and the sample size
determined by the time allotted for the field survey (15 working days). Details are presented
as follows:
Category 1: Industrial, semi-industrial semi industrial/local and canoes. Total: 40
vessels
o 20 in Takoradi
o 20 in Tema: spread questionnaire to capture all vessel types
15 for industrial/ semi-industrial
5 for canoes
Category 2: Elmina, Apam, Axim, Shama. Total 60 vessels
o 15 vessels each.
5 for semi-industrial
10 for canoes
Category 3: Ningo Prampram, Keta, Denu. Total 60 vessels
o 15 vessels per district.
Category 4: Fishmongers. Total 120 fishmongers
o 15 per location (i.e. 15 at each of the following places: Tema, Ningo
Prampram, Keta, Denu Elmina, Apam, Sekondi, Half Assini)
o Additional landing beaches with the potential to introducing variations were
added as appropriate.
Category 5: Drivers. Total 60 vessels
o 5 per location (i.e. 5 at each at lorry stations of the following places: Tema,
Ningo Prampram, Keta, Denu Elmina, Apam, Sekondi, Half Assini
Category 6: Focus group discussions
o Fishmongers
o Fishermen
Category 7: Key informant interviews

8
o GPRTU Chairmen/station masters
o Chief fishermen
o Leadership of fishmonger associations
In order to achieve the overall objective of the study the following characteristics and roles of
fisheries practitioners were interrogated:
Demographics
Fishing techniques and methods
Post-harvest handling of fish
Transportation (load trucking)
Stages, types and nature of losses along the value chain
Marketing
2.3 Validation of Results
The Consultants engaged focus groups in all the regions to validate the data collected in the
field by the Research Assistants. These groups included the leadership of the local fishing
associations, e.g., executive members of the fish processing associations at selected landing
beaches, Chief fishermen and the leadership of the transport unions and the drivers who are
directly involved in the processed fish haulage.
Consultant also visited some marketing canters during market days to observe and interact
with drivers and fishmongers; both the sellers and buyers
2.4 Data Analysis
Data gathered by the RAs on 73-question questionnaires for the 48 landing beached were
initially collated at the district levels and analyzed statistically using the SPSS statistical
package.

9
3.0 FISHERIES PRACTICES IN THE REGIONS: KEY FINDINGS
3.1 Western Region
There are six fishing districts and 96 landing beaches in the Western region. The SNV post-
harvest loss reducing study was conducted in four districts and 11 landing beaches in this
region. The four districts with the respective main fishing towns and number of landing
beaches are: Jomoro – Half Assini, (2), Nzema East – Axim, (3), STMA – Sekondi (3) and
Shama (3). A total of 20 fishermen, 30 fish processors and 10 drivers were interviewed in the
region. Focus group discussions were held for chief fishermen, fish processors associations
and some drivers in Half Assini and Denu in the Volta region.
3.1.1 Jomoro District – Half Assini
Half Assini is the biggest landing beach in the Jomoro district. It has two major landing sites
respectively operated by the Nzema and Fante communities (New York beach) and the Ewe
community (Bonglo beach). Cultural differences make the operations of the two landing
beaches different in terms of taboo days, the gear used, fishing practices and consequently the
catches landed. The general consensus is that the two factions co-exist peacefully; except in
the distribution of Pre-mix fuel.
At the Banglo beach, the main fishing economic unit is the dug-out canoe (some of which
may be motorized) and the seine net. The major fishing practice is thus the beach seining. At
the New York landing beach, the main fishing economic unit is the dug-out canoe but they
are all motorized. The fishing gear is more diverse which enable them to practice such fishing
methods as Ali, Poli and Watsa, hook and line, monofilament (rubber) net. The use of light
and other unorthodox methods of dynamite and DDT in fishing are thought not to be
prevalent in these areas.

10
Demographic Characteristics
Age
The age structure of male and female practitioners in this district spans three decades and
ranges from 31 to 57 years (Figure 1).
Figure 1 Age structure of fishermen in Jomoro District
Education
Classroom type of educational level is generally low. 50% of respondents have had no formal
education. The remaining 50% schooled only up to the middle school level.
Fishermen do not change their fishing gear in the course of the year and tend to use the same
gear at all times. The season of bumper harvest is variously stated as August, August and
September and September. However the majority of fishermen perceive September as the
period of highest catch (Figure 2).

11
Figure 2 Period of peak fish harvest in Half Assini – Jomoro District
Period of stay at sea
Traditionally, the Ewe fishermen spend a few hours at sea plying the beach seining. The
Nzema / Fante fishermen stay comparatively longer periods but up to a maximum of one day
(overnight) (Figure 3). This type of fishing makes them less dependent on ice preservatives at
sea.
Fish loss at sea has only a small proportion being attributed to spoilage and arises only when
catches are sparse and fishing time is prolonged. Other causes of loses stem from such
incidences as shortage of pre-mix at sea, outboard engine break down and breaking of fishing
nets among others. The occurrences are rare and the quantities involved, on the average are
negligible.

12
Figure 3 Period of stay at sea harvesting fish
Fish landings at the beach will not ordinarily stay too long between the time of discharge and
sale. While the quantities landed by the boats are an important determining factor, it is
estimated that within a period of 30 minutes of discharging from the boat all the fish would
have been sold out (Figure 4). Because fish is rapidly offloaded and sold out also within
relatively short periods, fish loss, according to the fisheries practitioners, is very minimal at
the beach when it exists.
Figure 4 Time lapse on fish discharge at beach before it is sold out

13
The instrument of measure of landed fish varies widely and may depend on the type and
quantity of fish landed. These include the enamel bowl, rubber buckets and rubber bowls.
The main type in use is however the enamel bowls. 30% of respondents use the enamel bowl,
commonly referred to as pan (Figure 5).
Fish by-catch
The major source of fish loss indirectly encountered by the fishers is the by-catch (usually
non-target juvenile fish). The reaction of fishermen to by-catch is variable and includes
outright release back into the sea, some being sold or sale at the landing beach. Over 60% of
all by-catch is sold out (Figure 6).
Figure 5 Instrument of measure of fish at landing beaches in Jomoro

14
Figure 6 Way of dealing with fish by-catch in Jomoro District
Fish processing, packaging and haulage, and marketing
Fish processing
Fish processing in the Jomoro district is dominated by the women in Nzema / Fante and Ewe
communities. Where males get involved in the processing, they are perceived as helping their
spouses. Like their male fishermen counterparts, the educational levels of the female
processors are generally low and do not go beyond middle school level. Most of them
inherited the businesses from their parents after they had passed on while others operate side
by side with their mothers. One significant observation is that the daughters who are in school
or have acquired some education beyond the Junior High school are usually exempted from
full time participation in the processing business.
There are three major fish processing methods in the Jomoro district. These are: smoking;
salting / drying; frying. By far the most popular method in use is smoking and it is followed
by salting/drying, frying and frying in that order. All types of fish can be used for processing
and any type is able to be processed using the available techniques. Plate 1 shows mixed
species of small pelagics left in treatment baskets to facilitate complete drain of water ahead
of smoking.
On choice of fish for processing, 30% of the respondents thought the question was not
applicable to them as they would select any type available on the fishing day to process. 20%
of them held that Sardinella aurita (round sardine) locally known as Eban were the preferred
fish for smoking. The remaining comprised of several other species (Figure 7).

15
Plate 1 Treatment of mixed small pelagics for smoking in Jomoro District
Figure 7 Preferred fish for processing in Jomoro District
Fish processing associated losses
Traditionally the effort required to process different species of fish are about the same, and
the fishing method in this region does not have effect on the processing time or quality.
Losses incurred during processing are thus about the same.

16
On the whole loss of fish during processing is not significant, according to majority of the
respondents. Similarly, about 40% of the respondents held that losses during preservation
were not an issue as they will ordinarily not preserve fish before they processed them.
Notwithstanding, some processors held that some element of losses may occur depending on
the preservation method adopted. In this wise, freezing as a means of preservation prior to
processing has the highest potential of incurring losses. This is followed by salting/drying and
smoking in that order (Figure 8).
Quantification of losses is extremely difficult for the fishers and processors to make; except
that they know money that ought to have accrued to them was not realized.
Figure 8 Processing / preservation – type associated losses in Jomoro District
Fish preferences for salting / drying processing
Generally, salting/drying processing can be made with all type of fish and under any
condition. However some species of fish are thought to sell better and earn good margins of
profit when processed. These include the deep body fish Caranx hippos (horse mackerel)
(Epae); Chloroscombrus chrusurus (Atlantic bumper) (Tantemire), Scomberomorus tritor
(Spanish mackerel king fish (Saforo) among others (Figure 9).

17
Figure 9 Preferred fish for salting / drying (momoi) processing in Jomoro District
Fish packaging and haulage
Processed fish is packaged in large enamel bowls lined with brown paper and secured using
ropes or heavy duty nets. Packaged height is normally three feet but this can be increased
depending on the type of fish and the extent of hardness.
Transportation of processed fish is by arranged transporters. Where to move to and when to
move is determined by marketing days of the major marketing centers in Ghana. For the
processors in this community, haulage days are usually Mondays, Tuesdays, Fridays and
Saturdays. The marketing centers include Elubo, Jeways Warf, Tikobo No. 1 Asankragua,
Sefwi Bekwai, Bogoso Kumasi, Accra and Aflao.
The fish smokers may or may not accompany the vehicles to the marketing centers. Where
goods are moved unaccompanied, adequate arrangements are made for ‘customer porters’ to
receive, store and in some cases even distribute the goods on behalf of the processor for an
agreed fee. Vehicle charges are on the basis of ‘per packaged item’ and payment may be
made to driver before or after discharge of goods. Charges range between GHc 3- Ghc 7
depending on the destination and also size of the packaged item.
For the salting/drying processors, haulage of the goods is dove unaccompanied. They board
passenger vehicles to follow-up to collect their wares at the designated destinations. In some
cases, designated agents may be commissioned to collect wares on behalf of the momoi
processors.
Losses incurred during the transporting process are deemed negligible and even when a
vehicle breaks down on the way, the only losses incurred may be loss of time. Anyhow, it

18
becomes the responsibility of the driver to lift the goods to the designated destination as
quickly as possible.
Marketing
Wares are sold in bulk at the marketing centers to customers (Plate 2). In extreme cases, the
processors may retail the fish. Any unsold fish is kept in safety at local ware houses at agreed
fee of GHc 1- 2 per basket per day.
Plate 2 Packaged processing fish displayed for marketing

19
3.1.2 Nzema East District – Axim
Axim and its environs, three landing beaches were studied. These are Supom, also known as
Russia Commandos; Boatase or Italy and Antoampusika landing beaches. There are no
industrial vessels in these landing beaches but the inshore vessels are capable of staying at
sea up to four days. Others stay for 24 hours while the ‘one-man’ canoes last for around 12
hours and more. The different vessels land different fish species.

20
Demographic Characteristics
The age structure among the randomly sampled fishermen spans six decades and ranges from
22 years to 70 years. Educational level of the respondents is low and range from no formal
class room education to middle school certificate holders. Only one diver had secondary
education. All the boat owner/fishermen and drivers were males while all the fish mongers
were females (Table 1). Majority of the practitioners were married.
Table 1 Educational levels of fisheries practitioners in Nzema East
Fishing is done through the year with almost all of them not changing their fishing gear.
Fishes landed include the following: Illisha Africana (long fin herring) (Kanfena); Caranx
hyppos (horse mackerel) Epae; Sardinella eba (flat sardines) Eban; Sardinella aurita (round
sardines) Eban kankama; Pseudotolithus typus (Cassava fish) Ekan.
Fish harvest
Period of bumper harvest varies widely among respondents; presumably corresponding to the
preponderance of the various fishery. Majority of respondents nonetheless hold the bumper
harvest to be in August. This period also corresponds to the period of highest fist haulage
from the processing centers to the consuming centers (Figure 10).
Fishermen (Males) Fishmongers / Buyers (Females)
Drivers of vehicles (Males)
Education. No. of Responses
Percent (%)
No. of Responses
Percent (%)
No. of Responses
Percent (%)
None 5 50 8 80 1 20
Middle/JSS 5 50 2 20 3 60
Secondary 1 20
Tertiary
Totals 10 100 10 100 5 100

21
Figure 10 Fish dominance during the bumper harvest season
During the period of bumper harvest, the catches are dominated by the sardinella with
Sardinella aurita (round sardines) at 80% of the catches while Sardinella eba (flat sardines)
constitute the remaining 20% of the landings (Figure 11).
Figure 11 Dominant fish landings at bumper harvest in Axim
Fish preservation at sea
0
1
2
3
4
5
6
7
August January - March August andSeptember
July - Sept. July -August
Nu
mb
er o
f R
esp
on
den
ts
Months
Time for bumper harvest
Month of most fish transport
20%
80%
Species Abundant in August
"Emani"
"Eban"

22
Majority of fishermen do not preserve their catches at sea. Those that preserve their catches
are those that stay for longer periods of time (i.e., from 1 to 4 days).
At the landing beaches, catches are removed from the boats fairly rapidly with about 50%
being emptied within one hour. In the same manner, within one hour of emptying the boats
the evacuated fish would have been sold out. 60% of respondents believe that their landed
fishes are sold off almost immediately (Figure 12).
Ways of losing fish
Fish loss is not a big issue with the fishermen. Nonetheless, any losses incurred may stem
from delay at sea or shortage of ice for preserving the catch and others (Figure 13). Suggested
remediation measures aimed at reducing fish loss include the following: access to plentiful
supply of ice, not going too far offshore or getting deteriorating fish processed into momoi
(salting / drying) (Table 2).
Figure 12 Duration of landed fish at beach prior to selling off
Almost immediately
60%
About 30 mins 20%
1 hour 10%
N/A 10%
Duration of fish when landed before it is sold

23
Figure 13 Potential causes of fish loss at sea in Nzema East
Table 2 Ways of reducing fish loss and incidence of spoilage
Fish processing
Fish processing is the preserve of women and it may be through smoking, salting and drying,
or frying. Fish may be put in cold storage, in rear circumstances, for preservation ahead of
processing. In the Nzema East District, the main processing technique practiced is smoking.
50% of respondents are into fish smoking because they find it more profitable. 30% of them
believe that smoked fish sells faster hence their choice of that fish processing technique. The
remaining 20% attribute their choice of fish smoking practices to lack of storage facilities,
presumably cold stores, in their location (Table 3).
0
0.5
1
1.5
2
2.5
3
3.5
4
4.5
None is lost fuel shortage atsea
shortage of ice when delayedat shore
delay at sea
Nu
mb
er o
f R
esp
on
den
ts
Causes of Fish Loss
Fish Loss
Strategy of reducing fish loss Number of Respondents Percentage (%)
Further processed into “Momoi” 3 30
Use of more ice blocks 3 30
Sell as well 3 30
Do not go far at sea 1 10
Total 10 100

24
Table 3 Reason for preferred fish processing technique
Stages of processed fish loss
Fish in this district is smoked using a variety of hard wood as a source of energy. The hard
wood is ordered from the hinterland. Dry coconut husks may also be used. Crushed and dried
sugarcane peels (bagasse) are sometimes used to enhance preservation and to improve taste
and general aesthetics. It is to be noted that in this district mangroves plants are never used as
sources of energy to process fish. The perception on avoidance of mangrove plants is that it
does not give the finished product the necessary good looks.
Generally, losses attributable to fish processing is not considered a major setback in the
processing business. Notwithstanding, it is acknowledged that if the smoking is not done
properly some losses may occur from time to time. The majority view, however, is that losses
incurred may be right at the landing site where pilfering by boat attendants and porters is very
rife. Others believe that losses occur during processing and at the point of sale. Losses before
processing and in storage are considered minimal (Figure 14).
Figure 14 Stages of fish loss in Nzema East District
Packaging, haulage, and marketing
Packaging
Reason for Choice of Processing Technique
Number of Respondents
Percentages (%)
Sells faster 3 30
Profitable 5 50
Because of no storage facility 2 20

25
Smoked fish is packaged in large aluminum bowls lined with brown paper and securely tied
with nets. Special efforts are made to pack the fish in such a manner that leaves no room for
movement within the bowls once they are tied. Packaged height is about two or three times
the height of the aluminum bowl.
Haulage
Transportation of processed fish to the commercial centers is by trucks. The drivers are called
in as and when a group of fish processors have enough wares to fill the trucks. During peak
periods of fish harvest, the wares of only one processor may fill a whole haulage truck. The
marketing centers patronized by processors in the District are diverse but a particular
destination selected by a processor may be informed by such market forces are scarcity of the
product, willingness of buyers (customers) to accept the desired quantities being sent and
availability of storage space, in the event that the wares are not sold out. Fish mongers may
stay at the marketing centers for as long as one week in order to sell off their wares.
Marketing
As it pertains in other districts of the region, the fish smokers may or may not accompany the
vehicles to the marketing centers. Where goods are moved unaccompanied, adequate
arrangements are made for ‘customer porters’ to receive, store and in some cases even
distribute the goods on behalf of the processor. Remuneration due such porters is usually by
negotiations. The major commercial markets patronized by the processors include Elubo,
Jeways Warf, Tikobo No. 1, Sefwi Bekwai, Tarkwa, Kumasi, Kintampo and Bolgatanga
Aflao, Denu and Aflao.
Fish processing and loss analysis
While some of the processors are of the view that fish losses are no major issues in the
business, majority of respondents believe that the processing techniques that returns the
biggest profit margin is smoking. In the same vein freezing, for preservation ahead of
processing, returns the biggest loss of revenue (Figure 15).
Another window of revenue loss is through forced sales. Forced sales are interpreted as a
situation where the fish monger is forced to sell without any profit or at times sell below
production cost in order to realize some cash to solve some pressing issues that may or may
not be directly related to the business but necessary to keep the business running. Example
may include payment of school fees, settling of medical bills, among others.

26
Figure 15 Dominant stage of fish loss
3.1.3 Sekondi / Takoradi Metropolitan Assembly (STMA) and Sham District
Data from the two districts of STMA and Shama were combined and analyzed together. The
study areas comprised two landing beaches in the STMA Albert Bosumtwi-Sam (ABS)
fishing harbor, New Takoradi beach and four landing beaches in Shama district (Shama
beach, Aboadze beach, Aboasi beach, Ngyasia beach).
0
1
2
3
4
5
6
7
8
Smoking Freezing N/A
Nu
mb
er o
f R
esp
on
den
ts
Fish Processing Technique
Fish Processing Analysis Processing with higest profit
Processing which result intomost losses

27
Fishing in these areas is done by male patrons while fish processing is performed
predominantly by females. Males who take part in the processing business are normally
regarded as offering assistance to their spouses.
All the major fishing methods, i.e., APW, hook & line, set net (monofilament net/rubber net
fishing) and the inshore semi-industrial trawling are practiced in the two districts. In addition
to this, five trawlers belonging to one fisheries practitioner are thought to be servicing the
landing beaches with supplies of demersal fishes. These trawlers are also thought to be the
main source of ‘syco’ fishing in the area. Also prevalent in this area are the practice of light
fishing and ‘bomb’ or dynamite fishing.
Demographic Characteristics
Age
The age profile of both fishermen and the fish processors spans only three decades (37 years
to 67 years) and dominated by those in the ages 37, 38, 40 and 47 at 12.5% (Figure 16).
Education
About 60% of the fisheries respondents had no formal education. The highest number of
educated people were middle school/JSS scholars and represented 20% of the respondents.
Secondary school and tertiary levels educated fisheries practitioners were equally represented
at 7.5% (Figure 17).
Figure 16 Age profile of fisheries practitioners in STMA and Shama District
28
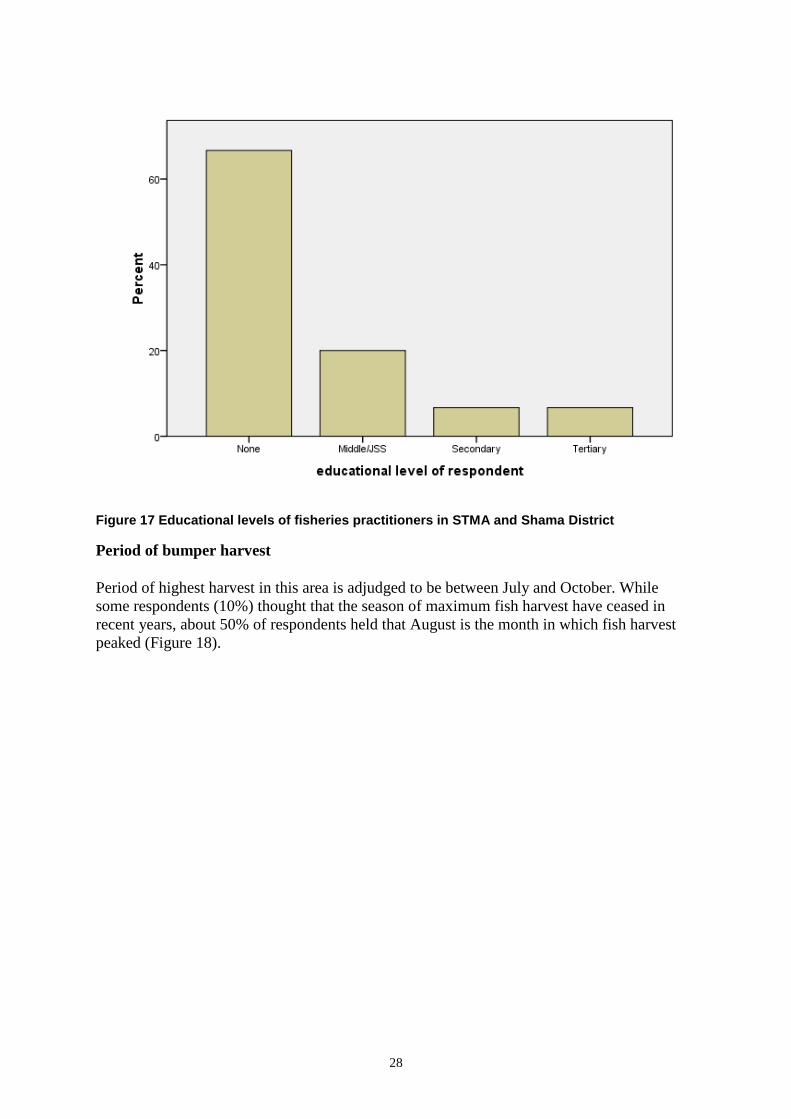
Figure 17 Educational levels of fisheries practitioners in STMA and Shama District
Period of bumper harvest
Period of highest harvest in this area is adjudged to be between July and October. While
some respondents (10%) thought that the season of maximum fish harvest have ceased in
recent years, about 50% of respondents held that August is the month in which fish harvest
peaked (Figure 18).

29
Figure 18 Period of peak fish harvest in STMA and Shama District
Period of stay at sea
Periods spent at sea range from four hours to five days and depends of the type of craft being
used. The one-man canoe operators spend the least time at sea operating largely in the
nearshore areas. They do not carry any for of preservatives with them. The Ali, poli and
watsa operators spend variable times with thie operation lasting between 12 hours and one to
two days. They donot carry much ice with them so in the event of much catch or decimated
catches, they often run out of ice. The main uses of ice preservatives are the semi-industrial
vessels and the trawlers. Depending on the quantum of catch and the fishing season, time
spent at sea may last from one day to five days. The monofilament net ussers usually set their
nets at night and remove them at dawn or early hours of the day. Thus their stah at sea also
lasts for less than 12 hours in any typical fish in day.
Way of losing fish
Fish loss at sea comes from three major ways: when fishing nets of two different fishing
groups get entangled ususlly as a result of receeding waves of storms; when fishing nets are
overrun by the trawling nets of the industrial fleet; when there is an attack on fishing nets by
dolphins and shacks. In all these instances, fish loss is only quantified in terms of loss of
man-hours or canoe hours. In cases where the fishing group runs out of ice, the catches may
begin to show signs of deterioration but usually do not get to the extent of being discarded.
Such fishes are offloaded at a lower price to the momoni processors to be salted and dried.
Thus real-time fish loss at sea is considered negligible.
Fish processeing, packaging, and marketing
30
Processing
There are three major processing methods being practised in the STMA and Shama districts.
These are smoking, drying/salting and frying. Freezing as a preservation method is
considered as pre-treatment technique for processing and occurs when catches are in plentiful
supply. Such treatment lasts for only a few days. The large scale fresh fish sellers do employ
refrigeration as a preservation method and release fish to the processors and other buyers on
demand. When cold storage becomes a problem and fish begins to show signs of deteroration,
the salting/drying fish processors are sought for by the frozen fish mongers and the fish off
loaded to them, usually at a reduced cost but not to the exent of incuring losses.
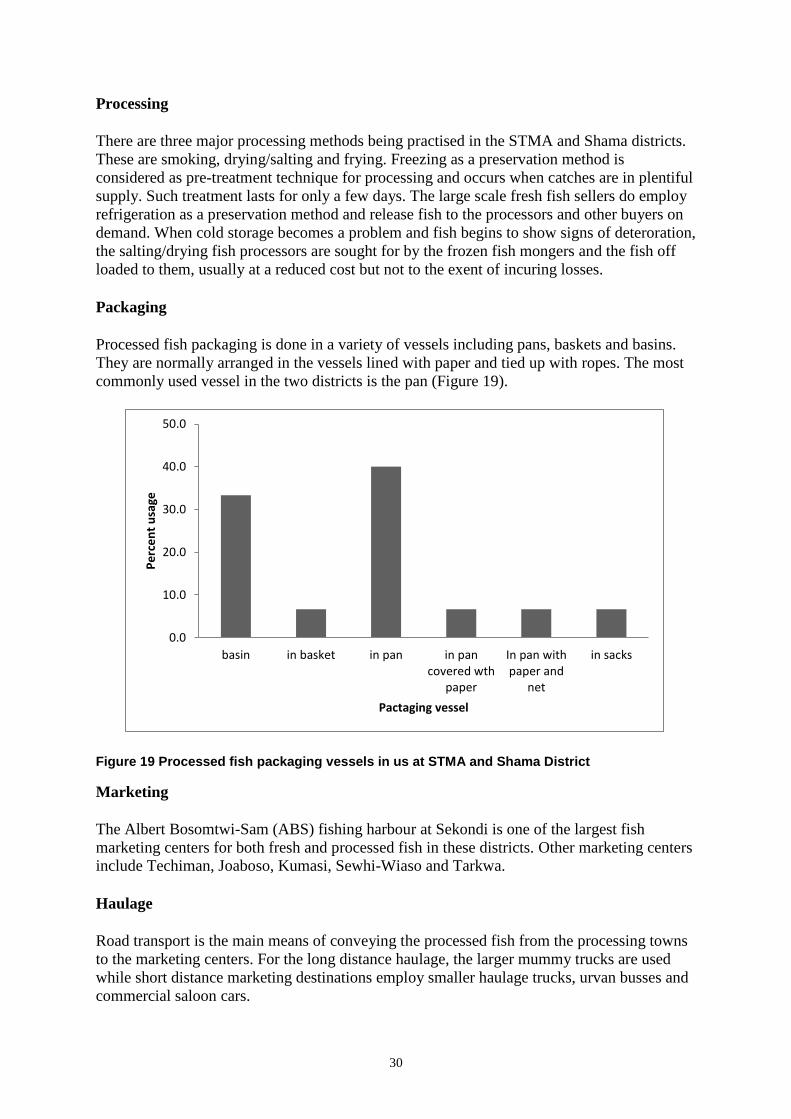
Packaging
Processed fish packaging is done in a variety of vessels including pans, baskets and basins.
They are normally arranged in the vessels lined with paper and tied up with ropes. The most
commonly used vessel in the two districts is the pan (Figure 19).
Figure 19 Processed fish packaging vessels in us at STMA and Shama District
Marketing
The Albert Bosomtwi-Sam (ABS) fishing harbour at Sekondi is one of the largest fish
marketing centers for both fresh and processed fish in these districts. Other marketing centers
include Techiman, Joaboso, Kumasi, Sewhi-Wiaso and Tarkwa.
Haulage
Road transport is the main means of conveying the processed fish from the processing towns
to the marketing centers. For the long distance haulage, the larger mummy trucks are used
while short distance marketing destinations employ smaller haulage trucks, urvan busses and
commercial saloon cars.
0.0
10.0
20.0
30.0
40.0
50.0
basin in basket in pan in pancovered wth
paper
In pan withpaper and
net
in sacks
Pe
rce
nt
usa
ge
Pactaging vessel

31
3.2 Central Region
Central region has 47 landing beaches spread across nine coastal districts. The study in this
region covered 13 landing beaches in the districts of Kommenda/Edna/ Eguafo/Abirem

32
(KEEA) and Gomoa West. The 13 beaches were located in three major fishing towns of
Elmina, Kommenda and Apam, within two districts (Table 4).
Table 4 Studied landing beaches in Central Region
3.2.1 KEEA – Elmina
Demographic Characteristics
Age
The age group of respondents spans a period of four decades in the range of 30 – 65 years.
The fishermen had modal ages in the age group of 40-59. The corresponding age groups for
the fish processors and the drivers were 60 years and above and 30-39 years respectively
(Table 5).
District Major towns Landing beach
Kommenda/Edna/ Eguafo/Abirem
(KEEA)
Elmina
Elmina
Abisisim
Asamanpom
Boatase
Marine park
Nyankyifom
Kommenda
British komenda
Dutch Komenda
Sesam
Gomoa West Apam
Abra mpoano
Akodaa ahenegwe
Apam main
Atlata mpuano
Nana apaaenim

33
Table 5 Age profile of fisheries practitioners
Gender
Gender specific activities are prevalent in the fisheries business in this region. There were no
females participating directly in the fishing activities. Similarly, all the processing was done
by women while the drivers were all males.
Education
Educational level of the fisheries practitioners in this district is generally very low. 84% of
the fishermen either had formal class room education up to the middle school or had no
formal education. Notwithstanding, 11% and 5% respectively possessed secondary school
and tertiary institution qualifications. Among the processors, 68% of them had no formal
education while 11% only managed up to the middle school. The remaining 21% just
attempted primary school l. All the fish haulage drivers were Middle school / JSS graduates
(Table 6).
Fishermen Fishmongers / Buyers Drivers of Vehicles
Age No. of Responses
Percent (%)
No. of Responses
Percent (%)
No. of Responses
Percent (%)
20 -29 years
30 - 39 years 2 11 2 11
3
40 - 49 years 8 42 4 21
50 -59 years 8 42 4 21
above 60years 1 5
5 26 1
N/A 4 21
Totals 19 100 19 100 4 100

34
Table 6 Educational levels of fisheries practitioners in KEEA District
Months of bumper harvest, type of fish, and high fish transport
The commonest fish species landed during this period were the sardines Sardinella aurita
(round sardines) and Sardinella eba (flat sardines) locally called eban. Other fish species
landed were Edae - Thunnus albacore (Yellow fin tuna), Nkafona -, Ilisha africana (long fin
herring) Tatamire- Chloroscombus chrysurus) – jack mackerel, Epo mpatowa - Chromis
lineatus (striped chromis) Efim – Argyrosoma reguis (cassava fish) Wrewrew / sika
sika(Redfish) Dentex angolensis (sea bream), Efin – Epinephelus aeneus - grouper, Engraulis
encrasicolus - Amoni, Selene dorsalis (African moonfish) - Tatamire. All the fishermen
interviewed were unanimous in their thoughts that the main fish harvest season was in
August.
Time spent at sea and preservation methods
Majority of the fishermen (57%) spend between six hours and fifteen hours at sea on any
typical fishing day. There is a split in the use of ice blocks for preserving fish at sea. 47% of
the respondents did not use ice at sea while those who used ice at sea were also 47%. The
remaining 6% were not consistent in use or nonuse of ice blocks while at sea (Table 7).
Fishermen Fishmongers / Buyers
Drivers of Vehicles
Educ. Level
No. of Respons
es
Percent (%)
No. of Respons
es
Percent (%)
No. of Response
s
Percent (%)
None 9 47 13 68 - -
Middle/JSS
7 37 2 11 4 100
Secondary 1 5
Tertiary 2 11 - - - -
N/A 4 21
Totals 19 100 19 100 4 100

35
Table 7 Fishing time and preservation schedule at sea
Time lapse of emptying boat at full boat load
Evacuation of boats at full capacity lasted between 30 minutes and five hours. 37% of the
respondents would off load all fish within 2 hours. The time lapse between offloading the fish
and selling off the catch was equally short at times not exceeding two hours. 37% of the
respondents disposed of their catches almost immediately (Table 8).
Table 8 Time lapse for emptying boat at full boat load
Duration on sea Maximum fish preservation time on sea
Time No. of Responses
Percentages (%)
No. of Responses
Percentages (%)
4 hours 1 5
6 hours 1 5
10 hours 1 5
12 hours 9 48
15 hours 1 5
1 day 5 27 - -
2 days 1 5
3 days 4 21
4 days 1 5 1 5
N/A 1 5 12 64
Time Number of Respondents Percentage (%)
30 minutes 2 11
1 hours 4 21
2 hours 7 37
3 hour 3 16
4 hours 1 5
36
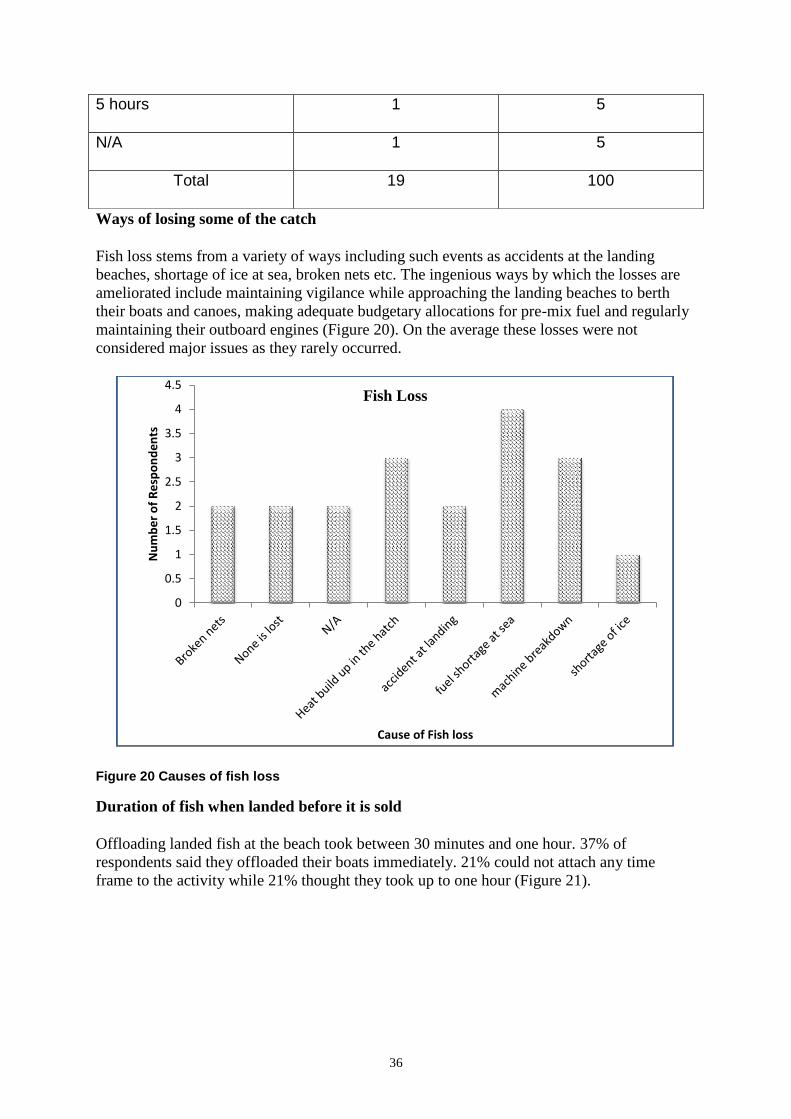
Ways of losing some of the catch
Fish loss stems from a variety of ways including such events as accidents at the landing
beaches, shortage of ice at sea, broken nets etc. The ingenious ways by which the losses are
ameliorated include maintaining vigilance while approaching the landing beaches to berth
their boats and canoes, making adequate budgetary allocations for pre-mix fuel and regularly
maintaining their outboard engines (Figure 20). On the average these losses were not
considered major issues as they rarely occurred.
Figure 20 Causes of fish loss
Duration of fish when landed before it is sold
Offloading landed fish at the beach took between 30 minutes and one hour. 37% of
respondents said they offloaded their boats immediately. 21% could not attach any time
frame to the activity while 21% thought they took up to one hour (Figure 21).
0
0.5
1
1.5
2
2.5
3
3.5
4
4.5
Nu
mb
er
of
Re
spo
nd
en
ts
Cause of Fish loss
Fish Loss
5 hours 1 5
N/A 1 5
Total 19 100

37
Figure 21 Time lapse for offloading landed fish at beach
Reduction of fish loss and incidence of spoilage by fishermen
Twenty six percent of respondents were of the view that fish loss was not an issue and
therefore did not contribute to measures loss reduction measures. Another 26% thought that if
they had extra pre-mix fuel on their fishing expeditions, losses could be minimized. 21%
thought additional ice blocks could facilitate better fish preservation and minimize loss. Other
suggestions made on possible reduction of fish loss included acquisition of new out board
engines (5%); good maintenance schedule (5%) good landing sites (5%) and spreading
catches evenly in the boat (5%) (Table 9)
Table 9 Ways of minimizing fish loss
Almost immediately
37%
About 30 mins 10%
N/A 21%
2 hours 11%
1 hour 21%
Duration of Fish at shore before sold
Strategy of reducing fish loss
Number of Respondents Percentage (%)
N/A 5 26
use more ice 4 21
good landing site 1 5
take extra fuel 5 26
new machine 1 5
evenly spread the fish 1 5

38
Fish processing, trucking, and marketing
Types of fish processing activity
Fish smoking, salting/drying and frying are the three most important fish processing methods
in the KEEA district and tend to assume near equal proportions ranging from 21% to 27%
(Figure 22).
In terms of profitability on processed fish types, most respondents were not sure which of the
major processing techniques yielded the highest profit margin. That aside, fish salting/drying
and frying were seen as being a bit more profitable (Figure 23).
Figure 22 Fish processing techniques in KEEA
frying 27%
smoking 26%
salting 26%
N/A 21%
Fish Processing Techniques
machine maintenance 1 5
Do not go far on sea 1 5
Total 19 100
39
Figure 23 Profitability of differently processed fish
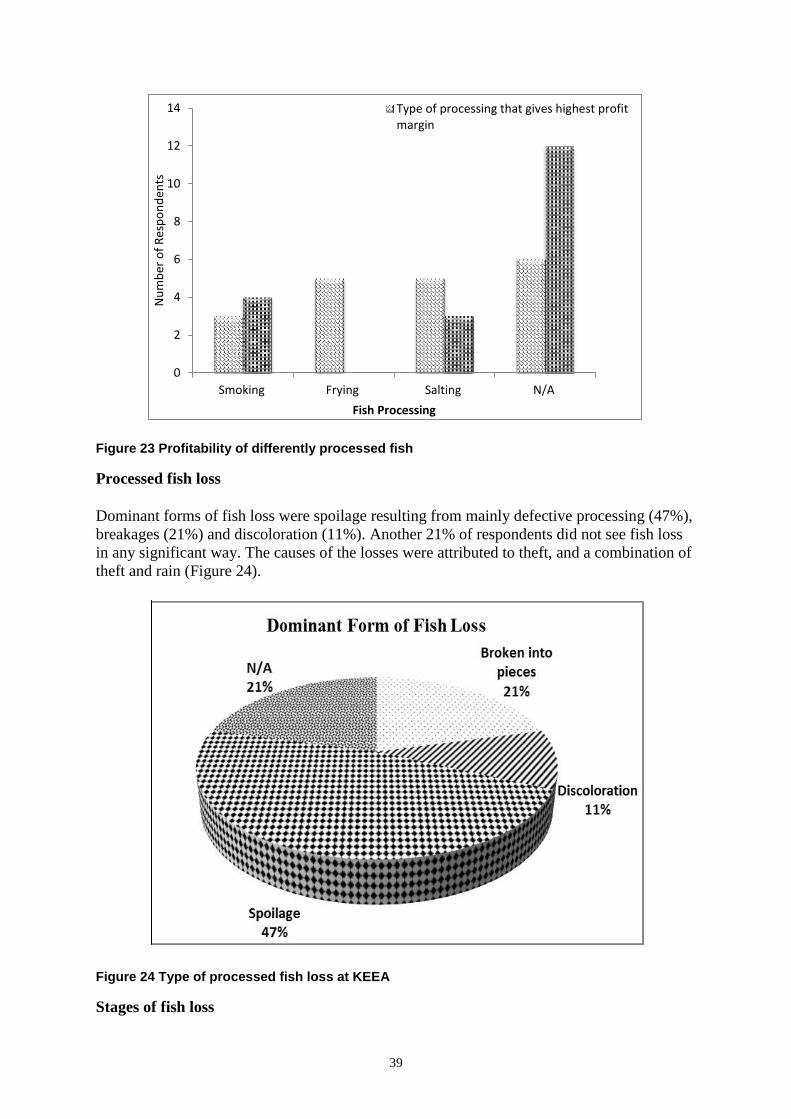
Processed fish loss
Dominant forms of fish loss were spoilage resulting from mainly defective processing (47%),
breakages (21%) and discoloration (11%). Another 21% of respondents did not see fish loss
in any significant way. The causes of the losses were attributed to theft, and a combination of
theft and rain (Figure 24).
Figure 24 Type of processed fish loss at KEEA
Stages of fish loss
0
2
4
6
8
10
12
14
Smoking Frying Salting N/A
Nu
mb
er o
f R
esp
on
den
ts
Fish Processing
Type of processing that gives highest profitmargin

40
Majority of respondents (42%) were of the view that the losses occur duing the processing
stages. 16% attributed the losses to packaging while 11% of them thought that the losses
occurred through handling at the point of sale. Those who could not attribute losses to any
particular event constituted 26% of the respondents (Table 10).
Table 10 Stages of fish loss
Fish packaging, trucking, and marketing
Packaging
Baskets and sacks are the two most important containers used for packaging fish in the
district. The additional precautions taken may include lining the baskets with paper and, or
wrapping the basket with ropes and nets.
Major markets for fish are Agona Nkwanta, Kumasi, Bogoso, Prestea, Accra and Sefwi
Bekwai. The fish is packaged in large, tagged aluminum pans and taken to the market in
trucks. The transport cost is paid in cash or on credit.
If the fishmonger decides to go to the market, she stays in the market town till the fish is sold
out. The fish can also be stored in the warehouse in an event of prolonged stay at the
marketing destination. Fish mongers always buy or sell to or from their customers, as the case
may be. When the quality of fish is not very good, they reduce the prices in order to always
retain loyalty of their clientele. If the fish is delivered to the clientele unaccompanied, the
purchased cash may be sent through mobile money transfer, other designated fish mongers or
the delivering driver.
Trucking
The fish haulage drivers also play other important roles in the marketing besides hauling the
products to the desired destinations. They recommended that packaging of fish to market be
painstakingly done to minimize losses. According to them, the most dominant form of fish
loss during transporting is breakages. Other recommendations from the haulage drivers
Stage of Fish Loss Number of Respondents Percentages (%)
Before processing 1 5
During processing 8 42
In packaging 3 16
At the point of sale / market 2 11
N/A 5 26
Total 19 100

41
include advice on the need to have the fish designated for very far destinations to be well
smoked and packaged well to avoid spoilage and losses.
Cost of transportation is always negotiated ahead of conveying the products. Agreed charges,
based on the number of parcels may be paid upfront in cash or on pro rata basis. It could also
be done on credit bases, although at such instances, the driver may request for money to fuel
the vehicle.
Marketing
Marketing of fish begins at the beach with the Konkohemaa (legally authorized chief
negotiator of prices at the landing beach). Thereafter the processors manage their own sales at
designated fish marketing centers. Markets availed to processors include Praso, Agona,
Fumso and Mankessim. Processed fish is usually sold at wholesale prices to customers.
Processors exercise the option of staying on to market any unsold fish by retailing over
several days or locking it up in safe storage and come back to it at a later time. They may also
sell it at reduced prices or even on credit depending on their schedules of activities at home.
3.2.2 Gomoa West District – Apam
There are five landing beaches in the Gomoa West district. The current study covered all the
five landing sites. They include the following: Apam main, Abra mpoano, Akoda ahenegwe,
Alata mpuano and Nana apaaenim. Two major fishing vessels operating from this location
are the canoes and the semi-industrial vessels. The industrial trawlers are not resident here
but they support the illegal vibrant by-catch trade popularly known as ‘sycho’.
Demographic Characteristics
Age

42
The ages of the fishers span five decades (22 – 60 years) with the modal class in the 4th
decade.
Education
Educational level of all practitioners is generally low along the values chain with majority of
them being middle school leavers (40%) and 26% not having had any formal classroom
education at all (Figure 25).
Figure 25 Educational level of respondents in Gomoa West District
Gear used to catch target fish
Seven main different fishing gears are employed in the fishery. Twenty percent of the fishers
employ the hook and line with between 7% – 13 % using the other fishing methods of
‘watsa’, set nets etc. (Figure 26. 80% of the fishers use the same gears throughout the year.
Period of bumper fish harvest
The bumper harvest in Central region is variously stated as being from April to July; August
to September; August to December and August but over 55% of the respondents held that the
bumper harvest is in August (Figure 26).

43
Figure 26 Fishing gear type used at Gomoa West District
Figure 27 Period of bumper harvest in Gomoa West District
Duration at sea and fish preservation time
Majority of fishermen (60%) stayed at sea for one day. This category of fishers had no need
for ice usage. 13% of respondents stayed for 5 days. Only 7% of them used iced throughout

44
the period. 60% of respondents had no use of ice for fish preservation at sea. Maximum ice
usage was by those who stayed at sea for four days. Those doing a day’s fishing trip had no
need for ice (Table 11).
In addition to the normal fishing practices in the Gomoa district, some canoes do daily trips
to offshore locations to procure juvenile fish by-catch, known locally as ‘Syco fishing’ and
land them at the various landing beaches, especially at the Apam main landing beach. This
fish comes frozen from the blast freezers of the industrial trawlers.
Table 11 Fishermen duration at sea ad fish preservation whilst at sea
Duration of fish at landing beaches
Landed fish is sold fairly rapidly and happens within 30 minutes. The actual time it takes to
dispose of all the fish is however a function of the quantum of fish landed (Figure 28).
Ways of losing the catch
The major ways by which fish is lost at sea is through theft, according to the majority of the
respondents. Other ways of fish loss are through loss of net at sea and broken nets. To others,
there are no losses incurred and therefore this does not appear to be a problem (Figure 29).
Duration on sea Maximum fish preservation time on sea
Time No. of Responses
Percentages (%)
No. of Responses
Percentages (%)
1 day 9 60 - -
2 days 2 13 1 7
3 days 1 7 1 6
4 days 1 7 3 20
5 days 2 13 1 7
N/A - - 9 60
Totals 15 100 15 100

45
Figure 28 Time lapse between landing fish ad selling out at landing beaches
Figure 29 Ways of fish loss at sea
Processing, packaging, haulage, and marketing
Processing
In principles, no fish gets discarded because it is going bad. The processors are able to gauge
the extent of deterioration and apply the appropriate processing method to it to make it
utilizable. There are three major processing methods currently in vogue in Central region.
These are respectively, smoking, salting/drying and frying. Other minor methods include
simmering and roasting. The latter two are, however, reserved for domestic usage as the life
span is relatively very short.
In the order of preference, fish smoking as processing and preservation method takes the
center-stage with about 60% of all fishes are able to be processed. Salting and frying follows
in the order of importance at 33% and 7% respectively (Figure 30). The main reason adduced
Almost immediately
87%
About 30 mins 6%
within 10 mins 7%
Duration of fish when landed before it is sold
0.0
10.0
20.0
30.0
40.0
50.0
60.0
Theft Broken nets None lost Not applicable
Pe
rce
nt
loss
Mode of fish loss

46
for choice of fish smoking is on the account of salability. Profitability is a good consideration
but majority of the practitioners prefer to keep a steady flow of business, hence the choice of
smoking as a fish processing techniques over the other methods. This is followed closely by
consideration of longevity in storage which the smoked fish provides. While salting/sun-
drying is a specialty for some fish processors, for others, the technique becomes important
when fish begins to show signs of deterioration.
Figure 30 Fish processing types and their relative importance
Packaging
Packaging forms a very important component of the profitability of the processed fish sales.
Thus the practitioners take extra care to package the fish which could be readility hauled to
the marketing centers or stored for a while; all in an effort to preserve the intergrity of the fish
and make it attractive to buyers. In the Gomoa West district, packaging of processed fish is
done in baskets and in enemel bowls. These are usually lined with brown paper and the
smoked fish painskakingly lined in a manner that allows no room for movement of the fish in
the packaging vessel thereby minimizing breakages (Plate 3).
7% 60%
33%
Type of Fish Processing
frying
smoking
salting
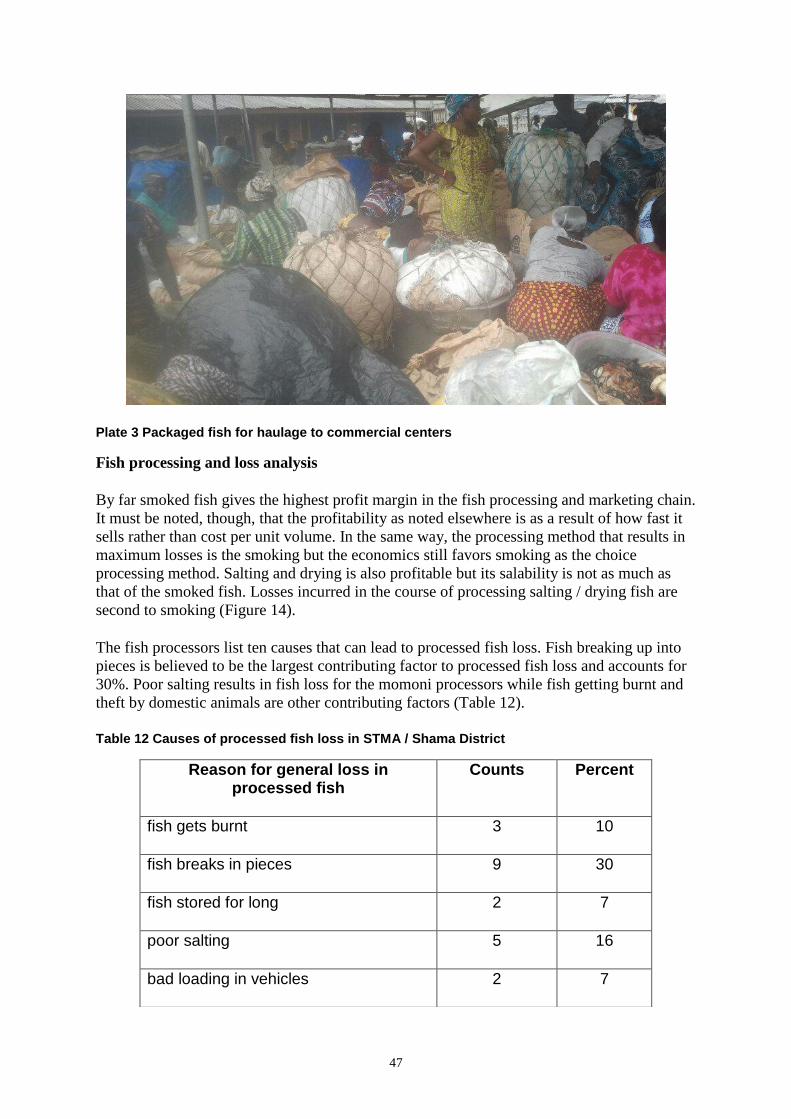
47
Plate 3 Packaged fish for haulage to commercial centers
Fish processing and loss analysis
By far smoked fish gives the highest profit margin in the fish processing and marketing chain.
It must be noted, though, that the profitability as noted elsewhere is as a result of how fast it
sells rather than cost per unit volume. In the same way, the processing method that results in
maximum losses is the smoking but the economics still favors smoking as the choice
processing method. Salting and drying is also profitable but its salability is not as much as
that of the smoked fish. Losses incurred in the course of processing salting / drying fish are
second to smoking (Figure 14).
The fish processors list ten causes that can lead to processed fish loss. Fish breaking up into
pieces is believed to be the largest contributing factor to processed fish loss and accounts for
30%. Poor salting results in fish loss for the momoni processors while fish getting burnt and
theft by domestic animals are other contributing factors (Table 12).
Table 12 Causes of processed fish loss in STMA / Shama District
Reason for general loss in processed fish
Counts Percent
fish gets burnt 3 10
fish breaks in pieces 9 30
fish stored for long 2 7
poor salting 5 16
bad loading in vehicles 2 7

48
Haulage and Marketing
Marketing of fish follows both market trends and traditions of established market links in
commercial centers. Markets trends are used especially during periods of bumper harvests
when marketing of processed fish is generally slowed down. The strategy at this point is to
hold onto processed fish in storage but when the economics do not favor the locking up of
capital for a long time, the processors look for where they can best sell their fish products. In
this case, the processors move to the markets and attempt whole sale of products or retail, as
the case may be. Losses may be incurred at this stage so the strategy will be to sell to break
even.
In normal times, marketing of processed fish follows the traditions established by fore
practitioners where the markets are established between families and known buyers, known
as customers. Such customers are always on course to receive supplies from the fish mongers
directly or through their designated agents like drivers, porters (kaya) or co-processors. The
whole exercise is based on trust and fish loss at his stage is estimated to range from low to
negligible; exceptions being through incidences of motor accidents and loss through improper
loading unto the vehicles. Losses incurred through this window are either borne wholly by
the driver at a negotiated cost and payment schedule or at a shared cost with the driver taking
between 60-70% of the agreed cost.
Cost of lifting packaged processed fish from the production centers to the marketing centers
is a function of distance and may range from GHc 3.0 to GHc 7.0 per package of at least two
baskets tied together or an enamel bowl packed to at least two times the normal height.
delay in delivery / vehicle accident 1 3
fish keeps long before processing 3 10
not stored well 1 3
theft by humans 2 7
theft by domestic animals 2 7
Total 30 100

49
3.3 Greater Accra Region
The SNV post-harvest loss study in the Greater Accra region covered 10 landing beaches in
five out of the eight coastal districts. The intention was to cover the entire fishing areas in
Accra and the Tema areas. The location of landing beaches in the Districts is presented in
Table 13.
Table 13 Location of landing beaches
Region District Landing Beach
Greater Accra Region Ningo/Pampram
Pampram
Ningo

50
3.3.1 Team Metro, Accra Metro, and Ga South District
Demographic Characteristics
Age
The ages of fishermen, fish mongers and processed fish haulage drivers in three districts of
Greater Accra region; Tema metropolitan area, Ga Central and Ga South districts spans 5
decades in the age groups of 20 to 59 years. Among the fishermen, the age group of 40 to 49
years dominates at 63%. This is followed jointly by the age groups of 50-59 years and 30-39
years at 16.5%. Among the fish processors, the younger age group of 30 – 39 years
dominates at 54% and it is followed by the age group of 50 – 59 years of the respondents
sampled. All the drivers fall within the age group of 20-49 years and with those in the age
group of 30 -39 years forming as much as 60%.
Table 14 Age profile of fishermen, fish mongers and drivers
Ahwiam
Nmetsokope
Kponkpo
Kpone Katamanso Kpone
Tema Metro Tema Fishing harbor
Accra metro Chorkor
Ga South Bortianor
Fishermen Fishmongers / Buyers Drivers of Vehicles
Age No. of Respons
es
Percent
(%)
No. of Respons
es
Percent
(%)
No. of Respons
es
Percent
(%)
20 – 29 years
1 4 1 4 1 20
30 - 39 years
4 17 13 54 3 60
40 - 49 years
15 63 4 17 1 20
50 -59 years
4 16 5 21

51
Gender
Fishing activities are wholly executed by males while fish mongering is undertaken wholly
by females. The drivers are also all males.
Education
The fisheries practitioners are fairly well educated in the Greater Accra region as 33% of
fishermen possess tertiary degree qualifications. 25% of the respondents possess secondary
education while 33% of them have middle school/JSS standard of education. Among the fish
mongers, as much as 71% have attained the Middle school/JSS level of education. 60% of the
drivers also have Middle school/JSS standard of education. Those with no formal class room
educational qualifications among the fishermen, fish mongers and the drivers are respectively
5%, 21% and 20%.
Table 15 Educational level of respondents
Months of bumper harvest and high fish transport
Above 60 years
1 4
Totals 24 100 24 100 5 100
Fishermen Fishmongers / Buyers
Drivers of Vehicles
Educ. No. of Respon
se
Percent (%)
No. of Respon
se
Percent (%)
No. of Respon
se
Percent (%)
None 1 5 5 21 1 20
Middle/JSS
8 33 17 71 3 60
Secondary
6 25 2 8 1 20
Tertiary 8 33
N/A 1 4
Totals 24 100 24 100 5 100

52
Fishing takes place at all times of the year. However, July-August is perceived by most
fishermen to be the bumper harvest. Others list August - December and July - September as
the most productive periods in the fisheries. The period that marks greatest haulage of
processed fish to other parts of the country is given as July – December. Correspondingly,
fishermen record most fish sales in August and September (Figure 31).
Method of fish preservation at sea
In the Greater Accra region, as much as 42% of the fishers employ the use of freezers and
other coolers mounted in their vessels to preserve their catches prior to marketing. 37% of
them use ice blocks while only 21% of them do not use any form of preservation of fish at
sea.
Figure 31 Months in which most fish is marketed
Table 16 Preservation of fish at sea
Fishermen duration at sea and fish preservation time lag whilst at sea
August/ September
42%
August - October 4%
August - December
25%
July - September 17%
July - August 12%
Month in which most fish are bought
Preservatives Number of Respondents Percentage (%)
Ice Blocks 9 37
No Preservation 5 21
Freezer or coolers in
Vessels
10 42
Total 24 100

53
Fishermen operating in the Accra and Tema metropolis spend comparatively longer periods
of time at sea. On the average, between 12 hours and two months are spent on sea fishing,
according to the survey (Table 17).
The time spent at sea also has cost implications on the preservation of fish. While monetary
terms cannot be applied to the cost incurred in fish preservation at sea, the view of most of
the respondents is that maintaining freezers at sea present highest cost in fish preservation.
This is followed by transport and use of ice blocks at sea. 24% of the respondents did not
need to preserve their catches and therefore incur no cost on fish preservation (Table 6).
Table 17 Duration of stay at sea and fish preservation time
Table 18 Relative cost of preserving fish at sea
Duration on sea Maximum fish preservation time on sea
Time No. of Responses
Percentages (%)
No. of Responses
Percentages (%)
12 hours
5 21 1 4
1 day 5 21 4 17
2 days 1 4 2 8
3 days 3 12 3 12
1 Months
1 4
2 Months
9 38 8 33
N/A 3 12
As long I stay at sea
3 12
Totals 24 100 24 100
Preservatives Number of Respondents Percentage (%)
Ice Blocks 7 29

54
Duration of fish at landing beach before it is sold
The time spent at landing beach or the fishing harbor before fish is sold out ranges from 30
minutes for the small canoes to two hours for the large industrial vessels. 71% of respondents
spend about 1 hour 30 minutes (Table 19).
Table 19 Time lapse between landing fish and selling out
Fish species landed and sold at bumper harvest
Many species of fish are landed during the bumper harvest in the Accra/Tema metropolis.
The major species landed include the sardines: Sardinella eba (flat sardines) locally called
Antebo; Sardinella aurita (round sardines) locally called Kankama; the mackerels: Scomber
japonicas (chub mackerel) called locally as Saman; the tunas: Thunnus albacore (yellow fin
tuna) also called Odaa in Ga and the African moon fish: Selene dorsalis; called Antele wawaa
in Ga. All the seven major fish species are found in landings from July to September. The
anchovies are perceived as the most profitable of the fish catches. This is followed by the
mackerels, and tunas in that order (Figure 32).
Fish losses occur in the fishing operations through a variety of ways. These include attack on
net by sharks and dolphins, broken nets, thefts, malfunctioning freezers and strong currents at
sea. Local knowledge to addressing the issues related to the fish loss include adoption of
more stringent security measures, use of stronger nets and making effort at keeping the
freezers in good state of repair at all times.
Ways of losing catch at sea
While loss of fish was not perceived as a major problem at sea, dolphin and shark attacks
were recorded as the main cause of fish loss. Broken nets and theft followed at the same
level. Current was also thought to be a factor leading to loss of fish at sea (Figure 33).
Freezer 11 46
N/A 6 25
Total 24 100
Time Number of Respondents Percentage (%)
30 mins 3 13
1 hour 2 8
1 hour 30mins 17 71
2 hours 2 8
Total 24 100

55
Figure 32 Major fish landings during the bumper harvest
Figure 33 Causes of fish loss at sea
Reduction of fish loss and incidence of spoilage by fishermen
Majority of the fishermen (29%) were of the opinion that losses at sea could be eliminated or
reduced substantially if they could keep their freezers in a state of repair at all times. Equal
numbers of fishers thought that the use of stronger nets could thwart the attacking efforts of
the sharks and dolphins and keep their fishes safe. Use of more ice at sea was also cited
among others (Table 20).

56
Table 20 Reduction of fish loss and incidence of spoilage by fishermen
Fish Processing
All the fish processors interviewed in the Accra / Tema metropolis were fish smokers. Some
of them have salting / drying capabilities but they do not consider themselves as ‘momoni’
processors. Reasons given for choosing fish smoking over the other processing techniques
include considerations of profitability and customer preference (Table 9).
Fish species difficult to process
While almost any type of fish landed may be smoked, the view held by the processors is that
the tuna are very difficult to process due to such reasons as it being too oily or too fleshy. In
the order of ranking, the tunas, anchovies and the African moon fish are respectively most
difficult fishes to process while the sardines and the mackerels are the easiest to smoke
(Table 21).
Table 21 Reason for preferred fish processing technique
Table 22 Fish species difficult to process
Strategy Number of Respondents Percent (%)
good security against theft 1 4
use more ice 6 25
Good observation and stronger nets 3 13
freezer working all times 7 29
use of stronger net 7 29
Total 14 100
Reasons Number of Respondents Percentages (%)
Sells faster 3 13
Easier to process 1 4
Customer’s Preference 5 21
Profitable 14 58
Used to this method 1 4
Total 24 100

57
Fish processing techniques with highest profit margins and losses
Ostensibly because fish smoking has been the processing techniques being practiced in these
areas, the mastery of best practices seems to have been acquired and consequently high
profitability assured. Compare to the other fish processing techniques, the respondents
believe that fish smoking gives the best returns on their investments. Notwithstanding, 84%
of them also believed that fish smoking elicits the highest losses during processing (Table
23).
Table 23 Fish processing techniques which result in losses
Dominant stage of fish loss
Fish losses do occur through such ways as theft at landing beaches, burning during smoking,
in packaging, in storage or during transportation. The general view expressed is that the mode
of loss encountered is largely a function of the expertise level of the fish monger. However,
because the methodology used to catch the fish has some inference on the post-harvest life of
the fish, the quality of the fish manifests during the smoking period and consequently during
packaging and at the point of sale in that order (Table 24). Generally, the losses incurred at
the processing stage results from burning and breaking during smoking. The consequence of
this is that it cannot keep for too long before it begins to show signs of spoilage, discoloration
and general deterioration in form and quality (Table 25).
Local Name of Fish Species Number of Respondents Percentages (%)
Tuna 11 46
Sardine 2 8
Mackerel 3 13
Anchovies 4 17
Moon fish 4 17
Total 24 100
Processing Technique Number of Respondents Percentages (%)
Smoking 20 84
Freezing 1 4
Frying 1 4
Drying 2 8
Total 24 100

58
Table 24 Stages of fish loss
Table 25 Dominant form of fish loss
Packaging, haulage and marketing
Packaging
The overwhelming majority of fish smoking processors (88%) employ the use of brown
paper-lined baskets in packaging. Very few of the fish mongers will package the fish directly
in the basket; usually in smaller baskets (Table 26).
Haulage
Stage of fish loss Number of Respondents Percentages (%)
At the landing site 3 13
Before processing 2 8
During processing 8 33
In storage 2 8
In packaging 4 17
In transport 2 8
At the point of sale / market 3 13
Total 24 100
Form of fish loss Number of Respondents Percentages (%)
Broken into pieces 4 17
Discoloration 8 33
Spoilage 11 46
N/A 1 4
Total 24 100

59
Road trucking of processed fish employs two sets of vehicles; the medium size 3-tonner KIA
trucks and the huge 5-tonner trucks, depending on the distance, quantum of the load and
whether the packages are in smaller baskets or in large baskets.
Marketing
Marketing centers are many but the bulk of the products are marketed locally with the
Accra/Tema metropolis, including Ashiama, capturing as much as 38% of the market. 25% of
the fishmongers market their produce in Techiman. Other marketing centers include Sunyani,
Kumasi, Takoradi, Kasse, Mamprobi and Denu (Figure 34). Significantly, the haulage trucks
that convey the processed fish to the marketing centers come back with new baskets. Table 26 Types of packaging techniques
Fish Packaging Number of Respondents Percentages (%)
In basket 1 4
Basket covered with paper 21 88
In basket and sacks 1 4
In basket with net wrapped around
1 4
Total 14 100
Figure 34 Major market destinations
Ashiaman 17%
kumasi 9%
Techiman 25%
Sunyani 8%
Tema 4%
Accra 17%
Kasseh 4%
Denu 8%
Takoradi 4%
Mamprobi 4%
Major Marketing Centres

60
3.3.2 Kpone / Katamanso District
One landing beach was studied in the Kpone / Katamanso District. The rationale was to cover
as many districts to be able to learn of disparities, if any, of the mode of operations and to
access how the fishing practices are faring there. Two fishermen and two fish mongers were
interviewed from the Kpone-on- sea landing beach.
Demographic Characteristics
Gender
All the fishermen boat/canoe owners in this district were males while the fish processors and
the mongers were women.
Age
The ages of the all the respondents ranged from 32 years to 45 years.
Education
Educational level was low for all the fishermen with highest classroom educational
qualification not exceeding the Middle school level.
Time spend at sea depends on the type of vessel used. The local canoes spend between six
hours and one day. In extreme cases, they may spend up to two days. Ice is carried along to
preserve fish whenever they intend to stay overnight.
The period of highest fish landings was given as July to September and July to December.
The major type of fish landed during this period is kankama, antebo, saman, tuna, mackerel
and African moonfish. It takes not more than two hours to evacuate the catches and sell off
the fish in normal times. During the bumper harvest the time may be prolonged but no fish is
discarded as having gone bad.
Processing Haulage and Marketing
Fish smoking is the main fish processing practice in this community. All kinds of fishes are
smoked but the commonest among them are the mackerels, anchovies, sardines, African
moonfish, doctor fish and sole.
Fish salting / drying is the second most important fish processing practice. As a matter of
principles in the business, no fish is considered wasted. Any ones showing signs of early
deterioration is quickly salted and processed into ‘momoi’.
Designated marketing centers for the fish processors in this community are Techiman,
Takoradi, Kumasi and Denu. Fish haulage is by small and large trucks. The packaging is
done in big baskets and sometimes aluminum bowls. They are securely covered with brown
paper and tied up.
The women may or may not accompany the processed fish to the marketing centers. When
fish has to be transported without the processors, the latter follow up later or drivers are
instructed to deliver them to their ‘buyers, usually called ‘customers’. There are usually no
losses in the transportation and handling at the delivery centers.
3.3.3 Ningo/Pampram District
The survey in the Ningo/Pampram covered the landing beaches in Lower Prampram, Ningo,
Ahwiam, Kponkpo and Nmetsokope. 20 people comprising of ten fishermen, five processors
and fiver fish haulage drivers were interviewed in this community.
Demographic Characteristics
Age
The ages of respondents ranged from 25 years to 68 years. The female processors were
comparatively older than the male fishing group. The drivers were all in the age group of 30-
40 years.
Education
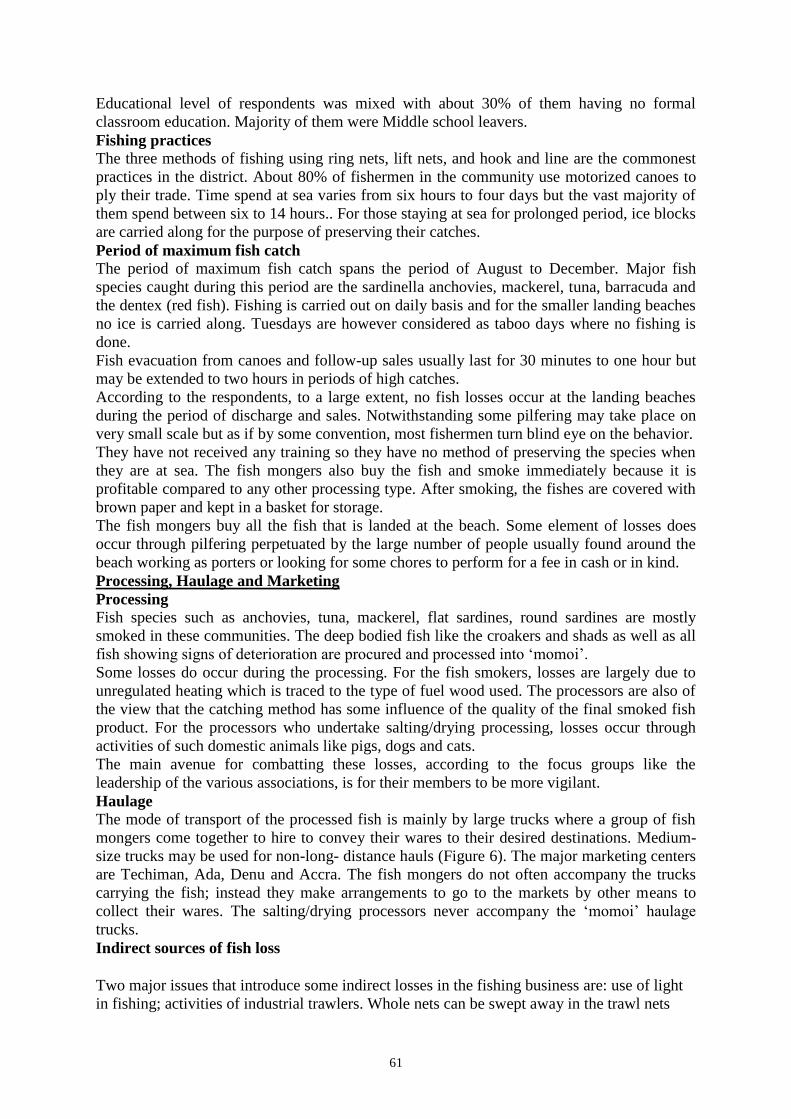
61
Educational level of respondents was mixed with about 30% of them having no formal
classroom education. Majority of them were Middle school leavers.
Fishing practices
The three methods of fishing using ring nets, lift nets, and hook and line are the commonest
practices in the district. About 80% of fishermen in the community use motorized canoes to
ply their trade. Time spend at sea varies from six hours to four days but the vast majority of
them spend between six to 14 hours.. For those staying at sea for prolonged period, ice blocks
are carried along for the purpose of preserving their catches.
Period of maximum fish catch
The period of maximum fish catch spans the period of August to December. Major fish
species caught during this period are the sardinella anchovies, mackerel, tuna, barracuda and
the dentex (red fish). Fishing is carried out on daily basis and for the smaller landing beaches
no ice is carried along. Tuesdays are however considered as taboo days where no fishing is
done.
Fish evacuation from canoes and follow-up sales usually last for 30 minutes to one hour but
may be extended to two hours in periods of high catches.
According to the respondents, to a large extent, no fish losses occur at the landing beaches
during the period of discharge and sales. Notwithstanding some pilfering may take place on
very small scale but as if by some convention, most fishermen turn blind eye on the behavior.
They have not received any training so they have no method of preserving the species when
they are at sea. The fish mongers also buy the fish and smoke immediately because it is
profitable compared to any other processing type. After smoking, the fishes are covered with
brown paper and kept in a basket for storage.
The fish mongers buy all the fish that is landed at the beach. Some element of losses does
occur through pilfering perpetuated by the large number of people usually found around the
beach working as porters or looking for some chores to perform for a fee in cash or in kind.
Processing, Haulage and Marketing
Processing
Fish species such as anchovies, tuna, mackerel, flat sardines, round sardines are mostly
smoked in these communities. The deep bodied fish like the croakers and shads as well as all
fish showing signs of deterioration are procured and processed into ‘momoi’.
Some losses do occur during the processing. For the fish smokers, losses are largely due to
unregulated heating which is traced to the type of fuel wood used. The processors are also of
the view that the catching method has some influence of the quality of the final smoked fish
product. For the processors who undertake salting/drying processing, losses occur through
activities of such domestic animals like pigs, dogs and cats.
The main avenue for combatting these losses, according to the focus groups like the
leadership of the various associations, is for their members to be more vigilant.
Haulage
The mode of transport of the processed fish is mainly by large trucks where a group of fish
mongers come together to hire to convey their wares to their desired destinations. Medium-
size trucks may be used for non-long- distance hauls (Figure 6). The major marketing centers
are Techiman, Ada, Denu and Accra. The fish mongers do not often accompany the trucks
carrying the fish; instead they make arrangements to go to the markets by other means to
collect their wares. The salting/drying processors never accompany the ‘momoi’ haulage
trucks.
Indirect sources of fish loss
Two major issues that introduce some indirect losses in the fishing business are: use of light
in fishing; activities of industrial trawlers. Whole nets can be swept away in the trawl nets

62
whenever thy come inshore to fish the pelagics which is forbidden for them to do. In the case
of the light fishing, it is believed that the lighting cause the fish to aggregate around those
areas where lights are being used thereby denying them access to fish. This is in addition to
biologically destroying the fishery by attracting the non-target juvenile fishes and killing
them.

63
3.4 Volta Region
The main fishing practice in the Volta region is the beach seine. While this fishing technique
is officially outlawed in the country because its tendency to sweep out juvenile fishes from
large areas of the near shore, its application is very widespread and has become synonymous
with the presence of one particular ethnic community.
As traditional regulatory and conservation measure, Volta region has instituted taboo days for
all the landing beaches. Three days, Sunday, Tuesday and Wednesdays are variously
observed by the landing beaches in the Keta district while South Tongu district observe
mixed days of the week.
The study covered fourteen out of twenty five landing beaches in the two coastal districts of
the Volta region. Eight beaches were studied in the Keta district while five were selected
from the Ketu South district. Details of the landing beaches in the respective districts of Keta
and Ketu South districts are presented in Table 27.
Table 27 Fish landing beaches in Keta Metro and Ketu South District
Region District Major fishing towns
Landing beaches
Taboo days
Volta Keta Abutia
Abutiakope Wednesday
64
3.4.1 Keta District
Demographic Characteristics
Age
The ages of the fishermen interviewed fell within 30 and 59 years with the modal class in the
40 – 49 year group. Similarly, the ages of the divers were in the range of 30 – 59 years. 36%
of them were in the age group of 40 – 49 years. While the ages of the fishmongers also in the
range of 30 – 59 years, majority of them (36%) were in the age group of 50- 59 years (Table
28).
Gender
All the fishermen and the drives were males. On the other hand, it was observed that some
males were also into fish processing.
Education
The educational level of the fisheries practitioners are general low. 64% of the fish mongers
had no formal classroom education. While 22% have only middle school level education.
With the fishermen, only one person (7%) had secondary education. The remaining had only
middle school qualification (Table 28).
Adzido Adzido Wednesday
Dzekukofe Dzekukofe Wednesday
Kedzi Sunday
Kedzikofe Wednesday
Tegbi Tegbi Sunday
Tetekope Tetekope Sunday
Vodzah Vodzah Sunday
Ketu South Denu Adafianu Wednesday
Denu Nil
Hedzranawo Sunday
Viefe Sunday
Aflao Atorkukope Friday

65
Table 28 Age distribution of respondents
Table 29 Educational level of respondents
Months of bumper harvest and high fish transport
In normal years, the periods of highest fish catch occurred in June and July and from
September and October. The corresponding period of highest fish transport is in August to
October. The month of highest fish marketing was recorded as June and July (Figure 35).
Fishermen Fishmongers / Buyers Drivers of Vehicles
Educ. No. of
Response
Percent
(%)
No. of
Response
Percent
(%)
No. of
Response
Percent (%)
None - - 9 64 - -
Middle/JS
S
13 93 3 22 8 57
Secondary 1 7 - - 2 14
N/A 2 14 4 29
Totals 14 100 14 100 14 100
Fishermen Fishmongers / Buyers Drivers of Vehicles
Age No. of Response
s
Percent (%)
No. of Response
s
Percent (%)
No. of Response
s
Percent (%)
30 - 39 years
4 29 3 21 2 14
40 - 49 years
7 50 4 29 5 36
50 -59 years
3 21 5 36 3 21
N/A - - 2 14 4 29
Totals 14 100 14 100 14 100

66
Figure 35 Period of bumper harvest and most fish transport
Method of fish preservation when at sea
Essentially because of the type of fishing practices prevailing in the Volta region requirement
for ice as a fish preservative is very low. 93% of respondents did not require ice at ice. Only
7% claimed to have need for use ice at sea. Even at that the total duration of stay at sea did
not exceed three hours in all instances. 50% stayed at sea on any fishing day for not more
than 6 hours (Table 30).
When the fish had landed at the beach, 86% of respondents said they disposed of all their
catches within one hour. The remaining 14% disposed of all catches within two hours (Table
31).
Table 30 Fishermen duration at sea and fish preservation at sea
Duration on sea Maximum fish preservation time on sea
Time No. of Responses
Percentages (%)
No. of Responses
Percentages (%)
12 hours
1 7.1
6 hours
7 50
9 hours
2 14.3
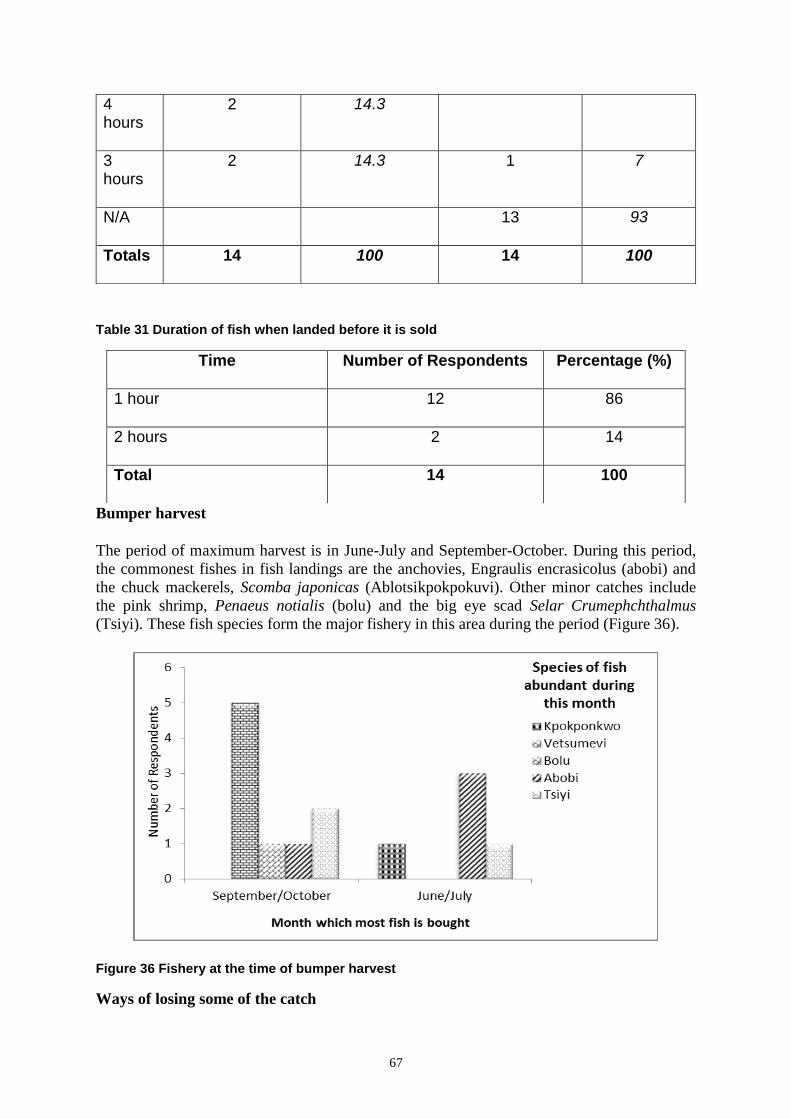
67
Table 31 Duration of fish when landed before it is sold
Bumper harvest
The period of maximum harvest is in June-July and September-October. During this period,
the commonest fishes in fish landings are the anchovies, Engraulis encrasicolus (abobi) and
the chuck mackerels, Scomba japonicas (Ablotsikpokpokuvi). Other minor catches include
the pink shrimp, Penaeus notialis (bolu) and the big eye scad Selar Crumephchthalmus
(Tsiyi). These fish species form the major fishery in this area during the period (Figure 36).
Figure 36 Fishery at the time of bumper harvest
Ways of losing some of the catch
4 hours
2 14.3
3 hours
2 14.3 1 7
N/A 13 93
Totals 14 100 14 100
Time Number of Respondents Percentage (%)
1 hour 12 86
2 hours 2 14
Total 14 100

68
Fish losses in their operations are not considered a major issue. When it does happen, it is
either part of the net is torn or the fish simply manages to jump out of the encircling net
(Figure 37).
Ways of reducing fish loss at sea
The way the problem of fish loss at sea, if they do occur, is to inspect the nets when they are
back at the shore and mend them. Furthermore, they could be more vigilant at keeping the
fishes in the water at sea. (Table 37).
Figure 37 Sources of fish loss at sea
Table 32 Reduction of fish loss by fishermen
Fish Processing, Packaging, Haulage and Marketing
Fish processing
The main fish processing activity in the fishing communities in the Keta districts are smoking
and salting / drying. In event of bumper harvests, fish may be preserved by freezing prior to
processing. The respective proportions of processing types of smoking, salting/drying and ice
Strategy Number of Respondents Percentage (%)
Repair of nets 5 36
Keep fish in the net whiles at sea 1 7
No loss of fish 8 57
Total 14 100

69
preservation are 72%, 14% and 7%. 7% of the respondents do not specialize in any of the
techniques (Figure 38).
Choice of preferred processing technique
The choice of methods of fish processes is informed by the ease of processing and longevity
in storage. Others do the smoking processing because they have inherited it from the earlier
generations (Table 33).
Fish species difficult to process
Tsivi or the big eye scad is the most difficult to process. This is followed by hawui (crabs)
and the chuck mackerels, Kpokpokuvi. All the other species require the same effort to
process (Table 34).
Figure 38 Fish processing and preservation techniques
Table 33 Reason for preferred fish processing technique
Reasons Number of Respondents Percentages (%)
used to this method 2 14
easier to process 5 36
can be stored for long 5 36
N/A 2 14
Total 14 100

70
Table 34 Effort level of fish species’ processing
Fish loss during processing
Nine out the 14 respondents (64%) do not lose any fish from processing to marketing. Among
those who lose some fish, the loss occurs during processing or in haulage. Whenever there is
any fish loss during processing, it is assumed to have been perpetuated through petty
thieving, cats and in extreme cases, rainfall (Figure 39).
Figure 39 Dominant forms of fish loss
Packaging and Haulage
Local Name of Fish Species
Number of Respondents
Percentages (%)
Kpokponkuvi 2 14
Tsiyi 5 36
Bolu 1 7
Mpayi 1 7
Hawui 3 21
Abobi 1 7
N/A 1 7
Total 14 100

71
The majority of fish processors (85%) package their processed fish in baskets. While majority
of them pack fish directly into the baskets, a few of the line the baskets with paper before
packaging. Yet another small group (7%) may package the fish in baskets and in sacks (Table
9). The choice of packaging type is informed by the distance travelled to the marketing
centers. Thus, the longer the distance to traverse, the more sophisticated the packaging.
Usually small vehicles are used to cart fish to the fish marketing centers, essentially because
of the relatively shorter distances covered. Such vehicles include mini busses, pick-ups and
taxis among others.
Fish marketing
Fish products are marketed largely within the Volta region. For example, among the
respondents from the Keta municipality, the furthest fish is hauled is said to be Aflao, a
distance of just 15 kilometers. Other marketing centers are Denu and Anloga. 36% of the
processors market their products in Keta (Figure 40).
Table 35 Packaging types for processed fish
Fish Packaging Number of Respondents Percentages (%)
In basket 9 64
Basket lined with paper 3 21
In basket and sacks 1 7
N/A 1 7
Total 14 100

72
Figure 40 Major market destinations for processed fish
3.4.2 Ketu South District
Demographic Characteristics

73
Age
Analysis of the ages of the fishermen, the fish mongers and fish haulage divers show the ages
structure to span five decades; from the thirties to the seventies, with a minimum of 32 years
and a maximum of 76 years. The mean age was recorded at 52.07 years. The modal age was
56 years.
There was skewness in the age structure of the male and female fisheries practitioners at
0.339 and showed the female processors to be slightly older than the male counterparts
(Table 36).
Table 36 Age structure of fisheries practitioners in Ketu South
Gender
All the fishing groups were males. The drivers were also all males. The processors were a
mixed gender represented approximately at 1male to 9 females. The profile of the local
processors association executives is presented in Plate 4.
N 20
Mean 52.07
Median 52.00
Mode 56
Skewness 0.339
Minimum 32
Maximum 76

74
Plate 4 Mixed gender fish processors in the Ketu South district
Education
The educational background spanned the maximum range of no formal classroom education
to tertiary level training. Nonetheless the majority of them were middle school leavers (56%)
with 1in 24 (6%) having a tertiary level education. 25% of them had not been to school
before (Figure 41).

75
Figure 41 Education level of fisheries practitioners
Fishing practices
The main fishing practice in use in this district is the beach seine or the drag net, known
locally as Yevudor (Plate 5). Other practices are the ring net (Watsa) and rift net (Toga).
Irrespective of the fishing practice, the main fishing economic unit is the locally made
wooden boats operated by outboard motors.
Drag net operatives ply their trade in the nearby shallow coastal area by encircling very large
and dragging the net ashore with the catch entrapped in it. Fish is not emptied into the boat at
shore. Catches may be sold directly from the net at the beach or from the sandy ground.
The ring net boats and rift net boats operate in deep waters and therefore spend a lot more
time at sea. Fish catches comprise of the slightly mature pelagics as against the usually
smaller juvenile pelagics landed by the beach seine.
Plate 5 Drag net (Yevodor) operation at landing beach
Periods of maximum catch and fish landings
The major fishing seasons in this location occurs in May/June and August - October. It is
believed that the bumper harvest hovers around these months and that there is the likelihood
of an early or late start. The main fish species landed during the bumper harvest are the
anchovies, Engraulis encrasicolus, chuck mackerels, Scomba japonicas and the sardines,
Sardinella aurita (round sardines) and Sardinella eba (flat sardines). Each species is
harvested for a period within the season. The tuna, Thunnus albacore (Yellow fin tuna) is
landed throughout the year.

76
In terms of profitability, the sardines and anchovies are the most important catches. However,
about 50% of respondents were of the opinion that there were no marked differences in the
price of the different fish species (Figure 42).
Fish landings take approximate 30 minutes to one hour to evacuate landing crafts and another
one to two hours to sell off the fish catch. Fish loss at the landing beaches is thus
insignificant.
Figure 42 Catch analysis of fish species (in terms of cost)
Fish loss
Three major ways by which fishermen lose fish are: breakage of collecting bag on the net;
delay in sales; pilfering. The fourth way is seen to be a combination of the three main factors.
The respondents assign equal weighting to all the four different ways of fish loss (Figure 43).
The ingenious ways devised to arrest the problems include frequent replacement of the
collecting sack, being more vigilant of the pilfering and getting more buyers.
Local knowledge from the drivers intended to help to reduce fish loss during transportation
include suggestions to tie-up packaged fishes very well, and the use of smaller baskets in
packaging.
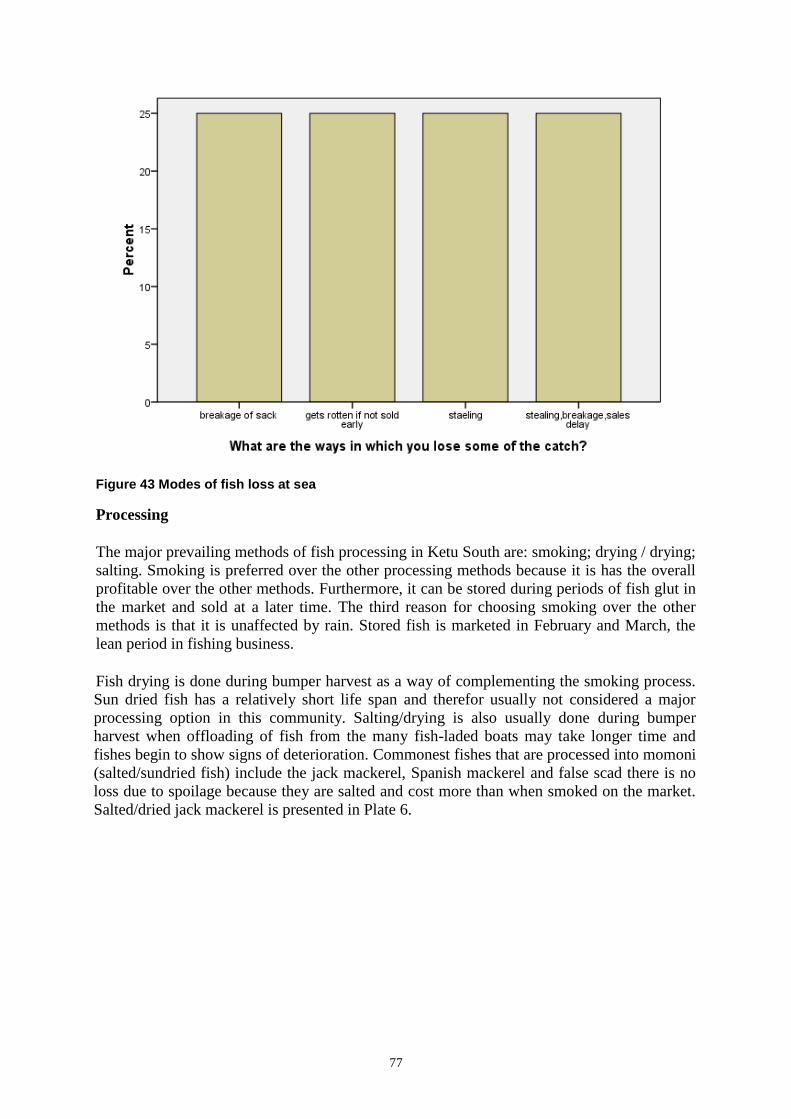
77
Figure 43 Modes of fish loss at sea
Processing
The major prevailing methods of fish processing in Ketu South are: smoking; drying / drying;
salting. Smoking is preferred over the other processing methods because it is has the overall
profitable over the other methods. Furthermore, it can be stored during periods of fish glut in
the market and sold at a later time. The third reason for choosing smoking over the other
methods is that it is unaffected by rain. Stored fish is marketed in February and March, the
lean period in fishing business.
Fish drying is done during bumper harvest as a way of complementing the smoking process.
Sun dried fish has a relatively short life span and therefor usually not considered a major
processing option in this community. Salting/drying is also usually done during bumper
harvest when offloading of fish from the many fish-laded boats may take longer time and
fishes begin to show signs of deterioration. Commonest fishes that are processed into momoni
(salted/sundried fish) include the jack mackerel, Spanish mackerel and false scad there is no
loss due to spoilage because they are salted and cost more than when smoked on the market.
Salted/dried jack mackerel is presented in Plate 6.

78
Plate 6 Salted / dried Jack Mackerel (Momoni)
Preservation and Storage
There are a variety of ways by which processed fish is stored in the Ketu South district. They
include short term and long term measures. For the short term storage, fish may be smoked
dry and packaged in brown paper-lined baskets and securely tied. It may also be left to
simmer gradually on smoking ovens under very low intense heating. Others sprinkle ground
dry pepper over the packaged fish and left in cool storage. For long term storage, preparation
includes well-packaged fish covered with sacks (Plate 7). Packages are placed in windowless,
non-ventilated room with single door which remains closed for the entire period of storage.
Life span is said to be anything between four to six months.

79
Plate 7 Sack covered packaged fish for long tem storage
Packaging, haulage, and marketing
Packaging
Fish from this community is usually packaged in baskets after processing. The baskets may
be lined with brown paper before packaging. One packaged load may comprise of two
baskets joined gape to gape and fastened together with ropes (Plate 8).
Plate 8 Packaged processed fish for road trucking
Haulage
Transportation of processed fish makes use of taxis, vans and smaller haulage trucks. On the
other hand Denu serves as a very important fish market and receives processed fish supply
from a great number of destinations. These other destinations include locations in the Keta
District, Ada, Tema, Accra, Cape Coast, Axim and Half Assini. Transportation from Keta
District and other parts of the Ketu District other than Denu is done by mini buses and

80
taxicabs while fish from Denu fishing communities are transported by head porters and truck
pushers. Taxi cabs also play a major role in the short distance haulage.
Marketing
Fish markets are relatively closer to the producing centers with Ho being the furthest
destination. Denu market serves as a transit point to other locations outside the country
including; Lome in the Republic of Togo and Benin City in Benin Republic. Processed fish is
done in the open markets by the fish mongers or are sold wholesale to designated buyers.
4.0 SUMMARY, CONCLUSIONS, AND RECOMMENDATIONS
4.1 Summary
Ghana’s four coastal regions comprise of a total of 47 coastal district and 228 landing
beaches. The SNV post-harvest loss reduction study was conducted in 47 landing beaches in
13 districts between August and September, 2015.
The patrons of the industry are largely middle-aged to old practitioners with ages ranging
between 22 to 70 years and averaging around 50 year for the exclusively male fishing
practitioners and several years more for the predominantly female processors.
Knowledge base of the practitioners is excellent in every respect in the practice of their trade
but lends very little support for innovation in the industry essentially because it is, to a very
large extent, oral tradition-based rather than being based on training and novelty.
Formal classroom educational level of practitioners is low and averages at middle school/JSS.
Notwithstanding, there is a demonstrable evidence of ingenuity to the overall execution of the
fishing and processing trade.
Fishing practices include the beach seine, set nets (rubber net) Ali (encircling net), Poli
(encircling net with fine-mesh net at base), Watsa (ring net) and hook & line. Unconventional
methods like light fishing, chemical fishing and use of dynamite are also in use at some
landing beaches.
Industrial trawlers support an illegal but vibrant pelagic by-catch fishery known locally as
‘syco’.
The variety of methods appears to have cultural antecedents with certain ethnic groups being
associated with particular fishing methods.
For some of the fishing groups, the quest for good fish catch appears to take precedent over
observance of the governing fisheries regulatory laws as manifests in the use of the illegal
fishing methods.
Fishing expedition, on the average lasts for less than 24 hours for the outboard motor
propelled canoes. The fishermen’s use of ice at sea as a preservative ranges from minimal to
nonexistence.
Periods of maximum fish catch (bumper harvest) vary from one region to the other but
largely center around July to October.

81
Marketing of landed fish does not last for more than two hours in all the landing beaches. Ex-
landing beach sales are conducted by the fishermen and prices vigorously negotiated for by
the Konkohemaa (legally approved sales superintendent for the community).
Extent of losses incurred by fishermen at sea and during processing in terms of volume and
cash, at this juncture, is not quantifiable because expression of losses along the value chain is
more qualitative; and generally expressed as being minimal or negligible.
Fish mongering involves largely women who learnt the trade from their elder peers or
departed parents. No effort seems to be made at attracting young educated individuals into
the trade.
Production methods, especially the salting/drying, operate under conditions that are generally
not environmentally acceptable. Nevertheless, it is good to note that in very few places, salted
fish is dried on platforms.
Haulage of usually well packaged processed fish is by a variety of vehicles ranging from
small saloon taxi cubs to huge cargo trucks driven by relatively younger drivers. Cargo is
usually transported and delivered to designated markets un-accompanied.
Marketing of processed fish is based on trust reposed in hauling drivers, porters and known
buyers instead of a search for excellence.
4.2 Conclusions
Fishing exploitation is all-year round in all the 47 coastal districts of the country using three
major fishing vessels; the motorized wooden canoes, the semi-industrial and the industrial
trawlers and a variety of methods including beach seining.
A variety of fish species are landed all year round but species dominance marks the period of
bumper harvest. Three main small pelagic fish species, Engraulis encrasicolus (Abobi or
Keta school boys) Sardinella aurita (round sardines) and Sardinella eba (flat sardines) form
an important fishery during the bumper harvest period in all the fishing communities.
By and large, post-harvest fish losses at sea; the landing beaches, the processing facilities and
the marketing outlays can be considered minimal to negligible based on the current available
evidence.
Nonetheless, decimation in catches at sea stems largely from dolphin and shark attack on
fishing nets and at the landing beaches; through petty pilfering. At the processing level, any
fish loss may arise from the smoking process and theft of drying salted fish by cats, dogs and
pigs.
Local knowledge in fish preservation and storage is very good and contributes largely to
minimal post-harvest loss.
The major problems encountered by the fishermen and fish processors are inadequate catches
and supply of fish respectively.

82
In addition, the fisheries practitioners can also do better with financial support and technical
training to broaden their financial base and improve their management skills respectively.
The fisheries value incorporates school-going aged children and other minors at various
points along a very long value chain.
Any efforts aimed to improve fisheries development will need to incorporate general
environment issues to make the exercise a worthwhile venture.
4.3. Recommendations
It is recommended that the fishing practices currently in vogue must be thoroughly evaluated
and the necessary regulatory measures put in place and enforced to ensure the prevalence of a
sustainable fishery.
The artisanal fisheries operatives and the fish processors especially can do with some training
and some credit facility to improve on their equipment base and knowledge in the planning
and management of their business as a viable and sustainable commercial venture.
While the study emphasizes post-harvest losses, it is important that the fishermen are made to
understand the dynamics of a dying fishery to enable them practice responsible fisheries.
An investment into alternative means of livelihood, for example, aquaculture, will help to
engage the fishermen during the lean season and lessen the pressure on the fish stocks to
allow them to rebuild the populations. In this way, the fish processors can also run their
businesses all year round.
5.0 BIBLIOGRAPHY
Directorate of fisheries (2007). A summary of fisheries statistics in Ghana (Mimeo). P2.
Ministry of Food and Agriculture, Accra
Directorate of fisheries (2008). National Fisheries and Aquaculture Policy, 2008). Ministry of
Food and Agriculture, Accra
Directorate of fisheries (2010). Fisheries regulations (Arrangements of regulations). Ministry
of food and Agriculture, Accra
FAO (1992) (Code of conduct for responsible fisheries (CCRF);
http://www.fao.org/docrep/005/v9878e00.htm
FAO (2008). Fishery Country Profile - The Republic Of Ghana
Maaeten Bavinck, Ratana Chuenpagdee, Mamadou Diallo, Jan Kooiman, Robin Mahon,
Stella Williams (2005). Interactive Fisheries Governance. Delft: Eburon Publishers.
72pp
Millennium Development Challenge Goals (MDCG) 2000.
http://www.unmilleniumproject.org
Quaatey, S. (1997). Synthesis of recent evaluations undertaken on the major fish stocks in
Ghanaian waters. A working document for the 11th
session of the CECAF Working
Party on Resource evaluation held in Accra. 35 pp.
Sustainable Livelihood Approaches (SLA) (2005). http://www.sla.org
www.Fao.Org/Fi/Oldsite/Fcp/En/Gha/Profile.Htm