Dynamics of the temperature-humidity index in the Mediterranean basin

doi: 10.1111/j.1529-8817.2005.00224.x
Population Structure in the Mediterranean Basin:A Y Chromosome Perspective
C. Capelli1,2,∗ , N. Redhead1, V. Romano3, F. Calı4, G. Lefranc5, V. Delague6,†, A. Megarbane6,A. E. Felice7, V. L. Pascali2, P. I. Neophytou8, Z. Poulli9, A. Novelletto10, P. Malaspina11,L. Terrenato11, A. Berebbi12, M. Fellous13, M. G. Thomas1 and D. B. Goldstein1
1Department of Biology, University College of London, London, UK2Istituto di Medicina Legale,Universita Cattolica del Sacro Cuore, Rome, Italy3Department of Biopathology and Biomedical Methodologies, University of Palermo, Palermo, Italy4Oasi Institute for Research on mental Retardation and Brain Aging (IRCCS), Troina, Italy5Universite Montpellier II et Institut de Genetique Humaine, CNRS UPR 1142, Montpellier, France6Unite de Genetique Medicale, Faculte de Medecine, Universite Saint-Joseph, Beyrouth, Lebanon7Laboratory of Molecular Genetics, Department of Pathology, University of Malta, Malta8Mendel Center for Biomedical Sciences, Eglomi, Nicosia, Cyprus9Cyprus Research Center (KYKEM), Nicosia, Cyprus10Department of Cell Biology, University of Calabria, Rende, Italy11Department of Biology, University “Tor Vergata”, Rome, Italy12Hematology Institute, Kaplan Medical Center, Rehovot, Israel13Department of Human Genetics, Universite Paris, Paris, France
Summary
The Mediterranean region has been characterised by a number of pre-historical and historical demographic eventswhose legacy on the current genetic landscape is still a matter of debate. In order to investigate the degree ofpopulation structure across the Mediterranean, we have investigated Y chromosome variation in a large dataset ofMediterranean populations, 11 of which are first described here. Our analyses identify four main clusters in theMediterranean that can be labelled as North Africa, Arab, Central-East and West Mediterranean. In particular, NearEastern samples tend to separate according to the presence of Arab Y chromosome lineages, suggesting that theArab expansion played a major role in shaping the current genetic structuring within the Fertile Crescent.
Keywords : Mediterranean, Y chromosome, population genetic structure, STRs, UEPs.
Introduction
The Mediterranean basin has witnessed a number ofdramatic demographic events throughout time. The areahas been peopled since the very beginning of the humandiaspora from the Africa continent. The archeological
∗Corresponding author: Cristian Capelli, Genetic Identity Eu-
rope, Promega Corporation, Madison WI, U.S.A. Promega Italia,Via Decembrio 28, 20137 Milano. Tel: +39 0773 458535; Fax:+39 0773 458535. E-mail: [email protected]†Current address: INSERM U491, Laboratoire GenetiqueMedicale et Developpement Faculte de Medecine de la Timone,Marseille, France. The opinions expressed in this article by C.Capelli do not necessarily reflect those of Promega Corporation
sites of Skhul and Qafzeh in the Middle-East (Stringer& Gamble, 1993) contain the oldest Homo sapiens re-mains outside Africa, dating to 90–100000 years beforepresent (yBP), and Southern Greece, Sicily and SouthCoastal Spain were peopled well before 10–12000 yBP.By 9000 yBP agricultural development occurred in theNear East and this new technology spread throughoutEurope in the next millennia (Cunliffe, 2001). The de-mographic effects the Neolithic revolution had on theEuropean peninsula are still a matter of debate amongboth geneticists (Barbujani et al. 1998; Chikhi et al. 1998;Richards et al. 2000; Simoni et al. 2000; Semino et al.2000; Rosser et al. 2000; Torroni et al. 2001; Chikhi et al.
C© University College London 2005 Annals of Human Genetics (2005) 1

C. Capelli et al.
2002; Richards et al. 2002) and archaeologists (Ammer-man & Cavalli-Sforza, 1984; Zvelebil & Zvelebil, 1988),even though in the frame of hypothesis testing, actualavailable data seems to support a Neolithic Demic Dif-fusion (NDD) scenario (Barbujani & Goldstein, 2004).The complexity of Mediterranean genetic history is tes-tified also by the number of historical events occur-ring in this area: the foundation of Greek colonies inthe west Mediterranean (South Italy, Spain and coastalFrance; Burn, 1990), Phoenician and Carthaginiansettlements (Cunliffe, 2001), and the creation of theRoman Empire, which at its peak dominated the en-tire Mediterranean coast. Later in time, the Arab con-quest had a major historical impact, starting from theArabian Peninsula, moving through the Near East andfinally reaching North Africa, the Iberian Peninsulaand Sicily (Dussaud, 1955; Finley, 1968; Ricci, 1984;Abun-Nasr, 1987; Hitti, 1990). The numbers of popu-lation contacts that occurred along the Mediterraneancoast following commercial routes (Braudel, 1998) arean additional element, suggesting that the gene flowacross groups was very large and that it possibly erasedgenetic differences across the basin. A recent study ofY chromosome variation in Mediterranean populationsshowed the distinctiveness of North Africans comparedto the rest of the Mediterranean, but failed to find anyheterogeneity among other Mediterranean populations(Quintana-Murci et al. 2003). Using a more formal in-ferential framework, Chikhi et al. (2002) estimated thecurrent degree of Neolithic component in Europeanpopulations, and revealed similar Near Eastern con-tributions in Mediterranean and continental Europeansamples. Flores et al. (2004) investigated the structurewithin Iberia and included in their analysis a group ofsamples representing Mediterranean populations. The
Figure 1 Geographic origin of the investigated samples.
North African populations tended to separate clearlyfrom other samples, with some indication of structurebetween Near East and Mediterranean samples, but sub-stantial homogeneity within Northern Mediterraneangroups was observed. Nebel et al. (2002) reported thepresence of Arab markers in some Near Eastern popula-tions, possibly as a result of the Arab expansion, but didnot specifically question if this had any effect on popu-lation structure within the Near East, and Hammer et al.(2000) pointed to a common male origin for Jews andMiddle Easterners.
So far little attention has been devoted to differenceswithin the Near East populations and across Mediter-ranean groups. The current set of data now makes itpossible to specifically address this issue.
Here we explicitly assess Mediterranean genetic struc-ture by analysing Y chromosome distribution in 11 dif-ferent populations with a battery of both fast and slowevolving markers (Fig. 1). A total of 656 Y-chromosomeswere typed for 6 Y linked STRs and 16 Unique EventPolymorphisms (UEPs). Additionally, we included pub-lished Y chromosome data for SNPs (58 populations)and STRs (34 populations) (Bosch et al. 1998, 2001;Nebel et al. 2001; Semino et al. 2000; Malaspina et al.2001; Wilson et al. 2001; Luis et al. 2004; Flores et al.2004; Cinnioglu et al. 2004; Thomas et al. 2000; Arrediet al. 2004).Our analyses revealed significant structure inthe Mediterranean Y chromosome gene pool, in par-ticular pointing to structure within the Middle East dueto the presence of an Arab genetic component, a resultalso supported by a reanalysis of published mtDNA andautosomal markers (Richards et al. 2002; Thomas et al.2002; Plaza et al. 2003; Rosenberg et al. 2002).
Materials and Methods
Samples
Geographic origin of populations genotyped in thisstudy is indicated in Figure 1. The Sicilians, a subsetof Sardinians and Tunisian sample origins have alreadybeen described (Romano et al. 2003; Ciminelli et al.1995; Comas et al. 2000; Plaza et al. 2003). Sample sizesare as in Table 1. Haplogroup and haplotype publisheddata included in the analyses are described in Table 1.
2 Annals of Human Genetics (2005) C© University College London 2005

Mediterranean Y Chromosome Population Structure
Y Chromosome Genotypings
Y-STRs were genotyped as described in Thomaset al. (1999) and included DYS388, DYS393, DYS392,DYS19, DYS390 and DYS391 loci. UEPs were geno-typed using monoplex and multiplex reactions (Table 2).YAP, SRY 10831, SY81 and SRY 4064 were genotypedfollowing published protocols (Thomas et al. 1999).RPS4Y polymorphism was genotyped as described inCapelli et al. (2001). Tat and 12f2 markers were scored asindicated in Rosser et al. (2000). All other markers weregenotyped as described below. The genealogical rela-tionship between the selected markers is shown in Figure2, following the Y Chromosome Consortium nomen-clature (2002). PCR was carried out in a final volume of10 µl. The reaction contained 1X buffer (HT Biotech,Cambridge), 200 µM dNTPs, and 0.13 units of Taqpolymerase enzyme (HT Biotech, Cambridge), as wellas 9.3 nM TaqStart Antybody (Clontech). The cyclingconditions were 94◦C for 5 minutes, and then 35 cyclesat 95◦C for 40 sec, 59◦C/58◦C/55◦C for 40 sec and40 sec at 72◦C, with a final incubation at 72◦C for 10minutes. For the M173/M17/M172/M170/M9/92R7multiplex, the final concentration of MgCl2 was2.2 mM. Primers and Endonucleases are shown inTable 2. Restriction reactions were performed follow-ing the supplier’s information (New England Biolabs,Beverly, Mass.)
The PCR mix preparation was performed followingsuggestions described in Thomas et al. (1999).
Appropriate allelic control DNAs where included toconfirm successful restriction reaction conditions. Thedigested products were run on a 377 ABI instrument(Applied BioSystems, Foster City, CA).
The M173/M17/M172/M170/M9/92R7 multiplexwas firstly genotyped in all the samples. M9 derivedsamples, ancestral at 92R7, were also tested for tat. M9,M170, M172 underived samples were tested for M89,12f2 and M35. Samples ancestral at these markers wereadditionally tested for SRY 10831, YAP and RPS4Y.YAP derived samples ancestral at M35 were tested forSRY4064 and SY81. M26 was tested only on M170derived chromosomes.
Two chromosomes found in Cyprus, ancestral at M89and YAP markers, could not be tested for RPS4Y andSRY10831. Haplotype comparison with unpublished
data suggested considering them as hg A. Similarly, dueto DNA not being available, three Djerba chromosomes,underived at M9, 12f2, M170, were assigned to hap-logroups E3b (1 chromosome) and FxIJK (2 chromo-somes) by haplotype comparison with fully genotypedavailable samples. For hgs analysis, chromosomes wereclustered in 8 groups following genealogical informa-tion: DE; Y∗ (xA,D,E,J,K); P∗ (xR1a1); J∗ (xJ2); J2; A;K∗ (xP), R1a1.
Statistical Analysis
Principal Components (PC) analysis was performed onhaplogroup frequencies by using POPSTR software(Henry Harpending, pers comm.). Geographic struc-turing of variation was assessed using AMOVA as im-plemented in the Arlequin software (Schneider et al.2000). AMOVA analysis was performed taking in con-sideration STR data only and using Rst genetic distance(Slatkin, 1995). Samples included in the analyses are in-dicated in Table 1. MtDNA PC analysis was perfomedon a set of published data (Richards et al. 2002; Thomaset al. 2002; Plaza et al. 2003) Admixture estimationswere calculated by LEA and ADMIX software (Chikhiet al. 2001; Bertorelle & Excoffier, 1998; Dupanloup& Bertorelle, 2001) using hg information (i.e. binarymarkers only) and considering the E3b North Africanmodal type as separate from the rest of the E3b group.Selected autosomal data from Rosenberg et al. (2002)was investigated by the use of the STRUCTURE pro-gram (Pritchard et al. 2000). Each STRUCTURE runwas performed twice with a burn-in and run length of200,000 each.
Results and Discussion
Mediterranean Population Structure
We analysed 16 biallelic markers (otherwise known asUnique Event Polymorphisms - UEPs) identifying hgs(Fig. 2, Table 3), and 6 Y linked microsatellites (Thomaset al. 1999) defining hpts (Appendix). To include addi-tional data from other reference populations (Table 1)Y chromosome PC analysis (Fig. 3a) was performedwith a lower level of resolution, collapsing the 14 ob-served haplogroups into 8 haplogroups, as described in
C© University College London 2005 Annals of Human Genetics (2005) 3

C. Capelli et al.
Table 1 Geographic origin of all the samples included in the Y chromosome and STRs analyses. Codes, sample sizes and referencesare indicated. na: not available
Haplogroup data Haplotype data Code Sample size Reference
Central-East MediterranenEast Sicily East Sicily ESC 87 this studySouth-West (SW) Sicily South-West (SW) Sicily SWS 55 this studyNorth-West (NW) Sicily North-West (NW) Sicily NWS 70 this studySouth Italy South Italy SIT 68 this studySardinia Sardinia SAR 81 this studyMalta Malta MAL 90 this studyCyprus Cyprus CYP 65 this studyTurkey na TRS 20 Semino et al. 2000na Turkey 68 Wilson et al. 2001na Turkey 523 Cinnioglu et al. 2004Turkey-1 na TR1 52 Cinnioglu et al. 2004Turkey-2 na TR2 29 Cinnioglu et al. 2004Turkey-3 na TR3 83 Cinnioglu et al. 2004Turkey-4 na TR4 82 Cinnioglu et al. 2004Turkey-5 na TR5 43 Cinnioglu et al. 2004Turkey-6 na TR6 33 Cinnioglu et al. 2004Turkey-7 na TR7 90 Cinnioglu et al. 2004Turkey-8 na TR8 30 Cinnioglu et al. 2004Turkey-9 na TR9 81 Cinnioglu et al. 2004
West Mediterranean (Iberians) Cinnioglu et al. 2004Seville na SEV 155 Flores et al. 2004Huelva na HUE 22 Flores et al. 2004Cadiz na CAD 28 Flores et al. 2004Cordoba na COR 27 Flores et al. 2004Malaga na MAG 26 Flores et al. 2004North Portugal na NPF 109 Flores et al. 2004Leon na LEO 60 Flores et al. 2004Galicia na GAL 19 Flores et al. 2004Cantabria na CAN 70 Flores et al. 2004Valencia na VAL 31 Flores et al. 2004Castile na CAS 21 Flores et al. 2004Madeira na MAD 129 Goncalves et al. 2005Acorres na ACO 121 Goncalves et al. 2005North Portugal na NPC 101 Goncalves et al. 2005Central Portugal na CPC 102 Goncalves et al. 2005South Portugal na SPC 100 Goncalves et al. 2005Basques Basques BAS 42 Bosch et al. 1998; 2001Catalans Catalans CAT 14 Bosch et al. 1998; 2001Andalusians Andalusians AND 37 Bosch et al. 1998; 2001
Middle East and Arabian PeninsulaOman Arabs Oman Arabs OMA 121/122
∗Luis et al. 2004
na Syria 72 Wilson et al. 2001Syria na SYR 20 Semino et al. 2000na Yemen 76 Wilson et al. 2001United Arab Emirates na UAE 33 Malaspina et al. 2001Iraq na IRQ 139 Al-Zahery et al, 2003Palestinians Palestinians PAL 143 Nebel et al. 2001Beduins Beduins BED 32 Nebel et al. 2001Muslim Kurds Muslim Kurds MKU 95 Nebel et al. 2001Kurdish Jews Kurdish Jews KJE 99 Nebel et al. 2001Ashkenazi Jews Ashkenazi Jews AJE 79 Nebel et al. 2001Sephardic Jews Sephardic Jews SJE 78 Nebel et al. 2001
4 Annals of Human Genetics (2005) C© University College London 2005

Mediterranean Y Chromosome Population Structure
Table 1 (continued)
Haplogroup data Haplotype data Code Sample size Reference
Muslim Lebanese Muslim Lebanese MLE 39 this studyChristian Lebanese Christian Lebanese CLE 43 this study
North AfricaAlgeria Arabs Algeria Arabs AAR 35 Arredi et al. 2004Algeria Berbers Algeria Berbers ABE 19 Arredi et al. 2004North Egypt North Egypt NEG 44 Arredi et al. 2004South Egypt South Egypt SEG 29 Arredi et al. 2004Egypt Arabs Egypt Arabs EAR 147/148
∗Luis et al. 2004
Tunisia Tunisia TUA 148 Arredi et al. 2004Tunisia Tunisia TUN 39 this studyDjerba Jews Djerba Jews DJE 19 this studyMoroccan Arabs Moroccan Arabs MAR 44 Bosch et al. 1998; 2001Moroccan Berbers Moroccan Berbers MBA 60 Bosch et al. 1998; 2001Saharawis Saharawis SAH 29 Bosch et al. 1998; 2001
Total populations 59 34Total individuals 3807 2692
∗Haplogroup/haplotype available individuals.
the Methods section. PC results were shaped by hgsP∗ (xR1a1), J∗ (xJ2) and DE along axis one (loading fac-tors: 0.484, −0.292, and −0.299, respectively) and byhgs J2 and DE on axis 2 (loading factors: 0.253 and−0.324, respectively). The PC plot suggested the pres-ence of four main groups (Fig. 3a): 1) North Africa,
Figure 2 Genealogical relationships of the selected UEPs. Nomenclature as suggested by YCC (2002).
2) Near East/Arabs (including Muslim Lebanese andAshkenazi Jews), 3) Central-East Mediterranean group-ing, including Christian Lebanese and 4) West Mediter-ranean. A population differentiation test was performedusing an analogue of the Fisher Exact Test as imple-mented in the Arlequin software (Schneider et al. 2000)
C© University College London 2005 Annals of Human Genetics (2005) 5

C. Capelli et al.
Tab
le2
Info
rmat
ion
onU
EP
geno
typi
ngpr
otoc
ols.a)
Und
erlin
edar
em
ismat
chnu
cleo
tides
used
tocr
eate
/elim
inat
ere
stri
ctio
nsit
es;b)
Size
swer
ees
timat
edus
ing
a4.
25%
acry
lam
ide
gelr
unon
a37
7A
BI
auto
mat
edse
quen
cer
with
TA
MR
A35
0(A
pplie
dB
iosy
stem
)as
inte
rnal
size
stan
dard
;c)M
17pr
imer
sw
ere
desc
ribe
din
Tho
mas
etal
.(19
99);d)
12f2
prim
ers
wer
ede
scri
bed
inR
osse
ret
al.(
2000
);e)
tat
prim
ers
wer
ede
scri
bed
inR
osse
ret
al.(
2000
)
Prim
erA
mpl
icon
Disc
rim
inat
ing
Frag
men
tsiz
eFr
agm
ent
size
conc
entr
atio
nsiz
eb)en
zym
ean
cest
ral
deri
ved
Rea
ctio
nLo
cus
Prim
ers
Labe
lPr
imer
sse
quen
ce(5
′-3
′ )a)
(µM
)nu
cleo
tide
nucl
eotid
e
192
R7
92R
7uH
EX
TC
AG
AA
AG
AT
AG
TA
AG
AG
GA
AC
AC
TT
C0.
1595
Hin
dII
I95
+66
(C)
95(T
)92
R7r
GC
AT
TG
TT
AA
AT
AT
GA
CC
AG
CA
M9
M9L
FC
AT
TG
AA
CG
TT
TG
AA
CA
TG
TC
0.15
114
Hin
fI
67(C
)97
(G)
(cut
byA
flII
I)M
9LR
TE
TT
GC
AG
CA
TA
TA
AA
AC
TT
TC
AG
GM
17c)
M17
FG
TG
GT
TG
CT
GG
TT
GT
TA
CG
T0.
1512
5A
flII
I12
5(+
G)
105
(-G
)M
17R
TE
TA
GC
TG
AC
CA
CA
AA
CT
GA
TG
TA
GA
M17
0M
170
FT
TA
CT
AT
TT
TA
TT
TA
CT
TA
AA
AA
TC
AT
TG
AT
C0.
511
1B
clI
83(A
)11
1(C
)M
170
RH
EX
CC
AA
TT
AC
TT
TC
AA
CA
TT
TA
AG
AC
CM
172
M17
2F
TE
TT
TA
GC
CA
GA
TG
AC
CA
GG
AT
GC
0.2
173
Hin
fI
173
(A)
143
(G)
M17
2R
GA
AA
AT
AA
TA
AT
TG
AA
GA
CC
TT
TT
GA
GT
M17
3II
M17
3F
AC
AA
TT
CA
AG
GG
CA
TT
TT
GT
AC
0.4
117
Bsr
GI
100
(A)
117
(C)
M17
3R
FAM
CT
TA
CT
CA
GT
AT
GG
GT
AA
AA
GA
AA
TG
C2
M89
M89
FH
EX
GA
AA
GT
GG
GG
CC
CA
CA
G0.
3598
Nla
III
80(C
)98
(T)
M89
RA
AC
TC
AG
GC
AA
AG
TG
AG
AC
AT
12f2
d)12
f2D
HE
XC
TG
AC
TG
AT
CA
AA
AT
GC
TT
AC
AG
AT
C0.
3588
-88
locu
sde
lete
d12
f2G
GG
AT
CC
CT
TC
CT
TA
CA
CC
TT
AT
AC
tate)
Tat
FG
AC
TC
TG
AG
TG
TA
GA
CT
TG
TG
A0.
3511
2-
PCR
cont
rol
PCR
cont
rol
Tat
RFA
MG
AA
GG
TG
CC
GT
AA
AA
GT
GT
GA
A3
M26
M26
FC
AA
TT
TC
TT
TC
TG
AA
TT
AG
AA
TG
AT
C0.
516
9B
clI
169
(G)
147
(A)
M26
RH
EX
CC
AT
AC
AC
AA
GG
AT
GC
AG
CA
C4
M35
IIM
35F
FAM
GA
AA
CT
GA
GA
GG
GC
AA
GG
TC
0.5
161
Bsr
I13
1(G
)16
1(C
)II
M35
RG
GA
GC
TT
CT
GC
CT
GT
TG
C
6 Annals of Human Genetics (2005) C© University College London 2005

Mediterranean Y Chromosome Population Structure
on hgs frequencies, using the same 8 hgs tested for PCanalysis. The pattern of population similarities paral-leled that displayed by PC analysis, with populations inthe same cluster being mostly not significantly differentfrom each other (P > 0.05, data not shown). Populationrelationships were also investigated by the use of mi-crosatellite variation on a total of 34 populations (Table1). Analysis of the distribution of molecular variation onSTRs haplotypes (performed using Arlequin software;Schneider et al. (2000)) was also consistent with the fourgroup clustering suggested by the PC analysis, with thelowest within groups variation (1.57%) and largest be-tween groups variation (7.70%, �st 0.077, P � 0.01).Clustering of the West and Central-East Mediterraneanpopulations lowered the intergroup variation to 6.95 %and increased the intragroup value to 2.35% (P� 0.01).Following a geographical clustering scheme as indicatedin Table 1, genetic variation showed a between groupsvalue of 5.18% and a within groups percentage of 3.06(P � 0.01). Finally, clustering the North African Arabsamples with the Arab cluster of Figure 3a displayed abetween groups value of 6.18% and a within groupspercentage of 2.71 (P � 0.01).
We also evaluated the degree of differentiation shownby Mediterranean populations by performing PC anal-ysis on previously published mtDNA haplogroup data(Richards et al. 2002; Thomas et al. 2002; Plaza et al.2003). In general agreement with the Y chromosomeresults, a Mediterranean, an Arab and a North Africancluster were apparent (Fig. 3b). Contrary to the Y chro-mosome PC plot (Figure 3a) West and Central Mediter-ranean samples did not cluster independently, whilea certain tendency to separate was shown by MiddleEastern samples. Mediterraneans and North Africanswere closer to each other than to Arabic populations(Bedouins and Yemenite), a result previously interpretedas a signature of female mediated gene flow across theMediterranean basin (Plaza et al. 2003). Near EasternArab populations (Palestinians, Jordanians and Syrians)did not cluster with the Arabians and were instead closerto Mediterranean populations. This result is in contrastwith the Y chromosomal data, where Arabian and non-Arabian Arabs grouped together (Fig. 3a). Sex mediateddifferential contacts between the Arabian peninsula andthe Near East could be responsible for the different ob-served pattern. In the Middle East, only Bedouins seem T
able
3Po
pula
tion
Yhg
freq
uenc
ies
(inbr
acke
tsab
solu
tenu
mbe
rof
chro
mos
omes
)in
vest
igat
edin
this
stud
y.N
ohg
Dan
dN
3ch
rom
osom
esw
ere
foun
d
E∗ (
xE3a
,C
J∗(x
J2)
J2I∗
(xI1
b2)
I1b2
F∗(x
I,K
∗ (xP
,Sa
mpl
eA
E3b
E3a
E3b
)J,K
)N
3)P∗
(xR
1)R
1∗(x
R1a
1)R
1a1
n
ESC
0.28
7(2
5)0.
069
(6)
0.28
7(2
5)0.
034
(3)
0.01
1(1
)0.
046
(4)
0.04
6(4
)0.
195
(17)
0.02
3(2
)87
SWS
0.16
4(9
)0.
273
(15)
0.05
5(3
)0.
145
(8)
0.05
5(3
)0.
291
(16)
0.01
8(1
)55
NW
S0.
214
(15)
0.01
4(1
)0.
071
(5)
0.11
4(8
)0.
157
(11)
0.11
4(8
)0.
014
(1)
0.01
4(1
)0.
257
(18)
0.02
9(2
)70
SIT
0.26
5(1
8)0.
044
(3)
0.16
2(1
1)0.
044
(3)
0.01
5(1
)0.
147
(10)
0.02
9(2
)0.
015
(1)
0.25
(17)
0.02
9(2
)68
SAR
0.01
2(1
)0.
099
(8)
0.04
9(4
)0.
099
(8)
0.04
9(4
)0.
259
(21)
0.18
5(1
5)0.
012
(1)
0.02
5(2
)0.
21(1
7)81
MA
L0.
089
(8)
0.01
1(1
)0.
011
(1)
0.07
8(7
)0.
211
(19)
0.12
2(1
1)0.
067
(6)
0.04
4(4
)0.
011
(1)
0.32
2(2
9)0.
033
(3)
90T
UN
0.51
3(2
0)0.
231
(9)
0.10
3(4
)0.
026
(1)
0.05
1(2
)0.
051
(2)
0.02
6(1
)39
DJE
0.05
3(1
)0.
316
(6)
0.52
6(1
0)0.
105
(2)
19M
LE0.
179
(7)
0.30
8(1
2)0.
256
(10)
0.12
8(5
)0.
051
(2)
0.05
1(2
)0.
026
(1)
39C
LE0.
163
(7)
0.09
3(4
)0.
349
(15)
0.04
7(2
)0.
186
(8)
0.04
7(2
)0.
07(3
)0.
047
(2)
43C
YP
0.03
1(2
)0.
2(1
3)0.
062
(4)
0.36
9(2
4)0.
077
(5)
0.09
2(6
)0.
046
(3)
0.09
2(6
)0.
031
(2)
65 656
C© University College London 2005 Annals of Human Genetics (2005) 7

C. Capelli et al.
Figure 3 a)Y chromosome hgs Principal Components plot. Codes as in Table 1; b) MtDNA hgsPrincipal Components plot. Codes for Figure 3b as follows: MAR, Moroccan Arabs; SBE, SouthBerbers; MOZ, Mozabites; SAH, Saharawis; TUN, Tunisians; MBE, Moroccan Berbers; AND,Andalusians; BAS, Basques; CAT, Catalans; CSP, Central Spanish; GAL, Galicians; VAL, Valencians;POR, Portuguese; NPO, North Portuguese; CPO, Central Portuguese; SPO, South Portuguese; IBE,Iberians; CIT, Central Italians; SIT, South Italians; SIC, Sicilians; TUS, Tuscans; SAR, Sardinians;AJE, Ashkenazi Jews; MJE, Moroccan Jews; TUR, Turks; JOR, Jordanians; PAL, Palestinians; SYR,Syrians, YEM, Yemenites; BED, Bedouins. Indicated are the percentages of genetic variationexpressed by each principal component.
8 Annals of Human Genetics (2005) C© University College London 2005

Mediterranean Y Chromosome Population Structure
to have had extensive contacts with Arabians, as in bothmtDNA and Y chromosome analyses they cluster to-gether. Recently Rosenberg et al. (2002) published aninvestigation of world-wide populations genotyped atalmost 400 microsatellite loci. They assessed populationdifferentiation using the clustering scheme implementedin the STRUCTURE software (Pritchard et al. 2000).Using the same approach we focused our attention onsamples present in their dataset that are comparable toours, namely Sardinians and Italians, Mozabites fromNorth Africa, Bedouins and Palestinians. Previous anal-ysis revealed independent clustering on Basques fromother European samples (Rosenberg et al. 2002); there-fore, in order to make the computation time feasible, wedid not include this group in our analysis. Several runswere performed and the highest likelihood values wereobtained when testing a number of clusters K >= 4.These K values were associated with overlapping like-lihood values across runs, so that it was not possible toidentify the most likely number of clusters (data notshown). However, in all these cases at least three differ-ent groups were present: group 1 clustered the majority(over 70%) of Italians and Sardinians, and a small part ofBedouins and Palestinians; group 2 was represented byalmost 90% of North Africans; and group 3 containedthe majority of Palestinians and a subset of Bedouins.Additional groups were composed by subsequent subdi-vision of the Bedouin sample. Clusters 1, 2 and 3 broadlymirrored Mediterranean, North African and Arab Ychromosome and mtDNA groupings. Taking into con-sideration the independent clustering of Basques fromother European samples (Rosenberg et al. 2002), thefour clustering scheme suggested by Y chromosomeanalysis seems to be supported also at an autosomallevel. Additional groups, almost exclusively representedby Bedouins, were also observed. These additional clus-ters most likely reflect specific gene flow or drift occur-ring in Bedouins. Richards et al. (2003) found geneticevidence of female gene flow from Sub-Saharan Africainto Near East Arab populations, resulting from the slavetrade. When we included in the STRUCTURE analysisthe available Sub-Saharan samples from Rosenberg et al.(2002), the three African populations (Bantu-speakingKenians, Yoruba and Mandenka) strongly clustered to-gether, with a minor portion (not above 10%) of NorthAfrican and Bedouins. Assuming correct identification
of source populations, this suggests minor Sub-Saharancontribution to current Near East Arab populations.
Near East, Jewish communities andArabians: evidence of Arab male geneticcontribution to Levantine populations
The independent clustering of Near Eastern Arab andnon-Arab populations is driven by J∗ (xJ2) frequen-cies, above 30% in all populations in the Arab group(Table 1 and Semino et al. 2004). Nebel et al. (2002)suggested this group (H71 in their nomenclature) as apossible marker of the Arab expansion in the SouthernLevant and North Africa. The authors found a J∗ (xJ2)haplotype mainly restricted to Arab populations or Ara-bised ones (Galilee Modal Haplotype, GMH, Nebelet al. 2000), and virtually absent from Jewish groups andthe North Mediterranean coast (this study and Nebelet al. 2001). The same haplotype has also been iden-tified in various North African groups (this study andBosch et al. 2000, 2001) and it is the modal hpt in Syriaand Yemen (Thomas et al. 2000). J∗ (xJ2) hg frequencyhas an important influence on the distribution of pop-ulations on the PC plot axis 2, the axis along whichArab and Arabian populations tend to cluster. Thesepopulations also show high frequencies for the GMHand its one microsatellite mutational step neighbours.J∗ (xJ2) and GMH appear then to be non-randomly dis-tributed across populations, and together may representa signature for Arabian influence. Interestingly, consid-ering the two Lebanese samples, the Muslims containedGMH and its one microsatellite mutation step clusterat frequencies of 4.6% and 14%, respectively, while onthe contrary the Christians displayed only the GMH(2.5%). Hg J∗ (xJ2) frequencies in Muslim and ChristianLebanese were 31% and 9%, respectively.
Nebel et al. (2002) suggested a “working model” withtwo main waves of contacts between the Near Eastand the Arabian peninsula. An earlier Near East ex-pansion toward the Arabian Peninsula during Neolithictime would be identified by types shared also with Jew-ish communities, while Arabian and Near East groupuniquely shared types could be instead related to a morerecent population movement, following the dispersionof nomadic tribes out of the Arabian peninsula.
C© University College London 2005 Annals of Human Genetics (2005) 9

C. Capelli et al.
Arabian male admixture with Near East populationscould explain the independent grouping of these fromMediterranean populations, as shown by Y chromosomedata. The different pattern shown by mtDNA (Fig. 3b),with non-Arabian Arabs clustering with Mediterraneangroups, suggests that Arab introgression had different ef-fects in different groups possibly due to sex-biased geneflow.
This scenario has important implications also on theinvestigation of the origin of Jewish communities. Ge-netic variation in Jewish populations has been inves-tigated in several recent papers using different geneticsystems (e.g. Hammer et al. 2000; Nebel et al. 2001;Thomas et al. 2002; Behar et al. 2003). Basing theiranalysis on Y chromosome variation, Hammer et al.(2000) recently found similarity between Near East-ern and Jewish communities, and suggested a com-mon Near Eastern origin for all these groups. We havefocused on Mediterranean and Near Eastern popu-lations and highlight a significant separation between“Arabian” Near Easterners and Jewish populations.Both PC and AMOVA analyses suggest a more com-plex scenario, with Sephardic and Kurdish Jews closerto Mediterraneans, and Djerba and Ashkenazi in-stead showing a higher affinity to Arab populations. Alarger Djerban Jewish sample confirms this observation(Leonardi et al. personal communication). These resultscontrast with those of Hammer et al. (2000). However,the main differences between the two investigations arethe specific focus on Mediterranean populations and theadditional level of resolution within hg J, offered by theinclusion of the M172 marker and microsatellite data.Hg J frequencies are in fact similar across Jewish com-munities and Near Easterners, while J2 and J∗ (xJ2) hgsfrequencies highlight important differences. Hg J∗ (xJ2)is always more frequent (sometime even as much astwice as frequent) than J2 in the “Arabian” Near East-ern populations, while J2 is more frequent than J∗ (xJ2)in the Jewish populations (Table 2; Nebel et al. 2001;Cinnioglu et al. 2004; Luis et al. 2004; Semino et al.2004) The inclusion of genetically different worldwidepopulations such as Sub Saharan African, European andNorth African in the MDS analysis by Hammer et al.(2000) probably favoured the clustering of broadly sim-ilar populations such as Near Easterners and Jews, dueto their high hg J frequencies (between 28% and 84%).
All the Europeans included in their analysis had low hg Jfrequencies except the only two Mediterranean samples,Italy and Greece, which were in fact the closest to NearEastern/Jews in their MDS analysis. The heterogeneitywe observed between the Jewish groups included hereand the Near East populations might be related to theindependent genetic histories and European admixture(Thomas et al. 2002; Nebel et al. 2002; Behar et al. 2003),and to male specific Arabic gene flow into Arab NearEastern populations.
North Africa, West and CentralMediterranean clusters
Genetic distinctness of North African populations hasbeen shown by a number of investigations (Arredi et al.2004; Bosch et al. 2001; Flores et al. 2004; Rosser et al.2000). This uniqueness seems to be only partially relatedto SubSaharan gene flow, as little introgression from thisarea has been suggested (Salas et al. 2004; Bosch et al.2001). North African populations show little Y chro-mosomal variation, a result interpreted as a consequenceof the Neolithic expansion (Arredi et al. 2004). NorthAfrican populations have E3b frequencies above 50%(Table 1 and Bosch et al. 2001; Arredi et al. 2004), whilethis hg is not above 29% in other Mediterranean andEuropean samples (Table 1, Semino et al. 2000, 2004;Rosser et al. 2000). The E3b North African types aremostly derived from the M81 marker, while EuropeanE3b types are defined by the M78 marker (both notincluded in our UEP panel) (Semino et al. 2004).
Very limited North African gene flow to Europeseems to have occurred (Bosch et al. 2001). In order toquantitatively estimate the North African male geneticintrogression on the northern shores of the Mediter-ranean basin, we used likelihood and least-square ap-proaches, as implemented in the LEA and ADMIXsoftware (Chikhi et al. 2001; Bertorelle & Excoffier,1998; Dupanloup & Bertorelle, 2001). We selected Mo-roccan Berbers/Basques (Bosch et al. 2000, 2001) andTunisian/Southern Italians, respectively, as possible rep-resentatives of the source populations for the Iberianand Sicilian samples. Hpt 44, modal in North Africa(see appendix and Bosch et al. 2000; 2001; Arrediet al. 2004) has been considered as separate from therest of the E3b chromosomes. The median likelihood
10 Annals of Human Genetics (2005) C© University College London 2005

Mediterranean Y Chromosome Population Structure
estimations ranged between 0.15 and 0.271, whilethe ADMIX values were between 0.004-0.21. Thetwo different approaches support a scenario with lim-ited genetic contribution of North African popula-tions, in agreement with their independent clusteringin the STRUCTURE analysis, and as suggested alsoby mtDNA and Y chromosome analysis (Figure 3a, 3b;Plaza et al. 2003) and in agreement with previous data(Bosch et al. 2001; Cruciani et al. 2004).
Of interest is the genetic separation that WestMediterranean samples from Iberia display vs. Centraland East Mediterranean samples, as shown in this studyby Y chromosome SNPs and STRs analyses and by au-tosomal data (Rosenberg et al. 2002). Investigation of themtDNA distribution of genetic variation instead seemsto support a more homogeneous situation for EuropeanMediterranean populations. Higher female than malegene flow across populations and/or difference in pop-ulation sizes of breeding individuals between the twogenders have been suggested as possible explanations forthis observation (Seielstad et al. 1998; Dupanloup et al.2003). The observed autosomal independent clustering(Rosenberg et al. 2002) could possibly be due to uniquecharacteristics of the Basque population, but not of all ofIberia, and reflects drift occurring in this group. A moreexhaustive sampling and genotyping of multiple geneticsystems for the same individuals from populations fromthis area and from other European populations wouldhelp to clarify this issue.
Conclusions
The significant genetic structuring of populations fac-ing the Mediterranean basin into three groupings, NearEastern Arab, Mediterranean and North African, is re-lated to the demographic processes that have occurredsince first populating the area. The distribution of Ne-olithic technologies was probably paralleled by demo-graphic expansion in the Mediterranean basin, and sub-sequent westward migration by Phoenicians and Greekscontributed to the distribution of Y chromosome typesof most likely Near East origin. The Arab conquestin particular appears to have had a dramatic influenceon the East and South Mediterranean coasts, with dif-ferential sex-related gene flow playing a major role inthe distribution of genetic variation. The presence of
Arab Y chromosome lineages in the Middle East sug-gests that most have experienced substantial gene flowfrom the Arabian peninsula. This result raises the issue ofthe correctness of identifying all Near Eastern popula-tions as reliable representations of the original Neolithicgroups that expanded from the Middle East towards theEuropean peninsula.
The identified genetic structure raises important is-sues not only for historical but also for medical genet-ics. Differential distribution of malaria resistance variantsamong Mediterranean populations is well known, andthought in part to be the result of local selection pressure(Tishkoff et al. 2001;Verrelli et al. 2002). The presence ofstructure as identified by multiple genetic systems sug-gests that other polymorphisms might be not randomlydistributed as a result of the indicated demographic phe-nomena. In particular, variants involved in the responseto drug metabolism are important candidates for suchinvestigation, and indeed some of them, for examplethe CYP2D6 and PKU genes, show significant differ-ences across European and Mediterranean populations(Bradford, 2002; Cali’ et al. 1997). More detailed sam-pling and investigation focused on this area will be crit-ical for extensive evaluation of the degree of populationstructuring present, and the demographic processes thathave shaped them.
Acknowledgements
We would like to thank the following people: Julia Aber-nethy and Fiona Gratrix helped in genotypings; Almut Nebeland Elena Bosch kindly provided data in an electronic for-mat; Prof. SantaCruz provided a subset of the Sardinian sam-ples; Jim Wilson and Martin Richards commented on anearlier version of the manuscript; Henry Harpending gavepermission to use POPSTR software. G.L., V.D. and A.M.would like to additionally thank Nabiha Salem and ElianeChoueiry. V.L.P. was supported by a grant PRIN-MIUR 2002(N.2002063871); A.N. by grant PRIN-MIUR 2003. D.B.G.is a Royal Society/Wolfson Research Merit Award holder.
References
Abun-Nasr, J. M. (1987) A history of the Maghrib in the IslamicPeriod. Cambridge: Cambridge University Press.
Al-Zahery, N., Semino, O., Benuzzi, G., Magri, C., Passarino,G., Torroni, A. & Santachiara-Benerecetti, A. S. (2003)Y-chromosome and mtDNA polymorphisms in Iraq, acrossroad of the early human dispersal and of post-Neolithicmigrations. Mol Phylogenet Evol. 28, 458–472.
C© University College London 2005 Annals of Human Genetics (2005) 11

C. Capelli et al.
Ammerman, A. & Cavalli-Sforza, L. L. (1984) The Neolithictransition and the genetics of human populations in Europe.Princeton , New Jersey: Princeton University Press.
Arredi, B., Poloni, E. S., Paracchini, S. et al. (2004) A Pre-dominantly Neolithic Origin for Y-Chromosomal DNAVariation in North Africa. Am J Hum Genet 75, 338–345.
Barbujani, G., Bertorelle, G. & Chikhi, L. (1998) Evidencefor Paleolithic and Neolithic gene flow in Europe. Am JHum Genet 62, 488–492.
Barbujani, G. & Goldstein, D. B. (2004) Africans and Asiansabroad: genetic diversity in Europe. Annu Rev GenomicsHum Genet 5, 119–150.
Bertorelle, G. & Excoffier, L. (1998) Inferring admixtureproportions from molecular data. Mol Biol Evol 15, 1298–1311.
Behar, D. M., Thomas, M. G., Skorecki, K. et al. (2003) Mul-tiple origins of Ashkenazi Levites: Y chromosome evidencefor both Near Eastern and European ancestries. Am J HumGenet 73, 768–779.
Bosch, E., Calafell, F., Perez-Lezaun, A. et al. (2000) Y chro-mosome STR haplotypes in four populations from north-west Africa. Int J Legal Med 114, 36–40.
Bosch, E., Calafell, F., Comas, D., Oefner, P. J., Underhill,P. A. & Bertranpetit, J. (2001) High-resolution analysis ofhuman Y-chromosome variation shows a sharp discontinu-ity and limited gene flow between northwestern Africa andthe Iberian Peninsula. Am J Hum Genet 68, 1019–1029.
Bradford, L. D. (2002) CYP2D6 allele frequency in EuropeanCaucasians, Asians, Africans and their descendants. Pharma-cogenomics 3, 229–243.
Braudel, F. (2002) The Mediterranean in the Ancient. London:World Penguin Books
Burn, A. R. (1990) The Penguin History of Greece. pp. 83–103.London: Penguin Books.
Cali, F., Dianzani, I., Desviat, L. R. et al. (1997) The STR252-IVS10nt546-VNTR7 phenylalanine hydroxylase minihap-lotype in five Mediterranean samples. Hum Genet 100, 350–355.
Capelli, C., Wilson, J. F., Richards, M. et al. (2001) A predom-inantly indigenous paternal heritage for the Austronesian-speaking peoples of insular Southeast Asia and Oceania. AmJ Hum Genet 68, 432–443.
Chikhi, L., Destro-Bisol, G., Bertorelle, G., Pascali, V. & Bar-bujani, G. (1998) Clines of nuclear DNA markers suggest alargely neolithic ancestry of the European gene pool. ProcNatl Acad Sci USA 95, 9053–9058.
Chikhi, L., Bruford, M. W. & Beaumont, M. A. (2001) Esti-mation of admixture proportions: a likelihood-based ap-proach using Markov chain Monte Carlo. Genetics 158,1347–1362.
Chikhi, L., Nichols, R. A., Barbujani, G. & Beaumont, M. A.(2002) Y genetic data support the Neolithic demic diffusionmodel. Proc Natl Acad Sci U S A 99, 11008–11013.
Ciminelli, B. M., Pompei, F., Malaspina, P. et al. (1995) Re-current simple tandem repeat mutations during humanY-chromosome radiation in Caucasian subpopulations. JMol Evol 41, 966–973.
Cinnioglu, C., King, R., Kivisild, T., Kalfoglu, E., Atasoy,S., Cavalleri, G. L., Lillie, A. S., Roseman, C. C., Lin,A. A., Prince, K., Oefner, P. J., Shen, P., Semino, O. &Cavalli-Sforza, L. L., Underhill, P. A. (2004) Excavating Y-chromosome haplotype strata in Anatolia. Hum Genet 114,127–148.
Comas, D., Calafell, F., Benchemsi, N. et al. (2000) Alu inser-tion polymorphisms in NW Africa and the Iberian Penin-sula: evidence for a strong genetic boundary through theGibraltar Straits. Hum Genet 107, 312–319.
Cruciani, F., La Fratta, R., Santolamazza, P. et al. (2004) Phy-logeographic analysis of haplogroup E3b (E-M215) Y chro-mosomes reveals multiple migratory events within and outof Africa. Am J Hum Genet 74, 1014–1022.
Cunliffe, B. (2001) The Oxford illustrated history of PrehistoricEurope. Oxford: Oxford University Press.
Di Giacomo, F., Luca, F., Popa, L. O. et al. (2004) Y Chro-mosomal Haplogroup J as a signature of the post-Neolithiccolonization of Europe. Hum Genet 115, 357–371.
Dupanloup, I. & Bertorelle, G. (2001) Inferring admixtureproportions from molecular data: extension to any numberof parental populations. Mol Biol Evol 18, 672–675.
Dupanloup, I., Pereira, L., Bertorelle, G., Calafell, F., Prata,M. J., Amorim, A. & Barbujani, G. (2003) A recent shiftfrom polygyny to monogamy in humans is suggested by theanalysis of worldwide Y-chromosome diversity. J Mol Evol57, 85–97.
Dussaud, R. (1955) La penetration des Arabes en Syrie avant l’-Islam. Paris: P Geuthner.
Finley, M. L. (1968) A History of Sicily: Ancient Sicily to theArab Conquest. London: Viking Press.
Flores, C., Maca-Meyer, N., Gonzalez, A. M., Oefner, P. J.,Shen, P., Perez, J. A., Rojas, A., Larruga, J. M. & Under-hill, P. A. (2004) Reduced genetic structure of the Iberianpeninsula revealed by Y-chromosome analysis: implicationsfor population demography. Eur J Hum Genet 10, 855–863.
Goncalves, R., Freitas, A., Branco, M., Rosa, A., Fernandes,A. T., Zhivotovsky, L. A., Underhill, P. A., Kivisild, T. &Brehm, A. (2005) Y-chromosome Lineages from Portugal,Madeira and Acores Record Elements of Sephardim andBerber Ancestry. Ann Hum Genet 69, 443–454.
Hammer, M. F., Redd, A. J., Wood, E. T. et al. (2000) Jewishand Middle Eastern non-Jewish populations share a com-mon pool of Y-chromosome biallelic haplotypes. Proc NatlAcad Sci USA 97, 6769–6774.
Hitti (1990) The Arabs: a short history. Gateway Editions.Washington, DC.
Luis, J. R., Rowold, D. J., Regueiro, M., Caeiro, B., Cin-nioglu, C., Roseman, C., Underhill, P. A., Cavalli-Sforza,
12 Annals of Human Genetics (2005) C© University College London 2005

Mediterranean Y Chromosome Population Structure
L. L. & Herrera, R. J. (2004) The Levant versus the Hornof Africa: evidence for bidirectional corridors of humanmigrations. Am J Hum Genet. 74, 532–544.
Malaspina, P., Tsopanomichalou, M., Duman, T. et al. (2001)A multistep process for the dispersal of a Y chromosomallineage in the Mediterranean area. Ann Hum Genet 65, 339–349.
Nebel, A., Filon, D., Weiss, D. A. et al. (2000) High-resolution Y chromosome haplotypes of Israeli and Pales-tinian Arabs reveal geographic substructure and substan-tial overlap with haplotypes of Jews. Hum Genet 107, 630–641.
Nebel, A., Filon, D., Brinkmann, B., Majumder, P. P., Faer-man, M. & Oppenheim, A. (2001) The Y chromosomepool of Jews as part of the genetic landscape of the MiddleEast. Am J Hum Genet 69, 1095–1112.
Nebel, A., Landau-Tasseron, E., Filon, D., Oppenheim, A. &Faerman, M. (2002) Genetic evidence for the expansion ofArabian tribes into the Southern Levant and North Africa.Am J Hum Genet 70, 1594–1596.
Plaza, S., Calafell, F., Helal, A. et al. (2003) Joining the pillarsof Hercules: mtDNA sequences show multidirectional geneflow in the western Mediterranean. Ann Hum Genet 67,312–328.
Pritchard, J. K., Stephens, M. & Donnelly, P. (2000) Inferenceof population structure using multilocus genotype data. Ge-netics 155, 945–959.
Quintana-Murci, L., Veitia, R., Fellous, M., Semino, O. &Poloni, E. S. (2003) Genetic structure of Mediterraneanpopulations revealed by Y-chromosome haplotype analysis.Am J Phys Anthropol 121, 157–171.
Ricci, L. (1984) L’expansion de l’arabie meridionale. In (Ed.J. Chelhod) L’Arabie du Sud. Maisonneuve et Larose, Paris,vol 1, pp 239–248.
Richards, M., Macaulay, V., Hickey, E. et al. (2000) TracingEuropean founder lineages in the Near Eastern mtDNApool. Am J Hum Genet 67, 1251–1276.
Richards, M., Macaulay, V., Torroni, A. & Bandelt, H. J.(2002) In search of geographical patterns in European mi-tochondrial DNA. Am J Hum Genet 71, 1168–1174.
Richards, M., Rengo, C., Cruciani, F. et al. (2003) ExtensiveFemale-Mediated Gene Flow from Sub-Saharan Africa intoNear Eastern Arab Populations. Am J Hum Genet 72, 1058–1064.
Romano, V., Cali, F., Ragalmuto, A. et al. (2003) A. Auto-somal microsatellite and mtDNA genetic analysis in Sicily(Italy). Ann Hum Genet 67, 42–53.
Rosser, Z. H., Zerjal, T., Hurles, M. E. et al. (2000)Y-chromosomal diversity in Europe is clinal and influencedprimarily by geography, rather than by language. Am J HumGenet 67, 1526–1543.
Rosenberg, N. A., Pritchard, J. K., Weber, J. L., Cann, H. M.,Kidd, K. K., Zhivotovsky, L. A. & Feldman, M. W. (2002)
Genetic structure of human populations. Science 298, 2381–2385.
Salas, A., Richards, M., Lareu, M. V., Scozzari, R., Coppa,A., Torroni, A., Macaulay, V. & Carracedo, A. (2004) TheAfrican diaspora: mitochondrial DNA and the Atlantic slavetrade. Am J Hum Genet 74, 454–465.
Schneider, S., Roessli, D. & Excoffier, L. (2000) ARLEQUINver. 2.00, A software for Population Genetic Data Analysis.Geneva: Genetics and Biometery Laboratory, Universityof Geneva.
Seielstad, M. T., Minch, E. & Cavalli-Sforza, L. L. (1998)Genetic evidence for a higher female migration rate in hu-mans. Nat Genet 20, 278–280.
Semino, O., Passarino, G., Oefner, P. J. et al. (2000) Thegenetic legacy of Paleolithic Homo sapiens sapiens in ex-tant Europeans: a Y chromosome perspective. Science 290,1155–1159.
Semino, O., Magri, C., Benuzzi, G. et al. (2004) Origin, dif-fusion, and differentiation of Y-chromosome haplogroups Eand J: inferences on the neolithization of Europe and latermigratory events in the Mediterranean area. Am J HumGenet 74, 1023–1034.
Simoni, L., Calafell, F., Pettener, D., Bertranpetit, J. & Bar-bujani, G. (2000) Geographic patterns of mtDNA diversityin Europe. Am J Hum Genet 66, 262–278.
Slatkin, M. (1995) A measure of population subdivision basedon microsatellite allele frequencies. Genetics 139, 457–462.
Stringer, C. & Gamble, C. (1993) In Search of the Neanderthals:Solving the Puzzle of Human Origins. pp. 96–122. Thamesand Hudson.
Thomas, M. G., Bradman, N. & Flinn, H. M. (1999) Highthroughput analysis of 10 microsatellite and 11 diallelicpolymorphisms on the human Y-chromosome. Hum Genet105, 577–581.
Thomas, M. G., Parfitt, T., Weiss, D. A. et al. (2000) Y chro-mosomes travelling south: the cohen modal haplotype andthe origins of the Lemba–the “Black Jews of SouthernAfrica”. Am J Hum Genet 66, 674–686.
Thomas, M. G., Weale, M. E., Jones, A. L. et al. (2002) Found-ing Mothers of Jewish Communities: Geographically Sepa-rated Jewish Groups Were Independently Founded by VeryFew Female Ancestors. Am J Hum Genet 70, 1411–1420.
Tishkoff, S. A., Varkonyi, R., Cahinhinan, N. et al. (2001)Haplotype diversity and linkage disequilibrium at humanG6PD: recent origin of alleles that confer malarial resis-tance. Science 293, 455–462.
Torroni, A., Bandelt, H. J., Macaulay, V. et al. (2001) A sig-nal, from human mtDNA, of postglacial recolonization inEurope. Am J Hum Genet 69, 844–852.
Wilson, J. F., Weiss, D. A., Richards, M., Thomas, M. G.,Bradman, N. & Goldstein, D. B. (2001) Genetic evidencefor different male and female roles during cultural transitionsin the British Isles. Proc Natl Acad Sci USA 98, 5078–5083.
C© University College London 2005 Annals of Human Genetics (2005) 13

C. Capelli et al.
Y Chromosome Consortium. (2002) A nomenclature systemfor the tree of human Y-chromosomal binary haplogroups.Genome Res 12, 339–348.
Verrelli, B. C., McDonald, J. H., Argyropoulos, G. et al. (2002)Evidence for balancing selection from nucleotide sequenceanalyses of human G6PD. Am J Hum Genet 71, 1112–1128.
Zvelebil, M. & Zvelebil, K. V. (1988) Agricultural tran-sition and Indo-European dispersals. Antiquity 62, 574–583.
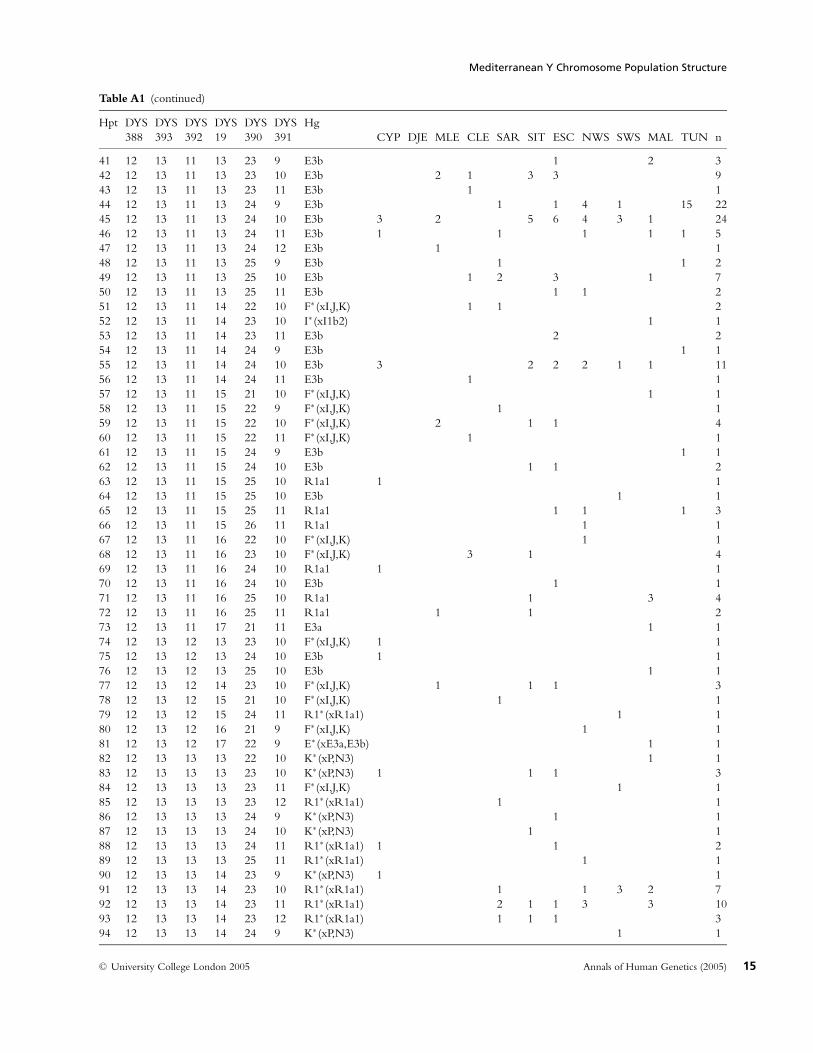
Table A1
Hpt DYS DYS DYS DYS DYS DYS Hg388 393 392 19 390 391 CYP DJE MLE CLE SAR SIT ESC NWS SWS MAL TUN n
1 9 13 11 13 24 10 E3b 1 12 9 14 12 15 23 11 F∗ (xI,J,K) 1 13 10 12 11 15 23 10 J2 1 14 10 13 11 13 24 10 E3b 2 25 10 13 13 15 24 12 R1∗ (xR1a1) 1 16 10 14 11 15 22 9 F∗ (xI,J,K) 1 17 11 13 11 15 22 11 A 1 18 11 13 13 14 23 10 K∗ (xP,N3) 1 19∗ 11 14 10 16 22 10 A 1 110∗ 11 14 11 13 24 10 A 1 111 12 11 14 14 22 10 K∗ (xP,N3) 1 112 12 11 14 14 25 10 K∗ (xP,N3) 1 113 12 12 11 13 23 11 E3b 1 114∗ 12 12 11 13 24 9 E3b 1 115 12 12 11 13 24 10 E3b 1 116 12 12 11 14 24 10 J2 1 117 12 12 11 14 24 11 R1∗ (xR1a1) 1 118 12 12 11 15 23 10 F∗ (xI,J,K) 2 219 12 12 13 13 24 10 R1∗ (xR1a1) 1 120 12 12 13 13 26 11 R1∗ (xR1a1) 1 121 12 12 13 14 23 10 K∗ (xP,N3) 1 122 12 12 13 14 23 10 R1∗ (xR1a1) 2 1 323 12 12 13 14 23 11 R1∗ (xR1a1) 1 124 12 12 13 14 24 10 R1∗ (xR1a1) 1 1 1 1 425 12 12 13 14 24 11 R1∗ (xR1a1) 1 1 1 326 12 12 13 14 25 10 R1∗ (xR1a1) 1 1 227 12 12 13 14 25 11 R1∗ (xR1a1) 1 128 12 12 13 15 25 10 R1∗ (xR1a1) 1 129 12 12 13 15 25 11 R1∗ (xR1a1) 1 1 230 12 12 14 14 23 10 P∗ (xR1) 1 131 12 12 14 14 23 10 K∗ (xP,N3) 1 132 12 12 14 14 24 10 R1∗ (xR1a1) 2 1 333 12 12 14 15 24 11 R1∗ (xR1a1) 1 134 12 12 15 14 24 10 R1∗ (xR1a1) 1 135 12 13 10 13 24 10 E3b 1 136 12 13 10 14 23 10 P∗ (xR1) 1 137 12 13 10 15 22 11 F∗ (xI,J,K) 1 138 12 13 11 9 24 11 E3b 1 139 12 13 11 13 21 8 E3b 1 140 12 13 11 13 22 10 E3b 1 1 2
Appendix
List of haplotypes (STRs plus hgs) and their occurrencein the populations investigated in this study. Codes as inTable A1. ∗Hg was identified as described in the text.
Received: 9 March 2005Accepted: 18 July 2005
14 Annals of Human Genetics (2005) C© University College London 2005
Mediterranean Y Chromosome Population Structure
Table A1 (continued)
Hpt DYS DYS DYS DYS DYS DYS Hg388 393 392 19 390 391 CYP DJE MLE CLE SAR SIT ESC NWS SWS MAL TUN n
41 12 13 11 13 23 9 E3b 1 2 342 12 13 11 13 23 10 E3b 2 1 3 3 943 12 13 11 13 23 11 E3b 1 144 12 13 11 13 24 9 E3b 1 1 4 1 15 2245 12 13 11 13 24 10 E3b 3 2 5 6 4 3 1 2446 12 13 11 13 24 11 E3b 1 1 1 1 1 547 12 13 11 13 24 12 E3b 1 148 12 13 11 13 25 9 E3b 1 1 249 12 13 11 13 25 10 E3b 1 2 3 1 750 12 13 11 13 25 11 E3b 1 1 251 12 13 11 14 22 10 F∗ (xI,J,K) 1 1 252 12 13 11 14 23 10 I∗ (xI1b2) 1 153 12 13 11 14 23 11 E3b 2 254 12 13 11 14 24 9 E3b 1 155 12 13 11 14 24 10 E3b 3 2 2 2 1 1 1156 12 13 11 14 24 11 E3b 1 157 12 13 11 15 21 10 F∗ (xI,J,K) 1 158 12 13 11 15 22 9 F∗ (xI,J,K) 1 159 12 13 11 15 22 10 F∗ (xI,J,K) 2 1 1 460 12 13 11 15 22 11 F∗ (xI,J,K) 1 161 12 13 11 15 24 9 E3b 1 162 12 13 11 15 24 10 E3b 1 1 263 12 13 11 15 25 10 R1a1 1 164 12 13 11 15 25 10 E3b 1 165 12 13 11 15 25 11 R1a1 1 1 1 366 12 13 11 15 26 11 R1a1 1 167 12 13 11 16 22 10 F∗ (xI,J,K) 1 168 12 13 11 16 23 10 F∗ (xI,J,K) 3 1 469 12 13 11 16 24 10 R1a1 1 170 12 13 11 16 24 10 E3b 1 171 12 13 11 16 25 10 R1a1 1 3 472 12 13 11 16 25 11 R1a1 1 1 273 12 13 11 17 21 11 E3a 1 174 12 13 12 13 23 10 F∗ (xI,J,K) 1 175 12 13 12 13 24 10 E3b 1 176 12 13 12 13 25 10 E3b 1 177 12 13 12 14 23 10 F∗ (xI,J,K) 1 1 1 378 12 13 12 15 21 10 F∗ (xI,J,K) 1 179 12 13 12 15 24 11 R1∗ (xR1a1) 1 180 12 13 12 16 21 9 F∗ (xI,J,K) 1 181 12 13 12 17 22 9 E∗ (xE3a,E3b) 1 182 12 13 13 13 22 10 K∗ (xP,N3) 1 183 12 13 13 13 23 10 K∗ (xP,N3) 1 1 1 384 12 13 13 13 23 11 F∗ (xI,J,K) 1 185 12 13 13 13 23 12 R1∗ (xR1a1) 1 186 12 13 13 13 24 9 K∗ (xP,N3) 1 187 12 13 13 13 24 10 K∗ (xP,N3) 1 188 12 13 13 13 24 11 R1∗ (xR1a1) 1 1 289 12 13 13 13 25 11 R1∗ (xR1a1) 1 190 12 13 13 14 23 9 K∗ (xP,N3) 1 191 12 13 13 14 23 10 R1∗ (xR1a1) 1 1 3 2 792 12 13 13 14 23 11 R1∗ (xR1a1) 2 1 1 3 3 1093 12 13 13 14 23 12 R1∗ (xR1a1) 1 1 1 394 12 13 13 14 24 9 K∗ (xP,N3) 1 1
C© University College London 2005 Annals of Human Genetics (2005) 15

C. Capelli et al.
Table A1 (continued)
Hpt DYS DYS DYS DYS DYS DYS Hg388 393 392 19 390 391 CYP DJE MLE CLE SAR SIT ESC NWS SWS MAL TUN n
95 12 13 13 14 24 10 F∗ (xI,J,K) 1 4 1 4 1 1196 12 13 13 14 24 11 R1∗ (xR1a1) 2 4 2 2 2 3 1597 12 13 13 14 24 12 R1∗ (xR1a1) 1 198 12 13 13 14 25 10 R1∗ (xR1a1) 1 199 12 13 13 14 25 11 R1∗ (xR1a1) 1 1 1 2 5100 12 13 13 15 23 10 P∗ (xR1) 1 1101 12 13 13 15 23 10 K∗ (xP,N3) 1 1102 12 13 13 15 23 10 R1∗ (xR1a1) 1 1 2103 12 13 13 15 23 11 K∗ (xP,N3) 1 1104 12 13 13 15 23 11 R1∗ (xR1a1) 1 1 1 3105 12 13 13 15 23 12 K∗ (xP,N3) 1 1106 12 13 13 15 24 10 R1∗ (xR1a1) 1 1107 12 13 13 15 24 11 K∗ (xP,N3) 1 1108 12 13 13 15 24 11 R1∗ (xR1a1) 1 1 1 1 2 1 1 8109 12 13 13 15 24 12 R1∗ (xR1a1) 1 1 2110 12 13 13 16 25 10 R1a1 1 1111 12 13 14 14 23 10 R1∗ (xR1a1) 1 1112 12 13 14 14 23 11 R1∗ (xR1a1) 1 1 1 3113 12 13 14 14 24 10 R1∗ (xR1a1) 1 1 2114 12 13 14 14 24 11 R1∗ (xR1a1) 1 1115 12 13 14 15 24 11 R1∗ (xR1a1) 1 1 2116 12 13 15 13 22 10 P∗ (xR1) 1 1117 12 13 15 14 23 11 R1∗ (xR1a1) 1 1118 12 14 10 14 23 10 P∗ (xR1) 1 1 2119 12 14 10 15 22 10 F∗ (xI,J,K) 2 2120 12 14 10 15 23 10 P∗ (xR1) 1 1121 12 14 11 13 23 10 E3b 1 1 2122 12 14 11 13 24 9 E3b 1 1 1 1 4123 12 14 11 13 24 10 E3b 2 1 3124 12 14 11 13 25 9 E3b 1 1125 12 14 11 14 22 10 F∗ (xI,J,K) 3 3126 12 14 11 14 23 10 F∗ (xI,J,K) 1 1127 12 14 11 15 21 10 F∗ (xI,J,K) 2 3 5128∗ 12 14 11 15 22 9 F∗ (xI,J,K) 1 1129 12 14 11 15 22 10 J∗ (xJ2) 1 1130 12 14 11 15 22 10 F∗ (xI,J,K) 2 1 3 2 1 9131 12 14 11 15 22 11 F∗ (xI,J,K) 2 2132 12 14 11 15 23 9 F∗ (xI,J,K) 1 1133 12 14 11 15 23 10 F∗ (xI,J,K) 1 1 2 4134 12 14 11 15 23 11 F∗ (xI,J,K) 1 1135 12 14 11 15 24 10 E3b 1 1136 12 14 11 16 23 10 F∗ (xI,J,K) 1 1137 12 14 11 17 22 11 F∗ (xI,J,K) 1 1138 12 14 12 15 22 10 F∗ (xI,J,K) 1 1139 12 14 12 15 23 9 F∗ (xI,J,K) 1 1140 12 14 12 16 24 10 F∗ (xI,J,K) 1 1141 12 14 13 13 24 11 R1∗ (xR1a1) 1 1142 12 14 13 14 23 10 K∗ (xP,N3) 1 1143 12 14 13 14 23 10 P∗ (xR1) 1 1144 12 14 13 14 24 10 R1∗ (xR1a1) 1 1 2145 12 14 13 14 24 11 R1∗ (xR1a1) 1 1146 12 14 13 15 22 10 K∗ (xP,N3) 1 1147 12 14 14 14 25 10 K∗ (xP,N3) 1 1
16 Annals of Human Genetics (2005) C© University College London 2005

Mediterranean Y Chromosome Population Structure
Table A1 (continued)
Hpt DYS DYS DYS DYS DYS DYS Hg388 393 392 19 390 391 CYP DJE MLE CLE SAR SIT ESC NWS SWS MAL TUN n
148 12 15 11 13 23 10 E3b 1 1 2149 12 15 11 14 21 10 F∗ (xI,J,K) 1 1150 12 15 11 15 23 10 F∗ (xI,J,K) 2 2151 12 15 11 16 22 10 F∗ (xI,J,K) 1 1152∗ 12 15 11 16 23 10 F∗ (xI,J,K) 1 1153 12 15 11 16 24 10 R1a1 1 1154 12 15 13 14 23 10 I∗ (xI1b2) 1 1155 12 15 13 14 23 10 F∗ (xI,J,K) 1 1156 13 12 11 14 24 9 C 1 1157 13 12 11 16 22 10 R1∗ (xR1a1) 1 1158 13 12 11 17 22 10 I∗ (xI1b2) 1 1159 13 12 13 14 25 11 R1∗ (xR1a1) 6 6160 13 12 13 14 26 10 R1∗ (xR1a1) 1 1161 13 12 13 14 26 11 R1∗ (xR1a1) 1 1162 13 12 13 15 23 10 J2 1 1163 13 13 11 13 24 11 E3b 1 1164 13 13 11 14 23 10 E3b 2 2165 13 13 11 14 24 10 E3b 2 2166 13 13 11 15 22 10 F∗ (xI,J,K) 1 1167 13 13 11 15 23 10 I∗ (xI1b2) 1 1168 13 13 11 15 23 10 I1b2 1 1169 13 13 11 15 23 11 I1b2 1 1170 13 13 11 15 24 10 E3b 1 1171 13 13 11 15 24 11 I∗ (xI1b2) 1 1 2172 13 13 11 15 25 10 I1b2 1 1173 13 13 11 15 25 11 I∗ (xI1b2) 1 1174 13 13 11 16 23 10 I1b2 5 5175 13 13 11 16 23 11 I∗ (xI1b2) 1 1 2176 13 13 11 16 24 9 I∗ (xI1b2) 1 1177 13 13 11 16 24 10 I1b2 1 1178 13 13 11 16 24 10 I∗ (xI1b2) 1 2 3179 13 13 11 16 24 11 I∗ (xI1b2) 1 1 2180 13 13 11 16 25 10 I∗ (xI1b2) 1 1181 13 13 11 17 23 10 I1b2 5 5182 13 13 11 17 24 10 I1b2 1 1 2183 13 13 11 17 24 11 F∗ (xI,J,K) 1 1184 13 13 11 17 25 10 I∗ (xI1b2) 1 1185 13 13 12 15 23 10 I∗ (xI1b2) 1 1 2186 13 13 12 16 24 11 I∗ (xI1b2) 1 1187 13 13 13 14 23 11 R1∗ (xR1a1) 1 1188 13 13 13 14 24 10 R1∗ (xR1a1) 1 1189 13 14 11 15 22 10 F∗ (xI,J,K) 1 1 2190 13 14 11 15 22 11 F∗ (xI,J,K) 1 1191 13 14 11 15 24 10 I∗ (xI1b2) 1 1192 13 14 11 15 24 11 I∗ (xI1b2) 1 1193 13 14 11 16 23 10 I1b2 4 4194 13 14 12 14 22 10 I∗ (xI1b2) 1 1195 13 14 12 15 23 10 I∗ (xI1b2) 1 1 3 1 6196 13 14 12 16 23 10 I∗ (xI1b2) 1 1197 13 14 13 13 24 11 R1∗ (xR1a1) 1 1198 13 14 13 15 22 10 I∗ (xI1b2) 1 4 5199 13 14 13 15 22 11 I∗ (xI1b2) 1 1200 13 14 13 16 22 10 I∗ (xI1b2) 2 2
C© University College London 2005 Annals of Human Genetics (2005) 17

C. Capelli et al.
Table A1 (continued)
Hpt DYS DYS DYS DYS DYS DYS Hg388 393 392 19 390 391 CYP DJE MLE CLE SAR SIT ESC NWS SWS MAL TUN n
201 14 12 11 14 23 9 J2 1 1202 14 12 11 14 23 10 J2 1 1203 14 12 11 14 23 11 J2 2 2204 14 12 11 14 24 10 J2 1 2 1 1 5205 14 12 11 14 25 10 J2 1 1206 14 12 11 15 23 10 J2 1 1 2 4207 14 12 13 14 24 10 R1∗ (xR1a1) 1 1208 14 13 11 13 24 10 E3b 1 1209 14 13 11 14 22 10 I∗ (xI1b2) 1 1210 14 13 11 14 25 10 E3b 1 1211 14 13 11 15 23 10 I1b2 1 1212 14 13 11 16 23 10 I∗ (xI1b2) 1 1213 14 13 11 16 24 11 I∗ (xI1b2) 1 1214 14 13 11 17 23 10 I∗ (xI1b2) 2 2215 14 13 12 15 22 11 I∗ (xI1b2) 1 1216 14 13 13 14 23 10 R1∗ (xR1a1) 3 3217 14 14 12 15 23 11 I∗ (xI1b2) 1 1218 15 12 11 13 22 9 J2 1 1219 15 12 11 13 24 10 J∗ (xJ2) 2 2220 15 12 11 14 20 10 J2 2 2221 15 12 11 14 22 9 J2 1 1222 15 12 11 14 22 10 J2 1 2 1 1 1 1 7223 15 12 11 14 22 11 J2 1 1224 15 12 11 14 23 9 J2 1 2 3225 15 12 11 14 23 10 J2 7 2 4 2 6 3 24226 15 12 11 14 23 11 J∗ (xJ2) 2 1 4 1 8227 15 12 11 14 24 10 J2 1 2 1 1 3 3 11228 15 12 11 14 24 11 J2 1 1 2229 15 12 11 14 25 11 J2 1 1230 15 12 11 15 22 10 J2 1 1 2231 15 12 11 15 23 10 J2 1 3 1 4 9232 15 12 11 15 24 10 J2 1 1 1 1 4233 15 12 11 15 24 11 J2 1 1234 15 12 11 15 25 10 J∗ (xJ2) 1 1235 15 12 11 16 23 10 J2 2 1 3236 15 12 11 16 24 11 J2 3 3237 15 12 11 16 24 12 J2 1 1238 15 12 12 15 24 10 J2 1 1239 15 12 14 14 24 10 J∗ (xJ2) 1 1240 15 12 15 14 23 10 J∗ (xJ2) 1 1241 15 13 11 14 22 10 J2 3 1 4242 15 13 11 14 23 10 J2 1 2 3243 15 13 11 14 24 11 J2 1 1244 15 13 11 15 22 10 J2 1 1245 15 13 11 15 22 11 J2 1 3 4246 15 13 11 15 23 10 F∗ (xI,J,K) 1 1247 15 13 11 15 23 10 J2 1 1 1 3248 15 14 11 15 23 10 F∗ (xI,J,K) 1 1249 16 12 11 13 24 10 J2 1 1250 16 12 11 14 22 10 J2 1 1251 16 12 11 14 22 10 J∗ (xJ2) 1 1252 16 12 11 14 22 10 J2 1 1253 16 12 11 14 23 9 J∗ (xJ2) 1 1
18 Annals of Human Genetics (2005) C© University College London 2005

Mediterranean Y Chromosome Population Structure
Table A1 (continued)
Hpt DYS DYS DYS DYS DYS DYS Hg388 393 392 19 390 391 CYP DJE MLE CLE SAR SIT ESC NWS SWS MAL TUN n
254 16 12 11 14 23 10 J∗ (xJ2) 3 3255 16 12 11 14 23 10 J2 1 1 1 1 4256 16 12 11 14 23 10 J∗ (xJ2) 1 1 2 3 2 5 14257 16 12 11 14 23 11 J2 1 1258 16 12 11 14 23 11 J∗ (xJ2) 1 1 1 3259 16 12 11 14 23 12 J∗ (xJ2) 1 1260 16 12 11 14 24 10 J∗ (xJ2) 1 1261 16 12 11 15 23 9 J2 2 1 3 1 1 8262 16 12 11 15 23 10 J∗ (xJ2) 1 1 2263 16 12 11 15 23 10 J2 1 2 3264 16 12 11 15 24 9 J2 1 1265 16 12 11 15 24 9 J∗ (xJ2) 2 2266 16 12 11 15 24 10 J2 1 1 2267 16 12 11 16 23 9 J2 1 1268 16 12 12 14 23 10 J2 1 1 2269 16 12 12 14 23 10 J∗ (xJ2) 1 1 2270 16 13 11 15 22 10 J∗ (xJ2) 1 1271 16 14 11 14 23 10 J∗ (xJ2) 1 1272 17 12 11 13 23 11 J∗ (xJ2) 1 1273 17 12 11 14 22 11 J∗ (xJ2) 1 1274 17 12 11 14 23 10 J∗ (xJ2) 1 1 2 4275 17 12 11 14 23 11 J2 1 1276 17 12 11 14 23 11 J∗ (xJ2) 2 1 3 6277 17 12 11 14 24 10 J2 1 1278 17 12 11 14 24 10 J∗ (xJ2) 1 1279 17 12 11 15 23 10 J2 1 1280 17 12 11 15 23 10 J∗ (xJ2) 1 1281 17 12 11 15 23 11 J∗ (xJ2) 2 2282 17 12 11 16 25 10 J2 1 1283 17 12 11 17 23 9 J2 1 1284 17 12 11 17 23 10 J∗ (xJ2) 1 1285 17 13 11 14 23 10 J2 1 1286 18 12 11 14 22 9 J∗ (xJ2) 1 1287 18 12 11 14 22 11 J∗ (xJ2) 1 1288 18 12 11 14 23 10 J2 1 1289 18 12 11 14 23 11 J∗ (xJ2) 1 1290 18 12 11 15 23 10 J∗ (xJ2) 1
65 19 39 43 81 68 87 70 55 90 39 656
C© University College London 2005 Annals of Human Genetics (2005) 19
Copyright © 2022 FDOKUMEN