A restored section of the “southern Variscan realm” across the Corsica–Sardinia microcontinent
Upload
independentCategory
view
0download
0
Peopling of Three Mediterranean Islands (Corsica,Sardinia, and Sicily) Inferred by Y-ChromosomeBiallelic VariabilityP. Francalacci,1* L. Morelli,1 P.A. Underhill,2 A.S. Lillie,2 G. Passarino,3 A. Useli,1 R. Madeddu,1
G. Paoli,4 S. Tofanelli,4 C.M. Calo,5 M.E. Ghiani,5 L. Varesi,6 M. Memmi,6 G. Vona,5 A.A. Lin,2
P. Oefner,7 and L.L. Cavalli-Sforza2
1Dipartimento di Zoologia e Antropologia Biologica, Universita di Sassari, 07100 Sassari, Italy2Department of Genetics, Stanford University, Stanford, California 94305-51203Dipartimento di Biologia Cellulare, Universita della Calabria, 87030 Rende, Italy4Dipartimento di Etologia, Ecologia ed Evoluzione, Universita di Pisa, 56123 Pisa, Italy5Dipartimento di Biologia Sperimentale, Universita di Cagliari, 09100 Cagliari, Italy6Faculte des Sciencies et Techniques, Universite de Corse, Corte, France7Stanford Sequencing and Technology Center, Palo Alto, California
KEY WORDS Y-chromosome; population genetics; Mediterranean populations
ABSTRACT An informative set of biallelic polymor-phisms was used to study the structure of Y-chromosomevariability in a sample from the Mediterranean islands ofCorsica and Sicily, and compared with data on Sardinia togain insights into the ethnogenesis of these island popu-lations. The results were interpreted in a broader Medi-terranean context by including in the analysis neighbor-ing populations previously studied with the samemethodology. All samples studied were enclosed in thecomparable spectrum of European Y-chromosome vari-ability. Pronounced differences were observed betweenthe islands as well as in the percentages of haplotypespreviously shown to have distinctive patterns of continen-tal phylogeography. Approximately 60% of the Sicilianhaplotypes are also prevalent in Southern Italy and
Greece. Conversely, the Corsican sample had elevatedlevels of alternative haplotypes common in Northern It-aly. Sardinia showed a haplotype ratio similar to thatobserved in Corsica, but with a remarkable difference inthe presence of a lineage defined by marker M26, whichapproaches 35% in Sardinia but seems absent in Corsica.Although geographically adjacent, the data suggest differ-ent colonization histories and a minimal amount of recentgene flow between them. Our results identify possibleancestral continental sources of the various island popu-lations and underscore the influence of founder effect andgenetic drift. The Y-chromosome data are consistent withcomparable mtDNA data at the RFLP haplogroup level ofresolution, as well as linguistic and historic knowledge. AmJ Phys Anthropol 121:270–279, 2003. © 2003 Wiley-Liss, Inc.
The contemporary genetic structure of Homo sa-piens in the Mediterranean basin is an amalgamshaped by numerous prehistoric African and Euro-pean population influences. This study is based onthe concept that living populations on the majorislands of the western Mediterranean (Sicily, Sardi-nia, and Corsica) retain a recoverable genetic recordreflective of various episodes of human movementsand settlement.
The largest island, Sicily, is closest to the main-land and shares considerable history with the Ital-ian peninsula and the populations of Southern Italy.During the historic period, Sicily was populated bydifferent peoples of both Indo-European (Sicels) andnon-Indo-European (Sicans, Elymes) origin (Devoto,1977). Subsequently, significant influences were im-parted by the Phoenicians in the West and Greeks inthe East. After the Roman period, Sicily was in-vaded by German tribes such as the Visigoths, andlater ruled by the Arabs and Normans. During thesecenturies, an appreciable immigration from both
Central-North Europe and North Africa is histori-cally documented. The genetic background of Sicily,as inferred by classical markers, is still debated,possibly a result of the different types of geneticprofiling used. Some authors described a western-eastern differentiation, reflecting the division of the
Grant sponsor: Italian National Council of Research; Grant num-ber: CNR 97.00712PF36; Grant sponsor: Interreg III; Grant sponsor:MURST 60%; Grant sponsor: 40% Cofin; Grant sponsor: University ofSassari; Grant number: L.27.12.97, art.51; Grant sponsor: NIH;Grant numbers: GM 28428, GM 55273.
*Correspondence to: Paolo Francalacci, Dipartimento di Zoologia eAntropologia Biologica, Universita di Sassari, Via Regina Margherita15, 07100 Sassari, Italy. E-mail: [email protected]
Received 25 January 2001; accepted 9 January 2003.
DOI 10.1002/ajpa.10265
AMERICAN JOURNAL OF PHYSICAL ANTHROPOLOGY 121:270–279 (2003)
© 2003 WILEY-LISS, INC.

island between Indo-European and non-Indo-Euro-pean populations (Piazza et al., 1988), while othersfound genetic homogeneity (Rickards et al., 1998).
Corsica and especially Sardinia are more isolated,although the former can be seen from the Italianmainland. The two islands presumably shared asimilar history during their early stages of coloniza-tion. Among the human remains of this period thereare the right temporal and left maxilla bones fromCorbeddu Cave in central Sardinia (radiocarbon-dated to 8,750 � 140 bp) (Spoor and Sondaar, 1986),and the human female skeleton of Araguina-Sen-nola (Corsica) dated to 8,300 � 130 bp (Lanfranchiand Weiss, 1997). Some influence from the IberianPeninsula is apparent, especially for Sardinia (Caoet al., 1989; Paulis, 1995).
Carthaginian and Roman pressure pushed the in-digenous non-Indo-European inhabitants of Sardi-nia (the Nuragians) into the hilly central region ofthe island. Both external cultural and genetic con-tacts have been minimal, making this the most con-servative region of the island from a linguistic (Con-tini et al., 1988–1989) and genetic (Piazza et al.,1988; Cappello et al., 1996) perspective. Corsica hasalways been scarcely populated, barely approaching100,000 inhabitants until the end of the 18th cen-tury (Memmi, 1999), and possibly experienced a con-traction in size during the Middle Ages due to theimpacts of Saracen incursions and epidemic dis-eases. The economy of the island flourished follow-ing the Pisan rule that left a footprint epitomized bythe Neolatin language. Genoan city-state gover-nance replaced Pisan rule for many centuries, whichwas eventually followed by French control. In thelatter period, the population increased to 250,000inhabitants. Studies on classical genetic markershave given discordant results, with some reportsshowing the genetic similarity of Corsica and Sardi-nia (Varesi et al., 1996; Memmi et al., 1998), andothers stressing the genetic diversity between thetwo neighboring islands (Calafell et al., 1996; Moralet al., 1996).
The stratification of gene pools of the islands wasinvestigated through analysis of binary polymor-phisms (on the nonrecombining portion of the Ychromosome (NRY) in a sample of Corsican andSicilian human Y chromosomes), and evaluated withprevious data obtained with the same methodologyin central Sardinia (Semino et al., 2000). Subse-quently, the perspectives drawn from patterns ofY-chromosome haplotypes were compared withthose derived from studies of mitochondrial DNA(mtDNA) coding and noncoding region sequencevariation performed on the same islands (Morelli etal., 2000). The formation of a population or a culturecan only be completely understood by an integrationof comprehensive genetic, linguistic, historical, ar-chaeological, and anthropological data. For this rea-son, it is not possible to associate automatically agenetic trait with a population, especially consider-ing the recency and relative homogeneity of the hu-
man species, where most of the alleles are sharedamong populations. However, DNA segments de-fined by numerous linked polymorphisms (i.e., hap-lotypes) allow a detailed population genetic analysisof the history of the molecule, thus providing anindex of population subdivision and gene flow in astraightforward manner (Harding et al., 1997). Thesmaller effective population size of the nonrecombin-ing haploid mtDNA and Y-chromosome loci resultsin a more rapid divergence relative to the auto-somes, providing more precise dissection of historicstrata. The nonrandom distribution of distinctivestable haplotypes can display a correspondence withgeography, thus providing patterns of affinity andclues concerning past human movements. Such ge-netic data are independent of, but often compatiblewith, scenarios inferred from nongenetic knowledge.On the European continent, genetic analyses of pro-tein variants and autosomal DNA polymorphismsindicate a southeast-northwest gradient, which wasattributed to the demic diffusion of agriculturalistsand pastoralists from the Near East that mergedwith the preexisting Mesolithic population (Menozziet al., 1978; Ammerman and Cavalli-Sforza, 1984;Sokal et al., 1991; Barbujani et al., 1994).
The peculiar genetic transmission of these sys-tems, matrilineal for mtDNA and patrilineal for theY chromosome, provides a useful tool for the infer-ence of human evolution, demographic history, andpopulation migration and admixture (Cann et al.,1987; Jobling and Tyler-Smith, 1995; Hammer andZegura, 1996). Despite being single nonrecombiningDNA molecules susceptible to gender-specific popu-lation dynamics, and the fact that their smaller ef-fective population size makes them more sensitive tostochastic processes (Edwards and Beerli, 2000),both haploid molecules have been used for popula-tion studies at both global and regional levels. Non-random distributions of mtDNA and Y-chromosomehaplotypes in Europe have been reported, wherefrequency gradients were detected for some mtDNAhaplogroups, such as H, J, T, and V. These havebeen interpreted as a reflection of past demographicevents, including the possible expansion of agricul-turalists from the Near East (Richards et al., 2000),the effect of the recolonization of Europe followingthe Last Glacial Maximum (LGM) (Torroni et al.,2001), and the persistence of lineages with pre-LGMheritage in the mitochondrial pool (Salas et al.,1998).
Similarly, southeast-northwest clines were recog-nized in Europe from the analysis of several Y-chro-mosome microsatellites (Semino et al., 1996;Malaspina et al., 1998, 2001; Casalotti et al., 1999;Rosser et al., 2000). These authors considered suchclines consistent with the demic diffusion model ofagriculture and the transition to a domestic econ-omy, while a minor east-west cline was proposed asa signal of an expansion from north of the Black Sea(Rosser et al., 2000).
Y-CHROMOSOME VARIABILITY IN MEDITERRANEAN ISLANDS 271

Because of high mutability, equivalently definedmicrosatellite haplotypes may not necessarily havecommon ancestry. However, binary polymorphismson the Y chromosome are generally consideredunique events (Jobling and Tyler-Smith, 1995), im-plying that all chromosomes that shared a derivedallele descend from a single male ancestor. Recentprogress in deciphering the Y-chromosome binarypolymorphism genealogy in contemporary popula-tions (Underhill et al., 2000) provides new impetusfor reevaluating views of prehistoric affinity andsubsequent diversification. In a manner analogousto what has been done for mtDNA (Torroni et al.,1993, 1996; Macaulay et al., 1999), the differenthaplotypes have been grouped into arbitrary haplo-groups identified by mutations occupying internalpositions in the phylogeny (Y Chromosome Consor-tium, 2002). Semino et al. (2000) used the distribu-tion of Y-chromosome binary haplotypes to infer dif-ferent demographic episodes associated with thecolonization of modern humans in Europe. Thesepan-European data provide a frame of reference forevaluating populations of the Mediterranean basin.
Here we report on the substructure of Y-chromo-some binary haplotypes on three western Mediter-ranean islands with complex histories of coloniza-tion, in an attempt to disentangle the differentialethnogenesis of each population. We also comparedpaternal Y-chromosome and maternal mtDNA per-spectives for any evidence of differential sex-specificinfluences.
MATERIALS AND METHODS
DNA was extracted from blood sampled in 85healthy unrelated male individuals using standardprocedures (Maniatis et al., 1990). A total of 51 camefrom western Sicily, and 34 from Corsica (sampledaround the towns of Corte in the center of the island,and Bastia in the north). In addition, one individualfrom Tuscany and one from Sardinia were also an-alyzed as control samples, and included in the com-parisons with other Mediterranean populations.
Since Y-chromosome haplogroups have a nonran-dom geographic distribution, we were able to limitthe analysis to geographically relevant markers. Intotal, 17 fragments from the NRY, which contained20 variable sites (16 SNPs, 3 small insertion/dele-tions, and 1 Alu insertion) were amplified. Detailsconcerning the NRY markers are given in Underhillet al. (2001).
A single thermal cycling protocol was used. Thisinvolves an initial denaturation at 95°C for 10 minto activate AmpliTaq Gold�, 14 cycles of denatur-ation at 94°C for 20 sec, primer annealing at 63–56°C using 0.5°C decrements, and extension at 72°Cfor 1 min, followed by 20 cycles at 94°C for 20 sec,56°C for 1 min, and 72°C for 1 min, and a final 5-minextension at 72°C. Each 50-�l PCR reaction con-tained 1 U of AmpliTaq Gold� polymerase, 10 mMTris-HCl, pH 8.3, 50 mM KCl, 2.5 mM MgCl2, 0.1mM each of the four deoxyribonucleotide triphos-
phates, 0.2 �M each of forward/reverse primers, and50 ng of genomic DNA.
After confirmation of successful amplification byagarose gel analysis, each fragment was combinedwith an equivalent amplicon generated from DNA ofa known allelic state. The mixtures were then dena-tured at 95°C for 1 min, and than reannealed bycooling to 65°C at a rate of 1°C per minute to poten-tially form heteroduplex and homoduplex molecules.The hybridized molecules were subsequently geno-typed by denaturing high-performance liquid chro-matography (D-HPLC), as described in Underhill etal. (1997). The temperature used for analysis of eachfragment was determined using the melting algo-rithm available at: http://insertion.stanford.edu/melt.html. The homoduplex and heteroduplex chro-matographic results were used to score the allelicstate of each marker, and hence to construct thehaplotype of each sample.
The seven samples showing the M89 marker forwhich no further downstream markers were de-tected were subsequently typed at the p12f2 locus,according to Sun et al. (2000).
Genetic distances were computed from haplotypefrequencies according to Nei (1972). A phylogenetictree was constructed, using the UPGMA method ofclustering in the Phylogeny Inference Package,Phylip version 3.2 (Felsentein, 1989). An unbiasedestimate of haplotype diversity, h, and its variance,V(h), were calculated according to the method of Nei(1987, formulas 8.5 and 8.13 therein). The SE of h,SE(h), was calculated by taking the square root ofV(h). Genetic relationships between different popu-lations based on haplotype frequencies were furtherexplored by analysis of molecular variance(AMOVA), as implemented in Arlequin (Schneideret al., 2000). Analyses were performed consideringhaplotype frequencies only. Significance levels ofpairwise genetic distances between populationswere estimated by 10,000 permutations. Mismatchdistributions and D (Tajima, 1989) and Fs (Fu, 1997)neutrality statistics were computed for both the Cor-sica and Sardinia mtDNA RFLP data of Morelli etal. (2000) and the new Sicilian mtDNA RFLP re-ported here using the Arlequin package. Similarcomputations were conducted on the companion Y-chromosome data.
RESULTS
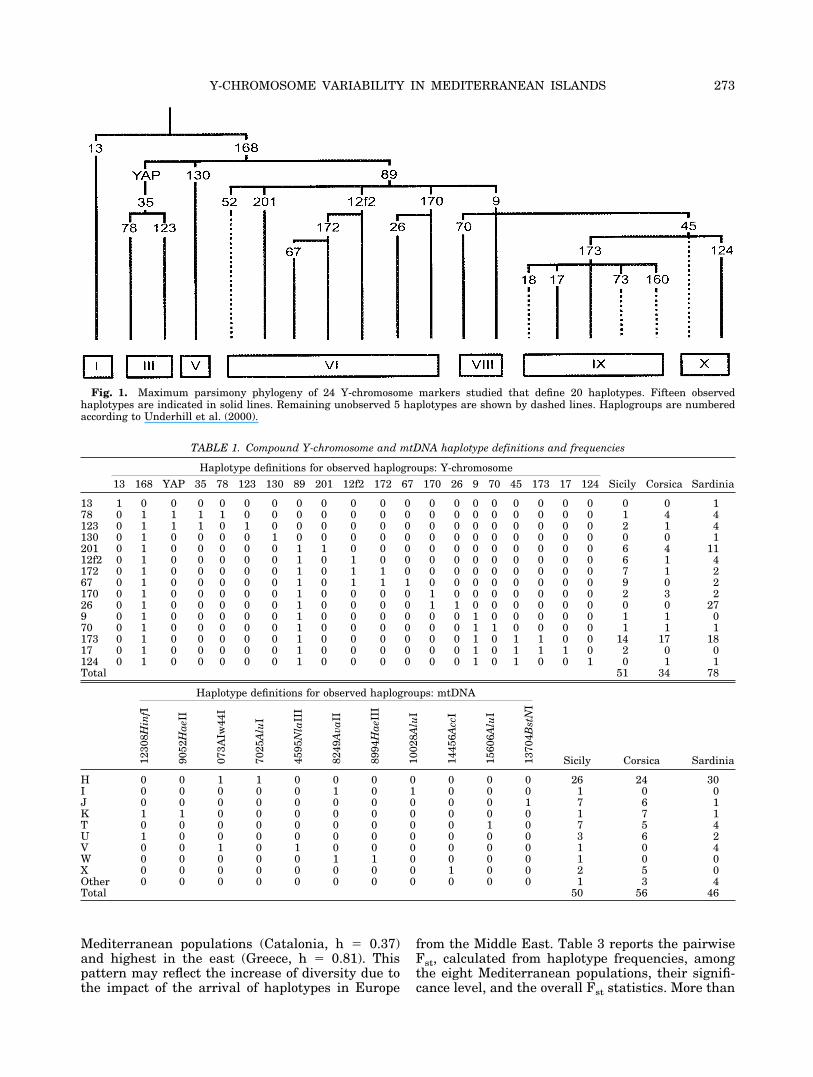
The phylogenetic relationships of the 24 variableY-chromosome sites defining 20 haplotypes ana-lyzed in this study are shown in Figure 1. Twentymarkers were polymorphic. Both the observedmtDNA RFLP and Y-chromosome haplotypes andtheir frequency by population are specified in Table 1.
The haplotype diversity, h, and its variance, V(h),are shown in Table 2. The three islands show similarvalues, with a slightly reduced variability in Cor-sica, possibly due to the smaller sample size. Thehaplotype diversity values are lowest in the western
272 P. FRANCALACCI ET AL.
Mediterranean populations (Catalonia, h � 0.37)and highest in the east (Greece, h � 0.81). Thispattern may reflect the increase of diversity due tothe impact of the arrival of haplotypes in Europe
from the Middle East. Table 3 reports the pairwiseFst, calculated from haplotype frequencies, amongthe eight Mediterranean populations, their signifi-cance level, and the overall Fst statistics. More than
Fig. 1. Maximum parsimony phylogeny of 24 Y-chromosome markers studied that define 20 haplotypes. Fifteen observedhaplotypes are indicated in solid lines. Remaining unobserved 5 haplotypes are shown by dashed lines. Haplogroups are numberedaccording to Underhill et al. (2000).
TABLE 1. Compound Y-chromosome and mtDNA haplotype definitions and frequencies
Haplotype definitions for observed haplogroups: Y-chromosome
Sicily Corsica Sardinia13 168 YAP 35 78 123 130 89 201 12f2 172 67 170 26 9 70 45 173 17 124
13 1 0 0 0 0 0 0 0 0 0 0 0 0 0 0 0 0 0 0 0 0 0 178 0 1 1 1 1 0 0 0 0 0 0 0 0 0 0 0 0 0 0 0 1 4 4123 0 1 1 1 0 1 0 0 0 0 0 0 0 0 0 0 0 0 0 0 2 1 4130 0 1 0 0 0 0 1 0 0 0 0 0 0 0 0 0 0 0 0 0 0 0 1201 0 1 0 0 0 0 0 1 1 0 0 0 0 0 0 0 0 0 0 0 6 4 1112f2 0 1 0 0 0 0 0 1 0 1 0 0 0 0 0 0 0 0 0 0 6 1 4172 0 1 0 0 0 0 0 1 0 1 1 0 0 0 0 0 0 0 0 0 7 1 267 0 1 0 0 0 0 0 1 0 1 1 1 0 0 0 0 0 0 0 0 9 0 2170 0 1 0 0 0 0 0 1 0 0 0 0 1 0 0 0 0 0 0 0 2 3 226 0 1 0 0 0 0 0 1 0 0 0 0 1 1 0 0 0 0 0 0 0 0 279 0 1 0 0 0 0 0 1 0 0 0 0 0 0 1 0 0 0 0 0 1 1 070 0 1 0 0 0 0 0 1 0 0 0 0 0 0 1 1 0 0 0 0 1 1 1173 0 1 0 0 0 0 0 1 0 0 0 0 0 0 1 0 1 1 0 0 14 17 1817 0 1 0 0 0 0 0 1 0 0 0 0 0 0 1 0 1 1 1 0 2 0 0124 0 1 0 0 0 0 0 1 0 0 0 0 0 0 1 0 1 0 0 1 0 1 1Total 51 34 78
Haplotype definitions for observed haplogroups: mtDNA
Sicily Corsica Sardinia1230
8Hin
fI
9052
Hae
II
073A
Iw44
I
7025
Alu
I
4595
Nla
III
8249
Ava
II
8994
Hae
III
1002
8Alu
I
1445
6Acc
I
1560
6Alu
I
1370
4Bst
NI
H 0 0 1 1 0 0 0 0 0 0 0 26 24 30I 0 0 0 0 0 1 0 1 0 0 0 1 0 0J 0 0 0 0 0 0 0 0 0 0 1 7 6 1K 1 1 0 0 0 0 0 0 0 0 0 1 7 1T 0 0 0 0 0 0 0 0 0 1 0 7 5 4U 1 0 0 0 0 0 0 0 0 0 0 3 6 2V 0 0 1 0 1 0 0 0 0 0 0 1 0 4W 0 0 0 0 0 1 1 0 0 0 0 1 0 0X 0 0 0 0 0 0 0 0 1 0 0 2 5 0Other 0 0 0 0 0 0 0 0 0 0 0 1 3 4Total 50 56 46
Y-CHROMOSOME VARIABILITY IN MEDITERRANEAN ISLANDS 273

90% of the total variability of the MediterraneanY-chromosome gene pool is within populations. Thevariability among populations, although represent-ing only 8.5 of the total value, is highly significant(P � 0.00001, 10,000 permutations). This value isabout a half of that obtained from the same analysiscarried out on the whole of Europe, including theSicilians and Corsicans studied here, the popula-tions reported in Semino et al. (2000), and a Norwe-gian sample (G. Passarino, unpublished results),where the variance among populations reached19.11%.
Sardinia was highly differentiated from all theother populations due in large part to the haplotypedefined by M26 that is exceedingly rare elsewhere.Corsica is not significantly different from continen-tal Italian and French populations, while the high-est significance value occurs in the comparison ofCorsica with Sardinia. Sicily was significantly dif-ferent from all other populations, except Calabria in
southern Italy, with no significant Fst values in thiscase.
Using the observed mtDNA and Y chromosomehaplotypes defined in Table 1, both mismatch distri-butions and neutrality statistics D and Fs were com-puted (Table 4) to investigate if the mtDNA andY-chromosome data suggest any population dy-namic or natural selection differences. Whenchecked against the respective population sizes, allD values were found to be not significantly differentfrom zero. In addition, based on the P-values gener-ated by the Arlequin package, the Fs neutrality sta-tistic of Fu (1997) was insignificant in all cases.
Visual inspection of the mismatch distributions(not shown) did not suggest any major difference inmodalities. Harpending’s “raggedness” indices fromthe mismatch distributions, along with their respec-tive P-values, are also shown for each sex-specificsystem in Table 4. Only Corsica had significant “rag-gedness” indices for both loci. For this island, the
TABLE 2. Percentage of haplotypes, haplotype diversity, h, and its error, se(h), observed in this sample and in reference populations
Population M35 M172 M89 M201 M170 M26 M173 M17 Other Sample size h SE(h)
Sicily 5.9 31.4 11.8 11.8 3.9 0.0 27.5 3.9 3.9 51 0.7983 0.0217Corsica 14.7 2.9 2.9 11.8 8.8 0.0 50.0 0.0 8.8 34 0.7077 0.0488NC Italy 2.0 14.0 0.0 10.0 8.0 0.0 62.1 4.0 0.0 50 0.5834 0.0509Calabria 13.5 21.6 10.8 8.1 0.0 0.0 32.4 0.0 13.5 37 0.8042 0.0223Sardinia 10.3 5.1 5.1 14.1 2.6 34.6 23.1 0.0 5.2 78 0.7930 0.0187France 8.7 13.0 4.3 0.0 17.4 0.0 52.2 0.0 4.3 23 0.6841 0.0607Catalonia 4.2 4.2 0.0 8.3 4.2 0.0 79.2 0.0 0.0 24 0.3687 0.0863Greece 22.4 21.0 1.3 2.6 7.9 0.0 27.6 11.8 5.2 76 0.8108 0.0131
NC, Northern-Central.
TABLE 3. Fst statistics calculated from haplotype frequencies in 8 mediterranean populations, and matrix of pairwise Fst values(below diagonal) and Fst probability values (1,000 permutations, above diagonal)1
Percentage ofvariation
Among populations 8.50Within populations
91.50Significance (10,000 permutations)
P � 0.00001
Sicily Corsica N. Italy Calabria Sardinia France Catalonia Greece
Sicily 0.00330* 0.00060* 0.49875 0.00000* 0.02420* 0.00000* 0.03570*Corsica 0.06982 0.13669 0.08239 0.00040* 0.59554 0.04780* 0.00740*NC Italy 0.09146 0.01665 0.00280* 0.00000* 0.40126 0.24218 0.00000*Calabria �0.00388 0.02536 0.07593 0.00020* 0.10809 0.00030* 0.17938Sardinia 0.09760 0.09807 0.16041 0.07977 0.00020* 0.00000* 0.00000*France 0.05250 �0.01005 �0.00092 0.02752 0.11879 0.05539 0.03560*Catalonia 0.19194 0.05496 0.01025 0.15976 0.22571 0.05771 0.00000*Greece 0.02316 0.04796 0.09640 0.00999 0.09652 0.03973 0.17844
1 Asterisk indicates significant Fst P values (significance level � 0.05).NC, Northern-Central.
TABLE 4. Measures of genetic diversity estimated from Y-chromosome and mtDNA data1
Population N Hp D Fs P (Fs) r P (r)
Y-chromosomeSicily 51 11 0.0973 �0.3806 0.4860 0.0407 0.3580Corsica 34 10 �0.1692 �0.8459 0.3890 0.2023 0.0260Sardinia 78 13 �0.2303 �0.5474 0.4990 0.0888 0.0330mtDNASicily 50 10 �0.5704 �1.9980 0.1980 0.3577 0.0070Corsica 56 7 0.9942 0.6766 0.7120 0.1986 0.0110Sardinia 46 7 �0.3353 �0.9716 0.3390 0.2662 0.1840
1 N, sample size; Hp, number of different haplogroups observed; D, Tajima’s D; Fs, Fu’s Fs; P(Fs), P-value for Fs; r, Harpending’sraggedness index; P(r), P-value for r.
274 P. FRANCALACCI ET AL.

indices reveal no detectable difference between themismatch distributions for both molecules. No con-clusions could be drawn using the “raggedness” in-dices for Sicily and Sardinia.
DISCUSSION
Although the genetic landscape of Europe reflectsgene diversification and microgeographic demogra-phy, including both size fluctuations, range expan-sions, and isolation by distance since the LGM (He-witt, 2000), the associated phylogeography ofmolecular antecedents to post-LGM diversificationprovides an opportunity to recover insights of popu-lation origins from earlier times (Underhill et al.,2001). The sequential accumulation of bifurcatingmutations in the phylogeny is unequivocal, as sup-ported by a consistency index (Kluge and Farris,1969) of 0.98 for the 218-marker phylogeny of Un-derhill et al. (2001). However, determining an accu-rate temporal chronology of specific haplotypes isdifficult, given the considerable uncertainties re-garding both population dynamics and Y-chromo-some microsatellite evolutionarily relevant muta-tion rates (see note 23, Semino et al., 2000). Thelevel of microsatellite variation associated with spe-cific binary haplotypes provides an index of theirrelative ages, regardless of the algorithms and as-sumptions used. Finally, leveraging paleoclimaticand archaeological knowledge provides an indepen-dent context for phylogeography (Foley, 1998). Aprevious survey on the European Y chromosome(Semino et al., 2000) showed haplotype frequencydistributions indicating a pronounced substructureaffiliated with geography. The habitation of thewestern Mediterranean islands during the past10,000 years has a complex history. Nonetheless,the availability of corresponding haplotype datafrom Europe and adjacent regions (Semino et al.,2000) provides the opportunity to either exclude orlocalize possible continental sources of post-LGMhunter-gathers and agriculturalists to the islands.
Semino et al. (2000) showed that the major com-ponent radiating from Iberia following the LGM in-volved RFLP 49a,f ht 15, a derivative of the M173haplotype. Support for this scenario was obtainedusing independent samples and the P25 �DYS194469 tranversion (Wilson et al., 2001). An-other relevant haplotype involves the M170 trans-version that arose in situ in Central Europe from anundifferentiated M89 ancestor who may have ar-rived in Europe via the Levant or Western Asia priorto the LGM. The contemporary distribution ofM170-associated lineages is consistent with post-LGM dispersal from the Balkans (Semino et al.,2000). The subsequent derived M170-related M26mutation defines a haplotype which, while absent innearby Corsica, occurs at a uniquely high frequency(34.6%) in Sardinia, probably due to founder effect.A similar frequency for this haplotype was reportedfor another set of Sardinian samples (Passarino etal., 2001). The M26 haplotype also occurs in Basques
at �10% (Semino et al., 2000), and it is reportedwith lower incidence in Andalusia, northwestern Af-rica (Bosch et al., 2001), and England (D. Goldstein,personal communication). Assessment of related mi-crosatellite diversity will be necessary to better un-derstand the origin of M26 lineages and their migra-tory relationship between continental Europe andSardinia.
The various haplotypes individually defined byeither M35, p12f2, M172, or M201 show a cline, withmaximum frequency in the Middle East and AsiaMinor decreasing towards southwestern Europe.The p12f2 derivative has been considered a signa-ture of demographic events associated with the tran-sition to agriculture (Santachiara-Benerecetti et al.,1993; Semino et al., 1996; Quintana-Murci et al.,2001).
Phylogeography and microsatellite diversity sug-gest that the M17-defined haplotype and its com-pound haplotype HG3 analogue (Rosser et al., 2000;Quintana-Murci et al., 2001) differentiated from anM173 predecessor north of the Black Sea during orafter the LGM and subsequently radiated into East-ern Europe and Western Asia.
To simplify our presentation, the 20 observed hap-lotypes are discussed on the basis of their mostderived mutation (Fig. 1). The comparison of conti-nental and island Mediterranean Y-chromosomehaplotype composition provides insights into the col-onization of the major islands of the Mediterranean.Regarding Corsica, the M173 haplotype approaches60%, while the various 12f2, M35, M172, and M201haplotypes represent about 30% of the variation.These results are similar to those observed in cen-tral-northern Italy. The ratio of 12f2, M35, M172,and M201 haplotypes is also similar to that observedin Sardinia, but the allelic partition of the M173 andM170 components is quite different. In fact, Sardi-nia shows a very high frequency of the M170-M26haplotypes (and consequently a lower incidence ofM173). In addition, the majority of M170-associatedSardinian chromosomes also show the M26 allele,while this mutation is absent in the 3 Corsican in-dividuals with M170 ancestry. This observation ex-cludes significant gene flow from central Sardinia tocentral-northern Corsica, and the Fst probabilityvalues show a highly significant difference in thecomparison between the two islands (Table 3). Alarger number of individuals analyzed for the mic-rosatellite YCAIIb by Scozzari et al. (2001) showedan analogous pattern, supporting our hypothesis. Aremarkable genetic differentiation between Sardi-nia (southern and central populations) and Corsica(samples from the north and south of the island) wasalso pointed out by multilocus analysis of autosomalmarkers (less influenced than a single-locus systemby stochastic variation) such as STRs (Tofanelli etal., 2001) and Alu polymorphisms (Moral et al.,1999).
The frequencies observed in the Corsican popula-tion seem to converge toward those detected in con-
Y-CHROMOSOME VARIABILITY IN MEDITERRANEAN ISLANDS 275

tinental Italy, as shown by the Fst probability valuethat does not reach the significance level (Table 3).This may be due to other distinctive gene flows thatoverlaid a previous genetic heritage shared withSardinia. This result is consistent with linguisticdata showing that the Corsican language is moreclosely related to Tuscan than to the Sardinian lan-guage (Grimes, 1996). The pattern of affinity is alsosupported by mtDNA RFLP data (Morelli et al.,2000), but not by pairwise difference analysis (Va-resi et al., 2000). This discrepancy could be due inpart to the different origin of the samples and partlyto the difference in the analytical approach, as thefirst work is based on phylogenetically relevant poly-morphisms of the whole mitochondrial genome, andthe second paper focused on the first hypervariablesegment of the control region.
The Sardinian sample came from the hilly centralregion of the island, called Barbagia. Previous stud-ies on classical markers (Cappello et al., 1996) andmtDNA (Morelli et al., 2000) showed a significantdifferentiation of this sample from surrounding pop-ulations (especially the population from the north-ern area of the island, called Gallura, that is genet-ically and linguistically similar to Corsica),indicating the persistence of more conservative fea-tures in Barbagia. In fact, the incidence of Westernhaplotypes was higher there, with a signature of anancient gene flow from the Iberian peninsula char-acterized by of the mitochondrial haplogroup V (Mo-relli et al., 2000). In fact, mtDNA haplogroup V wasconsidered by Torroni et al. (2001) a Mesolithic Ibe-rian marker, although this haplogroup was absentin ancient samples (Izagirre and De La Rua, 1999).The data are also confirmed by the Y-chromosomepolymorphisms, with a 2/3 ratio of M173 vs. 12f2,M35, M172, and M201 haplotypes, and the presenceof the M26 haplotype.
A more significant impact of the haplotypes ofMiddle East affiliation is reflected in the Y-chromo-some variation in Sicily. The ratio is reversed incentral-northern Italy and in the islands of Corsicaand Sardinia, being 2:1 in favor of the predominantMiddle East haplotypes. This ratio is similar to thatobserved in Calabria and Greece, in agreement withthe geographic and historic proximity of these threeregions. The Fst probability value is not significantin comparison with Calabria (Table 3). Sicily alsoshows a high incidence of M67 (which is absent inCorsica), a subsequently derived lineage from theM172 haplotype. This marker was already observedin the Middle East (Underhill et al., 2000), indicat-ing the impact of people of Mediterranean and Mid-dle Eastern ancestry on the island. In addition, 43%of the Sicilian haplotypes show the 8-Kb allele at thep12f2 locus, proposed as representative of popula-tions associated with the transition to agriculture byvarious authors (Santachiara-Benerecetti et al.,1993; Semino et al., 1996; Quintana-Murci et al.,2001). The Sicilian sample showed two chromo-somes defined by the M17 allele. The same haplo-
type was also observed in Northern Italy, though ithas possibly followed different paths: from northeastin this case, and through the historically well-knownGreek influence (where the markers reach the fre-quency of 11.8%) in the case of Sicily, as shown bythe fourth principal component of autosomal genesin Europe (Cavalli-Sforza et al., 1994).
The relationships between the various Europeanpopulations are illustrated in the tree shown in Fig-ure 2. This tree reveals a split between three majorpopulation groups, with relatively good agreementbetween the geographic and genetic distances. Thenorthwestern Mediterranean populations cluster to-gether, separating from the cluster including thesouthern Italian and Greek populations. The centralSardinian sample represents the outlier in this tree,reflecting the remarkable influence of genetic driftand of founder effect in its population history.
CONCLUSIONS
Drawing inferences concerning population historyfrom variation associated with a single sex-specific,nonrecombining DNA sequence must be done withcaution. However, the rapid between-population di-vergence of NRY biallelic variation, and its ability topreserve elements of common ancestry of prehistorictime spans, make it a unique tool for investigatingthe ethnogenesis of populations, including the rela-tive degree of admixture with preexisting popula-tions, especially in situations of complex demogra-phy common in the Mediterranean basin.Integration of binary haplotype-specific associatedmicrosatellite diversity provides evidence concern-ing the polarity of dispersals. In association withmtDNA analysis, companion high-resolution studiesof Y-chromosome diversity provide information con-cerning possible male/female differences in demo-graphic history. However, even though the two ge-netic systems share an analogous mode oftransmission, they are not directly comparable interms of absolute frequencies. While asymmetricpatterns of male and female migratory behaviourmay occur (Seielstad et al., 1998; Oota et al., 2001),
Fig. 2. UPGMA tree of Mediterranean populations. N-C,Northern-Central.
276 P. FRANCALACCI ET AL.

the effect of possible differences in the male vs.female effective population size should also be con-sidered (since males and females may have a differ-ent reproductive potential). Also, different mutationrates within and between loci have significant im-pact on Y-chromosome and mtDNA variability. Thequantitative comparison of both loci suggests littledifference regarding male and female demographyon all three islands. This differs from the resultsreported for other data (Perez-Lezaun et al., 1999;Pereira et al., 2001). Such differences may reflectdifferent microevolutionary histories or the differenttypes of data used, including sample size as well asY-chromosome microsatellites vs. binary andmtDNA noncoding sequences vs. RFLP data. In thethree populations studied here, the higher percent-age (30–60%) of Y-chromosome haplotypes of Mid-dle East affiliation with respect to correspondingmtDNA haplotypes (less than 20%, as reported byRichards et al., 2000) does not necessarily imply adifference in the sex ratio of the newcomer farmersin these islands (since a similar proportion is alsopresent in the Near East), but perhaps nonrandommating phenomena. In fact, the phylogeographysuggests that Y-chromosome haplotypes seem toturn over faster, diagnostic of more bottlenecks withrespect to mtDNA, and thus accentuating the fre-quency clines of Y-chromosome haplotypes relativeto mtDNA haplogroups. The three main Mediterra-nean islands studied show evidence of different pat-terns of human peopling, with Corsica and Sicilyclosely associated with neighboring continental pop-ulations, while Sardinia shows a marked feature ofisolation, with some possible ancient contact withthe Iberian Peninsula. These data are in substantialagreement with the trend observed with mtDNAdata (Morelli et al., 2000), suggesting that there wasno gender differentiation in the population path-ways. The linguistic data and historic events of theislands also support this interpretation.
The study of binary polymorphisms on the Y chro-mosome has proved effective in the reconstruction ofthe history of the peopling of the central Mediterra-nean islands. Further, more detailed analyses fo-cused on intraregional variation could shed light onmicroevolutionary processes and improve ourknowledge of the genetic relationships of the Corsi-can, Sardinian, and Sicilian populations, amongthemselves and in the Mediterranean framework.
ACKNOWLEDGMENTS
This work was supported by grants from the Ital-ian National Council of Research (CNR97.00712PF36 to L. Terrenato), Interreg III andMURST 60% to P.F., and 40% Cofin (to P.F., G.P.,and G.V.). L.M. was awarded a research contract(L.27.12.97, art.51) and support from the Young Re-searcher Fund from the University of Sassari. NIHgrants GM 28428 and GM 55273 went to L.L.C.-S.and P.A.U. We thank O. Semino for sharing unpub-lished data for the Sardinian samples.
LITERATURE CITED
Ammerman AJ, Cavalli-Sforza LL. 1984. The Neolithic transitionand the genetics of populations in Europe. Princeton: PrincetonUniversity Press.
Barbujani G, Pilastro A, De Domenico S, Renfrew C. 1994. Ge-netic variation in North Africa and Eurasia: Neolithic demicdiffusion vs. Paleolithic colonization. Am J Phys Anthropol95:137–154.
Bosch E, Calafell F, Comas D, Oefner PJ, Underhill PA, Bertran-petit J. 2001. High-resolution analysis of human Y-chromo-some variation shows a sharp discontinuity and limited geneflow between northwestern Africa and the Iberian Peninsula.Am J Hum Genet 68:1019–1029.
Calafell F, Bertranpetit J, Rendine S, Cappello N, Mercier P,Amoros JP, Piazza A. 1996. Population history of Corsica: alinguistic and genetic analysis. Ann Hum Biol 23:237–251.
Cann RL, Stoneking M, Wilson AC. 1987. Mitochondrial DNAand human evolution. Nature 325:31–36.
Cao A, Gossens M, Pirastu M. 1989. Beta thalassaemia mutationsin Mediterranean populations. Br J Haematol 1:309–312.
Cappello N, Rendine S, Griffo R, Mameli GE, Succa V, Vona G,Piazza A. 1996. Genetic analysis of Sardinia: I. Data on 12polymorphisms in 21 linguistic domains. Am J Hum Genet60:125–141.
Casalotti R, Simoni L, Belledi M, Barbujani G. 1999. Y-chromo-some polymorphysms and the origin of the European gene pool.Proc R Soc Lond [Biol] 266:1959–1965.
Cavalli-Sforza LL, Menozzi P, Piazza A. 1994. The history andgeography of human genes. Princeton: Princeton UniversityPress.
Contini M, Cappello N, Griffo R, Rendine S, Piazza A. 1988–1989.Geolinguistique et geogenetique: une demarche interdisciplin-are. Geolinguistique 4:129–197.
Devoto G. 1977. Il linguaggio d’Italia. Milano: Rizzoli Editore.Edwards SV, Beerli P. 2000. Gene divergence, population diver-
gence, and the variance in coalescence time in phylogeographicstudies. Evolution 54:1839–1854.
Felsestein J. 1989. PHYLIP—phylogeny inference package (ver-sion 3.2). Cladistics 5:164–166.
Foley R. 1998. The context of human evolution. Genome Res8:339–347.
Fu XY. 1997. Statistical tests of neutrality of mutations againstpopulation growth, hitchhiking and background selection. Ge-netics 147:915–925.
Grimes BF. 1996. Ethnologue: languages of the world. Dallas: SILInternational.
Hammer MF, Zegura SL. 1996. The role of Y chromosome inhuman evolutionary studies. Evol Anthropol 5:116–134.
Harding RM, Fullerton SM, Griffiths RC, Bond J, Cox MJ,Schneider JA, Moulin DS, Cleeg JB. 1997. Archaic African andAsian lineages in the genetic ancestry of modern humans. Am JHum Genet 60:772–789.
Hewitt G. 2000. The genetic legacy of the Quaternary ice ages.Nature 405:907–913.
Izagirre N, De La Rua C. 1999. An mtDNA analysis in ancientBasque populations: implications for haplogroup V as a markerfor a major Paleolithic expansion from southwestern Europe.Am J Hum Genet 65:199–207.
Jobling MA, Tyler-Smith C. 1995. Father and sons: the Y chro-mosome and human evolution. Trends Genet 11:449–456.
Kluge AG, Farris JS. 1969. Quantitative phyletics and the evo-lution of anurans. Syst Zool 18:1–32.
Lanfranchi F, Weiss MC. 1997. L’aventure humaine prehisto-rique en Corse. Ajaccio: Albiana.
Macaulay V, Richards M, Hickey E, Vega E, Cruciani F, Guida V,Scozzari R, Bonne-Tamir B, Sykes B, Torroni A. 1999. Theemerging tree of west Eurasian mtDNAs; a synthesis of control-region sequences and RFLPs. Am J Hum Genet 64:232–249.
Malaspina P, Cruciani F, Ciminelli BM, Terrenato L, Santo-lamazza P, Alonso A, Banyko J, Brdicka R, Garcia O, GaudianoC, Guanti G, Kidd KK, Lavinha J, Avila M, Mandich P, MoralP, Qamar R, Mehdi SQ, Ragusa A, Stefanescu G, Caraghin M,Tyler-Smith C, Scozzari R, Novelletto A. 1998. Network anal-
Y-CHROMOSOME VARIABILITY IN MEDITERRANEAN ISLANDS 277

yses of Y-chromosomal types in Europe, northern Africa, andwestern Asia reveal specific patterns of geographic distribu-tion. Am J Hum Genet 63:847–860.
Malaspina P, Tsopanomichalou M, Duman T, Stefan M, SilvestriA, Rinaldi B, Garcia O, Giparaki M, Plata E, Kozlov AI, Bar-bujani G, Vernesi C, Papola F, Ciavarella G, Kovatchev D,Kerimova MG, Anagnou N, Gavrila L, Veneziano L, Akar N,Loutradis A, Michalodimitrakis EN, Terrenato L, Novelletto A.2001. A multistep process for the dispersal of a Y chromosomallineage in the Mediterranean area. Ann Hum Genet 65:339–349.
Maniatis T, Fritsch EF, Sambrook J. 1990. Molecular cloning: alaboratory manual (second edition). Cold Spring Harbor: ColdSpring Harbor Laboratory.
Memmi M. 1999. Etude genetique de la population corse et sarelation avec les populations “euro-mediterraneennes”. Doc-toral thesis. Corte: Universite de Corse.
Memmi M, Moral P, Calo CM, Autuori L, Mameli GE, Succa V,Varesi L, Vona G. 1998. Genetic structure of southwesternCorsica (France). Am J Hum Biol 10:567–577.
Menozzi P, Piazza A, Cavalli-Sforza LL. 1978. Synthetic maps ofhuman gene frequencies in Europeans. Science 201:786–792.
Moral P, Memmi M, Varesi L, Mameli GE, Succa V, Gutierrez B,Lutken N, Vona G. 1996. Study on the variability of sevengenetic serum protein markers in Corsica (France). AnthropolAnz 54:97–107.
Moral P, Bao M, Gonzalez E, Lopez-Alomar A, Varesi L, MemmiM, Vona G. 1999. Alu polymorphisms in Corsica and Sardinia:new evidence for the genetic position of Corsican populationwithin western Mediterranean. Antropol Contemp 22:77–86.
Morelli L, Grosso MG, Vona G, Varesi L, Torroni A, FrancalacciP. 2000. Frequency distribution of mitochondrial haplogroupsin Corsica and Sardinia. Hum Biol 72:585–595.
Nei M. 1972. Genetic distance between populations. Am Nat106:283–292.
Nei M. 1987. Molecular evolutionary genetics. New York: Colum-bia University Press.
Oota H, Settheetham-Ishida W, Tiwawech D, Ishida T, StonekingM. 2001. Human mtDNA and Y-chromosome variation is cor-related with matrilocal versus patrilocal residence. Nat Genet29:20–21.
Passarino G, Underhill PA, Cavalli-Sforza, LL, Semino O, Pes G,Carru C, Ferrucci L, Franceschi C, Deiana L, Baggio G, DeBenedictis G. 2001. Use of Y chromosome binary markers tostudy the high prevalence of males in Sardinian centenariansand the genetic structure of the Sardinian population. HumHered 52:136–139.
Paulis G. 1995. Lingue e popoli della Sardegna preistorica eprotostorica. Antropol Contemp 18:37–40.
Pereira L, Dupanloup I, Rosser ZE, Jobling MA, Barbujani G.2001. Y-chromosome mismatch distributions in Europe. MolBiol Evol 18:1259–1271.
Perez-Lezaun A, Calafell F, Comas D, Mateu E, Bosch E, Mar-tinez-Arias R, Clarimon J, Fiori G, Luiselli D, Facchini F,Pettener D, Bertranpetit J. 1999. Sex-specific migration pat-terns in Central Asian populations, revealed by analysis ofY-chromosome short tandem repeats and mtDNA. Am J HumGenet 65:208–219.
Piazza A, Cappello N, Olivetti E, Rendine S. 1988. A genetichistory of Italy. Ann Hum Genet 52:203–213.
Quintana-Murci L, Krausz C, Zerjal T, Sayar SH, Hammer MF,Mehdi SQ, Ayub Q, Qamar R, Mohyuddin A, Radhakrishna U,Jobling MA, Tyler-Smith C, McElreavey K. 2001. Y-chromo-some lineages trace diffusion of people and language in south-western Asia. Am J Hum Genet 68:537–542.
Richards M, Macaulay V, Hickey E, Vega E, Sykes B, Guida V,Rengo C, Sellitto D, Cruciani F, Kivisild T, Villems R, ThomasM, Rychkov S, Rychkov O, Rychkov Y, Golge M, Dimitrov D,Hill E, Bradley D, Romano V, Calı F, Vona G, Demaine A,Papiha S, Triantaphyllidis C, Stefanescu G, Hatina J, BellediM, Di Rienzo A, Novelletto A, Oppenheim A, Nørby S, Al-ZaheriN, Santachiara-Benerecetti S, Scozzari R, Torroni A, BandeltHJ. 2000. Tracing European founder lineages in the Near East-ern mtDNA pool. Am J Hum Genet 67:1251–1276.
Rickards O, Martinez-Labarga C, Scano G, De Stefano GF, BiondiG, Pacaci M, Walter H. 1998. Genetic history of the populationof Sicily. Hum Biol 70:699–714.
Rosser ZH, Zerjal T, Hurles ME, Adojaan M, Alavantic D, Amo-rim A, Amos W, Armenteros M, Arroyo E, Barbujani G, Beck-man G, Beckman L, Bertranpetit J, Bosch E, Bradley DG,Brede G, Cooper G, Corte-Real HB, de Knijff P, Decorte R,Dubrova YE, Evgrafov O, Gilissen A, Glisic S, Golge M, HillEW, Jeziorowska A, Kalaydjieva L, Kayser M, Kivisild T,Kravchenko SA, Krumina A, Kucinskas V, Lavinha J, LivshitsLA, Malaspina P, Maria S, McElreavey K, Meitinger TA, Mikel-saar AV, Mitchell RJ, Nafa K, Nicholson J, Nørby S, Pandya A,Parik J, Patsalis PC, Pereira L, Peterlin B, Pielberg G, PrataMJ, Previdere C, Roewer L, Rootsi S, Rubinsztein DC, SaillardJ, Santos FR, Stefanescu G, Sykes BC, Tolun A, Villems R,Tyler-Smith C, Jobling MA. 2000. Y-chromosomal diversity inEurope is clinal and influenced primarily by geography, ratherthan by language. Am J Hum Genet 67:1526–1543.
Salas A, Comas D, Lareu MV, Bertranpetit J, Carracedo A. 1998.mtDNA analysis of the Galician population: a genetic edge ofEuropean variation. Eur J Hum Genet 6:365–375.
Santachiara-Benerecetti AS, Semino O, Passarino G, Torroni A,Brdicka R, Fellous M, Modiano G. 1993. The common Near-Eastern origin of Ashkenazi and Sephardi Jews supported byY-chromosome similarity. Ann Hum Genet 57:55–64.
Schneider S, Roessli D, Excoffier L. 2000. ARLEQUIN version2.0: a software for population genetics data analysis. Geneva:Genetics and Biometry Laboratory, University of Geneva.http://anthropologie.unige.ch/arlequin
Scozzari R, Cruciani F, Pangrazio A, Santolamazza P, Vona G,Moral P, Latini V, Varesi L, Memmi MM, Romano V, De Leo G,Gennarelli M, Jaruzelska J, Villems R, Parik J, Macaulay V,Torroni A. 2001. Human Y-chromosome variation in the west-ern Mediterranean area: implications for the peopling of theregion. Hum Immunol 62:871–884.
Seielstad MT, Minch E, Cavalli-Sforza LL. 1998. Genetic evi-dence for a higher female migration rate in humans. Nat Genet20:278–280.
Semino O, Passarino G, Brega A, Fellous M, Santachiara-Bene-recetti AS. 1996. A view of the Neolithic demic diffusion inEurope through two Y chromosome-specific markers. Am JHum Genet 59:964–968.
Semino O, Passarino G, Oefner PJ, Lin AA, Arbuzova S, BeckmanLE, De Bendictis G, Francalacci P, Limborska S, Kouvatsi A,Marcikiae M, Primorac D, Santachiara-Benerecetti S, Cavalli-Sforza LL, Underhill PA. 2000. The genetic legacy of Palaeo-lithic Homo sapiens sapiens in extant Europeans: a Y-chromo-some perspective. Science 290:1155–1159.
Sokal RR, Oden NL, Wilson C. 1991. Genetic evidence for thespread of agriculture in Europe. Nature 351:143–145.
Spoor CF, Sondaar PY. 1986. Human fossils from the endemicisland fauna of Sardinia. J Hum Evol 15:399–408.
Sun C, Skaletsky H, Rozen S, Gromoll J, Nieschlag E, Oates R,Page DC. 2000. Deletion of azospermia factor a (AZFa) region ofhuman Y chromosome caused by recombination betweenHERV15 proviruses. Hum Mol Genet 9:2291–2296.
Tajima F. 1989. Statistical method for testing the neutral muta-tion hypothesis by DNA polymorphism. Genetics 123:585–595.
Tofanelli S, Taglioli L, Varesi L, Paoli G. 2001. The STR-basedgenetic profile of the population from Corsica island (France).Forensic Sci Int 121:33–38.
Torroni A, Schurr TG, Cabell MF, Brown MD, Neel JV, Larsen M,Smith DG, Vullo CM, Wallace DC. 1993. Asian affinities andcontinental radiation of the four founding Native AmericanmtDNAs. Am J Hum Genet 53:563–590.
Torroni A, Huoponen K, Francalacci P, Petrozzi M, Morelli L,Scozzari A, Obinu D, Savontaus ML, Wallace DC. 1996. Clas-sification of European mitochondrial DNA from an analysis of 3European populations. Genetics 144:1835–1850.
Torroni A, Bandelt HJ, Macaulay V, Richards M, Cruciani F,Rengo C, Martinez-Cabrera V, Villems R, Kivisild T, MetspaluE, Parik J, Tolk HV, Tambets K, Forster P, Karger B, Franca-lacci P, Rudan P, Janicijevic B, Rickards O, Savontaus ML,Huoponen K, Laitinen V, Koivumaki S, Sykes B, Hickey E,
278 P. FRANCALACCI ET AL.
Novelletto A, Moral P, Sellitto D, Coppa A, Al-Zaheri N, San-tachiara-Benerecetti AS, Semino O, Scozzari R. 2001. A signal,from human mtDNA, of postglacial recolonization in Europe.Am J Hum Genet 69:844–852.
Underhill PA, Jin L, Lin AA, Mehdi SQ, Jenkins T, Vollrath D,Davis RW, Cavalli-Sforza LL, Oefner PJ. 1997. Detection ofnumerous Y chromosome biallelic polymorphisms by denatur-ing high performance liquid chromatography (DHPLC). Ge-nome Res 7:996–1005
Underhill PA, Shen P, Lin AA, Jin L, Passarino G, Yang WH,Kauffman E, Hurlbut A, Bonne-Tamir B, Bertranpetit J, Franca-lacci P, Ibrahim M, Jenkins T, Kidd JR, Mehdi SQ, Seielstad MT,Wells RS, Piazza A, Soergel D, Sherry S, Feldman MW, DavisRW, Cavalli-Sforza LL, Oefner PJ. 2000. Y Chromosome variationand the history of human populations. Nat Genet 26:358–361.
Underhill PA, Passarino G, Lin AA, Shen P, Mirazon-Lahr M,Foley RA, Oefner PJ, Cavalli-Sforza LL. 2001. The phylogeog-
raphy of Y chromosome binary haplotypes and the origins ofmodern human populations. Ann Hum Genet 65:43–62.
Varesi L, Memmi M, Moral P, Mameli GE, Succa V, Vona G. 1996.La distribution de quatorze marqueurs genetiques dans la pop-ulation de l’ile de Corse (France). Bull Mem Soc AnthropolParis 8:5–14.
Varesi L, Memmi M, Cristofari MC, Mameli GE, Calo CM,Vona G. 2000. Mitochondrial control region sequence varia-tion in the Corsican population (France). Am J Hum Biol12:339 –351.
Wilson JF, Weiss DA, Richards M, Thomas MG, Bradman N,Goldstein DB. 2001. Genetic evidence for different male andfemale roles during cultural transitions in the British Isles.Proc Natl Acad Sci USA 98:5078–5083.
Y Chromosome Consortium. 2002. A nomenclature system for thetree of human Y-chromosome binary haplotypes. Genome Res12:339–348.
Y-CHROMOSOME VARIABILITY IN MEDITERRANEAN ISLANDS 279
Copyright © 2022 FDOKUMEN