Chalcolithic and modern potting in Gilund, Rajasthan: a cautionary tale
doi: 10.1098/rspb.2011.1044, 884-892 first published online 24 August 2011279 2012 Proc. R. Soc. B
Wilson and Cristian CapelliToncheva, Paolo Anagnostou, Gianmarco Ferri, Cesare Rapone, Tor Hervig, Torolf Moen, James F.Vona, Rafal Ploski, Carla Vecchiotti, Tatijana Zemunik, Igor Rudan, Sena Karachanak, Draga Bodmer, Marielle Vennemann, Valentina Coia, Francesca Scarnicci, Sergio Tofanelli, GiuseppeMartinez-Cadenas, Mark G. Thomas, Daniel G. Bradley, Leonor Gusmão, Bruce Winney, Walter George B. J. Busby, Francesca Brisighelli, Paula Sánchez-Diz, Eva Ramos-Luis, Conrado chromosome lineage R-M269The peopling of Europe and the cautionary tale of Y
Supplementary data
tml http://rspb.royalsocietypublishing.org/content/suppl/2011/08/18/rspb.2011.1044.DC1.h
"Data Supplement"
Referenceshttp://rspb.royalsocietypublishing.org/content/279/1730/884.full.html#ref-list-1
This article cites 41 articles, 8 of which can be accessed free
Subject collections
(105 articles)molecular biology � (5 articles)genetics � (1124 articles)evolution �
Articles on similar topics can be found in the following collections
Email alerting service hereright-hand corner of the article or click Receive free email alerts when new articles cite this article - sign up in the box at the top
http://rspb.royalsocietypublishing.org/subscriptions go to: Proc. R. Soc. BTo subscribe to
on January 25, 2012rspb.royalsocietypublishing.orgDownloaded from

Proc. R. Soc. B (2012) 279, 884–892
on January 25, 2012rspb.royalsocietypublishing.orgDownloaded from
*Author
Electron
doi:10.1098/rspb.2011.1044
Published online 24 August 2011
ReceivedAccepted
The peopling of Europe and the cautionarytale of Y chromosome lineage R-M269
George B. J. Busby1, Francesca Brisighelli1,3,4, Paula Sanchez-Diz3,
Eva Ramos-Luis3, Conrado Martinez-Cadenas1, Mark G. Thomas6,
Daniel G. Bradley7, Leonor Gusmao8, Bruce Winney2,
Walter Bodmer2, Marielle Vennemann9,10, Valentina Coia4,11,
Francesca Scarnicci12, Sergio Tofanelli13, Giuseppe Vona14,
Rafal Ploski15, Carla Vecchiotti5, Tatijana Zemunik16, Igor Rudan16,17,
Sena Karachanak18, Draga Toncheva18, Paolo Anagnostou4,19,
Gianmarco Ferri20, Cesare Rapone21, Tor Hervig22, Torolf Moen23,
James F. Wilson17,24 and Cristian Capelli1,*1Department of Zoology, and 2Department of Clinical Pharmacology, University of Oxford, Oxford, UK
3Institute of Forensic Sciences Luis Concheiro, Genomics Medicine Group,
University of Santiago de Compostela, Spain4Department of Environmental Biology, and 5Department of Anatomy, Histology, Legal Medicine and
Locomotory System, University of Rome ‘La Sapienza’, Rome, Italy6Department of Genetics, Evolution and Environment, University College London, London, UK
7Smurfit Institute of Genetics, Trinity College Dublin, Republic of Ireland8IPATIMUP, Institute of Pathology and Molecular Immunology of the University of Porto, Portugal
9Centre for Forensic Science, University of Strathclyde, Glasgow, UK10Institute of Legal Medicine, University of Freiburg, Freiburg, Germany
11Department of Philosophy, History and Cultural heritage, University of Trento, Trento, Italy12Department of Legal Medicine, University ‘Cattolica del Sacro Cuore’, Rome, Italy
13Department of Biology, University of Pisa, Pisa, Italy14Department of Experimental Biology, University of Cagliari, Monserrato-Cagliari, Italy
15Department of Medical Genetics, Warsaw Medical University, Warsaw, Poland16Croatian Centre for Global Health, University of Split School of Medicine, Split, Croatia
17Centre for Population Health Sciences, University of Edinburgh, Teviot Place, Edinburgh, Scotland, UK18Department of Medical Genetics, Medical University of Sofia, Sofia, Bulgaria
19Department of Evolutionary and Experimental Biology, University of Bologna, Italy20Section of Legal Medicine, Department of Diagnostic and Laboratory Services and Legal Medicine,
University of Modena and Reggio Emilia, Modena, Italy21Biology Section, Carabinieri Scientific Research Department, Rome, Italy
22The Gade Institute, University of Bergen, Norway23Department of Laboratory Medicine, Children’s and Women’s Health, Faculty of Medicine, NTNU,
Trondheim, Norway24Ethnoancestry Limited, Edinburgh, UK
Recently, the debate on the origins of the major European Y chromosome haplogroup R1b1b2-M269 has
reignited, and opinion has moved away from Palaeolithic origins to the notion of a younger Neolithic spread
of these chromosomes from the Near East. Here, we address this debate by investigating frequency patterns
and diversity in the largest collection of R1b1b2-M269 chromosomes yet assembled. Our analysis reveals no
geographical trends in diversity, in contradiction to expectation under the Neolithic hypothesis, and suggests
an alternative explanation for the apparent cline in diversity recently described. We further investigate the
young, STR-based time to the most recent common ancestor estimates proposed so far for R-M269-related
lineages and find evidence for an appreciable effect of microsatellite choice on age estimates. As a consequence,
the existing data and tools are insufficient to make credible estimates for the age of this haplogroup, and
conclusions about the timing of its origin and dispersal should be viewed with a large degree of caution.
Keywords: Y-STRs; R1b1b2-M269; neolithic hypothesis; average squared distance
for correspondence ([email protected]).
ic supplementary material is available at http://dx.doi.org/10.1098/rspb.2011.1044 or via http://rspb.royalsocietypublishing.org.
17 May 20113 August 2011 884 This journal is q 2011 The Royal Society

The cautionary tale of R-M269 in Europe G. B. J. Busby et al. 885
on January 25, 2012rspb.royalsocietypublishing.orgDownloaded from
1. INTRODUCTIONSince the first attempts to use biological variation in
humans to aid our understanding of early human
migrations, the peopling of Europe has been a major
research focus [1,2]. Following the development of agri-
culture in the Fertile Crescent some 10 000 years ago
[3,4], this technology spread from the Near East west-
ward into Europe, causing a major cultural transition
from itinerant hunter–gathering to sedentary farming,
which led to dramatic population growth [5,6], during
what has become known as the Neolithic transition
[7,8]. Within this archaeological framework, debate
rages about the relative contributions to modern Euro-
pean populations of the first people of Europe and
those who migrated into it with the Neolithic transition,
both in terms of their genetic legacy and as to the pro-
cesses of migration and succession [9–16]. The true
scenario is undoubtedly multi-faceted and complex.
Both early work on ‘classical markers’ using principal
components analysis and more recent studies using the
Y chromosome have shown that in Europe, genetic
variation is distributed along a southeast–northwest
gradient. Such observations have been suggested to sup-
port a model of demic diffusion for the Neolithic
transition in Europe (i.e. that the spread of agriculture
also involved an associated movement of people from
the Near East) [2,17–19].
New work [20–22] has addressed the Neolithic transition
in Europe by focusing on the main western European Y
chromosome haplogroup R1b1b2-M269 (hereafter referred
to as R-M269). This lineage had hitherto received little
recent attention in this context, although previous work
suggested that the broader R-M173 clade (excluding the
R1a-M17 sub-lineage) and Haplogroup 1 (derived at
single nucleotide polymorphism, or SNP, 92r7) are likely
to have spread into Europe during the Palaeolithic
[17,18,23], and therefore unlikely to have been carried into
Europe with the migrating farmers. Balaresque et al. [20]
(hereafter ‘Balaresque’) used 840 Y chromosomes within
haplogroup R-M269 to show that, although this haplogroup
is characterized by a strong frequency cline from high in the
west to low in the east, the associated cline in haplotype
diversity (measured as mean short tandem repeat, or STR,
variance) is in the opposite direction. They posited that
this correlation could be explained by a more recent dispersal
of this lineage from the Near East coinciding with the Neo-
lithic transition in Europe. The lineage was estimated to be
approximately 6000 years old in various populations,
which was argued to be consistent with this model. This
result, as noted in their introduction, ‘indicates that the
great majority of the Y chromosomes of Europeans have
their origins in the Neolithic expansion’ (p. 2 in [20]).
Myres et al. [21] described several new SNP mutations
downstream of R-M269 that show strong geographical
structuring in a much larger sample of 2043 R-M269
chromosomes. They highlight an essentially European-
specific clade, defined by the presence of SNPs M412
(also known as S167) and L11 (S127), which is clinal
from high frequencies (greater than 70%) in western
Europe, decreasing eastward. This study showed that the
distributions of several downstream SNPs exhibit striking
frequency patterns and appear to spread from different
areas of highly localized frequencies, some of which were
also observed by Cruciani et al. [24]. Myres et al. estimated
Proc. R. Soc. B (2012)
coalescence times for the R-S116 haplogroup in different
populations in Europe and suggested, in broad agreement
with Balaresque, that the R-M269 haplogroup may have
spread with the Neolithic, and more specifically with the
Linearbandkeramik, a Neolithic agricultural industry that
spread throughout northern Europe, from Hungary to
France, around 7500 years ago.
The current uncertainty surrounding STR mutation
rates shows that despite these recent studies, there can
still be no consensus on when and where the R-M269
haplogroup originated and spread in Europe. Even if invok-
ing the origins of the European Y chromosome gene pool
‘must be viewed cautiously especially when such an argu-
ment is based on just a single incompletely resolved
haplogroup’ (p. 100 in [21]), it is of profound interest to
try to understand how the vast majority of western European
men (greater than 100 million) carry Y chromosomes that
belong to the R-M269 Y chromosome haplogroup.
Consequently, we have addressed these issues with our
own large R-M269 dataset, both on its own and in com-
bination with compatible data from the most recent
comprehensive survey [21]. We show that the funda-
mental relationship between mean STR variance and
longitude, which is the basis of the recent claim of sup-
port for the Neolithic hypothesis [20], does not hold for
our larger and geographically broader sample. We also
explain how this previous analysis may have resulted in
this spurious association. We finally explore the spatial
distribution of genetic diversity associated with the
R-M269 European-specific sub-lineage, defined by SNP
S127, showing an essentially homogeneous background
of microsatellite variation at several different sub-lineage
levels, based on a common set of 10 STRs typed across
2000 R-M269 chromosomes.
While acknowledging uncertainty, researchers usually
report the age of Y chromosome lineages based on differ-
ences between individuals across multiple STRs, often
using average squared distance (ASD) or related summary
statistics [25,26] as unbiased estimators of coalescence
time, T. We investigated how ASD changes in our dataset
based on different sets of STRs. Contrary to common
belief, estimates of ASD, and therefore T, vary widely
when different subsets of STRs are used with the same
sample. While recent evidence has increased support for
the Neolithic spread of R-M269, we conclude that at the
present time it is not possible to make any credible estimate
of divergence time based on the sets of Y-STRs used in
recent studies. Furthermore, we show that it is the proper-
ties of Y-STRs, not the number used per se, that appear to
control the accuracy of divergence time estimates, attributes
which are rarely, if ever, considered in practise.
2. MATERIAL AND METHODS(a) Ethics statement
All males sampled gave informed consent following ethical
approval by the ethics committees at the various universities
where the samples were collected.
(b) DNA samples and genotyping
We assembled a dataset of 2486 R-M269 Y chromosomes from
across Europe, the Near East and western Asia, from a total
population of 6503, which included both novel and previou-
sly published Y chromosomes. To assess the frequency

S21U106
S145M529
S28U152
S127L11
S116
M269
M222
S21 M222 S28S145(xM222)
M269(xS127)
S116(xS145,
S28)
S127(xS21,S116)
Figure 1. Y chromosome tree showing the relationships of
SNPs downstream from R-M269 tested in this study. Alterna-tive nomenclature for some SNPs is provided in italics.
886 G. B. J. Busby et al. The cautionary tale of R-M269 in Europe
on January 25, 2012rspb.royalsocietypublishing.orgDownloaded from
distribution of R-M269 and various sub-haplogroups in
Europe and Asia, we combined our data with that of Myres
et al. [21], which gave a combined set of 4529 R-M269 chromo-
somes from a total sample of 16 298 from 172 different
populations (electronic supplementary material, table S1 and
figure S1). The frequencies of the following SNPs, whose phy-
logeny is shown in figure 1, were ascertained: S127/L11
(rs9786076), S21/U106 (rs16981293), S116 (rs34276300),
S145/M529 (rs11799226) and S28/U152 (rs1236440).
Samples were amplified in a standard PCR reaction and the
SNaPshot Multiplex System (Life Technologies Corp., Carls-
bad, CA, USA) primer extension protocol was used to
characterize the allele present at each SNP loci. All primers
are listed in the electronic supplementary material.
For the majority of the individuals typed in this study
(2289), the following 10 STRs were available: DYS19;
DYS389I; DYS389b (subtracting the alleles scored at
DYS389I from the DYS389II locus); DYS390; DYS391;
DYS392; DYS393; DYS437; DYS438; and DYS439,
either being previously published or having been typed by
ourselves using the Yfiler kit (Life Technologies Corp.)
[27] or the Promega Powerplex assay (Promega Corp.,
Madison, WI, USA) [28]. For the samples from Weale
et al. [29], only five STRs were previously published, and
so the remaining five were typed with an internally designed
and verified multiplex using primers from the study of Butler
et al. [30] for DYS391, DYS437, DYS389I and II and
DYS439, and primers from the study of Gusmao & Alves
[31] for DYS438. DYS391 calls were used to check for con-
sistency with the original haplotypes of Weale et al. Three
of the Weale et al. populations were not typed further for
these STRs (114 individuals). Individuals typed using the
Yfiler kit (1035) were used to investigate the effect of STR
selection on ASD calculations (electronic supplementary
material, table S2).
Populations with a total size of 30 or above were used to
build the frequency maps (electronic supplementary
material, figure S1). Variance was calculated only for those
populations where haplotypes were available for at least 10
individuals within the relevant haplogroup.
Proc. R. Soc. B (2012)
(c) Analysis
Maps of SNP frequencies were displayed using ARCMAP GIS
(v. 9.2; ESRI). Interpolation was performed using the inverse
distance weighting procedure. Latitudes and longitudes for
all populations were based on the highest-resolution sampl-
ing centre associated with the samples and are shown in
electronic supplementary material, table S1.
The R statistical package [32] was used to calculate the
median STR variance (the variance in the number of repeats
within a locus averaged across all loci) between all individuals
within a population following 1000 bootstrap replicates with
replacement over individuals. Regression analysis was per-
formed in R to compare average STR variance with
latitude and longitude for the R-M269, R-M269(xS127)
and R-S127 haplogroups.
We investigated how ASD estimates change within our
sample when using different combinations of STRs based on
two separate criteria: mutation rate, m; and observed linearity,
u(R) (table 1). We used the observed m calculated recently
[33] to rank the 15 STRs on a scale of speed, and separately
calculated ASD based on the seven fastest and seven slowest
rates (electronic supplementary material, table S4). Our
second criterion was based on the estimated duration of line-
arity, D, of different groups of STRs. Duration of linearity is
an estimate of the divergence time after which ASD ceases
to increase linearly with time. For STRs mutating under a
strict stepwise model, Goldstein et al. showed that ASD
initially increases linearly with time, but that this linearity is
constrained by the maximum number of repeats an STR
can take, R [26]. D is approximated using u(R) (which is a
simple transformation of R) and m, and the effective popu-
lation size (Ne) (eqns 3 and 4 in [26]). Greater values of
u(R)/2m yield increased estimates of D. Using STRs with
greater values of u(R)/2m should allow linearity to be assumed
further into the past, and ASD calculated from these STRs
should be less likely to be underestimated as a result of satur-
ation. Table 1 and electronic supplementary material, table S4
show the different groups of STRs used and associated values
of m, R, u(R)/2m and ASD.
To check that any differences in time to the most recent
common ancestor (TMRCA) estimation are not specific to
methods based on ASD, we used BATWING [35] on the
HGDP Bedouin population for which a greater number of
Y-STRs (n ¼ 65) were available [36]. We compared four
different sets of STRs with varying degrees of duration of
linearity estimates (electronic supplementary material).
3. RESULTSTo investigate the origins of the R-M269 lineage in
Europe, we analysed a large dataset of 4529 R-M269
chromosomes (2486 of which have not previously been
published at such detailed resolution) from several popu-
lations across Europe, the Near East and western Asia
(electronic supplementary material, figure S1 and table
S1). Within Europe, we observed a northwest–southeast
frequency cline for R-M269, similar to those observed
previously [10,11,37], from high frequencies in western
Europe to lower frequencies in the east. Within hap-
logroup R-M269 we genotyped a newly characterized
SNP, S127 (equivalent to L11), for which the distribution
in Europe and the Near East, together with that of R-
M269 and R-M269(xS127), are shown in figure 2.
The distributions of R-M269 and R-S127 are broadly
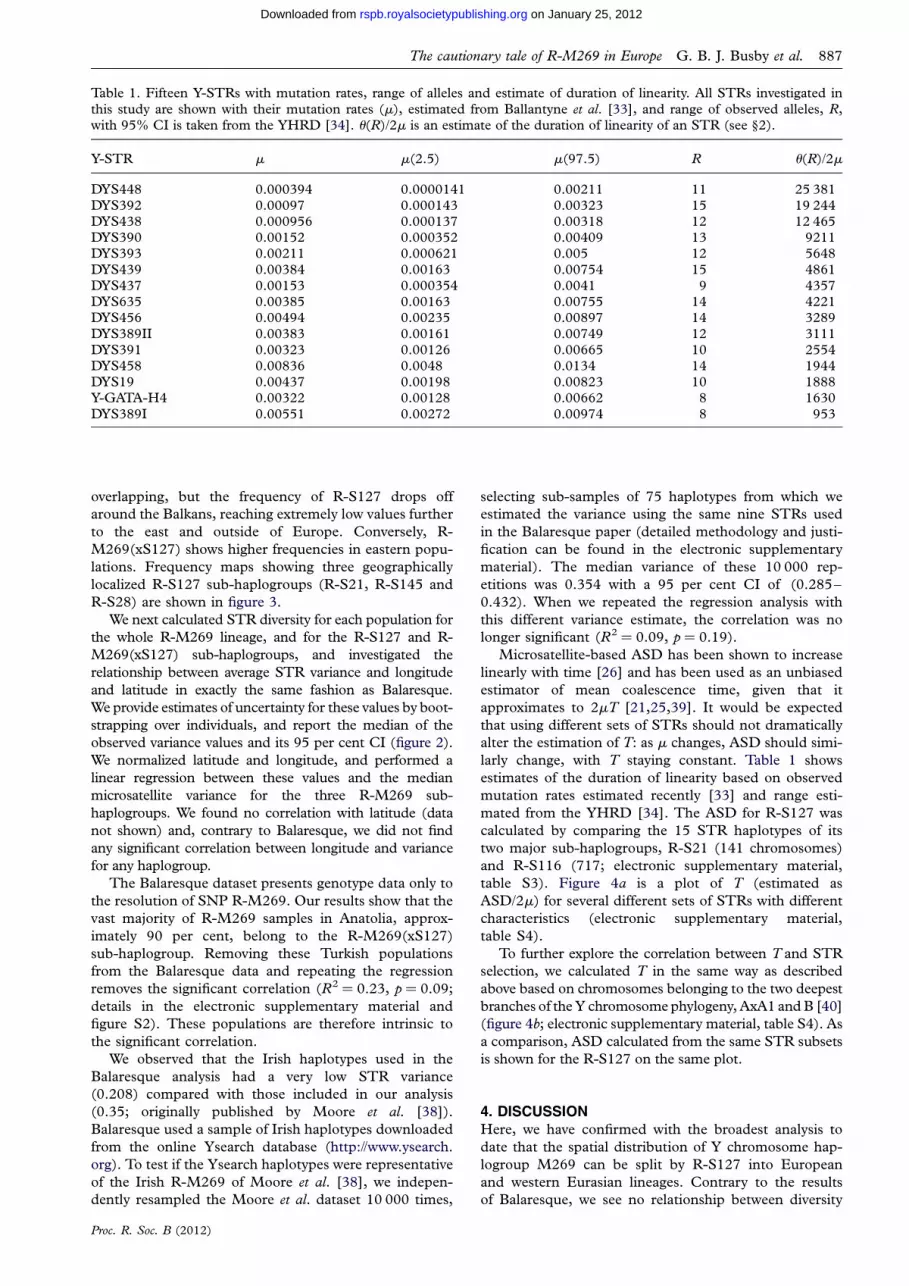
Table 1. Fifteen Y-STRs with mutation rates, range of alleles and estimate of duration of linearity. All STRs investigated in
this study are shown with their mutation rates (m), estimated from Ballantyne et al. [33], and range of observed alleles, R,with 95% CI is taken from the YHRD [34]. u(R)/2m is an estimate of the duration of linearity of an STR (see §2).
Y-STR m m(2.5) m(97.5) R u(R)/2m
DYS448 0.000394 0.0000141 0.00211 11 25 381DYS392 0.00097 0.000143 0.00323 15 19 244DYS438 0.000956 0.000137 0.00318 12 12 465DYS390 0.00152 0.000352 0.00409 13 9211DYS393 0.00211 0.000621 0.005 12 5648
DYS439 0.00384 0.00163 0.00754 15 4861DYS437 0.00153 0.000354 0.0041 9 4357DYS635 0.00385 0.00163 0.00755 14 4221DYS456 0.00494 0.00235 0.00897 14 3289
DYS389II 0.00383 0.00161 0.00749 12 3111DYS391 0.00323 0.00126 0.00665 10 2554DYS458 0.00836 0.0048 0.0134 14 1944DYS19 0.00437 0.00198 0.00823 10 1888Y-GATA-H4 0.00322 0.00128 0.00662 8 1630
DYS389I 0.00551 0.00272 0.00974 8 953
The cautionary tale of R-M269 in Europe G. B. J. Busby et al. 887
on January 25, 2012rspb.royalsocietypublishing.orgDownloaded from
overlapping, but the frequency of R-S127 drops off
around the Balkans, reaching extremely low values further
to the east and outside of Europe. Conversely, R-
M269(xS127) shows higher frequencies in eastern popu-
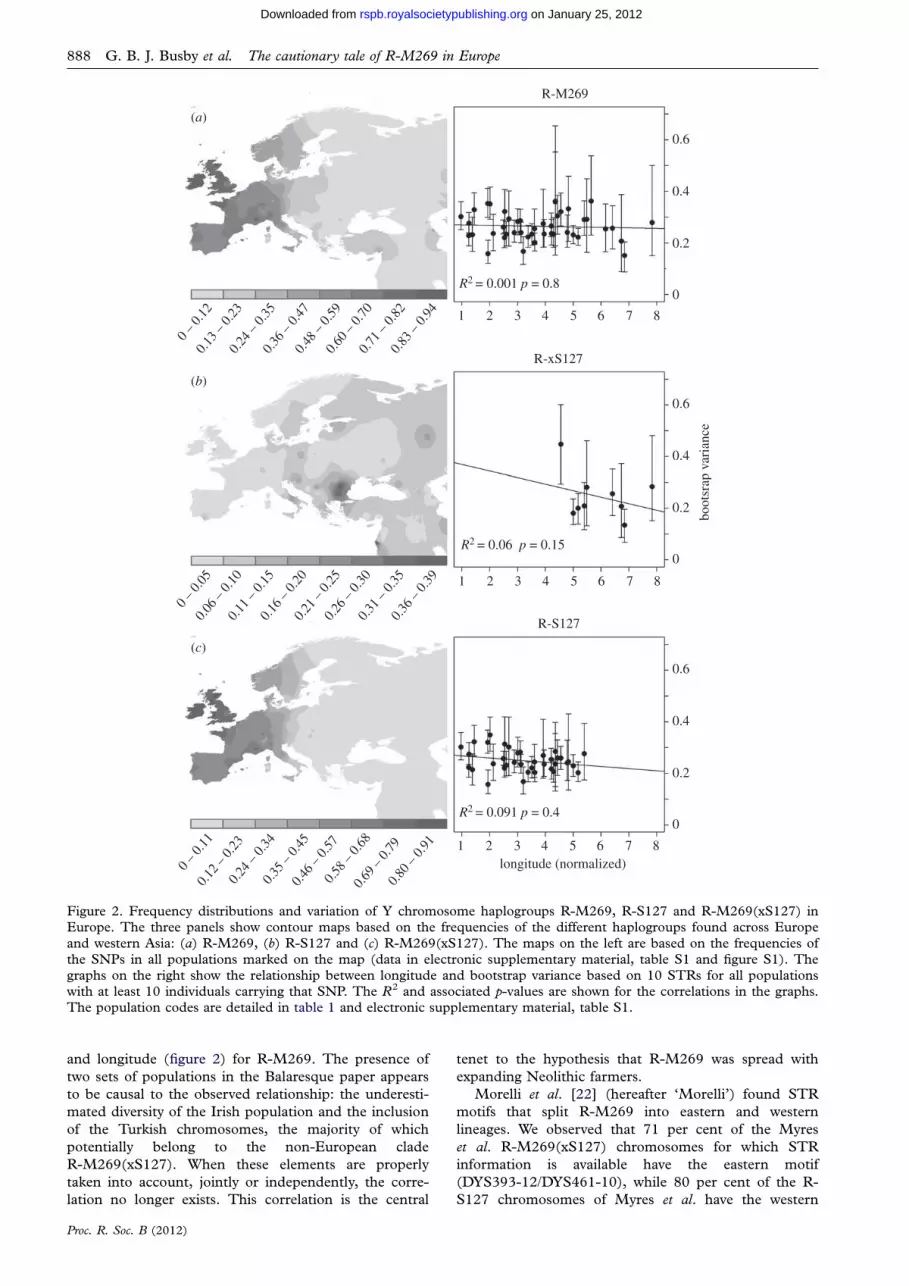
lations. Frequency maps showing three geographically
localized R-S127 sub-haplogroups (R-S21, R-S145 and
R-S28) are shown in figure 3.
We next calculated STR diversity for each population for
the whole R-M269 lineage, and for the R-S127 and R-
M269(xS127) sub-haplogroups, and investigated the
relationship between average STR variance and longitude
and latitude in exactly the same fashion as Balaresque.
We provide estimates of uncertainty for these values by boot-
strapping over individuals, and report the median of the
observed variance values and its 95 per cent CI (figure 2).
We normalized latitude and longitude, and performed a
linear regression between these values and the median
microsatellite variance for the three R-M269 sub-
haplogroups. We found no correlation with latitude (data
not shown) and, contrary to Balaresque, we did not find
any significant correlation between longitude and variance
for any haplogroup.
The Balaresque dataset presents genotype data only to
the resolution of SNP R-M269. Our results show that the
vast majority of R-M269 samples in Anatolia, approx-
imately 90 per cent, belong to the R-M269(xS127)
sub-haplogroup. Removing these Turkish populations
from the Balaresque data and repeating the regression
removes the significant correlation (R2 ¼ 0.23, p ¼ 0.09;
details in the electronic supplementary material and
figure S2). These populations are therefore intrinsic to
the significant correlation.
We observed that the Irish haplotypes used in the
Balaresque analysis had a very low STR variance
(0.208) compared with those included in our analysis
(0.35; originally published by Moore et al. [38]).
Balaresque used a sample of Irish haplotypes downloaded
from the online Ysearch database (http://www.ysearch.
org). To test if the Ysearch haplotypes were representative
of the Irish R-M269 of Moore et al. [38], we indepen-
dently resampled the Moore et al. dataset 10 000 times,
Proc. R. Soc. B (2012)
selecting sub-samples of 75 haplotypes from which we
estimated the variance using the same nine STRs used
in the Balaresque paper (detailed methodology and justi-
fication can be found in the electronic supplementary
material). The median variance of these 10 000 rep-
etitions was 0.354 with a 95 per cent CI of (0.285–
0.432). When we repeated the regression analysis with
this different variance estimate, the correlation was no
longer significant (R2 ¼ 0.09, p ¼ 0.19).
Microsatellite-based ASD has been shown to increase
linearly with time [26] and has been used as an unbiased
estimator of mean coalescence time, given that it
approximates to 2mT [21,25,39]. It would be expected
that using different sets of STRs should not dramatically
alter the estimation of T: as m changes, ASD should simi-
larly change, with T staying constant. Table 1 shows
estimates of the duration of linearity based on observed
mutation rates estimated recently [33] and range esti-
mated from the YHRD [34]. The ASD for R-S127 was
calculated by comparing the 15 STR haplotypes of its
two major sub-haplogroups, R-S21 (141 chromosomes)
and R-S116 (717; electronic supplementary material,
table S3). Figure 4a is a plot of T (estimated as
ASD/2m) for several different sets of STRs with different
characteristics (electronic supplementary material,
table S4).
To further explore the correlation between T and STR
selection, we calculated T in the same way as described
above based on chromosomes belonging to the two deepest
branches of the Y chromosome phylogeny, AxA1 and B [40]
(figure 4b; electronic supplementary material, table S4). As
a comparison, ASD calculated from the same STR subsets
is shown for the R-S127 on the same plot.
4. DISCUSSIONHere, we have confirmed with the broadest analysis to
date that the spatial distribution of Y chromosome hap-
logroup M269 can be split by R-S127 into European
and western Eurasian lineages. Contrary to the results
of Balaresque, we see no relationship between diversity
0 –
0.12
0.13
– 0
.23
0.24
– 0
.35
0.36
– 0
.47
0.48
– 0
.59
0.60
– 0
.70
0.71
– 0
.82
0.83
– 0
.94
0 –
0.05
0.06
– 0
.10
0.11
– 0
.15
0.16
– 0
.20
0.21
– 0
.25
0.26
– 0
.30
0.31
– 0
.35
0.36
– 0
.39
0 –
0.11
0.12
– 0
.23
0.24
– 0
.34
0.35
– 0
.45
0.46
– 0
.57
0.58
– 0
.68
0.69
– 0
.79
0.80
– 0
.91
(a)
(b)
(c)
1 2 3 4 5 6 7 8
1 2 3 4 5 6 7 8
1 2 3 4 5 6 7 8
R2 = 0.091 p = 0.4
R2 = 0.06 p = 0.15
R2 = 0.001 p = 0.8
0
0.2
0.4
0.6
0
0.2
0.4
0.6
0
0.2
0.4
0.6
R-M269
R-xS127
R-S127
longitude (normalized)
boot
srap
var
ianc
e
Figure 2. Frequency distributions and variation of Y chromosome haplogroups R-M269, R-S127 and R-M269(xS127) inEurope. The three panels show contour maps based on the frequencies of the different haplogroups found across Europe
and western Asia: (a) R-M269, (b) R-S127 and (c) R-M269(xS127). The maps on the left are based on the frequencies ofthe SNPs in all populations marked on the map (data in electronic supplementary material, table S1 and figure S1). Thegraphs on the right show the relationship between longitude and bootstrap variance based on 10 STRs for all populationswith at least 10 individuals carrying that SNP. The R2 and associated p-values are shown for the correlations in the graphs.The population codes are detailed in table 1 and electronic supplementary material, table S1.
888 G. B. J. Busby et al. The cautionary tale of R-M269 in Europe
on January 25, 2012rspb.royalsocietypublishing.orgDownloaded from
and longitude (figure 2) for R-M269. The presence of
two sets of populations in the Balaresque paper appears
to be causal to the observed relationship: the underesti-
mated diversity of the Irish population and the inclusion
of the Turkish chromosomes, the majority of which
potentially belong to the non-European clade
R-M269(xS127). When these elements are properly
taken into account, jointly or independently, the corre-
lation no longer exists. This correlation is the central
Proc. R. Soc. B (2012)
tenet to the hypothesis that R-M269 was spread with
expanding Neolithic farmers.
Morelli et al. [22] (hereafter ‘Morelli’) found STR
motifs that split R-M269 into eastern and western
lineages. We observed that 71 per cent of the Myres
et al. R-M269(xS127) chromosomes for which STR
information is available have the eastern motif
(DYS393-12/DYS461-10), while 80 per cent of the R-
S127 chromosomes of Myres et al. have the western

(a)
(b)
(c)
0 – 0.
04
0.05 –
0.09
0.10 –
0.13
0.11 –
0.17
0.18 –
0.21
0.22 –
0.26
0.27 –
0.30
0.31 –
0.34
0 – 0.
10
0.11 –
0.20
0.21 –
0.30
0.31 –
0.40
0.41 –
0.49
0.50 –
0.59
0.60 –
0.69
0.70 –
0.79
0 – 0.
05
0.06 –
0.11
0.12 –
0.16
0.17 –
0.22
0.23 –
0.27
0.28 –
0.32
0.33 –
0.38
0.39 –
0.43
0.35
Figure 3. Frequency distributions of R-M269sub-haplogroups.
Contour maps for lineages defined by marker (a) R-S21,(b) R-S145 and (c) R-S28.
The cautionary tale of R-M269 in Europe G. B. J. Busby et al. 889
on January 25, 2012rspb.royalsocietypublishing.orgDownloaded from
motif (DYS393-13/DYS461-11). No R-S127 chromo-
somes displayed the eastern motif, while 5 per cent of
R-M269(xS127) chromosomes displayed the western
motif (all of which were either L23 (S141) or M412
(S127)-derived). In both cases, however, these motifs dif-
fered from those suggested by Morelli by having one
repeat less at the DYS461 locus. The dichotomy observed
by Morelli based on a two STR motif is therefore corro-
borated, at least in part, by the presence of this SNP.
Proc. R. Soc. B (2012)
Dating of Y chromosome lineages is notoriously con-
troversial [25,41–44], the major issue being that the
choice of STR mutation rate can lead to age estimates
that differ by a factor of three (i.e. the evolutionary [25]
versus observed (genealogical) mutation rates [33,45]).
Interestingly, despite the fact that Myres et al. and
Balaresque used different STR mutation rates and
dating approaches, their TMRCA estimates overlap:
8590–11 950 years using a mutation rate of 6.9 � 1024
per generation, and 4577–9063 years using an average
mutation rate of 2.3 � 1023, respectively. Separately,
Morelli calculated the TMRCA based only on Sardinian
and Anatolian chromosomes, and estimated the R-
M269 lineage to have originated 25 000–80 700 years
ago) [22], based on the same evolutionary mutation rate
[25,41] as Myres et al.
In seeking to find a suitable set of STRs with which to
estimate the average coalescence time, T, of sub-hap-
logroup R-S127, we have shown that not all STRs are
of equal use in this context. We concentrated on estimat-
ing the duration of linearity, D, using different sets of
STRs. Our analyses suggest that the D of an STR is key
to its ability to uncover deep ancestry. Duration of linear-
ity refers to the length of time into the past over which
ASD and T continue to be linearly related for a specific
STR. Goldstein et al. [26] showed that D is affected by
two properties of the STRs used to calculate ASD: the
mutation rate and range of possible alleles that the STR
can take. When we manipulated our choice of STR
marker based on u(R)/2m (a surrogate for D; table 1),
we found that different sets of STRs gave different
values for T. It is clear, then, that coalescence estimates
explicitly depend on the STRs that one uses.
Our analysis confirms that this phenomenon is not
specific to the R-M269 haplogroup nor to methods
using ASD. Figure 4b shows that STRs with high D pro-
duce larger estimates of T. What is clear is that estimates
of T implicitly depend on the STRs that are selected to
make this inference. Using BATWING on an HGDP
population for which 65 Y-STRs are available, we have
shown that the median estimate of TMRCA can differ
by over five times when STRs are selected on the basis
of the expected duration of linearity (electronic sup-
plementary material, figure S4). While researchers take
into account STR mutation rates when estimating diver-
gence time with ASD, commonly used STRs do not
have the specific attributes that allow linearity to be
assumed further into the past. The majority of haplo-
group dates based on such sets of STRs may therefore
have been systematically underestimated.
5. CONCLUSIONThe distributions of the main R-S127 sub-haplogroups,
R-S21, R-S145 and R-S28, show markedly localized
concentrations (figure 3). If the R-M269 lineage is
more recent in origin than the Neolithic expansion,
then its current distribution would have to be the
result of major population movements occurring since
that origin. For this haplogroup to be so ubiquitous,
the population carrying R-S127 would have displaced
most of the populations present in western Europe
after the Neolithic agricultural transition. Alternatively,
if R-S127 originated prior to the Neolithic wave of

4.A
5.A
6.A7.A 8.A
10.A8.B 10.B
6.B4.B5.B
10.C 8.C 7.C
6.C 5.C4.C
7.F7.B
8.Bu8.M
15.All10.Bu
10.M
7.S
haplogroup comparisonAxA1 v BS21 v S116
0 0.001 0.002 0.003 0.004 0.005 0.006average STR mutation rate
0
50
100
150
200
250
300
0
500
1000
1500
2000
2500
T (
gene
ratio
ns)
T (
gene
ratio
ns)
(a)
(b)
Figure 4. Relationship between time to the most recent common ancestor, T, and mutation rate, m, for various STR subsets.(a) Estimates of T for the R-S127 haplogroup. Points are labelled with the subset of STRs used to calculate T and are detailed
in electronic supplementary material, table S4. (b) The same data, but this time together with estimates of T based oncomparisons of Y chromosome A and B haplogroups (see main text).
890 G. B. J. Busby et al. The cautionary tale of R-M269 in Europe
on January 25, 2012rspb.royalsocietypublishing.orgDownloaded from
expansion, then either it was already present in most of
Europe before the expansion, or the mutation occurred
in the east, and was spread before or after the expansion,
in which case we would expect higher diversity in the
east closer to the origins of agriculture, which is not
what we observe. The maps of R-S127 sub-haplogroup
frequencies for R-S21, R-S145 and R-S28 show radial
distributions from specific European locations (figure 3).
These centres have high absolute frequencies: R-S21
has a frequency of 44 per cent in Friesland, and R-
S28 reaches 25 per cent in the Alps; and in the popu-
lations where they are at the highest frequency, the
vast majority of R-S127 belong to that particular sub-
lineage. For example, half of all R-M269 across southern
Europe is R-S28-derived, and around 60 per cent of R-
M269 in Central Europe is R-S21-derived. At the sub-
haplogroup level, then, R-M269 is split into geographi-
cally localized pockets with individual R-M269 sub-
haplogroups dominating, suggesting that the frequency
of R-M269 across Europe could be related to the
growth of multiple, geographically specific sub-lineages
that differ in different parts of Europe.
Proc. R. Soc. B (2012)
A recent analysis of radiocarbon dates of Neolithic sites
across Europe [46] reveals that the spread of the Neolithic
was by no means constant, and that several ‘centres of
renewed expansion’ are visible across Europe, representing
areas of colonization, three of which map intriguingly
closely to the centres of the sub-haplogroups foci (electronic
supplementary material, figure S3). Future work involv-
ing spatially explicit simulations, together with accurate
measures of Y chromosome diversity, are needed to investi-
gate how the current distribution of sub-haplogroups may
have been produced. In this context, recent work by
Sjodin & Francois [47] rejected a Palaeolithic dispersion
for R1b-M269 using spatial simulations based on the data-
set of Balaresque. Nevertheless, we note that additional
work is still necessary as these authors were not aware of
the limitation of the Balaresque dataset presented here,
and did not fully explore the impact of the different molecu-
lar characteristics of the investigated loci on their analysis.
Age estimates based on sets of Y-STRs carefully
selected to possess the attributes necessary for uncovering
deep ancestry (for example, from the almost 200 recently
characterized here [33]), and from whole Y chromosome
The cautionary tale of R-M269 in Europe G. B. J. Busby et al. 891
on January 25, 2012rspb.royalsocietypublishing.orgDownloaded from
sequence comparisons, will provide robust dates for this
haplogroup in the future. For now, we can offer no date
as to the age of R-M269 or R-S127, but believe that
our STR analyses suggest the recent age estimates of
R-M269 [20] and R-S116 [21] are likely to be younger
than the true values, and the homogeneity of STR var-
iance and distribution of sub-types across the continent
are inconsistent with the hypothesis of the Neolithic
diffusion of the R-M269 Y chromosome lineage.
We thank all donors who contributed DNA for this projectand Hugh Sturrock for help with the spatial analysis. Wealso thank Prof. Bernd Brinkmann at the Institute ofForensic Genetics in Munster for access to samples fromTurkey. G.B.J.B. and C.C. conceived and designed theexperiments, G.B.J.B., F.B., P.S.D., E.R.L., C.M.C.,M.G.T., D.G.B., L.G., M.V., G.F. and J.F.W. genotypedthe samples, G.B.J.B. analysed the data, C.M.C., M.G.T.,D.G.B., L.G., B.W., W.B., M.V., V.C., F.S., S.T., G.V.,R.P., C.V., T.Z., I.R., S.K., D.T., P.A., G.F., C.R., T.H.,T.M. and J.F.W. contributed reagents/materials, andG.B.J.B. and C.C. wrote the paper.
G.B.J.B. is supported by a BBSRC doctoral training grant andSomerville College, University of Oxford, and J.F.W. by theRoyal Society. A subset of the genotyping data was generatedwithin a project funded by the British Academy (BARDA-47870). V.C. was supported by Provincia Autonoma di Trento(BIOSTRE project, Post-doc 2006). C.C. is an RCUKAcademic Fellow. F.B., V.C. and P.A. were supported by grantPrin 2009 project 200975T9EW from MUIR. S.T. wassupported by a University of Pisa 60%2010 grant. The fundershad no role in study design, data collection and analysis,decision to publish, or preparation of the manuscript. Theauthors declare no conflict of interest.
REFERENCES1 Menozzi, P., Piazza, A. & Cavalli-Sforza, L. 1978 Syn-
thetic maps of human gene frequencies in Europeans.Science 201, 786–792. (doi:10.1126/science.356262)
2 Cavalli-Sforza, L. L., Menozzi, P. & Piazza, A. 1994
The history and geography of human genes. Princeton, NJ:Princeton University Press.
3 Diamond, J. & Bellwood, P. 2003 Farmers and theirlanguages: the first expansions. Science 300, 597–603.(doi:10.1126/science.1078208)
4 Blockley, S. P. E. & Pinhasi, R. 2011 A revised chronol-ogy for the adoption of agriculture in the SouthernLevant and the role of Late Glacial climatic change.Q. Sci. Rev. 30, 98–108. (doi:10.1016/j.quascirev.2010.09.021)
5 Gamble, C., Davies, W., Pettitt, P., Hazelwood, L. &Richards, M. 2005 The archaeological and geneticfoundations of the European population during theLate Glacial: implications for ‘agricultural thinking’.Camb. Archaeol. J. 15, 193–223. (doi:10.1017/S0959
774305000107)6 Collard, M., Edinborough, K., Shennan, S. & Thomas,
M. G. 2010 Radiocarbon evidence indicates thatmigrants introduced farming to Britain. J. Archaeol. Sci.37, 866–870. (doi:10.1016/j.jas.2009.11.016)
7 Cunliffe, B. 1994 The Oxford illustrated history of prehistoricEurope. Oxford, UK: Oxford University Press.
8 Jobling, D. M., Hurles, M. & Tyler-Smith, C. 2004Human evolutionary genetics: origins, peoples and disease,1st edn. New York, NY: Garland Science.
9 Chikhi, L., Nichols, R. A., Barbujani, G. & Beaumont,M. A. 2002 Y genetic data support the Neolithic demicdiffusion model. Proc. Natl Acad. Sci. USA 99, 11 008–11 013. (doi:10.1073/pnas.162158799)
Proc. R. Soc. B (2012)
10 Capelli, C. et al. 2003 A Y chromosome census of theBritish Isles. Curr. Biol. 13, 979–984. (doi:10.1016/S0960-9822(03)00373-7)
11 Capelli, C. et al. 2006 Population structure in the Medi-terranean basin: a Y chromosome perspective. Ann.Hum. Genet. 70, 207–225. (doi:10.1111/j.1529-8817.2005.00224.x)
12 Battaglia, V. et al. 2008 Y-chromosomal evidence of the
cultural diffusion of agriculture in southeast Europe.Eur. J. Hum. Genet. 17, 820–830. (doi:10.1038/ejhg.2008.249)
13 Gallagher, A., Gunther, M. M. & Bruchhaus, H. 2009
Population continuity, demic diffusion and Neolithic ori-gins in central-southern Germany: the evidence frombody proportions. HOMO J. Comp. Hum. Biol. 60,95–126. (doi:10.1016/j.jchb.2008.05.006)
14 Francalacci, P. & Sanna, D. 2008 History and geography
of human Y-chromosome in Europe: a SNP perspective.J. Anthropol. Sci. 86, 59–89.
15 Rowley-Conwy, P. 2009 Human prehistory: hunting forthe earliest farmers. Curr. Biol. 19, R948–R949.(doi:10.1016/j.cub.2009.09.054)
16 Francalacci, P., Morelli, L., Useli, A. & Sanna, D. 2010The history and geography of the y chromosome SNPsin Europe: an update. J. Anthropol. Sci. 88, 207–214.
17 Semino, O. et al. 2000 The genetic legacy of paleolithicHomo sapiens sapiens in extant europeans: a Y chromo-
some perspective. Science 290, 1155–1159. (doi:10.1126/science.290.5494.1155)
18 Rosser, Z. H. et al. 2000 Y-chromosomal diversity inEurope is clinal and influenced primarily by geography,
rather than by language. Am. J. Hum. Genet. 67,1526–1543. (doi:10.1086/316890)
19 Novembre, J. et al. 2008 Genes mirror geographywithin Europe. Nature 456, 98–101. (doi:10.1038/nature07331)
20 Balaresque, P. et al. 2010 A predominantly neolithicorigin for European paternal lineages. PLoS Biol. 8,e1000285. (doi:10.1371/journal.pbio.1000285)
21 Myres, N. M. et al. 2011 A major Y-chromosome hap-logroup R1b Holocene era founder effect in Central
and Western Europe. Eur. J. Hum. Genet. 19, 95–101.(doi:10.1038/ejhg.2010.146)
22 Morelli, L., Contu, D., Santoni, F., Whalen, M. B.,Francalacci, P. & Cucca, F. 2010 A comparison ofY-chromosome variation in Sardinia and Anatolia is
more consistent with cultural rather than demic diffu-sion of agriculture. PLoS ONE 5, e10419. (doi:10.1371/journal.pone.0010419)
23 Wilson, J. F., Weiss, D. A., Richards, M., Thomas,
M. G., Bradman, N. & Goldstein, D. B. 2001 Geneticevidence for different male and female roles duringcultural transitions in the British Isles. Proc. NatlAcad. Sci. USA 98, 5078–5083. (doi:10.1073/pnas.071036898)
24 Cruciani, F. et al. 2011 Strong intra- and inter-continen-tal differentiation revealed by Y chromosome SNPsM269, U106 and U152. Forensic Sci. Int. Genet. 5,e49–e52. (doi:10.1016/j.fsigen.2010.07.006)
25 Zhivotovsky, L. A. et al. 2004 The effective mutation rate
at Y chromosome short tandem repeats, with applicationto human population-divergence time. Am. J. Hum.Genet. 74, 50–61. (doi:10.1086/380911)
26 Goldstein, D. B., Ruiz Linares, A., Cavalli-Sforza, L. L. &Feldman, M. W. 1995 An evaluation of genetic distances
for use with microsatellite loci. Genetics 139, 463.27 Mulero, J. J., Chang, C. W., Calandro, L. M., Green, R.
L., Li, Y., Johnson, C. L. & Hennessy, L. K. 2006 Devel-opment and validation of the AmpF‘STRw Yfiler
TM
PCRamplification kit: a male specific, single amplification 17

892 G. B. J. Busby et al. The cautionary tale of R-M269 in Europe
on January 25, 2012rspb.royalsocietypublishing.orgDownloaded from
Y-STR multiplex system. J. Forensic Sci. 51, 64–75.(doi:10.1111/j.1556-4029.2005.00016.x)
28 Krenke, B. E. et al. 2005 Validation of a male-specific,
12-locus fluorescent short tandem repeat (STR) multi-plex. Forensic Sci. Int. 148, 1–14. (doi:10.1016/j.forsciint.2004.07.008)
29 Weale, M. E., Weiss, D. A., Jager, R. F., Bradman, N. &Thomas, M. G. 2002 Y chromosome evidence for Anglo-
Saxon mass migration. Mol. Biol. Evol. 19, 1008–1021.30 Butler, J. M., Schoske, R., Vallone, P. M., Kline, M. C.,
Redd, A. J. & Hammer, M. F. 2002 A novel multiplex forsimultaneous amplification of 20 Y chromosome STR
markers. Forensic Sci. Int. 129, 10–24. (doi:10.1016/S0379-0738(02)00195-0)
31 Gusmao, L. & Alves, C. 2005 Y Chromosome STRtyping. In Forensic DNA typing protocols (ed. A. Carra-cedo), pp. 67–81. Totowa, NJ: Humana Press.
32 R Development Core Team. 2011 R: a language andenvironment for statistical computing. Vienna, Austria: RFoundation for Statistical Computing.
33 Ballantyne, K. N. et al. 2010 Mutability of Y-chromoso-mal microsatellites: rates, characteristics, molecular
bases, and forensic implications. Am. J. Hum. Genet.87, 341–353. (doi:10.1016/j.ajhg.2010.08.006)
34 Willuweit, S. & Roewer, L. 2007 Y chromosome haplo-type reference database (YHRD): update. Forensic Sci.Int. Genet. 1, 83–87. (doi:10.1016/j.fsigen.2007.01.017)
35 Wilson, I. J., Weale, M. E. & Balding, D. J. 2003Inferences from DNA data: population histories, evol-utionary processes and forensic match probabilities.J. R. Stat. Soc. A 166, 155–188. (doi:10.1111/1467-
985X.00264)36 Shi, W. et al. 2010 A worldwide survey of human male
demographic history based on Y-SNP and Y-STR datafrom the HGDP-CEPH populations. Mol. Biol. Evol.27, 385–393. (doi:10.1093/molbev/msp243)
37 Capelli, C. et al. 2007 Y chromosome genetic variationin the Italian peninsula is clinal and supports an ad-mixture model for the Mesolithic–Neolithic encounter.Mol. Phylogenet. Evol. 44, 228–239. (doi:10.1016/j.ympev.2006.11.030)
38 Moore, L. T., McEvoy, B., Cape, E., Simms, K. &Bradley, D. G. 2006 A Y-chromosome signature of
Proc. R. Soc. B (2012)
hegemony in Gaelic Ireland. Am. J. Hum. Genet. 78,334–338. (doi:10.1086/500055)
39 Sengupta, S. et al. 2006 Polarity and temporality of high-
resolution Y-chromosome distributions in India identifyboth indigenous and exogenous expansions andreveal minor genetic influence of Central Asian pastoral-ists. Am. J. Hum. Genet. 78, 202–221. (doi:10.1086/499411)
40 Batini, C. et al. In press. Signatures of the pre-agriculturalpeopling processes in sub-Saharan Africa as revealed bythe phylogeography of early Y chromosome lineages.Mol. Biol. Evol. (doi:10.1093/molbev/msr089)
41 Zhivotovsky, L. A., Underhill, P. A. & Feldman, M. W.2006 Difference between evolutionarily effective andgerm line mutation rate due to stochastically varyinghaplogroup size. Mol. Biol. Evol. 23, 2268–2270.(doi:10.1093/molbev/msl105)
42 Di Giacomo, F. et al. 2004 Y chromosomal haplogroup Jas a signature of the post-Neolithic colonization ofEurope. Hum. Genet. 115, 357–371. (doi:10.1007/s00439-004-1168-9)
43 Zhivotovsky, L. A. & Underhill, P. A. 2005 On the evol-
utionary mutation rate at Y-chromosome STRs:comments on paper by Di Giacomo et al. (2004).Hum. Genet. 116, 529–532. (doi:10.1007/s00439-005-1281-4)
44 Gusmao, L. et al. 2005 Mutation rates at Y chromosome
specific microsatellites. Hum. Mutat. 26, 520–528.(doi:10.1002/humu.20254)
45 Kayser, M. et al. 2000 Characteristics and frequency ofgermline mutations at microsatellite loci from the
human Y chromosome, as revealed by direct observationin father/son pairs. Am. J. Hum. Genet. 66, 1580–1588.(doi:10.1086/302905)
46 Bocquet-Appel, J.-P., Naji, S., Linden, M. V. &Kozlowski, J. K. 2009 Detection of diffusion and contact
zones of early farming in Europe from the space-time dis-tribution of 14C dates. J. Archaeol. Sci. 36, 807–820.(doi:10.1016/j.jas.2008.11.004)
47 Sjodin, P. & Francois, O. 2011 Wave-of-advance modelsof the diffusion of the Y chromosome haplogroup
R1b1b2 in Europe. PLoS ONE 6, e21592. (doi:10.1371/journal.pone.0021592)
Copyright © 2022 FDOKUMEN