Three phases for the early peopling of Hainan Island viewed from mitochondrial DNA
10
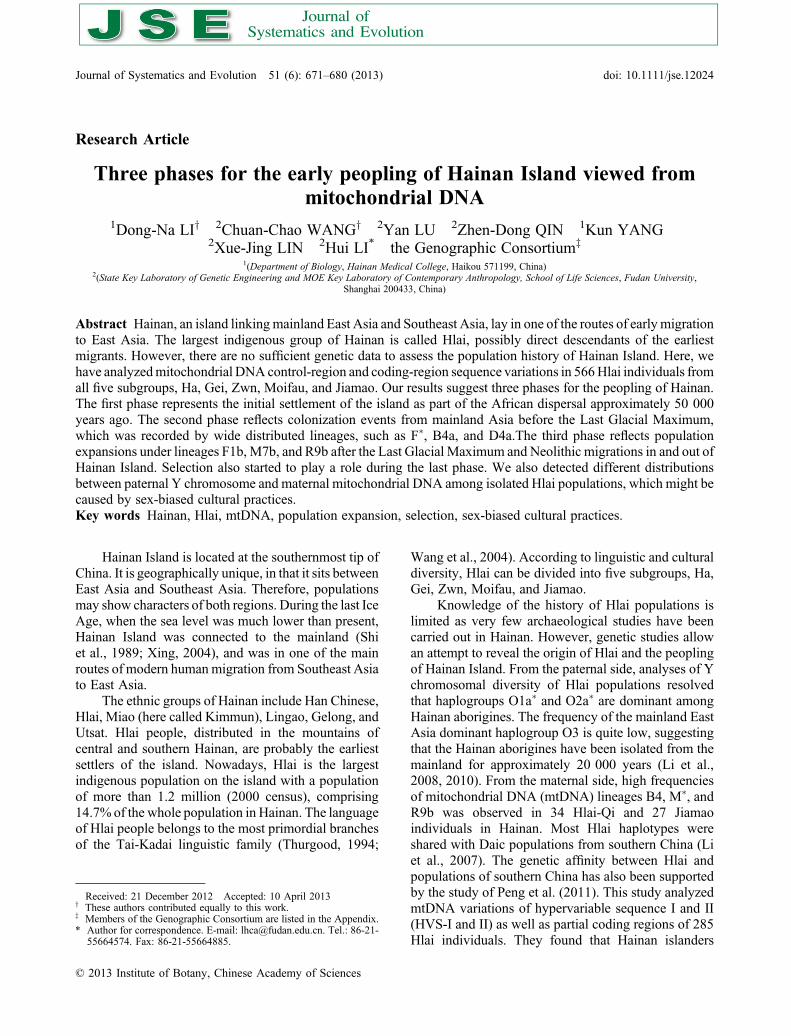
Research Article Three phases for the early peopling of Hainan Island viewed from mitochondrial DNA 1 Dong‐Na LI y 2 Chuan‐Chao WANG y 2 Yan LU 2 Zhen‐Dong QIN 1 Kun YANG 2 Xue‐Jing LIN 2 Hui LI * the Genographic Consortium z 1 (Department of Biology, Hainan Medical College, Haikou 571199, China) 2 (State Key Laboratory of Genetic Engineering and MOE Key Laboratory of Contemporary Anthropology, School of Life Sciences, Fudan University, Shanghai 200433, China) Abstract Hainan, an island linking mainland East Asia and Southeast Asia, lay in one of the routes of early migration to East Asia. The largest indigenous group of Hainan is called Hlai, possibly direct descendants of the earliest migrants. However, there are no sufficient genetic data to assess the population history of Hainan Island. Here, we have analyzed mitochondrial DNA control‐region and coding‐region sequence variations in 566 Hlai individuals from all five subgroups, Ha, Gei, Zwn, Moifau, and Jiamao. Our results suggest three phases for the peopling of Hainan. The first phase represents the initial settlement of the island as part of the African dispersal approximately 50 000 years ago. The second phase reflects colonization events from mainland Asia before the Last Glacial Maximum, which was recorded by wide distributed lineages, such as F , B4a, and D4a.The third phase reflects population expansions under lineages F1b, M7b, and R9b after the Last Glacial Maximum and Neolithic migrations in and out of Hainan Island. Selection also started to play a role during the last phase. We also detected different distributions between paternal Y chromosome and maternal mitochondrial DNA among isolated Hlai populations, which might be caused by sex‐biased cultural practices. Key words Hainan, Hlai, mtDNA, population expansion, selection, sex‐biased cultural practices. Hainan Island is located at the southernmost tip of China. It is geographically unique, in that it sits between East Asia and Southeast Asia. Therefore, populations may show characters of both regions. During the last Ice Age, when the sea level was much lower than present, Hainan Island was connected to the mainland (Shi et al., 1989; Xing, 2004), and was in one of the main routes of modern human migration from Southeast Asia to East Asia. The ethnic groups of Hainan include Han Chinese, Hlai, Miao (here called Kimmun), Lingao, Gelong, and Utsat. Hlai people, distributed in the mountains of central and southern Hainan, are probably the earliest settlers of the island. Nowadays, Hlai is the largest indigenous population on the island with a population of more than 1.2 million (2000 census), comprising 14.7% of the whole population in Hainan. The language of Hlai people belongs to the most primordial branches of the Tai‐Kadai linguistic family (Thurgood, 1994; Wang et al., 2004). According to linguistic and cultural diversity, Hlai can be divided into five subgroups, Ha, Gei, Zwn, Moifau, and Jiamao. Knowledge of the history of Hlai populations is limited as very few archaeological studies have been carried out in Hainan. However, genetic studies allow an attempt to reveal the origin of Hlai and the peopling of Hainan Island. From the paternal side, analyses of Y chromosomal diversity of Hlai populations resolved that haplogroups O1a and O2a are dominant among Hainan aborigines. The frequency of the mainland East Asia dominant haplogroup O3 is quite low, suggesting that the Hainan aborigines have been isolated from the mainland for approximately 20 000 years (Li et al., 2008, 2010). From the maternal side, high frequencies of mitochondrial DNA (mtDNA) lineages B4, M , and R9b was observed in 34 Hlai‐Qi and 27 Jiamao individuals in Hainan. Most Hlai haplotypes were shared with Daic populations from southern China (Li et al., 2007). The genetic affinity between Hlai and populations of southern China has also been supported by the study of Peng et al. (2011). This study analyzed mtDNA variations of hypervariable sequence I and II (HVS‐I and II) as well as partial coding regions of 285 Hlai individuals. They found that Hainan islanders Received: 21 December 2012 Accepted: 10 April 2013 y These authors contributed equally to this work. z Members of the Genographic Consortium are listed in the Appendix. * Author for correspondence. E‐mail: [email protected]. Tel.: 86‐21‐ 55664574. Fax: 86‐21‐55664885. Journal of Systematics and Evolution 51 (6): 671–680 (2013) doi: 10.1111/jse.12024 © 2013 Institute of Botany, Chinese Academy of Sciences
Transcript of Three phases for the early peopling of Hainan Island viewed from mitochondrial DNA
Research Article
Three phases for the early peopling of Hainan Island viewed frommitochondrial DNA
1Dong‐Na LIy 2Chuan‐Chao WANGy 2Yan LU 2Zhen‐Dong QIN 1Kun YANG2Xue‐Jing LIN 2Hui LI* the Genographic Consortiumz
1(Department of Biology, Hainan Medical College, Haikou 571199, China)2(State Key Laboratory of Genetic Engineering and MOE Key Laboratory of Contemporary Anthropology, School of Life Sciences, Fudan University,
Shanghai 200433, China)
Abstract Hainan, an island linkingmainland East Asia and Southeast Asia, lay in one of the routes of early migrationto East Asia. The largest indigenous group of Hainan is called Hlai, possibly direct descendants of the earliestmigrants. However, there are no sufficient genetic data to assess the population history of Hainan Island. Here, wehave analyzedmitochondrial DNA control‐region and coding‐region sequence variations in 566Hlai individuals fromall five subgroups, Ha, Gei, Zwn, Moifau, and Jiamao. Our results suggest three phases for the peopling of Hainan.The first phase represents the initial settlement of the island as part of the African dispersal approximately 50 000years ago. The second phase reflects colonization events from mainland Asia before the Last Glacial Maximum,which was recorded by wide distributed lineages, such as F�, B4a, and D4a.The third phase reflects populationexpansions under lineages F1b, M7b, and R9b after the Last Glacial Maximum and Neolithic migrations in and out ofHainan Island. Selection also started to play a role during the last phase. We also detected different distributionsbetween paternal Y chromosome and maternal mitochondrial DNA among isolated Hlai populations, which might becaused by sex‐biased cultural practices.Key words Hainan, Hlai, mtDNA, population expansion, selection, sex‐biased cultural practices.
Hainan Island is located at the southernmost tip ofChina. It is geographically unique, in that it sits betweenEast Asia and Southeast Asia. Therefore, populationsmay show characters of both regions. During the last IceAge, when the sea level was much lower than present,Hainan Island was connected to the mainland (Shiet al., 1989; Xing, 2004), and was in one of the mainroutes of modern humanmigration from Southeast Asiato East Asia.
The ethnic groups of Hainan include Han Chinese,Hlai, Miao (here called Kimmun), Lingao, Gelong, andUtsat. Hlai people, distributed in the mountains ofcentral and southern Hainan, are probably the earliestsettlers of the island. Nowadays, Hlai is the largestindigenous population on the island with a populationof more than 1.2 million (2000 census), comprising14.7% of the whole population in Hainan. The languageof Hlai people belongs to the most primordial branchesof the Tai‐Kadai linguistic family (Thurgood, 1994;
Wang et al., 2004). According to linguistic and culturaldiversity, Hlai can be divided into five subgroups, Ha,Gei, Zwn, Moifau, and Jiamao.
Knowledge of the history of Hlai populations islimited as very few archaeological studies have beencarried out in Hainan. However, genetic studies allowan attempt to reveal the origin of Hlai and the peoplingof Hainan Island. From the paternal side, analyses of Ychromosomal diversity of Hlai populations resolvedthat haplogroups O1a� and O2a� are dominant amongHainan aborigines. The frequency of the mainland EastAsia dominant haplogroup O3 is quite low, suggestingthat the Hainan aborigines have been isolated from themainland for approximately 20 000 years (Li et al.,2008, 2010). From the maternal side, high frequenciesof mitochondrial DNA (mtDNA) lineages B4, M�, andR9b was observed in 34 Hlai‐Qi and 27 Jiamaoindividuals in Hainan. Most Hlai haplotypes wereshared with Daic populations from southern China (Liet al., 2007). The genetic affinity between Hlai andpopulations of southern China has also been supportedby the study of Peng et al. (2011). This study analyzedmtDNA variations of hypervariable sequence I and II(HVS‐I and II) as well as partial coding regions of 285Hlai individuals. They found that Hainan islanders
Received: 21 December 2012 Accepted: 10 April 2013y These authors contributed equally to this work.z Members of the Genographic Consortium are listed in the Appendix.* Author for correspondence. E‐mail: [email protected]. Tel.: 86‐21‐
55664574. Fax: 86‐21‐55664885.
Journal of Systematics and Evolution 51 (6): 671–680 (2013) doi: 10.1111/jse.12024
© 2013 Institute of Botany, Chinese Academy of Sciences
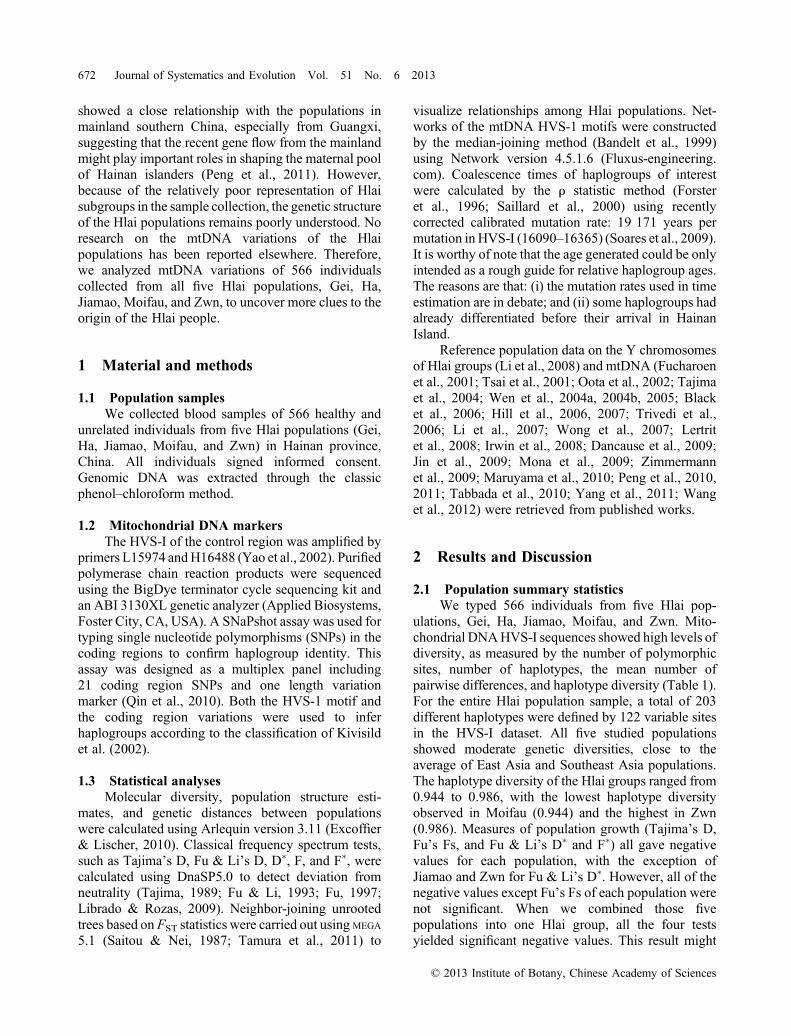
showed a close relationship with the populations inmainland southern China, especially from Guangxi,suggesting that the recent gene flow from the mainlandmight play important roles in shaping the maternal poolof Hainan islanders (Peng et al., 2011). However,because of the relatively poor representation of Hlaisubgroups in the sample collection, the genetic structureof the Hlai populations remains poorly understood. Noresearch on the mtDNA variations of the Hlaipopulations has been reported elsewhere. Therefore,we analyzed mtDNA variations of 566 individualscollected from all five Hlai populations, Gei, Ha,Jiamao, Moifau, and Zwn, to uncover more clues to theorigin of the Hlai people.
1 Material and methods
1.1 Population samplesWe collected blood samples of 566 healthy and
unrelated individuals from five Hlai populations (Gei,Ha, Jiamao, Moifau, and Zwn) in Hainan province,China. All individuals signed informed consent.Genomic DNA was extracted through the classicphenol–chloroform method.
1.2 Mitochondrial DNA markersThe HVS‐I of the control region was amplified by
primers L15974 andH16488 (Yao et al., 2002). Purifiedpolymerase chain reaction products were sequencedusing the BigDye terminator cycle sequencing kit andan ABI 3130XL genetic analyzer (Applied Biosystems,Foster City, CA, USA). A SNaPshot assay was used fortyping single nucleotide polymorphisms (SNPs) in thecoding regions to confirm haplogroup identity. Thisassay was designed as a multiplex panel including21 coding region SNPs and one length variationmarker (Qin et al., 2010). Both the HVS‐1 motif andthe coding region variations were used to inferhaplogroups according to the classification of Kivisildet al. (2002).
1.3 Statistical analysesMolecular diversity, population structure esti-
mates, and genetic distances between populationswere calculated using Arlequin version 3.11 (Excoffier& Lischer, 2010). Classical frequency spectrum tests,such as Tajima’s D, Fu & Li’s D, D�, F, and F�, werecalculated using DnaSP5.0 to detect deviation fromneutrality (Tajima, 1989; Fu & Li, 1993; Fu, 1997;Librado & Rozas, 2009). Neighbor‐joining unrootedtrees based on FST statistics were carried out using MEGA
5.1 (Saitou & Nei, 1987; Tamura et al., 2011) to
visualize relationships among Hlai populations. Net-works of the mtDNA HVS‐1 motifs were constructedby the median‐joining method (Bandelt et al., 1999)using Network version 4.5.1.6 (Fluxus‐engineering.com). Coalescence times of haplogroups of interestwere calculated by the r statistic method (Forsteret al., 1996; Saillard et al., 2000) using recentlycorrected calibrated mutation rate: 19 171 years permutation in HVS‐I (16090–16365) (Soares et al., 2009).It is worthy of note that the age generated could be onlyintended as a rough guide for relative haplogroup ages.The reasons are that: (i) the mutation rates used in timeestimation are in debate; and (ii) some haplogroups hadalready differentiated before their arrival in HainanIsland.
Reference population data on the Y chromosomesof Hlai groups (Li et al., 2008) and mtDNA (Fucharoenet al., 2001; Tsai et al., 2001; Oota et al., 2002; Tajimaet al., 2004; Wen et al., 2004a, 2004b, 2005; Blacket al., 2006; Hill et al., 2006, 2007; Trivedi et al.,2006; Li et al., 2007; Wong et al., 2007; Lertritet al., 2008; Irwin et al., 2008; Dancause et al., 2009;Jin et al., 2009; Mona et al., 2009; Zimmermannet al., 2009; Maruyama et al., 2010; Peng et al., 2010,2011; Tabbada et al., 2010; Yang et al., 2011; Wanget al., 2012) were retrieved from published works.
2 Results and Discussion
2.1 Population summary statisticsWe typed 566 individuals from five Hlai pop-
ulations, Gei, Ha, Jiamao, Moifau, and Zwn. Mito-chondrial DNAHVS‐I sequences showed high levels ofdiversity, as measured by the number of polymorphicsites, number of haplotypes, the mean number ofpairwise differences, and haplotype diversity (Table 1).For the entire Hlai population sample, a total of 203different haplotypes were defined by 122 variable sitesin the HVS‐I dataset. All five studied populationsshowed moderate genetic diversities, close to theaverage of East Asia and Southeast Asia populations.The haplotype diversity of the Hlai groups ranged from0.944 to 0.986, with the lowest haplotype diversityobserved in Moifau (0.944) and the highest in Zwn(0.986). Measures of population growth (Tajima’s D,Fu’s Fs, and Fu & Li’s D� and F�) all gave negativevalues for each population, with the exception ofJiamao and Zwn for Fu & Li’s D�. However, all of thenegative values except Fu’s Fs of each population werenot significant. When we combined those fivepopulations into one Hlai group, all the four testsyielded significant negative values. This result might
© 2013 Institute of Botany, Chinese Academy of Sciences
672 Journal of Systematics and Evolution Vol. 51 No. 6 2013
suggest very low levels of growth across the Hlaigroups.
2.2 Mitochondrial DNA haplogroup profilesAll the samples were assigned to mtDNA
haplogroups using a combination of HVS‐I sequencemotifs and SNPs distributed around the coding regionof the mtDNA genome. A total of 43 haplogroups orparagroups (unclassified lineages within a clademarkedwith an asterisk (�)) were identified (Table S1). Amongthe five groups, Ha shows the highest degree ofheterogeneity, with 30 lineages, followed by Zwn (29)and Jiamao (26), and the other two populations have 24lineages each. Almost all the mtDNA lineages in Hlaigroups are East Asian‐specific haplogroups, includingthose fromNortheast Asia (A, D, G,M8a, C, and Z) andsouthern China or Southeast Asia (B, F, M7, and R9).The frequencies of Northeast Asian haplogroups in Gei,Ha, Jiamao, Moifau, and Zwn are 16.07%, 13.12%,10.89%, 14.56%, and 21.88%, respectively. However,Jiamao, Ha, Moifau, Gei and, to a lesser extent, Zwn,show a considerable proportion of southern China orSoutheast Asia lineages (81.19%, 77.87%, 77.67%,75.00%, and 62.50%, respectively) (Table S2). Thehigh frequencies of southern haplogroups are consistentwith our previous paternal Y chromosome study (Liet al., 2008) which suggested that the specific lineagesof southern areas of mainland East Asia (haplogroupsO1a‐M119 and O2a1‐M95) are also dominant in Hlaigroups.
2.3 Phylogeography of macrohaplogroup NHowever, mtDNA haplogroup frequencies vary a
lot among the Hlai populations (Table S2). HaplogroupR and its subhaplogroups (F and B) represent themajority of the lineages branching from the super-haplogroup N. Haplogroup F1a1 and F1b comprise20.39% and 18.45% of Moifau people, respectively. Inthe other four Hlai populations, however, those twohaplogroups are observed at moderate or relativelylow levels (Zwn: 0, 2.34%; Gei: 9.82%, 2.68%;
Jiamao: 3.96%, 3.96%; Ha: 5.74%, 2.46%). At thehaplotype level, one haplotype (16129‐16162‐16172‐16304‐16399) was carried by 90.48% of Moifau F1a1individuals and the other haplotype (16189‐16304‐16311) also contributed 89.47% of Moifau F1b,suggesting a strong bottleneck or founder effect inthe maternal population history of Moifau. It isnoteworthy that haplogroup F1a4, which was previous-ly suggested as one of the candidate lineages for amid‐Holocene Taiwanese dispersal (Hill et al., 2007;Tabbada et al., 2010), was also detected, albeit limited,in Hlai groups except Moifau (from 1.79% in Gei to0.82% in Ha). Haplogroup B4 is characterized bysubhaplogroup B4b1 in Hlai groups but its frequencydecreases northward, from Ha (10.66%) and Jiamao(8.91%) to Gei (5.36%), Zwn (3.91%) and Moifau(2.91%). Haplogroup B5 is largely represented by B5ain Gei (7.14%), Zwn (4.69%), Ha (4.10%), Jiamao(2.97%), and Moifau (1.94%).
One of the basal mtDNA lineages R22 wasreported in the Nicobar Islands (Trivedi et al., 2006),Nias islands (van Oven et al., 2011), and shows aconcentration in eastern Indonesia (Hill et al., 2007).R22 was also detected in Cham, Thailand, andCambodia (4.2%, 1.1%, and 6.5%, respectively)(Peng et al., 2010). R22 might represent indigenousSoutheast Asian lineages. However, R22 was alsofound in Gei at a frequency of 0.89% in this study,which might reflect very recent gene flow, or probablyrepresent ancient maternal lineages tracing back to thefirst settlers in Hainan. Haplogroup N�, a sister cladeof haplogroup R, is largely represented by N9a inHlai populations. Specifically, haplotype N9a‐16311‐16390, which predominates in Maonan (12.5%) andother populations at the border of Guangxi and Guizhou(Li et al., 2007), comprises 63.64% of all the N9asamples in Hlai.
2.4 Phylogeography of macrohaplogroup MThe frequencies of superhaplogroup M in Hlai
populations also vary heavily, ranging from 54.46% in
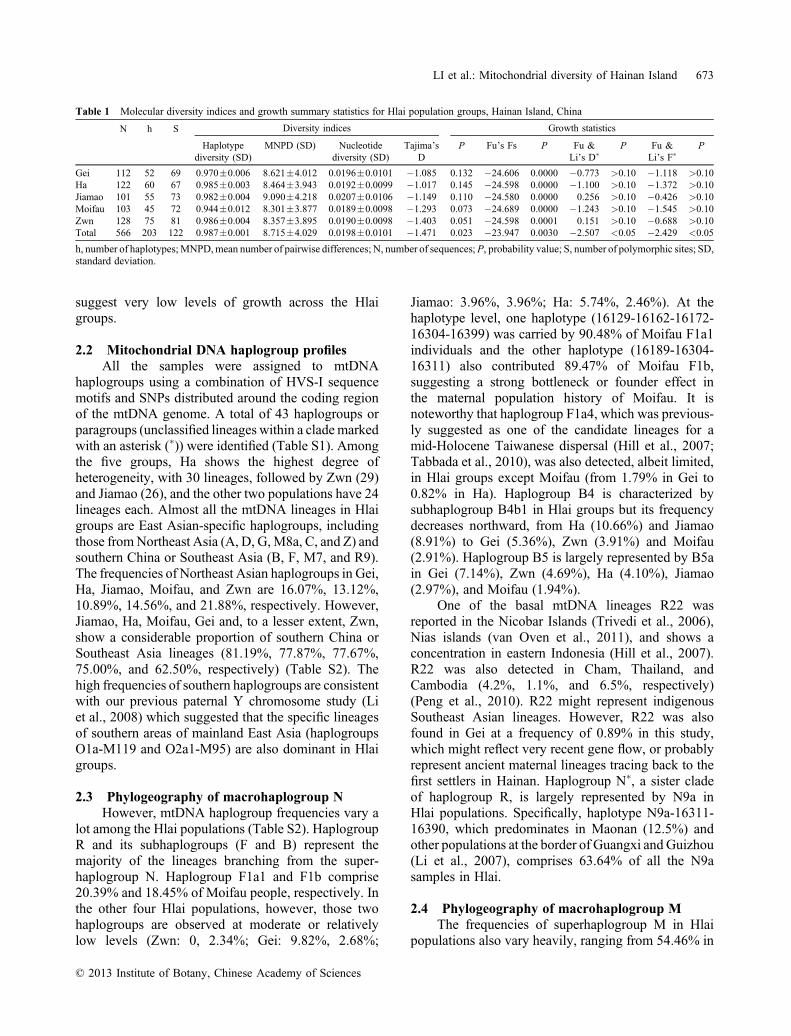
Table 1 Molecular diversity indices and growth summary statistics for Hlai population groups, Hainan Island, China
N h S Diversity indices Growth statistics
Haplotypediversity (SD)
MNPD (SD) Nucleotidediversity (SD)
Tajima’sD
P Fu’s Fs P Fu &Li’s D�
P Fu &Li’s F�
P
Gei 112 52 69 0.970�0.006 8.621�4.012 0.0196�0.0101 �1.085 0.132 �24.606 0.0000 �0.773 >0.10 �1.118 >0.10Ha 122 60 67 0.985�0.003 8.464�3.943 0.0192�0.0099 �1.017 0.145 �24.598 0.0000 �1.100 >0.10 �1.372 >0.10Jiamao 101 55 73 0.982�0.004 9.090�4.218 0.0207�0.0106 �1.149 0.110 �24.580 0.0000 0.256 >0.10 �0.426 >0.10Moifau 103 45 72 0.944�0.012 8.301�3.877 0.0189�0.0098 �1.293 0.073 �24.689 0.0000 �1.243 >0.10 �1.545 >0.10Zwn 128 75 81 0.986�0.004 8.357�3.895 0.0190�0.0098 �1.403 0.051 �24.598 0.0001 0.151 >0.10 �0.688 >0.10Total 566 203 122 0.987�0.001 8.715�4.029 0.0198�0.0101 �1.471 0.023 �23.947 0.0030 �2.507 <0.05 �2.429 <0.05
h, number of haplotypes;MNPD,mean number of pairwise differences; N, number of sequences;P, probability value; S, number of polymorphic sites; SD,standard deviation.
© 2013 Institute of Botany, Chinese Academy of Sciences
LI et al.: Mitochondrial diversity of Hainan Island 673
Gei to 21.36% in Moifau. Within this superhaplogroup,haplogroup M7 and its subhaplogroups (M7b, M7b1,M7c1, and M7e) were found to predominate in the Hlaimaternal gene pool, which represents nearly a quarter ofindividuals in Zwn and Jiamao, and one third of Gei andHa. Correspondingly, these haplogroups are rare orabsent in Moifau. It is noteworthy that haplogroup M7�
and M7b show geographical differential distributionsamong the four Hlai populations (Zwn, Gei, Jiamao,and Ha). Higher proportions of M7b are observed in thenorthern populations (Zwn and Gei: 11.72%, 9.82%,respectively) compared to that in the southern groups(Jiamao and Ha: 5.94%, 5.74%, respectively). Incontrast, M7� comprises 11.88% and 12.30% of Jiamaoand Ha, but only accounts for 3.13% and 4.46% of Zwnand Gei. At the haplotype level, one haplotype (16129‐16223‐16297) comprises 64.10% of Hlai M7b samples.Haplogroup M7e represents roughly 10% of Gei andHa, but only comprises 6.25% of Zwn and less than 1%ofMoifau and Jiamao.WithinM7e, only one haplotypewas found among 12Gei individuals, whereas five were
found among the Hlai. Haplogroup D, the sister clade ofhaplogroup M�, accounts for more than 10% of Zwnand Gei, but only comprises 3.96% of Jiamao.Specifically, subhaplogroup D5 represents the majorityof haplogroup D samples in Gei (8.04%) and Moifau(7.77%), as well as Ha (4.92%). In contrast, D4aaccounts for 6.25% of Zwn.
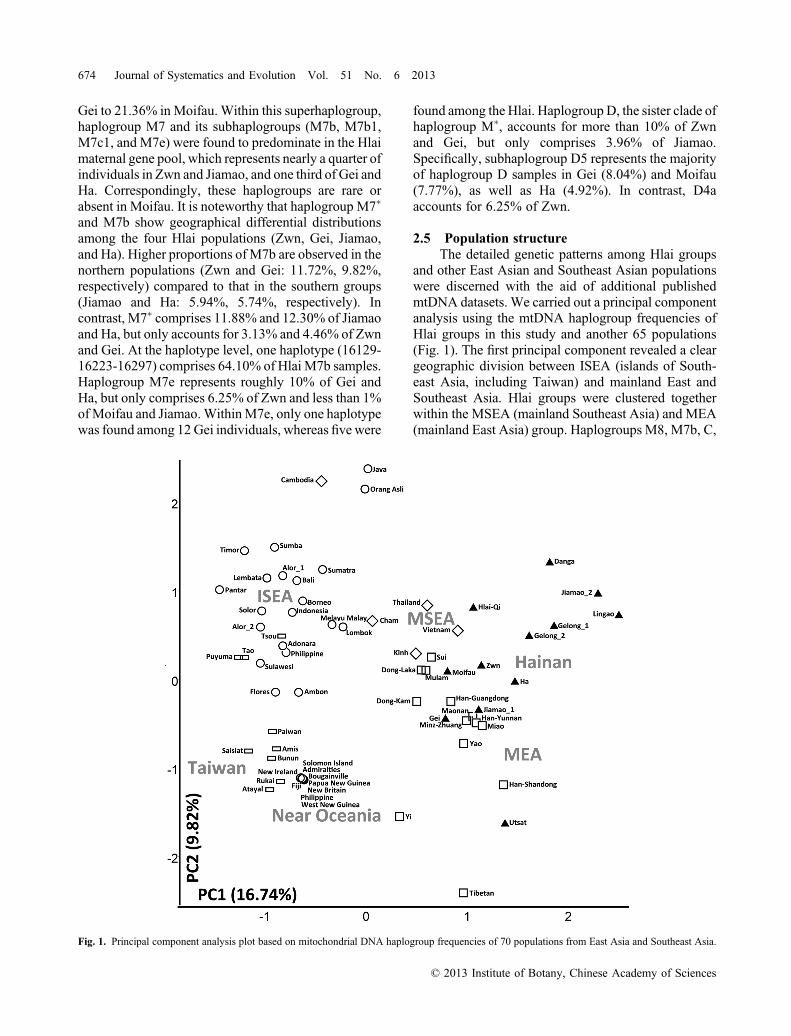
2.5 Population structureThe detailed genetic patterns among Hlai groups
and other East Asian and Southeast Asian populationswere discerned with the aid of additional publishedmtDNA datasets. We carried out a principal componentanalysis using the mtDNA haplogroup frequencies ofHlai groups in this study and another 65 populations(Fig. 1). The first principal component revealed a cleargeographic division between ISEA (islands of South-east Asia, including Taiwan) and mainland East andSoutheast Asia. Hlai groups were clustered togetherwithin the MSEA (mainland Southeast Asia) and MEA(mainland East Asia) group. Haplogroups M8, M7b, C,
Fig. 1. Principal component analysis plot based on mitochondrial DNA haplogroup frequencies of 70 populations from East Asia and Southeast Asia.
© 2013 Institute of Botany, Chinese Academy of Sciences
674 Journal of Systematics and Evolution Vol. 51 No. 6 2013
and G contributed most to theMSEA andMEA pole. Incontrast, haplogroups E, P, Q, and M7c were found tocontribute most to the ISEA pole. To visualize thedetailed relationships amongHlai populations and otherHainan populations, a neighbor‐joining unrooted treewas constructed using the HVS‐I sequences usingSlatkin’s linearized FST as the genetic distance betweenpopulations using MEGA 5.1 (Saitou & Nei, 1987;Tamura et al., 2011) (Fig. 2). An obvious geographicaldivision was observed in the neighbor‐joining tree, inthat northern Hainan groups (Gei, Zwn, and Gelong)cluster away from southern Hainan populations (Ha and
Jiamao). However, Moifau fell out of the Hlai group,probably because of the high frequencies of its founderlineages, F1a1 and F1b.
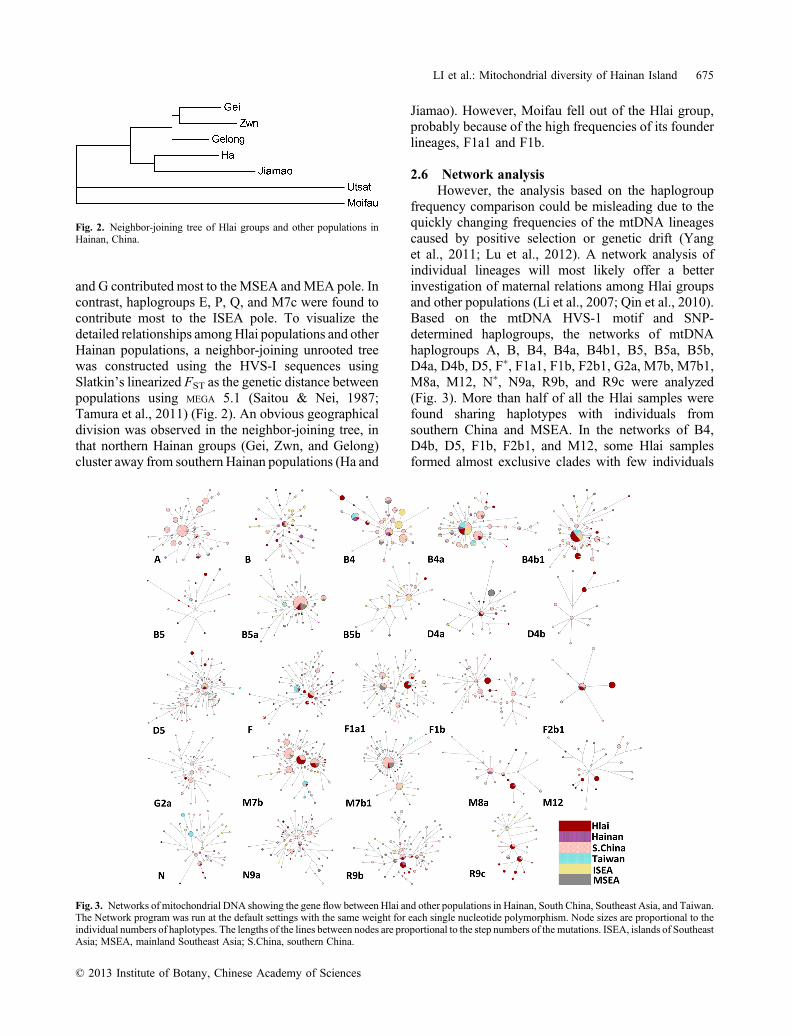
2.6 Network analysisHowever, the analysis based on the haplogroup
frequency comparison could be misleading due to thequickly changing frequencies of the mtDNA lineagescaused by positive selection or genetic drift (Yanget al., 2011; Lu et al., 2012). A network analysis ofindividual lineages will most likely offer a betterinvestigation of maternal relations among Hlai groupsand other populations (Li et al., 2007; Qin et al., 2010).Based on the mtDNA HVS‐1 motif and SNP‐determined haplogroups, the networks of mtDNAhaplogroups A, B, B4, B4a, B4b1, B5, B5a, B5b,D4a, D4b, D5, F�, F1a1, F1b, F2b1, G2a, M7b, M7b1,M8a, M12, N�, N9a, R9b, and R9c were analyzed(Fig. 3). More than half of all the Hlai samples werefound sharing haplotypes with individuals fromsouthern China and MSEA. In the networks of B4,D4b, D5, F1b, F2b1, and M12, some Hlai samplesformed almost exclusive clades with few individuals
Fig. 2. Neighbor‐joining tree of Hlai groups and other populations inHainan, China.
Fig. 3. Networks of mitochondrial DNA showing the gene flow between Hlai and other populations in Hainan, South China, Southeast Asia, and Taiwan.The Network program was run at the default settings with the same weight for each single nucleotide polymorphism. Node sizes are proportional to theindividual numbers of haplotypes. The lengths of the lines between nodes are proportional to the step numbers of the mutations. ISEA, islands of SoutheastAsia; MSEA, mainland Southeast Asia; S.China, southern China.
© 2013 Institute of Botany, Chinese Academy of Sciences
LI et al.: Mitochondrial diversity of Hainan Island 675
from other populations. Most Hlai samples were alsoclustered in exclusive clades with other Hainanaborigines in the networks of M8a and R9b. Thoseexclusive haplotypesmight represent the first settlers onthis island. Hlai groups and other Hainan aborigines,descendants of the first settlers, probably had undergonebottlenecks or founder events in their history, andremained genetically isolated for a long period of time.Some Hlai samples were clustered with Taiwanindividuals in exclusive clades in the networks of F�,F1a1, and M7b. Those shared lineages might beancestral haplotypes, and their descendent haplotypesdepicted star‐like networks surrounding those exclu-sive clades, which probably indicated populationexpansions.
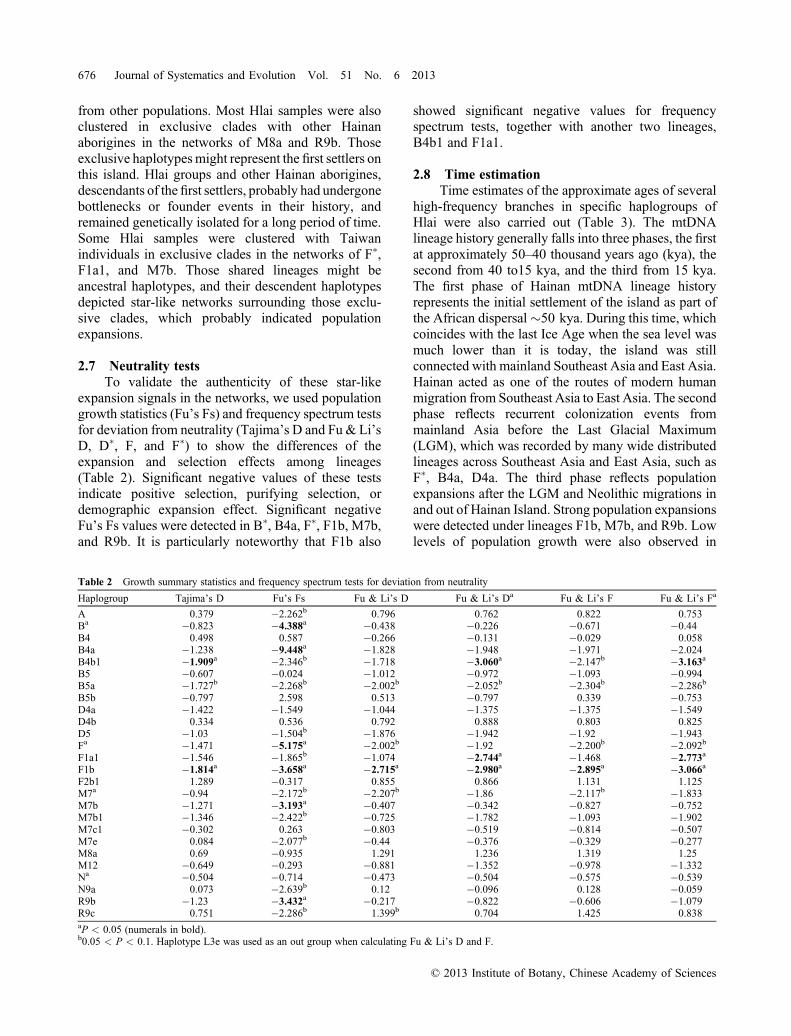
2.7 Neutrality testsTo validate the authenticity of these star‐like
expansion signals in the networks, we used populationgrowth statistics (Fu’s Fs) and frequency spectrum testsfor deviation from neutrality (Tajima’s D and Fu & Li’sD, D�, F, and F�) to show the differences of theexpansion and selection effects among lineages(Table 2). Significant negative values of these testsindicate positive selection, purifying selection, ordemographic expansion effect. Significant negativeFu’s Fs values were detected in B�, B4a, F�, F1b, M7b,and R9b. It is particularly noteworthy that F1b also
showed significant negative values for frequencyspectrum tests, together with another two lineages,B4b1 and F1a1.
2.8 Time estimationTime estimates of the approximate ages of several
high‐frequency branches in specific haplogroups ofHlai were also carried out (Table 3). The mtDNAlineage history generally falls into three phases, the firstat approximately 50–40 thousand years ago (kya), thesecond from 40 to15 kya, and the third from 15 kya.The first phase of Hainan mtDNA lineage historyrepresents the initial settlement of the island as part ofthe African dispersal�50 kya. During this time, whichcoincides with the last Ice Age when the sea level wasmuch lower than it is today, the island was stillconnected with mainland Southeast Asia and East Asia.Hainan acted as one of the routes of modern humanmigration from Southeast Asia to East Asia. The secondphase reflects recurrent colonization events frommainland Asia before the Last Glacial Maximum(LGM), which was recorded by many wide distributedlineages across Southeast Asia and East Asia, such asF�, B4a, D4a. The third phase reflects populationexpansions after the LGM and Neolithic migrations inand out of Hainan Island. Strong population expansionswere detected under lineages F1b, M7b, and R9b. Lowlevels of population growth were also observed in
Table 2 Growth summary statistics and frequency spectrum tests for deviation from neutrality
Haplogroup Tajima’s D Fu’s Fs Fu & Li’s D Fu & Li’s Da Fu & Li’s F Fu & Li’s Fa
A 0.379 �2.262b 0.796 0.762 0.822 0.753Ba �0.823 �4.388a �0.438 �0.226 �0.671 �0.44B4 0.498 0.587 �0.266 �0.131 �0.029 0.058B4a �1.238 �9.448a �1.828 �1.948 �1.971 �2.024B4b1 �1.909a �2.346b �1.718 �3.060a �2.147b �3.163a
B5 �0.607 �0.024 �1.012 �0.972 �1.093 �0.994B5a �1.727b �2.268b �2.002b �2.052b �2.304b �2.286b
B5b �0.797 2.598 0.513 �0.797 0.339 �0.753D4a �1.422 �1.549 �1.044 �1.375 �1.375 �1.549D4b 0.334 0.536 0.792 0.888 0.803 0.825D5 �1.03 �1.504b �1.876 �1.942 �1.92 �1.943Fa �1.471 �5.175a �2.002b �1.92 �2.200b �2.092b
F1a1 �1.546 �1.865b �1.074 �2.744a �1.468 �2.773a
F1b �1.814a �3.658a �2.715a �2.980a �2.895a �3.066a
F2b1 1.289 �0.317 0.855 0.866 1.131 1.125M7a �0.94 �2.172b �2.207b �1.86 �2.117b �1.833M7b �1.271 �3.193a �0.407 �0.342 �0.827 �0.752M7b1 �1.346 �2.422b �0.725 �1.782 �1.093 �1.902M7c1 �0.302 0.263 �0.803 �0.519 �0.814 �0.507M7e 0.084 �2.077b �0.44 �0.376 �0.329 �0.277M8a 0.69 �0.935 1.291 1.236 1.319 1.25M12 �0.649 �0.293 �0.881 �1.352 �0.978 �1.332Na �0.504 �0.714 �0.473 �0.504 �0.575 �0.539N9a 0.073 �2.639b 0.12 �0.096 0.128 �0.059R9b �1.23 �3.432a �0.217 �0.822 �0.606 �1.079R9c 0.751 �2.286b 1.399b 0.704 1.425 0.838aP < 0.05 (numerals in bold).b0.05 < P < 0.1. Haplotype L3e was used as an out group when calculating Fu & Li’s D and F.
© 2013 Institute of Botany, Chinese Academy of Sciences
676 Journal of Systematics and Evolution Vol. 51 No. 6 2013
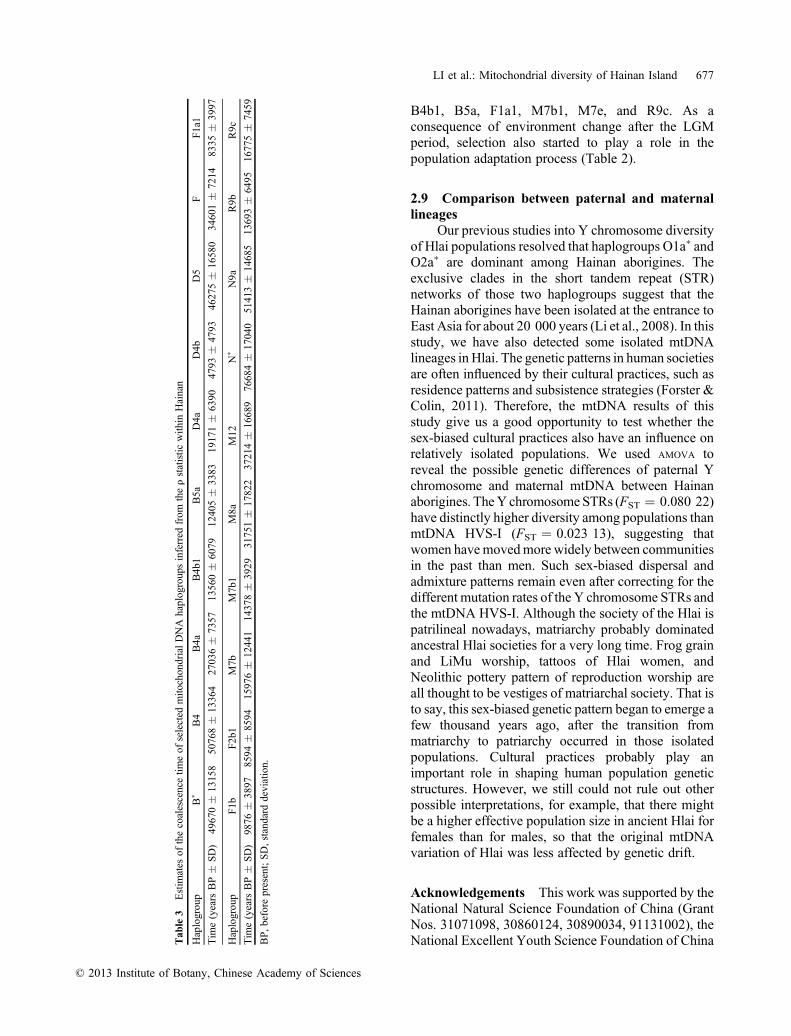
B4b1, B5a, F1a1, M7b1, M7e, and R9c. As aconsequence of environment change after the LGMperiod, selection also started to play a role in thepopulation adaptation process (Table 2).
2.9 Comparison between paternal and maternallineages
Our previous studies into Y chromosome diversityof Hlai populations resolved that haplogroups O1a� andO2a� are dominant among Hainan aborigines. Theexclusive clades in the short tandem repeat (STR)networks of those two haplogroups suggest that theHainan aborigines have been isolated at the entrance toEast Asia for about 20 000 years (Li et al., 2008). In thisstudy, we have also detected some isolated mtDNAlineages in Hlai. The genetic patterns in human societiesare often influenced by their cultural practices, such asresidence patterns and subsistence strategies (Forster &Colin, 2011). Therefore, the mtDNA results of thisstudy give us a good opportunity to test whether thesex‐biased cultural practices also have an influence onrelatively isolated populations. We used AMOVA toreveal the possible genetic differences of paternal Ychromosome and maternal mtDNA between Hainanaborigines. TheY chromosomeSTRs (FST ¼ 0.080 22)have distinctly higher diversity among populations thanmtDNA HVS‐I (FST ¼ 0.023 13), suggesting thatwomen havemovedmore widely between communitiesin the past than men. Such sex‐biased dispersal andadmixture patterns remain even after correcting for thedifferent mutation rates of the Y chromosome STRs andthe mtDNA HVS‐I. Although the society of the Hlai ispatrilineal nowadays, matriarchy probably dominatedancestral Hlai societies for a very long time. Frog grainand LiMu worship, tattoos of Hlai women, andNeolithic pottery pattern of reproduction worship areall thought to be vestiges of matriarchal society. That isto say, this sex‐biased genetic pattern began to emerge afew thousand years ago, after the transition frommatriarchy to patriarchy occurred in those isolatedpopulations. Cultural practices probably play animportant role in shaping human population geneticstructures. However, we still could not rule out otherpossible interpretations, for example, that there mightbe a higher effective population size in ancient Hlai forfemales than for males, so that the original mtDNAvariation of Hlai was less affected by genetic drift.
Acknowledgements This work was supported by theNational Natural Science Foundation of China (GrantNos. 31071098, 30860124, 30890034, 91131002), theNational Excellent Youth Science Foundation of ChinaT
able
3Estim
ates
ofthecoalescencetim
eof
selected
mito
chondrialDNA
haplogroupsinferred
from
therstatistic
with
inHainan
Haplogroup
B�
B4
B4a
B4b1
B5a
D4a
D4b
D5
FF1a1
Tim
e(years
BP�
SD)
49670�
13158
50768�
13364
27036�
7357
13560�
6079
12405�
3383
19171�
6390
4793
�4793
46275�
16580
34601�
7214
8335
�3997
Haplogroup
F1b
F2b1
M7b
M7b1
M8a
M12
N�
N9a
R9b
R9c
Tim
e(years
BP�
SD)
9876
�3897
8594
�8594
15976�
12441
14378�
3929
31751�
17822
37214�
16689
76684�
17040
51413�
14685
13693�
6495
16775�
7459
BP,before
present;SD,standard
deviation.
© 2013 Institute of Botany, Chinese Academy of Sciences
LI et al.: Mitochondrial diversity of Hainan Island 677
(Grant No. 31222030), the Shanghai Rising‐StarProgram (Grant No. 12QA1400300), the ShanghaiCommission of Education Research Innovation KeyProject (Grant No. 11zz04), and Shanghai ProfessionalDevelopment Funding (Grant No. 2010001).
References
Bandelt HJ, Forster P, Rohl A. 1999. Median‐joining networksfor inferring intraspecific phylogenies. Molecular Biologyand Evolution 16: 37–48.
Black ML, Dufall K, Wise C, Sulliva S, Bittles AH. 2006.Genetic ancestries in northwest Cambodia. Annals ofHuman Biology 33: 620–627.
Dancause KN, Chan CW, Arunotai NH, Lum JK. 2009. Originsof the Moken Sea Gypsies inferred from mitochondrialhypervariable region and whole genome sequences. Journalof Human Genetics 54: 86–93.
Excoffier L, Lischer HEL. 2010. Arlequin suite ver 3.5: A newseries of programs to perform population genetics analysesunder Linux and Windows. Molecular Ecology Resources10: 564–567.
Forster P, Colin R. 2011. Mother tongue and Y chromosomes.Science 333: 1390–1391.
Forster P, Harding R, Torroni A, Bandelt HJ. 1996. Origin andevolution of Native American mtDNA variation: Areappraisal. American Journal of Human Genetics 59:935–945.
Fu YX. 1997. Statistical tests of neutrality of mutations againstpopulation growth, hitchhiking and background selection.Genetics 147: 915–925.
Fu YX, Li WH. 1993. Statistical tests of neutrality of mutations.Genetics 133: 693–709.
Fucharoen G, Fucharoen S, Horai S. 2001. Mitochondrial DNApolymorphisms in Thailand. Journal of HumanGenetics 46:115–125.
Hill C, Soares P, Mormina M, Macaulay V, Clarke D, BlumbachPB, Vizuete‐ForsterM, Forster P, Bulbeck D, OppenheimerS, Richards M. 2007. A mitochondrial stratigraphy forIsland Southeast Asia. American Journal of HumanGenetics 80: 29–43.
Hill C, Soares P, Mormina M, Macaulay V, Meehan W,Blackburn J, Clarke D, Raja JM, Ismail P, Bulbeck D,Oppenheimer S, Richards M. 2006. Phylogeography andethnogenesis of aboriginal Southeast Asians. MolecularBiology and Evolution 23: 2480–2491.
Irwin JA, Saunier JL, Strouss KM, Diegoli TM, Sturk KA,O’Callaghan JE, Paintner CD, Hohoff C, Brinkmann B,Parsons TJ. 2008. Mitochondrial control region sequencesfrom aVietnamese population sample. International Journalof Legal Medicine 122: 257–259.
Jin HJ, Tyler‐Smith C, Kim W. 2009. The peopling of Korearevealed by analyses of mitochondrial DNA and Y‐chromosomal markers. PLoS ONE 4: e4210.
Kivisild T, Tolk HV, Parik J, Wang Y, Papiha SS, Bandelt HJ,Villems R. 2002. The emerging limbs and twigs of the EastAsian mtDNA tree. Molecular Biology and Evolution 19:1737–1751.
Lertrit P, Poolsuwan S, Thosarat R, Sanpachudayan T, BoonyaritH, Chinpaisal C, Suktitipat B. 2008. Genetic history ofSoutheast Asian populations as revealed by ancient andmodern human mitochondrial DNA analysis. AmericanJournal of Physical Anthropology 137: 425–440.
Li D, Li H, Ou C, Lu Y, Sun Y, Yang B, Qin Z, Zhou Z, Li S, JinL. 2008. Paternal genetic structure of Hainan aboriginesisolated at the entrance to East Asia. PLoS ONE 3: e2168.
Li D, Sun Y, Lu Y, Mustavich LF, Ou C, Zhou Z, Li S, Jin L, LiH. 2010. Genetic origin of Kadai‐speaking Gelong peopleon Hainan Island viewed from Y chromosomes. Journal ofHuman Genetics 55: 462–468.
Li H, Cai X,Winograd‐Cort ER,Wen B, ChengX, Qin Z, LiuW,Liu Y, Pan S, Qian J, Tan CC, Jin L. 2007. MitochondrialDNA diversity and population differentiation in southernEast Asia. American Journal of Physical Anthropology 134:481–488.
Librado P, Rozas J. 2009. DnaSP v5: A software forcomprehensive analysis of DNA polymorphism data.Bioinformatics 25: 1451–1452.
Lu Y, Wang C, Qin Z, Wen B, Farina SE, Jin L, Li H;Genographic Consortium. 2012. Mitochondrial origin ofthe matrilocal Mosuo people in China. Mitochondrial DNA23: 13–19.
Maruyama S, Nohira‐Koike C, Minaguchi K, Nambiar P. 2010.mtDNA control region sequence polymorphisms andphylogenetic analysis of Malay population living in oraround Kuala Lumpur in Malaysia. International Journal ofLegal Medicine 124: 165–170.
Mona S, Grunz KE, Brauer S, Pakendorf B, Castrì L, Sudoyo H,Marzuki S, Barnes RH, Schmidtke J, Stoneking M, KayserM. 2009. Genetic admixture history of eastern Indonesia asrevealed by Y chromosome and mitochondrial DNAanalysis. Molecular Biology and Evolution 26: 1865–1877.
Oota H, Kitano T, Jin F, Yuasa I, Wang L, Ueda S, Saitou N,Stoneking M. 2002. Extreme mtDNA homogeneity incontinental Asian populations. American Journal ofPhysical Anthropology 118: 146–153.
van Oven M, Hämmerle JM, van Schoor M, Kushnick G,Pennekamp P, Zega I, Oscar Lao OBrown L, KennerknechtI, Kayser M. 2011. Unexpected island effects at an extreme:Reduced Y chromosome and mitochondrial DNA diversityin Nias. Molecular Biology and Evolution 28: 1349–1361.
PengMS,He JD, Liu HX, ZhangYP. 2011. Tracing the legacy ofthe early Hainan Islanders—A perspective from mitochon-drial DNA. BMC Evolutionary Biology 11: 46.
PengMS, Quang HH, Dang KP, Trieu AV,Wang HW, Yao YG,Kong QP, Zhang YP. 2010. Tracing the Austronesianfootprint in Mainland Southeast Asia: A perspective frommitochondrial DNA. Molecular Biology and Evolution 27:2417–2430.
Qin Z, Yang Y, Kang L, Yan S, Cho K, Cai X, Lu Y, Zheng H,Zhu D, Fei D, Li S, Jin L, Li H. 2010. A mitochondrialrevelation of early human migrations to the Tibetan Plateaubefore and after the last glacial maximum. AmericanJournal of Physical Anthropology 143: 555–569.
Saillard J, Forster P, Lynnerup N, Bandelt HJ, Norby S. 2000.mtDNA variation among Greenland Eskimos: The edge ofthe Beringian expansion. American Journal of HumanGenetics 67: 718–726.
© 2013 Institute of Botany, Chinese Academy of Sciences
678 Journal of Systematics and Evolution Vol. 51 No. 6 2013
Saitou N, Nei M. 1987. The neighbor‐joining method: A newmethod for reconstructing phylogenetic trees. MolecularBiology and Evolution 4: 406–425.
Shi YF, Cui ZJ, Li JJ. 1989. Quaternary glacier in Eastern Chinaand the Climate Fluctuation. Beijing: Science Press.
Soares P, Ermini L, Thomson N, Mormina M, Rito T, Röhl A,Salas A, Oppenheimer S, Macaulay V, Richards MB. 2009.Correcting for purifying selection: An improved humanmitochondrial molecular clock. American Journal ofHuman Genetics 84: 740–759.
Tabbada KA, Trejaut J, Loo JH, Chen YM, LinM,Mirazón‐LahrM, Kivisild T, De Ungria MC. 2010. Philippine mitochon-drial DNA diversity: A populated viaduct between Taiwanand Indonesia? Molecular Biology and Evolution 27: 21–31.
Tajima F. 1989. Statistical‐method for testing the neutralmutation hypothesis by DNA polymorphism. Genetics123: 585–595.
Tajima A, Hayami M, Tokunaga K, Juji T, Matsuo M, MarzukiS, Omoto K, Horai S. 2004. Genetic origins of the Ainuinferred from combined DNA analyses of maternal andpaternal lineages. Journal of Human Genetics 49: 187–193.
Tamura K, Peterson D, Peterson N, Stecher G, Nei M, Kumar S.2011. MEGA5: Molecular evolutionary genetics analysisusing maximum likelihood, evolutionary distance, andmaximum parsimony methods. Molecular Biology andEvolution 28: 2731–2739.
Thurgood G. 1994. Tai‐Kadai and Austronesian: The nature ofthe historical relationship. Oceanic Linguistics 33: 345–368.
Trivedi R, Sitalaximi T, Banerjee J, SinghA, Sircar PK, KashyapVK. 2006. Molecular insights into the origins of theShompen, a declining population of the Nicobar archipela-go. Journal of Human Genetics 51: 217–226.
Tsai LC, Lin CY, Lee JC, Chang JG, Linacre A, Goodwin W.2001. Sequence polymorphism of mitochondrial D‐loopDNA in the Taiwanese Han population. Forensic ScienceInternational 119: 239–247.
Wang D, Su LY, Zhang AM, Li YY, Li XA, Chen LL, Long H,Yao YG. 2012. Mitochondrial DNA copy number, but nothaplogroup, confers a genetic susceptibility to leprosy inHan Chinese from Southwest China. PLoS ONE 7: e38848.
Wang XP, Wang JC, Xing GY. 2004. China Hlai. Beijing: TheEthnic Publishing House.
Wen B, Li H, Gao S, Mao X, Gao Y, Li F, Zhang F, He Y, DongY, Zhang Y, HuangW, Jin J, Xiao C, Lu D, Chakraborty R,Su B, Deka R, Jin L. 2005. Genetic structure of Hmong–Mien speaking populations in East Asia as revealed bymtDNA lineages. Molecular Biology and Evolution 22:725–734.
Wen B, Li H, LuD, SongX, Zhang F, HeY, Li F, GaoY,MaoX,Zhang L, Qian J, Tan J, Jin J, Huang W, Deka R, Su B,Chakraborty R, Jin L. 2004a. Genetic evidence supportsdemic diffusion of Han culture. Nature 431: 302–305.
Wen B, Xie X, Gao S, Li H, Shi H, Song X, Qian T, Xiao C, Jin J,Su B, Lu D, Chakraborty R, Jin L. 2004b. Analyses ofgenetic structure of Tibeto‐Burman populations reveals sex‐biased admixture in southern Tibeto‐Burmans. AmericanJournal of Human Genetics 74: 856–865.
WongHY, Tang JS, Budowle B, AllardMW, Syn CK, Tan‐SiewWF, Chow ST. 2007. Sequence polymorphism of themitochondrial DNA hypervariable regions I and II in 205Singapore Malays. Legal Medicine (Tokyo) 9: 33–37.
Xing GY. 2004. Discursion from the earliest governmentaliza-tion of Hainan Island. Hainan Archives 3: 43–47.
YangK, ZhengH, Qin Z, LuY, Farina SE, Li S, Jin L, Li D, Li H;Genographic Consortium. 2011. Positive selection onmitochondrial M7 lineages among the Gelong people inHainan. Journal of Human Genetics 56: 253–256.
Yao YG, Kong QP, Bandelt HJ, Kivisild T, Zhang YP. 2002.Phylogeographic differentiation of mitochondrial DNA inHan Chinese. American Journal of Human Genetics 70:635–651.
Zimmermann B, BodnerM, Amory S, Fendt L, RockA, Horst D,Horst B, Sanguansermsri T, Parson W, Brandstätter A.2009. Forensic and phylogeographic characterization ofmtDNA lineages from northern Thailand (Chiang Mai).International Journal of Legal Medicine 123: 495–501.
Supporting Information
Additional Supporting Information may be foundin the online version of this article at http://onlinelibrary.wiley.com/doi/10.1111/jse.12024/suppinfo:
Table S1. Mitochondrial DNA haplogroups andhypervariable sequence I (HVS‐I) motif of Hlaipopulations, Hainan Island, China
Table S2. Mitochondrial DNA haplogroup fre-quencies of Hlai populations, Hainan Island, China
Appendix I Members of the GenographicConsortium
Janet S. ZIEGLE (Applied Biosystems, FosterCity, CA, USA)
Li JIN (Fudan University, Shanghai, China)Hui LI (Fudan University, Shanghai, China)Shilin LI (Fudan University, Shanghai, China)Pandikumar SWAMIKRISHNAN (IBM, Somers,
NY, USA)Laxmi PARIDA (IBM, Yorktown Heights, NY,
USA)Daniel E. PLATT (IBM, Yorktown Heights, NY,
USA)Ajay K. ROYYURU (IBM, Yorktown Heights,
NY, USA)Lluis QUINTANA‐MURCI (Institut Pasteur,
Paris, France)R. John MITCHELL (La Trobe University,
Melbourne, Australia)Marc HABER (Lebanese American University,
Beirut, Lebanon)
© 2013 Institute of Botany, Chinese Academy of Sciences
LI et al.: Mitochondrial diversity of Hainan Island 679
Pierre A. ZALLOUA (Lebanese American Uni-versity, Beirut, Lebanon)
Syama ADHIKARLA (Madurai Kamaraj Univer-sity, Madurai, India)
ArunKumar GANESHPRASAD (MaduraiKamaraj University, Madurai, India)
Ramasamy PITCHAPPAN (Madurai KamarajUniversity, Madurai, India)
Varatharajan Santhakumari ARUN (MaduraiKamaraj University, Madurai, India)
R. SpencerWELLS (National Geographic Society,Washington DC, USA)
Himla SOODYALL (National Health LaboratoryService, Johannesburg, South Africa)
Elena BALANOVSKA (Research Centre forMedical Genetics, Russian Academy of MedicalSciences, Moscow, Russia)
Oleg BALANOVSKY (Research Centre forMedical Genetics, Russian Academy of MedicalSciences, Moscow, Russia)
Chris TYLER‐SMITH (The Wellcome TrustSanger Institute, Hinxton, UK)
Daniela R. LACERDA (Universidade Federal deMinas Gerais, Belo Horizonte, Brazil)
Fabrício R. SANTOS (Universidade Federal deMinas Gerais, Belo Horizonte, Brazil)
Pedro Paulo VIEIRA (Universidade Federal doRio de Janeiro, Rio de Janeiro, Brazil)
Jaume BERTRANPETIT (Universitat PompeuFabra, Barcelona, Spain)
David COMAS (Universitat Pompeu Fabra,Barcelona, Spain)
Begoña MARTÍNEZ‐CRUZ (Universitat PompeuFabra, Barcelona, Spain)
David F. SORIA‐HERNANZ (Universitat Pom-peu Fabra, Barcelona, Spain)
Christina J. ADLER (University of Adelaide,Adelaide, Australia)
Alan COOPER (University of Adelaide, Adelaide,Australia)
Clio S. I. Der SARKISSIAN (University ofAdelaide, Adelaide, Australia)
Wolfgang HAAK (University of Adelaide, Ade-laide, Australia)
Matthew E. KAPLAN (University of Arizona,Tucson, AZ, USA)
Nirav C. MERCHANT (University of Arizona,Tucson, AZ, USA)
Colin RENFREW (University of Cambridge,Cambridge, UK)
Andrew C. CLARKE (University of Otago,Dunedin, New Zealand)
Elizabeth A. MATISOO‐SMITH (University ofOtago, Dunedin, New Zealand)
Matthew C. DULIK (University of Pennsylvania,Philadelphia, PA, USA)
Jill B. GAIESKI (University of Pennsylvania,Philadelphia, PA, USA)
Amanda C. OWINGS (University of Pennsylva-nia, Philadelphia, PA, USA)
Theodore G. SCHURR (University of Pennsylva-nia, Philadelphia, PA, USA)
Miguel G. VILAR (University of Pennsylvania,Philadelphia, PA, USA)
© 2013 Institute of Botany, Chinese Academy of Sciences
680 Journal of Systematics and Evolution Vol. 51 No. 6 2013