500-year temperature reconstruction in the Mediterranean Basin by means of documentary data and...
32
This article was published in the above mentioned Springer issue. The material, including all portions thereof, is protected by copyright; all rights are held exclusively by Springer Science + Business Media. The material is for personal use only; commercial use is not permitted. Unauthorized reproduction, transfer and/or use may be a violation of criminal as well as civil law. ISSN 0165-0009, Volume 101, Combined 1-2
Transcript of 500-year temperature reconstruction in the Mediterranean Basin by means of documentary data and...

This article was published in the above mentioned Springer issue.The material, including all portions thereof, is protected by copyright;all rights are held exclusively by Springer Science + Business Media.
The material is for personal use only;commercial use is not permitted.
Unauthorized reproduction, transfer and/or usemay be a violation of criminal as well as civil law.
ISSN 0165-0009, Volume 101, Combined 1-2

Climatic Change (2010) 101:169–199DOI 10.1007/s10584-010-9815-8
500-year temperature reconstructionin the Mediterranean Basin by means of documentarydata and instrumental observations
Dario Camuffo · C. Bertolin · M. Barriendos · F. Dominguez-Castro · C. Cocheo ·S. Enzi · M. Sghedoni · A. della Valle · E. Garnier · M.-J. Alcoforado · E. Xoplaki ·J. Luterbacher · N. Diodato · M. Maugeri · M. F. Nunes · R. Rodriguez
Received: 11 August 2008 / Accepted: 10 February 2010 / Published online: 26 February 2010© Springer Science+Business Media B.V. 2010
Abstract The paper reports the main results of the EU project Millennium in theMediterranean area over the last 500 years. It analyses a long series of temperaturefrom Portugal, Spain, France, Italy and Greece. The series are obtained by combiningindices from documentary sources from AD 1500 to the onset of regular instrumentalobservations. There is an ongoing discussion regarding the proper way of combiningdocumentary and instrumental data and how to translate accurately the conventionalindices from −3 to +3 into modern units, i.e. degree Celsius. This paper produces forthe first time a number of early instrumental observations, in some cases (i.e. Italyand France) covering 350 years, including thereby the earliest regular observations
D. Camuffo (B) · C. Bertolin · A. della ValleNational Research Council of Italy (CNR), Institute of Atmospheric Sciences and Climate(ISAC), Padua, Italye-mail: [email protected]
M. Barriendos · R. RodriguezDepartment of Modern History, University of Barcelona, Barcelona, Spain
F. Dominguez-CastroDepartment of Earth Sciences II, Complutense University of Madrid, Madrid, Spain
C. CocheoSalvatore Maugeri Foundation IRCCS, Padua, Italy
S. Enzi · M. SghedoniKleiò, Padua, Italy
E. GarnierLaboratory of Climate and Environmental Sciences, UMR CEA-CNRS, Saclay, France
E. GarnierResearch Centre of Quantitative History, University of Caen, Caen, France
M.-J. AlcoforadoCentre for Geographical Studies, University of Lisbon, Lisbon, Portugal
Author's personal copy

170 Climatic Change (2010) 101:169–199
after the invention of the thermometer. These Mediterranean data show that anom-alous temperatures usually had only a locally limited effect, while only few extremeevents had a widespread impact over the whole region, such as the summer of 2003.During the period from 1850 to the present day, the Mediterranean temperatureanomaly was close to the Northern Hemisphere in spring and summer, while it waswarmer in autumn and winter. Compared with the long-term instrumental records(i.e. 1655 onwards), the recent warming has not exceeded the natural past variabilitycharacterized by heating–cooling cycles with no significant long-term trends.
1 Introduction
This work presents the research activities performed by a large research group inthe context of the Sixth EU Framework programme Millennium. The aim is tounderstand better the past climate of the Mediterranean through the gathering ofnew information from both documentary proxy (DP) and instrumental observations(IO). The sites under examination (Fig. 1) are located in an area within 35◦ to 50◦ Nand 10◦ W to 25◦ E: most of them are situated in the three large European peninsulas(the Iberian, Italian Peninsula and Balkan). A system of fold mountains, includingPyrenees, Alps and Balkans, separate the Mediterranean from the continental re-gions of Western and Central Europe. The Mediterranean climate is characterized bythe polar-ward (summer) and equator-ward (winter) shift of the Azores subtropicalhigh-pressure cell. As a consequence, during summer the Western Mediterraneanis invariably dominated by an anticyclonic circulation, with dry sinking air capping asurface marine layer of varying humidity leading to no rain in Central Mediterraneanbut thunderstorms in the North. On the other hand, in winter the polar jet stream and
E. XoplakiOeschger Centre for Climate Change Research (OCCR) and Institute of Geography,Climatology and Meteorology, University of Bern, Bern, Switzerland
E. XoplakiThe Cyprus Institute; Energy, Environment and Water Research Center (EEWRC),Nicosia, Cyprus
J. LuterbacherDepartment of Geography; Climatology, Climate Dynamics and Climate Change,Justus Liebig University, Giessen, Germany
N. DiodatoGTOS/TEMS Network, Monte Pino Met Research Observatory,Benevento, Italy
M. MaugeriDepartment of Physics, Università degli Studi di Milano, Milan, Italy
M. F. NunesHistory and Philosophy of Science Research Unit, University of Évora,Évora, Portugal
A. della ValleARPAV, Meteorological Centre, Teolo, Padua, Italy
Author's personal copy

Climatic Change (2010) 101:169–199 171
Fig. 1 The Mediterranean Basin with the indicated locations (circles with progressive number labeland flag colour code) where documentary proxies and/or instrumental observations have beenretrieved for use in this paper, divided by countries: Portugal (PT), Spain (SP), France (FR), Italy(IT) and Greece (GR). The stations are: 1: Lisbon (PT), 2: Évora (PT), 3: Cadiz (SP), 4: Seville (SP),5: Murcia (SP), 6: Tortosa (SP), 7: Tarragona (SP), 8: Barcelona (SP), 9: Girona (SP), 10: Perpignan(FR), 11: Narbonne (FR), 12: Carcassonne (FR), 13: Toulouse (FR), 14: Montpellier (FR), 15: Lyon(FR), 16: Paris (FR), 17: Milan (IT), 18: Padua (IT), 19: Bologna (IT), 20: Vallombrosa (IT),21: Florence (IT), 22: Benevento (IT), 23: Naples (IT), 24: Locorotondo, 25: Palermo (IT) and26: Erice (IT)
the associated periodic storms frequently reach the Mediterranean region, bringingheavy rain. More details about the Mediterranean climate can be found in UKMeteorological Office (1962), Reiter (1975), Wallén (1970, 1977), Jeftic et al. (1992),Camuffo et al. (2000a), Xoplaki (2002), Bolle (2003), Xoplaki et al. (2003, 2004),Fletcher and Spencer (2005), Lionello et al. (2006), Luterbacher et al. (2006).
The Mediterranean has an exceptionally large quantity of data available forpast climate reconstructions, including documentary proxies (DP) and instrumentalobservations (IO). A notable effort has been made to gather temperature andprecipitation data in a number of countries in the Mediterranean Basin, i.e. Portugal(PT), Spain (SP), France (FR), Italy (IT) and Greece (GR), supplemented by goodrecords consisting of DP for the period 1500–1799 and IO with correspondingmetadata from 1655 onwards. However, for sake of shortness this paper will dealonly with temperature. The earliest regular instrumental observations started in Italyin December 1654, when temperature readings were recorded up to eight times a day(Camuffo 2002a; Camuffo et al. 2009). A major effort has been devoted to transformearly, never-before utilized, or even unknown observations into modern series andunits, through rigorous quality controls, validation, correction and homogenization.The series have been expressed in terms of anomalies with respect to the 1961–1990reference period in order to identify local trends. The high quality of the data permitsa high signal-to-noise ratio, allowing for a better identification of long-term tempera-ture evolution. The effort to calibrate written sources by cross comparing DP with IOin the common period revealed some concerns that will be discussed later on. Prob-lems and uncertainties increase going back in time, when both DP evidence and theearliest IO become less frequent and precise. Nevertheless, always keeping in mindthese limitations, combining data from these two sources allowed us to compose aninteresting overview of the climate of the Mediterranean over the last five centuries.
Author's personal copy

172 Climatic Change (2010) 101:169–199
2 Documentary sources in the Mediterranean area
Documentary proxies (DP) consist of different kinds of first- and second-hand writ-ten sources, i.e. narrative, administrative and daily weather logs, with different relia-bility levels (Enzi and Camuffo 1995; Pfister et al. 1999). Narrative sources (NS) aregeneric description of events, such as chronicles, annals, diaries, early scientific trea-tises, poems, correspondence, and compilations of remarkable events, usually knownas Mirabilia—the Latin word for “extraordinary events”. NS can be manuscript orprinted, while their characteristics follow the literary genres on fashion during thevarious historical periods; they were often produced for purposes of communication.NS typically report exceptional climatic events with some impact on the society, e.g.extreme cold or hot, periods of inactivity of mills, drying up of fountains for shortageof water supply, lack of water hindering river navigation, over-abundant rains andrivers in flood, large water bodies completely frozen over an unusually frigid winter.
Administrative sources (AS) are documents written by public officers usually todiscuss a specific problem, its impact and the course of action undertaken in orderto solve it. AS are objective, reliable, precisely dated and often forming series ofevents precisely placed in a space and time. This kind of record increased in numberwith the development of national states (fourteenth to sixteenth centuries), when allover Europe specific departments were created to control the respective territories,sometimes with a special eye for the environment. In some cases the royal power es-tablished a centralised control of administration in opposition to the clergy. This hap-pened in France (Garnier 2007) with the Royal Administrative Archives and, startingfrom the sixteenth century, the king of France created a number of public officeswith specific tasks (the Forestry Commission, the Department of Civil EngineeringNavy). Scattered in the provinces, governmental officers noted all the main weatherevents and assumed that risk of atmospheric hazards was randomly distributed inopposition to the determinism supported by the Church. Several Mediterraneantowns produced local records, in France these were called “Mercuriales”, whichincluded food prices and timing of the harvest. French harvest bans and dates wereone of the first-used proxies (Le Roy Ladurie 1971; Chuine et al. 2004). Such publicadministration bodies evolved over time into great complexity, not only in Europebut also America, Africa and Asia. Ecclesiastical sources (ES) are a particular type ofadministrative sources. The Catholic Church had a strong control over the territoryand often maintained parish registers reporting weather injuries, mortality causedby natural hazards (famines, droughts, snow, floods, pestilences) and other relevantphenomena. Clergy recorded liturgical services and rogation ceremonies commis-sioned by local communities or authorities in case of adverse weather conditions. Propluvia were the rogations celebrated for rain in case of draught, while Pro serenitatewere offered in the hope of a cessation to prolonged rain. The Church organizationreached the same level of complexity of the State in economic, fiscal, institutional,judicial, educational and health matters. Daily weather logs (WL) were kept bysome early meteorologists and other scholars, e.g. astronomers, natural philosophers,chronicle writers, most of whom were authors with a scientific background. Theseare a particular category of documents, mainly starting from the sixteenth centuryand encouraged by the advent of the academies and other scientific societies in theeighteenth century (Camuffo and Enzi 1992a, 1994). The chronological distributionof DP varies widely over the centuries. Information from early Middle Age is rare,
Author's personal copy

Climatic Change (2010) 101:169–199 173
but is followed by a progressive increase in data frequency. Administrative sources,usually handwritten, can be mostly found starting from the fifteenth century.
DP can be divided into three main subgroups: (1) the ‘first class’, includes reliablecontemporary manuscripts; (2) the ‘second class’ reliable but not contemporary col-lections; (3) the ‘third class’ less reliable sources that should be rejected (Alexandre1987; Pfister et al. 1998; Brázdil et al. 2005). It is generally assumed that the dating ofcontemporary chroniclers who lived the events they describe is reliable. However, itis reasonable and useful to verify the dating accuracy with cross comparison with in-dependent factors, e.g. similar descriptions, historical analysis of social events foundin the manuscript, cross checking with astronomical features (e.g. passage of comets,solar and lunar eclipses) whose dating is known from astronomy (Camuffo andSturaro 2004). This step prevents the spurious multiplication of extreme events. Ac-cording to Camuffo and Enzi (1992a) and Pfister (1992), non-contemporary material(second class) was not rejected out-of-hand if it was possible to validate it. Validatedsecond-hand reports have been included in this work when they make a proven con-tribution to the understanding of past climate.
DP are generally commonly used to reconstruct past climates only in the absenceof direct IO (Luterbacher et al. 2006) because they are often considered imprecise,highly subjective, qualitative, hardly transformable into quantitative indices, whileIO are considered precise, objective, with high resolution. The truth is that proxiesare not a duplicate of, or equivalent to, instrumental records, and the informationthey provide is different. Keeping in mind the above-mentioned differences andlimitations, DP often include much more information than IO, which provide a quan-titative measurement of selected atmospheric variables at a given instant in time. DPprovide a much wider picture of events, telling us what happened in a certain area andfor a certain time, often pointing out cause–effect relationships, offering a variety ofweather information, and producing a quasi-objective index scale. In general, writtenproxies provide a qualitative or a semi-quantitative synergistic effect of one or moreatmospheric variables (Enzi and Camuffo 1995).
DP are especially useful when they represent the effect caused by a long-term per-sistence of a certain meteorological variable, e.g. severe cold and water bodies frozenover; or mild winters and early plant growing. DP data need, however, some interpre-tation followed by a very careful and deep physical and historical validation in orderto avoid possible mistakes in dating or interpretation.
DP are easily interpreted when they refer to events conditioned by thresholds. Inthe Mediterranean area in general, and for some regions in particular, DP indexingfor near-normal temperature is a hard task. When the situation was not risky foragriculture, or other human activities, there was no special reason for chroniclersto mention minor departures from the average. Extreme meteorological events andnatural hazards are better documented and constitute the best information in thiscontext (Daveau 1997; Barriendos and Martin-Vide 1998; Alcoforado et al. 2000;Camuffo et al. 2000a, b; Piervitali and Colacino 2001; Brázdil et al. 2006; Diodato2007; Garcia-Herrera 2008). DP are well distributed over the Mediterranean region,and are particularly abundant in Italy, France and Iberia. According to Alexandre(1987), 35% of all documents available for the Middle Age in Central Europe arefrom Italy. In contrast, DP are less frequently found for the Balkan area, i.e. Greece,and the former Yugoslavian countries, Albania, Bulgaria and Romania that sufferedfrom wars and other challenges from the fifteenth to the nineteenth centuries.
Author's personal copy

174 Climatic Change (2010) 101:169–199
However, some data have been collated and analyzed (Repapis and Philandras 1988;Grove and Conterio 1994, 1995; Xoplaki et al. 2001; Telelis 2004, 2008).
3 Documentary proxy indexing: a discussion on methodology
In this paper, a special effort was made to transform DP into numerical indices tosecure a quantitative evaluation of the local trends of temperature and precipitationover the last 500 years. All DP series produced within Millennium have beenindexed following an agreed protocol, i.e. all information from documentary proxyhas been transformed into a numerical value. This value is based on the effects thatreflect the severity of the event. However, two kinds of difficulties were found whenindexing DP. The first was qualitative, i.e. to establish a clear correlation between thisindex and a meteorological variable. The second was quantitative, i.e. to transformthe DP into a numerical index. Regarding the qualitative aspects, data were selectedonly when the link between the meteorological event and the index value was clearand reliable. For instance, the thickness of the ice slab formed in the cold seasonon large water bodies helped to classify winters into severity classes, but a carefulinterpretation is needed in such cases, and the context changes with space and time.Let us consider for instance two different scenarios regarding a frozen water body.A closed water body e.g. a lake with small exchange of waters—has a cumulativeeffect and it may form slabs of ice after water has lost enough heat. This may happeneither after a long-term light cooling, or after a short-term of intense cooling. A lakehas a long-term memory, but may equally respond to short, strong forcing pulses. Incontrast, an open water body, e.g. a lagoon with continuous exchange with the sea,has a different behaviour. The heat losses cannot be accumulated and the lagoonhas a short-term memory; it cannot freeze merely because the winter was long, butit needs 2 or 3 weeks of very intense cooling, possibly worsened by fresh wind, tofreeze over. Not in all severe winters both lakes and the Venice Lagoon were frozenover (Camuffo and Enzi 1992b). In the past times rivers formed marshes of stagnantwater where ice slabs were easily formed and later transported by the current untilthey were eventually stopped at some bend, forming an ice bridge that soon extendedfrom one bank to the other. Marshes were later drained to provide better flow andprotection. Over the years, the same river needed a different cold threshold to freezeover. In conclusion, the same cause does not always generate the same effect. DPprovide information that depends on the particular nature of each phenomenon andits environmental context, and it may be variable over the course of time. The indexclassification of events should reflect the climate of the region in order to representits real exceptionality, but differs from country to country. For instance, to find alake frozen in the northern regions or on the mountains is frequent (e.g. class-1), butexceptional in southern areas (e.g. class-3). A list of numerical indices and the relativedescription of event severity is given in Table 1 for temperature. This table helps totransform each DP into a numerical level xi, in quantitative terms, which range from−3 to +3, 0 being the normal. After the first-order individual classification madeby reading the descriptions and judging from the effects is concluded, we pass to asecond-order ensemble classification. The population of each class should reflect theGaussian distribution in Table 2, with frequent normal events, less frequent severe,and very rare exceptional ones. Events are classified in terms of standard deviation
Author's personal copy

Climatic Change (2010) 101:169–199 175
Table 1 Temperature indexing from qualitative descriptions of documentary proxy (DP)
Index Comments
+3 Extremely hot—not applicable for winter, very hardly for summer. Not easy to establishon a objective ground, often mixed and confused with dry and arid, especially in thesummertime
+2 Hot—not applicable for winter, hardly for summer. Many people die, but possibly forepidemics; reduced yield or damage to crops probably connected with aridity
+1 Warm. Applicable for hot summer: index established after (subjective) complaints from anumber of witnesses. For mild winter: early plant growing and flowering, early migratorybird arrival
0 Normal. Situation as usual, no special comments; sometimes, declared “normal” in thesources
−1 Cold. Complaints for unusual cold and need for heating or heavy clothing; some damageto local agriculture
−2 Severe cold. Applicable for severe winters, hardly applicable for summer. Winter: People,animals and plants killed by cold. Slab of ice cover large water bodies (including theVenice Lagoon). Summer: continuous cloud cover and rains, almost never sunshine
−3 Extremely severe cold. Applicable for great winters, not applicable for summer. Inaddition to the above descriptions, wine freezes into the barrels, springs and wells frozenover, rivers, lakes and other large water bodies completely covered with a thick slab ofice, supporting carriages and people walking on it
This index has been used for all the Mediterranean locations
(SD) into seven intervals, bound by ±0.5 SD, ±1 SD, ±2 SD or greater. The samemethodology was followed for Greece by Xoplaki et al. (2001) but with slightlydifferent intervals, i.e. ±0.7 SD, ±1.4 SD, ±2 SD. If we impose that the frequencydistribution of xi should be the same as IO, this leads to a further improvement ofthe xi levels. Now, it is possible to express the index, in terms of temperature (◦C).When a period is simultaneously covered with both DP and IO the overlap providesfor the possibility of calibration and verification. It is however necessary that bothDP and IO have the same distribution, i.e., the same range, mode and SD.
In a Gaussian distribution, the mode coincides with the mean and the 50thpercentile and becomes the zero reference of selected periods (e.g. 1961–1990) whencomputing the respective anomalies. This is simple with IO, a more difficult with DP.By definition, the mode is the most frequently occurring class and, therefore typicalof that time and therefore linked to the expectation of the observers who consideredit as the ‘normal’ situation. Temperatures below the “normal” were perceived as
Table 2 Classification in terms of standard deviation (SD) obtainable from the scatter of data
Index Type Classification Population (% of total data)
+3 Extremely high xi > 2 SD 2.1+2 Very high 1 SD < xi < 2 SD 13.6+1 High 0.5 SD < xi < 1 SD 150 Normal or no comments −0.5 SD < xi < 0.5 SD 38.3−1 Low −0.5 SD < xi < −1 SD 15−2 Very low −1 SD < xi < −2 SD 13.6−3 Extremely low xi < −2 SD 2.1
Author's personal copy

176 Climatic Change (2010) 101:169–199
negative (e.g. cold, dryness), above positive (e.g. warm, rainy) and it is this perceptionthat is reflected in the numerical values of indices. The aim here was to establish foreach proxy a scale of the correct distribution of the indexed variable, as we know ittoday, but in modern units. The distribution of temperature is generally Gaussian.The problem provided by DP is that the human factor may increase skewness,emphasizing the most dangerous events, e.g. an unusually hot summer or cold winter.These extremes are well documented for their negative impacts on people andland; on the other hand, the converse position i.e. mild summers or winters, areless threatening and, consequently, less clearly documented. Unfavourable extremeevents, which have caused severe damage or social consequences, have a higherprobability of being recorded compared with less relevant events that had a minorimpact. For this reason we first applied a temporary index based on the documentarytext and then made use of the properties of the Gaussian distribution. A largenumber of random events follow this bell-shaped distribution, characterized by apeak value that corresponds to the most frequent event (i.e. in our case the climaticaverage), and its width which is characterized by the standard deviation (SD). Thenumber of events included between −1 SD and +1 SD is 68% of the total, 95%between −2 SD and +2 SD and 99.6% between −3 SD and +3 SD, etc. Percentilescan be used therefore to represent points along the Gaussian curve. Therefore, ifwe start from a set of samples ordered from the smaller to the larger value, andwe express them as a percentage, the 0.15 percentile corresponds to 3 SD, the 2.1percentile to −2 SD, the 13.6 percentile to 1 SD, the 50 percentile to the average,the 86.4 percentile to +1 SD, the 97.9 percentile to +2 SD, the 99.85 percentileto +3 SD etc. As positive and negative values, e.g. hot and cold, are derived fromdifferent phenomena and involve different perceptions, it was appropriate to regardpositive and negative values in different contexts. The unknown level of the SDof documentary proxy was calibrated from the known values of the instrumentalreadings. In this way we calibrated our series moving from arbitrary values to anevaluation in degree Celsius. By applying to DP the SD observed with IO for eachgeographical area, the indexed data were corrected to take account for the biasintroduced by writers of such documents.
4 Meteorological networks and individual instrumental observations
The key meteorological instruments (thermometer, barometer, rain gauge and somehygrometers) were invented or improved in Italy in the first half of the seventeenthcentury thanks to a synergism between the Grand Duke of Tuscany, Ferdinand II De’Medici (1610–1670) and Galileo Galilei (1564–1642), who invented the thermometerin 1597. Ferdinand II was active in refining the instruments and founded the firstmeteorological network, called Rete Medicea (i.e. Medici Network, 1654–1670) forfundamental studies of meteorological variables and climate through the activities ofthe Accademia del Cimento (Academy of Experimental Observations: 1657–1667).This was the first Academy of Sciences, also founded by the Grand Duke, to studyNature through objective instrumental observations as opposed to the Aristotle’stradition based on subjective thought and unverifiable hypotheses. Luigi Antinoriwas Secretary of the Network while Lorenzo Magalotti occupied the same rolefor the Academy; Antinori distributed standardised instruments to all stations and
Author's personal copy

Climatic Change (2010) 101:169–199 177
established observational practices (Magalotti 1667; Targioni Tozzetti 1780). Dailyregular temperature readings were made outdoor with two Little Florentine spirit-in-glass thermometers, one hung on a wall facing north and one facing south, in orderto measure air temperature and the effect of sunshine. Readings were scheduled sixto eight times a day in Florence (IT), Vallombrosa (IT) Cutigliano (IT), Pisa (IT),Parma (IT), Bologna (IT), Milan (IT), Innsbruck (Austria), and Warsaw (Poland),shortly later followed by Paris. The most famous observers were Vincenzo Viviani,Alfonso Borelli, Fathers Casini and Paceschi. Readings were daily or weekly sent tothe Grand Duke, depending on the distance from the station.
Other international networks were later established (Camuffo 2002a). The firstattempt was made by Robert Hook in 1660 on behalf of the newly founded RoyalSociety, London. However, this was a limited attempt. The next internationalnetwork was successfully created in 1723, when James Jurin (1723) published a pleato join the correspondence network of the Royal Society. The Network was active forthe period 1724–1735 for meteorological and medical purposes but, unfortunatelyit was proposed that observations were made indoors and for two reasons: (1) theneed to know more living conditions in often unhealthy houses, (2) most of theearly thermometers, made with a glass capillary fixed to a wooden tablet with aniron wire were not resilient to outdoor conditions. Observations were published inthe Philosophical Transactions. Weather investigations connected with health arosefrom a very old medical theory inspired by Hippocrates (treatise On Air,Waters andPlaces, written 400 BC) and Galen of Pergamon (second century AD) who claimeda relationship between epidemics and climate, which was a reasonable hypothesis,especially in the absence of hygienic conditions and in warm regions.
In France, a similar activity was undertaken 50 years later under the patronage ofLouis XIV. Felix Vicq d’ Azyr, specialist in anatomy and queen Marie-Antoniette’sphysician, set up a network of the newly created Societé Royale de Médecine(Royal Society of Medicine), Paris. The aim of the network was to establish a linkbetween weather and health by collecting meteorological observations and medicalreports related to man and animal epidemics in France and other countries (Maraldi1732). Father Louis Cotte collected and published the meteorological observations inHistoire, the official journal of the Society for the period 1777–1786. Unfortunately,the Societé Royale de Médecine, was suppressed in 1793 by a French Revolutionarydecree.
At the same time, the German Prince-Elector Karl Theodor von Pfalz foundedanother international initiative: the Societas Meteorologica Palatina, Mannheim.Secretary was Jacob Hemmer (1783) who published readings in the EphemeridesSocietatis Meteorologicae Palatinae (1781–1792). This network was composed of 35stations in Europe none of which were in Britain or the Iberian Peninsula; althoughthere were three stations in Russia, one in Greenland and two in America.
In Paris (Legrand and Le Goff 1992; Slonosky 2002), Louis Morin started hisregular daily observations (1665–1713). The construction of the Paris Royal Ob-servatory, started in 1667 and was completed in 1671, the first director being GianDomenico Cassini (director 1671–1712) a former member of the Cimento Academywho began the series of meteorological observations. His co-worker was Philippede La Hire (readings 1669–1718) who used a Florentine thermometer probablybrought by Cassini from Florence to join the Medici Network. Leading scientists whocontributed to the Paris series were René Réaumur, Antoine Laurent de Lavoisier
Author's personal copy

178 Climatic Change (2010) 101:169–199
and Urbain Le Verrier. The meteorological observations in Paris started to bepublished in 1798 in the Journal de Physique.
All of the above networks had the primary merit of raising the interest in regulardaily observations, made with high-quality, standardized instruments, all of themhaving the same, or a similar exposure, and with readings performed at the same localtimes. The development of the meteorology is indebted to some leading scientistswhose work represents a milestone for the scientific community. Some of theseearly records were published in contemporary journals while others, handwrittenin the original logs and including both observations and notes about instruments,calibrations, and observational methodology, were dispersed in public and privatelibraries and archives. Within the EU funded projects Advice, Improve (Camuffoand Jones 2002) and Millennium, an effort was made to find the original readings,and recover, correct, adjust to modern standards, homogenize and analyze most ofthese longest European data series. In this paper we will present only the series thathave been made available either in their totality or for some previously unexploitedperiods (Table 3). The series used in this paper were selected from among a numberof available data for the following reasons: (1) exceptional length of the periodcovered, (2) continuity of the instrumental use, location, observational methodologyand careful observers, (3) reliability of the series checked established following astudy of data, metadata and the application of homogenisation tests. In those caseswhere it was not possible to verify the accuracy of an instrumental series from the
Table 3 Instrumental Series produced within MILLENNIUM and/or used in this paper
Country Location Length First MILLENIUM Referencesobserver new period
Italy Florence 1654–2007 Rete Medicea 1654–1670 Maracchi (1991); Crisci et al.(1998)
Italy Vallombrosa 1656–2003 Papeschi 1656–1670 Gandolfo and Sulli (1970)and Casini
France Paris 1676–2007 Morin 1676–1712 Legrand and Le Goff (1992);Slonosky (2002)
Italy Padua 1716–2008 Poleni 1716–1769 Camuffo (2002a, b, c);Cocheo and Camuffo (2002);Camuffo and Bertolin (2010)
Italy Bologna 1716–2007 Beccari 1716–1774 Baiada (1986); Brunetti et al.(2001)
Italy Naples 1727–2003 Cirillo 1727–1754 Cyrillus (1731–1732)France Lyon 1740–2007 Jesuits Fathers 1740–1780France Toulouse 1750–2007 1750–1850Italy Milan 1763–2007 Lagrange Maugeri et al. (2002)Spain Barcelona 1780–2007 Salvá 1780–1825Portugal Lisbon 1783–2007 Velho Maheras et al. (1994, 1995);
Alcoforado et al. (2000);Taborda et al. (2004)
Spain Cadiz 1787–2004 de Mazzaredo Barriendos et al. (2002);Rodrigo (2002);Gallego et al. (2007)
Italy Palermo 1791–2006 Piazzi 1791–1853 Chinnici et al. (2000);Micela et al. (2001)
Author's personal copy
Climatic Change (2010) 101:169–199 179
cross comparison with another used as a reference, but where dendrochronologicalseries were available for the same locality and period, these have been used toassess the reliability of the instrumental series under evaluation. For instance, thisprocedure has been applied to the early period of the French observations whichwere compared with tree-ring evidence (Etien et al. 2008).
5 Applied methodology for data analysis
5.1 Data homogenisation by means of direct methods
All the daily data were first transformed into monthly series and then presented asseasonal means (i.e. winter: DJF, spring: MAM, summer: JJA, autumn: SON), exceptwhen the time resolution was low and only annual values could be provided. The se-ries were all expressed in terms of anomalies from the reference period (1961–1990)in degree Celsius for temperature. Most of the IO presented in this study concernsthe Early Instrumental Period (EIP) 1654–1849, before the extensive standardizationof instruments and methods that took place in the second half of the 19th century. Itwas necessary to get as many metadata as possible in order to reconstruct the detailed“history” of all the readings and perform a first homogenization based on objectiveinformation extracted from the station history and other related sources. The nextstep was to study instrumental problems, calibration, observational methodology,exposure, location; all of which were needed to establish the corrections requiredfor the series (Camuffo 2002b; Cocheo and Camuffo 2002). The methodology is thesame as that presented within Improve (Camuffo and Jones 2002) and later appliedto the Histalp dataset (Böhm et al. 2009) for the Greater Alpine Region. Metadataallowed for the proper management of inhomogeneities resulting from the followingproblems:
1. Style used to compute the hours of the day. From the fourteenth century untilthe French Revolution in 1789, the official day started from the twilight, at theringing of the Angelus bell and subsequent hours were regulated by bell tollsaccording to the ecclesiastic system. This use is known as ‘Canonical Hours’ or‘Italian Time’. Being linked to the sunset, the Italian Time was variable duringthe calendar year, and it did not have finer subdivision, given the limited accuracyof early mechanical clocks. Readings taken following the Italian Time weretransformed into modern time units, i.e. Central European Time.
2. Readings at dif ferent times. In the EIP, readings were often made at differenthours during the day. In the case of the Medici Network with six to eightobservations per day, this was not a problem because it was easy to extrapolatethe maximum and the minimum temperature for each day. In some fortunatecases, observations were made near sunrise and 1 or 2 h after noon. Problemsarose when the readings were made at times far removed from those when theminimum and maximum temperatures might be expected e.g. the first reading inthe morning made 1 or 2 h after the sunrise, or readings with irregular samplingintervals (for a discussion see Camuffo 2002c). When we had only one observa-tion a day, taken at the same hour, the anomaly was computed as the differencefrom the available observations (as was the case for Florence, 1751–1766) andthe corresponding average for the same hour in the reference period 1961–1990.
Author's personal copy
180 Climatic Change (2010) 101:169–199
In those cases where the hour was not specified, but was always the same, e.g.Naples 1737–1757, the hour was interpreted by comparison with the daily cyclein the modern reference period. In those cases of multiple daily readings themaximum and minimum temperatures were calculated by reference to the dailytemperature cycle obtained from the modern hourly distribution, taking accountalso of its variability during the calendar year. The average daily temperaturewas the mean from the maximum and minimum temperatures because: (1)no alternative exists for large part of the early period; (2) the maximum andminimum average is in good agreement with the average from 24 hourly readings;(3) the need to use a homogeneous criterion throughout the series.
3. Original versus Celsius Scale. In the EIP, all the IO had particular scales, someof them unknown. The scale transformation to Celsius degrees was possiblebecause of: (1) direct information on the instrumental calibration, e.g. the LittleFlorentine Thermometer (Vittori and Mestitz 1981); the Stancari thermometerused in Bologna had notes in the Beccari log; the Hauksbee thermometer ofthe Royal Society, London, used in Naples had comments concerning problemswith the freezing point (Cyrillus 1731–1732); (2) the availability of simultaneousreadings of diverse instruments, one of which with known calibration, e.g. anunknown thermometer used by Beccari in Bologna that was compared withsimultaneous Réaumur readings.
4. Transformation of indoor into outdoor readings. This is a recurrent problem.In Padua, the second Poleni period (1725–1764) provided indoor temperaturereadings. However, referring to the simultaneous indoor and outdoor readingsmade by Morgagni for the period 1740–1768 not more than 1 mile far fromthe Poleni house, it was possible to transform the whole period 1716–1764 intostandard outdoor temperature readings. The indoor–outdoor transformationwas reliable except for short spells of 1 or 2 weeks of very cold conditions inwinter when the thermal inertia of the building became a factor. Fortunatelyin the most relevant of such cases some additional observations were madeoutdoors (e.g. Poleni 1740; Temanza 1755 in Toaldo 1781). Also the earliestperiod of the Beccari’s observations in Bologna, i.e. 1716 to 1741, was with indoorreadings only and the data needed to be transformed into outdoor ones. Thiswas possible because, fortunately, later on Beccari made simultaneous outdoorreadings with two Réaumur thermometers, and it was possible to establish theindoor–outdoor transfer function with very high correlation coefficient (R2 =0.98) and transform all the indoor readings into standard outdoor observations.
5. Overestimate of temperature. The earliest measurements were made withthermometers exposed outdoors in a wall facing north in order to avoid sunshine,following the recommendations by Luigi Antinori (1654) and Jacob Hemmer(1783), or in a room facing North where fire was never lit, following the recom-mendations by John Locke in the 1660s and James Jurin (1723). However, insome cases of the earliest period and before the invention of any form of shield-ing, the absolute maxima might be over-estimated in the case of the thermometerbeing exposed to some radiation. The first time when any such remedy wasapplied against the solar radiation was in 1780 and the first mention of a shieldwas found in 1785, both due to G. Toaldo (Camuffo 2002a). Screens started tobe used after 1835 (Middleton 1966). For this reason early very high maximamight be the result of poor exposure of the thermometer.
Author's personal copy

Climatic Change (2010) 101:169–199 181
5.2 Data homogenisation by means of indirect methods
Readings from the EIP are not easy to manage in terms of homogenisation. The stan-dard approach based on applying some statistical tests to the differences (or ratios)among one candidate series and one or more reference series is often problematic asgoing back in time the number of available series decreases and the factors leadingto inhomogeneity increase. Once the series had been homogenised for the aboveissues by reference to the metadata, the next step consisted of a statistical testingof the records with the Standard Normal Homogeneity Test (SNHT) by Mobergand Alexandersson (1997a, b). Useful references were those series already ho-mogenised and corrected series within IMPROVE, i.e. Padua (IT), Milan (IT), andCadiz/San Fernando (SP).
5.3 Low-pass filtering
In order to give better evidence the variability at decadal time scale, the final recordswere filtered with a bell-shaped low-pass filter by Hamming (Wei 1990):
D(τ ) ={
0.54 + 0.46 · cos πττm
, |τ | ≤ τm
0, |τ | > τm
where τm is the window, i.e. 11 years, and τ the time variable with 1 year steps.
6 Results and discussion
The present analysis includes only long-term, high-quality time series producedwithin the Millennium project and only European stations of Central and WesternMediterranean have been included. It would have been useful to include Greece forits location and in particular Athens for the exceptional length of the series (1891–today). However, this series was tested for homogeneity and found to include suspector doubtful data before 1979 (Tank 2007) and after 1995 (Repapis et al. 2007) andalthough the latter period has now been revised by Founda et al. (2009), the serieshas been excluded because some problems still exist.
In this paper, DP and IO concur together to provide a general view of theclimate variability over the last five centuries in the Mediterranean Basin. DP areof the greater relevance to provide information before the instrumental periodalthough they are affected by some subjectivity, with potential gaps and with indexingresolution limited to seven classes. Proxies and instrumental observations have beenhomogenized thanks to calibration and verification made on a common period forwhich both DP and IO were available. DP have been adjusted to IO and benefit ofthe same SD found for IO. However, despite all our efforts, some minor differencespersisted between DP and IO. An example is shown in Fig. 2 where indexed DPand IO winter are reported from 1750 to 1800 together with their Hamming filter.The running averages are near-parallel with 0.5◦C average difference showing thatthe information is reasonably reliable. Most of the individual points are reasonablycoincident but in some cases, e.g. 1768, 1776 and 1777, the DP departs much morefrom the IO. When a period is not documented, this is an unavoidable gap in
Author's personal copy

182 Climatic Change (2010) 101:169–199
Fig. 2 Example of documentary proxy (DP) and instrumental observations (IO) of winter airtemperature in Italy for the period 1750–1800. Open circles and dotted thin line refer to DP; fullcircles and continuous thin line to IO. Thick lines refer to 11-year filter, pink to DP, blue to IO
knowledge and no information. However, when a period is well documented butthe chroniclers failed to report any weather information, the index is interpreted asa zero, i.e. a normal situation, as shown in Fig. 2. This justifies the high number of“normal” events in the indexing. In general this is a correct procedure, but sometimesit may be misleading. Another problem is the true zero DP level. As a result of thenature of DP records, it is not possible to establish trends or express them in terms ofanomaly with respect to a given period as 1961–1990. In the case of IO continuing tothe present-day the matter is less complicated. However, matters are different for DPbecause the writer living centuries ago noted some events because he judged them‘anomalous’ or ‘exceptional’ making reference to his experience and time. DP areintimately referred to their contemporary period, with a floating zero reference level.In our graphs the DP zero has been established to be coincident with the averageof the whole available period of instrumental data (i.e. the average anomaly of allavailable IO). This choice, although arbitrary, avoids unjustified jumps in level whenpassing from DP to IO. So, the records that we got from superimposing DP and IOare useful in improving our knowledge about the Little Ice Age (LIA) but remainnevertheless partly inhomogeneous. From the mathematical point of view, a filtershould be applied to homogeneous and continuous series but whatever the natureof the calibration and validation exercises, DP and IO preserve some differencesin nature and have a slightly different confidence levels (e.g. DP have potentiallymissing or contradictory data, as discussed in Fig. 2). For this reason we preferred notto mix these two different forms of data and preserve each signal separately hencewe preferred to interrupt the low-pass Hamming filter and introduce a break in thecontinuity when passing from the DP to the IO series. In the cases where the DP andIO overlap the filter is applied to IO only.
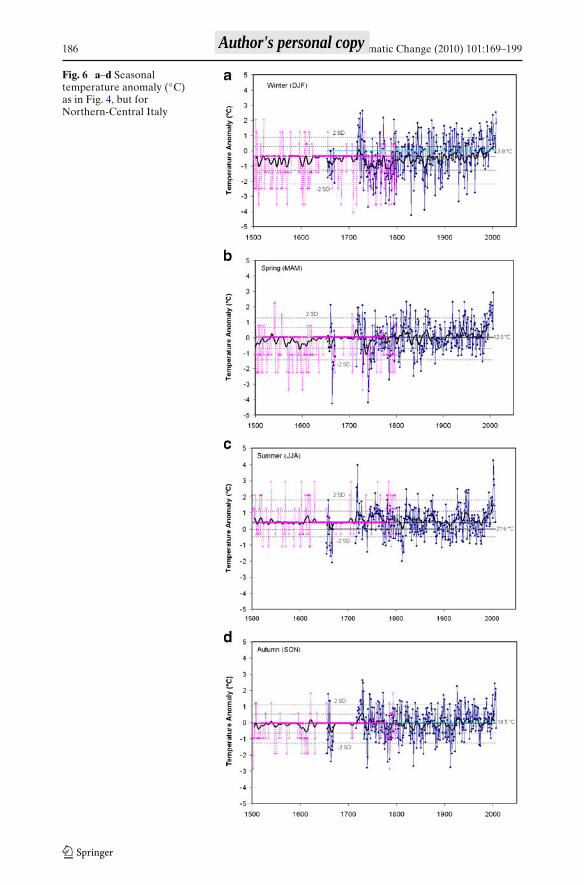
The result of the analysis for each country is reported in Figs. 3, 4, 5, 6, 7 and 8which illustrate temperature anomalies from 1500 to the present. Extreme events
Author's personal copy

Climatic Change (2010) 101:169–199 183
Fig. 3 Seasonal temperatureanomaly (◦C), referenceperiod 1961–1990, Barcelona,Spain. a Winter (months DJF),b spring (MAM), c summer(JJA), d autumn (SON). OnlyIO. Continuous thick blackline refers to 11-year Hammingfilter, The thick cyan line, i.e.the Zero Anomaly line, is theseasonal 1961–90 referenceperiod indicated on the right.Thick dotted line is the averageof all IO, Parallel thin dottedlines are for ±1 and ±2 SDcomputed on IO. Positive andnegative SDs are different,because the distributionis skew
Author's personal copy

184 Climatic Change (2010) 101:169–199
Fig. 4 a–d Seasonaltemperature anomaly (◦C)for Cadiz, Spain
Author's personal copy

Climatic Change (2010) 101:169–199 185
Fig. 5 a–d Seasonaltemperature anomaly (◦C) asin Fig. 4, but for France. Opencircles and pink dotted thin linerefer to the index from DP;full circles and continuous blueline to IO. Continuous blackline for Hamming filter
Author's personal copy
186 Climatic Change (2010) 101:169–199
Fig. 6 a–d Seasonaltemperature anomaly (◦C)as in Fig. 4, but forNorthern-Central Italy
Author's personal copy

Climatic Change (2010) 101:169–199 187
Fig. 7 a–d Annualtemperature anomaly(◦C) as in Fig. 4, but forSouthern Italy. Only IO
Author's personal copy

188 Climatic Change (2010) 101:169–199
Fig. 8 Seasonal index of temperature in Greece for the period 1675–1715 from documentary sources
and some periods with increased frequency of anomalous weather are evident.For their nature, no trends can be established with DP. A foreword is necessaryconcerning the stations in the Iberian peninsula, i.e. Cadiz and Barcelona. Atlanticperturbations cross the Iberian peninsula before entering the Mediterranean andloose their strength passing over the land. Cadiz is on the Atlantic side and exposedto westerly winds. Barcelona is on the Mediterranean coast and exposed to easterlyconditions. This causes a marked climate difference between Cadiz and Barcelonathat changes season by season (Oñate and Pou 1996). As Cadiz and Barcelona belongto different climatic regions, it is impossible to apply tests for homogeneity betweenthem. Although some uncertainty may remain, these two series have been recoveredwith the highest accuracy and verified on the grounds of metadata and statisticaltests. The cross comparison, i.e. the Pearson determination coefficient R2, betweenthese two series and the nearby countries (Table 4) shows that Barcelona with theother Mediterranean stations, i.e. France and Italy, has an average R2 greater than0.5. The less Mediterranean Cadiz has a lower correlation, i.e. R2 > 0.4 in winterand spring, but is almost zero correlated in the other seasons. Cadiz and Barcelonashow an average teleconnection (i.e. R2 > 0.4) in spring and winter, no correlation insummer and autumn. At a regional or national level, temperature trends are evident(Figs. 3–8, geographically distributed) only for particular periods, i.e., Barcelona (SP)where in winter (Fig. 3a) a warming trend started in 1880 and, in contrast, in summer(Fig. 3c) a cooling trend started in 1850. The present-day warming started later,around 1990. Other periods are characterized by unusual features, for example cold1820 to 1862 in winter and autumn, in Cadiz (SP) (Fig. 4a and d) and again between1850 and 1925 in summer and autumn in France (Fig. 5c and d). Hot conditionsprevailed between 1923 and 1975 in autumn in Southern Italy (Fig. 7d).
We should note that in DP, the winter severity is established through the mainconsequences, e.g. people killed or large water bodies frozen over. In IO theseasonal averages for most of the years famous for their severe winters, e.g. 1709,1789 and 1929, are not characterized by the lowest seasonal temperatures (see alsoLuterbacher et al. 2009) but were determined by spells of very cold air persisting fortwo, three, or more weeks. The impact was tremendous, but the principal cause wasgenerally limited to a short period. The comparison between DP famous years and IOaverages seems contradictory unless we consider, instead of the seasonal averages,the more detailed monthly averages in which cold spells are recognizable. We shouldkeep in mind that if we change the way of presenting data, e.g. by passing from daily,monthly or seasonal averages, as the extreme years characterized by the most severehot or cold weather will change.
Author's personal copy

Climatic Change (2010) 101:169–199 189
Table 4 Analysis of theseasonal correlation (R2)between individualtemperature series
N Italy S Italy France Barcelona CadizSP SP
WinterN Italy 1 0.47 0.76 0.65 0.32S Italy 1 0.33 0.51 0.44France 1 0.64 0.36Barcelona SP 1 0.51Cadiz SP 1
SpringN Italy 1 0.68 0.75 0.53 0.41S Italy 1 0.46 0.49 0.26France 1 0.54 0.48Barcelona SP 1 0.40Cadiz SP 1
SummerN Italy 1 0.59 0.56 0.51 0.15S Italy 1 0.39 0.50 0.24France 1 0.50 0.10Barcelona SP 1 0.03Cadiz SP 1
AutumnN Italy 1 0.49 0.64 0.53 0.07S Italy 1 0.38 0.35 0.12France 1 0.53 0.10Barcelona SP 1 −0.07Cadiz SP 1
Table 5 summarises those extreme events evident but not datable in Figs. 3–8.Extreme values of temperature are generally randomly distributed in time and space,except when extremes are found at the same time in a number of countries. Table 6identifies countries simultaneously affected by extreme events. The geographicalextension of anomalous seasons is limited and variable, in only a few cases reachinga large-scale area. The most outstanding events were: a severe winter in 1830; aspring killing frost in 1837; a hot summer in 2003 and 2004. For further details onthis anomalous year 2003 see also Luterbacher et al. (2004).
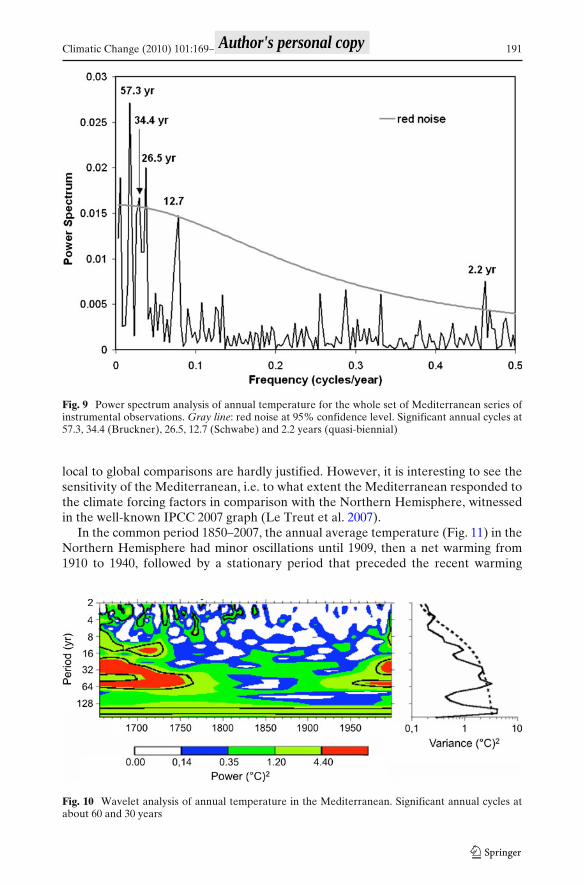
An analysis of the correlation between individual temperature series (Table 4)shows that in spring and winter all the stations are positively correlated (i.e. Pearsoncoefficient R > 0.33). The same holds in summer and autumn except for Cadiz(SP) where −0.33 < R < +0.33 with the rest of the stations. A comprehensiveMediterranean dimension is provided by combining all the individual series to obtainonly one comprehensive series for temperature. The Power Spectrum Analysisperformed on the composite Mediterranean temperature series at annual (Fig. 9)and seasonal level shows annual cycles at 57.3, 34.4 (Bruckner), 26.5, 12.7 (Schwabe)and 2.2 years (quasi-biennial) at the 95% confidence level. In spring the same cyclesare visible; in summer only the Bruckner; in autumn 26.5, 4.1 years and other shorterones; in winter 78, 3.5 years and shorter. Wavelet Analysis at an annual scale (Fig. 10)confirmed the same cycles. Previous studies that made comparisons between regionaland hemispheric/global past trends in surface temperature and precipitation/droughtduring the last millennium shown dramatic differences (Jones and Mann 2004) and
Author's personal copy

190 Climatic Change (2010) 101:169–199
Table 5 Extreme seasons: coldest winters/hottest summers, spring killing frost
Location period Temperature extremes Year
Spain, Barcelona Coldest winters 1808, 1827, 1830, 1857, 1871, 1880, 19631787–2007 Hottest summers 1822, 1828, 1846, 1849, 2003
Spring killing frost 1837, 1853, 1855, 1879, 1913, 1925Spain, Cadiz Coldest winters 1827, 1830, 1832, 1839, 1845, 1848, 1907, 1991
1805–2004 Hottest summers 1804, 1864, 1869, 1928, 1943, 1949, 1950, 1961, 1989,2003, 2004
Spring killing frost 1799, 1837, 1889, 1890, 1971, 1993France 1500–2007 Coldest winters 1565, 1608, 1684, 1685, 1695, 1697, 1740, 1784, 1795,
1830, 1880, 1891, 1963Hottest summers 1556, 1676, 1724, 1826, 1842, 1846, 1947, 1976, 2003Spring killing frost 1553, 1565, 1595, 1782, 1785, 1799, 1837, 1845, 1887,
1962Italy, North-Central Coldest winters 1503, 1549, 1571, 1740, 1766, 1777, 1784, 1830, 1855,
1858.Area 1500–2008 Hottest summers 1516, 1540, 1603, 1718, 1720, 2003, 2004, 2005
Spring killing frost 1515, 1664–1665, 1729, 1740–1743, 1747, 1785, 1837,1853, 1883, 1984
Italy, South Area Coldest winters 1728, 1729, 1850, 1891, 1905, 19291727–2006 Hottest summers 1746, 1802, 1822, 1854, 1950, 1952, 1994, 2003
Spring killing frost 1730, 1740, 1742, 1746, 1754, 1837, 1874Greece 1675–1715 Coldest winters 1683, 1687, 1709
Hottest summers 1685, 1682, 1708Spring killing frost 1687, 1714
In italics the most relevant events
Table 6 Geographical distribution of the most extreme events
1684 Murcia, Cadiz: humid winter; Greece: humid winter and autumn; France: cold winter.1701 Portugal, Murcia, Barcelona: humid autumn; Portugal humid spring; Barcelona: dry winter.1714 Portugal: dry autumn; Northern-Central Italy: humid autumn, Greece: dry winter, spring
and summer, spring killing frost.1740 Barcelona: humid winter, Murcia: humid spring; Cadiz/Sevilla: humid winter; France:
humid autumn and cold winter; Northern-Central Italy: dry summer and autumn, coldwinter, spring killing frost; Southern Italy: spring killing frost.
1784 Barcelona: humid winter; France: humid summer; France, Northern-Central Italy: coldwinter.
1830 Barcelona, Cadiz, France, Northern-Central Italy: cold winter; France: dry winter.1837 Portugal: dry spring and autumn; Barcelona: dry winter; Cadiz/Sevilla, France, Italy: spring
killing frost; Cadiz/Sevilla: dry autumn.1855 Portugal: humid spring; Portugal, Cadiz/Sevilla: humid autumn; Barcelona: spring killing
frost; Northern-Central Italy: coldest winter.1858 Cadiz/Sevilla: humid autumn; France, Northern-Central Italy: dry winter; Northern-Central
Italy: cold winter.1884 Portugal, Murcia: humid spring; Murcia: humid autumn; France: dry autumn.1896 Barcelona: humid summer; France: humid autumn; Northern-Central Italy: humid summer.1931 Murcia: dry winter; France: humid spring; Northern-Central Italy: dry summer.1936 Barcelona: dry winter; Cadiz/Sevilla: humid spring; France: humid winter and summer.2003 Spain, France, Italy: hot summer; Barcelona, Northern-Central Italy: dry summer;
Northern-Central Italy: dry spring.2004 Murcia: humid spring and autumn; Cadiz, Northern-Central Italy: hot summer.
Author's personal copy
Climatic Change (2010) 101:169–199 191
Fig. 9 Power spectrum analysis of annual temperature for the whole set of Mediterranean series ofinstrumental observations. Gray line: red noise at 95% confidence level. Significant annual cycles at57.3, 34.4 (Bruckner), 26.5, 12.7 (Schwabe) and 2.2 years (quasi-biennial)
local to global comparisons are hardly justified. However, it is interesting to see thesensitivity of the Mediterranean, i.e. to what extent the Mediterranean responded tothe climate forcing factors in comparison with the Northern Hemisphere, witnessedin the well-known IPCC 2007 graph (Le Treut et al. 2007).
In the common period 1850–2007, the annual average temperature (Fig. 11) in theNorthern Hemisphere had minor oscillations until 1909, then a net warming from1910 to 1940, followed by a stationary period that preceded the recent warming
Fig. 10 Wavelet analysis of annual temperature in the Mediterranean. Significant annual cycles atabout 60 and 30 years
Author's personal copy

192 Climatic Change (2010) 101:169–199
Fig. 11 Comparison between the annual temperature anomaly from instrumental observations inthe Mediterranean Basin and the Northern Hemisphere. Top: IPCC 2007 Northern Hemispheretemperature difference for 1850 to 2006 relative to the 1961–1990 mean (Le Treut et al. 2007).Bottom: Annual temperature difference in the Mediterranean Basin for 1655 to 2007 relative tothe 1961–1990 mean. Labels IT, FR and SP indicate the starting point of series from Italy, Franceand Spain, respectively. Vertical thin lines: 12-month averages; thick continuous line: 11-year movingaverage
since 1970. The Mediterranean had more regular oscillations around the sameaverage level, followed by the same warming after 1970. The similarity between theNorthern Hemisphere and the Mediterranean can be pinpointed with the Pearson’scorrelation coefficient calculated for the temperature R2(T) and the temperaturetime derivative R2(dT/dt), which is representative of the common warming/coolingtendency (Table 7). This table shows that, in the 1950–today period, a high corre-lation dominates for both temperatures and their trends. In the previous 1850–1949period, the Mediterranean climate oscillation generates an alternation of correlationand anti-correlation of both temperatures and trends, as already discussed. At theseasonal level (Fig. 12), both the Mediterranean and the Northern Hemisphere show(Fig. 12a) a close winter agreement; in spring (Fig. 12b) and summer (Fig. 12c)the Mediterranean is generally warmer than the Northern Hemisphere; in autumn(Fig. 12d) there is again a good agreement. On the longer time scale, i.e. 1650 to
Table 7 Pearson’s correlation coefficient calculated for the temperature R2(T) and the temperaturetime derivative R2(dT/dt), in the Northern Hemisphere and the Mediterranean
Year 1860 1865 1870 1875 1880 1885 1890 1895 1900 1905 1910 1915 1920 1925 1930
R2(T) −0.4 −0.4 −0.8 0.8 0.9 0.0 1.0 0.1 1.0 −0.9 −0.8 0.6 0.9 −0.2 −0.5R2(dT/dt) 0.3 0.4 0.0 0.3 0.2 0.6 0.4 0.2 0.6 0.6 −0.5 −0.6 −0.7 0.3 0.2
1935 1940 1945 1950 1955 1960 1965 1970 1975 1980 1985 1990 1995 2000R2(T) 0.9 −0.9 −0.1 0.9 0.4 1.0 0.9 0.6 0.9 0.8 0.5 0.9 1.0 1.0R2(dT/dt) −0.2 0.7 −0.7 −0.4 0.7 0.2 0.9 0.8 0.6 0.2 0.6 0.9 0.2 0.6
Author's personal copy

Climatic Change (2010) 101:169–199 193
Fig. 12 Comparison betweenthe anomaly of seasonaltemperature on theMediterranean Basin (MB) for1655–2007 and the NorthernHemisphere (NH) for1850–2008 (IPCC 2007)(Le Treut et al. 2007).a Winter, b spring, c summerand d autumn. Blue thin line:MB anomaly; black thick line:MB 11-year moving average;pink line: NH anomaly andyellow thick line: NH 11-yearmoving average
Author's personal copy

194 Climatic Change (2010) 101:169–199
Table 8 Error bars of theMediterranean annualtemperature series for thedifferent sub-periods
Sub-period Error bar (◦C)
Temperature 1500 to 1653 ±1.21654 to 1675 ±0.61676 to 1715 ±1.01716 to 1726 ±0.61727 to 1779 ±0.51780 to 1786 ±0.41787 to 1849 ±0.31850 to nowadays ±0.2
the present, the reconstructed Mediterranean temperature series (Figs. 11 and 12)show a repetition of heating and cooling cycles, evident also in individual series(Camuffo and Bertolin 2010) and different countries. Apparently, the cycles in theseventeenth and eighteenth centuries reach or even exceed the level of the present-day warming, and this is also confirmed by dendrochronology evidence (Etien et al.2008). However, this early period is based on a limited number of instrumentalstations with the consequence that local departures may have a larger incidence incomparison with the subsequent period. The pronounced cycles prior to 1750 shouldbe considered as being subject to a wider uncertainty band, as reported in Figs. 11and 12 and specified in Table 8. In addition, we should keep in mind three factors:first, the number of Mediterranean stations used in this work is much smaller thanthe number used by IPCC 2007 for the Northern Hemisphere and, therefore, lessrepresentative; however, the quality of individual series is higher; second, even atthe Mediterranean scale, the number of operative stations in the early period wasmuch smaller than today, but the same problem holds for IPCC too; third, at theglobal scale we see that at high and at low latitudes the tendency to warming orcooling is opposite, and the Mediterranean is in the belt between these oppositetendencies: any oscillation over this wide latitudinal range may have a large impactat the Mediterranean scale, thus justifying the observed cycles, remarkable on theMediterranean, but small on the global scale.
7 Conclusions
In this paper, documentary data and instrumental observations combine to extendour knowledge of the behaviour of temperature in the Mediterranean Basin over thelast 500 years, especially in relation to the recent global warming. Precipitation hasalso been analysed, but it will be discussed elsewhere. A tremendous effort was madeto gather, combine and homogenize data of a different nature including a huge quan-tity of documentary sources and a limited number of extremely long instrumentalseries. Some unknown instrumental series have been checked for problems, discon-tinuities and errors and are here presented for the first time and extend back upto 1654. Although they originated at the dawn of meteorological observations, theirquality has been carefully assessed. Now these retrieved data provide a long-termgeneral view of the climate features and their variability in the Mediterranean Basin.
From the comparison between documentary sources and instrumental observa-tions, it was clear that famous extreme events happened in the course of a few daysor weeks, rarely of months, and may by masked by seasonal averages. From thispoint of view, extreme features in chronicles or annals may appear in a different light
Author's personal copy

Climatic Change (2010) 101:169–199 195
when compared with instrumental readings, depending on the averaging time rangeselected in data processing.
DP are convenient for establishing the occurrence of extreme events, year-by-year variability, the existence of some time periods in which, cold or warm situationswere repeated, but not for identifying long-term trends. The latter can be assessedonly with IO, and for the first time we can see the climate variability from purelyinstrumental observations over the past 350 years or so.
In this paper the instrumental observations cover the exceptional length of threeand a half centuries. In the last 40 years we observe that all the Mediterraneanstations are in line with global warming. However, looking at the long-term timescale, warm and dry periods are not exceptional for the Mediterranean, which wascharacterized by a sequence of warming–cooling and rainy–dry cycles depending onthe relative influence of the Atlantic, the eastern side and Africa. In the future, it willbe interesting to see if such oscillation modes will persist and how they will combinewith global warming.
Acknowledgements Most of this work was supported by the EU, project Millennium (Contract017008-2). Previous EU contract mentioned in the text are ADVICE (ENV4-CT95-0129) andIMPROVE (ENV4-CT97-0511). The French contribution was within the framework of climatehistory OPHELIE (http://www.ipsl.jussieu.fr/~ypsce/ophelie.html) and RENASEC (http://www.gisclimat.fr/Doc/Projets_detail/RENASEC.html). The activity of Fernando Dominguez-Castro atCNR-ISAC, Padua, was possible thanks to ESF grant “Mediterranean Climate Variability andPredictability”. This paper was possible thanks to the exquisite cooperation of colleagues andInstitutions who have facilitated the research of data and metadata, or have kindly supplied data.The following instrumental data are due to the courtesy of: Florence (1889–2007): Prof. GP.Maracchi and Dr. A. Crisci, CNR-IBIMET, Florence; Vallombrosa (1872–2007): Dr. M. Sulli, IstitutoSperimentale per la Selvicoltura, Florence; Locorotondo (1884–2007): Prof. L. Ruggiero, Universityof Lecce; Palermo (1791–2007): Prof G. Micela, Prof. V. Iuliano and Dr. D. Randazzo, AstronomicalObservatory “G.S. Vaiana”, Palermo; Erice (1565–1915): Dr. M. Colacino, CNR-ISAC, Rome;Bologna series (1813–2007): Dr. T. Nanni, Dr. M. Brunetti, CNR-ISAC, Bologna. For the archivalresearch, data recovery and any other kind of help, special thanks are due to: Historical Archive ofthe Astronomical Observatory (INAF), Padua: Dr V. Zanini and Dr L. Pigatto; University Library,Padua: Dr L. Prosdocimi; Library of the Astronomy Department, Bologna University: Dr R. Stasi;National Central Library, Florence (BNCF): Dr. P. Pirolo and Dr S. Pelle; Institute and Museumof History of Science (IMSS), Florence: Prof. P. Galluzzi, Dr. A. Lenzi, Dr. G. Strano, Dr. A.Saviori; Library of the Vallombrosa Abbey: Father P.D. Spotorno; Ximenian Observatory, Florence:Father Prof. E. Borchi; Italian Corps of Foresters (GFS), Office for the Biodiversity, Vallombrosa:Mrs L. Persia; Naples: Capodimonte Astronomical Observatory (INAF). Most of Portuguese datacollection in the archives and the analysis referring to 18th century has been carried out by JoãoPaulo Taborda (University of Évora). Thanks are due to João Carlos-Garcia and Sandra Oliveira(University of Lisbon). Finally, for useful suggestions and discussions Dr. D. Wheeler, Universityof Sunderland, Dr V. Cantù and Dr D. Vergari. Elena Xoplaki is supported by the EuropeanUnion integrated project called CIRCE (Climate Change and Impact Research: the MediterraneanEnvironment). Jürg Luterbacher acknowledges support from the 7th EU Framework programACQWA (Assessing Climate impacts on the Quantity and quality of Water; http://www.acqwa.ch/)and MedClivar (http://www.medclivar.eu/).
References
Alcoforado MJ, Nunes MF, Garcia JC (2000) Temperature and precipitation reconstruction inSouthern Portugal during the late Maunder Minimum (AD 1675–1715). Holocene 10(3):333–340
Alexandre P (1987) Le climat en Europe au Moyen Age. Contribution à l’histoire des variationsclimatiques de 1000 à 1425, d’après les sources narratives de l’Europe occidentale. Ecole desHautes Etudes en Sciences Sociales, Paris
Author's personal copy

196 Climatic Change (2010) 101:169–199
Antinori L (1654) Correspondence between Giacomo Micaglia and Luigi Antinori, letter datedDecember 1654, Manoscritto Galileiano 307, Posteriori di Galileo Tomo 48, Accademia delCimento Parte III, carteggio vol. 33, Osservazioni meteorologiche 12, National Central Library(BNCF), Florence
Baiada E (1986) Da Beccari a Ranuzzi: la meteorologia nell’Accademia Bolognese nel XVIII secolo.In: Finzi R (ed) Le meteore ed il frumento: Clima, agricoltura, meteorologia a Bologna nel ‘700.Il Mulino, Bologna, pp 99–261
Barriendos M, Martin-Vide J (1998) Secular climatic oscillations as indicated by catastrophic floodsin the Spanish Mediterranean coastal area (14th–19th Centuries). Clim Change 38:473–491
Barriendos M, Martin-Vide J, Peña JC, Rodríguez R (2002) Daily meteorological observations inCádiz-San Fernando. Analysis of the documentary sources and the instrumental data content(1786–1996). Clim Change 53:151–170
Böhm R, Jones PD, Hiebl J, Brunetti M, Frank D, Maugeri M (2009) The early instrumentalwarm-bias: a solution for long central European temperatures series 1760–2007. Clim Change.doi:10.1007/s10584-009-9649-4
Bolle HJ (ed) (2003) Mediterranean climate. Springer, BerlinBrázdil R, Pfister C, Wanner H, von Storch H, Luterbacher J (2005) Historical climatology in
Europe—the state-of-the-art. Clim Change 70:363–430Brázdil R, Kundzewicz ZW, Benito G (2006) Historical hydrology for studying flood risk in Europe.
Hydrol Sci J 51(5):739–764Brunetti M, Buffoni L, Lo Vecchio G, Maugeri M, Nanni T (2001) Tre secoli di Meteorologia
a Bologna. ISAO-CNR, Bologna; Istituto di Fisica Generale Applicata-Università di Milano;Osservatorio Astronomico di Milano-Brera. CUSL, Milan
Camuffo D (2002a) History of the long series of the air temperature in Padova (1725–today). ClimChange 53(1–3):7–76
Camuffo D (2002b) Calibration and instrumental errors in early measurements of air temperature.Clim Change 53(1–3):297–330
Camuffo D (2002c) Errors in early temperature series arising from changes in style of measuringtime, sampling schedule and number of observations. Clim Change 53(1–3):331–354
Camuffo D, Bertolin C (2010) Recovery of the early period of long instrumental time seriesof air temperature in Padua, Italy (1716–2007). J Phys Chem Earth. doi:10.1016/j.pce.2010.02.002
Camuffo D, Enzi S (1992a) Critical analysis of archive sources for historical climatology of NorthernItaly. In: Frenzel B (ed.) European climate reconstructed from historical documents: methodsand results. Fischer, Stuttgart, pp 65–74
Camuffo D, Enzi S (1992b) Reconstructing the climate of Northern Italy from archive sources. In:Bradley RS, Jones PD (eds) Climate since 1500 A.D. Routledge, London, pp 143–154
Camuffo D, Enzi S (1994) The climate of Italy from 1675 to 1715. In: Frenzel B (ed) Climatic trendsand anomalies in Europe 1675–1715. Fischer, Stuttgart, pp 243–254
Camuffo D, Jones P (eds) (2002) Improved understanding of past climatic variability from early dailyEuropean instrumental sources. Kluwer, Dordrecht
Camuffo D, Sturaro G (2004) Use of proxy-documentary and instrumental data to assess the riskfactors leading to sea flooding in Venice. Glob Planet Change 40:93–103
Camuffo D, Secco C, Brimblecombe P, Martin-Vide J (2000a) Sea storms in the Adriatic sea and thewestern Mediterranean during the last millennium. Clim Change 46:209–223
Camuffo D, Cocheo C, Enzi S (2000b) Seasonality of instability phenomena (hailstorms and thun-derstorms) in Padova, Northern Italy, from archive and instrumental sources from AD 1300 to1989. Holocene 10(5):651–658
Camuffo D, Bertolin C, Jones P, Cornes R, Garnier E (2009) The earliest daily barometric pressurereadings in Italy: Pisa, 1657–8 and Modena, 1694 and the circulation index over Europe, 1694.The Holocene 20(3):1–13. doi:10.1177/0959683609351900
Chinnici I, Foderà Serio G, Granata L (2000) Duecento anni di meteorologia all’OsservatorioAstronomico di Palermo. Osservatorio Astronomico G.S. Vaiana, Palermo
Chuine I, Yiou P, Viovy N, Seguin B, Daux V, Le Roy Ladurine E (2004) Grape ripening as a pastclimate indicator. Nature 432:289–290
Cocheo C, Camuffo D (2002) Corrections of systematic errors and data homogenisation in thePadova series (1725–today). Clim Change 53(1–3):77–100
Crisci A, Gozzini B, Maracchi G, Meneguzzo F (1998) La serie storica delle temperature mediemensili di Firenze. Proceeding: Due secoli di osservazioni meteorologiche a Mantova, aspettiscientifici e storici, Mantova 22 ottobre 1998, 143–158
Author's personal copy

Climatic Change (2010) 101:169–199 197
Cyrillus N (1731–1732) An account of an extraordinary eruption of mount Vesuvius in the monthof March, in the year 1730, Extracted from the meteorological diary of that year at Naples,Communicated by Nichol. Cyrillus, M. D. R. S. S. Philos Trans 37:336–338
Daveau S (1997) Os tipos de tempo em Coimbra (Dez.1663–Set. 1665) nas cartas do Padre AntónioVieira. Finisterra-Revista Portuguesa de Geografia XXXII 64:109–115
Diodato N (2007) Climatic fluctuations in Southern Italy since 17th century: reconstruction withprecipitation records at Benevento. Clim Change 80:411–431
Enzi S, Camuffo D (1995) Documentary sources of the sea surges in Venice from A.D. 787 to A.D.1867. Nat Hazards 12:225–287
Etien N, Daux V, Masson-Delmotte V, Stievenard M, Bernard V, Durost S, Guillemin MT, MestreO, Pierre M (2008) A bi-proxy reconstruction of Fontainebleau (France) growing season tem-perature from A.D. 1596 to 2000. Clim Past 4:91–106
Fletcher CA, Spencer T (eds) (2005) Flooding and environmental challenges for Venice and itslagoon: state of knowledge. Cambridge University Press, Cambridge
Founda D, Kambezidis HD, Petrakis1 M, Zanis P, Zerefos C (2009) A correction of the recentair-temperature record at the historical meteorological station of the National Observatoryof Athens (NOA) due to instrument change. Theor Appl Climatol 97:385–389. doi:10.1007/s00704-008-0084-7
Gallego D, Garcia-Herrera R, Calvo N, Ribera P (2007) A new meteorological record for Cádiz(Spain) 1806–1852: implications for climatic reconstructions. J Geophy Res 112:D12108
Gandolfo C, Sulli M (1970) Vallombrosa 1872–1989: serie ultracentenaria di misure di precipitazionie di temperatura in ambiente forestale. Ann Ist Sper Selvic 21:147–181
Garcia-Herrera R (ed) (2008) El clima de Cádiz en la primera mitad del siglo XIX según los partesde la Vigía. Fundación Unicaja, Málaga
Garnier E (2007) La ville face aux caprices du fleuve XVIe–XVIIIe siècle. Hist Urbaine 18:41–60Grove JM, Conterio A (1994) Climate in the eastern and central Mediterranean. In: Frenzel B (ed)
Climatic trends and anomalies in Europe 1675–1715. Fischer, Stuttgart, pp 275–285Grove JM, Conterio A (1995) The climate of Crete in the sixteenth and seventeenth centuries. Clim
Change 30:223–247Hemmer JJ (1783) Descriptio instrumentorum meteorologicorum, tam eorum, quam Societas dis-
tribuit, quam quibus praeter haec Manheimii utitur. Ephemerides Societatis MeteorologicaePalatinae, Tomus 1:57–90
Jeftic L, Milliman DJ, Sestini G (1992) Climatic change and the Mediterranean. Edward Arnold,London
Jones PD, Mann ME (2004) Climate over past millennia. Rev Geophys 42:RG2002, doi:10.1029/2003RG000143
Jurin J (1723) Invitatio ad observationes Meteorologicas communi consilio instituendas a JacoboJurin M.D. Soc Reg Secr et Colleg Med Lond Socio Philos Trans 379:422–427
Legrand JP, Le Goff M (1992) Les observations météorologiques de Louis Morin. Monographie n◦6,Météorologie Nationale, Paris
Le Roy Ladurie E (1971) Times of feast, times of famine: a history of climate since the year 1000.Doubleday, Garden City, N.Y., 426 pp
Le Treut H, Somerville R, Cubasch U, Ding Y, Mauritzen C, Mokssit A, Peterson T, Prather M(2007) Historical overview of climate change. In: Solomon S, Qin D, Manning M, Chen Z,Marquis M, Averyt KB, Tignor M, Miller HL (eds) Climate change 2007: the physical sciencebasis. Contribution of working group I to the fourth assessment report of the intergovernmentalpanel on climate change. Cambridge University Press, Cambridge, pp 93–127
Lionello P, Malanotte-Rizzoli P, Boscolo R (2006) The Mediterranean climate: an overview of themain characteristics and issues. Elsevier, Amsterdam
Luterbacher J, Dietrich D, Xoplaki E, Grosjean M, Wanner H (2004) European seasonal and annualtemperature variability, trends, and extremes since 1500. Science 303:1499–1503
Luterbacher J, Xoplaki E, Casty C, Wanner H, Pauling A, Kuettel M, Rutishauser T, BroennimannS, Fischer E, Fleitmann D, Gonzalez-Rouco JF, Garcìa-Herrera R, Barriendos M, RodrigoFS, Gonzalez-Hidalgo JC, Saz MA, Gimeno L, Ribera P, Brunet M, Paeth H, Rimbu N, FelisT, Jacobeit J, Duenkeloh A, Zorita E, Guiot J, Turkes M, Alcoforado MJ, Trigo R, Wheeler D,Tett SFB, Mann ME, Touchan R, Shindell DT, Silenzi S, Montagna P, Camuffo D, Mariotti A,Nanni T, Brunetti M, Maugeri M, Zerefos C, De Zolt S, Lionello P, Nunes MF, Rath V, BeltramiH, Garnier E, Le Roy Ladurie E (2006) Mediterranean climate variability over the last centuries:a review. In: Lionello P, Malanotte-Rizzoli P, Boscolo R (eds) The Mediterranean climate: anoverview of the main characteristics and issues. Elsevier, Amsterdam
Author's personal copy

198 Climatic Change (2010) 101:169–199
Luterbacher J, Koenig SJ, Franke J, van der Schrier G, Della-Marta PM, Jacobeit J, Küttel M,Gonzales-Rouco FJ, Zorita E, Xoplaki E, Stössel M, Rutishauer T, Wanner H, Pfister C, BrázdilR, Dobrovolný P, Camuffo D, Bertolin C, Moberg A, Leijonhufvud V, Soderberg J, Allan R,Wilson R, Wheeler D, Barriendos M, Glaser R, Riemann D, Nordli O, Limanówka D, vanEngelen A, Zerefos CS (2009) Circulation dynamics and its influence on European and Mediter-ranean winter climate over the past half millennium: results and insights from instrumental data,documentary evidence and coupled climate models. Clim Change. doi:10.1007/s10584-009-9782-0
Magalotti L (1667) Saggi di naturali esperienze fatte nell’Accademia del Cimento. Nuova stamperiadi Gio. Filippo Cecchi, Florence
Maheras P, Alcoforado MJ, Guika S (1994) Les saisons, les années et les périodes sèches et humidesau Portugal durant la dernière période séculaire. Publ Assoc Intern Climatol 6:191–199
Maheras P, Alcoforado MJ, Guika S, Vafiadis M (1995) Relations entre les périodes sèches ethumides et les indices de circulation au Portugal, durant le dernière période séculaire. Publ AssocIntern Climatol 7:241–248
Maracchi GP (1991) A brief history of meteorology in Florence from the beginnings to the present.CIESIA-IATA, Florence
Maraldi M (1732) Observations Météorologiques faites pendant l’année 1732. Histoire del’Académie Royale des Sciences 1732:494–497
Maugeri M, Buffoni L, Delmonte B, Fassina A (2002) Daily Milan temperature and pressure series(1763–1998): Completing and homogenising the data. Clim Change 53:119–149
Micela G, Granata L, Iuliano V (2001) Due secoli di Pioggia a Palermo. Osservatorio Astronomicodi Palermo. G.S. Vaiana and University of Palermo, Palermo
Middleton KWE (1966) A history of the thermometer and its use in meteorology. Hopkins,Baltimore
Moberg A, Alexandersson H (1997a) Homogenization of Swedish temperature data. Part I: homo-geneity test for linear trends. Int J Climatol 17:25-34
Moberg A, Alexandersson H (1997b) Homogenization of Swedish temperature data. Part II: homog-enized gridded air temperature compared with a subset of global gridded air temperature since1861. Int J Climatol 17:35–54
Oñate JJ, Pou A (1996) Temperature variations in Spain since 1901: a preliminary analysis. Int JClimatol 16:805–815
Pfister C (1992) Monthly temperature and precipitation in central Europe 1525–1979: quantifyingdocumentary evidence on weather and its effects. In: Bradley RS, Jones PD (eds) Climate sinceAD 1500. Routledge, London, pp 118–142
Pfister C, Luterbacher J, Schwarz-Zanetti G, Wegmann M (1998) Winter air temperature variationsin western Europe during the early and high middle ages (AD 750–1300). Holocene 8:535–552
Pfister C, Brázdil R, Glaser R, Barriendos M, Camuffo D, Deutsch M, Dobrovolný P, Enzi S,Guidoboni E, Kotyza O, Militzer S, Racz L, Rodrigo FS (1999) Documentary evidence onclimate in the sixteenth-century Europe. Clim Change 43(1):55–110
Piervitali E, Colacino M (2001) Evidence of drought in western Sicily during the period 1565– 1915from liturgical offices. Clim Change 49:225–238
Poleni G (1740) Ioannis Poleni ad nobilissimum virum comitem Alexandrum de Pompeiis patriciumveronensem Epistola, qua nonnullae observationes astronomicae et meteorologicae continentur.Commentaria Academiae Scientificae Petropolitanae VIII:439–452
Reiter ER (1975) Weather Phenomena of the Mediterranean Basin. EPRFNPS, MontereyRepapis CC, Philandras CM (1988) A note on the air temperature trends of the last 100 years as
evidenced in the eastern Mediterranean time series. Theor Appl Climatol 39:93–97Repapis CC, Philandras CM, Kalabokas PD, Zanis P, Zerefos CS (2007) Is the last years abrupt
warming in the national observatory of Athens records a climate change manifestation? GlobalNEST J 9(2):107–116
Rodrigo FS (2002) Changes in climate variability and seasonal rainfall extremes: a case study fromSan Fernando (Spain), 1821–2000. Theor Appl Climatol 72:193–207
Slonosky V (2002) Wet winters, dry summers? Three centuries of precipitation data from Paris.Geophys Res Lett 29:1895–1898
Taborda JP, Alcoforado MJ, Garcia JC (2004) O Clima no Sul de Portugal no século XVIII.Reconstituição a partir de fontes descritivas e instrumentais. Geo-Ecologia, 2, Centro de EstudosGeográficos, Lisbon
Tank AK (2007) “EUMETNET/ECSN optional programme ‘European Climate Assessment &Dataset (ECA&D)”Algorithm Theoretical Basis Document (ATBD) KNMI Royal NetherlandsMeteorological Institute (http://eca.knmi.nl/dailydata/datadictionaryhomogeneity.php)
Author's personal copy

Climatic Change (2010) 101:169–199 199
Targioni Tozzetti G (1780) Notizie degli aggrandimenti delle Scienze Fisiche accaduti in Toscana nelcorso di anni LX del secolo XVII. Tomo I. Bouchard, Florence
Telelis I (2004) Meteorological Phaenomena and the Climate in Bysantium. 2 volumes (in Greek,summary in English). Athens Academy, Athens
Telelis I (2008) Climatic fluctuations in the eastern Mediterranean and the middle east AD 300–1500 from byzantine documentary and proxy physical paleoclimatic evidence—a comparison.Jahrbuch der Österreichischen Byzantinistik 58:167–208. doi:10.1553/joeb58
Toaldo G (1781) Saggio Meteorologico della vera influenza degli Astri, delle Stagioni e mutazioni diTempo. Manfrè, 2nd edn. Stamperia del Seminario, Padua
UK Meteorological Office (1962) Weather in the Mediterranean. Her Majesty Stationery Office,London
Vittori O, Mestitz A (1981) Calibration of the Florentine little thermometer. Endeavour 5(3):113–118
Xoplaki E (2002) Climate variability over the Mediterranean. Ph.D. thesis, University of Bern,Switzerland. http://sinus.unibe.ch/klimet/docs/phd_xoplaki.pdf
Xoplaki E, Maheras P, Luterbacher J (2001) Variability of climate in meridional Balkans during theperiods 1675–1715 and 1780–1830 and its impact on human life. Clim Change 48:581–615
Xoplaki E, Gonzalez-Rouco FJ, Luterbacher J, Wanner H (2003) Mediterranean summer air tem-perature variability and its connection to the large-scale atmospheric circulation and SSTs. ClimDyn 20:723–739
Xoplaki E, Gonzalez-Rouco JF, Luterbacher J, Wanner H (2004) Wet season Mediterranean precip-itation variability: influence of large-scale dynamics and trends. Clim Dyn 23:63–78
Wallén CC (ed) (1970) Climates of northern and Western Europe. Elsevier, AmsterdamWallén CC (ed) (1977) Climates of central and Southern Europe. Elsevier, AmsterdamWei AM (1990) Time series analysis. Addison-Wesley, Redwood City
Author's personal copy