Dynamics of the temperature-humidity index in the Mediterranean basin
11
ORIGINAL PAPER Dynamics of the temperature-humidity index in the Mediterranean basin Maria Segnalini & Alessandro Nardone & Umberto Bernabucci & Andrea Vitali & Bruno Ronchi & Nicola Lacetera Received: 28 January 2010 / Revised: 29 March 2010 / Accepted: 5 May 2010 / Published online: 4 June 2010 # ISB 2010 Abstract The study was aimed at describing the temper- ature humidity index (THI) dynamics over the Mediterra- nean basin for the period 1951–2007. The THI combines temperature and humidity into a single value, and may help to predict the effects of environmental warmth in farm animals. In particular, on the basis of THI values, numerous studies have been performed to establish thresholds for heat stress in dairy cows. The THI was calculated by using monthly mean values of temperature and humidity obtained from the National Center for Environmental Prediction/ National Center for Atmospheric Research reanalysis project. The analysis demonstrated a high degree of heterogeneity of THI patterns over the Mediterranean basin, a strong north–south gradient, and an overall warming during the study period, which was particularly marked during summer seasons. Results indicated that several areas of the basin present summer THI values which were unfavorable to cow welfare and productivity, and that risk of heat stress for cows is generally greater in the countries of the south coast of the basin. Furthermore, THI data from the summer 2003 revealed that severe positive anomalies may impact areas normally characterized by a favorable climate for animal production. In conclusion, THI dynamics should be taken into careful consideration by farmers and policy makers operating in Mediterranean countries when planning investments in the sector of animal production. The investments should at least partially be directed towards implementation of adaptation measures, which may help to alleviate the impact of hot on farm animals welfare, performance and health. Keywords Mediterranean basin . Temperature humidity index . Dynamics . Cattle Introduction Weather and climate may exert negative effects on farm animal welfare, performance and health (Nardone et al. 2006). Previous studies described the complexity of heat exchanges between animals and the environment, which involve heat production, storage and dissipation, and are dependent on both biological and physical factors (Hahn et al. 2003; Nienaber and Hahn 2007). Evaluation of air temperature alone does not permit an accurate assessment of the effects of the thermal environment on physiology, welfare, health, and productivity in farm animals. For instance, high humidity in combination with high temper- atures reduces the potential for evaporative heat loss (West 2003), solar radiation adds heat to that deriving from metabolic processes, and strong winds, especially in combination with precipitation, amplify the adverse effects of cold temperature (Gaughan et al. 2008). Different approaches have been used to quantify heat stress in farm animals (Hahn et al. 2003). These include utilization of the temperature humidity index (THI), which was originally developed by Thom (1958) as a “discomfort index“ to estimate the levels of discomfort for human beings during summer months. Afterwards, Berry et al. (1964) extended its use to bovine species. Hahn et al. (2003) indicated that, compared to other indexes, the THI is M. Segnalini : A. Nardone : U. Bernabucci : A. Vitali : B. Ronchi : N. Lacetera Dipartimento di Produzioni Animali, Università della Tuscia, Viterbo, Italy N. Lacetera (*) Via San Camillo De Lellis, 01100 Viterbo, Italy e-mail: [email protected] Int J Biometeorol (2011) 55:253–263 DOI 10.1007/s00484-010-0331-3
Transcript of Dynamics of the temperature-humidity index in the Mediterranean basin

ORIGINAL PAPER
Dynamics of the temperature-humidity indexin the Mediterranean basin
Maria Segnalini & Alessandro Nardone &
Umberto Bernabucci & Andrea Vitali & Bruno Ronchi &Nicola Lacetera
Received: 28 January 2010 /Revised: 29 March 2010 /Accepted: 5 May 2010 /Published online: 4 June 2010# ISB 2010
Abstract The study was aimed at describing the temper-ature humidity index (THI) dynamics over the Mediterra-nean basin for the period 1951–2007. The THI combinestemperature and humidity into a single value, and may helpto predict the effects of environmental warmth in farmanimals. In particular, on the basis of THI values, numerousstudies have been performed to establish thresholds for heatstress in dairy cows. The THI was calculated by usingmonthly mean values of temperature and humidity obtainedfrom the National Center for Environmental Prediction/National Center for Atmospheric Research reanalysisproject. The analysis demonstrated a high degree ofheterogeneity of THI patterns over the Mediterranean basin,a strong north–south gradient, and an overall warmingduring the study period, which was particularly markedduring summer seasons. Results indicated that several areasof the basin present summer THI values which wereunfavorable to cow welfare and productivity, and that riskof heat stress for cows is generally greater in the countriesof the south coast of the basin. Furthermore, THI data fromthe summer 2003 revealed that severe positive anomaliesmay impact areas normally characterized by a favorableclimate for animal production. In conclusion, THI dynamicsshould be taken into careful consideration by farmers andpolicy makers operating in Mediterranean countries whenplanning investments in the sector of animal production.
The investments should at least partially be directedtowards implementation of adaptation measures, whichmay help to alleviate the impact of hot on farm animalswelfare, performance and health.
Keywords Mediterranean basin . Temperature humidityindex . Dynamics . Cattle
Introduction
Weather and climate may exert negative effects on farmanimal welfare, performance and health (Nardone et al.2006). Previous studies described the complexity of heatexchanges between animals and the environment, whichinvolve heat production, storage and dissipation, and aredependent on both biological and physical factors (Hahn etal. 2003; Nienaber and Hahn 2007). Evaluation of airtemperature alone does not permit an accurate assessmentof the effects of the thermal environment on physiology,welfare, health, and productivity in farm animals. Forinstance, high humidity in combination with high temper-atures reduces the potential for evaporative heat loss (West2003), solar radiation adds heat to that deriving frommetabolic processes, and strong winds, especially incombination with precipitation, amplify the adverse effectsof cold temperature (Gaughan et al. 2008).
Different approaches have been used to quantify heatstress in farm animals (Hahn et al. 2003). These includeutilization of the temperature humidity index (THI), whichwas originally developed by Thom (1958) as a “discomfortindex“ to estimate the levels of discomfort for humanbeings during summer months. Afterwards, Berry et al.(1964) extended its use to bovine species. Hahn et al.(2003) indicated that, compared to other indexes, the THI is
M. Segnalini :A. Nardone :U. Bernabucci :A. Vitali :B. Ronchi :N. LaceteraDipartimento di Produzioni Animali, Università della Tuscia,Viterbo, Italy
N. Lacetera (*)Via San Camillo De Lellis,01100 Viterbo, Italye-mail: [email protected]
Int J Biometeorol (2011) 55:253–263DOI 10.1007/s00484-010-0331-3

a practical tool and a standard for many studies andapplications in animal biometeorology. There are a varietyof formulas to calculate THI which differ from each otherin the weight given to the effects of humidity (Bohmanovaet al. 2007). However, in all cases, temperature and humidityare combined in a single value. Several studies suggested thatTHI values may help to predict the effects of environmentalwarmth in farm animals. In particular, on the basis of THIvalues, numerous studies have been performed to establishthresholds for heat stress in dairy cows. Johnson (1980) andBouraoui et al. (2002) reported that milk production in dairycows begins to decline when THI reaches the value of 72 or69, respectively. In a recent study, Vitali et al. (2009)suggested that the risk of death in dairy cows starts toincrease when maximum daily THI is above 80.
The Mediterranean basin covers about 10 M km2 and goesfrom the Atlantic coast of Portugal to the southern part of theCaspian Sea with a core area that stretches over about20° latitude and 46° longitude (Nardone 2000). In biogeog-raphy, the Mediterranean basin refers to the lands around theMediterranean sea that have a Mediterranean climate, withmild, rainy winters and hot, dry summers, which supportcharacteristic Mediterranean forests, woodlands, and shrubvegetation (Köppen 1936). However, it is widely acceptedthat the Mediterranean basin is a highly heterogeneousregion, with a climate characterized by a great diversity offeatures, resulting in a variety of climate types due to itsunique geographic location: a transition zone between thehot and dry African climate regime in the south, and the mildand humid European climate in the north (Pinna 1977).Furthermore, the climate of the Mediterranean basin is alsovery sensitive to meteorological events originating in otherparts of the world, such as the North Atlantic Oscillation(NAO), the Indian monsoon and the dust transported fromthe Sahara to the Atlantic ocean through the Mediterraneanbasin (Holton 1992). In general terms, the basin ischaracterized by contrasting variations in temperature andprecipitation between winter and summer, stemming fromthe descending branch of the Hadley circulation in summerwhile westerlies prevail during the winter season(Bolle 2002).
Climate heterogeneity of the area likely contributes tothe differences between the Mediterranean countries interms of animal production (de Rancourt and Mottet 2006).With regard to bovine species, northern countries, whichbenefit from a more favorable climate, have larger cattleherds than southern countries where the hot climate andpoor grasslands are more suitable to sheep and goatproduction. However, the ongoing population and urbani-zation growth in the southern countries of the basin isconstantly increasing demand for animal products in urbanareas, and thus will certainly strengthen livestock farming,meat and milk industries in these countries.
Previous animal biometeorology studies have utilizedTHI to characterize the region of Córdoba in centralArgentina (De la Casa and Ravelo 2003), and the north-east region of Thailand (Somparn et al. 2004). To the bestof our knowledge, the Mediterranean basin has beencharacterized by focusing the attention on air temperatureand precipitation dynamics (Brunetti et al. 2000; KleinTank and Können 2003; Xoplaki et al. 2004, 2005;Touchan et al. 2005; Scherrer et al. 2006; Pauling andPaeth 2007), whereas no studies have been performed byutilizing THI.
The aim of this study was to describe the THI dynamicsover the Mediterranean basin for a period of timecomprising the years between 1951 and 2007.
Materials and methods
Study area
The Mediterranean basin we refer to is delimited by the28° and 48° North parallels and the 10° West and 40° Eastmeridians, and includes, fully or partially, over 20countries (from the Alpine region in the north to thenorth African countries in the south, from the Iberianpeninsula in the west to the Middle Eastern countries inthe east) (Fig. 1).
Data and methods
The THI was calculated by using monthly mean values oftemperature and humidity (2.5° x 2.5° latitude–longituderesolution), which were obtained from the National Centerfor Environmental Prediction (NCEP)/National Center forAtmospheric Research reanalysis project (Kalnay et al.1996) at the National Oceanic & Atmospheric Administra-tion (NOAA)/Earth System Research Laboratory (ESRL),
Fig. 1 Study area. The Mediterranean basin is delimited by the 28°and 48° North parallels and the 10° West and 40° East meridians
254 Int J Biometeorol (2011) 55:253–263
Physical Sciences Division (PSD) for the period 1951–2007. NCEP Reanalysis data were provided by the NOAA/ESRL PSD (Boulder, Colorado, USA) from their Web siteat http://www.esrl.noaa.gov/psd/. Briefly, the reanalysisdatasets are made available after executing three standardquality control: a "duplicate station check", which elimi-nates duplicates and key punch errors from reports, a"buddy check", which eliminates extreme values, and astandard deviation check, which compares the daily dataagainst a gridded daily climatology.
Calculation of THI may be carried out by differentformulas, which permit the establishment of the watervapour content of the air starting alternatively from wetbulb temperature, dew point temperature, or relativehumidity (Bohmanova et al. 2007). Among these variables,the only one available for the study area was the relativehumidity. For this reason, we calculated monthly meanvalues of THI by the following formula, which is based onvalues of ambient temperature (AT, °C) and relativehumidity (RH, %) (NOAA 1976):
THI ¼ 1:8 � ATþ 32ð Þ � 0:55� 0:55 � RHð Þ� 1:8 � ATþ 32ð Þ � 58½ �
With respect to the original one, this formula includesterms (1.8 × AT+32), which convert temperature data from°C to °F. Such a conversion was made because most ofliterature data reported the THI calculated by measuringambient temperature in a °F scale. The same formula hasbeen already utilized for THI calculation in Mediterraneancountries (Bouraoui et al. 2002; Vitali et al. 2009).Furthermore, Bohmanova et al. (2007) indicated thisformula as the one to be preferred for calculation of THIin regions with a subtropical climate, whereas otherformulas should be utilized for geographic areas with aridclimate. A body of literature has described the Mediterra-nean climate as subtropical (Troll and Paffen 1964;Griffiths 1976; Trewartha and Horn 1980).
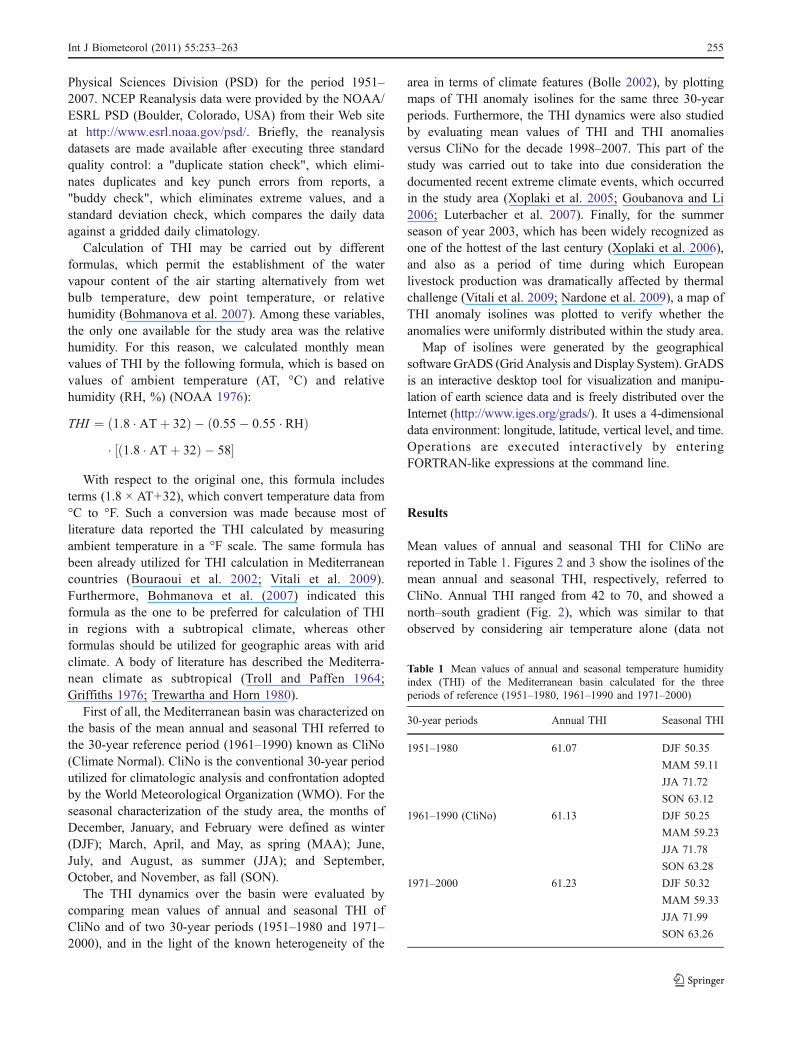
First of all, the Mediterranean basin was characterized onthe basis of the mean annual and seasonal THI referred tothe 30-year reference period (1961–1990) known as CliNo(Climate Normal). CliNo is the conventional 30-year periodutilized for climatologic analysis and confrontation adoptedby the World Meteorological Organization (WMO). For theseasonal characterization of the study area, the months ofDecember, January, and February were defined as winter(DJF); March, April, and May, as spring (MAA); June,July, and August, as summer (JJA); and September,October, and November, as fall (SON).
The THI dynamics over the basin were evaluated bycomparing mean values of annual and seasonal THI ofCliNo and of two 30-year periods (1951–1980 and 1971–2000), and in the light of the known heterogeneity of the
area in terms of climate features (Bolle 2002), by plottingmaps of THI anomaly isolines for the same three 30-yearperiods. Furthermore, the THI dynamics were also studiedby evaluating mean values of THI and THI anomaliesversus CliNo for the decade 1998–2007. This part of thestudy was carried out to take into due consideration thedocumented recent extreme climate events, which occurredin the study area (Xoplaki et al. 2005; Goubanova and Li2006; Luterbacher et al. 2007). Finally, for the summerseason of year 2003, which has been widely recognized asone of the hottest of the last century (Xoplaki et al. 2006),and also as a period of time during which Europeanlivestock production was dramatically affected by thermalchallenge (Vitali et al. 2009; Nardone et al. 2009), a map ofTHI anomaly isolines was plotted to verify whether theanomalies were uniformly distributed within the study area.
Map of isolines were generated by the geographicalsoftware GrADS (Grid Analysis and Display System). GrADSis an interactive desktop tool for visualization and manipu-lation of earth science data and is freely distributed over theInternet (http://www.iges.org/grads/). It uses a 4-dimensionaldata environment: longitude, latitude, vertical level, and time.Operations are executed interactively by enteringFORTRAN-like expressions at the command line.
Results
Mean values of annual and seasonal THI for CliNo arereported in Table 1. Figures 2 and 3 show the isolines of themean annual and seasonal THI, respectively, referred toCliNo. Annual THI ranged from 42 to 70, and showed anorth–south gradient (Fig. 2), which was similar to thatobserved by considering air temperature alone (data not
Table 1 Mean values of annual and seasonal temperature humidityindex (THI) of the Mediterranean basin calculated for the threeperiods of reference (1951–1980, 1961–1990 and 1971–2000)
30-year periods Annual THI Seasonal THI
1951–1980 61.07 DJF 50.35
MAM 59.11
JJA 71.72
SON 63.12
1961–1990 (CliNo) 61.13 DJF 50.25
MAM 59.23
JJA 71.78
SON 63.28
1971–2000 61.23 DJF 50.32
MAM 59.33
JJA 71.99
SON 63.26
Int J Biometeorol (2011) 55:253–263 255
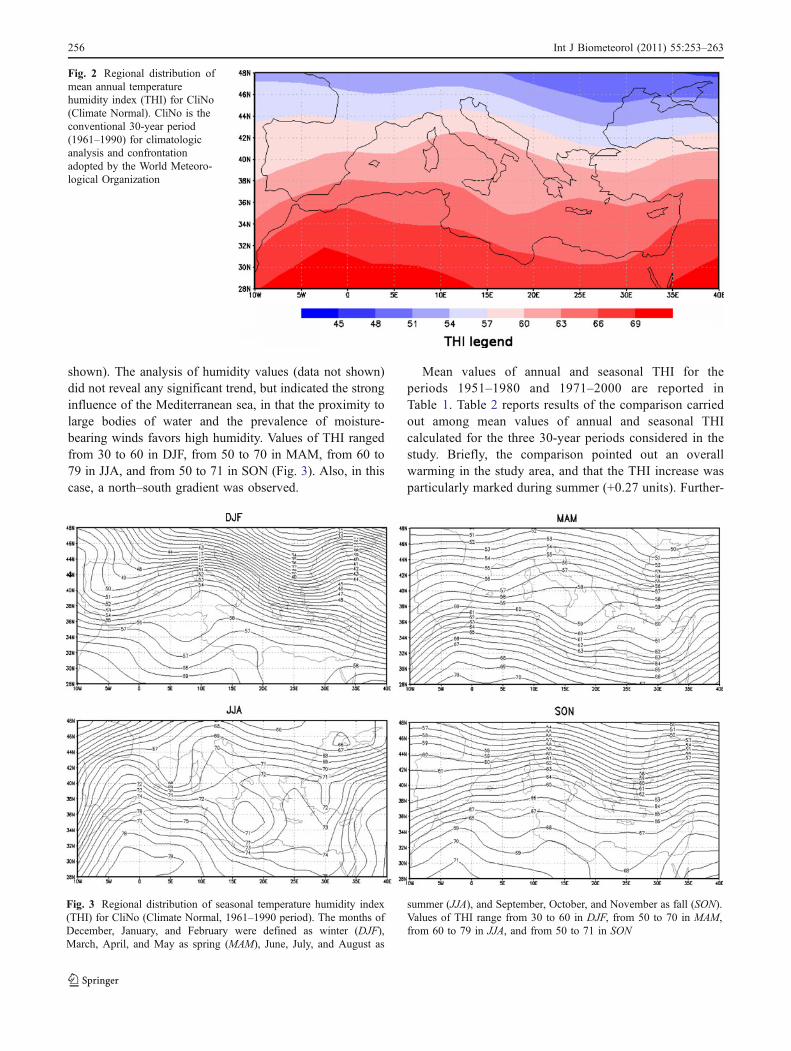
shown). The analysis of humidity values (data not shown)did not reveal any significant trend, but indicated the stronginfluence of the Mediterranean sea, in that the proximity tolarge bodies of water and the prevalence of moisture-bearing winds favors high humidity. Values of THI rangedfrom 30 to 60 in DJF, from 50 to 70 in MAM, from 60 to79 in JJA, and from 50 to 71 in SON (Fig. 3). Also, in thiscase, a north–south gradient was observed.
Mean values of annual and seasonal THI for theperiods 1951–1980 and 1971–2000 are reported inTable 1. Table 2 reports results of the comparison carriedout among mean values of annual and seasonal THIcalculated for the three 30-year periods considered in thestudy. Briefly, the comparison pointed out an overallwarming in the study area, and that the THI increase wasparticularly marked during summer (+0.27 units). Further-
Fig. 2 Regional distribution ofmean annual temperaturehumidity index (THI) for CliNo(Climate Normal). CliNo is theconventional 30-year period(1961–1990) for climatologicanalysis and confrontationadopted by the World Meteoro-logical Organization
Fig. 3 Regional distribution of seasonal temperature humidity index(THI) for CliNo (Climate Normal, 1961–1990 period). The months ofDecember, January, and February were defined as winter (DJF),March, April, and May as spring (MAM), June, July, and August as
summer (JJA), and September, October, and November as fall (SON).Values of THI range from 30 to 60 in DJF, from 50 to 70 in MAM,from 60 to 79 in JJA, and from 50 to 71 in SON
256 Int J Biometeorol (2011) 55:253–263

more, the analysis also indicated that, comparing thewinter seasons, the THI in the basin slightly decreasedduring the study period (−0.03 units).
Figure 4 shows the isolines of annual THI anomaliesversus CliNo for the two 30-year periods different fromCliNo considered in the study (1951–1980 and 1971–2000). Anomalies referred to the period 1951–1980 rangedfrom −0.5 to +0.7 units of THI (Fig. 4a). In detail, theperiod 1951–1980 was colder than CliNo in the central andwest countries of the basin (−0.5 THI units), whereascountries in the east (especially those in the Balkan area)were hotter (+0.7 THI units). Anomalies referred to theperiod 1971–2000 ranged from −0.8 to +0.8 units of THI(Fig. 4b). The greatest negative anomaly (−0.8 THI units)was observed in the south-west part of the area and overeastern Turkey, whereas the greatest positive anomaly (+0.8THI units) characterized the central and north-east area ofthe basin.
Figure 5 shows the isolines of seasonal THI anomaliesversus CliNo for the two 30-year periods different fromCliNo considered in the study (1951–1980 and 1971–2000). The analysis referred to the period 1951–1980(Fig. 5a) demonstrated that for the winter season theanomalies ranged from −0.6 (Iberian Peninsula) to +1.8units of THI (eastern Turkey); for spring, they rangedfrom −0.9 (north-east of the basin) to +0.6 (eastern andnorth-western France); for summer, they ranged from −0.6(central basin, Sicily, and north-western Spain) to +0.6(Balkan area); and for fall, they ranged from −0.9 (westernand central basin) to +0.6 (Balkan area).
The analysis of seasonal anomalies referred to the period1971–2000 (Fig. 5b) pointed out that for the winter seasonthe anomalies ranged from −1.8 (eastern Turkey) to +1.5units of THI (north-east of the basin); for the spring, therange was −0.9 to +0.9 (eastern Turkey and north-east of theBlack Sea, respectively); for summer, the anomalies rangedfrom −0.6 (Spain, Morocco, Algeria, and Libya) to +0.9(north-east of the Black Sea); and for fall, the range was −0.9to +0.6 (northern and Balkan areas, and eastern part of thebasin and Black Sea, respectively).
Table 3 reports the mean values of annual and seasonalTHI for the whole period 1998–2007, and for each singleyear of the decade.
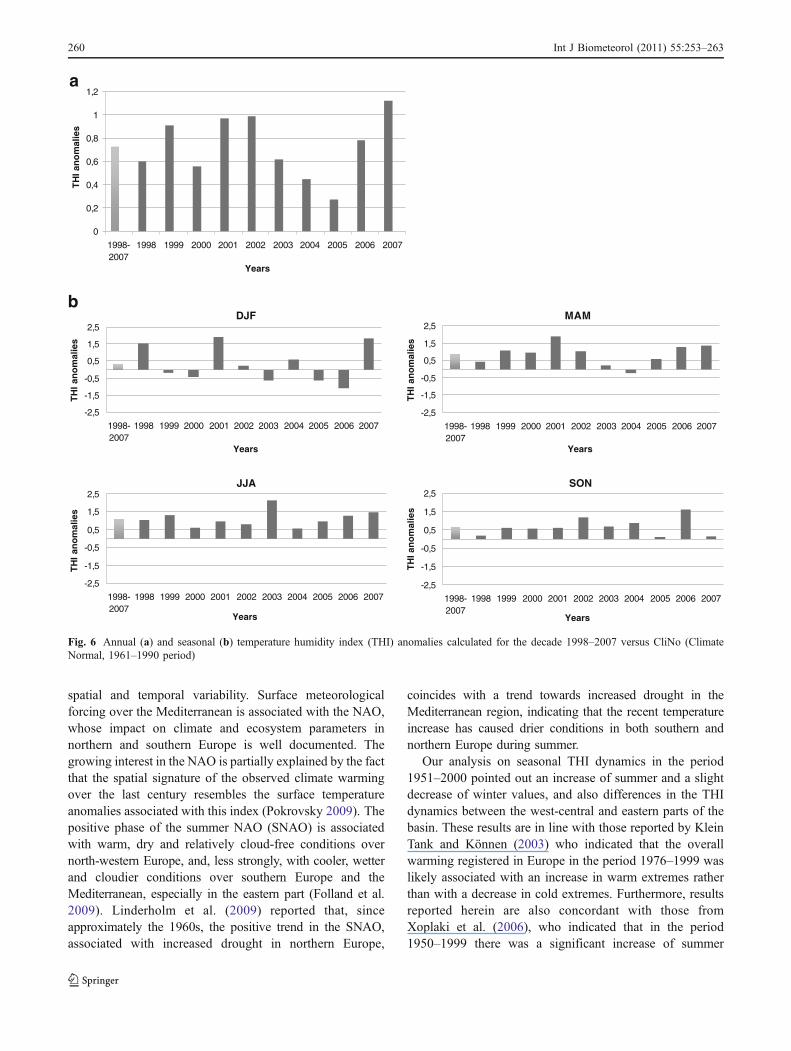
Figure 6 shows the THI anomalies calculated for thedecade 1998–2007 versus CliNo. Value of annual THIanomaly over the decade indicated a general warming in thearea with a positive anomaly respect to CliNo of +0.73(Fig. 6a). On the other hand, a positive annual anomaly wasrecorded for each single year of the decade with the lowestvalue referring to year 2005 (+0.27) and the highest to year2007 (+1.12). The analysis of seasonal anomalies (Fig. 6b)showed that in the winter season the anomalies recordedhave been either positive (years 1998, 2001, 2002, 2004,2007) or negative (years 1999, 2000, 2003, 2005, 2006); inthe spring season, only a negative anomaly was recorded(year 2004, −0.22), whereas for the remaining 9 years of
Table 2 Results of the comparison carried out among mean annualand seasonal temperature humidity index (THI) calculated for thethree periods of reference (1951–1980, 1961–1990 and 1971–2000)
Periods compared Annual Seasonal
1951–1980 vs 1961–1990 (CliNo) −0.06 DJF+0.10
MAM −0.12JJA −0.06SON −0.16
1971–2000 vs 1961–1990 (CliNo) + 0.10 DJF+0.07
MAM+0.10
JJA+0.21
SON −0.021971–2000 vs 1951–1980 + 0.16 DJF −0.03
MAM+0.22
JJA+0.27
SON+0.14
Fig. 4 Isolines of annual temperature humidity index (THI) anomalies versus CliNo (Climate Normal, 1961–1990 period) for the two 30-yearperiods different from CliNo considered in the study (1951–1980, a, and 1971–2000, b)
Int J Biometeorol (2011) 55:253–263 257

Fig. 5 Isolines of seasonal temperature humidity index (THI) anomalies versus CliNo (Climate Normal, 1961–1990 period) for the two 30-yearperiods different from CliNo considered in the study (1951–1980, a, and 1971–2000, b)
258 Int J Biometeorol (2011) 55:253–263

the decade, the anomalies were positive with the maximumvalue recorded in 2001 (+1.9); in the summer season, onlypositive anomalies were recorded and the highest value wasrelative to summer 2003 (+2.14); also, in the fall season,the anomalies were all positive and ranged from +0.13(year 2005) to +1.61 (year 2006).
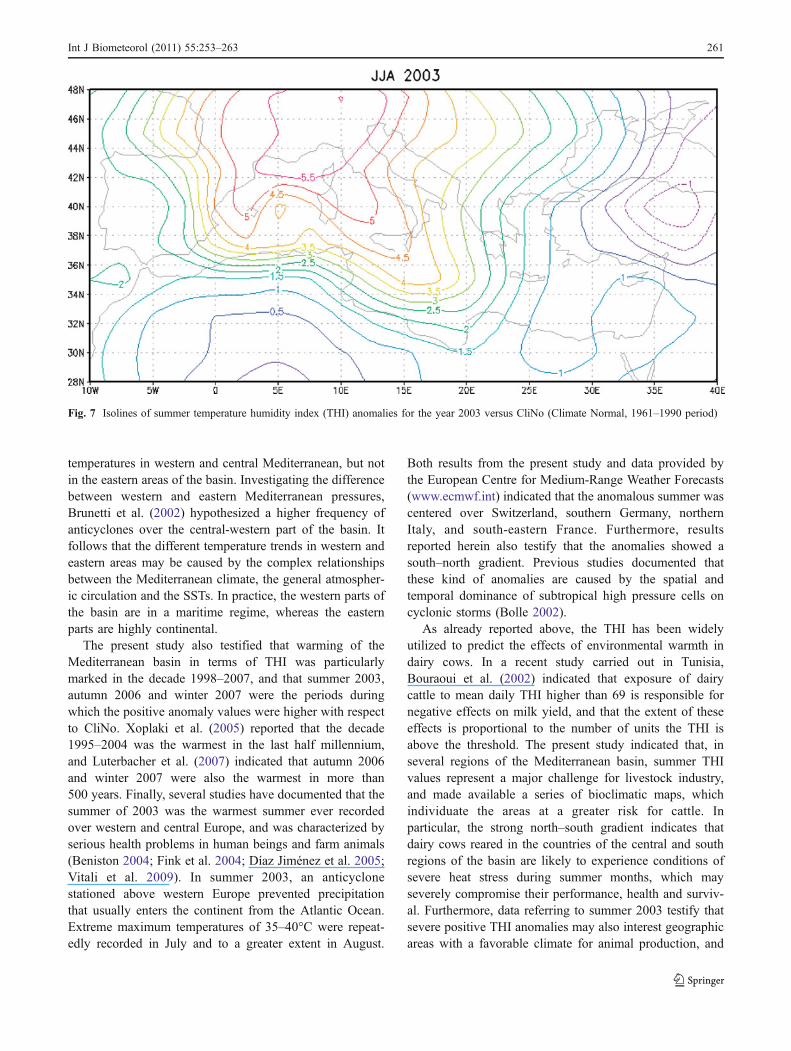
Figure 7 shows the isolines of summer THI anomalies ofyear 2003 versus CliNo. Also, in this case, the study arearevealed a strong heterogeneity: a single negative anomaly(−1) was detected in eastern Turkey, whereas the positiveanomalies showed a very wide range (from +0.5 to +5.5)and a south–north gradient.
Discussion
Results reported herein are in line with those obtained fromprevious studies, which on the basis of climate featuresdifferent from THI indicated that the geographical Medi-terranean domain does not share the Mediterranean climateaccording to its commonly adopted definition (Köppen1936; Bolle 2002). Furthermore, still in agreement withprevious findings referring to temperatures (Klein Tank andKönnen 2003; Xoplaki et al. 2005, 2006; Luterbacher et al.2007), the present study pointed out an overall THI increasein the Mediterranean basin in the period 1951–2007, andalso that the THI dynamics in the study area were notspatially and temporally homogeneous.
First of all, we wish to remark that the general agreementbetween our results with those from previous analysisreferred to temperature is not surprising, because in the THIformulas the weight of temperature is higher than that ofrelative humidity and this happens regardless the formulachosen for calculation (Bohmanova et al. 2007). However,as already explained, characterization of a geographic areain terms of THI permits a more accurate prediction of theeffects of environmental warmth in cattle because this indextakes into account the role of humidity in affecting thepotential for evaporative heat loss from the body.
On the basis of previous observations, climate heteroge-neity of the Mediterranean basin would reflect the presenceof strong mesoscale features, which determine largeclimatic gradients within a region, which would, otherwise,have a much more homogeneous climate. The climaticheterogeneity of the area is likely due to physical andphysico-geographical factors such as the atmosphericcirculation, which in turn alters the storm track, airtemperature, precipitation and pressure distribution, to theAtlantic and Mediterranean sea surface temperatures (SSTs)pattern and distribution, to the land–sea interactions, andalso to the latitude, altitude and orography (Frei and Schär1998). The response of the Mediterranean basin to large-scale climate forcing is very complicated, with strong
Table 3 Mean values of annual and seasonal temperature humidityindex (THI) of the Mediterranean basin calculated for the decade1998–2007
Years Annual THI Seasonal THI
1998–2007 61.86 DJF 50.49
MAM 60.10
JJA 72.89
SON 63.95
1998 61.73 DJF 51.80
MAM 59.66
JJA 72.83
SON 63.46
1999 62.04 DJF 50.05
MAM 60.32
JJA 73.08
SON 63.90
2000 61.69 DJF 49.83
MAM 60.20
JJA 72.40
SON 63.86
2001 62.10 DJF 52.18
MAM 61.13
JJA 72.74
SON 63.90
2002 62.12 DJF 50.48
MAM 60.26
JJA 72.57
SON 64.46
2003 61.75 DJF 49.59
MAM 59.46
JJA 73.92
SON 63.98
2004 61.58 DJF 50.83
MAM 59.01
JJA 72.36
SON 64.16
2005 61.40 DJF 49.62
MAM 59.81
JJA 72.73
SON 63.41
2006 61.91 DJF 49.16
MAM 60.50
JJA 73.04
SON 64.89
2007 62.25 DJF 52.10
MAM 60.59
JJA 73.24
SON 63.45
Int J Biometeorol (2011) 55:253–263 259
spatial and temporal variability. Surface meteorologicalforcing over the Mediterranean is associated with the NAO,whose impact on climate and ecosystem parameters innorthern and southern Europe is well documented. Thegrowing interest in the NAO is partially explained by the factthat the spatial signature of the observed climate warmingover the last century resembles the surface temperatureanomalies associated with this index (Pokrovsky 2009). Thepositive phase of the summer NAO (SNAO) is associatedwith warm, dry and relatively cloud-free conditions overnorth-western Europe, and, less strongly, with cooler, wetterand cloudier conditions over southern Europe and theMediterranean, especially in the eastern part (Folland et al.2009). Linderholm et al. (2009) reported that, sinceapproximately the 1960s, the positive trend in the SNAO,associated with increased drought in northern Europe,
coincides with a trend towards increased drought in theMediterranean region, indicating that the recent temperatureincrease has caused drier conditions in both southern andnorthern Europe during summer.
Our analysis on seasonal THI dynamics in the period1951–2000 pointed out an increase of summer and a slightdecrease of winter values, and also differences in the THIdynamics between the west-central and eastern parts of thebasin. These results are in line with those reported by KleinTank and Können (2003) who indicated that the overallwarming registered in Europe in the period 1976–1999 waslikely associated with an increase in warm extremes ratherthan with a decrease in cold extremes. Furthermore, resultsreported herein are also concordant with those fromXoplaki et al. (2006), who indicated that in the period1950–1999 there was a significant increase of summer
a
0
0,2
0,4
0,6
0,8
1
1,2
1998-2007
1998 1999 2000 2001 2002 2003 2004 2005 2006 2007
Years
TH
I an
om
alie
s
bMAM
-2,5
-1,5
-0,5
0,5
1,5
2,5
1998-2007
1998 1999 2000 2001 2002 2003 2004 2005 2006 2007
Years
TH
I an
om
alie
s
DJF
-2,5
-1,5
-0,5
0,5
1,5
2,5
1998-2007
1998 1999 2000 2001 2002 2003 2004 2005 2006 2007
Years
TH
I an
om
alie
s
JJA
-2,5
-1,5
-0,5
0,5
1,5
2,5
1998-2007
1998 1999 2000 2001 2002 2003 2004 2005 2006 2007
Years
TH
I an
om
alie
s
SON
-2,5
-1,5
-0,5
0,5
1,5
2,5
1998-2007
1998 1999 2000 2001 2002 2003 2004 2005 2006 2007
Years
TH
I an
om
alie
s
Fig. 6 Annual (a) and seasonal (b) temperature humidity index (THI) anomalies calculated for the decade 1998–2007 versus CliNo (ClimateNormal, 1961–1990 period)
260 Int J Biometeorol (2011) 55:253–263
temperatures in western and central Mediterranean, but notin the eastern areas of the basin. Investigating the differencebetween western and eastern Mediterranean pressures,Brunetti et al. (2002) hypothesized a higher frequency ofanticyclones over the central-western part of the basin. Itfollows that the different temperature trends in western andeastern areas may be caused by the complex relationshipsbetween the Mediterranean climate, the general atmospher-ic circulation and the SSTs. In practice, the western parts ofthe basin are in a maritime regime, whereas the easternparts are highly continental.
The present study also testified that warming of theMediterranean basin in terms of THI was particularlymarked in the decade 1998–2007, and that summer 2003,autumn 2006 and winter 2007 were the periods duringwhich the positive anomaly values were higher with respectto CliNo. Xoplaki et al. (2005) reported that the decade1995–2004 was the warmest in the last half millennium,and Luterbacher et al. (2007) indicated that autumn 2006and winter 2007 were also the warmest in more than500 years. Finally, several studies have documented that thesummer of 2003 was the warmest summer ever recordedover western and central Europe, and was characterized byserious health problems in human beings and farm animals(Beniston 2004; Fink et al. 2004; Díaz Jiménez et al. 2005;Vitali et al. 2009). In summer 2003, an anticyclonestationed above western Europe prevented precipitationthat usually enters the continent from the Atlantic Ocean.Extreme maximum temperatures of 35–40°C were repeat-edly recorded in July and to a greater extent in August.
Both results from the present study and data provided bythe European Centre for Medium-Range Weather Forecasts(www.ecmwf.int) indicated that the anomalous summer wascentered over Switzerland, southern Germany, northernItaly, and south-eastern France. Furthermore, resultsreported herein also testify that the anomalies showed asouth–north gradient. Previous studies documented thatthese kind of anomalies are caused by the spatial andtemporal dominance of subtropical high pressure cells oncyclonic storms (Bolle 2002).
As already reported above, the THI has been widelyutilized to predict the effects of environmental warmth indairy cows. In a recent study carried out in Tunisia,Bouraoui et al. (2002) indicated that exposure of dairycattle to mean daily THI higher than 69 is responsible fornegative effects on milk yield, and that the extent of theseeffects is proportional to the number of units the THI isabove the threshold. The present study indicated that, inseveral regions of the Mediterranean basin, summer THIvalues represent a major challenge for livestock industry,and made available a series of bioclimatic maps, whichindividuate the areas at a greater risk for cattle. Inparticular, the strong north–south gradient indicates thatdairy cows reared in the countries of the central and southregions of the basin are likely to experience conditions ofsevere heat stress during summer months, which mayseverely compromise their performance, health and surviv-al. Furthermore, data referring to summer 2003 testify thatsevere positive THI anomalies may also interest geographicareas with a favorable climate for animal production, and
Fig. 7 Isolines of summer temperature humidity index (THI) anomalies for the year 2003 versus CliNo (Climate Normal, 1961–1990 period)
Int J Biometeorol (2011) 55:253–263 261

that therefore may be characterized by a reduced capacity tocope with this kind of extreme climate events.
In conclusion, findings from this study suggest that THIdynamics should be taken into careful consideration byfarmers and policy makers operating in Mediterraneancountries when planning investments in the sector ofanimal production. In particular, in the areas of the basinwhere the THI increase was more pronounced or whichwere shown to be subjected to extreme climate events, theinvestments should at least partially be directed to imple-mentation of adaptation measures, which may help toalleviate the impact of hot extremes on animal welfare,performance and health.
Acknowledgements This study was financially supported by EU(CIRCE Integrated Project # 036961), and Università degli Studidella Tuscia.
References
Beniston M (2004) The 2003 heat wave in Europe: A shape of thingsto come? An analysis based on Swiss climatological data andmodel simulations. Geophys Res Lett 31 L02202. doi:10.1029/2003GL018857
Berry IL, Shanklin MD, Johnson HD (1964) Dairy shelter designbased on milk production decline as affected by temperature andhumidity. Trans Am Soc Agric Eng 7:329–331
Bohmanova J, Misztal I, Cole JB (2007) Temperature-HumidityIndices as indicator of milk production losses due to heat stress.J Dairy Sci 90:1947–1956. doi:10.3168/jds.2006–513
Bolle HJ (2002) Mediterranean climate: Variability and trends.Springer, New York
Bouraoui R, Lahmar M, Majdoub A, Djemali M, Belyea R (2002) Therelationship of temperature-humidity index with milk productionof dairy cows in a Mediterranean climate. Anim Res 51:479–491.doi:10.1051/animres:200236
Brunetti M, Maugeri M, Nanni T (2000) Variations of temperature andprecipitation in Italy from 1866 to 1995. Theor Appl Climatol65:165–174
Brunetti M, Maugeri M, Nanni T (2002) Atmospheric circulation andprecipitation in Italy for the last 50 years. Int J Climatol 22:1455–1471. doi:10.1002/joc.805
De la Casa AC, Ravelo AC (2003) Assessing temperature andhumidity conditions for dairy cattle in Córdoba, Argentina. IntJ Biometeorol 48:6–9. doi:10.1007/s00484-003-0179-x
Díaz Jiménez J, Linares Gil C, García Herrera R (2005) Impact ofextreme temperatures on public health. Rev Esp Salud Pública79:145–157
Fink AH, Brücher T, Krüger A, Leckebusch GC, Pinto JG, Ulbrich U(2004) The 2003 European summer heatwaves and drought-synoptic diagnosis and impacts. Weather 59:209–216
Folland CK, Knight J, Linderholm HW, Fereday D, Ineson S, HurrellJW (2009) The summer North Atlantic oscillation: past, present,and future. J Clim 22:1082–1103
Frei C, Schär C (1998) A precipitation climatology of the Alpsfrom high-resolution rain-gauge observations. Int J Climatol18:873–900
Gaughan JB, Mader TL, Holt SM, Lisle A (2008) A new heatload index for feedlot cattle. J Anim Sci 86:226–234.doi:10.2527/jas.2007-0305
Goubanova K, Li L (2006) Extremes in temperature and precipitationaround the Mediterranean basin in an ensembles of future climatescenario simulations. Glob Planet Chang 57:27–42. doi:10.1016/j.gloplacha.2006.11.012
Griffiths JF (1976) Applied climatology. Oxford University Press,London
Hahn GL, Mader TL, Eigenberg RA (2003) Perspective on develop-ment of thermal indices for animal studies and management.EAAP Technic Ser 7:31–44
Holton JR (1992) An Introduction to dynamic meteorology. Academic,San Diego
Johnson HD (1980) Environmental management of cattle to minimizethe stress of climatic change. Int J Biometeorol 24:65–78
Klein Tank AMG, Können GP (2003) Trends in indices of dailytemperature and precipitation extremes in Europe, 1946–99. JClim 16:3665–3680
Kalnay et al (1996) The NCEP/NCAR 40-year reanalysis project. BullAm Meteorol Soc 77:437–470
Köppen W (1936) Das geographische aystem der klimate. In: KöppenW, Geiger R (eds) Handbuch der Klimatologie, Bd 1. GebrBorntröger, Berlin, pp C1-C44
Linderholm HW, Folland CK, Walther A (2009) A multicenturyperspective on the summer North Atlantic oscillation (SNAO)and drought in the Eastern Atlantic region. J Quat Sci 24:415–425. doi:10.1002/jqs.1261
Luterbacher J, Liniger MA, Menzel A, Estrella N, Della-Marta PM,Pfister C, Rutishauser T, Xoplaki E (2007) ExceptionalEuropean warmth of autumn 2006 and winter 2007: Historicalcontext, the underlying dynamics, and its phonologicalimpacts. Geophys Res Lett 34 L12704. doi:10.1029/2007GL029951
Nardone A, (2000) Weather condition and genetics of breedingsystems in the Mediterranean area. Proc XXXV Int Symp ItSoc Progr Zootec. Ragusa, Italy, pp 67–91
Nardone A, Ronchi B, Lacetera N, Bernabucci U (2006) Climateeffects on productive traits in livestock. Vet Res Commun 30(1):75–81. doi:10.1007/s11259-006-0016-x
Nardone A, Ronchi B, Lacetera N, Ranieri MS, Bernabucci U (2009)Effects of climate change on animal production and sustainabilityof livestock system. Livestock Sci 130:57–69
Nienaber JA, Hahn GL (2007) Livestock production system manage-ment responses to thermal challenges. Int J Biometeorol 52:149–157. doi:10.1007/s00484-007-0103-x
NOAA (1976) Livestock hot weather stress. Oper Man Lett C-31-76,Kansas City, MO
Pauling A, Paeth H (2007) On the variability of return periods ofEuropean winter precipitation extremes over the last threecenturies. Clim Past 3:65–76
Pinna M (1977) Climatologia. UTET, TorinoPokrovsky OM (2009) European rain rate modulation enhanced by
changes in the NAO and atmospheric circulation regimes.Comput Geosci 35:897–906. doi:10.1016/j.cageo.2007.12.005
de Rancourt M, Mottet A (2006) Mediterranean animal production:development or decline? Options Méditerr 78:13–22
Scherrer SC, Appenzeller C, Liniger MA (2006) Temperature trend inSwitzerland and Europe: implication for Climate Normal. Int JClimatol 26:565–580. doi:10.1002/joc.1270
Somparn P, Gibb MJ, Markvichitr K, Chaiyabutr N, Thummabood S,Vajrabukka C (2004) Analysis of climatic risk for cattle andbuffalo production in northeast Thailand. Int J Biometeorol49:59–64. doi:10.1007/s00484-004-0206-6
Thom EC (1958) Cooling degrees: day air-conditioning, heating andventilating. Trans Am Soc Heat 55:65–69
Touchan R, Xoplaki E, Funkhouser G, Luterbacher J, Hughes MK,Erkan N, Akkemik Ü, Stephan J (2005) Reconstructions ofspring/summer precipitation for the Eastern Mediterranean from
262 Int J Biometeorol (2011) 55:253–263
tree-ring widths and its connection to large-scale atmosphericcirculation. Clim Dyn 25:75–98
Trewartha GT, Horn LH (1980) An Introduction to climate. McGraw-Hill, New York
Troll C, Paffen KH (1964) Karte der Jahreszeiten klimate der Erde.Erdkunde 18:5–28
Vitali A, Segnalini M, Bertocchi L, Bernabucci U, Nardone A,Lacetera N (2009) Seasonal pattern of mortality and relationshipsbetween mortality and temperature humidity index in dairy cows.J Dairy Sci 92:3781–3790. doi:10.3168/jds.2009.2127
West JW (2003) Effects of heat-stress on production in dairy cattle. JDairy Sci 86:2131–2144
Xoplaki E, González-Rouco JF, Luterbacher J, Wanner H (2004) Wetseason Mediterranean precipitation variability: influence of large-scale dynamics and trends. Clim Dyn 23:63–78. doi:10.1007/s00382-004-0422-0
Xoplaki E, Luterbacher J, Paeth H, Dietrich D, Steiner N, Grosjean M,Wanner H (2005) European spring and autumn temperaturevariability and change of extremes over the last half millennium.Geophys Res Lett 32:15713. doi:10.1029/2005GL023424
Xoplaki E, Luterbacher J, González-Rouco JF (2006) Mediterraneansummer temperature and winter precipitation, large-scale dynam-ics, trends. Il Nuovo Cimento C 29(1):45–54. doi:10.1393/ncc/i2005-10220-4
Int J Biometeorol (2011) 55:253–263 263