ENOVIA MatrixOne 10.8 accelerates innovation by enabling ...
Upload
independentCategory
view
0download
0
A r t i c l e s
1456 VOLUME 17 | NUMBER 11 | NOVEMBER 2011 nAture medicine
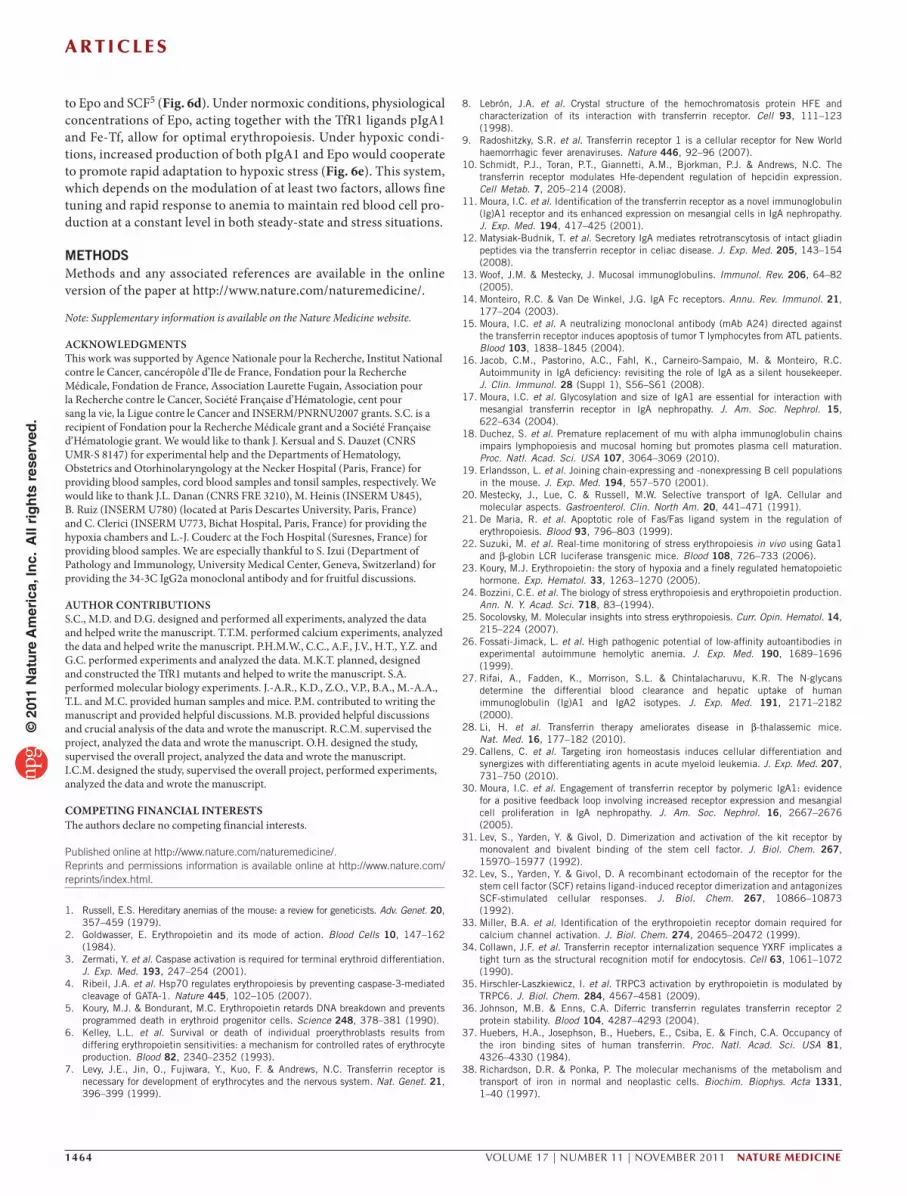
Erythropoiesis relies on the commitment of hematopoietic stem cells to erythroid progenitors and precursors. Stem cell factor (SCF) and Epo are required for the proliferation and survival of erythroid cells1. Epo is crucial to the end stage of erythropoiesis in that it allows terminal differ-entiation2, which is dependent on caspase-3 activation3. In the absence of Epo, late erythroblasts undergo apoptosis following the cleavage of the GATA-1 transcription factor by caspase-3. During differentiation, Epo allows HSP70 to remain associated with GATA-1 in the nucleus, thereby protecting the latter from caspase-3 cleavage4.
The amount of circulating Epo is suboptimal, and only a fraction of bone marrow progenitors survives to undergo terminal erythroid differentiation5. Therefore, the capacity of erythroblasts to survive in the bone marrow depends on their sensitivity to Epo6. However, the factors modulating responses to Epo during homeostatic and stress erythropoiesis remain unknown.
Another feature of erythroid precursors is their absolute require-ment for iron to support hemoglobin production. TfR1 (also known as
CD71) is essential for erythropoiesis7, and investigation of TfR1 func-tion has focused on its established role in iron metabolism. However, recent data have shown that TfR1 is a multiligand receptor that par-ticipates in a wide array of cellular functions8–10. We identified TfR1 as a receptor for A1 isotype immunoglobulins (IgA1)11. IgA1 binding to TfR1 depends on both the size and the glycosylation of IgA1 and has a pivotal role in IgA nephropathy and celiac disease11,12.
Bone marrow is the main site of serum IgA synthesis. IgAs are unique among immunoglobulins because of their heterogeneity. IgAs exist in two subclasses (termed IgA1 and IgA2), and each subclass is present in two different molecular forms, monomers and poly-mers, that coexist in constant proportions in various body fluids13. In humans (unlike other species such as mouse), circulating IgA is almost completely monomeric: approximately 90% of circulating IgA1 is monomeric, and the remaining 10% is polymeric14. IgA polymers are covalently associated with a cysteine-rich polypeptide called the joining chain.
1Centre National de la Recherche Scientifique (CNRS) Unité Mixte Recherche (UMR) 8147, Université Paris Descartes, Faculté de Médecine, Hôpital Necker, Paris, France. 2Institut National de la Santé et de la Recherche Médicale (INSERM) U699, Paris, France. 3Faculté de Médecine and Université Denis Diderot Paris VII, Paris, France. 4Clinique Geoffroy Saint-Hilaire, Paris, France. 5Université de Limoges, CNRS UMR 6101, Limoges, France. 6Service d’Immuno-Hématologie, Faculté de Médecine and Université Denis Diderot Paris VII, Assistance Publique-Hôpitaux de Paris, Hôpital Saint Louis, Paris, France. 7Laboratoire EA3963, Faculté de Médecine and Université Denis Diderot Paris VII, Assistance Publique-Hôpitaux de Paris, Hôpital Saint Louis, Paris, France. 8INSERM U1013, Université Paris Descartes, Faculté de Médecine, Hôpital Necker, Paris, France. 9Laboratoire d’Immunologie Biologique, Assistance Publique-Hôpitaux de Paris, Hôpital Necker, Paris, France. 10Institut Cochin, Département d’Hématologie, Paris, France. 11INSERM U567, Paris, France. 12CNRS UMR 8104, Université Paris Descartes, Faculté de Médecine, Paris, France. 13Immunology Group, Lund University, Lund, Sweden. 14Service d’Hématologie clinique, Assistance Publique-Hôpitaux de Paris, Hôpital Necker, Paris, France. 15Present addresses: Service de Pharmacie, Assistance Publique-Hôpitaux de Paris, Hôpital Cochin, Paris, France (S.C.) and Departement de Biothérapie, Hôpital Necker, Paris, France (J.-A.R.). 16These authors contributed equally to this work. Correspondence should be addressed to I.C.M. ([email protected]), R.M. ([email protected]) or O.H. ([email protected]).
Received 28 March; accepted 4 August; published online 23 October 2011; doi:10.1038/nm.2462
Polymeric IgA1 controls erythroblast proliferation and accelerates erythropoiesis recovery in anemiaSéverine Coulon1,15,16, Michaël Dussiot1–3,16, Damien Grapton1–3, Thiago Trovati Maciel2,3, Pamella Huey Mei Wang2,3, Celine Callens1, Meetu Kaushik Tiwari2,3, Saurabh Agarwal2,3, Aurelie Fricot1, Julie Vandekerckhove1, Houda Tamouza2,3, Yael Zermati1, Jean-Antoine Ribeil1,15, Kamel Djedaini4, Zeliha Oruc5, Virginie Pascal5, Geneviève Courtois1, Bertrand Arnulf6,7, Marie-Alexandra Alyanakian8,9, Patrick Mayeux10–12, Tomas Leanderson13, Marc Benhamou2,3, Michel Cogné5, Renato C Monteiro2,3, Olivier Hermine1,14 & Ivan C Moura2,3
Anemia because of insufficient production of and/or response to erythropoietin (Epo) is a major complication of chronic kidney disease and cancer. The mechanisms modulating the sensitivity of erythroblasts to Epo remain poorly understood. We show that, when cultured with Epo at suboptimal concentrations, the growth and clonogenic potential of erythroblasts was rescued by transferrin receptor 1 (TfR1)-bound polymeric IgA1 (pIgA1). Under homeostatic conditions, erythroblast numbers were increased in mice expressing human IgA1 compared to control mice. Hypoxic stress of these mice led to increased amounts of pIgA1 and erythroblast expansion. Expression of human IgA1 or treatment of wild-type mice with the TfR1 ligands pIgA1 or iron-loaded transferrin (Fe-Tf) accelerated recovery from acute anemia. TfR1 engagement by either pIgA1 or Fe-Tf increased cell sensitivity to Epo by inducing activation of mitogen-activated protein kinase (MAPK) and phosphatidylinositol 3-kinase (PI3K) signaling pathways. These cellular responses were mediated through the TfR1-internalization motif, YXXΦ. Our results show that pIgA1 and TfR1 are positive regulators of erythropoiesis in both physiological and pathological situations. Targeting this pathway may provide alternate approaches to the treatment of ineffective erythropoiesis and anemia.
© 2
011
Nat
ure
Am
eric
a, In
c. A
ll ri
gh
ts r
eser
ved
.
A r t i c l e s
nAture medicine VOLUME 17 | NUMBER 11 | NOVEMBER 2011 1457
We report here that pIgA1 is a positive regulator of erythropoiesis that controls the sensitivity of erythroid progenitors to suboptimal (that is, physiological) amounts of growth factors in both human erythroblasts and humanized mouse models expressing human IgA1 (α1KI mice). α1KI mice had an increased erythroblast pool and enhanced responses to stress (hypoxia or anemia). In addition, TfR1 elicited cell signaling dependent on its internalization motif, thereby modulating the activation of two major pathways involved in erythroblast proliferation and survival, the PI3K-AKT and MAPK-ERK pathways. Finally, we provide evidence that both pIgA1 and the classical TfR1 ligand Fe-Tf can accelerate recovery from anemia and that they act by convergent pathways to promote erythroblast growth and survival. Collectively, these data reveal a previously unknown role of IgA acting through TfR1 to regulate erythropoiesis.
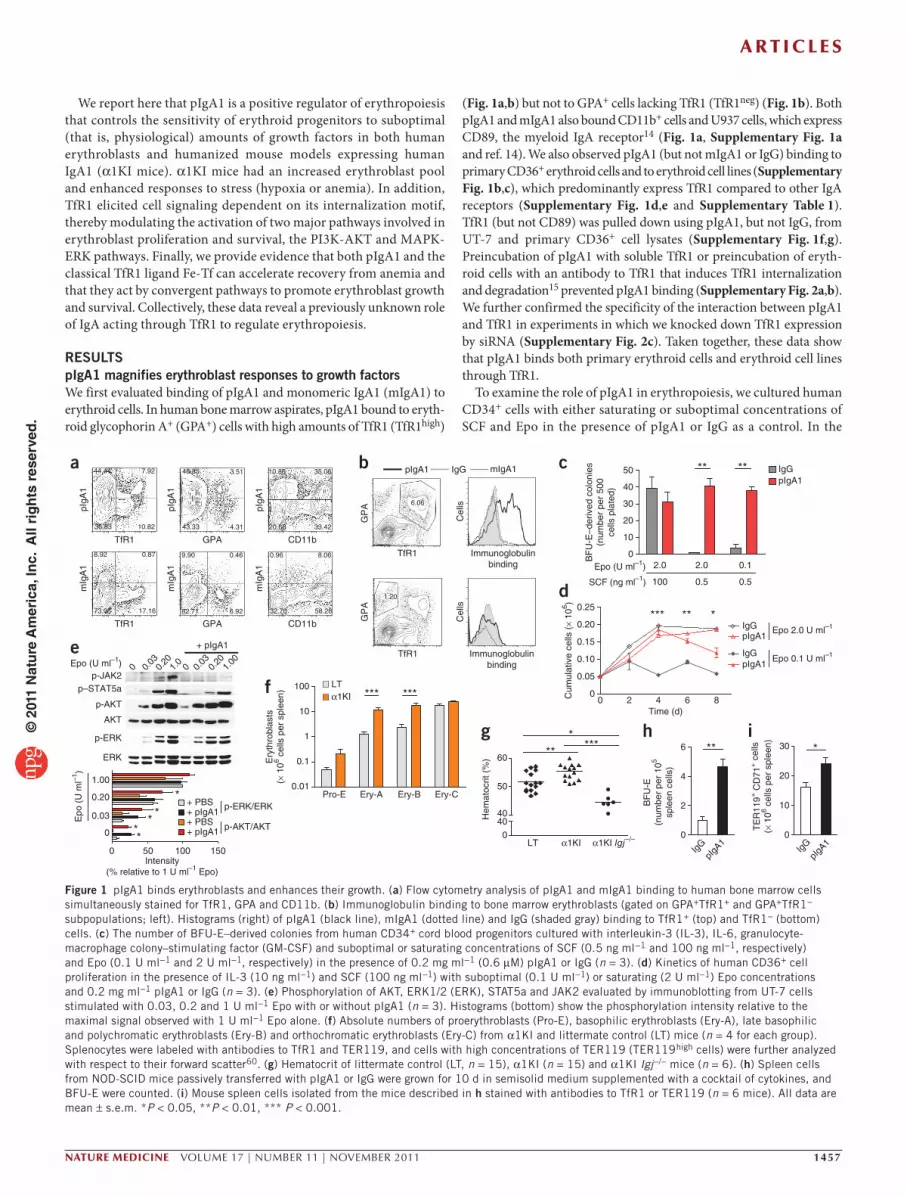
RESULTSpIgA1 magnifies erythroblast responses to growth factorsWe first evaluated binding of pIgA1 and monomeric IgA1 (mIgA1) to erythroid cells. In human bone marrow aspirates, pIgA1 bound to eryth-roid glycophorin A+ (GPA+) cells with high amounts of TfR1 (TfR1high)
(Fig. 1a,b) but not to GPA+ cells lacking TfR1 (TfR1neg) (Fig. 1b). Both pIgA1 and mIgA1 also bound CD11b+ cells and U937 cells, which express CD89, the myeloid IgA receptor14 (Fig. 1a, Supplementary Fig. 1a and ref. 14). We also observed pIgA1 (but not mIgA1 or IgG) binding to primary CD36+ erythroid cells and to erythroid cell lines (Supplementary Fig. 1b,c), which predominantly express TfR1 compared to other IgA receptors (Supplementary Fig. 1d,e and Supplementary Table 1). TfR1 (but not CD89) was pulled down using pIgA1, but not IgG, from UT-7 and primary CD36+ cell lysates (Supplementary Fig. 1f,g). Preincubation of pIgA1 with soluble TfR1 or preincubation of eryth-roid cells with an antibody to TfR1 that induces TfR1 internalization and degradation15 prevented pIgA1 binding (Supplementary Fig. 2a,b). We further confirmed the specificity of the interaction between pIgA1 and TfR1 in experiments in which we knocked down TfR1 expression by siRNA (Supplementary Fig. 2c). Taken together, these data show that pIgA1 binds both primary erythroid cells and erythroid cell lines through TfR1.
To examine the role of pIgA1 in erythropoiesis, we cultured human CD34+ cells with either saturating or suboptimal concentrations of SCF and Epo in the presence of pIgA1 or IgG as a control. In the
a b c
TfR1 GPA CD11b
mIg
A1
pIgA
1
TfR1 GPA CD11b
pIgA
1
pIgA
1
mIg
A1
mIg
A1
pIgA1 mIgA1IgG
Immunoglobulinbinding
Immunoglobulinbinding
Cel
ls
GP
AG
PA
TfR1
TfR1
Cel
ls
0
10
20
30
40
50 IgGpIgA1
****
Epo (U ml–1)
SCF (ng ml–1)
2.0 2.0 0.1
100 0.5 0.5B
FU
-E–d
eriv
ed c
olon
ies
(num
ber
per
500
cells
pla
ted)
0 2 4 6 80
0.05
0.10
0.15
0.20
0.25
pIgA1IgG
Epo 0.1 U ml–1
*** **IgGpIgA1
Epo 2.0 U ml–1
Time (d)
Cum
ulat
ive
cells
(×
106 )
*
Pro-E Ery-A Ery-B Ery-C0.01
0.1
1
10
100
Ery
thro
blas
ts(×
106 c
ells
per
spl
een) *** ***
d
f
e
LT α1KI α1KI Igj–/–0
4040
50
60 ***
***
Hem
atoc
rit (
%)
gERK
p-ERK
AKT
p-AKT
p-JAK2p–STAT5a
Epo (U ml–1) 0 0.03
0.20
1.0
0 0.03
0.20
1.00
+ pIgA1
p-AKT/AKT
p-ERK/ERK
+ pIgA1
+ PBS+ pIgA1+ PBS
0 50 100 150
0
0.03
0.20
1.00
Epo
(U
ml–1
)
***
*
*
Intensity(% relative to 1 U ml–1 Epo)
LTα1KI
h i
IgG
pIgA
10
10
20
30 *T
ER
119+
CD
71+ c
ells
(× 1
06 cel
ls p
er s
plee
n)
IgG
pIgA
10
2
4
6 **
BF
U-E
(num
ber
per
105
sple
en c
ells
)
44.44 7.92 48.85
43.33 4.31
10.85 35.06
20.68 33.42
6.06
3.51
10.8236.83
8.92
73.05 17.16
0.87 9.90
82.71 6.92
0.46 0.96
32.70 58.28
8.06
1.20
Figure 1 pIgA1 binds erythroblasts and enhances their growth. (a) Flow cytometry analysis of pIgA1 and mIgA1 binding to human bone marrow cells simultaneously stained for TfR1, GPA and CD11b. (b) Immunoglobulin binding to bone marrow erythroblasts (gated on GPA+TfR1+ and GPA+TfR1− subpopulations; left). Histograms (right) of pIgA1 (black line), mIgA1 (dotted line) and IgG (shaded gray) binding to TfR1+ (top) and TfR1− (bottom) cells. (c) The number of BFU-E–derived colonies from human CD34+ cord blood progenitors cultured with interleukin-3 (IL-3), IL-6, granulocyte-macrophage colony–stimulating factor (GM-CSF) and suboptimal or saturating concentrations of SCF (0.5 ng ml−1 and 100 ng ml−1, respectively) and Epo (0.1 U ml−1 and 2 U ml−1, respectively) in the presence of 0.2 mg ml−1 (0.6 µM) pIgA1 or IgG (n = 3). (d) Kinetics of human CD36+ cell proliferation in the presence of IL-3 (10 ng ml−1) and SCF (100 ng ml−1) with suboptimal (0.1 U ml−1) or saturating (2 U ml−1) Epo concentrations and 0.2 mg ml−1 pIgA1 or IgG (n = 3). (e) Phosphorylation of AKT, ERK1/2 (ERK), STAT5a and JAK2 evaluated by immunoblotting from UT-7 cells stimulated with 0.03, 0.2 and 1 U ml−1 Epo with or without pIgA1 (n = 3). Histograms (bottom) show the phosphorylation intensity relative to the maximal signal observed with 1 U ml−1 Epo alone. (f) Absolute numbers of proerythroblasts (Pro-E), basophilic erythroblasts (Ery-A), late basophilic and polychromatic erythroblasts (Ery-B) and orthochromatic erythroblasts (Ery-C) from α1KI and littermate control (LT) mice (n = 4 for each group). Splenocytes were labeled with antibodies to TfR1 and TER119, and cells with high concentrations of TER119 (TER119high cells) were further analyzed with respect to their forward scatter60. (g) Hematocrit of littermate control (LT, n = 15), α1KI (n = 15) and α1KI Igj−/− mice (n = 6). (h) Spleen cells from NOD-SCID mice passively transferred with pIgA1 or IgG were grown for 10 d in semisolid medium supplemented with a cocktail of cytokines, and BFU-E were counted. (i) Mouse spleen cells isolated from the mice described in h stained with antibodies to TfR1 or TER119 (n = 6 mice). All data are mean ± s.e.m. *P < 0.05, **P < 0.01, *** P < 0.001.
© 2
011
Nat
ure
Am
eric
a, In
c. A
ll ri
gh
ts r
eser
ved
.

A r t i c l e s
1458 VOLUME 17 | NUMBER 11 | NOVEMBER 2011 nAture medicine
absence of the growth factors, pIgA1 did not support the survival and growth of erythroblasts (data not shown). At a saturating concentra-tion of the growth factors, the number of erythroid burst-forming unit (BFU-E)–derived colonies (Fig. 1c) and the growth of erythroid pre-cursors (Fig. 1d) were not different with pIgA1 treatment compared to IgG. At suboptimal concentrations of SCF with either saturating or suboptimal amounts of Epo, the number of BFU-E–derived colonies decreased by at least 90%, but this number was fully restored by the addition of pIgA1 (Fig. 1c). pIgA1 also rescued the growth of erythro-blasts cultured with suboptimal Epo concentrations to a level similar to that of cultures containing a saturating concentration of Epo (Fig. 1d) and inhibited apoptosis of UT-7 cells, associated with a decrease in caspase-3 activity (Supplementary Fig. 2d). The addition of mIgA1, IgG or purified joining chain (which allows IgA polymerization) did not promote erythroblast survival and proliferation or the growth of BFU-E colonies (Supplementary Fig. 2e). Finally, the window of time during which pIgA1 was effective coincided with the peak of TfR1 expression (Supplementary Fig. 2f). Evaluation of pIgA1 concentra-tions in biological fluids from healthy subjects revealed that the pIgA1 fraction was enriched in bone marrow (Supplementary Fig. 3a), consistent with a role of pIgA1 in the maintenance of steady-state bone marrow erythropoiesis in humans.
IgA deficiency is the most common primary immunodeficiency16. In contrast to serum from healthy donors, serum from individuals with IgA deficiency did not promote erythroblast proliferation at sub-optimal Epo concentrations (Supplementary Fig. 3b), whereas addi-tion of pIgA1 rescued the growth of erythroblasts and protected them from apoptosis (Supplementary Fig. 3b,c). The amount of circulating Epo was substantially increased in individuals with IgA deficiency compared to control individuals (Supplementary Fig. 3d), suggesting
a compensatory mechanism allowing for the unaltered steady-state erythropoiesis observed in IgA-deficient individuals.
To identify the molecular pathways triggered by pIgA1, we stimu-lated growth-factor–starved cells with Epo, SCF or purified myeloma-derived pIgA1 (0.2 mg ml−1 (0.6 µM), which corresponds to the physiological concentration of serum pIgA1). The MAPK-ERK and PI3K-AKT pathways, but not the JAK2-STAT5 pathway, were induced by pIgA1 (Supplementary Fig. 3e–g), although pIgA1 alone did not induce cell proliferation (data not shown). However, pIgA1 had a cooperative effect when added with growth factors. When we acti-vated UT-7 cells or primary erythroblasts with increasing concentra-tions of SCF or Epo, addition of pIgA1 enhanced the phosphorylation of ERK1/2 and AKT (but not JAK2) at suboptimal concentrations of growth factors (Fig. 1e and Supplementary Fig. 3h,i).
The IgA system differs substantially between humans and mice because mouse IgAs are mainly polymeric and do not have the hinge region found in human IgA1, which contains O-linked gly-cosylation sites important for their interaction with TfR1 (ref. 17). However, mouse TfR1 is highly homologous to the human TfR1 and so should interact similarly with human pIgA1. In vitro, pIgA1 bound TER119+TfR1+ but not TER119+TfR1− mouse erythroblasts, confirm-ing that human pIgA1 binds mouse TfR1 (Supplementary Fig. 4a). To investigate the role of human IgA1 in vivo, we used α1KI mice, which carry a homozygous mutation of the immunoglobulin heavy chain (IgH) locus produced by replacing the mouse switch µ region (Sµ) with the human gene encoding the heavy chain of IgA (Cα1) (ref. 18). In the serum of these mice, we found human IgA1 in cir-culation in concentrations ranging from 0.5–1.0 mg ml−1 (ref. 18), with a pIgA1:mIgA1 ratio similar to that observed in human serum (Supplementary Fig. 4b).
b
e
r = 0.758, P = 0.011
10 20 30 40 50
12.5
15.0
17.5
20.0
22.5
pIgA1 (% AUC)
Hb
(g d
l–1)
a
LT α1KI LT α1KI 0
4040
50
60
70
80
HypoxiaNormoxia
******
*
Hem
atoc
rit (
%)
d
pIgA
1
mIg
A166
9 kD
a
150
kDa
0 5 10 15 20 250
10
20
30
40
HypoxiaNormoxia
Fraction number
IgA
(µg
ml–1
)
Normoxia Hypoxia0
20406080
100mIgA1pIgA1
AU
C o
f tot
alIg
A1
(%)
f
pIgA
1
mIg
A1
850
kDa
350
kDa
150
kDa
Healthy serum
Hypoxemic serum
0 5 10 15 20 25 30 35 400
10
20
30
40
50
60
Fraction number
IgA
(µg
ml–1
)
Hypoxemicindividuals
020406080
100 mIgA1pIgA1*
AU
C o
f tot
alIg
A1
(%)
Healthy volunteers
c
Pro-E Ery-A Ery-B Ery-C0.1
1
10
100
* * **
*** ***** ****
* ****
Ery
thro
blas
ts(×
106 c
ells
per
spl
een)
LT normoxiaα1KI normoxiaLT hypoxiaα1KI hypoxia
Pro-E Ery-A Ery-B Ery-C0.01
0.1
1
10**
**
Ery
thro
blas
ts(×
106 c
ells
per
fem
ur)
LT normoxiaα1KI normoxia
LT hypoxiaα1KI hypoxia
Figure 2 Enhanced erythropoiesis induced by hypoxic stress in α1KI mice. (a) Hematocrit values of mice subjected to intermittent chronic hypoxia: control littermate (LT) normoxia (n = 7), α1KI mice normoxia (n = 8), littermate hypoxia (n = 8) and α1KI mice hypoxia (n = 7) are shown. (b,c) Absolute numbers of erythroblasts subsets from spleen (b) or bone marrow (c) cells labeled with antibodies to TfR1 and TER119. Shown are control littermate normoxia (n = 10), α1KI mice normoxia (n = 10), littermate hypoxia (n = 10) and α1KI mice hypoxia (n = 10). (d) The IgA content of the fractions from gel filtration of serum from α1KI mice subjected to hypoxia or normoxia. Molecular standards are indicated. The inset shows the percentage of pIgA1 and mIgA1 fractions (n = 3 different sera). AUC, area under the curve. (e) The correlation between pIgA1 serum concentrations (percentage of AUC) and hemoglobin with a Spearman’s ρ coefficient is shown. (f) Fractions from gel filtration columns of serum from healthy or hypoxemic individuals analyzed for their IgA content using ELISA. Polymeric and monomeric fractions were evaluated as in d (n = 4: one individual with chronic obstructive pulmonary disease and three individuals suffering from obstructive sleep apnea). All data are mean ± s.e.m. *P < 0.05, ** P < 0.01, *** P < 0.001.
© 2
011
Nat
ure
Am
eric
a, In
c. A
ll ri
gh
ts r
eser
ved
.

A r t i c l e s
nAture medicine VOLUME 17 | NUMBER 11 | NOVEMBER 2011 1459
The joining chain is a 15-kDa polypeptide covalently associated with IgA to form IgA polymers13. Joining-chain–deficient mice have decreased pIgA concentrations19. We backcrossed α1KI mice to mice lacking joining chain (Igj−/− mice). pIgA1 concentrations were markedly reduced in α1KI Igj−/− mice (Supplementary Fig. 4b). In rats, mice and rabbits, the polymeric immunoglobulin receptor on hepatocytes binds circulating pIgA and mediates its transport into bile20. The half-life of IgA was similar between α1KI and α1KI Igj−/− mice (Supplementary Fig. 4c), and IgA serum concen-trations were decreased (rather than increased) in α1KI Igj−/− mice compared to α1KI mice, suggesting that human IgA1 and mouse IgA have different susceptibilities to hepatobiliary transport (Supplementary Fig. 4d). Epo, ferritin and transferrin concentra-tions did not differ between α1KI mice and their littermate controls (Supplementary Fig. 4e–g).
Under steady-state conditions, α1KI mice had a significant increase in spleen erythropoietic activity compared to littermate controls, as shown by increased numbers of proerythroblasts and basophilic and polychromatic erythroblasts (Fig. 1f). This increase had a minor but significant (P < 0.01) effect (an approximately 5% increase) on hematocrit and red blood cell (RBC) counts but not on
reticulocyte numbers (Supplementary Fig. 5a–c). This suggests that a negative regulation of erythropoiesis may maintain steady-state conditions to avoid polycythemia21. Bone marrow erythroblast num-bers were not different between α1KI mice and their littermate con-trols (Supplementary Fig. 5d), suggesting that pIgA1 affected RBC counts through a direct effect on spleen erythropoiesis. Conversely, α1KI Igj−/− mice had a decreased hematocrit (Fig. 1g), further con-firming that pIgA is the form of IgA that sustains erythropoiesis. To provide further evidence for the role of human pIgA1 in erythropoi-esis, we passively transferred human pIgA1 into nonobese diabetic severe combined immunodeficiency (NOD-SCID) mice. In this model, pIgA1 administration induced growth of spleen erythroblast progenitors (an over fourfold increase) (Fig. 1h) and precursors (Fig. 1i), but had a less pronounced effect on bone marrow progeni-tors (a 1.4-fold increase) (Supplementary Fig. 5e) and precursors (Supplementary Fig. 5f) and did not induce polycythemia (data not shown). These results are consistent with previous studies show-ing that in mice Epo injection induces spleen erythropoiesis rather than bone marrow erythropoiesis22. Together, these results highlight the role of pIgA1 in controlling erythropoiesis in both humans and humanized mouse models.
g h i PHZ
0 3 6 9044
6
8
10
****
LTα1KI
Time (d)
RB
C (
× 10
6 per
mm
3 )
Anti-RBC
0
20
40
60 ** **
Time (d)
Hem
atoc
rit (
%)
α1KIα1KI Igj –/–
***
0 2 5 7
d
e f
b ca
0 4 7 10 13 17 20 24 27 34
5-FU
066
7
8
9
10
11LTα1KI
* **
Time (d)
RB
C (
× 10
6 per
mm
3 )
PHZ
0
20
40
60 **
Time (d)
Hem
atoc
rit (
%)
0 3 6 9
LTα1KI
PHZ
0 3 6 90
2
4
6 ***
Time (d)
Ret
icul
ocyt
es(×
106 p
er m
m3 )
LTα1KI
0
0.5
1.0
1.5
2.0 * **
Time (d)
Ret
icul
ocyt
es (
× 10
6 per
mm
3 )
0 4 7 10 13 17 20 24 27 34
5-FULTα1KI
5-FU
0 4 7 10 13 17 20 24 27 340
20
40
60 ** *** *** * ** *
Time (d)
Hem
atoc
rit (
%)
LTα1KI
Anti-RBC
0 2 5 70
1
2
3
4 ***
Time (d)
Ret
icul
ocyt
es(×
106 p
er m
m3 )
α1KIα1KI Igj –/–
Anti-RBC
0 20
2
4
6
8
10
** *** **
Time (d)
75
RB
C (
× 10
6 per
mm
3 )
α1KIα1KI Igj –/–
j
LTα1KI
Pro-E Ery-A Ery-B Ery-C0
20
40
60
80 ** *****
Ery
thro
blas
ts(×
106 c
ells
per
spl
een)
PHZPHZ
LT α1KI0
5
10
15 *
BF
U-E
(num
ber
per
105 s
plee
n ce
lls)
LT α1KIPro-E0.5 ± 0.1% TER119
high
29.9 ± 6.3%
TfR
1
TER119
TER119high
67.3 ± 5.9%
Pro-E2.3 ± 0.2%
TER119
TfR
1
FSC
A 31.9 ± 2.1%
C 11.8 ± 4.1%
B 54.5 ± 1.7%
FSC
A 41.0 ± 1.2%
C 2.8 ± 0.6%
B 54.1 ± 2.5%
PHZ
TfR
1T
fR1
Figure 3 Accelerated recovery from acute anemia by TfR1 ligands. (a–c) Hematocrit (a), reticulocyte counts (b) and RBC counts (c) in α1KI mice (n = 4) and littermate controls (n = 4) with central anemia induced by injection of 5-fluorouracil (5-FU). (d–f) Erythropoietic response in α1KI (n = 7) and α1KI Igj−/− (n = 6) mice subjected to hemolytic anemia by injection of antibodies to RBC (anti-RBC). Hematocrit levels (d), reticulocyte counts (e) and RBC counts (f) at days 0, 2, 5 and 7. (g–j) Erythropoietic response to acute anemia in α1KI mice (n = 4) and littermate controls (n = 4) after PHZ-induced hemolysis (50 mg per kg of body weight per mouse injected on days 0 and 1). Hematocrit (g), reticulocyte count (h) and RBC counts (i) at days 0, 3, 6 and 9. (j) Number of spleen erythroid progenitors (left) determined using a methyl cellulose assay for BFU-E detection in α1KI mice (n = 3) and littermate controls (n = 5). All counts were in duplicate for each mouse. Representative flow cytometry analysis of the percentage of erythroblast subsets (middle). We labeled freshly isolated splenocytes with antibodies against TfR1 and TER119. We further analyzed TER119high cells with respect to their forward scatter (FSC) in the bottom plots (as indicated). The absolute numbers of the different erythroblast populations are shown (right). Pro-E, proerythroblasts; Ery-(A), basophilic erythroblasts; Ery-(B), late basophilic and polychromatic erythroblasts; Ery-(C), orthochromatic erythroblasts. All data are mean ± s.e.m. *P < 0.05, **P < 0.01, ***P < 0.001.
© 2
011
Nat
ure
Am
eric
a, In
c. A
ll ri
gh
ts r
eser
ved
.

A r t i c l e s
1460 VOLUME 17 | NUMBER 11 | NOVEMBER 2011 nAture medicine
Increased response to hypoxia in a1KI miceStress erythropoiesis is a physiological process defined by the ability of erythroid progenitors to rapidly proliferate in response to hypoxia and anemia. Erythropoiesis is tightly regulated by tissue oxygenation through the hypoxia-inducible factor transcriptional complex, which modulates Epo production23. To assess the role of pIgA1 in stress erythropoiesis, we evaluated the impact of hypoxic stress conditions on α1KI mice. We subjected these mice and their control littermates to chronic intermittent hypoxia (14 h of 8% O2 followed by 10 h of 20% O2 for 3 d). Hematocrit and the number of spleen erythroblast progenitors were significantly increased in α1KI mice relative to their littermate controls (Fig. 2a,b), indicating an enhanced response to stress in the presence of human IgA1. Bone marrow erythroblast populations were not different between α1KI mice and littermate controls (Fig. 2c). Therefore, in agreement with previous results24,25, spleen (but not bone marrow) precursors proliferated in response to stress erythropoiesis.
Hypoxia also affected the distribution of circulating IgA forms. In α1KI mice, hypoxia resulted in increased serum pIgA concentrations (Fig. 2d) without affecting IgA plasma cell numbers (data not shown). The serum pIgA concentration correlated with the amount of hemoglobin (Fig. 2e). To extend these results in humans, we compared the pIgA1 concentration in healthy subjects and in individuals who are chronically in hypoxic conditions (individuals with chronic obstructive pulmonary disease or obstructive sleep apnea). Hypoxemic individuals had enhanced pIgA1 concentrations (Fig. 2f), confirming the results we obtained in the humanized mice. We conclude that hypoxic stress increases pIgA1 concentrations, which then positively affect erythropoiesis.
pIgA1 accelerates recovery from anemiaTo determine whether IgA1 could modulate the response to ane-mia, we subjected α1KI mice or littermate controls to antimetabolite 5-fluorouracil treatment, which induces a severe and persistent ane-mia through depletion of proliferating progenitor cells. In this cen-tral anemia model, human IgA1 accelerated erythropoietic recovery (Fig. 3a–c). To evaluate the impact of IgA1 oligomerization on erythropoiesis, we compared anemia recovery in α1KI mice to that in α1KI Igj−/− mice. We used a second model of anemia in which we induced autoimmune hemolytic anemia by injection of a monoclonal antibody to RBC antigen (34-3C, IgG2a)26. Recovery from anemia was impaired in α1KI Igj−/− mice compared to wild-type α1KI mice (Fig. 3d–f), further emphasizing that human IgA oligomerization is essential for IgA1 activity in erythropoiesis. In contrast, mouse pIgA did not affect erythropoiesis, as Igj−/− mice and their littermate con-trols had similar recovery from anemia (Supplementary Fig. 6a–c). We then subjected mice to a model of anemia induced by phenylhy-drazine (PHZ) treatment, which induces a transient hemolytic ane-mia followed by a compensatory stress erythropoiesis. In this model, α1KI mice had an accelerated erythropoietic recovery from anemia (Fig. 3g–i) accompanied by spleen enlargement (Supplementary Fig. 6d), increased numbers of stress-induced BFU-E progenitors in spleen (Fig. 3j) and higher numbers of erythroblast precursors (Fig. 3j and Supplementary Fig. 6e). Proerythroblasts and basophilic and polychromatic erythroblasts (which express high TfR1 concentra-tions) were particularly abundant in α1KI mice subjected to PHZ treatment (Fig. 3j), confirming that human IgA1 acts directly on early precursors during stress erythropoiesis.
a
b
c e
f
PBS Apo-Tf Fe-Tf
0 3 6 9044
6
8
10
12 *********
Time (d)
RB
C (
× 10
6 per
mm
3 ) ***
0 3 6 90
2
4
6*
Time (d)
Ret
icul
ocyt
es(×
106 p
er m
m3 )
0 50 100 150 200
0
0.03
0.20
1.00
+ Fe-Tf+ PBS
+ PBS+ Fe-Tf p-AKT/AKT
p-ERK/ERK***
**
*E
po (
U m
l–1)
Intensity(% relative to 1 U ml–1 Epo)
ERK
p-ERK
AKT
p-AKT
Epo (U ml–1)0 0.
030.
201.
000 0.
030.
201.
00
+ Fe-Tf d
ERK
p-ERK
AKT
p-AKT
Epo (U ml–1) 0 0.03
0.20
1.00
0 0.03
0.20
1.00
+ Apo-Tf
0
10,000
20,000
30,000
40,000
pIgA1 (150 µg ml–1) +– +– +– +–
** ****
**
*
Cel
l num
ber
Fe-Tf (µg ml–1)
0
20,000
40,000
60,000
100.
0090
.00
30.0
010
.00
3.33
1.11
0.37
0.120
****
**
RLU
Fe-Tf/Tf (%)
050
01,0
001,5
00
MFI
+ Fe-Tf 0.4 µM
0 µM pIgA10.0024 µM pIgA1
10 µM pIgA1
0.0390 µM pIgA10.625 µM pIgA1
010
020
030
0
MFI
+ pIgA1 1 µM
0 µM Fe-Tf0.0156 µM Fe-Tf
64 µM Fe-Tf
0.250 µM Fe-Tf4 µM Fe-Tf
Fluoresence intensity
Fluoresence intensity
Cel
l num
ber
Cel
l num
ber
0 37.5 150.0 600.0
g
0 50 100 150 200
0.03
0.20
1.00
+ Apo-Tf+ PBS
+ PBS+ Apo-Tf
p-AKT/AKT
p-ERK/ERKEpo
(U
ml–1
)
Intensity(% relative to 1 U ml–1 Epo)
0
PBS Apo-Tf Fe-Tf
00 102 103 104 105
00102 103 104 105
Figure 4 Noncompetitive binding to TfR1 and convergent function of Fe-Tf and pIgA1. (a,b) RBC numbers (a) and reticulocyte counts (b) in NOD-SCID mice subjected to PHZ treatment and further treated with human Apo-Tf, Fe-Tf or PBS over 9 d (n = 6). We administered 10 mg of Apo-Tf or Fe-Tf intraperitoneally every 2 d starting at day –1. (c,d) Phosphorylation of AKT and ERK1/2 (ERK) in UT-7 cells starved of Epo overnight and stimulated with or without 0.03, 0.2 and 1 U ml−1 of Epo in the presence or absence of Fe-Tf (0.2 mg ml−1 (3 µM)) (c) or Apo-Tf (0.2 mg ml−1 (3 µM)) (d). Histograms show the phosphorylation intensity relative to the maximal signal observed with Epo alone (n = 3). (e) Cell viability of serum-starved UT-7 cells cultured for 24 h in serum-free medium supplemented with increasing ratios of Fe-Tf:Apo-Tf and 0.1 U ml−1 Epo. Relative luminescence units (RLU) are shown (n = 3). (f) Binding of Fe-Tf (0.4 µM, top) or pIgA1 (1 µM, bottom) to UT-7 cells preincubated with increasing doses of pIgA1 or Fe-Tf. MFI, mean fluorescence intensity (n = 3). (g) Primary human CD36+ cell proliferation in the presence of IL-3 (10 ng ml−1), SCF (100 ng ml−1) and Epo (0.1 U ml−1) and in the presence of various amounts of Fe-Tf with or without pIgA1 (150 µg ml−1 (0.45 µM)) (n = 3). All data are mean ± s.e.m. *P < 0.05, ** P < 0.01, *** P < 0.001.
© 2
011
Nat
ure
Am
eric
a, In
c. A
ll ri
gh
ts r
eser
ved
.

A r t i c l e s
nAture medicine VOLUME 17 | NUMBER 11 | NOVEMBER 2011 1461
To provide further evidence for the role of human pIgA1 in anemia recovery, we passively transferred NOD-SCID mice with pIgA1 or IgG. The half-lives of human IgA1 and IgG followed kinetics compa-rable to those observed in other studies14,27 (Supplementary Fig. 7a). Erythropoietic recovery from anemia induced by treatment with either antibody to RBC antigen or PHZ was accelerated by the pas-sive transfer of pIgA1 (Supplementary Fig. 7b–g). Spleen BFU-E and TER119+TfR1+ erythroblasts numbers were also increased in pIgA1-treated mice (Supplementary Fig. 7h,i). Therefore, human pIgA1 is beneficial in accelerating erythropoiesis recovery from anemia.
Convergent action of TfR1 ligands in erythropoiesisTo investigate whether other TfR1 agonists could mimic pIgA1 in anemia recovery, we pretreated wild-type mice beginning at day –1 (relative to anemia induction by PHZ treatment) and daily thereafter with apotrans-ferrin (Apo-Tf) or Fe-Tf (10 mg daily as described28). Erythropoiesis rebounded more efficiently in Apo-Tf– and Fe-Tf–injected mice than in control mice (Fig. 4a,b). In UT-7 cells, Fe-Tf, but not Apo-Tf, treat-ment enhanced Epo-induced phosphorylation of ERK1/2 and AKT (Fig. 4c,d). Therefore, the stimulating potential of passively transferred Apo-Tf in vivo probably results from its capacity to become iron loaded in the circulation28. Together, these data suggest that TfR1 triggering can boost erythropoiesis through the modulation of the major signaling pathways involved in erythroblast proliferation and survival.
To further evaluate the relative impact of transferrin saturation and to mimic Fe-Tf saturation concentrations observed in healthy individuals or individuals with either iron overload or iron-deficiency
anemia, we cultured serum-starved UT7 cells in serum-free medium supplemented with Fe-Tf and Apo-Tf at varying ratios. Erythroid cell proliferation reached a plateau at physiological Fe-Tf saturation con-centrations (around 30% Fe-Tf) (Fig. 4e). Therefore, in pathological situations of low Fe-Tf saturation, increasing iron supplementation could restore erythroblast growth.
As variations in both transferrin saturation (iron-deficiency anemia or iron overload) and pIgA1 concentrations (as described here) can occur in pathophysiological situations, we performed experiments to evaluate the relative contribution of each to the proliferation of erythroid cells. Fe-Tf and pIgA1 did not compete for binding to TfR1 in vitro (Fig. 4f). CD36+ primary erythroblasts cultured with sub-optimal Epo concentrations (0.1 U ml−1) proliferated minimally in the absence of Fe-Tf. In cells cultured with suboptimal Fe-Tf con-centrations (0.5 µM), addition of pIgA1 rescued erythroblast pro-liferation. pIgA1 promoted erythroblast proliferation and survival under conditions of either physiological or supraphysiological Fe-Tf concentrations (2 µM or 8 µM, respectively) (Fig. 4g). Therefore, in iron-deficiency anemia, the convergent actions of pIgA1 and Fe-Tf modulate the rate of erythropoiesis through their combined effects on TfR1. In addition, under supraphysiological Fe-Tf concentrations (iron overload), modulation of pIgA1 concentrations can still increase the erythropoiesis rate through TfR1.
TfR1 is a signaling-competent receptorTo examine the signaling function of TfR1, we took advantage of the species specificity of a monoclonal antibody to human TfR1
Mock
hTFR1
hTFR1 (Y20F)
hTFR1 (S24A)
hTFR1 (S34A)
hTFR1 (S63A)
hTFR1 (S65A)
a
0 50 100 150 2000.8
1.0
1.2
1.4
1.6
Time (s)
∆F/F
0
0 0.2 0.4 0.6 0.8∆RFU
**
+ A24+ PBS
+ PBS+ A24
0 50 100 150 200
0
0.03
0.20
1.00
***
***
*
Epo
(U
ml–1
)
ERK
p-ERK
AKT
p-AKT
Epo (U ml–1) 0 0.03
0.20
1.00
0 0.03
0.20
1.00
+ A24 d
c
0 50 100
Intensity (% relative to 4 ng ml–1 SCF)
Intensity (% relative to 1 U ml–1 Epo)
150 200
0
0.16
0.80
4.00
*
*
SC
F (
ng m
l–1)
*
ERK
p-ERK
AKT
p-AKT
SCF (ng ml–1)0 0.
160.
804.
000 0.
160.
804.
00+ A24
+ A24+ PBS
+ PBS+ A24 p-AKT/AKT
p-ERK/ERK
p-AKT/AKT
p-ERK/ERK
b
ERK
p-ERK
AKT
p-AKT
HSC70
p-JAK2p–STAT5a
0 3 10 30 3 10 30A24 Epo
Time (min)
Figure 5 TfR1 is a signaling-competent molecule. (a) Variations in intracellular calcium concentrations ([Ca2+]i) in CHO cells transfected with wild-type human TfR1 or with five different TfR1 mutants (Y20F, S24A, S34A, S63A or S65A) or with empty vector (Mock) and then stimulated with the monoclonal antibody A24. Variations are expressed as differences between the baseline and experimental [Ca2+]i elevations (∆F/F0) (left). Right, quantification expressed as the mean area under the curves (∆RFU) ± s.e.m. *P < 0.05. n = 4. (b) Time-dependent stimulation of UT-7 cells in the presence of A24 (10 µg ml− 1) or Epo (0.5 U ml−1) for 0, 3, 10 and 30 min. We examined the phosphorylation of JAK2, STAT5a, AKT and ERK1/2 (ERK) by immunoblotting on whole-cell lysates. We used AKT, ERK and HSC70 as loading controls. (c,d) Phosphorylation of AKT and ERK1/ERK2 (ERK) analyzed by immunoblotting of cell lysates from growth-factor–starved UT-7 cells stimulated in the presence or absence of A24 (10 µg ml−1) with or without SCF (0.16, 0.80 and 4.00 ng ml−1) (c) or with or without Epo (0, 0.03, 0.20 and 1.00 U ml−1) (d). Total AKT and ERK were used as loading controls. The data are representative of three independent experiments, which were quantified and expressed as histograms (lower panels) showing the phosphorylation intensity relative to the maximal signal observed with Epo or SCF alone. *P < 0.05, **P < 0.01. All data are mean ± s.e.m.
© 2
011
Nat
ure
Am
eric
a, In
c. A
ll ri
gh
ts r
eser
ved
.

A r t i c l e s
1462 VOLUME 17 | NUMBER 11 | NOVEMBER 2011 nAture medicine
(named A24)11,29,30 to perform experiments in Chinese hamster ovary (CHO) cells transfected with human TfR1. Addition of A24, but not an irrelevant control isotype antibody, rapidly induced cal-cium mobilization in these transfected cells (Fig. 5a, Supplementary Fig. 8a,c and Supplementary Table 2). Both transfected and non-transfected cells responded similarly to thapsigargin, a receptor- independent activator of calcium signaling (Supplementary Fig. 8b). TfR1-dependent signaling was independent of KIT and the Epo receptor (EpoR), which are absent in CHO cells (refs. 31–33 and data not shown). TfR1 targeting by A24 replicated cell activation by pIgA1 and Fe-Tf, as it induced phosphorylation of ERK1/2 and AKT (Fig. 5b). Furthermore, similar to pIgA1 and Fe-Tf, A24 enhanced these responses to suboptimal doses of SCF and Epo (Fig. 5c,d).
TfR1 contains a short intracellular domain (61 amino acids) with no known signal-transducing element. Cells transfected with a mutated version of human TfR1 lacking the YXXΦ endocytosis motif 34 (in which Y is tyrosine, X is any amino acid and Φ represents an amino acid residue with a hydrophobic side chain), the Y20F mutant, did not mobilize calcium after TfR1 triggering (Fig. 5a). In contrast, cells transfected with human TfR1 mutated at other potential phosphoryla-tion sites (S24A, S34A, T57A, S63A and S65A, as predicted by our in silico analysis using the Phosphosite, NetPhosK 1.0 and ScanProsite servers) had only partially reduced calcium mobilization (Fig. 5a) despite comparable cell surface expression of the receptor (data not
shown) and responsiveness to thapsigargin (Supplementary Fig. 8b). Thus, the cytoplasmic Tyr20 residue, which is predicted to be phosphor-ylated, is necessary for TfR1-mediated signaling. However, this require-ment seems independent of TfR1 internalization per se, as we observed calcium mobilization immediately after receptor engagement (Fig. 5a), that is, too quickly for internalization to have occurred. We conclude that, in addition to its role in iron uptake, TfR1 is a signaling-competent molecule that promotes erythropoiesis through induction of the MAPK-ERK and PI3K-AKT signaling pathways as well as through calcium mobilization, and that these actions depend on the integrity of the receptor’s internalization motif.
TfR1 triggering potentiates and sensitizes Epo signalingEpoR induces Ca2+ mobilization through activation of transient receptor potential channel (TRPC) family member TRPC3 (ref. 35). We performed experiments to examine the effect of TfR1 engagement on EpoR-mediated cell signaling. We transfected CHO cells with both human TfR1 and EpoR and determined the dose-response of these cells to A24 and Epo treatment (Supplementary Fig. 8c,d). EpoR singly transfected cells responded to a suboptimal dose of Epo but not to suboptimal doses of either A24 or pIgA1, whereas EpoR and human TfR1 doubly transfected cells showed an additive effect by combining a suboptimal dose of Epo together with a suboptimal dose of either A24 or pIgA1 (Fig. 6a,b). Cells transfected with the TfR1 Y20F mutant
Epo
Kidney
Epo-hyposensitiveerythroblasts
Epo-hypersensitiveerythroblasts
Normoxia
Hypoxia Epo
Kidney
pIgA1 synthesis
Bone marrowIgA1+ pIasma cells
Erythroblastpriming
pO2pO2
Apoptosis
Apoptosis
c
Epo (0.2 U ml–1)
A24 (0.1 µg ml–1)
+0 + ++0 0+ +
0+ 0 +++ +0 +
Mock
hTfR1
Y20FWT
0
0.2
0.4
0.6
0.8
1.0
1.2 ***
∆RF
U
0
0.2
0.4
0.6
Epo (0.2 U ml–1) + + + +
A24 (0.1 µg ml–1 30 min) 0 0+ +
*
Y20FWT
hTfR1
*
∆RF
U
a∆R
FU
Epo (0.2 U ml–1) +0 + ++0
pIgA1 (0.1 mg ml–1) 0+ 0 +++
0
+
+
0
+
+
Mock
hTfR1
Y20FWT
0
0.1
0.2
0.3
0.4 *b
hTFR1(Y20F)/EpoR
0 40 80 120 160 2000.8
1.0
1.2
1.4
1.6
1.8
2.0
Time (s)
PBS (30 min)/EpoA24 (30 min)/EpoA24 (30 min)/PBS
∆F/F
0
∆F/F
0
hTfR1/EpoR
0 40 80 120 160 2000.8
1.0
1.2
1.4
1.6
1.8
2.0
Time (s)
PBS (30 min)/EpoA24 (30 min)/EpoA24 (30 min)/PBS
Cellsurvival
Cellproliferation
[Epo]Cell
survivalCell
proliferation
[Epo]
Threshold
Epo-hyposensitiveerythroblasts
Epo-hypersensitiveerythroblasts
pIgA1
Apoptosis
PI3K-AKTMAPK-ERK
[Ca2+]iPI3K-AKT
MAPK-ERK[Ca2+]i
Threshold
Apoptosis
d e
Figure 6 TfR1 triggering potentiates and sensitizes Epo signaling. (a) Calcium responses of CHO cells transfected with EpoR and pCDNA 3.1 empty vector (mock), EpoR and wild-type (WT) human TfR1 (hTfR1) or EpoR and hTfR1 Y20F. The cells were stimulated with suboptimal doses of Epo (0.2 U ml−1), A24 (0.1 µg ml−1) or both. (b) Calcium responses of the same CHO cells as in a stimulated with 0.2 U ml−1 Epo, 0.1 mg ml−1 pIgA1 (0.3 µM) or both. (c) Calcium responses of doubly-transfected CHO cells primed with A24 (1 µg ml−1) and stimulated with Epo (0.2 U ml−1). Quantifications are shown in the histograms (right).*P < 0.05. All data are mean ± s.e.m. (n = 3). (d,e) Model summarizing the role of pIgA1 in erythropoiesis. (d) We propose that TfR1 functions as an erythroid receptor involved in the modulation of responses to Epo. In erythroid niches, two populations of erythroblasts coexist that differ in their sensitivity to Epo. TfR1 triggering by pIgA1 (or Fe-Tf) decreases the activation threshold required for proliferation and survival of erythroblasts by activation of the PI3K-AKT and MAPK-ERK signaling pathways and calcium influx. (e) Variation in RBC number depends on Epo concentration, which is physiologically controlled by oxygen tension. Under normoxia, the circulating Epo concentration is suboptimal (5–30 mU ml−1), and Epo-hyposensitive erythroblasts undergo apoptosis, whereas Epo-hypersensitive erythroblasts participate in steady-state erythropoiesis (top). Polymeric IgA1 is a modulator of sensitivity to Epo. Hypoxia induces Epo production by the kidneys, promoting the growth of Epo-hyposensitive erythroblasts, and reducing the pool of erythroblasts entering apoptosis. In addition, hypoxia induces pIgA1 production by plasma cells. pIgA1 binding to TfR1 (together with Fe-Tf) increases the sensitivity of erythroblasts to Epo, optimizing and accelerating the erythropoietic response to hypoxia.
© 2
011
Nat
ure
Am
eric
a, In
c. A
ll ri
gh
ts r
eser
ved
.

A r t i c l e s
nAture medicine VOLUME 17 | NUMBER 11 | NOVEMBER 2011 1463
did not respond to either A24 or pIgA1 (Fig. 6a,b). To examine the ability of TfR1 to sensitize cells to Epo, we pretreated cells with A24 or pIgA1 and stimulated them with Epo 30 min later. In EpoR and human TfR1 doubly transfected cells (but not in TfR1 Y20F mutant and EpoR doubly transfected cells), we observed A24- or pIgA1-enhanced calcium responses to Epo (Fig. 6c and Supplementary Fig. 8e,f). Therefore, TfR1 triggering allows a more robust cellular response to the growth factors involved in erythropoiesis.
DISCUSSIONOur data uncover a new role for pIgA1 in promoting erythropoiesis. Human pIgA1 can prime erythroblasts for survival and proliferation under physiological (suboptimal) concentrations of either Epo or SCF, adding another dimension to the finely-tuned positive regula-tion of erythropoiesis. This finding has major implications for stress erythropoiesis, as pIgA1 increased erythropoiesis during hypoxia and accelerated recovery from anemia. Fe-Tf had the same effect as pIgA1, suggesting that modulation of erythroblast responses depends more generally on TfR1 triggering. A recent report showed that transferrin-based therapy reverses anemia and its associated pathologies in a mouse model of β-thalassemia28, validating TfR1 targeting in the treatment of hematological disorders. Our data provide evidence that TfR1 targeting could over-ride ineffective erythropoiesis by priming erythroblasts and enhancing their responsiveness to growth factors.
TfR1 triggering induced calcium mobilization and major signaling pathways implicated in erythroblast response to cytokines and growth factors. This signaling was independent of the activation of KIT and EpoR, as these proteins were not expressed on CHO transfected cells in which TfR1 activation elicited calcium mobilization31–33. This response relies on residue Tyr20 of TfR1, which was initially char-acterized as an element of the YXXΦ motif implicated in receptor endocytosis34. Further characterization of early signaling events link-ing this residue to the activation of the MAPK-ERK and PI3K-AKT signaling pathways could provide targets to increase cell responses to growth factors. With the increase in the number of known TfR1 func-tions, TfR1 should now be considered not only a receptor required for iron uptake but also a receptor that fulfills major signaling func-tions involved in erythroblast activation. Notably, TfR1 triggering by pIgA1 is able to induce major signaling pathways implicated in the erythroblast response to cytokines and growth factors, thus providing optimal signaling for the proliferation of erythroid cells, as shown in mice responding to hypoxia and anemia.
In healthy individuals, the serum diferric transferrin (Fe2-Tf) concentration is in the range of approximately 2–5 µM36,37, but this concentration can increase to around 40 µM in iron-overload condi-tions such as β-thalassemia or hemochromatosis. Fe2-Tf has a high affinity for TfR1 (KD ~ 5 nM (ref. 8)) and rapidly induces receptor endocytosis38. In physiological conditions, Fe2-Tf concentrations36,37 are approximately tenfold higher than its saturating concentration for TfR1 endocytosis (0.5 µM of Fe-Tf39). Therefore, under physiological conditions, the majority of TfR1 should be engaged by Fe2-Tf. Because Fe2-Tf is present in serum at an almost tenfold greater concentration than that of pIgA1 (which is approximately 0.5 µM) and pIgA1 and Fe2-Tf do not compete for binding to TfR1, pIgA1 binding should occur on Fe2-Tf–TfR1 complexes. Thus, we propose that pIgA1 and Fe2-Tf act together on TfR1 to promote robust erythropoiesis.
Under steady-state conditions, α1KI mice had enhanced erythro-blast numbers in their spleen but not in their bone marrow, suggesting that the impact of pIgA1 on RBC numbers is mainly dependent on spleen erythropoiesis. Following stress (hypoxia or anemia), large
numbers of spleen but not bone marrow erythroblasts are induced in α1KI mice. Because stress erythropoiesis occurs in the spleen in mice, it seems that pIgA primarily, but not only, controls erythropoiesis dur-ing stress conditions. We propose that pIgA1 belongs to a group of pro-teins able to participate in both steady-state and stress erythropoiesis (including Epo, SCF and GATA-1)40–42, as opposed to proteins that have been associated preferentially with stress erythropoiesis (such as STAT5-, BMP4- and Hedgehog-dependent pathways)43–45. In support of this hypothesis, we showed that pIgA1 potentiates cell responses to Epo and SCF without affecting STAT5 signaling.
In the treatment of anemia in both cancer and chronic kidney disease, it is well established that intravenous iron supplementation increases hemoglobin concentrations and allows for a reduction in the administration of erythropoiesis-stimulating agents46,47. In these types of anemia, transferrin saturation can be less than 10% (<1.5 µM)48. We found that erythroid cell proliferation was maximal at physiologi-cal transferrin saturation concentrations (30%), providing a molecular basis to the value of iron supplementation to Epo therapy in anemia. Therefore, we conclude that, in addition to its well known role in iron transport for hemoglobin synthesis, Fe-Tf acts with erythroblast growth factors to promote cell proliferation and survival.
Anemia of chronic disease is a common condition characterized by low transferrin saturation and high ferritin comcentrations (>200 ng ml−1) associated with chronic inflammatory diseases (for example, tuber-culosis, lupus and rheumatoid arthritis)49. Inflammatory mediators (such as interferon-γ) greatly decrease erythroblast sensitivity to Epo and increase erythrophagocytosis (reviewed in ref. 50), thus promot-ing anemia51. We and others have reported that IgA1 has an anti-inflammatory role by preventing both phagocytosis and secretion of proinflammatory cytokines through its binding to CD89 on myeloid cells52,53. We propose that IgA1 could have been selected in humans through evolution, at least in part, to prevent anemia through inhi-bition of inflammation and of erythrophagocytosis (through CD89 binding) and to boost erythropoiesis through TfR1 binding. IgA may thus tune erythropoiesis to adapt to pathophysiological conditions.
Polymeric IgA1 concentrations were increased in chronically hypoxemic individuals (those with chronic obstructive pulmonary disease or obstructive sleep apnea), suggesting that pIgA1 concen-trations can be modulated by oxygen levels. Moreover, in α1KI mice, hypoxia induced an increase in the circulating amounts of pIgA1, which favored stress erythropoiesis responses. These responses allow for a fine tuning of the bone marrow response to changes in oxygen levels. Accordingly, researchers from a study performed more than 20 years ago on healthy subjects exposed to hypobaric chambers pointed out that amounts of serum polymeric immunoglobulins (IgM and IgA), but not serum monomeric IgG, were increased during hypoxia54. We propose that pIgA1 concentrations could be regulated in a similar way as other factors controlling erythropoiesis during stress (for example, glucocorticoids, SCF and bone morphogenetic protein 4 (refs. 55–57)). The mechanism regulating the synthesis rate of pIgA1 remains unknown. Because IgA1 oligomerization depends on junction chain, further studies on the regulation of junction-chain synthesis and IgA polymer assembly could provide additional infor-mation about the mechanisms involved in the modulation of pIgA1 concentrations during hypoxia. Because transforming growth factor-β1 synthesis is modulated by hypoxia58 and is crucial for IgA synthesis59, this protein could be a good candidate for the modulation of pIgA1 during hypoxia.
TfR1-dependent signals shed light on the molecular mechanisms underlying the heterogeneous sensitivity of erythroblast progenitors
© 2
011
Nat
ure
Am
eric
a, In
c. A
ll ri
gh
ts r
eser
ved
.
A r t i c l e s
1464 VOLUME 17 | NUMBER 11 | NOVEMBER 2011 nAture medicine
to Epo and SCF5 (Fig. 6d). Under normoxic conditions, physiological concentrations of Epo, acting together with the TfR1 ligands pIgA1 and Fe-Tf, allow for optimal erythropoiesis. Under hypoxic condi-tions, increased production of both pIgA1 and Epo would cooperate to promote rapid adaptation to hypoxic stress (Fig. 6e). This system, which depends on the modulation of at least two factors, allows fine tuning and rapid response to anemia to maintain red blood cell pro-duction at a constant level in both steady-state and stress situations.
METHODSMethods and any associated references are available in the online version of the paper at http://www.nature.com/naturemedicine/.
Note: Supplementary information is available on the Nature Medicine website.
ACKnOWLeDGMenTSThis work was supported by Agence Nationale pour la Recherche, Institut National contre le Cancer, cancéropôle d’Ile de France, Fondation pour la Recherche Médicale, Fondation de France, Association Laurette Fugain, Association pour la Recherche contre le Cancer, Société Française d’Hématologie, cent pour sang la vie, la Ligue contre le Cancer and INSERM/PNRNU2007 grants. S.C. is a recipient of Fondation pour la Recherche Médicale grant and a Société Française d’Hématologie grant. We would like to thank J. Kersual and S. Dauzet (CNRS UMR-S 8147) for experimental help and the Departments of Hematology, Obstetrics and Otorhinolaryngology at the Necker Hospital (Paris, France) for providing blood samples, cord blood samples and tonsil samples, respectively. We would like to thank J.L. Danan (CNRS FRE 3210), M. Heinis (INSERM U845), B. Ruiz (INSERM U780) (located at Paris Descartes University, Paris, France) and C. Clerici (INSERM U773, Bichat Hospital, Paris, France) for providing the hypoxia chambers and L.-J. Couderc at the Foch Hospital (Suresnes, France) for providing blood samples. We are especially thankful to S. Izui (Department of Pathology and Immunology, University Medical Center, Geneva, Switzerland) for providing the 34-3C IgG2a monoclonal antibody and for fruitful discussions.
AUTHOR COnTRIBUTIOnSS.C., M.D. and D.G. designed and performed all experiments, analyzed the data and helped write the manuscript. T.T.M. performed calcium experiments, analyzed the data and helped write the manuscript. P.H.M.W., C.C., A.F., J.V., H.T., Y.Z. and G.C. performed experiments and analyzed the data. M.K.T. planned, designed and constructed the TfR1 mutants and helped to write the manuscript. S.A. performed molecular biology experiments. J.-A.R., K.D., Z.O., V.P., B.A., M.-A.A., T.L. and M.C. provided human samples and mice. P.M. contributed to writing the manuscript and provided helpful discussions. M.B. provided helpful discussions and crucial analysis of the data and wrote the manuscript. R.C.M. supervised the project, analyzed the data and wrote the manuscript. O.H. designed the study, supervised the overall project, analyzed the data and wrote the manuscript. I.C.M. designed the study, supervised the overall project, performed experiments, analyzed the data and wrote the manuscript.
COMPETING FINANCIAL INTERESTSThe authors declare no competing financial interests.
Published online at http://www.nature.com/naturemedicine/. Reprints and permissions information is available online at http://www.nature.com/reprints/index.html.
1. Russell, E.S. Hereditary anemias of the mouse: a review for geneticists. Adv. Genet. 20, 357–459 (1979).
2. Goldwasser, E. Erythropoietin and its mode of action. Blood Cells 10, 147–162 (1984).
3. Zermati, Y. et al. Caspase activation is required for terminal erythroid differentiation. J. Exp. Med. 193, 247–254 (2001).
4. Ribeil, J.A. et al. Hsp70 regulates erythropoiesis by preventing caspase-3-mediated cleavage of GATA-1. Nature 445, 102–105 (2007).
5. Koury, M.J. & Bondurant, M.C. Erythropoietin retards DNA breakdown and prevents programmed death in erythroid progenitor cells. Science 248, 378–381 (1990).
6. Kelley, L.L. et al. Survival or death of individual proerythroblasts results from differing erythropoietin sensitivities: a mechanism for controlled rates of erythrocyte production. Blood 82, 2340–2352 (1993).
7. Levy, J.E., Jin, O., Fujiwara, Y., Kuo, F. & Andrews, N.C. Transferrin receptor is necessary for development of erythrocytes and the nervous system. Nat. Genet. 21, 396–399 (1999).
8. Lebrón, J.A. et al. Crystal structure of the hemochromatosis protein HFE and characterization of its interaction with transferrin receptor. Cell 93, 111–123 (1998).
9. Radoshitzky, S.R. et al. Transferrin receptor 1 is a cellular receptor for New World haemorrhagic fever arenaviruses. Nature 446, 92–96 (2007).
10. Schmidt, P.J., Toran, P.T., Giannetti, A.M., Bjorkman, P.J. & Andrews, N.C. The transferrin receptor modulates Hfe-dependent regulation of hepcidin expression. Cell Metab. 7, 205–214 (2008).
11. Moura, I.C. et al. Identification of the transferrin receptor as a novel immunoglobulin (Ig)A1 receptor and its enhanced expression on mesangial cells in IgA nephropathy. J. Exp. Med. 194, 417–425 (2001).
12. Matysiak-Budnik, T. et al. Secretory IgA mediates retrotranscytosis of intact gliadin peptides via the transferrin receptor in celiac disease. J. Exp. Med. 205, 143–154 (2008).
13. Woof, J.M. & Mestecky, J. Mucosal immunoglobulins. Immunol. Rev. 206, 64–82 (2005).
14. Monteiro, R.C. & Van De Winkel, J.G. IgA Fc receptors. Annu. Rev. Immunol. 21, 177–204 (2003).
15. Moura, I.C. et al. A neutralizing monoclonal antibody (mAb A24) directed against the transferrin receptor induces apoptosis of tumor T lymphocytes from ATL patients. Blood 103, 1838–1845 (2004).
16. Jacob, C.M., Pastorino, A.C., Fahl, K., Carneiro-Sampaio, M. & Monteiro, R.C. Autoimmunity in IgA deficiency: revisiting the role of IgA as a silent housekeeper. J. Clin. Immunol. 28 (Suppl 1), S56–S61 (2008).
17. Moura, I.C. et al. Glycosylation and size of IgA1 are essential for interaction with mesangial transferrin receptor in IgA nephropathy. J. Am. Soc. Nephrol. 15, 622–634 (2004).
18. Duchez, S. et al. Premature replacement of mu with alpha immunoglobulin chains impairs lymphopoiesis and mucosal homing but promotes plasma cell maturation. Proc. Natl. Acad. Sci. USA 107, 3064–3069 (2010).
19. Erlandsson, L. et al. Joining chain-expressing and -nonexpressing B cell populations in the mouse. J. Exp. Med. 194, 557–570 (2001).
20. Mestecky, J., Lue, C. & Russell, M.W. Selective transport of IgA. Cellular and molecular aspects. Gastroenterol. Clin. North Am. 20, 441–471 (1991).
21. De Maria, R. et al. Apoptotic role of Fas/Fas ligand system in the regulation of erythropoiesis. Blood 93, 796–803 (1999).
22. Suzuki, M. et al. Real-time monitoring of stress erythropoiesis in vivo using Gata1 and β-globin LCR luciferase transgenic mice. Blood 108, 726–733 (2006).
23. Koury, M.J. Erythropoietin: the story of hypoxia and a finely regulated hematopoietic hormone. Exp. Hematol. 33, 1263–1270 (2005).
24. Bozzini, C.E. et al. The biology of stress erythropoiesis and erythropoietin production. Ann. N. Y. Acad. Sci. 718, 83–(1994).
25. Socolovsky, M. Molecular insights into stress erythropoiesis. Curr. Opin. Hematol. 14, 215–224 (2007).
26. Fossati-Jimack, L. et al. High pathogenic potential of low-affinity autoantibodies in experimental autoimmune hemolytic anemia. J. Exp. Med. 190, 1689–1696 (1999).
27. Rifai, A., Fadden, K., Morrison, S.L. & Chintalacharuvu, K.R. The N-glycans determine the differential blood clearance and hepatic uptake of human immunoglobulin (Ig)A1 and IgA2 isotypes. J. Exp. Med. 191, 2171–2182 (2000).
28. Li, H. et al. Transferrin therapy ameliorates disease in β-thalassemic mice. Nat. Med. 16, 177–182 (2010).
29. Callens, C. et al. Targeting iron homeostasis induces cellular differentiation and synergizes with differentiating agents in acute myeloid leukemia. J. Exp. Med. 207, 731–750 (2010).
30. Moura, I.C. et al. Engagement of transferrin receptor by polymeric IgA1: evidence for a positive feedback loop involving increased receptor expression and mesangial cell proliferation in IgA nephropathy. J. Am. Soc. Nephrol. 16, 2667–2676 (2005).
31. Lev, S., Yarden, Y. & Givol, D. Dimerization and activation of the kit receptor by monovalent and bivalent binding of the stem cell factor. J. Biol. Chem. 267, 15970–15977 (1992).
32. Lev, S., Yarden, Y. & Givol, D. A recombinant ectodomain of the receptor for the stem cell factor (SCF) retains ligand-induced receptor dimerization and antagonizes SCF-stimulated cellular responses. J. Biol. Chem. 267, 10866–10873 (1992).
33. Miller, B.A. et al. Identification of the erythropoietin receptor domain required for calcium channel activation. J. Biol. Chem. 274, 20465–20472 (1999).
34. Collawn, J.F. et al. Transferrin receptor internalization sequence YXRF implicates a tight turn as the structural recognition motif for endocytosis. Cell 63, 1061–1072 (1990).
35. Hirschler-Laszkiewicz, I. et al. TRPC3 activation by erythropoietin is modulated by TRPC6. J. Biol. Chem. 284, 4567–4581 (2009).
36. Johnson, M.B. & Enns, C.A. Diferric transferrin regulates transferrin receptor 2 protein stability. Blood 104, 4287–4293 (2004).
37. Huebers, H.A., Josephson, B., Huebers, E., Csiba, E. & Finch, C.A. Occupancy of the iron binding sites of human transferrin. Proc. Natl. Acad. Sci. USA 81, 4326–4330 (1984).
38. Richardson, D.R. & Ponka, P. The molecular mechanisms of the metabolism and transport of iron in normal and neoplastic cells. Biochim. Biophys. Acta 1331, 1–40 (1997).
© 2
011
Nat
ure
Am
eric
a, In
c. A
ll ri
gh
ts r
eser
ved
.

A r t i c l e s
nAture medicine VOLUME 17 | NUMBER 11 | NOVEMBER 2011 1465
39. Chan, R.Y., Ponka, P. & Schulman, H.M. Transferrin-receptor–independent but iron-dependent proliferation of variant Chinese hamster ovary cells. Exp. Cell Res. 202, 326–336 (1992).
40. Gutiérrez, L. et al. Ablation of Gata1 in adult mice results in aplastic crisis, revealing its essential role in steady-state and stress erythropoiesis. Blood 111, 4375–4385 (2008).
41. Li, K., Menon, M.P., Karur, V.G., Hegde, S. & Wojchowski, D.M. Attenuated signaling by a phosphotyrosine-null Epo receptor form in primary erythroid progenitor cells. Blood 102, 3147–3153 (2003).
42. Arcasoy, M.O. & Jiang, X. Co-operative signalling mechanisms required for erythroid precursor expansion in response to Epo and stem cell factor. Br. J. Haematol. 130, 121–129 (2005).
43. Perry, J.M., Harandi, O.F. & Paulson, R.F. BMP4, SCF, and hypoxia cooperatively regulate the expansion of murine stress erythroid progenitors. Blood 109, 4494–4502 (2007).
44. Menon, M.P. et al. Signals for stress erythropoiesis are integrated via an erythropoietin receptor-phosphotyrosine-343-Stat5 axis. J. Clin. Invest. 116, 683–694 (2006).
45. Harandi, O.F., Hedge, S., Wu, D.C., McKeone, D. & Paulson, R.F. Murine erythroid short-term radioprotection requires a BMP4-dependent, self-renewing population of stress erythroid progenitors. J. Clin. Invest. 120, 4507–4519 (2010).
46. Auerbach, M. et al. Intravenous iron optimizes the response to recombinant human erythropoietin in cancer patients with chemotherapy-related anemia: a multicenter, open-label, randomized trial. J. Clin. Oncol. 22, 1301–1307 (2004).
47. Besarab, A. & Coyne, D.W. Iron supplementation to treat anemia in patients with chronic kidney disease. Nat. Rev. Nephrol. 6, 699–710 (2010).
48. Cook, J.D., Finch, C.A. & Smith, N.J. Evaluation of the iron status of a population. Blood 48, 449–455 (1976).
49. Keel, S.B. & Abkowitz, J.L. The microcytic red cell and the anemia of inflammation. N. Engl. J. Med. 361, 1904–1906 (2009).
50. Means, R.T. Jr. & Krantz, S.B. Progress in understanding the pathogenesis of the anemia of chronic disease. Blood 80, 1639–1647 (1992).
51. Zoller, E.E. et al. Hemophagocytosis causes a consumptive anemia of inflammation. J. Exp. Med. 208, 1203–1214 (2011).
52. Pasquier, B. et al. Identification of FcαRI as an inhibitory receptor that controls inflammation: dual role of FcRγ ITAM. Immunity 22, 31–42 (2005).
53. Kerr, M.A. The structure and function of human IgA. Biochem. J. 271, 285–296 (1990).
54. Meehan, R. et al. Operation Everest II: alterations in the immune system at high altitudes. J. Clin. Immunol. 8, 397–406 (1988).
55. Bauer, A. et al. The glucocorticoid receptor is required for stress erythropoiesis. Genes Dev. 13, 2996–3002 (1999).
56. Broudy, V.C., Lin, N.L., Priestley, G.V., Nocka, K. & Wolf, N.S. Interaction of stem cell factor and its receptor c-kit mediates lodgment and acute expansion of hematopoietic cells in the murine spleen. Blood 88, 75–81 (1996).
57. Lenox, L.E., Perry, J.M. & Paulson, R.F. BMP4 and Madh5 regulate the erythroid response to acute anemia. Blood 105, 2741–2748 (2005).
58. Falanga, V. et al. Hypoxia upregulates the synthesis of TGF-β 1 by human dermal fibroblasts. J. Invest. Dermatol. 97, 634–637 (1991).
59. Dullaers, M. et al. A T cell-dependent mechanism for the induction of human mucosal homing immunoglobulin A-secreting plasmablasts. Immunity 30, 120–129 (2009).
60. Liu, Y. et al. Suppression of Fas-FasL coexpression by erythropoietin mediates erythroblast expansion during the erythropoietic stress response in vivo. Blood 108, 123–133 (2006).
© 2
011
Nat
ure
Am
eric
a, In
c. A
ll ri
gh
ts r
eser
ved
.
nAture medicine doi:10.1038/Nm.2462
ONLINE METHODSHuman subjects. Subject samples were obtained with informed consent from the donors and after approval by the institutional review board at Hopital Necker (Paris, France). Bone marrow aspirates and sera were collected from individu-als admitted to the Department of Hematology at the Necker-Enfants-Malades Hospital (Paris, France). Umbilical cord blood cells from normal full-term deliveries were obtained from the Department of Obstetrics (Necker-Enfants-Malades Hospital, Paris, France). Human tonsils were obtained from individuals undergoing tonsillectomy in the Department of Otorhinolaryngology (Necker-Enfants-Malades Hospital, Paris, France). Serum samples from chronically hypoxemic individuals were from Foch hospital (Suresnes, France) and Clinique Geoffroy Saint-Hilaire (Paris, France).
Mice and anemia models. α1KI mice were previously described18. α1KI mice were also backcrossed with joining chain knockout mice (Igj−/−)19. Controls were littermates in all experiments.
NOD-SCID mice (6–8 weeks old) were from Jackson Laboratories. All mouse experiments were approved by the INSERM Ethics Committee for Animal Experimentation. Acute hemolytic anemia was induced either by injection of PHZ (Sigma) or antibodies to RBCs. PHZ was injected at a concentration of 50 mg per kg body weight twice, with an interval of 24 h between injections. In PHZ-treated mice, FACS compensation (to prevent spillover between signals) was performed using tubes containing cells with only one fluorescent label from treated mice. Immune-mediated anemia was induced by a single intra-peritoneal injection of 100 µg of purified antibodies to RBC (34-3C, IgG2a) (derived from unmanipulated NZB mice)26 kindly provided by S. Izui (Department of Pathology and Immunology, University Medical Center, Geneva, Switzerland). Central anemia was induced by a single intraperito-neal injection of 5-fluorouracil (150 mg per kg of body weight). For passive transfer experiments, NOD-SCID mice were injected intravenously with pIgA1 or IgG (400 µg at days –1 and 0 and every 2 d thereafter until killing at day 9) (purified as previously described11). For each mouse, blood was collected from the retro-orbital plexus, and hematological parameters were monitored with an MS9 analyzer (Melet Schloesing). Reticulocyte counts were performed using the BD Retic-Count Reticulocyte Reagent (BD Biosciences). Nonspecific labeling was excluded after comparing PBS- and Reticount-labeled samples.
For intermittent chronic hypoxia, mice were exposed to hypoxia (8% oxygen; Messer) for 14 h followed by reoxygenation (20% oxygen) for 10 h for 3 d consecu-tively in a hypoxic animal chamber and killed immediately thereafter. Five hundred microliters of blood were taken by retro-orbital bleeding for further analysis.
In vitro generation of human erythroid cells. CD34+ progenitors were isolated from cord blood using the Miltenyi CD34 Progenitor Cell Isolation Kit and cultured for 7 d with IL-6 (100 ng ml−1), IL-3 (10 ng ml−1) and SCF
(100 ng ml−1). CD36+ erythroid cells were further positively selected from these cultures using magnetic beads and cultured in the presence of IL-3 (10 ng ml−1), SCF (100 ng ml−1) or Epo (2 U ml−1) in Iscove’s modified Dulbecco’s medium (IMDM; GIBCO cell culture) supplemented with 15% BIT 9500 serum substitute (Stemcell Technologies) as previously described3. In this medium, the Fe-Tf concentration was 200 µg ml−1, which corresponds to 3 µM (the concentration of Fe-Tf usually found in human serum). In some cases, CD36+ cells were cul-tured with cytokines as described above in IMDM supplemented with insulin (7.5 µg ml−1), BSA (7.5 mg ml−1) and 5% human serum from either healthy subjects, individuals deficient in IgA or individials with multiple myeloma with increased IgA levels.
UT-7 cells were maintained in minimum essential medium alpha supple-mented with 5% FCS (Hyclone) and Epo (2 U ml−1) at 37 °C in a 5% CO2 humid-ified atmosphere. To starve cells from growth factors, the cells were washed and maintained in medium without cytokines for 16–18 h before the experiments and were processed as described below. In some experiments, the cells were starved of growth factors and of transferrin for 18 h in the presence of IMDM containing 0.4% BSA and 5 µM ferric nitrilotriacetate. Cell viability was evalu-ated by ATP incorporation (using a CellTiter-Glo Assay, Promega).
Methylcellulose assays. Single-cell suspensions of bone marrow or spleen from adult mice were mixed with methocult M3434 medium (Stemcell Technologies), plated into 35 mm dishes and cultured at 37 °C in a 5% CO2 humidified atmosphere. The BFU-E colonies were scored at day 10 (in some experiments, mouse BFU-E were scored from day 7 onward to day 10, and there was no difference in colony numbers at day 7 and at day 10). Human progenitor CD34+ cells (isolated from human cord blood) were plated in methocult H4230 (Stemcell Technologies) in the presence of IL-6 and IL-3 (20 ng ml−1), GM-CSF (10 ng ml−1) and various concentrations of SCF (0.5–100.0 ng ml−1) and/or Epo (0.1–2.0 U ml−1). BFU-E colonies were scored after 16 days according to the manufacturer’s recommendations (Stemcell Technology). Three different cultures were derived independently from each cord blood sample.
Statistical analyses. Statistical analyses were performed with GraphPad Prism (version 5.0; GraphPad Software). The data are expressed as the mean ± s.e.m. of n determinations unless noted otherwise. A Student’s t test or a Mann-Whitney test was used to compare two groups, whereas multigroup comparisons were made using a two-way analysis of variance test followed by post-hoc analysis (Bonferroni test). We computed the correlation between the pIgA percentage and the hematobiological parameters with the Spearman’s ρ coefficient. Differences were considered significant at P < 0.05 (*), P < 0.01 (**) or P < 0.001 (***).
Additional methods. Detailed methodology is described in the Supplementary Methods.
© 2
011
Nat
ure
Am
eric
a, In
c. A
ll ri
gh
ts r
eser
ved
.
Copyright © 2022 FDOKUMEN