Do Alcoholics Know What They're Doing? Identifications of the Act of Drinking
Upload
independentCategory
view
2download
0
0 145-6008/92/ 1606- 1078$3.00/0 ALCOHOLISM: CIJNICAL A N D E X P F R I M ~ N T A L RESEARCH
Vol. 16, No. 6 NovemberfDecernber
Brain Gray and White Matter Volume Loss Accelerates with Aging in Chronic Alcoholics: A Quantitative
MRI Study Adolf Pfefferbaum, Kelvin 0. Lim, Robert B. Zipursky, Daniel H. Mathalon, Margaret J. Rosenbloom, Barton Lane, Chung Nim Ha,
and Edith V. Sullivan
Magnetic resonance imaging (MRI) was used to study in vivo the brains of 49 patients with chronic alcoholism, 3 to 4 weeks postwith- drawal, and 43 normal healthy controls, all right-handed male veter- ans between the ages of 23 and 70 years. MRI scans were analyzed using a semi-automated procedure, which allowed the subcortical regions to be segmented into cerebrospinal fluid (CSF) and brain tissue and the cortical regions to be segmented into CSF, gray matter, and white matter. An age regression model was used to examine the effects of alcohol on brain structure, over and above that expected from the normal aging process. The alcoholics exhib- ited decreased tissue and increased CSF after correcting for aging. In the cortex, there was significant loss of both gray matter and white matter volume. In this sample of alcoholics, no particular cortical region was preferentially affected or spared. Furthermore, brain tissue volume loss increased with advanced age in the alco- holics. In this group of alcoholics there was no relationship between length of illness and age, i.e., the younger alcoholics had as heavy alcohol use histories as did the older alcoholics. Thus, the increased brain tissue loss with advanced age is interpreted as evidence for age-related increase in brain vulnerability to chronic alcohol abuse.
Key Words: Alcoholism, Brain, MRI, Aging, White Matter.
UMEROUS NEURORADIOLOGICAL and neuro- N pathological studies have reported that significant structural alterations occur in the brains of chronic alco- holics (for reviews These alcohol-related abnormalities are widespread and may be particularly marked in the anterior regions of the brain.'-7 Post-mortem studies sug- gest a special vulnerability of cerebral white matter to the neurotoxic effects of alcohol, with little or no gray matter reduction.*-]' By contrast, an in vivo study using magnetic resonance imaging (MRI) has revealed widespread deficits in the volumes of cortical and subcortical gray matter structures as well as focal subcortical white matter abnor- malities in alcoholics." No MRI study to date, however,
From the Psychiatry and Radiology Services, Department of Veterans Afsairs Medical Center, Palo Alto, California; and Departments of Psy- chiatry and Behavioral Sciences and Radiology, Stanford University School of Medicine, Stanford, California.
Received for publication December 30, 1991; accepted June 29, I992 This study was supported by National Institute on Alcohol Abuse and
Alcoholism (AA 05965), National Institute ofMental Health (MH 30854), the Department of Veterans Affairs, National Alliance for Research in Schizophrenia and Affective Disorders, Norris Mental Health Center, and the Meyer Foundation.
Reprint requests: Dr. Adolph Pfeferbaum, Psychiatry Service I16A, VA Medical Center, 3801 Miranda Avenue, Palo Alto, CA 94304.
Copyright 0 I992 by The Research Society on Alcoholism.
I 078
has quantified reductions in cerebral gray vs. white matter volumes as they relate to chronic alcoholism. Decrease in white matter volume may result from demyelination; neu- ritic dystrophy12 and demyelination of cerebral white matterI3 have been observed in rats fed alcohol prenatally. As pointed out by Harper and Knl,' although demyeli- nation is not an histological feature of chronic alcoholism, it may subtly contribute to the reduction in white matter volume, which may be detectable with a quantitative MRI study.
In vivo brain imaging of chronic alcoholics can provide a critical extension to post-mortem studies, which have inherent flaws of difficulty in collection of essential, quan- titative ante-mortem data and of fixation artifacts. In particular, neuropathological studies commonly do not have access to the alcohol consumption status of the subjects at time of death, and because of limited numbers of cases, typically combine subjects spanning broad age ranges, thus ignoring the interactive effects of aging and alcohol abuse. Additionally, the failure to observe gray matter volume changes at autopsy may be due to artifacts in specimen preparation and fixation differentially affect- ing gray matter, which has a higher water content than white matter. Furthermore, it is vital to have appropriate age controls for the normal age-related changes which affect gray matter but not white matter, even over a restricted age range of 20 to 45 years.I4
In our initial computed tomography (CT) investigation of alcohol-induced brain damage, we used an age-regres- sion model'' to account for normal age-related brain changes and applied them to CT values obtained in chronic alcoholics. l 6 The age correction permitted analysis of brain changes related to alcoholism, over and above those seen with normal aging. With this statistical method, we demonstrated increases in cerebrospinal fluid (CSF) volume and concomitant decreases in tissue volume throughout the brain. Despite age correction, brain tissue losses were greater for older alcoholics than younger al- coholics and were positively associated with lifetime al- cohol consumption. The observed acceleration of brain tissue loss with age in alcoholics suggested that the aging brain may be especially susceptible to the deleterious effect of alcohol. In the earlier sample of alcoholics, however, age and disease duration were correlated; thus, it remained
Alcohol Clin Exp Res, Vol 16, No 6, 1992: pp 1078-1089

MRI IN CHRONIC ALCOHOLISM 1079
unclear whether the brain abnormalities were related to aging, length of abusive drinking, or both. Furthermore, the CT study, which assessed volume of CSF, was unable to address whether the assumed tissue loss was attribut- able, in life, to diminished gray matter alone or to both gray and white matter.
Impaired nutrition is a frequent sequela of chronic alcohol abuse and one that possibly interacts with alcohol exposure to produce liver disea~e’~ and pathological changes in the Although extreme malnourish- ment, as manifest in anorexia nervosa, is associated with brain ventricular enlargement which reverses to some extent with treatment,20-22 the level of malnourishment present in alcoholics participating in treatment programs and recruited to research protocols is considerably less than that associated with anorexia. Nonetheless, our orig- inal CT study of alcoholisrnl6 did not provide evidence for nutritional effects on brain structure in that body mass index (BMI), hemoglobin and mean corpuscular volume (MCV) were correlated with ventricular size. However, the contributions of cumulative alcohol exposure and nutritional status on the morphology of different brain tissue types have yet to be investigated with quantitative MRI data.
Compared with CT, MRI provides an improved in vivo technique to image soft tissue and to distinguish brain tissue types. MR images are useful in differentiating gray matter from white matter as well as CSF from tissue. We have developed a three compartment segmentation analy- sis technique, which semi-automatically separates gray- matter, white matter, and CSF.23 A quantitative, volumet- ric measurement is yielded by summing the pixels of each compartment over multiple sections. Here, we applied this segmentation analysis and the age regression model to MRI scans obtained in men with chronic alcoholism (age 26 to 63) and similar age controls. The present report is one component of a longitudinal study investigating short- term (1 to 4 weeks post-detoxification) and long-term recovery (1 and 2 years) of brain changes related to chronic alcohol abuse. The results reported here were derived from MRI scans acquired about 4 weeks after detoxification; this interval is commonly used so as to assess the chronic rather than the acute effects of alcohol abuse. Further, assessment at this interval permitted replication of our earlier CT findings in chronic alcoholics and extension of them to include an investigation of gray and white matter effects. The goals of the present study were: (1) to quantify differences in volumes of gray matter, white matter, and CSF in alcoholics using age-corrected measures; (2) to seek regional variations in brain volume measures of each of the three tissue types; and (3) to test whether the aging brain is especially vulnerable to the neurotoxic effects of chronic alcohol abuse. In addition, we examined the pre- dictive value of routine clinical laboratory tests, which are influenced by general health and nutrition.
METHODS
Subjects
Patients with Chronic Alcoholism. The sample included 49 veterans of the United States Armed Forces (Table 1). All patients were right- handed men, recruited for this study as follows. Consecutive admissions to the Alcohol Rehabilitation program at the Palo Alto Department of Veterans Affairs Medical Center (DVAMC) were reviewed for eligibility for this study. The MRI data reported here were acquired on average one month following a patient’s last drink (mean = 33.4 days, range = 26-63, SD = 7.03). Patients were considered for entry into this study if they met the following eligibility criteria: age 20 to 70, Research Diag- nostic Criteria (RDC24 criteria for alcoholism, no past history of hospi- talization for DSM-111-R” diagnosis of schizophrenia or major affective disorders, no history of medical or neurological illness or trauma which would affect central nervous system (CNS), no seizure disorder unrelated to alcohol withdrawal, nor dilantin or steroid use in the past month, last drink at least 3 weeks prior to the MRI scan, and no history of metal implantation which would preclude MRI scanning. Subjects meeting RDC criteria for substance abuse other than alcohol within the past year were excluded.
These criteria were applied in the following manner. First, the hospital charts of all new admissions were reviewed for readily determinable exclusion factors (age, interval since last drink, prior hospitalization‘for clearly diagnosed psychiatric disorder, current drug abuse or use of contraindicated drugs, well-documented medical disorder). Patients who passed the initial chart review were invited to participate in the study, and if they consented, underwent additional screening.
Psychiatric screening involved an interview by a psychiatrist or a post- doctoral fellow in psychiatry, using the Schedule for Affective Disorders and Schizophrenia-Lifetime (SADS-L)26 to confirm absence of current or past psychiatric and nonalcoholic drug use problems, and confirma- tion of RDC diagnosis. Medical screening included a medical and psy- chiatric history, physical examination, and a panel of blood tests (CBC, SMA-20) administered to all patients on admission. CBC, SMA-20 were also obtained at the time of MRI scan. These data were reviewed for evidence of liver, heart, pulmonary disease, thyroid dysfunction, diabetes, or other diseases that might affect the variables being measured. BMI was calculated as weight in kilograms per height in meters squared.
Normal Control Subjects. The controls included 43 men recruited from the neighboring community (Table I). All were veterans, age 23 to 70 years old. Subjects responding to recruitment advertisements were initially screened over the phone. Those willing to participate and passing this screen were invited into the laboratory where they were further screened by a psychiatric interview (SADS-L) and a lifetime alcohol use interview.
Controls met the same psychiatric and medical criteria, including blood work, as the patients. Subjects were excluded if they met RDC criteria for substance abuse in the past year, or had drunk more than 54 g ethanol per day (equivalent of four “drinks” containing an average of 13.6 g ethanol) for a period exceeding 1 month.
Demographic Data for Alcoholic and Control Groups (Table 1). The two groups were matched for age in mean and range. All subjects were self-declared right-handers and were also matched on a quantified mea- sure of handedness2’ The National Adult Reading Test (NART)28 and
Table 1. Demographic Characteristics: Means, Standard Deviations, and Ranges
Age Group (years)
Normal control 45.4 (N = 43) (12.5)
Alcoholic 45.0 23-70
(N = 49) (9.5) 26-63
Education (years)
(2.4) 16.0
12-21 13.3“‘ (2.8) 8-20
Vocabulary NART age-scaled
IQ score 109.5 11.7 (7.1) (2.6)
90-125 7-18 107.0 10.3” (7.9) (2.4)
94-125 6-17
Handedness score
(range = 14-7O)t
18.8 (4.2)
14-28 18.9 (5.2)
14-32
t Range for right handedness = 14 to 32. ** p < 0.01, ’** p < 0.001 (group differences derived from t tests).

1080
55-
50.
PFEFFERBAUM ET AL.
5 .
0.
the age-scaled Vocabulary subtest of the Wechsler Adult Intelligence Test-Revised (WAIS-R)29 were administered to each patient within a week of their MRI scan (Table 1). The NART is considered to reflect premorbid IQ while the Vocabulary subtest provides an estimate of current Verbal IQ and is commonly related to educational experience. Although the alcoholic group had significantly fewer years of education than the control group, the NART scores of the two groups were equivalent. The patients had lower Vocabulary age scaled scores (SS) than controls, which could reflect the difference in educational experi- ence, or alternatively, an illness-related deficit, particularly in light of the lack of difference in NART scores.
Questionnaire for Alcohol Consumption. To quantify exposure to alcohol in both the alcoholic patients and the normal control subjects, we used a semi-structured interview based on one developed by Skinner3’,” and Skinner and Sheu.” The interviewer began by asking the subject how old he was when he first drank on a regular basis (at least one drink/month). The quantity (how many drinks/day) and fre- quency (how many drinks on average in a month) were elicited. “Nor- mal” daily quantities were elicited separately from “maximum” daily quantities. Then the subject was asked to think of when his drinking behavior ever changed in any appreciable way. In a chronological fashion, the interviewer helped the subject describe his life as a series of “drinking stages,” and estimated normal and maximum quantity and their fre- quencies for each stage. Approximate body weight at each stage was also estimated. Various liquors were converted into “drink” equivalences, each given a value of 13.6 g absolute alcohol.
Although the normal control and the alcoholic groups drank alcohol for about the same length of time, the lifetime ethanol intake of the alcoholic group was about 17 times that of the normal control group. As a group, the alcoholics had their first drink at a younger age than the controls (Table 2, p < 0.01).
An important feature of the alcoholic group was that the onset age of alcoholism was significantly correlated with current age ( r = 0.64, p = 0.0001). Complementing this feature was the lack of correlations of age with disease duration ( r = 0.12, NS), years of alcoholic drinking ( r = 0.14, NS), or total lifetime intake of ethanol ( r =0.04, NS) (Fig. 1). Disease duration was highly correlated with total lifetime ethanol intake ( r =
0.69, p < 0.0001). Thus, in this sample of alcoholics, the effect of age could be assessed relatively independently of disease duration and total lifetime intake of ethanol.
Questionnairefor Family History ofAIcohol Abuse. Information about alcoholism in relatives was available to dichotomize subjects as family history positive (FH+) or family history negative (FH-). A person was determined to have a positive family history if at least one first degree family member was considered a “problem drinker.” This information was also used to develop continuous measures of family history density based on the number of affected relatives, and whether they were first or second degree. These data were available for 37 control subjects and 45 alcoholics (Table 2). Of these subjects, 38% of controls and 67% of alcoholics had at least one first- or second-degree relative who had problems with alcohol ( p < 0.01); 24% of controls and 47% of alcoholics reported that one or both parents had problems with alcohol.
0 .
0 . .
Table 2. Drinking Characteristics: Means, Standard Deviations, and Ranges
Disease Years Lifetime No. problem duration drinkin a%% ethanol drinkers in
Group (years) alcoho? drink intake (kg) familyt
Normal control 23.8 20.1 74.4 0.6 (12.6) (6.0) (83.7) (0.9) 3-50 13-50 1-366 0-3
Alcoholic 19.1 25.7 16.9‘‘ 1249.8”’ 1.4” (9.8) (8.8) (3.8) (855.9) (1 3) 0-43 12-45 5-25 122-4383 0-5
t Taken from the subjects’ reports. “ p -= 0.01, “ * p < 0.001 (group differences derived from t tests).
. .* . . 8
15
10
, / o 0 ..* . . . . * . . . _. 25 30 35 40 45 50 55 60 65
. . . .
25 30 35 40 45 50 55 60 65
Age Fig. 1. Disease onset, disease duration and total ethanol intake plotted as a
function of age for the alcoholics.
MRI IN CHRONIC ALCOHOLISM 1081
Procedure thresholding technique was validated against our previously reported
MRI Scan Acquisition. All patients were scanned using a 1.5T General Electric Signa MRI scanner. Scanning parameters and procedures used in this study have been previously described in detail by Lim and Pfefferbaum*’ and Zipursky et al.I4 Axial MR images were acquired using a spin-echo sequence with a field of view of 24 cm and a 256 x 256 matrix. Acquisition was gated to every other cardiac cycle for an effective TR of >2400 msec with one excitation for each of 256 phase encodes. Early and late echoes were obtained at 20 msec and 80 msec, respectively. All axial images were oriented in an oblique plane, perpendicular to the sagittal plane, and passing through the anterior and posterior commis- sures which were identified from a midsagittal image. Beginning inferiorly at the base of the pons, 17 to 20, 5-mm thick sections were collected with a 2.5-mm interslice skip to reduce crosstalk.
MRI scans of all patients and control subjects were independently evaluated by a clinical neuroradiologist. No patient was excluded on the basis of clinical readings, but four control subjects were excluded for the following reasons: one for marked ventriculomegaly and possibly arrested communicating hydrocephalus, one for colpocephaly, and two for sub- arachnoid cyst.
MRI Section Selection Criteria and Quantixcation. All images were stored on magnetic tape, transferred to a laboratory mini computer and coded to allow processing to be performed blind to subject identity, age, diagnosis, and neuroradiologist’s report. For each scan the most inferior section above the level of the orbits, where the anterior horns of the lateral ventricles could be seen, was identified as an index section. Eight consecutive sections, beginning at the section immediately inferior to the index section and proceeding rostrally, were analyzed for each subject. The lowest section was used only for quantification of the third ventricle. The superior seven sections were used in volumetric quantification. Sections superior to this were excluded because, in many subjects, they contained only fluid and partially volumed cortical tissue, making quan- tification unreliable. Sections inferior to the index section were also excluded from all but the third ventricle analysis because their irregularly shaped skull boundaries precluded stripping of skull and soft tissue pixels from the images, a preprocessing requirement for automated tissue segmentation.
Three Compartment Image Segmentation. Each of the MRI sections was segmented into CSF and tissue or gray matter and white matter compartments, using a semi-automated image analysis technique devel- oped in this laboratory.’’ The technique consisted of the following steps: First, skull margins were identified, and skull and all pixels peripheral to it were stripped from each image. Then, in order to enhance CSF-tissue contrast, a composite image was created by subtracting late from early echo images. This image was filtered using a homomorphic digital filter to reduce the effects of radiofrequency inhomogeneity (which results in spatial variations in baseline pixel intensity). Trained research assistants blind to subject identity, age, and diagnosis identified the image intensity value above which all pixels could be considered tissue and below which all pixels could be considered CSF. In addition, midlines were drawn to separate the left and right hemispheres of the brain for all brain sections using a series of 17 points for all sections inferior to the centrum semiovale and 9 points for all sections located more superiorly. For each scan, the most anterior and posterior points of the corpus callosum were also identified.
Inter-rater reliability for six raters and 15 subjects was assessed with intraclass correlation^^^ for the left and right hemispheric estimates of CSF and tissue volume and third ventricle CSF. The reliabilities ranged from 0.95 for the third ventricle to 0.99 for the hemispheric measures.
In order to enhance gray-white contrast, another set of composite images was created by adding together pixel intensity values for the early and late echo images. These composite images were also filtered to reduce radiofrequency inhomogeneity. Gray-white segmentation was achieved using an automated procedure3’ based on a nonparametric histogram analysis te~hnique.)~ All pixels identified as tissue during manual thresh- olding were subjected to histogram analysis which determined the thresh- old value separating gray from white matter. This automatic gray-white
operator-driven thresholding methodF3 Inter-rater reliability for the man- ual gray-white separation technique had a rho = 0.73, while comparing the automated technique to this manual technique yielded a rho = 0.79.
The quality of the segmentation was judged blind to diagnosis for each subject by comparing it to the MRI films. Scans of one control and three alcoholics were eliminated from further analysis because of seg- mentation failure, in which gray and white matter classification was reversed due to periventricular and deep white matter hyperintensity.
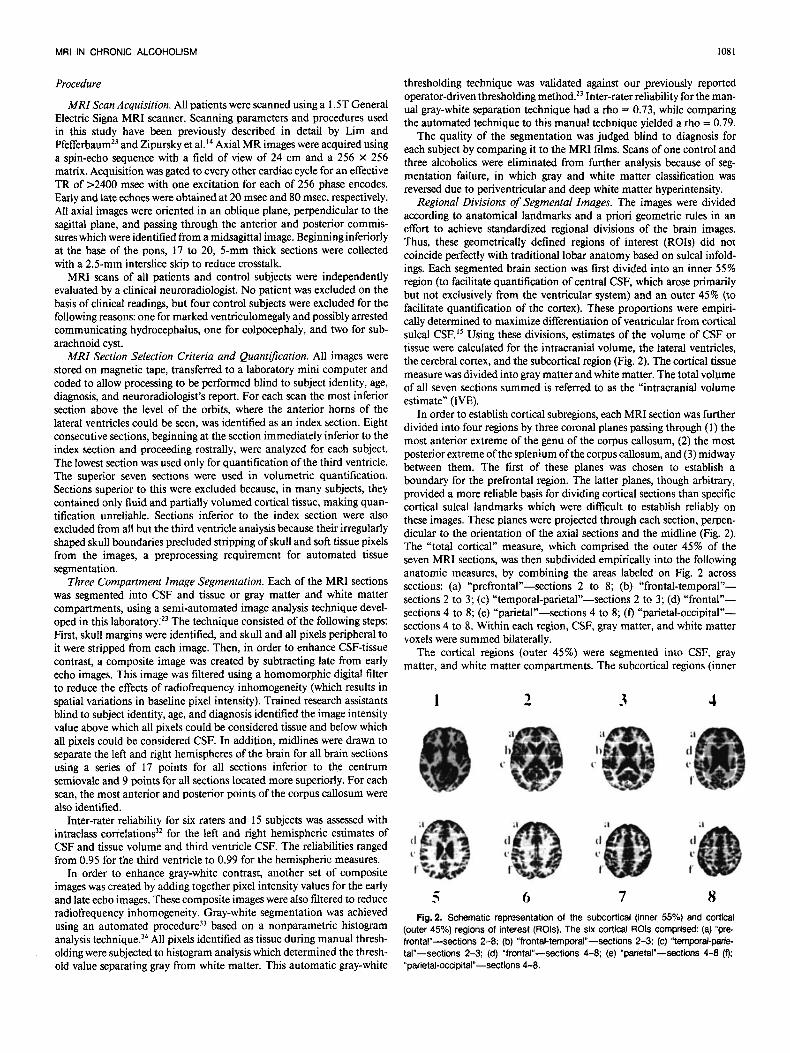
Regional Divisions of Segmental Images. The images were divided according to anatomical landmarks and a priori geometric rules in an effort to achieve standardized regional divisions of the brain images. Thus, these geometrically defined regions of interest (ROIs) did not coincide perfectly with traditional lobar anatomy based on sulcal infold- ings. Each segmented brain section was first divided into an inner 55% region (to facilitate quantification of central CSF, which arose primarily but not exclusively from the ventricular system) and an outer 45% (to facilitate quantification of the cortex). These proportions were empiri- cally determined to maximize differentiation of ventricular from cortical sulcal CSF.I5 Using these divisions, estimates of the volume of CSF or tissue were calculated for the intracranial volume, the lateral ventricles, the cerebral cortex, and the subcortical region (Fig. 2) . The cortical tissue measure was divided into gray matter and white matter. The total voLume of all seven sections summed is referred to as the “intracranial volume estimate” (WE).
In order to establish cortical subregions, each MRI section was further divided into four regions by three coronal planes passing through ( I ) the most anterior extreme of the genu of the corpus callosum, ( 2 ) the most posterior extreme of the splenium of the corpus callosum, and (3) midway between them. The first of these planes was chosen to establish a boundary for the prefrontal region. The latter planes, though arbitrary, provided a more reliable basis for dividing cortical sections than specific cortical sulcal landmarks which were difficult to establish reliably on these images. These planes were projected through each section, perpen- dicular to the orientation of the axial sections and the midline (Fig. 2). The “total cortical” measure, which comprised the outer 45% of the seven MRI sections, was then subdivided empirically into the following anatomic measures, by combining the areas labeled on Fig. 2 across sections: (a) “prefronta1”-sections 2 to 8; (b) “frontal-temporal”- sections 2 to 3; (c) “temporal-parietal”-sections 2 to 3; (d) ‘‘frontal”- sections 4 to 8; (e) “parietal”-sections 4 to 8; (0 “parietal-occipital”- sections 4 to 8. Within each region, CSF, gray matter, and white matter voxels were summed bilaterally.
The cortical regions (outer 45%) were segmented into CSF, gray matter, and white matter compartments. The subcortical regions (inner
1
c 3 6
3
7
4
8 Fig. 2. Schematic representation of the subcortical (inner 55%) and cortical
(outer 45%) regions of interest (ROls). The six cortical ROls comprised: (a) “p re frontal”-sections 2-8; (b) “frontal-temporal”-sections 2-3; (c) “temporal-pane tal”-sections 2-3; (d) “frontal”-sections 4-8; (e) “parietal”-sections 4-8 (0; “parietal-occipital”-sections 4-8.

1082 PFEFFERBAUM ET AL.
55%) were segmented only into CSF and tissue compartments because the automated method, which discriminated between gray and white matter, can fail in the presence of large hyperintensities appearing pen- ventricularly and in the centrum semiovale (see al~o’~3’~). The IVE measure, which comprised the cortical and subcortical regions, was also segmented in two compartments, CSF and tissue.
White Matter Lucency Raiing System. In order to assess the extent of white matter hyperintensities in the image data amenable to segmenta- tion analysis, all MRI films were blinded to diagnosis and rated by an experienced neuroradiologist (BL) using separate scales, modified from van Swieten et al.,” for periventricular lucencies (PVLs) and deep white matter lucencies (DWMLs), which clinically are read as “lesions.” The PVLs were graded on a 4-point scale (0 = none; 1 = minimal; 2 = moderate; 3 = extensive). The DWMLs were graded on a 5-point scale (0 = none; 1 = one lesion less than 1 mm; 2 = one to five lesions; 3 = five to ten lesions; 4 = more than 10 lesions or a single lesion greater than 1 cm in diameter).
Statistical Analysis Using regression analyses, the pixel counts which formed the volu-
metric ROI measures were corrected for two sources of variation known to influence brain size: headsize (intracranial volume) and normal aging. The statistical procedure was carried out in two steps, the first controlling for headsize, and the second controlling for age. In the first step, linear regressions of the brain measures on the IVE were performed in the normal control group. The IVE comprised the sum of all pixel counts (CSF and tissue) over the seven sections on which the volumetric measures were based. The predicted values from these regression analyses represented the predicted ROI norms for a given headsize. Residual ROI values were then calculated for both the normal controls and the alco- holics by subtracting the predicted scores, based on the subject’s WE, from the observed scores.
In the second step, these residualized pixel counts (i.e., residualized on IVE) were regressed on age for the normal control group. Two issues were addressed in performing the age regression analyses. The first concerned the form of the regression line. Previous studies have indicated that, depending on the ROI, brain volume may change in a linear or a curvilinear fashion with age.’5.36.38 Using a polynomial regression ap- proach, quadratic functions usually emerge as the best representation of curvilinear age trends. However, in the age range of 20 to 70, quadratic curves sometimes have inflection points that do not make biological sense (e.g., CSF increases after age 20 and before age 20). Our solution was to depict curvilinear age trends using a quadratic polynomial regres- sion model constrained to permit only monotonic changes from age 10 onwards. The age 10 constraint was chosen based on post mortem studies suggesting that adult brain weight is substantially achieved by about age
When applied to ROIs that show linear age trends, the constrained quadratic model produced nearly linear regression lines. Thus, the con- strained quadratic model was flexible enough to fit both linear and curvilinear data treods, and did not produce biologically implausible curve inflections.
The second issue concerned how to deal with age-related increases in brain volume variability that have been evident in previous normal aging s t~dies .~~,~~. ’* Ordinary least squares (OLS) regression assumes that the variance is constant or “homoscedastic” across the range of the predictor variable. To deal with heteroscedasticity in the data, weighted least squares (WLS) regression was used instead of OLS regression. A proce- dure based on Glejser’s4’ test for heteroscedasticity provided estimates of the ROI standard deviations specific for each age. These estimates served as weights in the (constrained quadratic) age regression analyses. The estimates also served as age-specific standard deviations for the denomi- nator of a “Z-score” calculation described below.
After the age regression analyses was completed, the predicted values were used to calculate age-normalized Z-scores for all subjects. For each ROI, the Z-score was calculated as follows:
(observed score - predicted score for a given age) control standard deviation for a given age Z =
Thus, the Z-score, which was the final unit of analysis, was based on headsize-corrected pixel counts that were then expressed as standard deviations from estimated age norms. Data from the control subjects were used to generate age norms for each MRI measure.
Correlations of global brain measures with demographic, alcohol use, laboratory, and family history variables were calculated with Pearson Product-Moment tests. Analysis of variance (ANOVA) with repeated measures for ROIs were performed for each MRI compartment across the two groups. In addition, white vs gray matter effects were assessed by ANOVA with repeated measure for compartment across the two groups, and by paired t tests comparing Z-scores for white and gray matter in each cortical ROI. Multiple regression analysis was used to assess the contribution of drinking history to the MRI scores. Because the multiplicity of statistical analyses used could result in Type I errors, we have explicitly described all tests carried out specifying multiple levels of statistical significance and have been conservative in interpreting the differences, providing Bonferroni corrections where appropriate.
RESULTS
Brain Volume Estimates of Normal Control Subjects The estimate of intracranial tissue volume in the con-
trols was based upon the seven sections comprising 463 cc (105,379 pixels; volume of 1 pixel = 4.4 mm3). Taking into account the 2.5-mm skip between sections, the IVE covers about half the brain. Thus, doubling the IVE of this normal control sample yields an estimate of total brain volume comparable to post mortem studies. CSF volume of the IVE was about one-seventh of tissue volume (CSF: 17,222 pixels = 76 cc). The cortical region had, on average, 44 cc of CSF and a greater volume of gray matter (1 17 cc) than white matter (87 cc).
Within the control group, age correlated significantly with all but one measure of CSF and gray matter volumes, but not white matter volume (Table 3). In general, CSF volume increased with age and gray matter volume showed a complementary decrease. For the total cortical ROI, CSF, and gray matter volumes correlated highly with each other ( r = 0.66, p < O.OOOI), whereas white matter volume correlated less so with gray matter volume ( r = 0.34, p < 0.03) and did not correlate significantly with CSF ( r = 0.12, NS).
Table 3. Age Correlated with Raw MRI Scores for Each ROI in 43 Controls
ROI CSF Tissue Grav White
IVE Cortical
Prefrontal Frontal Parietal Parietal-occipital Frontal-temporal Temporal-parietal
Lateral ventricles Third ventricle
Subcortical
0.64***’ 0.60”*’ 0.51 *** 0.59**** 0.47‘. 0.24 0.65”” 0.51*** 0.43” 0.50*’* 0.59””
~
-0 18 -0 58”” 0 26 -0 43*’ 0 09 -0 62”” 0 26 -0 47”’ 0 19 -0 38’ 0 25 -0 51 **’ -0 23 -0 63’*** 0 21
-0.1 3
~~
Family-wise Bonferroni correlations (alpha = 0.05) for two comparisons = 0.025,
‘ p 5 0.05, * * p < 0.01, “ ‘ p 5 0.001, ****p c 0,0001. for seven comparisons = 0.007, and for 11 comparisons = 0.005.

MRI IN CHRONIC ALCOHOLISM 1083
Brain Volume Estimates of Alcoholic Patients Raw MRI Scores (Pixel Counts). The alcoholic and
control groups had similar estimates of intracranial vol- ume (alcoholics = 121,382 pixels = 533 cc; controls = 122,601 pixels = 539 cc; t(90 = -0.539, NS). Despite this similarity in IVE, analysis of raw MRI scores expressed as pixel counts revealed that the alcoholic group had signifi- cantly more CSF ( p < 0.00 1) and less tissue volume ( p < 0.01 5 ) than did the control group (Table 4). The alcoholics had about 30% more CSF than the controls. The abnor- mally large CSF volumes were present in all cortical and subcortical ROIs, including the lateral and third ventricles. The tissue deficit occurred in the subcortical and cortical regions, where it encompassed both gray matter ( p < 0.05) and white matter ( p < 0.05).
MRI Scores Residualized on IVE. In order to minimize effects on regional volume due to normal variation in headsize, the raw scores of the controls were residualized on the IVE, and the resulting values were used to stand- ardize the MRI scores of the alcoholics. The pattern of results with this headsize correction was the same as
observed with the raw scores (Table 4 and Figs. 3 and 4, left).
Age-Corrected MRI 2-Scores. Because of the system- atic influence of age on the MRI measures in the control group, the alcoholic patients’ scores, corrected for IVE, were converted to age-corrected Z-scores based on the control data in order to assess the adverse effects of exces- sive alcohol consumption having controlled for age. Even with the age correction, the CSF regional volumes were, on average, 1 standard deviation greater than expected in the control group. Two-way ANOVAs with repeated meas- ures for the six ROIs across the two groups were performed for each MRI compartment. The group effects were sig- nificant for all three compartments [CSF: F(1,90) = 16.294, p < 0.0001; gray: F(1,90) = 9.401, p < 0.003; white: F( 1,90) = 6.659, p = 0.0121 (Fig. 4, right). Neither the repeated measure effects nor the interactions ap- proached significant differences. All global and regional CSF measures showed highly significant enlargement in the alcohol group ( p < 0.01 or less), as assessed with t tests (Table 4 for means and p values from t test). Espe-
Table 4. Mean and Standard Error of the Mean (SEM) for Each MRI Region of Interest (ROI)
Raw MRI Scores Scores residualized Age-corrected
on IVE 2-scores Controls Alcoholics Alcoholics Alcoholics
ROI mean (SEM) mean (SEM) mean (SEM) mean (SEM)
lntracranial volume estimate (WE) CSF Tissue
Total cortical CSF Gray White
Prefrontal CSF Gray White
Frontal CSF Gray White
CSF Gray White
CSF Gray White
Parietal CSF Gray White
CSF Gray White
Subcortical CSF Tissue
Fronto-temporal
Temporo-parietal
Parieto-occipital
Lateral ventricles Third ventricle
17,222 (71 9.2) 105,379 (1,631)
10,038 (403.8) 26,597 (499.7) 19,693 (513.5)
3,333 (145.8) 6,538 (140.4) 3,913 (131.1)
1,465 (76.8) 3,505 (91.9) 2,753 (80.0)
614 (49.0) 1,741 (40.6)
966 (44.9)
334 (34.3) 1,688 (38.2) 1,335 (35.6)
1,280 (67.8) 3,425 (86.7) 3,063 (81 .2)
2,697 (120.3) 6,365 (156.1) 4,630 (233.6)
1,144 (56.8) 9,649 (99.7) 5,158 (368.4)
92 15.8)
22,227 (1,178.6)”‘ 99,154 (1,581)”
12.517 (623.6)” 25,005 (577.4)’ 18,309 (388.2)’
4,048 (200.7)” 6,043 (168.7)* 3,627 (119.6)
1.857 (106.8)” 3,188 (85.2)’ 2,564 (67.8)
805 (61 .8)’ 1,600 (42.1)’
869.5 (47.6)
445 (39.8)’ 1,640 (37.8) 1,230 (32.0)”
1,639 (102.0)” 3,236 (87.1) 2,803 (58.7)”
3,288 (165.2)” 6.d09 (1 70.2) 4,321 (162.2)
1,470 (83.3)” 9,146 (107.4)*” 7,131 (513.6)”
134 flO.lY*
5,104 (1,136.6)”’ -5,104 (1,136.6)”‘
2,479 (623.7)” -1,377 (524.2)’ -1,042 (289.6)”
734 (193.5)” -436 (153.6)’ -219 (103.6)
387 (108.3)” -290 (83.9)’ -145 (59.5)
205 (56.9)” -128 (44.0)’ -103 (46.7)
11 3 (39.3)’ -44 (37.5) -89 (36.5)
351 (105.6)’’ -1 56 (82.7) -215 (65.6)’
573 (17l.OY’ -287 (139.4) -172 (113.2)
335 (80.5)’*’
2,100 (458 .0 r 42 (9.7Y’
-449 (88.6)”’
1.389 (0.249)’*” -1.389 (0.249)””
1.086 (0.235)”’ -0.736 (0.212)” -0.671 (0.196)”
0.969 (216)”’ -0.620 (0.207)’ -0.300 (0.155)
0.854 (0.214)” -0.721 (0.155)” -0.424 (0.1 85)
1.038 (0.225)”’ -0.712 (0.186)” -0.387 (0.171)
0.676 (0.216)” -0.223 (0.176) -0.490 (0.223)
0.893 (0.238)” -0.406 (0,171) -0.563 (0.212)’
0.852 (0.236)*’ -0.459 (0.174) -0.169 (0,147)
1.029 (0.221)”’
1.179 (0.205)”” 1.450 (0.275)””
-1.080 (0.196)’*“
Family-wise Bonferroni correction (alpha = 0.05) for 27 tests = 0.002. ‘ p 5 0.05, * ‘ p 5 0.01, ” “ p 5 0,001, “ * * p I 0.0001 (group differences derived from 2-tailed t tests)

1084
8 7 6 5 4 3 2 1 0
-1 -2 -3 -4
49 ALCOHOLICS Lateral Ventricle CSF
0 .. 0 0
0 0 . 0 .............. ..4 ..... ...'.*............... Re.. .....
-0 .Fc 1
............................ 0 O 0 .......... o , o ..........* o o o .. oq..-.o ...........
-0. - 0 ...................................................................................... ...................... * ...............................................................
PFEFFERBAUM ET AL.
......... 1 ....................................................
49 ALCOHOLICS L a h d Ventricle CSF
8 7 6 5
15000
12000 h m
a 2 9000 v
g - 3000
0
- 3000
3
0
0 0
0
0 ...... .... . 0 0 ...... ._.- 0
............................................................
-6o00l 20 25 30 35 40 45 50 55 60 65 70
Thircl Ventricle CSF
0
E s I
N
00 4
........................... ................ 0 ..................................
-1 ...................... 0 .........!!...................*.............................. -21 0 0 1 ....................................................... ...............................
-31 20 25 80 35 40 45 50 55 60 65 70
-1501 -4 - 200 20 25 30 35 40 45 50 55 60 65 70
Age @ears) Age @m) Fig. 3. Left: Lateral ventricle and third ventricle CSF volume (head-size corrected residual) for the alcoholics, plotted as a function of age. The solid line represents
expected values and dashed lines represent 1 and 2 SD for the controls. Right: Alcoholics' data expressed as agecorrected 2-scores, plotted as a function of age.
ciaily prominent was the enlargement of the third and lateral ventricles (Fig. 3, right). Complementing the in- creases in CSF-filled spaces were highly significant de- creases in tissue volume, as measured by the IVE and subcortical ROIs ( p < 0.000 1).
The two-way ANOVAs (above) performed for each compartment served to test whether the CSF and tissue deficits followed a selective pattern of regional involve- ment. No regional pattern of brain pathology was dem- onstrated using the geometrically defined ROIs (i.e., there was no ROI effect in any of the three ANOVAs). The same results were also obtained with univariate and mul- tivariate trend analysis and profile analysis.
In the alcoholic group, the total cortical measures based on age-corrected Z-scores were abnormally large for CSF by more than 1 standard deviation ( p < 0.0005). This
enlargement of CSF-filled spaces was at the expense of both gray and white matter. The magnitude of the cortical gray and white matter deficits were, on average, 0.7 stand- ard deviations ( p < 0.01; Table 4). When the total cortical region was divided into six ROIs, gray and white matter volume differences between the alcoholic and control groups were pervasive (Table 4, Fig. 5). In particular, gray matter volumes were significantly smaller in three of the six cortical ROIs, showing on average a 0.6-standard de- viation effect. For white matter, regional analysis revealed statistically significant deficiencies in the parietal cortical region only, although all white matter volume measures were, on average, 0.4 standard deviation less in the alcohol group than in the control group. Results from t tests revealed no significant difference between gray and white matter in the extent of deficit in any of the cortical

MRI IN CHRONIC ALCOHOLISM
6 5 4 3 2
49 ALCOHOLICS Cortieal CSF
................... .................................................................
1085
-3 -4 -5
49 ALCOHOLICS Cortical CSF
0 0
0 0
20000 17500 15000
h
312500 pz
6 5 4 3 2
P 1
N -1 - 2 -3 -4 -5
8 0 I
0
.................................... * ................................................. 0 0 .......................... ,, ..................................................... - 0 - .. 0
1 w - a .
- - --. - . ...................................... a................ ................ I ............................... ..). ........ .@. ... .!.. ..................................
0 e.. 0 .
.a 8 0
4 *ti 10000 0 0 Y
0 ................... t.** 0 % 3
2 2 I ........ - . - - . . . ~ . . . ~ - . . ~ - ~ @ 0 - 0 N 1
0.
...,..--..' .t..r-. 0 ...... *..P.--***-'
..&...... . . . 0 ..................
............. ..................... 0 ...a .... ..*....*'". ... ey 0 ............... -2 -1
-EOO~ -3 - 10000 I - -4
0
......................... J"'u ..... ..... a ...............
..............I... .................. ................
y . 0 ..... l .9 .... 9m ................. 0 ............................. 0 . 9 ..... a... ..... ....................................... 0 0 0
.........................
..............I... ................. - / 0 ......................... ......... w.... ........................................................................
5000 h
42500 g o aJ -2500 - -5000 g 9 -7500 z -lm 2 -12500
- 15000 - 17500
20 25 30 35 40 45 50 55 60 65 $0 20 25 30 35 40 45 50 55 60 65 70
Cortical Gray Matter Cortical Gray Matter
0 0
0
-20000 I -61 20 25 30 35 40 45 50 55 60 65 70 20 25 30 35 40 45 50 55 60 65 70
15000 12500 loo00
9- 7500 8 5000
-125001 ~ ~ ~ ~ - Y -
20 25 30 35 40 45 50 55 60 65 70 20 25 30 35 40 45 50 55 60 65 70 Age (Years) Age (Years)
Fig. 4. Left Cortical CSF. gray matter, and white matter volume (head-size corrected residual) for the alcoholics, plotted as a function of age The solid line represents expected values and dashed lines represent 1 and 2 SD for the controls Right Alcoholics' data expressed as age-corrected 2-scores, plotted as a function of age

PFEFFERBAUM ET AL.
* * * *
*p1.05, **p<.Ol, ***p1.001
Prefrontal Gi Frontal
Frontal-tem poral 0 Temporal-parietal 0 Parietal
Parietal-occipital
CSF Gray
subregions. In addition, a two-way ANOVA with repeated measures for total cortical gray and white matter deficits revealed neither a compartment effect [F( 1,90) = 0.37, NS] nor a group by compartment effect [F(1,90) = 0.34,
White matter ratings revealed that the vast majority of both alcoholics and controls had no or few hyperintensities or "lesions" (Table 5). Only four of the cases reviewed (three alcoholics and one control) had DWML more prominent than would be expected for age. Even in these cases, the total volume of affected white matter was prob- ably less than one cubic centimeter. Only three of the cases reviewed (two alcoholics and one control) had PVL graded as moderate.
Correlations of MRI Z-Scores with Age. The influence of aging within the alcoholic group over and above the normal aging effect was assessed by regressing the age- corrected Z-scores on age. Despite the age correction, many MRI measures still correlated significantly with age in the alcoholics, including the whole brain estimate (IVE) of CSF ( r = 0.40, p < 0.005) and tissue ( r = -0.40, p c 0.005) (Table 6, Figs. 3 and 4, right). The most prominent correlations were based on CSF measures; significant cor- relations of CSF volume with age were observed for the total cortical, prefrontal, frontal, parietal, parietal-occipi-
NS] .
Table 5. White Matter Hyperintensity Ratings
0 1 2 3 4
Periventricular lucency rating' Controls (N = 43) 40 2 1 0 Alcoholics (N = 49) 4 4 3 2 0
Controls (N = 43) 3 4 5 3 0 1 Alcoholics (N = 49) 3 3 5 8 2 1
Deep white matter lucency ratingt
* 0 = none; 1 = minimal; 2 = moderate; 3 = extensive. t 0 = none; 1 = one lesion less than 1 mm; 2 = one to five lesions; 3 = five to
ten lesions; 4 = more than ten lesions or a single lesion greater than 1 cm in diameter.
White
Fig. 5. Mean age-corrected 2-scores for the six cortical ROls for CSF, gray matter, and white matter from the alcohol group.
Table 6. Age Correlated with Age-Corrected 2-Scores for Each ROI in 49 Alcoholics
~
ROI CSF Tissue Gray White
IVE 0.40" -0.40** Cortical 0.38" -0.41" -0.17
Prefrontal 0.49"' -0.37** -0.28 Frontal 0.33' -0.22 -0.33' Parietal 0.41 ** -0.35' -0.24 Parietal-occipital 0.36' -0.37** -0.22
-0.44" 0.20 Temporal-parietal 0.22 -0.03 -0.12 Frontal-temporal 0.1 1
Subcortical 0.37" -0.23 Lateral ventricles 0.24 Third ventricle 0.44"
Family-wise Bonferroni corrections (alpha = 0.05) for two comparisons = 0.025.
' p s 0.05, ' * p c 0.01, " ' p 5 0.001, ' *"p 5 0.0001. for seven comparisons = 0.007, and for 11 comparisons = 0.005.
tal, subcortical, and third ventricle measures. Age corre- lated significantly with gray matter Z-scores of the total cortical, prefrontal, parietal, parietal-occipital, and frontal- temporal measures. In contrast, the only significant age correlation with white matter Z-scores was for the frontal cortical measure.
The drinking history variables (disease duration and lifetime alcohol consumption) were not significantly cor- related with age, suggesting that the age interaction was not a reflection of the cumulative effects of drinking over time. In order to explicitly rule out drinking history as a possible mediator of the age-MRI Z-score relationship, hierarchical regression analyses were performed for each of the MRI Z-scores. Lifetime alcohol consumption was entered as the first predictor and age was entered second. The results paralleled the simple correlations reported above, with age continuing to predict the MRI measures even after controlling for lifetime alcohol consumption. Moreover, the same pattern of results emerged with the regression analyses controlled for disease duration.
Correlations of MRI Z-Scores with Demographic Vari- ables. Years of formal education did not correlate signifi-

MRI IN CHRONIC ALCOHOLISM 1087
cantly with any ROI measure (Table 7). Although NART IQ and Vocabulary Age SS showed significant correlations with most ROIs considered, all correlations were in the unexpected duration, i.e., good performance scores were related to large CSF or small tissue volumes.
Correlations of MRI Z-Scores with Drinking Variables. Without Bonferroni correction, age at alcoholism onset correlated significantly with the CSF and tissue measures of the IVE as well as the third ventricle measure. No other drinking history variable showed a significant correlation with ROI measure (Table 7).
Correlations ofMRI Z-Scores with Family History Vari- ables. The number of problem drinkers in the family of the patient did not correlate significantly with any ROI measure considered (Table 7). The 45 alcoholics with family history data were divided on the basis of family history positive ( N = 30) and negative ( N = 15). As assessed with t tests, these subgroups did not differ in any demographic, alcohol-use, laboratory serum test, or MRI measure.
Correlations of MRI Z-Scores with Nutritional Vari- ables. The alcoholic group had, on average, a smaller body mass index (mean = 25.0 +- 3.98) than did the control group (mean = 26.7 k 4.01; t(87) = -2.03, p c 0.05). Of the 49 alcoholics, 40 had laboratory tests performed within a day of the MRI scan. Age-corrected volume measures of the lateral ventricles, third ventricle, and IVE CSF showed significant negative correlations with red blood count (RBC), hemoglobin, and hematocrit, i.e., anemia correlated with greater CSF and less tissue volume (Table 7). Although MCV and mean corpuscular hemoglobin concentration (MCHC) did not correlate with CSF vol- ume, seven alcoholics had macrocytic anemia based on hemoglobin and/or RBC and MCV (Table 8).
DISCUSSION
This study demonstrated deficits in both cortical gray matter and white matter and enlargement of CSF-filled spaces in cortical and subcortical regions in chronic alco- holism, relative to age norms. Our norms were derived from a population of healthy community members, all of whom were social drinkers explicitly screened to exclude any who reported drinking more than four drinks a day for more than 1 month. Although the mean gray matter deficit in general exceeded the mean white matter deficit, there was no statistical difference between these two com- partments. These abnormalities, and in particular gray matter, were more prominent in older alcoholics, despite the fact that in this sample age did not correlate signifi- cantly with disease duration or total lifetime intake of ethanol. Taken together, these observations suggest that the adverse effects of alcohol abuse interact with age. This accelerating function could imply that the aged brain is particularly susceptible to ethanol.
Age-related changes in metabolizing alcohol may con- tribute to the age-related brain volume abnormalities re- ported here. For instance, peak blood ethanol concentra- tion after an acute fixed dose of alcohol increases with age and may be attributed to reduction in lean body mass and total body water occurring with age.4' Furthermore, al- though gastric alcohol dehydrogenase activity decreases significantly with advancing age in men,42 CNS functions are more impaired by alcohol with advancing age even when one controls for blood alcohol In order to clarify the relationships among age, alcohol intake, and disease duration, further work with larger samples of pa- tients, matched for ethanol exposure over a period of time but differing in current age is required.
In our earlier CT report, we found relationships between hematologic variables probably reflecting nutritional sta-
Table 7. Correlations of ROls with Descriptive Variables for the Alcoholics
IVE Cortical Third Lateral
Variable CSF Tissue CSF Gray White ventricle ventricles
Demographic Education 0.17 -0.17 0.17 -0.18 -0.1 1 0.26 0.07 NART IQ 0.30't -0.30.t 0.35*t -0.29't -0.28't 0.37"t 0.06 Vocabulary age SS 0.34.t -0.34't 0.3V.t -0.32't -0.31.t 0.29.t 0.09
Drinking and family history Age at onset 0.30' -0.30' 0.28 -0.28 -0.12 0.44" 0.24 Disease duration 0.02 -0.02 0.01 -0.03 0.03 -0.08 0.03 Lifetime EtOH 0.003 -0.003 0.02 -0.03 0.08 -0.10 0.06 Drinkers in family 0.002 -0.002 0.06 -0.06 -0.01 -0.12 -0.04
Body mass index -0.06 0.06 -0.00 0.04 -0.08 -0.01 -0.16 RBC -0.32* 0.32' -0.24 0.28 0.07 -0.31 -0.40' Hemoglobin -0.37' 0.37' -6.29 0.31 0.10 -0.38' -0.41" Hematocrit -0.34' 0.34' -0.26 0.27 0.09 -0.35' -0.42" MCV 0.10 -0.10 0.07 -0.1 1 -0.01 0.08 0.12 MCHC -0.23 0.23 -0.17 0.28 -0.02 -0.27 -0.17 Total protein 0.26 -0.26 0.30 -0.22 -0.27 0.22 0.08 Albumin -0.13 0.13 -0.09 -0.02 0.14 -0.19 -0.18
For family-wise Bonferroni corrections (alpha = 0.05) for three comparisons, p I 0.02; for four comparisons; p I 0.01: and for eight comparisons, p 5 0.006. ' p c 0.05, " p c 0.01, " * p 5 0.001. t Correlations in the unexpected direction.
Nutritional and laboratory tests

1088 PFEFFERBAUM ET AL.
Table 8. Laboratory Values in the Alcoholics Alcoholic patients
No. of outliers
Laboratory Standard test range Mean SD Range Low High
RBC 4.4-6 M/crnrn 4.7 0.46 3.3-5.7 10 0 Hemoglobin 14-17gldl 14.9 1.24 11.9-17.6 10 1 Hematocrit 390/0-51 YO 43.7 3.57 33.7-52.4 2 1 MCV 81-96 fl 93.6 5.45 80-108 1 11 MCHC 33-36 g/dl 34.1 0.69 33-35 0 0
Albumin 3-5.5 g/dl 4.3 0.28 3.4-4.9 0 0 Total protein 6-8.5 g/dl 6.8 0.46 5.7-8.0 0 0
tus (MCV, hemoglobin, HCT) and age-corrected CSF volumes, and suggested that some part of the CSF in- creases could be related to impaired nutritional state of the subjects. In the present study, there was a similar relationship between HCT, hemoglobin, and RBC to CSF volumes but not for cortical white or gray matter volumes. MRI scans described in this report were obtained after patients had completed at least 3 weeks of inpatient treat- ment during which many acute nutritional deficiencies may have been remedied. Also similar to our previous study was the counterintuitive relationship between in- creased CSF volume and better cognitive performance by the alcoholics. Again, this may reflect a selection and survival bias in older alcoholics who present for treatment.
Neuropathological studies of gross brain morphological changes in alcoholics have reported volumetric reductions in cortical white matter but not gray A recent neuropathological pair-fed control study of dogs main- tained on a high alcohol versus no alcohol diets for 1 year concluded that white rather than gray matter “bears the brunt” of high alcohol consumption, since the alcohol-fed dogs showed no difference in neuronal counts, but CSF volumes increased.44 However, frontal and temporal glial cell loss was noted in that study. By contrast, microscopic neuropathological studies of human alcoholics have shown reduction in neuronal count, cell body size and basal dendritic arborization in selected frontal cortical region^.^,^^,^^ In vivo, these cellular changes might result in gray matter volume reduction.
Our in vivo MRI study provides evidence that both cortical white matter and cortical gray matter bear the brunt of alcohol consumption. Our results are comparable with another MRI study’’ in documenting widespread cortical gray matter loss in chronic alcoholics, even after correcting for normal age-related reduction in gray matter. In that study, white matter volume, either cortical or subcortical, was not quantified. Instead, white matter sig- nal hyperintensity, an index of a white matter change of unclear etiology, was quantified and found to be increased in alcoholics. In the current study, however, we chose not to quantify gray versus white matter changes in subcortical regions because of current limitations in our capacity to differentiate these tissue types when white matter abnor- malities are present. Our ratings of PVLs and DWMLs,
both groups had no or few white matter hyperintensities. In cortical regions, where white matter hyperintensity was not a factor, segmentation was possible and demonstrated a reduction in white matter volume. Classic neuropatho- logical studies of alcoholics have highlighted frontal re- gions as the cortical areas showing greatest atrophy in alcoh~lism.~ We, however, found no evidence for specific vulnerability of the frontal or any other cortical region in this sample of alcoholics.
In summary, although it seems likely that the cumula- tive toxicity of a lifetime of alcohol exposure would also contribute and possibly further accelerate the brain defi- cits, the present data did not support this hypothesis. Age- corrected MRI measures correlated significantly with age but not years of alcoholic drinking. In most studies, it is difficult to determine whether changes in brain morphol- ogy are due to the accumulation of alcohol consumed or to the greater vulnerability of the aging brain because age and cumulative alcohol exposure are typically correlated and thus inextricably linked. By contrast, the sample of alcoholics in the present study showed little correlation of total lifetime ethanol consumption with age. The aged brain, therefore, appears to be more susceptible to chronic alcohol abuse than the young adult brain, with both gray and white matter being affected.
ACKNOWLEDGMENTS
The authors would like to thank Brian Matsumoto, Stacie DeMent, Jody Rawles, Linda Davis, Maria Stein, Theresa Chan and other staff members of the Laboratory of Physiological and Structural Brain Imaging and the Staff of the Alcohol Rehabilitation Unit for their role in the recruitment, diagnosis, care, and scanning of alcoholic patients and control subjects; Leslie Zatz, M.D., for clinically reviewing MRI scans; and James Moses, Ph.D., for providing a subset of the WAIS-R Vocab- ulary Scores.
REFERENCES
1. Harper CG, Kril JJ: Neuropathology of alcoholism. Alcohol
2. Lishman WA: Alcohol and the brain. Br J Psychiatry 156:635- 644, 1990
3. Pfefferbaum A, Rosenbloom MJ: Brain imaging tools for the study of alcoholism. Alcohol Health Res World 14:219-231, 1990
4. Ron MA: The Brain of Alcoholics: An Overview. New York, Guilford Press, 1987
5. Courville CB: Effects of Alcohol on the Nervous System in Man. Los Angeles, San Lucas Press, 1955
6. Harper CG, Kril JJ, Daly JM: Are we drinking our neurones away? Br Med J 294534-536, 1987
7. Jacobson RR, Lishman WA: Cortical and diencephalic lesions in Korsakoffs syndrome: A clinical and CT scan study. Psycho1 Med 2063- 15, 1990
8. de la Monte SM. Disproportionate atrophy of cerebral white matter in chronic alcoholics. Arch Neurol45:990-992, 1988
9. Harper CG, Kril JJ, Holloway R L Brain shrinkage in chronic alcoholics: A pathological study. Br Med J 290501-504, 1985
10. Harper CG, Smith NA, Kril JJ: The effects of alcohol on the female brain-A neuropathological study. Alcohol Alcohol 25:445-448, 1990
Alcohol 25~207-216, 1990
however, indicated that the vast majority of subjects in 1 1. Jernigan TL, Butters N, DiTraglia G, et al: Reduced cerebral grey

MRI IN CHRONIC ALCOHOLISM 1089
matter observed in alcoholics using magnetic resonance imaging. Alcohol Clin Exp Res 15:4 18-427, 1991
12. Popova EN, Frumkina L E Changes in neurons and interneural connnections of the higher sections of the motor system in the progeny of alcoholized male and female rats. Neurosci Behav Physiol 15:476- 479, 1985
13. Lancaster FE, Philips SM, Patsalos PN, Wiggins RC: Brain mye- lination in the offspring of ethanol-treated rats: in Utero versus lactational exposure by cross-fostering offspring of control pairfed, and ethanol treated dams. Brain Res 309:209-216, 1984
14. Zipursky RB, Lim KO, Sullivan EV, et al: Widespread cerebral gray matter volume deficits in schizophrenia. Arch Gen Psychiatry
15. Pfefferbaum A, Zatz L, Jernigan TL: Computer-interactive method for quantifying cerebrospinal fluid and tissue in brain CT scans: Effects ofaging. J Comput Assist Tomogr 10571-578, 1986
16. Pfefferbaum A, Rosenbloom MJ, Crusan K, Jernigan T L Brain CT changes in alcoholics. The effects of age and alcohol consumption. Alcohol Clin Exp Res 1231-87, 1988
17. Patek AJ: Alcohol, malnutrition and alcoholic cirrhosis. Am J Clin Nutr 32:1304-1312, 1979
18. Pratt OE, Rooprai HK, Shaw GK, Thomson A D The genesis of alcoholic brain tissue injury. Alcohol Alcohol 25:2 17-230, 1990
19. Victor M, Adam RD, Collins GH: The Wernicke-Korsakoff Syndrome. Philadelphia, F.A. Davis Co, 1971
20. Krieg J-C, Lauer C, Pirke K-M: Structural brain abnormalities in patients with bulimia nervosa. Psychiatry Res 27:39-48, 1989
21. Enzmann DR, Lane B: Cranial computed tomography findings in anorexia nervosa. J Comput Assist Tomog 1 :4 10-4 14, I977
22. Artmann H, Grau H, Adelmann M, Schleiffer R: Reversible and non-reversible enlargement of cerebrospinal fluid spaces in anorexia nervosa. Neuroradiology 27:304-312, 1985
23. Lim KO, Pfefferbaum A: Segmentation of MR brain images into cerebrospinal fluid spaces, white and gray matter. J Comput Assist Tomog 13:588-593, 1989
24. Spitzer RL, Endicott J, Robins E: Research Diagnostic Criteria (RDC). New York, Biometrics Research, New York State Psychiatric Institute, 1975
25. American Psychiatric Association: Diagnostic and Statistical Manual of Mental Disorder (DSM-111-R). Washington, American Psy- chiatric Association, 1987
26. Endicott J, Spitzer RL: A diagnostic interview: The Schedule for Affective Disorders and Schizophrenia. Arch Gen Psychiatry 35:837- 844, 1978
27. Crovitz HF, Zener KA: Group test for assessing hand and eye dominance. Am J Psycho1 75:271-276, 1962
49195-205, 1992
28. Nelson HE: National Adult Reading Test, NART. Windsor, Nelson Publishing Company, 1982
29. Wechsler D. Wechsler Adult Intelligence Scale-Revised. San Antonio, TX, The Psychological Corporation, 198 1
30. Skinner HA: Development and Validation of a Lifetime Alcohol Consumption Assessment Procedure. Toronto, Canada, Addiction Re- search Foundation, 1982
31. Skinner HA, Sheu WJ: Reliability of alcohol use indices: The lifetime drinking history and the MAST. J Stud Alcohol 43:1157-1170, 1982
32. Cronbach LJ, Gleser GC, Nanda H, Rajaratnam N: The Depend- ability of Behavioral Measurements: Theory of Generalizability for Scores and Profiles. New York, Wiley, 1972
33. Lim KO, Zipursky RB, Watts MC, Pfefferbaum A: Decreased grey matter in normal aging: An in vivo MR study. J Gerontol47:B26- B30, 1992
34. Otsu N A threshold selection method from gray-level histograms. IEEE Trans (SMC). 9:63-66, 1979
35. Grafton ST, Sumi SM, Stimac GK, et al: Comparison of post- mortem magnetic resonance imaging and neuropathologic findings in the cerebral white matter. Arch Neurol 48:293-298, 1991
36. Jernigan TL, Press GA, Hesselink JR: Methods for measuring brain morphologic features on magnetic resonance images: Validation and normal aging. Arch Neurol47:27-32, 1990
37. van Swieten JC, Geyskes GG, Derix MMA, et al: Hypertension in the Elderly Is Associated with White Matter Lesions and Cognitive Decline. Ann Neurol30:825-830, 1990
38. Pfefferbaum A, Sullivan EV, Jernigan TL, et al: A quantitative analysis of CT and cognitive measures in normal aging and Alzheimer’s disease. Psychiatry Res Neuroimaging 35: 1 15-1 36, 1990
39. Dekaban A, Sadowsky D Changes in brain weights during the span of human life: Relation of brain weights to body heights and body weights. Ann Neurol4:345-356, 1978
40. Glejser H: A new test for heteroscedaticity. J Am Stat Assoc
41. Vestal RE, McGuire EA, Tobin JD, et al: Aging and ethanol metabolism in man. Clin Pharrnacol Ther 21:343-354, 1977
42. Seitz HK, Egerer G, Simanowski UA: High blood alcohol levels in women. New Engl J Med 32358, 1990
43. Vogel-Sprott M, Barrett P Age, drinking habits, and the effects of alcohol. J Stud Alcohol 45517-521, 1984
44. Hansen LA, Natelson BH, Lemere C, et al: Alcohol-induced brain changes in dogs. Arch Neurol48:939-942, 199 I
45. Kril JJ, Harper CG: Neuronal counts from four cortical regions of the alcoholic brain. Acta Neuropathol79:200-204, 1989
46. Harper C, Corbett D Changes in the basal dendrites of cortical pyramidal cells from alcoholic patients-A quantitative golgi study. J Neurol Neurosurg Psychiatry 532356-861, 1990
64:316-323, 1969
Copyright © 2022 FDOKUMEN