Mesalazine and thymoquinone attenuate intestinal tumour development in Msh2loxP/loxP Villin-Cre mice
© 2001 Oxford University Press Human Molecular Genetics, 2001, Vol. 10, No. 17 1829–1845
Polyglutamine expansions cause decreasedCRE-mediated transcription and early gene expression changes prior to cell death in an inducible cell model of Huntington’s diseaseAndreas Wyttenbach, Jina Swartz, Hiroko Kita1, Thomas Thykjaer2, Jenny Carmichael, Jane Bradley3, Rosemary Brown, Michelle Maxwell, Anthony Schapira3, Torben F. Orntoft2, Kikuya Kato1 and David C. Rubinsztein*
Wellcome Trust Centre for Molecular Mechanisms in Disease, Cambridge Institute for Medical Research, Wellcome Trust/MRC Building, Addenbrooke’s Hospital, Hills Road, Cambridge CB2 2XY, UK, 1Taisho Laboratory of Functional Genomics, Nara Institute of Science and Technology, 8916-5 Takayama, Ikoma, Nara, 630-0101, Japan, 2Molecular Diagnostic Laboratory, Department of Clinical Biochemistry, Aarhus University Hospital, Brendstrupgaardsvej, 8200 Aarhus N., Denmark and 3University Department of Clinical Neurosciences, Royal Free and University College Medical School, UCL, London NW3 2PF, and Institute of Neurology, Queen Square, London WC1N 3BG, UK
Received May 8, 2001; Revised and Accepted June 19, 2001
Huntington’s disease (HD) is one of 10 knowndiseases caused by a (CAG)n trinucleotide repeatexpansion that is translated into an abnormally longpolyglutamine tract. We have developed stableinducible neuronal (PC12) cell lines that expresshuntingtin exon 1 with varying CAG repeat lengthsunder doxycycline (dox) control. The expression ofexpanded repeats is associated with aggregateformation, caspase-dependent cell death anddecreased neurite outgrowth. Post-mitotic cellsexpressing mutant alleles were more prone to celldeath compared with identical cycling cells. To deter-mine early metabolic changes induced by this muta-tion in cell models, we studied changes in geneexpression after 18 h dox induction, using Affymetrixarrays, cDNA filters and adapter-tagged competitivePCR (ATAC-PCR). At this time point there were lowrates of inclusion formation, no evidence of mito-chondrial compromise and no excess cell death inthe lines expressing expanded compared with wild-type repeats. The expression profiles suggest noveltargets for the HD mutation and were compatible withimpaired cAMP response element (CRE)-mediatedtranscription, which we confirmed using CRE-luciferase reporter assays. Reduced CRE-mediatedtranscription may contribute to the loss of neuriteoutgrowth and cell death in polyglutamine diseases,as these phenotypes were partially rescued bytreating cells with cAMP or forskolin.
INTRODUCTION
Huntington’s disease (HD) is a progressive, autosomal domi-nant, neurodegenerative disorder caused by a CAG trinucle-otide repeat expansion in the gene that encodes huntingtin (htt)(1). Symptomatic individuals have 36 or more repeats and thelength of the trinucleotide expansion tends to be inverselycorrelated with the age of onset. The CAG expansion is trans-lated into a series of glutamine residues [a polyglutamine(polyQ) tract] in htt. HD is one of 10 known neurodegenerativedisorders, including spinobulbar muscular atrophy (SBMA),dentatorubral pallidolusian atrophy (DRPLA) and five formsof spinocerebellar ataxia (SCA), caused by a polyQ expansion(reviewed in 2–4).
PolyQ diseases are characterized by neuronal loss andintraneuronal aggregates/inclusions containing the respectivegene products or fragments including the polyQ tract(reviewed in 2). The pathogenic roles of aggregates/aggrega-tion are subjects of vigorous debate (5–9). The earliest clinicalsigns of these diseases may be due to cell dysfunction thatoccurs before overt cell loss. In studies of SCA1 transgenicmice, the earliest clinical deficits correlate with the loss ofdendritic spines, which precede cell loss (10). Loss of dendriticspines is also a feature of HD pathology (11).
In order to model the biology of polyglutamine diseases intissue culture, we have generated inducible lines in PC12 (ratphaeochromocytoma) cells, which express a GFP-taggedexon 1 fragment of the HD gene with 23, 43, 53 or 74glutamine repeats, driven by a doxycycline (dox)-dependentTet-On promoter (12). PolyQ diseases have been extensivelystudied using htt exon 1, because large fragments of the HD,SCA3 and DRPLA gene products do not induce inclusionformation or cell death in cell culture models (13–17). Also, a
*To whom correspondence should be addressed. Tel: +44 1223 762608; Fax: +44 1223 331206; Email: [email protected] The authors wish it to be known that, in their opinion, the first two authors should be regarded as joint First Authors.
1830 Human Molecular Genetics, 2001, Vol. 10, No. 17
small N-terminal polyQ-containing part(s) of htt is found ininclusions in vivo (18). Exon 1 models have been powerfultools for studying inclusion formation in relation to cell death/dysfunction in cultured cells and transgenic mice (19–22).While these models may not reflect the cellular specificity ofHD, they are likely to show features generic to all poly-glutamine diseases. These diseases almost certainly sharecommon pathogenic pathways, and an understanding of theshared pathways will have a wide impact on the biology ofneurodegenerative processes.
In this study we report the basic characterization of theinducible lines, where we have specifically investigatedsusceptibility to cell death and htt aggregation. It is possiblethat the post-mitotic state of virtually all neurons contributes tothe central nervous system (CNS) being more susceptible topolyQ mutations than many other tissues expressing themutant proteins. Accordingly, we compared cell death and
inclusion formation in the same clonal cell lines in cycling andpost-mitotic states. Proteasome inhibition increases polyQaggregate formation and inclusions sequester ubiquitin, protea-somal components and heat-shock proteins (HSPs) in vivo(20,23–25). We studied the kinetics of the association of thesecomponents with the aggregates, since some proteins may besequestered to inclusions as late events long after theirformation.
One of our aims is to determine the earliest metabolicchanges resulting from the HD mutation. We have studiedmRNA expression profiles in our PC12 cell lines at an earlytime after induction of expression, in order to preferentiallyassay the primary consequences of polyQ mutations, asopposed to secondary downstream effects. PC12 cells werechosen as these neuronal precursor cells have been extensivelycharacterized. The use of clonal cell lines allows comparisonsof cells of common origin under conditions of fairly homoge-nous transgene expression, where the main difference betweenthe lines is the length of the polyQ tract. (Since integration sitesalso differ between lines, we have repeated relevantexperiments in independent clonal lines.) We believe that thisapproach is a powerful strategy, which complements geneexpression studies in transgenic mice (26). As far as we areaware, this is the first report of mRNA profiling in a cellularmodel of a polyQ disease or a neurodegenerative conditionassociated with protein aggregation.
RESULTS
Inducible htt exon 1 expression leads to time- and polyQ length-dependent aggregation of insoluble, fibrillar inclusions
We established stable, inducible PC12 cell lines, whereexpression of htt exon 1 containing 23, 43, 53 or 74 glutamines(HD-Q23, -Q43, -Q53 or -Q74) fused downstream of enhancedgreen fluorescent protein (EGFP) is driven by a minimalcytomegalovirus promoter under the control of a tetracyclineresponsive element (TRE). This promoter is induced when the‘reverse’ Tet repressor (tTetR) binds to TRE in the presence ofdox. We grew 20–40 independent single cell clones for eachpolyQ line and selected one inducible line from 2–4 low back-ground/high inducer lines of each polyQ length for detailedstudy. Upon treatment with nerve growth factor (NGF)(100 ng/ml) in the presence of reduced amounts of serum(1%), each clonal cell line differentiated into post-mitotic,neuron-like cells in the absence of dox (data not shown).
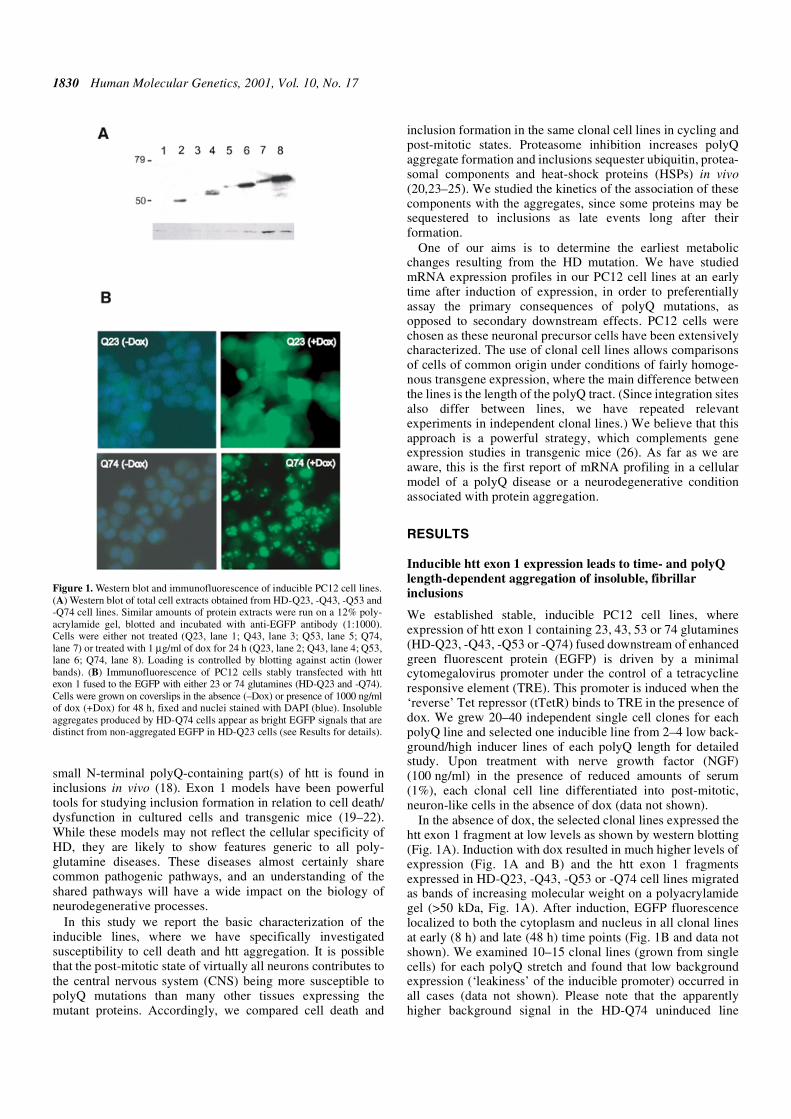
In the absence of dox, the selected clonal lines expressed thehtt exon 1 fragment at low levels as shown by western blotting(Fig. 1A). Induction with dox resulted in much higher levels ofexpression (Fig. 1A and B) and the htt exon 1 fragmentsexpressed in HD-Q23, -Q43, -Q53 or -Q74 cell lines migratedas bands of increasing molecular weight on a polyacrylamidegel (>50 kDa, Fig. 1A). After induction, EGFP fluorescencelocalized to both the cytoplasm and nucleus in all clonal linesat early (8 h) and late (48 h) time points (Fig. 1B and data notshown). We examined 10–15 clonal lines (grown from singlecells) for each polyQ stretch and found that low backgroundexpression (‘leakiness’ of the inducible promoter) occurred inall cases (data not shown). Please note that the apparentlyhigher background signal in the HD-Q74 uninduced line
Figure 1. Western blot and immunofluorescence of inducible PC12 cell lines.(A) Western blot of total cell extracts obtained from HD-Q23, -Q43, -Q53 and-Q74 cell lines. Similar amounts of protein extracts were run on a 12% poly-acrylamide gel, blotted and incubated with anti-EGFP antibody (1:1000).Cells were either not treated (Q23, lane 1; Q43, lane 3; Q53, lane 5; Q74,lane 7) or treated with 1 µg/ml of dox for 24 h (Q23, lane 2; Q43, lane 4; Q53,lane 6; Q74, lane 8). Loading is controlled by blotting against actin (lowerbands). (B) Immunofluorescence of PC12 cells stably transfected with httexon 1 fused to the EGFP with either 23 or 74 glutamines (HD-Q23 and -Q74).Cells were grown on coverslips in the absence (–Dox) or presence of 1000 ng/mlof dox (+Dox) for 48 h, fixed and nuclei stained with DAPI (blue). Insolubleaggregates produced by HD-Q74 cells appear as bright EGFP signals that aredistinct from non-aggregated EGFP in HD-Q23 cells (see Results for details).
Human Molecular Genetics, 2001, Vol. 10, No. 17 1831
(Fig. 1A, lane 7) is largely due to the increased protein loading(assessed by actin probing on the figure).
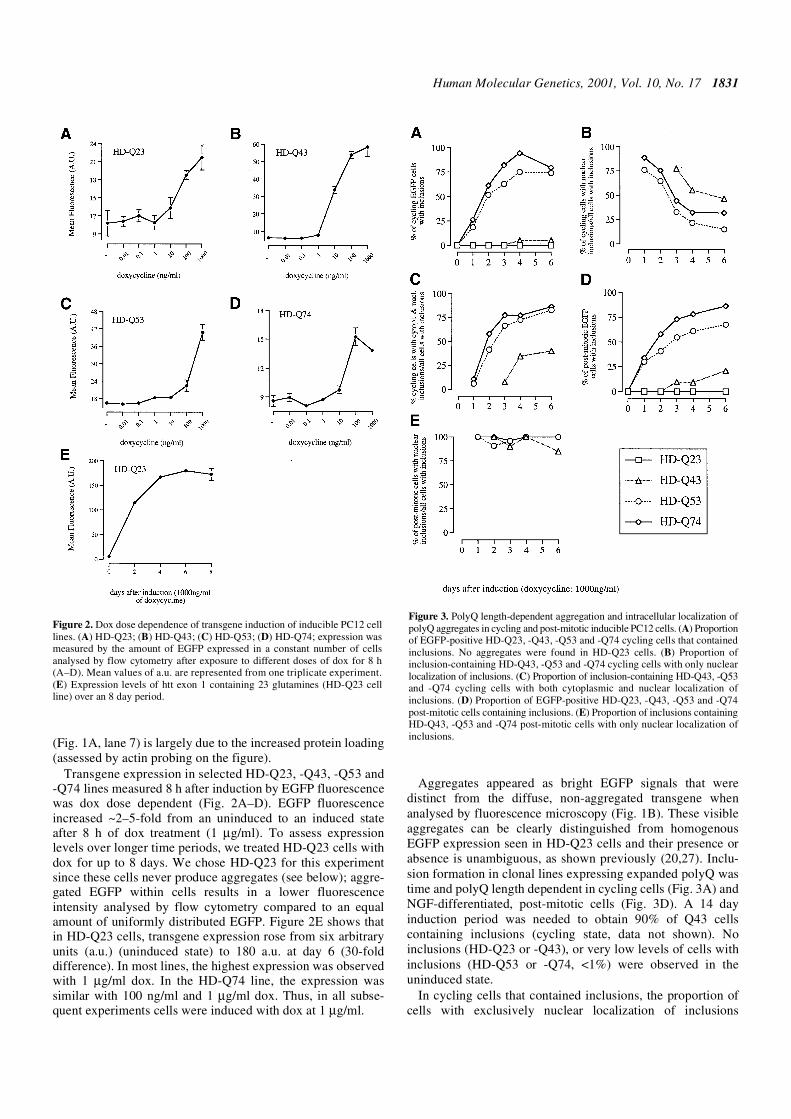
Transgene expression in selected HD-Q23, -Q43, -Q53 and-Q74 lines measured 8 h after induction by EGFP fluorescencewas dox dose dependent (Fig. 2A–D). EGFP fluorescenceincreased ~2–5-fold from an uninduced to an induced stateafter 8 h of dox treatment (1 µg/ml). To assess expressionlevels over longer time periods, we treated HD-Q23 cells withdox for up to 8 days. We chose HD-Q23 for this experimentsince these cells never produce aggregates (see below); aggre-gated EGFP within cells results in a lower fluorescenceintensity analysed by flow cytometry compared to an equalamount of uniformly distributed EGFP. Figure 2E shows thatin HD-Q23 cells, transgene expression rose from six arbitraryunits (a.u.) (uninduced state) to 180 a.u. at day 6 (30-folddifference). In most lines, the highest expression was observedwith 1 µg/ml dox. In the HD-Q74 line, the expression wassimilar with 100 ng/ml and 1 µg/ml dox. Thus, in all subse-quent experiments cells were induced with dox at 1 µg/ml.
Aggregates appeared as bright EGFP signals that weredistinct from the diffuse, non-aggregated transgene whenanalysed by fluorescence microscopy (Fig. 1B). These visibleaggregates can be clearly distinguished from homogenousEGFP expression seen in HD-Q23 cells and their presence orabsence is unambiguous, as shown previously (20,27). Inclu-sion formation in clonal lines expressing expanded polyQ wastime and polyQ length dependent in cycling cells (Fig. 3A) andNGF-differentiated, post-mitotic cells (Fig. 3D). A 14 dayinduction period was needed to obtain 90% of Q43 cellscontaining inclusions (cycling state, data not shown). Noinclusions (HD-Q23 or -Q43), or very low levels of cells withinclusions (HD-Q53 or -Q74, <1%) were observed in theuninduced state.
In cycling cells that contained inclusions, the proportion ofcells with exclusively nuclear localization of inclusions
Figure 2. Dox dose dependence of transgene induction of inducible PC12 celllines. (A) HD-Q23; (B) HD-Q43; (C) HD-Q53; (D) HD-Q74; expression wasmeasured by the amount of EGFP expressed in a constant number of cellsanalysed by flow cytometry after exposure to different doses of dox for 8 h(A–D). Mean values of a.u. are represented from one triplicate experiment.(E) Expression levels of htt exon 1 containing 23 glutamines (HD-Q23 cellline) over an 8 day period.
Figure 3. PolyQ length-dependent aggregation and intracellular localization ofpolyQ aggregates in cycling and post-mitotic inducible PC12 cells. (A) Proportionof EGFP-positive HD-Q23, -Q43, -Q53 and -Q74 cycling cells that containedinclusions. No aggregates were found in HD-Q23 cells. (B) Proportion ofinclusion-containing HD-Q43, -Q53 and -Q74 cycling cells with only nuclearlocalization of inclusions. (C) Proportion of inclusion-containing HD-Q43, -Q53and -Q74 cycling cells with both cytoplasmic and nuclear localization ofinclusions. (D) Proportion of EGFP-positive HD-Q23, -Q43, -Q53 and -Q74post-mitotic cells containing inclusions. (E) Proportion of inclusions containingHD-Q43, -Q53 and -Q74 post-mitotic cells with only nuclear localization ofinclusions.
1832 Human Molecular Genetics, 2001, Vol. 10, No. 17
decreased progressively over time after induction with dox(Fig. 3B). The proportion of cells in which inclusions wereobserved in the cytoplasm increased with time (Fig. 3C). Themajority of cells (>85%) with cytoplasmic aggregates alsocontained inclusions in the nucleus. However, in NGF-differentiated, post-mitotic cells, inclusions localized mainlyto the nucleus and we observed no change over time (Fig. 3E)in contrast to cycling cells (Fig. 3B). Occasionally, aggregatesin post-mitotic cells localized to the cell soma or were found inneurites (data not shown).
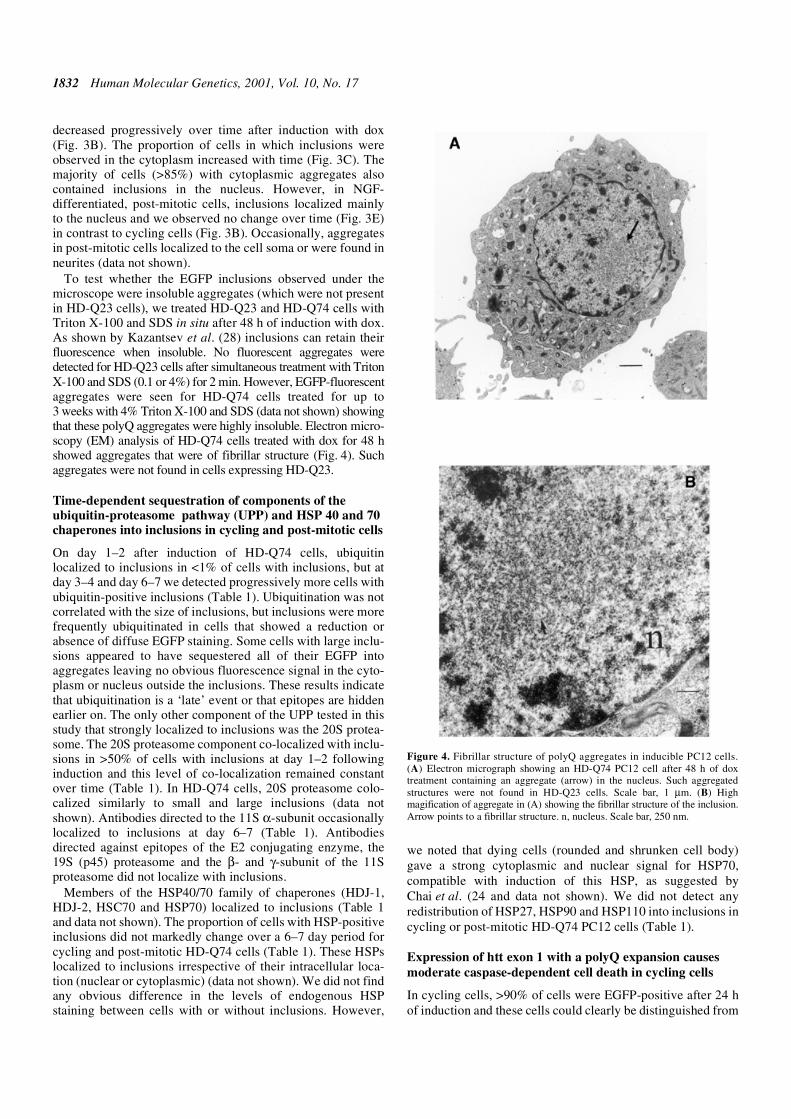
To test whether the EGFP inclusions observed under themicroscope were insoluble aggregates (which were not presentin HD-Q23 cells), we treated HD-Q23 and HD-Q74 cells withTriton X-100 and SDS in situ after 48 h of induction with dox.As shown by Kazantsev et al. (28) inclusions can retain theirfluorescence when insoluble. No fluorescent aggregates weredetected for HD-Q23 cells after simultaneous treatment with TritonX-100 and SDS (0.1 or 4%) for 2 min. However, EGFP-fluorescentaggregates were seen for HD-Q74 cells treated for up to3 weeks with 4% Triton X-100 and SDS (data not shown) showingthat these polyQ aggregates were highly insoluble. Electron micro-scopy (EM) analysis of HD-Q74 cells treated with dox for 48 hshowed aggregates that were of fibrillar structure (Fig. 4). Suchaggregates were not found in cells expressing HD-Q23.
Time-dependent sequestration of components of the ubiquitin-proteasome pathway (UPP) and HSP 40 and 70 chaperones into inclusions in cycling and post-mitotic cells
On day 1–2 after induction of HD-Q74 cells, ubiquitinlocalized to inclusions in <1% of cells with inclusions, but atday 3–4 and day 6–7 we detected progressively more cells withubiquitin-positive inclusions (Table 1). Ubiquitination was notcorrelated with the size of inclusions, but inclusions were morefrequently ubiquitinated in cells that showed a reduction orabsence of diffuse EGFP staining. Some cells with large inclu-sions appeared to have sequestered all of their EGFP intoaggregates leaving no obvious fluorescence signal in the cyto-plasm or nucleus outside the inclusions. These results indicatethat ubiquitination is a ‘late’ event or that epitopes are hiddenearlier on. The only other component of the UPP tested in thisstudy that strongly localized to inclusions was the 20S protea-some. The 20S proteasome component co-localized with inclu-sions in >50% of cells with inclusions at day 1–2 followinginduction and this level of co-localization remained constantover time (Table 1). In HD-Q74 cells, 20S proteasome colo-calized similarly to small and large inclusions (data notshown). Antibodies directed to the 11S α-subunit occasionallylocalized to inclusions at day 6–7 (Table 1). Antibodiesdirected against epitopes of the E2 conjugating enzyme, the19S (p45) proteasome and the β- and γ-subunit of the 11Sproteasome did not localize with inclusions.
Members of the HSP40/70 family of chaperones (HDJ-1,HDJ-2, HSC70 and HSP70) localized to inclusions (Table 1and data not shown). The proportion of cells with HSP-positiveinclusions did not markedly change over a 6–7 day period forcycling and post-mitotic HD-Q74 cells (Table 1). These HSPslocalized to inclusions irrespective of their intracellular loca-tion (nuclear or cytoplasmic) (data not shown). We did not findany obvious difference in the levels of endogenous HSPstaining between cells with or without inclusions. However,
we noted that dying cells (rounded and shrunken cell body)gave a strong cytoplasmic and nuclear signal for HSP70,compatible with induction of this HSP, as suggested byChai et al. (24 and data not shown). We did not detect anyredistribution of HSP27, HSP90 and HSP110 into inclusions incycling or post-mitotic HD-Q74 PC12 cells (Table 1).
Expression of htt exon 1 with a polyQ expansion causes moderate caspase-dependent cell death in cycling cells
In cycling cells, >90% of cells were EGFP-positive after 24 hof induction and these cells could clearly be distinguished from
Figure 4. Fibrillar structure of polyQ aggregates in inducible PC12 cells.(A) Electron micrograph showing an HD-Q74 PC12 cell after 48 h of doxtreatment containing an aggregate (arrow) in the nucleus. Such aggregatedstructures were not found in HD-Q23 cells. Scale bar, 1 µm. (B) Highmagification of aggregate in (A) showing the fibrillar structure of the inclusion.Arrow points to a fibrillar structure. n, nucleus. Scale bar, 250 nm.
Human Molecular Genetics, 2001, Vol. 10, No. 17 1833
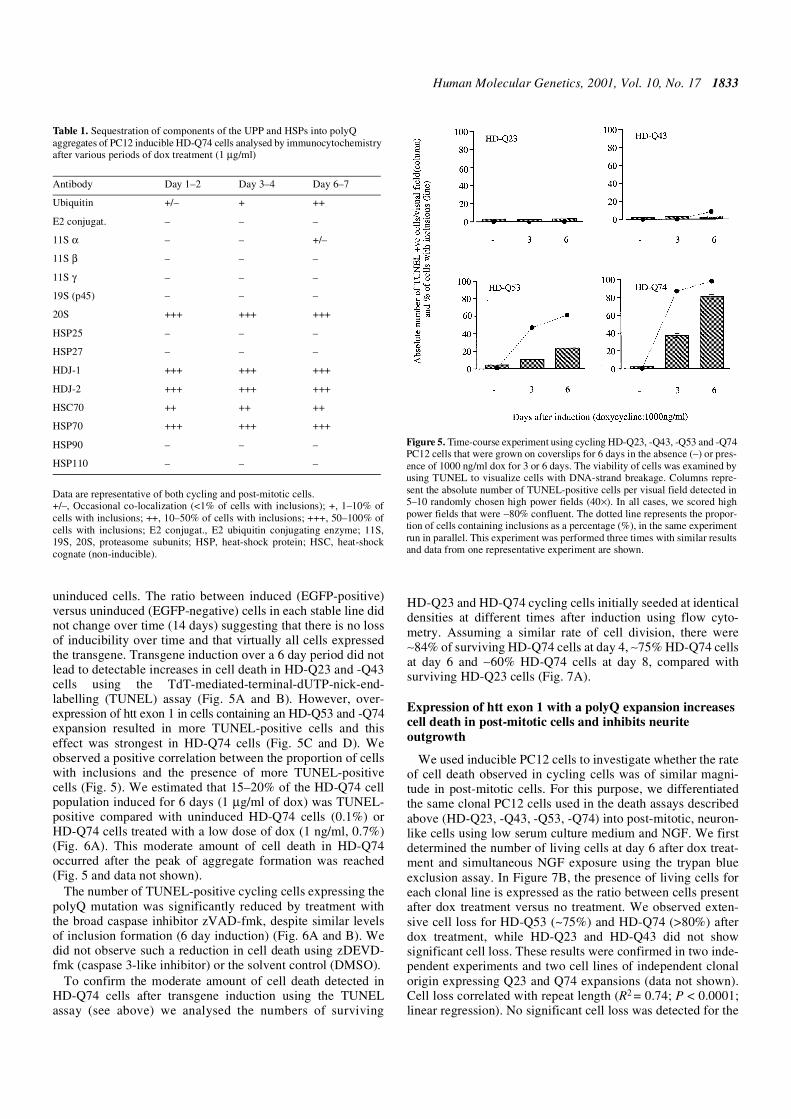
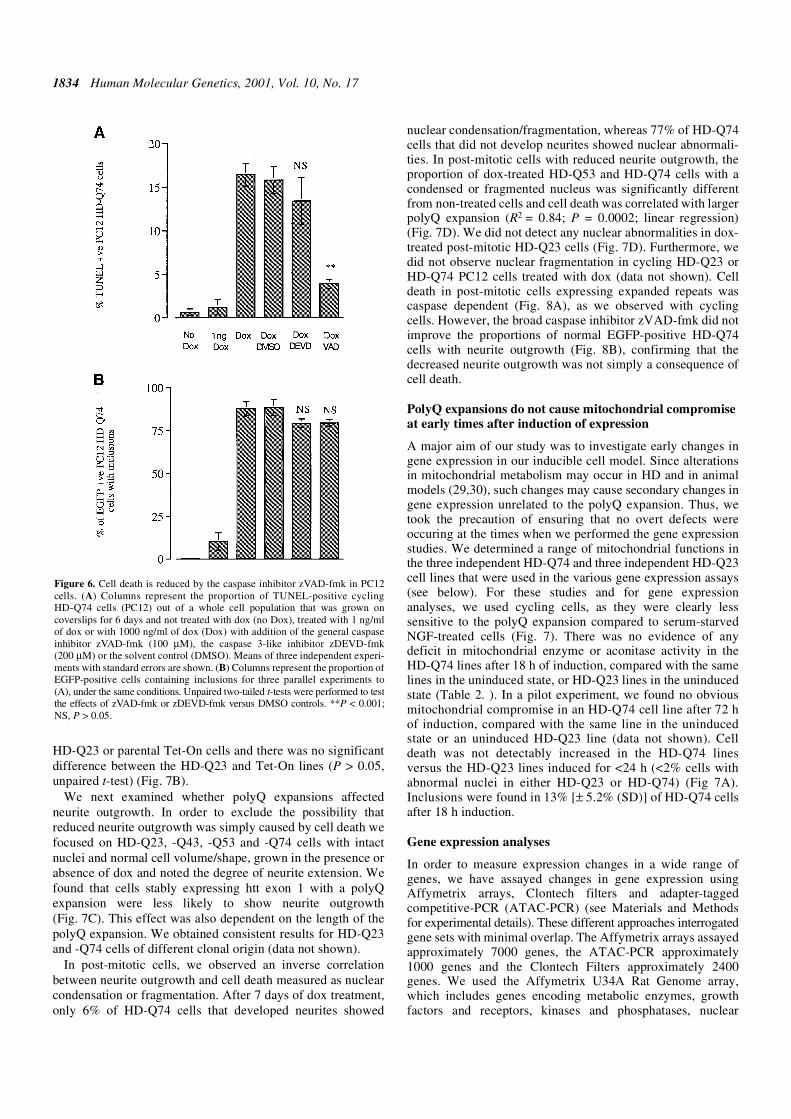
uninduced cells. The ratio between induced (EGFP-positive)versus uninduced (EGFP-negative) cells in each stable line didnot change over time (14 days) suggesting that there is no lossof inducibility over time and that virtually all cells expressedthe transgene. Transgene induction over a 6 day period did notlead to detectable increases in cell death in HD-Q23 and -Q43cells using the TdT-mediated-terminal-dUTP-nick-end-labelling (TUNEL) assay (Fig. 5A and B). However, over-expression of htt exon 1 in cells containing an HD-Q53 and -Q74expansion resulted in more TUNEL-positive cells and thiseffect was strongest in HD-Q74 cells (Fig. 5C and D). Weobserved a positive correlation between the proportion of cellswith inclusions and the presence of more TUNEL-positivecells (Fig. 5). We estimated that 15–20% of the HD-Q74 cellpopulation induced for 6 days (1 µg/ml of dox) was TUNEL-positive compared with uninduced HD-Q74 cells (0.1%) orHD-Q74 cells treated with a low dose of dox (1 ng/ml, 0.7%)(Fig. 6A). This moderate amount of cell death in HD-Q74occurred after the peak of aggregate formation was reached(Fig. 5 and data not shown).
The number of TUNEL-positive cycling cells expressing thepolyQ mutation was significantly reduced by treatment withthe broad caspase inhibitor zVAD-fmk, despite similar levelsof inclusion formation (6 day induction) (Fig. 6A and B). Wedid not observe such a reduction in cell death using zDEVD-fmk (caspase 3-like inhibitor) or the solvent control (DMSO).
To confirm the moderate amount of cell death detected inHD-Q74 cells after transgene induction using the TUNELassay (see above) we analysed the numbers of surviving
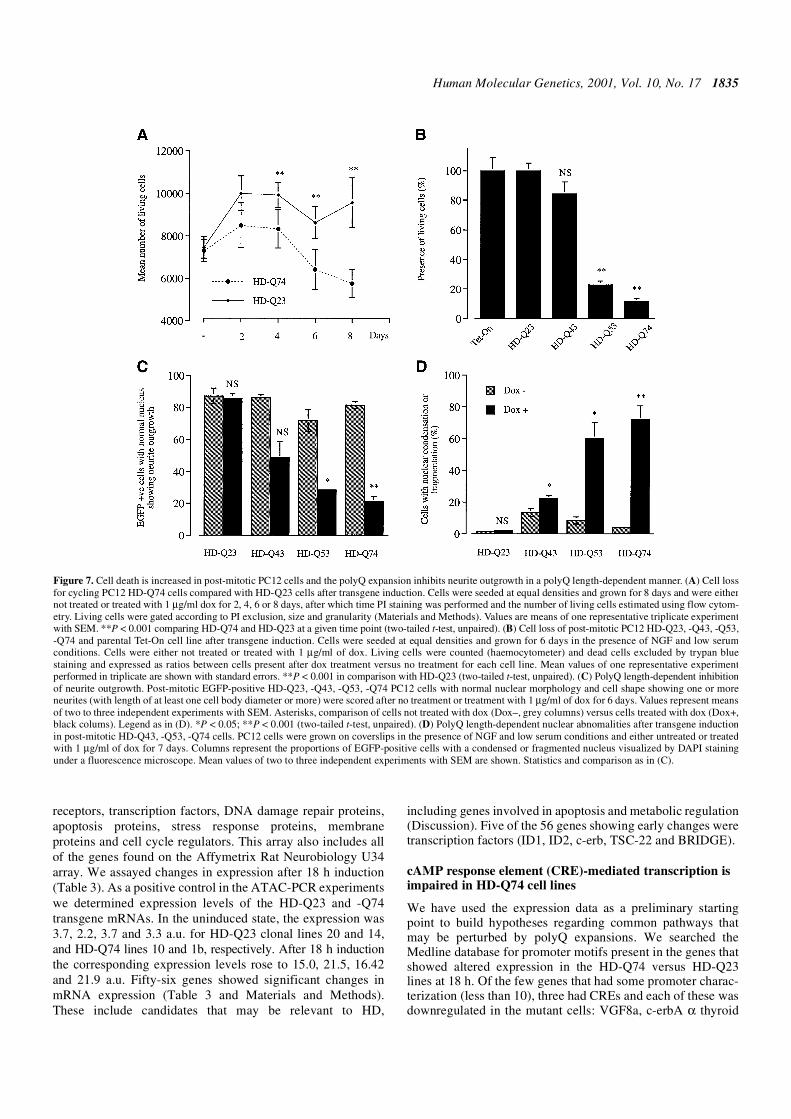
HD-Q23 and HD-Q74 cycling cells initially seeded at identicaldensities at different times after induction using flow cyto-metry. Assuming a similar rate of cell division, there were∼84% of surviving HD-Q74 cells at day 4, ∼75% HD-Q74 cellsat day 6 and ∼60% HD-Q74 cells at day 8, compared withsurviving HD-Q23 cells (Fig. 7A).
Expression of htt exon 1 with a polyQ expansion increases cell death in post-mitotic cells and inhibits neurite outgrowth
We used inducible PC12 cells to investigate whether the rateof cell death observed in cycling cells was of similar magni-tude in post-mitotic cells. For this purpose, we differentiatedthe same clonal PC12 cells used in the death assays describedabove (HD-Q23, -Q43, -Q53, -Q74) into post-mitotic, neuron-like cells using low serum culture medium and NGF. We firstdetermined the number of living cells at day 6 after dox treat-ment and simultaneous NGF exposure using the trypan blueexclusion assay. In Figure 7B, the presence of living cells foreach clonal line is expressed as the ratio between cells presentafter dox treatment versus no treatment. We observed exten-sive cell loss for HD-Q53 (~75%) and HD-Q74 (>80%) afterdox treatment, while HD-Q23 and HD-Q43 did not showsignificant cell loss. These results were confirmed in two inde-pendent experiments and two cell lines of independent clonalorigin expressing Q23 and Q74 expansions (data not shown).Cell loss correlated with repeat length (R2 = 0.74; P < 0.0001;linear regression). No significant cell loss was detected for the
Table 1. Sequestration of components of the UPP and HSPs into polyQ aggregates of PC12 inducible HD-Q74 cells analysed by immunocytochemistry after various periods of dox treatment (1 µg/ml)
Data are representative of both cycling and post-mitotic cells.+/–, Occasional co-localization (<1% of cells with inclusions); +, 1–10% ofcells with inclusions; ++, 10–50% of cells with inclusions; +++, 50–100% ofcells with inclusions; E2 conjugat., E2 ubiquitin conjugating enzyme; 11S,19S, 20S, proteasome subunits; HSP, heat-shock protein; HSC, heat-shockcognate (non-inducible).
Antibody Day 1–2 Day 3–4 Day 6–7
Ubiquitin +/– + ++
E2 conjugat. – – –
11S α – – +/–
11S β – – –
11S γ – – –
19S (p45) – – –
20S +++ +++ +++
HSP25 – – –
HSP27 – – –
HDJ-1 +++ +++ +++
HDJ-2 +++ +++ +++
HSC70 ++ ++ ++
HSP70 +++ +++ +++
HSP90 – – –
HSP110 – – –
Figure 5. Time-course experiment using cycling HD-Q23, -Q43, -Q53 and -Q74PC12 cells that were grown on coverslips for 6 days in the absence (–) or pres-ence of 1000 ng/ml dox for 3 or 6 days. The viability of cells was examined byusing TUNEL to visualize cells with DNA-strand breakage. Columns repre-sent the absolute number of TUNEL-positive cells per visual field detected in5–10 randomly chosen high power fields (40×). In all cases, we scored highpower fields that were ∼80% confluent. The dotted line represents the propor-tion of cells containing inclusions as a percentage (%), in the same experimentrun in parallel. This experiment was performed three times with similar resultsand data from one representative experiment are shown.
1834 Human Molecular Genetics, 2001, Vol. 10, No. 17
HD-Q23 or parental Tet-On cells and there was no significantdifference between the HD-Q23 and Tet-On lines (P > 0.05,unpaired t-test) (Fig. 7B).
We next examined whether polyQ expansions affectedneurite outgrowth. In order to exclude the possibility thatreduced neurite outgrowth was simply caused by cell death wefocused on HD-Q23, -Q43, -Q53 and -Q74 cells with intactnuclei and normal cell volume/shape, grown in the presence orabsence of dox and noted the degree of neurite extension. Wefound that cells stably expressing htt exon 1 with a polyQexpansion were less likely to show neurite outgrowth(Fig. 7C). This effect was also dependent on the length of thepolyQ expansion. We obtained consistent results for HD-Q23and -Q74 cells of different clonal origin (data not shown).
In post-mitotic cells, we observed an inverse correlationbetween neurite outgrowth and cell death measured as nuclearcondensation or fragmentation. After 7 days of dox treatment,only 6% of HD-Q74 cells that developed neurites showed
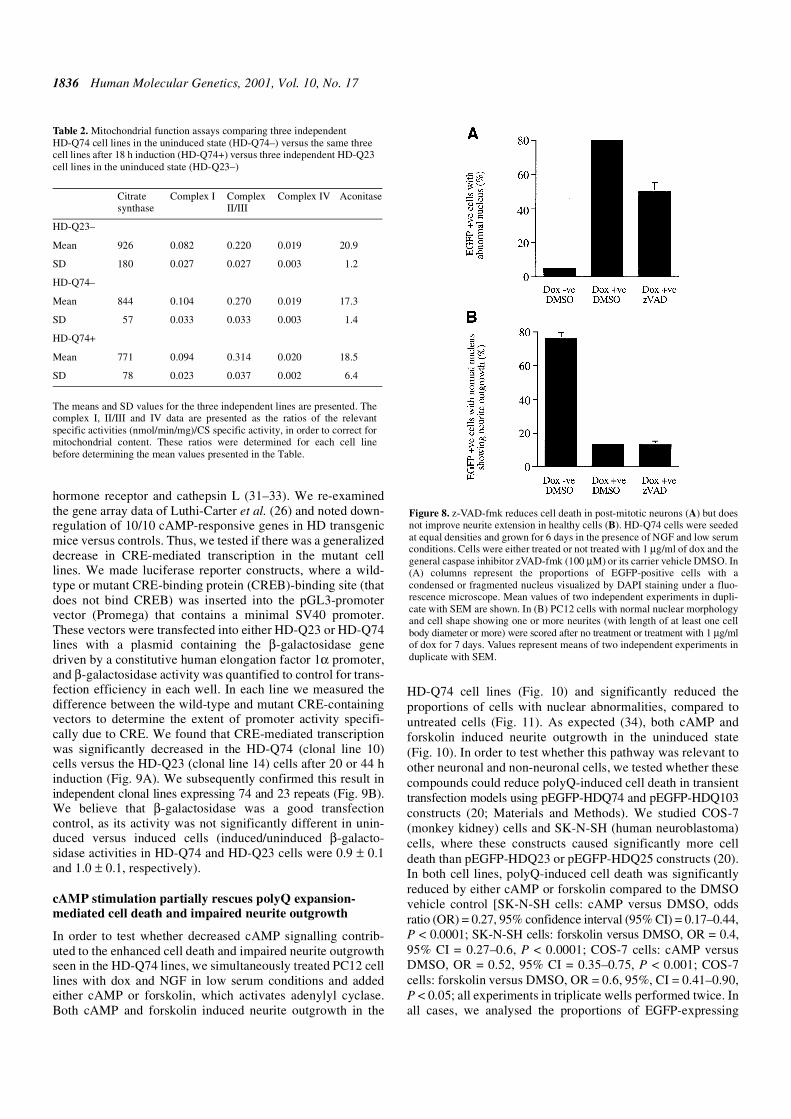
nuclear condensation/fragmentation, whereas 77% of HD-Q74cells that did not develop neurites showed nuclear abnormali-ties. In post-mitotic cells with reduced neurite outgrowth, theproportion of dox-treated HD-Q53 and HD-Q74 cells with acondensed or fragmented nucleus was significantly differentfrom non-treated cells and cell death was correlated with largerpolyQ expansion (R2 = 0.84; P = 0.0002; linear regression)(Fig. 7D). We did not detect any nuclear abnormalities in dox-treated post-mitotic HD-Q23 cells (Fig. 7D). Furthermore, wedid not observe nuclear fragmentation in cycling HD-Q23 orHD-Q74 PC12 cells treated with dox (data not shown). Celldeath in post-mitotic cells expressing expanded repeats wascaspase dependent (Fig. 8A), as we observed with cyclingcells. However, the broad caspase inhibitor zVAD-fmk did notimprove the proportions of normal EGFP-positive HD-Q74cells with neurite outgrowth (Fig. 8B), confirming that thedecreased neurite outgrowth was not simply a consequence ofcell death.
PolyQ expansions do not cause mitochondrial compromise at early times after induction of expression
A major aim of our study was to investigate early changes ingene expression in our inducible cell model. Since alterationsin mitochondrial metabolism may occur in HD and in animalmodels (29,30), such changes may cause secondary changes ingene expression unrelated to the polyQ expansion. Thus, wetook the precaution of ensuring that no overt defects wereoccuring at the times when we performed the gene expressionstudies. We determined a range of mitochondrial functions inthe three independent HD-Q74 and three independent HD-Q23cell lines that were used in the various gene expression assays(see below). For these studies and for gene expressionanalyses, we used cycling cells, as they were clearly lesssensitive to the polyQ expansion compared to serum-starvedNGF-treated cells (Fig. 7). There was no evidence of anydeficit in mitochondrial enzyme or aconitase activity in theHD-Q74 lines after 18 h of induction, compared with the samelines in the uninduced state, or HD-Q23 lines in the uninducedstate (Table 2. ). In a pilot experiment, we found no obviousmitochondrial compromise in an HD-Q74 cell line after 72 hof induction, compared with the same line in the uninducedstate or an uninduced HD-Q23 line (data not shown). Celldeath was not detectably increased in the HD-Q74 linesversus the HD-Q23 lines induced for <24 h (<2% cells withabnormal nuclei in either HD-Q23 or HD-Q74) (Fig 7A).Inclusions were found in 13% [± 5.2% (SD)] of HD-Q74 cellsafter 18 h induction.
Gene expression analyses
In order to measure expression changes in a wide range ofgenes, we have assayed changes in gene expression usingAffymetrix arrays, Clontech filters and adapter-taggedcompetitive-PCR (ATAC-PCR) (see Materials and Methodsfor experimental details). These different approaches interrogatedgene sets with minimal overlap. The Affymetrix arrays assayedapproximately 7000 genes, the ATAC-PCR approximately1000 genes and the Clontech Filters approximately 2400genes. We used the Affymetrix U34A Rat Genome array,which includes genes encoding metabolic enzymes, growthfactors and receptors, kinases and phosphatases, nuclear
Figure 6. Cell death is reduced by the caspase inhibitor zVAD-fmk in PC12cells. (A) Columns represent the proportion of TUNEL-positive cyclingHD-Q74 cells (PC12) out of a whole cell population that was grown oncoverslips for 6 days and not treated with dox (no Dox), treated with 1 ng/mlof dox or with 1000 ng/ml of dox (Dox) with addition of the general caspaseinhibitor zVAD-fmk (100 µM), the caspase 3-like inhibitor zDEVD-fmk(200 µM) or the solvent control (DMSO). Means of three independent experi-ments with standard errors are shown. (B) Columns represent the proportion ofEGFP-positive cells containing inclusions for three parallel experiments to(A), under the same conditions. Unpaired two-tailed t-tests were performed to testthe effects of zVAD-fmk or zDEVD-fmk versus DMSO controls. **P < 0.001;NS, P > 0.05.
Human Molecular Genetics, 2001, Vol. 10, No. 17 1835
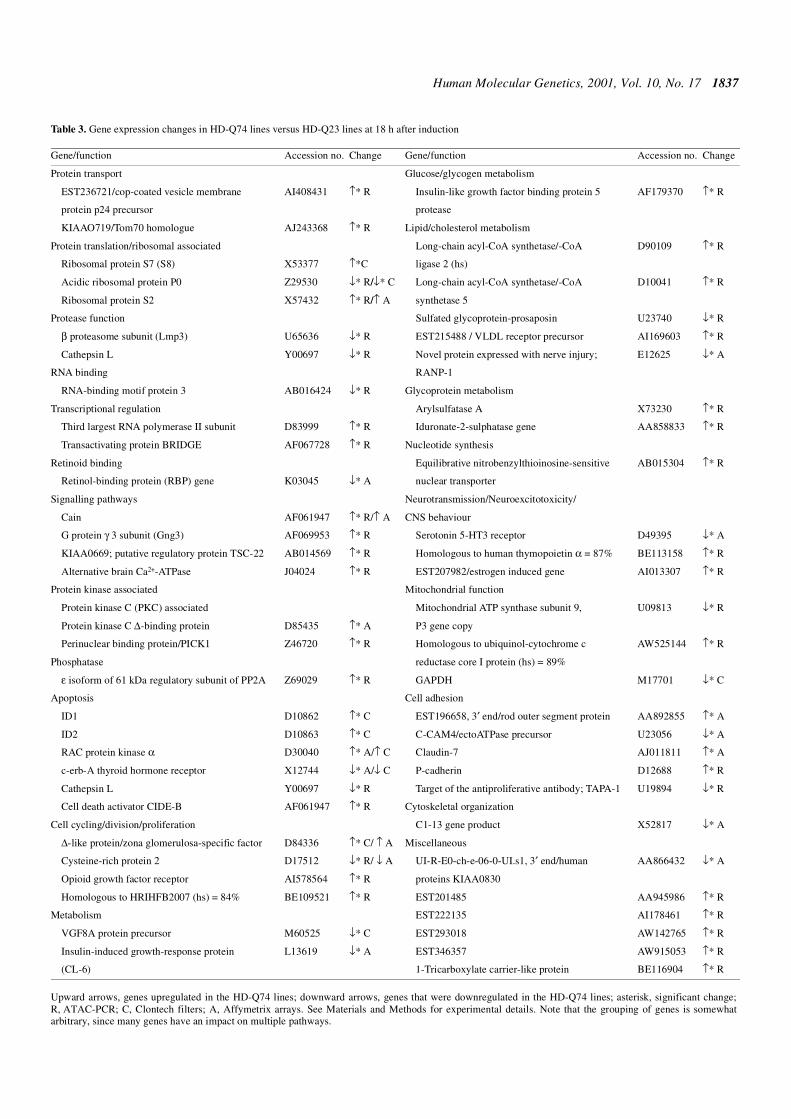
receptors, transcription factors, DNA damage repair proteins,apoptosis proteins, stress response proteins, membraneproteins and cell cycle regulators. This array also includes allof the genes found on the Affymetrix Rat Neurobiology U34array. We assayed changes in expression after 18 h induction(Table 3). As a positive control in the ATAC-PCR experimentswe determined expression levels of the HD-Q23 and -Q74transgene mRNAs. In the uninduced state, the expression was3.7, 2.2, 3.7 and 3.3 a.u. for HD-Q23 clonal lines 20 and 14,and HD-Q74 lines 10 and 1b, respectively. After 18 h inductionthe corresponding expression levels rose to 15.0, 21.5, 16.42and 21.9 a.u. Fifty-six genes showed significant changes inmRNA expression (Table 3 and Materials and Methods).These include candidates that may be relevant to HD,
including genes involved in apoptosis and metabolic regulation(Discussion). Five of the 56 genes showing early changes weretranscription factors (ID1, ID2, c-erb, TSC-22 and BRIDGE).
cAMP response element (CRE)-mediated transcription is impaired in HD-Q74 cell lines
We have used the expression data as a preliminary startingpoint to build hypotheses regarding common pathways thatmay be perturbed by polyQ expansions. We searched theMedline database for promoter motifs present in the genes thatshowed altered expression in the HD-Q74 versus HD-Q23lines at 18 h. Of the few genes that had some promoter charac-terization (less than 10), three had CREs and each of these wasdownregulated in the mutant cells: VGF8a, c-erbA α thyroid
Figure 7. Cell death is increased in post-mitotic PC12 cells and the polyQ expansion inhibits neurite outgrowth in a polyQ length-dependent manner. (A) Cell lossfor cycling PC12 HD-Q74 cells compared with HD-Q23 cells after transgene induction. Cells were seeded at equal densities and grown for 8 days and were eithernot treated or treated with 1 µg/ml dox for 2, 4, 6 or 8 days, after which time PI staining was performed and the number of living cells estimated using flow cytom-etry. Living cells were gated according to PI exclusion, size and granularity (Materials and Methods). Values are means of one representative triplicate experimentwith SEM. **P < 0.001 comparing HD-Q74 and HD-Q23 at a given time point (two-tailed t-test, unpaired). (B) Cell loss of post-mitotic PC12 HD-Q23, -Q43, -Q53,-Q74 and parental Tet-On cell line after transgene induction. Cells were seeded at equal densities and grown for 6 days in the presence of NGF and low serumconditions. Cells were either not treated or treated with 1 µg/ml of dox. Living cells were counted (haemocytometer) and dead cells excluded by trypan bluestaining and expressed as ratios between cells present after dox treatment versus no treatment for each cell line. Mean values of one representative experimentperformed in triplicate are shown with standard errors. **P < 0.001 in comparison with HD-Q23 (two-tailed t-test, unpaired). (C) PolyQ length-dependent inhibitionof neurite outgrowth. Post-mitotic EGFP-positive HD-Q23, -Q43, -Q53, -Q74 PC12 cells with normal nuclear morphology and cell shape showing one or moreneurites (with length of at least one cell body diameter or more) were scored after no treatment or treatment with 1 µg/ml of dox for 6 days. Values represent meansof two to three independent experiments with SEM. Asterisks, comparison of cells not treated with dox (Dox–, grey columns) versus cells treated with dox (Dox+,black colums). Legend as in (D). *P < 0.05; **P < 0.001 (two-tailed t-test, unpaired). (D) PolyQ length-dependent nuclear abnomalities after transgene inductionin post-mitotic HD-Q43, -Q53, -Q74 cells. PC12 cells were grown on coverslips in the presence of NGF and low serum conditions and either untreated or treatedwith 1 µg/ml of dox for 7 days. Columns represent the proportions of EGFP-positive cells with a condensed or fragmented nucleus visualized by DAPI stainingunder a fluorescence microscope. Mean values of two to three independent experiments with SEM are shown. Statistics and comparison as in (C).
1836 Human Molecular Genetics, 2001, Vol. 10, No. 17
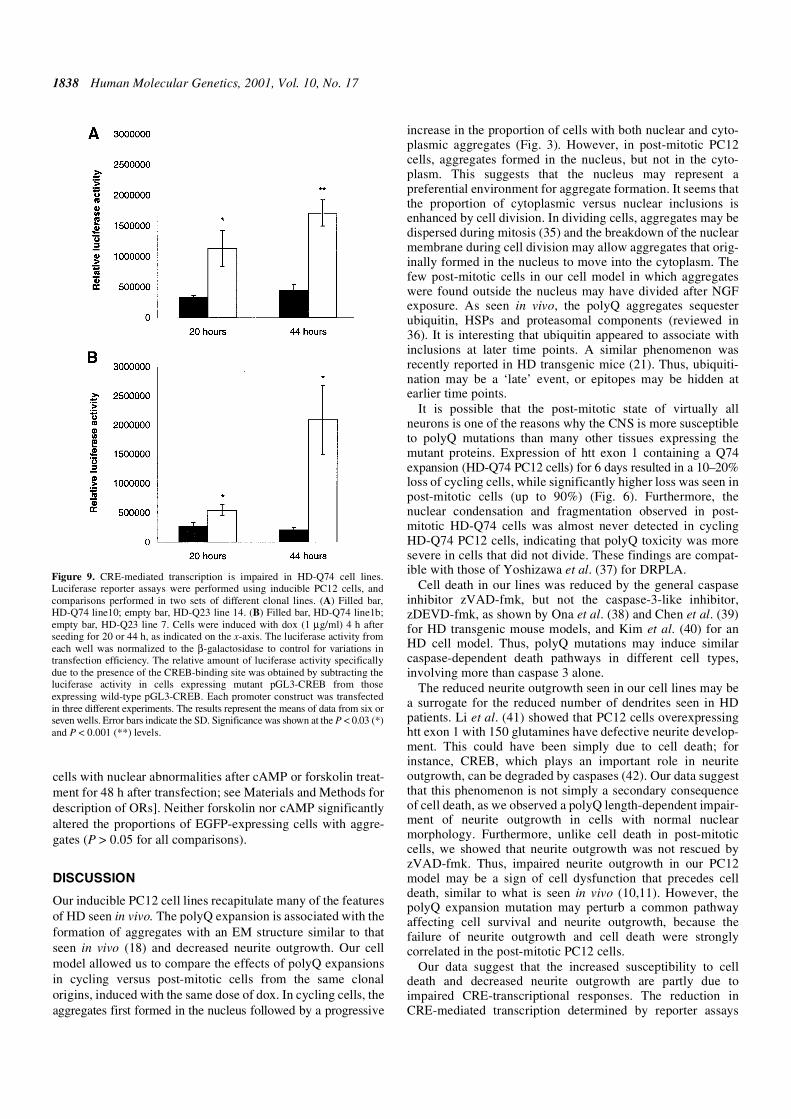
hormone receptor and cathepsin L (31–33). We re-examinedthe gene array data of Luthi-Carter et al. (26) and noted down-regulation of 10/10 cAMP-responsive genes in HD transgenicmice versus controls. Thus, we tested if there was a generalizeddecrease in CRE-mediated transcription in the mutant celllines. We made luciferase reporter constructs, where a wild-type or mutant CRE-binding protein (CREB)-binding site (thatdoes not bind CREB) was inserted into the pGL3-promotervector (Promega) that contains a minimal SV40 promoter.These vectors were transfected into either HD-Q23 or HD-Q74lines with a plasmid containing the β-galactosidase genedriven by a constitutive human elongation factor 1α promoter,and β-galactosidase activity was quantified to control for trans-fection efficiency in each well. In each line we measured thedifference between the wild-type and mutant CRE-containingvectors to determine the extent of promoter activity specifi-cally due to CRE. We found that CRE-mediated transcriptionwas significantly decreased in the HD-Q74 (clonal line 10)cells versus the HD-Q23 (clonal line 14) cells after 20 or 44 hinduction (Fig. 9A). We subsequently confirmed this result inindependent clonal lines expressing 74 and 23 repeats (Fig. 9B).We believe that β-galactosidase was a good transfectioncontrol, as its activity was not significantly different in unin-duced versus induced cells (induced/uninduced β-galacto-sidase activities in HD-Q74 and HD-Q23 cells were 0.9 ± 0.1and 1.0 ± 0.1, respectively).
cAMP stimulation partially rescues polyQ expansion-mediated cell death and impaired neurite outgrowth
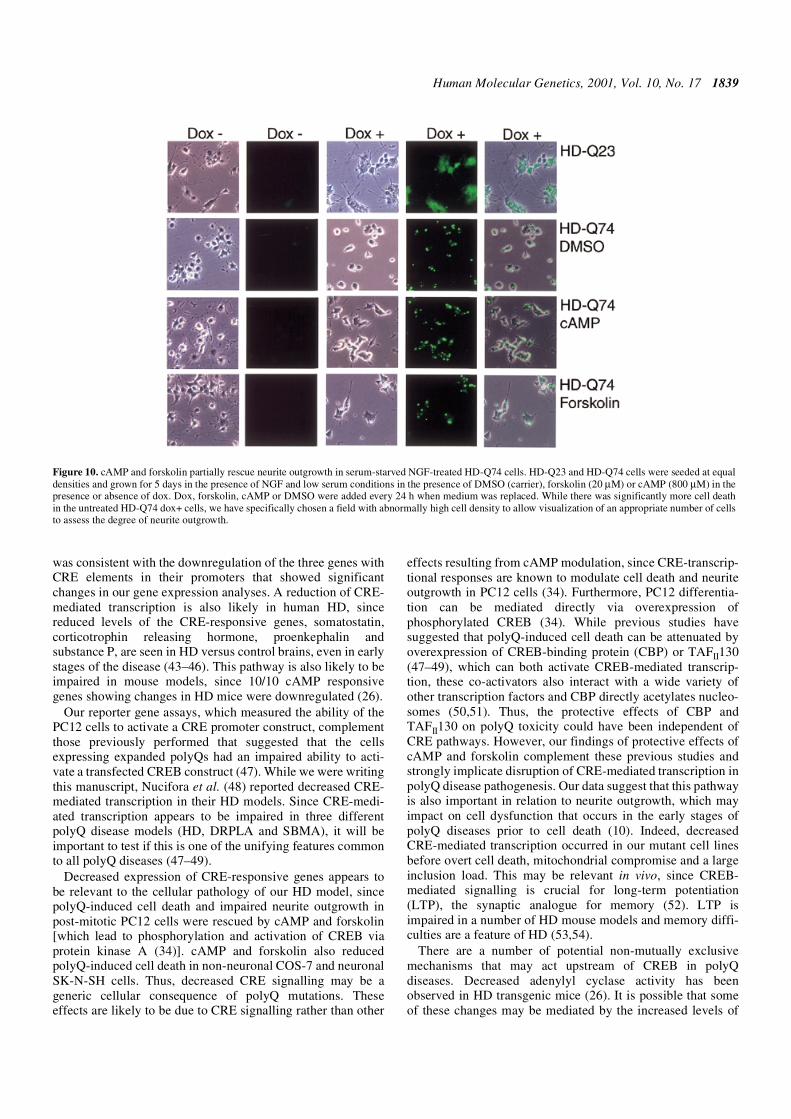
In order to test whether decreased cAMP signalling contrib-uted to the enhanced cell death and impaired neurite outgrowthseen in the HD-Q74 lines, we simultaneously treated PC12 celllines with dox and NGF in low serum conditions and addedeither cAMP or forskolin, which activates adenylyl cyclase.Both cAMP and forskolin induced neurite outgrowth in the
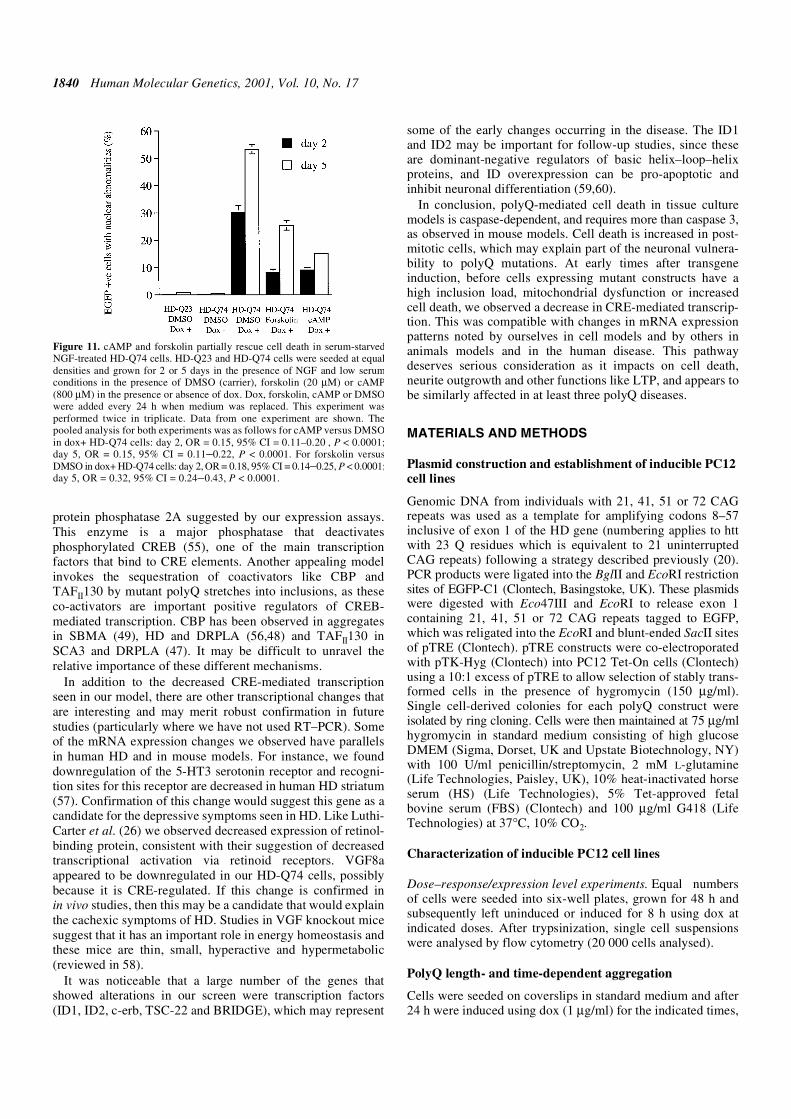
HD-Q74 cell lines (Fig. 10) and significantly reduced theproportions of cells with nuclear abnormalities, compared tountreated cells (Fig. 11). As expected (34), both cAMP andforskolin induced neurite outgrowth in the uninduced state(Fig. 10). In order to test whether this pathway was relevant toother neuronal and non-neuronal cells, we tested whether thesecompounds could reduce polyQ-induced cell death in transienttransfection models using pEGFP-HDQ74 and pEGFP-HDQ103constructs (20; Materials and Methods). We studied COS-7(monkey kidney) cells and SK-N-SH (human neuroblastoma)cells, where these constructs caused significantly more celldeath than pEGFP-HDQ23 or pEGFP-HDQ25 constructs (20).In both cell lines, polyQ-induced cell death was significantlyreduced by either cAMP or forskolin compared to the DMSOvehicle control [SK-N-SH cells: cAMP versus DMSO, oddsratio (OR) = 0.27, 95% confidence interval (95% CI) = 0.17–0.44,P < 0.0001; SK-N-SH cells: forskolin versus DMSO, OR = 0.4,95% CI = 0.27–0.6, P < 0.0001; COS-7 cells: cAMP versusDMSO, OR = 0.52, 95% CI = 0.35–0.75, P < 0.001; COS-7cells: forskolin versus DMSO, OR = 0.6, 95%, CI = 0.41–0.90,P < 0.05; all experiments in triplicate wells performed twice. Inall cases, we analysed the proportions of EGFP-expressing
Table 2. Mitochondrial function assays comparing three independent HD-Q74 cell lines in the uninduced state (HD-Q74–) versus the same three cell lines after 18 h induction (HD-Q74+) versus three independent HD-Q23 cell lines in the uninduced state (HD-Q23–)
The means and SD values for the three independent lines are presented. Thecomplex I, II/III and IV data are presented as the ratios of the relevantspecific activities (nmol/min/mg)/CS specific activity, in order to correct formitochondrial content. These ratios were determined for each cell linebefore determining the mean values presented in the Table.
Citrate synthase
Complex I ComplexII/III
Complex IV Aconitase
HD-Q23–
Mean 926 0.082 0.220 0.019 20.9
SD 180 0.027 0.027 0.003 1.2
HD-Q74–
Mean 844 0.104 0.270 0.019 17.3
SD 57 0.033 0.033 0.003 1.4
HD-Q74+
Mean 771 0.094 0.314 0.020 18.5
SD 78 0.023 0.037 0.002 6.4
Figure 8. z-VAD-fmk reduces cell death in post-mitotic neurons (A) but doesnot improve neurite extension in healthy cells (B). HD-Q74 cells were seededat equal densities and grown for 6 days in the presence of NGF and low serumconditions. Cells were either treated or not treated with 1 µg/ml of dox and thegeneral caspase inhibitor zVAD-fmk (100 µM) or its carrier vehicle DMSO. In(A) columns represent the proportions of EGFP-positive cells with acondensed or fragmented nucleus visualized by DAPI staining under a fluo-rescence microscope. Mean values of two independent experiments in dupli-cate with SEM are shown. In (B) PC12 cells with normal nuclear morphologyand cell shape showing one or more neurites (with length of at least one cellbody diameter or more) were scored after no treatment or treatment with 1 µg/mlof dox for 7 days. Values represent means of two independent experiments induplicate with SEM.
Human Molecular Genetics, 2001, Vol. 10, No. 17 1837
Table 3. Gene expression changes in HD-Q74 lines versus HD-Q23 lines at 18 h after induction
Upward arrows, genes upregulated in the HD-Q74 lines; downward arrows, genes that were downregulated in the HD-Q74 lines; asterisk, significant change;R, ATAC-PCR; C, Clontech filters; A, Affymetrix arrays. See Materials and Methods for experimental details. Note that the grouping of genes is somewhatarbitrary, since many genes have an impact on multiple pathways.
Gene/function Accession no. Change Gene/function Accession no. Change
Protein transport Glucose/glycogen metabolism
EST236721/cop-coated vesicle membrane AI408431 ↑* R Insulin-like growth factor binding protein 5 AF179370 ↑* R
protein p24 precursor protease
KIAAO719/Tom70 homologue AJ243368 ↑* R Lipid/cholesterol metabolism
Protein translation/ribosomal associated Long-chain acyl-CoA synthetase/-CoA D90109 ↑* R
Ribosomal protein S7 (S8) X53377 ↑*C ligase 2 (hs)
Acidic ribosomal protein P0 Z29530 ↓* R/↓* C Long-chain acyl-CoA synthetase/-CoA D10041 ↑* R
Ribosomal protein S2 X57432 ↑* R/↑ A synthetase 5
Protease function Sulfated glycoprotein-prosaposin U23740 ↓* R
β proteasome subunit (Lmp3) U65636 ↓* R EST215488 / VLDL receptor precursor AI169603 ↑* R
Cathepsin L Y00697 ↓* R Novel protein expressed with nerve injury; E12625 ↓* A
RNA binding RANP-1
RNA-binding motif protein 3 AB016424 ↓* R Glycoprotein metabolism
Transcriptional regulation Arylsulfatase A X73230 ↑* R
Third largest RNA polymerase II subunit D83999 ↑* R Iduronate-2-sulphatase gene AA858833 ↑* R
Transactivating protein BRIDGE AF067728 ↑* R Nucleotide synthesis
Retinoid binding Equilibrative nitrobenzylthioinosine-sensitive AB015304 ↑* R
Retinol-binding protein (RBP) gene K03045 ↓* A nuclear transporter
Signalling pathways Neurotransmission/Neuroexcitotoxicity/
Cain AF061947 ↑* R/↑ A CNS behaviour
G protein γ 3 subunit (Gng3) AF069953 ↑* R Serotonin 5-HT3 receptor D49395 ↓* A
KIAA0669; putative regulatory protein TSC-22 AB014569 ↑* R Homologous to human thymopoietin α = 87% BE113158 ↑* R
Alternative brain Ca2+-ATPase J04024 ↑* R EST207982/estrogen induced gene AI013307 ↑* R
Protein kinase associated Mitochondrial function
Protein kinase C (PKC) associated Mitochondrial ATP synthase subunit 9, U09813 ↓* R
Protein kinase C ∆-binding protein D85435 ↑* A P3 gene copy
Perinuclear binding protein/PICK1 Z46720 ↑* R Homologous to ubiquinol-cytochrome c AW525144 ↑* R
Phosphatase reductase core I protein (hs) = 89%
ε isoform of 61 kDa regulatory subunit of PP2A Z69029 ↑* R GAPDH M17701 ↓* C
Apoptosis Cell adhesion
ID1 D10862 ↑* C EST196658, 3′ end/rod outer segment protein AA892855 ↑* A
ID2 D10863 ↑* C C-CAM4/ectoATPase precursor U23056 ↓* A
RAC protein kinase α D30040 ↑* A/↑ C Claudin-7 AJ011811 ↑* A
c-erb-A thyroid hormone receptor X12744 ↓* A/↓ C P-cadherin D12688 ↑* R
Cathepsin L Y00697 ↓* R Target of the antiproliferative antibody; TAPA-1 U19894 ↓* R
Cell death activator CIDE-B AF061947 ↑* R Cytoskeletal organization
Cell cycling/division/proliferation C1-13 gene product X52817 ↓* A
∆-like protein/zona glomerulosa-specific factor D84336 ↑* C/ ↑ A Miscellaneous
Cysteine-rich protein 2 D17512 ↓* R/ ↓ A UI-R-E0-ch-e-06-0-UI.s1, 3′ end/human AA866432 ↓* A
Opioid growth factor receptor AI578564 ↑* R proteins KIAA0830
Homologous to HRIHFB2007 (hs) = 84% BE109521 ↑* R EST201485 AA945986 ↑* R
Metabolism EST222135 AI178461 ↑* R
VGF8A protein precursor M60525 ↓* C EST293018 AW142765 ↑* R
Insulin-induced growth-response protein L13619 ↓* A EST346357 AW915053 ↑* R
(CL-6) 1-Tricarboxylate carrier-like protein BE116904 ↑* R
1838 Human Molecular Genetics, 2001, Vol. 10, No. 17
cells with nuclear abnormalities after cAMP or forskolin treat-ment for 48 h after transfection; see Materials and Methods fordescription of ORs]. Neither forskolin nor cAMP significantlyaltered the proportions of EGFP-expressing cells with aggre-gates (P > 0.05 for all comparisons).
DISCUSSION
Our inducible PC12 cell lines recapitulate many of the featuresof HD seen in vivo. The polyQ expansion is associated with theformation of aggregates with an EM structure similar to thatseen in vivo (18) and decreased neurite outgrowth. Our cellmodel allowed us to compare the effects of polyQ expansionsin cycling versus post-mitotic cells from the same clonalorigins, induced with the same dose of dox. In cycling cells, theaggregates first formed in the nucleus followed by a progressive
increase in the proportion of cells with both nuclear and cyto-plasmic aggregates (Fig. 3). However, in post-mitotic PC12cells, aggregates formed in the nucleus, but not in the cyto-plasm. This suggests that the nucleus may represent apreferential environment for aggregate formation. It seems thatthe proportion of cytoplasmic versus nuclear inclusions isenhanced by cell division. In dividing cells, aggregates may bedispersed during mitosis (35) and the breakdown of the nuclearmembrane during cell division may allow aggregates that orig-inally formed in the nucleus to move into the cytoplasm. Thefew post-mitotic cells in our cell model in which aggregateswere found outside the nucleus may have divided after NGFexposure. As seen in vivo, the polyQ aggregates sequesterubiquitin, HSPs and proteasomal components (reviewed in36). It is interesting that ubiquitin appeared to associate withinclusions at later time points. A similar phenomenon wasrecently reported in HD transgenic mice (21). Thus, ubiquiti-nation may be a ‘late’ event, or epitopes may be hidden atearlier time points.
It is possible that the post-mitotic state of virtually allneurons is one of the reasons why the CNS is more susceptibleto polyQ mutations than many other tissues expressing themutant proteins. Expression of htt exon 1 containing a Q74expansion (HD-Q74 PC12 cells) for 6 days resulted in a 10–20%loss of cycling cells, while significantly higher loss was seen inpost-mitotic cells (up to 90%) (Fig. 6). Furthermore, thenuclear condensation and fragmentation observed in post-mitotic HD-Q74 cells was almost never detected in cyclingHD-Q74 PC12 cells, indicating that polyQ toxicity was moresevere in cells that did not divide. These findings are compat-ible with those of Yoshizawa et al. (37) for DRPLA.
Cell death in our lines was reduced by the general caspaseinhibitor zVAD-fmk, but not the caspase-3-like inhibitor,zDEVD-fmk, as shown by Ona et al. (38) and Chen et al. (39)for HD transgenic mouse models, and Kim et al. (40) for anHD cell model. Thus, polyQ mutations may induce similarcaspase-dependent death pathways in different cell types,involving more than caspase 3 alone.
The reduced neurite outgrowth seen in our cell lines may bea surrogate for the reduced number of dendrites seen in HDpatients. Li et al. (41) showed that PC12 cells overexpressinghtt exon 1 with 150 glutamines have defective neurite develop-ment. This could have been simply due to cell death; forinstance, CREB, which plays an important role in neuriteoutgrowth, can be degraded by caspases (42). Our data suggestthat this phenomenon is not simply a secondary consequenceof cell death, as we observed a polyQ length-dependent impair-ment of neurite outgrowth in cells with normal nuclearmorphology. Furthermore, unlike cell death in post-mitoticcells, we showed that neurite outgrowth was not rescued byzVAD-fmk. Thus, impaired neurite outgrowth in our PC12model may be a sign of cell dysfunction that precedes celldeath, similar to what is seen in vivo (10,11). However, thepolyQ expansion mutation may perturb a common pathwayaffecting cell survival and neurite outgrowth, because thefailure of neurite outgrowth and cell death were stronglycorrelated in the post-mitotic PC12 cells.
Our data suggest that the increased susceptibility to celldeath and decreased neurite outgrowth are partly due toimpaired CRE-transcriptional responses. The reduction inCRE-mediated transcription determined by reporter assays
Figure 9. CRE-mediated transcription is impaired in HD-Q74 cell lines.Luciferase reporter assays were performed using inducible PC12 cells, andcomparisons performed in two sets of different clonal lines. (A) Filled bar,HD-Q74 line10; empty bar, HD-Q23 line 14. (B) Filled bar, HD-Q74 line1b;empty bar, HD-Q23 line 7. Cells were induced with dox (1 µg/ml) 4 h afterseeding for 20 or 44 h, as indicated on the x-axis. The luciferase activity fromeach well was normalized to the β-galactosidase to control for variations intransfection efficiency. The relative amount of luciferase activity specificallydue to the presence of the CREB-binding site was obtained by subtracting theluciferase activity in cells expressing mutant pGL3-CREB from thoseexpressing wild-type pGL3-CREB. Each promoter construct was transfectedin three different experiments. The results represent the means of data from six orseven wells. Error bars indicate the SD. Significance was shown at the P < 0.03 (*)and P < 0.001 (**) levels.
Human Molecular Genetics, 2001, Vol. 10, No. 17 1839
was consistent with the downregulation of the three genes withCRE elements in their promoters that showed significantchanges in our gene expression analyses. A reduction of CRE-mediated transcription is also likely in human HD, sincereduced levels of the CRE-responsive genes, somatostatin,corticotrophin releasing hormone, proenkephalin andsubstance P, are seen in HD versus control brains, even in earlystages of the disease (43–46). This pathway is also likely to beimpaired in mouse models, since 10/10 cAMP responsivegenes showing changes in HD mice were downregulated (26).
Our reporter gene assays, which measured the ability of thePC12 cells to activate a CRE promoter construct, complementthose previously performed that suggested that the cellsexpressing expanded polyQs had an impaired ability to acti-vate a transfected CREB construct (47). While we were writingthis manuscript, Nucifora et al. (48) reported decreased CRE-mediated transcription in their HD models. Since CRE-medi-ated transcription appears to be impaired in three differentpolyQ disease models (HD, DRPLA and SBMA), it will beimportant to test if this is one of the unifying features commonto all polyQ diseases (47–49).
Decreased expression of CRE-responsive genes appears tobe relevant to the cellular pathology of our HD model, sincepolyQ-induced cell death and impaired neurite outgrowth inpost-mitotic PC12 cells were rescued by cAMP and forskolin[which lead to phosphorylation and activation of CREB viaprotein kinase A (34)]. cAMP and forskolin also reducedpolyQ-induced cell death in non-neuronal COS-7 and neuronalSK-N-SH cells. Thus, decreased CRE signalling may be ageneric cellular consequence of polyQ mutations. Theseeffects are likely to be due to CRE signalling rather than other
effects resulting from cAMP modulation, since CRE-transcrip-tional responses are known to modulate cell death and neuriteoutgrowth in PC12 cells (34). Furthermore, PC12 differentia-tion can be mediated directly via overexpression ofphosphorylated CREB (34). While previous studies havesuggested that polyQ-induced cell death can be attenuated byoverexpression of CREB-binding protein (CBP) or TAFII130(47–49), which can both activate CREB-mediated transcrip-tion, these co-activators also interact with a wide variety ofother transcription factors and CBP directly acetylates nucleo-somes (50,51). Thus, the protective effects of CBP andTAFII130 on polyQ toxicity could have been independent ofCRE pathways. However, our findings of protective effects ofcAMP and forskolin complement these previous studies andstrongly implicate disruption of CRE-mediated transcription inpolyQ disease pathogenesis. Our data suggest that this pathwayis also important in relation to neurite outgrowth, which mayimpact on cell dysfunction that occurs in the early stages ofpolyQ diseases prior to cell death (10). Indeed, decreasedCRE-mediated transcription occurred in our mutant cell linesbefore overt cell death, mitochondrial compromise and a largeinclusion load. This may be relevant in vivo, since CREB-mediated signalling is crucial for long-term potentiation(LTP), the synaptic analogue for memory (52). LTP isimpaired in a number of HD mouse models and memory diffi-culties are a feature of HD (53,54).
There are a number of potential non-mutually exclusivemechanisms that may act upstream of CREB in polyQdiseases. Decreased adenylyl cyclase activity has beenobserved in HD transgenic mice (26). It is possible that someof these changes may be mediated by the increased levels of
Figure 10. cAMP and forskolin partially rescue neurite outgrowth in serum-starved NGF-treated HD-Q74 cells. HD-Q23 and HD-Q74 cells were seeded at equaldensities and grown for 5 days in the presence of NGF and low serum conditions in the presence of DMSO (carrier), forskolin (20 µM) or cAMP (800 µM) in thepresence or absence of dox. Dox, forskolin, cAMP or DMSO were added every 24 h when medium was replaced. While there was significantly more cell deathin the untreated HD-Q74 dox+ cells, we have specifically chosen a field with abnormally high cell density to allow visualization of an appropriate number of cellsto assess the degree of neurite outgrowth.
1840 Human Molecular Genetics, 2001, Vol. 10, No. 17
protein phosphatase 2A suggested by our expression assays.This enzyme is a major phosphatase that deactivatesphosphorylated CREB (55), one of the main transcriptionfactors that bind to CRE elements. Another appealing modelinvokes the sequestration of coactivators like CBP andTAFII130 by mutant polyQ stretches into inclusions, as theseco-activators are important positive regulators of CREB-mediated transcription. CBP has been observed in aggregatesin SBMA (49), HD and DRPLA (56,48) and TAFII130 inSCA3 and DRPLA (47). It may be difficult to unravel therelative importance of these different mechanisms.
In addition to the decreased CRE-mediated transcriptionseen in our model, there are other transcriptional changes thatare interesting and may merit robust confirmation in futurestudies (particularly where we have not used RT–PCR). Someof the mRNA expression changes we observed have parallelsin human HD and in mouse models. For instance, we founddownregulation of the 5-HT3 serotonin receptor and recogni-tion sites for this receptor are decreased in human HD striatum(57). Confirmation of this change would suggest this gene as acandidate for the depressive symptoms seen in HD. Like Luthi-Carter et al. (26) we observed decreased expression of retinol-binding protein, consistent with their suggestion of decreasedtranscriptional activation via retinoid receptors. VGF8aappeared to be downregulated in our HD-Q74 cells, possiblybecause it is CRE-regulated. If this change is confirmed inin vivo studies, then this may be a candidate that would explainthe cachexic symptoms of HD. Studies in VGF knockout micesuggest that it has an important role in energy homeostasis andthese mice are thin, small, hyperactive and hypermetabolic(reviewed in 58).
It was noticeable that a large number of the genes thatshowed alterations in our screen were transcription factors(ID1, ID2, c-erb, TSC-22 and BRIDGE), which may represent
some of the early changes occurring in the disease. The ID1and ID2 may be important for follow-up studies, since theseare dominant-negative regulators of basic helix–loop–helixproteins, and ID overexpression can be pro-apoptotic andinhibit neuronal differentiation (59,60).
In conclusion, polyQ-mediated cell death in tissue culturemodels is caspase-dependent, and requires more than caspase 3,as observed in mouse models. Cell death is increased in post-mitotic cells, which may explain part of the neuronal vulnera-bility to polyQ mutations. At early times after transgeneinduction, before cells expressing mutant constructs have ahigh inclusion load, mitochondrial dysfunction or increasedcell death, we observed a decrease in CRE-mediated transcrip-tion. This was compatible with changes in mRNA expressionpatterns noted by ourselves in cell models and by others inanimals models and in the human disease. This pathwaydeserves serious consideration as it impacts on cell death,neurite outgrowth and other functions like LTP, and appears tobe similarly affected in at least three polyQ diseases.
MATERIALS AND METHODS
Plasmid construction and establishment of inducible PC12 cell lines
Genomic DNA from individuals with 21, 41, 51 or 72 CAGrepeats was used as a template for amplifying codons 8–57inclusive of exon 1 of the HD gene (numbering applies to httwith 23 Q residues which is equivalent to 21 uninterruptedCAG repeats) following a strategy described previously (20).PCR products were ligated into the BglII and EcoRI restrictionsites of EGFP-C1 (Clontech, Basingstoke, UK). These plasmidswere digested with Eco47III and EcoRI to release exon 1containing 21, 41, 51 or 72 CAG repeats tagged to EGFP,which was religated into the EcoRI and blunt-ended SacII sitesof pTRE (Clontech). pTRE constructs were co-electroporatedwith pTK-Hyg (Clontech) into PC12 Tet-On cells (Clontech)using a 10:1 excess of pTRE to allow selection of stably trans-formed cells in the presence of hygromycin (150 µg/ml).Single cell-derived colonies for each polyQ construct wereisolated by ring cloning. Cells were then maintained at 75 µg/mlhygromycin in standard medium consisting of high glucoseDMEM (Sigma, Dorset, UK and Upstate Biotechnology, NY)with 100 U/ml penicillin/streptomycin, 2 mM L-glutamine(Life Technologies, Paisley, UK), 10% heat-inactivated horseserum (HS) (Life Technologies), 5% Tet-approved fetalbovine serum (FBS) (Clontech) and 100 µg/ml G418 (LifeTechnologies) at 37°C, 10% CO2.
Characterization of inducible PC12 cell lines
Dose–response/expression level experiments. Equal numbersof cells were seeded into six-well plates, grown for 48 h andsubsequently left uninduced or induced for 8 h using dox atindicated doses. After trypsinization, single cell suspensionswere analysed by flow cytometry (20 000 cells analysed).
PolyQ length- and time-dependent aggregation
Cells were seeded on coverslips in standard medium and after24 h were induced using dox (1 µg/ml) for the indicated times,
Figure 11. cAMP and forskolin partially rescue cell death in serum-starvedNGF-treated HD-Q74 cells. HD-Q23 and HD-Q74 cells were seeded at equaldensities and grown for 2 or 5 days in the presence of NGF and low serumconditions in the presence of DMSO (carrier), forskolin (20 µM) or cAMP(800 µM) in the presence or absence of dox. Dox, forskolin, cAMP or DMSOwere added every 24 h when medium was replaced. This experiment wasperformed twice in triplicate. Data from one experiment are shown. Thepooled analysis for both experiments was as follows for cAMP versus DMSOin dox+ HD-Q74 cells: day 2, OR = 0.15, 95% CI = 0.11–0.20 , P < 0.0001;day 5, OR = 0.15, 95% CI = 0.11–0.22, P < 0.0001. For forskolin versusDMSO in dox+ HD-Q74 cells: day 2, OR = 0.18, 95% CI = 0.14–0.25, P < 0.0001;day 5, OR = 0.32, 95% CI = 0.24–0.43, P < 0.0001.
Human Molecular Genetics, 2001, Vol. 10, No. 17 1841
washed, fixed and mounted (see below). 500–1000 EGFP-positive cells were analysed per coverslip. PolyQ aggregationin post-mitotic PC12 cells was estimated by treating cells withNGF and low serum media (see below) for 6 days, after whichcells were induced with dox. Nuclear localization of inclusionswas considered positive if the EGFP inclusions were totallysurrounded by the DNA dye 4′,6-diamino-2-phenylindole(DAPI) (100–200 EGFP-positive cells/coverslip).
Treatment with NGF
For co-localization studies (see below), cells were seeded oncoverslips and 24 h later exposed to 100 ng/ml of NGF (Sigma)under low-serum conditions (1% HS) for 6 consecutive days andinduced subsequently using 1 µg/ml of dox. For cell death andneurite outgrowth experiments, cells of similar passage numberwere either induced or left uninduced for 24 h (1 µg/ml dox)after which the cells were seeded at 1–2 × 10⁵ per well on cover-slips in NGF/1% HS. Coverslips were coated with CollagenType I (1 mg/ml) (Sigma), air dried and overlaid for 1 h withDMEM containing rat laminin (10 µg/ml) (Life Technologies).
FACS analysis
Quantitative flow cytometry was performed as describedpreviously (20). For some experiments (see below), cells wereexposed to propidium iodide (PI) at 1 µg/ml in 1× PBS for10 min.
Immunocytochemistry and western blotting
For co-localization studies, PC12 HD-Q23, -Q43 and -Q74cells were grown on coverslips coated with poly-ornithine(10 µg/ml in DMEM, overlay for 1 h), left uninduced or treatedwith dox (1000 ng/ml) for either 1–2, 3–4 or 6–7 days. Forstudies of NGF-differentiated PC12 cells, coverslips wereadditionally coated with rat laminin (see above). Immunocyto-chemistry was performed as described previously (20). Anti-bodies were rabbit anti-HDJ-1 polyclonal/1:1000 (SPA-400,Stressgene, Victoria, CA), mouse anti-HDJ-2 monoclonal/1:200 (Neomarker, Fremont, CA), rabbit anti-HSP25 poly-clonal/1:200 (Stressgene), mouse anti-HSP27/1:400(Neomarker), mouse anti-HSP70 monoclonal/1:200 (SPA-810,Stressgene), rat anti-HSC70 monoclonal/1:400 (Stressgene),mouse anti-HSP90 monoclonal/1:200 (Stressgene), rabbit anti-HSP110 polyclonal/1:200 (Stressgene), mouse anti-ubiquitinmonoclonal/1:200 (Chemicon, Harrow, UK), rabbit anti-11Sproteasome regulator subunit PA28 (α, β and γ) polyclonal/1:2000 (Affiniti, Exeter, UK), rabbit anti-19S regulatorATPase subunit 8 (p45) polyclonal/1:200 (Affiniti), rabbitanti-20S proteasome polyclonal/1:200 (Affiniti) and rabbitanti-ubiquitin conjugating enzyme E2 polyclonal/1:200(Affiniti).
For western blotting, cell pellets were lysed in 1% Triton X-100,150 mM NaCl, 25 mM Tris–HCl and 0.4% SDS for 30 min onice in the presence of protease inhibitors (Roche, Lewes, UK),centrifuged at high speed for 20 min at 4°C and supernatantssubjected to SDS–PAGE (12%). Antibodies were mouse anti-GFP monoclonal (1:1000, Clontech) and rabbit anti-actin poly-clonal (1:2500, Sigma). Blots were probed with peroxidase-labelled anti-mouse or -rabbit antibodies at 1:2500 (Amersham,
Buckinghamshire, UK). Bands were visualized with the ECLdetection reagent (Amersham).
Preparation of EM samples
Aliquots of 25 cm2 (80% confluency) of untreated and dox-treated(48 h) PC12 HD-Q23 and -Q74 cells were pelleted, fixed over-night in 2% paraformaldehyde/2.5% glutaraldehyde in 0.1 MNa-cacodylate-HCl buffer (pH 7.2), washed and postfixed in2% osmium tetroxide for 1 h. Then, cell pellets were treatedwith 50:50 epoxy-propane:araldite CY212 resin overnight andfinally embedded in fresh resin and cured for 2 days at 60°C.Sections (70 nm) were cut on a ultracut microtome (Leica),mounted on grids, stained with 7.5% uranylacetate in methanolfor 30 s and analysed by EM (100CX/TEM, Philips).
Cell death assays, caspase inhibition and estimation of neurite outgrowth
Presence and absence of living cells. We seeded an equalnumber of HD-Q23 and -Q74 cells and either left theseuninduced or induced for 2, 4, 6 or 8 days. Cells in each dishwere then resuspended in equal volumes of 1× PBS to getsingle cell suspensions and each suspension was analysed byflow cytometry for a constant time period (1 min). Living cellswere identified by PI exclusion, size and granularity. Thisexperiment was performed in triplicate. To estimate the pres-ence of living cells after induction of htt exon 1 in post-mitoticcells, we seeded HD-Q23, -Q43, -Q53, -Q74 and parentalTet-On cells into six-well plates, grew these for 3 days, primedcells with NGF (100 ng/ml) and induced with dox (1 µg/ml)simultaneously for 24 h or left cells uninduced in paralleldishes. Then, cells were re-seeded at equal numbers (1–2 × 10⁵
per well) in six-well plates. Plates were coated with CollagenType I (1 mg/ml) and rat laminin (10 µg/ml) (see above). Cellswere then treated for 6 days with/without dox (1 µg/ml) andNGF/1% HS (see above), washed twice, treated with trypsinand resuspended in equal volumes of 1× PBS with addition of0.4% trypan-blue (1:100). The numbers of living (trypan-blue-excluding) cells in each dish were estimated using a haemocy-tometer (two experiments in triplicate; means obtained fromfive to ten counting events per well).
Nuclear morphology and TUNEL assay
The morphology DAPI-stained nuclei was consideredabnormal if the nucleus was fragmented or condensed to asmall size. We analysed 100–200 EGFP-positive COS-7 orSK-N-SH cells per coverslip and 50–200 PC12 inducible cells.Cells exhibiting DNA strand breaks were detected by TUNELusing 3,3′-diaminobenzidine as a chromogenic substrate (Roche).For time-course experiments using HD-Q23, -Q43, -Q53 and-Q74 cells, we counted TUNEL positive cells in 5–10randomly chosen visual fields of similar density (80%) in twoto three independent experiments. To estimate the proportionof TUNEL-positive cells for the HD-Q74 clonal line, wecounted at least 1000 cells.
Caspase inhibition
zVAD-fmk (100 µM) and zDEVD-fmk (200 µM) (Calbio-chem, Nottingham, UK) were added to the media every 24 h.
1842 Human Molecular Genetics, 2001, Vol. 10, No. 17
Neurite outgrowth
PC12 cells that exhibited one or several neurites, which wereequal to or exceeded the diameter of the cells body in length,were scored as positive. We performed two to three inde-pendent experiments using single standing cells from inde-pendent clonal lines with similar passage numbers. Wecounted 50–200 cells and only considered cells with normalnuclear morphology.
cAMP and forskolin treatments
Cells were grown for the indicated periods in the presence ofDMSO (carrier), forskolin (20 µM), or cAMP [8-(4-chloro-phenylthio)adenosine3′:5′-cyclic monophosphate] (800 µM)(Sigma). PC12 cells were grown in NGF/1% HS. In transientexpression experiments in COS-7 (monkey kidney) cell lines,we used HD gene exon 1 fused to EGFP containing74 glutamine repeats (pEGFP-HDQ74) (EGFP at N-terminus,EGFP-C1; Clontech) and a comparable construct with23 glutamines. In SK-N-SH (human neuroblastoma) cells, weused a construct expressing HD gene exon 1 fused to EGFP with103 repeats (pEGFP-HDQ103) (EGFP at C-terminus, EGFP-N1;Clontech), and a comparable construct with 25 glutamines, kindgifts from Drs A.Tobin and G.Lawless. These constructs weretransfected and analysed as described previously (20).
Statistical analysis
Pooled estimates for the changes in inclusion formation/celldeath resulting from experimental manipulations assessed inmultiple experiments were calculated as ORs with 95% CIs(20). ORs compare the proportions of EGFP-expressing cellswith or without inclusions (or nuclear abnomalities) underperturbed conditions (e.g. cAMP treatment), to proportionsobserved under control conditions (e.g. DMSO carrier controlin cAMP experiments). ORs and P-values were determined byunconditional logistical regression analysis by using thegeneral loglinear option of SPSS 9.0.1 software (SPSS,Chicago). For some experiments we applied t-tests (two-tailed)or linear regression analysis (Statview for Windows, Version4.5, Chicago).
Mitochondrial function assays
For each cell line, samples were harvested from ten 10 cmdiameter plates (80–90% confluent) as described (61), with theexception that the homogenization buffer was 10 mM Tris–HClpH 7.4/0.25 M sucrose/1 mM EDTA. Following three freeze–thawcycles, mitochondrial complex I (rotenone-sensitive NADHCoQ1 reductase), complex II/III (succinate cytochrome creductase), complex IV (cytochrome oxidase) and citratesynthase (CS) activities were assayed at 30°C as described(62). Aconitase activity was analysed as described previously(63). Protein concentrations were determined by the procedureof Lowry et al. (64) using bovine serum albumin as a standard.Specific enzyme activities are expressed in nmol/min/mg.Mitochondrial respiratory chain activities are also expressed asa ratio with CS.
mRNA expression analyses
mRNA extraction. Total RNA was extracted from threedifferent clonal lines of HD-Q74 and HD-Q23 after 18 h induc-tion with 1 µg/ml dox. Six millilitres of TRIzolTM reagent (LifeTechnologies) was added to each 75 cm2 flask at 80% conflu-ency and the RNA was extracted using the manufacturer’sprotocol. RNA samples were resuspended in RNAse-freewater and quantified spectrophotometrically. The integrity ofall samples was confirmed by gel electrophoresis, demon-strating a 2-fold excess of 28S to 18S RNA, with no evidenceof degradation.
ATAC-PCR. Two 3′-directed cDNA libraries were constructedusing RNAs from the uninduced HD-Q23 (line 20) and HD-Q74 (line 10) cells induced with dox for 20 h, as describedpreviously (65). A total of 4006 unique EST sequences wasobtained from single pass sequencing of 12476 cDNA clones.We selected 1824 genes for primer design, prioritizing knowngenes and abundant unknown genes. ATAC-PCR reactionswere performed as described previously (66). However, sevenadaptors were used, instead of six in the previously describedmethod. Three adaptors were assigned for control cDNAs,which were made from RNA of the 21.10 cell line. Four adap-tors were assigned for the sample cDNAs. Each sample wasassayed twice with different calibration. One calibration used10×, 3× and 1× equivalents of the control sample compared toa 1× equivalent of the test sample. The other calibration used1×, 3× and 10× equivalents of the control sample compared toa 3× equivalent of the test sample. Relative expression levelswere calculated using calibration curves based on the controlsamples. Good quality data were obtained from 1049 genes.
Affymetrix. Twelve micrograms total RNA were used as thestarting material for the cDNA preparation. The first and secondstrand cDNA synthesis was performed using the SuperScriptChoice System (Life Technologies) according to the manufac-turer’s instructions except using an oligo(dT) primer containing aT7 RNA polymerase promoter site. Labelled cRNA wasprepared using the MEGAscript in vitro Transcription (IVT)kit (Ambion). Biotin-labelled CTP and UTP (Enzo) were usedin the reaction together with unlabelled NTPs. Following theIVT reaction, the unincorporated nucleotides were removedusing RNeasy columns (Qiagen). Fifteen micrograms of cRNAwere fragmented at 94°C for 35 min in a fragmentation buffercontaining 40 mM Tris-acetate pH 8.1, 100 mM KOAc,30 mM MgOAc. Prior to hybridization, the fragmented cRNAin a 6× SSPE-T hybridization buffer (1 M NaCl, 10 mM TrispH 7.6, 0.005% Triton) was heated to 95°C for 5 min andsubsequently to 40°C for 5 min, before loading onto theAffymetrix probe array cartridge. The probe array was thenincubated for 16 h at 40°C at constant rotation (60 r.p.m.). Thewashing and staining procedure was performed in theAffymetrix Fluidics Station. The probe array was exposed to10 washes in 6× SSPE-T at 25°C followed by four washes in0.5× SSPE-T at 50°C. The biotinylated cRNA was stained witha streptavidin–phycoerythrin conjugate, 10 mg/ml (MolecularProbes, Eugene, OR), in 6× SSPE-T for 30 min at 25°Cfollowed by 10 washes in 6× SSPE-T at 25°C. The probearrays were scanned at 560 nm using a confocal laser-scanningmicroscope with an argon ion laser as the excitation source
Human Molecular Genetics, 2001, Vol. 10, No. 17 1843
(Hewlett Packard GeneArray Scanner G2500A). The readingsfrom the quantitative scanning were analysed by the Affyme-trix Gene Expression Analysis Software. For comparison fromarray to array, these were scaled to a global intensity of 150, aspublished previously (67).
cDNA microarray screening32P-labelled cDNA was prepared using [α-32P]dATP from 3 µgtotal RNA derived from two clonal cell lines, namely HD-Q74line 10 versus HD-Q23 line 20, or HD-Q74 line 1b versus HD-Q23 line 14. RNA was hybridized to the Atlas Rat cDNAExpression Array, 588 genes (catalogue number 7738–1;Clontech Laboratories, Palo Alto, CA); Atlas Rat Stress/Toxi-cology Array, 207 genes (catalogue number 7735–1; Clon-tech); Atlas Rat Toxicology Array II, 465 genes (cataloguenumber 7732–1; Clontech) and the Atlas Rat 1.2 Array II, 1176genes (catalogue number 7856–1; Clontech) according to theuser manual. Expression was visualized by exposing filters toa phosphor screen and analysed with a Packard CycloneStorage Phosphor System. Spot alignment and intensity wasquantified using the AtlasImage 1.5 software package(Clontech). Global sum normalization mode was selected tocalculate the overall normalization coefficient whencomparing arrays. The ratio and difference thresholds usedwere the default values adopted by the program software.
Selection criteria for genes showing significant changes
For the Clontech microexpression array analysis, significantgene changes between the two comparative samples werethose in which the ratio threshold was ≥2 (for upregulatedgenes) or ≤0.5 (for downregulated genes). Only those genesthat showed such changes in one HD-Q74 versus one HD-Q23line that met the same criteria and changed in the same direc-tion in an independent set of HD-Q74 and HD-Q23 lines, weredeemed to be significantly changed.
With the Affymetrix gene chips, significant gene changes inany comparison were limited to fold changes of three or more,where the sort score was ≥0.5. The sort score is a function ofboth the fold change and average difference change betweensamples. It can be used to evaluate the ‘significance’/reliabilityof the differences observed. Each sample comprised a pool ofequal amounts of mRNA from three different clonal lines ofHD-Q74 or -Q23 induced for 18 h or left uninduced for 18 h.Since single chips were run for the normal and expanded repeatpools in different induced and uninduced conditions, we onlyselected genes where there were changes in the same directionin two different comparisons. First, we selected changes thatwere consistent when comparing HD-Q74 cells induced for18 h to HD-Q23 induced for 18 h, where the HD-Q74 inducedsample also showed a significant change in the same directionwhen compared to uninduced HD-Q74 cells. A second groupof genes was selected which showed similar significant differ-ences between HD-Q74 and HD-Q23 clonal lines induced for18 h, as between HD-Q74 uninduced versus HD-Q23 uninduced.Since uninduced cells have low background transgene expression,we felt that this set reflected genes which show differences inHD-Q23 and -Q74 at both high and low transgene expressionlevels. For all comparisons we excluded genes that showed
significant changes in HD-Q23 in the induced versus theuninduced state.
For ATAC-PCR, genes showing a 2-fold increase ordecrease in expression after 18 h induction compared with theuninduced state in two independent 72 repeat cell lines, but notin two independent 21 cell lines, were selected for furtherconsideration. From this set of genes, we selected those thatshowed at least 2-fold differences in expression at the 18 hpoint when comparing the two independent 72 repeat lineswith the two independent 21 repeat lines.
Cross comparisons between the three different methods weremade, where genes were common to two or more techniques.We have discarded Affymetrix data with sort scores of 0.05 orless for these comparisons, as these are too unreliable given thevery low number of hybridizing oligonucleotides in the gene.Of the six Clontech genes meeting cut-off criteria for signifi-cance, two had sort scores of >0.05 on the Affymetrix system.Of these significant Clontech changes, one (delta-like protein)showed a non-significant change in the same direction in theAffymetrix system. While GAPDH showed a significantchange in the Clontech filters it had no change in the Affyme-trix system. Twelve genes met the criteria for significance onthe Affymetrix arrays, of which two were represented on theClontech membranes. In both these cases (c-erb-A thyroidhormone receptor and RAC protein kinase α) the changes seenin the Clontech system were in the same direction as on theAffymetrix arrays.
Using the ATAC-PCR analysis, 44 genes met the criteria forsignificance. However, five of these were excluded from finaltabulation as they were represented in two or three of theexperimental systems and changes seen were inconsistent indirection. Of the remaining 39 genes, two were also representedon the Affymetrix system with the sort score being ≥0.05. Inboth cases (cain and ribosomal protein S2), the changes on theAffymetrix arrays are consistent with the ATAC-PCR data.Another one gene was represented on the Clontech membranes,where the change was in the same direction and significant(acidic ribosomal protein P0), as shown in the table.
Luciferase assays
Promoter constructs. The promoter element which bindsCREB wild-type (CREB-wt) (Geneka catalogue, Canada), or amutated promoter element which does not bind CREB mutant(CREB-mt) (Geneka) were incorporated into oligonucleotideswith a 5′ SacI site, a PstI unique linker site and a 3′ NheI site,when in double-stranded form. The forward sequences of theseoligonucleotides were as follows: CREB-wt consensussequence 5′-CCTGCAGGATTCAATGACATCACGGCTG-TGG-3′ and CREB-mt consensus sequence 5′-CCTGCAGGA-TTCAAGAACATAGCGGCTGTGG-3′. These were double-digested, purified and ligated into identical sites in the pGL3-promoter luciferase vector (Promega, Southampton, UK),containing the SV40 promoter.
DNA transfections, luciferase and β-galactosidase assays. Twoclonal lines of stably transfected PC12 HD-Q74 (lines 10 and 1b)and PC12 HD-Q23 (lines 14 and 7), were transfected usingLipoFECTAMINE PLUSTM Reagent (Gibco BRL, Life Tech-nologies, UK). Luciferase reporter assays were performed asdescribed (68). We co-transfected 750 ng of plasmid
1844 Human Molecular Genetics, 2001, Vol. 10, No. 17
containing CREB-wt or CREB-mt, with 300 ng of a plasmidcontaining the gene for β-galactosidase linked to a constitutivelyactive human elongation factor 1α promoter, into cells in a 24-wellplate. Cells were induced with 1 µg/ml dox 4 h thereafter andthen harvested either 24 or 48 h after transfection. The luciferaseactivity from each well was normalized to the β-galactosidase tocontrol for variations in transfection efficiency. To measure theamount of luciferase activity specifically due to the presence ofthe CREB-binding site we subtracted the luciferase activity incells expressing mutant pGL3-CREB from those expressingwild-type pGL3-CREB.
ACKNOWLEDGEMENTS
We thank L.Ho for help with analyses of some caspase experi-ments, Y.Narain for help with EM analysis, A.Tobin andG.Lawless for providing constructs and J.Arthur for assistancewith fluorescent microscopy. We are grateful to the HereditaryDisease foundation (A.W. and D.C.R.), The Swiss NationalScience Foundation (A.W.), Merck Sharp and Dohme (A.W.and J.S.), Action Research (J.C.), The Violet Richards Charity(D.C.R.), The Isaac Newton Trust (D.C.R.), Core Research forEvolutional Science and Technology, Japan Science andTechnology Corporation (K.K.), Ataxia (J.B. and A.S.) and theNational Lottery (J.B. and A.S.) for financial support. J.S. andJ.C. are grateful for Sackler studentships. D.C.R. is a GlaxoWellcome Research Fellow.
REFERENCES
1. Huntington’s Disease Collaborative Research Group (1993) A novel gene containing a trinucleotide repeat that is expanded and unstable on Huntington’s disease chromosomes. Cell, 72, 971–983.
2. Ross, C.A. (1997) Intranuclear neuronal inclusions: a common pathogenic mechanism for glutamine-repeat neurodegenerative diseases? Neuron, 19, 1147–1150.
3. Nakamura, K., Jeong, S.Y., Ichikawa, Y., Nagamisha, K., Nagamisha, T., Goto, J., Ikeda, S. and Kanazawa, I. (2000) SCA13, a novel autosomal dominant cerebellar ataxia caused by the expanded polyglutamine in TATA-binding protein identified with IC2 antibody immunoscreening. Am. J. Hum. Genet., 67 (Suppl. 2), 389.
4. Margolis, R.L., O’ Hearn, E., Rosenblatt, A., Troncoso, J., Holmes, S., Franz, M.L., Sherr, M., Callahan, C., Hwang, J. and Ross, C.A. (2000)An autosomal dominant disorder similar to Huntington’s disease is associated with a CAG trinucleotide expansion. Am. J. Hum. Genet., 67 (Suppl. 2), 378.
5. Saudou, F., Finkbeiner, S., Devys, D. and Greenberg, M.E. (1998) Huntingtin acts in the nucleus to induce apoptosis but death does not correlate with the formation of intranuclear inclusions. Cell, 95, 55–66.
6. Klement, I.A., Skinner, P.J., Kaytor, M.D., Yi, H., Hersch, S.M., Clark, H.B., Zoghbi, H.Y. and Orr, H.T. (1998) Ataxin-1 nuclear localiza-tion and aggregation: role in polyglutamine-induced disease in SCA1 transgenic mice. Cell, 95, 41–53.
7. Cummings, C.J., Reinstein, E., Sun, Y., Antalffy, B., Jiang, Y., Ciechanover, A., Orr, H.T., Beaudet, A.L. and Zoghbi, H.Y. (1999) Mutation of the E6-AP ubiquitin ligase reduces nuclear inclusion frequency while accelerating polyglutamine-induced pathology in SCA1 mice. Neuron, 24, 879–892.
8. Perutz, M.F. (1999) Glutamine repeats and neurodegenerative diseases: molecular aspects. Trends Biochem. Sci., 24, 58–63.
9. Carmichael, J., Chatellier, J., Woolfson, A., Milstein, C., Fersht, A.R. and Rubinsztein, D.C. (2000) Bacterial and yeast chaperones reduce both aggregate formation and cell death in mammalian cell models of Huntington’s disease. Proc. Natl Acad. Sci. USA, 97, 9701–9705.
10. Orr, H.T. and Zoghbi, H.Y. (1998) Polyglutamine tract vs. protein context in SCA1 pathogenesis. In Rubinsztein, D.C and Hayden, M.R. (eds), Analysis of Triplet Repeat Disorders. Bios Scientific Publishers, Oxford, pp. 105–117.
11. Young, A., (1999) Huntington’s disease and other trinucleotide repeat disorders. In J. Martin (ed.), Scientific American Molecular Neurology, Scientific American, Inc., New York.
12. Gossen, M., Freundlieb, S., Bender, G., Muller, G., Hillen, W. and Bujard, H. (1995) Transcriptional activation by tetracyclines in mammalian cells. Science, 268, 1766–1769.
13. Paulson, H.L., Perez, M.K., Trottier, Y., Trojanowski, J.Q., Subramony, S.H., Das, S.S., Vig, P., Mandel, J.L., Fischbeck, K.H. and Pittman, R.N. (1997) Intranuclear inclusions of expanded polyglutamine protein in spinocerebellar ataxia type 3. Neuron, 19, 333–344.
14. Igarashi, S., Koide, R., Shimohata, T., Yamada, M., Hayashi, Y., Takano, H., Date, H., Oyake, M., Sato, T., Sato, A. et al. (1998) Suppression of aggregate formation and apoptosis by transglutaminase inhibitors in cells expressing truncated DRPLA protein with an expanded polyglutamine stretch. Nat. Genet., 18, 111–117.
15. Cooper, J.K., Schilling, G., Peters, M.F., Herring, W.J., Sharp, A.H., Kaminsky, Z., Masone, J., Khan, F.A., Delanoy, M., Borchelt, D.R. et al. (1998) Truncated N-terminal fragments of huntingtin with expanded glutamine repeats form nuclear and cytoplasmic aggregates in cell culture. Hum. Mol. Genet., 7, 783–790.
16. Hackam, A.S., Singaraja, R., Wellington, C.L., Metzler, M., McCutcheon, K., Zhang, T., Kalchman, M. and Hayden, M.R. (1998)The influence of huntingtin protein size on nuclear localization and cellular toxicity. J. Cell Biol., 141, 1097–1105.
17. Martindale, D., Hackam, A., Wieczorek, A., Ellerby, L., Wellington, C., McCutcheon, K., Singaraja, R., Kazemi-Esfarjani, P., Devon, R., Kim, S.U. et al. (1998) Length of huntingtin and its polyglutamine tract influences localization and frequency of intracellular aggregates. Nat. Genet., 18, 150–154.
18. DiFiglia, M., Sapp, E., Chase, K.O., Davies, S.W., Bates, G.P., Vonsattel, J.P. and Aronin, N. (1997) Aggregation of huntingtin in neuronal intranuclear inclusions and dystrophic neurites in brain. Science, 277, 1990–1993.
19. Davies, S.W., Turmaine, M., Cozens, B.A., DiFiglia, M., Sharp, A.H., Ross, C.A., Scherzinger, E., Wanker, E.E., Mangiarini, L. and Bates, G.P. (1997) Formation of neuronal intranuclear inclusions underlies the neurological dysfunction in mice transgenic for the HD mutation. Cell, 90, 537–548.
20. Wyttenbach, A., Carmichael, J., Swartz, J., Furlong, R.A., Narain, Y., Rankin, J. and Rubinsztein D.C. (2000) Effects of heat shock, heat shock protein 40 (HDJ-2), and proteasome inhibition on protein aggregation in cellular models of Huntington’s disease. Proc. Natl Acad. Sci. USA, 97, 2898–2903.
21. Jana, N.R., Tanaka, M., Wang, G.H. and Nukina, N. (2000) Polyglutamine length-dependent interaction of hsp40 and hsp70 family chaperones with truncated N-terminal huntingtin: their role in suppression of aggregation and cellular toxicity. Hum. Mol. Genet., 9, 2009–2018.
22. Schilling, G., Becher, M.W., Sharp, A.H., Jinnah, H.A., Duan, K., Kotzuk, J.A., Slunt, H.H., Ratovitski, T., Cooper, J.K., Jenkins, N.A. et al. (1999) Intranuclear inclusions and neuritic aggregates in transgenic mice expressing a mutant N-terminal fragment of huntingtin. Hum. Mol. Genet., 8, 397–407.
23. Cummings, C.J., Mancini, M.A., Antalffy, B., DeFranco, D.B., Orr, H.T. and Zoghbi, H.Y. (1998) Chaperone suppression of aggregation and altered subcellular proteasome localization imply protein misfolding in SCA1. Nat. Genet., 19, 148–154.
24. Chai, Y., Koppenhafer, S.L., Bonini, N.M. and Paulson, H.L. (1999) Analysis of the role of heat shock protein (Hsp) molecular chaperones in polyglutamine disease. J. Neurosci., 19, 10338–10347.
25. Stenoien, D.L., Cummings, C.J., Adams, H.P., Mancini, M.G., Patel, K., DeMartino, G.N., Marcelli, M., Weigel, N.L. and Mancini, M.A. (1999) Polyglutamine-expanded androgen receptors form aggregates that sequester heat shock proteins, proteasome components and SRC-1, and are suppressed by the HDJ-2 chaperone. Hum. Mol. Genet., 8, 731–741.
26. Luthi-Carter, R., Strand, A., Peters, N.L., Solano, S.M., Hollingsworth, Z.R., Menon, A.S., Frey, A.S., Spektor, B.S., Penney, E.B., Schilling, G. et al. (2000) Decreased expression of striatal signaling genes in a mouse model of Huntington’s disease. Hum. Mol. Genet., 9, 1259–1271.
27. Narain, Y., Wyttenbach, A., Rankin, J., Furlong, R.A. and Rubinsztein, D.C. (1999) A molecular investigation of true dominance in Huntington’s disease. J. Med. Genet., 36, 739–746.
28. Kazantsev, A., Preisinger, E., Dranovsky, A., Goldgaber, D. and Housman, D. (1999) Insoluble detergent-resistant aggregates form
Human Molecular Genetics, 2001, Vol. 10, No. 17 1845
between pathological and nonpathological lengths of polyglutamine in mammalian cells. Proc. Natl Acad. Sci. USA, 96, 11404–11409.
29. Lodi, R., Schapira, A.H., Manners, D., Styles, P., Wood, N.W., Taylor, D.J. and Warner, T.T. (2000) Abnormal in vivo skeletal muscle energy metabolism in Huntington’s disease and dentatorubropallidoluy-sian atrophy. Ann. Neurol., 48, 72–76.
30. Tabrizi, S.J., Workman, J., Hart, P.E., Mangiarini, L., Mahal, A., Bates, G., Cooper, J.M. and Schapira AH (2000) Mitochondrial dysfunction and free radical damage in the Huntington R6/2 transgenic mouse. Ann. Neurol., 47, 80–86.
31. Hawley, R.J., Scheibe, R.J. and Wagner, J.A. (1992) NGF induces the expression of the VGF gene through a cAMP response element. J. Neurosci., 12, 2573–2581.
32. Ishida, T., Yamauchi, K., Ishikawa, K. and Yamamoto, T. (1993) Molecular cloning and characterization of the promoter region of the human c-erbA α gene. Biochem. Biophys. Res. Commun., 191, 831–839
33. Ishidoh, K., Suzuki, K., Katunuma, N. and Kominami, E. (1991) Gene structures of rat cathepsins H and L. Biomed. Biochim. Acta, 50, 541–547.
34. Du, K., Asahara, H., Wagner, B. and Montminy, M. (2000) Characterisation of a CREB gain-of-function mutant with constitutive transcriptional acitivity in vivo. Mol. Cell Biol., 20, 4320–4327.
35. Rich, T., Assier, E., Skepper, J., Segard, H.B., Allen, R.L., Charron, D. and Trowsdale, J. (1999) Disassembly of nuclear inclusions in the dividing cell—a novel insight into neurodegeneration. Hum. Mol. Genet., 8, 2451–2459.
36. Sherman, M.Y. and Goldberg, A.L. (2001) Cellular defenses against unfolded proteins: a cell biologist thinks about neurodegenerative diseases. Neuron, 29, 15–32.
37. Yoshizawa, T., Yamagishi, Y., Koseki, N., Goto, J., Yoshida, H., Shibasaki, F., Shoji, S. and Kanazawa, I. (2000) Cell cycle arrest enhances the in vitro cellular toxicity of the truncated Machado–Joseph disease gene product withan expanded polyglutamine stretch. Hum. Mol. Genet., 9, 69–78.
38. Ona, V.O., Li, M., Vonsattel, J.P., Andrews, L.J., Khan, S.Q., Chung, W.M., Frey, A.S., Menon, A.S., Li, X.J., Stieg, P.E. et al. (1999) Inhibition of caspase-1 slows disease progression in a mouse model of Huntington’s disease. Nature, 399, 263–267.
39. Chen, M., Ona, V.O., Li, M., Ferrante, R.J., Fink, K.B., Zhu, S., Bian, J., Guo, L., Farrell, L.A., Hersch, S.M. et al. (2000) Minocycline inhibits caspase-1 and caspase-3 expression and delays mortality in a transgenic mouse model of Huntington disease. Nat. Med., 6, 797–801.
40. Kim, M., Lee, H.S., LaForet, G., McIntyre, C., Martin, E.J., Chang, P., Kim, T.W., Williams, M., Reddy, P.H., Tagle, D. et al. (1999) Mutant huntingtin expression in clonal striatal cells: dissociation of inclusion formation and neuronal survival by caspase inhibition. J. Neurosci., 19, 964–973.
41. Li, S.H., Cheng, A.L., Li, H. and Li, X.J. (1999) Cellular defects and altered gene expression in PC12 cells stably expressing mutant huntingtin. J. Neurosci., 19, 5159–5172.
42. Francois, F., Godinho, M.J. and Grimes, M.L. (2000) CREB is cleaved by caspases during neural cell apoptosis. FEBS Lett., 486, 281–284.
43. De Souza, E.B., Whitehouse, P.J., Folstein, S.E., Price, D.L. and Vale, W.W. (1987) Corticotropin-releasing hormone (CRH) is decreased in the basal ganglia in Huntington’s disease. Brain Res., 437, 355–359.
44. Sapp, E., Ge, P., Aizawa, H., Bird, E., Penney, J., Young, A.B., Vonsattel, J.P. and DiFiglia, M. (1995) Evidence for a preferential loss of enkephalin immunoreactivity in the external globus pallidus in low grade Huntington’s disease using high resolution image analysis. Neuroscience, 64, 397–404
45. Timmers, H.J., Swaab, D.F., van de Nes, J.A. and Kremer, H.P. (1996) Somatostatin 1–12 immunoreactivity is decreased in the hypothalamic lateral tuberal nucleus of Huntington’s disease patients. Brain Res., 728, 141–148.
46. Augood, S.J., Faull, R.L., Love, D.R. and Emson, P.C. (1996) Reduction in enkephalin and substance P messenger RNA in the striatum of early grade Huntington’s disease: a detailed cellular in situ hybridization study. Neuroscience, 72, 1023–1036.
47. Shimohata, T., Nakajima, T., Yamada, M., Uchida, C., Onodera, O., Naruse, S., Kimura, T., Koide, R., Nozaki, K., Sano, Y. et al. (2000) Expanded polyglutamine stretches interact with TAFII130, interfering with CREB-dependent transcription. Nat. Genet., 26, 29–36.
48. Nucifora, F.C.,Jr, Sasaki, M., Peters, M.F., Huang, H., Cooper, J.K., Yamada, M., Takahashi, H., Tsuji, S., Troncoso, J., Dawson, V.L. et al. (2001) Interference by huntingtin and atrophin-1 with cbp-mediated transcription leading to cellular toxicity. Science, 291, 2423–2428.
49. McCampbell, A., Taylor, J.P., Taye, A.A., Robitschek, J., Li, M., Walcott, J., Merry, D., Chai, Y., Paulson, H., Sobue, G. and Fischbeck, K.H. (2000) CREB-binding protein sequestration by expanded polyglutamine. Hum. Mol. Genet., 9, 2197–2202.
50. Giebler, H.A., Lemasson, I. and Nyborg, J.K. (2000) p53 recruitment of CREB binding protein mediated through phosphorylated CREB: a novel pathway of tumor suppressor regulation. Mol. Cell. Biol., 20, 4894–4858.
51. Saluja, D., Vassallo, M.F. and Tanese, N. (1998) Distinct subdomains of human TAFII130 are required for interactions with glutamine-rich transcription activators. Mol. Cell. Biol., 18, 5734–5743.
52. Barth, A.L., McKenna, M., Glazewski, S., Hill, P., Impey, S., Storm, D. and Fox, K. (2000) Upregulation of cAMP response element-mediated expression during experience-dependent plasticity in adult neocortex. J. Neurosci., 20, 4206–4216.
53. Usdin, M.T., Shelbourne, P.F., Myers, R.M. and Madison, D.V. (1999) Impaired synaptic plasticity in mice carrying the Huntington’s disease mutation. Hum. Mol. Genet., 8, 839–846.
54. Murphy, K.S.J., Carter, R.J., Lione, L.A., Mangiarini, L., Mahal, A., Bates, G.P., Dunnett, S.B. and Morton, A.J. (2000) Abnormal synpatic plasticity and impaired spatial cognition in mice transgenic for exon 1 of the human Huntington’s disease mutation. J. Neurosci., 20, 5115–5123.
55. Wadzinski, B.E., Wheat, W.H., Jaspers, S., Peruski, J.F.,Jr, Lickteig, R.L, Johnson, G.L. and Klemm, D.J. (1993) Nuclear protein phosphatase 2A dephosphorylates protein kinaseA-phosphorylated CREB and regulates CREB transcriptional stimulation. Mol. Cell. Biol., 13, 2822–2834.
56. Steffan, J.A., Kazantsev, A., Spasic-Boskovic, O., Greenwald, M., Zhu, Y.-Z., Gohler, H., Wanker, E., Bates, G.P., Housman, D.E. and Thompson, L.M. (2000) The Huntington’s disease protein interacts with p53 and CREB-binding protein and represses transcription. Proc. Natl Acad. Sci. USA, 97, 6763–6768.
57. Steward, L.J., Bufton, K.E., Hopkins, P.C., Davies, W.E. and Barnes, N.M. (1993) Reduced levels of 5-HT3 receptor recognition sites in the putamen of patients with Huntington’s disease. Eur. J. Pharmacol., 242, 137–143.
58. Salton, S.R., Ferri, G.L., Hahm, S., Snyder, S.E., Wilson, A.J., Possenti, R. and Levi, A. (2000) VGF: a novel role for this neuronal and neuroendocrine polypeptide in the regulation of energy balance. Front. Neuroendocrinol., 21, 199–219.
59. Tanaka, K., Pracyk, J.B., Takeda, K., Yu, Z.X., Ferrans, V.J., Deshpande, S.S., Ozaki, M., Hwang, P.M., Lowenstein, C.J., Irani, K. and Finkel, T. (1998) Expression of Id1 results in apoptosis of cardiac myocytes through a redox-dependent mechanism. J. Biol. Chem., 273, 25922–25928.
60. Tzeng, S.F. and de Vellis, J. (1998) Id1, Id2, and Id3 gene expression in neural cells during development. Glia, 24, 372–381.
61. Rickwood, D., Wilson, M.T. and Darley-Usmar, V.M. (1987) Isolation and characteristics of intact mitochondria. In Darley-Usamr, V.M., Rickwood, D. and Wilson, M.T. (eds), Mitochondria: A Practical Approach. IRL Press, Oxford, pp. 1–16.
62. Schapira, A.H.V., Mann, V.M., Cooper, J.M., Dexter, D., Daniel, S.E., Jenner, P., Clark, J.B. and Marsden, C.D. (1990) Anatomic and disease specificity of NADH CoQ1 reductase (complex I) deficiency in Parkinson’s disease. J. Neurochem., 55, 2142–2145.
63. Gardner, P.R., Nguyen, D.D.H. and White, C.W. (1994) Aconitase is a sensitive and critical target of oxygen poisoning in cultured mammalian cells and in rat lungs. Proc. Natl Acad. Sci. USA, 91, 12248–12252.
64. Lowry, O.H., Rosebrough, N.J., Farr, A.L. and Randall, R.J. (1951). Protein measurement with the Folin phenol reagent. J. Biol. Chem., 193, 265–275.
65. Matoba, R., Kato, K., Saito, S., Kurooka, C., Maruyama, C., Sakakibara, Y. and Matsubara, K. (2000) Gene expression in the mouse cerebellum during its development. Gene, 241, 125–131.
66. Matoba, R., Kato, K., Kurooka, C., Maruyama, C., Sakakibara, Y. and Matsubara, K. (2000b) Correlation between gene functions and developmental expression patterns in the mouse cerebellum. Eur. J. Neurosci., 12, 1357–1371.
67. Kaminnski, N., Allard, J.D., Pittet, J.F., Zuo, F., Griffiths, M.J. and Morris, D. (2000) Global analysis of gene expression in pulmonary fibrosis reveals distinct programs regulating lung inflammation and fibrosis. Proc. Natl Acad. Sci. USA, 97, 1778–1783.
68. Coles, R., Caswell, R. and Rubinsztein, D.C. (1998) Functional analysis of the Huntington’s disease (HD) gene promoter. Hum. Mol. Genet., 7, 791–800.
Copyright © 2022 FDOKUMEN