PM source apportionment and health effects. 3. Investigation of inter-method variations in...
10
PM source apportionment and health effects. 3. Investigation of inter-method variations in associations between estimated source contributions of PM 2.5 and daily mortality in Phoenix, AZ THERESE F. MAR, a KAZUHIKO ITO, b JANE Q. KOENIG, a TIMOTHY V. LARSON, c DELBERT J. EATOUGH, d RONALD C. HENRY, e EUGENE KIM, f FRANCINE LADEN, g RAMONA LALL, b LUCAS NEAS, h MATTHIAS STO ¨ LZEL, i PENTTI PAATERO, j PHILIP K. HOPKE f AND GEORGE D. THURSTON b a Department of Environmental and Occupational Health Sciences, University of Washington, Seattle, Washington, USA b Nelson Institute of Environmental Medicine, New York University School of Medicine, Tuxedo Park, New York, USA c Department of Civil and Environmental Engineering, University of Washington, Seattle, Washington, USA d Department of Chemistry and Biochemistry, Brigham Young University, Provo, Utah, USA e Department of Civil and Environmental Engineering, Southern California University, Los Angeles, California, USA f Center for Air Resources Engineering and Science, Clarkson University, Potsdam, New York, USA g Department of Environmental Health, Harvard School of Public Health, Boston, Massachusetts, USA h National Health & Environmental Effects Research Laboratory, U.S. Environmental Protection Agency, Chapel Hill, North Carolina, USA i Institute of Epidemiology, GSF Focus Network Aerosols and Health, GSF National Research Center for Environment and Health, Neuherberg, Germany j Department of Physical Sciences, University of Helsinki, Helsinki, Finland As part of an EPA-sponsored workshop to investigate the use of source apportionment in health effects analyses, the associations between the participant’s estimated source contributions of PM 2.5 for Phoenix, AZ for the period from 1995–1997 and cardiovascular and total nonaccidental mortality were analyzed using Poisson generalized linear models (GLM). The base model controlled for extreme temperatures, relative humidity, day of week, and time trends using natural spline smoothers. The same mortality model was applied to all of the apportionment results to provide a consistent comparison across source components and investigators/methods. Of the apportioned anthropogenic PM 2.5 source categories, secondary sulfate, traffic, and copper smelter-derived particles were most consistently associated with cardiovascular mortality. The sources with the largest cardiovascular mortality effect size were secondary sulfate (median estimate ¼ 16.0% per 5th-to-95th percentile increment at lag 0 day among eight investigators/methods) and traffic (median estimate ¼ 13.2% per 5th-to-95th percentile increment at lag 1 day among nine investigators/methods). For total mortality, the associations were weaker. Sea salt was also found to be associated with both total and cardiovascular mortality, but at 5 days lag. Fine particle soil and biomass burning factors were not associated with increased risks. Variations in the maximum effect lag varied by source category suggesting that past analyses considering only single lags of PM 2.5 may have underestimated health impact contributions at different lags. Further research is needed on the possibility that different PM 2.5 source components may have different effect lag structure. There was considerable consistency in the health effects results across source apportionments in their effect estimates and their lag structures. Variations in results across investigators/methods were small compared to the variations across source categories. These results indicate reproducibility of source apportionment results across investigative groups and support applicability of these methods to effects studies. However, future research will also need to investigate a number of other important issues including accuracy of results. Journal of Exposure Science and Environmental Epidemiology (2006) 16, 311–320. doi:10.1038/sj.jea.7500465; published online 16 November 2005 Keywords: air pollution, source apportionment, health effects, mortality Introduction The published evidence supports an association between particulate matter (PM) air pollution and increased risk of mortality (US EPA, 2004). It has been shown that those with cardiovascular or respiratory conditions and the elderly are the most susceptible to the adverse effects of PM. While particles less than 10 m in diameter (PM 10 ), and especially those less than 2.5 m in diameter (PM 2.5 ), are most strongly associated with an increased risk of total and cause- specific mortality, some studies have suggested that coarse particles (PM 10 –PM 2.5 ) are also associated with an increase risk of mortality, as well. (Schwartz et al., 1996; Ostro et al., 2000). Although it would be difficult to dispute that PM has a toxic effect on susceptible populations, it is still unclear as to the specific chemical component(s) of PM responsible for the observed health effects. Particulate air pollution is a complex Received 20 April 2005; accepted 10 October 2005; published online 16 November 2005 1. Address all Correspondence to: Professor P.K. Hopke, Center for Air Resources Engineering and Science, Clarkson University, Potsdam, NY 13699-5708, USA. Tel.: þ 1 315 268 3861. Fax: þ 1 315 268 4410. E-mail: [email protected]. Journal of Exposure Science and Environmental Epidemiology (2006) 16, 311–320 r 2006 Nature Publishing Group All rights reserved 1053-4245/06/$30.00 www.nature.com/jes
Transcript of PM source apportionment and health effects. 3. Investigation of inter-method variations in...
PM source apportionment and health effects. 3. Investigation of
inter-method variations in associations between estimated source
contributions of PM2.5 and daily mortality in Phoenix, AZ
THERESE F. MAR,a KAZUHIKO ITO,b JANE Q. KOENIG,a TIMOTHY V. LARSON,c DELBERT J. EATOUGH,d
RONALD C. HENRY,e EUGENE KIM,f FRANCINE LADEN,g RAMONA LALL,b LUCAS NEAS,h
MATTHIAS STOLZEL,i PENTTI PAATERO,j PHILIP K. HOPKEf AND GEORGE D. THURSTONb
aDepartment of Environmental and Occupational Health Sciences, University of Washington, Seattle, Washington, USAbNelson Institute of Environmental Medicine, New York University School of Medicine, Tuxedo Park, New York, USAcDepartment of Civil and Environmental Engineering, University of Washington, Seattle, Washington, USAdDepartment of Chemistry and Biochemistry, Brigham Young University, Provo, Utah, USAeDepartment of Civil and Environmental Engineering, Southern California University, Los Angeles, California, USAfCenter for Air Resources Engineering and Science, Clarkson University, Potsdam, New York, USAgDepartment of Environmental Health, Harvard School of Public Health, Boston, Massachusetts, USAhNational Health & Environmental Effects Research Laboratory, U.S. Environmental Protection Agency, Chapel Hill, North Carolina, USAiInstitute of Epidemiology, GSF Focus Network Aerosols and Health, GSF National Research Center for Environment and Health, Neuherberg, GermanyjDepartment of Physical Sciences, University of Helsinki, Helsinki, Finland
As part of an EPA-sponsored workshop to investigate the use of source apportionment in health effects analyses, the associations between the
participant’s estimated source contributions of PM2.5 for Phoenix, AZ for the period from 1995–1997 and cardiovascular and total nonaccidental
mortality were analyzed using Poisson generalized linear models (GLM). The base model controlled for extreme temperatures, relative humidity, day of
week, and time trends using natural spline smoothers. The same mortality model was applied to all of the apportionment results to provide a consistent
comparison across source components and investigators/methods. Of the apportioned anthropogenic PM2.5 source categories, secondary sulfate, traffic,
and copper smelter-derived particles were most consistently associated with cardiovascular mortality. The sources with the largest cardiovascular mortality
effect size were secondary sulfate (median estimate¼ 16.0% per 5th-to-95th percentile increment at lag 0 day among eight investigators/methods) and
traffic (median estimate¼ 13.2% per 5th-to-95th percentile increment at lag 1 day among nine investigators/methods). For total mortality, the
associations were weaker. Sea salt was also found to be associated with both total and cardiovascular mortality, but at 5 days lag. Fine particle soil and
biomass burning factors were not associated with increased risks. Variations in the maximum effect lag varied by source category suggesting that past
analyses considering only single lags of PM2.5 may have underestimated health impact contributions at different lags. Further research is needed on the
possibility that different PM2.5 source components may have different effect lag structure. There was considerable consistency in the health effects results
across source apportionments in their effect estimates and their lag structures. Variations in results across investigators/methods were small compared to
the variations across source categories. These results indicate reproducibility of source apportionment results across investigative groups and support
applicability of these methods to effects studies. However, future research will also need to investigate a number of other important issues including
accuracy of results.
Journal of Exposure Science and Environmental Epidemiology (2006) 16, 311–320. doi:10.1038/sj.jea.7500465; published online 16 November 2005
Keywords: air pollution, source apportionment, health effects, mortality
Introduction
The published evidence supports an association between
particulate matter (PM) air pollution and increased risk of
mortality (US EPA, 2004). It has been shown that those with
cardiovascular or respiratory conditions and the elderly are
the most susceptible to the adverse effects of PM.
While particles less than 10 m in diameter (PM10), and
especially those less than 2.5 m in diameter (PM2.5), are most
strongly associated with an increased risk of total and cause-
specific mortality, some studies have suggested that coarse
particles (PM10–PM2.5) are also associated with an increase
risk of mortality, as well. (Schwartz et al., 1996; Ostro et al.,
2000).
Although it would be difficult to dispute that PM has a
toxic effect on susceptible populations, it is still unclear as to
the specific chemical component(s) of PM responsible for the
observed health effects. Particulate air pollution is a complexReceived 20 April 2005; accepted 10 October 2005; published online 16
November 2005
1. Address all Correspondence to: Professor P.K. Hopke, Center for
Air Resources Engineering and Science, Clarkson University, Potsdam,
NY 13699-5708, USA.
Tel.: þ 1 315 268 3861. Fax: þ 1 315 268 4410.
E-mail: [email protected].
Journal of Exposure Science and Environmental Epidemiology (2006) 16, 311–320r 2006 Nature Publishing Group All rights reserved 1053-4245/06/$30.00
www.nature.com/jes
mixture of solid particles and liquid droplets, where the
specific chemical composition of the mass varies depending
on emission source, season and atmospheric condition.
To date, only a limited number of studies have investigated
the association between estimated source contributions of
PM and health effects (Ozkaynak and Thurston, 1987;
Laden et al., 2000, Mar et al., 2000, Mar et al., 2003a). In
the Six Cities study, Laden et al. reported that coal
combustion was associated with an increased acute risk of
mortality in Boston. Mar et al. (2000) found that mortality
was associated with regional sulfates and, to a lesser extent,
motor vehicle exhaust.
Recently, there is increasing interest in using source
apportionment data in health effects studies. Conclusions
based on such studies are somewhat limited, since the
estimated source contributions can vary depending on the
method of source apportionment. As discussed in detail in a
companion paper by Hopke et al. (2005), several source
apportionment methods are currently available including
absolute principal components analysis (APCA), positive
matrix factorization (PMF), Unmix, target-transformation
factor analysis, and chemical mass balance (CMB) models.
The variations in some of these approaches may include: the
choice and number of factors to use, the interpretation of
source profiles to identify specific sources, difficulty in
resolving sources that are similar, and issues regarding model
inputs, such as missing data, or data that are below detection.
Thus, it is presently uncertain whether variations in source
apportionments of health effects are due to variations in the
apportionment approach, or variations in the source
components’ respective toxicities.
To systematically investigate the effect of different methods
of source apportionment in a health effects analysis, a
workshop sponsored by the U.S. EPA PM Centers Program
and New York State was held in May 2003 at Harriman,
NY. As discussed in more detail elsewhere (Thurston et al.,
2005), participants of the workshop included PM center
members from Seattle, Rochester, Boston, New York and
U.S. EPA North Carolina. Each participant analyzed air
pollution data from both Phoenix, AZ and Washington, DC
using a source apportionment method of their choosing.
These cities were chosen because their PM data were similar
to the data being collected by the EPA’s Speciation Trends
Network (STN) data. The Phoenix speciation data were
collected by the National Exposure Research Laboratory
(NERL) at EPA. Dr. Gary Norris from NERL provided us
the Phoenix data (US EPA, 1999). The Washington, DC
data were downloaded from the Interagency Monitoring
of Protected Visual Environments (IMPROVE) network
website.
The speciation data from these cities were sent to each of
the participating research teams to analyze the data for daily
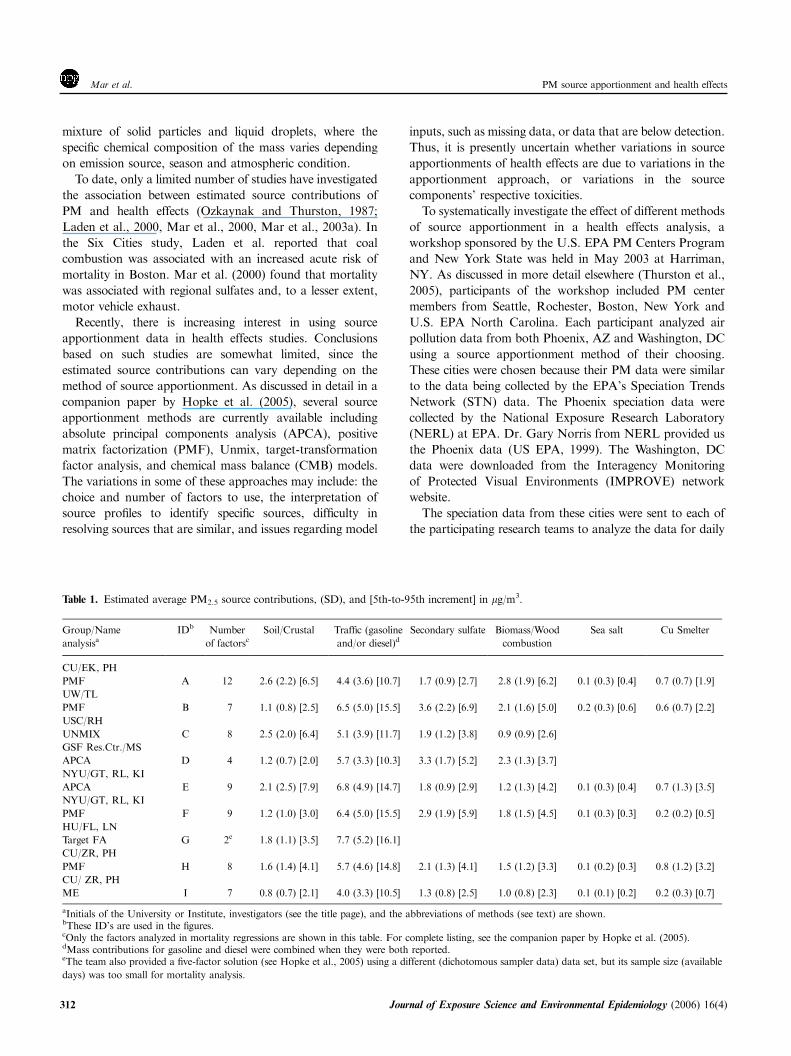
Table 1. Estimated average PM2.5 source contributions, (SD), and [5th-to-95th increment] in mg/m3.
Group/Name
analysisaIDb Number
of factorscSoil/Crustal Traffic (gasoline
and/or diesel)dSecondary sulfate Biomass/Wood
combustion
Sea salt Cu Smelter
CU/EK, PH
PMF A 12 2.6 (2.2) [6.5] 4.4 (3.6) [10.7] 1.7 (0.9) [2.7] 2.8 (1.9) [6.2] 0.1 (0.3) [0.4] 0.7 (0.7) [1.9]
UW/TL
PMF B 7 1.1 (0.8) [2.5] 6.5 (5.0) [15.5] 3.6 (2.2) [6.9] 2.1 (1.6) [5.0] 0.2 (0.3) [0.6] 0.6 (0.7) [2.2]
USC/RH
UNMIX C 8 2.5 (2.0) [6.4] 5.1 (3.9) [11.7] 1.9 (1.2) [3.8] 0.9 (0.9) [2.6]
GSF Res.Ctr./MS
APCA D 4 1.2 (0.7) [2.0] 5.7 (3.3) [10.3] 3.3 (1.7) [5.2] 2.3 (1.3) [3.7]
NYU/GT, RL, KI
APCA E 9 2.1 (2.5) [7.9] 6.8 (4.9) [14.7] 1.8 (0.9) [2.9] 1.2 (1.3) [4.2] 0.1 (0.3) [0.4] 0.7 (1.3) [3.5]
NYU/GT, RL, KI
PMF F 9 1.2 (1.0) [3.0] 6.4 (5.0) [15.5] 2.9 (1.9) [5.9] 1.8 (1.5) [4.5] 0.1 (0.3) [0.3] 0.2 (0.2) [0.5]
HU/FL, LN
Target FA G 2e 1.8 (1.1) [3.5] 7.7 (5.2) [16.1]
CU/ZR, PH
PMF H 8 1.6 (1.4) [4.1] 5.7 (4.6) [14.8] 2.1 (1.3) [4.1] 1.5 (1.2) [3.3] 0.1 (0.2) [0.3] 0.8 (1.2) [3.2]
CU/ ZR, PH
ME I 7 0.8 (0.7) [2.1] 4.0 (3.3) [10.5] 1.3 (0.8) [2.5] 1.0 (0.8) [2.3] 0.1 (0.1) [0.2] 0.2 (0.3) [0.7]
aInitials of the University or Institute, investigators (see the title page), and the abbreviations of methods (see text) are shown.bThese ID’s are used in the figures.cOnly the factors analyzed in mortality regressions are shown in this table. For complete listing, see the companion paper by Hopke et al. (2005).dMass contributions for gasoline and diesel were combined when they were both reported.eThe team also provided a five-factor solution (see Hopke et al., 2005) using a different (dichotomous sampler data) data set, but its sample size (available
days) was too small for mortality analysis.
PM source apportionment and health effectsMar et al.
312 Journal of Exposure Science and Environmental Epidemiology (2006) 16(4)
source apportionments of the fine mass using their appor-
tionment methods of choice. The estimated mass contribu-
tions from each investigator/method for Phoenix, AZ were
then analyzed in a consistent way at the University of
Washington in a time-series daily mortality study. The
mortality analysis of the Washington, DC source-appor-
tioned data was conducted at New York University and
described in a companion paper (Ito et al., 2005).
This paper will present the association between mortality
and the estimated source contributions of PM2.5, as obtained
via each research group’s source apportionment proce-
dure(s). A previous study of PM and mortality in Phoenix,
had shown that cardiovascular mortality was associated with
PM2.5, PM10 and the coarse fraction (PM10-PM2.5) and
several source factors derived from an Unmix model (Mar
et al., 2003b). In this work, we seek to determine which
sources contribute to the previously documented PM2.5-
mortality associations in this city, and to assess the extent to
which variations in source apportionment methods across
researchers affects those conclusions.
Methods
DataThe Phoenix, AZ PM2.5 speciation data were sent to each
team for source apportionment analysis. We received nine
source apportionment results usable for the health effects
analyses. These teams/investigators were: Philip Hopke and
Eugene Kim (Clarkson University), Pentti Paatero (Uni-
versity of Helsinki) and Philip Hopke (Clarkson University),
Timothy Larson (University of Washington), Ronald Henry
(University of Southern California), Mathias Stolzel (GSF-
University of Rochester PM Center), George Thurston
and Kazuhiko Ito (New York University), Francine
Laden (Harvard University) and Ziad Ramadan (Clarkson
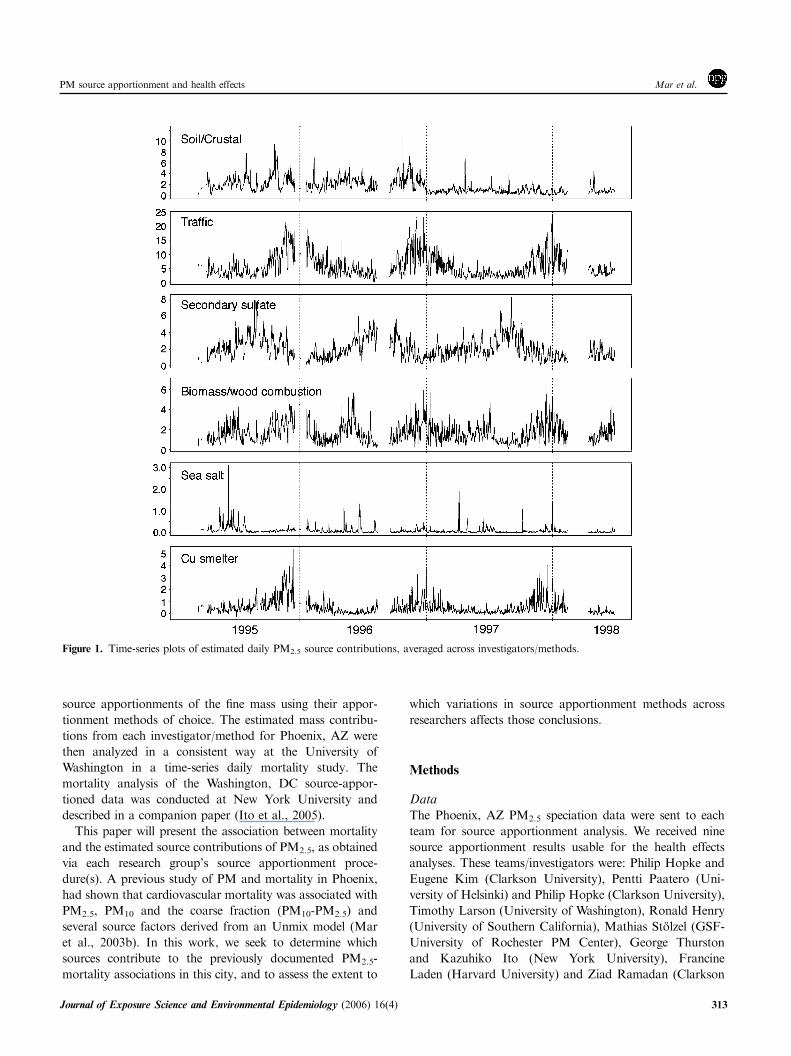
Figure 1. Time-series plots of estimated daily PM2.5 source contributions, averaged across investigators/methods.
PM source apportionment and health effects Mar et al.
Journal of Exposure Science and Environmental Epidemiology (2006) 16(4) 313
University) (Ramadan et al., 2000, 2003) with some groups
submitting several solutions. Details are described in Hopke
et al. (2005). We note that all the source apportionment
methods applied by the participants were multivariate factor
analysis based receptor models. None of the participants
applied source profiles based approach such as the CMB
method. Thus, the variation of the source apportionment
results and corresponding variation in mortality risk
estimates in this analysis is limited to this particular type of
source apportionment methods.
Note that these multivariate factor analysis based models
yield a set of factors. The investigator then gives each of these
factors a label that is indicative of a source or source type
(e.g., ‘‘soil’’) based on the investigator’s prior knowledge on
‘‘signature species’’ that is identified with a certain source. As
such, these factors could be labeled subjectively. Never-
theless, several commonly labeled factors were found in the
results submitted by the investigators. At the workshop, we
ascertained the assignment of each investigator’s factors to
commonly named factors. Thus, in the rest of the paper,
when we mention, for example, ‘‘soil factor’’, we mean
the factor that was labeled as soil (or something equivalent)
by the investigators.
Mortality data from 1995 to 1997 were obtained from the
Arizona Center for Health Statistics. In this analysis, we
included only mortality counts for residents X65 from zip
code regions thought to be most represented by the EPA
monitoring platform (see Mar et al., 2003a). We evaluated
total nonaccidental mortality (ICD-9 codes o800.00) and
cardiovascular mortality (ICD9 codes 390.00–448.99) from
2/9/95 to12/31/97. From 1995 to 1997 there were a total of
9081 cases of total nonaccidental deaths and 4109 cases of
cardiovascular deaths.
Temperature and relative humidity were also included in
the mortality model, as measured at the Phoenix NERL air
monitoring platform. Missing values for temperature were
estimated using data from Phoenix Sky Harbor Airport and
missing relative humidity data were calculated from the dry
bulb temperature at the NERL site and the Sky Harbor dew
point temperature (Mar et al., 2003b).
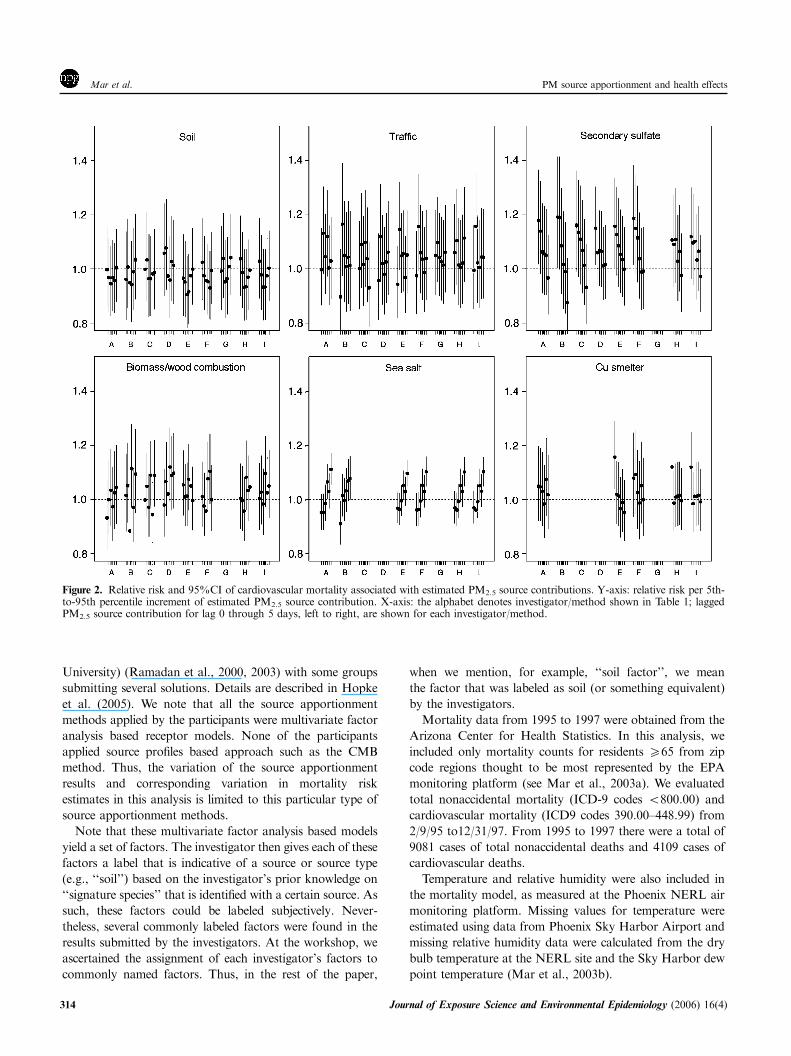
Figure 2. Relative risk and 95%CI of cardiovascular mortality associated with estimated PM2.5 source contributions. Y-axis: relative risk per 5th-to-95th percentile increment of estimated PM2.5 source contribution. X-axis: the alphabet denotes investigator/method shown in Table 1; laggedPM2.5 source contribution for lag 0 through 5 days, left to right, are shown for each investigator/method.
PM source apportionment and health effectsMar et al.
314 Journal of Exposure Science and Environmental Epidemiology (2006) 16(4)
Statistical MethodsAssociations between source contributions and cardiovascu-
lar and total nonaccidental mortality were analyzed using
Poisson generalized linear models (GLM) in SPLUS 2000
(Insightful Inc., Seattle, WA). The same mortality model was
applied to all group’s source apportionment analyses in order
to provide a consistent basis for comparison across source
components and investigators/methods (i.e., to eliminate
model specification variability from the analysis). The base
model controlled for confounding by including an indicator
variable for extreme temperatures (values greater than the
95th percentile and those less than the 5th percentile were
indicated with a 1, and 0 was used otherwise), a day of week
variable, and smoothing terms for time trends, temperature,
and relative humidity. Natural spline smoothers were used
for time trends, temperature and relative humidity. We used
12 degrees of freedom (df) for the smoothing of time trend.
The degrees of freedom (df) for the natural splines for time
trends were selected so as to minimize autocorrelation in the
residuals and the Akaike Information Criterion (AIC). For
the analysis of cardiovascular mortality, we employed 5 df
for the smoothing spline and 2 days lag for temperature,
based on past experience with models of PM2.5 and mortality
in this city (Mar et al., 2003a, b). For the total mortality
analysis, we used 5 df for the smoothing spline and 1 day lag
for temperature. We used 2 df for the smoothing of relative
humidity with 0 days lags for both the cardiovascular and
total mortality analyses. The df and the lags were chosen to
minimize the AIC.
To this base model, we added, in turn, the various
investigators’ respective estimated source contributions as the
pollution variable. The relative risk associated with a 5th-to-
95th percentile increase in the source estimate is computed for
lag days 0 to 5 for each of the source apportionment
analyses. This consistent mortality analysis approach across
source apportionments allows a direct comparison of the
source components’ impacts on daily mortality effect
estimates across the various submitted source apportionment
analyses.
We further summarized the results across investigators/
methods in two ways. First, we computed variance-weighted
average risk estimates for each lag and estimated source type
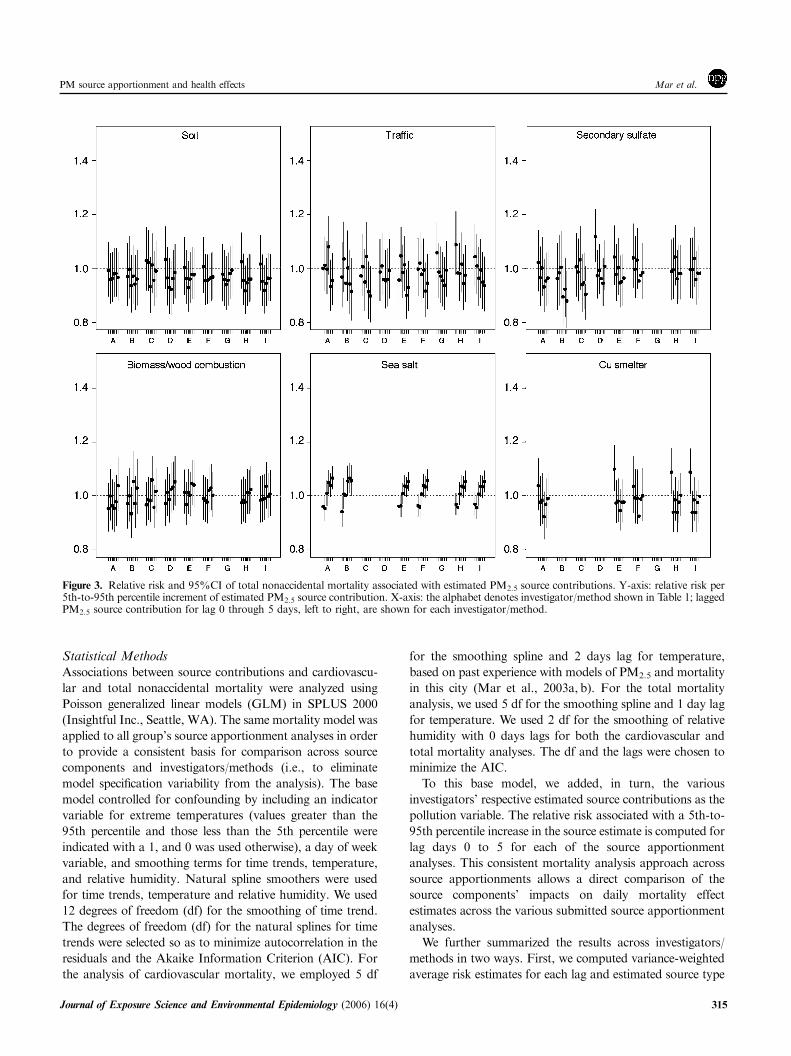
Figure 3. Relative risk and 95%CI of total nonaccidental mortality associated with estimated PM2.5 source contributions. Y-axis: relative risk per5th-to-95th percentile increment of estimated PM2.5 source contribution. X-axis: the alphabet denotes investigator/method shown in Table 1; laggedPM2.5 source contribution for lag 0 through 5 days, left to right, are shown for each investigator/method.
PM source apportionment and health effects Mar et al.
Journal of Exposure Science and Environmental Epidemiology (2006) 16(4) 315
across investigators/methods. Second, we attempt to explain
the variation in the estimated risks as a function of lag,
estimated source type, and investigators/methods. This was
done by regressing the percent excess deaths as the dependent
variable and indicator variables for estimated source types (5
df), investigators/methods (8 df) and lags (5 df) in a general
linear model, yielding an analysis of variance (ANOVA)
table.
Results
Descriptive StatisticsTable 1 shows the mean, standard deviation and the 5th-to-
95th percentiles of the fine mass estimates for the source
components most consistently reported for this city by the
various investigators/methods. All of the investigators listed a
soil or crustal particle factor as well as a traffic (gasoline and/
or diesel) factor. Total traffic was either originally listed by
the investigator as ‘‘total traffic’’, or was subsequently
summed by us from the gasoline and diesel traffic source
contributions to give directly comparable estimates across
groups. Six teams listed a marine or sea salt factor. The
biomass/wood combustion factor was either listed as
biomass, vegetative, or wood burning by the investigator.
The time-series plot of the daily average estimated fine
mass contributions (averaged across all of the investigators)
for each source category is presented for this city in Figure 1.
The average mass contribution of soil was higher for 1995
and 1996 than for 1997. The average diesel and sea salt
contributions were higher in 1995 than in 1996 and 1997.
As described by Hopke et al. (2005); some of these
estimated source contributions (e.g., soil, traffic, secondary
sulfate) correlated better across investigators/methods than
others (e.g., biomass/wood combustion).
Mortality time-series analyses
The cardiovascular mortality relative risks associated with
a 5th-to-95th percentile increase in the most consistently
identified source components are presented for each of the
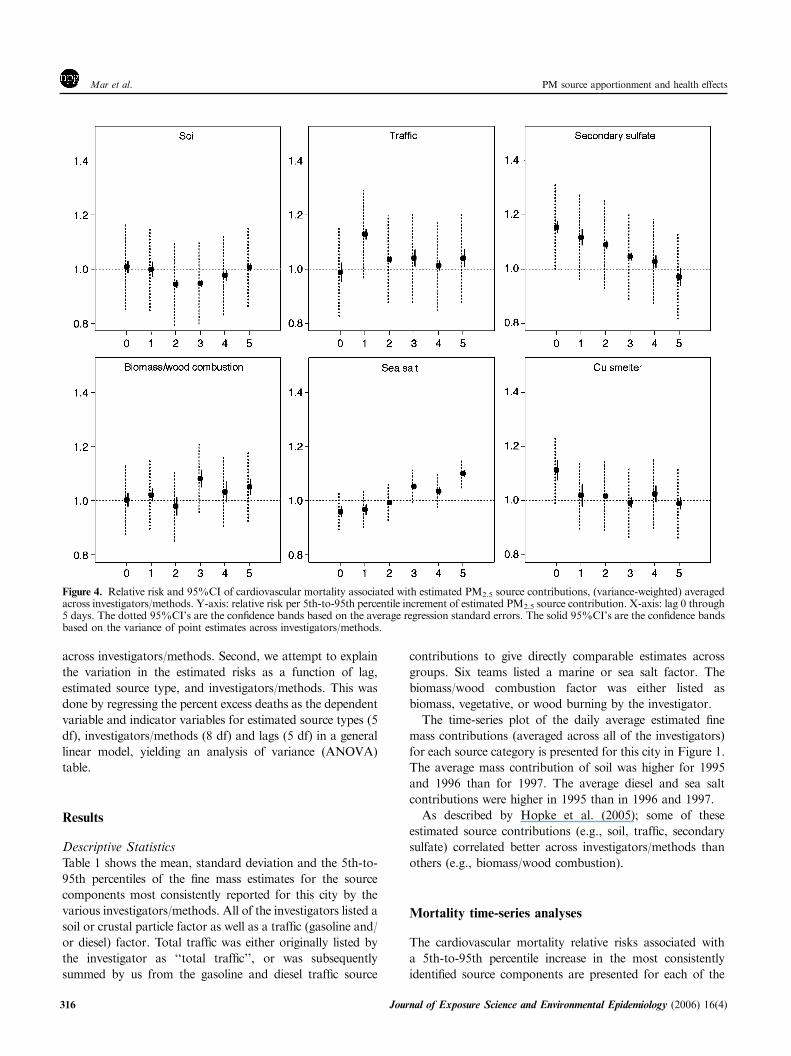
Figure 4. Relative risk and 95%CI of cardiovascular mortality associated with estimated PM2.5 source contributions, (variance-weighted) averagedacross investigators/methods. Y-axis: relative risk per 5th-to-95th percentile increment of estimated PM2.5 source contribution. X-axis: lag 0 through5 days. The dotted 95%CI’s are the confidence bands based on the average regression standard errors. The solid 95%CI’s are the confidence bandsbased on the variance of point estimates across investigators/methods.
PM source apportionment and health effectsMar et al.
316 Journal of Exposure Science and Environmental Epidemiology (2006) 16(4)

investigators/methods (A-I) for lags 0–5 days (i.e., for same
day and for each of the prior 5 days of pollution) in Figure 2.
As expected, the source factors that were correlated across
investigators/methods tended to show more similar risk
estimates. For each source type factor, the lag structures of
associations and the magnitude of risk estimates were similar
across investigators/methods. However, the lag structure of
associations varied across estimated source factors. For
example, the largest estimates for the secondary sulfate factor
was consistently found at lag 0 day (and nearly mono-
tonically decreasing for longer lags), whereas for the traffic
factor, it was lag 1 day, and for the sea salt factor, it was lag 5
days. The magnitude of relative risk per 5th-to-95th
percentile increment was greatest for secondary sulfate factor
Figure 5. Relative risk of cardiovascular mortality associated with estimated PM2.5 source contributions, (variance-weighted) averaged acrossinvestigators/methods. Y-axis: relative risk per 5th-to-95th percentile increment of estimated PM2.5 source contribution. X-axis: lag 0 through 5days. The dotted 95%CI’s are the confidence bands based on the average regression standard errors. The solid 95%CI’s are the confidence bandsbased on the variance of point estimates across investigators/methods.
Table 2. Analysis of variance results: variation in cardiovascular mortality percent excess risk estimates as a function of source type, investigators/
methods, and lag days in a general linear model
Source of variation Degrees of freedom Sequential sum of squares Adjusted sum of squares Adjusted mean squares F–value P-value
Pollution source type 5 2069.04 2076.76 415.35 14.35 o0.001
Investigators/methods 8 87.93 87.93 10.99 0.38 0.931
Lag days 5 450.99 450.99 90.20 3.12 0.009
Error 251 7262.93 7262.93 28.94
Total 269 9870.88
PM source apportionment and health effects Mar et al.
Journal of Exposure Science and Environmental Epidemiology (2006) 16(4) 317
(median percent excess risk estimate is 16.0% at lag 0 day
among eight investigators/methods), followed by traffic
(median percent excess risk estimate¼ 13.2% at lag 1 day
among nine investigators/methods), and copper (Cu) smelter
factor (median percent excess risk estimate¼ 12.0% at lag 0
day among five investigators/methods). While the magnitude
of estimated risks for the sea salt factor were smaller (median
percent excess risk estimate¼ 10.2% at lag 5 day among six
investigators/methods), their statistical significance was high-
er than other factors. The biomass/wood combustion factor
had less consistent lag structure of associations (median
percent excess risk estimate¼ 8.6% at lag 3 day among eight
investigators/methods). The soil factor showed no associa-
tions with no consistent lag structure of associations.
The relative risks for total nonaccidental mortality
associated with a 5th-to-95th percentile increase of the most
consistently identified sources are presented for each
investigator/method (A-I) in Figure 3. In these analyses,
we found fewer statistically significant associations between
PM impacts and total mortality, as compared with
cardiovascular mortality in this city. The Cu smelter and
sea salt factors showed some significant associations with lag
structures of associations similar to those for cardiovascular
mortality but with smaller effect sizes.
To further summarize the variability of the risk estimates
across investigators/methods, we computed variance-
weighted average risk estimates at each lag across investiga-
tors/methods, as shown in Figure 4 for cardiovascular
mortality. Also shown are the 95%CI from the variability
across investigators/methods and the average 95%CI’s from
regressions (based on the average of standard errors of
regression across investigators/methods). It is clear from this
figure that the variability of the estimated source-specific risk
estimates due to investigators/methods is much smaller than
that due to regression standard error. The differences in lag
structure of associations across the estimated source type
factors are clearly seen. Figure 5 shows the variance-weighted
mean risk estimates result for total mortality. Again, very
weak or no associations were seen except for sea salt and Cu
smelter factors.
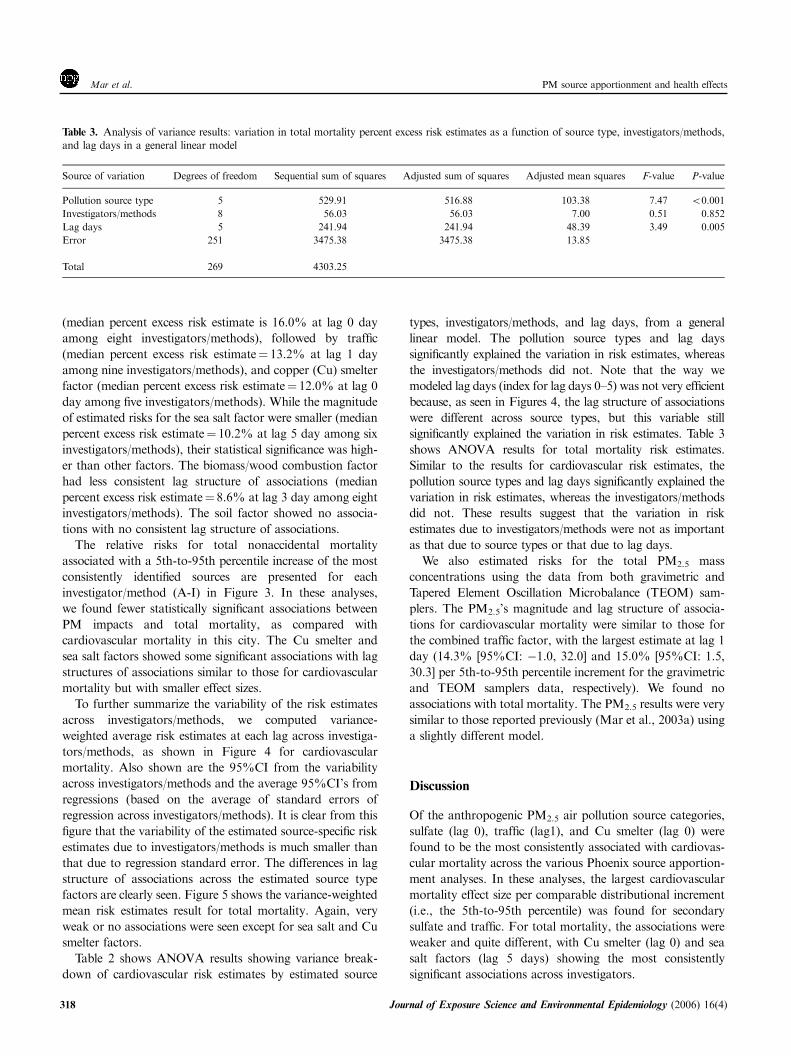
Table 2 shows ANOVA results showing variance break-
down of cardiovascular risk estimates by estimated source
types, investigators/methods, and lag days, from a general
linear model. The pollution source types and lag days
significantly explained the variation in risk estimates, whereas
the investigators/methods did not. Note that the way we
modeled lag days (index for lag days 0–5) was not very efficient
because, as seen in Figures 4, the lag structure of associations
were different across source types, but this variable still
significantly explained the variation in risk estimates. Table 3
shows ANOVA results for total mortality risk estimates.
Similar to the results for cardiovascular risk estimates, the
pollution source types and lag days significantly explained the
variation in risk estimates, whereas the investigators/methods
did not. These results suggest that the variation in risk
estimates due to investigators/methods were not as important
as that due to source types or that due to lag days.
We also estimated risks for the total PM2.5 mass
concentrations using the data from both gravimetric and
Tapered Element Oscillation Microbalance (TEOM) sam-
plers. The PM2.5’s magnitude and lag structure of associa-
tions for cardiovascular mortality were similar to those for
the combined traffic factor, with the largest estimate at lag 1
day (14.3% [95%CI: �1.0, 32.0] and 15.0% [95%CI: 1.5,
30.3] per 5th-to-95th percentile increment for the gravimetric
and TEOM samplers data, respectively). We found no
associations with total mortality. The PM2.5 results were very
similar to those reported previously (Mar et al., 2003a) using
a slightly different model.
Discussion
Of the anthropogenic PM2.5 air pollution source categories,
sulfate (lag 0), traffic (lag1), and Cu smelter (lag 0) were
found to be the most consistently associated with cardiovas-
cular mortality across the various Phoenix source apportion-
ment analyses. In these analyses, the largest cardiovascular
mortality effect size per comparable distributional increment
(i.e., the 5th-to-95th percentile) was found for secondary
sulfate and traffic. For total mortality, the associations were
weaker and quite different, with Cu smelter (lag 0) and sea
salt factors (lag 5 days) showing the most consistently
significant associations across investigators.
Table 3. Analysis of variance results: variation in total mortality percent excess risk estimates as a function of source type, investigators/methods,
and lag days in a general linear model
Source of variation Degrees of freedom Sequential sum of squares Adjusted sum of squares Adjusted mean squares F-value P-value
Pollution source type 5 529.91 516.88 103.38 7.47 o0.001
Investigators/methods 8 56.03 56.03 7.00 0.51 0.852
Lag days 5 241.94 241.94 48.39 3.49 0.005
Error 251 3475.38 3475.38 13.85
Total 269 4303.25
PM source apportionment and health effectsMar et al.
318 Journal of Exposure Science and Environmental Epidemiology (2006) 16(4)
The time lag of the time-series mortality associations
varied across the various PM2.5 source components. This
was especially clear in the associations for cardio-
vascular mortality. The secondary sulfate showed consis-
tently largest risk estimates at lag 0 day with a decreasing
trend with increasing lag time. The largest risk estimates
for the combined traffic were seen at lag 1 day most
consistently. The total PM2.5 mass concentration also
showed the largest (and most significant) estimate at lag 1
day. This is not surprising considering the estimated
combined traffic-related PM2.5 mass explained the largest
fraction of total PM2.5.
Sea salt was also found to be associated with both total
and cardiovascular mortality, but strangely so, with a nearly
significant negative association at lag 0 and a statistically
significantly positive association at lag 5. The sea salt effect
size estimates for lag 5 were also consistently smaller
than those for sulfate or motor vehicles. This sea salt
factor’s consistently negative (though not large in magnitude)
associations raise some concern about potential
residual confounding. Since the covariates (e.g., temperature)
are also likely correlated with some of these source-
apportioned PM2.5, the negative estimates may also be an
indication of over-fitting or sharing of the effects by
correlated variables.
We found in this city that the fine particle soil and biomass
burning factors were not associated with an increased risk of
cardiovascular mortality or total mortality. These results may
suggest that fossil fuel and industrial emissions-related
particles are more toxic than the ‘‘pre-Industrial Revolution’’
sources these analyses identified (i.e., vegetative burning and
crustal-derived soil particles).
The variations in the maximum effect lag day between
source categories may suggest that different mechanisms of
effect are at work for the various types of PM2.5. This may
indicate that past analyses looking only at a single lag of
PM2.5 may have missed some source impact contributions at
different lags. Further research is needed to investigate the
possibility that different PM2.5 mass source components have
different effect lag structure.
Overall, we found reasonably consistent health effects
results across source apportionment methods and research-
ers, with similar sources being identified and similar effect
estimates and lag structures across analyses, despite indepen-
dent efforts and differences in approaches. Furthermore, the
variability in source-specific effect estimates across investiga-
tors/methods was found to be relatively small, as compared
to the variability between particle source categories. The
variability due to investigators/methods was also found to be
smaller compared to that from regression uncertainty (i.e.,
standard error of regression coefficients). Although the use of
source contribution estimates in the time-series models may
have potential for bias, these results are reasonably consistent
between different investigators using different multivariate
receptor models (note that no CMB type models were used)
and thus provide some support for the contention that
today’s source apportionment approaches are reliable enough
to be useful in the investigation of source-specific health
effects. Future research will also need to investigate a number
of other important issues including accuracy of results.
Acknowledgements
The Workshop was organized under the auspices of the
participating U.S. EPA PMHealth Effects Research Centers
(grant R827351 at NYU, R827355 at the University of
Washington, R827353 at Harvard University, and R927354
at the University of Rochester). We thank individual
researchers who participated in this workshop, often on their
own time and resources. Support for the organization and
administration of the Workshop was also provided by the
New York State Energy Research and Development
Authority (NYSERDA grant 375-34215). We also thank
Gary Norris of the U.S. EPA for providing us with the
Phoenix AZ data, and William Wilson of the U.S. EPA for
providing us with temperature and relative humidity data for
Phoenix, AZ for the days for which data were not available
from NERL.
References
Hopke P.K., Ito K., Mar T., Christensen W.F., Eatough D.J., Henry R.C., Kim
E., Laden F., Lall R., Larson T.V., Liu H., Neas L., Pinto J., Stolzel M., Suh
H., Paatero P., and Thurston G.D. PM source apportionment and health
effects: 1. Intercomparison of source apportionment results. J Exp Anal Env
Epidem 2005 (accepted).
Ito K., Christensen W., Eatough D.J., Henry R.C., Kim E., Laden F., Lall R.,
Larson T.V., Neas L., Hopke P.K., and Thurston G. An investigation of
inter-method variability in associations between source-apportioned fine
particle mass and daily mortality in Washington, DC. J Expos Anal Environ
Epidemiol 2005 (accepted).
Laden F., Neas L.M., Dockery D.W., and Schwartz J. Association of fine
particulate matter from different sources with daily mortality in six U.S. cities.
Environ Health Perspect 2000: 108: 941–947.
Mar T.F., Norris G.A., Koenig J.Q., and Larson T.V. Associations between air
pollution and mortality in Phoenix, 1995–1997. Environ Health Perspect 2000:
108: 347–353.
Mar T.F., Norris G.A., Koenig J.Q., and Larson T.V. Air pollution and
cardiovascular mortality in Phoenix, 1995–1997. In: Revised Analyses Of
Time-Series Studies Of Air Pollution And Health, Special Report. Health
Effects Institute, Boston, MA, 2003a, pp. 177–182. Available at http://
www.healtheffects.org/news.htm (accessed 16 May, 2003).
Mar T.F., Larson T.V., Wilson W.E., and Koenig J.Q. The association between
air pollution and cardiovascular mortality in greater Phoenix, 1995 to 1997.
AAAR abstract 2003b, 97.
Ostro B.D., Broadwin R., and Lipsett M.J. Coarse and fine particles and daily
mortality in the Coachella Valley, California: a follow-up study. J Expo Anal
Environ Epidemiol 2000: 10: 412–419.
Ozkaynak H., and Thurston G.D. Associations between 1980 U.S. mortality rates
and alternative measures of airborne particle concentration. Risk Analysis
1987: 7: 449–460.
Ramadan Z., Eickhout B., Song X.H., Buydens L., and Hopke P.K. Comparison
of Positive Matrix Factorization (PMF) and Multilinear Engine (ME-2) for
the source apportionment of particulate pollutants. Chemometrics and
Intelligent Laboratory Systems 2003: 66: 15–28.
PM source apportionment and health effects Mar et al.
Journal of Exposure Science and Environmental Epidemiology (2006) 16(4) 319

Ramadan Z., Song X.H., and Hopke P.K. Identification of sources of Phoenix
Aerosol by Positive Matrix Factorization. J Air & Waste Manage Assoc 2000:
50: 1308–1320.
Schwartz J., Dockery D.W., and Neas L.M. Is daily mortality associated
specifically with fine particles? J Air Waste Manage Assoc 1996: 46: 927–939.
Thurston G.D., Ito K., Mar T., Christensen W.F., Eatough D.J., Henry R.C.,
Kim E., Laden F., Lall R., Larson T.V., Liu H., Neas L., Pinto J., Stolzel
M., Suh H., and Hopke P.K. The Workshop on the Source Apportionment of
PM Health Effects: Inter-Comparison of Results and Implications. Environ
Health Persp 2005 (in press).
U.S. Environmental Protection Agency. Phoenix PM Mass and Species Data,
February 1, 1995 to June 30, 1998 (on CD), National Exposure Research
Laboratory, Research Triangle Park, NC, 1999.
U.S. Environmental Protection Agency (USEPA). Air Quality Criteria for Particulate
Matter. EPA 600/P-99/002bF, National Center for Environmental Assessment,
Office of Research and Development, Research Triangle Park, NC, 2004.
PM source apportionment and health effectsMar et al.
320 Journal of Exposure Science and Environmental Epidemiology (2006) 16(4)