Arsenic health risk assessment in drinking water and source apportionment using multivariate...
10
Arsenic health risk assessment in drinking water and source apportionment using multivariate statistical techniques in Kohistan region, northern Pakistan Said Muhammad a , M. Tahir Shah a, * , Sardar Khan b, ** a National Center of Excellence in Geology, University of Peshawar, Pakistan b Department of Environmental Sciences, University of Peshawar, Pakistan article info Article history: Received 12 May 2010 Accepted 12 July 2010 Keywords: Arsenic Health risk Hazard quotient Average daily dose Drinking water abstract The present study was conducted in Kohistan region, where mafic and ultramafic rocks (Kohistan island arc and Indus suture zone) and metasedimentary rocks (Indian plate) are exposed. Water samples were collected from the springs, streams and Indus river and analyzed for physical parameters, anions, cations and arsenic (As 3+ , As 5+ and arsenic total). The water quality in Kohistan region was evaluated by compar- ing the physio-chemical parameters with permissible limits set by Pakistan environmental protection agency and world health organization. Most of the studied parameters were found within their respective permissible limits. However in some samples, the iron and arsenic concentrations exceeded their permis- sible limits. For health risk assessment of arsenic, the average daily dose, hazards quotient (HQ) and can- cer risk were calculated by using statistical formulas. The values of HQ were found >1 in the samples collected from Jabba, Dubair, while HQ values were <1 in rest of the samples. This level of contamination should have low chronic risk and medium cancer risk when compared with US EPA guidelines. Further- more, the inter-dependence of physio-chemical parameters and pollution load was also calculated by using multivariate statistical techniques like one-way ANOVA, correlation analysis, regression analysis, cluster analysis and principle component analysis. Ó 2010 Elsevier Ltd. All rights reserved. 1. Introduction Arsenic (As) is one of the hazardous metalloids present in the drinking water, resulting from both anthropogenic and geogenic sources (Baig et al., 2009). It has many chemical forms that differ not only with regards to physical, chemical and biological proper- ties but also have different toxicities (Devesa et al., 2008). Both the organic and inorganic As species are toxic in nature (WHO, 2008) but the inorganic species are considered more toxic as compared to organic species (Lim et al., 2007). Among the inorganic species, As 3+ is considered as the major arsenic species present in natural water system and has higher toxicity than As 5+ . However, As 3+ and As 5+ are inter-convertible in aqueous solution but it is depen- dent on various environmental factors such as pH, temperature, oxygen contents and microorganisms present in the aquatic eco- system (Hall et al., 1999; Pizarro et al., 2003). Arsenic not only con- taminates surface and groundwater but also enters into food chains like vegetables and food staff (Arain et al., 2009; Rahman et al., 2008). The ingestion of As contaminated drinking water can cause serious health problems including cancer, melanosis, hyperkeratosis, restrictive lung disease, gangrene, hypertension and peripheral vascular disease (Josef et al., 2007; Rahman et al., 2009), skin lesion (Fatmi et al., 2009), as well as its carcinogenic ef- fect on lungs and skin (IARC, 2004). However, the cancer is also af- fected by a number of other factors like smoking, and exposure environment (Fu et al., 2003). The As concentration in drinking water has been used to calculate potential health risk assessment: chronic and carcinogenic effects like average daily dose (ADD), hazard quotient (HQ) and carcinogenic risk (CR) (Nguyen et al., 2009; Kavcar et al., 2009). In drinking water the physio-chemical parameters are impor- tant and their high or low concentration directly or indirectly af- fects the human. The pH is one of the important indicators of water quality and level of pollution in aquatic system (Jonnalag- adda and Mhere, 2001). Drinking water pH has no direct effects on human health but it has some indirect health effects by bringing changes in other water quality parameters such as metal solubility and pathogens survival. However, high range of pH attributes bit- ter taste to drinking water (US EPA, 1977). The electrical conduc- tivity (EC) qualitatively estimates the status of inorganic dissolved solids and ionized species in water (Jonnalagadda and Mhere, 2001). High nitrate (NO 3 ) concentration is toxic especially for bottle fed babies causing blue baby syndrome (Leeuwen, 2000). The adults average daily intakes of potassium (K) through water ingestion is generally <0.1% (Latorre and Toro, 1997). For 0278-6915/$ - see front matter Ó 2010 Elsevier Ltd. All rights reserved. doi:10.1016/j.fct.2010.07.018 * Corresponding author. Tel.: +92 91 9218182; fax: +92 91 9218183. ** Corresponding author. Tel.: +92 91 9216742; fax: +92 91 9218401. E-mail addresses: [email protected] (M. Tahir Shah), sardar.kha- [email protected] (S. Khan). Food and Chemical Toxicology 48 (2010) 2855–2864 Contents lists available at ScienceDirect Food and Chemical Toxicology journal homepage: www.elsevier.com/locate/foodchemtox
Transcript of Arsenic health risk assessment in drinking water and source apportionment using multivariate...
Food and Chemical Toxicology 48 (2010) 2855–2864
Contents lists available at ScienceDirect
Food and Chemical Toxicology
journal homepage: www.elsevier .com/locate / foodchemtox
Arsenic health risk assessment in drinking water and source apportionmentusing multivariate statistical techniques in Kohistan region, northern Pakistan
Said Muhammad a, M. Tahir Shah a,*, Sardar Khan b,**
a National Center of Excellence in Geology, University of Peshawar, Pakistanb Department of Environmental Sciences, University of Peshawar, Pakistan
a r t i c l e i n f o
Article history:Received 12 May 2010Accepted 12 July 2010
Keywords:ArsenicHealth riskHazard quotientAverage daily doseDrinking water
0278-6915/$ - see front matter � 2010 Elsevier Ltd. Adoi:10.1016/j.fct.2010.07.018
* Corresponding author. Tel.: +92 91 9218182; fax:** Corresponding author. Tel.: +92 91 9216742; fax:
E-mail addresses: [email protected] ([email protected] (S. Khan).
a b s t r a c t
The present study was conducted in Kohistan region, where mafic and ultramafic rocks (Kohistan islandarc and Indus suture zone) and metasedimentary rocks (Indian plate) are exposed. Water samples werecollected from the springs, streams and Indus river and analyzed for physical parameters, anions, cationsand arsenic (As3+, As5+ and arsenic total). The water quality in Kohistan region was evaluated by compar-ing the physio-chemical parameters with permissible limits set by Pakistan environmental protectionagency and world health organization. Most of the studied parameters were found within their respectivepermissible limits. However in some samples, the iron and arsenic concentrations exceeded their permis-sible limits. For health risk assessment of arsenic, the average daily dose, hazards quotient (HQ) and can-cer risk were calculated by using statistical formulas. The values of HQ were found >1 in the samplescollected from Jabba, Dubair, while HQ values were <1 in rest of the samples. This level of contaminationshould have low chronic risk and medium cancer risk when compared with US EPA guidelines. Further-more, the inter-dependence of physio-chemical parameters and pollution load was also calculated byusing multivariate statistical techniques like one-way ANOVA, correlation analysis, regression analysis,cluster analysis and principle component analysis.
� 2010 Elsevier Ltd. All rights reserved.
1. Introduction
Arsenic (As) is one of the hazardous metalloids present in thedrinking water, resulting from both anthropogenic and geogenicsources (Baig et al., 2009). It has many chemical forms that differnot only with regards to physical, chemical and biological proper-ties but also have different toxicities (Devesa et al., 2008). Both theorganic and inorganic As species are toxic in nature (WHO, 2008)but the inorganic species are considered more toxic as comparedto organic species (Lim et al., 2007). Among the inorganic species,As3+ is considered as the major arsenic species present in naturalwater system and has higher toxicity than As5+. However, As3+
and As5+ are inter-convertible in aqueous solution but it is depen-dent on various environmental factors such as pH, temperature,oxygen contents and microorganisms present in the aquatic eco-system (Hall et al., 1999; Pizarro et al., 2003). Arsenic not only con-taminates surface and groundwater but also enters into foodchains like vegetables and food staff (Arain et al., 2009; Rahmanet al., 2008). The ingestion of As contaminated drinking watercan cause serious health problems including cancer, melanosis,
ll rights reserved.
+92 91 9218183.+92 91 9218401.
. Tahir Shah), sardar.kha-
hyperkeratosis, restrictive lung disease, gangrene, hypertensionand peripheral vascular disease (Josef et al., 2007; Rahman et al.,2009), skin lesion (Fatmi et al., 2009), as well as its carcinogenic ef-fect on lungs and skin (IARC, 2004). However, the cancer is also af-fected by a number of other factors like smoking, and exposureenvironment (Fu et al., 2003). The As concentration in drinkingwater has been used to calculate potential health risk assessment:chronic and carcinogenic effects like average daily dose (ADD),hazard quotient (HQ) and carcinogenic risk (CR) (Nguyen et al.,2009; Kavcar et al., 2009).
In drinking water the physio-chemical parameters are impor-tant and their high or low concentration directly or indirectly af-fects the human. The pH is one of the important indicators ofwater quality and level of pollution in aquatic system (Jonnalag-adda and Mhere, 2001). Drinking water pH has no direct effectson human health but it has some indirect health effects by bringingchanges in other water quality parameters such as metal solubilityand pathogens survival. However, high range of pH attributes bit-ter taste to drinking water (US EPA, 1977). The electrical conduc-tivity (EC) qualitatively estimates the status of inorganicdissolved solids and ionized species in water (Jonnalagadda andMhere, 2001). High nitrate (NO3) concentration is toxic especiallyfor bottle fed babies causing blue baby syndrome (Leeuwen,2000). The adults average daily intakes of potassium (K) throughwater ingestion is generally <0.1% (Latorre and Toro, 1997). For
2856 S. Muhammad et al. / Food and Chemical Toxicology 48 (2010) 2855–2864
normal body functions, like other light elements, sufficient amountof K is also very significant. The low concentration of K can causeheart problems, hypertension, muscle weakness, bladder weak-ness, kidney diseases, asthma, while its high concentration cancause rapid heartbeat, cystitis, ovarian cysts, reduced renal func-tion and abnormal metabolism of protein (Marijic and Toro,2000). Minerals deposits are the main sources of sodium (Na) inwater. Low concentrations of Na can cause numerous health prob-lems such as mental apathy, low blood pressure, fatigue, depres-sion, and dehydration, while its high concentration is responsiblefor edema, hypertension, stroke, headaches, kidney damages,stomach problems and nausea (Robert and Mari, 2003). The defi-ciency of base cations like calcium (Ca) and magnesium (Mg) indrinking water has been associated with cardiovascular diseases(Yang et al., 2006). Iron (Fe) is one of the human essential elementsand needed for hemoglobin, myoglobin and a number of enzymes.However, high concentration of Fe is also toxic and characterizedby the vomiting, diarrhea, with subsequent effect on cardiovascu-lar, and central nerves systems, liver, kidney and blood (Goldhaber,2003).
High concentration of As and other physio-chemical parametersin surface and groundwater has been previously reported from sev-eral South-Asian countries like Bangladesh (Halim et al., 2009),China (Xie et al., 2009) and India (Gupta et al., 2009). Like neigh-boring countries, Pakistan is also facing serious public health prob-lems due to As contamination in portable water supply. InPakistan, high As concentrations have been reported in differentparts of the country such as Jamshoro (Baig et al., 2009), Mancharlake (Arain et al., 2008, 2009), Lahore and Kasur (Farooqi et al.,2007) and Muzaffargarh District (Nickson et al., 2005). The PakEPA and WHO recommended permissible limits for arsenic indrinking water 50 lg L�1 and 10 lg L�1, respectively.
In the study area, so far no research work on the environmentalpoint of view; especially As contamination in drinking water and
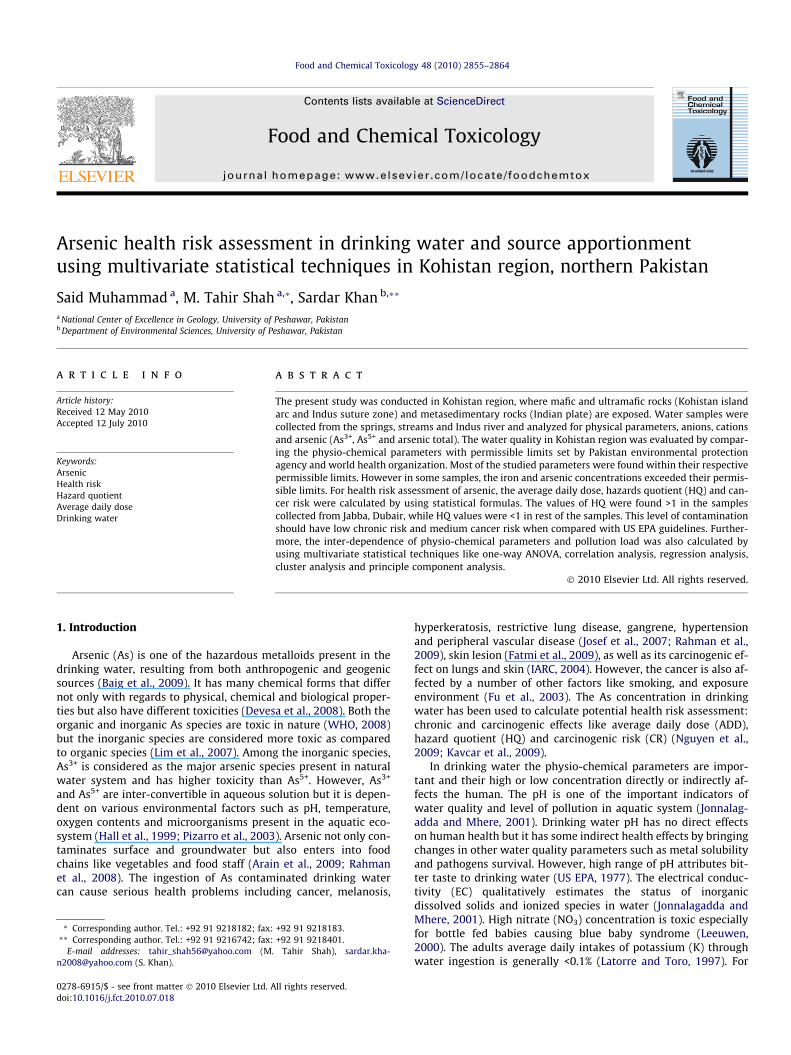
Fig. 1. Location map of the study area and sampling points havi
its potential effects on human health have been conducted. Keep-ing in view the geology of the study area and possible leachingof As and other light metals. This study aimed to determine con-tamination levels in surface and groundwater of Kohistan region,northern Pakistan, with main emphasis on As contamination indrinking water and its health risk. Multivariate statistical tech-niques were also used for the identification of potential pointand non-point contamination sources.
2. Materials and methods
2.1. Study area
The study area in Kohistan region, northern Pakistan is located in between34�500 to 35�120 latitudes N and 72�300 to 73�050 longitudes E. It covers approxi-mately 1800 km2 area and 0.25 million populations, where the local people obtainwater from springs, streams (Khwars) and Indus river for drinking, domestic con-sumption and agriculture purposes. The main occupation is agriculture, but agricul-tural land is very limited and within mountains. Dubair and Khan Khwars are themain sources of irrigation in the area. The region is warm in the summer(32.5 �C) except high altitude area and very cold in the winter (�2.4 �C) receivingan annual precipitation of 1415.9 mm. Indus is the main river flowing throughthe area that divides Kohistan, into Hazara Kohistan and Swat Kohistan (DCR,1998a,b).
The Kohistan region is mainly composed of the mafic and ultramafic rocks of theKohistan island arc (KIA) and Indus suture zone (ISZ) and the metasedimentaryrocks of the Indian plate (IP) as shown in Fig. 1. The ultramafic rocks (dunite andperidotite) of the KIA and the ISZ are hosting the chromite deposits at Jijal-Dubairand Alpuri areas, respectively (Ashraf and Hussian, 1982; Miller et al., 1991), whilethe metasedimentary rocks (ortho and paragneises and calc-silicates) of the IP hav-ing Pb–Zn massive sulfides at Pazang and Lahor areas in the vicinity of Besham(Fletcher et al., 1986; Shah, 2000). The ISZ, consisting of Mingora-Shangla–Allaimélanges, represents the contact between the KIA in the north and the IP in thesouth (Dipietro et al., 1993).
2.2. Sampling
The representative surface and groundwater samples were collected from geol-ogy based classified Jijal-Dubair, Besham and Alpuri areas. In the study area, 45
ng scale of 1:250,000 (modified from Dipietro et al., 1993).
Tabl
e1
Phys
io-c
hem
ical
wat
erqu
alit
ypa
ram
eter
sco
llect
edfr
omth
est
udy
area
(n=
85).
Para
met
ers
Jija
l-D
uba
irar
eaB
esh
amar
eaA
lpu
riar
ea
Surf
ace
wat
erG
rou
ndw
ater
Surf
ace
wat
erG
rou
ndw
ater
Surf
ace
wat
erG
rou
ndw
ater
n=
15n
=10
n=
18n
=15
n=
15n
=12
Ran
geM
ean
Ran
geM
ean
Ran
geM
ean
Ran
geM
ean
Ran
geM
ean
Ran
geM
ean
pH7.
14–7
.77.
46(0
.21)
7.56
–8.5
07.
90(0
.36)
6.53
–7.9
07.
53(0
.32)
7.00
–7.7
27.
38(0
.24)
7.30
–7.8
07.
63(0
.23)
7.80
–8.0
07.
90(0
.10)
TDS
(mg
L�1)
35.4
0–75
.60
97.0
6(16
.52)
78.4
0–23
0.00
136.
28(5
6.54
)80
.00–
219.
0012
5.21
(37.
98)
68.1
0–43
3.00
196.
89(1
15.2
9)58
.40–
174.
0011
0.57
(41.
61)
103.
00–
116.
0011
1.00
(7.0
0)
EC(l
scm�
1)
66.4
0–14
2.90
51.4
4(31
.31)
147.
40–
438.
0025
6.28
(108
.88)
152.
00–
414.
0023
5.89
(71.
40)
128.
00–
813.
0037
0.50
(216
.64)
110.
00–
326.
0020
8.20
(77.
81)
203.
00–
215.
0021
0.33
(6.4
3)
SO4
(mg
L�1)
3.00
–10.
004.
80(2
.95)
1.00
–7.0
04.
00(2
.24)
3.30
–126
.00
41.2
3(32
.43)
10.0
0–17
6.00
78.5
1(51
.33)
4.00
–9.0
06.
83(1
.94)
4.00
–5.0
04.
33(0
.58)
NO
3(m
gL�
1)
2.10
–4.5
02.
96(0
.97)
3.40
–5.1
04.
46(0
.66)
0.70
–4.8
02.
82(0
.98)
1.80
–4.6
02.
95(1
.04)
2.50
–5.0
03.
97(0
.85)
2.50
–3.8
03.
33(0
.72)
PO4
(mg
L�1)
0.03
–0.3
70.
13(0
.14)
0.05
–0.4
50.
19(0
.16)
0.01
–0.4
30.
10(0
.10)
0.05
–0.1
60.
08(0
.04)
0.02
–0.3
00.
11(0
.10)
0.03
–0.0
80.
05(0
.03)
Cl
(mg
L�1)
0.20
–3.5
01.
16(1
.39)
0.70
–3.2
01.
90(0
.95)
1.40
–4.3
02.
41(0
.85)
0.60
–3.4
02.
06(0
.87)
0.70
–2.0
01.
22(0
.45)
0.50
–1.1
00.
80(0
.30)
HC
O3(m
gL�
1)
31.0
0–66
.00
43.4
0(13
.45)
63.0
0–19
4.00
114.
60(4
8.85
)56
.00–
113.
0082
.67(
16.4
9)56
.00–
119.
0084
.88(
21.5
5)34
.00–
150.
0088
.67(
42.6
0)10
3.00
–11
9.00
108.
33(9
.24)
K(m
gL�
1)
0.71
–1.6
11.
01(0
.38)
0.75
–2.6
61.
41(0
.89)
1.32
–7.1
43.
46(1
.68)
1.64
–9.2
25.
32(2
.49)
0.50
–1.5
81.
11(0
.42)
0.33
–0.5
40.
41(0
.11)
Na
(mg
L�1)
1.46
–3.6
52.
28(0
.90)
0.90
–4.2
52.
19(1
.24)
2.60
–7.5
14.
39(1
.67)
4.30
–8.0
15.
61(1
.17)
1.63
–3.3
42.
48(0
.61)
0.84
–1.8
51.
47(0
.55)
Ca
(mg
L�1)
10.8
0–16
.26
12.7
1(2.
62)
8.95
–27.
8516
.80(
6.99
)23
.41–
67.4
438
.35(
14.0
3)20
.13–
164.
0861
.68(
47.5
6)14
.16–
33.0
422
.70(
7.83
)11
.64–
16.9
714
.09(
2.69
)M
g(m
gL�
1)
1.54
–9.8
44.
23(3
.40)
8.75
–29.
2419
.69(
9.63
)0.
95–1
1.73
5.77
(2.9
6)1.
65–1
5.29
5.30
(4.5
1)4.
57–3
8.80
15.7
5(13
.60)
22.6
5–27
.76
24.6
7(2.
72)
Fe( l
gL�
1)
112.
21–
328.
2023
4.00
(97.
38)
174.
00–
1070
.00
419.
40(3
69.8
3)71
.02–
1268
.02
446.
80(3
03.4
0)10
6.04
–51
0.01
278.
40(1
78.6
0)21
.00–
503.
0028
5.50
(182
.02)
135.
04–
428.
0328
5.00
(146
.60)
Nu
mbe
rsin
pare
nth
esis
indi
cate
the
stan
dard
devi
atio
n.
nm
ean
sn
um
ber
ofsa
mpl
es.
S. Muhammad et al. / Food and Chemical Toxicology 48 (2010) 2855–2864 2857
sampling sites were selected and a total of 85 water samples were collected fromboth surface and groundwater sources. The physical parameters like pH, EC and to-tal dissolved solid (TDS) were determined in situ by using pH Meter and Electro-chemical Analyzer (CONSORT C931), respectively. The water samples werecollected in two plastic bottles, pre-washed with 0.5 N nitric acid (HNO3) and de-ionized water, from each sampling point. During sampling, two bottles was filledwith water from each spot, filtered and add few drops of HNO3 in one water samplethat used for major cations and As analysis, while second sample was not acidifiedand used for major anions. All the samples were transported and kept in the dark at4 �C for analysis.
2.3. Analysis
All filtered and non-acidified samples of surface and groundwater were ana-lyzed for major anions including chloride (Cl), nitrate (NO3), sulfate (SO4), phos-phate (PO4) using HACH Spectrophotometer (DR 2800) and bicarbonates (HCO3)using titration method as adopted by Srivastava (2004). Major cations like Na, K,Ca, Mg and Fe were measured by using Perkin Elmer atomic absorption spectrom-eter (AAS-PEA-700).
For analysis of As total (AsT) concentrations 10 ml of water samples was mixedwith 10 ml of 5 M HCl and then with 1 ml of KI and stand for 30 min, while As3+ wasby mixing of 10 ml sample with 10 ml 1.5% HCl. However, the As5+ was measuredby subtracting the As3+ from AsT concentration. Arsenic (As3+, As5+ and AsT) wasdetermined using AAS-PEA-700 equipped with of mercury hydride generation sys-tem (MHS), according to the procedure adopted by Welz and Šucmanová (1993).
Each water sample was analyzed in triplicate for anions, light metals and heavymetals. The reproducibility was found to 95% confidence level. Therefore, the aver-age value of each water sample was used for further interpretation. All the acids andreagents used were of analytical grade and purchased from MERCK Company. Allthese analysis were performed in the Geochemistry laboratory of the National Cen-tre of Excellence in Geology (NCEG), University of Peshawar, Pakistan.
2.4. Arsenic risk assessment
2.4.1. Exposure assessmentArsenic enters into human body through several pathways including food chain,
dermal contact and inhalation but in comparison with oral intake all others are neg-ligible (ATSDR, 2000). The average daily dose (ADD) through drinking water intakeis calculated according to following formula (US EPA, 1998).
ADD ¼ C� IR � ED� EF=BW� AT
where C, IR, ED, EF, BW, AT represents the As concentration in water (lg L�1), wateringestion rate 2 (L day�1), exposure duration (assumed 67 years), exposure fre-quency (365 days year�1), body weight (72 kg) and average life time (24,455 days),respectively.
2.4.2. Human health risk assessmentIn this study, both the chronic and carcinogenic risk levels were also assessed.
Generally, the HQ can be calculated by the following equation (US EPA, 1998).
HQ ¼ ADD=RfD ð1Þ
where the As toxicity reference dose (RfD) is 0.0003 mg kg�1 day�1 (US EPA, 2005).The health risk is generally occurs when the HQ values were >1 (Khan et al., 2008)
The cancer risk (CR) was calculated using the formula:
CR ¼ ADD� CSF
According to US EPA (2005) database the cancer slope factor (CSF) for As is1.5 mg kg�1 day�1.
2.5. Statistical analysis
All mathematical calculations like ranges, means and standard deviations werecalculated for physio-parameters using Excel 2007 (Microsoft Office). The statisticalanalysis like one-way ANOVA, correlation analysis, regression analysis, cluster anal-ysis (CA) and principle component analysis (PCA) were analyzed by using SPSS soft-ware version 17.
3. Result and discussion
3.1. Physio-chemical aspects
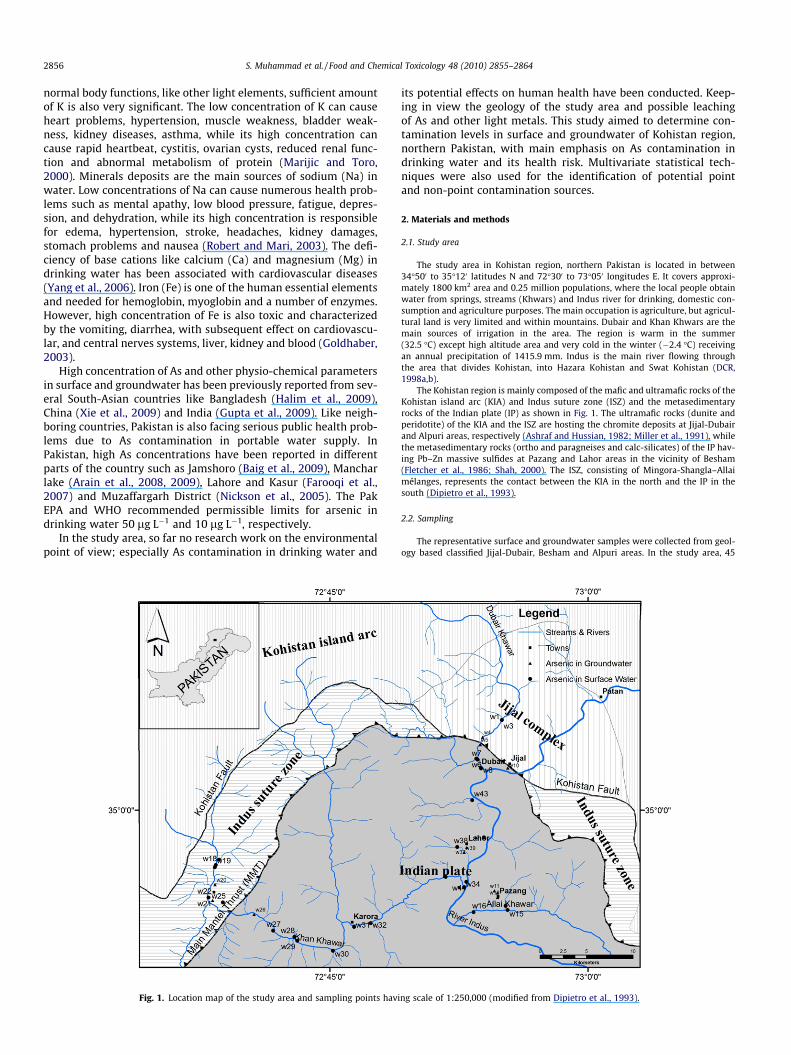
Table 1 summarizes the physio-chemical parameters concen-trations in both surface and groundwater samples collected fromJijal-Dubair, Besham and Alpuri areas. In study area, pH values insurface water ranged from 7.14 to 7.70, 6.53 to 7.90 and 7.30 to7.80, while in groundwater it ranged from 7.56 to 8.50, 7.00 to
2858 S. Muhammad et al. / Food and Chemical Toxicology 48 (2010) 2855–2864
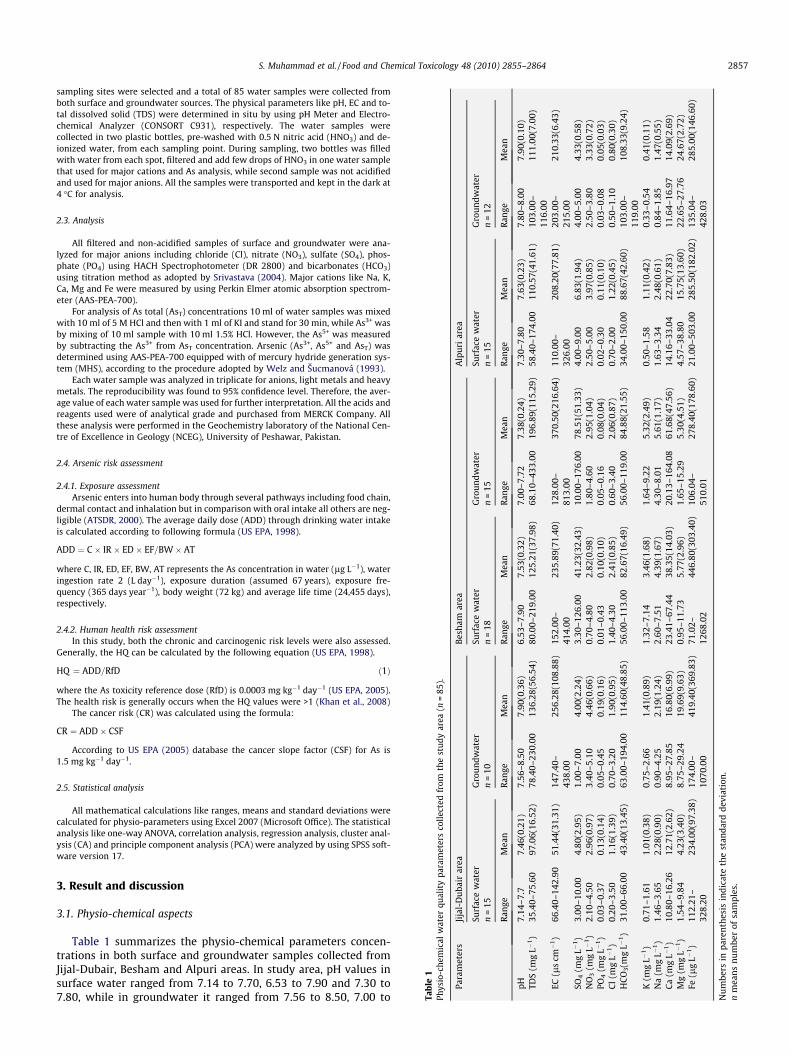
7.72 and 7.80 to 8.00 in Jijal-Dubair, Besham and Alpuri areas,respectively (Table 1). The mean pH values of surface water werein order of Jijal-Dubair > Besham > Alpuri, while that of groundwa-ter were in order of Besham > Alpuri > Jijal-Dubair area. The high-est pH (8.50) was found in spring water sample collected fromJijal area. The EC values in surface water ranged from 66.40 to142.90, 152.00 to 414.00 and 110.00 to 326.00 ls cm�1, while ingroundwater it ranged from 147.40 to 438.00, 128.00 to 813.00and 203.00 to 215.00 ls cm�1 in Jijal-Dubair, Besham and Alpuriareas, respectively (Table 1). The mean EC value in groundwaterwas greater than that of surface water, may be attributed due toPb–Zn sulfides mineralization in Besham area. The highest EC value(813.00 ls cm�1) was observed in spring water sample collectedfrom Pazang area. The pH and EC values of the study area werelower than those reported by Halim et al. (2009) in groundwater.The TDS concentration depends on concentrations of CO3, HCO3,Cl, SO4, NO3, Na, K, Ca and Mg. The TDS concentrations of surfacewater samples ranged from 35.40 to 75.60, 80.00 to 219.00 and58.40 to 174.00 mg L�1, while in groundwater it ranged from78.40 to 230.00, 68.10 to 433.00 and 103.00 to 116.00 mg L�1 in Ji-jal-Dubair, Besham and Alpuri areas, respectively (Table 1). Themean TDS contents in groundwater was greater than that of sur-face water (Fig. 2), may be attributed due to underground sulfidesmineralization in Besham area. The highest TDS contents(433.00 mg L�1) were observed in water sample collected fromthe Pb–Zn sulfides mining area in Pazang. The TDS concentrationsin the water of the study area were found lower than those re-ported by Baig et al. (2009) in groundwater. The pH, EC and TDSin surface and groundwater samples were found within their per-missible limits set by Pak EPA (2008) and WHO (2008).
In study area, the SO4 concentrations in surface water rangedfrom 3.00 to 10.00, 3.30 to 126.00 and 4.00 to 9.00 mg L�1, whilein groundwater it ranged from 1.00 to 7.00, 10.00 to 176.00 and4.00 to 5.00 mg L�1 in Jijal-Dubair, Besham and Alpuri areas,respectively (Table 1). The relatively highest SO4 concentration(176.00 mg L�1) was observed in the spring water sample collectedfrom Pazang area. The groundwater showed higher SO4 concentra-
0.001
0.01
0.1
1
10
100
1000
10000
pH TDS SO4 NO3 PO4 Cl- HCO
Physio-chemi
Con
cent
rati
on (
mg/
L)
Surface water
Fig. 2. A comparisons of selected physio-chemical parameters in surfa
tion than those of surface water (Fig. 2). This high level of SO4 canbe attributed to the sulfide mineralization in Pazang and Lahorarea (Shah, 2000). The SO4 concentration of the study area waslower than those reported by Baig et al. (2009) in groundwater.The NO3 concentrations in surface water ranged from 2.10 to4.50, 0.70 to 4.80 and 2.50 to 5.00 mg L�1, while in groundwaterit ranged from 3.40 to 5.10, 1.80 to 4.60 and 2.50 to 3.80 mg L�1
in Jijal-Dubair, Besham and Alpuri areas, respectively (Table 1).Highest NO3 concentration (5.10 mg L�1) was observed in a springwater sample collected from Jabba, Dubair area. However, NO3
concentrations of the study area were lower than those reportedby Nickson et al. (2005) in groundwater.
The PO4 concentrations in surface water ranged from 0.03 to0.37, 0.01 to 0.43 and 0.02 to 0.30 mg L�1, while in groundwaterit ranged from 0.05 to 0.45, 0.05 to 0.16 and 0.03 to 0.08 mg L�1
in Jijal-Dubair, Besham and Alpuri areas, respectively (Table 1).The highest PO4 concentration of (0.45 mg L�1) was observed in aspring water sample collected from Jijal area. The PO4 concentra-tion of the study area was lower than those reported by Farooqiet al. (2007) in groundwater. The Cl concentrations in surfacewater ranged from 0.20 to 3.50, 1.40 to 4.30 and 0.70 to2.00 mg L�1, while in groundwater it ranged from 0.70 to 3.20,0.60 to 3.40 and 0.50 to 1.10 mg L�1 in Jijal-Dubair, Besham andAlpuri areas, respectively (Table 1). The highest Cl concentrationof (4.30 mg L�1) was found in stream water sample collected fromtributary of Khan Khwar. The Cl concentration of the study areawas lower than those reported by Farooqi et al. (2007) in ground-water. The HCO3 concentrations in surface water ranged from31.00 to 66.00, 56.00 to 113.00 and 34.00 to 150.00 mg L�1, whilein groundwater it ranged from 63.00 to 194.00, 56.00 to 119.00 and103.00 to 119.00 mg L�1 in Jijal-Dubair, Besham and Alpuri areas,respectively (Table 1). The highest HCO3 concentration(194.00 mg L�1) was observed in spring water sample collectedfrom Jijal area. The HCO3 of the study area was lower than thosereported by Nickson et al. (2005) in groundwater. The SO4, NO3,PO4 and Cl of surface and groundwater samples were found withinthe permissible limits set by Pak EPA (2008) and WHO (2008).
3 K Na Ca Mg
Fe As IIIAs V Astotal
cal parameters
Groundwater WHO
ce and groundwater SW = surface water and GW = groundwater.
S. Muhammad et al. / Food and Chemical Toxicology 48 (2010) 2855–2864 2859
In the study area, the K concentrations in surface water rangedfrom 0.71 to 1.61, 1.32 to 7.14 and 0.50 to 1.58 mg L�1, while ingroundwater it ranged from 0.75 to 2.66, 1.64 to 9.22 and 0.33 to0.54 mg L�1 in Jijal-Dubair, Besham and Alpuri areas, respectively(Table 1). The relatively highest K concentration (9.22 mg L�1)was observed in spring water sample collected from Pazang area.The K concentration of the study area was lower than those re-ported by Manzoor et al. (2006) in groundwater. The Na concentra-tions in surface water ranged from 1.46 to 3.65, 2.60 to 7.51 and1.63 to 3.34 mg L�1, while in groundwater it ranged from 0.90 to4.25, 4.30 to 8.01 and 0.84 to 1.85 mg L�1 in Jijal-Dubair, Beshamand Alpuri areas, respectively (Table 1). The highest Na concentra-tion (8.01 mg L�1) was observed in a spring water sample collectedfrom Pazang area. The Na concentration of the study area was low-er than those reported by Manzoor et al. (2006) in groundwater.The surface and groundwater of the study area have equal Naand K concentration (Fig. 2).
The Ca concentrations in surface water ranged from 10.80 to16.26, 23.41 to 67.44 and 14.16 to 33.04 mg L�1, while in ground-water it ranged from 8.95 to 27.85, 20.13 to 164.08 and 11.64 to16.97 mg L�1 in Jijal-Dubair, Besham and Alpuri areas, respectively(Table 1). The relatively highest Ca concentration (164.08 mg L�1)was observed in spring water sample collected from Pazang area.The Ca concentration in groundwater was higher than that of sur-face water (Fig. 2). This is due to the dissolution of Ca in the perco-lating water through sulfides bearing calc-silicate rocks (Shah,2000). The Ca concentration of the study area was lower than thosereported by Kazi et al. (2009) in groundwater. The Mg concentra-tions in surface water ranged from 1.54 to 9.84, 0.95 to 11.73and 4.57 to 38.80 mg L�1, while in groundwater it ranged from8.75 to 29.24, 1.65 to 15.29 and 22.65 to 27.76 mg L�1 in Jijal-Dub-air, Besham and Alpuri areas, respectively (Table 1). The relativelyhighest Mg concentration (38.80 mg L�1) was observed in streamsample collected from Alpuri area. The Mg concentration in
C a2+
Mg2+
Na+ + K
+
SO42-
+C
l-
100
0
0
100
100 0
10
10
0
SW of Dubair & Jijal
SW of Pazang & Lahor
GW of Alpuri & BeshamSW of Alpuri & BeshamGW of Pazang & Lahor
GW of Dubair & Jijal
II
III
IV
VI
V
SW = Surface water and GW = Groundwate
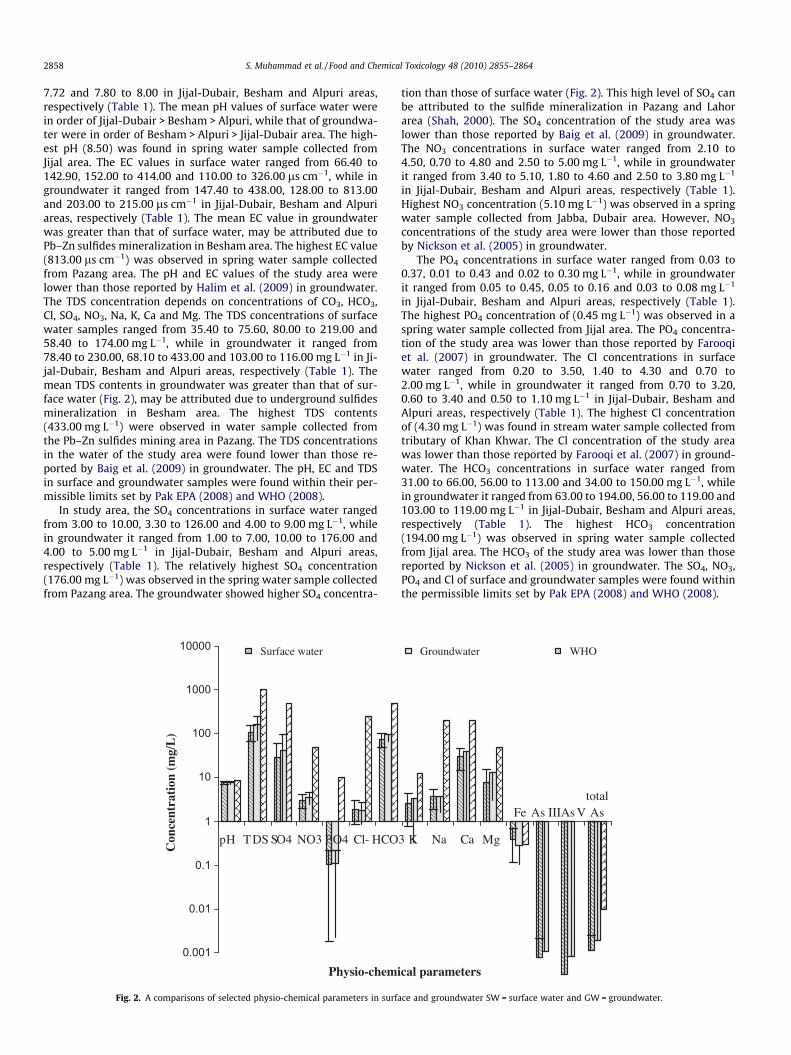
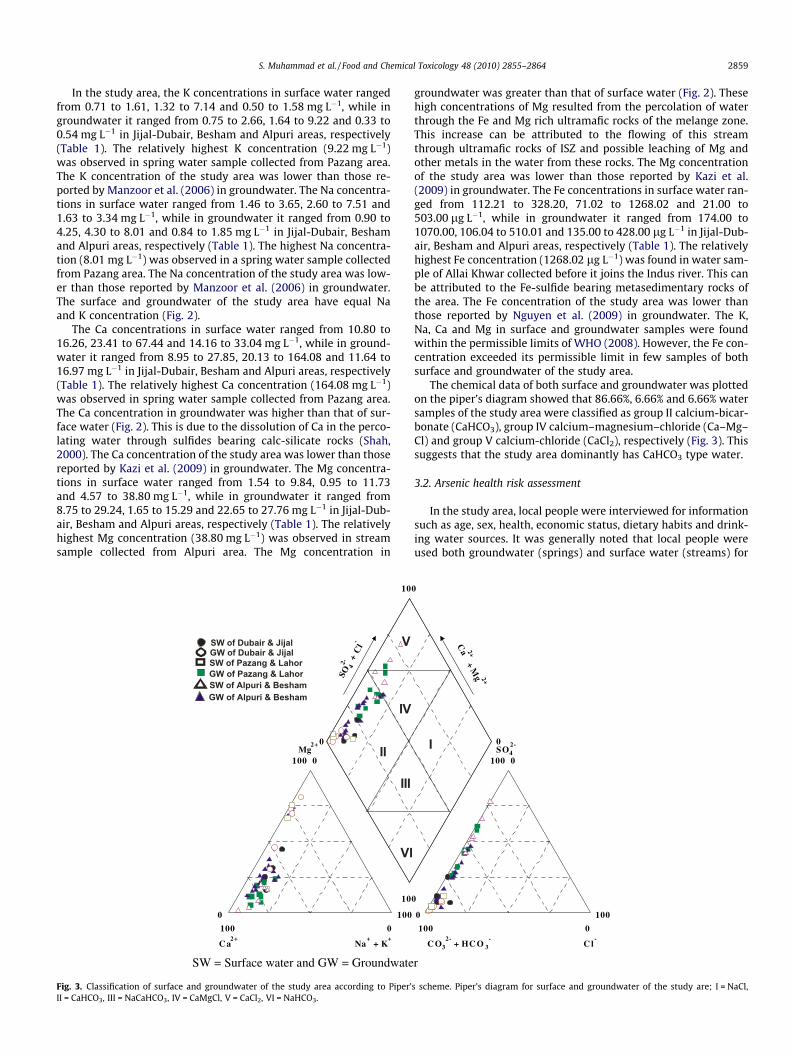
Fig. 3. Classification of surface and groundwater of the study area according to Piper’II = CaHCO3, III = NaCaHCO3, IV = CaMgCl, V = CaCl2, VI = NaHCO3.
groundwater was greater than that of surface water (Fig. 2). Thesehigh concentrations of Mg resulted from the percolation of waterthrough the Fe and Mg rich ultramafic rocks of the melange zone.This increase can be attributed to the flowing of this streamthrough ultramafic rocks of ISZ and possible leaching of Mg andother metals in the water from these rocks. The Mg concentrationof the study area was lower than those reported by Kazi et al.(2009) in groundwater. The Fe concentrations in surface water ran-ged from 112.21 to 328.20, 71.02 to 1268.02 and 21.00 to503.00 lg L�1, while in groundwater it ranged from 174.00 to1070.00, 106.04 to 510.01 and 135.00 to 428.00 lg L�1 in Jijal-Dub-air, Besham and Alpuri areas, respectively (Table 1). The relativelyhighest Fe concentration (1268.02 lg L�1) was found in water sam-ple of Allai Khwar collected before it joins the Indus river. This canbe attributed to the Fe-sulfide bearing metasedimentary rocks ofthe area. The Fe concentration of the study area was lower thanthose reported by Nguyen et al. (2009) in groundwater. The K,Na, Ca and Mg in surface and groundwater samples were foundwithin the permissible limits of WHO (2008). However, the Fe con-centration exceeded its permissible limit in few samples of bothsurface and groundwater of the study area.
The chemical data of both surface and groundwater was plottedon the piper’s diagram showed that 86.66%, 6.66% and 6.66% watersamples of the study area were classified as group II calcium-bicar-bonate (CaHCO3), group IV calcium–magnesium–chloride (Ca–Mg–Cl) and group V calcium-chloride (CaCl2), respectively (Fig. 3). Thissuggests that the study area dominantly has CaHCO3 type water.
3.2. Arsenic health risk assessment
In the study area, local people were interviewed for informationsuch as age, sex, health, economic status, dietary habits and drink-ing water sources. It was generally noted that local people wereused both groundwater (springs) and surface water (streams) for
C O32-
+ HC O 3-
SO42-
C l-
Ca 2+
+M
g 2+
100
0
0
100
100 0
0
0
0I
r
s scheme. Piper’s diagram for surface and groundwater of the study are; I = NaCl,
2860 S. Muhammad et al. / Food and Chemical Toxicology 48 (2010) 2855–2864
drinking and domestic purposes. The main reasons for using thesprings and streams water for drinking and domestic purposes inthe area were poverty, lack of awareness and having no other alter-natives. Therefore, for As risk assessment both the groundwaterand only those surface water streams that were used for drinkingpurpose were also considered in this study.
Table 2 summarizes As concentrations in drinking water of theJijal-Dubair, Besham and Alpuri areas. In Jijal-Dubair area, the As3+,As5+ and AsT (As3+ and As5+) concentrations in surface water rangedfrom <0.03, <0.03 and <0.03 to 0.48 lg L�1, while in groundwater itranged from 0.05 to 12.27, 0.01 to 4.42 and 0.13 to 16.69 lg L�1,respectively. Similarly, in Besham area the As3+, As5+ and AsT con-centrations in surface water ranged from <0.03 to 0.78, 0.04 to 0.85and 0.05 to 1.11 lg L�1, while in groundwater it ranged from <0.03to 0.11, 0.01 to 0.34 and <0.03 to 0.45 lg L�1, respectively. In Alpuriarea the As3+, As5+ and AsT concentrations in surface water rangedfrom <0.03 to 1.58, 0.00 to 0.44 and 0.98 to 2.02 lg L�1, while ingroundwater it ranged from <0.03 to 0.02, <0.01 and <0.03 to0.02 lg L�1, respectively. The highest As3+, As5+ and AsT concentra-tions were found in groundwater samples collected from Jabba,Dubair area (12.27, 4.42 and 16.69 lg L�1), respectively. In thestudy area, the AsT concentrations in surface and groundwatersamples were found within the limits set by WHO (2008) and byPak EPA (2008) except samples collected from spring water in Jab-ba, Dubair area. In the study area, the As concentrations in waterwere lower than those reported by Arain et al. (2009) in MancherLake water (35.00–157.00 lg L�1) and adjoining groundwater(23.30–96.30 lg L�1); Nickson et al. (2005) in Muzaffargarh Dis-trict surface and groundwater (1.00–905.00 lg L�1); Farooqi et al.(2007) in Lahore and Kasur District rain and groundwater(<10.00–1900.00 lg L�1); Baig et al. (2009) in Jamshoro surfaceand groundwater (3.00–106.00 lg L�1).
Table 2 also summarizes the calculated ADD values in the studyarea. The results suggest that in Jijal-Dubair area, where people
Table 2Arsenic concentrations in drinking water samples along with ADD, HQ and CR values of s
Jijal-Dubair
Surface watern = 8
Groundwatern = 10
As3+ concentration(lg L�1)
Range <0.03 0.05–12.27Mean <0.03 3.43Standarddeviation
<0.03 5.24
As5+ concentration(lg L�1)
Range <0.03 <0.01–4.42Mean <0.03 2.64Standarddeviation
<0.03 2.22
AsT concentration(lg L�1)
Range <0.03–0.48 0.13–16.69Mean 0.24 6.07Standarddeviation
0.34 6.23
ADD (mg kg�1 day�1) Range 0.00–1.33E�05 3.61E�06–4.64E�04
Mean 6.63E�06 1.69E�04Standarddeviation
9.37E�06 1.73E�04
HQ Range 0.00–0.04 0.01–1.55Mean 0.02 0.56Standarddeviation
0.03 0.58
CR Range 0.00–1.99E�05 5.42E�06–6.95E�04
Mean 9.94E�06 2.53E�04Standarddeviation
1.41E�05 2.60E�04
n means number of samples; AsT (arsenic total); detection limit = 0.03 ppb; ADD means
have consumed surface water contaminated with As, had ADD val-ues ranged from 0.00 to 1.33E�05 mg kg�1 day�1, while the peoplewho consumed groundwater, had ADD values ranged from3.61E�06 to 4.64E�04 mg kg�1 day�1. In Besham area, the peoplewho consumed surface water, the ADD values ranged from1.50E�06 to 3.09E�05 mg kg�1 day�1, while those people who con-sumed groundwater, had ADD values ranged from 5.28E�07 to1.24E�05 mg kg�1 day�1. Similarly, in Alpuri area, the people whoconsumed surface water, the ADD values ranged from 2.73E�05to 5.61E�05 mg kg�1 day�1, while those who consumed groundwa-ter, had ADD values ranged 5.50E�07–5.56E�07 mg kg�1 day�1. Inthe study area, the ADD values of As were lower than those reportedby Karim (2000) in Bangladesh drinking water (5.00E�02–5.00E�01 mg kg�1 day�1) and Nguyen et al. (2009) in Vietnamdrinking water (5.00E�03–4.39E�01 mg kg�1 day�1).
Table 2 shows the calculated HQ through consumption of Ascontamination of drinking water in the study area. In Jijal-Dubair,Besham and Alpuri the HQ values through consumption of surfacewater ranged from 0.00 to 0.04, 0.01 to 0.10, 0.09 to 0.19, while ingroundwater it ranged from 0.00 to 1.55, 0.00 to 0.04, less than 0.1,respectively. The highest HQ value (1.55) was found in springwater sample collected from Jabba, Dubair. About 14% of familiesin Jijal-Dubair area were using the spring water for drinking pur-pose and therefore, considered at low risk, when compared withUS EPA approach (1999). However, no risk was noticed for remain-ing 86% families of Jijal-Dubair and also for 100% families of Be-sham and Alpuri. In Jijal-Dubair the potential CR values forsurface water ranged from 0.00 to 1.99E�05 with mean values of9.94EE�06, while in groundwater CR ranged from 5.42E�06 to6.95E�04 with mean values of 2.53E�04. In Besham area, the po-tential CR values for surface water ranged from 2.25E�06 to4.63E�05, while for groundwater ranged from 5.28E�07 to1.24E�05. Similarly, in Alpuri area potential CR values for surfacewater ranged from 4.09E�05 to 8.41E�05 with mean values of
tudy area.
Besham Alpuri
Surface watern = 9
Groundwatern = 15
Surface watern = 8
Groundwatern = 12
<0.03–0.78 <0.03–0.11 <0.03–1.58 <0.030.46 0.06 0.79 0.010.30 0.04 0.79 0.01
0.04–0.85 0.01–0.34 0.00–0.44 <0.010.25 0.08 0.21 <0.010.26 0.12 0.22 <0.01
0.05–1.11 <0.03–0.45 0.98–2.02 <0.03–0.020.71 0.14 1.50 0.010.35 0.18 0.73 0.01
1.50E�06–3.09E�05
5.28E�07–1.24E�05
2.73E�05–5.61E�05
5.50E�07–5.56E�07
1.97E�05 3.75E�06 4.17E�05 5.53E�079.83E�06 4.91E�06 2.04E�05 4.24E�09
0.01–0.10 0.00–0.04 0.09–0.19 <0.010.07 0.01 0.14 BL0.03 0.02 0.07 BL
2.25E�06–4.63E�05
7.92E�07–1.86E�05
4.09E�05–8.41E�05
8.20E�07–8.33E�07
2.95E�05 5.63E�06 6.25E�05 8.27E�071.47E�05 7.36E�06 3.06E�05 9.19E�09
average daily dose; HQ means hazard quotient; CR means cancer risk.
S. Muhammad et al. / Food and Chemical Toxicology 48 (2010) 2855–2864 2861
6.25E�05, while for groundwater these values ranged from8.20E�07 to 8.33E�07 with mean value of 8.27E�07. The calcu-lated CR index values shows that cancer risk was in order of Jijal-Dubair > Besham area > Alpuri-area. The CR value greater thanone in a million (10�6) was generally considered significant byUS EPA. However, this standard may change according to the na-tional standards and environmental policies (US EPA, 2000;WHO, 2004). The results indicate that drinking water generallyhas very low CR values except for the 14% of families in Jijal-Dubairarea that showed medium risk, when compared with US EPA ap-proach (1999). The CR index of study area was lower than those re-ported by Karim (2000) and Nguyen et al. (2009) for drinking waterin Bangladesh and Vietnam, respectively. The results of water inBesham and Alpuri areas showed that water has low level of con-tamination and is safe for drinking and other domestic uses.
3.3. Statistical techniques
The statistical comparison of different sampling sites contami-nation using one-way ANOVA showed no statistical significant var-iation (p = 0.57) which showed that all these sampling sitescontribute equally to the mean contamination in surface andgroundwater (Table 3). The physio-chemical parameters correla-tion matrices in surface and groundwater are given in Tables 4and 5. In surface water the correlation matrices show that variousphysio-chemical parameters pairs have significant positive correla-tions such as TDS–EC (r = 1.000), TDS–SO4 (r = 0.724), TDS–HCO3
(r = 0.772), TDS–K (r = 0.723), TDS–Na (r = 0.595), TDS–Ca (r =0.704), EC–SO4 (r = 0.729), EC–HCO3 (r = 0.768), EC–K (r = 0.724),EC–Na (r = 0.602), EC–Ca (r = 0.700), SO4–K (r = 0.838), SO4–Na(r = 0.804), SO4–Ca (r = 0.620), Cl–Na (r = 0.588), HCO3–Ca
Table 3ANOVA for comparison of different site contamination load in surface andgroundwater.
Sources ofvariation
Sum ofsquares
df Meansquare
F p-value
Between groups 62855.97 5.00 12571.19 0.78 0.57Within groups 11029521.89 681.00 16196.07
Total 11092377.86 686.00
The mean difference is significant at a level of 0.05; df: degree of freedom; F: factor.
Table 4Correlation matrix of selected physio-chemical parameters of surface water in the study a
Paramètres pH TDS EC SO4 NO3 PO4 Cl H
pH 1.000TDS 0.263 1.000EC 0.256 1.000 1.000SO4 0.033 0.724 0.729 1.000NO3 �0.052 �0.317 �0.315 �0.460 1.000PO4 �0.235 0.110 0.129 0.154 �0.103 1.000Cl 0.041 0.430* 0.428 0.346 �0.24 0.212 1.000HCO3 0.411 0.772 0.768 0.286 �0.161 �0.036 0.254K 0.180 0.723 0.724 0.838 �0.490 0.059 0.446Na 0.018 0.595 0.602 0.804 �0.357 0.370 0.588Ca 0.191 0.704 0.700 0.620 �0.351 �0.087 0.434Mg 0.391 0.464 0.461 �0.082 �0.014 �0.031 �0.118Fe �0.095 �0.313 �0.312 �0.126 �0.041 0.063 �0.121 �As3+ �0.151 �0.508 �0.505 �0.314 0.023 0.139 0.021 �As5+ �0.074 �0.008 �0.003 0.261 �0.269 0.199 0.031 �AsT �0.149 �0.395 �0.391 �0.181 �0.046 0.184 0.075 �
Bold correlation is significant at the 0.05 level (2-tailed).Italic correlation is significant at the 0.01 level (2-tailed).n means number of samples.
(r = 0.549), HCO3–Mg (r = 0.731), K–Na (r = 0.660), K–Ca(r = 0.801), As3+–AsT (r = 0.965) and As5+–AsT (r = 0.515). Similarly,some pairs also show significant negative correlation such as Ca–As3+ (r = �0.602) and Ca–As total (r = �0.542). In groundwaterthe correlation matrices also show that various physio-chemicalparameters pairs have significant positive correlations such asTDS–EC (r = 1.000), TDS–SO4 (r = 0.810), TDS–K (r = 0.681), EC–SO4 (r = 0.808), EC–K (r = 0.681), SO4–K (r = 0.798), SO4–Na(r = 0.643), SO4–Ca (r = 0.629), PO4–HCO3 (r = 0.667), PO4–AsV(r = 0.781), K–Na (r = 0.798), K–Ca (r = 0.884), Na–Ca (r = 0.606),As3+–AsT (r = 0.942) and As5+–AsT (r = 0.763). Similarly some pairsalso showed significant negative correlation such as pH–SO4
(r = �0.647), pH–Ca (r = �0.755), K–Mg (r = �.630), Na–Mg(r = �0.738). The co-relation of physio-chemical parameters in sur-face and groundwater was further supported by the linear regres-sion analysis as summarized in the Table 6. The linear regressionpairs that support physio-chemical parameters correlation in sur-face water and groundwater were TDS–EC, TDS–Ca, EC–SO4, EC–Ca, SO4–NO3, SO4–As3+, NO3–K, Cl–Na, HCO3–Mg, Na–Ca, Ca–As3+,As3+–AsT and As5+–AsT. The co-relationship of physio-chemicalparameters was supplementary supported by dendrogram of CAin both surface and groundwater (Figs. 4 and 5). The clusteringbehavior of surface water figure showed that there is one largeand one small cluster while groundwater have two broad clustersof physio-chemical parameters. As noted from the correlation thatsome these have strong correlation and to which they form pri-mary cluster pairs. The primary clusters were found betweenTDS–EC and As3+–AsT in both surface and groundwater. The quali-tative information about clustering behaviors was extracted fromPCA.
For qualitative evaluation the PCA with varimax normalization(PCA-V) was applied and the results for surface water the resultsare given in the Table 7. The PCA results indicated their associationand grouping with four factors in surface water having a total var-iance 84.490%. Factor-1 contributed 43.396% to the total variancewith a high loading on TDS (r = 0.942), EC (r = 0.940), SO4
(r = 0.899), K (r = 0.826) and Ca (r = 0.706). The sources of TDS,EC, SO4, K and Ca could be the weathering of the sulfides bearingcalc-silicate and acidic rocks suggesting that factor-1 has geogenicsources. Factor-2 contributed 18.274% to the total variance with ahigh loading on pH (r = 0.526), PO4 (r = 0.885), HCO3 (r = 0.871), Mg(r = 0.942), Fe (r = 0.540) and As5+ (r = 0.688). The pH, PO4, HCO3,
Mg, Fe and As5+ level could have been influenced by weathering
rea (n = 48).
CO3 K Na Ca Mg Fe As(III)
As(V)
AsT
1.0000.396 1.0000.200 0.660 1.0000.549 0.801 0.402 1.0000.731 �0.071 �0.116 0.019 1.0000.251 �0.269 �0.107 �0.066 �0.260 1.0000.467 �0.476 �0.224 �0.602 �0.059 0.084 1.0000.243 �0.025 0.493 �0.255 �0.040 0.212 0.271 1.0000.402 �0.399 �0.039 �0.542 �0.053 0.131 0.965 0.515 1.000
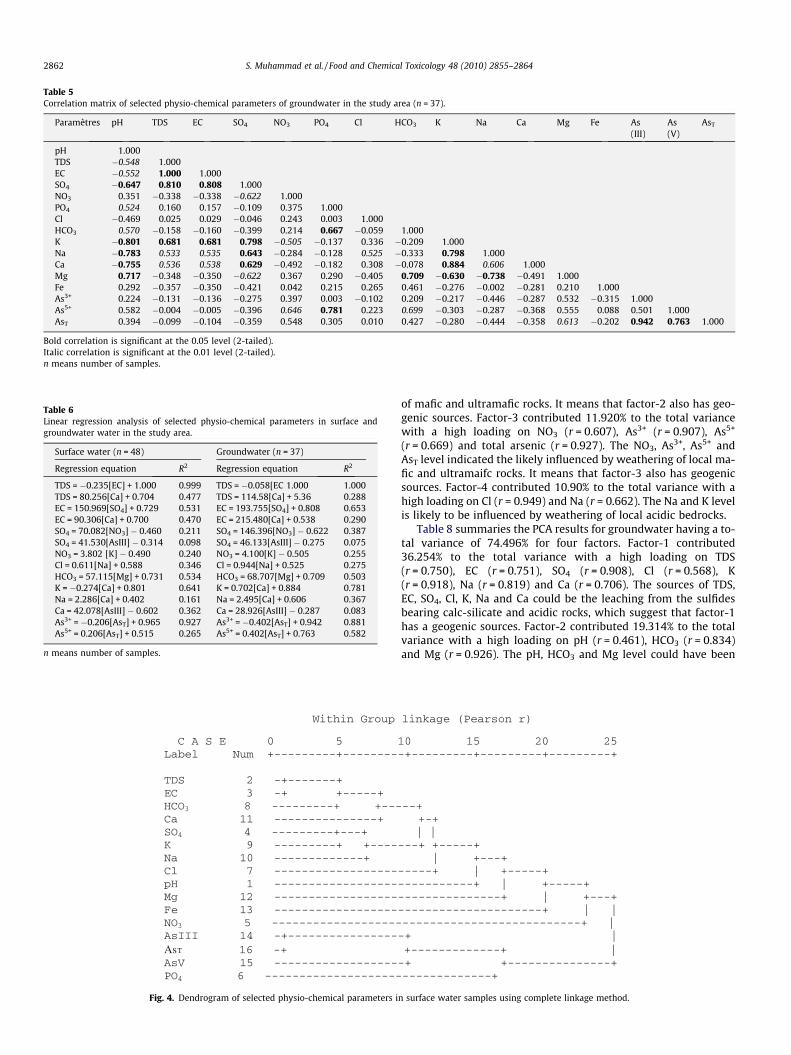
Table 5Correlation matrix of selected physio-chemical parameters of groundwater in the study area (n = 37).
Paramètres pH TDS EC SO4 NO3 PO4 Cl HCO3 K Na Ca Mg Fe As(III)
As(V)
AsT
pH 1.000TDS �0.548 1.000EC �0.552 1.000 1.000SO4 �0.647 0.810 0.808 1.000NO3 0.351 �0.338 �0.338 �0.622 1.000PO4 0.524 0.160 0.157 �0.109 0.375 1.000Cl �0.469 0.025 0.029 �0.046 0.243 0.003 1.000HCO3 0.570 �0.158 �0.160 �0.399 0.214 0.667 �0.059 1.000K �0.801 0.681 0.681 0.798 �0.505 �0.137 0.336 �0.209 1.000Na �0.783 0.533 0.535 0.643 �0.284 �0.128 0.525 �0.333 0.798 1.000Ca �0.755 0.536 0.538 0.629 �0.492 �0.182 0.308 �0.078 0.884 0.606 1.000Mg 0.717 �0.348 �0.350 �0.622 0.367 0.290 �0.405 0.709 �0.630 �0.738 �0.491 1.000Fe 0.292 �0.357 �0.350 �0.421 0.042 0.215 0.265 0.461 �0.276 �0.002 �0.281 0.210 1.000As3+ 0.224 �0.131 �0.136 �0.275 0.397 0.003 �0.102 0.209 �0.217 �0.446 �0.287 0.532 �0.315 1.000As5+ 0.582 �0.004 �0.005 �0.396 0.646 0.781 0.223 0.699 �0.303 �0.287 �0.368 0.555 0.088 0.501 1.000AsT 0.394 �0.099 �0.104 �0.359 0.548 0.305 0.010 0.427 �0.280 �0.444 �0.358 0.613 �0.202 0.942 0.763 1.000
Bold correlation is significant at the 0.05 level (2-tailed).Italic correlation is significant at the 0.01 level (2-tailed).n means number of samples.
Table 6Linear regression analysis of selected physio-chemical parameters in surface andgroundwater water in the study area.
Surface water (n = 48) Groundwater (n = 37)
Regression equation R2 Regression equation R2
TDS = �0.235[EC] + 1.000 0.999 TDS = �0.058[EC 1.000 1.000TDS = 80.256[Ca] + 0.704 0.477 TDS = 114.58[Ca] + 5.36 0.288EC = 150.969[SO4] + 0.729 0.531 EC = 193.755[SO4] + 0.808 0.653EC = 90.306[Ca] + 0.700 0.470 EC = 215.480[Ca] + 0.538 0.290SO4 = 70.082[NO3] � 0.460 0.211 SO4 = 146.396[NO3] � 0.622 0.387SO4 = 41.530[AsIII] � 0.314 0.098 SO4 = 46.133[AsIII] � 0.275 0.075NO3 = 3.802 [K] � 0.490 0.240 NO3 = 4.100[K] � 0.505 0.255Cl = 0.611[Na] + 0.588 0.346 Cl = 0.944[Na] + 0.525 0.275HCO3 = 57.115[Mg] + 0.731 0.534 HCO3 = 68.707[Mg] + 0.709 0.503K = �0.274[Ca] + 0.801 0.641 K = 0.702[Ca] + 0.884 0.781Na = 2.286[Ca] + 0.402 0.161 Na = 2.495[Ca] + 0.606 0.367Ca = 42.078[AsIII] � 0.602 0.362 Ca = 28.926[AsIII] � 0.287 0.083As3+ = �0.206[AsT] + 0.965 0.927 As3+ = �0.402[AsT] + 0.942 0.881As5+ = 0.206[AsT] + 0.515 0.265 As5+ = 0.402[AsT] + 0.763 0.582
n means number of samples.
Fig. 4. Dendrogram of selected physio-chemical parameters i
2862 S. Muhammad et al. / Food and Chemical Toxicology 48 (2010) 2855–2864
of mafic and ultramafic rocks. It means that factor-2 also has geo-genic sources. Factor-3 contributed 11.920% to the total variancewith a high loading on NO3 (r = 0.607), As3+ (r = 0.907), As5+
(r = 0.669) and total arsenic (r = 0.927). The NO3, As3+, As5+ andAsT level indicated the likely influenced by weathering of local ma-fic and ultramaifc rocks. It means that factor-3 also has geogenicsources. Factor-4 contributed 10.90% to the total variance with ahigh loading on Cl (r = 0.949) and Na (r = 0.662). The Na and K levelis likely to be influenced by weathering of local acidic bedrocks.
Table 8 summaries the PCA results for groundwater having a to-tal variance of 74.496% for four factors. Factor-1 contributed36.254% to the total variance with a high loading on TDS(r = 0.750), EC (r = 0.751), SO4 (r = 0.908), Cl (r = 0.568), K(r = 0.918), Na (r = 0.819) and Ca (r = 0.706). The sources of TDS,EC, SO4, Cl, K, Na and Ca could be the leaching from the sulfidesbearing calc-silicate and acidic rocks, which suggest that factor-1has a geogenic sources. Factor-2 contributed 19.314% to the totalvariance with a high loading on pH (r = 0.461), HCO3 (r = 0.834)and Mg (r = 0.926). The pH, HCO3 and Mg level could have been
n surface water samples using complete linkage method.
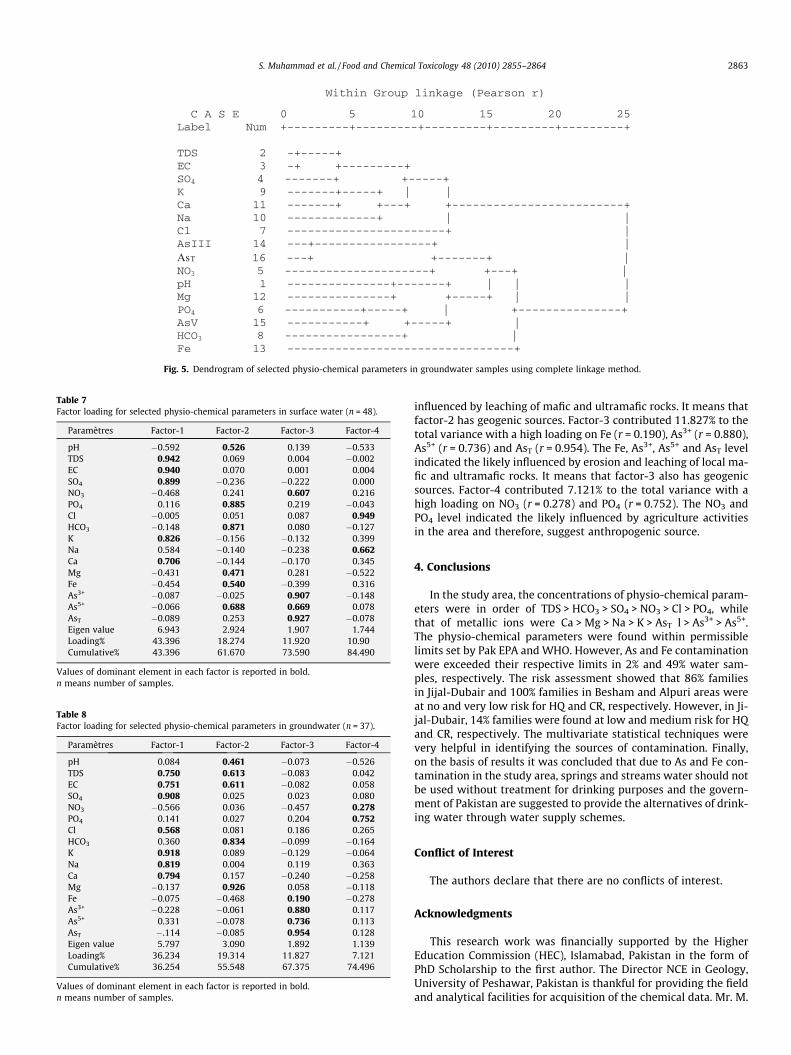
Fig. 5. Dendrogram of selected physio-chemical parameters in groundwater samples using complete linkage method.
Table 7Factor loading for selected physio-chemical parameters in surface water (n = 48).
Paramètres Factor-1 Factor-2 Factor-3 Factor-4
pH �0.592 0.526 0.139 �0.533TDS 0.942 0.069 0.004 �0.002EC 0.940 0.070 0.001 0.004SO4 0.899 �0.236 �0.222 0.000NO3 �0.468 0.241 0.607 0.216PO4 0.116 0.885 0.219 �0.043Cl �0.005 0.051 0.087 0.949HCO3 �0.148 0.871 0.080 �0.127K 0.826 �0.156 �0.132 0.399Na 0.584 �0.140 �0.238 0.662Ca 0.706 �0.144 �0.170 0.345Mg �0.431 0.471 0.281 �0.522Fe �0.454 0.540 �0.399 0.316As3+ �0.087 �0.025 0.907 �0.148As5+ �0.066 0.688 0.669 0.078AsT �0.089 0.253 0.927 �0.078Eigen value 6.943 2.924 1.907 1.744Loading% 43.396 18.274 11.920 10.90Cumulative% 43.396 61.670 73.590 84.490
Values of dominant element in each factor is reported in bold.n means number of samples.
Table 8Factor loading for selected physio-chemical parameters in groundwater (n = 37).
Paramètres Factor-1 Factor-2 Factor-3 Factor-4
pH 0.084 0.461 �0.073 �0.526TDS 0.750 0.613 �0.083 0.042EC 0.751 0.611 �0.082 0.058SO4 0.908 0.025 0.023 0.080NO3 �0.566 0.036 �0.457 0.278PO4 0.141 0.027 0.204 0.752Cl 0.568 0.081 0.186 0.265HCO3 0.360 0.834 �0.099 �0.164K 0.918 0.089 �0.129 �0.064Na 0.819 0.004 0.119 0.363Ca 0.794 0.157 �0.240 �0.258Mg �0.137 0.926 0.058 �0.118Fe �0.075 �0.468 0.190 �0.278As3+ �0.228 �0.061 0.880 0.117As5+ 0.331 �0.078 0.736 0.113AsT �.114 �0.085 0.954 0.128Eigen value 5.797 3.090 1.892 1.139Loading% 36.234 19.314 11.827 7.121Cumulative% 36.254 55.548 67.375 74.496
Values of dominant element in each factor is reported in bold.n means number of samples.
S. Muhammad et al. / Food and Chemical Toxicology 48 (2010) 2855–2864 2863
influenced by leaching of mafic and ultramafic rocks. It means thatfactor-2 has geogenic sources. Factor-3 contributed 11.827% to thetotal variance with a high loading on Fe (r = 0.190), As3+ (r = 0.880),As5+ (r = 0.736) and AsT (r = 0.954). The Fe, As3+, As5+ and AsT levelindicated the likely influenced by erosion and leaching of local ma-fic and ultramafic rocks. It means that factor-3 also has geogenicsources. Factor-4 contributed 7.121% to the total variance with ahigh loading on NO3 (r = 0.278) and PO4 (r = 0.752). The NO3 andPO4 level indicated the likely influenced by agriculture activitiesin the area and therefore, suggest anthropogenic source.
4. Conclusions
In the study area, the concentrations of physio-chemical param-eters were in order of TDS > HCO3 > SO4 > NO3 > Cl > PO4, whilethat of metallic ions were Ca > Mg > Na > K > AsT l > As3+ > As5+.The physio-chemical parameters were found within permissiblelimits set by Pak EPA and WHO. However, As and Fe contaminationwere exceeded their respective limits in 2% and 49% water sam-ples, respectively. The risk assessment showed that 86% familiesin Jijal-Dubair and 100% families in Besham and Alpuri areas wereat no and very low risk for HQ and CR, respectively. However, in Ji-jal-Dubair, 14% families were found at low and medium risk for HQand CR, respectively. The multivariate statistical techniques werevery helpful in identifying the sources of contamination. Finally,on the basis of results it was concluded that due to As and Fe con-tamination in the study area, springs and streams water should notbe used without treatment for drinking purposes and the govern-ment of Pakistan are suggested to provide the alternatives of drink-ing water through water supply schemes.
Conflict of Interest
The authors declare that there are no conflicts of interest.
Acknowledgments
This research work was financially supported by the HigherEducation Commission (HEC), Islamabad, Pakistan in the form ofPhD Scholarship to the first author. The Director NCE in Geology,University of Peshawar, Pakistan is thankful for providing the fieldand analytical facilities for acquisition of the chemical data. Mr. M.
2864 S. Muhammad et al. / Food and Chemical Toxicology 48 (2010) 2855–2864
Tariq Khan (Lab. Technician) is highly acknowledged for help dur-ing chemical analysis.
References
Arain, M.B., Kazi, T.G., Baig, J.A., Jamali, M.K., Afridi, H.I., Shah, A.Q., Jalbani, N.,Sarfraz, R.A., 2009. Determination of arsenic levels in lake water, sediment, andfoodstuff from selected area of Sindh, Pakistan: estimation of daily dietaryintake. Food Chem. Toxicol. 47, 242–248.
Arain, M.B., Kazi, T.G., Jamali, M.K., Jalbani, N., Afridi, H.I., Kandhro, G.A., Ansari, R.,Sarfraz, R.A., 2008. Hazardous impact of toxic metals on tobacco leaves grown incontaminated soil by ultrasonic assisted pseudo digestion; multivariate study. J.Hazard. Mater. 155, 216–224.
Ashraf, M., Hussian, S.S., 1982. Chromite occurrence in Indus suture ophiolite of Jijal,Kohistan Pakistan. In: Sinha, K.A. (Ed.), Contemporary Geoscientific Researchesin Himalaya, Dehra Dun, India, pp. 129–131.
ATSDR, 2000. Toxicological Profile for Arsenic. US Department of Health and HumanServices, Atlanta, Georgia.
Baig, J.A., Kazi, T.G., Arain, M.B., Afridi, H.I., Kandhro, G.A., Sarfraz, R.A., Jamal, M.K.,Shah, A.Q., 2009. Evaluation of arsenic and other physico-chemical parametersof surface and groundwater of Jamshoro, Pakistan. J. Hazard. Mater. 166, 662–669.
Devesa, V., Velez, D., Montoro, R., 2008. Effect of thermal treatments on arsenicspecies contents in food. Food Chem. Toxicol. 46, 1–8.
Dipietro, J.A., Pogue, K.R., Lawrence, R.D., Baig, M.S., Hussain, A., Ahmad, I., 1993.Stratigraphy south of the main mantle thrust, lower Swat, Pakistan. In: Treloar,P.J., Searle, M.P. (Eds.), Himalayan Tectonics. Geol. Soc. Lond. 45, pp. 207–220.
District Census Report of Kohistan (DCR) 1998a. Population Census Organization,Statistic Division, Ministry of Economic Affairs and Statistic Government ofPakistan, pp. 1–17.
District Census Report of Shangla (DCR) 1998b. Population Census Organization,Statistic Division, Ministry of Economic Affairs and Statistic, Government ofPakistan, pp. 1–17.
Farooqi, A., Masuda, H., Firdous, N., 2007. Toxic fluoride and arsenic contaminatedgroundwater in the Lahore and Kasur districts, Punjab, Pakistan and possiblecontaminant sources. Environ. Pollut. 145, 839–849.
Fatmi, Z., Azam, I., Ahmed, F., Kazi, A., Gill, A.B., Kadir, M.M., Ahmed, M., Ara, N.,Janjua, N.Z., Panhwar, S.A., Tahir, A., Ahmed, T., Dil, A., Habaz, A., Ahmed, S.,2009. Health burden of skin lesions at low arsenic exposure throughgroundwater in Pakistan, is river the source? Environ. Res. 109, 575–581.
Fletcher, C.J.N., Leake, R.C., Haslam, H.W., 1986. Tectonic setting, mineralogy andchemistry of a metamorphose stratiform base metal deposit within theHimalayas of Pakistan. Geol. Soc. Lond. 143, 521–536.
Fu, P.P., Cheng, S.H., Coop, L., Xia, Q., Culp, S.J., Tolleson, W.H., Wamer, W.G., Howard,P.C., 2003. Photoreaction, phototoxicity, and photocarcinogenicity of retinoids.J. Environ. Sci. Health C 21, 165–197.
Goldhaber, S.B., 2003. Trace elements risk assessments: essentiality vs. toxicity.Regul. Toxicol. Pharm. 38, 232–242.
Gupta, A., Chauhan, V.S., Sankararamakrishnan, N., 2009. Preparation andevaluation of iron–chitosan composites for removal of As(III) and As(V) fromarsenic contaminated real life groundwater. Water Res. 43, 3862–3870.
Halim, M.A., Majunder, R.K., Nessa, S.A., Oda, K., Hiroshiro, K., Saha, B.B., Hussain,S.M., Latif, S.A., Islam, M.A., Jinno, K., 2009. Groundwater contamination witharsenic in Sherajdikhan, Bangladesh: geochemical and hydrologicalimplications. Environ. Geol. 58, 73–84.
Hall, G.E.M., Pelachat, J.C., Gautier, G., 1999. Stability of inorganic arsenic (III) andarsenic (V) in water samples. J. Anal. Atomic Spectrom. 14, 205–213.
International Agency for Research on Cancer (IARC), 2004. IARC Monographs on theEvaluation of Carcinogenic Risk to Human. Some Drinking-water Disinfectantsand Contaminants, Including arsenic, Lyons, France, vol. 84, pp. 39–270.
Jonnalagadda, S.B., Mhere, G., 2001. Water quality of the Odzi River in easternhighlands of Zimbabwe. Water Res. 35, 2371–2376.
Josef, G., Thundiyil, Y., Smith, A.H., Steinmaus, C., 2007. Seasonal variation of arsenicconcentration in wells in Nevada. Environ. Res. 104, 367–373.
Karim, M.M.D., 2000. Arsenic in groundwater and health problems in Bangladesh.Water Res. 34, 304–310.
Kavcar, P., Sofuoglu, A., Sofuoglu, S.C., 2009. A health risk assessment for exposureto trace metals via drinking water ingestion pathway. Int. J. Hyg. Environ.Health 212, 216–227.
Kazi, T.G., Arain, M.B., Jamali, M.K., Jalbani, N., Afridi, H.I., Sarfraz, R.A., Baig, J.A.,Shah, A.Q., 2009. Assessment of water quality of polluted lake using
multivariate statistical techniques: a case study. Ecotox. Environ. Safety 72,301–309.
Khan, S., Cao, Q., Zheng, Y.M., Huang, Y.Z., Zhu, Y.G., 2008. Health risk of heavymetals in contaminated soils and food crops irrigated with wastewater inBeijing China. Environ. Pollut. 152, 686–692.
Latorre, R.E., Toro, L., 1997. Balls, chains and potassium channels. In: Sotelo, J.R.,Benech, J.C. (Eds.), Calcium and Cellular Metabolism: Transport and Regulation.Plenum Press, New York, pp. 59–71.
Leeuwen, F.X.R.V., 2000. Safe drinking water; the toxicologist’s approach. FoodChem. Toxicol. 38, 51–58.
Lim, M.S., Yeo, I.W., Clement, T.P., Roh, Y., Lee, K.K., 2007. Mathematical model forpredicting microbial reduction and transport of arsenic in groundwater system.Water Res. 41, 2079–2088.
Manzoor, S., Shah, M.H., Shaheen, N., Khalique, A., Jaffar, M., 2006. Multivariateanalysis of trace metals in effluents from textile industry in relation to soil andground water. J. Hazard. Mater. 137, 31–37.
Marijic, J., Toro, L., 2000. Voltage and calcium-activated K channels of coronarysmooth muscle. In: Sperelakis, N., Kurachi, Y., Terzic, A., Cohen, M. (Eds.), HeartPhysiology and Pathophysiology. Academic Press, pp. 309–325.
Miller, D.J., Loucks, R.R., Ashraf, M., 1991. Platinum-group element mineralization inthe Jijal layered ultramafic-mafic complex, Pakistani Himalayas. Econ. Geol. 86,1093–1102.
Nguyen, V.A., Bang, S., Viet, P.H., Kim, K.W., 2009. Contamination of groundwaterand risk assessment for arsenic exposure in Ha Nam province, Vietnam.Environ. Int. 35, 466–472.
Nickson, R.T., McArthur, J.M., Shrestha, B., Kyaw-Mynt, T.O., Lowery, D., 2005.Arsenic and other drinking water quality issues, Muzaffargarh district, Pakistan.Appl. Geochem. 20, 55–68.
Pak EPA, 2008. National Standards for Drinking Water Quality, PakistanEnvironmental Protection Agency, (Ministry of Environment) Government ofPakistan.
Pizarro, I., Gomez, M., Camara, C., Palacios, M.A., 2003. Arsenic speciation inenvironmental and biological samples extraction and stability studies. Anal.Chim. Acta 495, 85–98.
Rahman, M.A., Hasegawa, H., Rahman, M.M., Miah, M.A.M., Tasmin, A., 2008. Arsenicaccumulation in rice (Oryza sativa L. human exposure through food chain.Ecotox. Environ. Safety 69, 317–324.
Rahman, M.M., Naidu, R., Bhattacharya, P., 2009. Arsenic contamination ingroundwater in the Southeast Asia region. Environ. Geochem. Health 31, 9–21.
Robert, G., Mari, G., 2003. Issue Paper on Human Health Effects of Metals. USEnvironmental Protection Agency Risk Assessment Forum, Washington, DC.
Shah, M.T., 2000. Mineralogy, chemistry and genesis of the proterozoic base metalsdeposits at the northern margin of Indian plate, in the Besham area Himalaya,northern Pakistan. In: Hussian, S.S., Akbar, H.M. (Eds.), Economic Geology ofPakistan, pp. 11–57.
Srivastava, M.L., 2004. Environmental Chemistry. 81-88658-11-1. Shree Publisherand Distributor; New Delhi, pp. 119–120.
US Environmental Protection Agency (US EPA), 1977. Toxicology of metals,Environmental Health Effects Research Series, vol. II, Washington, DC, EPA/600/1-77-022.
US Environmental Protection Agency (US EPA), 1998. Arsenic, Inorganic. UnitedStates Environmental Protection Agency, Integrated Risk Information System(IRIS), (CASRN 7440-38-2). <http://www.epa.gov/iris/subst/0278.htm>.
US Environmental Protection Agency (US EPA), 1999. A Risk Assessment – MultiwayExposure Spreadsheet Calculation Tool. United States Environmental ProtectionAgency, Washington, DC.
US Environmental Protection Agency (US EPA), 2000. Water Quality Standards,Establishment of Numeric Criteria for Priority Toxic Pollutants for the State ofCalifornia.
US Environmental Protection Agency (US EPA), 2005. Guidelines for Carcinogen RiskAssessment. Risk Assessment Forum, Washington, DC, EPA/630/P-03/001F.
Welz, B.M., Šucmanová, M., 1993. Analyst London 118/11, pp 1417–1423.World Health Organization (WHO), 2004. Guidelines for Drinking Water Quality,
second ed., Geneva.World Health Organization (WHO), 2008. Guidelines for drinking water quality. In:
Recommendations, 3rd ed., vol. 1, Geneva.Xie, X., Wang, Y., Duan, M., Xie, Z., 2009. Geochemical and environmental magnetic
characteristic of high arsenic aquifer sediments from Datong Basin, northernChina. Environ. Geol. 58, 45–52.
Yang, C.Y., Chang, C.C., Tsai, S.S., Chiu, H.F., 2006. Calcium and magnesium indrinking water and risk of death from acute myocardial infarction in Taiwan.Environ. Res. 101, 407–411.