Plasticity in above- and belowground resource acquisition traits in response to single and multiple...
16
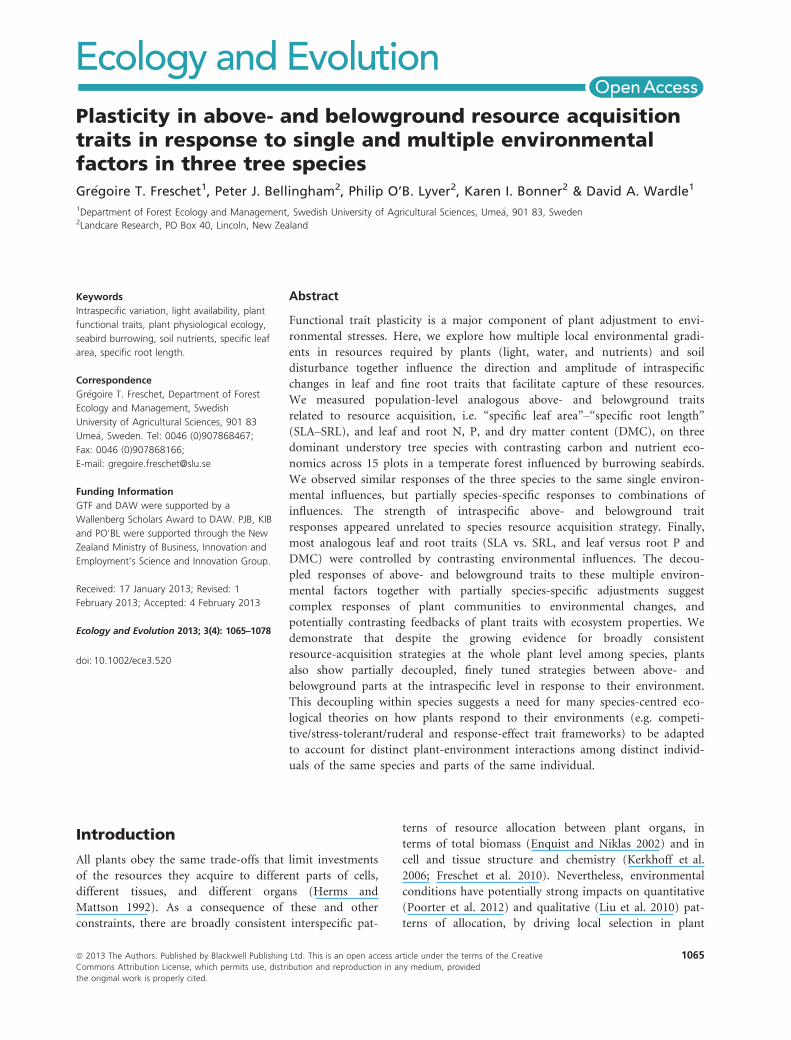
Plasticity in above- and belowground resource acquisition traits in response to single and multiple environmental factors in three tree species Gr egoire T. Freschet 1 , Peter J. Bellingham 2 , Philip O’B. Lyver 2 , Karen I. Bonner 2 & David A. Wardle 1 1 Department of Forest Ecology and Management, Swedish University of Agricultural Sciences, Ume a, 901 83, Sweden 2 Landcare Research, PO Box 40, Lincoln, New Zealand Keywords Intraspecific variation, light availability, plant functional traits, plant physiological ecology, seabird burrowing, soil nutrients, specific leaf area, specific root length. Correspondence Gr egoire T. Freschet, Department of Forest Ecology and Management, Swedish University of Agricultural Sciences, 901 83 Ume a, Sweden. Tel: 0046 (0)907868467; Fax: 0046 (0)907868166; E-mail: [email protected] Funding Information GTF and DAW were supported by a Wallenberg Scholars Award to DAW. PJB, KIB and PO’BL were supported through the New Zealand Ministry of Business, Innovation and Employment’s Science and Innovation Group. Received: 17 January 2013; Revised: 1 February 2013; Accepted: 4 February 2013 Ecology and Evolution 2013; 3(4): 1065–1078 doi: 10.1002/ece3.520 Abstract Functional trait plasticity is a major component of plant adjustment to envi- ronmental stresses. Here, we explore how multiple local environmental gradi- ents in resources required by plants (light, water, and nutrients) and soil disturbance together influence the direction and amplitude of intraspecific changes in leaf and fine root traits that facilitate capture of these resources. We measured population-level analogous above- and belowground traits related to resource acquisition, i.e. “specific leaf area”–“specific root length” (SLA–SRL), and leaf and root N, P, and dry matter content (DMC), on three dominant understory tree species with contrasting carbon and nutrient eco- nomics across 15 plots in a temperate forest influenced by burrowing seabirds. We observed similar responses of the three species to the same single environ- mental influences, but partially species-specific responses to combinations of influences. The strength of intraspecific above- and belowground trait responses appeared unrelated to species resource acquisition strategy. Finally, most analogous leaf and root traits (SLA vs. SRL, and leaf versus root P and DMC) were controlled by contrasting environmental influences. The decou- pled responses of above- and belowground traits to these multiple environ- mental factors together with partially species-specific adjustments suggest complex responses of plant communities to environmental changes, and potentially contrasting feedbacks of plant traits with ecosystem properties. We demonstrate that despite the growing evidence for broadly consistent resource-acquisition strategies at the whole plant level among species, plants also show partially decoupled, finely tuned strategies between above- and belowground parts at the intraspecific level in response to their environment. This decoupling within species suggests a need for many species-centred eco- logical theories on how plants respond to their environments (e.g. competi- tive/stress-tolerant/ruderal and response-effect trait frameworks) to be adapted to account for distinct plant-environment interactions among distinct individ- uals of the same species and parts of the same individual. Introduction All plants obey the same trade-offs that limit investments of the resources they acquire to different parts of cells, different tissues, and different organs (Herms and Mattson 1992). As a consequence of these and other constraints, there are broadly consistent interspecific pat- terns of resource allocation between plant organs, in terms of total biomass (Enquist and Niklas 2002) and in cell and tissue structure and chemistry (Kerkhoff et al. 2006; Freschet et al. 2010). Nevertheless, environmental conditions have potentially strong impacts on quantitative (Poorter et al. 2012) and qualitative (Liu et al. 2010) pat- terns of allocation, by driving local selection in plant ª 2013 The Authors. Published by Blackwell Publishing Ltd. This is an open access article under the terms of the Creative Commons Attribution License, which permits use, distribution and reproduction in any medium, provided the original work is properly cited. 1065
-
Upload
independent -
Category
Documents
-
view
2 -
download
0
Transcript of Plasticity in above- and belowground resource acquisition traits in response to single and multiple...
Plasticity in above- and belowground resource acquisitiontraits in response to single and multiple environmentalfactors in three tree speciesGr�egoire T. Freschet1, Peter J. Bellingham2, Philip O’B. Lyver2, Karen I. Bonner2 & David A. Wardle1
1Department of Forest Ecology and Management, Swedish University of Agricultural Sciences, Ume�a, 901 83, Sweden2Landcare Research, PO Box 40, Lincoln, New Zealand
Keywords
Intraspecific variation, light availability, plant
functional traits, plant physiological ecology,
seabird burrowing, soil nutrients, specific leaf
area, specific root length.
Correspondence
Gr�egoire T. Freschet, Department of Forest
Ecology and Management, Swedish
University of Agricultural Sciences, 901 83
Ume�a, Sweden. Tel: 0046 (0)907868467;
Fax: 0046 (0)907868166;
E-mail: [email protected]
Funding Information
GTF and DAW were supported by a
Wallenberg Scholars Award to DAW. PJB, KIB
and PO’BL were supported through the New
Zealand Ministry of Business, Innovation and
Employment’s Science and Innovation Group.
Received: 17 January 2013; Revised: 1
February 2013; Accepted: 4 February 2013
Ecology and Evolution 2013; 3(4): 1065–1078
doi: 10.1002/ece3.520
Abstract
Functional trait plasticity is a major component of plant adjustment to envi-
ronmental stresses. Here, we explore how multiple local environmental gradi-
ents in resources required by plants (light, water, and nutrients) and soil
disturbance together influence the direction and amplitude of intraspecific
changes in leaf and fine root traits that facilitate capture of these resources.
We measured population-level analogous above- and belowground traits
related to resource acquisition, i.e. “specific leaf area”–“specific root length”
(SLA–SRL), and leaf and root N, P, and dry matter content (DMC), on three
dominant understory tree species with contrasting carbon and nutrient eco-
nomics across 15 plots in a temperate forest influenced by burrowing seabirds.
We observed similar responses of the three species to the same single environ-
mental influences, but partially species-specific responses to combinations of
influences. The strength of intraspecific above- and belowground trait
responses appeared unrelated to species resource acquisition strategy. Finally,
most analogous leaf and root traits (SLA vs. SRL, and leaf versus root P and
DMC) were controlled by contrasting environmental influences. The decou-
pled responses of above- and belowground traits to these multiple environ-
mental factors together with partially species-specific adjustments suggest
complex responses of plant communities to environmental changes, and
potentially contrasting feedbacks of plant traits with ecosystem properties. We
demonstrate that despite the growing evidence for broadly consistent
resource-acquisition strategies at the whole plant level among species, plants
also show partially decoupled, finely tuned strategies between above- and
belowground parts at the intraspecific level in response to their environment.
This decoupling within species suggests a need for many species-centred eco-
logical theories on how plants respond to their environments (e.g. competi-
tive/stress-tolerant/ruderal and response-effect trait frameworks) to be adapted
to account for distinct plant-environment interactions among distinct individ-
uals of the same species and parts of the same individual.
Introduction
All plants obey the same trade-offs that limit investments
of the resources they acquire to different parts of cells,
different tissues, and different organs (Herms and
Mattson 1992). As a consequence of these and other
constraints, there are broadly consistent interspecific pat-
terns of resource allocation between plant organs, in
terms of total biomass (Enquist and Niklas 2002) and in
cell and tissue structure and chemistry (Kerkhoff et al.
2006; Freschet et al. 2010). Nevertheless, environmental
conditions have potentially strong impacts on quantitative
(Poorter et al. 2012) and qualitative (Liu et al. 2010) pat-
terns of allocation, by driving local selection in plant
ª 2013 The Authors. Published by Blackwell Publishing Ltd. This is an open access article under the terms of the Creative
Commons Attribution License, which permits use, distribution and reproduction in any medium, provided
the original work is properly cited.
1065

genotypes and adjustments through plant phenotypic
plasticity. At the species level, the relative availability of
different resources can trigger adaptive and non-adaptive
physiological changes in plants, which can mitigate the
constraints imposed by the most limiting resources (Cha-
pin et al. 1987; Van Kleunen and Fischer 2005; Valladares
et al. 2007). Plants can therefore adjust biomass allocation
to roots or shoots (i.e. quantitative adjustment) according
to whether the most limiting resource is above- or below-
ground (Shipley and Meziane 2002; Poorter et al. 2012).
Plants can also adjust the morphology and efficiency of
their tissues (i.e. qualitative adjustment) to increase
uptake of the most limiting resource (Ryser and Eek
2000; Hill et al. 2006) to the extent that these adjustments
might be more important than changes in total mass allo-
cation as a response to abiotic stresses (Poorter et al.
2012).
Qualitative intraspecific adjustments to abiotic stresses
are widespread among plants, and are manifest in many
plant traits (Chapin 1991). Aboveground, decreasing light
availability commonly drives an increase in leaf area per
unit mass (specific leaf area, SLA; Rijkers et al. 2000; Evans
and Poorter 2001), i.e. there is an increase in the area of
light capture for a constant amount of resource invested.
Also, decreasing partial pressure in CO2 leads to higher
leaf nitrogen concentrations (LNC), which is indicative of
the leaf carboxylation capacity (i.e. concentration of
CO2-fixing protein Rubisco in leaf) per unit mass invested
(Ellsworth et al. 2004). Belowground, increasing nutrient
limitation generally drives intraspecific increases in specific
root length (SRL) (Hill et al. 2006; Ostonen et al. 2007),
which represents the length of root potentially able to
explore soil per unit mass invested. Together these exam-
ples illustrate how changes in the availability of any one
resource, either above- or belowground, trigger changes in
functional traits that determine the ability of plants to
acquire that resource. However, several other environmen-
tal factors can also influence these responses (see Poorter
et al. 2009 for an overview of factors influencing SLA).
Under natural conditions, plants are exposed to multiple
stresses and compete both for above- and belowground
resources simultaneously. Furthermore, the acquisition of
any one resource (e.g. carbon) generally relies on several
others (e.g. light, water, and nutrients). For instance, the
effect of light stress on SLA can shift from null to positive
along a gradient of nitrogen availability (Meziane and
Shipley 1999). Therefore, multiple environmental stresses
can drive complex integration of responses at the plant
level (Chapin 1991; de Kroon et al. 2005), which are
potentially accountable for distinct responses across plant
species with contrasting physiologies.
An important component of plant responses to the
environment, other than the direction of intraspecific trait
adjustments, is the strength of the response (Valladares
et al. 2006). This magnitude of response can be quantified
as changes in plant biomass, seed production, or any
plant trait related to fitness. A high magnitude of
response in those traits that determine fitness can poten-
tially help a species maintain fitness in stressful environ-
ments and/or increase fitness in favorable environments
(Richards et al. 2006). However, strong responses also
come with costs and limits to fitness, such as the
resources needed to generate responses, intrinsic genetic
costs owing to pleiotropy, gene linkages and epistasis, or
unstable plant development when environmental signals
are unreliable (DeWitt et al. 1998; Van Kleunen and Fi-
scher 2005). Although the adaptive role of intraspecific
plant responses has yet to be generally demonstrated, it is
likely to play an important role in determining plant fit-
ness (Sultan 2000; Valladares et al. 2006). Several hypoth-
eses have been proposed regarding its connections to
various aspects of plant strategies (see Lavorel et al.
2009). In particular, resource-acquisitive species have
been hypothesized to express a greater magnitude of
intraspecific responses than resource-conservative ones
because they generally appear better at exploiting varying
levels of resource availability (Crick and Grime 1987;
Grassein et al. 2010). However, the extent to which plant
intraspecific responses are related to plant economics has
received little explicit attention (Grassein et al. 2010)
except in the context of plant invasions (Richards et al.
2006; Funk 2008).
In this study, we explore how multiple environmental
gradients associated with light (carbon), water, and nutri-
ent resource availability, as well as disturbance, collec-
tively drive intraspecific changes in leaf and root traits
related to the capture of these same resources. Firstly, we
hypothesize that three tree species competing for the same
spatial niche, but with contrasting carbon and nutrient
economics, will have broadly similar responses to any
single environmental factor, but will have stronger and
more specific responses to combinations of several envi-
ronmental factors. This is because the response of each
species results from a complex integration of environmen-
tal factors at the whole-plant level (Chapin 1991; de
Kroon et al. 2005). Secondly, we hypothesize that the
magnitude of intraspecific responses of these species, both
above- and belowground, will be related to the extent to
which their economies are acquisitive or conservative.
Thirdly, we hypothesize that, despite the potentially wide-
spread coordination in leaf and root economics across
species (Reich et al. 2008; Liu et al. 2010), there will be
uncoordinated shifts in nutrient and carbon economics
above- versus belowground within species, because leaf
and root traits (associated with the acquisition of above-
and belowground resources respectively) should respond
1066 ª 2013 The Authors. Published by Blackwell Publishing Ltd.
Plasticity in Above- and Belowground Traits G. T. Freschet et al.
differently to (orthogonally) varying levels of resources
above- versus belowground. We test these hypotheses by
measuring a set of above- and belowground plant traits
representative of plant carbon and nutrient economics on
three tree species at the population level within the same
ecosystem along strong gradients of light, soil nutrient
concentrations, moisture, and disturbance.
Materials and Methods
Study system
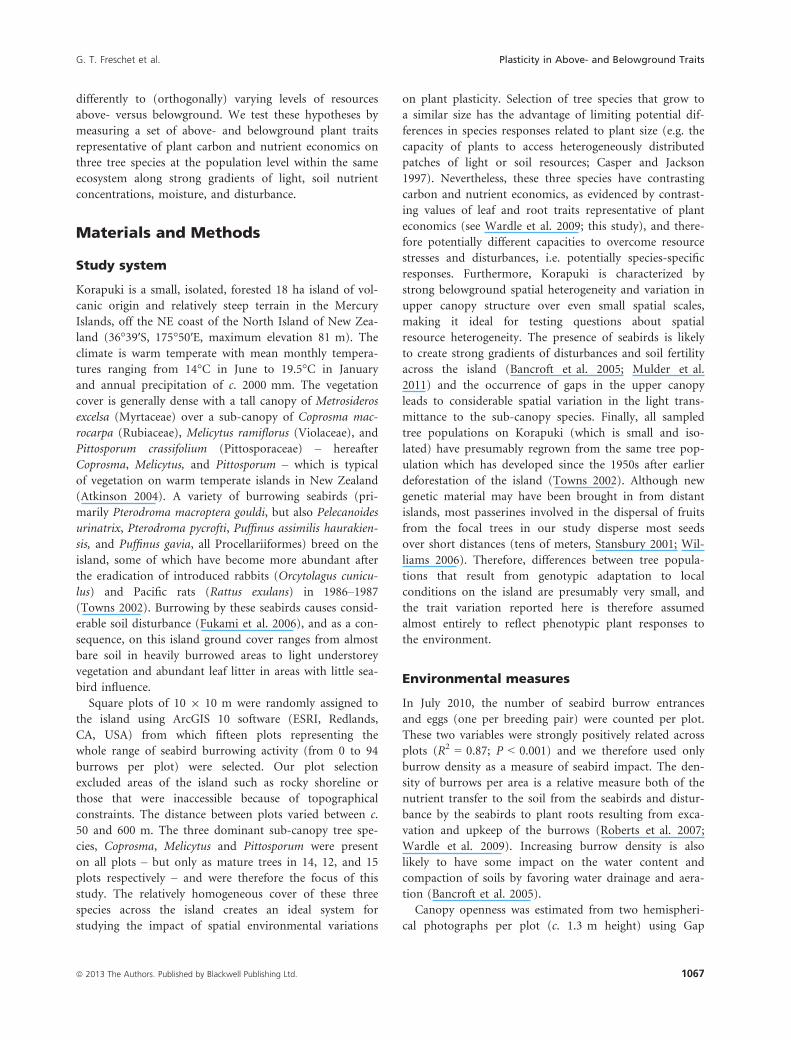
Korapuki is a small, isolated, forested 18 ha island of vol-
canic origin and relatively steep terrain in the Mercury
Islands, off the NE coast of the North Island of New Zea-
land (36°39′S, 175°50′E, maximum elevation 81 m). The
climate is warm temperate with mean monthly tempera-
tures ranging from 14°C in June to 19.5°C in January
and annual precipitation of c. 2000 mm. The vegetation
cover is generally dense with a tall canopy of Metrosideros
excelsa (Myrtaceae) over a sub-canopy of Coprosma mac-
rocarpa (Rubiaceae), Melicytus ramiflorus (Violaceae), and
Pittosporum crassifolium (Pittosporaceae) – hereafter
Coprosma, Melicytus, and Pittosporum – which is typical
of vegetation on warm temperate islands in New Zealand
(Atkinson 2004). A variety of burrowing seabirds (pri-
marily Pterodroma macroptera gouldi, but also Pelecanoides
urinatrix, Pterodroma pycrofti, Puffinus assimilis haurakien-
sis, and Puffinus gavia, all Procellariiformes) breed on the
island, some of which have become more abundant after
the eradication of introduced rabbits (Orcytolagus cunicu-
lus) and Pacific rats (Rattus exulans) in 1986–1987(Towns 2002). Burrowing by these seabirds causes consid-
erable soil disturbance (Fukami et al. 2006), and as a con-
sequence, on this island ground cover ranges from almost
bare soil in heavily burrowed areas to light understorey
vegetation and abundant leaf litter in areas with little sea-
bird influence.
Square plots of 10 9 10 m were randomly assigned to
the island using ArcGIS 10 software (ESRI, Redlands,
CA, USA) from which fifteen plots representing the
whole range of seabird burrowing activity (from 0 to 94
burrows per plot) were selected. Our plot selection
excluded areas of the island such as rocky shoreline or
those that were inaccessible because of topographical
constraints. The distance between plots varied between c.
50 and 600 m. The three dominant sub-canopy tree spe-
cies, Coprosma, Melicytus and Pittosporum were present
on all plots – but only as mature trees in 14, 12, and 15
plots respectively – and were therefore the focus of this
study. The relatively homogeneous cover of these three
species across the island creates an ideal system for
studying the impact of spatial environmental variations
on plant plasticity. Selection of tree species that grow to
a similar size has the advantage of limiting potential dif-
ferences in species responses related to plant size (e.g. the
capacity of plants to access heterogeneously distributed
patches of light or soil resources; Casper and Jackson
1997). Nevertheless, these three species have contrasting
carbon and nutrient economics, as evidenced by contrast-
ing values of leaf and root traits representative of plant
economics (see Wardle et al. 2009; this study), and there-
fore potentially different capacities to overcome resource
stresses and disturbances, i.e. potentially species-specific
responses. Furthermore, Korapuki is characterized by
strong belowground spatial heterogeneity and variation in
upper canopy structure over even small spatial scales,
making it ideal for testing questions about spatial
resource heterogeneity. The presence of seabirds is likely
to create strong gradients of disturbances and soil fertility
across the island (Bancroft et al. 2005; Mulder et al.
2011) and the occurrence of gaps in the upper canopy
leads to considerable spatial variation in the light trans-
mittance to the sub-canopy species. Finally, all sampled
tree populations on Korapuki (which is small and iso-
lated) have presumably regrown from the same tree pop-
ulation which has developed since the 1950s after earlier
deforestation of the island (Towns 2002). Although new
genetic material may have been brought in from distant
islands, most passerines involved in the dispersal of fruits
from the focal trees in our study disperse most seeds
over short distances (tens of meters, Stansbury 2001; Wil-
liams 2006). Therefore, differences between tree popula-
tions that result from genotypic adaptation to local
conditions on the island are presumably very small, and
the trait variation reported here is therefore assumed
almost entirely to reflect phenotypic plant responses to
the environment.
Environmental measures
In July 2010, the number of seabird burrow entrances
and eggs (one per breeding pair) were counted per plot.
These two variables were strongly positively related across
plots (R2 = 0.87; P < 0.001) and we therefore used only
burrow density as a measure of seabird impact. The den-
sity of burrows per area is a relative measure both of the
nutrient transfer to the soil from the seabirds and distur-
bance by the seabirds to plant roots resulting from exca-
vation and upkeep of the burrows (Roberts et al. 2007;
Wardle et al. 2009). Increasing burrow density is also
likely to have some impact on the water content and
compaction of soils by favoring water drainage and aera-
tion (Bancroft et al. 2005).
Canopy openness was estimated from two hemispheri-
cal photographs per plot (c. 1.3 m height) using Gap
ª 2013 The Authors. Published by Blackwell Publishing Ltd. 1067
G. T. Freschet et al. Plasticity in Above- and Belowground Traits
Light Analyzer 2.0 software (Simon Fraser University,
Burnaby, Canada). It therefore represents an index of
light availability to leaves of the lower sub-canopy (on
average from 2 to 4 m in height), including those of our
three focal tree species.
Four 10 9 10 9 10 cm soil pits were sampled per plot
in March 2010, pooled, homogenized and used for further
soil analysis. The mass and volume of this soil was used
to calculate bulk density. Soil moisture content was mea-
sured on a sub-sample dried to constant weight at 60°C.Since weather was warm and dry with no precipitation
during the entire sampling period, soil moisture content
was used here as an index of water availability for plants.
The two main form of N available for plants, i.e. NO3-N
and NH4-N, were extracted with KCl solution and mea-
sured by auto-analyser (Lachat Instruments Division, Zell-
weger Analytics Inc., Milwaukee, WI, USA). A measure of
available phosphorus for plants, Olsen-P, was measured
using sodium bicarbonate digest.
Plant traits
In November 2011, Coprosma, Melicytus and Pittosporum
were sampled from each plot for shade leaves and fine
superficial roots sampled whenever possible from a mini-
mum of ten distinct plant individuals. Fifty healthy, fully
expanded leaves (presumably from the current year) were
sampled per species per plot from the inside of the sub-
canopy (between c. 2–3 m in height). Ten to twenty roots
per species per plot were tracked down from the tree
stem to the fine root tips and dug out. All leaf and root
material was kept cool and wet until cleaning and further
processing in the lab. All root branches below 1 mm in
diameter, except explorative roots, were clipped off, thor-
oughly cleaned from residual soil and taken as “fine
roots.” For each species and plot, all 50 leaves and all fine
root material was used to estimate specific leaf area (SLA,
mm2/mg) and specific root length (SRL, m/mg) as well as
leaf and fine root dry matter content (DMC, fresh to dry
weight ratio, mg/g). Measurements followed Cornelissen
et al. (2003). All leaves and fine roots were then coarsely
ground and homogenized manually before taking a sub-
sample for total N and P concentration analysis using
acid digest and colorimetric methods of Blakemore et al.
(1987).
Data analysis
The single and multiple influences of four environmental
parameters (light availability, soil nutrient availability, soil
moisture availability, and seabird burrow density) on
intraspecific variation in leaf and root functional traits
(SLA–SRL, DMC, N and P) were assessed separately for
each plant species using simple and multiple linear regres-
sions. In order to maximize the statistical power of our
tests and minimize multicollinearity, two highly correlated
environmental parameters were transformed into one
summarizing index using a principal component analysis
(PCA): “soil nutrient availability” was thus estimated as
the first axis of a PCA that summarizes 89% of variation
in available N (nitrate + ammonium) and available P
(Olsen-P). Seabird burrowing activity was included in
multiple linear regressions because it represents the
impact of disturbances caused by seabird burrowing activ-
ity in addition to the effects of seabirds on soil nutrients,
so could potentially explain variability that ‘soil nutrient
availability’ cannot. Seabird burrow density was log10-
transformed for all single and multiple regressions con-
cerned to comply with normality assumptions. For each
species 9 trait combination, the most relevant models
were identified using Akaike’s Information Criterion
(AIC). Models displaying AIC � lowest AIC + 1 were
considered equivalent. Results of regressions with four
parameters were not shown because of the low number of
observations per parameter and because their AIC never
fell below these with less parameters.
To illustrate the effect of multiple contrasting environ-
mental influences on the intraspecific variation in whole-
plant economic strategies of our three tree species, we
performed a PCA on all leaf and root traits of all species
simultaneously. We used t-tests among pairs of species to
determine whether the ranking of these three species
along the first axis of the PCA, which represented a
“plant economics spectrum” (Freschet et al. 2010), chan-
ged across environmental influences (i.e. across plots).
In order to compare the magnitude of plastic responses
among tree species and organs to the same environmental
variation, we focused on intraspecific trait responses to
multiple environmental influences rather than to single
environmental factor or sets of environmental factors
(Valladares et al. 2006). This is because intraspecific shifts
in plant trait values were generally co-determined by sev-
eral environmental parameters which often differed across
species. Consequently, measuring trait responses of differ-
ent species to the same set of (subjectively chosen) envi-
ronmental factors would make little sense in this context.
Specifically, for each trait 9 species combination, we
transformed trait values at each plot into percentages of
deviation from the mean trait value across all plots. Then,
for each trait, we used two-sample Fisher’s F-tests to test
for differences between species in the homogeneity of var-
iance in these percentages of deviation from the mean
trait value. For each species, we also used Fisher’s F-tests
in the same way to assess the homogeneity of intraspecific
variance between functionally analogous leaf and root
traits (i.e. SLA vs. SRL; root vs. leaf DMC, N and P).
1068 ª 2013 The Authors. Published by Blackwell Publishing Ltd.
Plasticity in Above- and Belowground Traits G. T. Freschet et al.

Expressing the magnitude of intraspecific trait responses
as a relative deviation from the species mean trait value is
equivalent to using coefficients of variation (CV) and
allows comparisons of species’ variance independently of
the mean plant trait value.
Standardized major axes regressions were used to test
the coordination between functionally equivalent leaf
and root traits across the 15 plots for each species and,
when significant, slope comparison procedures were per-
formed between species (SMATR-package; Warton et al.
2006).
Results
Among all possible pairs of four environmental parame-
ters (see Table 1 for an outline of parameters’ ranges,
means, and variabilities), only soil nutrient availability
and seabird burrow density were significantly positively
related (R2 = 0.45; P < 0.01). Light availability was largely
unrelated to soil moisture content, soil nutrient availabil-
ity, and seabird disturbance (R2 = 0.18, 0.10, 0.20, respec-
tively; P � 0.10). Soil moisture content was unrelated to
seabird disturbance (R2 = 0.11; P � 0.10) and only mar-
ginally negatively related to soil nutrient availability
(R2 = 0.25; P = 0.06).
Multiple environmental factors co-determine intraspecific trait responses
The PCA primary axis scores for the three species with
regard to their traits differed greatly, although there was
some overlap between Coprosma and each of the other
two species along the plant economics spectrum axis
(Fig. 1). The species’ ranking along this axis was strictly
conserved across the 15 plots, indicating that there were
broadly consistent influences of environmental parameters
on multiple traits of the three distinct tree species.
More specifically, several models that included either
single or multiple environmental factors often explained
more than half of the total trait variance across the plots
for all three species (Tables 2 and 3; Tables S1 and S2).
For most plant traits, although we observed largely con-
sistent trends across all three tree species, the best models
often differed at least slightly between species. This was
particularly true for SLA, SRL, leaf and root N concentra-
tions, root DMC and root P concentration, but less so for
leaf DMC and leaf P concentration.
Among the models with the lowest AIC (i.e. � lowest
AIC + 1), population level SLA across plots was best fit-
ted by models using seabird disturbance, soil moisture
content and light availability for Pittosporum, disturbance
and light availability for Coprosma, and disturbance, soil
moisture content and soil nutrient availability for Melicy-
tus (Table 2). However, when single parameter predic-
tions were considered, disturbance, light and soil
moisture on their own consistently explained significant
amounts of variation in SLA. While intraspecific variation
in SRL was best fitted by models using disturbance, soil
nutrient availability and light for both Pittosporum and
Melicytus, it was best fitted by models that integrated soil
nutrient availability and moisture for Coprosma (Table 2).
Also, the sign of disturbance and light parameters of the
models appeared reversed between Pittosporum and Meli-
cytus. Thus, in all three cases only soil nutrient availability
had a consistent (positive) influence on SRL. When con-
sidered alone it explained a large proportion of the total
variability in SRL across plots, i.e. 49, 53, and 42% for
Pittosporum, Coprosma, and Melicytus, respectively.
Table 1. Range of the main environmental gradients on Korapuki
Island.
Environmental parameters Range Mean (�SD)
Light availability
(% canopy openness)
1.4�11.2 6 (�2.8)
Soil NO3-N and
NH4-N (mg/kg)
6.5�173.6 52 (�51)
Soil Olsen-P (mg/kg) 10.0�994.0 273 (�254)
Soil moisture content
(% dry weight)
127�267 177 (�43)
Seabird burrow
density (m�2)
0�0.94 0.25 (�0.26)
Figure 1. South coast of Korapuki. Photo by G.T. Freschet.
ª 2013 The Authors. Published by Blackwell Publishing Ltd. 1069
G. T. Freschet et al. Plasticity in Above- and Belowground Traits

Table 2. Linear models of single and multiple environmental parameters’ fit of specific leaf area and specific root length of three sub-canopy tree species.
Specific leaf area (mm2/mg) Specific root length (mg)
Pittosporum Coprosma Melicytus Pittosporum Coprosma Melicytus
Sign R2 AIC Sign R2 AIC Sign R2 AIC Sign R2 AIC Sign R2 AIC Sign R2 AIC
Burrow density – 0.45 1.3 � 0.44 21.2 � 0.56 20.4 + 0.28 43.9 + 0.19 68.5 + 0.03 42.4
Soil Nutrient availability � 0.40 2.7 � 0.10 27.7 � 0.10 29.1 + 0.49 38.7 + 0.53 61.0 + 0.42 36.8
Soil Water content + 0.58 �2.8 + 0.19 26.2 + 0.27 26.5 � 0.02 48.5 � 0.48 62.4 � 0.06 42.1
Light availability � 0.52 �0.7 � 0.33 23.6 � 0.38 24.6 � 0.00 48.7 + 0.11 69.9 + 0.11 41.5
Burrow + Nutrient �,� 0.51 1.7 �, + 0.46 22.6 �, + 0.59 21.8 +, + 0.50 40.5 �, + 0.53 63.0 �, + 0.50 37.2
Burrow + Water �, + 0.77 �9.9 �, + 0.50 21.5 �, + 0.63 20.6 +, + 0.28 45.9 +, � 0.54 62.7 +, � 0.06 44.1
Burrow + Light �,� 0.67 �4.4 �,� 0.53 20.5 �,� 0.62 20.7 +, � 0.38 43.6 +, + 0.22 70.1 �, + 0.11 43.5
Nutrient + Water �, + 0.66 �4.1 �, + 0.21 27.9 �, + 0.27 28.5 +, + 0.55 38.9 +, � 0.68 57.4 +, + 0.45 38.2
Nutrient + Light �,� 0.69 �5.5 �,� 0.35 25.1 �,� 0.39 26.5 +, � 0.58 37.9 +, + 0.54 62.7 +, + 0.43 38.6
Water + Light +, � 0.77 �9.9 +, � 0.38 24.6 +, � 0.48 24.6 �,� 0.04 50.2 �, + 0.48 64.4 �, + 0.13 43.3
Burrow + Nutrient + Water �, �, + 0.77 �7.9 �, +, + 0.57 21.4 �, +, + 0.71 19.7 +, +, + 0.55 40.7 �, +, � 0.69 59.3 �, +, + 0.50 39.1
Burrow + Nutrient + Light �,�,� 0.72 �4.9 �, +, � 0.56 21.7 �, +, � 0.65 21.8 +, +, � 0.61 38.7 �, +, + 0.54 64.5 �, +, + 0.59 37.0
Burrow + Water + Light �, +, � 0.86 �15.5 �, +, � 0.56 21.8 �, +, � 0.66 21.4 +, �, � 0.38 45.5 +, �, � 0.54 64.6 �, �, + 0.14 45.1
Nutrient + Water + Light �, +, � 0.82 �11.8 �, +, � 0.38 26.5 +, +, � 0.48 26.6 +, +, � 0.60 39.1 +, �, � 0.69 59.3 +, +, + 0.47 39.8
Signs of model parameters are displayed for each model. The fraction of total trait variation explained by each model is represented by regression coefficients R2. Models with Akaike’s informa-
tion criterion (AIC) � (lowest AIC + 1) were considered of high likelihood and indicated in bold. The number of tree populations is 15 for Pittosporum crassifolium, 14 for Coprosma macrocarpa,
and 12 for Melicytus ramiflorus.
1070
ª2013Th
eAuthors.
Publish
edbyBlackw
ellPu
blish
ingLtd
.
Plasticity
inAbove
-andBelowgroundTraits
G.T.
Freschet
etal.

Table 3. Linear models of single and multiple environmental parameters’ fit of leaf and fine root nitrogen concentration of three sub-canopy tree species.
Leaf nitrogen content (%) Root nitrogen content (%)
Pittosporum Coprosma Melicytus Pittosporum Coprosma Melicytus
Sign R2 AIC Sign R2 AIC Sign R2 AIC Sign R2 AIC Sign R2 AIC Sign R2 AIC
Burrow density + 0.59 �65.6 + 0.07 �43.9 + 0.01 �18.0 + 0.64 �55.1 + 0.29 �27.4 + 0.10 �23.5
Soil Nutrient availability + 0.60 �65.7 + 0.36 �49.0 + 0.44 �24.8 + 0.64 �54.7 + 0.36 �28.9 + 0.53 �31.3
Soil Water content � 0.04 �52.9 � 0.00 �42.9 � 0.04 �18.4 � 0.05 �40.3 � 0.00 �22.6 � 0.24 �25.5
Light availability + 0.00 �52.2 � 0.07 �43.8 � 0.08 �18.9 + 0.01 �39.7 � 0.06 �23.4 � 0.01 �22.3
Burrow + Nutrient +, + 0.71 �68.7 �, + 0.39 �47.7 �, + 0.58 �26.3 +, + 0.77 �59.3 +, + 0.40 �27.7 �, + 0.55 �29.8
Burrow + Water +, + 0.59 �63.7 +, + 0.07 �41.9 +, � 0.04 �16.4 +, + 0.65 �53.2 +, + 0.32 �25.9 +, � 0.26 �23.8
Burrow + Light +, � 0.74 �70.1 +, � 0.25 �44.8 +, � 0.15 �18.0 +, � 0.73 �57.1 +, � 0.58 �32.8 +, � 0.21 �23.0
Nutrient + Water +, + 0.64 �65.3 +, + 0.43 �48.7 +, + 0.48 �23.7 +, + 0.68 �54.6 +, + 0.46 �29.1 +, � 0.55 �29.7
Nutrient + Light +, � 0.66 �66.5 +, � 0.58 �53.2 +, � 0.75 �32.3 +, � 0.66 �53.9 +, � 0.57 �32.5 +, � 0.69 �34.1
Water + Light �,� 0.05 �51.0 �,� 0.10 �42.3 �,� 0.18 �18.3 �, + 0.05 �38.3 �,� 0.07 �21.6 �,� 0.34 �25.1
Burrow + Nutrient + Water +, +, + 0.75 �69.0 �, +, + 0.46 �47.4 �, +, + 0.60 �25.1 +, +, + 0.81 �60.4 +, +, + 0.49 �28.1 �, +, � 0.57 �28.3
Burrow + Nutrient + Light +, +, � 0.86 �78.1 �, +, � 0.58 �51.2 �, +, � 0.76 �31.3 +, +, � 0.86 �64.7 +, +, � 0.71 �35.8 +, +, � 0.69 �32.1
Burrow + Water + Light +, �, � 0.74 �68.4 +, �, � 0.26 �43.1 +, �, � 0.22 �17.0 +, �, � 0.73 �55.2 +, �, � 0.58 �30.8 +, �, � 0.44 �25.2
Nutrient + Water + Light +, +, � 0.68 �65.2 +, +, � 0.60 �51.6 +, +, � 0.75 �30.6 +, +, � 0.69 �53.1 +, +, � 0.60 �31.4 +, �, � 0.73 �33.9
Signs of model parameters are displayed for each model. The fraction of total trait variation explained by each model is represented by regression coefficients R2. Models with Akaike’s informa-
tion criterion (AIC) � (lowest AIC + 1) were considered of high likelihood and indicated in bold. The number of tree populations is 15 for Pittosporum crassifolium, 14 for Coprosma macrocarpa,
and 12 for Melicytus ramiflorus.
ª2013Th
eAuthors.
Publish
edbyBlackw
ellPu
blish
ingLtd
.1071
G.T.
Freschet
etal.
Plasticity
inAbove
-andBelowgroundTraits

For all three species, soil nutrient availability alone
explained a substantial proportion of the variability across
plots in leaf and root N concentrations (Table 3). How-
ever, Pittosporum LNC was most strongly influenced by a
combination of soil nutrient availability, light and distur-
bance, while LNC for Coprosma and Melicytus were most
responsive to soil nutrient availability and light only.
Intraspecific variability for root N concentration (RNC)
was also largely driven by nutrients and light, but while
Pittosporum and Coprosma responded most strongly to
these in combination with disturbance, Melicytus
responded most strongly to them in combination with
soil moisture (Table 3).
Intraspecific variability in leaf dry matter content
(LDMC) was relatively well fitted by models containing
disturbance alone or including both disturbance and light
for Coprosma and Melicytus, but no models were satisfac-
tory for Pittosporum (Table S1). In contrast, while largely
different models best fitted intraspecific variability in root
dry matter content (RDMC) across species, soil nutrient
availability emerged as a consistent driver across all three
species and explained 64, 63, and 58% of the variability
in RDMC of Pittosporum, Coprosma, and Melicytus,
respectively (Table S1).
Finally, while a model that included light, soil nutri-
ent availability and moisture explained up to 59% in
the intraspecific variability in leaf P concentration
(LPC) of Melicytus, none of the environmental parame-
ters could adequately explain the intraspecific variability
in LPC for Pittosporum and Coprosma (Table S1). In
contrast, the intraspecific variation in root P concentra-
tion (RPC) across species appeared mostly driven by
disturbance and soil nutrient availability although,
depending on the species, either soil moisture or light
appeared to slightly improve model fits (higher R2 but
similar AIC).
A broadly similar magnitude of intraspecifictrait responses across organs and species
Only leaf and root DMC followed the hypothesized trend
of increasing trait variance from Pittosporum to Coprosma
to Melicytus, and the only difference in trait variance
among species that was statistically significant was for
LDMC between Pittosporum and both Coprosma and Mel-
icytus (P = 0.01 in both cases; Fig. 2). Furthermore, vari-
ances of six traits, including RDMC, leaf and root N and
P concentrations, and SLA, were not significantly different
among the three tree species. Also, the intraspecific vari-
ance in SRL was significantly higher for Coprosma than
for both Pittosporum and Melicytus (P = 0.01 in both
cases).
crassifolium(P < 0.001) (P < 0.001)
Paired t-test:Coprosma
macrocarpa<
Melicytusramiflorus
Axi
s 2
(14.
37 %
)
Axis 1 (58.12 %)RNC
LNC
LPC
RPC
SLALDMC
RDMC
SRL
Plant economics spectrumNutrientconserva�vepopula�ons
Nutrientacquisi�ve
popula�ons
<
1
1
2
22
3
3
5
5
4 4
4
6
6
7
7
7
8
8
8
9
9
15
15
15 14
14
13
13
13
11
11
11
12
12
12
1
10
10
10
Figure 2. Principal component analysis (PCA) on eight leaf and root traits representative of plant nutrient and carbon economics for all tree
populations (15 plots 9 3 species). Plot numbers are indicated for each population of Pittosporum crassifolium (●), Coprosma macrocarpa ( ), and
Melicytus ramiflorus (○). The x-axis, summarizing 58% of total trait variation, ordinates tree populations from those showing the most resource-
conservative traits (left) to those displaying the most resource-acquisitive ones (right). Results of paired-samples t-tests between the x-axis scores
of Coprosma and Pittosporum and Coprosma and Melicytus show consistent rankings of the three tree species across all plots. Species centroids
are displayed as diamonds. Plant traits: specific leaf area (SLA), specific root length (SRL), leaf and root dry matter content (LDMC, RDMC), leaf
and root nitrogen (LNC, RNC) and phosphorus concentrations (LPC, RPC).
1072 ª 2013 The Authors. Published by Blackwell Publishing Ltd.
Plasticity in Above- and Belowground Traits G. T. Freschet et al.

At the species level, mostly similar variances were
observed between functionally equivalent leaf and root
traits, although in three instances root traits showed
higher variance than their leaf trait counterparts. Thus,
Pittosporum displayed significantly higher variance in root
than leaf DMC (P = 0.04) and Coprosma showed signifi-
cantly higher variance in root than leaf N concentration
(P = 0.04) and in SRL than SLA (P < 0.01).
Orthogonal responses of analogous leaf androot traits to multiple environmentalinfluences
As described above, for each of the three species, different
environmental parameters appeared to drive intraspecific
shifts in analogous above- and belowground traits, such as
SLA versus SRL (Table 2), LDMC versus RDMC (Table
S1), and LPC versus RPC (Table S2). In contrast, LNC and
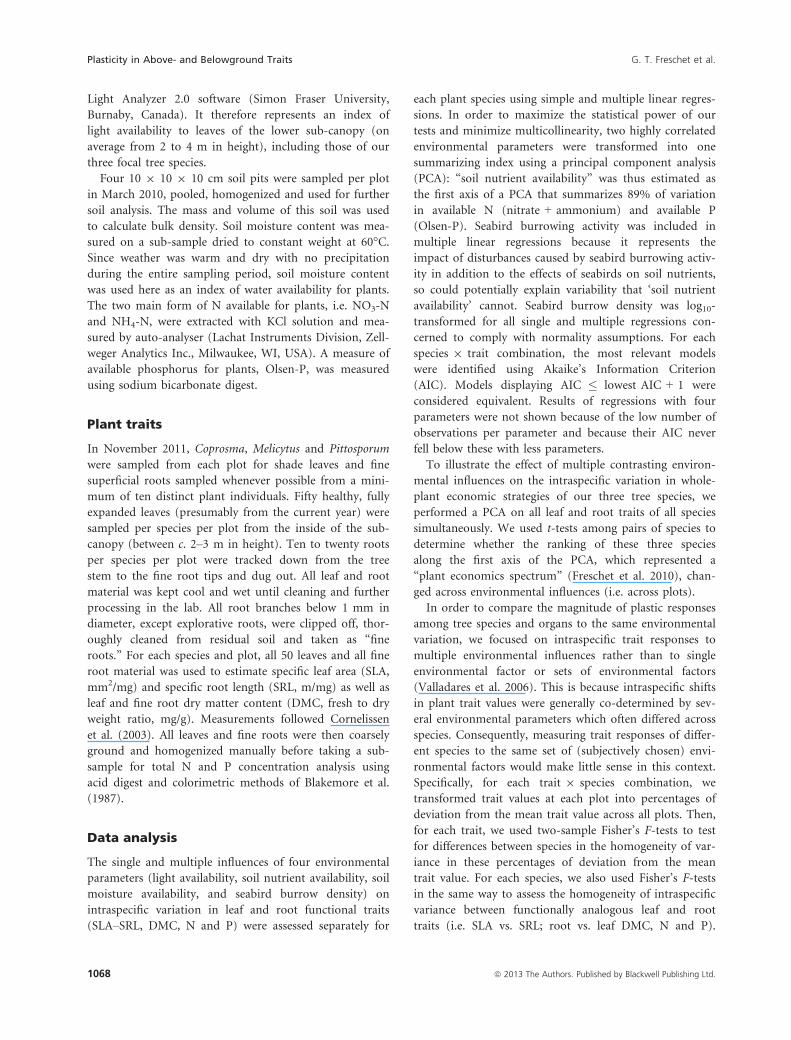
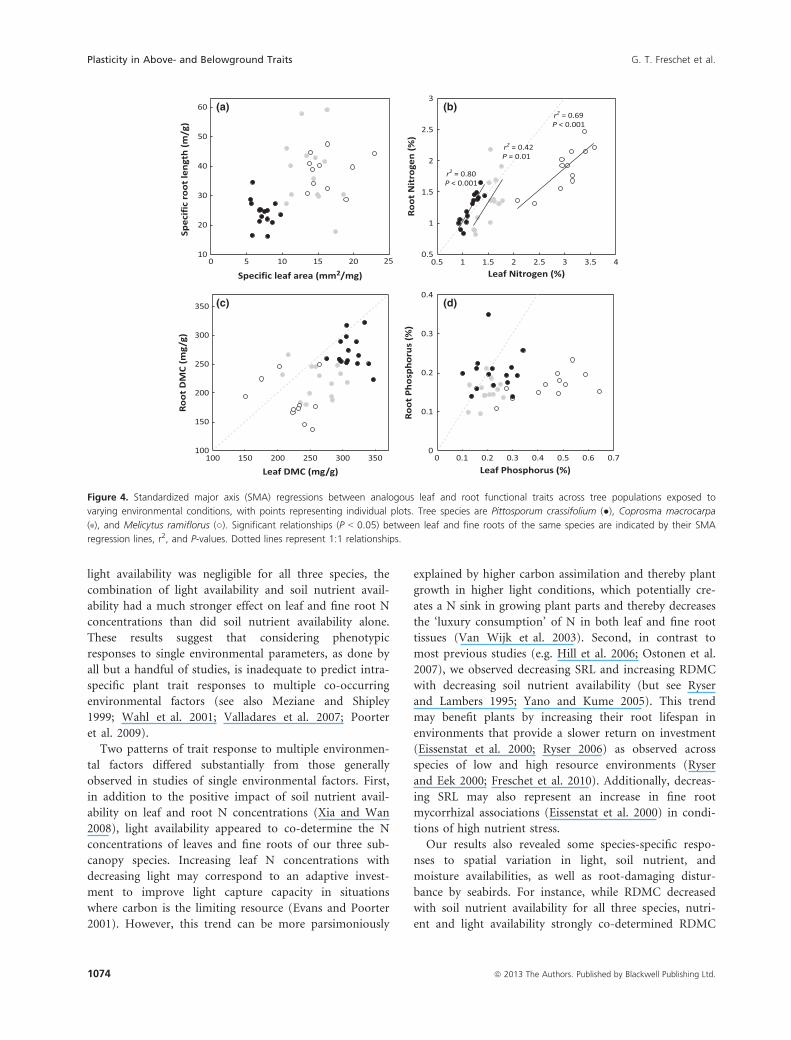
RNC were driven by a similar combination of parameters,
notably nutrient and light availability (Table 3). As a con-
sequence, while intraspecific variation in LNC and RNC
were significantly related (Fig. 3b), all other pairs of leaf
and root traits were not (Fig. 3a, c, d). The slope of LNC–
RNC relationship for Melicytus was significantly smaller
than this for the two other species (P < 0.01 in both cases).
Discussion
Multiple environmental factors often co-determine intraspecific trait responses anddrive partially species-specific responses
Most traits of the three tree species showed similar
responses to the same environmental factors when factors
were considered separately (e.g. Wahl et al. 2001; Ro-
zendaal et al. 2006), and, consistent with our first hypoth-
esis, combinations of several factors often explained
higher intraspecific trait variation than single factors. For
instance, light availability is generally considered as the
main driver of intraspecific shifts in SLA (Evans and
Poorter 2001; Rozendaal et al. 2006). However, for all
three tree species we observed a strong influence of soil
disturbance caused by seabird burrowing and soil mois-
ture content (see also Poorter et al. 2009), which together
explained more variance than the otherwise significant
influence of light availability alone. Also, even though the
variance in leaf and root N concentrations explained by
ns
ns
ns
a b
b
b nsns
ns
SLA LDMC
a aRDMC RNC RPC
LPCLNC
SRL
P C MP C MP C M P C M
P C MP C MP C M P C M
–60
–40
–20
0
20
40
60
–60
–40
–20
0
20
40
60
–60
–40
–20
0
20
40
60
–60
–40
–20
0
20
40
60
–60
–40
Perc
enta
ge o
f int
rasp
ecei
fic tr
ait d
evia
tion
from
the
mea
n sp
ecie
s tr
ait v
alue
–20
0
20
40
60
–60
–40
–20
0
20
40
60
–60
–40
–20
0
20
40
60
–60
–40
–20
0
20
40
60
Figure 3. Percentage deviation of Pittosporum crassifolium (P), Coprosma macrocarpa (C), and Melicytus ramiflorus (M) tree populations from
their respective mean species trait value, for eight above- and belowground traits. Species are ranked from left to right from the most
conservative to the most acquisitive. Each boxplot represents the intraspecific trait variation of a group of 12–15 tree populations (i.e. plots)
depending on species, where population trait values are expressed as percentage deviation from the mean species trait value across all
populations (central line is median; mean is zero; boxes indicate the first and third quartiles; whiskers are confidence limits; empty circles are
outliers). Significant (P < 0.05; as indicated by different letters) and non-significant (ns) heterogeneity in intraspecific trait variance were tested
using two-sample Fisher’s F-tests on all pairs of species for each trait. Plant traits: specific leaf area (SLA), specific root length (SRL), leaf and root
dry matter content (LDMC, RDMC), leaf and root nitrogen (LNC, RNC) and phosphorus concentrations (LPC, RPC).
ª 2013 The Authors. Published by Blackwell Publishing Ltd. 1073
G. T. Freschet et al. Plasticity in Above- and Belowground Traits
light availability was negligible for all three species, the
combination of light availability and soil nutrient avail-
ability had a much stronger effect on leaf and fine root N
concentrations than did soil nutrient availability alone.
These results suggest that considering phenotypic
responses to single environmental parameters, as done by
all but a handful of studies, is inadequate to predict intra-
specific plant trait responses to multiple co-occurring
environmental factors (see also Meziane and Shipley
1999; Wahl et al. 2001; Valladares et al. 2007; Poorter
et al. 2009).
Two patterns of trait response to multiple environmen-
tal factors differed substantially from those generally
observed in studies of single environmental factors. First,
in addition to the positive impact of soil nutrient avail-
ability on leaf and root N concentrations (Xia and Wan
2008), light availability appeared to co-determine the N
concentrations of leaves and fine roots of our three sub-
canopy species. Increasing leaf N concentrations with
decreasing light may correspond to an adaptive invest-
ment to improve light capture capacity in situations
where carbon is the limiting resource (Evans and Poorter
2001). However, this trend can be more parsimoniously
explained by higher carbon assimilation and thereby plant
growth in higher light conditions, which potentially cre-
ates a N sink in growing plant parts and thereby decreases
the ‘luxury consumption’ of N in both leaf and fine root
tissues (Van Wijk et al. 2003). Second, in contrast to
most previous studies (e.g. Hill et al. 2006; Ostonen et al.
2007), we observed decreasing SRL and increasing RDMC
with decreasing soil nutrient availability (but see Ryser
and Lambers 1995; Yano and Kume 2005). This trend
may benefit plants by increasing their root lifespan in
environments that provide a slower return on investment
(Eissenstat et al. 2000; Ryser 2006) as observed across
species of low and high resource environments (Ryser
and Eek 2000; Freschet et al. 2010). Additionally, decreas-
ing SRL may also represent an increase in fine root
mycorrhizal associations (Eissenstat et al. 2000) in condi-
tions of high nutrient stress.
Our results also revealed some species-specific respo-
nses to spatial variation in light, soil nutrient, and
moisture availabilities, as well as root-damaging distur-
bance by seabirds. For instance, while RDMC decreased
with soil nutrient availability for all three species, nutri-
ent and light availability strongly co-determined RDMC
10
20
30
40
50
60
Spec
ific
ro
ot
len
gth
(m
/g)
Specific leaf area (mm2/mg)
r2 = 0.80P < 0.001
0.5
1
1.5
2
2.5
3
Ro
ot
Nit
roge
n (
%)
Leaf Nitrogen (%)
100
150
200
250
300
350
Ro
ot
DM
C (
mg/
g)
Leaf DMC (mg/g)
0
0.1
0.2
0.3
0.4
0 5 10 15 20 25 0.5 1 1.5 2 2.5 3 3.5 4
100 150 200 250 300 350 0 0.1 0.2 0.3 0.4 0.5 0.6 0.7
Ro
ot
Ph
osp
ho
rus
(%)
Leaf Phosphorus (%)
r2 = 0.42P = 0.01
r2 = 0.69P < 0.001
(a) (b)
(c) (d)
Figure 4. Standardized major axis (SMA) regressions between analogous leaf and root functional traits across tree populations exposed to
varying environmental conditions, with points representing individual plots. Tree species are Pittosporum crassifolium (●), Coprosma macrocarpa
( ), and Melicytus ramiflorus (○). Significant relationships (P < 0.05) between leaf and fine roots of the same species are indicated by their SMA
regression lines, r2, and P-values. Dotted lines represent 1:1 relationships.
1074 ª 2013 The Authors. Published by Blackwell Publishing Ltd.
Plasticity in Above- and Belowground Traits G. T. Freschet et al.

in Pittosporum, and nutrient, light, and seabird burrow-
ing co-determined RDMC in Melicytus. Our results,
together with previous studies exploring gradients in soil
nutrient availability (Lawrence 2003), soil moisture con-
tent (Cornwell and Ackerly 2009), and temperature
(Albert et al. 2010), suggest that plant communities
could exhibit complex responses to changing environ-
mental conditions (Lavorel et al. 2009), which portends
substantial uncertainty in trait-based projections of plant
assemblages under scenarios of global change (Thuiller
et al. 2008).
Does the strength of intraspecific plant traitresponses relate to plant resourceacquisition strategy?
We found broadly similar amplitudes of intraspecific
plant trait responses across all three tree species to the
same multiple environmental influences, irrespective of
their nutrient and carbon economics (Fig. 2; see also
Funk 2008). This result did not provide support for our
second hypothesis. Only leaf and root DMC displayed the
expected trend of increasing strength of intraspecific
response (although mostly non-significant) as the species
became more resource-acquisitive, which is consistent
with results for leaf DMC in alpine grassland communi-
ties (Lavorel et al. 2009; Grassein et al. 2010). Our results
therefore suggest that the capacity for large intraspecific
variation in traits might be equally important for both
acquisitive and conservative species. Environmental heter-
ogeneity is widespread within both fertile and unfertile
sites and plants characteristic of both environments may
have a selective benefit through exhibiting strong intra-
specific trait responses. Studies featuring a greater number
of species remain necessary to answer whether the magni-
tude of plant intraspecific responses relates to their
resource economics. Also, our study system is unlikely to
cover the entire range of environmental conditions that
our focal species can occupy. Therefore, the general lack
of relationship observed in our study between the
strength of plant intraspecific response and plant econom-
ics does not exclude the possibility that between-species
differences in plasticity could be observed with respect to
the physiological limits of plastic responses (rather than
the proportional strength of the response).
Multiple environmental influences drivedecoupled plant resource acquisitionstrategies above- and belowground
In support of our third hypothesis, we observed uncoor-
dinated shifts within species for three of four functionally
analogous leaf and root traits, which resulted from con-
trasting responses of leaf and root traits to the same mul-
tiple environmental gradients. Growing evidence suggests
that there are broadly coordinated economics of both car-
bon and nutrients between plant above- and belowground
organs at the between-species level (Wright and Westoby
1999; Freschet et al. 2010; Liu et al. 2010), most likely as
a consequence of allometric, physiological, and ontoge-
netic constraints in plant evolutionary selection (Ackerly
et al. 2000; Reich et al. 2003b; Kerkhoff et al. 2006).
However, these relationships are not always apparent
(Reich et al. 2003a; Craine et al. 2005; Tjoelker et al.
2005) and can vary in their slope and intercept across
plant communities as a consequence of variation in cli-
matic or edaphic parameters (Craine et al. 2005; Wright
et al. 2005; Liu et al. 2010). The large magnitude and
orthogonal direction of intraspecific shifts in some analo-
gous leaf and root trait values (SLA vs. SRL, leaf vs. root
DMC and P; Fig. 3) that we observed at the local scale
(see also Ryser and Eek 2000) suggests a major role for
plant plasticity, as opposed to species turnover, in altering
these trait relationships across environmental gradients.
Our findings therefore suggest that global relationships
between (species mean) leaf and root traits could poten-
tially occur but effectively disrupted by plant plastic
responses to contrasting above- and belowground envi-
ronmental heterogeneity occurring at multiple spatial
scales (Ettema and Wardle 2002). These large partially de-
coupled plastic adjustments also suggest a need for many
species-centred ecological theories on how plants respond
to their environments (e.g. r–K strategy theory, competi-
tive/stress-tolerator/ruderal theory, trait-based response-
effect frameworks) to be adapted to account for distinct
plant-environment interactions among distinct individuals
of the same species and parts of the same individual.
Conclusion
Our results highlight the potentially complex integration of
multiple environmental influences by plants, stress the large
potential for plastic adjustments both above and below-
ground and reveal that these adjustments can to some
extent differ among coexisting plant species. They also sug-
gest that while there may be broadly consistent strategies at
the whole plant level among species (Grime 2001), there
are also partially decoupled, finely tuned strategies between
above- and belowground plant parts at the intraspecific
level. These findings have a number of implications for
plant community assembly, plant–soil feedbacks and eco-
system properties. For instance, they indicate that plants
are capable of considerable flexibility in passing through
multiple environmental filters that may exert contrasting
constraints on above- and belowground organs (D�ıaz et al.
1998), which may potentially impact on the resilience of
ª 2013 The Authors. Published by Blackwell Publishing Ltd. 1075
G. T. Freschet et al. Plasticity in Above- and Belowground Traits

plant communities to environmental changes. Further-
more, our finding that trait responses to the same underly-
ing environmental influences differed at least partially
among coexisting species suggests potentially complex
responses of plant communities to shifts in multiple envi-
ronmental conditions. Also, given the role that plant spe-
cies have as ecosystem drivers, the decoupled adjustments
of leaf and root traits along gradients of environmental
stresses may potentially contribute to contrasting feedbacks
of litters from above- and belowground plant organs
with soil properties (Wardle et al. 2004; Freschet et al.
2012). For all these reasons, our results stress the impor-
tance for ecologists to routinely consider the above- and
belowground components of plants together and to rec-
ognize the major role of functional trait plasticity in
driving plant responses to community assembly pro-
cesses and the effects that plants have on ecosystem
properties.
Acknowledgments
The authors are grateful to Ng�ati Hei Trust, Ng�ati Wha-
naunga, and the Ruamaahua Islands Trust for supporting
this project and allowing this experiment to occur on
their land. We appreciated the assistance of the Depart-
ment of Conservation who also permitted access to the
island, and in particular, David Towns for his involve-
ment in the project and Rob Chappell for facilitating the
quarantine procedures. We are also thankful to Ewen
Cameron, who provided contextual data on Korapuki
plant communities, Chris Jones for advice around seabird
plot design and Morgan Coleman, Jim Coleman, Brian
Karl, Kevin Drew and David Hamon who organized and
conducted field sampling for this study. Finally, Emilie
Kichenin and Saga Fogelberg provided invaluable help
with sample processing and trait measurements. GTF and
DAW were supported by a Wallenberg Scholars Award to
DAW. PJB, KIB, and PO’BL were supported through the
New Zealand Ministry of Business, Innovation and
Employment’s Science and Innovation Group funded Te
Hiringa Tangata Ki Tai Pari Ki Tai Timu (Bicultural res-
toration of coastal forest ecosystems – C09X0908) project.
Conflict of Interest
None declared.
References
Ackerly, D. D., S. A. Dudley, S. E. Sultan, J. Schmitt, J. S.
Coleman, C. R. Linder, et al. 2000. The evolution of plant
ecophysiological traits: recent advances and future
directions. Bioscience 50:979–995.
Albert, C. H., W. Thuiller, N. G. Yoccoz, A. Soudant, F.
Boucher, P. Saccone, et al. 2010. Intraspecific functional
variability: extent, structure and sources of variation. J. Ecol.
98:604–613.
Atkinson, I. A. E. 2004. Successional processes induced by fires
on the northern offshore islands of New Zealand. N. Z. J.
Ecol. 28:181–193.
Bancroft, W. J., M. J. Garkaklis, and J. D. Roberts. 2005.
Burrow building in seabird colonies: a soil-forming process
in island ecosystems. Pedobiologia 49:149–165.
Blakemore, L. C., Searle , P. L. , Daly , and B. K. 1987.
Methods for chemical analysis of soils. NZ Soil Bureau
Scientific Report 80. Department of Sciences and Industrial
Research, Wellington, NZ.
Casper, B. B., and R. B. Jackson. 1997. Plant competition
underground. Annu. Rev. Ecol. Syst. 28:545–570.
Chapin, F. S. III. 1991. Integrated responses of plants to stress.
Bioscience 41:29–36.
Chapin, F. S. III, A. J. Bloom, C. B. Field, and R. H. Waring.
1987. Plant responses to multiple environmental factors.
Bioscience 37:49–57.
Cornelissen, J. H. C., S. Lavorel, E. Garnier, S. D�ıaz, N.
Buchmann, D. E. Gurvich, et al. 2003. A handbook of
protocols for standardised and easy measurement of plant
functional traits worldwide. Aust. J. Bot. 51:335–380.
Cornwell, W. K., and D. D. Ackerly. 2009. Community
assembly and shifts in plant trait distributions across an
environmental gradient in coastal California. Ecol. Monogr.
79:109–126.
Craine, J. M., W. G. Lee, W. J. Bond, R. J. Williams, and L. C.
Johnson. 2005. Environmental constraints on a global
relationship among leaf and root traits of grasses. Ecology
86:12–19.
Crick, J. C., and J. P. Grime. 1987. Morphological plasticity
and mineral nutrient capture in two herbaceous species of
contrasted ecology. New Phytol. 107:403–414.
DeWitt, T. J., A. Sih, and D. S. Wilson. 1998. Costs and limits
of phenotypic plasticity. Trends Ecol. Evol. 13:77–81.
D�ıaz, S., M. Cabido, and F. Casanoves. 1998. Plant functional
traits and environmental filters at a regional scale. J. Veg.
Sci. 9:113–122.
Eissenstat, D. M., C. E. Wells, R. D. Yanai, and J. L. Whitbeck.
2000. Building roots in a changing environment:
implications for root longevity. New Phytol. 147:33–42.
Ellsworth, D. S., P. B. Reich, E. S. Naumburg, G. W. Koch, M.
E. Kubiske, and S. D. Smith. 2004. Photosynthesis,
carboxylation and leaf nitrogen responses of 16 species to
elevated pCO2 across four free-air CO2 enrichment
experiments in forest, grassland and desert. Glob. Change
Biol. 10:2121–2138.
Enquist, B. J., and K. J. Niklas. 2002. Global allocation rules
for patterns of biomass partitioning in seed plants. Science
295:1517–1520.
1076 ª 2013 The Authors. Published by Blackwell Publishing Ltd.
Plasticity in Above- and Belowground Traits G. T. Freschet et al.
Ettema, C. H., and D. A. Wardle. 2002. Spatial soil ecology.
Trends Ecol. Evol. 17:177–183.
Evans, J. R., and H. Poorter. 2001. Photosynthetic acclimation
of plants to growth irradiance: the relative importance of
specific leaf area and nitrogen partitioning in maximizing
carbon gain. Plant, Cell Environ. 24:755–767.
Freschet, G. T., J. H. C. Cornelissen, R. S. P. van Logtestijn,
and R. Aerts. 2010. Evidence of the ‘plant economics
spectrum’ in a subarctic flora. J. Ecol. 98:362–373.
Freschet, G. T., R. Aerts, and J. H. C. Cornelissen. 2012. A
plant economics spectrum of litter decomposability. Funct.
Ecol. 26:56–65.
Fukami, T., D. A. Wardle, P. J. Bellingham, C. P. H.
Mulder, D. R. Towns, G. W. Yeates, et al. 2006. Above-
and below-ground impacts of introduced predators in
seabird-dominated island ecosystems. Ecol. Lett. 9:1299–
1307.
Funk, J. L. 2008. Differences in plasticity between invasive and
native plants from a low resource environment. J. Ecol.
96:1162–1173.
Grassein, F., I. Till-Bottraud, and S. Lavorel. 2010. Plant
resource-use strategies: the importance of phenotypic
plasticity in response to a productivity gradient for two
subalpine species. Ann. Bot. 106:637–645.
Grime, J. P. 2001. Plant strategies, vegetation processes, and
ecosystem properties. Wiley, New York.
Herms, D. A., and W. J. Mattson. 1992. The dilemma of
plants: To grow or defend. Q. Rev. Biol. 67:283–335.
Hill, J., R. Simpson, A. Moore, and D. Chapman. 2006.
Morphology and response of roots of pasture species to
phosphorus and nitrogen nutrition. Plant Soil 286:7–19.
Kerkhoff, A. J., W. F. Fagan, J. J. Elser, and B. J. Enquist.
2006. Phylogenetic and growth form variation in the scaling
of nitrogen and phosphorus in the seed plants. Am. Nat.
168:E103–E122.
de Kroon, H., H. Huber, J. F. Stuefer, and J. M. Van
Groenendael. 2005. A modular concept of phenotypic
plasticity in plants. New Phytol. 166:73–82.
Lavorel, S., S. Gachet, A. Sahl, M. -P. Colace, S.
Gaucherand, M. Burylo, et al. 2009. A plant functional
traits data base for the Alps – understanding functional
effects of changed grassland management. Pp. 106–123 in
E. Spehn and C. K€orner, eds. Data Mining for Global
Trends in Mountain Biodiversity. CRC Press/Taylor and
Francis, Boca Raton.
Lawrence, D. 2003. The response of tropical tree seedlings to
nutrient supply: meta-analysis for understanding a changing
tropical landscape. J. Trop. Ecol. 19:239–250.
Liu, G., G. T. Freschet, X. Pan, J. H. C. Cornelissen, Y. Li, and
M. Dong. 2010. Coordinated variation in leaf and root traits
across multiple spatial scales in Chinese semi-arid and arid
ecosystems. New Phytol. 188:543–553.
Meziane, D., and B. Shipley. 1999. Interacting determinants of
specific leaf area in 22 herbaceous species: effects of
irradiance and nutrient availability. Plant, Cell Environ.
22:447–459.
Mulder, C. P. H., H. P. Jones, K. Kameda, C. Palmborg, S.
Schmidt, J. C. Ellis, et al. 2011. Impacts of seabirds on plant
and soil properties. Pp. 135–176 in C. P. H. Mulder, W. B.
Anderson, D. R. Towns and P. J. Bellingham, eds. Seabird
islands: ecology, invasion, and restoration. Oxford
University Press, New York.
Ostonen, I., €U. P€uttsepp, C. Biel, O. Alberton, M. R.
Bakker, K. L~ohmus, et al. 2007. Specific root length as an
indicator of environmental change. Plant Biosyst. 141:
426–442.
Poorter, H., €U. Niinemets, L. Poorter, I. J. Wright, and R.
Villar. 2009. Causes and consequences of variation in leaf
mass per area (LMA): a meta-analysis. New Phytol.
182:565–588.
Poorter, H., K. J. Niklas, P. B. Reich, J. Oleksyn, P. Poot, and
L. Mommer. 2012. Biomass allocation to leaves, stems and
roots: meta-analyses of interspecific variation and
environmental control. New Phytol. 193:30–50.
Reich, P. B., C. Buschena, M. G. Tjoelker, K. Wrage, J. Knops,
D. Tilman, et al. 2003a. Variation in growth rate and
ecophysiology among 34 grassland and savanna species
under contrasting N supply: a test of functional group
differences. New Phytol. 157:617–631.
Reich, P. B., I. J. Wright, J. Cavender-Bares, J. M. Craine, J.
Oleksyn, M. Westoby, et al. 2003b. The evolution of plant
functional variation: traits, spectra, and strategies. Int. J.
Plant Sci. 164:S143–S164.
Reich, P. B., M. G. Tjoelker, K. S. Pregitzer, I. J. Wright, J.
Oleksyn, and J. -L. Machado. 2008. Scaling of respiration to
nitrogen in leaves, stems and roots of higher land plants.
Ecol. Lett. 11:793–801.
Richards, C. L., O. Bossdorf, N. Z. Muth, J. Gurevitch, and M.
Pigliucci. 2006. Jack of all trades, master of some? On the
role of phenotypic plasticity in plant invasions. Ecol. Lett.
9:981–993.
Rijkers, T., T. L. Pons, and F. Bongers. 2000. The effect of tree
height and light availability on photosynthetic leaf traits of
four neotropical species differing in shade tolerance. Funct.
Ecol. 14:77–86.
Roberts, C. M., R. P. Duncan, and K. -J. Wilson. 2007.
Burrowing seabirds affect forest regeneration, Rangatira
Island, Chatham Islands, New Zealand. N. Z. J. Ecol.
31:208–222.
Rozendaal, D. M. A., V. H. Hurtado, and L. Poorter. 2006.
Plasticity in leaf traits of 38 tropical tree species in response
to light; relationships with light demand and adult stature.
Funct. Ecol. 20:207–216.
Ryser, P. 2006. The mysterious root length. Plant Soil 286:1–6.
Ryser, P., and L. Eek. 2000. Consequences of phenotypic
plasticity vs. interspecific differences in leaf and root traits
for acquisition of aboveground and belowground resources.
Am. J. Bot. 87:402–411.
ª 2013 The Authors. Published by Blackwell Publishing Ltd. 1077
G. T. Freschet et al. Plasticity in Above- and Belowground Traits
Ryser, P., and H. Lambers. 1995. Root and leaf attributes
accounting for the performance of fast- and slow-growing
grasses at different nutrient supply. Plant Soil 170:251–265.
Shipley, B., and D. Meziane. 2002. The balanced-growth
hypothesis and the allometry of leaf and root biomass
allocation. Funct. Ecol. 16:326–331.
Stansbury, C. D. 2001. Dispersal of the environmental weed
bridal creeper, Asparagus asparagoides, by silvereyes,
Zosterops lateralis, in south-western Australia. Emu 101:39–
45.
Sultan, S. E. 2000. Phenotypic plasticity for plant development,
function and life history. Trends Plant Sci. 5:537–542.
Thuiller, W., C. Albert, M. B. Ara�ujo, P. M. Berry, M. Cabeza,
A. Guisan, et al. 2008. Predicting global change impacts on
plant species’ distributions: Future challenges. Perspect.
Plant Ecol. Evol. Syst. 9:137–152.
Tjoelker, M. G., J. M. Craine, D. Wedin, P. B. Reich, and D.
Tilman. 2005. Linking leaf and root trait syndromes among
39 grassland and savannah species. New Phytol. 167:493–508.
Towns, D. R. 2002. Korapuki Island as a case study for
restoration of insular ecosystems in New Zealand. J.
Biogeogr. 29:593–607.
Valladares, F., D. Sanchez-Gomez, and M. A. Zavala. 2006.
Quantitative estimation of phenotypic plasticity: bridging
the gap between the evolutionary concept and its ecological
applications. J. Ecol. 94:1103–1116.
Valladares, F., E. Gianoli, and J. M. G�omez. 2007. Ecological
limits to plant phenotypic plasticity. New Phytol. 176:749–763.
Van Kleunen, M., and M. Fischer. 2005. Constraints on the
evolution of adaptive phenotypic plasticity in plants. New
Phytol. 166:49–60.
Van Wijk, M. T., M. Williams, L. Gough, S. E. Hobbie, and G.
R. Shaver. 2003. Luxury consumption of soil nutrients: a
possible competitive strategy in above-ground and below-
ground biomass allocation and root morphology for slow-
growing arctic vegetation? J. Ecol. 91:664–676.
Wahl, S., P. Ryser, and P. J. Edwards. 2001. Phenotypic
plasticity of grass root anatomy in response to light intensity
and nutrient supply. Ann. Bot. 88:1071–1078.
Wardle, D. A., R. D. Bardgett, J. N. Klironomos, H. Setala, W.
H. van der Putten, and D. H. Wall. 2004. Ecological
linkages between aboveground and belowground biota.
Science 304:1629–1633.
Wardle, D. A., P. J. Bellingham, K. I. Bonner, and C. P. H.
Mulder. 2009. Indirect effects of invasive predators on litter
decomposition and nutrient resorption on seabird-
dominated islands. Ecology 90:452–464.
Warton, D. I., I. J. Wright, D. S. Falster, and M. Westoby.
2006. Bivariate line-fitting methods for allometry. Biol. Rev.
81:259–291.
Williams, P. A. 2006. The role of blackbirds (Turdus merula)
in weed invasion in New Zealand. N. Z. J. Ecol. 30:285–291.
Wright, I. J., and M. Westoby. 1999. Differences in seedling
growth behaviour among species: trait correlations across
species, and trait shifts along nutrient compared to rainfall
gradients. J. Ecol. 87:85–97.
Wright, I. J., P. B. Reich, J. H. C. Cornelissen, D. S. Falster, P.
K. Groom, K. Hikosaka, et al. 2005. Modulation of leaf
economic traits and trait relationships by climate. Glob.
Ecol. Biogeogr. 14:411–421.
Xia, J., and S. Wan. 2008. Global response patterns of
terrestrial plant species to nitrogen addition. New Phytol.
179:428–439.
Yano, K., and T. Kume. 2005. Root morphological plasticity
for heterogeneous phosphorus supply in Zea mays L. Plant
Prod. Sci. 8:427–432.
Supporting Information
Additional Supporting Information may be found in the
online version of this article:
Table S1. Linear models of single and multiple environ-
mental parameters’ fit of leaf and fine root dry matter
content of three sub-canopy tree species.
Table S2. Linear models of single and multiple environ-
mental parameters’ fit of leaf and fine root phosphorus
content of three sub-canopy tree species.
1078 ª 2013 The Authors. Published by Blackwell Publishing Ltd.
Plasticity in Above- and Belowground Traits G. T. Freschet et al.

Supporting Information
Table S1 Linear models of single and multiple environmental parameters’ fit of leaf and fine root dry matter content of three sub-
canopy tree species
Sign R² AIC Sign R² AIC Sign R² AIC Sign R² AIC Sign R² AIC Sign R² AIC
Burrow density + 0.13 89.2 + 0.43 90.6 + 0.59 77.1 - 0.27 97.2 - 0.13 93.5 - 0.50 81.1
Soil Nutrient availability + 0.11 89.7 + 0.10 97.0 + 0.09 86.8 - 0.64 86.9 - 0.63 81.7 - 0.58 78.8
Soil Water content - 0.22 87.7 - 0.17 95.8 - 0.13 86.2 + 0.04 101.4 + 0.26 91.4 + 0.10 88.1
Light availability + 0.13 89.3 + 0.35 92.5 + 0.41 81.7 + 0.01 101.9 - 0.06 94.6 - 0.02 89.1
Burrow + Nutrient + . + 0.14 91.0 + , - 0.45 92.0 + , - 0.63 78.1 + , - 0.64 88.8 + , - 0.67 82.0 - , - 0.69 77.5
Burrow + Water + , - 0.26 88.8 + , - 0.49 91.2 + , - 0.60 79.0 - , + 0.28 99.2 - , + 0.30 92.4 - , + 0.50 83.0
Burrow + Light + . + 0.18 90.4 + . + 0.54 89.6 + . + 0.66 77.1 - , + 0.40 96.3 - , - 0.14 95.4 - , + 0.58 81.0
Nutrient + Water + , - 0.23 89.5 + , - 0.19 97.5 + , - 0.15 88.0 - , - 0.68 86.8 - , + 0.65 82.8 - , - 0.60 80.4
Nutrient + Light + . + 0.18 90.4 + . + 0.37 94.1 + . + 0.41 83.6 - , + 0.77 82.0 - , + 0.63 83.7 - , + 0.60 80.3
Water + Light - , + 0.25 89.1 - , + 0.38 93.7 - , + 0.42 83.3 + . + 0.08 102.8 + , - 0.26 93.3 + , - 0.10 90.1
Burrow + Nutrient + Water + , - , - 0.27 90.7 + , - , + 0.55 91.2 + , - , - 0.65 79.2 + , - , - 0.68 88.8 + , - , + 0.69 83.1 - , - , - 0.71 78.5
Burrow + Nutrient + Light + , + , + 0.19 92.2 + , - , + 0.57 90.7 + , - , + 0.70 77.6 - , - , + 0.78 83.2 + , - , - 0.67 83.8 - , - , + 0.78 75.0
Burrow + Water + Light + , - , + 0.28 90.5 + , - , + 0.56 91.1 + , - , + 0.66 79.1 - , + , + 0.43 97.6 - , + , + 0.31 94.4 - , + , + 0.59 82.6
Nutrient + Water + Light + , - , + 0.25 91.0 + , - , + 0.39 95.6 + , - , + 0.42 85.3 - , - , + 0.78 83.2 - , + , + 0.65 84.7 - , - , + 0.61 82.1
Melicytus
Leaf dry matter content (mg g-1) Root dry matter content (mg g-1)
Signs of model parameters are displayed for each model. The fraction of total trait variation explained by each model is represented by regression coefficients R2. Models w ith Akaike's information criterion (AIC) ≤ (low est
AIC + 1) w ere considered of high likelihood and indicated in bold. The number of tree populations is 15 for Pittosporum crassifolium , 14 for Coprosma macrocarpa and 12 for Melicytus ramiflorus .
Pittosporum Coprosma Melicytus Pittosporum Coprosma

Table S2 Linear models of single and multiple environmental parameters’ fit of leaf and fine root phosphorus concentration of three
sub-canopy tree species
Sign R² AIC Sign R² AIC Sign R² AIC Sign R² AIC Sign R² AIC Sign R² AIC
Burrow density - 0.02 -75.7 - 0.00 -86.3 + 0.03 -47.2 - 0.28 -90.9 - 0.11 -96.1 - 0.10 -80.3
Soil Nutrient availability - 0.02 -75.8 - 0.00 -86.3 + 0.33 -51.6 - 0.01 -86.1 + 0.04 -95.1 + 0.02 -79.3
Soil Water content + 0.04 -76.0 + 0.07 -87.3 + 0.00 -46.8 + 0.03 -86.5 + 0.04 -95.1 + 0.02 -79.3
Light availability - 0.00 -75.5 - 0.02 -86.5 - 0.04 -47.3 - 0.12 -87.9 - 0.10 -96.0 - 0.19 -81.6
Burrow + Nutrient - , - 0.02 -73.8 - , - 0.00 -84.3 - , + 0.37 -50.4 - , + 0.40 -91.6 - , + 0.40 -99.7 - , + 0.26 -80.7
Burrow + Water - , + 0.04 -74.1 + . + 0.08 -85.4 + . + 0.03 -45.2 - , + 0.28 -88.9 - , + 0.12 -94.3 - , + 0.10 -78.3
Burrow + Light - , + 0.02 -73.7 + , - 0.02 -84.5 + , - 0.14 -46.7 - , - 0.29 -89.2 - , - 0.14 -94.7 - , - 0.20 -79.7
Nutrient + Water - , + 0.04 -74.0 + . + 0.08 -85.5 + . + 0.47 -52.4 - , + 0.03 -84.5 + . + 0.15 -94.8 + . + 0.09 -78.2
Nutrient + Light - , + 0.02 -73.8 + , - 0.02 -84.5 + , - 0.51 -53.5 + , - 0.12 -85.9 + , - 0.20 -95.7 + , - 0.30 -81.3
Water + Light + . + 0.04 -74.0 + , - 0.07 -85.3 - , - 0.04 -45.4 + , - 0.12 -85.9 + , - 0.11 -94.1 - , - 0.19 -79.6
Burrow + Nutrient + Water - , - , + 0.04 -72.1 - , + , + 0.08 -83.5 - , + , + 0.50 -51.0 - , + , + 0.42 -90.2 - , + , + 0.52 -100.7 - , + , + 0.30 -79.4
Burrow + Nutrient + Light - , - , + 0.02 -71.8 + , - , - 0.02 -82.5 - , + , - 0.51 -51.5 - , + , - 0.42 -90.1 - , + , - 0.45 -98.8 - , + , - 0.38 -80.8
Burrow + Water + Light - , + , + 0.04 -72.1 + , + , - 0.08 -83.4 + , - , - 0.14 -44.7 - , - , - 0.29 -87.2 - , + , - 0.14 -92.7 - , - , - 0.20 -77.8
Nutrient + Water + Light - , + , + 0.04 -72.1 + , + , - 0.09 -83.5 + , + , - 0.59 -53.6 + , + , - 0.12 -83.9 + , + , - 0.25 -94.5 + , + , - 0.32 -79.7
Signs of model parameters are displayed for each model. The fraction of total trait variation explained by each model is represented by regression coefficients R2. Models w ith Akaike's information criterion (AIC) ≤ (low est
AIC + 1) w ere considered of high likelihood and indicated in bold. The number of tree populations is 15 for Pittosporum crassifolium , 14 for Coprosma macrocarpa and 12 for Melicytus ramiflorus .
Pittosporum Melicytus Pittosporum Coprosma Melicytus
Root phosphorus content (%)Leaf phosphorus content (%)
Coprosma