Imitation in Literary Theory and Practice in Italy, 1400 - 1530 ...

YAG:Dy and YAG:Tm Fluorescence Above 1400 C
M R. Cates, S. W. Allison, S. L. Jaiswal, D. L. Beshears Oak Ridge National Laboratory 2360 Cherahala Blvd, MS-6472
Knoxville, TN 37932
ABSTRACT Fluorescence from three samples of YAG:Tm, and three samples of YAG:Dy, with different activator concentrations, was measured for a wide temperature range, extending from room temperature to about 1700 C. Fluorescence lifetimes were measured for emissions at 460 nm from the YAG:Tm and at 453, 480, and 575 nm from YAG:Dy. The measurement system is described, including techniques for ac-commodating the high background blackbody radiation encountered at these very high temperatures. Data compilations are shown, including the fluorescence lifetimes over the temperature range of the measurement. This study has extended the high-temperature range of phosphor thermometry by ap-proximately 200 C and shown the feasibility of using phosphor materials for very high temperature non-contact thermometry, opening up further applications for engines, materials, high-temperature process-ing, and related areas.
INTRODUCTION Phosphor thermometry has been used for non-contact temperature measurement in many applications over the last couple of decades.1-6 A number of the applications have been associated with high tempera-tures, especially for systems where blackbody radiation backgrounds are high and when challenging measurement environments, such as vibrations, rotation, flame, electromagnetic noise, etc., have re-stricted the use of thermocouples or infrared thermometric techniques. In particular, temperature meas-urement inside jet turbine engines or other similar high-temperature devices is especially amenable to phosphor techniques. Often the fluorescent materials are used in powder form, either suspended in binders and applied very much like paint or applied as high-temperature sprays. Thin coatings ( ~50 mi-crons thickness or less) are used on surfaces of interest. These coatings will quickly assume the same temperatures as the surface to which they are applied, so that monitoring the coating temperature is tan-tamount to measuring the temperature of the surface to which they are applied. In some applications where temperatures are changing at rates greater than hundreds of degrees per second it requires knowl-edge of the phosphor coating thermal response to properly unfold the material surface temperature; but most applications involve much slower temperature transients where the coating-surface correspondence is unambiguous. The temperature dependence of fluorescent materials is dependent on the matrix spectral into which a low-percentage of activator ions has been added, as well as the ionic properties of the activator itself.7 Often, for high-temperature applications, the matrices used are refractory chemicals that include rare-

2
earth metal ions. These materials will survive the high temperatures, which they would monitor, and can be configured to have fluorescent emissions that are changing rapidly in lifetime and intensity over the temperature range of interest. Two such materials were studied here: YAG:Tm and YAG: Dy. (The YAG formulation is written chemically as Y3Al5O12.) The activators Tm+++ and Dy+++ replace some percentage of the Y ions in the material lattice. It was known from other measurements8,9 that materials of this type might be usable at extremely high temperatures. In this project we showed this to be the case and extended the measurement range about 200 C higher than any previously reported measure-ments of which we are aware.
TECHNICAL BACKGROUND Figures 1 and 2 show the emission spectra of YAG:Tm and YAG:Dy, respectively, measured for a vari-ety of activator concentrations. The measurements were made using a Perkin Elmer Model LS50B spec-trophotometer at 355 nm excitation. The wavelength and samples chosen were planned to correspond to the later study of their fluorescence lifetimes. The specific samples measured included a number of those studied in the high-temperature furnace. In the spectrophotometer, the sample configuration was duplicated for all measurements; therefore, the amplitude values can be compared from sample to sam-ple. Variations can occur in the preparation of samples of research phosphors like these, sometimes causing batch-dependent differences in fluorescence characteristics. All spectrophotometer data were obtained at room temperature. Note that for YAG:Tm the strongest band – consisting of several emis-sion peaks -- is centered near 460 nm. For YAG:Dy two bands are strongly excited, centered near 480 and 575 nm. In addition, in YAG:Dy a shorter wavelength band (centered at 453 nm), only weakly ex-cited at room temperature and not clearly discernible in Figure 2, grows in strength as the phosphor is heated, becoming similar in intensity to the other bands.
FIGURE 1. EMISSION SPECTRA AT ROOM TEMPERATURE FOR YAG:TM
(EXCITATION ENERGY 355 NM) FOR VARIOUS ACTIVATOR CONCENTRATIONS.

3
FIGURE 2. EMISSION SPECTRA AT ROOM TEMPERATURE FOR YAG:DY (EXCITATION ENERGY 355 NM) FOR VARIOUS ACTIVATOR CONCENTRATIONS.
In a simple fluorescence model for many phosphors, the emission lifetime arises from depletion of the electron population for some excited state in the activator ion by photon emission (the fluorescence) in competition with non-photon de-excitation processes. As the temperature increases into the sensitive range for a particular emission wavelength the non-photon processes allowed by the quantum behavior of the molecule de-excite a larger and larger fraction of the electron population, leaving fewer to de-excite by photon emission. Because the fluorescence is essentially a statistical process dependent on the excited electron population the signal intensity I at any time can be written, to a close approximation, as I = I0 e-t/τ, where t is the time, I0 is the intensity at t = 0, and τ is the “lifetime”. This lifetime τ is the slope of the natural log of the time dependent emission, a critical parameter dependent on temperature. The fluores-cent emissions measured in this study approximate, but vary to some extent from the single-exponential behavior expressed in the equation. In the measurement system, single exponential fits to the fluores-cence-intensity-versus-time data are routinely performed so that a resulting single value of τ can be used to describe the fluorescence at a particular temperature. The actual data vary to a greater or lesser extent (depending on activator concentration and temperature) from the single-exponential behavior and could be analyzed in a more general way, involving further exponential components, a direct correlation analysis; or a similar treatment, however, in this study the single-exponential assumption has been used throughout for simplicity. Although the extracted lifetime values at any temperature can vary according to parametric choices – when the emission is not truly single-exponential -- the variations are unimpor-tant with respect to evaluating the temperature response range of the particular phosphor. Figures 3 and 4 show the energy diagrams for the Tm and Dy ions, respectively, that activate the two phosphor types used. The photon emission band centered near 460 nm in Tm corresponds to transitions from 1D2 to 3F4.10 The three emission bands in Dy arise from 4I to 6H transitions in the Dy+++.11 The more energetic Dy emission at 453 nm wavelength, weak at room temperature but continuously stronger at higher temperature, probably is populated in part from energy broadening of the band at 480

4
nm
FIGURE 3. SIMPLIFIED ENERGY DIAGRAM FOR TM+++
FIGURE 4. SIMPLIFIED ENERGY DIAGRAM FOR DY+++
5
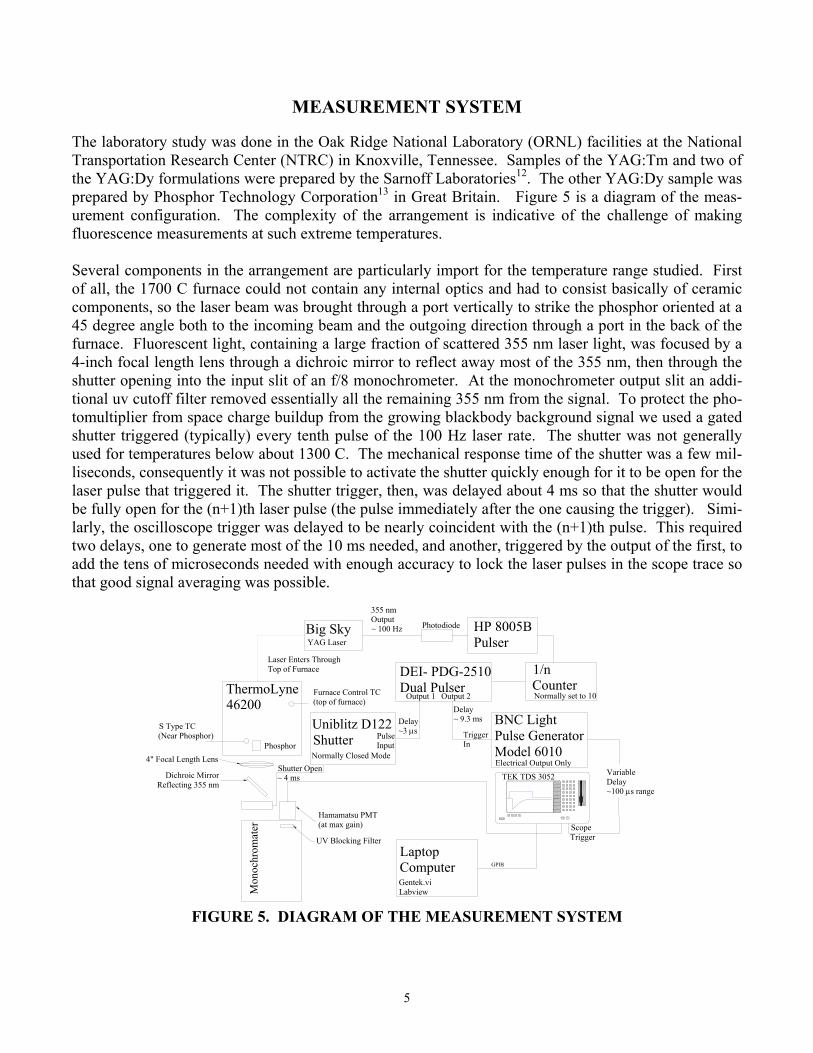
MEASUREMENT SYSTEM The laboratory study was done in the Oak Ridge National Laboratory (ORNL) facilities at the National Transportation Research Center (NTRC) in Knoxville, Tennessee. Samples of the YAG:Tm and two of the YAG:Dy formulations were prepared by the Sarnoff Laboratories12. The other YAG:Dy sample was prepared by Phosphor Technology Corporation13 in Great Britain. Figure 5 is a diagram of the meas-urement configuration. The complexity of the arrangement is indicative of the challenge of making fluorescence measurements at such extreme temperatures. Several components in the arrangement are particularly import for the temperature range studied. First of all, the 1700 C furnace could not contain any internal optics and had to consist basically of ceramic components, so the laser beam was brought through a port vertically to strike the phosphor oriented at a 45 degree angle both to the incoming beam and the outgoing direction through a port in the back of the furnace. Fluorescent light, containing a large fraction of scattered 355 nm laser light, was focused by a 4-inch focal length lens through a dichroic mirror to reflect away most of the 355 nm, then through the shutter opening into the input slit of an f/8 monochrometer. At the monochrometer output slit an addi-tional uv cutoff filter removed essentially all the remaining 355 nm from the signal. To protect the pho-tomultiplier from space charge buildup from the growing blackbody background signal we used a gated shutter triggered (typically) every tenth pulse of the 100 Hz laser rate. The shutter was not generally used for temperatures below about 1300 C. The mechanical response time of the shutter was a few mil-liseconds, consequently it was not possible to activate the shutter quickly enough for it to be open for the laser pulse that triggered it. The shutter trigger, then, was delayed about 4 ms so that the shutter would be fully open for the (n+1)th laser pulse (the pulse immediately after the one causing the trigger). Simi-larly, the oscilloscope trigger was delayed to be nearly coincident with the (n+1)th pulse. This required two delays, one to generate most of the 10 ms needed, and another, triggered by the output of the first, to add the tens of microseconds needed with enough accuracy to lock the laser pulses in the scope trace so that good signal averaging was possible.
FIGURE 5. DIAGRAM OF THE MEASUREMENT SYSTEM
YAG Laser
HP 8005B Pulser
1/n CounterNormally set to 10
DEI- PDG-2510 Dual Pulser
Uniblitz D122 ShutterNormally Closed Mode
BNC Light Pulse Generator Model 6010Electrical Output Only
Photodiode
Output 1 Output 2
Big Sky
TEK TDS 3052
ScopeTrigger
PulseInput
Delay~3 µs Trigger
In
ThermoLyne 46200
Mon
ochr
omat
er
4" Focal Length Lens
Dichroic Mirror Reflecting 355 nm
Hamamatsu PMT(at max gain)
UV Blocking Filter
Phosphor
Furnace Control TC (top of furnace)
S Type TC(Near Phosphor)
Laptop ComputerGentek.vi Labview
GPIB
Delay~ 9.3 ms
Shutter Open ~ 4 ms
Laser Enters Through Top of Furnace
Variable Delay~100 µs range
355 nm Output ~ 100 Hz

6
The 355-nm (tripled fundamental) laser energy was about 3 millijoules per pulse. At room temperature the optical system provided peak signals of up to around 200 mV into 50 ohms of scope impedance. The signals were noisy and required signal averaging (usually 512 averages) to produce a waveform from which a lifetime could be extracted with less than 1% variance (for a given choice of parameters in the exponential fit) at a fixed temperature. Figure 6 is a photograph of the arrangement of the mono-chrometer and optics back of the furnace. In Figure 7 is shown the lens, dichroic mirror, shutter and photomultiplier. Also in Figure 7 (foreground) is the S-type thermocouple sheath, inserted into the fur-nace chamber at the same level and beside the measurement sample. Figure 8 is a photograph of the ce-ramic assembly where the phosphor sample was located. The phosphor was in powder form for all the measurements. The actual laser-induced fluorescence is shown in a mirror imaging the phosphor (upper part of the photograph), the powder located in an alumina “boat” facing the back of the furnace where the exit aperture is located. The signal data were processed in a scope-computer arrangement, pictured in Figure 9. The scope waveforms were transferred by a GPIB interface to a laptop computer, processed by a LabView Virtual Instrument that extracts a lifetime and transfers data waveforms into the computer for archiving and any further processing.
FIGURE 6. ARRANGEMENT BEHIND THE 1700 C FURNACE
FIGURE 7. DETAILS OF THE OPTICS

7
FIGURE 8. PHOSPHOR IN CERAMIC ASSEMBLY
FIGURE 9. COMPUTER, OSCILLOSCOPE, AND PULSERS
PHOSPHOR DATA
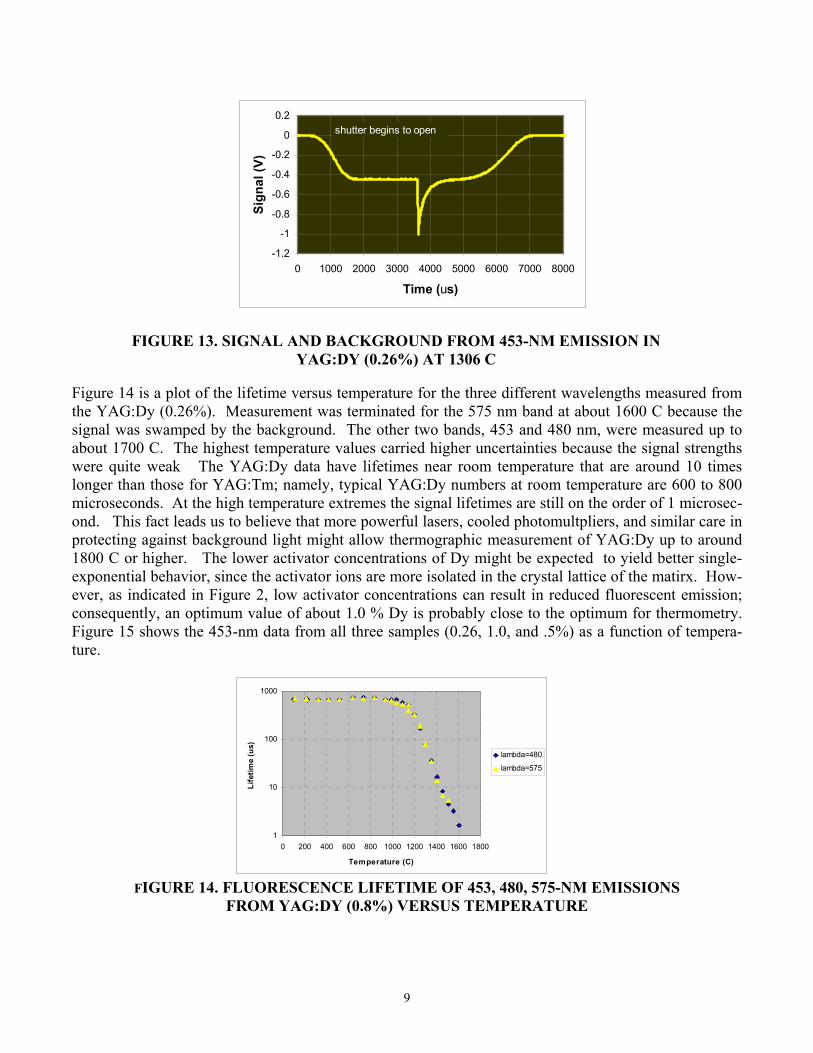
Figure 10 is a representative sample of the signal data from YAG:Tm. The sample used was .5% Tm. We also studied samples with 0.14 and 0.26 % Tm. The two lower concentration samples were taken up to around 1400 C and the .5% sample to about 1500 C. Figure 11 is a plot of the fluorescent lifetime versus temperature for each of the YAG:Tm samples. With the Y-axis (lifetime) plotted on a logarith-mic scale, the strong temperature dependence after the “knee,” the onset of quenching, of the response curve (near 1000 C) is very close to linear. This kind of behavior is typical for thermographic phos-phors. Notice that the “unquenched” lifetimes at lower temperatures are no greater than about 60 micro-seconds. The lifetimes near the upper end of their temperature ranges were reduced to less than 100 nanoseconds. Figure 12 shows some typical signal data for the YAG: Dy. Here the activator concentra-tion is 0.26%. We also measured data from 1.0 and 1.5 % concentrations. For this phosphor we meas-ured three emission bands, centered at 453, 480 and 575 nm. As illustrated in Figure 12, all three bands have approximately the same temperature-dependent response but the higher energy 453 and 480 nm bands are much less affected by the growing blackbody radiation background at the highest tempera-tures. To illustrate that background, and to illustrate the behavior of the mechanical shutter, Figure 13 shows a signal, including the blackbody background from the 453-nm band at 1306 C. In the figure, the (negative-going) photomultiplier signal begins with the shutter closed, generating an output near zero until the shutter begins to open at about 0.5 ms. The shutter is completely open at about 1.8 ms, where the approximately 450-mV signal arises entirely from the blackbody emission. At about 3.6 ms, when the laser fires, the fluorescence signal is built on this baseline. At about 5.2 ms the shutter begins to close, and is completely

8
closed by 7.0 ms. At higher temperatures the blackbody background signal increases in signal strength and the data signal gets progressively weaker.
FIGURE 10. SIGNAL FROM 460-NM EMISSION FROM YAG:TM (1.5%) AT 1092 C
FIGURE 11. FLUORESCENT LIFETIME OF 460-NM EMISSIONS FROM YAG:TM, AT 0.14, 0.26, .5% TM ACTIVATOR
FIGURE 12. SIGNAL FROM 453, 480, 575-NM EMISSIONS FROM YAG:DY (0.26%) AT 1039 C
-1
-0.8
-0.6
-0.4
-0.2
0
0.2
0 5 10 15 20 25 30 35 40
Time (us)
Sign
al (V
)
-1.2
-1
-0.8
-0.6
-0.4
-0.2
0
0.2
0 500 1000 1500 2000 2500 3000 3500 4000
Time (us)
Sign
al (V
)
575nm emission453 nm emission480 nm emission
9
-1.2
-1
-0.8
-0.6
-0.4
-0.2
0
0.2
0 1000 2000 3000 4000 5000 6000 7000 8000
Time (us)
Sign
al (V
)
shutter begins to open
FIGURE 13. SIGNAL AND BACKGROUND FROM 453-NM EMISSION IN YAG:DY (0.26%) AT 1306 C
Figure 14 is a plot of the lifetime versus temperature for the three different wavelengths measured from the YAG:Dy (0.26%). Measurement was terminated for the 575 nm band at about 1600 C because the signal was swamped by the background. The other two bands, 453 and 480 nm, were measured up to about 1700 C. The highest temperature values carried higher uncertainties because the signal strengths were quite weak The YAG:Dy data have lifetimes near room temperature that are around 10 times longer than those for YAG:Tm; namely, typical YAG:Dy numbers at room temperature are 600 to 800 microseconds. At the high temperature extremes the signal lifetimes are still on the order of 1 microsec-ond. This fact leads us to believe that more powerful lasers, cooled photomultpliers, and similar care in protecting against background light might allow thermographic measurement of YAG:Dy up to around 1800 C or higher. The lower activator concentrations of Dy might be expected to yield better single-exponential behavior, since the activator ions are more isolated in the crystal lattice of the matirx. How-ever, as indicated in Figure 2, low activator concentrations can result in reduced fluorescent emission; consequently, an optimum value of about 1.0 % Dy is probably close to the optimum for thermometry. Figure 15 shows the 453-nm data from all three samples (0.26, 1.0, and .5%) as a function of tempera-ture.
FIGURE 14. FLUORESCENCE LIFETIME OF 453, 480, 575-NM EMISSIONS FROM YAG:DY (0.8%) VERSUS TEMPERATURE
1
10
100
1000
0 200 400 600 800 1000 1200 1400 1600 1800
Temperature (C)
Life
time
(us)
lambda=480
lambda=575

10
FIGURE 15. FLUORESCENCE LIFETIME OF 453-NM EMISSIONS FROM YAG:DY, AT
0.26, 1.0, .5 % TM ACTIVATOR CONCENTRATIONS, VERSUS TEMPERATURE
YAG:Dy DATA ABOVE 1600 C The extraction of a signal lifetime for the very high temperature data is limited by the signal strength, the signal-to-noise ratio, and by the blackbody background that must be subtracted. In our data the automatic subtraction of background was not reliable above 1600 C, although the examination of the data showed that the signal remained measurable. An example is shown in Figure 16, for YAG:Dy (0.26%). Two signals are shown: the total signal, including the background, and the background signal alone. In order to process the data it was necessary to slightly change the phase of the background sig-nal to align it with the characteristic shape on the total signal. When the subtraction was made the resul-tant fluorescence signal resulted. Its lifetime in this instance was about 1.5 microseconds, consistent with the trends shown in Figures 14 and 15.
FIGURE 16. SIGNAL AND BACKGROUND (INVERTED) FROM 453-NM
OF YAG:DY (0.26%) AT 1705 C

11
CONCLUSIONS
These measurements have extended the high-temperature range of phosphor thermometry a full 200 C above any prior data of which we are aware. By being able to routinely monitor surface temperatures at 1600 C or higher, ceramic processes, jet turbine combustion, and other industrial operations can be con-trolled and studied with a facility that has heretofore not been available. The measurement methods used to obtain these data can be modified and adapted to “real-world” configurations that will make proper utilization possible. With improvements in some of the measurement parameters, even higher temperatures than those obtained in this study may be achieved, pushing toward the material breakdown limits of the phosphors themselves.
ACKNOWLEDGEMENTS
The authors wish to thank Shawn Goedeke for his helpful support in the laboratory and in preparation of the experimental arrangement chart. We are also grateful to Tom Bonsett and Andy Brewington of the Rolls Royce Corporation, and to Tim Bencic and Carolyn Mercer of NASA Glen Research Center for financial support of this high temperature phosphor study program. ORNL is operated by UT-Battelle, LLC, for the U.S. Department of Energy under contract DE-AC05-00OR22725.
REFERENCES 1. S. W. Allison and G. T. Gillies, "Remote thermometry with thermographic phosphors Instrumentation and applications." Rev. Sci. Instrum, 68 (7), 2615-2650, 1997. 2. M. R. Cates, S. W. Allison, L. A. Franks, H. M. Borella, B. R. Marshall, and B. W. Noel, “Laser-Induced Fluorescence of Europium-Doped Yttrium Oxide for Remote High-Temperature Thermome-try,” Proc. Laser Inst. Am. 49-51, 142 (1985). 3. S. W. Allison, L. A. Boatner, G. T. Gillies, “Characterization of High-Temperature Thermographic Phosphors: Spectral Properties of LuPO4:Dy (1%)Eu(2%),” Appl. Opt. 34, 5624 (1995). 4. Shionoya S and Yen W M eds, Phosphor Handbook 1999 CRC Press 189, p.496. 5. S. W. Allison, L. A. Boatner, G. T. Gillies, “Characterization of High-Temperature Thermographic Phosphors: Spectral Properties of LuPO4:Dy(1%),Eu(2%),” Appl. Opt. 34, 5624 (1995). 6. A. C. Edge, G. Laufer, and R. H. Krauss, "Surface temperature-field imaging with laser-induced thermographic phosphorescence," Appl. Opt. 39(4), 546-553, 2000. 7. W. H. Fonger and C. W. Struck, “Eu+++ 5D Resonance Quenching to the Charge-Transfer States in Y2O2S, La2O2S, and LaOCl,” J. Chem Phys. 52, 6364 (1970). 8. L. P. Goss, A. A. Smith, M. E. Post, “Surface Thermometry by Laser-Induced Fluorescence,” Rev. Sci. Instr. 60 (12), pp. 3702-3706 (1989). 9. W. Lewis, W. D. Turley, H. M. Borella, and B. W. Noel, “Noncontact Thermometry in Excess of 2500 F using Thermographic Phosphors,” in Proc. 36th International Instrumentation Symposium, ISA, Research Triangle Park, NC 1990, pp 23-27. 10. O. A. Lopez, J. McKittrick, L.E. Shea, “Fluorescence properties of polycrystalline Tm+++-activated Y3Al5O12 and Tm+++-Li+ co-activated Y3Al5O12. In the visible and near IR ranges,” Journal of Lumi-nescence 71, 1-11 (1997).

12
11. J. Ohwald and Y. Wang, “1.3 µm to visible upconversion in Dy+++- and Er+++-codoped BaCl2 phosphor,” Appl. Phys. Lett 65 (2), 129-131 (July 1994). 12.www.sarnoff.com/consumer_electronics/display_technology/phosphors.asp 13. www.phosphor-technology.com/
Copyright © 2022 FDOKUMEN