Procedures for quantification of belowground biomass of three mangrove tree species
16
ORIGINAL PAPER Procedures for quantification of belowground biomass of three mangrove tree species Marco Andrew Njana • Tron Eid • Eliakimu Zahabu • Rogers Malimbwi Received: 10 June 2014 / Accepted: 24 February 2015 Ó Springer Science+Business Media Dordrecht 2015 Abstract A review of studies on belowground biomass (BGB) of mangroves revealed that proce- dures for excavation and determination of dry weight are insufficiently documented. The main objective of this study was therefore to describe procedures for quantification of tree BGB for Avicennia marina (Forssk.), Sonneratia alba J. Smith and Rhizophora mucronata Lam. The study covered four sites in Tanzania where 30 trees were sampled (10 for each species). A new root sampling procedure applied for A. marina and S. alba seemed to work adequately. Dry to fresh weight ratios (DF-ratios) varied between tree species, between tree sizes and between root compo- nents. Therefore, for each tree species, tree- and root component-specific DF-ratios were applied for dry weight determination. For A. marina and S. alba trees, a significant proportion of total tree BGB is stored in the root crown (34 and 10 % respectively). Future studies should therefore ensure inclusion of root crown when accounting for total tree BGB. Tests of previously developed models on our data revealed large prediction errors, partly due to differences in site conditions and partly due to incomprehensive exca- vation procedures applied when these models were developed. Local tree BGB models for mangroves should therefore be developed. Keywords Avicenia–Rhizophora–Sonneratia Root biomass Root sampling Tanzania Introduction Mangroves are an important and productive ecosys- tem. Among other functions, mangroves store large amounts of carbon per unit area (e.g. Murdiyarso et al. 2009; Donato et al. 2011; Kauffman et al. 2011). Large proportions of carbon in mangroves is also stored belowground, which are highly vulnerable to distur- bances whose consequences include the release of greenhouse gasses (Hutchings and Saenger 1987; Komiyama et al. 2000; Kauffman and Donato 2012). In Tanzania mainland, mangroves cover about 108,000 ha (Wang et al. 2003). In total there are ten tree species, and among them Avicenia marina (Forssk.) Vierh, Sonneratia alba J. Smith and Rhi- zophora mucronata Lam. are dominant (Wang et al. 2003; Luoga et al. 2004; Nshare et al. 2007). Despite their importance, mangroves are threatened by defor- estation and forest degradation in Tanzania (e.g. Wang M. A. Njana (&) E. Zahabu R. Malimbwi Department of Forest Mensuration and Management, Sokoine University of Agriculture, P. O. Box 3013, Morogoro, Tanzania e-mail: [email protected]; [email protected] T. Eid Department of Ecology and Natural Resources Management, Norwegian University of Life Sciences, P. O. Box 5003, 1432 A ˚ s, Norway 123 Wetlands Ecol Manage DOI 10.1007/s11273-015-9417-3
Transcript of Procedures for quantification of belowground biomass of three mangrove tree species

ORIGINAL PAPER
Procedures for quantification of belowground biomassof three mangrove tree species
Marco Andrew Njana • Tron Eid •
Eliakimu Zahabu • Rogers Malimbwi
Received: 10 June 2014 / Accepted: 24 February 2015
� Springer Science+Business Media Dordrecht 2015
Abstract A review of studies on belowground
biomass (BGB) of mangroves revealed that proce-
dures for excavation and determination of dry weight
are insufficiently documented. The main objective of
this study was therefore to describe procedures for
quantification of tree BGB for Avicennia marina
(Forssk.), Sonneratia alba J. Smith and Rhizophora
mucronata Lam. The study covered four sites in
Tanzania where 30 trees were sampled (10 for each
species). A new root sampling procedure applied for
A. marina and S. alba seemed to work adequately. Dry
to fresh weight ratios (DF-ratios) varied between tree
species, between tree sizes and between root compo-
nents. Therefore, for each tree species, tree- and root
component-specific DF-ratios were applied for dry
weight determination. For A. marina and S. alba trees,
a significant proportion of total tree BGB is stored in
the root crown (34 and 10 % respectively). Future
studies should therefore ensure inclusion of root crown
when accounting for total tree BGB. Tests of
previously developed models on our data revealed
large prediction errors, partly due to differences in site
conditions and partly due to incomprehensive exca-
vation procedures applied when these models were
developed. Local tree BGB models for mangroves
should therefore be developed.
Keywords Avicenia–Rhizophora–Sonneratia � Root
biomass � Root sampling � Tanzania
Introduction
Mangroves are an important and productive ecosys-
tem. Among other functions, mangroves store large
amounts of carbon per unit area (e.g. Murdiyarso et al.
2009; Donato et al. 2011; Kauffman et al. 2011). Large
proportions of carbon in mangroves is also stored
belowground, which are highly vulnerable to distur-
bances whose consequences include the release of
greenhouse gasses (Hutchings and Saenger 1987;
Komiyama et al. 2000; Kauffman and Donato 2012).
In Tanzania mainland, mangroves cover about
108,000 ha (Wang et al. 2003). In total there are ten
tree species, and among them Avicenia marina
(Forssk.) Vierh, Sonneratia alba J. Smith and Rhi-
zophora mucronata Lam. are dominant (Wang et al.
2003; Luoga et al. 2004; Nshare et al. 2007). Despite
their importance, mangroves are threatened by defor-
estation and forest degradation in Tanzania (e.g. Wang
M. A. Njana (&) � E. Zahabu � R. Malimbwi
Department of Forest Mensuration and Management,
Sokoine University of Agriculture,
P. O. Box 3013, Morogoro, Tanzania
e-mail: [email protected];
T. Eid
Department of Ecology and Natural Resources
Management, Norwegian University of Life Sciences,
P. O. Box 5003, 1432 As, Norway
123
Wetlands Ecol Manage
DOI 10.1007/s11273-015-9417-3

et al. 2003) and in different parts of the globe (e.g.
Valiela et al. 2001; FAO 2007).
Various methods may be employed to quantify
forest carbon stock. The most common and accurate
approach involve the use of models for prediction of
tree dry weight, from which carbon stock may be
derived (e.g. Brown 1997; Chave et al. 2005, 2014).
Development of models requires destructive sampling
of trees, where aboveground biomass (AGB) and
belowground biomass (BGB) are first determined for
fresh weight. Subsequently dry weight is determined
by using oven-dry to fresh weight ratio (DF-ratio)
derived from sub-samples. Finally, models predicting
dry weight biomass based on tree parameters such as
diameter breast height (dbh) and total tree height (ht)
are developed.
The diversity of tree forms among mangrove
species, especially their unusual root systems, along
with the growing conditions and changing tides,
salinity levels and muddy soils, pose many challenges
in field surveys of mangrove forests. In spite of this,
quantification of biomass in mangroves has attracted
much attention. A review by Komiyama et al. (2008)
identified 72 published articles related to biomass and
tree allometry. Most of these studies focused on AGB
and were largely carried out in Asia while only two
were carried out in Africa (Steinke et al. 1995; Slim
et al. 1996). Besides, additional studies on biomass
and allometry of mangroves by Kirui et al. (2006),
Tamooh et al. (2008), Kairo et al. (2008, 2009), Cohen
et al. (2013), Lang’at et al. (2013) and Sitoe et al.
(2014) carried out in Africa exist. Studies on BGB
particularly on allometry are however fewer in number
compared to AGB for mangroves. Among the studies
from Africa, Steinke et al. (1995), Tamooh et al.
(2008), Kairo et al. (2008) and Lang’at et al. (2013)
dealt with BGB issues while Kirui et al. (2006) and
Kairo et al. (2009) dealt with allometry of BGB for R.
mucronata. However, the latter two studies sampled
the aboveground part of stilt roots only while the
belowground part of stilt roots was not considered.
The relatively few studies on BGB of mangroves
are obviously due to difficult and tedious excavation
conditions. A number of different excavation methods
have been applied, however. Some studies have
applied full excavation of all roots on small sample
plots (e.g. Steinke et al. 1995) or used soil core
samples distributed randomly on plots (e.g. Lang’at
et al. 2013). With these methods, however, it is not
possible to link BGB to a particular tree. Thus, the
development of models predicting BGB based on tree
variables such as dbh and ht is not possible.
Based on previous literature, we identified four
BGB sampling methods where the link between BGB
and tree variables exists. The methods include
(i) ‘‘trench method’’ (e.g. Komiyama et al. 1987,
2000), (ii) ‘‘root ball method’’ (e.g. Comley and
McGuinness 2005), (iii) ‘‘pull up method’’ (e.g. Tamai
et al. 1986) and (iv) ‘‘total excavation method’’ (e.g.
Ong et al. 2004). The ‘‘trench method’’ is based on the
establishment of a trench of a certain size in length,
width and depth starting at the base of the subject tree
while for the ‘‘root ball method’’ all roots surrounding
the subject tree within a limited radius are excavated.
For none of these two methods, however, roots are
traced to their terminal end. The ‘‘pull up method’’
involves pulling up the roots of individual trees
physically. In soft soils and for small trees, loss of
root biomass with this method is probably relatively
small. However, for large trees, where machinery is
required, most likely larger roots will snap and remain
unmeasured. The ‘‘total excavation method’’ assumes
that all roots belonging to the subject tree are
excavated. Although total excavation generally should
give the most accurate BGB, probably some parts of
the medium sized and fine roots in the deeper zones are
lost even with this method.
In addition to the loss of biomass, the main
challenge related to all the described methods is the
amount of work involved. As a compromise between
these two partly conflicting factors, i.e. work load and
loss of biomass, one could consider, at least for some
of the mangrove species, a ‘‘root sampling method’’ as
an alternative. For this method, a few sample roots of
different sizes for each tree are traced to their terminal
end and weighed for fresh weight. Based on sampled
roots from many trees, regression models predicting
biomass from the basal diameter of the roots are
developed. Finally, these models are used to predict
biomass of all roots not excavated based on measure-
ment of basal diameter of the root originating from the
root crown. To our knowledge this method has never
been applied for mangroves, but has proved successful
for tropical dry forests (e.g. Mugasha et al. 2013).
The review of studies on BGB of mangroves also
revealed that both excavation procedures and proce-
dures for determining dry weight quite often are
imprecisely or insufficiently documented. One
Wetlands Ecol Manage
123

example of insufficient documentation is related to the
procedures applied for conversion of fresh weight to
dry weight by means of dry to fresh weight ratios (DF-
ratios) from sub-samples. The studies however failed
to mention whether the DF-ratios are based on the
average of the sub-samples from the whole tree, from
all belowground parts only or from different root
components (e.g. root crown, roots, above- and
belowground stilt roots) (e.g. Komiyama et al.
1987). It is obvious that if conversion of fresh to dry
weight is not done appropriately, the final estimates of
BGB are subject to uncertainty.
The present study focused on the three dominant
mangrove species in Tanzania; A. marina, S. alba and
R. mucronata. The aims were to (i) describe proce-
dures for excavation of tree BGB, (ii) document
procedures for determination of tree BGB, (iii)
provide basic information on tree BGB quantities
and (iv) test relevant previously developed models for
predicting tree BGB.
Materials and methods
Site and tree species descriptions
The study was conducted in four sites distributed
along the Tanzanian coastline from north (border with
Kenya) to south (border with Mozambique). Study
sites included (i) Pangani, (ii) Bagamoyo, (iii) Rufiji
and (iv) Lindi–Mtwara (Fig. 1). The study sites
represent different soil types and climatic conditions
(Table 1). The spring tidal range along the Tanzanian
coastline vary from 2 to 4 m (Richmond 1997). The
elevations from sea to inland were from 1 to 16 m and
from river to inland 2–18 m.
The sites are located in the largest continuous
naturally growing mangrove forests along the coast-
line and are characterised by the dominating three
mangrove species in Tanzania, i.e. A. marina, S. alba
and R. mucronata (MNRT 1991; Luoga et al. 2004;
Nshare et al. 2007). The tree species are structurally
distinct and adapted to different environments. For
example, while A. marina tolerate salinity levels
ranging from 12 to 31 %, S. alba and R. mucronata
grow best at around 2 and 30 %, respectively (Ball
and Pidsley 1995; Joshi and Ghose 2003). All three
species are ever-green and may exist as single or
multi-stemmed trees.
Sampling and excavation procedures
Sample plots
In general, site conditions in mangroves vary trans-
versely with reference to the sea/river (e.g. Dahdouh-
Guebas et al. 2004; Lovelock et al. 2005). To cover as
much variation as possible, a total of 37 transects were
established perpendicular to the sea/rivers. Within
these transects, a total of 120 plots were established.
The first plot was located close to the edge of the sea/
river and the remaining plots were located at fixed
distances of 150–250 m depending on the total
extension of the forest along transects. For some
transects it was not possible to establish all plots
because of impenetrable mangrove stand or inacces-
sibility due to rivers/streams. Therefore the number of
plots sampled within transects varied from one to four.
Among the 120 plots, 15, 45, 45 and 15 were measured
in Pangani, Bagamoyo, Rufiji and Lindi–Mtwara,
respectively. Initially the study targeted Bagamoyo
only since mangroves in the site represent a large
range of functional types of mangrove stands (Spald-
ing et al. 2010). Later we decided to cover more
variation by adding sites, and the largest number of
plots was allocated to Rufiji since the site represents
the largest single block of mangroves in the country.
We established a nested plot design with 2 and 10 m
radius concentric plots. On each plot we measured
diameter at breast height (dbh) (1.3 m above soil
surface for A. marina and S. alba and 0.3 m above the
highest stilt root for R. mucronata) for all trees with dbh
larger than 1 and 5 cm within the 2 and 10 m radius
plots, respectively. All trees were identified for species.
Tree selection
For each plot, one tree was selected for destructive
sampling. A total of 120 trees were measured for AGB
(not reported on in this study) and 30 out of these were
excavated and measured for BGB. In addition to
allocation of equal number of trees to each of the three
tree species (40), the selection of trees was based on
strata defined by five dbh classes; 1–10, 10.1–20,
20.1–30, 30.1–40 and [40 cm. The strata were
established based on previous studies on mangrove
structure in the country (Mattia 1997; Luoga et al.
2004; Nshare et al. 2007). In the selection of trees for
excavation we also checked the conditions on each
Wetlands Ecol Manage
123

plot in order to avoid root system interference and
cross-over. Finally, this resulted in the excavation of 3,
15, 9 and 3 trees, respectively, for Pangani, Bag-
amoyo, Rufiji and Lindi–Mtwara.
For all sample trees belong to A. marina and S. alba
we measured dbh, basal diameter (bd, diameter 15 cm
above soil surface), total tree height (ht, distance from
soil surface to highest point of the tree), bole height
Fig. 1 Map of Tanzania
showing the four study sites
Wetlands Ecol Manage
123

(bht, distance from soil surface to first living branch)
and crown diameter (crd, average of the longest crown
diameter and diameter perpendicular to the longest
crown diameter). Crown length (crl) was determined
as the difference between total tree height and bole
height. For R. mucronata we measured the same
parameters, but bd was defined to be at the same level
as the highest stilt root, while dbh was measured
30 cm above this level. Bole height and ht were
measured from the level of the highest stilt root.
Diameter at breast height and bd were measured using
a diameter tape while crd was determined using a
distance tape. Total tree height was measured using a
distance tape for small trees and a Suunto hypsometer
for larger trees. Three sample trees (R. mucronata)
were multi-stemmed, i.e. two trees with two stems and
one tree with three stems. For these trees, dbh, bd and
ht were determined for each stem while crd, bht and crl
were recorded for the main stem only (i.e. the stem
with the largest dbh). The sample trees covered large
variations regarding plot level conditions, i.e. number
of trees (N) (trees ha-1) and basal area (G) (m2 ha-1)
for trees with dbh larger than 5 cm, and tree
parameters (Table 2).
Excavation procedures
In addition to the root crown, the root systems of A.
marina and S. alba trees may be divided into four
parts; cable roots (lateral growth), pneumatophores
(vertical upward growth), feeder roots and anchor
roots (Fig. 2). For A. marina, the pneumatophores are
pencil-like, on average about 8 mm thick and peak to
about 20 cm above ground level while for S. alba are
conical-like, about 50 mm thick and peak to about
30 cm above ground level. The root system of R.
mucronata (Fig. 3) comprises of root crown and
above- and belowground stilt roots. Since the three
tree species are structurally distinct, procedures for
BGB destructive sampling are described separately.
To quantify tree BGB we applied root sampling (i.e.
not all roots for a given tree were excavated (e.g.
Mugasha et al. 2013)) for A. marina and S. alba. For R.
mucronata we applied total root excavation (e.g. Ong
et al. 2004).
(1) Destructive sampling of BGB for A. marina
Trees were cut at 15 cm above ground level using a
chain saw (Fig. 2). The cut-off point was guided by
National Forest Resources Monitoring and Assess-
ment (NAFORMA) of Tanzania definition of a stump
(URT 2010). Then the root crown was excavated while
at the same time the main cable roots originating from
root crown were partially exposed up to about 0.5 m
away from the stump. Finally, the main cable roots
were cut from the crown at the point where root begin
to swell abruptly. The approach of cutting and
immediate felling, followed by excavation of the root
crown, however, appeared to be laborious. We there-
fore employed a new strategy, where the tree was left
un-cut while we excavated the root crown and exposed
the main cable roots around the base of the tree. This
approach proved to be efficient since the weight of the
tree, with the help of pushing or wind, aided
significantly in unearthing the root crown.
After felling, the root crown was fully excavated.
We used a combination of pickaxes, hand hoes,
machetes and spades. Subsequently, for each tree, one
or two main cable roots including feeder and anchor
roots were selected and traced to their terminal end.
The root selection for each tree considered inclusion of
small and large roots in order to cover a wide cable
Table 1 Site, location, dominant soil type, temperature and precipitation for the study sites
Site and location Dominant soil type Mean annual min.
temperature (�C)
Mean annual max.
temperature (�C)
Annual rainfall
(mm)
Mean ± STD Mean ± STD Mean ± STD
Pangani (5�240S, 38�590E) Alluvial, clay and sandy soils 22.4 ± 0.7 30.8 ± 0.3 1240 ± 333
Bagamoyo (6�260S, 38�540E) Alluvial and sandy soils 21.0 ± 1.5 30.7 ± 0.8 940 ± 239
Rufiji (7�490S, 39�150E) Alluvial, silt and clay soils 23.7 ± 0.5 30.3 ± 0.3 879 ± 200
Lindi (10�20S, 39�390E)–
Mtwara (10�150S, 40�100E)
Alluvial and sandy soils 21.1 ± 0.5 30.2 ± 0.4 1072 ± 249
Source Tanzania Meteorological Agency, rainfall and temperature data; Pangani and Lindi–Mtwara (1970–2012); Bagamoyo
(1964–2013) and Rufiji (2005–2012)
Wetlands Ecol Manage
123

root size ranges. Basal diameter of both excavated and
unexcavated main and side cable roots (Fig. 2) were
measured. Finally, the root crown and all selected
cable roots were carefully washed and their fresh
weights determined by means of a spring balance
(0.1 kg accuracy). In total 20 main cable roots and 22
side cable roots were selected for A. marina. Basal
diameter of excavated side cable roots ranged from
0.52 to 1.98 cm with a mean of 1.19 cm (the
unexcavated roots had a mean basal diameter of
1.23 cm) while for main cable roots basal diameter
ranged from 1.02 to 13.53 cm with a mean of 4.33 cm
(the unexcavated roots had a mean basal diameter of
2.57 cm).
Excavation pits for exposing roots ranged from 0.2
to 1.4 m in depth while length of traced cable roots
Table 2 Statistical summary of sample tree parameters and plot variables
A. marina (n = 10) S. alba (n = 10) R. mucronata (n = 10)a
Mean ± STD Min. Max. Mean ± STD Min. Max. Mean ± STD Min. Max.
Plot variables
N (trees ha-1) 420 ± 290 0 892 602 ± 532 96 1719 343 ± 319 0 1083
G (m2 ha-1) 10.3 ± 11.0 0 35.6 8.8 ± 6.1 0.3 19.3 9.4 ± 7.1 0 24.2
Tree parameters
dbh (cm) 17.6 ± 13.2 3.0 38.6 17.1 ± 10.5 6.5 33.8 17.5 ± 10.7 1.4 32.6
bd (cm) 21.4 ± 14.3 4.1 45.4 24.7 ± 15.1 8.2 51.7 16.6 ± 12.2 1.9 39.1
ht (m) 9.6 ± 5.4 3.1 21.5 9.5 ± 4.7 4.0 20.9 7.4 ± 6.4 0.8 18.7
bht(m) 4.2 ± 3.4 0.8 11.0 2.9 ± 2.9 1.1 10.0 4.2 ± 4.9 0.2 12.5
crd (m) 5.2 ± 3.8 1.4 11.9 4.9 ± 3.3 0.7 10.1 4.3 ± 2.5 0.8 8.1
crl (m) 5.4 ± 3.2 1.2 10.2 6.6 ± 2.3 2.8 10.9 5.2 ± 3.1 0.6 9.7
a For R. mucronata, sample size (n) for all variables was 10 except for dhh, bd and ht where it was 14 because the stems for multi-
stemmed trees were regarded as individual trees
gthRoot crown
Side cable root
Main cable root
Pneumatophores Feeder root
Anchor root
Stem
Cable root basal diameter
15 cm
Cable root len
Fig. 2 Avicennia marina
and S. alba tree root system
(modified from Purnobasuki
2013), the dashed lines
indicate cut-off point
between root crown and
main cable roots and
between main cable roots
and side cable roots
Wetlands Ecol Manage
123

ranged from 1.4 to 16.1 m. Since A. marina constitute
numerous pneumatophores, it was not possible to
identify which ones belonging to which root for those
located close to the stump. Pneumatophores located up
to about 0.5 m from the stump were therefore
excluded. However, beyond 0.5 m around the stump,
adequate care was taken to identify and gather all
pneumatophores from the main and side cable roots
being traced.
Sub-samples from different parts of the root system
were taken for laboratory analyses. One sub-sample
was taken from each root crown by slicing them from
the top down towards the tap root so as to secure an
appropriate vertical representation. In addition, sub-
samples were taken randomly along the lengths of the
selected side or main cable roots. In total for all A.
marina trees, 10 and 19 sub-samples were taken from
root crowns and roots, respectively. All sub-samples
were labelled and measured for fresh weight using a
digital balance (0.01 g accuracy). On average, the sub-
samples added up to about 450 g fresh weight per tree.
(2) Destructive sampling of BGB for S. alba
The same approach for excavation and destructive
sampling as described for A. marina was applied for S.
alba. In total, 20 main cable roots and 13 side cable
roots were selected. Furthermore, 10 and 19 sub-
samples were taken from root crown and roots,
respectively. Excavated pits ranged from 0.2 to
1.8 m in depth and lengths of root tracing ranged
from 1.3 to 14.5 m. The basal diameters ranged from
0.83 to 4.43 cm with a mean of 1.82 cm for the
excavated side cable roots (the unexcavated roots had
a mean basal diameter of 1.79 cm) and from 1.43 to
10.48 cm with a mean of 5.32 cm for the excavated
main cable roots (the unexcavated roots had a mean
basal diameter of 3.60 cm).
(3) Destructive sampling of BGB for R. mucronata
The excavated BGB for R. mucronata included root
crown and stilt roots from both above and below the
ground level (Fig. 3). This conform with IPCC (2006,
2013) guidelines stating that BGB should include all
live roots. The same procedure was followed by
Komiyama et al. (2005) for R. mucronata, Ong et al.
(2004) for Rhizophora apiculata and Comley and
McGuinness (2005) for Rhizophora stylosa. Although
contrary to our approach, for example, Tamai et al.
(1986) and Kairo et al. (2009) excluded the below-
ground stilt roots when sampling BGB for R.
mucronata.
The stilt roots of R. mucronata trees are numerously
stocked within a limited area (Fig. 3) and are densely
entangled, which made it impossible to trace
Ground level
Root crown
Stem
Stilt root
Above ground stilt root
Below ground stilt root
Fig. 3 Rhizophora
mucronata tree root system,
the dashed lines indicate
cut-off point between root
crown and stilt roots
Wetlands Ecol Manage
123

individual roots. Instead we performed a total exca-
vation of all roots. After taking tree measurements, the
tree was cut just above the root crown (i.e. above the
highest stilt root) and felled. Subsequently, the stilt
roots were cut approximately at 0.3 m above ground
level while the stilt root stumps were marked in order
to avoid mixing roots of the subject tree with those of
neighbouring trees. Then all belowground stilt roots
were completely excavated. The excavation pits
ranged from 0.3 to 1.0 m in depth and from 1.6 to
5.1 m in width.
For multi-stemmed R. mucronata trees, roots were
partitioned based on the proportion of the individual
stem basal areas, and each stem was assumed to be a
stand-alone tree. For the 10 trees, we therefore have a
total of 14 observations for BGB (see also Table 2). A
similar procedure is detailed by Clough et al. (1997).
During field work, the different root components of
R. mucronata, i.e. root crown, above- and below-
ground stilt roots, were mixed together because
initially the study aimed at quantifying total BGB
rather than individual component biomass. Despite
this, sub-samples from root crown, and above- and
belowground stilt roots were extracted separately,
weighed for fresh weight, labelled and brought to
laboratory for dry weight determination. A total of 7
(from 7 trees), 17 (from 9 trees) and 19 (from 10 trees)
sub-samples were extracted from root crowns, and
above- and belowground stilt roots, respectively.
Dry weight determination procedures
All sub-samples were taken to laboratory and oven-dried
at 105 �C to constant weight. Dry weights of all sub-
samples (kg) were determined by using a digital balance.
For A. marina and S. alba, dry weights of the
belowground components, i.e. side and main cable
roots and root crown, were determined by multiplying
fresh weights and tree- and component-specific DF-
ratios derived from the sub-samples. This resulted into
individual cable root dry weight (kg root-1) as well as
root crown dry weight (kg tree-1). The procedure for
determination of total tree BGB (kg tree-1) for A.
marina and S. alba trees was as follows;
(1) From the dry weight of excavated side cable
roots (Bside_excav), we developed regression
models for prediction of dry weight of indi-
vidual unexcavated side cable roots
(Bside_unexcav) based on basal side root diameter
as predictor variable.
(2) Total dry weight of side cable roots (Bside)
belonging to an individual main cable root was
then determined by adding all predicted dry
weights of unexcavated side cable roots to dry
weights of excavated side cable roots; Bside =
R Bside_excav ? R Bside_unexcav.
(3) Total dry weight of the individual sample main
cable roots (Bmain) was determined by adding
dry weight of excavated main cable roots
(Bmain_excav) and dry weight from all side cable
roots; Bmain = Bmain_excav ? Bside.
(4) From the dry weight of individual sample main
cable roots, we developed regression models for
prediction of dry weight of unexcavated main
cable roots (Bmain_unexcav) based on basal main
root diameter as predictor variable.
(5) Total tree root dry weight (Broots) was deter-
mined by adding dry weights of excavated main
cable roots (Bmain) and dry weights of predicted
main cable roots not excavated (Bmain_unexcav);
Broots = R Bmain ? R Bmain_unexcav.
(6) Total tree BGB was finally determined by
adding total tree root dry weight (Broots) and
root crown dry weight (Brcrown); BGB =
Broots ? Brcrown.
Since the R. mucronata trees were totally excavated
and since we did not separate the root components
(root crown, and above- and belowground stilt roots)
when determining fresh weight in the field, dry weight
determination procedure for this species was straight-
forward; we applied tree-specific DF-ratios without
differentiating between the root components to con-
vert fresh weight into total tree BGB.
Analyses
Statistical data analyses
All statistical analyses were carried out in R software
version 2.8.0 (R Core Team 2013). Prior to dry weight
determination, DF-ratios were subjected to analysis of
covariance (ANCOVA) to determine differences be-
tween species, between individual trees within the
same species and between root components within
trees following general linear model (GLM) proce-
dures. When analysing difference in DF-ratio between
Wetlands Ecol Manage
123
species, the root component DF-ratios were sum-
marised to tree level all components (i.e. root crown
and root) average or simply tree average. When the
differences were significant we applied Bonferroni
post hoc tests. Diameter at breast height (dbh) served
as a covariate in the analyses and significance levels of
0.1, 1 and 5 % were applied. Since DF-ratios varied
between species, between individual trees within the
same species and between root components, dry
weights of A. marina and S. alba (as described above)
were determined by multiplying fresh weight and tree-
and component-specific DF-ratios derived from sub-
samples. ANCOVA was also applied when testing
differences in total tree BGB between the tree species.
During explorative data analysis, we found that the
relationships between main and side cable root dry
weights and basal diameter were nonlinear. We therefore
initially tested several options to describe the nonlinear
relationships (e.g. second order polynomial functions and
exponential functions) but found the power function as
the best. The power function has also been widely used to
describe biomass relationships (e.g. Niklas 2004;
Komiyama et al. 2008). The model form was as follows:
B ¼ b0 � xb1 þ e
where B = root dry weight of main/side cable roots
(kg root-1), x = main/side cable root basal diameter
(cm), b0 and b1 are model parameters and e is an
additive error term.
The model fitting was done by using ‘nls2’ function
in R software (R Core Team 2013). Both ordinary and
weighted nonlinear least squares methods were em-
ployed in estimation of model parameters. Regression
assumptions on homoscedasticity and normal distri-
bution of residuals were examined by means of
graphical plots (plots not displayed in results). Where
heteroscedastic error distributions were observed,
nonlinear weighted least squares were employed to
compensate for violation of homoscedasticity and
allocate less weight to extreme observations. Root
mean square error (RMSE) and mean prediction error
(MPE (%)) for the models were computed as follows:
RMSE ¼ffiffiffiffiffiffiffiffiffiffi
P
e2
n
r
where e = residuals, i.e. differences between predict-
ed and observed dry weights (kg) and n = number of
observations, and
MPE %ð Þ ¼P
eð Þ=n
MBobs
� �
� 100
where MBobs = mean observed dry weight (kg). Two-
tailed paired t-tests were employed to determine the
significance of MPE (%).
Relationships between BGB and tree variables
were determined using Spearman correlation tests.
Significance levels of 0.1, 1 and 5 % were applied.
Evaluation of existing models
Based on literature, we found four models for predic-
tion of tree BGB relevant for testing on our data. The
models included a common model developed by
Komiyama et al. (2005) (model 1), a species-specific
model for A. marina developed by Comley and
McGuinness (2005) (model 2) and two species-specific
models for R. mucronata developed by Tamai et al.
(1986) (model 3) and Kairo et al. (2009) (model 4);
BGB¼ 0:199� q0:899� �
� dbh2:22� �
; R2¼ 0:95; SE = 1:81� �
ð1Þ
BGB¼ 1:28� dbh1:171� �
; R2¼ 0:80; RMSE = 0:268� � ð2Þ
BGB¼ 0:00974 dbh2 � ht� �1:0525 ð3Þ
log10 BGBð Þ¼ �1:3010þ 2:4044
� log10 dbhð Þ; R2¼ 0:70; SE = 0:37� �
ð4Þ
where BGB = total tree belowground dry weight (kg),
q = wood density (gcm-3), dbh = diameter at breast
height (cm) and ht = total tree height (m). The model
reported by Komiyama et al. (2005) requires wood
density as a predictor variable. However, wood density
values for mangrove species are lacking in Tanzania and
Africa in general. We therefore used data from the global
wood density (GWD) database (Zanne et al. 2009; Chave
et al. 2009). Since we found more than one wood density
value for A. marina, S. alba and R. mucronata in GWD
database and the values were variable, we applied
species-specific mean values, i.e. 0.648 for A. marina,
0. 508 for S. alba and 0.814 for R. mucronata.
Results
Dry to fresh weight ratios (DF-ratios) varied between
the tree species and root components (Table 3). The
Wetlands Ecol Manage
123
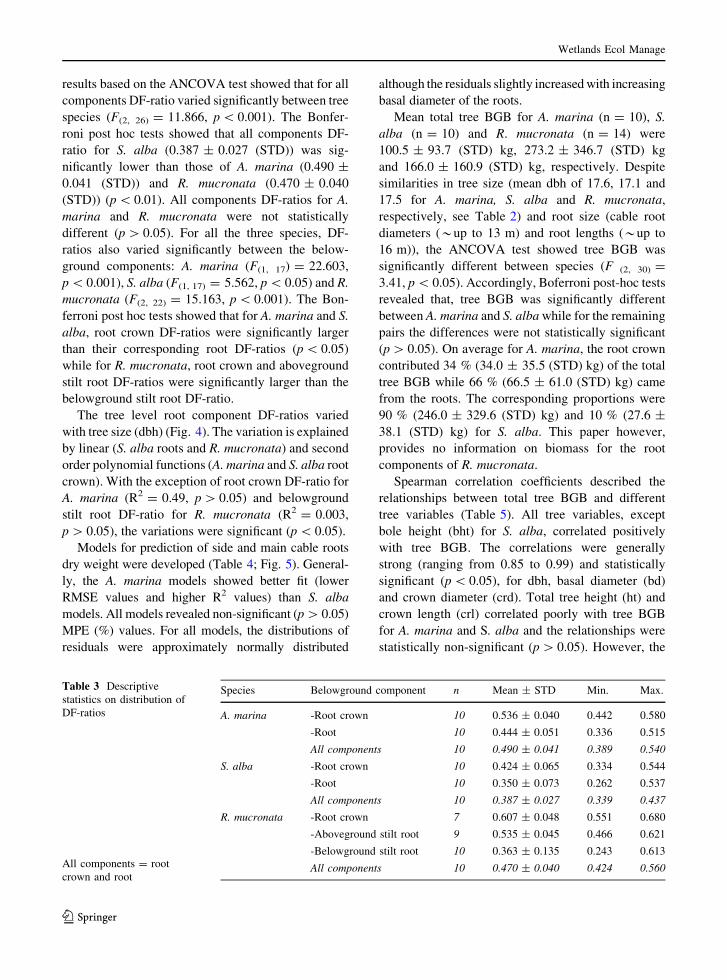
results based on the ANCOVA test showed that for all
components DF-ratio varied significantly between tree
species (F(2, 26) = 11.866, p \ 0.001). The Bonfer-
roni post hoc tests showed that all components DF-
ratio for S. alba (0.387 ± 0.027 (STD)) was sig-
nificantly lower than those of A. marina (0.490 ±
0.041 (STD)) and R. mucronata (0.470 ± 0.040
(STD)) (p \ 0.01). All components DF-ratios for A.
marina and R. mucronata were not statistically
different (p [ 0.05). For all the three species, DF-
ratios also varied significantly between the below-
ground components: A. marina (F(1, 17) = 22.603,
p \ 0.001), S. alba (F(1, 17) = 5.562, p \ 0.05) and R.
mucronata (F(2, 22) = 15.163, p \ 0.001). The Bon-
ferroni post hoc tests showed that for A. marina and S.
alba, root crown DF-ratios were significantly larger
than their corresponding root DF-ratios (p \ 0.05)
while for R. mucronata, root crown and aboveground
stilt root DF-ratios were significantly larger than the
belowground stilt root DF-ratio.
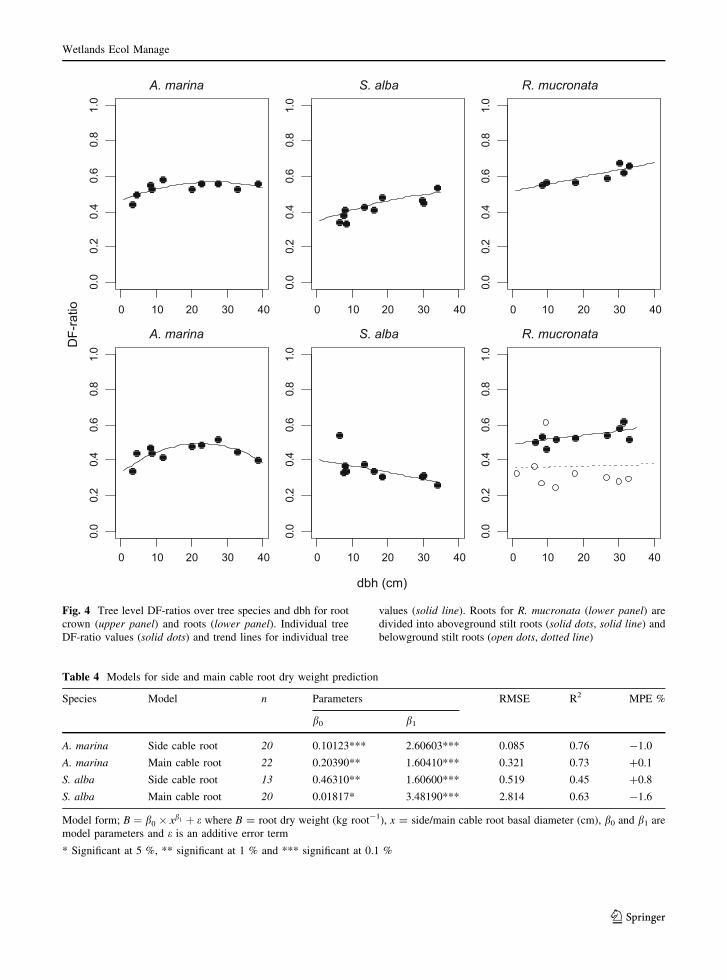
The tree level root component DF-ratios varied
with tree size (dbh) (Fig. 4). The variation is explained
by linear (S. alba roots and R. mucronata) and second
order polynomial functions (A. marina and S. alba root
crown). With the exception of root crown DF-ratio for
A. marina (R2 = 0.49, p [ 0.05) and belowground
stilt root DF-ratio for R. mucronata (R2 = 0.003,
p [ 0.05), the variations were significant (p \ 0.05).
Models for prediction of side and main cable roots
dry weight were developed (Table 4; Fig. 5). General-
ly, the A. marina models showed better fit (lower
RMSE values and higher R2 values) than S. alba
models. All models revealed non-significant (p [ 0.05)
MPE (%) values. For all models, the distributions of
residuals were approximately normally distributed
although the residuals slightly increased with increasing
basal diameter of the roots.
Mean total tree BGB for A. marina (n = 10), S.
alba (n = 10) and R. mucronata (n = 14) were
100.5 ± 93.7 (STD) kg, 273.2 ± 346.7 (STD) kg
and 166.0 ± 160.9 (STD) kg, respectively. Despite
similarities in tree size (mean dbh of 17.6, 17.1 and
17.5 for A. marina, S. alba and R. mucronata,
respectively, see Table 2) and root size (cable root
diameters (*up to 13 m) and root lengths (*up to
16 m)), the ANCOVA test showed tree BGB was
significantly different between species (F (2, 30) =
3.41, p \ 0.05). Accordingly, Boferroni post-hoc tests
revealed that, tree BGB was significantly different
between A. marina and S. alba while for the remaining
pairs the differences were not statistically significant
(p [ 0.05). On average for A. marina, the root crown
contributed 34 % (34.0 ± 35.5 (STD) kg) of the total
tree BGB while 66 % (66.5 ± 61.0 (STD) kg) came
from the roots. The corresponding proportions were
90 % (246.0 ± 329.6 (STD) kg) and 10 % (27.6 ±
38.1 (STD) kg) for S. alba. This paper however,
provides no information on biomass for the root
components of R. mucronata.
Spearman correlation coefficients described the
relationships between total tree BGB and different
tree variables (Table 5). All tree variables, except
bole height (bht) for S. alba, correlated positively
with tree BGB. The correlations were generally
strong (ranging from 0.85 to 0.99) and statistically
significant (p \ 0.05), for dbh, basal diameter (bd)
and crown diameter (crd). Total tree height (ht) and
crown length (crl) correlated poorly with tree BGB
for A. marina and S. alba and the relationships were
statistically non-significant (p [ 0.05). However, the
Table 3 Descriptive
statistics on distribution of
DF-ratios
All components = root
crown and root
Species Belowground component n Mean ± STD Min. Max.
A. marina -Root crown 10 0.536 ± 0.040 0.442 0.580
-Root 10 0.444 ± 0.051 0.336 0.515
All components 10 0.490 ± 0.041 0.389 0.540
S. alba -Root crown 10 0.424 ± 0.065 0.334 0.544
-Root 10 0.350 ± 0.073 0.262 0.537
All components 10 0.387 ± 0.027 0.339 0.437
R. mucronata -Root crown 7 0.607 ± 0.048 0.551 0.680
-Aboveground stilt root 9 0.535 ± 0.045 0.466 0.621
-Belowground stilt root 10 0.363 ± 0.135 0.243 0.613
All components 10 0.470 ± 0.040 0.424 0.560
Wetlands Ecol Manage
123
0 10 20 30 40
0.0
0.2
0.4
0.6
0.8
1.0
A. marina
0 10 20 30 40
0.0
0.2
0.4
0.6
0.8
1.0
S. alba
0 10 20 30 40
0.0
0.2
0.4
0.6
0.8
1.0
R. mucronata
0 10 20 30 40
0.0
0.2
0.4
0.6
0.8
1.0
A. marina
0 10 20 30 40
0.0
0.2
0.4
0.6
0.8
1.0
S. alba
0 10 20 30 40
0.0
0.2
0.4
0.6
0.8
1.0
R. mucronata
dbh (cm)
DF-
ratio
Fig. 4 Tree level DF-ratios over tree species and dbh for root
crown (upper panel) and roots (lower panel). Individual tree
DF-ratio values (solid dots) and trend lines for individual tree
values (solid line). Roots for R. mucronata (lower panel) are
divided into aboveground stilt roots (solid dots, solid line) and
belowground stilt roots (open dots, dotted line)
Table 4 Models for side and main cable root dry weight prediction
Species Model n Parameters RMSE R2 MPE %
b0 b1
A. marina Side cable root 20 0.10123*** 2.60603*** 0.085 0.76 -1.0
A. marina Main cable root 22 0.20390** 1.60410*** 0.321 0.73 ?0.1
S. alba Side cable root 13 0.46310** 1.60600*** 0.519 0.45 ?0.8
S. alba Main cable root 20 0.01817* 3.48190*** 2.814 0.63 -1.6
Model form; B ¼ b0 � xb1 þ e where B = root dry weight (kg root-1), x = side/main cable root basal diameter (cm), b0 and b1 are
model parameters and e is an additive error term
* Significant at 5 %, ** significant at 1 % and *** significant at 0.1 %
Wetlands Ecol Manage
123

corresponding correlations were stronger for R.
mucronata.
The prediction errors for the models selected from
previous studies when tested on our data (Table 6). For
all cases, except when the common model developed by
Komiyama et al. (2005) was applied on A. marina data
set, the models under-estimated tree BGB (not sig-
nificant for S. alba). Where tested models under-
estimated tree BGB, MPE values ranged from
-56.1 ± 62.5 (STD) kg (-33.8 %) to -186.6 ±
290.4 (STD) kg (-68.3 %). When the common model
developed by Komiyama et al. (2005) was applied on A.
marina data set, the model over-estimated tree BGB by
26.2 ± 69.8 (STD) kg (26.1 %), although not statisti-
cally significant (p [ 0.05).
Discussion
The basic task in any quantification of biomass dry
weight is the determination of DF-ratio.
The DF-ratios varied significantly between the
three species. Within species, DF-ratios also varied
between root components and tree sizes. Based on our
results we therefore suggest that future studies should
avoid the use of mean DF-ratios across species, root
components and trees. Instead, species-, tree- and root
component-specific DF-ratios should be applied.
Comparable results on DF-ratios for tree BGB of
mangrove species are difficult to find in literature.
Often DF-ratios are not reported (e.g. Tam et al. 1995;
Komiyama et al. 2005; Comley and McGuinness
2005; Kairo et al. 2009). In addition, for the core
sampling method (e.g. Tamooh et al. 2008) and the
‘‘trench method’’ (e.g. Komiyama et al. 1987), it is not
clear how the root sub-samples for generation of DF-
ratios were extracted, how the DF-ratios of roots from
different species and tree sizes were distinguished and
treated; and finally how they arrived at tree dry weight.
Our study has clearly demonstrated that, unless the
determination of DF-ratios is consciously and appro-
priately dealt with, the quantification of dry weight is
subject to uncertainties.
The developed side and main cable root dry weight
models for A. marina and S. alba generally showed
strong relationships between basal diameter and dry
0.0 0.5 1.0 1.5 2.0 2.5
A. marina
0 1 2 3 4 5 6
02
46
8
S. alba
0 5 10 15 0 2 4 6 8 10 120
2040
6080
100
Side/Main cable root basal diameter (cm)
Sid
e/m
ain
cabl
e ro
ot d
ry w
eigh
t (kg
root
-1)
0.0
0.5
1.0
1.5
05
1015
20
Fig. 5 Side (upper panel)
and main (lower panel)
cable root dry weight
models (solid line) and
observations (solid dots) for
A. marina and S. alba
Wetlands Ecol Manage
123

weights. The mean prediction errors (MPE) for all
models were statistically insignificant. It is, however,
worth mentioning that main cable root residual
variance increased with increasing root basal di-
ameter. Although this pattern is normal for biomass
regression models, this point at challenges concerning
uncertainty when models are applied outside their data
range, as is the case in the current study. For example,
the largest basal diameter in the data used to develop
the main cable root model for A. marina was 13.5 cm,
while the largest basal diameter that we measured was
18.5 cm. Clearly when applying a root sampling
procedure, like in the present study, extrapolation
cannot be avoided. However, including as large data
ranges as much as possible, when selecting sample
roots, is vital to overcome such challenges. Selection
of ‘‘one small and one big’’ root for each sample tree,
as done in our study, was an attempt to include diverse
root size covering a reasonable data range as a basis for
the root dry weight models. Possibly the models would
have improved if larger roots were included.
The mean total tree BGB for A. marina and S. alba
were quite different. The larger pneumatophores of S.
alba as compared to A. marina probably explains
much of this difference. Larger side and main cable
roots for S. alba could be another explanation for the
observed differences in tree BGB between the two
species. It is also worth mentioning that we found
relatively large proportions of the total tree BGB for A.
marina and S. Alba stored in root crowns. This suggest
that sampling approaches such as root coring (e.g.
Tamooh et al. 2008), where the sampling (coring)
often is done around the subject tree without including
root crown, leaves out an important part in accounting
for total tree BGB. The total tree BGB for R.
mucronata was determined, but unfortunately we do
not have any information on the different components
of the root system (root crown, above- and
Table 5 Correlation between total BGB dry weight and tree variables
Variable Total belowground dry weight (kg tree-1)
A. marina (n = 10) S. alba (n = 10) R. mucronata (n = 10)a
dbh (cm) ?0.99** ?0.87** ?0.93**
bd (cm) ?0.98** ?0.94** ?0.98**
ht (m) ?0.53NS ?0.15NS ?0.83**
bht (m) ?0.33NS -0.24NS ?0.90**
crd (m) ?0.94** ?0.96** ?0.85**
crl (m) ?0.53NS ?0.33NS ?0.87**
Spearman correlation analysis (e.g. Crawley 2007)a For dbh, bd and ht, n = 14, NS not significant at 5 %, * significant at 5 %, ** significant at 1 % and *** significant at 0.1 %
Table 6 Mean prediction errors of previously developed BGB models
Species Model Wood
density
BGB (kg tree-1) MPE
Pred. Obs. Mean ± STD
(kg tree-1)
(%)b
A. marina (n = 10) Common, Komiyama et al. (2005) q = 0.648a 126.7 100.5 ?26.2 ± 69.8 26.1NS
Species-specific, Comley and
McGuinness (2005)
– 38.4 100.5 -62.8 ± 63.9 -62.5*
S. alba (n = 10) Common, Komiyama et al. (2005) q = 0.508a 86.6 273.2 -186.6 ± 290.4 -68.3NS
R. mucronata (n = 14) Common, Komiyama et al. (2005) q = 0.814a 109.9 166.0 -56.1 ± 62.5 -33.8**
Species-specific, Tamai et al.(1986) – 75.0 166.0 -91.0 ± 75.5 -54.8**
Species-specific, Kairo et al. (2009) – 60.8 166.0 -105.2 ± 91.3 -63.4**
a Wood density based on global wood density database (Zanne et al. 2009; Chave et al. 2009)b Two-tailed t-tests, NS not significant at 5 %, * significant at 5 %, ** significant at 1 % and *** significant at 0.1 %
Wetlands Ecol Manage
123

belowground stilt roots) for this species. Obviously the
excavation procedure for R. mucronata should be
modified to accommodate separation of tree BGB into
root components.
The strong and statistically significant relationships
seen between basal diameter (bd), dbh and crown
diameter (crd) and total tree BGB suggest that these
variables may be important predictors in tree BGB
models. It is worth mentioning that crd as a predictor
variable may be of particular interest since the
technology for assessment of biomass is advancing.
Wannasiri et al. (2013) and Hirata et al. (2014), for
example, used high resolution data based on Lidar and
QuickBird, respectively, and estimated biomass of
mangroves by using crd as predictor variable. Besides,
tree height (ht) is usually an important predictor
variable in biomass models (e.g. Chave et al. 2014).
For our data, however, the relationships between this
variable and tree BGB were relatively weak for A.
marina and S. alba, yet stronger for R. mucronata.
When the common model developed by Komiyama
et al. (2005) was tested on our data, tree BGB were
over-estimated for A. marina and under-estimated for
S. alba and R. mucronata. Since differences in forest
structure, soil, salinity and climate may influence the
results, it is generally not surprising that large
prediction errors appear when this model is applied
outside the data range from where it was developed. A
common model is also supposed to work for all
relevant tree species, but the data used by Komiyama
et al. (2005) did not include A. marina (which was one
of the target species for the test on our data).
Excavation procedures may also have influenced the
prediction errors. However, since Komiyama et al.
(2005) partly applied full excavation we do not believe
that the excavation procedure is a major factor here.
The tested species-specific models (Comley and
McGuinness 2005; Tamai et al. 1986; Kairo et al. 2009)
all significantly under-estimated tree BGB. The most
likely explanation for such under-estimations is loss of
biomass due to the excavation procedures applied
when these models were developed. For A. marina,
Comley and McGuinness (2005) applied the ‘‘root ball
method’’. Irrespective of tree size; they limited exca-
vation to a radius of 2 m from the subject tree. Since we
in the present study sampled roots as far as 16 m from
the tree base, it is quite obvious that models based on
data from ‘‘root ball method’’ generally under-esti-
mates tree BGB, and that the under-estimation
increases with tree size. Similarly, when Tamai et al.
(1986) and Kairo et al. (2009) developed their R.
mucronata models they did not excavate the below-
ground stilt roots. Since we during field work observed
that a significant proportion of the tree BGB originated
from the belowground stilt roots, it is not surprising
that the models developed by Tamai et al. (1986) and
Kairo et al. (2009) under-estimated tree BGB.
According to Chave et al. (2005, 2014) and
Komiyama et al. (2005) the prediction quality of
biomass models is improved by including wood
density as predictor variable.
However, various sources of information on wood
density, including the GWD database (Zanne et al.
2009; Chave et al. 2009), show that species-specific
wood density values are variable and that the reasons
for such variation is not well documented. Wood
density of A. marina, for example, varies from 0.520 to
0.732 in the GWD database. Wood density values for
the three studied mangrove species based on sites from
Tanzania and Africa are in general lacking in the
database. In addition to differences in wood density
between sites, within-tree differences are likely to be
present (e.g. Nock et al. 2009; Santini et al. 2012). It is
important that such differences are understood and
taken into account when developing models for
prediction of biomass. To our knowledge such issues
have hardly been investigated for mangroves.
Biomass and carbon quantification are imperative
for the implementation of reducing emission from
deforestation and forest degradation (REDD) pro-
grams. To engage in such programs, Tanzania like
other participating countries, need reliable assessment
tools for biomass quantification in various forest types
including mangroves. This is of particular importance
for Tanzania since the country started the first national
forest inventory in 2009 (URT 2010). Therefore, more
research on mangroves is needed, not only on basic
issues such as wood density, but also on the develop-
ment of local tree BGB models.
Conclusions
The present study applied an excavation procedure
involving root sampling when quantifying tree BGB
for A. marina and S. alba. This procedure has never
been applied to mangroves previously, but seemed to
work adequately. Within a given budget, the
Wetlands Ecol Manage
123

procedure facilitates more trees to be included in a
sample compared to if all roots are excavated. DF-
ratios varied between species, trees and root compo-
nents. Therefore, species-, tree- and root component-
specific DF-ratios were applied in conversion of fresh
to dry weight biomass. For A. marina and S. alba trees,
a significant proportion of total tree BGB is stored in
the root crown. Future studies should therefore ensure
inclusion of root crown in accounting for total tree
BGB. Tests of previously developed models on our
data revealed large prediction errors, partly due to
differences in site conditions and partly due to
incomprehensive excavation procedures applied when
these models were developed. Local tree BGB models
for mangroves should therefore be developed.
Acknowledgments This research work was financed by the
Climate Change Impacts and Adaptation Mitigation (CCIAM)
Programme under the cooperation between the Government of
the United Republic of Tanzania and the Government of the
Kingdom of Norway. We are also grateful for supplementary
funding by the Project ‘‘Enhancing the Measuring, Reporting and
Verification (MRV) of forests in Tanzania’’. Besides we are
indebted to D. Mnyagi (Pangani), S.K. Nyabange (Bagamoyo),
H. Mallya (Rufiji) and M.C. Mbago (Mtwara), working for
Tanzania Forest Service, for logistical support during field work.
The field assistants including boat drivers are also acknowledged
for their hard work and courage throughout an intensive and
tiresome data collection. The anonymous reviewers are
appreciated for their valuable and critical comments.
Funding The work reported here was financed by the CCIAM
Programme and Enhancing the measuring, reporting and
verification (MRV) of forests in Tanzania Project both under the
cooperation between the Government of United Republic of
Tanzania and the Kingdom of Norway.
References
Ball MC, Pidsley SM (1995) Growth responses to salinity in
relation to distribution of two mangrove species, Son-
neratia alba and S. lanceolata, in northern Australia. Funct
Ecol 9(1):77–85
Brown S (1997) Estimating biomass change of tropical forests:
primer. FAO forestry paper 134. FAO, Rome
Chave J, Andalo C, Brown S, Cairns MA, Chambers JQ, Eamus
D, Folster H, Fromard F, Higuchi N, Kira T, Lescure JP,
Nelson BW, Ogawa H, Puig H, Riera B, Yamakura T (2005)
Tree allometry and improved estimation of carbon stocks
and balance in tropical forests. Oecologia 145:87–99
Chave J, Coomes DA, Jansen S, Lewis SL, Swenson NG, Zanne
AE (2009) Towards a worldwide wood economics spec-
trum. Ecol Lett 12:351–366
Chave J, Rejou-Mechain M, Burquez A, Chidumayo E, Colgan
MS, Delitti WBC, Duque A, Eid T, Fearnside PM,
Goodman RC, Henry M, Martınez-Yrızar A, Mugasha
WA, Muller-Landau HC, Mencuccini M, Nelson BW,
Ngomanda A, Nogueira EM, Ortiz-Malavassi E, Pelissier
R, Ploton P, Ryan CM, Saldarriaga JG, Vieilledent G
(2014) Improved allometric models to estimate the
aboveground biomass of tropical forests. Glob Chang Biol
20:3177–3190
Clough BF, Dixon P, Dalhaus O (1997) Allometric relationships
for estimating biomass in multi-stemmed mangrove trees.
Aust J Bot 45:1023–1031
Cohen R, Kairo J, Okello JA, Bosire JO, Kairo JG, Huxham M,
Mencuccine M (2013) Propagating uncertainty to estimates
of above-ground biomass for Kenyan mangroves: a scaling
procedure from tree to landscape level. For Ecol Manag
310:968–982
Comley BWT, McGuinness KA (2005) Above- and below-
ground biomass, and allometry of four common northern
Australian mangroves. Aust J Bot 53:431–436
Crawley MJ (2007) The R book. Wiley, Chichester
Dahdouh-Guebas F, De Bondt R, Abeysinghe PD, Kairo JG,
Cannicci S, Triest L, Koedam N (2004) Comparative study
of the disjunct zonation pattern of the grey mangrove
Avicennia Marina (Forsk.)Vierh. In Gazi Bay (Kenya).
Bull Mar Sci 74:237–252
Donato DC, Kauffman JB, Murdiyarso D, Kurnianto S, Stidham
M, Kanninen M (2011) Mangroves among the most car-
bon-rich forests in the tropics. Nat Geosci 4:293–297
Food and Agriculture Organization of the United Nations (FAO)
(2007) The World’s mangroves 1980–2005. FAO forestry
paper 153. FAO, Rome
Hirata Y, Tabuchi R, Patanaponpaiboon P, Poungparn S,
Yoneda R, Fujioka Y (2014) Estimation of aboveground
biomass in mangrove forests using high-resolution satellite
data. J For Res 19:34–41
Hutchings P, Saenger P (1987) Ecology of mangroves.
University of Queensland Press, Brisbone, p 388
IPCC (2006) Guidelines for national greenhouse gas invento-
ries. Vol. 4: agriculture, forestry and other landuse. In:
Eggleston HS, Buendia L, Miwa K, Ngara T, Tanabe K
(eds) IPCC, Inter-governmental panel on climate change
(IPCC). IPCC/IGES, Hayama
IPCC (2013) Revised supplementary methods and good practice
guidance arising from the Kyoto protocol. In: Irving W,
Zhou L (eds) Inter-governmental panel on climate change
(IPCC). IPCC/IGES.3, Stockholm
Joshi H, Ghose M (2003) Forest structure and species distribu-
tion along soil salinity and pH gradient in mangrove
swamps of the Sundarbans. Trop Ecol 44(2):197–206
Kairo JG, Joseph KSL, Dahdouh-Guebas F, Bosire J, Karachi M
(2008) Structural development and productivity of re-
planted mangrove plantations in Kenya. For Ecol Manag
255:2670–2677
Kairo JG, Bosire J, Langat J, Kirui B, Koedam N (2009) Al-
lometry and biomass distribution in replanted mangrove
plantations at Gazi Bay, Kenya. Aquat Conserv 19:S63–S69
Kauffman JB, Donato DC (2012) Protocols for the measure-
ment, monitoring and reporting of structure, biomass and
carbon stocks in mangrove forests. Working paper 86.
CIFOR, Bogor
Kauffman JB, Heider C, Cole T, Dwire KA, Donato DC (2011)
Ecosystem Carbon stocks of Micronesian mangrove
Wetlands Ecol Manage
123

forests: implications of land use and climate change.
Wetlands 31:343–352
Kirui B, Kairo JG, Karachi M (2006) Allometric equations for
estimating aboveground biomass of Rhizophora mu-
cronata mangroves at Gazi Bay Kenya. WIOJMS5
5(1):27–34
Komiyama A, Ogino K, Akisornkoae S, Sabhasri S (1987) Root
biomass of a mangrove forest in Southern Thailand 1. Es-
timation by trench method and the zonal structure of root
biomass. J Trop Ecol 3:97–108
Komiyama A, Havanond S, Srisawatt W, Mochida Y, Fujimoto
K, Ohnishi T, Ishihara S, Miyagi T (2000) Top/root bio-
mass ratio of a secondary mangrove (Ceriops tagal (Perr.)
C.B. Rob.) forest. For Ecol Manag 39:127–134
Komiyama A, Poungparn S, Kato S (2005) Common allometric
equations for estimating the tree weight of mangroves.
J Trop Ecol 21:471–477
Komiyama A, Ong JE, Poungparn S (2008) Allometry, biomass,
and productivity of mangrove forests: a review. Aquat Bot
89:128–137
Lang’at JKS, Kirui BKY, Skov MW, Kairo JG, Mencuccini M,
Huxham M (2013) Species mixing boosts root yield in
mangrove trees. Oecologia 172:271–278
Lovelock CE, Feller IC, McKee KL, Thompson R (2005) Var-
iation in mangrove forest structure and sediment charac-
teristics in Bocas del Toro, Panama. Caribb J Sci
41(3):456–464
Luoga EJ, Malimbwi RE, Kajembe GC, Zahabu E, Shemwetta
DTK, Lyimo-Macha J Mtakwa P Mwaipopo CS (2004)
Tree species composition and structures of Jasini Mwajuni
Mangrove forest at Pangani, Tanzania. J TAF10: 42–47
Mattia SB (1997) Species and structural composition of natural
mangrove forests: a case study of the Rufiji delta. Tanzania.
Dissertation for award of MSc. Degree at Sokoine
University of Agriculture, Morogoro, Tanzania
MNRT (Ministry of Natural Resources and Tourism) (1991)
Management plan for the mangrove ecosystem of Rufiji
District, mainland Tanzania, vol 7. Ministry of Tourism,
Natural Resources and Environment (MTNRE), Forestry
and Beekeeping Division, Catchment Forestry Project, Dar
es Salaam
Mugasha WA, Eid T, Bollandsas OM, Malimbwi RE, Cham-
shama SAO, Zahabu E, Katani JZ (2013) Allometric
models for prediction of above- and belowground biomass
of trees in the miombo woodlands of Tanzania. Forest Ecol
Manag 310:87–101
Murdiyarso D, Donato DC, Kauffman JB, Stidham M, Kur-
nianto S, Kanninen M (2009) Carbon storage in mangrove
and peatland ecosystems in Indonesia—a preliminary ac-
count from plots in Indonesia. Working paper 48. Center
for International Forest Research, Bogor
Niklas KJ (2004) Plant allometry: is there a ground unifying
theory? Biol Rev 79:871–889
Nock CA, Geihofer D, Grabner M, Baker PJ, Bunyavejchewin
S, Hietz P (2009) Wood density and its radial variation in
six canopy tree species differing in shade-tolerance in
western Thailand. Ann Bot 104:297–306
Nshare JS, Chitiki A, Malimbwi RE, Kinana BM, Zahabu E
(2007) The current status of the mangrove forest along
seashore at Salenda bridge, Dar es Salaam, Tanzania.
J TAF 11:172–179
Ong JE, Gong WK, Wong CH (2004) Allometry and parti-
tioning of the mangrove, Rhizophora apiculata. For Ecol
Manag 88:395–408
Purnobasuki H (2013) Characteristics of root caps in four root
types of Avicennia marina (Forsk.) Vierh. Am J P Sci
4:853–858
Richmond MD (ed) (1997) A guide to the sea shores of Eastern
Africa and the Western Indian Ocean islands. Sida
Department for Research Cooperation, SAREC,
Stockholm
R Core Team (2013) R: a language and environment for sta-
tistical computing. R Foundation for Statistical Comput-
ing, Vienna. http://www.R-project.org/. Accessed 20 Nov
2013
Santini NS, Schmitz N, Lovelock CE (2012) Variation in wood
density and anatomy in a widespread mangrove species.
Trees 26:1555–1563
Sitoe AA, Mandlate LJC, Guedes BS (2014) Biomass and car-
bon stocks of Sofala Bay mangrove forests. Forests
5:1967–1981
Slim FJ, Gwada PM, Kodjo M, Hemminga MA (1996) Biomass
and litterfall of Ceriops tagal and Rhizophora mucronata
in the mangrove forest of Gazi Bay, Kenya. Mar Freshw
Res 47:999–1007
Spalding M, Kainuma M, Collings L (2010) World atlas of
mangroves. A collaborative project of ITTO, ISME, FAO,
UNEP-WCMC, UNESCO-MAB, UNU-INWEH and
TNC. Earthscan, London, p 319
Steinke TD, Ward CJ, Rajh A (1995) Forest structure and bio-
mass of mangroves in the Mgeni estuary, South Africa.
Hydrobiologia 295:159–166
Tam NFY, Wong YS, Lan CY, Chen GZ (1995) Community
structure and standing crop biomass of a mangrove forest in
Futian Nature Reserve, Shenzhen, China. Hydrobiologia
295:193–201
Tamai S, Nakasuga T, Tabuchi R, Ogino K (1986) Standing
biomass of mangrove forests in southern Thailand. J Jpn
For Soc 68:384–388
Tamooh F, Huxhamd M, Karachi M, Mencuccini M, Kairo JG,
Kirui B (2008) Below-ground root yield and distribution in
natural and replanted mangrove forests at Gazi Bay,
Kenya. For Ecol Manag 256:1290–1297
United Republic of Tanzania (URT) (2010) National forest re-
sources monitoring and assessment of Tanzania
(NAFORMA). Field manual. Biophysical survey.
NAFORMA document M01 – 2010, p 108
Valiela I, Bowen JL, York JK (2001) Mangrove forests: one of
the world’s threatened major tropical environments. Bio-
science 51(10):807–815
Wang Y, Bonynge G, Nugranad J, Traber M, Ngusaru A, Tobey
J, Hale L, Bowen R, Makota V (2003) Remote sensing of
mangrove change along the Tanzania coast. Mar Geod
26:1–14
Wannasiri W, Nagai M, Honda K, Santitamnont P, Miphokasap
P (2013) Extraction of mangrove biophysical parameters
using airborne LiDAR. Remote Sens 5:1787–1808
Zanne AE, Lopez-Gonzalez G, Coomes DA, Ilic J, Jansen S,
Lewis SL, Miller RB, Swenson NG, Wiemann MC, Chave
J (2009) Global wood density database. Dryad. Identifier:
http://hdl.handle.net/10255/dryad.235. Accessed 15 Dec
2013
Wetlands Ecol Manage
123