Placental HIF-1 , HIF-2 , membrane and soluble VEGF receptor-1 proteins are not increased in...
28
PLACENTAL HIF-1, HIF -2, MEMBRANE AND SOLUBLE VEGF RECEPTOR-1 PROTEINS ARE NOT INCREASED IN NORMOTENSIVE PREGNANCIES COMPLICATED BY LATE ONSET INTRAUTERINE GROWTH RESTRICTION Augustine Rajakumar a , Arun Jeyabalan a , Nina Markovic b , Roberta Ness b , Carol Gilmour c and Kirk P. Conrad a,d Departments of Obstetrics, Gynecology and Reproductive Sciences a , Epidemiology, Graduate School of Public Health b and of Cell Biology and Physiology d , University of Pittsburgh School of Medicine and Magee Womens Research Institute Pittsburgh, PA 15213 USA. c Department of Pediatrics, Allegheny General Hospital and Drexel University School of Medicine, Pittsburgh, PA 15212 USA. Key words: Preeclampsia, Intrauterine Growth Restriction, Fetal Growth Restriction, Placenta, Hypoxia Inducible Transcription Factors, VEGF Receptor-1, sFlt-1 Word count: 3768 Address for Correspondence: Department of Physiology and Functional Genomics University of Florida College of Medicine 1600 SW Archer Road, M552 P.O. Box 100274 Gainesville, FL 32610-0274 Ph 352-392-2798 Fax 352-846-0270 Email [email protected] Page 1 of 28 Articles in PresS. Am J Physiol Regul Integr Comp Physiol (May 16, 2007). doi:10.1152/ajpregu.00097.2007 Copyright © 2007 by the American Physiological Society.
-
Upload
independent -
Category
Documents
-
view
2 -
download
0
Transcript of Placental HIF-1 , HIF-2 , membrane and soluble VEGF receptor-1 proteins are not increased in...

PLACENTAL HIF-1α, HIF -2α, MEMBRANE AND SOLUBLE VEGF RECEPTOR-1
PROTEINS ARE NOT INCREASED IN NORMOTENSIVE PREGNANCIES COMPLICATED BY LATE ONSET INTRAUTERINE GROWTH RESTRICTION
Augustine Rajakumara, Arun Jeyabalana, Nina Markovicb, Roberta Nessb, Carol
Gilmourc and Kirk P. Conrad a,d
Departments of Obstetrics, Gynecology and Reproductive Sciencesa, Epidemiology,
Graduate School of Public Healthb and of Cell Biology and Physiologyd, University of
Pittsburgh School of Medicine and Magee Womens Research Institute Pittsburgh, PA
15213 USA. cDepartment of Pediatrics, Allegheny General Hospital and Drexel
University School of Medicine, Pittsburgh, PA 15212 USA.
Key words: Preeclampsia, Intrauterine Growth Restriction, Fetal Growth Restriction,
Placenta, Hypoxia Inducible Transcription Factors, VEGF Receptor-1, sFlt-1
Word count: 3768
Address for Correspondence: Department of Physiology and Functional Genomics University of Florida College of Medicine 1600 SW Archer Road, M552
P.O. Box 100274
Gainesville, FL 32610-0274
Ph 352-392-2798
Fax 352-846-0270
Email [email protected]
Page 1 of 28Articles in PresS. Am J Physiol Regul Integr Comp Physiol (May 16, 2007). doi:10.1152/ajpregu.00097.2007
Copyright © 2007 by the American Physiological Society.

2
ABSTRACT Context: Inadequate trophoblast invasion and spiral artery remodeling leading to poor
placental perfusion are believed to underlie the pregnancy pathologies, preeclampsia
(PE) and intrauterine growth restriction (IUGR).
Main Objective: To investigate HIF-α and downstream genes (VEGF receptor-1) Flt-1
and (soluble) sFlt-1 proteins in IUGR placentas.
Design: Placentas from normal pregnant (NP, n=18), PE (n=18) and IUGR (n=10)
patients were investigated. Normotensive patients with IUGR delivered babies at > 37
weeks of gestation with birth weights of <10% and asymmetrical growth. HIF-1α and -
2α, Flt-1 and sFlt-1 protein and mRNA were assessed by Western and Northern
analyses, respectively. The results are expressed as ratios of the densitometric values
for each pair of pathologic and normal placentas, a ratio of 1.0 indicating no difference.
Results: Comparable to our earlier studies, the PE/NP ratios for HIF-1α, -2α, and Flt
proteins were significantly increased by 50-100% (all p < 0.01 vs 1.0). Unexpectedly,
the IUGR/NP ratios for HIF-1α and -2α proteins were 1.03 + 0.07 and 0.96 + 0.16,
respectively, and for Flt and sFlt, 1.14 ± 0.15 and 0.95 ± 0.12, respectively (all p = NS vs
1.0). Northern analysis revealed comparable levels of HIF-α mRNA in abnormal and
normal placentas.
Conclusion: In contrast to PE, HIF-α proteins and regulated genes are not increased in
placentas from normotensive pregnant women delivering small, asymmetrically grown
babies > 37 weeks of gestation. The absence of an increase in HIF-α protein is not due
to insufficient HIF-α mRNA for protein synthesis. Thus, the placentas from women with
PE and late IUGR are fundamentally different at the molecular level.
Page 2 of 28

3
INTRODUCTION Inadequate trophoblast invasion and remodeling of uterine spiral arteries leading
to poor placental perfusion is believed to underlie the pregnancy pathologies,
preeclampsia (PE) and intrauterine growth restriction (IUGR) (18, 21). We previously
documented that hypoxia inducible transcription factors, HIF-1α and -2α proteins, and
target genes such as Flt-1 and tyrosine hydroxylase are significantly increased in PE
placentas by 50-100 % relative to normal term and gestationally aged-matched control
placentas (27, 29). This placental over-expression of HIF-α protein and downstream
genes is most likely due to several factors including local hypoxia (38), as well as a
defect in oxygen-dependent degradation of HIF-α protein (28). In the present study, we
investigated placentas obtained from normotensive women who delivered growth
restricted babies (idiopathic IUGR). Since PE pregnancies (with or without IUGR) and
idiopathic IUGR are believed to share the same placental etiology, i.e., inadequate
trophoblast invasion and spiral artery remodeling leading to poor placental perfusion,
and consequently, decreased oxygen delivery, we hypothesized that the expression of
HIF-α and target genes, Flt-1 and sFlt-1 (38), would be increased in placentas from
normotensive women delivering growth restricted fetuses comparable to that observed in
placentas from women with PE (19, 27, 29). In this work, we focused on late onset
IUGR because being more frequent than early onset IUGR representing 90 and 10% of
IUGR cases (5), respectively, our sample collection reflected this distribution and
consisted almost exclusively of late onset IUGR cases.
Page 3 of 28

4
MATERIALS AND METHODS Placental collection and processing
Placentas were obtained from women with normal (n=18) and preeclamptic
(n=18) pregnancies, as well as from women who delivered small babies (n=14) under
the approval of the Institutional Internal Review Board of the University of Pittsburgh.
The placentas were sampled immediately after extraction from the uterus. To ensure
systematic and unbiased sampling of the entire placenta, we fitted a circular plastic grid
containing 16 holes over the maternal face of the placenta and obtained 16 biopsy
samples (4, 29). Each ~ 0.5 g sample contained the decidua basalis and villous
placenta but not chorionic plate. After several, rapid rinses in chilled saline, the tissues
were blotted dry and flash frozen in liquid nitrogen. In this study, we randomly chose 3
biopsy sites from the 16 site biopsy collection, and pooled the 3 biopsy sites, each of
comparable mass, to represent a single placenta.
Clinical definitions Clinical details for the patient groups are shown in Table 1.
The diagnosis of preeclampsia was made based on the Working Group Report
on High Blood Pressure in Pregnancy (30). Gestational blood pressure elevation was
defined as systolic blood pressure >140 or diastolic pressure >90 mmHg. Furthermore,
the subjects were normotensive during early pregnancy or postpartum with no history of
chronic hypertension. Preeclamptic subjects had new-onset proteinuria of >2+ on
dipstick or urinary creatinine/protein ratio > 0.3, and hyperuricemia of 1 SD above normal
for gestational age.
As shown in Table 2, five of the 18 preeclamptic subjects delivered small babies
(<5.5% based on gestational age at delivery, sex, and race for Magee-Womens
Hospital), all of whom were asymmetrically grown (see below) and/or showed abnormal
umbilical artery Doppler waveforms. The umbilical artery Doppler was considered to be
abnormal, if the systolic/diastolic ratio was greater than the 95% for gestational age or if
the diastolic flow was absent or reversed (6). Thus, we considered these babies to be
pathologically small or growth restricted rather than constitutionally small babies.
Fourteen patients without PE or gestational hypertension delivered small
babies with weights <10% based on gestational age at delivery, sex, and race for
Magee-Womens Hospital. Patients with underlying medical disorders, infection during
Page 4 of 28

5
pregnancy or substance abuse including smoking were excluded. There were no
recognized chromosomal or genetic defects in the babies. Symmetrically small babies
showed proportionate weight, length and head circumference below the population tenth
percentile. Asymmetric IUGR was defined by birth weight < length < head
circumference percentiles when the weight percentile was at least two percentile
categories below length and/or head circumference. Percentile categories were defined
by cutpoints at 3, 5, 10, 25, 50, 75, 90, 95, 97% (32). For example, the infant born of
patient #6 in Table 3 has a birth percentile of 2.0 (category <3), length percentile of 10-
25, and head circumference percentile of 10. Thus, the weight percentile is at least 2
categories below length and below the head circumference percentiles. Ten of 14
manifested asymmetric growth, and thus, we considered these to be pathologically small
or growth restricted babies (Table 3). In addition, seven of these 14 babies were <2.4%-
-a baby weight more likely to be associated with absent trophoblast invasion and
physiological remodeling of spiral arteries in the placental bed (13).
Placental weights were obtained for most of the patients and are listed in the
Tables. The placenta percentile weight was determined based on Magee-Womens
Hospital data for gestational ages 18-43 weeks. The percentile ranges are <10, 10-25,
25-50, 50-75, 75-90, and >90.
Western analysis
Total protein was extracted and Western analysis was conducted using our
published procedures with minor modification (27, 29). An anti-HIF-1α monoclonal
antibody (Transduction Laboratories, Lexington, KY, Cat # H72320) and a rabbit
polyclonal anti-HIF-2α antibody (Novus Biologicals, Littleton, CO, Cat # NB 100-122B2)
were utilized. The HIF-1α antibody was diluted 1:200 in TBS buffer (Tris buffered saline)
containing 0.05% Tween-20 (1.25 µg/mL); the HIF-2α antibody was diluted 1:1000 (2.2
µg/mL). Rabbit anti-human Flt-1 (Santa Cruz Biotechnology, Santa Cruz, CA, cat # SC-
316) was used to detect the full-length 185 kDa Flt-1 and mouse monoclonal anti-human
Flt-1 (Sigma Chemical Company, St Louis, MO, Cat # V4262) was used to detect the
100 KDa sFlt-1. They were diluted 1:200 and 1:1000, respectively, each to 2.2 µg/ml.
The mouse monoclonal anti-β-actin antibody (Sigma Chemical Company, St Louis, MO,
Cat # A 5441, respectively) was diluted 1:1000 yielding final concentrations of 2.2 µg/ml.
Fifty µg total protein was electrophoresed for detection of HIF-α, Flt-1, and sFlt-1. For
Page 5 of 28

6
the analysis of β-actin, 5 µg of total protein was electrophoresed on separate gels and
subjected to Western analysis. In addition, Coomassie blue staining of gels and
membranes indicated uniform loading and transfer (data not shown).
Northern Blot analysis Total RNA was isolated from placental tissues (n=8 for each group) using
RNAwiz (Ambion, Austin,TX) and Northern analysis was conducted using our published
procedures (29). For the preparation of the cDNA probes, plasmids pBS/HIF-1α 3.2-3T7
(EcoR1 digest of the complete cDNA produces 3 bands of sizes 2063, 1011 and 604 bp)
was generously provided by Dr. Gregg Semenza. Plasmid hEPAS-pcDNA3 (HIF-2α, a
2818 bp BamH1 fragment) was a kind gift from Dr. Steven McKnight. A 376 bp DNA
fragment specific for human β-actin (GenBank Accession # X00351), was amplified
using RT-PCR (forward primer 5’ AGCCATGTACGTTGCTATCCAGGCTGTGCT and
reverse primer 5’ AGCGGAACCGCTCATTGCCAATGGTGATGA).
Densitometry The bands on the developed Western and Northern blot films, as well as the
bands on the ethidium bromide stained gel (for 18S RNA) were scanned using a Hewlett
Packard laser scanner (Scanjet 5370C, Hewlett Packard, Palo Alta, CA) into a PICT or
TIFF file in grey scale. Densitometry was performed using anautomated digitizing
software UN-SCANITTM Gel Version 4.3 (Silk Scientific Inc., Orem, Utah).
Statistical analyses The data in all graphs are presented as mean + SEM. Statistical analyses
(Abacus Concepts, StatView, Abacus Concepts, Inc, Berkeley, CA 1992) consisted of
one-sample t-test or one or two factor univariate analysis of variance (ANOVA). When
appropriate, post hoc comparisons between individual group means were made by
Fishers Protected LSD tests. A p value of less than 0.05 was considered to be
significant.
Page 6 of 28

7
RESULTS
The expression of HIF-1α and -2α proteins for all subjects is shown in Figure 1.
Figure 1A portrays a representative western blot. Because multiple gels were required
to assess placental HIF-α protein levels for all patients in each group (a total of 50
subjects), we made a ratio of HIF-α expression between each of the abnormal placentas
and a normal placenta loaded adjacently in the gel. (The normal and pathological
placentas were randomly matched.) Thus, a ratio equal to 1.0 indicates no difference in
HIF-α expression between the normal term and abnormal placentas. In this way, the
assay variation among western blots was circumvented, thereby allowing for compilation
of the data as shown in Figure 1B. Both HIF-1α and -2α levels were significantly
increased in preeclamptic relative to normal term placentas, the ratios + SEM being 1.67
± 0.15 and 1.72 ± 0.20, respectively (p < 0.001 and <0.01 vs 1.0). In contrast, there was
no significant elevation of HIF-1α or -2α in the placentas from normotensive women
delivering growth restricted babies, the ratios being 1.03 ± 0.07 and 0.96 + 0.16,
respectively (both p = NS vs 1.0).
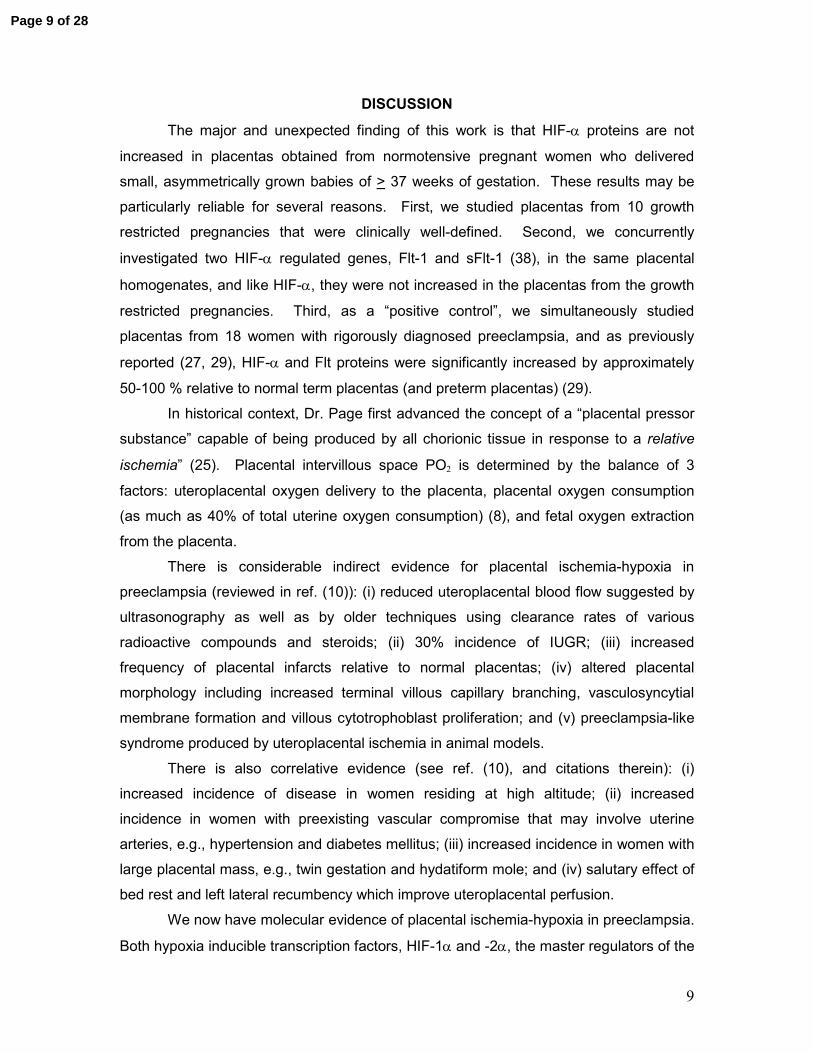
Because the results in Figure 1 included all women with PE, we further analyzed
the data according to baby weights > 10% (n=13 patients) and <10% (in fact, <5.5%,
n=5; Fig. 2A). The increase in HIF-α was comparable between these two groups of
preeclamptic women.
We further analyzed the data for the normotensive IUGR pregnancies shown in
Figure 1 by comparing those delivering babies of <2.4% (n=7 patients) vs >2.4% (n=7;
Fig. 2B). The former are more likely to have abnormal trophoblast invasion and absent
remodeling of spiral arteries which is believed to compromise placental perfusion and
delivery of oxygen and nutrients (13). Once again, however, neither HIF-1α nor -2α
protein was significantly increased in placentas from women delivering of asymmetrically
grown, small babies.
The expression of placental Flt-1 and sFlt-1 proteins for all subjects is shown in
Figure 3. Figure 3A portrays a representative western blot. Again, because multiple
gels were required to assess placental Flt-1 proteins for all patients in each group, we
made a ratio of Flt-1 or sFlt-1 expression between each abnormal and normal placenta.
Thus, a ratio equal to 1.0 indicates no difference in the expression of Flt-1 proteins
Page 7 of 28
8
between normal and abnormal placentas. In this way, the assay variation among
western blots was circumvented, thereby allowing for compilation of the data as shown
in Figure 3B. Both Flt-1 and sFlt-1 levels were significantly increased in preeclamptic
relative to normal term placentas, the ratios + SEM being 2.23 ± 0.30 and 2.11 ± 0.40,
respectively (both p < 0.001 vs 1.0). In contrast, there was no significant elevation of Flt-
1 or sFlt-1 in the placentas from women delivering asymmetrically grown, small babies
without preeclampsia, the ratios being 1.14 ± 0.15 and 0.95 + 0.12, respectively (both p
= NS vs 1.0).
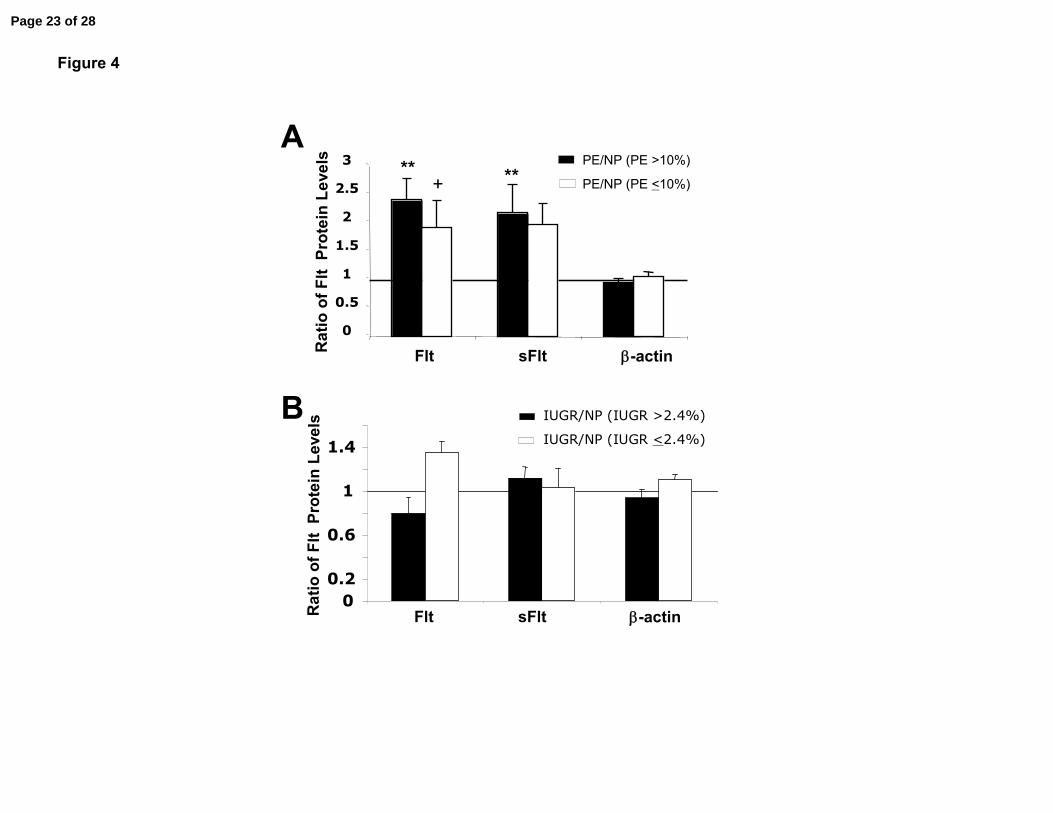
Because the results in Figure 3 included all women with PE, we further analyzed
the data according to baby weights > 10% (n=13 patients) and <10% (in fact, <5.5%,
n=5; Fig. 4A). The increase in Flt-1 and sFlt-1 were comparable between these two
groups of preeclamptic women.
We further analyzed the data in Figure 3 for the normotensive IUGR
pregnancies by comparing those delivering babies of <2.4% (n=7 patients) vs >2.4%
(n=7; Fig. 4B). Again, the former are more likely to have abnormal trophoblast invasion
and absent remodeling of spiral arteries (13). However, neither Flt-1 nor sFlt-1 protein
was significantly increased in placentas from women delivering of asymmetrically grown,
small babies.
One possible explanation for the lack of increase of HIF-α protein expression in
placentas from normotensive women delivering growth restricted babies is that there is
inadequate HIF-α mRNA to permit HIF-α protein accumulation despite protein
stabilization under hypoxia (36). Figure 5A depicts a representative Northern blot. After
normalizing for 18S RNA, we made a ratio of HIF-1α or -2α mRNA expression between
each abnormal and normal placenta. A compilation of the data is shown in Figure 5B;
HIF-1α and -2α mRNA levels were comparable among the normal and abnormal
placentas, the ratios not being significantly different from 1.0.
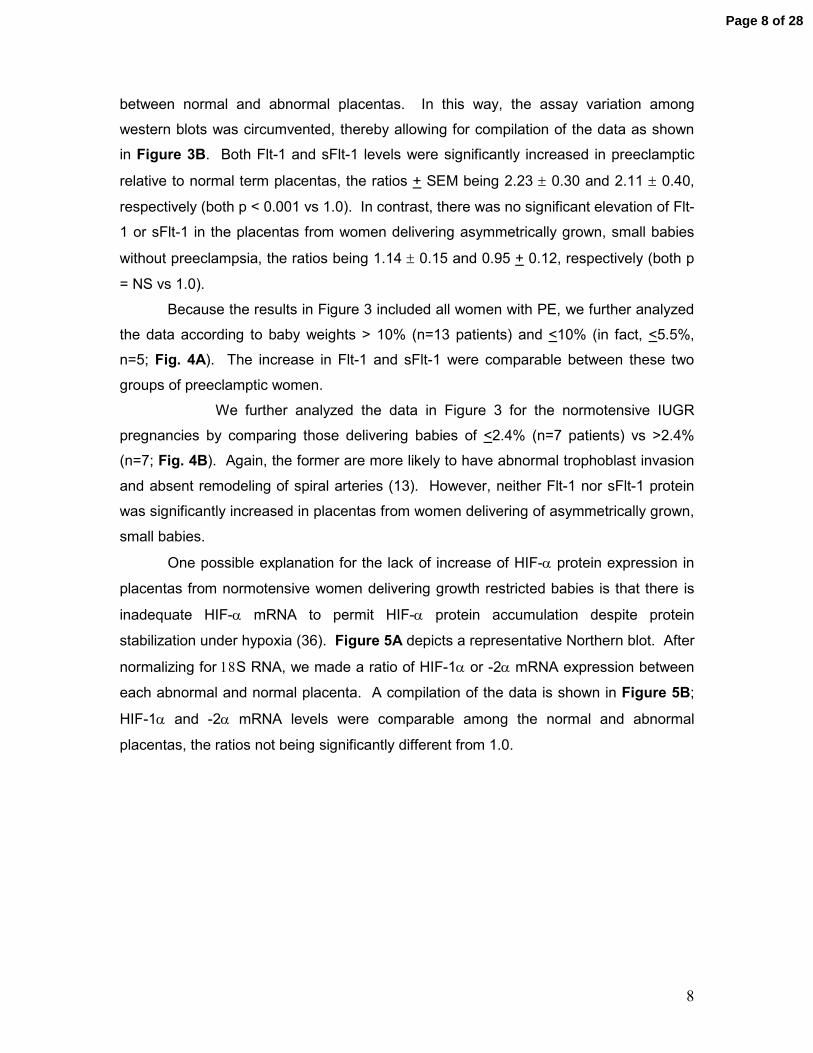
Page 8 of 28
9
DISCUSSION
The major and unexpected finding of this work is that HIF-α proteins are not
increased in placentas obtained from normotensive pregnant women who delivered
small, asymmetrically grown babies of > 37 weeks of gestation. These results may be
particularly reliable for several reasons. First, we studied placentas from 10 growth
restricted pregnancies that were clinically well-defined. Second, we concurrently
investigated two HIF-α regulated genes, Flt-1 and sFlt-1 (38), in the same placental
homogenates, and like HIF-α, they were not increased in the placentas from the growth
restricted pregnancies. Third, as a “positive control”, we simultaneously studied
placentas from 18 women with rigorously diagnosed preeclampsia, and as previously
reported (27, 29), HIF-α and Flt proteins were significantly increased by approximately
50-100 % relative to normal term placentas (and preterm placentas) (29).
In historical context, Dr. Page first advanced the concept of a “placental pressor
substance” capable of being produced by all chorionic tissue in response to a relative
ischemia” (25). Placental intervillous space PO2 is determined by the balance of 3
factors: uteroplacental oxygen delivery to the placenta, placental oxygen consumption
(as much as 40% of total uterine oxygen consumption) (8), and fetal oxygen extraction
from the placenta.
There is considerable indirect evidence for placental ischemia-hypoxia in
preeclampsia (reviewed in ref. (10)): (i) reduced uteroplacental blood flow suggested by
ultrasonography as well as by older techniques using clearance rates of various
radioactive compounds and steroids; (ii) 30% incidence of IUGR; (iii) increased
frequency of placental infarcts relative to normal placentas; (iv) altered placental
morphology including increased terminal villous capillary branching, vasculosyncytial
membrane formation and villous cytotrophoblast proliferation; and (v) preeclampsia-like
syndrome produced by uteroplacental ischemia in animal models.
There is also correlative evidence (see ref. (10), and citations therein): (i)
increased incidence of disease in women residing at high altitude; (ii) increased
incidence in women with preexisting vascular compromise that may involve uterine
arteries, e.g., hypertension and diabetes mellitus; (iii) increased incidence in women with
large placental mass, e.g., twin gestation and hydatiform mole; and (iv) salutary effect of
bed rest and left lateral recumbency which improve uteroplacental perfusion.
We now have molecular evidence of placental ischemia-hypoxia in preeclampsia.
Both hypoxia inducible transcription factors, HIF-1α and -2α, the master regulators of the
Page 9 of 28

10
cellular response to hypoxia, are increased in preeclamptic placentas ((27, 29), and
current study). In addition, downstream genes that are known to be regulated by HIF-
α are increased in the placentas of preeclamptic women ((1, 7, 17, 19, 22, 24, 35, 37),
and current study): TGF-β3, TERT (teleomerase), LDH-A4, tyrosine hydroxylase, Flt-1,
soluble Flt-1, endoglin and soluble endoglin, and pyroyl hydroxylase-3. Finally, DNA
microarray and suppressive- subtractive hybridization analyses demonstrate global
increase in hypoxia-activated genes (33, 36).
Nevertheless, there is one caveat. HIF-α protein abundance, transactivational
activity, or both can also be stimulated under “non-hypoxic” conditions, e.g., by growth
factors and cytokines such as insulin growth factor-1 and angiotensin II, small molecules
such as nitric oxide and reactive oxygen species, as well as other factors (38).
However, the mechanism of stimulation may be different, e.g., IGF-1 and angiotensin II
increase HIF-α protein abundance through increasing translational efficiency rather than
protein stabilization as occurs under hypoxia (38). On balance, after considering all of
the evidence reviewed above (indirect, correlative, and molecular), uteroplacental
oxygen delivery in preeclampsia is likely to be reduced relative to placental and/or fetal
oxygen consumption, thereby rendering a relatively hypoxic intervillous space and
placenta.
Interestingly, increased expression of HIF-α and downstream genes, Flt-1 and
sFlt-1 were comparable in placentas from preeclamptic women with normally grown or
growth restricted fetuses. Because uterine blood flow is believed to be more severely
compromised in the latter, we anticipated even higher levels of HIF-α and regulated
genes. On a cautionary note, however, only 5 of 18 or 30% of the preeclamptic
pregnancies were associated with fetal growth restriction in agreement with the literature
(20). This low number of cases may have precluded the detection of any further
increase in the expression of HIF-α and regulated genes in this sub-group of
preeclamptic subjects. Alternatively, restricted fetal and placental growth may reduce
oxygen consumption, thereby offsetting the more severely compromised uterine blood
flow and oxygen delivery and preventing further increases in HIF-α and regulated genes.
Of additional note is the lack of association between gestational age and HIF-
1α, −2α, Flt-1 and sFlt-1 protein expression in placentas from preeclamptic women as
shown in Figure 6 which is a compilation of individual data from the present and our
previous studies (27, 29). On the one hand, we expected that early, severe
Page 10 of 28

11
preeclampsia might be associated with higher levels of placental HIF-α and regulated
genes, due to more severely compromised trophoblast invasion, spiral artery
remodeling, uterine blood flow and oxygen delivery. On the other hand, early, severe
preeclampsia is frequently associated with both abnormal uterine and umbilical artery
Doppler waveforms (12), the latter suggesting reduced fetal oxygen extraction which
may mitigate further increases in HIF-α. Unfortunately, we did not obtain placentas from
women with early onset IUGR (without preeclampsia) to make a similar correlation (see
penultimate paragraph, below).
The main goal of this study was to investigate the status of placental HIF-α
expression in normotensive women who delivered growth restricted babies, because
both preeclampsia and IUGR are thought to share a common placental etiology; namely,
shallow placentation and placental hypoxia (21). Indeed, Mayhew and colleagues (18)
stated that “…late onset IUGR and presence of end diastolic waveforms on umbilical
artery Doppler ultrasound belong to the uteroplacental type of hypoxia since [it is]
associated with ischemia-hypoxia in which delivery of blood flow to the intervillous space
is compromised by events initiated early in pregnancy when there is deficient trophobast
invasion of spiral arteries.” Thus, we studied placentas from normotensive women who
delivered asymmetrically grown babies of > 37 weeks of gestation with normal umbilical
artery Doppler waveforms. However, the data show that HIF-1α and -2α proteins, as
well as the downstream genes sFlt-1 and Flt-1 are not increased in these placentas even
from pregnancies that resulted in a baby of < 2.4 % which has been shown to be
associated with absent trophoblast invasion and spiral artery remodeling (13). In future
studies, it would be worthwhile to concurrently perform placental bed biopsies to
document the degree of deficient trophoblast invasion and spiral artery remodeling and
measurements of molecular markers of villous oxygenation. Indeed, one possibility is
that trophoblast invasion and spiral artery remodeling are not compromised in
normotensive patients with IUGR babies > 37 weeks gestation with birth weights < 10%
(or < 2.4% for that matter, see above) and asymmetrical growth.
A previous investigation suggested a global decrease in transcriptional activity
and mRNA abundance in placentas from IUGR pregnancies (36). However, absence of
HIF-α induction in our study was not a consequence of insufficient mRNA to make
protein for stabilization by hypoxia as assessed by Northern analysis. Comparable
levels of HIF-α mRNA were observed between normal term placentas and placentas
from normotensive IUGR and preeclamptic women, the latter corroborating earlier work
Page 11 of 28

12
(29). Another explanation is that the IUGR placentas are unable to sense or respond to
hypoxia, a possibility to be tested in the future.
The most likely explanation for the present findings is that, in contrast to
preeclampsia, uteroplacental oxygen delivery is matched to reduced placental and/or
fetal oxygen consumption such that the intervillous/placental PO2 is relatively non-
hypoxic (26). This conclusion is consistent with the finding that sFlt-1 is not increased in
the maternal circulation of these women (12, 32). It is also consistent with one (36), but
not another (31) report on the status of hypoxia activated genes in placentas from IUGR
pregnancies as determined by subtractive-suppressive hybridization and DNA
microarray, respectively.
The present results raise a conundrum. In late onset IUGR, does reduced
uteroplacental oxygen delivery limit fetal oxygen extraction and hence growth, or does
reduced fetal oxygen extraction and growth limit uteroplacental blood flow? The latter
suggests that some cases of late onset IUGR may represent a primary reduction in fetal
oxygen extraction with appropriately matched (reduced) placental growth, trophoblast
invasion, spiral artery remodeling, and uteroplacental blood flow.
We speculate that the potential link between fetal growth and uteroplacental
blood flow may be intervillous space/placental PO2. In normal pregnancy, fetal growth
increases fetoplacental oxygen extraction, thereby reducing intervillous space/placental
PO2. (Note that HIF-α expression is exquisitely sensitive to small changes of PO2 in the
physiological range (28, 38)). The reduced PO2, in turn, stimulates expression of
placental HIF-α and downstream genes such as vascular endothelial and other growth
factors, the latter serving to increase placental size and vascularization, and perhaps
through veno-arterial exchange (9), to enhance uterine blood flow by promoting
trophoblast migration and invasion on the one hand, and by dilating spiral and more
proximal uterine arteries on the other. The opposite chain of events may pertain to
some cases of late IUGR. With reduced fetal growth, fetoplacental oxygen extraction is
less (or vice versa, see below), such that an imbalance between uteroplacental oxygen
delivery and consumption is not produced, and intervillous space/placental PO2 is
relatively non-hypoxic. In the absence of reduced PO2, HIF-α and regulated genes are
not induced, thereby depriving (and appropriately so) the placenta of growth factors to
grow and vascularize, and the placental bed of these signals to promote trophoblast
migration and invasion, and dilation of uterine arteries. Thus, the lack of placental
growth, trophoblast invasion, spiral artery remodeling and dilation is a secondary rather
Page 12 of 28

13
than a primary event. Because the placenta virtually doubles in diameter from 20
gestational weeks to term (3), trophoblast invasion and spiral artery remodeling likely
occur throughout gestation, and therefore, these processes could conceivably be
modified (restrained) as described above by fetal growth restriction occurring later in
pregnancy. (Note however that, despite its logical basis, to our knowledge there are no
data to support the contention that trophoblast invasion and remodeling entails
progressively more lateral arteries as gestation advances.)
In addition to a primary reduction in fetal growth, another potential explanation for
reduced fetoplacental oxygen extraction is a primary increase in fetoplacental vascular
resistance and/or decreased compliance (due to abnormal arterial function and structure
or inadequate vascularity) albeit typically below the sensitivity of umbilical artery Doppler
ultrasound as applied clinically (Table 3), perhaps as a consequence of epigenetic or
genetic inheritance. This concept of fetoplacental vascular abnormalites in utero that are
inherited may be another explanation for the apparent predisposition of some babies
who are born small to develop cardiovascular disease in adult life (2).
Although we did not have placentas from early IUGR available to us, there are
relevant data emerging from other labs that need mention here. Traditionally, early
IUGR with abnormal umbilical artery Doppler waveforms is considered to be “post-
placental” hypoxia, although to our knowledge, HIF-α protein expression has not been
reported for these placentas. Thus, the PO2 of the intervillous space and villous
placenta has been considered to be non-hypoxic or even relatively “hyperoxic” (3).
However, recent evidence suggests increased sFlt-1 expression in the placenta (23, 34),
as well as increased maternal circulating levels of sFlt-1 in these pregnancies (12).
Insofar as sFlt-1 is regulated by hypoxia and HIF-α, these findings do not support the
concept of “post-placental” hypoxia in early IUGR. However, an explanation that may
reconcile this apparent contradiction is that, if HIF-α is found to be increased, it may be
elevated on the basis of excess reactive oxygen species which can stabilize HIF-α
protein by any one of several mechanisms impairing degradation (38).
A non-invasive measurement of the relative state of intervillous space/placental
oxygenation would be useful in the prediction, classification, and treatment of the
obstetrical diseases believed to be related to inadequate placentation (intrauterine
growth restriction, preeclampsia and preterm labor). In this regard, non-invasive
approaches such as Near-Infrared Spectroscopy and Blood Oxygen Level-Dependent
Magnetic Resonance Imaging may prove to be safe and reliable methodologies (15, 16).
Page 13 of 28

14
When relative placental ischemia/hypoxia is a component of the disease, then strategies
to improve uteroplacental blood flow may be beneficial, in order to improve placental and
fetal growth, and/or alleviate maternal endothelial dysfunction by reducing circulating
toxic factors which emanate from the placenta as a consequence of local hypoxia. In
this regard, recombinant human relaxin may be efficacious by not only improving
maternal renal and systemic hemodynamics (without causing undue systemic
hypotension), but also by vasodilating unremodeled spiral arteries and more proximal,
vasoconstricted uterine arteries (11, 14).
ACKNOWLEDGEMENTS
Portions of this work were published in abstract form: J Soc Gynecol Invest 13 (2): 229A,
2006. This work was supported by NIH PO1 HD30367. Dr. Jeyabalan is supported by
the BIRCWH Faculty Development Award (NIH K12-HD043441).
Page 14 of 28

15
REFERENCES
1. Alfaidy N, Gupta S, DeMarco C, Caniggia I, and Challis JR. Oxygen regulation of placental 11 beta-hydroxysteroid dehydrogenase 2: physiological and pathological implications. J Clin Endocrinol Metab 87: 4797-4805, 2002. 2. Barker DJ. The long-term outcome of retarded fetal growth. Clin Obstet Gynecol 40: 853-863, 1997. 3. Benirschke K KP. Pathology of Human Placenta. New York: Springer-Verlag, 2000. 4. Benyo DF, Smarason A, Redman CW, Sims C, and Conrad KP. Expression of inflammatory cytokines in placentas from women with preeclampsia. J Clin Endocrinol Metab 86: 2505-2512, 2001. 5. Boulet SL, Alexander GR, Salihu HM, Kirby RS, and Carlo WA. Fetal growth risk curves: defining levels of fetal growth restriction by neonatal death risk. Am J Obstet Gynecol 195: 1571-1577, 2006. 6. Bulletins-Gynecology CoP. Intrauterine Growth Restriction. Clinical Management Guidelines for Obstetricians-Gynecologists. American College of Obstetricians and Gynecologists. Int J Gynaecol Obstet 72: 85-96, 2001. 7. Caniggia I, Grisaru-Gravnosky S, Kuliszewsky M, Post M, and Lye SJ. Inhibition of TGF-beta 3 restores the invasive capability of extravillous trophoblasts in preeclamptic pregnancies. J Clin Invest 103: 1641-1650, 1999. 8. Carter AM. Placental oxygen consumption. Part 1. In vivo Studies-A review. Placenta, Supplement A, trophoblast Research 14: S31-S37, 1999. 9. Celia G and Osol G. Uterine venous permeability in the rat is altered in response to pregnancy, vascular endothelial growth factor, and venous constriction. Endothelium 12: 81-88, 2005. 10. Conrad KP and Benyo DF. Placental cytokines and the pathogenesis of preeclampsia. Am J Reprod Immunol 37: 240-249, 1997. 11. Conrad KP and Novak J. Emerging role of relaxin in renal and cardiovascular function. Am J Physiol Regul Integr Comp Physiol 287: R250-261, 2004. 12. Crispi F, Dominguez C, Llurba E, Martin-Gallan P, Cabero L, and Gratacos E. Placental angiogenic growth factors and uterine artery Doppler findings for characterization of different subsets in preeclampsia and in isolated intrauterine growth restriction. Am J Obstet Gynecol 195: 201-207, 2006. 13. Gerretsen G, Huisjes HJ, and Elema JD. Morphological changes of the spiral arteries in the placental bed in relation to pre-eclampsia and fetal growth retardation. Br J Obstet Gynaecol 88: 876-881, 1981. 14. Jeyabalan A and Conrad KP. Renal function during normal pregnancy and preeclampsia. Front Biosci 12: 2425-2437, 2007. 15. Kakogawa J, Sumimoto K, Ho E, and Kanayama N. Transabdominal measurement of oxygenation of the placenta by near-infrared spectroscopy. Semin Thromb Hemost 31: 297-301, 2005. 16. Levine D. Science to practice: can MR oxygenation imaging be used to assess at-risk pregnancies? Radiology 238: 765-766, 2006. 17. Lyall F, Simpson H, Bulmer JN, Barber A, and Robson SC. Transforming growth factor-beta expression in human placenta and placental bed in third trimester normal pregnancy, preeclampsia, and fetal growth restriction. Am J Pathol 159: 1827-1838, 2001.
Page 15 of 28

16
18. Mayhew TM, Charnock-Jones DS, and Kaufmann P. Aspects of human fetoplacental vasculogenesis and angiogenesis. III. Changes in complicated pregnancies. Placenta 25: 127-139, 2004. 19. Maynard SE, Min JY, Merchan J, Lim KH, Li J, Mondal S, Libermann TA, Morgan JP, Sellke FW, Stillman IE, Epstein FH, Sukhatme VP, and Karumanchi SA. Excess placental soluble fms-like tyrosine kinase 1 (sFlt1) may contribute to endothelial dysfunction, hypertension, and proteinuria in preeclampsia. J Clin Invest 111: 649-658, 2003. 20. Ness RB RJ. Epidemiology of Hypertension. Connecticut: Appleton & Lange, 1978. 21. Ness RB and Sibai BM. Shared and disparate components of the pathophysiologies of fetal growth restriction and preeclampsia. Am J Obstet Gynecol 195: 40-49, 2006. 22. Nevo O, Soleymanlou N, Wu Y, Xu J, Kingdom J, Many A, Zamudio S, and Caniggia I. Increased expression of sFlt-1 in in vivo and in vitro models of human placental hypoxia is mediated by HIF-1. Am J Physiol Regul Integr Comp Physiol 291: R1085-1093, 2006. 23. Nevo O XJ, Many A, Wu Y, Petkovic L, Kingdom J, Todros T, Caniggia I. sFLT-1 expression is increased in placentae from IUGR pregnancies. J Soc Gynecol Invest 13: 235A, 2006. 24. Nishi H, Nakada T, Kyo S, Inoue M, Shay JW, and Isaka K. Hypoxia-inducible factor 1 mediates upregulation of telomerase (hTERT). Mol Cell Biol 24: 6076-6083, 2004. 25. Page EW. The relation between hydatid moles, relative ischemia of the gravid uterus, and the placental origin of eclampsia. Am J Obstet Gynecology 37: 291-293, 1939. 26. Pardi G, Cetin I, Marconi AM, Bozzetti P, Buscaglia M, Makowski EL, and Battaglia FC. Venous drainage of the human uterus: respiratory gas studies in normal and fetal growth-retarded pregnancies. Am J Obstet Gynecol 166: 699-706, 1992. 27. Rajakumar A, Brandon HM, Daftary A, Ness R, and Conrad KP. Evidence for the functional activity of hypoxia-inducible transcription factors overexpressed in preeclamptic placentae. Placenta 25: 763-769, 2004. 28. Rajakumar A, Doty K, Daftary A, Harger G, and Conrad KP. Impaired oxygen-dependent reduction of HIF-1alpha and -2alpha proteins in pre-eclamptic placentae. Placenta 24: 199-208, 2003. 29. Rajakumar A, Whitelock KA, Weissfeld LA, Daftary AR, Markovic N, and Conrad KP. Selective overexpression of the hypoxia-inducible transcription factor, HIF-2alpha, in placentas from women with preeclampsia. [Overexpression of the hypoxia-inducible factors HIF-1. Biol Reprod 64: 499-506; Erratum 464:1019-1020, 2001. 30. Roberts JM PG, Cutler J, Lindheimer M. Summary of the NHLBI working group on research on hypertension during pregnancy., 2003, p. 437-445. 31. Roh CR, Budhraja V, Kim HS, Nelson DM, and Sadovsky Y. Microarray-based identification of differentially expressed genes in hypoxic term human trophoblasts and in placental villi of pregnancies with growth restricted fetuses. Placenta 26: 319-328, 2005. 32. Shibata E, Rajakumar A, Powers RW, Larkin RW, Gilmour C, Bodnar LM, Crombleholme WR, Ness RB, Roberts JM, and Hubel CA. Soluble fms-like tyrosine kinase 1 is increased in preeclampsia but not in normotensive pregnancies with small-for-gestational-age neonates: relationship to circulating placental growth factor. J Clin Endocrinol Metab 90: 4895-4903, 2005.
Page 16 of 28

17
33. Soleymanlou N, Jurisica I, Nevo O, Ietta F, Zhang X, Zamudio S, Post M, and Caniggia I. Molecular evidence of placental hypoxia in preeclampsia. J Clin Endocrinol Metab 90: 4299-4308, 2005. 34. Tsatsaris V, Goffin F, Munaut C, Brichant JF, Pignon MR, Noel A, Schaaps JP, Cabrol D, Frankenne F, and Foidart JM. Overexpression of the soluble vascular endothelial growth factor receptor in preeclamptic patients: pathophysiological consequences. J Clin Endocrinol Metab 88: 5555-5563, 2003. 35. Tsoi SC, Zheng J, Xu F, and Kay HH. Differential expression of lactate dehydrogenase isozymes (LDH) in human placenta with high expression of LDH-A(4) isozyme in the endothelial cells of pre-eclampsia villi. Placenta 22: 317-322, 2001. 36. Vaiman D, Mondon F, Garces-Duran A, Mignot TM, Robert B, Rebourcet R, Jammes H, Chelbi ST, Quetin F, Marceau G, Sapin V, Piumi F, Danan JL, Rigourd V, Carbonne B, and Ferre F. Hypoxia-activated genes from early placenta are elevated in preeclampsia, but not in Intra-Uterine Growth Retardation. BMC Genomics 6: 111, 2005. 37. Venkatesha S, Toporsian M, Lam C, Hanai J, Mammoto T, Kim YM, Bdolah Y, Lim KH, Yuan HT, Libermann TA, Stillman IE, Roberts D, D'Amore PA, Epstein FH, Sellke FW, Romero R, Sukhatme VP, Letarte M, and Karumanchi SA. Soluble endoglin contributes to the pathogenesis of preeclampsia. Nat Med 12: 642-649, 2006. 38. Wenger RH, Stiehl DP, and Camenisch G. Integration of oxygen signaling at the consensus HRE. Sci STKE 2005: re12, 2005.
Page 17 of 28

18
FIGURE LEGENDS
Figure 1. Western blot analyses of HIF-1 and -2α proteins in placental biopsies
obtained from women with normal (NP) or preeclamptic (PE) pregnancies, or from
normotensive pregnant women who delivered growth restricted babies (IUGR, < 10%
birth weight, n=10) without PE. Pregnancies resulting in both normally grown (> 10%,
n=13) and small babies (< 10%, n=5) are included in the PE group. (A) A representative
western blot is depicted. (B) HIF-α protein in each abnormal placenta is expressed as
the ratio of HIF-α protein in a normal term placenta. The individual ratios for n=18
placental pairs each for PE/NP and n=10 placental pairs each for IUGR/NP are
averaged and depicted in the graph. A stippled line indicates a ratio of 1.0. If the ratio is
not significantly different from unity, then expression of HIF-α protein is comparable in
the placentas from abnormal and normal pregnancies. ** P< 0.001 and *P<0.01 vs 1.0.
Figure 2. Additional analyses of HIF-1α and -2α proteins in placental biopsies. HIF-α
protein in each abnormal placenta is expressed as the ratio of HIF-α protein in a normal
term placenta. Portrayed in (A) are HIF-α protein levels in n= 5 placentas from women
with PE who delivered growth restricted babies of <10% birth weight (in fact, <5.5%),
and n= 13 placentas from women with PE who delivered babies >10% expressed as a
ratio of HIF-α protein in normal term placentas. In (B) HIF-α protein levels are portrayed
for placentas from normotensive women delivering of growth restricted babies <2.4%
and >2.4%, n=7 each. **P<0.01, *P<0.05, and †P<0.1 vs 1.0.
Figure 3. Western blot analysis of HIF-α regulated proteins, VEGF receptor, Flt-1 and
intracellular sFlt-1, in placental biopsies obtained from women with normal (NP) or
preeclamptic (PE) pregnancies, or from normotensive pregnant women who delivered
growth restricted babies (IUGR, < 10% birth weight, n=10) without PE. Pregnancies
resulting in both normally grown (>10%, n=13) and small babies (< 10%, n=5) are
included in the PE group. (A) A representative western blot is depicted. (B) Flt protein
in each abnormal placenta is expressed as the ratio of Flt protein in a normal term
placenta. The individual ratios for n=18 placental pairs each for PE/NP and n=10
placental pairs for IUGR/NP are averaged and depicted in the graph. A stippled line
indicates a ratio of 1.0. If the ratio is not significantly different from unity, then
Page 18 of 28

19
expression of Flt protein is comparable in the placentas from abnormal and normal
pregnancies. ** P< 0.001 vs 1.0.
Figure 4. Additional analyses of Flt proteins in placental biopsies. Flt protein in each
abnormal placenta is expressed as the ratio of Flt protein in a normal term placenta.
Portrayed in (A) are Flt-1 and sFlt-1 protein levels in n= 5 placentas from women with PE
who delivered growth restricted babies of <10% birth weight (in fact, <5.5%), and n= 13
placentas from women with PE who delivered babies >10% expressed as a ratio of HIF-
α protein in normal term placentas. In (B) Flt-1 and sFlt-1 protein levels are portrayed
for placentas from normotensive women delivering of growth restricted babies <2.4%
and >2.4%, n=7 each. **P<0.01 and †P<0.1 vs 1.0.
Figure 5. Northern blot analysis of HIF-1α and -2α mRNA in placental biopsies
obtained from women with normal (NP) or preeclamptic (PE) pregnancies, or from normotensive pregnant women who delivered growth restricted babies (IUGR, < 10% birth weight) without PE. Pregnancies resulting in both normally grown (> 10%,
n=5) and small babies (< 10 %, n=3) are included in the PE group. (A) A representative
northern blot for HIF-1α and -2α is depicted. (B) Densitometry was performed and HIF-
α values were first normalized to 18S RNA. Then, normalized HIF-α mRNA in each
abnormal placenta is expressed as the ratio of HIF-α mRNA in a normal term placenta.
The individual ratios for n=8 placental pairs each for PE/NP and IUGR/NP are averaged
and depicted in the graph. A stippled line indicates a ratio of 1.0. If the ratio is not
significantly different from unity, then expression of HIF-α mRNA is comparable in the
placentas from abnormal and normal pregnancies. .
Figure 6. Compilation of HIF-1α, -2α, Flt-1 and sFlt-1 protein levels in placentas
from preeclamptic women expressed as a function of gestational age [from the
present study and refs (27, 29)]. (A) HIF-1a, (B) HIF-2α, (C) Flt-1 and (D) sFlt proteins
in each preeclamptic placenta are expressed as the ratio of their respective proteins in a
normal term placenta. Each point represents one placental pair. There was no
significant correlation between HIF-α or Flt proteins and gestational age.
Page 19 of 28

Placenta # 1 2 3
HIF-1α
HIF-2α
130 Kd
115 Kd
43 Kd β-actin
IUG
R
PENP IUG
R
PENP IUG
R
PENP
HIF-2α
Rat
io o
f H
IF P
rote
in L
evel
s
** * PE/NP
IUGR/NP
β-actinHIF-1α
A
B
Figure 1
0
0.5
1
1.5
2
2.5
Page 20 of 28
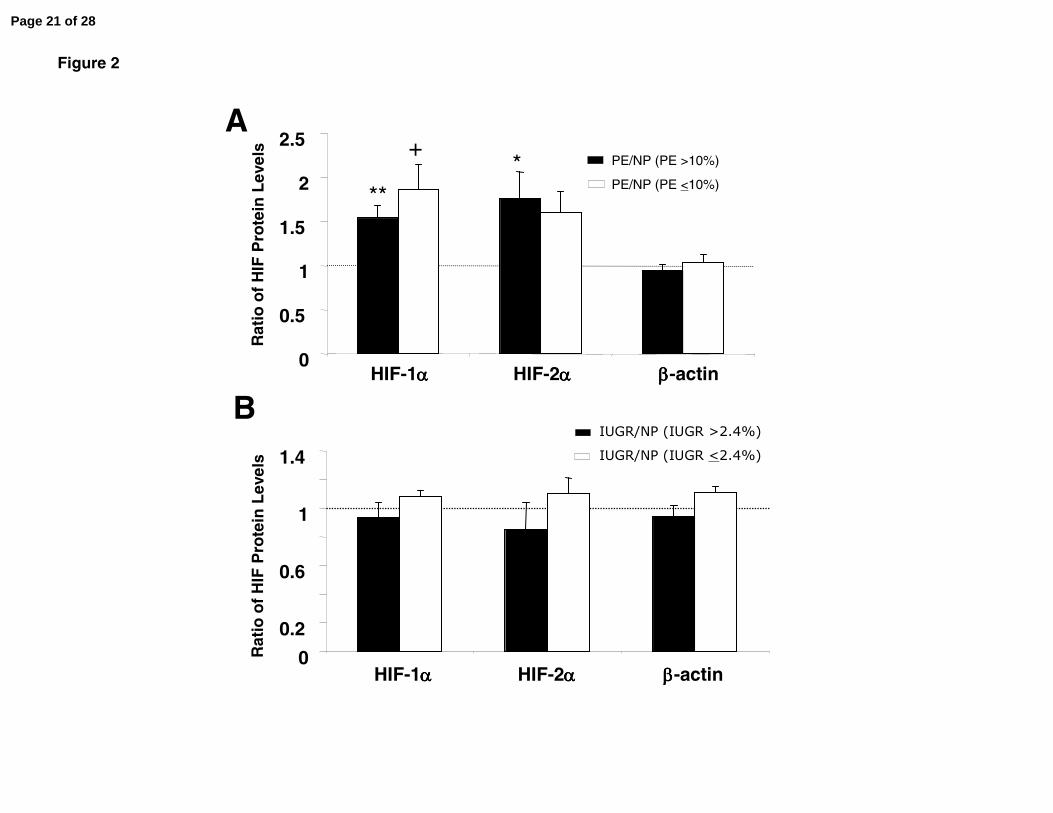
Figure 2
B
A
0
0.5
1
1.5
2
2.5
HIF-1αααα HIF-2αααα ββββ-actin
PE/NP (PE >10%)
PE/NP (PE <10%)
Rat
io o
f H
IF P
rote
in L
evel
s
0
0.2
0.6
1
1.4IUGR/NP (IUGR >2.4%)IUGR/NP (IUGR <2.4%)
HIF-1αααα HIF-2αααα ββββ-actin
Rat
io o
f H
IF P
rote
in L
evel
s
***
+
Page 21 of 28

Rat
io o
fFlt
Prot
ein
leve
ls
0
0.5
1
1.5
2
2.5
Flt-1 sFlt-1 β-actin
PE/NP
IUGR/NP
**
A
B
Figure 3
Placenta # 1 2 3
Flt-1
sFlt-1
185 Kd
100 Kd
43 Kd β-actin
IUGR
PENP IUGR
PENP IUGR
PENP
**
Page 22 of 28
0
0.5
1
1.5
2
2.5
3
Flt sFlt β-actin
00.2
0.6
1
1.4
Flt sFlt β-actin
Figure 4
B
A
Rat
ioof
F lt
Pro t
ein
L eve
ls ** **+
Rat
ioof
F lt
Pro t
ein
L eve
ls
PE/NP (PE >10%)
PE/NP (PE <10%)
IUGR/NP (IUGR >2.4%)
IUGR/NP (IUGR <2.4%)
Page 23 of 28

Figure 5
Page 24 of 28

0
1
2
3
4
5
20 30 40 50
0
0.5
1
1.5
2
2.5
3
3.5
20 30 40 50
0
1
2
3
4
5
6
20 30 40 50
0123456789
20 30 40 50
A
B
C
D
Rat
io o
f H
IF-2α
Pro
tein
(PE
/NP
)R
atio
of
HIF
-1α
Pro
tein
(PE
/NP
)R
atio
of
Flt
Pro
tein
(PE
/NP
)
Rat
io o
f sF
ltP
rote
in(P
E/N
P)
Gestational Age (weeks)
y=-0.014x+2.15R2 = 0.01
y=-0.05x+3.9R2 = 0.04
y= 0.03x+1.3R2 = 0.006
y= 0.07x-0.46R2 = 0.03
Figure 6
Page 25 of 28

TABLE 1. General clinical parameters of all subjects
Normal Pregnancy (n=18) Preeclampsia (n=18)a Small Babies (n=14) b
Maternal age (years) 28 ± 2 27 ± 2 27 ± 2
Race 16 Caucasian,2 African American
13 Caucasian,3 African American, 2 Asian
9 Caucasion4 African American, 1 Asian
Gestational age at delivery (weeks)
39.5 ± 0.3 35.9 ± 0.8* 38.0 ± 0.2**
Birth weight (g) 3551 ± 232*** 2433 ± 230 2225 ± 61
Placental weight (g) Not available 308 ± 30 286 ± 25
Parity 17/18 Nulliparous 16/18 Nulliparous 10/14 Nulliparous
Mode of delivery 9 CS, 9 VD 10 CS, 8 VD 3 CS, 11 VD
Systolic blood pressure (mmHg) 118 ± 2 154 ± 3**** 113 ± 2
Diastolic blood pressure (mmHg) 72 ± 2 96 ± 3**** 71 ± 2
Proteinuria None 18/18c None
Uric acid (mg/dL) ND 6.3 ± 0.3 ND
Means ± SEM. a One patient had HELLP syndrome. Five of the preeclamptic patients delivered small babies (< 5.5% birth weight). See Table 2
for further details. b Patients delivered small babies of < 10% birth weight. See Table 3 for further details. c ≥ 2+ on dipstick (5 patients),
protein/creatinine ratio of >0.3 (13 patients). ND, not determined. * P < 0.0001 vs normal pregnancy; **P < 0.05 vs normal pregnancy and
preeclampsia; ***P<0.001 vs preeclampsia and IUGR: **** P<0.0001 vs normal pregnancy and IUGR. CS= Cesarean section; VD= Vaginal
delivery.
Page 26 of 28

TABLE 2. Clinical characteristics of preeclamptic pregnancies with small babies
Patient #
Birth Weight
Percentile
Length Percentile
Head Circumference
Percentile
Gestational Age at
Delivery
Oligo-hydramnios
Abnormal Umbilical
Artery Doppler
Growth Profile Research Classification
Placental weight
(g)
Placental wt %tile
1 3.9 25-50 25-50 37 - NAa Asymmetrical IUGR 270 <10
2 4.7 5-10 10 33 + + Asymmetrical IUGR 150 <10
3 0.8 3-5 5-10 37 - NA Asymmetrical IUGR 270 <10
4 0.0 10-25 25-50 38 - NA Asymmetrical IUGR 245 <10
5 5.5 10-25 3 36 - NA bAsymmetrical IUGR 240 <10
Five of 18 women with preeclampsia delivered small babies. These infants also showed clinical evidence of growth
restriction (abnormal umbilical artery Doppler waveforms and/or asymmetric growth profile). aNot Available; bMicroencephalic.
Page 27 of 28

TABLE 3. Clinical characteristics of pregnancies with small babies
Patient
#
Birth
Weight
Percentile
Length
Percentile
Head
Circumference
Percentile
Gestational
Age at
Delivery
Oligo-
hydramnios
Abnormal
Umbilical
Artery
Doppler
Growth Profile Research
Classification
Placental
weight
(g)
Placental
wt %tile
1 0.4 <3 5-10 38 - - Asymmetrical IUGR 245 <10
2 4.1 10 5-10 37 - - Symmetrical SGA 295 <10
3 9.5 25-50 5 40 - - bAsymmetrical IUGR 400 10-25
4 9.8 75-90 25 39 - NA Asymmetrical IUGR NA NA
5 2.1 NA NA 33 aNA NA NA NA 226 <10
6 2.0 10-25 10 37 - - Asymmetrical IUGR 390 10-25
7 2.4 3-5 5-10 39 - - Asymmetrical IUGR 190 <10
8 1.5 5-10 5 37 - - Asymmetrical IUGR 325 <10
9 5.5 10-25 10 39 - - Symmetrical SGA 275 <10
10 0.6 3 25-50 38 - NA Asymmetrical IUGR 440 50-75
11 8.3 5-10 10-25 39 - - Asymmetrical IUGR NA NA
12 0.0 <3 <3 37 - - Asymmetrical IUGR 160 <10
13 3.3 5-10 3 38 - - Symmetrical SGA 250 <10
14 9.1 50 50-75 37 - - Asymmetrical IUGR 240 <10
Ten of 14 pregnancies had clinical evidence of fetal growth restriction (asymmetric growth profile). One pregnancy lacked sufficient data to further
classify. aNot Available; bMicroencephalic.
Page 28 of 28