Piggery: From environmental pollution to a climate change solution
17
Piggery: from environmental pollution to a climate change solution TEK N. MARASENI 1 & JERRY MAROULIS 2 1 Australian Centre for Sustainable Catchments-Condamine Alliance, University of Southern Queensland, Queensland, Toowoomba, 4350, Australia 2 Faculty of Education and Australian Centre for Sustainable Catchments, Queensland, Toowoomba, 4350, Australia ABSTRACT Pig farms are a vital component of rural economies in Australia. However, disposal of effluent leads to many environmental problems. This case study of the Berrybank Farm piggery waste management system in Victoria estimates greenhouse gas (GHG) benefits from three different activities. Analysis reveals that the capturing and combusting of methane from piggery effluent could save between 4859 and 5840 tCO 2 e yr -1 of GHG emissions. Similarly, using methane for replacing fuels for electricity generation could save another 800 tCO 2 e yr -1 of GHGs. Likewise, by utilising the biogas wastes to replace inorganic fertilisers there could be a further saving of 1193 to 1375 tCO 2 e yr -1 of GHG, depending on the type of fertilisers the waste replaces. Therefore, a well-managed piggery farm with 15,000 pigs could save 6,852 to 8,015 tCO 2 e yr -1 , which equates to the carbon sequestrated from 6,800 to 8,000 spotted gum trees (age =35 year) in their above plus belowground biomass. Implementation of similar project in suitable areas in Australia could have significant environmental and financial benefits. 1 Address correspondence to Tek N. Maraseni, Australian Centre for Sustainable Catchments, University of Southern Queensland, Queensland, Toowoomba,4350, Australia Tel: +61-7-46312995, Fax: +61-7-46315594; Email: [email protected] 1
-
Upload
wageningen-ur -
Category
Documents
-
view
3 -
download
0
Transcript of Piggery: From environmental pollution to a climate change solution

Piggery: from environmental pollution to a climate change solution
TEK N. MARASENI1 & JERRY MAROULIS2
1Australian Centre for Sustainable Catchments-Condamine Alliance, University of Southern
Queensland, Queensland, Toowoomba, 4350, Australia
2 Faculty of Education and Australian Centre for Sustainable Catchments,
Queensland, Toowoomba, 4350, Australia
ABSTRACT
Pig farms are a vital component of rural economies in Australia. However, disposal of
effluent leads to many environmental problems. This case study of the Berrybank Farm
piggery waste management system in Victoria estimates greenhouse gas (GHG) benefits
from three different activities. Analysis reveals that the capturing and combusting of
methane from piggery effluent could save between 4859 and 5840 tCO2e yr-1 of GHG
emissions. Similarly, using methane for replacing fuels for electricity generation could
save another 800 tCO2e yr-1 of GHGs. Likewise, by utilising the biogas wastes to replace
inorganic fertilisers there could be a further saving of 1193 to 1375 tCO2e yr-1 of GHG,
depending on the type of fertilisers the waste replaces. Therefore, a well-managed
piggery farm with 15,000 pigs could save 6,852 to 8,015 tCO2e yr-1, which equates to the
carbon sequestrated from 6,800 to 8,000 spotted gum trees (age =35 year) in their above
plus belowground biomass. Implementation of similar project in suitable areas in
Australia could have significant environmental and financial benefits. 1 Address correspondence to Tek N. Maraseni, Australian Centre for Sustainable Catchments, University of Southern Queensland, Queensland, Toowoomba,4350, Australia Tel: +61-7-46312995, Fax: +61-7-46315594; Email: [email protected]
1

Key Words: pigs, greenhouse gas, Berrybank Farm, nitrogen, phosphorus, potassium
INTRODUCTION
Australia produces 362,850 t per annum of pig, representing 0.5% of global production.
[1] However, Australia has relatively higher costs of production than Canada, USA or
Brazil, the major world suppliers of pork. [1] In order to make the pig industry in Australia
financially attractive, some value adding is necessary. This study explores the
possibilities of value adding through carbon credits in the pig industry. This research is
timely, as the Australian government is implementing a domestic emissions trading
scheme by 2012. [2]
The pig industry plays a vital role in sustaining Australian rural economies and supplying
valuable employment; however, piggeries are renowned for generating a host of
environmental issues. For instance, pigs return more than half of the feed they consumed
as waste: ~15,000 pigs (800 t) produce 275,000 L of sewage effluent per day, equivalent
to the sewage output of a town with a population of 50,000 people. [3] The disposal of
effluent from intensive piggeries can generate water pollution (both surface and ground),
eutrophication and phosphate leaching. [4] They can also spread putrid odours, fly
infestation, and diseases in the adjoining neighbourhoods. [5] In addition, current piggery
waste treatment methods (anaerobic lagoon and direct land application) in Australia leads
to the production of biogas consisting of methane, which has 21 times more global
warming potential than carbon dioxide.[6] If this methane could be captured this could be
2

used for electricity generation (replacing other fuels), that would reduce GHG emissions
and would help reduce odour, pest, disease and water contamination problems.
Furthermore, due to intensive cultivation systems, cropping lands are highly degraded
across the world. To help improve the productivity of cropped areas, fertilisers are
increasingly used, as they are considered as an integral part of intensive cultivation. [9,10]
Compared to the 1950s, the global use of fertilisers in 1999 was about 23 times in the
case of nitrogen (N), almost eight times for phosphorus (P) and more than four times for
potassium (K). [9] In Australia, between 1987 and 2000, nitrogen fertiliser use increased
by 325%. [10] The production, packing, transportation and application of these fertilisers
need huge investment of energy which leads to GHG emissions. [11] If it is possible to
collect wastes after biogas production and replace the energy intensive fertiliser, multiple
environmental and financial benefits can be achieved for piggeries.
Capturing methane and producing electricity from methane is highly desirable with
regard to three GHG reduction public policies: (1) the Australian Government’s
Mandatory Renewable Energy Target Scheme requires electricity retailers and other large
electricity buyers to source an additional 9.5 TWh of their electricity per year from
renewable or specified waste-product energy resources by 2010; (2) the New South
Wales Greenhouse Gas Abatement Scheme needs electricity retailers and large users to
meet their mandatory targets of emissions reduction; and (3) the Queensland
Government's new 13% Gas Scheme requires electricity retailers and other liable parties
to source at least 13% of their electricity from gas-fired generation. [7, 8]
3
Therefore, the aims of this study are to estimate: (1) methane emissions from currently
used barn flushing wastewater treatment systems; (2) GHG emissions by generating
electricity from biogas (replacement of other fuel sources); and (3) GHG emissions by
replacing inorganic fertilisers with biogas sludge and mineralised water.
METHODOLOGY
There are currently piggery projects in Thailand and India that capture methane from
animal wastes and used for electricity generation. [16] However, in Australia only one such
initiative, the Barrybank Piggery Farm (in Victoria), has been reported. [3, 7, 12, 13]
Therefore, in this study data from Barrybank Farm were used to estimate GHG benefits.
Berrybank Farm has 15,000 pigs (approximately 53.33kg/pig), which produces 275,000
litres of sewage effluent on average per day. Given the size of the waste stream,
Berrybank Farm developed a sophisticated waste management system in November 1989
involving a two-stage anaerobic digestion system. In this system, the pig effluent is
transformed into odourless fertiliser and methane gas, which is captured and used for
electricity generation. Each day the farm recovers: (1) approximately seven tonnes of
waste solids, used as fertiliser; (2) 100,000 litres of recyclable water; (3) 100,000 litres of
mineralised water, used as fertiliser; and (4) 180 KWh of electricity for 16 hours per day.
The capital cost of the Berrybank Farm project was approximately $2 million with an
estimated payback period of six years. The annual estimated saving for Berrybank Farm
4

is $425,000 which includes $125,000 in electricity, $50,000 in water saving and $250,000
in fertiliser sale. [3, 7, 12, 13] However, the Berrybank Farm has not considered the
greenhouse benefits of the project.
Barrrybank Farm is estimated to have GHGs benefits at three levels: (1) capturing and
avoiding of methane emissions; (2) reducing of GHG emissions by generating electricity
from captured methane (replacement of other fuel sources); and (3) reduction of GHG
emissions by replacing inorganic fertiliser with biogas sludge and mineralised water.
Therefore, the total GHG benefit would be calculated as:
)1...(CO CO CO Tot. fertiliser avoided 2eelecticity avoided 2eCH avoided 2eavoidance 2e 4++= CO
Where,
Tot. CO2e avoidance = total CO2 equivalent of GHG emissions avoidance from
the whole project (tCO2e yr-1)
CO2e avoided CH4 = CO2 equivalent of methane emissions avoided through
recovery and combustion of biogas ((tCO2e yr-1)
CO2e avoided electricity = CO2e emissions avoided through biogas-powered
electricity generation (tCO2e yr-1)
CO2e avoided fertiliser = CO2 equivalent of GHG emissions avoided by
replacing chemical fertiliser
5
RESULTS AND DISCUSSIONS
Avoidance of Methane Emissions
In Australia, there are two dominant piggery waste treatment methods: anaerobic lagoon
system and direct land application method. In the anaerobic lagoon system, wastewater is
released into settling ponds which allows water to be separated from the entrained solids.
Solids are then collected and used as fertilisers, however there is little demand for
undigested solid pig waste. The direct land application method involves wastewater being
directly released onto paddocks. [6] The anaerobic lagoon system releases 6.074 kgCO2e
yr-1 of methane per kg of meat while the direct land application method releases 7.304
kgCO2e yr-1. [6] Regardless of the approach used at Berrybank, we considered both waste
treatment methods to help develop a range of scenarios to guide future piggery project
developers.
For the size and number of pigs at Berrybank, calculations revealed that, about 4,859
tCO2e yr-1of methane could be avoided as emissions, if the biogas plant replaces the
anaerobic lagoon system, and about 5,840 tCO2e yr-1 for direct land application. Thus, by
capturing and using the resultant methane for electricity production, a biogas plant would
avoid about 4,859 to 5,840 tCO2e yr-1 methane from being emitted into the atmosphere.
Considering the average weight of pigs, climatic condition and waste treatment system,
there figures are comparable with Ratchaburi Farms Biogas Project in Thailand. [16]
6
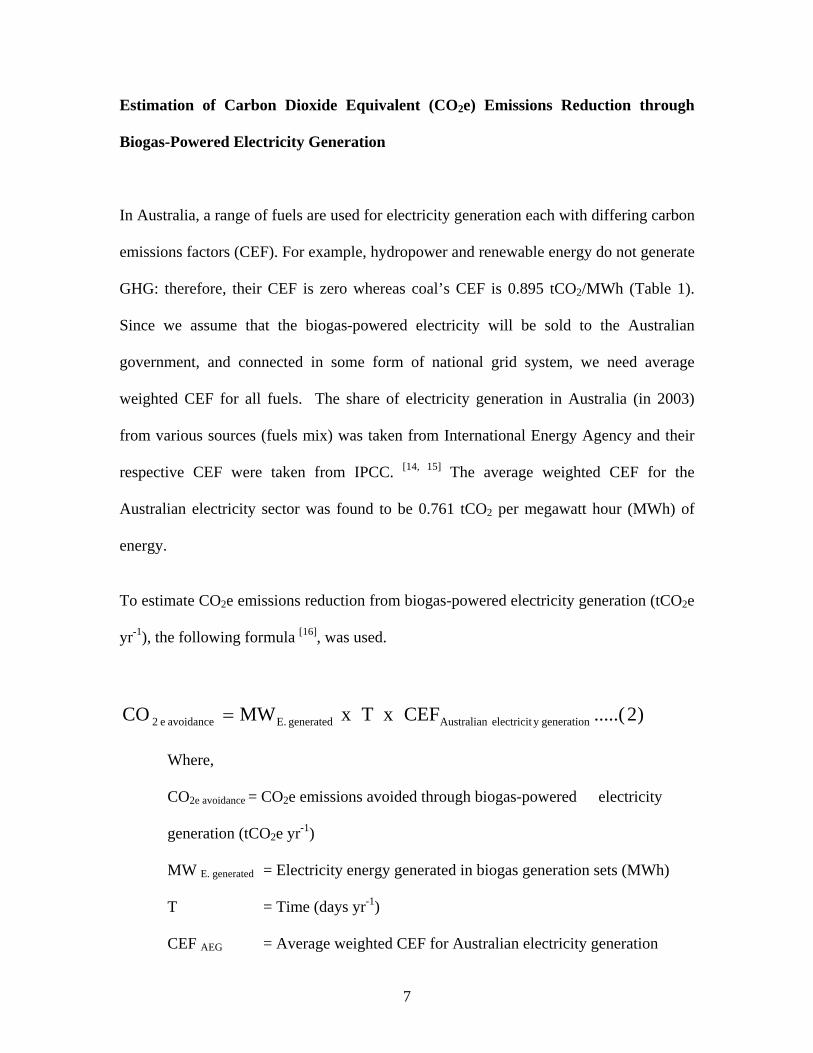
Estimation of Carbon Dioxide Equivalent (CO2e) Emissions Reduction through
Biogas-Powered Electricity Generation
In Australia, a range of fuels are used for electricity generation each with differing carbon
emissions factors (CEF). For example, hydropower and renewable energy do not generate
GHG: therefore, their CEF is zero whereas coal’s CEF is 0.895 tCO2/MWh (Table 1).
Since we assume that the biogas-powered electricity will be sold to the Australian
government, and connected in some form of national grid system, we need average
weighted CEF for all fuels. The share of electricity generation in Australia (in 2003)
from various sources (fuels mix) was taken from International Energy Agency and their
respective CEF were taken from IPCC. [14, 15] The average weighted CEF for the
Australian electricity sector was found to be 0.761 tCO2 per megawatt hour (MWh) of
energy.
To estimate CO2e emissions reduction from biogas-powered electricity generation (tCO2e
yr-1), the following formula [16], was used.
)2.....(CEF x T x MWCO generationy electricit Australiangenerated E.avoidance e 2 =
Where,
CO2e avoidance = CO2e emissions avoided through biogas-powered electricity
generation (tCO2e yr-1)
MW E. generated = Electricity energy generated in biogas generation sets (MWh)
T = Time (days yr-1)
CEF AEG = Average weighted CEF for Australian electricity generation
7

The Berrybank Farm has been generating 180 KWh electricity for 16 hours a day [3, 12],
with the total amount of electricity generated per day of 2.88 MWh (MWE. generated = 2.88
MWh). Thus CO2 avoidance through biogas-powered electricity generation (tCO2e yr-1)
at Berrybank Farm is 800 tCO2e yr-1.
Reduction of GHG Emissions by Replacing Inorganic Fertiliser by Biogas Solid
Sludge and Mineralised Water
Kim and Dale [17] estimated a global warming impact (GWI) value for most fertilisers
(Table 2). The GWI value included all three greenhouse gases (CO2, CH4 and N2O) and
their impact on emissions to their production, packing, transportation and application. In
this study, we used these values to estimate GHG emissions by fertilisers. In the case of
mixed fertiliser such as N and P, an average value was used. However, we considered the
replacement of chemical fertilisers by biogas wastes, and the transportation and
application of biogas wastes which also consume energy2. Therefore, the GWI value
which also considers energy used for transportation and application of fertilisers needs to
be adjusted. The transportation and application of N, P and K fertilisers require 10%,
40% and 40% of the total energy, respectively, with the reminder used in production and
packaging. [18] In light of these additional considerations, the GWI value was recalculated
for production and packing of fertilisers alone (Table 2). Calculations revealed that the
production and packing of one kg of N, P, K and mixed (N & P) fertilisers emit 2943,
2 It can be argued that due to the bulky nature of biogas waste, the transportation and application of this waste may need more energy than for chemical fertilisers. However, fertilisers are transported from a long distances, sometimes from overseas, therefore, we assumed that this does not make a big difference.
8

804, 385 and 1729 gmCO2e of GHGs, respectively. Nitrogen fertiliser is usually
produced from ammonia. The production of ammonia through Haber process, the most
renowned method, requires significant amounts of energy. [18] Therefore, compared to
other fertilizers, N fertilizer has higher GWI value.
In order to determine the amount of GHG benefits by replacing chemical fertilisers with
biogas wastes (solid sludge and mineralised water), it is crucial to know two things: (1)
what are the commonly used fertilisers in Australia; and (2) the percentage of different
nutrients in chemical fertilisers and biogas wastes. In Australia, urea, di-ammonium
phosphate (DAP) and muriate of potash (MOP, potassium chloride) are commonly used
fertilisers for nitrogen, phosphorus and potassium. [19] Among them, urea contains 46%
nitrogen, MOP contains 49.5% K, and the DAP contains 18% N and 20% P (Table 3).
At Berrybank Farm, on average, the solid sludge contains 3.1% N, 3.5% P and 1% K
(Table 4). [4] Likewise, the mineralised water contains 0.24%, 0.12% and 0.12% of N, P
and K. [4] We assumed that the biogas sludge replaced DAP and MOP, as the sludge
contains both N and P in approximately the same proportion, and the DAP also contains
both N & P in similar proportion (18% N and 20% P). But in the case of mineralised
water, the N percent is much higher than that of P. Therefore, we analysed both
scenarios: replacement of urea and MOP; and DAP and MOP.
From the percentages of N, P, and K in the sludge, we found that 7 t of sludge can
produce 217 kg of N, 245 kg of P and 70 kg of K (Table 4). Therefore, 7 t of sludge can
9

work as 1206 kg of DAP for N and 1225 kg of DAP for P. However, we erred on the side
at conservative estimates, so the lowest value was considered. This means we assumed
that the solid sludge replaces 1206 kg of DAP for N. Similarly, from the percentages of
N, P, and K in mineralised water, it is found that the 100,000 L3 of mineralised water can
give 240 kg of N, 120 kg of P and 120 kg of K. Hence, 100,000 L of mineralised water
can work as a 1333 kg of DAP for N and 600 kg of DAP for P, but as before, lower more
conservatives were considered. Thus, mineralised water replaces 600 kg of DAP for P.
This is more realistic if the sludge and mineralised water need to be transported long
distances, as more energy is consumed and thus more GHG emissions will be released.
It is estimated that the replacement of 1206 kg of DAP for nitrogen fertiliser with biogas
sludge can save 2084 kgCO2e of GHG emissions per day, whilst the added replacement
of 141 kg of MOP can save another 54 kgCO2 of GHGs per day (Table 4). Therefore,
replacement of DAP and MOP with biogas sludge can reduce 780 tCO2e yr-1 of GHG
emissions. Likewise, if we replace inorganic fertilisers by mineralised water, ~ 413
tCO2e yr-1 (if we replace DAP and MOP) to 595 tCO2e yr-1 (if we replace urea and MOP)
of GHG emissions can be reduced (Table 4). Therefore, 1193 t to 1375 tCO2e of GHGs
can be reduced annually by using sludge and mineralised water during biogas generation.
3 1 L of mineralised water would be >1 kg in weight as the water is not pure. However, for simplicity 1 L of mineralised water is assumed as 1 kg.
10

Estimation of Total Greenhouse Gas Benefit
By capturing methane piggery effluent, utilising that methane for replacing conventional
fuels used in electricity generation, and using wastes for replacing inorganic fertilisers
could have significant GHG benefits (Table 5). Capturing and combusting methane could
save 4859 tCO2e yr-1 (by replacing the anaerobic lagoon system) to 5840 tCO2e yr-1 (by
replacing the direct application system) in GHG emissions. Similarly, using the methane
for replacing fuels for electricity generation could save another 800 tCO2e yr-1. Likewise,
using the biogas wastes to replace inorganic fertilisers could save 1193 tCO2e yr-1 (if it
replaces DAP and MOP) to 1375 tCO2e yr-1 (if it replaces urea and MOP).
In total, a well-managed piggery farm with 15,000 pigs could save 6,852 to 8,015 tCO2e
yr-1 (Table 5). This is equivalent to the carbon sequestered from 6,800 to 8,000 spotted
gum trees (of 35 years age) in their aboveground and belowground biomass. [20] If the size
of the pig farm operation is larger (>15,000 pigs), the GHG benefit could be higher due to
enhanced economies of scale of production.
The biogas waste not only adds N, P and K but also adds zinc, sulphur, and organic
matter which are very important for better soil structure and cation exchange capacity. [21]
Similarly, the biogas waste also helps to increase soil pH thereby reducing the use of lime
and GHG emissions associated with production, packing, transportation and application
of lime. Likewise, bio-fertilizers produce growth-promoting substances such as
hormones, vitamins, amino-acids and anti-fungal chemicals, thereby accelerating the
plants’ establishment. In addition, this project helps to:
11

• reduce the odour and fly nuisance problem;
• eliminate some pests, and reduce mosquitoes breeding areas and thereby improve
working and living conditions;
• encourage farmers and other potential project developers to value add;
• reduce potential surface and ground water pollution problems;
• recycle water and thereby reduce water usage;
• promote technological excellence and innovation in the country; and
• encourage integrated farming system (grains for pigs, electricity to make warm
pigs and wastes for increased grain production. [3, 7, 16]
Apart from the GHG saving, the added benefits listed above provide considerable
support for similar initiatives elsewhere.
CONCLUSION
The analysis undertaken in this study suggests that capturing methane from piggery
effluent, using the methane for replacing fuels for electricity generation, and using wastes
for replacing inorganic fertilisers could have significant GHG plus economic benefits.
Implementation of similar projects in suitable areas in Australia could have both
environmental and financial benefits.
12

ACKNOWLEDGEMENT
We would like to thank the Australian Centre for Sustainable Catchments, University of
Southern Queensland, for research and logistical and other support. Our special thanks go
to the Condamine Alliance for financial support.
References
1. Pork CRC. CRC for an internationally competitive pork industry annual report 2005-2006,
(2006) http://www.porkcrc.com.au/publications/report.pdf accessed 20 September 2007
2. The Department of Prime Minister and Cabinet. Australia’s climate change policy: our
economy, our environment, our future, Australian Government, Canberra, 2007
3. Charles IFE Pty Ltd Company. Charles IFE Pty Ltd Company Profile. 2004,
http://www.pc.gov.au/inquiry/pigmeat/subs/sub007.pdf accessed in 23 September 2007
4. Rao, J. R.; Watabe, M.; Stewart, T.; A..; Millar, B. C.; Moore, J. E. Pelleted organo-mineral
fertilisers from composted pig slurry solids, animal wastes and spent mushroom compost for
amenity grasslands. Waste Management, 2007, 27, 1117-1128.
5. Diez, J.A.; De la Torre, A.I.; Cartagena, M.C.; Carballo M.; Vallejo, A.; Muñoz , M.J.
Evaluation of the application of pig slurry to an experimental crop using agronomic and
ecotoxicological approaches, J. Environ. Qual. 2001, 30, 2165–2172.
6. Farran, I.; Maul, C.; Charles, S. Waste management options for the pig industry. Report to the
Pig Research and Development Corporation and AFFA. Canberra, 2000
7. Bob Lim & Co P/L & Headberry Partners P/L. Australian Pork Limited Project 1915: renewal
energy industry development report on technical, economic and financial implications of
using piggery waste to generate electricity, 2004
13

8. Queensland Department of Mine and Energy. Thirteen percent gas scheme, Queensland
Department of Mine and Energy, Brisbane, 2007, http://www.energy.qld.gov.au/ accessed 23
September 2007.
9. Smil, V. Long-range perspectives on inorganic fertilizers in global agriculture. International
Fertilizer Development Centre, Florence, Alabama, USA, 1999
10. Dalal, R. C.; Wang, W.; Robertson, G. P.; Partoon, W. J. Nitrous oxide emission from
Australian agricultural lands and mitigation option: a review. Australian Journal of Soil
Research, 2003, 41, 165-195.
11. Gower, S. T. Patterns and mechanisms of the forest carbon cycle. Annual Review of
Environmental Resources, 2003, 28, 169–204.
12. Australian Centre for Cleaner Production. Total waste management system at Berrybank
Farm Piggery, Charles I.F.E. Pty Ltd. In Best Practice Design, Technology and Management,
Victoria 1998, 20-22.
13. Zimmermann, L.; & Nuberg, I. Factsheet No: atlas_007 anaerobic digestion at Berrybank
Farm piggery, Adelaide University, Adelaide, 1998
14. International Energy Agency (IEA). Energy Policies of IEA Countries - Australia- 2005
Reviewhttp://www.iea.org/Textbase/publication/ accessed on 24 September 2007
15. Intergovernmental Panel on Climate Change (IPCC). Revised 1996 IPCC guidelines for
national greenhouse gas inventories, reference manual, 1996.
16. Royal Danish Embassy in Bangkok. Clean Development Mechanism simplified project design
document for small-scale project activities, Ratchaburi Farms Biogas Project, Thailand, 2005,
http://www.danishcdm.um.dk/NR/rdonlyres/ accessed 13 September 2007
17. Kim, S.; Dale, B. Cumulative energy and global warming impact from the production of
biomass for bio-based products. Journal of Industrial Ecology, 2003, 7, 147-162.
18. Mudahar, M.; & Hingnett, T.; Energy requirements, technology and resources in the fertilizer
sector, energy in world agriculture, Elsevier, Amsterdam, 1987.
14
19. Fertiliser Industry Federation Australia Inc. Fertiliser industry environment report 2002, 2004.
http://www.fifa.asn.au/files/pdf/environment/ accessed on 18 September 2007
20. Maraseni, T.N. Re-evaluating land use choices to incorporate carbon values: a case study in
the South Burnett region of Queensland', PhD thesis submitted to the University of Southern
Queensland, Queensland, Australia, 2007, p264
21. Cotching, B. Long term management of Krasnozems in Australia. Australian Journal of Soil
and Water Conservation, 1995, 8, 19-27.
15
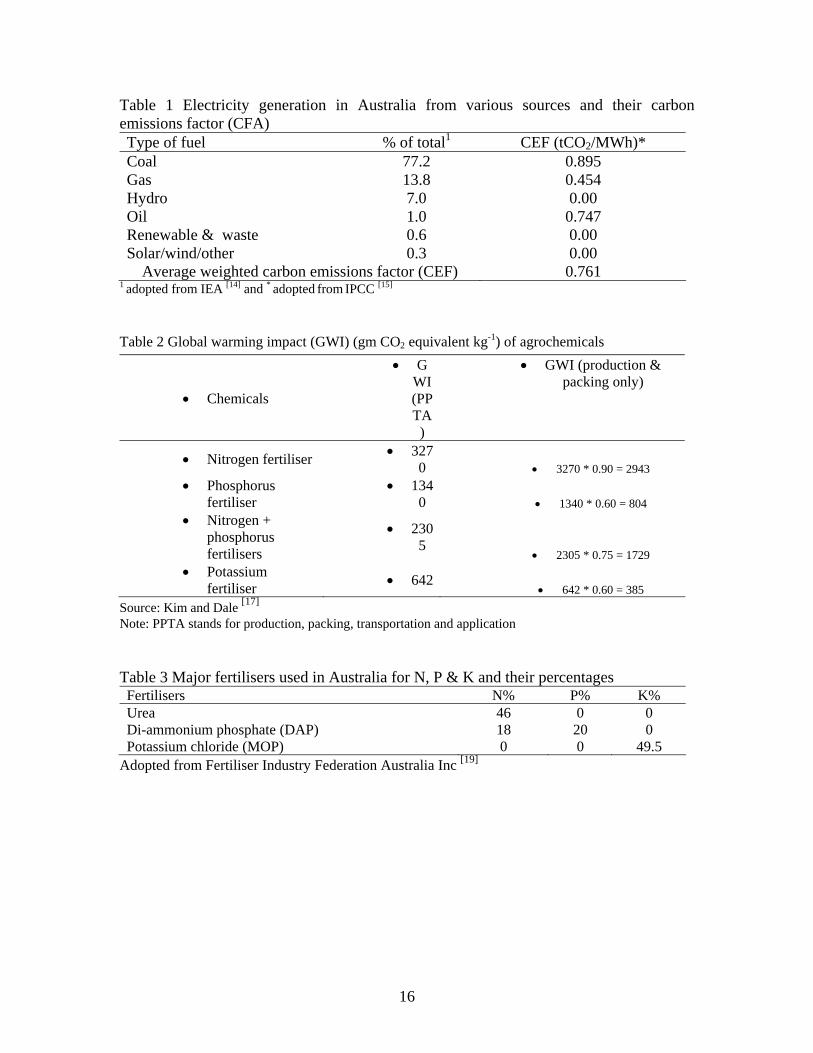
Table 1 Electricity generation in Australia from various sources and their carbon emissions factor (CFA) Type of fuel % of total1 CEF (tCO2/MWh)* Coal 77.2 0.895 Gas 13.8 0.454 Hydro 7.0 0.00 Oil 1.0 0.747 Renewable & waste 0.6 0.00 Solar/wind/other 0.3 0.00
Average weighted carbon emissions factor (CEF) 0.761 1 adopted from IEA [14] and * adopted from IPCC [15]
Table 2 Global warming impact (GWI) (gm CO2 equivalent kg-1) of agrochemicals
Source: Kim and Dale [17]
T Australia for N, P & K an eir perce es N% P%
Note: PPTA stands for production, packing, transportation and application
able 3 Major fertilisers used in d th ntagFertilisers K% Urea 46 0 0 Di-ammonium phosphate (DAP) 18 20 0 Potassium chloride (MOP) 0 0 49.5
Adopted from Fertiliser Industry Federation Australia Inc [19]
• Chemicals
• GWI (PPTA
)
• GWI (production & packing only)
• Nitrogen fertiliser 0 • 3270 * 0.90 = 2943 • 327
• 0
s 5
• 2305 * 0.75 = 1729
fertiliser • 642 * 0.60 = 385
Phosphorus fertiliser
• 134• 1340 * 0.60 = 804
• Nitrogen + phosphoru • 230
fertilisers• Potassium • 642
16

Table 4 Average contents of different nutrients in piggery sludge and mineralised water in Berrybank Farm, Victoria, Australia
Mineralised water (100,000 L/d, water content 98.7%)
Nutrient % Amount (kg/d)
Replace (DAP & MOP)
GHG (kg CO2e/d)
Replace (urea & MOP)
GHG (kgCO2e/d)
Nitrogen 0.24% 240 600 kg DAP 1037.4 521.7 kg urea 1535.5 Phosphorus 0.12% 120 Potassium 0.12% 120 242.4 kg MOP 93.3 242.4 kg MOP 93.3
Total GHG (kgCO2e/yr) saved/day 1130.7 1628.8 Total GHG saved (kgCO2e/yr) 412,706 594,512
Solid sludge (7 t/d, water content 70%)
Nutrient % Amount (kg/d)
Replace (DAP & MOP)
GHG (kg CO2e/d)
Nitrogen 3.1% 217 1205.6kg DAP 2084.4 Phosphorus 3.5% 245 Potassium 1% 70 141.4kg MOP 54.4
Total GHG (kgCO2e/yr) saved/day 2138.9 Total GHG saved (kgCO2e/yr) 780,370
Note: Percentage of nutrients in sludge and mineralised water is taken from Charles IFE Pty Ltd Company. [3]
Table 5 Estimation of total GHGs benefits (tCO2e yr-1) from 15,000 pigs
Avoidance of CH4 emissions from
Reduction of GHG emissions
by making electricity
Reduction of GHG emissions by replacing ino. fertiliser by biogas waste
Total (tCO2ey-1)
Open lagoon
Direct application Scenario A Scenario
B
GHG (tCO2ey-1) 4,859 5,840 800 1,193 1,375 6,852 to
8,015 Note: Scenario A = both sludge and mineralised water replace DAP and MOP Scenario B = sludge replace DAP and MOP, and mineralised water replace urea and mop
17