Assessment of Pollution Level of Habbaniya Lake, Iraq, Using Organic Pollution indicators
12
International Journal of Lakes and Rivers. ISSN 0973-4570 Volume 7, Number 1 (2014), pp. 25-36 © Research India Publications http://www.ripublication.com Assessment of Pollution Level of Habbaniya Lake, Iraq, Using Organic Pollution indicators 1 Emad A. Salah * , 2 Khalid F. AbdulGhafoor, 3 Ethar M. Abdalwahab 1 Department of Applied Geology, College of Science, University of Anbar, Iraq Email: salahemad99@gmail. com 2 Department of Chemistry, College of Science, University of Anbar, Iraq 3 Department of Biology, College of Education For Women, University of Anbar, Iraq Abstract In this study, we used some organic pollution indicators (DO, BOD and COD) to estimate the pollution level of Habbaniya Lake, Iraq. The surface water samples were collected from six stations. The sampling was bimonthly. The parameters, DO, pH, and T were measured in field using portable meters, while Biochemical Oxygen Demand (BOD) and Chemical Oxygen Demand (COD) were determined by standard methods, respectively. Variation of DO with depth, temporal and spatial variation of DO, BOD and COD were investigated. The DO level ranged from 6. 72 mg l -1 to 10. 57 mgl -1 with a mean value of 8. 9 mgl - . The mean value of DO level was above the WHO permissible limit for the protection of fisheries and aquatic life and for domestic water supply. Results show variation of DO with vertically. The BOD level varied from 2. 86 to 11. 16 mgl -1 with a mean value of 7. 53 mgl -1 . Mean value of BOD is within the WHO and USEPA permissible limits. COD levels ranged between 26. 83 and 40. 33 mgl -1 with a mean value of 33. 47 mg l -1 . The mean value of COD did not exceed the WHO limit. Analysis of variance (ANOVA) showed that there is significant difference between the sampling periods for values of DO and BOD, insignificant difference for COD values and insignificant difference between the sampling stations. The results of organic pollution indicators show that Habbaniya Lake is unpolluted to less pollution in the organic matter during the sampling period and could support aquatic life and use as domestic water supply. Key Words: organic pollution; DO and BOD, Habbaniya lake, Iraq
Transcript of Assessment of Pollution Level of Habbaniya Lake, Iraq, Using Organic Pollution indicators

International Journal of Lakes and Rivers. ISSN 0973-4570 Volume 7, Number 1 (2014), pp. 25-36 © Research India Publications http://www.ripublication.com
Assessment of Pollution Level of Habbaniya Lake, Iraq, Using Organic Pollution indicators
1Emad A. Salah*, 2Khalid F. AbdulGhafoor, 3Ethar M. Abdalwahab
1 Department of Applied Geology, College of Science, University of Anbar, Iraq
Email: salahemad99@gmail. com
2 Department of Chemistry, College of Science, University of Anbar, Iraq 3 Department of Biology, College of Education For Women, University of Anbar, Iraq
Abstract
In this study, we used some organic pollution indicators (DO, BOD and COD) to estimate the pollution level of Habbaniya Lake, Iraq. The surface water samples were collected from six stations. The sampling was bimonthly. The parameters, DO, pH, and T were measured in field using portable meters, while Biochemical Oxygen Demand (BOD) and Chemical Oxygen Demand (COD) were determined by standard methods, respectively. Variation of DO with depth, temporal and spatial variation of DO, BOD and COD were investigated. The DO level ranged from 6. 72 mg l-1 to 10. 57 mgl-1 with a mean value of 8. 9 mgl-. The mean value of DO level was above the WHO permissible limit for the protection of fisheries and aquatic life and for domestic water supply. Results show variation of DO with vertically. The BOD level varied from 2. 86 to 11. 16 mgl-1 with a mean value of 7. 53 mgl-1. Mean value of BOD is within the WHO and USEPA permissible limits. COD levels ranged between 26. 83 and 40. 33 mgl-1 with a mean value of 33. 47 mg l-1. The mean value of COD did not exceed the WHO limit. Analysis of variance (ANOVA) showed that there is significant difference between the sampling periods for values of DO and BOD, insignificant difference for COD values and insignificant difference between the sampling stations. The results of organic pollution indicators show that Habbaniya Lake is unpolluted to less pollution in the organic matter during the sampling period and could support aquatic life and use as domestic water supply. Key Words: organic pollution; DO and BOD, Habbaniya lake, Iraq

26 Emad A. Salah et al
Introduction Lakes are an important water resource for domestic, agricultural and industrial uses and they are also important for fishery, recreational and energy production purposes. Lakes are an important habitats for wildlife and support a very diverse fauna and flora, consisting important plant, bird and animal species (Anon, 2006). The lakes have a complex and fragile ecosystem, as they do not have self- cleaning ability and therefore readily accumulate pollutants (Abid et al., 2008). Lakes are gradually becoming polluted due to the addition of different materials, such as, organic matter, of plant and animal origin, nutrients, and toxic chemicals. The major sources of these pollutant are urban, agricultural and industrial activities (Iscen et al., 2008). An important pollution indicator of water is the total oxygen demand. It represents the organic indicator of water quality. The total oxygen demand includes dissolved oxygen (DO), biological oxygen demand (BOD), and chemical oxygen demand (COD). The measurement of DO, BOD, and COD could indicate the level of pollution of a given river, lake or pond (Manahan, 1992; Kolo et al., 2010). Many studies have been undertaken to assess the level of pollution or water quality of lakes using oxygen parameters or organic pollution indicators (Kolo et al., 2010; Maitera et al., 2010; Akan et al., 2012; Idris et al., 2013; Gwaski et al., 2013). Review of literature reveals very few studies have been carried out to assess water quality and pollution status of Habbaniya Lake. Al-Saadi et al. (2002) investigated the concentrations of heavy metals in water, suspended particles, sediments and aquatic plants of the lake. The limnological characters of the Habbaniya lake were evaluated by Al-Lami et al. (2002). Al-Janabi (2008) investigated some chemical and biological pollutants in Habbaniya lake water. The aim of this study is evaluation of pollution level of the Habbaniya Lake in terms of organic pollution indicators (DO, BOD, and COD) and assessment of suitability of the lake water to support the aquatic life and uses as domestic supply. Materials and Methods Study Area Habbaniya Lake is located in the middle of Iraq (33o 17' 43" N, 43o 27' 10" E) at an altitude of 51m above sea level, Fig. 1. Its depth ranges between 9 – 13 m, length about 35km, maximum width of 25km and the storage capacity of 3. 26 x 109 m3 (Al-Saadi et al. 2002). The lake is an oligotrophic lake because of the effect of water level fluctuation in the water body (Hunt and Jones, 1972). Oligotrophic lakes are of low primary productivity and low biomass associated with low concentrations of nutrients (N and P). In temperate regions the fish fauna is dominated by species such as lake trout and whitefish. These lakes tend to be saturated with O2throughout the water column (WHO, 1996). The lake is fed principally by the Euphrates River through Warar Canal and has two outlets: the Majara Canal drains the water into Razazzah Lake and Theban Canal discharges the water into the Euphrates River, again. Water Sampling Water samples were collected at bimonthly intervals, except in the winter, at monthly intervals, between January and October 2013, from six sampling stations in

Assessment of Pollution Level of Habbaniya Lake, Iraq 27
Habbaniya Lake, Fig. 2. All samples were collected, preserved and stored for analysis as outlined in standard methods for the examination of water and wastewater (APHA, 1992). Water samples were collected in sterile dark glass bottles. The bottles were kept at 4oC and analyzed within approximately 24 h. Determination of Properties of Water Measurements of Temperature (T), pH, and Dissolved Oxygen (DO) of water were performed in situ during the sampling process at a depth of 30cm. Dissolved oxygen (DO) was measured in situ using polargraphic membrane electrode method. Biological Oxygen Demand (BOD) was measured with use the Winkler method. Chemical Oxygen Demand (COD) measurements were performed with the potassium dichromate method. Statistical Analysis The data obtained were subjected to descriptive statistical analysis and to one – way analysis of variance (ANOVA), to assess whether samples varied significantly between sampling stations and sampling months, probabilities less than 0. 05 (p<0. 05) were considered statistically significant, using Statistica Release 7 software. Results and Discussion The levels of some parameters in water samples from six stations in Habbaniya Lake and USEPA and WHO guidelines are listed in Table 1. Because of very limited investigations about water quality of Habbaniya lake, levels of DO, BOD, and COD in the investigated lake were compared to those reported in other lakes in the world, Table 2. The temporal and spatial variation of T, pH, DO, BOD, and COD are shown in Figs. 3 and 4. The scatter plots between T and DO and BOD are illustrated in Figs. 5 and 6. The variation of DO level with depth is shown in Fig. 7. Temperature The temperature of water is one of the most important factor in an aquatic environment. The water temperature changes affect the level of dissolved oxygen, salinity, pH and biological and microbial activity in water. The level of dissolved oxygen in a water body is related inversely to the temperature of the water. During the investigation period, the temperature varied from 12. 5oC to 32. 1oC with a mean value of 21. 3oC. The highest temperature value was recorded in the June month, and lowest value in the January month, Fig. 3. Increasing of temperature causes increase in the metabolic activity of organism and decrease of dissolved oxygen level in the water body (Macan, 1978). There is no spatial variation in water temperature of the lake, Fig. 4. Al-Janabi (2008) found that the average water temperature in Habbaniya lake was 9. 9oC. She measured it through the winter months of 2007. pH The pH of water is a measure of its acidity and basicity. pH regulates most of the biological processes and biochemical reactions (Mathur et al., 2008). The pH of an

28 Emad A. Salah et al
aquatic ecosystem is closely associated to biological productivity and hence, fluctuation of water pH can be caused by excessive (Carr and Neary, 2008). Most lakes are basic when they are first formed and become more acidic with time due to the build – up of organic materials (Akan et al., 2012). In the present study, the pH of lake water ranged from 7. 9 to 8. 2 with a mean value of 8. 1. These values were within the limits of USEPA (1999) and WHO (2004) guidelines, for drinking water. The mean value of pH indicates that water of Habbaniya lake is alkaline. The acidity of natural lake ecosystems has been reported to be in the range of 4. 5-6. 5 (Chapman, 1998). Low pH values are found in natural waters which are rich in organic matter (Wetzel, 1983). There were not temporal and spatial variations in values of pH of the lake water, Figs. 3 and 4, respectively. The mean value of pH was in an agreement with that recorded by Al-Janabi (2008). Dissolved Oxygen (DO) The dissolved oxygen content in water bodies depends on the balance between water and atmospheric oxygen. The amount of dissolved oxygen in natural water depends on many physical, chemical and biochemical factors: aeration, wind, water flow velocity, algae, temperature, atmospheric pressure, organic compounds, salt contents, bacteria, animals, and so forth (Zhang, 2007). Dissolved oxygen supports the biological life in water, its fluctuations depend on temperature and algal population (Lashari et al., 2009). Increasing of the flow rate of a water body will increase the amount of dissolved oxygen in the water, because the flow rate increases the diffusion or movement of oxygen into water from atmosphere. The amount of organic matter in the water affects dissolved oxygen levels by lowering it. Dissolved oxygen is a measure of the degree of pollution by organic matter, the destruction of organic substances as well as the self-purification capacity which is a major indicator of water quality (WHO, 2000). Concentrations of DO below 5mg/l may adversely affect the functioning and survival of biological communities and below 2mg/l may lead to fish mortality (Sisodia and Moundiotiya, 2006). In lakes, the dissolved oxygen levels are most likely to vary vertically in the water column. In the present study, dissolved oxygen level varied from 6. 72 mgl-1 to 10. 57 mgl-1 with mean value of 8. 90mg l-1. The recorded levels of DO in Habbaniya Lake water were above the USEPA and WHO permissible limit. The highest DO level recorded in this study is in a good agreement with that recorded (10. 4 mgl-1) by Al-Janabai (2008) during the winter months. The temporal and spatial variations of DO level in the lake are given in Figs. 3 and 4, respectively. The highest value for DO (10. 57 mgl-1) was recorded in January (wet season) and the lowest (6. 72 mgl-1) in June (dry season). The statistical analysis using ANOVA showed that there was significant difference between the sampling periods and insignificant difference between the sampling stations. The scatter plot of DO against temperature showed that there is an significant negative correlation at p<0. 05(r = - 0. 81), Fig. 5. There is an negative correlation between DO and BOD at p<0. 05 (r = - 0. 23), Fig. 6. The significant difference between the sampling periods may be attributed in term of seasonal variation in temperature of water of the lake (low temperatures increase oxygen solubility and vise versa), photosynthesis of aquatic plants, and the aerobic decomposition rate of organic
Assessment of Pollution Level of Habbaniya Lake, Iraq 29
material. The insignificant difference between the sampling stations suggests that there were not a point sources of the organic effluents such as, sewage, industrial and livestock, distributed around the lake. The vertical distribution of DO level was investigated in four stations (S1, S2, S3, and S4), because of low water depth in other stations, during the sampling periods. Figure 7 shows variation of DO level with depth of water of the Lake. Biological Oxygen Demand (BOD) Biological oxygen demand (BOD) is a measure of amount of oxygen used by microorganisms in decomposing organic matter in water body. BOD is an effective indicator of organic quality of water and wastewater treatment plants (Clair et al., 2003). BOD directly affects the amount of dissolved oxygen in rivers and lakes. The greater the BOD, the lower DO in the water body. High content of BOD and CODcause oxygen depletion, which leads to the suffocation of aquatic life (Verma et al., 1984). The BOD values in Habbaniya Lake water ranged from 2. 86 mgl-1 to 11. 16 mgl-1, with a mean value of 7. 53 mgl-1. Mean value of BOD is within the WHO and USEPA permissible limits. Al-Janabi (2008) found that the BOD level in Habbaniya lake water ranged from 2. 6 mgl-1 to 4 mgl-1 with average value of 3. 3 mgl-1 during the winter months. The temporal and spatial variations of BOD level in the lake are given in Figs. 3 and 4, respectively. The highest value of BOD (11. 16 mgl-1) was recorded in October and the lowest (2. 86 mgl-1) in January. The highest value of BOD may be due to the high input of organic matter, especially plant remains, such as leaves. October month in the study area is one of the months of autumn season. The statistical analysis using ANOVA showed significant differences in BOD values (at p<0. 05) between the sampling periods and insignificant differences between the sampling stations. The insignificant differences in BOD values between sampling stations show that the quantity and quality of organic matter entering to Habbaniya lake were similar in all stations. The scatter plot between BOD and temperature showed that there is significant correlation at p<0. 05 (r=0. 39), Fig. 8. Chemical Oxygen Demand (COD) The chemical oxygen demand (COD) is the amount of oxygen consumed to completely oxidize the organic water contents to inorganic end product. COD is an indicator of the organic content of water samples. The COD of water increases with increasing concentration of organic matter. In the present study, the value of COD ranged between 26. 83 mgl-1 to 40. 33 mgl-1 with a mean value of 33. 47 mgl-1. These values did not exceed the WHO and USEPA permissible limits. Figs. 3 and 4 show the temporal and spatial variation of COD level in the lake water. The statistical analysis using ANOVA suggested that there was no significant difference between the sampling periods and also between sampling stations. Conclusion Based on the results of this investigation, it was observed that the levels of DO, BOD, and COD in the water samples are within the WHO and USEPA permissible limits.

30 Emad A. Salah et al
Analysis of variance (ANOVA) showed that there is significant difference between the sampling periods for values of DO and BOD, and insignificant difference for COD values at p<0. 05. According to ANOVA, there is insignificant difference between the sampling stations for the values of DO, BOD, and COD. The results of the organic pollution indicators (DO, BOD, and COD) obtained in this study area show that Habbaniya Lake is unpolluted to less pollution in the organic matter during the sampling period and could support aquatic life and use as domestic water supply.
Fig. 1. Study area location map.
Fig. 2. Locations of the sampling stations.

Assessment of Pollution Level of Habbaniya Lake, Iraq 31
jFig. 3. Temporal variation of physical and chemical properties Habbaniya lake water.
Fig. 4 Spatial variation of physical and chemical properties Habbaniya lake water.
Fig. 5. Scatter plot of DO against temperature.

32 Emad A. Salah et al
Fig. 6 Scatter plot of DO against BOD.
Fig. 7. Vertical distribution of DO with depth of Habbaniya lake water.
Fig. 8. Scatter plot of BOD against temperature.
Assessment of Pollution Level of Habbaniya Lake, Iraq 33
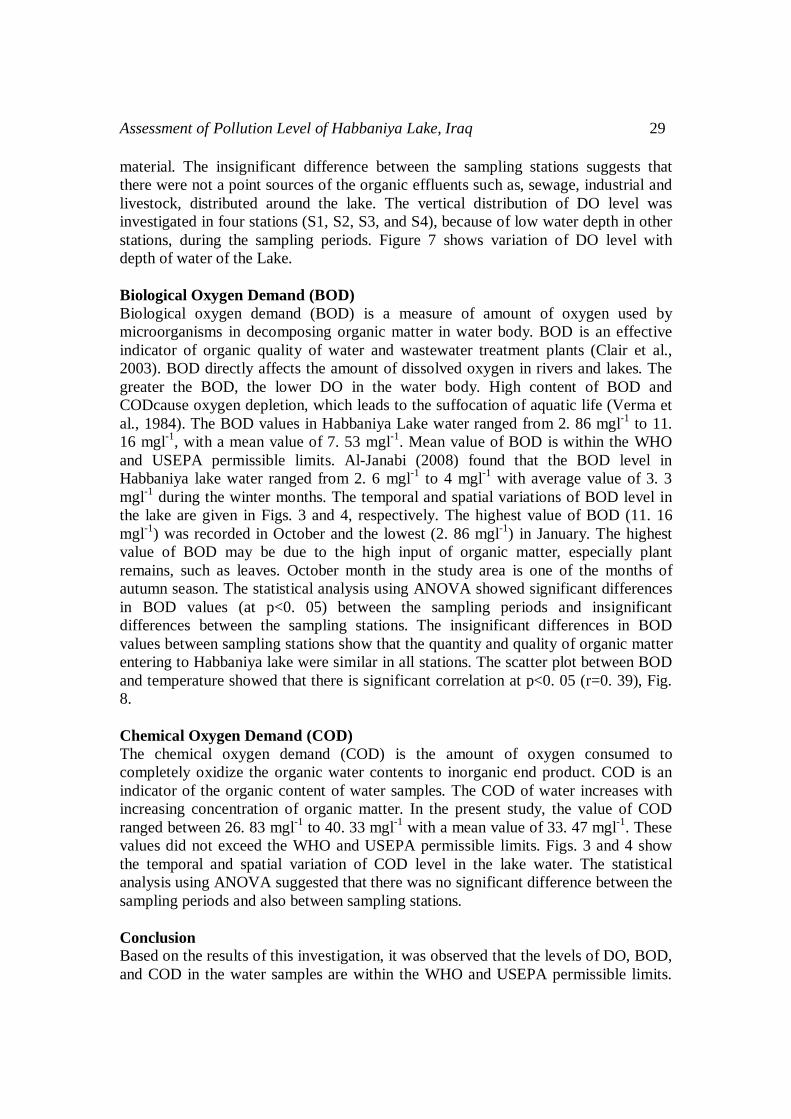
Table 1. Physical and chemical parameters of Habbaniya lake water.
Parameter Mean Minimum Maximum Standard Deviation USEPA Standards
WHO Standards
DO (mg l-1) 8. 90 6. 72 10. 57 1. 52 Not<2 4 BOD (mg l-1) 7. 53 2. 86 11. 16 2. 74 10 50 COD (mg l-1) 33. 47 26. 83 40. 33 5. 79 80 200
pH 8. 1 7. 9 8. 2 0. 1 6-9 7. 0 – 8. 5 ˚C 21. 3 12. 5 32. 1 7. 0 26 25 - 30
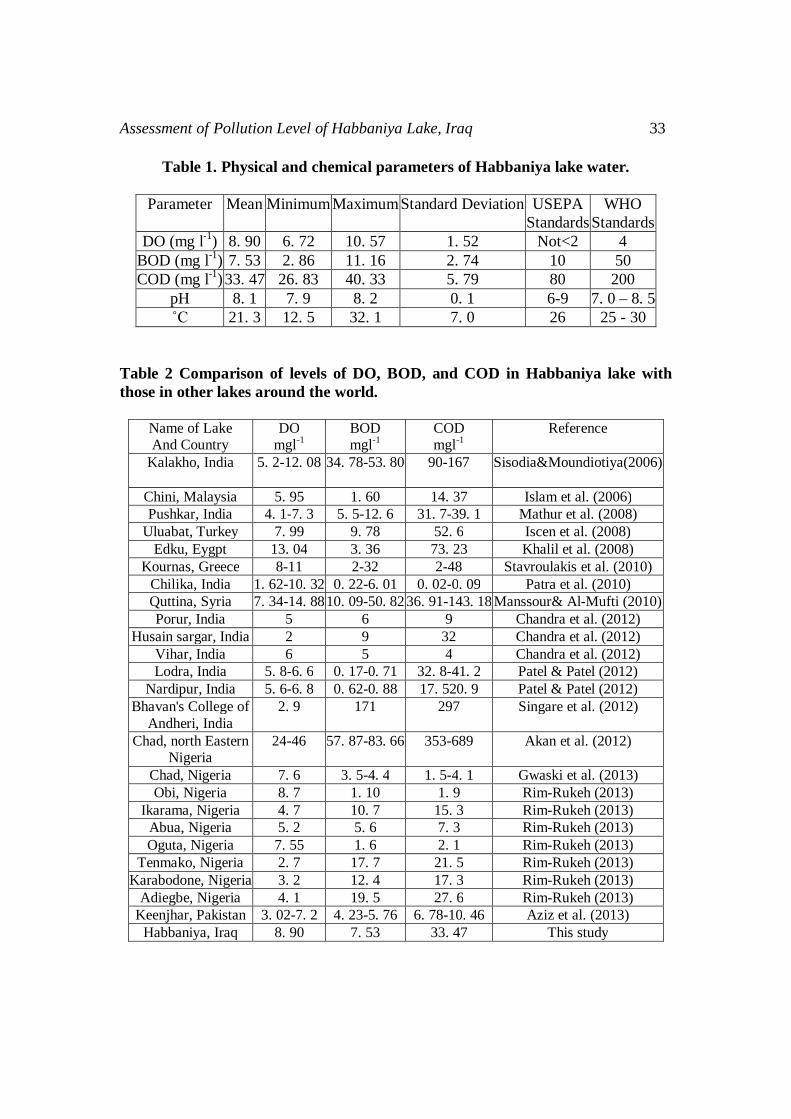
Table 2 Comparison of levels of DO, BOD, and COD in Habbaniya lake with those in other lakes around the world.
Name of Lake And Country
DO mgl-1
BOD mgl-1
COD mgl-1
Reference
Kalakho, India 5. 2-12. 08 34. 78-53. 80 90-167 Sisodia&Moundiotiya(2006)
Chini, Malaysia 5. 95 1. 60 14. 37 Islam et al. (2006) Pushkar, India 4. 1-7. 3 5. 5-12. 6 31. 7-39. 1 Mathur et al. (2008)
Uluabat, Turkey 7. 99 9. 78 52. 6 Iscen et al. (2008) Edku, Eygpt 13. 04 3. 36 73. 23 Khalil et al. (2008)
Kournas, Greece 8-11 2-32 2-48 Stavroulakis et al. (2010) Chilika, India 1. 62-10. 32 0. 22-6. 01 0. 02-0. 09 Patra et al. (2010) Quttina, Syria 7. 34-14. 88 10. 09-50. 82 36. 91-143. 18 Manssour& Al-Mufti (2010) Porur, India 5 6 9 Chandra et al. (2012)
Husain sargar, India 2 9 32 Chandra et al. (2012) Vihar, India 6 5 4 Chandra et al. (2012) Lodra, India 5. 8-6. 6 0. 17-0. 71 32. 8-41. 2 Patel & Patel (2012)
Nardipur, India 5. 6-6. 8 0. 62-0. 88 17. 520. 9 Patel & Patel (2012) Bhavan's College of
Andheri, India 2. 9 171 297 Singare et al. (2012)
Chad, north Eastern Nigeria
24-46 57. 87-83. 66 353-689 Akan et al. (2012)
Chad, Nigeria 7. 6 3. 5-4. 4 1. 5-4. 1 Gwaski et al. (2013) Obi, Nigeria 8. 7 1. 10 1. 9 Rim-Rukeh (2013)
Ikarama, Nigeria 4. 7 10. 7 15. 3 Rim-Rukeh (2013) Abua, Nigeria 5. 2 5. 6 7. 3 Rim-Rukeh (2013) Oguta, Nigeria 7. 55 1. 6 2. 1 Rim-Rukeh (2013)
Tenmako, Nigeria 2. 7 17. 7 21. 5 Rim-Rukeh (2013) Karabodone, Nigeria 3. 2 12. 4 17. 3 Rim-Rukeh (2013)
Adiegbe, Nigeria 4. 1 19. 5 27. 6 Rim-Rukeh (2013) Keenjhar, Pakistan 3. 02-7. 2 4. 23-5. 76 6. 78-10. 46 Aziz et al. (2013)
Habbaniya, Iraq 8. 90 7. 53 33. 47 This study

34 Emad A. Salah et al
References
[1] Abida, B. Harikrishna, S. Irfanulla, K. Ramaiah, M. Veena, K. and Vintha, K. 2008. Analysis of Fluoridelevel in water and fish species of Sankey, Bellandur and Madivala Lakes of Bangalore, Rasayan. Journal of Chemistry, 1: 596 – 601.
[2] Akan, J. Abbagambo, M. and Chellube, Z. 2012. Assessment of pollutants in water and sediments in Lake Chad, Baga, North Eastern Nigeria. Journal of Environmental Protection, 3: 1428 – 1441.
[3] Al-Janabi, W. 2008. The investigation of some chemical and bacterial pollutants in water of the Euphrates River from Ramadi to Fallujah and the lakes of Therthar and Habbaniya. M. sc. thesis submitted to Department of Chemistry, College of Science, University of Anbar, Iraq (In Arabic).
[4] Al-Lami, A. Al-Saadi, H. Mekhlef, A. and Mosa, K. 2002. Limnological features of Habbaniya lake, Iraq. Journal of College of Education for Women, University of Baghdad, 13:21-31.
[5] Al-Saadi, H. Al-Lami, A. Hassan, F. and Al-Dulymi, A. 2002. Heavy metals in water, suspended particles, sediments and aquatic plants of Habbaniya lake, Iraq. International Journal of Environmental Studies, 59: 589-598.
[6] Anonymous. 2006. Morbidity and mortality: How do we value the risk of death and illness? National Center for Environmental Economics, US Environmental Protection Agency[ online]. Available: http:// Yosemite. epa. gov/ee/epa/eerm. nsf/vwRepNum Lookup/EE-0497? Open Document.
[7] APHA, AWWA, and WPCF. 1992. Standard methods for the examination of water and wastewater. 18th Ed. Washington DC. American Public Health Association, American Water Works Association, and Water Pollution Control Federation 10 – 137 pp.
[8] Aziz, F. Azmat, R. Jabeen, F. and Bilal, B. 2013. A comparison study of physico-chemical parameters of Keenjhar lake, Thatta, Sindh, Pakistan. International Journal of Advanced Research, 1: 482-488.
[9] Carr, GM. And Neary, JP. 2008. Water quality for ecosystem and Human Health, 2n ed. (Robarts R. and Barher S. eds) UNEP global environmental monitoring system water programme with International Institute, PAS. European Regional Center for Eco-hydrology UNESCO IAP Water Programme, pp 9-17.
[10] Chandra, S. Singh, A. and Tomar, P. 2012. Assessment of water quality values in Porur lake Chennai, HussainSargar Hyderabad and Vihar lake Mumbai, India. Chemical Science Transaction, 1:508-515.
[11] Clair, N. Perry, L. and Gene, F. 2003. Chemistry for environmental engineering and science. 5th ed., p. 233.
[12] Gwaski, P. Hati, S. Ndahi, N. and Ogugbuaja, V. 2013. Modeling parameters of oxygen demand in the aquatic environment of Lake Chad for depletion estimation. ARPN Journal of Science and Technology, 3: 116-123.
[13] Hunt, P. and Jones, J. 1972. The effect of water level fluctuation on a littoral funa. Journal of Fish Biology, 4: 385-394.

Assessment of Pollution Level of Habbaniya Lake, Iraq 35
[14] Idris, M. Kolo, B. and Sani, A. 2013. Organic pollution indicator and anion concentration of pharmaceutical effluent and surface water in Minna, Niger state, Nigeria. The International Journal of Engineering And Science, 2: 27-32.
[15] Iscen, C. Emiroglu, Ӧ. Ilhan, S. Arslan, N. Yilmaz, V. and Ahiska, S. 2008. Application of multivariate statistical techniques in the assessment of surface water quality in Uluabat Lake, Turkey. Environmental Monitoring and Assessment, 144: 269-276.
[16] Islam, M. Ismail, B. Barzani, G. Sahibin, A. and Ekhwan, T. 2012. Hydrological assessment of water quality characteristics of Chini lake, Pahang, Malaysia. American-Eurasian Journal Agricultural & Environmental Sciences, 12: 737-749.
[17] Khalil, M. Shakir, S. Saad, A. ElShabrawy, M. and Hassan, M. 2008. Physico-chemical environment of lake Edku, Egypt. Egyptian Journal of Aquatic Biology and Fishery, 12:119-132.
[18] Kolo, B. Ogugbuaj, V. and Dauda, M. 2010. Seasonal variation in dissolved oxygen and organic pollution indicators of Lake Chad area of Borno state, Nigeria. Continental Journal Water, Air and Soil Pollution, 1: 1-5.
[19] Lashari, K. Korai, A. Sahato, G. and Kazi, T. 2009. Limnological studies of Keenjhar Lake (District Thatta), Sindh, Pakistan. Pakistan Journal Analytical Environmental Chemistry, 10: 39-47.
[20] Macan, T. 1978. Freshwater Ecology. 2nd Edi., Longman Group Limited, London, pp:346.
[21] Manahan, S. 1992. Toxicological Chemistry. 2nd edition, Lewis Publishing, USA.
[22] Manssour, K. and Al-Mufti, B. 2010. Influence of industrial, agricultural and sewage water discharges on eutrophication of Quttina lake. Jordan Journal of Civil Engineering, 4: 351-366.
[23] Mathur, P. Agarwal, S. and Nag, M. 2008. Assessment of physic-chemical characteristics and suggested restoration measures for Pushkar lake, Ajmer Rajasthan (India). Proceedings of Taal2007: The 12th World Lake Conference: 1518-1529, Sengupta, M. and Dalawani, R. (Editors).
[24] Patel, A. and Patel, R. 2012. Comparison of the physic-chemical parameters of two lakes at Lordra and Nardipur under biotic stress. International Journal of Scientific and Research Publications, 2: 1-5.
[25] Patra, A. Patra, J. Mahapatra, N. Das, S. and Swain, G. 2010. Seasonal variation in physicochemical parameters of Chilika lake after opening of new mouth near Gabakunda, Orissa, India. World Journal of Fish and Marine Sciences, 2: 109-117.
[26] Rim-Rukeh, A. 2013. Physico-chemical and biological characteristics of stagnant surface water bodies (ponds and lakes) used for drinking and domestic purposes in Niger delta, Nigeria. Journal of Environmental Protection, 4: 920-928.
[27] Singar, P. Talpade, M. Dagli, D. and Bhawe, V. 2012. Water pollution monitoring study of Bhavan's College lake of Andheri, Mumbai: Assessment of physicochemical parameters. Water Research & Development, 2: 79-84.

36 Emad A. Salah et al
[28] Sisodia, R. and Moundiotiya, C. 2006. Assessment of the water quality index of wetland Kalakho Lake, Rajasthan, India. Journal of Environmental Hydrology, 14: 1-11.
[29] Stavroulakis, G. Papfilippaki, A. and Kalderis, D. 2010. Water pollution level of the groundwater and surface water in the lake Kournas, Crete-Greece. Proceedings of the " Protection and Restoration of the Environment X " 5-9/7/2010 Corfu.
[30] USEPA. 1999. Volunteer Lake monitoring: A methods Manual. EPA 44014-91-002. Office of Water US Environmental Protection Agency, Washington DC.
[31] Verma, S. Sharma, P. Tyagi, A. Rani, S. Gupta, A. and Dalela, R. 1984. Pollution and saprobic status of Eastern Kalinadi. Limnology, 15: 69-133.
[32] Wetzel, R. 1983. Limnology. Philadelphia: Sunders College Publishing. [33] World Health Organization WHO. 2000. Rolling revision of the WHO
guidelines for drinking –water quality, Draft for review and comments. http:// www. Hls. gov. bc. ca/ protect/ pdf/ WHO-V2-2000.
[34] World Health Organization WHO. 2004. Guidelines for Drinking Water Quality, ” 3rd Edition, Geneva.
[35] Zhang, C. 2007. Fundamentals of environmental sampling and analysis. John Wiley & Sons, Inc., Hoboken, New Jersey.