URBAN DISPLACEMENT IN FEDERAL IRAQ - ReliefWeb
37
1 URBAN DISPLACEMENT IN FEDERAL IRAQ
-
Upload
khangminh22 -
Category
Documents
-
view
0 -
download
0
Transcript of URBAN DISPLACEMENT IN FEDERAL IRAQ - ReliefWeb

1
URBAN DISPLACEMENT IN FEDERAL IRAQ

CONTENTS
E XECUTIVE SUMMARY 1
METHODOLOGY 2
ACRONYMS 2
BAGHDAD AND ABU GHRAIB 5
BAQUBA 10
KIRKUK 15
MOSUL 20
T IKRIT 25
TUZ KHURMATU 30
IOM IRAQ

1
URBAN DISPLACEMENT IN FEDERAL IRAQ
EXECUTIVE SUMMARY
As displacement within Iraq becomes increasingly protracted for internally displaced persons (IDPs), further research is needed to understand its causes and put forward potential durable solutions. The United Nations (UN) International Organisation for Migration Displacement Tracking Matrix (IOM DTM) undertook this research project “Urban Displacement in Iraq” with the primary objective of supporting evidence-based planning for the humanitarian community and the government of Iraq, and to inform the response to protracted displacement in this post-emergency phase. This report will detail findings from urban centres within the Federal Iraq. An equivalent report is available for urban centres assessed within the Kurdistan Region of Iraq (KRI).
Data for this assessment was collected on a sample of households, representative at the city level (95%, 5%), between March and December 2020. Ten urban centres of Iraq were assessed, namely the cities of Baghdad/Abu Ghraib, Baquba, Dahuk, Erbil, Kirkuk, Mosul, Sulaymaniyah, Tikrit, Tuz Khurmatu, and Zakho. Please refer to the methodological overview for further details.
The findings for the Federal Iraq cities – Baghdad/Abu Ghraib, Baquba, Mosul, Kirkuk, Tikrit and Tuz Khurmatu – are presented in the attached factsheets, which give a detailed analysis of the conditions for IDPs in protracted urban displacement. Some of the main findings include:
Socio-demographic composition
• While the number of IDP households remained stable in the majority of cities between August 2019 and August 2020, Baghdad/Abu Ghraib, Tikrit and Tuz Khurmatu saw a significant decline in their IDP population.
• The density of IDPs varies greatly between the cities, ranging from less than one displaced household for 100 host households in Baghdad/Abu Ghraib to 17 IDP for every 100 host households in Tuz Khurmatu.
• Over 25 per cent of IDP households in Baghdad/Abu Ghraib and Kirkuk are headed by females, with just over 20 per cent of those female-headed households being “alone”, i.e. either single, widowed, separated, divorced or if married, not living with their husband. In fact, five out of the six assessed cities in Federal Iraq have 10 per cent or more of households that are headed by a female who could be described as “alone”.
Livelihoods
• Less than half of IDP households have a stable source of income in three out of the six cities, namely Kirkuk, Baghdad/Abu Ghraib and Mosul.
• Relatedly, informal or daily wage labour is a prominent source of income among the displaced population in Baghdad/Abu Ghraib, Kirkuk and Tuz Khurmatu, which have commensurately low rates of private sector employment (ranging from 2-6% of displaced households).
• Federal Iraq hosts the two cities (of the 10 assessed), Baghdad/Abu Ghraib and Kirkuk, with the highest dependency ratio among IDP households, meaning that their IDP population comprises a high number of children or elderly people. These cities also record the lowest proportion of households able to meet basic needs, even though the heads of displaced households in those cities were more likely to be working than those in any other assessed city. This points to a key challenge of protracted urban displacement where the income sources of primary caregivers in displaced households are insufficient to meet the needs of young dependents, a growing proportion of whom are born into displacement.
Primary needs in area of displacement
• Medical care ranked highly among the needs of the displaced population in all cities, a need perhaps exacerbated by the COVID-19 pandemic. The most severe situation was in Tikrit where 50 per cent of households
reported medical care as one of their top three needs.
• Shelter remains a significant concern in two important respects. Over one third of households in Baquba, Tuz Khurmatu and Baghdad/Abu Ghraib reported the need for a new shelter as a priority. Similarly, high proportions of households in Tikrit, Tuz Khurmatu and Mosul identified the need to repair their shelter in their area of origin. Notably, in the cities where a high proportion of households expressed the need to repair their shelter in their area of origin, the most reported intention was to return.
• Food was reported as a main top need at a much higher rate in Kirkuk and Tikrit - by nearly half of households, in those cities - than in the other assessed urban centres. As a comparison, a low of six per cent of households reported food as a top three need in Mosul.
Levels of peaceful coexistence and feelings of safety and security
• IDPs in the cities of Federal Iraq feel comparatively less safe than those in KRI. The lowest levels of safety were reported in Baquba, where 43 per cent of households reported not feeling completely safe, along with 33 per cent of households in Tuz Khurmatu. However, very few IDP households reported experiencing discrimination, the highest proportion being 14 per cent in Baghdad/Abu Ghraib.
• Trust in local authorities was notably low in Kirkuk, with 21 per cent of households reporting they would not feel comfortable seeking help from the authorities, compared with a high of 92 per cent of households feeling comfortable seeking help from authorities in Mosul.
• Political participation was also extremely low in Tikrit, where only 48 per cent of households voted in the 2018 elections, as well as in Baghdad/Abu Ghraib (55%). Among those that did not vote, lack of faith in the political system was more commonly reported than among IDPs in KRI cities, with Tikrit, Kirkuk and Baquba having the highest proportion of households that reported political apathy and mistrust.
Future intentions and influencing factors
• IDPs in the cities of Federal Iraq were considerably more likely than those in KRI cities to intend to return, with the majority of households expressing an intention to return in Tuz Khurmatu, Tikrit and Mosul. However, among those households that intend to return, most are deferring that decision by at least a year or are undecided about when to do so. In Tuz Khurmatu, for example, only nine per cent intend to return in the next year and 45 per cent remain undecided.
• Despite high proportions of households reporting an intention to return, key barriers persist and influence the decision to move. The lack of financial means was widely reported in Tuz Khurmatu, Baquba and Tikrit. A lack of housing in the AoO was the most prominent obstacle reported by households in Kirkuk and Mosul, where the vast majority of households are displaced from within the governorate, in the case of Kirkuk, or within the district for those in Mosul city. The unstable security situation was another barrier reported by nearly half of IDP households in Tuz Khurmatu city, nearly all of whom originate from within Tuz Khurmatu district.
• Baquba was an outlier among all assessed cities with 78 per cent of households expressing the intention to stay within the city. The same proportion of households originate from districts within Diyala Governorate, each of which have locations with poor access to services, housing destruction and concerns related to multiple security actors according to the Return Index.

URBAN DISPLACEMENT IN FEDERAL IRAQ
2
• Across all assessed cities, those households that reported having previously attempted to return (once or more) are more likely to report that their future intention is to return to their area of origin. This shows that failed returns do not discourage households from wanting to return in future, and potentially even make them more determined to do so. Additionally, the findings indicate that households who attempted return have greater economic means than those who do not, which is likely a factor in their ability to attempt return rather than an indicator of their vulnerability.
METHODOLOGY
This section provides a summary of the methodology used for this assessment - please refer to the Methodological Overview for a more detailed description. As the majority of the remaining caseload of IDPs reside in urban centres across Iraq, DTM determined that this study would focus on those centres, with data collected at the household-level to generate findings that are representative at the city and national level.1 Existing data on IDPs in – or at risk of – protracted displacement was used to select the main urban centres which are the focus of this study. These areas were selected with the aim of understanding the progress and challenges related to achieving durable solutions to displacement. For the purpose of this study, protracted displacement is defined as three years of displacement or longer, and all IDPs included were displaced as a result of the 2014 crisis (or re-displaced as a result of this crisis, if they had already been forced to resettle prior to 2014).2 Additionally, all IDPs included in the study are residing in the host community and not in camp setting, as conditions for IDPs vary substantially between camps and from conditions in the host communities.
The cities selected for the study are: Baghdad and Abu Ghraib, Baquba, Dahuk, Erbil, Kirkuk, Mosul, Sulaymaniyah, Tikrit, Tuz Khurmatu, and Zakho. These urban centres were determined using the DTM Master List round 112 (the most up to date at the time of selection), taking in to consideration the areas with the greatest non-camp IDP concentration, accessibility and security conditions.3
These facthseets present the findings for the assessed cities of the of Federal Iraq: Baghdad and Abu Ghraib, Baquba, Kirkuk, Mosul, Tikrit and Tuz Khurmatu. The findings for the assessed cities of the KRI are presented in a seperate document.
Following selection, the IDP population of the urban centre was mapped at the neighbourhood level to show the distribution of the IDP population across the city/town. IOM DTM’s Rapid Assessment and Response Teams (RARTs) then used their detailed knowledge of the locality to determine which neighbourhods are considered to be part of the urban centre, so as to exclude peri-urban and rural locations. For the purposes of this assessment, ‘urban’ neighbourhoods were considered to be those that were fully reliant on an urban centre for jobs and basic services such as healthcare and education.
For the purpose of sampling, each urban centre was treated separately, depending on the IDP population size and the number of neighbourhoods
1 Findings from ILA V show that 64% of IDPs are living in urban settings across Iraq, 24% are living in camps, 3% are living in peri-urban and 9% in rural locations. More information can be found at: http://iraqdtm.iom.int/ILA5
2 Protracted displacement is generally described as a condition in which IDPs are prevented from accessing durable solutions that would reduce their displacement-induced vulnerability, impoverishment and marginalization. The criteria for this determination relate to: the duration of displacement (UNHCR defines protracted displacement as three or more years in displacement); locations where durable solutions are not possible (i.e., return, settlement in the area of displacement, or resettlement in a third area); the continued dependence on humanitarian assistance while economic conditions are either not improving or are further deteriorating; and the continuing or worsening psychosocial impacts of displacement and marginalization.
3 The most up to date Master List, round 112, was used for the initial drawing of the sample, and subsequently data was collected for the cities of Erbil, Dahuk, Zakho, Sulaymaniyah and Mosul. After data collection began, movement restrictions aimed at curbing the spread of the coronavirus disease 2019 (COVID-19) pandemic were implemented and data collection was paused. Before data collection could resume in September 2020 the sample for the remaining five locations – Baghdad and Abu Ghraib, Baquba, Kirkuk, Tikrit and Tuz Khurmatu - was updated using Master List 117.
over which the population of interest was distributed. Over-sampling was conducted in some areas to ensure that representative data could be collected regarding the district/governorate of origin, to improve the efficiency of the sample overall.
Map 1. Sampled urban centres
ACRONYMS
AoD Area of displacement
AoO Area of origin
CCCA Central Committee for Compensating
the Affected
HH Household
HoHH Head of household
IDPs Internally displaced persons
KRI Kurdistan Region of Iraq
ML Master List
MoMD Ministry of Migration and Displacement
This map is for illustration purpose only. The boundar-ies and names shown and the designations used on this map do not imply official endoresement or acceptance bythe International Organization for Migration
Data Source :
0 80 16040Kilometers
District boundaries
Governorate boundaries
Zakho
Tooz
Tilkaif
Tikrit
Telafar
Sinjar
Soran
Shaqlawa
Ramadi
Ra'ua
Najaf
Mosul
Makhmur
Nassriya
Kut
Kifri
Heet
Hatra
Khanaqin
Kalar
Haditha
Falluja
Erbil
Daquq
Baladrooz
Badra
Al-Salman
Al-Rutba
Al-Zubair
Al-Ba'aj
Al-Daur
Afaq
Al-Rifa'i
Amedi
Al-Hai
Akre
Amara
Fao
Hamza
Samarra
Sumel
Sulaymaniya
barA-lA ttahS
Sharbazher
Suq Al-Shoyokh
Rania
Qal'at Saleh
Penjwin
Pshdar
Halabja
Hashimiya
Mergasur
Kerbala
Koisnjaq
Kirkuk
Kufa
Hilla
Dokan
Diwaniya
Darbandikhan
Dahuk
Dabes
Choman
Chamchamal
Basrah
Baiji
Balad
Ba'qubaAl-M
uqdadya
Al-Qurna
Al-Thethar
Al-Hawiga
Al-Khidhir
Ali Al-Gharbi
Al-Maimouna
Al-Shirqat
Al-Shatra
Tarmia
Al-Shikhan
Al-Mahawil
Ain Al-Tamur
Al-SuwairaAl-Na'maniya
Al-Ka'im
Al-Azezia
Abu Al-Khaseeb
Mahmoudiya
Al-KahlaAl-Rumaitha
Al-C
hiba
yish
Kadhimia
Al-Samawa
Mada’in
Ana
Al-Midaina
Al-Hindiya
Al-Hamdaniya
Al-Fares
Al-Khalis
Al-Mejar Al-Kabir
Al-ShamiyaAl-Manathera
!.
!.
!.
!.
!.
!.
!.
!.
!.
!.
Dahuk City
Sulaymaniyah City
Zakho Town
Mosul CityErbil City
Tikrit City
Kirkuk City
Baghdad & Abu Graib
Tooz Khurmatu Town
Baqubah City
Dahuk City
Sulaymaniyah CitySulaymaniyah City
Zakho Town
Mosul CityErbil City
Tikrit City
Kirkuk City
Baghdad & Abu Graib
Tooz Khurmatu Town
Baqubah City
Anbar
Najaf
Muthanna
NinewaErbil
Diyala
Wassit
Basrah
Missan
Salah Al-Din
Thi-Qar
Kirkuk
Dahuk
Qadissiya
Sulaymaniyah
BabylonKerbala
BaghdadAnbar
Najaf
Muthanna
NinewaErbil
Diyala
Wassit
Basrah
Missan
Salah Al-Din
Thi-Qar
Kirkuk
Dahuk
Qadissiya
Sulaymaniyah
BabylonKerbala
Baghdad
!. Selected urban centers

URBAN DISPLACEMENT IN FEDERAL IRAQ
3
Table 1. Sample breakdown4
CityPopulation Sample
# of locations # of HHs # of locations # of HHs
Baghdad and Abu Ghraib 365 4,869 74 452
Baquba 16 2,299 16 330
Kirkuk 38 12,104 38 396
Mosul 86 17,512 62 486
Tikrit 23 1,815 23 308
Tuz Khurmatu 8 3,288 8 332
Dahuk 44 5,972 44 343
Erbil 93 20,604 68 500
Sulaymaniyah 151 10,035 72 525
Zakho 13 6,869 13 350
Total 837 85,367 422 4,022
4 Sample for Erbil, Dahuk, Zakho, Sulaymaniyah and Mosul drawn in December 2019 using Master List 112, sample for Baghdad and Abu Ghraib, Baquba, Kirkuk, Tikrit and Tuz Khurmatu updated using Master List 117 in September 2020.
5 More details on the infrastructure and services composite indicator can be found in the ‘Urban displacement in Iraq: A preliminary analysis’ factsheets which serve as a baseline to this study. Available from: http://iraqdtm.iom.int/DurableSolutions.
6 Estimates available from: https://www.citypopulation.de/Iraq-Cities.html
7 This definition of essential documentation used for this study includes all those considered critical in the Multi-Sector Needs Assessment (as defined by the Protection Cluster and REACH 2020) but also considers additional documentation that is considered necessary to be able to obtain a durable solution to displacement. Additionally, the questionnaire allowed space for the respondent to list another document if missing and considered essential. More information on essential documentation is available from: https://www.reachresourcecentre.info/country/iraq/theme/multi-sector-assessments/cycle/28380/#cycle-28380
8 The Washington Group on Disability Statistics, Conceptual Framework. Available from: https://www.washingtongroup-disability.com/about/conceptual-framework/
Enumerators selected household for interview using randomly drawn GPS locations, selecting the nearest households to the GPS point. ArcGIS Beta and Open Data Kit (ODK) were used for the selection of households and collection of data.
The following definitions are used throughout this factsheet. For a more detailed explanation of the methodology used, please consult the Understanding Urban Displacement: Methodology document.
Adequate/good access5 – DTM created a composite index to better understand access to infrastructure and services. All indicators were weighted with the number of IDPs living in the location where the issue was reported to determine the severity of conditions in each location, using a three-point scale of high severity, medium severity and low severity. For the assessed services/facilities to be considered as adequate, the location had to fulfil at least 13 of the following 17 criteria:
• Electricity and water: at least 75 per cent of residents at the location were connected to the public electricity network, and at least 75 per cent had tap water running.
• Primary and secondary schools, health clinics, hospitals, markets, places of worship and police stations: these services were present and functional within 5km, with the hospital within 10km.
• Courts, legal services for Housing, Land and Property (HLP) issues, offices for Public Distribution System (PDS) and civil directorates: these services were functional and present within the sub-district.
• Access to latrines, desludging and waste collection services, and immunisations for the community
Dependency ratio – The dependency ratio relates to the number of children (aged 0–17 years) and older persons (aged 60 years or older) in relation to the working-age population or active citizens (aged 18–59 years).
IDP to host population ratio – the ratio of IDPs to the population in each city. IDP estimates refer to IOM DTM Master List 117 (August
2020), while urban population estimates refer to 2009 figures and official estimation of the urban population at sub-district level according to the household listing.6
Male to female (sex) ratio – the ratio of males to females in the IDP population. A sex ratio of 112, for example, means that males slightly outnumber females by 112 males to every 100 females.
Stable income sources – regular income generated from salaried work (public or private sector), pensions, and owned business or from rented property that is not fluctuating significantly on a month-by-month basis.
Female-headed household – households that are headed by a female member. When female heads of households are described as ‘alone’ it means that they are single, widowed, separated, divorced, or if married, not living with their husband.
Essential identity documents – the documents considered to be essential are: proof of nationality, national ID, residency card, birth certificate . All others are not considered to be essential for the purpose of this study.7
Functional difficulties – the Washington Group Questions on Disability Statistics use the term functional difficulty/ies instead of disability. This choice is intended to focus on those who have difficulty in carrying out basic universal tasks in order to identify those within a population who would be at greater risk of social exclusion if their environment is not enabling. Additionally, verification of ‘disability’ requires a medical diagnosis that cannot be ascertained during an assessment of this nature.8 The questions use a 5-point assessment scale ranging from ‘no difficulty’ to ‘cannot do at all’. As recommended by the developers of the methodology, any answer from point 3 on the scale ‘a lot of difficulty’ and upwards in at least one domain is considered to be a functional difficulty for the purpose of this assessment.

URBAN DISPLACEMENT IN FEDERAL IRAQ
4
City IDP population
High recipient City hosting 10% or more of the total caseload of current non-camp IDPs in Iraq
Medium recipient City hosting between 3% and 10% of the total caseload of non-camp IDPs
Low recipient City hosting less than 3% of the total caseload of non-camp IDPs
Rate of change in IDP population
The rate of change is used to highlight the fluidity of IDP arrivals and departures between two points, in this case between ML 117 (August 2020) and ML 111 (August 2019). On occasion, a positive rate of change can be seen, highlighting an increase in the IDP population over the reporting period. The rate of change is classified using the following categories:
Stationary City with a rate of change for the displaced population of between 0% and -10%, indicating that IDPs are not (or only very slowly) moving out of their location of displacement
Fairly stationary City with a rate of change for the displaced population between -10% and -20%
Fairly dynamic City with a rate of change for the displaced population between -20% and -30%
Dynamic City with a rate of change for the displaced population greater than -30%, indicating that IDPs have been rapid-ly or very rapidly moving out of their location of displacement
District of origin
Homogeneous City with 80% or more of the IDPs coming from the same district of origin
Fairly homogeneous City with between 50% and 80% of the IDPs coming from the same district of origin
Heterogeneous City with no majority group found in terms of district of origin
Ethno-religious composition
Homogeneous City with 80% or more of the IDPs coming from the same ethno-religious group
Fairly homogeneous City with between 50% and 80% of the IDPs coming from the same ethno-religious group
Heterogeneous City with no majority group found in terms of ethno-religious group
Length of displacement
Homogeneous City in which 80% or more of the IDPs displaced within the same time period
Fairly homogeneous City in which 50% to 80% of the IDPs displaced within the same time period
Mixed City with no majority group found in terms of time of displacement
Protracted displacement IDPs who fled before October 2016

5
URBAN DISPLACEMENT
BAGHDAD AND ABU GHRAIBGENERAL CONTEXT9
Displaced individuals 19,506
Displaced households 3,251
Neighborhoods hosting IDPs 365
IDP to host population ratio 0.29
While there has been much focus on the closure of IDP camps on
the outskirts of Baghdad and Abu Ghraib, urban displacement re-
mains extensive and protracted. This combined urban centre hosts
19,506 non-camp IDPs, equivalent to 2 per cent of the total out-of-
camp displaced population nationwide.
Recipient of out of camp IDPs
2% of total out-of-camp IDPs
Low Recipient
Medium Recipient
High Recipient
9 Population figures as of August 2020.
10 The survey enabled respondents and enumerators to omit an answer on ethno-religious affiliation, as a result the percentages shown here do not add to 100.
Rate of change in IDP population
-42% IDPs (August 2019–August 2020)
Stationary
Fairly Stationary
Fairly Dynamic
Dynamic
Districts of origin
38% Falluja
14% Ramadi
8% Al-Kaim
8% Mosul
7% Balad
6% Mahmoudiya
3% Baiji
3% Heet
3% Sinjar
3% Al-Musayab
Homogeneous
Fairly Homogeneous
Heterogeneous
Ethno-religious composition
82% Arab Sunni
3% Arab Shia
Homogeneous10
Fairly Homogeneous
Heterogeneous
Map 2. IDP locations and population concentration
The displacement situation in Baghdad and Abu Ghraib is the most dynamic
of any assessed urban centre nationwide – 42 per cent of IDPs have left
their location of displacement within the city since August 2019.
The majority of IDPs in Baghdad and Abu Ghraib are from Anbar
Governorate, specifically the districts of Falluja (38%), Ramadi (14%),
Al-Kaim (8%). A further eight per cent of IDPs originate from Mosul in
Ninewa Governorate, and 6 per cent are displaced from Mahmoudiya
within Baghdad Governorate itself. Notably, when asked about the best
aspects of living within Baghdad and Abu Ghraib, 27 per cent reported
proximity to relatives and friends that can offer support and 24 per cent
cited the affordable cost of living. Households from Baghdad and Abu
Ghraib were more likely to cite these two aspects than in any other urban
centre. While it may be expected that a bustling capital city provides IDPs
with a greater support network of family and friends, the ability to manage
the cost of living may be a reflection of the high proportion of heads of
household that are working (87%), although their earnings are mostly via
informal or daily wage labour (65%).
Al Amreya-630
Al baladiyat-728
Al Basaten-362
Al Forat-893
Al Ghazaliya-651
Al Ghazaliya-655
Al Ghazaliya-667
AlJameah-631
Al Jameah-633
Al Jazaer-818
Al Jazaer-820
Al Jazera-808
Al Jazera-814
Al Jumhoriyah-117
Al Karkh-212
Al Khadraa-639
Al Khadraa-640
Al Maalef-843
Al Mechanic(AlHader)-830
Al Mechanic(AlHader)-834
Al Mechanic(AlHader)-832
Al Qadissiya-606
Al Qahira-311
Al Resala-849
Al Resala-851
Al Saadon-101
Al Saydia-835
Al Saydiya-821
Al Shaikh Omer-131
Al Shamasiyah-318
Al Shamasiyah-320Al Shamasiyah-316
Al Wardia
Al Yarmouk-610
Al Yarmouk-616
Al Zaafaranyah-969
Al-DhahabAl-Abyadh
Al Salam-408
Al-Nasir Walsalam-3000
Al-Nasir Walsalam-4000Al-Nasir
Walsalam-5000
Al-NasirWalsalam-8000 Al-Resalah
Bob AlSham-367
Bob AlSham-388
Hay AlGhawassah
Hay aljamiyah (AlMasfi)-842
Hay AlRabee-336
Hay Al Zohor
HayAshbilia
SheikhMaaroof-214
Shoala-450
Shoala-458
Shoala-464
Al Raie 861
Abo Moniaser
Adhamia-314
Adhamiya-310
Al Ameen-745
Al Amerya-628
Al Amerya-632Al Amerya-636
Al Amerya-638
1 Athar
AbuDsheer-852
Al Toma(AlMasfi)-826
Hay AlRabee-332
Khernabat-South
ShuhadaMarkza-Shuhdda
the second
Shurta AlMasafi-840
Suwaib-871
ShuhadaMarkza-Shuhdda
Shurtah Al Hader-846
Al Jamhoriyah(Al Masfi)-838
Density of IDP population per neighbourhood
36 - 156
157 - 372
373 - 786

6
URBAN DISPLACEMENT IN FEDERAL IRAQ BAGHDAD AND ABU GHRAIB
Table 2. Best aspects of living in current location, compared to the area of origin11
64% Good security situation
38% Functioning schools
28% Functioning healthcare services
27% Relatives or friends that can offer support
24% Affordable cost of living
23% Money/financial resources/a job/means of livelihood generation
22% No restrictions on freedom of movement, internal movement
12% A better house
VULNERABILITY FACTORS AND SOCIO-DEMOGRAPHIC COMPOSITION
Average HH size 6 individuals
Male to female ratio 99
Dependency ratio 159
The displaced population, overall, is comparatively young, with 60
per cent of the population aged 17 or younger. Of all assessed urban
centres, Baghdad and Abu Ghraib have the highest dependency ratio,
159, meaning that potentially active individuals (in the 18–59 years
age-bracket) are heavily outnumbered by dependents. Given that
nearly all households have been displaced for more than five years,
an estimated 15 per cent of the IDP population have been born into
displacement.
SEX AND AGE
Displaced households display a number of vulnerabilities. Baghdad and
Abu Ghraib have the highest proportion of female-headed house-
holds of any of the assessed urban centres (27%), and a significant
proportion of these are single female heads of household (21% of
all households). In addition, around 9 per cent of households have at
least one member with functional difficulties, though this is compara-
tively low against other urban centres. Other proxies for vulnerability
such as protracted displacement and multiple displacement are both
very common, with 38 per cent of households having been displaced
multiple times. Nearly all households have been displaced for more
than three years (99%) with very few having been displaced before
the 2014 crisis (3%).
11 Other response options include: ‘Freedom to voice my political opinion/participate in political life’ and ‘Support reconciling with the community’ and were mentioned by a small percentage of households. These figures may have been underestimated considering that respondents could name only three response options.
Table 3. Vulnerability profile
99% HHs in protracted displacement
38% HHs who experienced multiple displacement
27% Female HoHHs, 21% of which are ‘alone’
9% HHs with members with functional difficulties
3% HHs who were displaced before 2014
LIVELIHOODS
Although the vast majority of households can count on the head of
household working (87%), less than half are able to meet basic needs
(45%). Only 35 per cent of households can count on a stable source
of income among their top three sources of income. The apparent
disconnect between the high rate of employment and low financial
resilience may partly be explained by the prevalence of informal
commerce or daily labour, which is by far the most common source
of income (64% of households) in Baghdad and Abu Ghraib – and the
highest proportion of any of the assessed urban centres. The precarity
of informal economic activities and the high dependency ratio may
explain why IDP households are struggling to meet basic needs.
Households in Baghdad and Abu Ghraib were more likely than other
urban centres to report borrowing money from friends and family
(15%), cash/grants or aid from national institutions as a source of
income (6%) and savings (5%). This may indicate a more entrenched
reliance on kinship networks in Baghdad and Abu Ghraib as an area of
displacement, and also that access to government and banking institu-
tions for the displaced population in Baghdad and Abu Ghraib is easier
compared with other urban centres. In addition, many households
appear to be indebted, as over one third of households reported
that if they had additional financial resources, they would use it to
repay debts (39%).
Only 2 per cent of households live in a house they own, while 36
per cent still own a property in their area of origin (AoO), which
is very low compared to other urban centres. Nevertheless, 44 per
cent consider their current situation better or the same as it was
before displacement, which is among the highest proportions of all
urban centres assessed.
Table 4. Livelihoods profile
87% HoHH is working
45% HHs able to meet basic needs
44% HHs whose situation is better or the same as before
35%HHs who have a stable source of income among the top three income sources
2% HHs living in owned house
100+100+100+1007+22+20+1 100+100+100+1008+22+19+1Male Female
7% Under 5 8%
22% School aged children (5-17 years) 22%
20% Active population (18-59 years) 19%
1% Older people (60+ years) 1%

7
URBAN DISPLACEMENT IN FEDERAL IRAQ BAGHDAD AND ABU GHRAIB
Table 5. Main sources of income
64% Informal commerce or daily labour
15% Borrowing money from friends or family
15% Paid job (public sector)
10% Money from family/friends inside Iraq
9% Own business
7% Pension
6% Cash/grants or aid from national institutions
5% Agriculture/farming/herd animal raising
5% Savings
3% Income from rent of house or land
2% Paid job (private sector)
2% Cash/grants or aid from international institutions
Table 6. Primary needs12
39% Repaying debts
35% Medical care
33% Food
30% Commercial or livelihood activity
29% Shelter - pay for new shelter
27% Repairing house in AoO
25% Supporting extended family
21% Investment
14% Clothing
7% Education
3% Repairing my house of current residence
1% Transport
1% Assisting others
SAFETY AND SOCIAL INCLUSION IN CURRENT LOCATION
Safety and peaceful coexistence with the host community remain an area of
some concern in Baghdad and Abu Ghraib.13 One in four IDP households
don’t feel completely safe and 14 per cent report experiencing discrimination.
Most IDPs would also feel comfortable seeking help from local authorities if
needed (89%). Only 55 per cent of IDPs voted in the 2018 elections and, of
those who did not vote, 45 per cent reported they had no faith or interest
in the political system. Lack of a biometric card (17%), inability to apply for a
biometric card (16%) and an inability to travel to voting locations (23%) were
also important technical barriers to political participation.
Table 7. Safety and social inclusion
89% Would feel comfortable to seek help from local authorities
86% Have not suffered discrimination
75% Feel completely safe
69% Registered with MoMD
55% Voted in 2018 elections
12 In order to assess main needs, households were asked ‘Imagine for a moment that your household inherit a large sum of money. Please rank the three main items your household would use this money for (starting with 1 for the most important).’ The table shows the percentage of respondents that mentioned each option, but not the prioritization given to each option.
13 This confirms findings from the safety and social cohesion data as outlined in Urban Displacement: A preliminary Analysis. IOM, DTM Iraq 2020. Available at http://iraqdtm.iom.int/DurableSolutions/Description/342
14 Proof of nationality, national ID and residential card are the top three documents reported missing by between 1 and 2.5 per cent of households. All other types of documents are each missed by less than 1 per cent of households.
15 Of those who own a house in the area of origin.
WILLINGNESS AND PLANNING FOR RETURN
Nearly all IDPs seem to have the key personal documents (91%).14 However,
around 60 per cent of households are missing information on their area
of origin, either because they do not trust the information they receive or
do not have relatives or friends in the area of origin who can provide this
information. Livelihoods and shelter are other urgent issues impacting upon
returns: only 42 per cent of households believe they would have better
livelihood opportunities and affordable conditions of living in their area of
origin (as compared to the conditions in displacement). Of the 36 per cent
who own a house in their area of origin, 58 per cent report their house
is completely destroyed, and a further 28 per cent report their house is
partially destroyed and uninhabitable. Excluding those who do not know
the condition of their house, only six per cent believe they could return to
a habitable dwelling in their area of origin. Furthermore, around 1 in 5 who
own a house report their property documentation to be lost or destroyed
(19%) or stolen or confiscated (2%).
Table 8. Conditions surrounding return
91% Have personal documentation
42% Livelihoods and living conditions are better at the AoO
40% Have enough information on AoO
22% Have house ownership documents
2% Owns a habitable house
Although return seems possible – around three quarters of households
know someone who made it back to the area of origin (72%) – very few
households have made plans to return (6% of all households). Among
households who expressed an intention to return, 15 per cent had made
plans, and the most common action taken is checking the conditions at the
location of origin (14%), followed by arranging accommodation (2%) and
making arrangements with family, friends or community members (2%).
Awareness of compensation programmes such as that provided by the
Central Committee for Compensating the Affected (CCCA) is the lowest
of the urban centres in Federal Iraq, at 19 per cent. Only 13 per cent of
all IDP households have applied for compensation. However, the need for
such programmes remains high as 61 per cent of households report that
they would repair their house in the area of origin if they received a large
sum of money, which was the highest proportion among the assessed
urban centres.
Table 9. Planning for return
72% Know people who successfully returned
23% Tried to return at least once
13% Have applied for compensation15
6% Have made plans to return
3% Tried to return more than once

8
URBAN DISPLACEMENT IN FEDERAL IRAQ BAGHDAD AND ABU GHRAIB
INTENTIONS AND PREFERRED DURABLE SOLUTION
Although around 96 per cent of households still consider themselves
‘displaced’, intentions to stay (39%) and indecision (16%) outweigh the
willingness to return (41%). Moreover, very few who intend to return
have taken action in this direction (15%) and are either unsure about the
date of their return (54%) or do not plan to do so in less than one or
two years time (40%). This finding would suggest that the rate of change
in the displaced population is likely to stabilize in Baghdad and Abu Ghraib
over the next two years unless there is a significant shift in the landscape.
Figure 2. Intentions of household, in the event that no obstacles are faced16
For IDPs in Baghdad and Abu Ghraib who reported an intention to return,
lack of economic opportunities in their area of origin seems to be the
primary reason for delaying return (35%), also reflected by those who
state that there are better economic opportunities in their current loca-
tion (36%). Of all urban centres, IDPs in Baghdad and Abu Ghraib were
most likely to report the perceived economic advantage of remaining in
their current location. Around a quarter of households believe that living
16 Respondents were asked ‘Imagine for a moment that you faced no obstacles to return or to remain in the current location: what would be your household’s preferred place to live in the future?’
conditions are better in their current location (24%), while children being
enrolled in school and a better security situation in Baghdad and Abu Ghraib
are also notable factors for delaying return (8% and 7% respectively).
However, the economic precarity of the IDP population in Baghdad and
Abu Ghraib also plays a role in delaying returns. As noted above, less than
half of households are able to meet basic needs and only 35 per cent have
a stable source of income. As a result, 22 per cent of households who
reported an intention to return cite a lack of financial means to do so as a
reason for remaining, or at least deferring the decision to return.
Table 10. Factors associated with area of origin
35% Lack of economic opportunities
9% Basic services unavailable or inadequate
5% Lack of housing
3% Unstable security situation
2% Issues regarding access documents, security clearance
Table 11. Factors associated with area of displacement
36% Better economic opportunities
24% Better living conditions
22% No financial means to return
8% HH members in school in current location
7% Better security situation
Map 3. Future intention per neighbourhood
39+41+16+4+C39%41%
16%
3%
Stay
Return
Undecided
Move abroad
Al Amreya-630
Al Basaten-362
Al Forat-893
Al Ghazaliya-651
Al Ghazaliya-655
Al Ghazaliya-667
AlJameah-631
Al Jameah-633
Al Jazaer-818
Al Jazaer-820
Al Jazera-808Al Jazera-814
AlJumhoriyah-117
Al Karkh-212
Al Khadraa-639
Al Khadraa-640
Al Maalef-843
Al Mechanic(AlHader)-830
Al Mechanic(AlHader)-832
Al Mechanic(AlHader)-834
Al Qadissiya-606
Al Qahira-311
Al Resala-849
Al Resala-851
Al Saadon-101
Al Saydia-835
Al Saydiya-821
Al ShaikhOmer-131
Al Shamasiyah-316
AlShamasiyah-318
Al Shamasiyah-320
Al Wardia
Al Yarmouk-610AlYarmouk-612
Al Yarmouk-616
Al-DhahabAl-Abyadh
Al Salam-408
Al-Nasir Walsalam-3000
Al-Nasir Walsalam-4000
Al-Nasir Walsalam-5000
Al-NasirWalsalam-8000
Al-Resalah
Bob AlSham-367
Bob AlSham-388
Hay Al Ghawassah
Hay aljamiyah (AlMasfi)-842
Hay AlRabee-336
Hay Al Zohor
Hay-Busatan
SheikhMaaroof-214
Shoala-450
Shoala-458
Shoala-464
ShuhadaMarkza-Shuhadda
the first
Al Raie 861
Abo Moniaser
Adhamia-314
Adhamiya-310
AlAmerya-632Al Amerya-636
Al Amerya-638Al Amerya-628
1 Athar
AbuDsheer-852
Al Toma(AlMasfi)-826
Hay AlRabee-332
Shuhada Markza-Shuhddathesecond
Shurta Al
Masafi-840
Suwaib-871
Intention of the majority of IDPsin the neighborhood
Return
Move within Iraq
Stay
Undecided

9
URBAN DISPLACEMENT IN FEDERAL IRAQ BAGHDAD AND ABU GHRAIB
FACTORS AFFECTING THE INTENTIONS OF DISPLACED URBAN POPULATIONS
17 Return Index 10 shows that Falluja has comparatively more ‘hotspots’ of of high severity compared with the other two districts of origin. A severity hotspot is defined as a location where critical livelihood, services, safety and social cohesion conditions are not met, or are only partially met in areas with large numbers of returnees. At present 148,914 returnees live in high severity hotspots in Falluja.
Future intentions seem to be impacted by the gender of the head of household. Male-headed households were more likely than female heads of household to want to stay in their area of displacement (AoD), with females more likely to be undecided. While not all households opted to declare their ethno-religious affiliation, Arab Shia were more likely than Arab Sunni Muslims to intend to move to another location within Iraq, but they represent only three per cent of households surveyed. Just under half of Arab Sunni Muslims expressed an intention to return. Households originating from Al-Ka’im were the least likely to intend to return (25%), followed by those from Ramadi (40%) and those from Falluja (48%). Conversely, 4 per cent of those from Falluja intend to move to another location within Iraq, which may suggest
that for some households the conditions in areas of Falluja make return an undesirable solution to displacement.17 Only nine per cent of households displaced before 2014 expressed an intention to return. However, those displaced before 2014 were also far more likely to intend to move within Iraq (8%), to move abroad (7%), or to be undecided (26%). Those who had tried to return once or more than once were considerably more likely to intend to return (62% and 67% respectively). There is also a correlation between those who no longer consider themselves displaced and intending to stay in their Area of displacement (69%). Multiple displacements also appear to make households more intent on return to their area of origin (49%, compared with 36% who had been displaced once).
Figure 3. Factors affecting intentions
Sex of HoHH
Male
Female
Arab Sunni
Kurdish Sunni
District of origin
Falluja
Ramadi
Al-Kaim
Previous displacementprior to 2014
No
Tried to return
Never
At least once
More than once
Still considersthemselvesto be displaced
No
Yes
Displacement
Once
More than once
41%
42%
49%
18%
47%
25%
42%
35%
31%
36%
49%
43%
30%
35%
63%
29%
39%
53%
39%
45%
8%
42%
45%
30%
3%
4%
3%
19%
4%
43%
3%
2% <1% 18%
62%19% 7%
69%
38%
2%
<1% 13%
24%
<1% 13%
25%
1% 17%
21%
16%
Yes 9%49% 9% 7% 26%
12%
67%25% 8%
17%<1%3%
4% <1% 15%
18%
Ethno-religiousaffiliation
1%
ReturnStay Move within Iraq Undecided Move abroad

10
URBAN DISPLACEMENT
BAQUBA
GENERAL CONTEXT18
Displaced individuals 13,368
Displaced households 2,228
Neighborhoods hosting IDPs 16
IDP to host population ratio 4.57
In addition to hosting a large number of IDPs in camps on the outskirts
of the city (around 5,410 individuals), urban displacement is extensive in
Baquba which hosts 13,368 IDPs – 1 per cent of the total out-of-camp
displaced population nationwide. The neighbourhoods of Al Gatoon Al
Rahma and Al Gatoon Al Yarmook hold the highest concentrations of
IDP households – 48 per cent of the total IDP population between
them – with lower concentrations in the surrounding neighbourhoods.
Recipient of out of camp IDPs
1% of total out-of-camp IDPs
Low Recipient
Medium Recipient
High Recipient
18 Population figures as of August 2020.
Rate of change in IDP population
-5% IDPs (August 2019 – August 2020)
Stationary
Fairly Stationary
Fairly Dynamic
Dynamic
Districts of origin
32% Al-Muqdadiya
30% Khanaqin
13% Al-Khalis
3% Baquba
Homogeneous
Fairly Homogeneous
Heterogeneous
Ethno-religious composition
97% Arab Sunni
3% Arab Shia
Homogeneous
Fairly Homogeneous
Heterogeneous
Map 4. IDP locations and population concentration
The displacement situation in Baquba is stationary, only 5 per cent of IDPs
have left their location of displacement within the city since August 2019,
which is aligned with the high proportion of households that reported an
intention to stay in their current location of displacement (78%, the highest
of any assessed urban centre). IDP households cited the good security
situation in Baquba, in addition to better housing, functioning schools and
no restrictions to their movement, when compared to their area of origin.
The majority of IDPs in Baquba are from surrounding districts in Diyala
Governorate, specifically Al-Muqdadiya (31%), Khanaqin (30%), Al-Khalis
(13%).
Al Tahreer
Al-Qatoon-Al Raazi Qtr
Al Takiya
Al-Shuhada Qtr
Al Gatoon-Al Mujama Qtr
Al Gatoon-Al rahma
Al Mafraq
Al Gatoon-Al Yarmook QtrNew Baquba Qtr
Al-Mualmeen Qtr
Al-Mustafa Qtr
Muskar Saad QtrAl-Manjara Qtr
Jorf Al Milih QtrAl-Sumud Qtr
Al-Mualimeen-Shahid wadah Qtr
Density of IDP population per neighbourhood
24 - 600
601 - 2,520
2,521 - 4,200

11
URBAN DISPLACEMENT IN FEDERAL IRAQ BAQUBA
Table 12. Best aspects of living in current location, compared to the area of origin19
77% Good security situation
39% A better house
39% No restrictions on freedom of movement, internal movement
38% Functioning schools
23% Money/financial resources/a job/means of livelihood generation
22% Affordable cost of living
21% Functioning health-care services
9% Relatives or friends who can offer support
3% Psychosocial care
VULNERABILITY FACTORS AND SOCIO-DEMOGRAPHIC COMPOSITION
Average HH size 6 individuals
Male to female ratio 96
Dependency ratio 112
The displaced population, overall, is quite young, with children 17 years or
younger accounting for just under half of all IDPs (48%). With a depend-
ency ratio of 112, the potentially active population in Baquba (in the 18–59
years age bracket) is smaller than the dependent population. School-aged
children account for just over a third of the total IDPs (35%) and, consid-
ering that nearly all households have been displaced for more than five
years, an estimated 13 per cent of the IDP population are children born
in displacement. Females slightly outnumber males in Baquba’s displaced
population, which is not common among the assessed urban centres.
The head of household is on average 46 years old, which increases to 49
when the household is headed by a female.
Figure 4. Sex and age of displaced population
Displaced households display a number of vulnerabilities. Twenty-six per
cent of the households have a female head, and 21 per cent are single
female heads of household, which is the second highest proportion among
the assessed urban centres.20 Protracted displacement is almost universal
(97%) and multiple displacements are also very common, 54 per cent
of households having been displaced multiple times. Notably, 34 per
cent of Baquba’s displaced population had already experienced internal
displacement prior to the 2014 crisis, by far the highest proportion of
any urban centre in either Federal Iraq or the Kurdistan Region of Iraq
(KRI), and a possible cause of the rootedness of that population to their
area of displacement .
19 Other response options include: ‘Freedom to voice my political opinion/participate in political life’ and ‘Support reconciling with the community’ and were mentioned by a small percentage of households. These figures may have been underestimated considering that respondents could name only three response options.
20 The equal highest rate of single FHH is in Baghdad and Abu Ghraib, which has 27 per cent FHHs.
21 In order to assess main needs households were asked ‘Imagine for a moment that your household inherit a large sum of money. Please rank the three main items your household would use this money for (starting with 1 for the most important).’
Table 13. Vulnerability profile
97% HHs in protracted displacement
54% HHs who experienced multiple displacement
34% HHs who were displaced before 2014
26% Female HoHHs, 3% of which are ‘alone’
13% HHs with members with functional difficulties
LIVELIHOODS
Less than half of households can count on the head of household working
in Baquba (42%) which drops substantially to 27 per cent for female
heads. Informal sector and daily wage labour are the most prominent
source of household income (34%), followed by private sector employ-
ment (16%) and pensions (16%). In addition, Baquba appears to have one
of the highest rates of indebtedness among the assessed urban centres,
with 44 per cent of households reporting that if they had additional finan-
cial resources they would repay debts.21 This was followed by paying for a
new shelter (39%), repairing the current residence (18%) and supporting
the extended family (18%).
Of all assessed urban centres, IDPs in Baquba were most likely to report
that their situation was better or the same as it was prior to displacement
(46%). However, only 61 per cent of households reported being able to
meet basic needs and just over half of all IDP households have a stable
source of income among their top three reported sources of income (53%).
Table 14. Livelihoods profile
61% HHs able to meet basic needs
53%HHs who have a stable source of income among the top three income sources
46% HHs whose situation is better or the same as before
42% HoHH is working
9% HHs living in owned house
Table 15. Main sources of income
34% Informal commerce or daily labour
16% Pension
16% Paid job (private sector)
12% Own business
11% Paid job (public sector)
5% No source of income
4% Money from family/friends inside Iraq
3% Borrowing money from friends or family
3% Government assistance, including compensation
2% Cash/grants or aid from national institutions
2% Borrowing money from bank
2% Other
1% Income from rent of house or land
1% Savings
1% Cash/grants or aid from international institutions
100+100+100+1007+18+24+2 100+100+100+1006+17+23+2Male Female
7% Under 5 6%
18% School aged children (5-17 years) 17%
24% Active population (18-59 years) 23%
2% Older people (60+ years) 2%

12
URBAN DISPLACEMENT IN FEDERAL IRAQ BAQUBA
Table 16. Primary needs
44% Repaying debts
39% Shelter - pay for new shelter
24% Medical care
19% Food
18% Repairing my house of current residence
18% Supporting extended family
16% Repairing house in AoO*
16% Commercial or livelihood activity
8% Clothing
6% Investment
4% Education
3% Assisting others
1% Transport
SAFETY AND SOCIAL INCLUSION IN CURRENT LOCATION
The levels of safety and peaceful coexistence with the host commu-
nity appear to be low in Baquba in two important respects. Only 57
per cent of households reported feeling completely safe, and 86 per
cent would feel comfortable seeking assistance from local authorities.
In both cases, these were the lowest proportions of any urban centre
assessed. However, 95 per cent of households reported not having
suffered discrimination and 75 per cent had registered with the MoMD,
which would appear to indicate successful integration and coexistence
with the host community.
Only 60 per cent of IDPs voted in the 2018 elections, and of those
who did not, 47 per cent reported that they have no faith or interest
in the political system. An inability to travel to voting locations was also
reported as a prevalent barrier to voting (43%), and very few IDPs
reported difficulty applying for or receiving a biometric card (5% and
2% respectively).
Table 17. Safety and social inclusion
95% Have not suffered discrimination
86% Would feel comfortable to seek help from local authorities
75% Registered with MoMD
60% Voted in 2018 elections
57% Feel completely safe
22 Proof of nationality, national ID and residential card are the top three documents reported missing by between 1 per cent and 2.5 per cent of households. All other types of documents are each missed by less than 1 per cent of HHs.
23 The Integrated Location Assessment V ( July-August 2020) found that 20 per cent of locations in Al-Muqdadiya reported having between 25-49 per cent of housing destroyed, 55 per cent of locations in Khanaqin and 14 per cent of locations in Al-Khalis reported having 1-24 per cent of housing destroyed. In Return Index 10 (Oct 2020) found that 42 per cent of returnees in Diyala (78,462 individuals) live in locations with a high severity with regard to the reconstruction of housing.
24 Of those who own a house in the area of origin.
WILLINGNESS AND PLANNING FOR RETURN
Nearly all IDPs seem to have their key personal documents (96%).22
However, around 47 per cent of households are missing information on
their area of origin, mostly because they lack access to information and
have no friends, family or community in the area of origin to contact for
information. Moreover, 38 per cent of IDP households believe that live-
lihoods and living conditions in Baquba are better than at their area of
origin, which is aligned with the high preference to stay among the Baquba
displaced population.
Sixty per cent of IDP households own a house in their area of origin, but
around three quarters of them report their house is completely destroyed
or uninhabitable (74%). This is the highest proportion among all of the
assessed urban centres in KRI and Federal Iraq. This is aligned with loca-
tion-based assessments conducted by IOM DTM, which find that in the
primary districts of origin for IDP households in Baquba, housing destruc-
tion was reported as a driver of severity for returnees.23
Table 18. Conditions surrounding return
96% Have personal documentation
53% Livelihoods and living conditions are better at the AoO
38% Have house ownership documents
28% Have enough information on AoO
7% Owns a habitable house
Comparatively few IDP households in Baquba know someone who actually
made it back to their area of origin (52%), and only seven per cent of all
households have made plans to return. Around one in four IDP households
have checked the conditions of their area of origin and tried to return (27%
and 25% respectively).
Awareness of compensation programmes such as the CCCA is the highest
in Baquba compared with the other urban centres assessed (48%), which
rises among IDPs who own a house (56%), and even more among IDPs
who own a house that is destroyed (59%). However, a smaller proportion
of all IDP households in Baquba have applied for compensation (17%), while
19 per cent of those who own a house reported they would repair the
house in their area of origin if they had a large sum of money.
Table 19. Planning for return
52% Know people who successfully returned
25% Tried to return at least once
17% Have applied for compensation24
8% Tried to return more than once
7% Have made plans to return

13
URBAN DISPLACEMENT IN FEDERAL IRAQ BAQUBA
INTENTIONS AND PREFERRED DURABLE SOLUTION
Although around 88 per cent of households still consider themselves
‘displaced’, the intention to stay (78%) drastically outweighs the intention
to return (21%) – the lowest among any of the assessed urban centres.
Among households who intend to return, and have made plans to do so
(32%), the most common action has been checking the conditions of the
location of origin (27%), with very few households reporting any further
actions. Notably, when these same households were asked when they
planned to return, 14 per cent reported in the next three months – the
highest proportion for this timeframe across all assessed urban centres –
while the majority reported they were unsure (71%).
Figure 5. Intentions of household, in the event that no obstacles are faced25
For IDP households who reported an intention to return, the lack of finan-
cial means to do so was the primary barrier (39%). This is aligned with the
findings that less than half of households can count on the head of house-
hold being employed (42%) and that only 61 per cent of IDP households
are able to meet basic needs in Baquba. Economic opportunities, living
conditions and security situation of Baquba were also quoted as obstacles
25 Respondents were asked ‘Imagine for a moment that you faced no obstacles to return or to remain in the current location: what would be your household’s preferred place to live in the future?’
to return, but only by around 10 per cent of households. The perceptions of
an unstable security situation (24%) and the lack of housing reconstruction
(21%) in areas of origin were also important obstacles to return.
Table 20. Factors associated with area of origin
24% Lack of economic opportunities
21% Lack of housing
8% Lack of economic opportunities
6% Issues regarding access documents, security clearance
5% Basic services unavailable
3% Prevented from returning to AoO
2% Fear or trauma associated with return
Table 21. Factors associated with area of displacement
39% No financial means to return
10% Better economic opportunities
10% Better living conditions
9% Stable security situation
7% Tribal and reconciliation issues
2% No transportation available for return
2% Health condition prevents HH from returning
2% HH members in school in current location
Map 5. Future intention per neighbourhood
78+21+1+0+C78%
21%
1%
Stay
Return
Undecided
Al Amreya-630
Al Basaten-362
Al Forat-893
Al Ghazaliya-651
Al Ghazaliya-655
Al Ghazaliya-667
AlJameah-631
Al Jameah-633
Al Jazaer-818
Al Jazaer-820
Al Jazera-808Al Jazera-814
AlJumhoriyah-117
Al Karkh-212
Al Khadraa-639
Al Khadraa-640
Al Maalef-843
Al Mechanic(AlHader)-830
Al Mechanic(AlHader)-832
Al Mechanic(AlHader)-834
Al Qadissiya-606
Al Qahira-311
Al Resala-849
Al Resala-851
Al Saadon-101
Al Saydia-835
Al Saydiya-821
Al ShaikhOmer-131
Al Shamasiyah-316
AlShamasiyah-318
Al Shamasiyah-320
Al Wardia
Al Yarmouk-610AlYarmouk-612
Al Yarmouk-616
Al-DhahabAl-Abyadh
Al Salam-408
Al-Nasir Walsalam-3000
Al-Nasir Walsalam-4000
Al-Nasir Walsalam-5000
Al-NasirWalsalam-8000
Al-Resalah
Bob AlSham-367
Bob AlSham-388
Hay Al Ghawassah
Hay aljamiyah (AlMasfi)-842
Hay AlRabee-336
Hay Al Zohor
Hay-Busatan
SheikhMaaroof-214
Shoala-450
Shoala-458
Shoala-464
ShuhadaMarkza-Shuhadda
the first
Al Raie 861
Abo Moniaser
Adhamia-314
Adhamiya-310
AlAmerya-632Al Amerya-636
Al Amerya-638Al Amerya-628
1 Athar
AbuDsheer-852
Al Toma(AlMasfi)-826
Hay AlRabee-332
Shuhada Markza-Shuhddathesecond
Shurta Al
Masafi-840
Suwaib-871
Intention of the majority of IDPsin the neighborhood
Return
Move within Iraq
Stay
Undecided

14
URBAN DISPLACEMENT IN FEDERAL IRAQ BAQUBA
FACTORS AFFECTING THE INTENTIONS OF DISPLACED URBAN POPULATIONS
The gender of the head of house does not appear to have a strong impact on intentions in Baquba. Although the majority of households intend to stay, regardless of their district of origin, this intention was most pronounced for households from Al-Muqdadiya (87% intending to stay). A similar preference for staying was expressed by households that had been displaced prior to 2014, suggesting a rootedness to their area of displacement due to their protracted displacement. Households that had previously attempted to return
once, or more than once, were more likely to intend to return, than those who had never tried, but only marginally. Understandably, the intention to stay was prevalent among those those who no longer consider themselves displaced (95% of these households that intend to stay in their area of displacement). There was, however, little difference in intentions between households that had been displaced once, or more than once.
Figure 6. Factors affecting intentions
79%
82%
Sex of HoHH
Male
Female
Arab Sunni
Kurdish Sunni
District of origin
Al-Muqdadiya
Khanaqin
Al-Khalis
Previous displacementprior to 2014
No
Tried to return
Never
At least once
More than once
Still considersthemselvesto be displaced
No
Yes
Displacement
Once
More than once
17%
20%
18%
5%
21%
22%
67%
81%
23%
79%
77%
25%74%
95%
76%
1%
1%
87% 1%
1%
1%
1%
1%
1%
1%
<1%
67%
76%
74%
Yes 85%
36%64%
Ethno-religiousaffiliation
76% 23% <1%
ReturnStay Undecided
33%
12%
32%
24%
25%
15%

15
URBAN DISPLACEMENT
KIRKUK
GENERAL CONTEXT26
Displaced individuals 73,404
Displaced households 12,234
Neighborhoods hosting IDPs 38
IDP to host population ratio 7.02
The city of Kirkuk has a significant displaced population, hosting
73,404 non-camp IDPs (7% of the total out-of-camp displaced pop-
ulation nationwide). The neighbourhood of Hay Al Jamia-Mahalla has
the highest concentration of IDPs in Kirkuk (18%), whereas the rest
of the displaced population is evenly spread among the remaining
locations.
Recipient of out of camp IDPs
7% of total out-of-camp IDPs
Low Recipient
Medium Recipient
High Recipient
26 Population figures as of August 2020.
27 The IDP population in Kirkuk increased slightly in the reporting period as a result of secondary displacement.
Rate of change in IDP population
3% IDPs27 (August 2019 – August 2020)
Stationary
Fairly Stationary
Fairly Dynamic
Dynamic
Districts of origin
43% Hawija
15% Tuz
7% Baiji
6% Daquq
5% Kirkuk
3% Mosul
2% Tikrit
2% Dibis
2% Telafar
Homogeneous
Fairly Homogeneous
Heterogeneous
Ethno-religious composition
94% Arab Sunni
2% Kurd Sunni
2% Turkmen Sunni
2% Turkmen Shia
Homogeneous
Fairly Homogeneous
Heterogeneous
Map 6. IDP locations and population concentration
The displacement situation in Kirkuk is stationary, with new displacements
contributing to a 3 per cent increase in the IDP population within the city
since August 2019. The majority of IDPs in Kirkuk are from districts in
Diyala, Kirkuk and Salah al-Din Governorates, specifically Hawija (43%), Tuz
Khurmatu (15%), Baiji (6%), Daquq (6%), Kirkuk (5%), Mosul (3%), with
others making up the remaining six per cent. When asked about the best
aspects of living in Kirkuk city compared with their area of origin, the vast
majority of households reported the good security situation (87%), along
with the absence of movement restrictions (42%) and the presence of
employment and opportunities for livelihood generation (41%).
Hay Adan
Hay Al Sekak
Hay AlJamia-Mahalla
622
Al Taakhi
HayAl-Khadraa
Tiseen
Hay AlHamzali
Hay AlMansour
Hay Ghurnata
Hay Al-Urooba
Runaki
Panja Ali
Darwaza
HayMusalla
Al-Qadisssiya(Rabareen)first
Al-Qadisssiya(Rabareen)second
Hay Al Nassir
HayAl-Nasir 2
Al Hurriyah
Hay Azadi
HayArafah
201
Hay AlErtiqaa
Al Faylaq-Mahala 5
Amal alshaabi
Hay Al mas
Sary Kahya
Sary Kahya
Baglar
HayAl-ZawraaHay
Rasheed(Domiz)
Hay Al-Nedaa
Al Tadamon(Hawkari)
HayAl-Askary 1
HayAl-Askary 2
Hay 1Athar
Rahim Awa
Shorawo
Sekanyan
Al-SayadaComplex
Density of IDP population per neighbourhood
150 - 1,890
1,891 - 5,400
5,401 - 13,080

16
URBAN DISPLACEMENT IN FEDERAL IRAQ KIRKUK
Table 22. Best aspects of living in current location, compared to the area of origin28
87% Good security situation
42% No restrictions on freedom of movement, internal movement
41% Money/financial resources/a job/means of livelihood generation
25% Functioning schools
23% A better house
18% Functioning health-care services
9% Affordable cost of living
8% Relatives or friends that can offer support
1% Psychosocial care
VULNERABILITY FACTORS AND SOCIO-DEMOGRAPHIC COMPOSITION
Average HH size 7 individuals
Male to female ratio 100
Dependency ratio 153
The displaced population appears, overall, to be younger than that of
other urban centres in Federal Iraq, with a dependency ratio of 153,
meaning the potentially active population (aged 18-59 years) is significantly
smaller than the dependent population. School-aged children account
for almost half of the total IDP population (44%) and, considering that
nearly all households have been displaced for more than five years, an
estimated 14 per cent of the population are children born in displace-
ment. The household size in Kirkuk is slightly larger than average, at seven
members, possibly reflecting the clustering of IDPs under the same roof
in order to better provide for the well-being of its members. The head
of the household is on average 44 years old, which increases to 47 when
the household is headed by a female.
Figure 7. Sex and age of displaced population
Displaced households display a number of vulnerabilities. Around one in
five of Kirkuk’s IDP households have at least one member with functional
difficulties, which is among the highest proportion of the urban centres in
Federal Iraq.29 Twenty per cent of IDP households are headed by females,
and 16 per cent are headed by a single female. Protracted displacement
affects about 92 per cent of households and 49 per cent of households
have been displaced multiple times
28 Other response options include: ‘A better house’, ‘Freedom to voice my political opinion/participate in political life’, ‘Support reconciling with the community’, ‘Affordable cost of living’ and were mentioned each by less than 7% of families. These figures may have been underestimated considering that IDPs could name only three response options.
29 Tuz Khurmatu also has 20 per cent of households with at least one member with functional difficulties.
Table 23. Vulnerability profile
92% HHs in protracted displacement
49% HHs who experienced multiple displacement
20% HHs with members with functional difficulties
20% Female HoHHs, 7% of which are ‘alone’
3% HHs who were displaced before 2014
LIVELIHOODS
Only 22 per cent of IDP households in Kirkuk can afford to meet basic
needs, the lowest of all assessed urban centres. The same can be said for
the proportion that have a stable source of income among their top three
sources of income, which is only 28 per cent of households. Despite this,
81 per cent of households can count on the head of household working,
which drops to 59 per cent for female heads of household. The informal
sector and daily wage labour are the most prominent sources of IDP
household income (62%), followed by the public sector (12%), pensions
(8%) and money from friends and family within Iraq (8%). The needs
expressed by IDP households in Kirkuk are aligned with the inability of
many to meet basic needs. When asked how they would use additional
financial resources, 48 per cent reported they would spend on food, 31
per cent on commercial or livelihood activities, 30 per cent on medical
care and 25 per cent on for paying for a new shelter. As a result, only
29 per cent of households believe their situation is better or the same
as before displacement.
Table 24. Livelihoods profile
81% HoHH is working
29% HHs whose situation is better or the same as before
28%HHs who have a stable source of income among the top three income sources
22% HHs able to meet basic needs
11% HHs living in owned house
Table 25. Main sources of income
62% Informal commerce or daily labour
12% Paid job (public sector)
8% Money from family/friends inside Iraq
8% Pension
6% No source of income
6% Own business
3% Borrowing money from friends or family
3% Paid job (private sector)
2% Cash/grants or aid from national institutions
1% Savings
100+100+100+1007+22+19+2 100+100+100+1007+20+20+1
Male Female
7% Under 5 7%
22% School aged children (5-17 years) 22%
19% Active population (18-59 years) 20%
2% Older people (60+ years) 1%

17
URBAN DISPLACEMENT IN FEDERAL IRAQ KIRKUK
Table 26. Primary needs30
48% Food
31% Commercial or livelihood activity
30% Medical care
25% Shelter - pay for new shelter
20% Repairing my house of current residence
20% Repaying debts
19% Repairing house in AoO
16% Supporting extended family
10% Clothing
9% Education
3% Investment
SAFETY AND SOCIAL INCLUSION IN CURRENT LOCATION
Safety and peaceful coexistence with the host community appears to
be the norm in Kirkuk, with 99 per cent of IDP households reporting
they had never experienced discrimination and 98 per cent reporting
they felt completely safe. However, IDP households in Kirkuk are the
least likely to feel comfortable seeking help from local authorities when
compared with the other assessed urban centres, a finding that may
warrant further research into public trust and institutional account-
ability in the city.
Around 78 per cent of IDP households voted in the 2018 elections
and, of those who did not, 55 per cent reported that they have no
faith or interest in the political system. The inability to travel to polling
locations (29%) and not receiving a biometric card (13%) were the
two most prominent technical reasons given for not participating
politically.31
Table 27. Safety and social inclusion
99% Have not suffered discrimination
98% Feel completely safe
79% Would feel comfortable to seek help from local authorities
78% Voted in 2018 elections
66% Registered with MoMD
30 In order to assess main needs households were asked ‘Imagine for a moment that your household inherit a large sum of money. Please rank the three main items your household would use this money for (starting with 1 for the most important).’ The table shows the percentage of respondents that mentioned each option, but not the prioritization given to each option.
31 This confirms findings from the safety and social cohesion data as outlined in Urban Displacement: A preliminary Analysis. IOM, DTM Iraq 2020.
32 Proof of nationality, national ID and residential card are the top three documents reported missing by between 1 per cent and 2.5 per cent of households. All other types of documents are each missed by less than 1 per cent of HHs.
33 Of those who own a house in the area of origin.
WILLINGNESS AND PLANNING FOR RETURN
Nearly all IDPs report having the key personal documents (91%).32 The
majority of IDP households in Kirkuk feel that they have sufficient informa-
tion about their area of origin (78%), and those who do not have sufficient
information report a lack of access to – or trust in – information. Perhaps
as a result of the difficulty of meeting basic needs for many IDPs in Kirkuk,
47 per cent of households believe that livelihoods and living conditions
are better in the area of origin, which (along with Tikrit) is the highest rate
among any of the urban centres assessed. Around 1 in 5 households have
tried to return once to their area of origin (22%), but very few have tried
more than once (3%).
In addition, 75 per cent of IDP households own a house in their area of
origin, which is the highest rate among the urban centres in Federal Iraq.
However, 65 per cent of those houses are purportedly destroyed and 14
per cent partially damaged – with only 15% inhabitable. Around one in four
households have the necessary property documents (23%). Awareness
of compensation programmes such as the CCCA is among the highest
in Kirkuk compared with the other urban centres assessed in Federal Iraq
(43%), which rises among IDPs who own a house (46%). IDP households
in Kirkuk are also the most likely to have applied for compensation among
all urban centres assessed (21%).
Table 28. Conditions surrounding return
91% Have personal documentation
78% Have enough information on AoO
47% Livelihoods and living conditions are better in the AoO
23% Have house documents
12% Owns a habitable house
Around 62 per cent of IDP households in Kirkuk know someone who made
it back to their area of origin, though very few have made plans to return
(3%) or checked conditions at their area of origin (6%). Among the few
households who have made plans to return (6% of the total), all of them
had gone to check the conditions of the location of origin. The majority of
those with plans reported that they did not know when they would return
(59%), followed by in one to two years (21%).
Table 29. Planning for return
62% Know people who successfully returned
22% Tried to return at least once
21% Have applied for compensation33
3% Have made plans to return
3% Tried to return more than once

18
URBAN DISPLACEMENT IN FEDERAL IRAQ KIRKUK
INTENTIONS AND PREFERRED DURABLE SOLUTION
Although around 84 per cent of households still consider themselves
‘displaced’, intentions to stay (48%) are equal to intentions to return (47%).
For IDP households who reported an intention to return, the lack of housing
in the area of origin was the most commonly reported obstacle (41%), in
addition to an unstable security situation (19%) and a lack of economic
opportunities (16%). Pull factors in the area of displacement complement
these perceptions, with IDP households believing that the security situation
in their current location is more stable (14%), there are greater economic
opportunities (14%) and living conditions are better (13%). Given the very
low proportion of IDP households able to meet their basic needs in Kirkuk
(22%), the lack of financial means to return to the area of origin is also an
important obstacle to return (11%).
Figure 8. Intentions of household, in the event that no obstacles are faced34
34 Respondent was asked ‘Imagine for a moment that you faced no obstacles to return or to remain in the current location: what would be your household’s preferred place to live in the future?’
Table 30. Factors associated with area of origin
41% No housing
19% Unstable security situation
4% Lack of economic opportunities
1% Basic services unavailable/not adequate
1% Fear or trauma associated with return
1% Prevented from returning
Table 31. Factors associated with area of displacement
14% Stable security situation
14% Economic opportunities
13% Living conditions better
12% No financial means to return
1% Health condition prevents HH from returning
Map 7. Future intention per neighbourhood
48+47+4+1+C48%47%
1%
Stay
Return
Undecided
Move abroad
4%
Hay Adan
Hay AlSekak
Hay AlJamia-Mahalla
622
Al Taakhi
HayAl-Khadraa
Tiseen
Hay AlHamzali
Hay AlMansour
Hay Ghurnata
Hay Al-Urooba
Runaki
Panja Ali
Darwaza
HayMusalla
Al-Qadisssiya(Rabareen)first
Al-Qadisssiya(Rabareen)second
Hay Al NassirHayAl-Nasir 2
Al Hurriyah
Hay Azadi
HayArafah
201
Hay AlErtiqaa
Al Faylaq-Mahala 5
Amal alshaabi
Hay Al mas
Sary Kahya
Baglar
Hay Al-Zawraa
HayRasheed(Domiz)
Hay Al-Nedaa
Al Tadamon(Hawkari)Hay
Al-Askary 1 HayAl-Askary 2
Hay 1Athar
Rahim Awa
Shorawo
Sekanyan
Al-SayadaComplex
Intention of the majority of IDPsin the neighborhood
Return
Stay
48%
4%
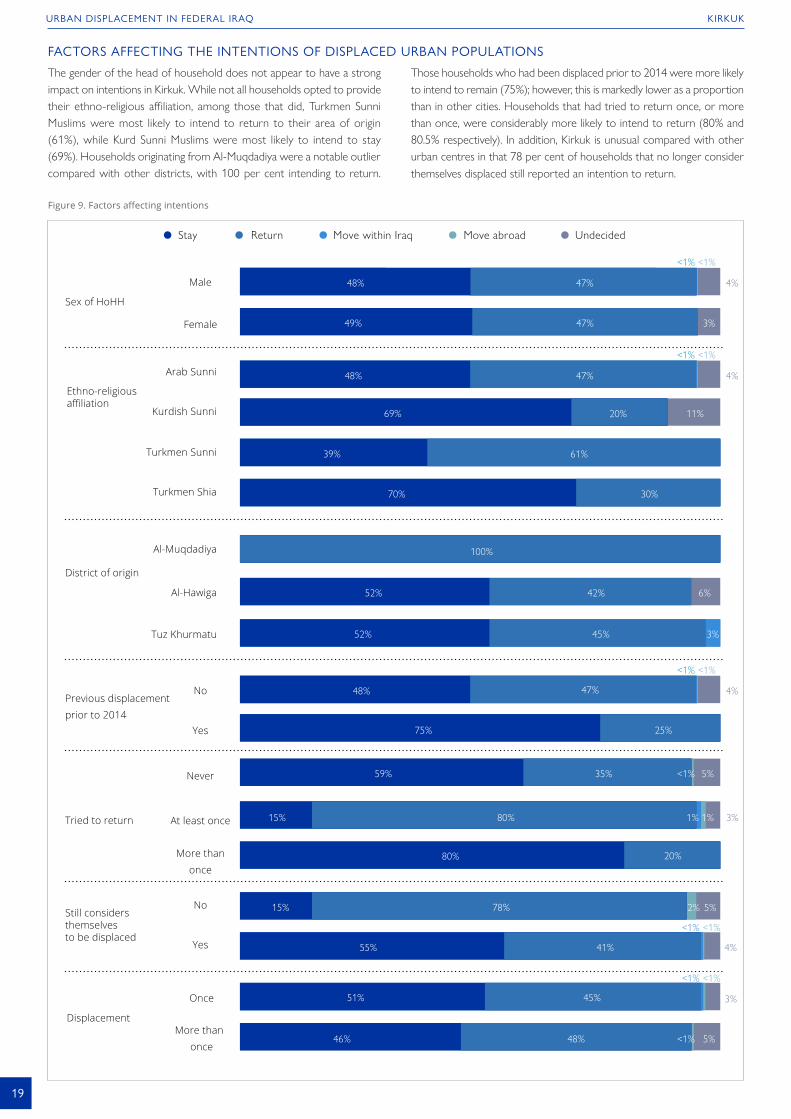
19
URBAN DISPLACEMENT IN FEDERAL IRAQ KIRKUK
FACTORS AFFECTING THE INTENTIONS OF DISPLACED URBAN POPULATIONS
The gender of the head of household does not appear to have a strong impact on intentions in Kirkuk. While not all households opted to provide their ethno-religious affiliation, among those that did, Turkmen Sunni Muslims were most likely to intend to return to their area of origin (61%), while Kurd Sunni Muslims were most likely to intend to stay (69%). Households originating from Al-Muqdadiya were a notable outlier compared with other districts, with 100 per cent intending to return.
Those households who had been displaced prior to 2014 were more likely to intend to remain (75%); however, this is markedly lower as a proportion than in other cities. Households that had tried to return once, or more than once, were considerably more likely to intend to return (80% and 80.5% respectively). In addition, Kirkuk is unusual compared with other urban centres in that 78 per cent of households that no longer consider themselves displaced still reported an intention to return.
Figure 9. Factors affecting intentions
Sex of HoHH
Male
Female
Arab Sunni
Kurdish Sunni
District of origin
Al-Muqdadiya
Al-Hawiga
Tuz Khurmatu
Previous displacementprior to 2014
No
Tried to return
Never
At least once
More than once
Still considersthemselvesto be displaced
No
Yes
Displacement
Once
More than once
47%
20%
100%
45%
35%
78%
45%
48%
49%
69%
42%
52%
59%
15%
41%
51%
46%
52%
<1% 5%
80%15% 1% 1%
55%
3%
11%
Turkmen Sunni
Turkmen Shia 30%
39% 61%
70%
6%
3%
Yes 25%75%
3%
20%80%
2% 5%
4%
<1%<1%
<1%<1%
3%
<1% 5%
Ethno-religiousaffiliation
47%48%
<1%<1%
4%
47%48%
<1%<1%
4%
47%48%
<1%<1%
4%
ReturnStay Move within Iraq Undecided Move abroad

20
URBAN DISPLACEMENT
MOSUL
GENERAL CONTEXT35
Displaced individuals 96,786
Displaced households 16,131
Neighborhoods hosting IDPs 86
IDP to host population ratio 7.11
Mosul hosts the second highest share of Iraq’s out-of-camp IDP
population (9%) after Erbil, with 16,131 households. A high pro-
portion of displacement in Mosul is linked to movements from the
western to the eastern part of the city which experienced a lesser
degree of destruction to housing and public infrastructure when the
city was retaken in the military campaign against ISIL.
Recipient of out of camp IDPs
9% of total out-of-camp IDPs
Low Recipient
Medium Recipient
High Recipient
35 Population figures as of August 2020.
36 Proportion of out-of-camp IDPs determined using figures from Master List 117.
Rate of change in IDP population36
-9% IDPs (August 2019 - August 2020)
Stationary
Fairly Stationary
Fairly Dynamic
Dynamic
Districts of origin
39% Mosul
26% Sinjar
24% Telafar
2% Al-Hamdaniya
Homogeneous
Fairly Homogeneous
Heterogeneous
Ethno-religious composition
86% Arab Sunni
12% Turkmen Sunni
1% Kurd Sunni
1% Turkmen Shia
Homogeneous
Fairly Homogeneous
Heterogeneous
Map 8. IDP locations and population concentration
The displacement situation in Mosul is stationary – nine per cent of IDPs
have left their location of displacement within the city since August 2019.
The majority of IDPs in Mosul are displaced from within Mosul district (39%)
or from other districts within Ninewa Governorate, namely Sinjar (26%),
Telafar (24%) and Al-Hamdaniya (2%).
When asked about the best aspects of living within Mosul compared with
their area of origin, over half of households cited that the urban setting
affords greater security (51%). Access to services, shelter and infrastruc-
ture were also identified, specifically healthcare (41%), functioning schools
(40%) and a better house (36%). The lack of restrictions on freedom of
movement (22%) and the access to livelihood and employment opportu-
nities (18%) were also identified as positive aspects of living in the city by
slightly smaller proportions of households.
Mosul Jadida
MosulJadida
Al-Najjar
Al-Rabeea
Hay 30July
Al-Iqtisadieen
Msherfa 1
Msherfa 2
Hay Al IslahAl Zirai
Al-Abar Al-SinaaAl-QademaAl-Matahin
Al Sikak
Al-Maghreb
Al-smood
Door Al-Sukar
Al-Mansour
Al-Maamon
Al-Amil
Al-Yarmuk
Hay Nablus
TalAl-Rumman
AlshuhadaaWadi Hajar
Hay AlNahrawan
Al Tanak
Al Harmaat
Al-Sihha
Zanjili
Al-Nabi Sheet
Al-Fisaliyah
HayAl-Maliyah
Hay AlIntisar
Al-Swais
Al jazaer
Al-Mothana
Al rasheediya
Bysan
Al-Hadbaa
Al-Baladyat
Hayalsedeeq
Al-Bareed
Al-Falah
Al-Qahira
Hay AL-Jamea Al tahreer
Hay Al Zahraa
Arbajiyah
Hay-Karkukli
HayAl-Baker
Al-Muharibeen
Al-Moalemen
Al-Salam
Domiz
HAY-FALISTINE
Al-Methaq
Hay AlSamah
Hay Adan
Al-Wahda
AlqadisiyaAl-thaniya
Hay Al Tammem
HayAlalam Al-Akhaa
Density of IDP population per neighbourhood
66 - 1,554
1,555 - 4,398
4,399 - 9,360

21
URBAN DISPLACEMENT IN FEDERAL IRAQ MOSUL
Table 32. Best aspects of living in current location, compared to the area of origin
51% Good security situation
41% Functioning healthcare services
40% Functioning schools
36% A better house
22% No restrictions of freedom of movement, internal movement
18% Money/financial resources/a job/means of livelihood generation
18% Relatives or friends that can offer support
12% Affordable cost of living
2% Psychosocial care
1% Support reconciling with the community
VULNERABILITY FACTORS AND SOCIO-DEMOGRAPHIC COMPOSITION
Average HH size 7 individuals
Male to female ratio 100
Dependency ratio 126
The displaced population, overall, is relatively young, with 51 per cent of the
population aged 17 or younger. Mosul has the third highest dependency ratio
of all assessed urban centres, 126, meaning that potentially active individuals
(in the 18–59 years age-bracket) are somewhat outnumbered by dependents.
With many households displaced for more than five years, around 12 per cent
of the IDP population may have been born into displacement.
Figure 10. Sex and age of displaced population
Displaced households display a number of vulnerabilities. Sixteen per cent of
IDP households are headed by a female, and nearly all of these are “alone”,
i.e. either single, widowed, separated, divorced or if married, not living with
their husband (15% of all households). In addition, nearly one in every
four IDP households have at least one member with functional difficulties
(23%), which is the highest rate in any of the assessed urban centres in
Federal Iraq. Other proxies for vulnerability such as multiple displacement
are commonplace, with 37 per cent of households having been displaced
multiple times. However, as one of the final areas to be re-taken as part of
the military operation against ISIL, Mosul has the lowest rate of households
experiencing protracted displacement of any assessed urban centre (81%).
Table 33. Vulnerability profile
81% HHs in protracted displacement
37% HHs who experienced multiple displacement
23% HHs with member with functional difficulties
16% Female HoHH, of which 15% are ‘alone’
6% HHs who were displaced before 2014
LIVELIHOODS
Around half of displaced households in Mosul can count on the head
of household working (52%), with the majority of households are able
to meet basic needs (65%). Only 39 per cent of households can count
on a stable source of income among their top three sources of income.
Unstable sources of income such as informal commerce or daily labour
(45%) and money from family and friends within Iraq (14%) are prom-
inent among displaced households in Mosul. Private (14%) and public
sector (14%) employment provide income for a smaller proportion of
households as do pensions (9%).
The majority of households identified commercial or livelihood activities
as among their top three primary needs, reflecting a desire to develop
stable sources of income. Displaced households also display a high rate
of indebtedness with 38 per cent reporting that they would use additional
financial resources to repay debts. Around a third of households reported
medical care as a primary need (30%), with similar proportions reporting
that the need to repair their house in their AoO (28%).
Only eight per cent of households live in a house they own, while two
thirds of displaced households own a property in their area of origin
(66%). With displaced households forced to rent, where previously the
majority owned their own home, it is perhaps unsurprising that only 26
per cent consider their current situation better or the same as it was
prior to their displacement.
Table 34. Livelihoods profile
65% HHs able to meet basic needs
52% HoHH is working
39%HHs who have a stable source of income among the top three income sources
26% HHs whose situation is better or the same as before
8% HHs living in owned house
Table 35. Main sources of income
45% Informal commerce or daily labour
14% Paid job (public sector)
14% Money from family/friends inside Iraq
14% Paid job (private sector)
9% Pension
5% Own business
3% Cash/grants or aid from national institutions
3% Borrowing money from friends or family
2% No source of income
2% Other
2% Agriculture/farming/herd animal raising
100+100+100+1006+20+22+2 100+100+100+1006+19+23+2Male Female
6% Under 5 6%
20% School aged children (5-17 years) 19%
22% Active population (18-59 years) 23%
2% Older people (60+ years) 2%

22
URBAN DISPLACEMENT IN FEDERAL IRAQ MOSUL
Table 36. Primary needs
58% Commercial or livelihood activity
38% Repaying debts
30% Medical care
28% Repairing house in AoO
26% Shelter - pay for new shelter
19% Supporting extended family
12% Education
10% Investment
6% Food
5% Repairing my house of current residence
1% Clothing
SAFETY AND SOCIAL INCLUSION IN CURRENT LOCATION
The levels of safety and peaceful coexistence in Mosul are high, with
nearly all IDPs reporting that they feel completely safe (96%) and have
never suffered from discrimination (98%).37 Additionally, 92 per cent
would feel comfortable seeking help from the authorities if needed, which
is the second highest level across all urban centres after Sulaymaniyah.
Levels of participation in political life are relatively strong, with 85 per
cent of households reporting at least one member voted in the 2018
elections, which is likely linked to their close proximity to their area of
origin. For those that did not participate in elections, lack of biometric
card (44%) and lack of faith in the political system (29%) were the most
commonly reported obstacles.
Table 37. Safety and social inclusion
98% Have not suffered discrimination
96% Feel completely safe
92% Would feel comfortable seeking help from local authorities
85% Voted in 2018 elections
25% Registered with MoMD
WILLINGNESS AND PLANNING FOR RETURN
Whilst most households (89%) have their key personal documentation,
this was the lowest proportion reported among the assessed urban
centres. This is likely due to the heavy destruction the city incurred,
with many families losing their documentation as a result. Over three
quarters of households report they have enough information on their
area of origin (77%) which for many is likely linked to their close prox-
imity to their area of origin. Of those that reported not having enough
information (23%) the main issues are that they do not trust the infor-
mation they receive (56%), they cannot access information (23%), or
they do not have any friends or family that can provide information on
the conditions in the area of origin (10%).
37 This confirms findings from the safety and social cohesion data as outlined in Urban Displacement: A preliminary Analysis. IOM, DTM Iraq 2020. Available at http://iraqdtm.iom.int/ DurableSolutions/Description/342
38 Proof of nationality, national ID and residential card are the top three documents reported missing by between 1 and 2.5 per cent of households. All other types of documents are each missed by less than 1 per cent of households.
39 Of those who own a house in the area of origin.
Of the 66 per cent of households that own a house in the area of origin,
62 per cent report their house is completely destroyed and a further 22
per cent report partial destruction. Furthermore, only 42 per cent can
access their ownership documents.
Table 38. Conditions surrounding return
89% Have personal documentation38
77% Have enough information on AoO
27% Have house documents
27% Livelihoods and living conditions are better in the AoO
9% Owns a habitable house
Although return seems possible – around two thirds of households
know someone who made it back to the area of origin (62%) – very
few households who remain displaced have made any concrete plans
to return. Only 13 per cent have tried to return at least once (of which
6% have tried to return more than once). One per cent of households
have made plans to return, with checking the conditions in the area of
origin as the only concrete action taken.
Awareness of compensation programmes such as that provided by the
Central Committee for Compensating the Affected (CCCA) is relatively
low at 28 per cent of households, increasing to only 32 per cent among
those who own a house. Only 11 per cent of households have actually
applied for compensation.
Table 39. Planning for return
62% Know people who successfully returned
13% Tried to return once
11% Have applied for compensation39
6% Tried to return more than once
1% Have made plans to return
INTENTIONS AND PREFERRED DURABLE SOLUTION
Although around 79 per cent of households still consider themselves
‘displaced’, this is the lowest proportion among the assessed urban centres
of Federal Iraq. Despite that, intentions to return remain high at 50 per cent
of households, outweighing the intention to stay (44%) and indecision (2%).
However, very few who intend to return have taken any steps in this direc-
tion (1%) and plan to return in 6-12 months (50%) or longer (25%), whilst
one quarter remain undecided (25%), suggesting that we may see further
returns in the year following data collection.
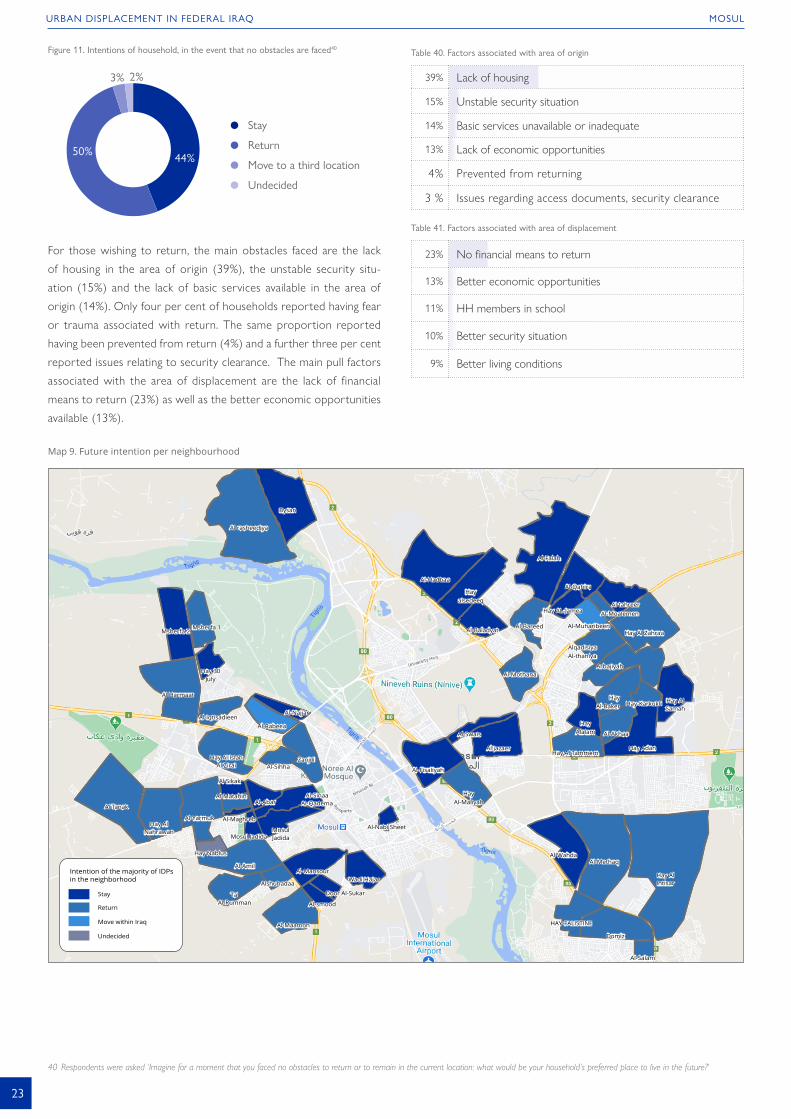
23
URBAN DISPLACEMENT IN FEDERAL IRAQ MOSUL
Figure 11. Intentions of household, in the event that no obstacles are faced40
For those wishing to return, the main obstacles faced are the lack
of housing in the area of origin (39%), the unstable security situ-
ation (15%) and the lack of basic services available in the area of
origin (14%). Only four per cent of households reported having fear
or trauma associated with return. The same proportion reported
having been prevented from return (4%) and a further three per cent
reported issues relating to security clearance. The main pull factors
associated with the area of displacement are the lack of financial
means to return (23%) as well as the better economic opportunities
available (13%).
40 Respondents were asked ‘Imagine for a moment that you faced no obstacles to return or to remain in the current location: what would be your household’s preferred place to live in the future?’
Table 40. Factors associated with area of origin
39% Lack of housing
15% Unstable security situation
14% Basic services unavailable or inadequate
13% Lack of economic opportunities
4% Prevented from returning
3 % Issues regarding access documents, security clearance
Table 41. Factors associated with area of displacement
23% No financial means to return
13% Better economic opportunities
11% HH members in school
10% Better security situation
9% Better living conditions
Map 9. Future intention per neighbourhood
Mosul JadidaMosulJadida
Al-Najjar
Al-Rabeea
Hay 30July
Al-Iqtisadieen
Msherfa 1Msherfa 2
Hay Al IslahAl Zirai
Al-AbarAl-Sinaa
Al-QademaAl-Matahin
Al Sikak
Al-Maghreb
Al-smood
Door Al-Sukar
Al-Mansour
Al-Maamon
Al-Amil
Al-Yarmuk
Hay Nablus
TalAl-Rumman
AlshuhadaaWadi Hajar
Hay AlNahrawan
Al Tanak
Al Harmaat
Al-SihhaZanjili
Al-Nabi Sheet
Al-Fisaliyah
HayAl-Maliyah
Hay AlIntisar
Al-Swais
Al jazaer
Al-Mothana
Al rasheediya
Bysan
Al-Hadbaa
Al-Baladyat
Hayalsedeeq
Al-Bareed
Al-Falah
Al-Qahira
Hay AL-JameaAl tahreer
Hay Al Zahraa
Arbajiyah
Hay-KarkukliHay
Al-Baker
Al-Muharibeen
Al-Moalemen
Al-Salam
Domiz
HAY-FALISTINE
Al-Methaq
Hay AlSamah
Hay Adan
Al-Wahda
AlqadisiyaAl-thaniya
Hay Al Tammem
HayAlalam Al-Akhaa
Intention of the majority of IDPsin the neighborhood
Return
Move within Iraq
Stay
Undecided
44+51+3+2+C44%50%
2%
Stay
Return
Move to a third location
Undecided
3%

24
URBAN DISPLACEMENT IN FEDERAL IRAQ MOSUL
FACTORS AFFECTING THE INTENTIONS OF DISPLACED URBAN POPULATIONS
Future intentions seem not to be impacted by the gender of the head of household. Male heads of household were equally likely to intend to return as female heads of household (50% and 49% respectively) as well as equally likely to intend to stay (44% for both groups). For the two main ethno-religious groups present, again, there was no difference seen in relation to their future intentions. For Arab Sunni Muslims, as the dominant ethno-religious group, 50 per cent of households reported an intention to return, compared to 51 per cent of Turkmen Sunni Muslims as the second most common ethno-religious group.
Households originating from Sinjar were the most likely to intend to return (64%), compared to those from Telafar (57%) and Mosul, where only 34 per cent reported an intention to return. Their close proximity to their area of origin is likely to be the main cause for the high proportion intending to stay and settle in their current location. Having tried to return at least once in the past makes households more determined in their commitment to return – with only 46 per cent who have never attempted return wanted to return, compared to 70 per cent of those who tried to return once and 65 per cent of those who tried more than once.
Figure 12. Factors affecting intentions
ReturnStay Move within Iraq Undecided Move abroad
Sex of HoHH
Male
Female
Arab Sunni
Turkmen Sunni
District of origin
Mosul
Sinjar
Tel Afar
Previous displacementprior to 2014
No
Tried to return
Never
At least once
More than once
Still considersthemselvesto be displaced
No
Yes
Displacement
Once
More than once
49%
51%
34%
57%
50%
46%
27%
47%
54%
44%
43%
58%
64%
39%
44%
48%
65%
56%
47%
39%
4%
3%
5%
32%
3% 1%
3%
4% 2%
70%25% 3%
8%
39%
4%
3%
1% 1%
2%
3%
1%1% 2%
2%
Yes 48%45% 3% 3%
1%
65%32%
2%2%
2%
1% 1%
Ethno-religiousaffiliation
50%44% 3% 2%
50%44% 3% 2%

25
GENERAL CONTEXT41
Displaced individuals 8,868
Displaced households 1,478
Neighborhoods hosting IDPs 23
IDP to host population ratio 7.52
In addition to hosting around 900 IDPs in camps on the outskirts
of the city, urban displacement persists in Tikrit, which hosts 8,868
non-camp IDPs (1% of the total out-of-camp displaced population
nationwide). Around 40 per cent of the IDP population in Tikrit are
located in three neighbourhoods: Hay Alfirdous, Hay Al Zuhour and
Hay Alqalaa, with the rest of the displaced population evenly spread
among the remaining locations.
Recipient of out of camp IDPs
1% of total out-of-camp IDPs
Low Recipient
Medium Recipient
High Recipient
41 Population figures as of August 2020.
42 More information on Baiji district and other districts of origin can be found in the 2019 report ‘Reasons to Remain: An In-Depth Analysis of the Main Districts of Origin’.
Rate of change in IDP population
-23% IDPs (August 2019 - August 2020)
Stationary
Fairly Stationary
Fairly Dynamic
Dynamic
Districts of origin
74% Baiji
5% Al-Shirqat
4% Tikrit
3% Al-Daur
3% Balad
2% Mosul
2% Samarra
Homogeneous
Fairly Homogeneous
Heterogeneous
Ethno-religious composition
99% Arab Sunni
Homogeneous
Fairly Homogeneous
Heterogeneous
Map 10. IDP locations and population concentration
The displacement situation in Tikrit is fairly dynamic, with a 23 per cent
decrease in the IDPs population within the city since August 2019. The
majority of IDPs in Tikrit are from Baiji district, in Salah al-Din Governorate
(74%), with far smaller contingents from Al-Shirqat (5%), Tikrit (4%),
Al-Daur (3%), Balad (3%), Mosul (2%) and Samarra (2%). In a previous
assessment, it was found that a third of locations in Baiji district reported
a need for community reconciliation and over half of locations reported
relatively high levels of daily tensions.42 Further, the previous assessment
found that residents in all Baiji locations reported fear of clashes between
different security forces as well as harassment at checkpoints. Baiji Centre,
where half of the households interviewed in this assessment originate from
is known to have an empty village and two empty neighbourhoods as a
result of unexploded ordnance. Unsurprisingly, therefore, IDP households
reported that Tikrit’s security, employment, cost of living and service delivery
were superior to those they would expect to find in their area of origin.
Hay AlDhubbat
Qadisya 2500 Area
Hay Alziraa
Al-Muskarat
Hay Al AnwaaMahala 420
Al Baladiyat-402
Hay Al-Tajneed
Hay AlZuhour-422
Hay Alkahrbaa
Hay Aldiuom
Hay Al AsryAl Jadid-404
HayAlqalaa
Qadisya 1Mahala 214
Hay Alarbaen
HayAlfirdous
Hay SalmaAltaghlubia
Qadisya 2Mahala 216
Al-Mutaradah204
Hay SheshenMahal 408
Density of IDP population per neighbourhood
48 - 270
271 - 930
931 - 1,620
URBAN DISPLACEMENT
TIKRIT

26
URBAN DISPLACEMENT IN FEDERAL IRAQ TUZ KHURMATU
Table 42. Best aspects of living in current location, compared to the area of origin43
74% Good security situation
33% Money/financial resources/a job/means of livelihood generation
28% A better house
25% Functioning schools
24% Affordable cost of living
23% Functioning health-care services
20% No restrictions on freedom of movement, internal movement
15% Relatives or friends that can offer support
3% Psychosocial care
1% Support reconciling with the community
VULNERABILITY FACTORS AND SOCIO-DEMOGRAPHIC COMPOSITION
Average HH size 6 individuals
Male to female ratio 106
Dependency ratio 104
The displaced population appears, overall, to be slightly older than that of
other urban centres in Federal Iraq with a dependency ratio of 104, as the
active population (aged 18–59 years) make up 49 per cent of the total
population. School-aged children account for just over a third of the total
IDP population (35%) and, considering that nearly all households have been
displaced for more than five years, an estimated 13 per cent of the popula-
tion were born in displacement. The head of the household is on average 45
years old, which increases to 47 when the household is headed by a female.
Figure 13. Sex and age of displaced population
Displaced households display a number of vulnerabilities. Nearly all house-
holds are in protracted displacement (99%), and IDP households in Tikrit
are the most likely to have experienced multiple displacement out of any
of the assessed urban centres (89%). Female-headed households make
up 19 per cent of the population and single female-headed households
represent 10 per cent of the population.
Table 43. Vulnerability profile
99% HHs in protracted displacement
89% HHs who experienced multiple displacement
19% Female HoHHs, 10% of which are ‘alone’
14% HHs with members with functional difficulties
6% HHs who were displaced before 2014
43 Other response options include: ‘Freedom to voice my political opinion/participate in political life’ but this was not mentioned by households in Tikrit. These figures may have been underestimated considering that respondents could name only three response options.
LIVELIHOODS
Just over half of all IDP households in Tikrit reported that they can afford
to meet basic needs (54%), and a similar proportion have a stable source
of income among their top three income sources (59%). Despite this,
Tikrit has the lowest proportion of households where the head of house-
hold is working (28%), compared with all other urban centres, which is
true both of male-headed households (32%) and female-headed house-
holds (11%). Only 28 per cent of households believe their situation is
better or the same as it was before displacement, and only 2 per cent of
households live in a house they own – which is the lowest rate of owner-
ship, equalled only in Baghdad and Abu Ghraib.
Tikrit is notable among the urban centres in Federal Iraq for having a higher
rate of private sector employment (24%) and self-employment among
IDPs (19%), in addition to the more common informal sector and daily
wage labour (43%). Relatedly, 33 per cent of households reported that
their livelihood and employment were the best aspects of living in Tikrit
compared with their area of origin. However, IDP households in Tikrit are
also the most indebted of all urban centres assessed. When asked how
they would use additional financial resources, 45 per cent of households
reported that they would repay debts, along with purchasing medical
care (50%), repairing a house in the area of origin (44%), and food (43%).
Table 44. Livelihoods profile
59%HHs who have a stable source of income among the top three income sources
54% HHs able to meet basic needs
28% HHs whose situation is better or the same as before
28% HoHH is working
2% HHs living in owned house
Table 45. Main sources of income
43% Informal commerce or daily labour
24% Paid job (private sector)
19% Own business
18% Paid job (public sector)
11% Pension
10% Borrowing money from friends or family
8% No source of income
6% Savings
4% Money from family/friends inside Iraq
3% Agriculture/farming/herd animal raising
100+100+100+1007+18+25+2 100+100+100+1006+17+24+2Male Female
7% Under 5 6%
18% School aged children (5-17 years) 17%
25% Active population (18-59 years) 24%
2% Older people (60+ years) 2%

27
URBAN DISPLACEMENT IN FEDERAL IRAQ TIKRIT
Table 46. Primary needs44
50% Medical care
45% Repaying debts
44% Repairing house in area of origin
43% Food
15% Commercial or livelihood activity
14% Shelter - pay for new shelter
11% Clothing
11% Supporting extended family
9% Investment
6% Repairing my house of current residence
5% Education
1% Assisting others
1% Transport
SAFETY AND SOCIAL INCLUSION IN CURRENT LOCATION
IDP households in Tikrit report a peaceful coexistence with the host
community, with 87 per cent comfortable seeking help from local author-
ities and 96 per cent having never suffered discrimination. Seventy-three
per cent of IDP households have registered with MoMD. However, IDPs
are less politically engaged, with only 48 per cent of IDPs reporting that
they voted in the 2018 elections, the second lowest of all assessed urban
centres (the lowest is Sulaymaniyah with 46%). Of those who did not vote,
Tikrit IDPs were the most likely to have no faith or interest in the political
system (65%). Compounding voter apathy, over one in four IDP households
reported they had not received a biometric card necessary for voting (26%).
Table 47. Safety and social inclusion
96% Have not suffered discrimination
87%Would feel comfortable to seek help from local
authorities
79% Feel completely safe
73% Registered with MoMD
48% Voted in 2018 elections
WILLINGNESS AND PLANNING FOR RETURN
Nearly all IDPs seem to have the key personal documents (96%) and
over half of households have the necessary property documents (58%),
which is the highest proportion of the assessed urban centres.45 The vast
majority of IDP households in Tikrit feel that they have sufficient infor-
mation about their area of origin (88%), and those that do not report a
lack of trust in the information they receive (60%) which is considerably
higher than the other assessed urban centres.
44 In order to assess main needs households were asked ‘Imagine for a moment that your household inherit a large sum of money. Please rank the three main items your household would use this money for (starting with 1 for the most important).’ The table shows the percentage of respondents that mentioned each option, but not the prioritization given to each option.
45 Proof of nationality, national ID and residential card are the top three documents reported missing by between 1 per cent and 2.5 per cent of households. All other types of documents are each missed by less than 1 per cent of HHs.
46 The highest is Tuz Khurmatu with 28 per cent.
47 Of those who own a house in the area of origin.
Just under half of all IDP households believe that livelihoods and living
conditions are better in their area of origin (47%). Around 68 per cent
own a house in their area of origin, and of those, 76 per cent have
their property documentation physically with them, which is the highest
proportion among all of the assessed urban centres. Of those who own a
house in their area of origin, 52 per cent report their house is destroyed
and 30 per cent that it is partially damaged and uninhabitable – with only
18 per cent of houses believed to be habitable.
Table 48. Conditions surrounding return
96% Have personal documentation
88% Have enough information on AoO
58% Have house documents
47% Owns a habitable house
12% Livelihoods and living conditions are better in the AoO
Almost all IDP households in Tikrit know people who have successfully
returned to their area of origin (93%). Tikrit has among the highest
proportion of IDP households that have made plans to return (26%).46
Tikrit also has the highest proportion of IDP households who have tried
to return once (35%) and one of the highest proportions of those who
have tried to return multiple times (21%). Over one third of IDP house-
holds have also checked conditions in their area of origin (37%).
Awareness of compensation programmes such as the CCCA was found
with 37 per cent of households. However, only 12 per cent of IDP house-
holds in Tikrit have applied for compensation.
Table 49. Planning for return
93% Know people who successfully returned
35% Tried to return once
26% Have made plans to return
21% Tried to return more than once
12% Have applied for compensation47
INTENTIONS AND PREFERRED DURABLE SOLUTION
Almost all IDP households in Tikrit consider themselves displaced (96%) and
over half of households expressed the intention to return (56%). Of those
that intend to return, Tikrit had the highest proportion of households that had
made plans to do so (46%). The most common actions of those with plans
was to check conditions in their area of origin (37%) and arrange accommo-
dation (15%). However, the timelines for return remain quite uncertain for
these households, with 25 per cent planning to leave in 6–12 months, 24
per cent in 1–2 years and 24 per cent undecided. With a further 15 per cent
reporting an intention to return within six months, it can be inferred that the
dynamic nature of Tikrit’s IDP population will continue into 2021 and beyond.

28
URBAN DISPLACEMENT IN FEDERAL IRAQ TIKRIT
Figure 14. Intentions of household, in the event that no obstacles are faced48
Table 50. Factors associated with area of origin
29% No housing
12% Lack of economic opportunities
11% Basic services unavailable/not adequate
7% Unstable security situation
4% Fear or trauma associated with return
1% Issues regarding access documents, security clearance
48 Respondent was asked ‘Imagine for a moment that you faced no obstacles to return or to remain in the current location: what would be your household’s preferred place to live in the future?’
Table 51. Factors associated with area of displacement
36% No financial means to return
16% Better economic opportunities
16% Better living conditions
11% Stable security situation
5% HH members in school
4% Health condition prevents HH from returning
3% Other
1% No transportation available for return
1% No obstacle
Map 11. Future intention per neighbourhood
41+56+2+1+C41%
56%
1%
Stay
Return
Move abroad
Undecided
2%
Hay AlDhubbat
Qadisya 2500 Area
HayAlziraa
Al-Muskarat
Hay Al AnwaaMahala 420
HayAl-Sikak
Al Baladiyat-402
HayAl-Tajneed
HayAl Zuhour-422
Hay Aldiuom
Hay AlAsry Al Jadid-404
Hay Alqalaa
Qadisya 1Mahala 214
Hay AlMualimeen-406
HayAlarbaen
Hay Alfirdous
Hay SalmaAltaghlubia
Qadisya 2Mahala 216
Al-Mutaradah204
Hay SheshenMahal 408
Intention of the majority of IDPsin the neighborhood
Return
Stay

29
URBAN DISPLACEMENT IN FEDERAL IRAQ TIKRIT
FACTORS AFFECTING THE INTENTIONS OF DISPLACED URBAN POPULATIONS
The gender of the household head does appear to impact intentions, with male-headed households considerably more likely to intend to return (61%) compared with female-headed households (37%). While not all households opted to provide their ethno-religious affiliation, among those that did, there was a slight preference for intending to return among Arab Sunni Muslims (56%). Among the top three districts of origin, only Al-Shirqat had a majority of households that intended to stay in their area of displacement. A similar preference for staying was expressed by households that had
been displaced prior to 2014, suggesting a rootedness to their area of displacement from protracted displacement. Multiple displacements also seem to affect intentions, with 59 per cent of households who had been displaced more than once intending to return, compared with 36 per cent who had been displaced once only. Households that had tried to return more than once were considerably more likely to intend to return (69%) compared with those that had never attempted return (51%) and those that had attempted once (56%).
Figure 15. Factors affecting intentions
Sex of HoHH
Male
Female
Arab Sunni
Turkmen Shia
District of origin
Baiji
Al-Shirqat
Tikrit
Previous displacementprior to 2014
No
Tried to return
Never
At least once
More than once
Still considersthemselvesto be displaced
No
Yes
Displacement
Once
More than once
37%
56%
64%
51%
45%
36%
59%
61%
41%
34%
43%
46%
55%
57%
64%
38%
100%
57%
55%40% 3%
40%
2%
2%
1% 1%
58%42%
58%39% 2% 1%
2% 1%
2% 1%
2% 1%
Yes 28%72%
2%
69%31%
Ethno-religiousaffiliation
61%36% 2% 1%
1%
ReturnStay Move within Iraq Undecided Move abroad

30
GENERAL CONTEXT49
Displaced individuals 17,136
Displaced households 2,856
Neighborhoods hosting IDPs 8
IDP to host population ratio 14.31
Of the urban centres assessed in Federal Iraq, Tuz Khurmatu has one
of the highest IDP to host population ratios at 14.31.50 The city hosts
17,136 IDPs (approximately 2% of the total out-of-camp displaced pop-
ulation nationwide). Around 65 per cent of Tuz Khurmatu’s IDP popula-
tion is concentrated in three neighbourhoods, namely Hay Al Taiyar, Hay
Al Askari and Hay Komari. The rest of the displaced population is spread
evenly among the remaining neighbourhoods.
Recipient of out of camp IDPs
2% of total out-of-camp IDPs
Low Recipient
Medium Recipient
High Recipient
49 Population figures as of August 2020
50 The highest nationwide is Zakho town with 15.69.
51 For more information on Tuz district, see the 2019 report ‘Reasons to Remain: An In-Depth Analysis of the Main Districts of Origin’.
Rate of change in IDP population
-15% IDPs (August 2019 - August 2020)
Stationary
Fairly Stationary
Fairly Dynamic
Dynamic
Districts of origin
94% Tuz
1% Al Khalis
1% Kifri
1% Hawiga
1% Samarra
1% Tikrit
Homogeneous
Fairly Homogeneous
Heterogeneous
Ethno-religious composition
80% Arab Sunni
15% Turkmen Sunni
1% Kurd Sunni
1% Turkmen Shia
Homogeneous
Fairly Homogeneous
Heterogeneous
Map 12. IDP locations and population concentration
The displacement situation in Tuz Khurmatu is fairly stationary with a 15 per cent decrease in the IDPs population within the city since August 2019. The majority of IDPs in the city of Tuz Khurmatu are from the surrounding Tuz Khurmatu district (94%). In a previous assessment of districts of origin,51 it was found that five locations in Tuz Khurmatu district (out of 48 locations assessed) had severe housing destruction with more than half of all houses destroyed. Tuz Khurmatu district is also diverse in terms of ethno-religious composition, with concerns over tensions and revenge acts reported in two thirds of all locations in the district. The ethno-religious composition of the IDP population in the city of Tuz Khurmatu is predominantly Arab
Sunni (80%). The second most common affiliation is Turkmen Sunni (15%). In the same assessment, movement restrictions were also reported in all locations, with several locations reporting the presence of up to six different security forces operating. The majority of IDP households interviewed in this assessment identified the security situation as one of the best aspects of living in Tuz Khurmatu compared with their intra-district area of origin, with other service and livelihood related factors also cited. As the vast majority of the displaced population originate from Tuz Khurmatu district, there may be a perception that urban life affords greater protection from certain security
threats compared with more rural areas.
HayRizgari-114
MarkazTooz-Hay Al
Askari
Markaz Tooz-HayAl Taiyar 122
MarkazTooz-Hay
Brayati
Tooz-HayAl Teen
Hay Al SideeqMahalla 105
HayGarmian
HayKomari-120
Density of IDP population per neighbourhood
438 - 780
781 - 2,226
2,227 - 5,004
URBAN DISPLACEMENT
TUZ KHURMATU

31
URBAN DISPLACEMENT IN FEDERAL IRAQ TUZ KHURMATU
Table 52. Best aspects of living in current location, compared to the area of origin
74% Good security situation
42% Functioning health-care services
39% No restrictions on freedom of movement, internal movement
34% A better house
34% Functioning schools
22% Money/financial resources/a job/means of livelihood generation
21% Affordable cost of living
12% Relatives or friends that can offer support
12% Psychosocial care
3% Support reconciling with the community
VULNERABILITY FACTORS AND SOCIO-DEMOGRAPHIC COMPOSITION
Average HH size 7 individuals
Male to female ratio 101
Dependency ratio 125
The potentially active population in Tuz Khurmatu (aged 18–59 years) make
up 37 per cent of the total population, which results in a dependency ratio
of 125. School-aged children account for just over a third of the total IDP
population (37%) and, considering that nearly all households have been
displaced for more than five years, an estimated 13 per cent of the popu-
lation were born in displacement. The household size in Tuz Khurmatu is
slightly larger than the average at seven members. The head of the house-
hold is on average 46 years old, which is the same for male and female
heads of household.
Figure 16. Sex and age of displaced population
Protracted displacement affects almost all IDP households in Tuz Khurmatu
(99%). Female-headed households make up 24 per cent of the population
and single female-headed households represent 10 per cent of the popu-
lation. Around one in three households have been displaced multiple times
(33%), which is comparatively low and perhaps reflects the high degree
of intra-district displacement in Tuz Khurmatu district.
Table 53. Vulnerability profile
99% HHs in protracted displacement
33% HHs who experienced multiple displacement
24% Female HoHHs, 10% of which are ‘alone’
20% HHs with members with functional difficulties
6% HHs who were displaced before 2014
LIVELIHOODS
Just over half of all IDP households in Tuz Khurmatu reported that they
can afford to meet basic needs (55%), and a similar proportion can rely
on the head of household to be working (56%) and have a stable source
of income among their top three income sources (54%). However, only
19 per cent of households consider their situation to be better or the
same as before displacement, which is the lowest proportion of any of
the assessed urban centres.
Tuz Khurmatu is similar to other urban centres in Federal Iraq in that the
IDP population relies on informal commerce or daily wage labour as a
primary source of income (50%), followed by public sector employment
(26%) and pensions (18%). Female or older heads of household are more
likely to rely on pension income as a main source of income. Six per cent
of IDP households in Tuz Khurmatu are over 60 years old, which may
explain why IDP households in Tuz Khurmatu report the highest reliance
on pension income in the assessed Federal Iraq urban centres.
When asked how they would use additional financial resources, IDP
households in Tuz Khurmatu reported the need to support extended
family (43%), repay debts (41%), seek medical care (37%) and pay for a
new shelter (35%). The support to extended family is by far the highest
reported among other urban centres, most likely as a result of the high
rate of intra-district displacement in Tuz with family networks displacing
and clustering together.
Table 54. Livelihoods profile
56% HoHH is working
55% HHs able to meet basic needs
54%HHs who have a stable source of income among the top three income sources
19% HHs whose situation is better or the same as before
8% HHs living in owned house
Table 55. Main sources of income
50% Informal commerce or daily labour
26% Paid job (public sector)
18% Pension
15% Other
14% Money from family/friends inside Iraq
12% Borrowing money from friends or family
12% Own business
6% Paid job (private sector)
3% Cash/grants or aid from national institutions
2% Government assistance, including compensation
2% Agriculture/farming/herd animal raising
1% No source of income
1% Money from family/friends outside Iraq
1% Cash/grants or aid from international institutions
100+100+100+1006+19+22+3 100+100+100+1007+18+22+3Male Female
6% Under 5 7%
19% School aged children (5-17 years) 18%
22% Active population (18-59 years) 22%
3% Older people (60+ years) 3%

32
URBAN DISPLACEMENT IN FEDERAL IRAQ TUZ KHURMATU
Table 56. Primary needs52
43% Supporting extended family
41% Repaying debts
37% Medical care
37% Repairing house in area of origin
35% Shelter - pay for new shelter
29% Commercial or livelihood activity
24% Education
23% Food
11% Repairing my house of current residence
10% Clothing
6% Investment
2% Assisting others
SAFETY AND SOCIAL INCLUSION IN CURRENT LOCATION
IDP households in Tuz Khurmatu report a peaceful coexistence with
the host community, with 89 per cent comfortable seeking help from
local authorities and 99 per cent having never suffered discrimination.
However, nearly a third of households in Tuz Khurmatu reported feeling
unsafe (33%), a concerning outlier worthy of further investigation. Eighty
per cent of IDP households have registered with MoMD and 81 per
cent voted in the 2018 elections. Of those who did not vote, 51 per
cent reported difficulty travelling to their polling station. Among those
who did not vote, lack of faith and interest in the political system was
comparatively low (28%).
Table 57. Safety and social inclusion
99% Have not suffered discrimination
89% Would feel comfortable to seek help from local authorities
81% Voted in 2018 elections
80% Registered with MoMD
67% Feel completely safe
WILLINGNESS AND PLANNING FOR RETURN
Nearly all IDPs seem to have the key personal documents (91%).53 The
vast majority of IDP households in Tuz Khurmatu feel that they have
sufficient information about their area of origin (90%), and those who do
not, report a lack of access (47%) or knowledge of where to look (31%).
Just under half of all IDP households believe that livelihoods and living
conditions are better in their area of origin (40%). Around 65 per cent
own a house in their area of origin, and of those, 19 per cent have the
necessary property documentation, which is the lowest proportion
52 In order to assess main needs households were asked ‘Imagine for a moment that your household inherit a large sum of money. Please rank the three main items your household would use this money for (starting with 1 for the most important).’ The table shows the percentage of respondents that mentioned each option, but not the prioritization given to each option.
53 Proof of nationality, national ID and residential card are the top three documents reported missing by between 1 per cent and 2.5 per cent of households. All other types of documents are each missed by less than 1 per cent of HHs.
54 Of those who own a house in the area of origin.
among all of the assessed urban centres. Of those who own a house in
their area of origin, 66 per cent report their house is destroyed and 28
per cent that it is partially damaged and uninhabitable – with only 3 per
cent of households believing their house to be habitable.
Table 58. Conditions surrounding return
91% Have personal documentation
90% Have enough information on AoO
40% Livelihoods and living conditions are better in the AoO
19% Have house documents
3% Owns a habitable house
A little over half of IDP households in Tuz Khurmatu know people who
have successfully returned to their area of origin (58%). A significant
proportion of IDP households have tried to return once (34%) and Tuz
Khurmatu has the highest proportion of households who have tried
to return multiple times (32%). This legacy of failed returns potentially
contributes to the fact that Tuz Khurmatu has the highest proportion of
IDP households who have made plans to return (39%), as well as house-
holds who have checked the conditions in their area of origin (52%).
Awareness of compensation programmes such as the CCCA was found
in 38 per cent of households, which drops among IDPs who own a house
(31%). However, only 7 per cent of IDP households in Tuz Khurmatu
have applied for compensation.
Table 59. Planning for return
58% Know people who successfully returned
39% Have made plans to return
34% Tried to return more than once
32% Tried to return once
7% Have applied for compensation54
INTENTIONS AND PREFERRED DURABLE SOLUTION
Almost all IDP households in Tuz Khurmatu consider themselves displaced
(97%) and the city has the highest rate of households with the intention to
return of all assessed urban centres (72%). The most common actions of
those with plans to return was to check conditions at their area of origin
(52%) and to make arrangements with friends, family and community
members (4%). However, the timelines for return remain quite distant for
these households, with 21 per cent planning to leave in 1–2 years, 26 per
cent in longer than two years and 45 per cent undecided. From this it can
be inferred that the fairly stationary nature of Tuz Khurmatu’s IDP popula-
tion will continue into 2021 and beyond, should present conditions remain.

33
URBAN DISPLACEMENT IN FEDERAL IRAQ TUZ KHURMATU
Figure 17. Intentions of household, in the event that no obstacles are faced55
For IDP households who reported an intention to return, the lack of
basic services in the area of origin was the most commonly reported
obstacle (46%), in addition to an unstable security situation in the area
of origin (46%) and a perceived lack of economic opportunities (21%).
Obstacles to return include the lack of financial means to return
(54%), but also positive conditions in Tuz Khurmatu, for example
31 per cent of households cited economic opportunities in Tuz
Khurmatu, 24 percent cited better living conditions and 17 per cent
of households with children in schools.
55 Respondents were asked ‘Imagine for a moment that you faced no obstacles to return or to remain in the current location: what would be your household’s preferred place to live in the future?’
Table 60. Factors associated with area of origin
46% Basic services unavailable/not adequate
45% Unstable security situation
21% Lack of economic opportunities
15% No housing
8% Issues regarding access documents, security clearance
3% Fear or trauma associated with return
2% Prevented from returning
Table 61. Factors associated with area of displacement
54% No financial means to return
31% Better economic opportunities
24% Better living conditions
17% HH members in school
12% Stable security situation
1% No transportation available for return
1% Health condition prevents household from returning
1% Tribal and reconciliation issues
Map 13. Future intention per neighbourhood
26+72+1+1+C26%
72%
1%
Stay
Return
Move to a third location in Iraq
Undecided
1%
HayRizgari-114
MarkazTooz-Hay Al
Askari
Markaz Tooz-HayAl Taiyar 122
MarkazTooz-Hay
Brayati
Hay Al SideeqMahalla 105
HayGarmian
HayKomari-120
Tooz-HayAl Teen
Intention of the majority of IDPsin the neighborhood
Return

34
URBAN DISPLACEMENT IN FEDERAL IRAQ TUZ KHURMATU
FACTORS AFFECTING THE INTENTIONS OF DISPLACED URBAN POPULATIONS
The gender of the household head does appear to impact intentions, with male-headed households considerably more likely to intend to return (61%) compared with female-headed households (38%). While not all households opted to provide their ethno-religious affiliation, among those that did, there was a slight preference for intending to return among Arab Sunni Muslims (56%). Among the top three districts of origin, only Al-Shirqat had a majority of households that intended to stay in their AoD. A similar preference for
staying was expressed by households that had been displaced prior to 2014, suggesting a rootedness to their AoD from protracted displacement. Multiple displacements also seem to affect intentions, with 59 per cent of households who had been displaced more than once intending to return, compared with 36 per cent who had been displaced once only. Households that had tried to return more than once were considerably more likely to intend to return (69%) compared with those that had never attempted return (51%) and those that had attempted once (56%).
Figure 18. Factors affecting intention
Sex of HoHH
Male
Female
Arab Sunni
Kurd Sunni
District of origin
Tuz Khurmatu
Al-Khalis
Kifri
Previous displacementprior to 2014
No
Tried to return
Never
At least once
More than once
Still considersthemselvesto be displaced
No
Yes
Displacement
Once
More than once
66%
75%
40%
58%
40%
74%
68%
34%
23%
17%
40%
39%
24%
29%
Turkmen Sunni
Turkmen Shia 67% 33%
83%
3%
79%21%
60%
1%
1%
20%
73%25% <1% 1%
73%25% 1% 1%
Yes 57%33% 10%
79%18% 3%
1%
2%
Ethno-religiousaffiliation
74%23% 1% 2%
ReturnStay Move within Iraq Undecided Move abroad
50% 50%
73%25% 1% 1%
1% 1%
28% 72%

© 2021 International Organization for Migration (IOM)
No part of this publication may be reproduced, stored in a retrieval system, or transmitted in any form or by any means, electronic, mechanical, photocopying, recording or otherwise without the prior written permission of the publisher.
IOM IRAQ
iraq.iom.int
[email protected] @IOMIraq
UNAMI Compound (Diwan 2), International Zone,
Baghdad/Iraq