Levels of Organic Pollution Indicators in Groundwater at the ...
22
applied sciences Article Levels of Organic Pollution Indicators in Groundwater at the Old Landfill and Waste Management Site Eugeniusz Koda, Anna Miszkowska and Anna Sieczka * Department of Geotechnical Engineering, Faculty of Civil and Environmental Engineering, Warsaw University of Life Sciences, Nowoursynowska 159 St., 02-776 Warsaw, Poland; [email protected] (E.K.); [email protected] (A.M.) * Correspondence: [email protected]; Tel.: +48-22-593-5222 Academic Editor: Samuel B. Adeloju Received: 19 May 2017; Accepted: 16 June 2017; Published: 20 June 2017 Abstract: The aim of this paper was to assess groundwater quality in a landfill and waste management site, with special regard to levels of organic pollution indicators: chemical oxygen demand (COD), biochemical oxygen demand (BOD), and total organic carbon (TOC). Analysis of specific indicators was conducted for piezometers located in the area of the Radiowo landfill, the composting plant and the facilities adjacent to the landfill. The article discusses the temporal and spatial changes of selected organic pollution indicators. Based on the results of groundwater monitoring, several maps of COD, BOD and TOC areal distribution were provided. Statistical distribution of monitoring data was presented using box-and-whisker plots. Pearson’s correlation coefficients between selected pollution indicators were measured with a significance level set at p < 0.01 and p < 0.05. The strongest correlation was observed between BOD and COD. The maximum BOD/COD ratio was observed at the level of 1.561 before the closure of the vertical barrier, whereas, at present, average values of this ratio are below 0.18. The results indicate significant improvement of groundwater quality in the landfill site after the closure of the vertical barrier. In particular, this refers to BOD values, which decreased even 160 times in the 1998–2016 monitoring period. Keywords: landfill; pollution; monitoring; biochemical oxygen demand; chemical oxygen demand; total organic carbon 1. Introduction Nowadays, landfilling is the most common practice of waste disposal all over the world [1,2]. In 2015, a total of 10.9 million tons of municipal solid wastes were collected in Poland, of which 44.3% were landfilled in 347 operating landfills [3]. Landfill leachate is considered the main source of groundwater and surface water contamination. In recent decades, the influence of leachates on water resources has attracted a lot of attention because of its high environmental significance [4,5]. Leachates mainly contain immense amounts of organic matter, ammonium, heavy metals, and salts [6–8]. According to Christensen et al. [1], the components of leachates can be subdivided into the following groups: organic matter expressed as chemical oxygen demand (COD) and total organic carbon (TOC), specific organic compounds, inorganic compounds, and heavy metals. Leachates are commonly characterized by high chemical and biochemical oxygen demand values (COD and BOD, respectively) that reflect concentrations of soluble organic matter. The organic composition of leachates is variable depending on the characteristics of the landfilled wastes, age of the landfill or climatic conditions [8,9]. Appl. Sci. 2017, 7, 638; doi:10.3390/app7060638 www.mdpi.com/journal/applsci
-
Upload
khangminh22 -
Category
Documents
-
view
0 -
download
0
Transcript of Levels of Organic Pollution Indicators in Groundwater at the ...

applied sciences
Article
Levels of Organic Pollution Indicators inGroundwater at the Old Landfill and WasteManagement Site
Eugeniusz Koda, Anna Miszkowska and Anna Sieczka *
Department of Geotechnical Engineering, Faculty of Civil and Environmental Engineering,Warsaw University of Life Sciences, Nowoursynowska 159 St., 02-776 Warsaw, Poland;[email protected] (E.K.); [email protected] (A.M.)* Correspondence: [email protected]; Tel.: +48-22-593-5222
Academic Editor: Samuel B. AdelojuReceived: 19 May 2017; Accepted: 16 June 2017; Published: 20 June 2017
Abstract: The aim of this paper was to assess groundwater quality in a landfill and waste managementsite, with special regard to levels of organic pollution indicators: chemical oxygen demand (COD),biochemical oxygen demand (BOD), and total organic carbon (TOC). Analysis of specific indicatorswas conducted for piezometers located in the area of the Radiowo landfill, the composting plantand the facilities adjacent to the landfill. The article discusses the temporal and spatial changesof selected organic pollution indicators. Based on the results of groundwater monitoring, severalmaps of COD, BOD and TOC areal distribution were provided. Statistical distribution of monitoringdata was presented using box-and-whisker plots. Pearson’s correlation coefficients between selectedpollution indicators were measured with a significance level set at p < 0.01 and p < 0.05. The strongestcorrelation was observed between BOD and COD. The maximum BOD/COD ratio was observedat the level of 1.561 before the closure of the vertical barrier, whereas, at present, average values ofthis ratio are below 0.18. The results indicate significant improvement of groundwater quality in thelandfill site after the closure of the vertical barrier. In particular, this refers to BOD values, whichdecreased even 160 times in the 1998–2016 monitoring period.
Keywords: landfill; pollution; monitoring; biochemical oxygen demand; chemical oxygen demand;total organic carbon
1. Introduction
Nowadays, landfilling is the most common practice of waste disposal all over the world [1,2].In 2015, a total of 10.9 million tons of municipal solid wastes were collected in Poland, of which 44.3%were landfilled in 347 operating landfills [3].
Landfill leachate is considered the main source of groundwater and surface water contamination.In recent decades, the influence of leachates on water resources has attracted a lot of attention becauseof its high environmental significance [4,5]. Leachates mainly contain immense amounts of organicmatter, ammonium, heavy metals, and salts [6–8]. According to Christensen et al. [1], the componentsof leachates can be subdivided into the following groups: organic matter expressed as chemical oxygendemand (COD) and total organic carbon (TOC), specific organic compounds, inorganic compounds,and heavy metals. Leachates are commonly characterized by high chemical and biochemical oxygendemand values (COD and BOD, respectively) that reflect concentrations of soluble organic matter.The organic composition of leachates is variable depending on the characteristics of the landfilledwastes, age of the landfill or climatic conditions [8,9].
Appl. Sci. 2017, 7, 638; doi:10.3390/app7060638 www.mdpi.com/journal/applsci
Appl. Sci. 2017, 7, 638 2 of 22
In order to protect the natural environment from leachates, each landfill must be properly secured,for example by using artificial sealing based on cohesive soil liners [8]. Municipal landfills containa high content of organic wastes, with great impact on the biogeochemical processes in the landfillbody and leachate generation with a substantial content of ammonium, dissolved organic carbon andorganic compounds [9].
It is important to stress that the content of organic matter affects the level of dissolved oxygen andcan be determined by measurements of the biochemical oxygen demand (BOD) and chemical oxygendemand (COD). The BOD is also used as a value to indicate the leachate “quality”.
In cases when leachate is discharged directly into a watercourse, it will absorb oxygen fromthe water to complete its decomposition. As a result, the level of oxygen in water may fall belowa minimum supporting aquatic life [10].
Because of the decomposition of organic matter, leachate derived from landfills comprisesprimarily dissolved organic carbon [11]. The solubility of organic contaminants in wastes can beslightly enhanced through the presence of high levels of organic carbon in the leachate [12].
The composition of landfill leachate varies over time. Leachates generated during the early stagesof anaerobic degradation are characterized e.g., by high BOD values and a high BOD/COD ratio.According to Getinby [13], BOD values are the highest in the first five years of landfill operation anddecrease with time (for example BOD equal to 2000 mg O2/L after five years and BOD equal to 70 mgO2/L after 40 years of landfill operation). Similarly, five-year leachates are characterized by a CODvalue at a level of 8000 mg O2/L, but, after 30 years, this value decreases to 500 mg O2/L.
BOD and COD indicators have a significant meaning in environmental studies because of theirability to indicate the pollutant strength of polluted water [14,15].
In recent years, the impact of landfills on groundwater quality has enhanced numerous studiesrelating to the assessment of the soil-water environment near landfills and waste managementfacilities [6,16–24].
Owing to the fact that groundwater quality within the landfill site should be controlled bya monitoring system based on a network of piezometric wells and sampling points located alongsurface streams near the landfills, this study focuses on detailed analyses using data from a monitoringperiod of almost 20 years (1998–2016).
The principal aim of this paper is to evaluate the impact of the landfill and the waste managementfacilities on the groundwater quality within the landfill site. With particular emphasis on the extentof groundwater contamination by organic substances, concentrations of BOD, COD and TOC weredetermined in the collected samples. This can complete and add additional information to Radiowolandfill monitoring data results which have been published [21]. An attempt was also made to answerthe following questions: (1) “Is groundwater quality significantly affected by leachate percolation fromthe landfill?” (2) “Does a vertical barrier limit the spread of pollutants to the soil-water environment?”
2. Materials and Methods
2.1. Site Characteristics
The Radiowo Landfill (52◦16′47.80” N, 20◦52′45.30” E) is located partly in the Stare Babicecommune and partly in Warsaw, the capital of Poland (Figure 1). It covers an area of ca. 16.2 ha and itselevation is almost 60 m. From the north, the landfill lies adjacent to a composting plant and a wastetreatment plant located in the Warsaw–Bielany District.
A Mechanical-Biological Treatment (MBT) installation located in the study area was built in2012–2014 as a result of the reconstruction of the former compost plant, which operated on the DANOtechnology. The area of the MBT installation covers almost 10 ha. The composting plant is situatedon the western side from the railway siding and since 2013 has been working as an element of theRegional Municipal Waste Treatment Installation. The basic role of this installation is the production ofa stabilat, which contains a reduced content of organic fraction and can be disposed on non-hazardous
Appl. Sci. 2017, 7, 638 3 of 22
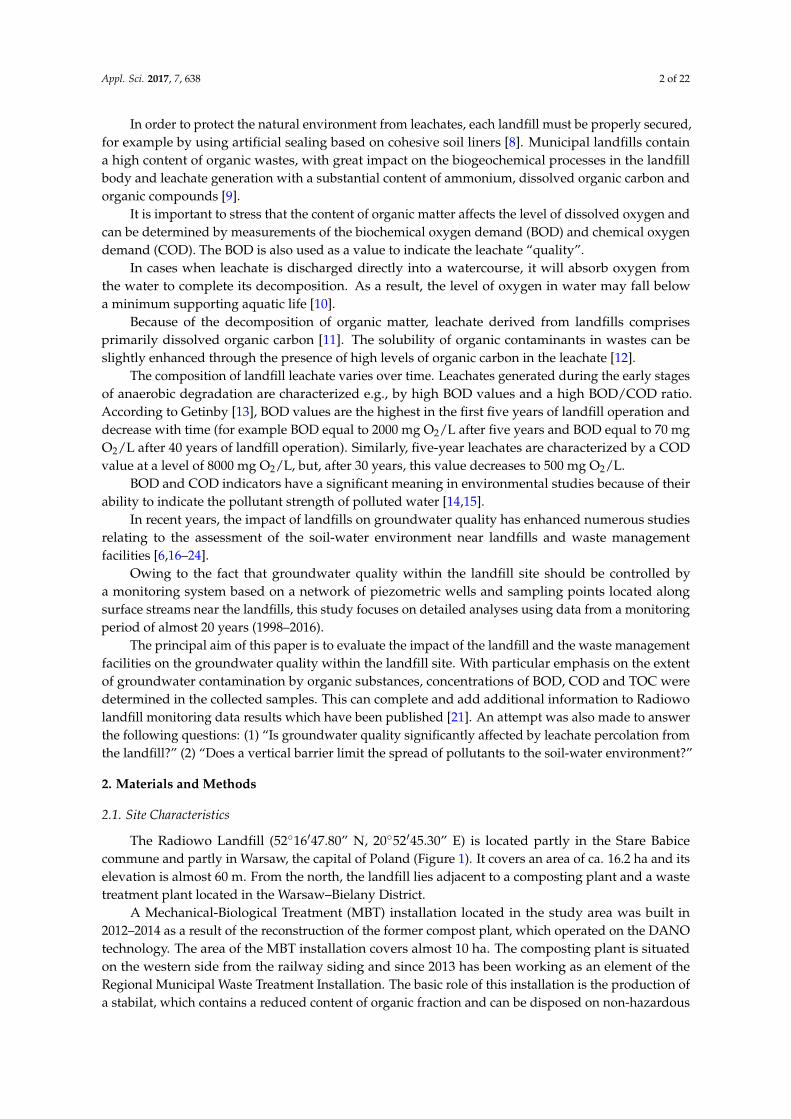
and inert waste landfills. The capacity of this installation, measured as the mass of mixed processedwastes, is approximately 1000 tons per day. From the south and east, the landfill is surrounded bythe Forest Park “Bemowo” and two Nature Reserves (Kalinowa Łaka and Łosiowe Błota). To thewest occurs a railway siding, and industrial and service facilities. A paved storage yard is located ca.200 m from the toe of the landfill slope, and to the northwest lies a fuel storage base. The ZaborowskiCanal watercourse (connected with the Lipkowska Woda stream) occurs to the north from the landfill,at a distance of about 350 m from the composting plant (400 m from the landfill). The area of theKampinos National Park is situated approximately 3 km to the northwest of the Radiowo landfill [21].
Appl. Sci. 2017, 7, 638 3 of 22
Błota). To the west occurs a railway siding, and industrial and service facilities. A paved storage yard is located ca. 200 m from the toe of the landfill slope, and to the northwest lies a fuel storage base. The Zaborowski Canal watercourse (connected with the Lipkowska Woda stream) occurs to the north from the landfill, at a distance of about 350 m from the composting plant (400 m from the landfill). The area of the Kampinos National Park is situated approximately 3 km to the northwest of the Radiowo landfill [21].
Figure 1. Location of the study area in relation to protected areas.
From 1962 to 1991, the Radiowo landfill was a disposal site for the municipal wastes from Warsaw. Since 1992, only non-composted wastes from the Radiowo compostory plant are stored on the landfill, and, since 2012, only waste from the MBT installation is stored there. Since 1994, remedial works have been carried out on the landfill site, including forming and planting of slopes, reinforcement of their stability, clay mineral capping, construction of a bentonite cut-off wall, peripheral drainage, and installation of a leachate re-circulation system.
A vertical barrier was designed to minimize the spread of pollutants to the groundwater system. This construction provides favorable hydraulic conditions by forcing a lowered groundwater level inside the peripheral cut-off wall in relation to the natural water level around the landfill site [25].
2.2. Geological and Hydrogeological Conditions
The landfill subsoil consists of sandy soils with a thickness of 2–15 m. The upper part is represented by dense sands underlain by well-graded sands. The first groundwater level is at the depth 0.3–2 m below the surface level and its fluctuations depend on the weather and the local drainage conditions.
The deeper part of the subsoil consists of low permeable boulder and varved clays (thickness 25–40 m, average permeability coefficient at 10−9 m/s). Drillings have revealed the occurrence of fluvioglacial sands on the south and southwestern side of the vertical barrier, and boulder clays in the remaining sections of the barrier. These deposits occur on glaciotectonic landforms composed of Pliocene clays. Due to the differentiation of soils occurring in the soil profile, the subsoil can be subdivided into five geotechnical layers (Table 1).
Figure 1. Location of the study area in relation to protected areas.
From 1962 to 1991, the Radiowo landfill was a disposal site for the municipal wastes from Warsaw.Since 1992, only non-composted wastes from the Radiowo compostory plant are stored on the landfill,and, since 2012, only waste from the MBT installation is stored there. Since 1994, remedial workshave been carried out on the landfill site, including forming and planting of slopes, reinforcement oftheir stability, clay mineral capping, construction of a bentonite cut-off wall, peripheral drainage, andinstallation of a leachate re-circulation system.
A vertical barrier was designed to minimize the spread of pollutants to the groundwater system.This construction provides favorable hydraulic conditions by forcing a lowered groundwater levelinside the peripheral cut-off wall in relation to the natural water level around the landfill site [25].
2.2. Geological and Hydrogeological Conditions
The landfill subsoil consists of sandy soils with a thickness of 2–15 m. The upper part isrepresented by dense sands underlain by well-graded sands. The first groundwater level is at thedepth 0.3–2 m below the surface level and its fluctuations depend on the weather and the localdrainage conditions.
The deeper part of the subsoil consists of low permeable boulder and varved clays (thickness25–40 m, average permeability coefficient at 10−9 m/s). Drillings have revealed the occurrence offluvioglacial sands on the south and southwestern side of the vertical barrier, and boulder clays inthe remaining sections of the barrier. These deposits occur on glaciotectonic landforms composedof Pliocene clays. Due to the differentiation of soils occurring in the soil profile, the subsoil can besubdivided into five geotechnical layers (Table 1).
Appl. Sci. 2017, 7, 638 4 of 22
Table 1. Main geotechnical characteristics of the subsoil.
Layer Soil IL or ID Stratigraphy ρ k
I clSa 0.4 Quaternary (Pleistocene) 2.1 9.2 × 10⁻⁶
II Sa 0.7 Quaternary (Pleistocene) 2.0 5 × 10⁻⁵
III saclSi/Cl 0.2 Quaternary (Pleistocene) 2.1 1.2 × 10⁻⁷
IV saCl 0.1 Quaternary (Pleistocene) 2.2 3 × 10⁻⁸
V Cl/saCl <0.25 Tertiary (Pliocene) 2.1 <10−9
Notes: IL: liquidity index (-), ID: density index (-), ρ: bulk density of soil (g/cm3), k: coefficient of permeability (m/s).
The groundwater flow direction is from the southeast to the northwest. Nevertheless, changes ingroundwater levels, the presence of drainage systems and linear embankments, surface development,and the shape of the landfill force local changes of the flow direction. Low hydraulic gradientsin the southern and eastern part of the area adjacent to the landfill result in very low velocity ofthe groundwater flow (inflow to the landfill). The influence of the vertical bentonite barrier on thegroundwater flow was modeled in our previous studies using the numerical modeling techniques [26].The FEMWATER model, using 3D finite elements method, was used to solve the issue of groundwaterflow described by Richard’s equation. According to that modeling studies, it was noticed thegroundwater level increase from approximately 0.25 m in the southern part to more than 0.75 min the north-western part of the landfill site. Small increase (ca. 0.2 m) of the groundwater level wasobserved in the area close to the south part of the landfill.
Flow velocity on the western side of the landfill (beyond the railway siding) is significantly higher.Along the outflow direction from the landfill, the velocity of groundwater flow in sandy soils is about5.8 × 10−7 m/s (for a hydraulic gradient at i = 10‰), but this value, as mentioned above, may undergochanges depending on the flow direction, and the hydrogeological and meteorological factors.
2.3. Technical Characteristics of the Vertical Barrier
The 0.6 m wide vertical barrier was installed at a depth of 2 m below the top of the clayey soils,at an average level of 3.5–22 m below the surface, which had resulted from the variable depths withregard to the top of the impermeable layer. The permeability coefficient for the cut-off wall is below10−9 m/s [19], making the subsoil environment practically impermeable. The characteristics of thevertical barrier are presented in Table 2.
Table 2. Characteristics of the vertical barrier.
Parameter Unit Value
Geometric ParametersThickness m 0.6
Length m 1687.2Minimum depth m 3.0
Mean depth m 8.6Maximum depth m 22.0
Lateral surface area m2 14529.8
Filtration ParametersPermeability coefficient after 28 days m/s 2.5 × 10⁻⁸
Permeability coefficient after 60 days m/s 1.0 × 10⁻⁹
Strength ParametersCompressive strength after 28 days MPa min. 0.53Compressive strength after 60 days MPa min. 0.91
2.4. Monitoring Network
The monitoring system of the landfill site includes three basic elements: (1) groundwater;(2) surface water; and (3) leachates. Shallow piezometers and one deep well were installed in the
Appl. Sci. 2017, 7, 638 5 of 22
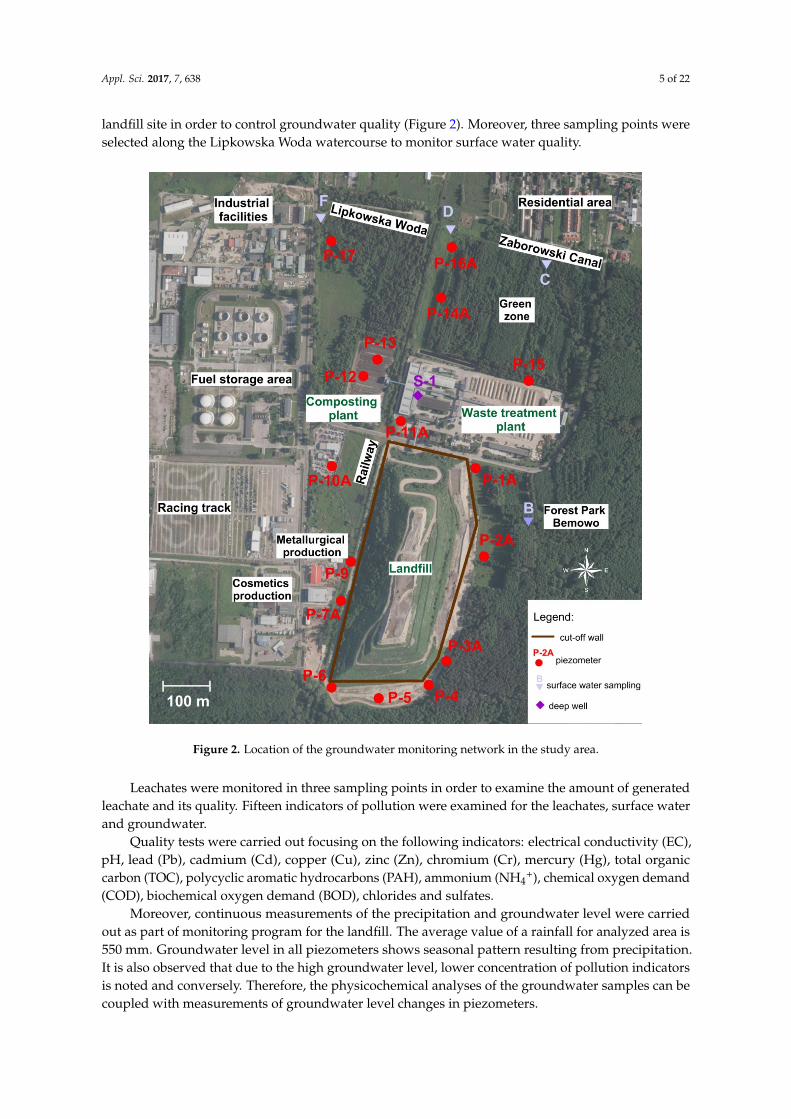
landfill site in order to control groundwater quality (Figure 2). Moreover, three sampling points wereselected along the Lipkowska Woda watercourse to monitor surface water quality.
Appl. Sci. 2017, 7, 638 5 of 22
Figure 2. Location of the groundwater monitoring network in the study area.
Leachates were monitored in three sampling points in order to examine the amount of generated leachate and its quality. Fifteen indicators of pollution were examined for the leachates, surface water and groundwater.
Quality tests were carried out focusing on the following indicators: electrical conductivity (EC), pH, lead (Pb), cadmium (Cd), copper (Cu), zinc (Zn), chromium (Cr), mercury (Hg), total organic carbon (TOC), polycyclic aromatic hydrocarbons (PAH), ammonium (NH4+), chemical oxygen demand (COD), biochemical oxygen demand (BOD), chlorides and sulfates.
Moreover, continuous measurements of the precipitation and groundwater level were carried out as part of monitoring program for the landfill. The average value of a rainfall for analyzed area is 550 mm. Groundwater level in all piezometers shows seasonal pattern resulting from precipitation. It is also observed that due to the high groundwater level, lower concentration of pollution indicators is noted and conversely. Therefore, the physicochemical analyses of the groundwater samples can be coupled with measurements of groundwater level changes in piezometers.
Figure 2. Location of the groundwater monitoring network in the study area.
Leachates were monitored in three sampling points in order to examine the amount of generatedleachate and its quality. Fifteen indicators of pollution were examined for the leachates, surface waterand groundwater.
Quality tests were carried out focusing on the following indicators: electrical conductivity (EC),pH, lead (Pb), cadmium (Cd), copper (Cu), zinc (Zn), chromium (Cr), mercury (Hg), total organiccarbon (TOC), polycyclic aromatic hydrocarbons (PAH), ammonium (NH4
+), chemical oxygen demand(COD), biochemical oxygen demand (BOD), chlorides and sulfates.
Moreover, continuous measurements of the precipitation and groundwater level were carriedout as part of monitoring program for the landfill. The average value of a rainfall for analyzed area is550 mm. Groundwater level in all piezometers shows seasonal pattern resulting from precipitation.It is also observed that due to the high groundwater level, lower concentration of pollution indicatorsis noted and conversely. Therefore, the physicochemical analyses of the groundwater samples can becoupled with measurements of groundwater level changes in piezometers.
Appl. Sci. 2017, 7, 638 6 of 22
The monitoring network of the Radiowo landfill consists of: piezometer P-2A located on theoutflow, to the east of the landfill; piezometers P-4 and P-6 located on the inflow (background), to thesoutheast of the landfill; piezometers P-7A, P-9, P-10A, P-11A, P-12 and P-17 located in the outflow;piezometers P-14A and P-15 located in the outflow, to the north from the composting area; and deepwell S-1 located in the compostory plant area. Monitoring studies are conducted quarterly and annualreports are submitted to the administrative bodies responsible for the environment-related issues.
2.5. Sampling and Experimental Analysis
Owing to the fact that about 30% of the monitoring results may be biased due to inappropriatesampling and sample transportation [27], all samples were collected with great care to eliminatepotential errors. Water samples were collected in accordance with the procedure outlined in EN ISO5667-3 [28] and ISO 5667-11 [29]. Before sampling, the top water in each piezometer was carefullypumped out. Calculations of the pumping time were based on the volume of water in each piezometerand the pump efficiency. To assure sampling appropriateness, each pumping was accompanied withsimultaneous measurements of pH, temperature and electrical conductivity. Groundwater sampleswere taken four times in each year (March, June, September and November).
Chemical analysis of COD, BOD and TOC were conducted according to PN-ISO 15705:2005P [30],PN-EN 1899-2:2002P [31] and PN-EN 1484:1999P [32], respectively. Additionally, the values of pH andEC were measured in accordance with the recommendations presented in PN-EN ISO 10523:2012 [33]and PN-EN 27888:1999 [34].
Analysis of changes of the pollution indicators was carried out in a temporal and spatial aspect.Graphs of BOD, COD and TOC concentrations were presented for piezometers located in the landfillarea, composting plant, and the adjacent service facilities. The obtained results were compared withthe groundwater quality standard presented in the Regulation of the Minister of the Environment ofPoland [35] (third class representing good groundwater quality).
2.6. Statistical Analysis
The monitoring data were analyzed using the Statistica 12.0 software package. Pearson’scorrelation coefficients (r) were calculated between each of the pollution indicator levels in groundwater,with a significance level set at p < 0.05 and p < 0.01. The purpose of the statistical analysis was topresent the existing correlations between pollution indicators with respect to the specific locations ofpiezometers from which the groundwater samples were taken. In order to display the entire statisticsof the dataset, box-and-whisker plots were used. The minimum, quartile 1 (25%), median, mean,quartile 3 (75%), and the maximum values were determined.
3. Results
3.1. Pollution Level in Groundwater Due to Localization of Piezometers
Based on the monitoring studies, the most vulnerable to contamination were the areas closest tothe landfill (0.5 km zone), mainly to the northwest and southwest. Monitoring results from piezometerP-2A, located at the outflow on the eastern slope of the landfill, indicate significant changes in thelevels of pollution indicators, in particular caused by organic waste storage. Slight increase of the TOClevel observed in this piezometer may be a result of its localization in a forest area. A similar trend inthe TOC level, caused by forest surroundings, was also noted in piezometer P-4.
Monitoring results from piezometer P-6A, localized in a local depression with periodicallystagnant water on the surface, show pollution concentrations exceeding the acceptable values for thethird water quality class. Exceeded values primarily refer to the TOC level, which can be regarded astypical of a forest area.
For piezometer P-7A, the most visible changes concern the COD level. Exceeded values of thisparameter result from its localization in an overgrown area.
Appl. Sci. 2017, 7, 638 7 of 22
A similar trend in the COD level changes is observed for the monitoring results from piezometerP-9, which is very much dependent on the putrefaction of vegetal remnants along the railway sidingsituated near to this piezometer. In the case of piezometer P-9, the fluctuations of some pollutantconcentrations (for example the TOC level) also result from its localization. Particular influence on theconcentration of selected pollution indicators has the nearest area where the production and servicefacilities are situated.
Higher concentration levels of contaminants in piezometer P-11A result from a local depressionwhere the piezometer is located. Because of this, water from the railway siding and the compostingarea can flow down easily to that point and directly cause groundwater pollution in this piezometer.
Fluctuations in the concentrations of pollution indicators (especially TOC) and exceeded standardsfor the third class of groundwater quality were also observed in piezometer P-12. The main reason forthis is runoff of contaminants from the composting plant area.
Groundwater in piezometer P-14A meets the standards for the third class of water quality.Only periodic fluctuations in TOC and COD concentrations may result from seasonal changes ofgroundwater level, which means that increased values of these parameters correspond to lowergroundwater levels.
Apart from the sporadic excesses above reference values, the TOC and COD concentrations ingroundwater from piezometer P-15 located in the area of the MBT installation comply with Polishstandards. Seasonal fluctuations of these indicators can be attributed to runoff from the compostoryplant and seasonal changes of groundwater level.
Seasonal changes in pollution indicator levels observed in groundwater from piezometer P-17are determined mainly by runoff of contaminants from Estrady St. and the industrial facilitieslocated nearby.
Based on the obtained results, it can be concluded that the concentrations of the analyzedparameters have decreased with the distance from the landfill, which can be linked to biodegradationand dilution.
A similar trend proving that concentrations of contaminants in groundwater decrease withincreased distance from the pollution source was presented by Ling and Zhang [23], Aderemi et al. [36]and Mor et al. [37].
Regarding the influence of precipitation on contaminant concentration we can also claim that theconcentrations are linked to the groundwater level which is mainly supplied by rainfall. According togroundwater level monitoring data (not presented in this article) it is noted that groundwater level inall piezometers show seasonal pattern. It should be noted that in accordance to high precipitation andresulting from this high groundwater level, lower concentration of indicators are observed.
3.2. Areal Distribution and Temporal Changes of Organic Pollution Indicators (BOD, COD, TOC)in Groundwater
3.2.1. Biochemical Oxygen Demand (BOD) in Groundwater
As presented by Hazelton and Murphy [38], typical BOD values are: 150–300 mg O2/L for rawsewage, 200–600 mg O2/L for storm water runoff from residential areas, and 20–30 mg O2/L fortreated sewage. Unpolluted natural waters are characterized by BOD values below 5 mg O2/L. It canalso be stated that a BOD level between 1 and 2 mg O2/L indicates very clean water, 3.0 to 5.0 mg O2/Lindicates moderately clean water and BOD > 5 mg O2/L indicates a nearby pollution source. At BODlevels of 100 mg O2/L or higher, the water supply is considered as very polluted with organic waste.
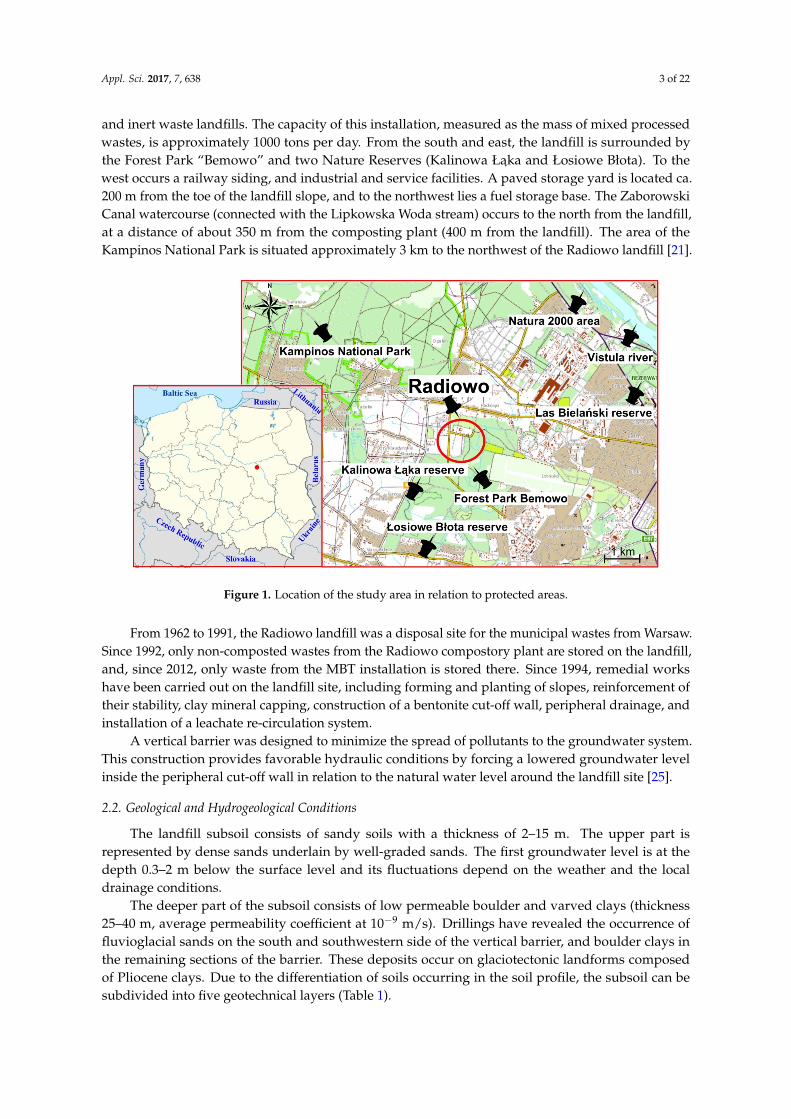
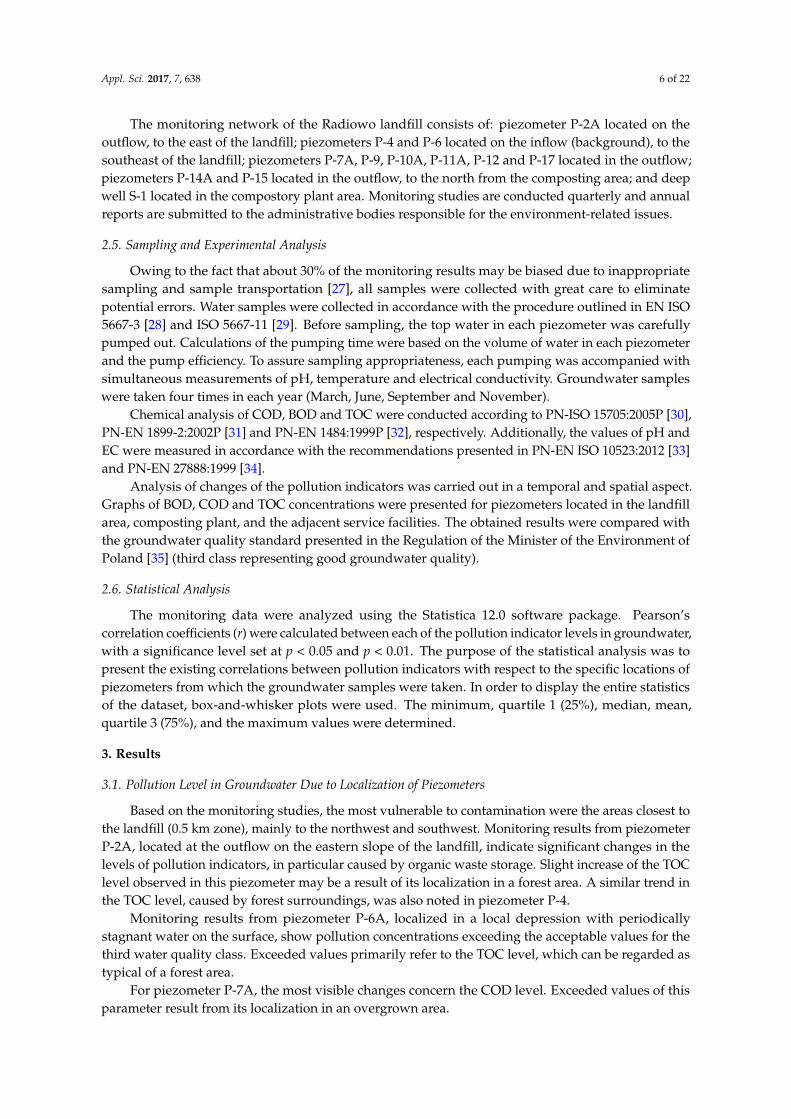
Monitoring data of BOD in groundwater show that two years before the closure of the verticalbarrier, the BOD values exceeded 500 mg O2/L in some parts of the monitored area (Figure 3). Suchhigh concentrations referred to the western and northern part of the landfill site, strictly surroundingpiezometers P-9, P-7 and P-11A. In the eastern part of the study area, the BOD concentrations were inthe range of 100–260 mg O2/L. As a result, it can definitely be stated that a large part of the study areawas at that time contaminated by organic compounds.
Appl. Sci. 2017, 7, 638 8 of 22Appl. Sci. 2017, 7, 637 8 of 23
Figure 3. Distribution of the mean values of the biochemical oxygen demand (BOD) in groundwater in 1998, 2004 and 2016. Figure 3. Distribution of the mean values of the biochemical oxygen demand (BOD) in groundwater in 1998, 2004 and 2016.

Appl. Sci. 2017, 7, 638 9 of 22
Worth emphasizing is the fact that, as compared to the survey outcomes from 1998, BODconcentrations were even seven times lower four years after the closure of the vertical barrier (2004).The highest concentrations of BOD recorded at that time in the monitored area did not exceed 70 mgO2/L, but still referred to the presence of organic contaminants in groundwater (Figure 3).
For actual monitoring data (2016), the results show a low BOD level (1.0–7.0 mg O2/L), whichmeans that groundwater has not been contaminated with fresh leachate. Increased values of BOD(6–7 mg O2/L) concentrations were measured only in the area of the composting plant and theMBT installation.
Similar results reporting low BOD concentrations in piezometers located at the landfill site werereported, for instance, by Ngang and Agbazue [15], Bandara and Hettiaratchi [39], and Sugirtharanand Rajendran [40]. As opposed to these examples, incomparably higher values of BOD were recordedat a municipal solid waste landfill site in Sri Lanka (BOD = 3590 mg O2/L) [41].
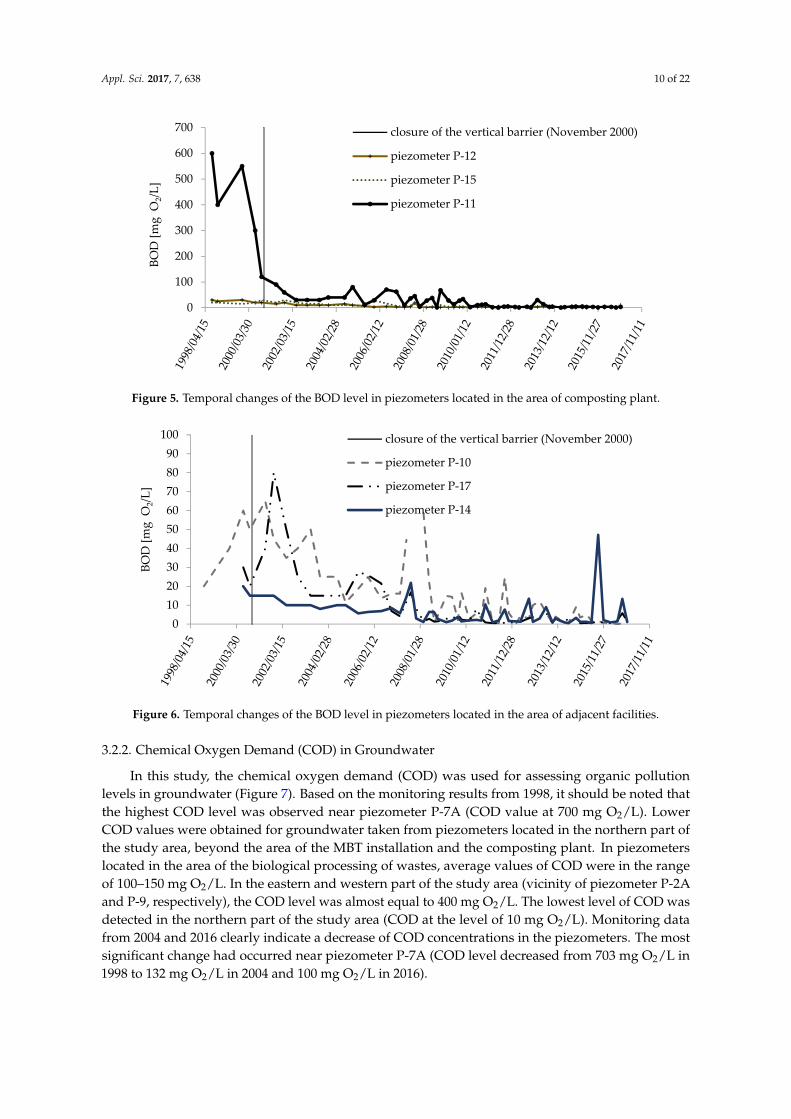
Additionally, valuable is observation of temporal changes of the BOD level from 1998 to 2016(Figures 4–6). Apart from the changes before the closure of the vertical barrier (November 2000),the monitoring data show stabilization with some exceptions in case of piezometers located in thearea of adjacent facilities. However, in piezometers P-10, P-17 and P-14, data show very low valuesso even some changes are acceptable and should not be disquieting. It is also worth emphasizingthat changes of pH can affect the microorganisms that consume the organic matter and then affectthe level of pollution caused by organic compounds. The microorganisms (their amount and activity)have the significant impact on BOD values. In the case, when the amount of microorganisms is small,the processes of biochemical breakdown do not occur or intensity of the biochemical breakdown isinsignificant. In natural conditions, such effect is often caused by the presence of toxic compounds(e.g., heavy metals) that adversely affect the enzymatic activity of the microorganisms. In that case,it must be considered that the changed values of BOD do not reflect the actual level of water pollution.
Appl. Sci. 2017, 7, 637 9 of 22
Worth emphasizing is the fact that, as compared to the survey outcomes from 1998, BOD concentrations were even seven times lower four years after the closure of the vertical barrier (2004). The highest concentrations of BOD recorded at that time in the monitored area did not exceed 70 mg O2/L, but still referred to the presence of organic contaminants in groundwater (Figure 3).
For actual monitoring data (2016), the results show a low BOD level (1.0–7.0 mg O2/L), which means that groundwater has not been contaminated with fresh leachate. Increased values of BOD (6–7 mg O2/L) concentrations were measured only in the area of the composting plant and the MBT installation.
Similar results reporting low BOD concentrations in piezometers located at the landfill site were reported, for instance, by Ngang and Agbazue [15], Bandara and Hettiaratchi [39], and Sugirtharan and Rajendran [40]. As opposed to these examples, incomparably higher values of BOD were recorded at a municipal solid waste landfill site in Sri Lanka (BOD = 3590 mg O2/L) [41].
Additionally, valuable is observation of temporal changes of the BOD level from 1998 to 2016 (Figures 4–6). Apart from the changes before the closure of the vertical barrier (November 2000), the monitoring data show stabilization with some exceptions in case of piezometers located in the area of adjacent facilities. However, in piezometers P-10, P-17 and P-14, data show very low values so even some changes are acceptable and should not be disquieting. It is also worth emphasizing that changes of pH can affect the microorganisms that consume the organic matter and then affect the level of pollution caused by organic compounds. The microorganisms (their amount and activity) have the significant impact on BOD values. In the case, when the amount of microorganisms is small, the processes of biochemical breakdown do not occur or intensity of the biochemical breakdown is insignificant. In natural conditions, such effect is often caused by the presence of toxic compounds (e.g., heavy metals) that adversely affect the enzymatic activity of the microorganisms. In that case, it must be considered that the changed values of BOD do not reflect the actual level of water pollution.
Figure 4. Temporal changes of the BOD level in piezometers located in the landfill area.
0
100
200
300
400
500
600
700
800
BOD
[mg
O2/L
]
closure of the vertical barrier (November 2000)
piezometer P-2A
piezometer P-9
piezometer P-7
Figure 4. Temporal changes of the BOD level in piezometers located in the landfill area.
Appl. Sci. 2017, 7, 638 10 of 22
Appl. Sci. 2017, 7, 637 10 of 22
Figure 5. Temporal changes of the BOD level in piezometers located in the area of composting plant.
Figure 6. Temporal changes of the BOD level in piezometers located in the area of adjacent facilities.
3.2.2. Chemical Oxygen Demand (COD) in Groundwater
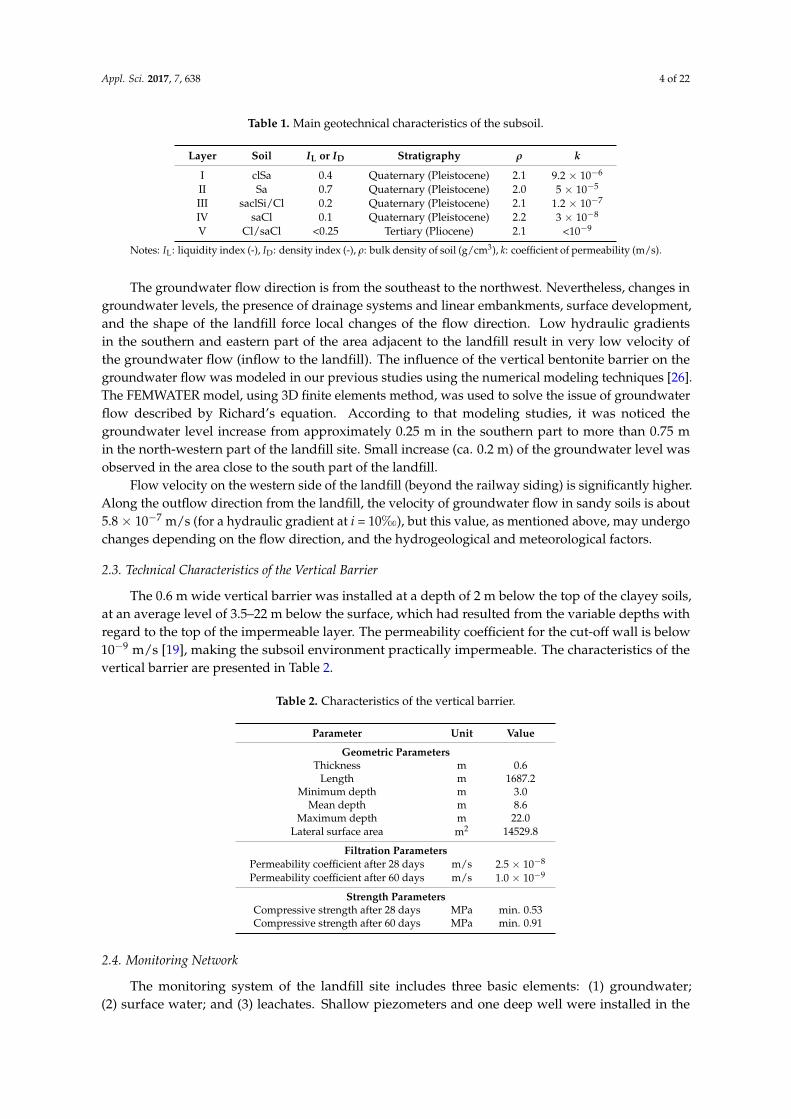
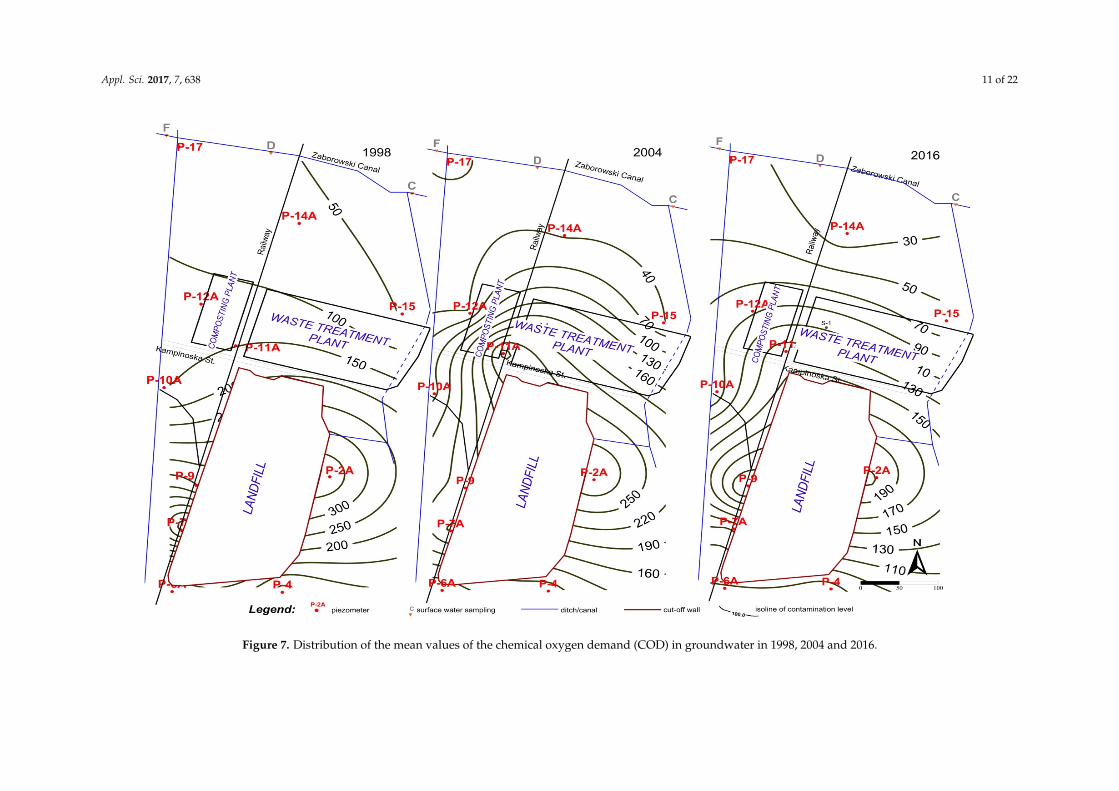
In this study, the chemical oxygen demand (COD) was used for assessing organic pollution levels in groundwater (Figure 7). Based on the monitoring results from 1998, it should be noted that the highest COD level was observed near piezometer P-7A (COD value at 700 mg O2/L). Lower COD values were obtained for groundwater taken from piezometers located in the northern part of the study area, beyond the area of the MBT installation and the composting plant. In piezometers located in the area of the biological processing of wastes, average values of COD were in the range of 100–150 mg O2/L. In the eastern and western part of the study area (vicinity of piezometer P-2A and P-9, respectively), the COD level was almost equal to 400 mg O2/L. The lowest level of COD was detected in the northern part of the study area (COD at the level of 10 mg O2/L). Monitoring data from 2004 and 2016 clearly indicate a decrease of COD concentrations in the piezometers. The most significant change had occurred near piezometer P-7A (COD level decreased from 703 mg O2/L in 1998 to 132 mg O2/L in 2004 and 100 mg O2/L in 2016).
0
100
200
300
400
500
600
700
BOD
[mg
O2/L
]
closure of the vertical barrier (November 2000)
piezometer P-12
piezometer P-15
piezometer P-11
0102030405060708090
100
BOD
[mg
O2/L
]
closure of the vertical barrier (November 2000)
piezometer P-10
piezometer P-17
piezometer P-14
Figure 5. Temporal changes of the BOD level in piezometers located in the area of composting plant.
Appl. Sci. 2017, 7, 637 10 of 22
Figure 5. Temporal changes of the BOD level in piezometers located in the area of composting plant.
Figure 6. Temporal changes of the BOD level in piezometers located in the area of adjacent facilities.
3.2.2. Chemical Oxygen Demand (COD) in Groundwater
In this study, the chemical oxygen demand (COD) was used for assessing organic pollution levels in groundwater (Figure 7). Based on the monitoring results from 1998, it should be noted that the highest COD level was observed near piezometer P-7A (COD value at 700 mg O2/L). Lower COD values were obtained for groundwater taken from piezometers located in the northern part of the study area, beyond the area of the MBT installation and the composting plant. In piezometers located in the area of the biological processing of wastes, average values of COD were in the range of 100–150 mg O2/L. In the eastern and western part of the study area (vicinity of piezometer P-2A and P-9, respectively), the COD level was almost equal to 400 mg O2/L. The lowest level of COD was detected in the northern part of the study area (COD at the level of 10 mg O2/L). Monitoring data from 2004 and 2016 clearly indicate a decrease of COD concentrations in the piezometers. The most significant change had occurred near piezometer P-7A (COD level decreased from 703 mg O2/L in 1998 to 132 mg O2/L in 2004 and 100 mg O2/L in 2016).
0
100
200
300
400
500
600
700BO
D [m
g O
2/L]
closure of the vertical barrier (November 2000)
piezometer P-12
piezometer P-15
piezometer P-11
0102030405060708090
100
BOD
[mg
O2/L
]
closure of the vertical barrier (November 2000)
piezometer P-10
piezometer P-17
piezometer P-14
Figure 6. Temporal changes of the BOD level in piezometers located in the area of adjacent facilities.
3.2.2. Chemical Oxygen Demand (COD) in Groundwater
In this study, the chemical oxygen demand (COD) was used for assessing organic pollutionlevels in groundwater (Figure 7). Based on the monitoring results from 1998, it should be noted thatthe highest COD level was observed near piezometer P-7A (COD value at 700 mg O2/L). LowerCOD values were obtained for groundwater taken from piezometers located in the northern part ofthe study area, beyond the area of the MBT installation and the composting plant. In piezometerslocated in the area of the biological processing of wastes, average values of COD were in the rangeof 100–150 mg O2/L. In the eastern and western part of the study area (vicinity of piezometer P-2Aand P-9, respectively), the COD level was almost equal to 400 mg O2/L. The lowest level of COD wasdetected in the northern part of the study area (COD at the level of 10 mg O2/L). Monitoring datafrom 2004 and 2016 clearly indicate a decrease of COD concentrations in the piezometers. The mostsignificant change had occurred near piezometer P-7A (COD level decreased from 703 mg O2/L in1998 to 132 mg O2/L in 2004 and 100 mg O2/L in 2016).
Appl. Sci. 2017, 7, 638 11 of 22Appl. Sci. 2017, 7, 637 11 of 22
Figure 7. Distribution of the mean values of the chemical oxygen demand (COD) in groundwater in 1998, 2004 and 2016. Figure 7. Distribution of the mean values of the chemical oxygen demand (COD) in groundwater in 1998, 2004 and 2016.
Appl. Sci. 2017, 7, 638 12 of 22
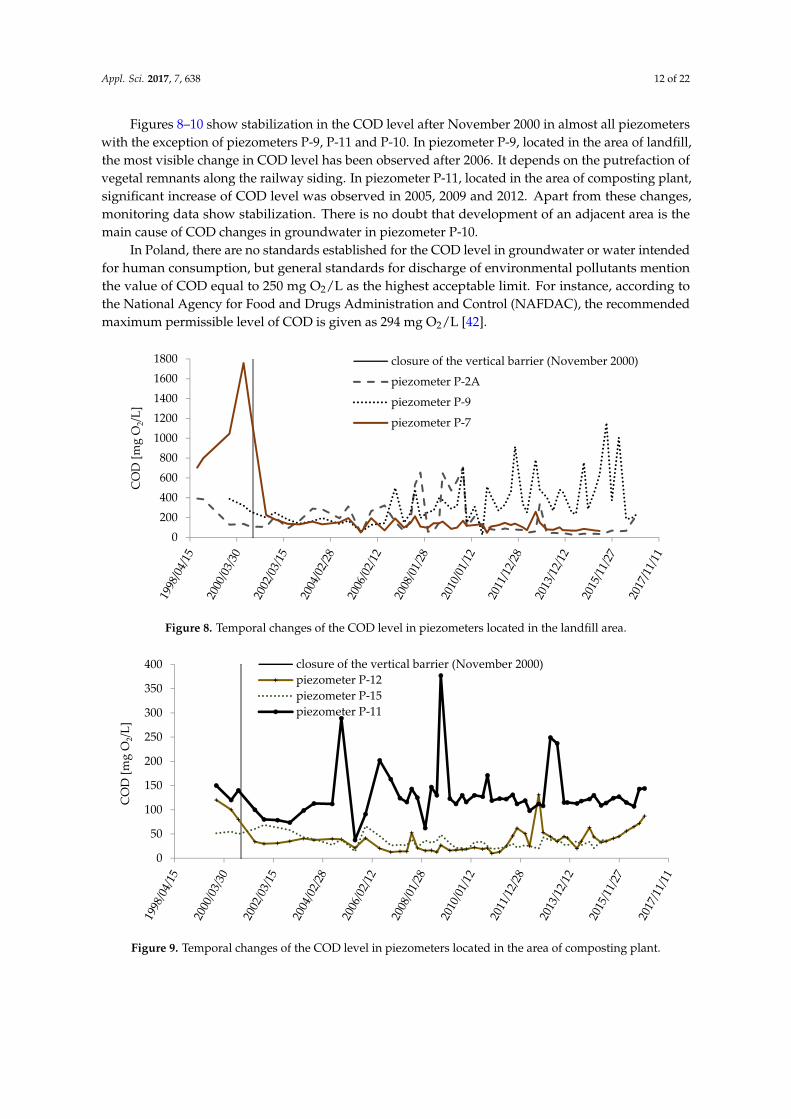
Figures 8–10 show stabilization in the COD level after November 2000 in almost all piezometerswith the exception of piezometers P-9, P-11 and P-10. In piezometer P-9, located in the area of landfill,the most visible change in COD level has been observed after 2006. It depends on the putrefaction ofvegetal remnants along the railway siding. In piezometer P-11, located in the area of composting plant,significant increase of COD level was observed in 2005, 2009 and 2012. Apart from these changes,monitoring data show stabilization. There is no doubt that development of an adjacent area is themain cause of COD changes in groundwater in piezometer P-10.
In Poland, there are no standards established for the COD level in groundwater or water intendedfor human consumption, but general standards for discharge of environmental pollutants mentionthe value of COD equal to 250 mg O2/L as the highest acceptable limit. For instance, according tothe National Agency for Food and Drugs Administration and Control (NAFDAC), the recommendedmaximum permissible level of COD is given as 294 mg O2/L [42].
Appl. Sci. 2017, 7, x FOR PEER REVIEW 12 of 22
Figures 8–10 show stabilization in the COD level after November 2000 in almost all piezometers with the exception of piezometers P-9, P-11 and P-10. In piezometer P-9, located in the area of landfill, the most visible change in COD level has been observed after 2006. It depends on the putrefaction of vegetal remnants along the railway siding. In piezometer P-11, located in the area of composting plant, significant increase of COD level was observed in 2005, 2009 and 2012. Apart from these changes, monitoring data show stabilization. There is no doubt that development of an adjacent area is the main cause of COD changes in groundwater in piezometer P-10.
In Poland, there are no standards established for the COD level in groundwater or water intended for human consumption, but general standards for discharge of environmental pollutants mention the value of COD equal to 250 mg O2/L as the highest acceptable limit. For instance, according to the National Agency for Food and Drugs Administration and Control (NAFDAC), the recommended maximum permissible level of COD is given as 294 mg O2/L [42].
Figure 8. Temporal changes of the COD level in piezometers located in the landfill area.
Figure 9. Temporal changes of the COD level in piezometers located in the area of composting plant.
0200400600800
10001200140016001800
CO
D [m
g O
2/L]
closure of the vertical barrier (November 2000)
piezometer P-2A
piezometer P-9
piezometer P-7
0
50
100
150
200
250
300
350
400
CO
D [m
g O
2/L]
closure of the vertical barrier (November 2000)piezometer P-12piezometer P-15piezometer P-11
Figure 8. Temporal changes of the COD level in piezometers located in the landfill area.
Appl. Sci. 2017, 7, x FOR PEER REVIEW 12 of 22
Figures 8–10 show stabilization in the COD level after November 2000 in almost all piezometers with the exception of piezometers P-9, P-11 and P-10. In piezometer P-9, located in the area of landfill, the most visible change in COD level has been observed after 2006. It depends on the putrefaction of vegetal remnants along the railway siding. In piezometer P-11, located in the area of composting plant, significant increase of COD level was observed in 2005, 2009 and 2012. Apart from these changes, monitoring data show stabilization. There is no doubt that development of an adjacent area is the main cause of COD changes in groundwater in piezometer P-10.
In Poland, there are no standards established for the COD level in groundwater or water intended for human consumption, but general standards for discharge of environmental pollutants mention the value of COD equal to 250 mg O2/L as the highest acceptable limit. For instance, according to the National Agency for Food and Drugs Administration and Control (NAFDAC), the recommended maximum permissible level of COD is given as 294 mg O2/L [42].
Figure 8. Temporal changes of the COD level in piezometers located in the landfill area.
Figure 9. Temporal changes of the COD level in piezometers located in the area of composting plant.
0200400600800
10001200140016001800
CO
D [m
g O
2/L]
closure of the vertical barrier (November 2000)
piezometer P-2A
piezometer P-9
piezometer P-7
0
50
100
150
200
250
300
350
400
CO
D [m
g O
2/L]
closure of the vertical barrier (November 2000)piezometer P-12piezometer P-15piezometer P-11
Figure 9. Temporal changes of the COD level in piezometers located in the area of composting plant.
Appl. Sci. 2017, 7, 638 13 of 22
Appl. Sci. 2017, 7, x FOR PEER REVIEW 13 of 22
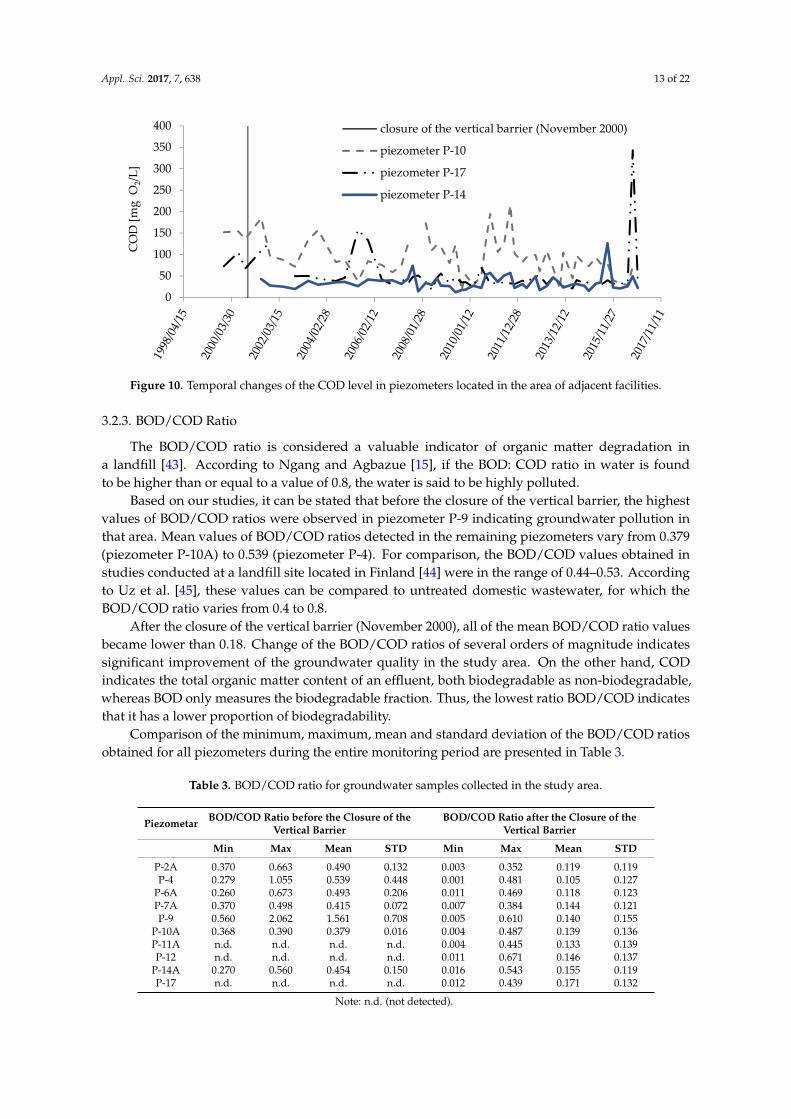
Figure 10. Temporal changes of the COD level in piezometers located in the area of adjacent facilities.
3.2.3. BOD/COD Ratio
The BOD/COD ratio is considered a valuable indicator of organic matter degradation in a landfill [43]. According to Ngang and Agbazue [15], if the BOD: COD ratio in water is found to be higher than or equal to a value of 0.8, the water is said to be highly polluted.
Based on our studies, it can be stated that before the closure of the vertical barrier, the highest values of BOD/COD ratios were observed in piezometer P-9 indicating groundwater pollution in that area. Mean values of BOD/COD ratios detected in the remaining piezometers vary from 0.379 (piezometer P-10A) to 0.539 (piezometer P-4). For comparison, the BOD/COD values obtained in studies conducted at a landfill site located in Finland [44] were in the range of 0.44–0.53. According to Uz et al. [45], these values can be compared to untreated domestic wastewater, for which the BOD/COD ratio varies from 0.4 to 0.8.
After the closure of the vertical barrier (November 2000), all of the mean BOD/COD ratio values became lower than 0.18. Change of the BOD/COD ratios of several orders of magnitude indicates significant improvement of the groundwater quality in the study area. On the other hand, COD indicates the total organic matter content of an effluent, both biodegradable as non-biodegradable, whereas BOD only measures the biodegradable fraction. Thus, the lowest ratio BOD/COD indicates that it has a lower proportion of biodegradability.
Comparison of the minimum, maximum, mean and standard deviation of the BOD/COD ratios obtained for all piezometers during the entire monitoring period are presented in Table 3.
Table 3. BOD/COD ratio for groundwater samples collected in the study area.
Piezometar BOD/COD Ratio before the Closure of the Vertical Barrier
BOD/COD Ratio after the Closure of the Vertical Barrier
Min Max Mean STD Min Max Mean STDP-2A 0.370 0.663 0.490 0.132 0.003 0.352 0.119 0.119 P-4 0.279 1.055 0.539 0.448 0.001 0.481 0.105 0.127
P-6A 0.260 0.673 0.493 0.206 0.011 0.469 0.118 0.123 P-7A 0.370 0.498 0.415 0.072 0.007 0.384 0.144 0.121 P-9 0.560 2.062 1.561 0.708 0.005 0.610 0.140 0.155
P-10A 0.368 0.390 0.379 0.016 0.004 0.487 0.139 0.136 P-11A n.d. n.d. n.d. n.d. 0.004 0.445 0.133 0.139 P-12 n.d. n.d. n.d. n.d. 0.011 0.671 0.146 0.137
P-14A 0.270 0.560 0.454 0.150 0.016 0.543 0.155 0.119 P-17 n.d. n.d. n.d. n.d. 0.012 0.439 0.171 0.132
Note: n.d. (not detected).
0
50
100
150
200
250
300
350
400C
OD
[mg
O2/L
]closure of the vertical barrier (November 2000)
piezometer P-10
piezometer P-17
piezometer P-14
Figure 10. Temporal changes of the COD level in piezometers located in the area of adjacent facilities.
3.2.3. BOD/COD Ratio
The BOD/COD ratio is considered a valuable indicator of organic matter degradation ina landfill [43]. According to Ngang and Agbazue [15], if the BOD: COD ratio in water is foundto be higher than or equal to a value of 0.8, the water is said to be highly polluted.
Based on our studies, it can be stated that before the closure of the vertical barrier, the highestvalues of BOD/COD ratios were observed in piezometer P-9 indicating groundwater pollution inthat area. Mean values of BOD/COD ratios detected in the remaining piezometers vary from 0.379(piezometer P-10A) to 0.539 (piezometer P-4). For comparison, the BOD/COD values obtained instudies conducted at a landfill site located in Finland [44] were in the range of 0.44–0.53. Accordingto Uz et al. [45], these values can be compared to untreated domestic wastewater, for which theBOD/COD ratio varies from 0.4 to 0.8.
After the closure of the vertical barrier (November 2000), all of the mean BOD/COD ratio valuesbecame lower than 0.18. Change of the BOD/COD ratios of several orders of magnitude indicatessignificant improvement of the groundwater quality in the study area. On the other hand, CODindicates the total organic matter content of an effluent, both biodegradable as non-biodegradable,whereas BOD only measures the biodegradable fraction. Thus, the lowest ratio BOD/COD indicatesthat it has a lower proportion of biodegradability.
Comparison of the minimum, maximum, mean and standard deviation of the BOD/COD ratiosobtained for all piezometers during the entire monitoring period are presented in Table 3.
Table 3. BOD/COD ratio for groundwater samples collected in the study area.
Piezometar BOD/COD Ratio before the Closure of theVertical Barrier
BOD/COD Ratio after the Closure of theVertical Barrier
Min Max Mean STD Min Max Mean STD
P-2A 0.370 0.663 0.490 0.132 0.003 0.352 0.119 0.119P-4 0.279 1.055 0.539 0.448 0.001 0.481 0.105 0.127
P-6A 0.260 0.673 0.493 0.206 0.011 0.469 0.118 0.123P-7A 0.370 0.498 0.415 0.072 0.007 0.384 0.144 0.121P-9 0.560 2.062 1.561 0.708 0.005 0.610 0.140 0.155
P-10A 0.368 0.390 0.379 0.016 0.004 0.487 0.139 0.136P-11A n.d. n.d. n.d. n.d. 0.004 0.445 0.133 0.139P-12 n.d. n.d. n.d. n.d. 0.011 0.671 0.146 0.137
P-14A 0.270 0.560 0.454 0.150 0.016 0.543 0.155 0.119P-17 n.d. n.d. n.d. n.d. 0.012 0.439 0.171 0.132
Note: n.d. (not detected).

Appl. Sci. 2017, 7, 638 14 of 22
3.2.4. Total Organic Carbon (TOC) in Groundwater
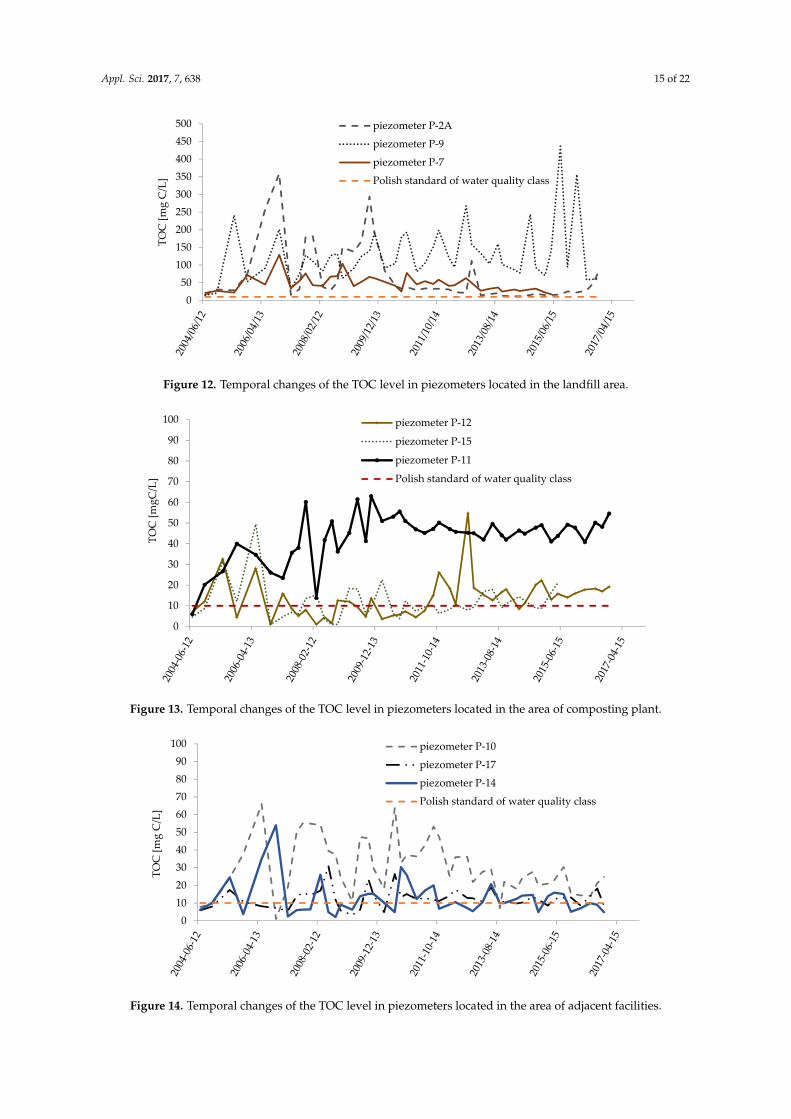
TOC (total organic carbon) is considered as the most relevant parameter for quantifying organicpollution in water [46]. The Regulation of the Minister of the Environment of Poland on the criteriaand method of evaluating the underground water condition sets the upper acceptable limit forTOC in groundwater at the level of 10 mg C/L. Comparison to the results obtained in our studies(Figures 11–14) indicates that the groundwater is contaminated by organic chemicals. The highestvalues are observed nearest the landfill (piezometers P-7A (in 2007), P-9 (in 2015) and P-2A (in 2006)).However, Figure 12 shows that level of TOC in piezometer P-7 was stable during analyzed period (from1998 to 2016) as opposed to a piezometer P-9. In piezometer P-2A, after 2009 monitoring data indicatestabilization. In 2016, the concentrations were lower, but still exceeded the maximum allowable limit.The maximum level of TOC is currently observed around piezometers P-9 and P-11A but in piezometerP-11A after 2009 increase in level of TOC was observed. Worthy of note is a fact that piezometer P-11Ais located in a local depression, and consequently, water from the railway siding and the compostingarea can flow down easily to that point and directly cause groundwater pollution in this piezometer.In case of piezometers located in the area of adjacent facilities, after 2009 decrease of the TOC level wasobserved. Due to the lack of monitoring data from the period before the closure of the vertical barrier,the overall assessment of the impact of the cut-off wall construction on the TOC in groundwater cannotbe made.
Appl. Sci. 2017, 7, x FOR PEER REVIEW 14 of 22
3.2.4. Total Organic Carbon (TOC) in Groundwater
TOC (total organic carbon) is considered as the most relevant parameter for quantifying organic pollution in water [46]. The Regulation of the Minister of the Environment of Poland on the criteria and method of evaluating the underground water condition sets the upper acceptable limit for TOC in groundwater at the level of 10 mg C/L. Comparison to the results obtained in our studies (Figures 11–14) indicates that the groundwater is contaminated by organic chemicals. The highest values are observed nearest the landfill (piezometers P-7A (in 2007), P-9 (in 2015) and P-2A (in 2006)). However, Figure 12 shows that level of TOC in piezometer P-7 was stable during analyzed period (from 1998 to 2016) as opposed to a piezometer P-9. In piezometer P-2A, after 2009 monitoring data indicate stabilization. In 2016, the concentrations were lower, but still exceeded the maximum allowable limit. The maximum level of TOC is currently observed around piezometers P-9 and P-11A but in piezometer P-11A after 2009 increase in level of TOC was observed. Worthy of note is a fact that piezometer P-11A is located in a local depression, and consequently, water from the railway siding and the composting area can flow down easily to that point and directly cause groundwater pollution in this piezometer. In case of piezometers located in the area of adjacent facilities, after 2009 decrease of the TOC level was observed. Due to the lack of monitoring data from the period before the closure of the vertical barrier, the overall assessment of the impact of the cut-off wall construction on the TOC in groundwater cannot be made.
Figure 11. Distribution of the mean values of the total organic carbon (TOC) in groundwater in 2004 and 2016. Figure 11. Distribution of the mean values of the total organic carbon (TOC) in groundwater in 2004and 2016.
Appl. Sci. 2017, 7, 638 15 of 22
Appl. Sci. 2017, 7, x FOR PEER REVIEW 15 of 22
Figure 12. Temporal changes of the TOC level in piezometers located in the landfill area.
Figure 13. Temporal changes of the TOC level in piezometers located in the area of composting plant.
050
100150200250300350400450500
TOC
[mg
C/L
]
piezometer P-2A
piezometer P-9
piezometer P-7
Polish standard of water quality class
0
10
20
30
40
50
60
70
80
90
100
TOC
[mgC
/L]
piezometer P-12
piezometer P-15
piezometer P-11
Polish standard of water quality class
0102030405060708090
100
TOC
[mg
C/L
]
piezometer P-10
piezometer P-17
piezometer P-14
Polish standard of water quality class
Figure 12. Temporal changes of the TOC level in piezometers located in the landfill area.
Appl. Sci. 2017, 7, x FOR PEER REVIEW 15 of 22
Figure 12. Temporal changes of the TOC level in piezometers located in the landfill area.
Figure 13. Temporal changes of the TOC level in piezometers located in the area of composting plant.
050
100150200250300350400450500
TOC
[mg
C/L
]
piezometer P-2A
piezometer P-9
piezometer P-7
Polish standard of water quality class
0
10
20
30
40
50
60
70
80
90
100
TOC
[mgC
/L]
piezometer P-12
piezometer P-15
piezometer P-11
Polish standard of water quality class
0102030405060708090
100
TOC
[mg
C/L
]
piezometer P-10
piezometer P-17
piezometer P-14
Polish standard of water quality class
Figure 13. Temporal changes of the TOC level in piezometers located in the area of composting plant.
Appl. Sci. 2017, 7, x FOR PEER REVIEW 15 of 22
Figure 12. Temporal changes of the TOC level in piezometers located in the landfill area.
Figure 13. Temporal changes of the TOC level in piezometers located in the area of composting plant.
050
100150200250300350400450500
TOC
[mg
C/L
]piezometer P-2A
piezometer P-9
piezometer P-7
Polish standard of water quality class
0
10
20
30
40
50
60
70
80
90
100
TOC
[mgC
/L]
piezometer P-12
piezometer P-15
piezometer P-11
Polish standard of water quality class
0102030405060708090
100
TOC
[mg
C/L
]
piezometer P-10
piezometer P-17
piezometer P-14
Polish standard of water quality class
Figure 14. Temporal changes of the TOC level in piezometers located in the area of adjacent facilities.
Appl. Sci. 2017, 7, 638 16 of 22
3.3. Statistical Analysis of the Monitoring Data
3.3.1. Pearson’s Correlation Analysis
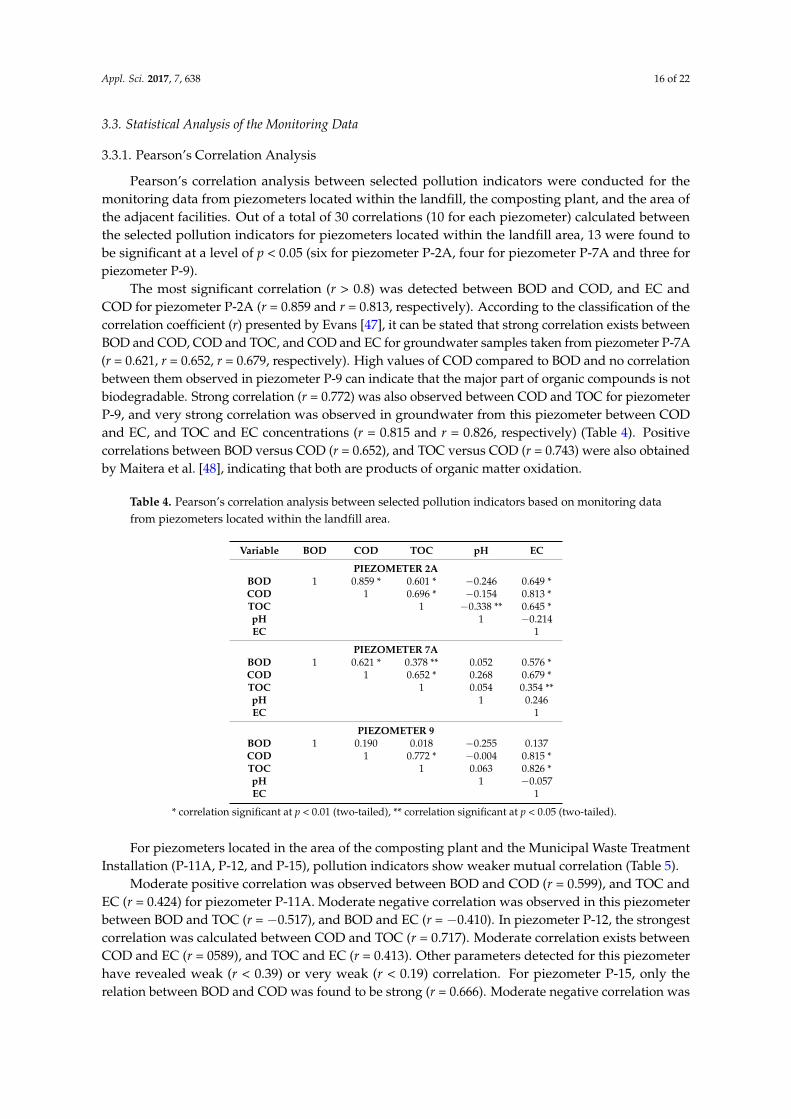
Pearson’s correlation analysis between selected pollution indicators were conducted for themonitoring data from piezometers located within the landfill, the composting plant, and the area ofthe adjacent facilities. Out of a total of 30 correlations (10 for each piezometer) calculated betweenthe selected pollution indicators for piezometers located within the landfill area, 13 were found tobe significant at a level of p < 0.05 (six for piezometer P-2A, four for piezometer P-7A and three forpiezometer P-9).
The most significant correlation (r > 0.8) was detected between BOD and COD, and EC andCOD for piezometer P-2A (r = 0.859 and r = 0.813, respectively). According to the classification of thecorrelation coefficient (r) presented by Evans [47], it can be stated that strong correlation exists betweenBOD and COD, COD and TOC, and COD and EC for groundwater samples taken from piezometer P-7A(r = 0.621, r = 0.652, r = 0.679, respectively). High values of COD compared to BOD and no correlationbetween them observed in piezometer P-9 can indicate that the major part of organic compounds is notbiodegradable. Strong correlation (r = 0.772) was also observed between COD and TOC for piezometerP-9, and very strong correlation was observed in groundwater from this piezometer between CODand EC, and TOC and EC concentrations (r = 0.815 and r = 0.826, respectively) (Table 4). Positivecorrelations between BOD versus COD (r = 0.652), and TOC versus COD (r = 0.743) were also obtainedby Maitera et al. [48], indicating that both are products of organic matter oxidation.
Table 4. Pearson’s correlation analysis between selected pollution indicators based on monitoring datafrom piezometers located within the landfill area.
Variable BOD COD TOC pH EC
PIEZOMETER 2ABOD 1 0.859 * 0.601 * −0.246 0.649 *COD 1 0.696 * −0.154 0.813 *TOC 1 −0.338 ** 0.645 *pH 1 −0.214EC 1
PIEZOMETER 7ABOD 1 0.621 * 0.378 ** 0.052 0.576 *COD 1 0.652 * 0.268 0.679 *TOC 1 0.054 0.354 **pH 1 0.246EC 1
PIEZOMETER 9BOD 1 0.190 0.018 −0.255 0.137COD 1 0.772 * −0.004 0.815 *TOC 1 0.063 0.826 *pH 1 −0.057EC 1
* correlation significant at p < 0.01 (two-tailed), ** correlation significant at p < 0.05 (two-tailed).
For piezometers located in the area of the composting plant and the Municipal Waste TreatmentInstallation (P-11A, P-12, and P-15), pollution indicators show weaker mutual correlation (Table 5).
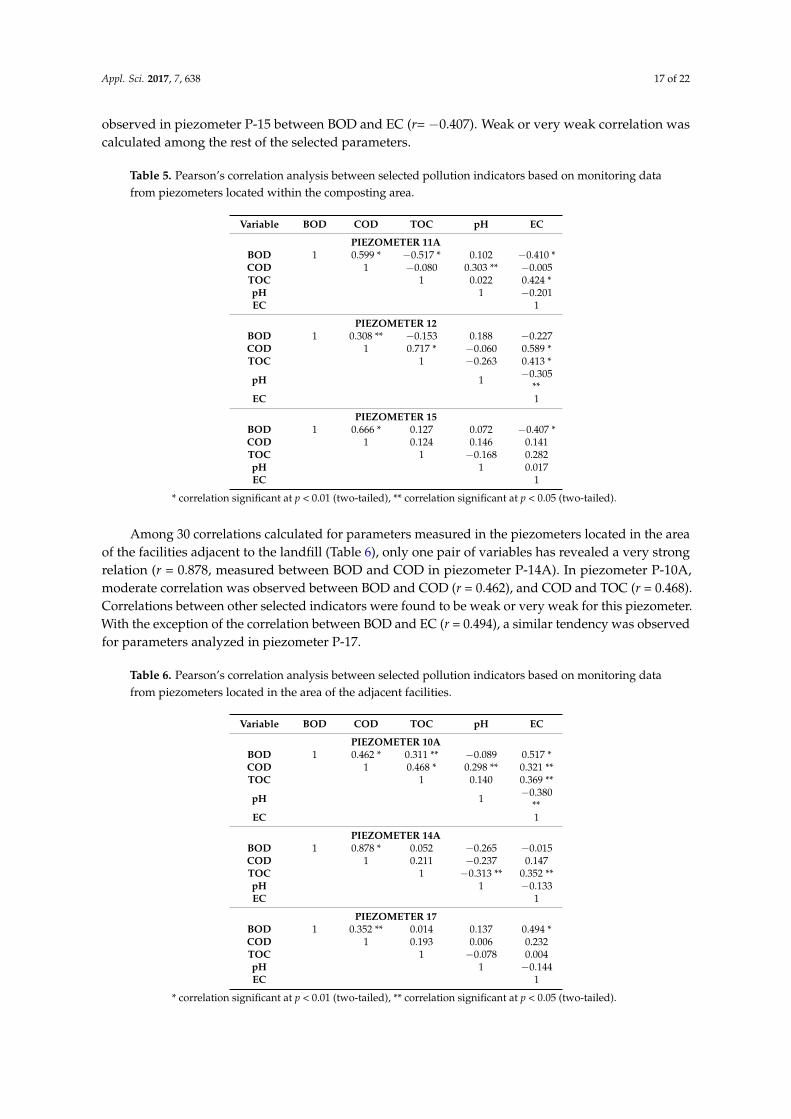
Moderate positive correlation was observed between BOD and COD (r = 0.599), and TOC andEC (r = 0.424) for piezometer P-11A. Moderate negative correlation was observed in this piezometerbetween BOD and TOC (r = −0.517), and BOD and EC (r = −0.410). In piezometer P-12, the strongestcorrelation was calculated between COD and TOC (r = 0.717). Moderate correlation exists betweenCOD and EC (r = 0589), and TOC and EC (r = 0.413). Other parameters detected for this piezometerhave revealed weak (r < 0.39) or very weak (r < 0.19) correlation. For piezometer P-15, only therelation between BOD and COD was found to be strong (r = 0.666). Moderate negative correlation was
Appl. Sci. 2017, 7, 638 17 of 22
observed in piezometer P-15 between BOD and EC (r= −0.407). Weak or very weak correlation wascalculated among the rest of the selected parameters.
Table 5. Pearson’s correlation analysis between selected pollution indicators based on monitoring datafrom piezometers located within the composting area.
Variable BOD COD TOC pH EC
PIEZOMETER 11ABOD 1 0.599 * −0.517 * 0.102 −0.410 *COD 1 −0.080 0.303 ** −0.005TOC 1 0.022 0.424 *pH 1 −0.201EC 1
PIEZOMETER 12BOD 1 0.308 ** −0.153 0.188 −0.227COD 1 0.717 * −0.060 0.589 *TOC 1 −0.263 0.413 *
pH 1 −0.305**
EC 1
PIEZOMETER 15BOD 1 0.666 * 0.127 0.072 −0.407 *COD 1 0.124 0.146 0.141TOC 1 −0.168 0.282pH 1 0.017EC 1
* correlation significant at p < 0.01 (two-tailed), ** correlation significant at p < 0.05 (two-tailed).
Among 30 correlations calculated for parameters measured in the piezometers located in the areaof the facilities adjacent to the landfill (Table 6), only one pair of variables has revealed a very strongrelation (r = 0.878, measured between BOD and COD in piezometer P-14A). In piezometer P-10A,moderate correlation was observed between BOD and COD (r = 0.462), and COD and TOC (r = 0.468).Correlations between other selected indicators were found to be weak or very weak for this piezometer.With the exception of the correlation between BOD and EC (r = 0.494), a similar tendency was observedfor parameters analyzed in piezometer P-17.
Table 6. Pearson’s correlation analysis between selected pollution indicators based on monitoring datafrom piezometers located in the area of the adjacent facilities.
Variable BOD COD TOC pH EC
PIEZOMETER 10ABOD 1 0.462 * 0.311 ** −0.089 0.517 *COD 1 0.468 * 0.298 ** 0.321 **TOC 1 0.140 0.369 **
pH 1 −0.380**
EC 1
PIEZOMETER 14ABOD 1 0.878 * 0.052 −0.265 −0.015COD 1 0.211 −0.237 0.147TOC 1 −0.313 ** 0.352 **pH 1 −0.133EC 1
PIEZOMETER 17BOD 1 0.352 ** 0.014 0.137 0.494 *COD 1 0.193 0.006 0.232TOC 1 −0.078 0.004pH 1 −0.144EC 1
* correlation significant at p < 0.01 (two-tailed), ** correlation significant at p < 0.05 (two-tailed).
Appl. Sci. 2017, 7, 638 18 of 22
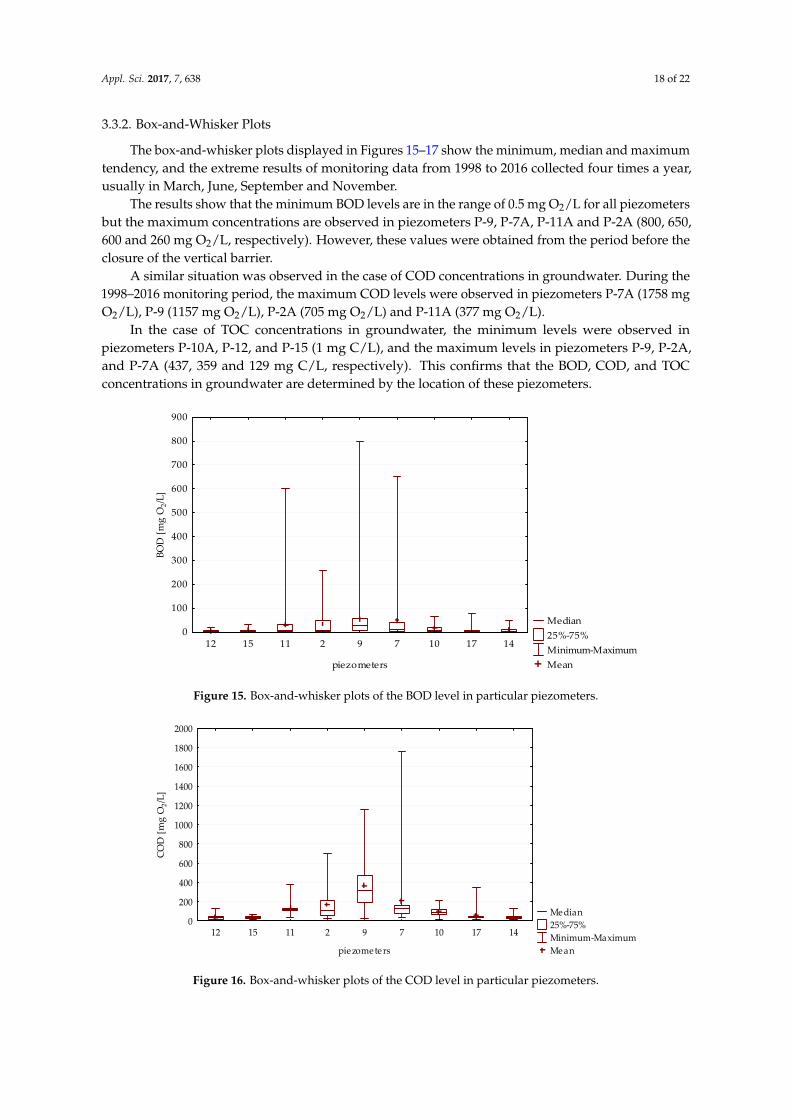
3.3.2. Box-and-Whisker Plots
The box-and-whisker plots displayed in Figures 15–17 show the minimum, median and maximumtendency, and the extreme results of monitoring data from 1998 to 2016 collected four times a year,usually in March, June, September and November.
The results show that the minimum BOD levels are in the range of 0.5 mg O2/L for all piezometersbut the maximum concentrations are observed in piezometers P-9, P-7A, P-11A and P-2A (800, 650,600 and 260 mg O2/L, respectively). However, these values were obtained from the period before theclosure of the vertical barrier.
A similar situation was observed in the case of COD concentrations in groundwater. During the1998–2016 monitoring period, the maximum COD levels were observed in piezometers P-7A (1758 mgO2/L), P-9 (1157 mg O2/L), P-2A (705 mg O2/L) and P-11A (377 mg O2/L).
In the case of TOC concentrations in groundwater, the minimum levels were observed inpiezometers P-10A, P-12, and P-15 (1 mg C/L), and the maximum levels in piezometers P-9, P-2A,and P-7A (437, 359 and 129 mg C/L, respectively). This confirms that the BOD, COD, and TOCconcentrations in groundwater are determined by the location of these piezometers.
Appl. Sci. 2017, 7, x FOR PEER REVIEW 18 of 22
BOD 1 0.352 ** 0.014 0.137 0.494 * COD 1 0.193 0.006 0.232 TOC 1 −0.078 0.004 pH 1 −0.144 EC 1
* correlation significant at p < 0.01 (two-tailed), ** correlation significant at p < 0.05 (two-tailed).
3.3.2. Box-and-Whisker Plots
The box-and-whisker plots displayed in Figures 15–17 show the minimum, median and maximum tendency, and the extreme results of monitoring data from 1998 to 2016 collected four times a year, usually in March, June, September and November.
Figure 15. Box-and-whisker plots of the BOD level in particular piezometers.
Figure 16. Box-and-whisker plots of the COD level in particular piezometers.
Median 25%-75% Minimum-Maximum Mean
12 15 11 2 9 7 10 17 14
piezometers
0
100
200
300
400
500
600
700
800
900
BOD
[mg
O2/L
]
Median 25%-75% Minimum-Maximum Mean
12 15 11 2 9 7 10 17 14
piezometers
0
200
400
600
800
1000
1200
1400
1600
1800
2000
COD
[mg
O2/
L]
Figure 15. Box-and-whisker plots of the BOD level in particular piezometers.
Appl. Sci. 2017, 7, x FOR PEER REVIEW 18 of 22
BOD 1 0.352 ** 0.014 0.137 0.494 * COD 1 0.193 0.006 0.232 TOC 1 −0.078 0.004 pH 1 −0.144 EC 1
* correlation significant at p < 0.01 (two-tailed), ** correlation significant at p < 0.05 (two-tailed).
3.3.2. Box-and-Whisker Plots
The box-and-whisker plots displayed in Figures 15–17 show the minimum, median and maximum tendency, and the extreme results of monitoring data from 1998 to 2016 collected four times a year, usually in March, June, September and November.
Figure 15. Box-and-whisker plots of the BOD level in particular piezometers.
Figure 16. Box-and-whisker plots of the COD level in particular piezometers.
Median 25%-75% Minimum-Maximum Mean
12 15 11 2 9 7 10 17 14
piezometers
0
100
200
300
400
500
600
700
800
900
BOD
[mg
O2/L
]
Median 25%-75% Minimum-Maximum Mean
12 15 11 2 9 7 10 17 14
piezometers
0
200
400
600
800
1000
1200
1400
1600
1800
2000
COD
[mg
O2/
L]
Figure 16. Box-and-whisker plots of the COD level in particular piezometers.
Appl. Sci. 2017, 7, 638 19 of 22Appl. Sci. 2017, 7, x FOR PEER REVIEW 19 of 22
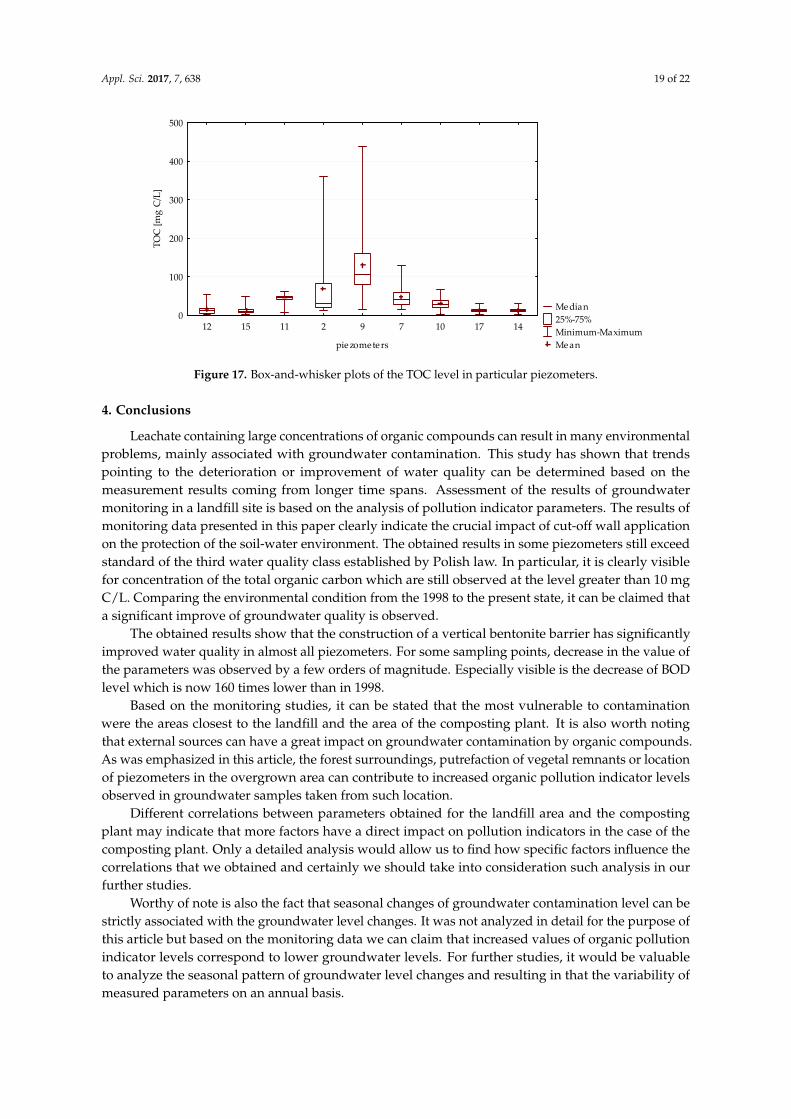
Figure 17. Box-and-whisker plots of the TOC level in particular piezometers.
The results show that the minimum BOD levels are in the range of 0.5 mg O2/L for all piezometers but the maximum concentrations are observed in piezometers P-9, P-7A, P-11A and P-2A (800, 650, 600 and 260 mg O2/L, respectively). However, these values were obtained from the period before the closure of the vertical barrier.
A similar situation was observed in the case of COD concentrations in groundwater. During the 1998–2016 monitoring period, the maximum COD levels were observed in piezometers P-7A (1758 mg O2/L), P-9 (1157 mg O2/L), P-2A (705 mg O2/L) and P-11A (377 mg O2/L).
In the case of TOC concentrations in groundwater, the minimum levels were observed in piezometers P-10A, P-12, and P-15 (1 mg C/L), and the maximum levels in piezometers P-9, P-2A, and P-7A (437, 359 and 129 mg C/L, respectively). This confirms that the BOD, COD, and TOC concentrations in groundwater are determined by the location of these piezometers.
4. Conclusions
Leachate containing large concentrations of organic compounds can result in many environmental problems, mainly associated with groundwater contamination. This study has shown that trends pointing to the deterioration or improvement of water quality can be determined based on the measurement results coming from longer time spans. Assessment of the results of groundwater monitoring in a landfill site is based on the analysis of pollution indicator parameters. The results of monitoring data presented in this paper clearly indicate the crucial impact of cut-off wall application on the protection of the soil-water environment. The obtained results in some piezometers still exceed standard of the third water quality class established by Polish law. In particular, it is clearly visible for concentration of the total organic carbon which are still observed at the level greater than 10 mg C/L. Comparing the environmental condition from the 1998 to the present state, it can be claimed that a significant improve of groundwater quality is observed.
The obtained results show that the construction of a vertical bentonite barrier has significantly improved water quality in almost all piezometers. For some sampling points, decrease in the value of the parameters was observed by a few orders of magnitude. Especially visible is the decrease of BOD level which is now 160 times lower than in 1998.
Based on the monitoring studies, it can be stated that the most vulnerable to contamination were the areas closest to the landfill and the area of the composting plant. It is also worth noting that external sources can have a great impact on groundwater contamination by organic compounds. As was emphasized in this article, the forest surroundings, putrefaction of vegetal remnants or location of piezometers in the overgrown area can contribute to increased organic pollution indicator levels observed in groundwater samples taken from such location.
Median 25%-75% Minimum-Maximum Mean
12 15 11 2 9 7 10 17 14
piezometers
0
100
200
300
400
500
TOC
[mg
C/L
]
Figure 17. Box-and-whisker plots of the TOC level in particular piezometers.
4. Conclusions
Leachate containing large concentrations of organic compounds can result in many environmentalproblems, mainly associated with groundwater contamination. This study has shown that trendspointing to the deterioration or improvement of water quality can be determined based on themeasurement results coming from longer time spans. Assessment of the results of groundwatermonitoring in a landfill site is based on the analysis of pollution indicator parameters. The results ofmonitoring data presented in this paper clearly indicate the crucial impact of cut-off wall applicationon the protection of the soil-water environment. The obtained results in some piezometers still exceedstandard of the third water quality class established by Polish law. In particular, it is clearly visiblefor concentration of the total organic carbon which are still observed at the level greater than 10 mgC/L. Comparing the environmental condition from the 1998 to the present state, it can be claimed thata significant improve of groundwater quality is observed.
The obtained results show that the construction of a vertical bentonite barrier has significantlyimproved water quality in almost all piezometers. For some sampling points, decrease in the value ofthe parameters was observed by a few orders of magnitude. Especially visible is the decrease of BODlevel which is now 160 times lower than in 1998.
Based on the monitoring studies, it can be stated that the most vulnerable to contaminationwere the areas closest to the landfill and the area of the composting plant. It is also worth notingthat external sources can have a great impact on groundwater contamination by organic compounds.As was emphasized in this article, the forest surroundings, putrefaction of vegetal remnants or locationof piezometers in the overgrown area can contribute to increased organic pollution indicator levelsobserved in groundwater samples taken from such location.
Different correlations between parameters obtained for the landfill area and the compostingplant may indicate that more factors have a direct impact on pollution indicators in the case of thecomposting plant. Only a detailed analysis would allow us to find how specific factors influence thecorrelations that we obtained and certainly we should take into consideration such analysis in ourfurther studies.
Worthy of note is also the fact that seasonal changes of groundwater contamination level can bestrictly associated with the groundwater level changes. It was not analyzed in detail for the purpose ofthis article but based on the monitoring data we can claim that increased values of organic pollutionindicator levels correspond to lower groundwater levels. For further studies, it would be valuableto analyze the seasonal pattern of groundwater level changes and resulting in that the variability ofmeasured parameters on an annual basis.

Appl. Sci. 2017, 7, 638 20 of 22
At present, the levels of BOD, COD and TOC in groundwater point to contamination by organicsubstances in the study area. Thus, the authors point out the need of a re-analysis in the future based onmonitoring data covering a longer time span, which should aid in the assessment of the effectivenessof groundwater self-purification.
Author Contributions: Anna Miszkowska, Anna Sieczka and Eugeniusz Koda conceived the subject of the paper,prepared and wrote the manuscript. Anna Miszkowska and Anna Sieczka were responsible for data analysis andfigures preparation. Eugeniusz Koda provided the expertise on the research.
Conflicts of Interest: The authors declare no conflict of interest.
References
1. Christensen, T.H.; Cossu, R.; Stegmann, R. Landfilling of Waste: Leachate; Taylor & Francis: Abingdon,UK, 1992.
2. Central Statistical Office: Warsaw, Poland, 2016. Available online: http://stat.gov.pl/obszary-tematyczne/infrastruktura-komunalna-nieruchomosci/nieruchomosci-budynki-infrastruktura-komunalna/infrastruktura-komunalna-w-2015-r-,3,13.html (accessed on 19 June 2017).
3. Slack, R.J.; Gronow, J.R.; Voulvoulis, N. Household hazardous waste in municipal landfills: Contaminants inleachate. Sci. Total Environ. 2005, 337, 119–137. [CrossRef] [PubMed]
4. Akinbile, C.O. Environmental impact of landfill on groundwater quality and agricultural soils in Nigeria.Soil Water Res. 2012, 7, 18–26.
5. Klinck, B.; Stuart, M. Human Health Risk in Relation to Landfill Leachate Quality; Technical Report WC/99/17;British Geological Survey: Nottingham, UK, 1999.
6. Albaiges, J.; Casado, F.; Ventura, F. Organic indicators of groundwater pollution by a sanitary landfill.Water Res. 1986, 20, 1153–1159. [CrossRef]
7. Dvronic, A.; Djogo, M.; Vojinovic–Miloradov, M.; Vujic, G. Biological and chemical oxygen demand asindicators of organic pollution of leachate and piezometric water from semi controlled, non-sanitary landfillin Novi Sad, Serbia. Ann. Fac. Eng. Hunedoara Int. J. Eng. 2011, 9, 79–82.
8. Kos, K.; Zawisza, E. Landfill liners from dam reservoir sediments. Ann. Warsaw Univ. Life Sci. SGGWLand Reclam. 2016, 48, 41–52.
9. Bjerg, P.L.; Albrechtsen, H.J.; Kjeldsen, P.; Christensen, T.H.; Cozzarelli, I. The groundwater geochemistry ofwaste disposal facilities. In Treatise on Geochemistry. Environmental Geochemistry; Holland, H.D., Turekian, K.K.,Lollar, B.S., Eds.; Elsevier: Amsterdam, The Netherlands, 2004; Volume 9.
10. Sarsby, R.W. Environmental Geotechnics; Thomas Telford: London, UK, 2013.11. Christensen, J.B.; Jensen, D.L.; Gron, C.; Filip, Z.; Christensen, T.H. Characterization of the dissolved organic
carbon fraction in landfill leachate-pol luted groundwater. Water Res. 1998, 32, 125–135. [CrossRef]12. Anilkumar, A.; Sukumaran, D.; Vincent, S.G.T. Effect of Municipal Solid Waste Leachate on Ground Water
Quality of Thiruvananthapuram District, Kerala, India. Appl. Ecol. Environ. Sci. 2015, 3, 151–157.13. Gettinby, J.H. The Composition of Landfill Leachate and Its Interaction with Compacted Clay Liners.
Ph.D. Thesis, Manchester University (Bolton Institute), Manchester, UK, 1999.14. Kalenik, M. Sewage Treatment Efficacy of Sandy Soil Bed with Natural Clinoptilolite Assist Layer.
Ochr. Srodowiska 2014, 36, 43–48.15. Ngang, B.U.; Agbazue, V.E. Aseasonal Assessment of Groundwater Pollution due to Biochemical Oxygen
Demand, Chemical Oxygen Demand and Elevated Temperatures in Enugu Northern Senatorial District,South East Nigeria. IOSR J. Appl. Chem. 2016, 9, 66–73.
16. Adamcová, D.; Vaverková, M.D.; Barton, S.; Havlícek, Z.; Broušková, E. Soil contamination in landfills:A case study of a landfill in Czech Republic. Solid Earth 2016, 7, 239–247. [CrossRef]
17. Calvo, F.; Moreno, B.; Zamorano, M.; Szanto, M. Environmental diagnosis methodology for municipal wastelandfills. Waste Manag. 2005, 25, 768–779. [CrossRef] [PubMed]
18. Gworek, B.; Dmuchowski, W.; Koda, E.; Marecka, M.; Baczewska, A.H.; Bragoszewska, P.; Sieczka, A.;Osinski, P. Impact of the Municipal Solid Waste Łubna Landfill on Environmental Pollution by Heavy Metals.Water 2016, 8, 470. [CrossRef]
Appl. Sci. 2017, 7, 638 21 of 22
19. Koda, E. Influence of vertical barrier surrounding old sanitary landfill on eliminating transport of pollutantson the basis of numerical modelling and monitoring results. Pol. J. Environ. Stud. 2012, 21, 929–935.
20. Koda, E.; Osinski, P.; Sieczka, A.; Wychowaniak, D. Areal Distribution of Ammonium Contamination ofSoil-Water Environment in the Vicinity of Old Municipal Landfill Site with Vertical Barrier. Water 2015, 7,2656–2672. [CrossRef]
21. Koda, E.; Sieczka, A.; Osinski, P. Ammonium concentration and migration in groundwater in the vicinity ofwaste management site located in the neighborhood of protected areas of Warsaw, Poland. Sustainability2016, 8, 1253. [CrossRef]
22. Koda, E.; Tkaczyk, A.; Lech, M.; Osinski, P. Application of Electrical Resistivity Data Sets for the Evaluationof the Pollution Concentration Level within Landfill Subsoil. Appl. Sci. 2017, 7, 262. [CrossRef]
23. Ling, C.; Zhang, Q. Evaluation of surface water and groundwater contamination in a MSW landfill area usinghydrochemical analysis and electrical resistivity tomography: A case study in Sichuan province, SouthwestChina. Environ. Monit. Assess. 2017, 189, 1–18. [CrossRef] [PubMed]
24. Pande, G.; Sinha, A.; Agarwal, S. Impacts of leachate percolation on ground water quality: A case study ofDhanbad City. Glob. Nest J. 2015, 17, 162–174.
25. Koda, E. Local water quality monitoring on surroundings of the sanitary landfill. Ann. Warsaw Agric. Univ.SGGW AR Land Reclam. 2004, 35, 131–144.
26. Koda, E.; Osinski, P.; Kolanka, T. Flow numerical modeling for efficiency assessment of vertical barriersin landfills. In Coupled Phenomena in Environmental Geotechnics: From Theoretical and Experimental Researchto Practical Applications, Proceedings of International Symposium TC215 ISSMGE, Torino, Italy, 1–3 July 2013;Manassero, M., Dominijanni, A., Foti, S., Musso, G., Eds.; CRC Press: London, UK, 2013; pp. 693–698.
27. Nielsen, D.M. Practical Handbook of Environmental Site Characterization and Ground-Water Monitoring, 2nd ed.;CRC Press: Boca Raton, FL, USA, 2005.
28. Water Quality. Sampling. Part 3: Preservation and Handling of Water Samples; EN ISO 5667-3; InternationalOrganization for Standardization: Geneva, Switzerland, 2012.
29. Water Quality. Sampling. Part 11: Guidance on Sampling of Groundwaters; ISO 5667-11; InternationalOrganization for Standardization: Geneva, Switzerland, 2009.
30. Water Quality: Determination of the Chemical Oxygen Demand Index (ST-COD)–Small-Scale Sealed-Tube Method;PN-ISO 15705:2005P; International Organization for Standardization: Geneva, Switzerland, 2002.
31. Water Quality; Determination of Biochemical Oxygen Demand after n Days (BODn)–Part 2: Method for UndilutedSamples (ISO 5815:1989, Modified); PN-EN 1899-2:2002P; Polish Committee for Standardization: Warsaw,Poland, 2002.
32. Water Analysis: Guidelines for the Determination of Total Organic Carbon (TOC) and Dissolved Organic Carbon(DOC); PN-EN 1484:1999P; Polish Committee for Standardization: Warsaw, Poland, 1999.
33. Water Quality: Determination of pH; PN-EN ISO 10523:2012; International Organization for Standardization:Geneva, Switzerland, 2012.
34. Water Quality: Determination of Electrical Conductivity; PN-EN 27888:1999; Polish Committee forStandardization: Warsaw, Poland, 1999.
35. Regulation of the Minister of Environment Dated 21 December 2015 on the Criteria and Method of Evaluatingthe Underground Water Condition (Journal of Laws 2016, Item 85). Available online: http://isap.sejm.gov.pl/DetailsServlet?id=WDU20160000085 (accessed on 19 June 2017).
36. Aderemi, A.O.; Oriaku, A.V.; Adewumi, G.A.; Otitoloju, A.A. Assessment of groundwater contamination byleachate near a municipal solid waste landfill. Afr. J. Environ. Sci. Technol. 2010, 5, 933–940.
37. Mor, S.; Ravindra, K.; Dahiya, R.P.; Chandra, A. Leachate characterization and assessment of ground-waterpollution near municipal solid waste landfill site. Environ. Monit. Assess. 2006, 118, 435–456.
38. Hazelton, P.; Murphy, B. Interpreting Soil Test Results: What Do All the Numbers Mean? CSIRO Publishing:Melbourne, Australia, 2007.
39. Bandara, N.J.G.J.; Hettiaratchi, J.P.A. Environmental impacts with waste disposal practices in a suburbanmunicipality in Sri Lanka. Int. J. Environ. Waste Manag. 2010, 6, 107–116. [CrossRef]
40. Sugirtharan, M.; Rajendran, M. Ground water quality near municipal solid waste dumping site atThirupperumthurai, Batticaloa. J. Agric. Sci. 2015, 10, 21–28. [CrossRef]
Appl. Sci. 2017, 7, 638 22 of 22
41. Wijesekara, S.S.R.M.D.H.R.; Mayakaduwa, S.S.; Siriwardana, A.R.; de Silva, N.; Basnayake, B.F.A.;Kawamoto, K.; Vithanage, M. Fate and transport of pollutants through a municipal solid waste landfillleachate in Sri Lanka. Environ. Earth Sci. 2014, 72, 1707–1719. [CrossRef]
42. National Agency for Food and Drug Administration and Control (NAFDAC). Guidelines for Registration andProduction of Packaged Water in Nigeria; NAFDAC: Abuja, Nigeria, 1999.
43. Lee, A.H.; Hamid, N. BOD/COD ratio as an indicator for pollutants leaching from landfill. J. Clean EnergyTechnol. 2014, 2, 263–266. [CrossRef]
44. Nininen, M.; Kalliokoski, P.; Parjala, E. Effect of organic contaminants in landfill leachates on groundwaterquality in Finland: Groundwater Quality Management. In Proceedings of the GQM 93 Conference, Tallinn,Estonia, 6–9 September 1993; pp. 64–71.
45. Uz, G.; Turak, F.; Afsar, H. Research of BOD and COD values of wastewaters that contain organic materials.4th Aegean Analytical Chemistry Days, Kusadasi, Turkey, 29 September–3 October 2004.
46. Wang, M.; Liu, X.; Pan, B.; Zhang, S. Photodegradation of Acid Orange 7 in a UV/acetylacetone Process.Chemosphere 2013, 93, 2877–2882. [CrossRef] [PubMed]
47. Evans, J.D. Straightforward Statistics for the Behavioral Sciences. Brooks/Cole Publishing: Pacific Grove,CA, USA, 1996.
48. Maitera, O.N.; Ogugbuaja, V.O.; Barminas, J.T. An assessment of the organic pollution indicator levels ofRiver Benue in Adamawa State, Nigeria. JECE 2010, 2, 110–116.
© 2017 by the authors. Licensee MDPI, Basel, Switzerland. This article is an open accessarticle distributed under the terms and conditions of the Creative Commons Attribution(CC BY) license (http://creativecommons.org/licenses/by/4.0/).