Palms (Arecaceae) from a Paleocene rainforest of northern Colombia
Phylogeny and historical biogeography of the cocosoid palms(Arecaceae, Arecoideae, Cocoseae) inferred from sequences of six
WRKY gene family loci
Alan W. Meerowa,*, Larry Noblickb, Dayana E. Salas-Leivaa,b,c, Vanessa Sancheza,Javier Francisco-Ortegac,d, Brett Jestrowd and Kyoko Nakamuraa
aUSDA-ARS-SHRS-National Germplasm Repository, 13601 Old Cutler Rd., Miami, FL 33158, USA; bMontgomery Botanical Center, 11901 Old
Cutler Rd., Coral Gables, FL 33156, USA; cDepartment of Biological Sciences, Florida International University, 11200 SW 8th St., Miami, FL
33199, USA; dKushlan Tropical Science Institute, Fairchild Tropical Botanical Garden, 10901 Old Cutler Rd., Miami, FL 33156, USA
Abstract
Arecaceae tribe Cocoseae is the most economically important tribe of palms, including both coconut and African oil palm. Itis mostly represented in the Neotropics, with one and two genera endemic to South Africa and Madagascar, respectively. Usingprimers for six single copy WRKY gene family loci, we amplified DNA from 96 samples representing all genera of the palmtribe Cocoseae as well as outgroup tribes Reinhardtieae and Roystoneae. We compared parsimony (MP), maximum likelihood(ML), and Bayesian (B) analysis of the supermatrix with three species-tree estimation approaches. Subtribe Elaeidinae is sisterto the Bactridinae in all analyses. Within subtribe Attaleinae, Lytocaryum, previously nested in Syagrus, is now positioned byMP and ML as sister to the former, with high support; B maintains Lytocaryum embedded within Syagrus. Both MP and MLresolve Cocos as sister to Syagrus; B positions Cocos as sister to Attalea. Bactridineae is composed of two sister clades, Bactrisand Desmoncus in one, for which there is morphological support, and a second comprising Acrocomia, Astrocaryum, and Ai-phanes. Two B and one ML gene tree-species estimation approaches are incongruent with the supermatrix in a few critical inter-generic clades, but resolve the same infrageneric relationships. The biogeographic history of the Cocoseae is dominated bydispersal events. The tribe originated in the late Cretaceous in South America. Evaluated together, the supermatrix and speciestree analyses presented in this paper provide the most accurate picture of the evolutionary history of the tribe to date, with morecongruence than incongruence among the various methodologies.Published [2014]. This article is a U.S. Government work and is in the public domain in the USA.
Introduction
The tribe Cocoseae, one of 13 tribes of Arecaceaesubfam. Arecoideae (Dransfield et al., 2008), containsa number of palms with significant economic impor-tance throughout the world (coconut, Cocos nuciferaL.; African oil palm, Elaeis guineensis Jacq.; in LatinAmerica, peach palm, Bactris gasipaes Kunth), as wellas many species that feature in local economies (Balickand Beck, 1990).First recognized informally as “the cocosoid palms”
(Moore, 1973), characterized by fruits with bony en-docarps bearing three germination pores, the tribe was
delimited into three subgroups as the Bactris Jacq.,Cocos L., and Elaeis Jacq. alliances. In 1987, thegroup was formalized as tribe Cocoeae encompassingfive subtribes with 22 genera, later reduced to threesubtribes (Uhl and Dransfield, 1987), and ultimatelyto 18 genera (Dransfield et al., 2005, 2008). Ortho-graphic correction of the name to Cocoseae was madeby Dransfield et al. (2005). The tribe also exhibits aonce-branched inflorescence, inconspicuous prophyll,conspicuous and often woody peduncular bract, imbri-cate or connate petals of female flowers, and a triovu-late gyneocium (Dransfield et al., 2008). Currentconsensus (Dransfield et al., 2008) recognizes threesubtribes, Attaleinae, Elaeidinae, and Bactridinae.Bactridinae is distinguished from the other two sub-tribes by the emergent spines that occur on the leaves,
*Corresponding author.E-mail address: [email protected]
CladisticsCladistics (2014)1–26
10.1111/cla.12100
Published [2014]. This article is a U.S. Government work and is in the public domain in the USA.
inflorescences and/or stems of every genus. It also con-tains the only genus of lianaceous palms (Desmoncus)in the Americas, outside of a single species of Chame-dorea (C. elatior).The tribe is particularly well represented in the Neo-
tropics, with 13 endemic genera (Dransfield et al.,2008). The monotypic Voanioala J. Dransf. is foundon Madagascar, along with Beccariophoenix Jum. &H.Perrier (three spp.); the monotypic Jubaeopsis Becc.is restricted to a small area in South Africa. Elaeis hasone species each in tropical Africa and tropical Amer-ica. Barcella Drude has one species in Amazonian Bra-zil. Cocos nucifera is the only pantropical genus in thetribe, a range influenced both by a seed that is welladapted to oceanic dispersal and the species’ significantimportance to humans (Harries, 1978; Gruezo andHarries, 1984). The remainder of the tribe is endemicto tropical and southern subtropical America. TheAmerican Attaleinae and Elaeis all have 2n = 32 chro-mosomes; Bactridinae are characterized by 2n = 30[summarized in Dransfield et al. (2008) with the originalreports cited]. Chromosome number of Barcella isunknown. Beccariophoenix has 2n = 36, and Jubaeopsisand Voanioala are both polyploids (Read, 1966; Robert-son, 1976; Johnson, 1989; Johnson et al., 1989).Baker et al. (1999), Asmussen et al. (2000), and
Hahn (2002a) analysed a broad sampling of the palmfamily using one or several plastid gene regions. Onlythree members of Cocoseae were included in the firsttwo studies, and two in the third, but in each casethey formed a monophyletic group with strong boot-strap (BP) support. The Cocoseae were more inten-sively sampled in Hahn’s (2002b) analysis ofsubfamily Arecoideae with three plastid genes. The 16cocosoid genera included formed a clade with weakBP. Monophyletic Elaeidinae and Bactridinae wereweakly supported as sisters, and Attaleinae sensu latowas a monophyletic sister clade to (Bactridinae, Elae-idinae). Attaleinae sens. str., Butiinae and Beccario-phoenicinae formed a paraphyletic grade and thelatter two are now submerged in Attaleinae (Drans-field et al., 2005, 2008). The genus Reinhardtia Liebm.[Arecoideae tribe Reinhardtieae sens. Dransfield et al.(2005, 2008)] was unexpectedly positioned as sister toCocoseae. Cocos nucifera resolved as sister to AttaleaH. B. K.Gunn (2004) obtained nucleotide sequences of the
nuclear gene prk from 34 taxa representing all generaof Cocoseae and analysed them with parsimony (MP),maximum likelihood (ML), and Bayesian (B) infer-ence. The MP analysis found two very well supportedclades, which were informally called the “spiny group”(a monophyletic Bactridinae and Elaeis; Barcella wassister to the rest of the tribe), and a “non-spiny” group[subtribe Attaleinae sens. Dransfield et al. (2005)].Cocos was sister to Parajubaea Burret, but only in the
ML tree. With MP or B, the position of Cocos wasunresolved. Using four plastid genes across the entirefamily, Asmussen et al. (2006) also recovered spiny(91% BP) and non-spiny (71% BP) clades, but thetribe as a whole had < 50% BP (Barcella was not rep-resented).Baker et al. (2009), using supertree and supermatrix
approaches combining plastid and nuclear sequences,restriction fragment length polymorphisms, and mor-phological characters across the entire palm family,resolved a well-supported Cocoseae in a clade withReinhardtia, followed by Roystonea. Within Cocoseae,monophyletic subtribes Attaleinae, Bactridinae, andElaeidineae (the latter as sister groups) had moderateto strong support. A later analysis of subfamily Ar-ecoideae (Baker et al., 2011) with two low copynuclear genes (PRK and PRB2) found some incongru-ent generic relationships within Cocoseae between thetwo loci. Gene PRB2 also placed Reinhardtia as sisterto subtribe Attaleinae, a position retained in the com-bined analysis. Meerow et al. (2009) analysed a su-permatrix of seven WRKY loci across 72 samples ofthe subtribe Attaleinae, with one species each of Bac-tris and Elaeis as outgroups. Syagrus appeared para-phyletic due to the nested inclusion of Lytocaryum,and was the sister genus to Cocos nucifera with strongBP. Attalea and Butia were both monophyletic, andJubaea was robustly sister to Butia. A novel sister rela-tionship of Allagoptera (including Polyandrococos) andParajubaea was resolved with high support, which wasalso confirmed by leaf anatomical evidence. Subcladeswithin Syagrus and Attalea were congruent with mor-phological and/or biogeographic data. A gene tree/spe-cies tree reconciliation approach was applied to thedata using gene tree bootstrapping (Page, 1998), whichwas partially informative.The WRKY transcription factors are predominantly
plant-specific proteins (a single WRKY locus is foundin the ancient eukaryote Giardia lamblia and the myce-tozoan Dictyostelium discoideum, but not in fungi andanimals (Zhang and Wang, 2005)) involved in severaldiverse pathways (reviewed in €Ulker and Somssich,2004). The loci are characterized by a highly conservedDNA binding domain containing the conservedWRKYGQK sequence, followed by a C2H2- orC2HC-type zinc finger motif. Eulgem et al. (2000) clas-sified these loci into groups and subgroups based uponthe number and type of WRKY domains, additionalamino acid motifs, and a phylogeny developed from58 loci isolated from Arabidopsis (DC.) Heynh. TheWRKY gene family has evolved primarily by large-scale duplications of entire genomic regions as a resultof separate polyploid events throughout plant evolu-tionary time (Bowers et al., 2003; Cannon et al., 2004;Thomas et al., 2006), with the rapid diversificationpredating the divergence of monocots and eudicots
2 A. W. Meerow et al. / Cladistics (2014)1–26

(Wu et al., 2005; Xiong et al., 2005). In Oryza sativasubsp. indica, 99 of the 102 described WRKY loci areunigenes; 97 of the 98 loci characterized in O. sativasubsp. japonica are unique (Ross et al., 2007). The util-ity of WRKY loci for phylogenetic analysis of angio-sperms has been demonstrated in Malvaceae (Borroneet al., 2007) and Arecaceae (Meerow et al., 2009), andmore detailed discussion of the structure, evolution,and low levels of paralogous variation in WRKY locican be found in these two papers.In this paper, we use sequences of six independent,
single copy WRKY loci originally isolated fromCocos nucifera to address the phylogeny of the entireCocoseae with concatenated MP, ML and B, as wellas three species-tree inference approaches. We wereinterested in testing the monophyly of all genera andwhether phylogenetic relationships within the Attalei-nae would change with the increased sampling ofElaeidinae and Bactridinae, as well as by the use ofmore distantly related outgroups than were employedin our previous analysis of Attaleinae alone (Meerowet al., 2009). To our knowledge, this paper, Meerowet al. (2009), and Bacon et al. (2012) are the onlymolecular phylogenetic studies in Arecacaeae thathave used species-tree approaches in addition to con-catenation.
Materials and methods
Sampling and DNA extraction, amplification,sequencing, and alignment
Sampling. DNA was isolated from living accessionsof 96 taxa (Table S1, Supporting Information), incultivation at the Montgomery Botanical Center,Fairchild Tropical Botanical Garden, or the NationalGermplasm Repository of the US Department ofAgriculture. Two species each of Roystonea (tribeRoystoneae) and Reinhardtia (tribe Reinhardtieae) wereused as outgroups. Tribe Reinhardtieae appears to bethe closest extant relative to the Cocoseae (Hahn,2002b). All species of the Attaleinae represented inMeerow et al. (2009) were included to test the overallphylogeny of the Cocoseae, but we eliminated themultiple sampling of those species as they hadpreviously resolved as clades (Meerow et al., 2009). Allgenera of Cocoseae subtribes Bactridinae andElaeidinae were sampled, with multiple individuals forone or more species in several genera as a consistencycheck. DNA was extracted from silica gel dried leafsamples using the BIO101 kit as described in Borroneet al. (2004). The quantity of DNA isolated wasassessed with a GeneQuant pro RNA/DNA calculator(Amersham Pharmacia Biotech, Piscataway, NJ, USA).Isolated DNA was stored at �80 °C until use.
WRKY gene isolation. The WRKY sequences wereisolated from Cocos nucifera as described in Mauro-Herrera et al. (2006) and Meerow et al. (2009). Of theseven loci used in our previous analyses of subtribeAttaleinae (Meerow et al., 2009), WRKY2 wasdropped from the current study due to its inability toamplify from any Bactris species. In fact, ampliconsfrom our primers for WRKY2 amplified WRKY12 inthat genus. We noted in our previous study (Meerowet al., 2009) that WRKY2 and WRKY12 had highsynteny and, of the seven loci, were most likely torepresent recent paralogs. Primers are listed in TableS2 (Supporting Information).
Amplification and sequencing. Amplificationscontained 200 nM of forward and reverse primer,200 lM dNTPs, 0.2 mg/mL bovine serum albumin,1 9 amplification buffer with 2 mM MgSO4, 0.025 U/lL reaction volume Taq DNA Polymerase (NewEngland Biolabs, Ipswich, MA, USA) and 10 ng oftemplate DNA brought to a total volume of 15 lL withnuclease-free H2O. Amplifications were conducted usingPTC-225 thermalcyclers (MJ Research, Waltham, MA,USA). Conditions were, 95 °C, 2 min; [95 °C, 30 s; 57–64 °C, 60 s; 72 °C, 60 s] 9 35 cycles; 72 °C, 10 min;4 °C, hold. The polymerase chain reaction (PCR)amplification was checked by electrophoresis in 1.2%agarose gel stained with ethidium bromide and underultraviolet (UV) light. Amplifications were treated withexonuclease I, followed by ethanol precipitation andresuspension in sterile H2O. In all cases, singlesequencing reactions were carried out with 1–2 lL ofthe cleaned-up product and the same primer used forinitial amplification. Cycle sequencing was performedwith BigDye Terminator Reaction kit Version 3.1 andvisualized on a ABI 3730 Genetic Analyzer (AppliedBiosystems, Foster City, CA, USA).
Cloning. Several taxa were cloned for each of thesix loci (Table S1, Supporting Information). Pre-cloning PCR was carried out with AmpliTaq (AppliedBiosystems), and PCR products were cloned intopGEM-T vector. Vectors were transformed intoJH109 high efficiency competent cells according to theinstructions of the manufacturer (Promega, Madison,WI, USA). Colonies were placed into 96-well platesand incubated overnight at 37 °C in SOC (superoptimal broth with catabolite repression) with 100 lg/mL ampicillin. Transformed cells were lysed by adding50 lL of 10 mM Tris–HCl pH 8.0. To confirm insertsize on agarose gel, 1 lL of the lysed cells solutionwas used as PCR template. After that confirmation,the PCR product was sequenced. The allelic variationexhibited for most clones was located at repeatregions of the introns. A few species had small indelpolymorphisms among the clones. In all cases, clones
A. W. Meerow et al. / Cladistics (2014)1–26 3
consistently resolved as sisters with 100% of BP whenincorporated into the analysis. No evidence ofparalogy was detected.
Alignment. Sequences were aligned using MAFFT(Katoh et al., 2002, 2005, 2009; Katoh and Toh, 2008;Katoh and Standley, 2013) and checked manually withSequencherTM 5.1 (Gene Codes Corporation, AnnArbor, MI, USA). The aligned lengths (Table 1)ranged from 732 bp (WRKY19) to 1098 bp(WRKY16). Only two of the locus alignments(WRKY7 and 12) included coding regions; theremaining four were intron sequences only. We testedthe exon alignments of both of these loci for positiveselection using two alignment wide methods, PARRIS(Scheffler et al., 2006), and evolutionary fingerprintdetection (Pond et al., 2010) with Datamonkey (Pondand Frost, 2005; Delport et al., 2010). Neither testfound any evidence of positive selection in these twoloci. A 20–100 bp region of the WRKY19 alignmentcontaining an interrupted ATT repeat was trimmedbecause it could not be aligned unambiguously acrossthe tribe.
Phylogenetic analyses
Supermatrix (concatenated) analyses. Alignedsequences for the six WRKY loci were analysedseparately and together using MP with PAUP*Version 4.0b10 (Swofford, 2002). Heuristic searcheswere conducted using the Fitch (equal) weights (Fitch,1971) criterion with 1000 rounds of random additionand saving up to 10 minimum length trees per searchfor swapping with tree bisection and reconnection(TBR). Tree branches were collapsed when theminimum length = 0. Gaps were (i) treated as missingdata and (ii) coded with simple coding (SIC; Simmonsand Ochoterena, 2000) using SeqState (M€uller, 2005).Jacknife was applied with 37% deletion (JK; Farriset al., 1996; 1000 heuristic replicates with simple
addition, TBR branch-swapping, saving 10 trees perreplicate). The cut-off JK value was 50%. The JKvalues were considered good (> 85%), moderate (75–85%), and weak support (≤ 75%). TreeRot version 3.0(Sorenson and Franzosa, 2007) was used forcalculating partitioned Bremer indices (Bremer, 1988)for the concatenated matrix. A total of 100 heuristicsearches were carried out for each constraint statementpostulated by TreeRot, saving up to ten trees persearch. A minimum DI = 2 was considered goodsupport for a clade (Meerow et al., 2009).Both partitioned and non-partitioned maximum ML
were conducted with Treefinder (Jobb, 2011), each rep-licated with 500 iterations, and subsequent BP (Felsen-stein, 1985) analysis (1000 iterations). A best-fitnucleotide substitution model was determined for eachgene region with KAKUSAN Version 4 (Tanabe,2007). Best-fit models were evaluated using the cor-rected Akaike Information Criterion (AICc; Akaike,1973; Shono, 2000). Significance of model-fit statisticswas determined by chi-square analysis. For partitionedML, a mixed model, retaining each partition’s best-fitnucleotide substitution model, was applied.
Divergence age estimation. BEAST Version 1.8.0(Drummond et al., 2012) was used to perform an ageestimation of divergence. The molecular clock wasassessed using the likelihood ratio test (LRT)implemented in the program HyPhy 2.2.0 (Pond et al.,2005) using the optimal substitution model, rates, andbase frequencies determined by KAKUSAN Version4.A global molecular clock was rejected for all six loci.
However, HyPhy detected evidence of local clock-ratesin portions of each tree. For the analysis in BEAST, alog-normal non-correlated relaxed clock model wasapplied with the following calibration points: for thestem node of Attaleinae, > 62 million years ago (Ma)was selected based on recent fossils described from thePaleocene of southern Argentina by Futey et al.
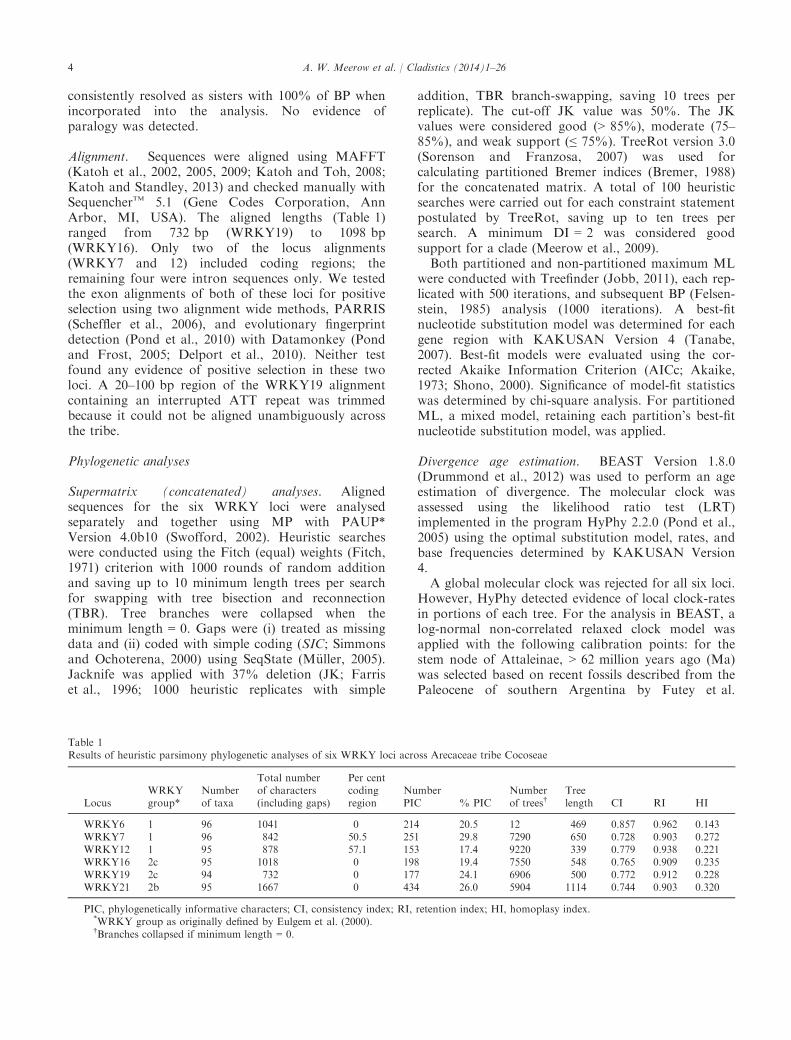
Table 1Results of heuristic parsimony phylogenetic analyses of six WRKY loci across Arecaceae tribe Cocoseae
LocusWRKYgroup*
Numberof taxa
Total numberof characters(including gaps)
Per centcodingregion
NumberPIC % PIC
Numberof trees†
Treelength CI RI HI
WRKY6 1 96 1041 0 214 20.5 12 469 0.857 0.962 0.143WRKY7 1 96 842 50.5 251 29.8 7290 650 0.728 0.903 0.272WRKY12 1 95 878 57.1 153 17.4 9220 339 0.779 0.938 0.221WRKY16 2c 95 1018 0 198 19.4 7550 548 0.765 0.909 0.235WRKY19 2c 94 732 0 177 24.1 6906 500 0.772 0.912 0.228WRKY21 2b 95 1667 0 434 26.0 5904 1114 0.744 0.903 0.320
PIC, phylogenetically informative characters; CI, consistency index; RI, retention index; HI, homoplasy index.*WRKY group as originally defined by Eulgem et al. (2000).†Branches collapsed if minimum length = 0.
4 A. W. Meerow et al. / Cladistics (2014)1–26
(2012). This was a more convincing fossil than thePaleocene fruit impression described from Colombiaby Gomez-Navarro et al. (2009) and assigned toCocos, which we used previously to calibrate the samenode as > 60 Ma (Meerow et al., 2009). Three othercalibration points were from the conservative schemeof Eiserhardt et al. (2011) in their analysis of Bactridi-nae: stem node of Bactridinae (> 40 Ma), crown nodeof Bactridinae (> 30 Ma), and stem node of Elaeis(> 20 Ma), all with a uniform prior, following Eiser-hardt et al. (2011). In all cases an upper bound of100 Ma was applied. A root height constraint of70 Ma was imposed, based on the mean stem age ofthe tribe Chamaedoreeae in Baker and Couvreur’s(2013a) age estimation for the entire Arecaceae(Chamaedoreeae is the next terminal branch belowRoystoneae in their tree) with a normal prior and astandard deviation of 3.0. The only monophyly con-straint was placed on Roystonea. Both partitioned andnon-partitioned analyses were run. For both analyses,a user-supplied starting tree (one of the 12 fullyresolved trees found by MP) was provided, after beingrendered ultrameric. A total of 100 million iterationswere carried out in BEAST, with log and tree samplesevery 5000th round. The total number of trees sampledwas 20 000, of which 5000 were discarded as burn-inbefore generating a maximum clade credibility (MCC)chronogram. Log output was evaluated in TracerVersion 1.5 (Rambaut and Drummond, 2005) to deter-mine whether stationarity was reached. TreeAnnotatorin BEAST was assisted to generate the MCC that wasvisualized with FigTree Version 1.4 (Rambaut, 2012).The non-partitioned analysis was run three times ondifferent machines as a consistency check.
Species tree estimation analyses. Species treeestimation was performed with three applications thatuse a multispecies coalescent model. The two Bapproaches were *BEAST (Heled and Drummond,2010) as implemented in BEAST Version 1.8.0(Drummond et al., 2012), and Bayesian concordanceanalysis (BCA; An�e et al., 2007) with BUCKy Version1.4.2 (Larget et al., 2010). A concordance factor (CF)represents the proportion of the genome sampled thatsupports a given node in a species tree (An�e et al., 2007;Baum, 2007). A ML approach was also taken with theprogram STELLS Version 1.6.1 (Wu, 2012). STELLSinfers a coalescent-based species tree from gene treetopologies under a model of incomplete lineage sorting.A partitioned analysis was run in *BEAST with 100
million Markov chain Monte Carlo (MCMC) itera-tions, under an uncorrelated relaxed clock (Drum-mond et al., 2006), with random starting trees for eachpartition generated under a constant population sizecoalescent model. A Yule model was applied as priorfor the species tree likelihood. The MCMC statistics
and trees were sampled every 5000 iterations. A MCCconsensus species tree was created from 15 000 trees(20 000 trees saved, less 5000 burn-in).MrBayes Version 3.2.1 (Ronquist et al., 2012) was
used to generate tree files for BCA in BUCKy. Fourreplicate analyses were run on each partition, with10 million iterations and four chains each, samplingevery 500 iterations, and a burn-in of 1000 for sum-marizing posterior samples of both parameter valuesand trees. The resulting tree files from the four runsfor each partition contained a total of 40 000 trees,which were transformed to BUCKy infiles using thembsum module of BUCKy, with a further burn-in of20 000. BUCKy was run four times for 10 millionMCMC updates each with four chains. Analyses wereconducted for three different a levels (a in BUCKy isan estimate of degree of incongruence, with 0 beingnone, and infinity the greatest). We used 1 (default),10, and 1000. BUCKy yields two types of speciestrees. The primary concordance tree is presented as afully resolved tree and may include clades that are in< 50% of the gene trees. The population tree is esti-mated from quartet concordance factors (i.e. there arethree possible quartets for each set of four taxa). Thequartet with highest CF is selected, and the tree isbuilt from all quartets retained using a quartet-joiningalgorithm (Ma et al., 2008). On each branch in thetree, the CFs of all quartets in agreement with thefour-way partition defined by the branch are averagedtogether. This quartet-based method recovers the“true” species tree if concordance factors are estimatedwithout error and all discordance is due to the coales-cent process along this tree (Degnan et al., 2009).Either strict or 50% majority rule consensus gene
trees for each of the six individual analyses of WRKYloci were submitted to STELLS for estimation of aspecies tree. We sacrificed some degree of accuracy forspeed, using the -S option, which restricted the searchof tree space such that only near-MDC optimal treesare evaluated (i.e. no NNI local search). How manynear-MDC optimal trees depends on the MDC level,which we set to 15 using the -d option (default is 5),and -c set to 25 (the number of configurations neededfor probability computation).
Tests for recombination (reticulation)
Tests of recombinant signal in each of the WRKY or-tholog alignments were conducted with RDP4 (Martinet al., 2005), a program for detecting and analysingrecombination signals in a set of aligned DNAsequences. The program uses a diverse set of algorithms:its own RDP method (Martin and Rybicki, 2000), boot-scanning (Salminen et al., 1995; Martin et al., 2005),GENECONV (Padidam et al., 1999), maximum chisquare (MaxChi; Maynard Smith, 1992; Posada and
A. W. Meerow et al. / Cladistics (2014)1–26 5
Crandall, 2001), Chimaera (Posada and Crandall, 2001),sister scanning (SiScan; Gibbs et al., 2000), 3SEQ (Boniet al., 2007), reticulate compatibility matrix (Jakobsenand Easteal, 1996) and TOPAL DSS (McGuire andWright, 1998, 2000). Breakpoint polishing and checkingfor misalignment were options that were invoked, andthe matrix was analysed with a requirement for phylo-genetic evidence for recombination signals.
Biogeographic analysis
Biogeographic analyses were conducted with RASPVersion 2.1b (Yu et al., 2013a) using the S-DIVA (Yuet al., 2010) method. The tree used was the non-parti-tioned Bayesian MCC tree from the age estimationanalysis of BEAST, Maximum area reconstructionswere limited to five. The 10 areas assigned to the 96terminal taxa in our matrix were based on the Ameri-can palm regions of Henderson et al. (1995) plus threeadditional for Old World taxa: A = Mexican region,B = Central American region, C = Caribbean region,D = Andean region, E = Amazon region, F = CentralBrazilian region (which includes similar biomes ofadjacent northern Argentina, Paraguay and Uruguay),G = Atlantic Coastal Forest, H = South Africa,I = Madagascar, J = Tropical Africa. For the pantrop-ical Cocos nucifera, we assigned only those areas ofthe Americas where the species is currently found inlarge populations, as Gunn (2004) and Meerow et al.(2009) clearly indicated that the species originated inSouth America.
Results
Analysis by locus
Only two of the locus alignments (WRKY7 and 12)included coding regions; the remaining four wereintron sequences only. The range of phylogeneticallyinformative characters (Table 1) was 153 (WRKY12)to 434 (WRKY21); on a percentage basis, the rangewas 17.4% (WRKY12) to 29.8% (WRKY7). The MPconsensus trees for individual loci are available as FigsS1–S6 in Supporting Information. Consistency indices(CI) were above 0.72 for all matrices investigated,while retention indices (RI) were always > 0.90(Table 1). The alignments for WRKY 16, 19, and 21required a great deal of gaps, mostly to account forthe three or four base insertions that were, in mostcases, autapomorphic for single taxa. Results obtainedwith the addition of binary indel matrices did not yieldadditional resolution to the trees, although BP valueswere slightly higher for some clades (not shown). Themost resolved and best supported gene trees werefound with the WRKY6 and WRKY7 alignments
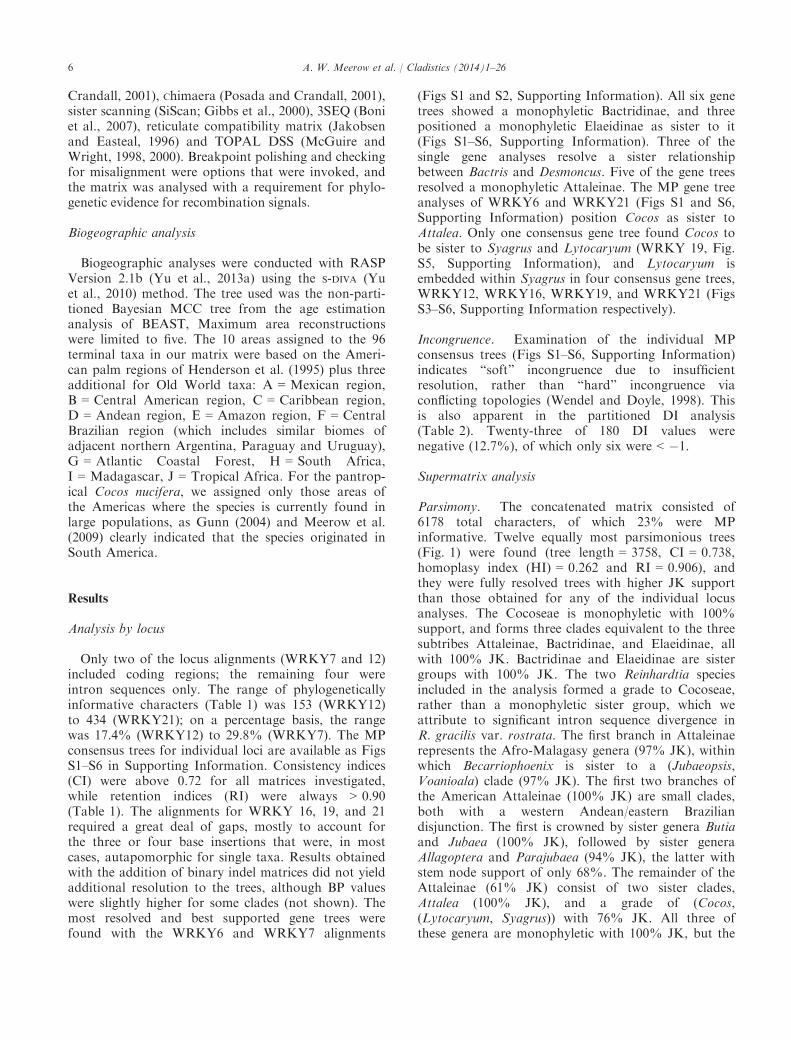
(Figs S1 and S2, Supporting Information). All six genetrees showed a monophyletic Bactridinae, and threepositioned a monophyletic Elaeidinae as sister to it(Figs S1–S6, Supporting Information). Three of thesingle gene analyses resolve a sister relationshipbetween Bactris and Desmoncus. Five of the gene treesresolved a monophyletic Attaleinae. The MP gene treeanalyses of WRKY6 and WRKY21 (Figs S1 and S6,Supporting Information) position Cocos as sister toAttalea. Only one consensus gene tree found Cocos tobe sister to Syagrus and Lytocaryum (WRKY 19, Fig.S5, Supporting Information), and Lytocaryum isembedded within Syagrus in four consensus gene trees,WRKY12, WRKY16, WRKY19, and WRKY21 (FigsS3–S6, Supporting Information respectively).
Incongruence. Examination of the individual MPconsensus trees (Figs S1–S6, Supporting Information)indicates “soft” incongruence due to insufficientresolution, rather than “hard” incongruence viaconflicting topologies (Wendel and Doyle, 1998). Thisis also apparent in the partitioned DI analysis(Table 2). Twenty-three of 180 DI values werenegative (12.7%), of which only six were < �1.
Supermatrix analysis
Parsimony. The concatenated matrix consisted of6178 total characters, of which 23% were MPinformative. Twelve equally most parsimonious trees(Fig. 1) were found (tree length = 3758, CI = 0.738,homoplasy index (HI) = 0.262 and RI = 0.906), andthey were fully resolved trees with higher JK supportthan those obtained for any of the individual locusanalyses. The Cocoseae is monophyletic with 100%support, and forms three clades equivalent to the threesubtribes Attaleinae, Bactridinae, and Elaeidinae, allwith 100% JK. Bactridinae and Elaeidinae are sistergroups with 100% JK. The two Reinhardtia speciesincluded in the analysis formed a grade to Cocoseae,rather than a monophyletic sister group, which weattribute to significant intron sequence divergence inR. gracilis var. rostrata. The first branch in Attaleinaerepresents the Afro-Malagasy genera (97% JK), withinwhich Becarriophoenix is sister to a (Jubaeopsis,Voanioala) clade (97% JK). The first two branches ofthe American Attaleinae (100% JK) are small clades,both with a western Andean/eastern Braziliandisjunction. The first is crowned by sister genera Butiaand Jubaea (100% JK), followed by sister generaAllagoptera and Parajubaea (94% JK), the latter withstem node support of only 68%. The remainder of theAttaleinae (61% JK) consist of two sister clades,Attalea (100% JK), and a grade of (Cocos,(Lytocaryum, Syagrus)) with 76% JK. All three ofthese genera are monophyletic with 100% JK, but the
6 A. W. Meerow et al. / Cladistics (2014)1–26
position of Cocos as sister to Syagrus and Lytocaryumis just at the threshold of moderate support.Within the Elaeidinae, Barcella was sister to Elaeis
(100% JK). The Bactridinae was well resolved withthe exception of Aiphanes, which forms a polytomywith two larger subclades. The first of these positionsAstrocaryum and Acrocomia as sister genera, albeitwith low support (68% JK). In half the 12 trees found,Aiphanes is sister to this clade. In the other half, Ai-phanes occupies a basal position in the subtribe. Thesecond subclade (79% JK) places Bactris as sister toDesmoncus.
Partition models. The best-scoring models for eachgene partition (G = gamma) were GTR-G (WRKY6,WRKY7, WRKY16, WRKY21) and HKY-G(WRKY12, WRKY19). The TVM-G model was thehighest scoring for the non-partitioned matrix.
Maximum likelihood. The ML trees (Figs S7 and S8,Supporting Information) were identical to the MPconsensus with a single exception, the resolution of
Aiphanes. In the non-partitioned ML analysis (Fig. S7,Supporting Information), Aiphanes is unresolved andAcrocomia and Astrocaryum are sister genera(BP < 50%), as occurs in half the 12 trees found withMP. In the partitioned ML analysis (Fig. S8,Supporting Information), Aiphanes is sister toAcrocomia (BP < 50%), a topology not represented inany of the 12 MP trees.
Bayesian analysis. The estimated sample size (ESS)scores in Tracer from the non-partitioned analysiswere all > 300, with most > 2000. Non-partitioned Banalysis of the combined data matrix was largelycongruent with MP and ML (Figs 1 and 2), except forthe resolution of Lytocaryum, which is embeddedwithin Syagrus, thus rendering the latter paraphyletic,and the position of Cocos as sister to Attalea. Theonly clades with posterior probability (PP) < 0.8 werenodes 7 (Fig. 1), the stem node of (Attalea, Cocos)(Fig. 2), the stem node of (Aiphanes, (Acrocomia,Astrocaryum)) (Fig. 2), and one internal node each inSyagrus and Butia. By contrast, the partitioned
Table 2Partitioned Bremer (decay) indices (DI) for the combined parsimony analysis of six WRKY loci across the Cocoseae. Refer to Fig. 1 for nodenumbers. Minus signs, including �0, indicate incongruity at that node for that locus. A �0 indicates that lack of Bremer support contributed tonode collapse
Node WRKY6 WRKY7 WRKY12 WRKY16 WRKY19 WRKY21
1 �1 4 6 5 3 42 5 3 6 1 7 43 4 4 2.5 2.5 1.5 1.54 0 0.5 0.5 0.5 �1.5 25 3 6 0 1 0 06 0 0 1 0.5 �1.5 27 0 2.5 �0 0 �0 �0.58 �1 1.5 �0 0 1 0.59 4 0 2 2 2 1410 0 �3 0.11 �0 4.2 2.7811 5 0 3 2 1 012 �0 �2.83 �0 0 �0.33 6.3313 14.33 12.17 3 12 �1 13.514 5 0 0.33 0.33 �2 2.3315 3 4.33 3 1 1 1216 0 3 0 0 �0 117 6 5.5 1 3 1 14.518 1 1.83 3 0 0 �0.8319 4 3.5 9 0 2 7.520 6 16.5 10 4 7 9.521 13.5 8 10 6.5 7.5 16.522 6 8.5 7 4 11 20.523 2 1 3 1 3 1024 �1 �6.5 3.5 2.5 0.5 625 2 4.5 4.5 5 5 1126 13 5 7 7 9 2527 �1 1 0 2 5 828 1 4.33 1 5.5 0.42 4.7529 1 �1 3 �1 0 430 5 5.5 3 3 3 4.5
A. W. Meerow et al. / Cladistics (2014)1–26 7
8 A. W. Meerow et al. / Cladistics (2014)1–26

analysis had lower ESS scores, even after a second rundoubling the number of iterations from 100 to200 million, with four remaining below 100. The MCCtree from the partitioned analysis (not shown) differedfrom the non-partitioned tree by twice as many nodeswith PP < 0.8 than in the non-partitioned analysis, butwith no differences in topology.
Estimating species trees from gene trees
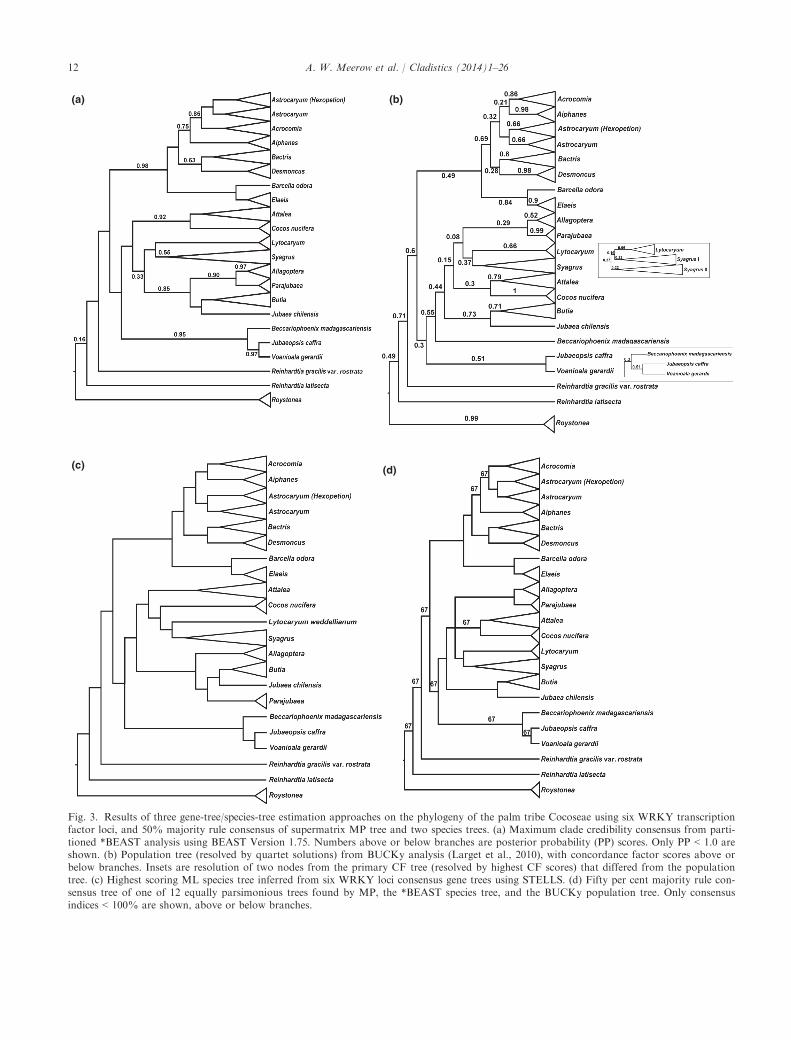
*BEAST. The ESS scores from the species treeanalysis were all > 100, with most > 1000. The MCCspecies tree from the *BEAST analysis (Fig. 3a and Fig.S9, Supporting Information) was well supported in thedeeper nodes of the tree, resolving the same threemonophyletic subtribes congruent with MP, PP = 1).Critical differences between it and the MP and MLsupermatrix topologies (Fig. 1) were, within Attaleinae:(i) the weak resolution of Cocos as sister to Attalea(PP = 0.53), rather than Syagrus, the two genera weaklyforming a sister clade to a monophyletic Lytocaryumand Syagrus (PP = 0.64); (ii) the genera Allagoptera andParajubaea in a clade (PP = 0.9) with Butia/Jubaea,rather than forming a grade as with MP. WithinBactridinae, Desmoncus is the first branch in thesubtribe (PP = 1), followed by Bactris (PP = 0.54).Aiphanes is weakly sister to an Acrocomia/Astrocaryumclade as is seen in half the MP trees, as well as the non-partitioned ML and B searches.
BUCKy. We found no differences among therespective primary CF consensus and population treesamong the three a levels set with BUCKy, and showthe results from the default (a = 1). The populationtree (Fig. 3b and Fig. S10, Supporting Information),which uses a quartet puzzle approach to resolve cladesbased on CF scores, positioned Lytocaryum as sister toa monophyletic Syagrus, placed the Butia/Jubaeasubclade as the first branch of the American Attaleinae,but failed to resolve Beccariophoenix madagascariensisin a clade with the two other Afro-Malagasy genera. Inthe CF tree (not shown except insets in Fig. 3b), whichresolves clades based solely on highest CF score,Syagrus was rendered paraphyletic by the position ofLytocaryum within it, with a low CF = 0.16. Supportfor (Cocos, Attalea) also had a low CF = 0.28.Likewise, (Bactris, Desmoncus) had a CF = 0.28, and(Aiphanes, Acrocomia) had a CF score = 0.21.(Allagoptera, Parajubaea) are sister to Lytocaryum andSyagrus.
STELLS. The species tree generated by STELLS(Fig. 3c and Fig. S11, Supporting Information) wascongruent with the supermatix MP and ML topology asregards the position of Cocos, Lytocaryum and Syagrus,and the relationship of Bactris and Desmoncus, butagrees with the CF topologies in resolving (Aiphanes,Acrocomia). However, Allagoptera and Parajubaea arepositioned in a grade that terminates with a Butia/Jubaea subclade. We used a shallow search option withSTELLS, which may result in less than optimumaccuracy in species tree estimation.Species relationships within each monophyletic
genus were largely congruent across all three speciestree estimations (Figs S9–S11, Supporting Informa-tion) and the supermatrix topologies (Figs 1 and 2),most completely within Bactridineae and Elaeidinae.Differences in terminal positions occurred within somesubclades of the larger genera, most notably in Syag-rus, but also in Butia, which was barely resolved in theMP consensus (Fig. 1), but had the same structure inthe ML (Figs S7 and S8, Supporting Information) andB (Fig. 2) trees. The same species groups resolvedwithin Attalea and Syagrus (Meerow et al., 2009) werestable in both supermatrix and species tree estimations(Fig. 1 and Figs S9–S11, Supporting Information).
Evidence of reticulation
The program RDP4 found some degree of recombi-nant signal in three of the six loci, WRKY16, 19, and21. These three alignments contain a large number ofgaps, especially WRKY19 and 21, which according tothe authors the program does not handle very well (D.Martin, pers. comm.). The only search algorithm thatdetected recombination events in the initial scan of theWRKY16 alignment was SiScan. Two events weredescribed in the initial search, one of which wasrejected after the refinement process described in theRDP manual. The accepted putative recombinationevent involved Syagrus schizophylla as the recombi-nant, with the major parent identified as S. cearensis,and the minor parent S. coronata, which after refine-ment was also supported by the MaxChi algorithm.The analysis conceded that S. cearensis could possiblybe the true recombinant, although if this possibilitywas tested, the identity of one of the parents becameunknown. With WRKY19, the single event found wassupported only by SiScan but with the following cave-ats: only one parental sequence could be identified,and the possible presence of a misalignment artefact
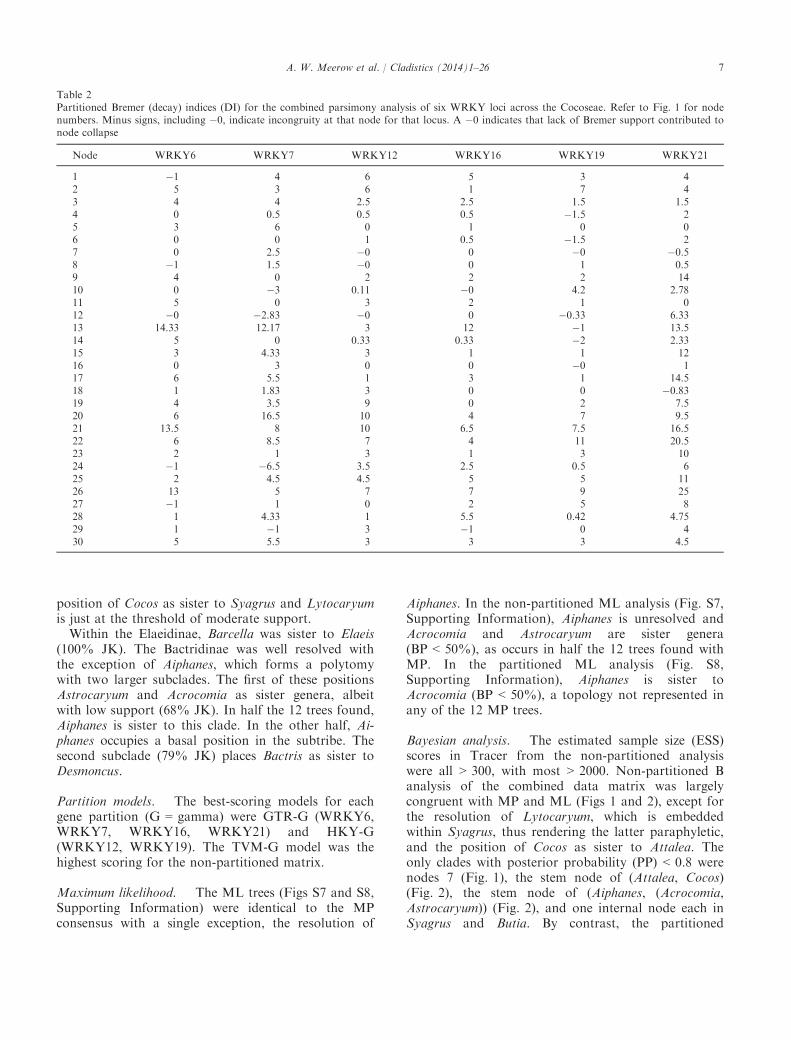
Fig. 1. Strict consensus tree of 12 equally parsimonious trees found by heuristic parsimony analysis of six combined WRKY loci sequencesaligned across Areceaceae tribe Cocoseae, with Roystonea and Reinhardtia as outgroups (Roystonea is the functional outgroup). Numbers abovebranches are parsimony jackknife support percentages. Numbers below branches are ML bootstrap (BP) support (non-partitioned analysis).Numbers at nodes are posterior probabilities from the non-partitioned BEAST analysis. The numbered nodes are referenced in Table 2 (parti-tioned decay indices). The inset box shows the ML resolution of Butia with BP percentages. * = 100% support.
A. W. Meerow et al. / Cladistics (2014)1–26 9
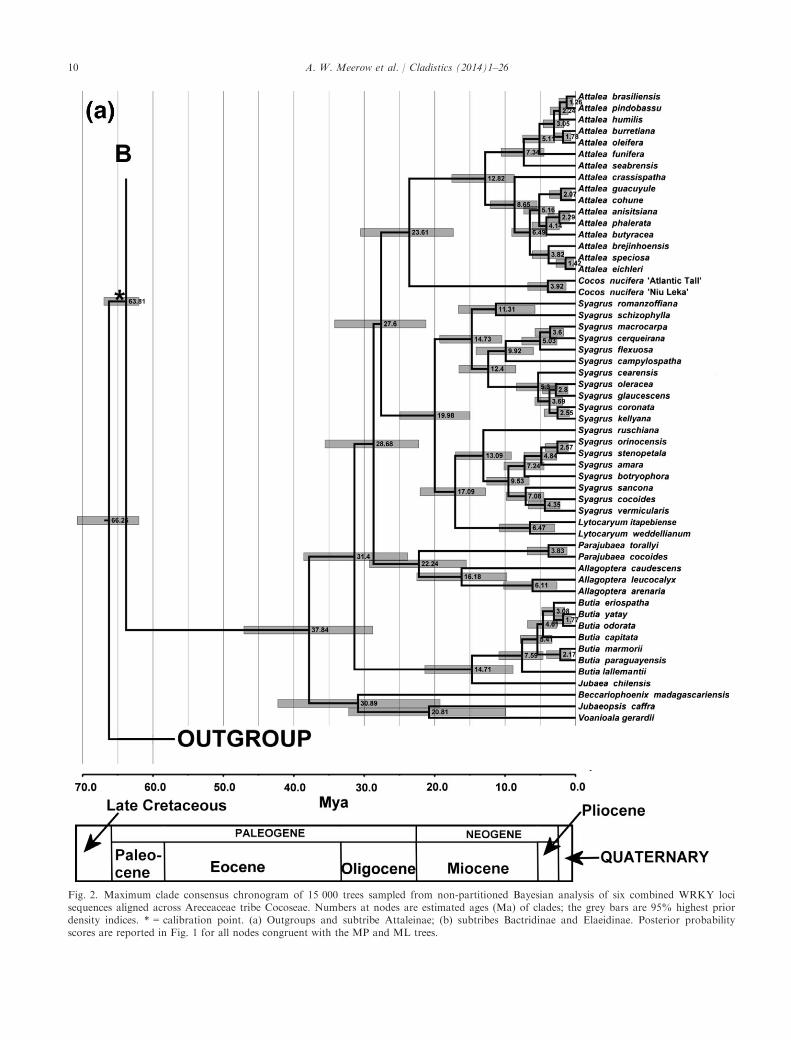
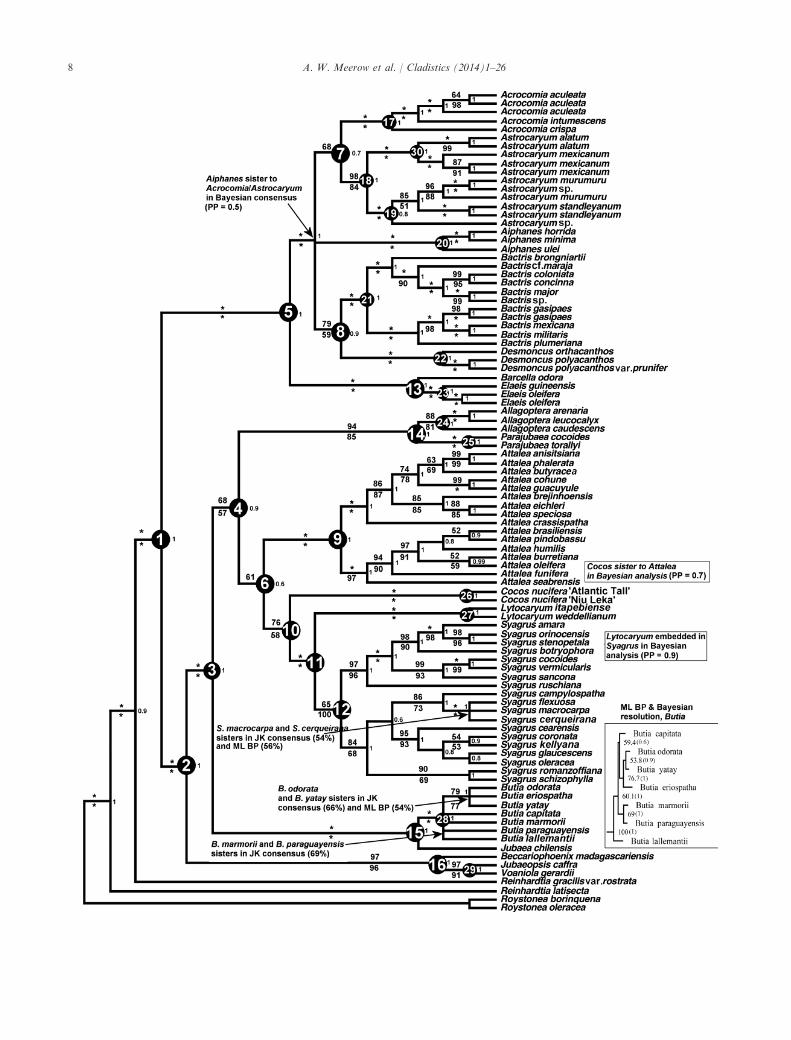
Fig. 2. Maximum clade consensus chronogram of 15 000 trees sampled from non-partitioned Bayesian analysis of six combined WRKY locisequences aligned across Areceaceae tribe Cocoseae. Numbers at nodes are estimated ages (Ma) of clades; the grey bars are 95% highest priordensity indices. * = calibration point. (a) Outgroups and subtribe Attaleinae; (b) subtribes Bactridinae and Elaeidinae. Posterior probabilityscores are reported in Fig. 1 for all nodes congruent with the MP and ML trees.
10 A. W. Meerow et al. / Cladistics (2014)1–26
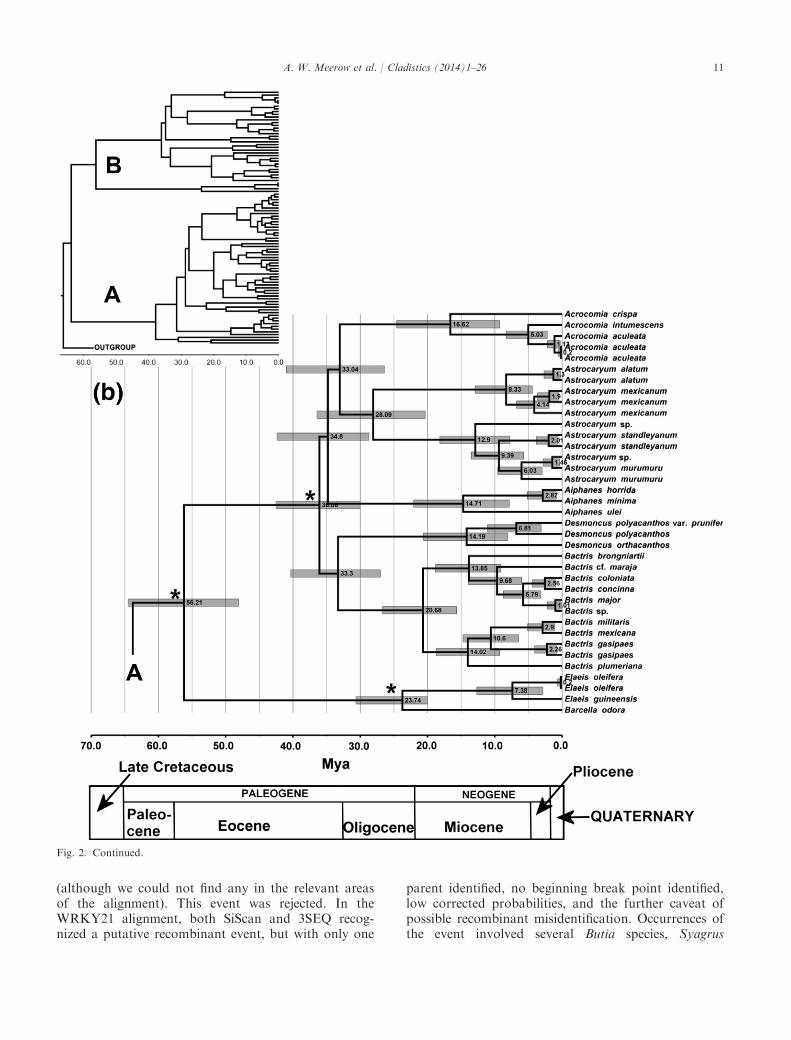
(although we could not find any in the relevant areasof the alignment). This event was rejected. In theWRKY21 alignment, both SiScan and 3SEQ recog-nized a putative recombinant event, but with only one
parent identified, no beginning break point identified,low corrected probabilities, and the further caveat ofpossible recombinant misidentification. Occurrences ofthe event involved several Butia species, Syagrus
Fig. 2. Continued.
A. W. Meerow et al. / Cladistics (2014)1–26 11
(a) (b)
(c) (d)
Fig. 3. Results of three gene-tree/species-tree estimation approaches on the phylogeny of the palm tribe Cocoseae using six WRKY transcriptionfactor loci, and 50% majority rule consensus of supermatrix MP tree and two species trees. (a) Maximum clade credibility consensus from parti-tioned *BEAST analysis using BEAST Version 1.75. Numbers above or below branches are posterior probability (PP) scores. Only PP < 1.0 areshown. (b) Population tree (resolved by quartet solutions) from BUCKy analysis (Larget et al., 2010), with concordance factor scores above orbelow branches. Insets are resolution of two nodes from the primary CF tree (resolved by highest CF scores) that differed from the populationtree. (c) Highest scoring ML species tree inferred from six WRKY loci consensus gene trees using STELLS. (d) Fifty per cent majority rule con-sensus tree of one of 12 equally parsimonious trees found by MP, the *BEAST species tree, and the BUCKy population tree. Only consensusindices < 100% are shown, above or below branches.
12 A. W. Meerow et al. / Cladistics (2014)1–26
schizophylla, Lytocaryum itapebiense, and even Jubaeachilensis. This was rejected.
Divergence age estimation
All three BEAST runs found the same tree topologyand PP scores, and age estimations differed amongthem by no more than 0.1%. We arbitrarily chooseone of the analyses as representative.The crown age of the Cocoseae was estimated at
63.8 Ma (95% highest posterior density (HPD) 62.0–68.2), which is also the stem age of the (Elaeidinae, Bac-tridinae) and Attaleinae clades (Fig. 2 and Table 3). Thecrown age of the Bactridinae/Elaeidinae clade is56.2 Ma (95% HPD 48.1–64.5). The crown age of Bac-tridinae is 36.1 Ma (95% HPD 30.0–42.5), with rapiddiversification of the two major subclades in the tribebetween 36 and 33 Ma. The crown age of Elaeidinae ismuch younger, at 23.7 Ma (95% HPD 20.0–30.7). TheAttaleinae is the oldest of the three subtribes, with acrown age of 37.8 Ma (95% HPD 28.8–47.1). WithinBactridinae, Astrocaryum has the oldest crown age at28.1 Ma (95% HPD 20.4–36.4). Overall, the major lin-eages within each subtribe appear to have originatedduring the Oligocene (33.9–23.0 Ma). Throughout theentire tribe, speciation within each genus dates noearlier than the Miocene (< 23 Ma).
Biogeographic analysis
Optimization of ancestral areas on the Bayesiansupermatrix tree (Fig. 4) with S-DIVA required 86 dis-
persals, 27 vicariance events, and one extinction (TableS3, Supporting Information). The sole extinction eventoccurred in an internal node of Syagrus (168). Areaoptimization at the deepest node of the tree (189, 190)had very low probabilities (P = 0.08 and 0.05, respec-tively; Fig. 4 and Table S3, Supporting Information),due to myriad alternative optimizations. Overall, 75%of the node area optimizations were supported byP = 1.0; the per cent < 0.5 was 14%, < 0.1 was 5%. Itshould be kept in mind that our sampling of the tribeis less than 50%, particularly subtribe Bactridinae,thus our results should not be considered a final wordon the biogeography of Cocoseae.The ancestral range of Cocoseae had five possible
optimizations (P = 0.05), all of which included theAmazon region (E); four of which included the An-dean region (D), Central Brazil (F) and Madagascar(I), followed by vicariance between the Amazon regionand Central Brazil–Atlantic Coastal Forest–Madagas-car. The crown node of subtribe Attaleinae (189,Fig. 4b, P = 0.083) is optimized among four compositeareas, all four including Madagascar (I), and threeincluding the Andean region (D), Central Brazil (F),and/or the Atlantic Coastal Forest (G), with subse-quent dispersal to the Andes and vicariance betweenMadagascar (I) and South America (DFG). The crownnode of the Afro-Malagasy subclade (188) is Madagas-car with no events hypothesized and high probability(P = 1.0), followed by dispersal to South Africa (187;P = 1.0). The crown node of the American Attaleinae(186, P = 0.33) is optimized ambiguously as AtlanticCoastal Forest region (G) across several combinations
Table 3Selected taxon ages (means) and their 95% highest posterior density (HPD) intervals from age divergence analysis with BEAST of Arecaceaetribe Cocoseae using a supermatrix of six WRKY loci (Fig. 2)
Taxon Stem age (Ma) 95% HPD interval (Ma) Crown age (Ma) 95% HPD interval (Ma)
Acrocomia 33.04 26.42–40.99 16.62 9.19–24.43Aiphanes 34.80 28.71–42.38 14.71 7.84–22.06(Allagoptera, Parajubaea) 28.68 22.27–35.57 22.24 15.52–29.23Allagoptera 22.24 15.52–29.23 16.18 9.74–22.53Astrocaryum 33.04 26.42–40.99 28.09 20.35–36.43Attalea 23.61 17.35–30.51 12.82 8.68–17.57Attaleinae 63.81 62.00–66.97 37.84 28.79–47.08Afro-MalagasyAttaleinae 37.84 28.79–47.08 30.89 19.23–42.27Bactridinae 56.21 48.10–64.51 36.06 30.00–42.53Bactris 33.30 27.01–40.35 20.68 15.68–26.69(Butia, Jubaea) 31.40 23.82–38.59 14.71 8.87–21.39Butia 14.71 8.87–21.39 7.59 4.61–10.89Cocos 23.61 17.35–30.51 3.92 1.34–6.78Cocoseae 66.26 62.00–70.60 63.81 62.00–68.22Desmoncus 33.30 27.01–40.35 14.19 8.12–20.59Elaeidinae 56.21 48.10–64.51 23.74 20.00–30.65Elaeis 23.74 20.00–30.65 7.38 2.86–12.69Jubaea 14.71 8.87–21.39 n/a n/aLytocaryum 17.09 12.80–22.05 6.47 2.94–10.98Parajubaea 22.24 15.52–29.23 3.83 1.20–6.86Syagrus (Lytocaryum embedded) 27.60 21.23–34.32 19.98 14.99–24.95
A. W. Meerow et al. / Cladistics (2014)1–26 13
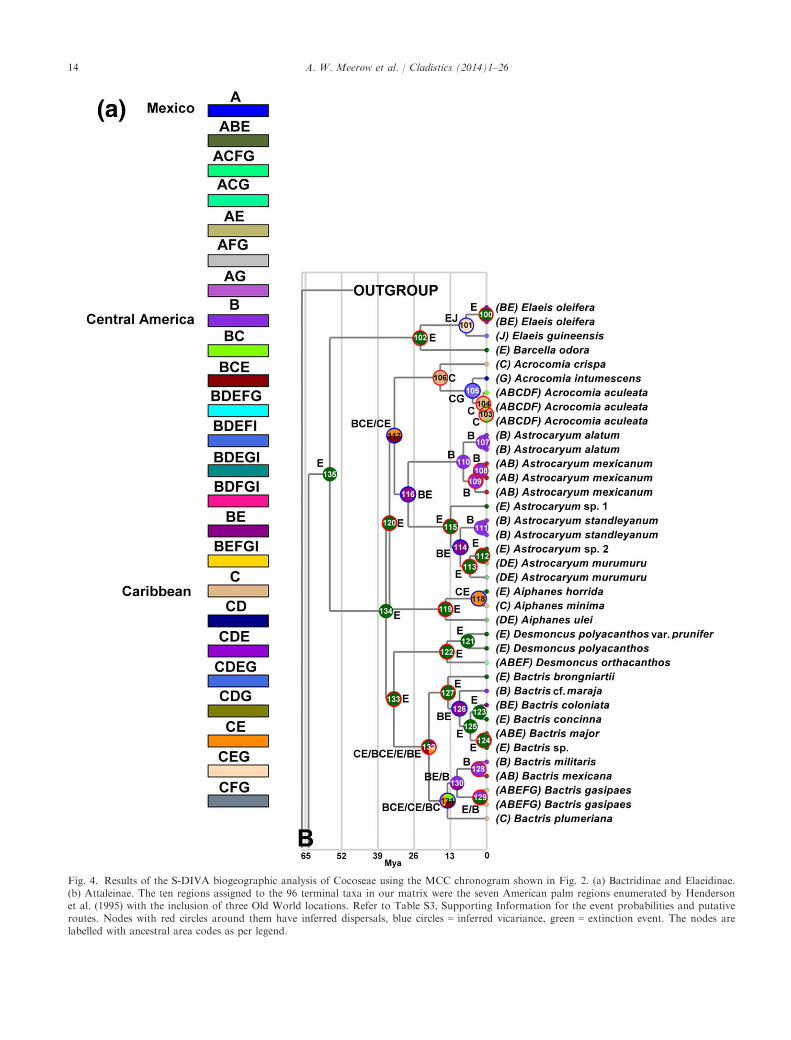
Fig. 4. Results of the S-DIVA biogeographic analysis of Cocoseae using the MCC chronogram shown in Fig. 2. (a) Bactridinae and Elaeidinae.(b) Attaleinae. The ten regions assigned to the 96 terminal taxa in our matrix were the seven American palm regions enumerated by Hendersonet al. (1995) with the inclusion of three Old World locations. Refer to Table S3, Supporting Information for the event probabilities and putativeroutes. Nodes with red circles around them have inferred dispersals, blue circles = inferred vicariance, green = extinction event. The nodes arelabelled with ancestral area codes as per legend.
14 A. W. Meerow et al. / Cladistics (2014)1–26
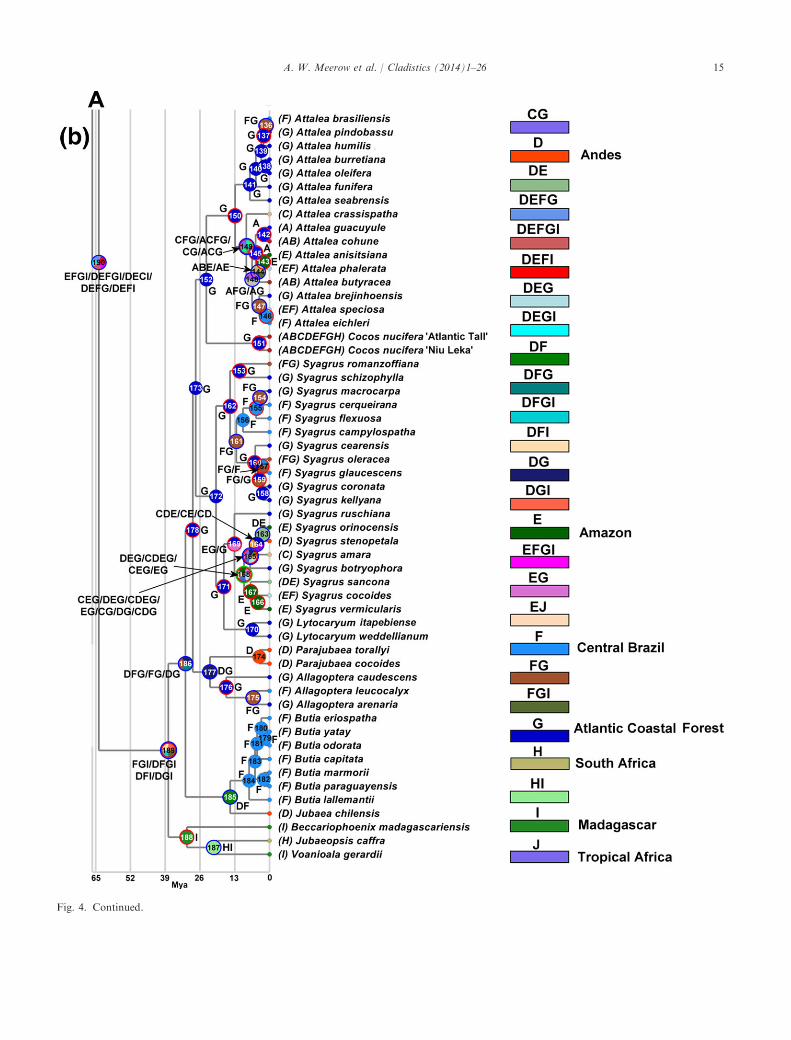
Fig. 4. Continued.
A. W. Meerow et al. / Cladistics (2014)1–26 15

with both the Andean (D) and Central Brazilianregion (F), with subsequent vicariance between theAtlantic Coastal Forest and Central Brazil–Andes.The crown node of the Jubaea/Butia clade (185) beginsin the Andean region and Central Brazil, followed byvicariance between the two regions. All of the internalnodes within Butia (184–179) are optimized in CentralBrazil (F) with high probability (P = 1.0). The area ofthe stem node of the Allagoptera/Parajubaea subclade(178) is optimized as Atlantic Coastal Forest (G,P = 1.0), with one dispersal to the Andes, followed byvicariance between the two areas at the crown node(177, P = 1.0), with stasis in the Andes for Parajubaea(node 174, P = 1.0). Allagoptera dispersed from ances-tral Atlantic Coastal Forest (node 176, P = 1.0) toCentral Brazil (node 175, P = 1.0), ultimately with avicariance event between the two areas. The ancestralarea at the stem node (173, P = 1.0) for the (Cocos,Attalea) and (Syagrus—with Lytocaryum embedded)subclades was optimized as Atlantic Coastal Forest(G) with stasis until dispersal occurred to the Amazonat the crown node of the “rain forest clade” of Syagrus(169, P = 0.1). Two internal nodes in this subcladehad poorly supported and ambiguous optimizations(168, P = 0.029; 165, P = 0.048), involving the Carib-bean, Andean, Amazon, and Atlantic Coastal Forestregions, and one extinction event, ostensibly in the An-dean region. At nodes 167 and 166 in this subclade ofSyagrus, both ancestrally optimized in the Amazonregion, there occurred dispersal to the Andes and Cen-tral Brazil, respectively (P = 1.0 at both nodes). Thecrown node of the second subclade of Syagrus isancestrally optimized in the Atlantic Coastal Forestregion (G, node 162, P = 1.0), dispersing to CentralBrazil (node 161, P = 1.0) with subsequent vicariance(node 160, P = 0.5; 153, P = 1.0), then dispersing backto Central Brazil (157, P = 0.5). The remaining nodes(156–153) in Syagrus are optimized between CentralBrazil and the Atlantic Coastal Forest, with mostlydispersal and vicariance events (Fig. 4 and Table S3,Supporting Information), all with P = 1.0.The stem node of Cocos and Attalea (152) is opti-
mized ancestrally in the Atlantic Coastal Forest region(P = 1.0) with no events hypothesized. From thecrown node of Cocos, ancestrally optimized in theAtlantic Coastal Forest region (node 151, P = 1.0), 14dispersals are predicted to account for the coconut’sbroad terminal distribution. The crown node of Atta-lea (150) has an ancestral optimization in the AtlanticCoastal Forest region (G, P = 0.25). Nodes 141–136(all with P = 1.0), representing the Attalea sensu strictoclade, are all ancestrally optimized in this same region,with stasis (nodes 141–138), one dispersal to CentralBrazil (node 137) and vicariance between the tworegions (136). The second subclade of Attalea (nodes149–142), comprising the Orbignya and Scheelea
groups, is more wide-ranging, and involves a complexrange expansion via dispersal from an ambiguouslyoptimized crown node (149, P = 0.13) involving theCaribbean, Central Brazil, and the Atlantic CoastalForest, and possibly Mexico, mostly followed by vicar-iance (nodes 149–147, 136), between the Caribbeanand all mainland optimized areas. At the stem node ofthe Bactridinae and Elaeidinae (135, P = 1.0; Fig. 4a),as well as at the crown node for Bactridinae (134,P = 1.0), there was stasis in the ancestral Amazonregion. The crown node of Elaeidinae (102, P = 1.0) isplaced in this same ancestral area, followed by onesubsequent dispersal event to tropical Africa (J). Atthe crown node of Elaeis, a vicariance occurs betweenAmazonas and tropical Africa (node 101, P = 1.0).The crown node of the Aiphanes–Acrocomia–Astrocar-yum subclade (120) is optimized ancestrally in theAmazon, with two dispersal events to Central Americaand the Caribbean (node 120, P = 0.5). The crownnode of Aiphanes (119, P = 1.0) is ancestrally opti-mized in the Amazon region, with two later dispersalsto the Andes and Caribbean. The stem node of Astro-caryum and Acrocomia (117, P = 0.5) involved dis-persal from Central America, Amazonas and theCaribbean (or alternatively just the Caribbean andAmazon) with eventual vicariance between the islandsand the mainland. The crown node of Astrocaryum(116, P = 1.0) is placed in Central America (B) andthe Amazon (E), with subsequent vicariance betweenthe two regions. The crown node of the subgroupHexopetion subclade (110, P = 1.0) is optimized withinthe Central American region from where dispersal toMexico occurred at both nodes 109 and 108 (P = 1.0).The Amazon is the optimized ancestral area for thecrown node (115, P = 1.0) of the second clade of As-trocaryum, which ultimately dispersed to CentralAmerica, with later vicariance at node 114 (P = 1.0) tothe Andes (nodes 113 and 112, P = 1.0).The crown node of Acrocomia (106) is placed ances-
trally in the Caribbean (106, P = 1.), ultimately dis-persing to the Atlantic Coastal Forest region withvicarance between the two areas (node 105, P = 1.0).The ancestral area of the crown node for the secondsubclade of Bactridinae (133, P = 0.25) is optimized asthe Amazon, with dispersal into the Caribbean andCentral America. The crown node of Bactris is opti-mized with low probability (132, P = 0.08) and hasfour possible ancestral optimizations, all involving theAmazon region, by itself or with either the Caribbean,Central America, or both. Three subsequent nodes(131, 130, 129) in the B. gasipaes subclade are ambigu-ously optimized and have relatively low probabilities(P = 0.17, 0.25, and 0.5, respectively), involving Cen-tral America, the Caribbean, and the Amazon region.The second subclade of Bactris is optimized at itscrown node as Amazonian (127, P = 1.0) with dis-
16 A. W. Meerow et al. / Cladistics (2014)1–26
persal to Central America, followed by vicariance atnode 126 (P = 1.0) between the two areas. The remain-ing nodes within Bactris (125, 124, 123) are assignedto the Amazon region ancestrally with stasis at node125 (P = 1.0), followed by dispersals to Mexico andCentral America (124, P = 1.0), or to only CentralAmerica (123, P = 1.0). Desmoncus (nodes 122 and121) is ancestrally optimized within the Amazon regionwith three dispersals to Mexico, Central America andCentral Brazil (122, P = 1.0) or stasis (121, P = 1.0).
Discussion
Concatenation versus incongruent species trees
The heterogeneity of gene trees, and their conflict withspecies trees, can be caused by several phenomena: geneduplication/extinction, horizontal gene transfer andhybridization, and incomplete lineage sorting or deepcoalescence (Maddison, 1997; Maddison and Knowles,2006; Degnan and Rosenberg, 2009; Edwards, 2009;Knowles, 2009; Anderson et al., 2012). The develop-ment of species tree estimation methods such as*BEAST (Heled and Drummond, 2010), BEST (Liu andPearl, 2007) and BUCKy (An�e et al., 2007) attempt toprovide a consensus approach that overcomes thepotential inaccuracies of supermatrix topologies(Edwards et al., 2007). Most of these methods implyonly incomplete lineage sorting as the source of genetree incongruence (Nakhleh, 2013). Although a fewrecent reconciliation approaches incorporate hybridiza-tion as well as deep coalescence and gene duplication intheir algorithms (Bansal et al., 2012; Stolzer et al., 2012;Yu et al., 2012, 2013b), most of these require a speciestree topology in addition to gene trees as input.Supermatrix and species tree estimation approaches
are completely congruent in supporting the three sub-tribes in the tribe Cocoseae with good support (Figs 1and 2)—Attaleinae, Bactridinae, and Elaeidinae—andthe latter two as sister groups: this same resolution ofthe three subtribes was also found by others usingplastid and/or nuclear loci (Hahn, 2002b; Asmussenet al., 2006; Baker et al., 2009).Also supported is the monophyly of all genera with
the exception of Syagrus in the BEAST supermatrixanalysis (Fig. 2b). There is discordance among thethree species trees (Fig. 3) in terms of some intergener-ic relationships, as well as between them and superma-trix trees (Fig. 1). These species tree estimationapproaches can be sensitive to inherent lack of resolu-tion in the gene trees themselves (Betancour-R et al.,2013; Corl and Ellegren, 2013), which is obvious forthree of our loci, WRKY 16, 19, and 21 (Figs S4–S6,Supporting Information). A number of authors havefound that concatenation delivers more strongly sup-
ported phylogenies than coalescent-based species-treeapproaches (Brumfield et al., 2008; Thomson et al.,2008; Leache, 2010; Townsend et al., 2011). It haseven been suggested that if a significant proportion ofthe loci used in species tree analysis result in poorlyresolved gene trees, the resulting species tree may benot only poorly supported, but also inaccurate (Liuet al., 2008; Heled and Drummond, 2010; Townsendet al., 2011; Betancour-R et al., 2013). On the otherhand, concatenation may sometimes drive the emer-gence of “hidden support” (Townsend et al., 2011),which implies weak positive contributions from eachpartition that cumulatively result in greater resolution.There has also begun to be some questioning of thevalidity of the multispecies coalescent model in phylog-enetics (Springer and Gatesy, 2014), and Reid et al.(2014) demonstrated that phylogenetic sequence datasets fit the coalescent model rather poorly (they testedthe coalescent model used by *BEAST across 25 mul-tilocus data sets).
The possibility of reticulation. What are theconsequences of recombination on species treeestimation? Using simulations, Lanier and Knowles(2012) concluded that species tree estimation isrelatively robust in the face of recombination. Of thethree loci that tested positively for putative recombinantsequence, only in WRKY16 was an event involvingthree species of Syagrus accepted, due to support fromtwo different recombinant break-point discoveryalgorithms, and a deficit of caveats raised by thesoftware itself in evaluating these events. The threespecies were S. schizophylla as the recombinant, withparent sequences identified in S. cearensis andS. coronata. Syagrus 9 costae Glassman (1970) is arecognized hybrid of S. coronata and S. cearensis(Noblick, 2004) that is not represented in our data (thusRDP4’s flag that the actual recombinant may bemisidentified). The recognition of two parents of aknown hybrid in Syagrus by RDP4 (Martin et al., 2010)lends credence to the event, even if S. schizophylla iswrongly identified as the recombinant.We will now discuss each of the two larger clades of
Cocoseae in turn, highlighting differences among theresults presented here, our earlier analysis of the Atta-leinae (Meerow et al., 2009), four previous phylogeniesof the Bactridinae or component genera (Couvreuret al., 2007; Eiserhardt et al., 2011; Ludena et al.,2011; Roncal et al., 2013) and Baker and Couvreur’s(2013a,b), historical biogeographic and diversificationanalyses of the palm family.
Phylogeny of the Attaleinae
There are several notable differences in resolution ofthe American Attaleinae in this current study from our
A. W. Meerow et al. / Cladistics (2014)1–26 17
previous phylogeny of this subtribe (Meerow et al.,2009), which only included 1 or 2 members of Bactrid-inae and Elaeidinae as outgroup. Lytocaryum isresolved as sister to Syagrus in the MP and ML su-permatrix trees (Fig. 1), and in all of the species treeanalyses (Fig. 3), instead of being embedded in Syag-rus (Meerow et al., 2009). The latter position occursonly in the B supermatrix tree. Although Cocos is stillplaced as sister to a Lytocaryum/Syagrus subclade inthe MP and ML supermatrix analyses (Fig. 1), supportis lower than in Meerow et al. (2009). This is the mostcontroversial node of our supermatrix topology; twoof our species tree estimation analyses position Cocosas sister to Attalea (Fig. 3a, b), as does the B analysisof the supermatrix, although never with very strongsupport. Our ML species tree (Fig. 3c) agrees with theMP and ML supermatrix topology. We tested the sis-ter relationship of Cocos and Attalea as a constrainton the supermatrix with MP, and found that only fouradditional base substitutions were required to supportthis resolution. Like Attalea, Cocos has a fibrousmesocarp, unlike the fleshy mesocarp of Syagrus andLytocaryum (Dransfield et al., 2008). It is important tonote that the single gene analyses of WRKY6 (Fig. S1,Supporting Information) and WRKY21 (Fig. S6, Sup-porting Information), resolve Cocos as sister to Atta-lea. Only one gene tree resolves Cocos as sister toSyagrus and Lytocaryum, WRKY 19 (Fig. S5, Sup-porting Information). This ambiguity may reflectincomplete lineage sorting in the nuclear genome, butin any event we reject the poorly supported position ofCocos as sister to Parajubaea in Gunn (2004) andBaker et al. (2009). We are inclined to accept the sisterrelationship of Cocos and Attalea as the more likelyscenario, given the consensus of two species tree esti-mation approaches (Fig. 3) and two of the single geneMP consensus topologies, as well as fruit morphology.Hydrochory, the dispersal mechanism in Cocos, isknown in Attalea as well (Orozco-Segovia et al., 2003).Likewise controversial is whether Lytocaryum is sisterto Syagrus. Again, it is necessary to look at the MPconsensus gene trees, four of which render Syagrus pa-raphyletic by embedding Lytocaryum within it (FigsS3–S6, Supporting Information). It is only when all sixloci are combined that a sister relationship emerges(Fig. 1). Yet this is also supported by all three of ourspecies trees (Fig. 3a–c). The question that perhapsshould be asked, then, is whether there is much meritmaintaining Lytocaryum as a genus distinct from Sy-agrus, regardless of which resolution is the “true” one.A novel clade in the previous analysis of Attaleinae
(Meerow et al., 2009) united Allagoptera and Paraju-baea, which was also supported by leaf anatomy. Inthat study, this clade was sister to the only other thatshows a similar eastern Brazilian/western Andeanvicariance, Butia and its monotypic sister Jubaea,
although with weak MP support (BP = 66%). They inturn were weakly resolved as sister to Attalea.(BP = 72%). In our current supermatrix, these twoclades form a grade at the base of the American Atta-leinae (Fig. 1), a resolution that does not explicitlyappear in any of the species trees (Figs 2 and 3). Sup-port in the supermatrix for Allagoptera/Parajubaea asthe second branch in this grade is weak, however(JK = 57%, ML BP = 68%), and the sister relationshipresolved in the *BEAST species tree (PP = 0.9) may bea more accurate resolution. (Butia, Jubaea) was posi-tioned as the first branch in Baker et al. (2009) superm-atrix consensus and most congruent supertree, as wellas in the slightly expanded and reanalysed supermatrixtree used by Baker and Couvreur (2013a,b) in their bi-ogeographic and diversification analyses.In the two largest genera of Attaleinae, Attalea and
Syagrus, Meerow et al. (2009) resolved species groupsthat remain intact in the current analyses (Figs 1 and2). In Attalea, these groups represented former segre-gates of the genus: a Scheelea clade, a paraphyletic (toScheelea) Orbignya group and an Attalea sensu strictoclade. In Syagrus, we can still recognize the same“rainforest, Eastern Brazilian, and cluster-stem” cladesas we did in Meerow et al. (2009), and we refer read-ers to that paper and to Noblick (2013) for moredetailed discussion.
Divergence age estimation. Our mean age estimatesfor most generic crown ages from the current analysisare relatively close to those we obtained from ananalysis of only subtribe Attaleinae (Meerow et al.,2009); for example, Afro-Malagasy clade (i.e.Beccariophoenx, Jubaeopsis, Voanioala), 30.9 Macurrent, 28.5 Ma (Meerow et al., 2009); Attaleinae,37.8, 43.7 Ma; Allagoptera, 16.2, 20.4 Ma; Attalea,12.8, 13.0 Ma; Butia, 7.6, 8.1 Ma; Syagrus, 20.0,27.0 Ma. There is more disagreement than agreementbetween our mean age estimations and those of Bakerand Couvreur (2013a,b), with ours always older: Bakerand Couvreur (2013a,b) reported only stem ages forindividual genera in their Appendix S3. Percentagedifference between Baker and Couvreur’s (2013a) stem-age estimates and ours (Table 3) for seven genera of theAttaleinae ranged from only 1.4% (Allagoptera) to asmuch as 224.7% (Syagrus), with a mean of 93.1%(� 84.6%). Although their stem and crown ages forAttaleinae as a whole (55.87 and 36.2 Ma, respectively)compare favourably with ours (63.8 and 37.7 Ma;Fig. 2 and Table 3), their generic chronogram differsfrom ours in the resolution of Cocoseae at some criticalnodes, which probably affects generic stem and crownages. For example, the Afro-Malagasy genera form abasal grade in Attaleinae, rather than a sister to theAmerican clade of the subtribe, in their analyses, andCocos resolves as sister to Parajubaea. Our depth of
18 A. W. Meerow et al. / Cladistics (2014)1–26

sampling of Cocoseae is also much greater, which mostcertainly influences age estimation (Linder et al., 2005;Roncal et al., 2013).
Phylogeny of Bactridinae
Eiserhardt et al. (2011) presented the most well-sam-pled previous phylogenetic analysis of subtribe Bac-tridinae using five plastid regions and three nuclearmarkers with a supermatrix approach. Neither ourWRKY-based supermatrix or any of the species treeestimations we undertook are highly congruent withtheir trees. A sister relationship between Bactris andDesmoncus, which Eiserhardt et al. (2011) concededwas suggested on morphological grounds (inflorescencestructure) was not resolved in any of their trees, but issupported by our supermatrix (Fig. 1), and two of thespecies trees estimations (Figs 2b, c and 3). This reso-lution was also found by Baker et al. (2009) in theirsupertree analysis but not in their supermatrix consen-sus, and by Couvreur et al. (2011) in their reanalysisof Baker et al. (2009) supermatrix data, but not inRoncal et al. (2013) analysis of Astrocaryum. Superm-atrix support for this relationship is nonetheless weakto moderate (JK = 59%, ML BP = 79), except with B(PP = 0.9).Our weakly supported sister relationship between
Acrocomia and Astrocaryum (JK = 68%, Fig. 1;PP = 0.53, Fig. 3a) did not appear in Eiserhardt et al.’s(2011) trees; instead, they resolved Astrocaryum as sisterto Bactris, and Acrocomia in a clade with Desmoncus.This result was diagnosed as largely influenced by oneof their nuclear partitions, the gene RPB2 (Eiserhardtet al., 2011). Roncal et al. (2013) also captured the samerelationships in their analysis, which included two ofthe same genes as Eiserhardt et al. (2011). Several ear-lier studies (Hahn, 2002b; Baker et al., 2009) placedAcrocomia at the base of Bactridinae, a position thatwas strongly a consequence of plastid ndhF sequences(Eiserhardt et al., 2011). In our study, Acrocomia eitherresolves as sister to Astrocaryum in our supermatrixtrees (MP, B, Fig. 1), and B (Fig. 3a) and ML speciestrees (Fig. 3c), or as sister to Aiphanes in the BUCKypopulation tree (Fig. 3b), but only with weak support.Acrocomia has pistillate flowers with distinct, imbricatepetals, whereas in all other genera of Bactridinae, thepetals of pistillate flowers are connate for one-third tohalf their length (Dransfield et al., 2008). This conditionin Acrocomia has been interpreted as plesiomorphic andtherefore supporting the basal position of that genus(Eiserhardt et al., 2011). This is not obvious from ourtrees, none of which position Acrocomia as sister to therest of the subtribe (Figs 1–3). However, the presence offloral pits and associated bracts in Acrocomia andAstrocaryum, which Eiserhardt et al. (2011) interpretedas homoplasious based on the position of these two
genera in their trees, do support the close relationshipof these two genera resolved by our supermatrix (Fig. 1)and the *BEAST species tree (Fig. 3a). In Baker andCouvreur (2013a) supermatrix tree, Acrocomia,Aiphanes and Astrocaryum form a grade at the base ofBactridinae.Aiphanes is the most problematic member of the
subtribe in our trees. The genus appears unresolved inthe supermatrix MP consensus (Fig. 1) because half ofMP trees position it as sister to the rest of the sub-tribe, and half as sister to an Acrocomia/Astrocaryumclade, which B analysis of the supermatrix weakly sup-ports, along with the *BEAST estimated species trees(Fig. 3a). Other species trees place Aiphanes as sisterto Acrocomia (Fig. 3b, c), a resolution also supportedby Ludena et al. (2011) with the nuclear genesAGAMOUS1 and PHYB. Roncal et al. (2013)resolved Aiphanes as sister to Bactris and Astrocaryum.Acrocomia and Aiphanes, to the exclusion of the restof Bactridinae, share the root anatomical character ofinner cortex thick-walled fibre bundles in conjunctionwith stegmata (Tomlinson et al., 2011); however, theseso-called “Raphia-type” fibres have evolved at leastfive times in the family (Tomlinson et al., 2011), whichdoes not rule out its evolution in the most recent com-mon ancestor of a terminal Acrocomia/Astrocaryumclade, followed by loss in Astrocaryum. The congruenttrend from all of our analyses, supermatrix and spe-cies-tree estimation alike, is that Acrocomia, Astrocar-yum and Aiphanes are more closely related to eachother than to Bactris and Desmoncus.
Divergence age estimation. Our estimates of cladeages in Bactridinae were in many cases similar tothose of Eiserhardt et al. (2011). Their mean stem-ageestimates for the subtribe varied from 49.1 to54.1 Ma, depending on the calibration scheme used,not far removed from our estimated mean of 56.2 Ma(95% HPD 48.1–64.5) for the stem. Similarly, ourcrown-age mean of 36.1 Ma (95% HPD 30.0–42.5)compares favourably with Eiserhardt et al.’s (2011)estimate of 35.5–39.1 Ma, but less so with Roncalet al.’s (2013) mean crown-age estimate of 43.1 Ma.Baker and Couvreur’s (2013a) stem-age estimate of35 Ma and crown age of 22.3 Ma for the subtribe isconsiderably younger than ours. Eiserhardt et al.’s(2011) stem-age estimates of 32.1–38.9 Ma (dependingon calibration scheme) for Aiphanes are not farremoved from our mean of 34.8; their crown ageestimates, 23.4–28.3 Ma, are considerably older thanour mean of 14.7 Ma. Our crown-age estimate forDesmoncus (14.2 Ma, 95% HPD 8.1–20.6) is alsoyounger than Eiserhardt et al. (2011), which wasreported as 17.8–21.4 Ma. However, their crown-ageestimates for Astrocaryum, (26.3–32.3 Ma) were quiteclose to ours (28.1 Ma, 95% HPD 20.4–36.4), whereas
A. W. Meerow et al. / Cladistics (2014)1–26 19
that of Roncal et al. (2013) was somewhat younger(20.6 Ma, 95% HPD 14.6–27.7). Of the five genera forwhich stem ages were estimated in Baker andCouvreur (2013a), the percentage difference betweentheir estimates and ours ranged from 48.2%(Acrocomia) to 162.2% (Bactris and Desmoncus), witha mean of 116.1% (�48.1%).
Infrageneric relationships in Bactridinae. As resolvedhere and previously by Eiserhardt et al. (2011),Ludena et al. (2011), and Roncal et al. (2013), thecontroversial segregation of Hexopetion fromAstrocaryum (Pintaud et al., 2008) does not violatemonophyly, but we support recognition at asubspecific rank rather than as a sister genus. Bactris,the largest genus of Bactridinae with 73 species(Henderson, 2000), is consistently split into twosubclades in all of our supermatrix analyses (Figs 1and 2) with good support. One clade includesB. gasipaes with B. mexicana and B. militaris (Mexicoand northern Central America, respectively), and theCaribbean B. plumeriana sister to the rest. The secondsubclade is predominantly southern Central Americaand South American; but the broadly dispersedB. brongiartii and B. major extend this clade into thenorthern portions of the Neotropics as well(Henderson, 2000). Our sampling differs substantiallyfrom that of Couvreur et al. (2007) and Eiserhardtet al. (2011), making it difficult to directly compareour trees with theirs; resolution was poor in theformer. The congruence and high support for thephylogenetic substructure within Bactris in our study(Figs 1 and 3) suggest that a broader sampling withthese WRKY loci would be informative.
Historical biogeography of the Cocoseae
Baker and Couvreur’s (2013a) biogeographic anddivergence age-estimation analysis of Arecaceae sup-ported Uhl and Dransfield’s (1987) hypothesis that theearliest diversification of modern palm lineages tookplace during the mid-Cretaceous in Laurasia. Subfam-ily Arecoideae subsequently expanded into SouthAmerica and was extirpated in North America beforethe subfamily’s crown-age mean of 74 Ma (Baker andCouvreur, 2013a). Many of the earliest branching tri-bal lineages diversified in South America as well.Biogeographic analysis presents a divergence history
for Arecaceae tribe Cocoseae dominated by dispersalevents, which outnumber vicariances threefoldthroughout the entire chronogram (Fig. 4), despite thefact that the palm family overall has been assessed asdispersal limited (Kissling et al., 2012b). The Cocoseaeis rich in animal-dispersed fruits (Zona and Hender-son, 1989; Dransfield et al., 2008), which may allowexceptions to this generalized view. Extinction events
were rare, occurring only once (node168). This is inaccord with Couvreur et al.’s (2011) consensus thatextinction was a minor component of the evolutionaryhistory of Arecaceae at least until the Neogene. OurS-DIVA analysis suggests that the ancestral area ofthe Cocoseae (crown node, node 190 in Fig. 4) couldhave comprised five of the seven palm regions of Hen-derson et al. (1995), excluding Mexico and CentralAmerica, but including Madagascar as well, ratherthan only South America as determined by Baker andCouvreur (2013a) with dispersal–extinction–cladogene-sis analysis (Ree and Smith, 2008). The origins (stem)of the tribe date to the late Cretaceous (Fig. 2 andTable 3), when direct connections between Africa andSouth America were severed (Raven and Axelrod,1974), and when the asteroid impact at the Cretae-cous–Tertiary (K-T) boundary, ca. 65.5 Ma (Schulteet al., 2010) resulted in extinction of nearly a third ofterrestrial vegetation and great declines in speciesabundance (Nichols and Johnson, 2008). The extinc-tion rate in tropical North America may have been ashigh as 60–70% (Nichols and Johnson, 2008). Theeffects of the K-T boundary impact on palms are notclear, but there is a 26 Ma gap between the stem(63.8 Ma, 95% HPD 62.0–67.0) and crown (37.8 Ma,95% HPD 28.8–47.1) nodes of the Attaleinae. Thismay indicate that massive extinction occurred veryearly in the history of this lineage, despite Couvreuret al.’s (2011) conclusion that extinction has been aminimal vector of evolution in the Arecaceae and itsrelatively low frequency in our S-DIVA analysis(Table S3, Supporting Information).Great diversification of palms seems to have
occurred during the Paleocene, particularly in thenorthern region of South America (Herngreen andChlonova, 1981; Morley, 2000), which fits the meancrown age of Cocoseae (63.8 Ma, 95% HPD 62.0–68.2; Fig. 2 and Table 3), and agrees reasonably wellwith estimates by Gunn (2004) and Baker and Couvr-eur (2013a). Although there is evidence of decline inthe abundance of fossil palm in South America duringthe early Eocene, this appears not to have been accom-panied by loss of diversity (Morley, 2000). The stemnode for both Bactridineae and Elaeidinae (node 135in Fig. 4; 56.2 Ma, 95% HPD 48.10–64.51, Fig. 2 andTable 3) was dated to the Paleocene–Eocene bound-ary. As with the earlier branching Attaleinae, a32.5 Myr gap between stem and crown (23.7 Ma 95%HPD 20.0–30.7) nodes of Elaeidinae may be evidenceof extinction. The stem–crown gap is smaller for Bac-tridinae (21.2 Myr; Table S3), but is still significant.The terminal Eocene global cooling event had little
effect on the South American flora, including palms(Morley, 2000), but resulted in massive extinctions inWest Africa, very notably of palms (Morley, 2000;Kissling et al., 2012a; Blach-Overgaard et al., 2013).
20 A. W. Meerow et al. / Cladistics (2014)1–26
There is no way to know with certainty if there wereany ancient cocosoid lineages in continental Africa asthere is a complete absence of African fossils of thetribe before ca. 6 Ma Elaeis pollen (Pan et al., 2006);an earlier Miocene (11–22.5 Ma) reference for WestAfrican Elaeis pollen by Gunn (2004), citing Muller(1981), is not mentioned by either Harley (2006) orPan et al. (2006).There are no known African Bactridinae, and the
sole representative of Elaeidinae in Africa is E. guine-ensis, which, by our age estimation, is a late Miocenedivergence from the Central American E. oleifera(Figs 2 and 4). In our biogeographic analysis (Fig. 4),dispersal to Central Africa (C) does not occur untilnode 101 (Fig. 4), thus we conclude that the presenceof Elaeis in Africa is a relatively recent long-distancedispersal event.Establishment of the major clades of Bactridinae
does, however, appear congruent with the terminalEocene cooling event (Eiserhardt et al., 2011), withstem ages for most of the subclades ranging from 33to 34 Ma (Figs 2 and 4 and Table 3). Central Americafigures importantly in most of the early nodes of diver-sification in the subtribe (Fig. 4 and Table S3, Sup-porting Information) as well as in its sister, Elaeidinae.This may reflect the importance of the Greater Antillesand the Aves Ridge land bridge (GAARlandia, 33–35 Ma) in the dispersal of the Bactridinae betweenCentral and South America during the Eocene–Oligo-cene boundary (Iturralde-Vinent and MacPhee, 1999;Roncal et al., 2013). By contrast, Attaleinae appearabsent from Central America (not counting Cocos nu-cifera) until the late Neogene entry of Attalea, perhapsfrom the West Indies (Fig. 4 and Table S3, SupportingInformation).Modern African representation of the Attaleinae is
restricted to three relics, a monotypic genus on themainland (Jubaeopsis), and two Madagascar endemicgenera (Beccariophoenix, three spp., and Voanioala,monotypic), although our analyses indicate that Mada-gascar was colonized before South Africa (Figs 2 and4). Jubaeopsis and Voanioala are both high polyploids(Read, 1966; Johnson, 1989), Voanioala with the highestchromosome number known in the monocotyledons(Johnson et al., 1989), which has been suggested as evi-dence of a long period of isolation and autopolyploidi-zation (Johnson et al., 1989). Dispersal to Madagascardid not occur until the late Eocene (node 189 in Fig. 4),with a date of 37.8 Ma (95% HPD 28.79–47.08, Fig. 2and Table 3) for the most recent common ancestor ofthe Afro-Malagasy and American Attaleinae. Two pos-sible routes for this vicariance are (i) migration via Ant-arctica during the Eocene thermal maximum (Baker andCouvreur, 2013b), or (ii) dispersal via southern Africawhere rainforest vegetation occurred during the Eocene(Morley, 2000, 2007). The presence of fossil palm pollen
associated with other tropical rainforest flora in Eocenedeposits in Antarctica (Pross et al., 2012) would supportthe former, as would fossils attributed to Cocoseae fromthe Eocene of India and New Zealand (Gunn, 2004), ifcorrectly identified, and Paleocene fossil endocarpsassigned to Attaleinae from Patagonia, Argentina (Fu-tey et al., 2012). Gunn (2004) resolved Jubaeopsis as sis-ter to the American Attaleinae and suggested that itarrived in South Africa via long distance dispersal in theEocene. Based on our analysis, which infers a Micoeneorigin for the genus (Fig. 2 and Table 3) from a Mala-gasy ancestor (Fig. 4), this seems unlikely.Area optimization (Fig. 4 and Table S3, Supporting
Information) indicates that the ancestral American At-taleinae were restricted to the Andes and eastern andcentral Brazil during the Eocene–Oligocene boundary(e.g. node 186). The stem-age means of the (Butia,Jubaea) and (Allagoptera, Parajubaea) clades are31.4 Ma (95% HPD 23.8–38.6) and 28.7 Ma (95%HPD 22.3–35.6) respectively. Both clades exhibit a dis-junction between western South America and EasternBrazil. As Meerow et al. (2009) discussed, the earlyMiocene divergence between Parajubaea and Allagop-tera corresponds to the flooding of western Amazoniacaused by the uplift of the Eastern Cordillera of theCentral Andes in the early Miocene and subsequentCaribbean marine incursion to the north (Lundberget al., 1998; Wesselingh et al., 2002; Wesselingh, 2006;Wesselingh and Salo, 2006; Antonelli et al., 2009), whenan enormous system of long-lived lakes and wetlands(“Lake Pebas” or the “Pebas Sea”) was formed that pro-vided a significant barrier to dispersal from easternSouth America to the Andes lasting until the Late Mio-cene. This time period also coincides with the divergenceof Cocos and Attalea, and the earliest diversificationwithin Syagrus (Fig. 2 and Table 3). Roncal et al.(2013) considered the Pebas system as a major con-straint on the diversification and colonization within As-trocaryum. Although the Butia-Jubaea clade is the firstbranch of the American Attaleinae (Figs 1 and 3), thedivergence between the two genera took place ca.8.5 Ma, after that of Allagoptera and Parajubaea (Fig. 2and Table 3), suggesting that other forces, such as theAndean uplift (Gregory-Wodzicki, 2000; Garzioneet al., 2008; Antonelli et al., 2009), were responsible forthe divergence of Butia and Jubaea, a lower latitudinalvicariance.Based on our estimated dates, much of the subse-
quent diversification within the genera of Cocoseaecan be attributed to the Andean uplift from late Mio-cene through the Pliocene (Van der Hammen et al.,1973; Van der Hammen, 1979; Garzione et al., 2008;Kissling et al., 2012a), and Pleistocene fluctuations inthe extent and location of rainforest and seasonallydry climates in South America (Haffer, 1987; Prance,1987). Species-level divergences in most of the genera
A. W. Meerow et al. / Cladistics (2014)1–26 21
are concentrated within the past 10 Myr, as has beenestimated for other Neotropical taxa (Richardsonet al., 2001; Kay et al., 2005; Linder, 2008; Penningtonet al., 2010; Nagalingum et al., 2011; Kissling et al.,2012b). Other than the pantropical Cocos nucifera, theonly two species of Attaleinae found in the Caribbeanare both endemics, Attalea crassispatha in Haiti andSyagrus amara in the Lesser Antilles, with Neogenedivergence dates from their respective congeners(Figs 2 and 4). The same is true for the Caribbean en-demics among the Bactridinae represented in ourmatrix (i. e. Acrocomia crispa, Aiphanes minima, Bac-tris plumeriana). Overall, there is a reasonable degreeof conformance to the timing of area events in Coco-seae with the general area cladogram of Morrone(2014) based on 36 animal and plant taxa.
Conclusions
Neither a supermatrix analysis nor any one species-tree estimation probably represents the true phylogenyof Arecaceae tribe Cocoseae. However, evaluatedtogether, the analyses presented in this paper provideus the most accurate picture of the evolutionary historyof the tribe to date. A consensus approach (Fig. 3d)indicates that there is more congruence across the vari-ous methodologies than incongruence. In the Bactridi-nae, two well-supported clades unite Bactris andDesmoncus, for which there is morphological support(Eiserhardt et al., 2011), with the second formed byAcrocomia, Aiphanes, and Astrocaryum. Acrocomia andAstrocaryum are most likely sister genera. In the Amer-ican Attaleinae, the Butia–Jubaea subclade is the earli-est branch, but it is unclear if Allagoptera–Parajubaea,with a similar east/west disjunct, is a sister clade or thenext branch in a grade. As regards the shifting land-scape of the relationships of Cocos, the sum total ofavailable evidence, including individual gene-tree reso-lution, compels us to accept the sister relationshipbetween Cocos and Attalea. The position of Lytocar-yum is less straightforward, given that four of six sin-gle-gene MP topologies (Figs S3–S6, SupportingInformation) embed the genus within Syagrus. Given,the congruence of concatenated MP and ML analyses(Fig. 1), and the *BEAST species tree (Fig. 3a),BUCKy population tree (Fig. 3b) and STELLS MLspecies tree (Fig. 3c), we are inclined to accept Lytocar-yum as sister to Syagrus, but suggest that it be sub-sumed taxonomically under the latter genus.Our broad-based phylogenetic approach provides the
most well-resolved hypothesis of generic relationshipswithin the Cocoseae (Fig. 3d). Various species tree esti-mation approaches can inform a supermatrix phylog-eny, even when there is incongruence. With theavailability now of a complete genome sequence for
Elaeis guineensis (Singh et al., 2013), a completeplastid sequence (Huang et al., 2013) and nucleartranscriptome for Cocos nucifera (Fan et al., 2013), andperhaps soon a complete genome for coconut (Alsaihatiet al., 2014), there is ample opportunity to mine theseresources for additional single-copy genes or massivelyparallel next-generation sequencing that could helpresolve the ambiguities that still remain in achieving awell-supported, fully resolved phylogeny of the econom-ically most important tribe in the palm family.
Acknowledgements
We gratefully acknowledge the receipt of genomicDNA of Barcella odora from Conny Asmussen. Wealso thank Wolf Eiserhardt, William Baker, and ananonymous reviewer for their useful comments.
References
Akaike, H., 1973. Information theory and an extension of themaximum likelihood principle. In: Petrov, B.N., Csaki, F. (Eds.),Second International Symposium on Information Theory.Akademia Kiado, Budapest, pp. 267–281.
Alsaihati, B., Liu, W., Lin, Q., Al-Mssallem, I.S., 2014. Coconutgenome de novo sequencing. Poster presented at Plant andAnimal Genome (PAG) Meeting XXII, San Diego.
Anderson, C.N., Liu, L., Pearl, D., Edwards, S.V., 2012. Tangledtrees: the challenge of inferring species trees from coalescent andnoncoalescent genes. Methods Mol. Biol. 856, 3–28.
An�e, C., Larget, B., Baum, D.A., Smith, S.D., Rokas, A., 2007.Bayesian estimation of concordance among gene trees. Mol. Biol.Evol. 24, 412–426.
Antonelli, A., Nylander, J.A.A., Persson, C., Sanmart�ın, I., 2009.Tracing the impact of the Andean uplift on neotropical plantevolution. Proc. Natl Acad. Sci. USA 106, 9749–9754.
Asmussen, C.B., Baker, W.J., Dransfield, J., 2000. Phylogeny of thepalm family (Arecaceae) based on rps16 intron and trnL–trnFplastid DNA sequences. In: Wilson, K.L., Morrison, D.A. (Eds.),Systematics and Evolution of Monocots. CSIRO Publishing,Collingwood, Victoria, pp. 525–537.
Asmussen, C.B., Dransfield, J., Deickmann, V., Barfod, A.S.,Pintaud, J.-C., Baker, W.J., 2006. A new subfamily classificationof the palm family (Arecaceae): evidence from plastid DNAphylogeny. Bot. J. Linn. Soc. 151, 15–38.
Bacon, C.D., McKenna, M.J., Simmons, M.P., Wagner, W.L., 2012.Evaluating multiple criteria for species delimitation: an empiricalexample using Hawaiian palms (Arecaceae: Pritchardia). BMCEvol. Biol. 12, 23.
Baker, W.J., Couvreur, T.L.P., 2013a. Global biogeography anddiversification of palms sheds light on the evolution of tropicallineages. J. Biogeog. 40, 274–285.
Baker, W.J., Couvreur, T.L.P., 2013b. Global biogeography anddiversification of palms sheds light on the evolution of tropicallineages. I. Diversification history and origin of regionalassemblages. J. Biogeog. 40, 286–298.
Baker, W.J., Asmussen, C.B., Barrow, S.C., Dransfield, J.,Hedderson, T.A., 1999. A phylogenetic study of the palm family(Palmae) based on chloroplast DNA sequences from the trnL-trnF region. Pl. Syst. Evol. 219, 111–126.
Baker, W.J., Savolainen, V., Asmussen-Lange, C.B., Chase, M.W.,Dransfield, J., Forest, F., Harley, M.M., Uhl, N.W., Wilkinson,M., 2009. Complete generic-level phylogenetic analyses of palms
22 A. W. Meerow et al. / Cladistics (2014)1–26
(Arecaceae) with comparisons of supertree and supermatrixapproaches. Syst. Biol. 58, 240–256.
Baker, W.J., Norup, M.V., Clarkson, J.J., Couvreur, T.L.P., Dowe,J.L., Lewis, C.E., Pintaud, J.C., Savolainen, V., Wilmot, T.,Chase, M.W., 2011. Phylogenetic relationships among arecoidpalms (Arecaceae: Arecoideae). Ann. Bot. 108, 1417–1432.
Balick, M.J., Beck, H.T., 1990. Useful Palms of the World.Columbia University Press, New York.
Bansal, M.S., Alm, E.J., Kellis, M., 2012. Efficient algorithms forthe reconciliation problem with gene duplication, horizontaltransfer and loss. Bioinformatics 28, I283–I291.
Baum, D.A., 2007. Concordance trees, concordance factors, and theexploration of reticulate genealogy. Taxon 56, 416–427.
Betancour-R, R., Li., C., Munroe, T.A., Ballesteros, J.A., Ort�ı, G.,2013. Addressing gene tree discordance and non-stationarity toresolve a multi-locus phylogeny of the flatfishes (Teleostei:Pleuronectiformes). Syst. Biol. 62, 763–785.
Blach-Overgaard, A., Kissling, W.D., Dransfield, J., Balslev, H.,Svenning, J.-C., 2013. Multimillion-year climatic effects on palmspecies diversity in Africa. Ecology 94, 2426–2435.
Boni, M.F., Posada, D., Feldman, M.W., 2007. An exactnonparametric method for inferring mosaic structure in sequencetriplets. Genetics 176, 1035–1047.
Borrone, J.W., Kuhn, D.N., Schnell, R.J., 2004. Isolation,characterization, and development of WRKY genes as usefulgenetic markers in Theobroma cacao. Theor. Appl. Genet. 109,495–507.
Borrone, J.W., Meerow, A.W., Kuhn, D.N., Whitlock, B.A.,Schnell, R.J., 2007. The potential of the WRKY gene family forphylogenetic reconstruction: an example from the Malvaceae.Mol. Phylogenet. Evol. 44, 1141–1154.
Bowers, J.E., Chapman, B.A., Rong, J., Patterson, A.H., 2003.Unravelling angiosperm genome evolution by phylogeneticanalysis of chromosomal duplication events. Nature 422, 433–438.
Bremer, K., 1988. The limits of amino acid sequence data inangiosperm phylogenetic reconstruction. Evolution 42, 795–803.
Brumfield, R.T., Liu, L., Lum, D.E., Edwards, S.V., 2008.Comparison of species tree methods for reconstructing thephylogeny of bearded manakins (Aves: Pipridae, Manacus) frommultilocus sequence data. Syst. Biol. 57, 719–731.
Cannon, S.B., Mitra, A., Baumgarten, A., Young, N.D., May, G.,2004. The roles of segmental and tandem gene duplication in theevolution of large gene families in Arabidopsis thaliana. BMCPlant Biol. 4, 10.
Corl, A., Ellegren, H., 2013. Sampling strategies for species trees: theeffects on phylogenetic inference of the number of genes, numberof individuals, and whether loci are mitochondrial, sex-linked, orautosomal. Mol. Phylogenet. Evol. 67, 358–366.
Couvreur, T.L.P., Hahn, W.J., de Granville, J.J., Pham, J.L.,Ludena, B., Pintaud, J.C., 2007. Phylogenetic relationships of thecultivated neotropical palm Bactris gasipaes (Arecaceae) with itswild relatives inferred from chloroplast and nuclear DNApolymorphisms. Syst. Bot. 32, 519–530.
Couvreur, T.L.P., Forest, F., Baker, W.J., 2011. Origin and globaldiversification patterns of tropical rain forests: inferences from acomplete genus-level phylogeny of palms. BMC Biol. 9, 44.
Degnan, J.H., Rosenberg, N.A., 2009. Gene tree discordance,phylogenetic inference and the multispecies coalescent. TrendsEcol. Evol. 24, 332–340.
Degnan, J.H., DeGiorgio, M., Bryant, D., Rosenberg, N.A., 2009.Properties of consensus methods for inferring species trees fromgene trees. Syst. Biol. 58, 35–54.
Delport, W., Poon, A.F.Y., Frost, S.D.W., Pond, S.L.K., 2010.Datamonkey 2010: a suite of phylogenetic analysis tools forevolutionary biology. Bioinformatics 26, 2455–2457.
Dransfield, J., Uhl, N.W., Asmussen, C.B., Baker, W.J., Harley,M.M., Lewis, C.E., 2005. A new phylogenetic classification of thepalm family, Arecaceae. Kew. Bull. 60, 559–569.
Dransfield, J., Uhl, N.W., Asmussen, C.B., Baker, W.J., Harley,M.M., Lewis, C.E., 2008. Genera Palmarum, 2nd edn. RoyalBotanic Garden, Kew.
Drummond, A., Ho, S., Phillips, M., Rambaut, A., 2006. Relaxedphylogenetics and dating with confidence. PLoS Biol. 4, 699–710.
Drummond, A., Suchard, M., Xie, D., Rambaut, A., 2012. BayesianPhylogenetics with BEAUti and the BEAST 1.7. Mol. Biol. Evol.29, 1969–1973.
Edwards, S.V., 2009. Is a new and general theory of molecularsystematics emerging? Evolution 63, 1–19.
Edwards, S.V., Liu, L., Pearl, D.K., 2007. High-resolution speciestrees without concatenation. Proc. Natl Acad. Sci. USA 104,5936–5941.
Eiserhardt, W.L., Pintaud, J.C., Asmussen-Lange, C., Hahn, W.J.,Bernal, R., Balslev, H., Borchsenius, F., 2011. Phylogeny anddivergence times of Bactridinae (Arecaceae, Palmae) based onplastid and nuclear DNA sequences. Taxon 60, 485–498.
Eulgem, T., Rushton, P.J., Robatzek, S., Somssich, L.E., 2000. TheWRKY superfamily of plant transcription factors. Trends PlantSci. 5, 199–206.
Fan, H.K., Xiao, Y., Yang, Y.D., Xia, W., Mason, A.S., Xia, Z.H.,Qiao, F., Zhao, S.L., Tang, H.R., 2013. RNA-seq analysis ofCocos nucifera: transcriptome sequencing and de novo forsubsequent functional genomics approaches. PLoS ONE 8, e59997.
Farris, J.S., Albert, V.A., K€allersj€o, M., Lipscomb, D., Kluge, A.G.,1996. Parsimony jackknifing outperforms neighbor-joining.Cladistics 12, 99–124.
Felsenstein, J., 1985. Confidence limits on phylogenies, an approachusing the bootstrap. Evolution 39, 783–791.
Fitch, W.M., 1971. Toward defining the course of evolution, minimumchange for a specific tree topology. Syst. Zool. 20, 406–416.
Futey, M.K., Gandolfo, M.A., Zamaloa, M.C., C�uneo, R., Cladera,G., 2012. Arecaceae fossil fruits from the Paleocene ofPatagonia, Argentina. Bot. Rev. 78, 205–234.
Garzione, C.N., Hoke, G.D., Libarkin, J.C., Withers, S.,MacFadden, B., Eiler, J., Prosenjit, G., Mulch, A., 2008. Rise ofthe Andes. Science 320, 1304–1307.
Gibbs, M.J., Armstrong, J.S., Gibbs, A.J., 2000. Sister-Scanning: aMonte Carlo procedure for assessing signals in recombinantsequences. Bioinformatics 16, 573–582.
Glassman, S., 1970. A new hybrid in the palm genus Syagrus Mart.Fieldiana Bot. 32, 241–257.
Gomez-Navarro, C., Jaramillo, C., Herrera, F., Wing, S.L., Callejas,R., 2009. Palms (Arecaceae) from a Paleocene rainforest ofnorthern Colombia. Amer. J. Bot. 96, 1300–1312.
Gregory-Wodzicki, K.M., 2000. Uplift history of the Central andNorthern Andes: a review. GSA Bull. 112, 1091–1105.
Gruezo, W.S., Harries, H.C., 1984. Self-sown, wild-type coconuts inthe Philippines. Biotropica 16, 140–147.
Gunn, B., 2004. The phylogeny of the Cocoeae (Arecaceae) withemphasis on Cocos nucifera. Ann. Missouri Bot. Gard. 91, 505–522.
Haffer, J., 1987. Quaternary history of tropical America. In:Whitmore, T.C., Prance, G.T. (Eds.), Biogeography andQuaternary History in Tropical America. Clarendon Press,Oxford, pp. 1–18.
Hahn, W.J., 2002a. A molecular phylogenetic study of the Palmae(Arecaceae) based on atpB, rbcL, and 18S nrDNA sequences.Syst. Biol. 51, 92–112.
Hahn, W.J., 2002b. A phylogenetic analysis of the Arecoid line ofpalms based on plastid DNA sequence data. Mol. Phylogenet.Evolution 23, 189–204.
Harley, M.M., 2006. A summary of fossil records for Arecaceae.Bot. J. Linn. Soc. 151, 39–67.
Harries, H., 1978. The evolution, dissemination and classification ofCocos nucifera L. Bot. Rev. 44, 265–319.
Heled, J., Drummond, A.J., 2010. Bayesian inference of species treesfrom multilocus data. Mol. Biol. Evol. 27, 570–580.
Henderson, A., 2000. Flora Neotropica Monograph 79, Bactris(Palmae). NY Botanical Garden, Bronx.
Henderson, A., Galeano, G., Bernal, R., 1995. Field Guide to thePalms of the Americas. Princeton University Press, Princeton,NJ.
A. W. Meerow et al. / Cladistics (2014)1–26 23
Herngreen, G.F.W., Chlonova, A.F., 1981. Cretaceous microfloralprovinces. Pollen Spores 23, 441–555.
Huang, Y.Y., Matzke, A.J., Matzke, M., 2013. Complete sequenceand comparative analysis of the chloroplast genome of coconutpalm (Cocos nucifera). PLoS ONE 8, e74736.
Iturralde-Vinent, M.A., MacPhee, R.D.E., 1999. Palaeogeography ofthe Caribbean region: implications for Cenozoic biogeography.Bull. Amer. Mus. Nat. Hist. 238, 1–95.
Jakobsen, I.B., Easteal, S., 1996. A program for calculating anddisplaying compatibility matrices as an aid in determiningreticulate evolution in molecular sequences. CABIOS 12, 291–295.
Jobb, G., 2011. TREEFINDER version of March 2011. Munich,Germany. Distributed by the author at www.treefinder.de.
Johnson, M.A.T., 1989. An unusually high chromosome number inVoanioala gerardii (Palmae: Arecoideae: Cocoeae: Butiinae) fromMadagascar. Kew. Bull. 44, 207–210.
Johnson, M.A.T., Kenton, A.Y., Bennett, M.D., Brandham, P.E.,1989. Voanioala gerardii has the highest known chromosomenumber in the monocotyledons. Genome 32, 328–333.
Katoh, K., Standley, D.M., 2013. MAFFT multiple sequencealignment software version 7: improvements in performance andusability. Mol. Biol. Evol. 30, 772–780.
Katoh, K., Toh, H., 2008. Recent developments in the MAFFTmultiple sequence alignment program. Brief. Bioinform. 9, 286–298.
Katoh, K., Misawa, K., Kuma, K., Miyata, T., 2002. MAFFT, anovel method for rapid multiple sequence alignment based onfast Fourier transform. Nucleic Acids Res. 30, 3059–3066.
Katoh, K., Kuma, K., Toh, H., Miyata, T., 2005. MAFFT version5, improvement in accuracy of multiple sequence alignment.Nucleic Acids Res. 33, 511–518.
Katoh, K., Asimenos, G., Toh, H., 2009. Multiple alignment ofDNA sequences with MAFFT. In: Posada, D. (Ed.),Bioinformatics for DNA Sequence Analysis. Humana Press, NewYork, pp. 39–64.
Kay, K.M., Reeves, P.A., Olmstead, R.G., Schemske, D.W., 2005.Rapid speciation and the evolution of hummingbird pollinationin neotropical Costus subgenus Costus (Costaceae): evidence fromnrDNA ITS and ETS sequences. Amer. J. Bot. 92, 1899–1910.
Kissling, W.D., Eiserhardt, W.L., Baker, W.J., Borchsenius, F.,Couvreur, T.L.P., Balslev, H., Svenning, J.-C., 2012a. Cenozoicimprints on the phylogenetic structure of palm speciesassemblages worldwide. Proc. Natl Acad. Sci. USA 109, 7379–7384.
Kissling, W.D., Baker, W.J., Balslev, H., Barfod, A.S., Borchsenius,F., Dransfield, J., Govaerts, R., Svenning, J.-C., 2012b.Quaternary and pre-Quaternary historical legacies in the globaldistribution of a major tropical plant lineage. Global Ecol.Biogeogr. 21, 909–921.
Knowles, L.L., 2009. estimating species trees: methods ofphylogenetic analysis when there is incongruence across genes.Syst. Biol. 58, 463–467.
Lanier, H.C., Knowles, L.L., 2012. Is recombination a problem forspecies-tree analyses? Syst. Biol. 61, 691–701.
Larget, B.R., Kotha, S.K., Dewey, C.N., An�e, C., 2010. BUCKy:gene tree/species tree reconciliation with Bayesian concordanceanalysis. Bioinformatics 26, 2910–2911.
Leache, A.D., 2010. Species trees for spiny lizards (genusSceloporus): identifying points of concordance and conflictbetween nuclear and mitochondrial data. Mol. Phylogenet. Evol.54, 162–171.
Linder, H.P., 2008. Plant species radiations: where, when, why? Phil.Trans. R. Soc. B 363, 3097–3105.
Linder, H.P., Hardy, C.R., Rutschmann, F., 2005. Taxon samplingeffects in molecular clock dating: an example from AfricanRestoniaceae. Mol. Phylogen. Evol. 35, 569–582.
Liu, L., Pearl, D.K., 2007. Species trees from gene trees:reconstructing Bayesian posterior distributions of a speciesphylogeny using estimated gene tree distributions. Syst. Biol. 56,504–514.
Liu, L., Pearl, D.K., Brumfield, R.T., Edwards, S.V., 2008.Estimating species trees using multiple-allele DNA sequence data.Evolution 62, 2080–2091.
Ludena, B., Chabrillange, N., Aberlenc-Bertossi, F., Adam, H.,Tregear, J.W., Pintaud, J.C., 2011. Phylogenetic utility of thenuclear genes AGAMOUS1 and PHYTOCHROME B in palms(Arecaceae): an example within Bactridinae. Ann. Bot. 108,1433–1444.
Lundberg, J.G., Marshall, L.G., Guerrero, J., Horton, B.,Malabarba, M.C.S.L., Wesselingh, F., 1998. The stage forNeotropical fish diversification, A history of tropical SouthAmerican rivers. In: Malabarba, L.R., Reis, R.E., Vari, R.P.,Lucena, Z.M., Lucena, C.A.S. (Eds.), Phylogeny andClassification of Neotropical Fishes. Edipucrs, Porto Alegre, pp.13–48.
Ma, B., Xin, L., Zhang, K.Z., 2008. A new quartet approach forreconstructing phylogenetic trees: quartet joining method. J.Comb. Optim. 16, 293–306.
Maddison, W.P., 1997. Gene trees in species trees. Syst. Biol. 46,523–536.
Maddison, W.P., Knowles, L.L., 2006. Inferring phylogeny despiteincomplete lineage sorting. Syst. Biol. 55, 21–30.
Martin, D., Rybicki, E., 2000. RDP: detection of recombinationamongst aligned sequences. Bioinformatics 16, 562–563.
Martin, D.P., Posada, D., Crandall, K.A., Williamson, C., 2005. Amodified bootscan algorithm for automated identification ofrecombinant sequences and recombination breakpoints. AIDSRes. Hum. Retroviruses 21, 98–102.
Martin, D.P., Lemey, P., Lott, M., Moulton, V., Posada, D.,Lefeuvre, P., 2010. RDP3: a flexible and fast computer programfor analyzing recombination. Bioinformatics 26, 2462–2463.
Mauro-Herrera, M., Meerow, A.W., Borrone, J.W., Kuhn, D.N.,Schnell, R.J., 2006. Ten informative markers developed fromWRKY sequences in coconut (Cocos nucifera). Mol. Ecol. Notes6, 904–906.
Maynard Smith, J., 1992. Analyzing the mosaic structure of genes. J.Mol. Evol. 34, 126–129.
McGuire, G., Wright, F., 1998. TOPAL: recombination detection inDNA and protein sequences. Bioinformatics 14, 219–220.
McGuire, G., Wright, F., 2000. TOPAL 2.0: improved detection ofmosaic sequences within multiple alignments. Bioinformatics 16,130–134.
Meerow, A.W., Noblick, L., Borrone, J.W., Couvreur, T.L., Mauro-Herrera, M., Hahn, W.J., Kuhn, D.N., Nakamura, K., Oleas,N.H., Schnell, R.J., 2009. Phylogenetic analysis of seven WRKYgenes across the palm subtribe Attaleinae (Arecaceae) [corrected]identifies Syagrus as sister group of the coconut. PLoS ONE 4,e7353.
Moore, H.E. Jr, 1973. The major groups of palm and theirdistribution. Gentes Herb. 11, 27–111.
Morley, R.J., 2000. Origin and Evolution of Tropical Rain Forests.John Wiley & Sons, Chichester, UK.
Morley, R.J., 2007. Cretaceous and Tertiary climate change and thepast distribution of megathermal rainforests. In: Bush, M.B.,Flenley, J.R. (Eds.), Tropical Rainforest Responses to ClimaticChange. Springer-Praxis, Berlin, pp. 1–31.
Morrone, J.J., 2014. Cladistic biogeography of the Neotropicalregion: identifying the main events in the diversification of theterrestrial biota. Cladistics 30, 202–214.
Muller, J., 1981. Fossil pollen records of extant angiosperms. Bot.Rev. 47, 1–142.
M€uller, K.F., 2005. SeqState - primer design and sequence statisticsfor phylogenetic DNA data sets. Appl. Bioinform. 4, 65–69.
Nagalingum, N.S., Marshall, C.R., Quental, T.B., Rai, H.S., Little,D.P., Mathews, S., 2011. Recent synchronous radiation of aliving fossil. Science 334, 796–799.
Nakhleh, L., 2013. Computational approaches to species phylogenyinference and gene tree reconciliation. Trends Ecol. Evol. 28,719–728.
Nichols, D., Johnson, L., 2008. Plants and the K-T Boundary.Cambridge University Press, Cambridge, UK.
24 A. W. Meerow et al. / Cladistics (2014)1–26
Noblick, L.R., 2004. Syagrus cearensis. Palms 48, 70–76.Noblick, L.R., 2013. Leaflet anatomy verifies relationships within
Syagrus (Arecaceae) and aids in identification. Phytokeys 26, 75–99.
Orozco-Segovia, A., Batis, A.I., Rojas-Ar�echiga, M., Mendoza, A.,2003. Seed biology of palms: a review. Palms 47, 79–94.
Padidam, M., Sawyer, S., Fauquet, C.M., 1999. Possible emergenceof new geminiviruses by frequent recombination. Virology 265,218–225.
Page, R.D.M., 1998. GeneTree, comparing gene and speciesphylogenies using reconciled trees. Bioinformatics 14, 819–820.
Pan, A.D., Jacobs, B.F., Dransfield, J., Baker, W.J., 2006. The fossilhistory of palms (Arecaceae) in Africa and new records from theLate Oligocene (28–27 Mya) of north-western Ethiopia. Bot. J.Linn. Soc. 151, 69–81.
Pennington, R.T., Lavin, M., S€arkinen, T., Lewis, G.P., Klitgaard,B.B., Hughes, C.E., 2010. Contrasting plant diversificationhistories within the Andean biodiversity hotspot. Proc. NatlAcad. Sci. USA 107, 13783–13787.
Pintaud, J.-C., Mill�an, B., Kahn, F., 2008. The genus HexopetionBurret (Arecaceae). Rev. Peru. Biol. 15 (Suppl. 1), 49–54.
Pond, S.L.K., Frost, S.D.W., 2005. Datamonkey: rapid detection ofselective pressure on individual sites of codon alignments.Bioinformatics 21, 2531–2533.
Pond, S.L.K., Frost, S.D.W., Muse, S.V., 2005. HyPhy, hypothesistesting using phylogenies. Bioinformatics 21, 676–679.
Pond, S.L.K., Scheffler, K., Gravenor, M.B., Poon, A.F.Y., Frost,S.D.W., 2010. Evolutionary fingerprinting of genes. Mol. Biol.Evol. 27, 520–536.
Posada, D., Crandall, K.A., 2001. Evaluation of methods fordetecting recombination from DNA sequences: computersimulations. Proc. Natl Acad. Sci. USA 98, 13757–13762.
Prance, G.T., 1987. Biogeography of Neotropical plants. In:Whitmore, T.C., Prance, G.T. (Eds.), Biogeography andQuaternary History in Tropical America. Clarendon Press,Oxford, pp. 46–55.
Pross, J., Contreras, L., Bijl, P.K., Greenwood, D.R., Bohaty, S.M.,Schouten, S., Bendle, J.A., R€ohl, U., Tauxe, L., Raine, J.I., Huck,C.E., van de Flierdt, T., Jamieson, S.S.R., Stickley, C.E., van deSchootbrugge, B., Escutia, C., Brinkhuis, H., Integrated OceanDrilling Program Expedition 318 Scientists., 2012. Persistent near-tropical warmth on the Antarctic continent during the earlyEocene epoch. Nature 488, 73–77.
Rambaut, A., 2012. FigTree Version 1.4. http://tree.bio.ed.ac.uk/software/figtree/
Rambaut, A., Drummond, A.J., 2005. Tracer, Version 1.4. http://tree.bio.ed.ac.uk/software/figtree/
Raven, P.H., Axelrod, D.I., 1974. Angiosperm biogeography andpast continental movements. Ann. Missouri Bot. Gard. 61, 539–673.
Read, R.W., 1966. New chromosome counts in the Palmae.Principes 10, 55–61.
Ree, R.H., Smith, S.A., 2008. Maximum likelihood inference ofgeographic range evolution by dispersal, local extinction, andcladogenesis. Syst. Biol. 57, 4–14.
Reid, N.M., Hird, S.M., Brown, J.M., Pelletier, T.A., McVay, J.D.,Satler, J.D., Carstens, B.C., 2014. Poor fit to the multispeciescoalescent is widely detectable in empirical data. Syst. Biol. 63,322–333.
Richardson, J.E., Pennington, R.T., Pennington, T.D.,Hollingsworth, P.M., 2001. Rapid diversification of a species-richgenus of neotropical rain forest trees. Science 293, 2242–2245.
Robertson, B.L., 1976. Embryology of Jubaeopsis caffra Becc.: 2,Megasporangium, megasporogeneis, and microgametogenesis. J.South Afr. Bot. 42, 173–184.
Roncal, J., Kahn, F., Millan, B., Couvreur, T.L.P., Pintaud, J.-C.,2013. Cenozoic colonization and diversification patterns oftropical American palms: evidence from Astrocaryum(Arecaceae). Bot. J. Linn. Soc. 171, 120–139.
Ronquist, F., Teslenko, M., van der Mark, P., Ayres, D.L., Darling,A., Hohna, S., Larget, B., Liu, L., Suchard, M.A., Huelsenbeck,
J.P., 2012. MrBayes 3.2: efficient Bayesian phylogenetic inferenceand model choice across a large model space. Syst. Biol. 61, 539–542.
Ross, C.A., Liu, Y., Shen, Q.J., 2007. The WRKY gene family inrice (Oryza sativa). J. Integr. Plant Biol. 49, 827 84, 2.
Salminen, M.O., Carr, J.K., Burke, D.S., McCutchan, F.E., 1995.Identification of breakpoints in intergenotypic recombinants ofHIV type 1 by Bootscanning. AIDS Res. Hum. Retroviruses 11,1423–1425.
Scheffler, K., Martin, D.P., Seoighe, C., 2006. Robust inference ofpositive selection from recombining coding sequences.Bioinformatics 22, 2493–2499.
Schulte, P., Alegret, L., Arenillas, I., Arz, J.A., Barton, P.J., Bown,P.R., Bralower, T.J., Christeson, G.L., Claeys, P., Cockell, C.S.,Collins, G.S., Deutsch, A., Goldin, T.J., Goto, K., Grajales-Nishimura, J.M., Grieve, R.A.F., Gulick, S.P.S., Johnson, K.R.,Kiessling, W., Koeberl, C., Kring, D.A., MacLeod, K.G., Matsui,T., Melosh, J., Montanari, A., Morgan, J.V., Neal, C.R., Nichols,D.J., Norris, R.D., Pierazzo, E., Ravizza, G., Rebolledo-Vieyra,M., Reimold, W.U., Robin, E., Salge, T., Speijer, R.P., Sweet,A.R., Urrutia-Fucugauchi, J., Vajda, V., Whalen, M.T.,Willumsen, P.S., 2010. The Chicxulub asteroid impact and massextinction at the Cretaceous-Paleogene boundary. Science 327,1214–1218.
Shono, H., 2000. Efficiency of the finite correction of Akaike’sInformation Criteria. Fisheries Sci. 66, 608–610.
Simmons, M.P., Ochoterena, H., 2000. Gaps as characters insequence based phylogenetic analyses. Syst. Biol. 49, 369–381.
Singh, R., Ong-Abdullah, M., Low, E.T., Manaf, M.A., Rosli, R.,Nookiah, R., Ooi, L.C., Ooi, S.E., Chan, K.L., Halim, M.A.,Azizi, N., Nagappan, J., Bacher, B., Lakey, N., Smith, S.W., He,D., Hogan, M., Budiman, M.A., Lee, E.K., DeSalle, R., Kudrna,D., Goicoechea, J.L., Wing, R.A., Wilson, R.K., Fulton, R.S.,Ordway, J.M., Martienssen, R.A., Sambanthamurthi, R., 2013.Oil palm genome sequence reveals divergence of interfertilespecies in Old and New worlds. Nature 500, 335–339.
Sorenson, M.D., Franzosa, E.A., 2007. TreeRot, version 3. BostonUniversity, Boston.
Springer, M.S., Gatesy, J., 2014. Land plant origins and coalescenceconfusion. Trends Plant Sci. 19, 267–269.
Stolzer, M., Lai, H., Xu, M.L., Sathaye, D., Vernot, B., Durand,D., 2012. Inferring duplications, losses, transfers and incompletelineage sorting with nonbinary species trees. Bioinformatics 28,I409–I415.
Swofford, D.L., 2002. PAUP*. Phylogenetic Analysis UsingParsimony (*and Other Methods). Version 4. Sinauer Associates,Sunderland.
Tanabe, A.S., 2007. Kakusan, a computer program to automate theselection of a nucleotide substitution model and the configurationof a mixed model on multilocus data. Mol. Ecol. Notes 7, 962–964.
Thomas, B.C., Pedersen, B., Freeling, M., 2006. Followingtetraploidy in an Arabidopsis ancestor, genes were removedpreferentially from one homeolog leaving clusters enriched indose-sensitive genes. Genome Res. 16, 934–946.
Thomson, R.C., Shedlock, A.M., Edwards, S.V., Shaffer, H.B.,2008. Developing markers for multilocus phylogenetics in non-model organisms: a test case with turtles. Mol. Phylogenet. Evol.49, 514–525.
Tomlinson, P.B., Horn, J.W., Fisher, J.B., 2011. The Anatomy ofPalms, Arecaceae—Palmae. Oxford University Press, NewYork.
Townsend, T.M., Mulcahy, D.G., Noonan, B.P., Sites, J.W.,Kuczynski, C.A., Wiens, J.J., Reeder, T.W., 2011. Phylogeny ofiguanian lizards inferred from 29 nuclear loci, and a comparisonof concatenated and species-tree approaches for an ancient, rapidradiation. Mol. Phylogenet. Evol. 61, 363–380.
Uhl, N.W., Dransfield, J., 1987. Genera Palmarum, a classificationof palms based on the work of H. E. Moore Jr. Lawrence,Kansas, International Palm Society and L. H. Bailey Hortorium,Ithaca.
A. W. Meerow et al. / Cladistics (2014)1–26 25
€Ulker, B., Somssich, L.E., 2004. WRKY transcription factors, fromDNA binding towards biological function. Curr. Opin. PlantBiol. 7, 491–498.
Van der Hammen, T., 1979. History of the flora, vegetation andclimate in the Cordillera Oriental during the last five millionyears. In: Larsen, H., Holm-Nielsen, L.B. (Eds.), TropicalBotany. Academic Press, London, pp. 25–32.
Van der Hammen, T., Werner, J.H., van Dommelen, H., 1973.Palynological record of the upheaval of the northern Andes, astudy of the Pliocene and Lower Quaternary of the ColombianEastern Cordillera and the early evolution of its high-Andeanbiota. Rev. Palaeobot. Palynol. 16, 1–122.
Wendel, J.F., Doyle, J.J., 1998. Phylogenetic incongruence, windowinto genome history and molecular evolution. In: Soltis, D.E.,Soltis, P.S., Doyle, J.J. (Eds.), Molecular Systematics of PlantsII. DNA Sequencing. Kluwer Academic Publishers, Norwell,MA, pp. 265–296.
Wesselingh, F.P., 2006. Miocene long-lived lake Pebas as a stage ofmollusc radiations, with implications for landscape evolution inwestern Amazonia. Scripta Geol. 133, 1–17.
Wesselingh, F.P., Salo, J.A., 2006. A Miocene perspective on theevolution of the Amazonian biota. Scripta Geol. 133, 439–458.
Wesselingh, F.P., R€as€anen, M.E., Irion, G., Vonhof, H.B.,Kaandorp, R., Renema, W., Romero-Pittman, L., Gingras, M.,2002. Lake Pebas, A palaeoecological reconstruction of aMiocene, long-lived lake complex in western Amazonia.Cainozoic Res. 1, 35–81.
Wu, Y., 2012. Coalescent-based species tree inference from gene treetopologies under incomplete lineage sorting by maximumlikelihood. Evolution 66, 763–775.
Wu, K.-L., Guo, Z.-J., Wang, H.-H., Li, J., 2005. The WRKYfamily of transcription factors in rice and Arabidopsis and theirorigins. DNA Res. 12, 9–26.
Xiong, Y., Liu, T., Sun, S., Li, J., Chen, M., 2005. Transcriptionfactors in rice, a genome-wide comparative analysis betweenmonocots and eudicots. Plant Mol. Biol. 59, 191–203.
Yu, Y., Harris, A.J., He, X., 2010. S-DIVA (Statistical Dispersal-Vicariance Analysis): a tool for inferring biogeographic histories.Mol. Phylogenet. Evol. 56, 848–850.
Yu, Y., Degnan, J.H., Nakhleh, L., 2012. The probability of agene tree topology within a phylogenetic network withapplications to hybridization detection. PLoS Genet. 8, 456–465.
Yu, Y., Harris, A.J., He, X.-J., 2013a. Reconstruct Ancestral Statein Phylogenies (RASP) 2.1 beta. http://mnh.scu.edu.cn/soft/blog/RASP
Yu, Y., Barnett, R.M., Nakhleh, L., 2013b. Parsimonious inferenceof hybridization in the presence of incomplete lineage sorting.Syst. Biol. 62, 738–751.
Zhang, Y., Wang, L., 2005. The WRKY transcription factorsuperfamily, its origin in eukaryotes and expansion in plants.BMC Evol. Biol. 5, 1.
Zona, S., Henderson, A., 1989. A review of animal-mediated seeddispersal of palms. Selbyana 11, 6–21.
Supporting Information
Additional Supporting Information may be found inthe online version of this article:Figures S1–S6 Strict or majority rule consensus and
Jackknife consensus trees for individual WRKY geneMP analyses across the Cocoseae. S1. WRKY6. S2.WRKY7. S3. WRKY12. S4. WRKY16. S5. WRKY19.S6. WRKY21.Figures S7–S8 Best scoring trees and bootstrap con-
sensus from ML analyses of the six WRKY gene su-permatrix across the Cocoseae. S7. Partitionedanalysis. A. Best scoring tree. B. Bootstrap consensus.S8. Non-partitioned analysis. A. Best scoring tree. B.Bootstrap consensus.Figures S9–S11 Fully expanded versions of species
trees from Fig. 3a–c. S9. *BEAST MCC species tree.S10. Population tree from BUCKy analysis. S11. MLspecies tree estimated by STELLS.Table S1 Taxa, voucher specimens or live plant
accession numbers (FTBG = Fairchild Tropical Bota-nic Garden; MBC = Montgomery Botanical center)and GenBank sequence accession numbers of Areca-ceae tribe Cocoseae and outgroups used in the cladisticanalysis of WRKY loci.Table S2 WRKY loci primer sequences (50 ? 30).Table S3 Event matrix from S-DIVA analysis on 6-
gene sequence phylogeny of Arecaceae tribe Cocoseae.
26 A. W. Meerow et al. / Cladistics (2014)1–26
Copyright © 2022 FDOKUMEN