KNOWLEDGE OF DIVERSITY OF WILD PALMS (ARECACEAE) IN THE REPUBLIC OF BENIN: FINDING GAPS IN THE...
11
Biodiversity Informatics, 10, 2015, 45-55 KNOWLEDGE OF DIVERSITY OF WILD PALMS (ARECACEAE) IN THE REPUBLIC OF BENIN: FINDING GAPS IN THE NATIONAL INVENTORY BY COMBINING FIELD AND DIGITAL ACCESSIBLE KNOWLEDGE RODRIGUE IDOHOU 1,2 *, ARTURO H. ARIÑO 3 , ACHILLE EPHREM ASSOGBADJO 2 , ROMAIN GLELE KAKAI 1 , BRICE SINSIN 2 1 Laboratory of Biomathematics and Forest Estimations, University of Abomey-Calavi, Benin. 2 Laboratory of Applied Ecology, Faculty of Agronomic Sciences, University of Abomey-Calavi, 01 BP 526, Cotonou, Benin. 3 Department of Environmental Biology, University of Navarra, Pamplona, Spain. *corresponding author: [email protected]. Abstract.—Despite efforts by researchers worldwide to assess the biodiversity of plant groups, many locations on Earth remain poorly surveyed, resulting in inadequate or biased knowledge. Robust estimates of inventory completeness could help alleviate the problem. This study aimed to identify areas representing gaps in current knowledge of African palms, with a focus on Benin (West Africa). We assessed the completeness of knowledge of African palms, targeting geographic distance and climatic difference from well-known sites. Data derived from intensive fieldwork were combined with independent data available online. Inventory completeness indices were calculated and coupled with other criteria. Results showed a high overall value for inventory completeness, as well as an even distribution of well-known areas across the country. However, poorly-known areas were identified, which were in remote locations with low accessibility. This study illustrates how biodiversity survey and inventory efforts can be guided by existing knowledge. We strongly recommend the combination of digital accessible knowledge and fieldwork, coupled with expert knowledge, to obtain a better picture of inventory completeness in tropical ecosystems. Key words.—Biological databases, GIS, inventory, sampling efficiency, spatial resolution. One of the greatest challenges that tropical biologists are facing now is how to conserve biological diversity in the current context of demographic pressure, increase of needs, overexploitation, climate change, and economic crisis (FAO 2010). Under these threats, without effective protection, much of tropical biodiversity is unlikely to survive, so strategies to promote its conservation are needed (Bruner et al. 2001). Measurements of biological diversity can provide baseline information on distribution, richness, and relative abundance of taxa that is required for taking appropriate conservation decisions (Humphries et al. 1995; May 1988; Magurran 1988; Raven and Wilson 1992). The national flora of Benin is estimated at 2807 species (Akoègninou et al. 2006). Some of those species are of high socioeconomic importance and have been studied in depth. However, others remain not well assessed, such as wild palm species. Wild palms are amongst the most diverse plant groups in the world (Tomlinson 1990) and are species with significant cultural, social, economic, and ecological uses (Monteiro et al. 2006). They serve as bio-indicators in many Latin-American countries (Kjaeret al. 2004; Vormisto et al. 2004), and their occurrences could be used as climate trend proxies. In sub-Saharan Africa, and especially in Benin, wild palms are not well documented. The species diversity is not well known, and ecological studies are rare. These data, together with a complete richness inventory, are nonetheless critical to planning informed conserva- tion actions. Many studies now exist on the use of primary biodiversity data that are both digital and accessible in standard formats (Graham et al. 2004; Guralnick et al. 2007; Sousa-Baena et al. 2014) providing access to more than 6 x10 8 data records. The magnitude of digital accessible knowledge (DAK) is large though perhaps not sufficient when measured against global biodiversity (Sousa-Baena et al. 2014). In contrast, cases of use of extensive fieldwork data not obtained from online data portals (i.e., requiring time-consuming, expensive field surveys) are less frequent. In addition, assessing sampling effort across geographic space requires an understanding of how species assemblages differ among different environments, across biogeographic barriers, and as a result of
-
Upload
abomeycalavi -
Category
Documents
-
view
7 -
download
0
Transcript of KNOWLEDGE OF DIVERSITY OF WILD PALMS (ARECACEAE) IN THE REPUBLIC OF BENIN: FINDING GAPS IN THE...

Biodiversity Informatics, 10, 2015, 45-55
KNOWLEDGE OF DIVERSITY OF WILD PALMS (ARECACEAE) IN THE REPUBLIC OF BENIN: FINDING GAPS IN THE NATIONAL INVENTORY
BY COMBINING FIELD AND DIGITAL ACCESSIBLE KNOWLEDGE
RODRIGUE IDOHOU1,2*, ARTURO H. ARIÑO3, ACHILLE EPHREM ASSOGBADJO2, ROMAIN GLELE KAKAI1, BRICE SINSIN2
1Laboratory of Biomathematics and Forest Estimations, University of Abomey-Calavi, Benin. 2Laboratory of Applied Ecology, Faculty of Agronomic Sciences, University of Abomey-Calavi,
01 BP 526, Cotonou, Benin. 3Department of Environmental Biology, University of Navarra, Pamplona, Spain. *corresponding author: [email protected].
Abstract.—Despite efforts by researchers worldwide to assess the biodiversity of plant groups, many locations on Earth remain poorly surveyed, resulting in inadequate or biased knowledge. Robust estimates of inventory completeness could help alleviate the problem. This study aimed to identify areas representing gaps in current knowledge of African palms, with a focus on Benin (West Africa). We assessed the completeness of knowledge of African palms, targeting geographic distance and climatic difference from well-known sites. Data derived from intensive fieldwork were combined with independent data available online. Inventory completeness indices were calculated and coupled with other criteria. Results showed a high overall value for inventory completeness, as well as an even distribution of well-known areas across the country. However, poorly-known areas were identified, which were in remote locations with low accessibility. This study illustrates how biodiversity survey and inventory efforts can be guided by existing knowledge. We strongly recommend the combination of digital accessible knowledge and fieldwork, coupled with expert knowledge, to obtain a better picture of inventory completeness in tropical ecosystems. Key words.—Biological databases, GIS, inventory, sampling efficiency, spatial resolution. One of the greatest challenges that tropical
biologists are facing now is how to conserve biological diversity in the current context of demographic pressure, increase of needs, overexploitation, climate change, and economic crisis (FAO 2010). Under these threats, without effective protection, much of tropical biodiversity is unlikely to survive, so strategies to promote its conservation are needed (Bruner et al. 2001). Measurements of biological diversity can provide baseline information on distribution, richness, and relative abundance of taxa that is required for taking appropriate conservation decisions (Humphries et al. 1995; May 1988; Magurran 1988; Raven and Wilson 1992).
The national flora of Benin is estimated at 2807 species (Akoègninou et al. 2006). Some of those species are of high socioeconomic importance and have been studied in depth. However, others remain not well assessed, such as wild palm species. Wild palms are amongst the most diverse plant groups in the world (Tomlinson 1990) and are species with significant cultural, social, economic, and ecological uses (Monteiro et al. 2006). They serve as bio-indicators in many
Latin-American countries (Kjaeret al. 2004; Vormisto et al. 2004), and their occurrences could be used as climate trend proxies. In sub-Saharan Africa, and especially in Benin, wild palms are not well documented. The species diversity is not well known, and ecological studies are rare. These data, together with a complete richness inventory, are nonetheless critical to planning informed conserva-tion actions.
Many studies now exist on the use of primary biodiversity data that are both digital and accessible in standard formats (Graham et al. 2004; Guralnick et al. 2007; Sousa-Baena et al. 2014) providing access to more than 6 x10⁸ data records. The magnitude of digital accessible knowledge (DAK) is large though perhaps not sufficient when measured against global biodiversity (Sousa-Baena et al. 2014). In contrast, cases of use of extensive fieldwork data not obtained from online data portals (i.e., requiring time-consuming, expensive field surveys) are less frequent. In addition, assessing sampling effort across geographic space requires an understanding of how species assemblages differ among different environments, across biogeographic barriers, and as a result of
townpeterson
Typewritten Text
45

Biodiversity Informatics, 10, 2015, 45-55
dispersal limitation. Species accumulation curves, species richness estimates, and diversity accumulation curves have been used to determine the level of survey completeness (Thompson et al. 2007; Ariño et al. 2008; de Thoisy et al. 2008; Aranda et al. 2010; Lovell et al. 2010). The measured level of completeness can be compared to the desired level of completeness for the same locality, and some authors have defined particular targets that may be broadly appropriate (Cardoso et al. 2009). Several statistics are available for calculating species richness estimates, including non-parametric methods and extrapolations of species accumulation curves, that vary in their accuracy under different conditions, often having drawbacks that may prevent their use in common circumstances (e.g. low species density). Other less well-known methods have been proposed to try to overcome some of these challenges, such as the generalization by Ariño (2010) of the probability theory developed by Seber (1982).These novel methods may help determining the completeness of the inventory and bring out gaps in sampled areas for further documentation (Chao and Jost 2012).
We carried out this study on both available DAK and extensive fieldwork inventory of wild palms (i) to describe the national species richness of this group, and (ii) to estimate the completeness of the inventory within the group. We assessed knowledge gaps across Benin through estimation of geographic and environmental distances to well-known localities.
METHODS Study Area
Benin is a West African country located between 6°20’ and 12°25’N and 1° and 3°40’E. Biogeographically, Benin is subdivided into three contrasting phytochorological zones: the Guineo-Congolean zone, the Sudano-Guinean transition zone and the Sudanian zone (Akoègninou et al. 2006; White 1983). Rainfall is bimodal in the Guineo-Congolean zone. North of this zone, rainfall distribution becomes unimodal. Human activities have resulted in a high level of degradation of the vegetation (Figure 1).
Data Sources Our analyses are based on data from both
extensive fieldwork carried out from May 2013 to April 2014, during which a megatransect covering
the whole country was executed, comprised of daily transects, and data downloaded from the Global Biodiversity Information Facility1, com-prising data on 11 wild palm species (8 observed during our fieldwork, and 3 additional species appearing in the GBIF dataset). The GBIF search was done in January 2015 through the use of key fields such as palms, Arecaceae, African palms, African native palms, Borassus, Eremo-spatha, Hyphaene, Laccosperma, Phoenix, Raphia, rattan, raffia, Wild palms, etc. The initial dataset contained 1847 records from the two sources.
The dataset was then cleaned via a series of inspections and visualizations designed to detect and document inconsistency, as follows. (1) We created lists of unique names in each dataset in Microsoft Excel, and manually inspected them for repeated versions of the same taxonomic concepts: misspellings, name variants, different versions of authority information, etc. Such repeated name variants were flagged, checked via independent sources, and corrected to produce unique scientific names that we believed correctly referred to single taxa. (2) We checked for geographic coordinates that fell outside of the country, but which were referred to Benin. (3) Within the country, we checked for consistency between descriptions of district and position of geographic coordinates. In each case, where possible, we created a corrected version of the data record; where no clear correction was possible, we discarded data, recording data losses at each step in the cleaning process. In all, 1375 records were finally considered (1154 fieldwork + 221 GBIF records; Figure 2) which were constrained also to include only those with consistent coordinates.
Data Analysis and Interpretation We aggregated point-based occurrence data to
½° spatial resolution across the country, which near the Equator corresponds to a square ~56 km on a side (Figure 2). This spatial resolution was the product of a detailed analysis of balancing the benefits of aggregating data (i.e., larger sample sizes), versus the loss of spatial resolution that accompanies broader aggregation areas that can make imperceptible important geographic features. The procedure consists on examining the relative change in area-adjusted variance of the data versus
1 http://www.gbif.org.
townpeterson
Typewritten Text
46

Biodiversity Informatics, 10, 2015, 45-55
Figure 1. Geographic pattern of Benin’s biogeographic zones (Sudanian, Sudano-Guinean, and Guineo-Congolean) and soil types.
townpeterson
Typewritten Text
47

Biodiversity Informatics, 10, 2015, 45-55
Figure 2. Elevation map of Benin, with the geographic locations of records of palms collected in the field and downloaded through GBIF. Grid squares delimit the ½° cells used to calculate completeness.
townpeterson
Typewritten Text
48
Biodiversity Informatics, 10, 2015, 45-55
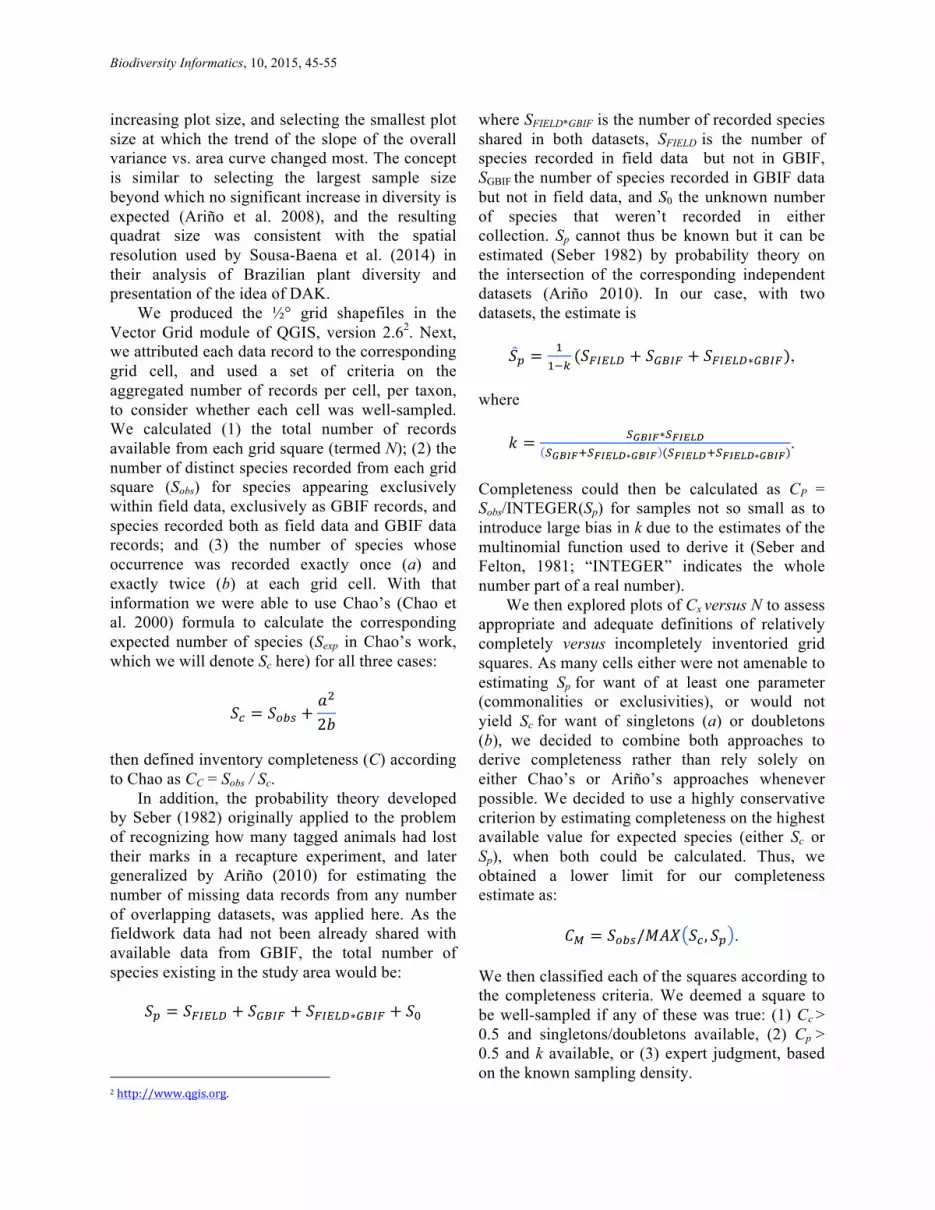
increasing plot size, and selecting the smallest plot size at which the trend of the slope of the overall variance vs. area curve changed most. The concept is similar to selecting the largest sample size beyond which no significant increase in diversity is expected (Ariño et al. 2008), and the resulting quadrat size was consistent with the spatial resolution used by Sousa-Baena et al. (2014) in their analysis of Brazilian plant diversity and presentation of the idea of DAK.
We produced the ½° grid shapefiles in the Vector Grid module of QGIS, version 2.62. Next, we attributed each data record to the corresponding grid cell, and used a set of criteria on the aggregated number of records per cell, per taxon, to consider whether each cell was well-sampled. We calculated (1) the total number of records available from each grid square (termed N); (2) the number of distinct species recorded from each grid square (Sobs) for species appearing exclusively within field data, exclusively as GBIF records, and species recorded both as field data and GBIF data records; and (3) the number of species whose occurrence was recorded exactly once (a) and exactly twice (b) at each grid cell. With that information we were able to use Chao’s (Chao et al. 2000) formula to calculate the corresponding expected number of species (Sexp in Chao’s work, which we will denote Sc here) for all three cases:
𝑆! = 𝑆!"# +𝑎!
2𝑏
then defined inventory completeness (C) according to Chao as CC = Sobs / Sc.
In addition, the probability theory developed by Seber (1982) originally applied to the problem of recognizing how many tagged animals had lost their marks in a recapture experiment, and later generalized by Ariño (2010) for estimating the number of missing data records from any number of overlapping datasets, was applied here. As the fieldwork data had not been already shared with available data from GBIF, the total number of species existing in the study area would be:
𝑆! = 𝑆!"#$% + 𝑆!"#$ + 𝑆!"#$%∗!"#$ + 𝑆!
2 http://www.qgis.org.
where SFIELD*GBIF is the number of recorded species shared in both datasets, SFIELD is the number of species recorded in field data but not in GBIF, SGBIF the number of species recorded in GBIF data but not in field data, and S0 the unknown number of species that weren’t recorded in either collection. Sp cannot thus be known but it can be estimated (Seber 1982) by probability theory on the intersection of the corresponding independent datasets (Ariño 2010). In our case, with two datasets, the estimate is
𝑆! =!
!!!(𝑆!"#$% + 𝑆!"#$ + 𝑆!"#$%∗!"#$),
where
𝑘 = !!"#$∗!!"#$%!!"#$!!!"#$%∗!"#$ (!!"#$%!!!"#$%∗!"#$)
. Completeness could then be calculated as CP = Sobs/INTEGER(Sp) for samples not so small as to introduce large bias in k due to the estimates of the multinomial function used to derive it (Seber and Felton, 1981; “INTEGER” indicates the whole number part of a real number).
We then explored plots of Cx versus N to assess appropriate and adequate definitions of relatively completely versus incompletely inventoried grid squares. As many cells either were not amenable to estimating Sp for want of at least one parameter (commonalities or exclusivities), or would not yield Sc for want of singletons (a) or doubletons (b), we decided to combine both approaches to derive completeness rather than rely solely on either Chao’s or Ariño’s approaches whenever possible. We decided to use a highly conservative criterion by estimating completeness on the highest available value for expected species (either Sc or Sp), when both could be calculated. Thus, we obtained a lower limit for our completeness estimate as:
𝐶! = 𝑆!"#/𝑀𝐴𝑋 𝑆! , 𝑆! . We then classified each of the squares according to the completeness criteria. We deemed a square to be well-sampled if any of these was true: (1) Cc > 0.5 and singletons/doubletons available, (2) Cp > 0.5 and k available, or (3) expert judgment, based on the known sampling density.
townpeterson
Typewritten Text
49

Biodiversity Informatics, 10, 2015, 45-55
Next, in QGIS, we linked the table with the grid square statistics (i.e., Sobs, Sc, Sp, CM, Cc, Cp) to the aggregation grid, and saved this file as a shapefile. The shapefile of well-sampled grid squares was further converted to raster (geotiff) format using custom scripts in R (R Development Core Team 2013). This raster coverage was the basis for our identification of gaps, as follows.
We used the Proximity (Raster Distance) function in QGIS to summarize geographic dis-tance to any well-sampled area. To create a parallel view of environmental difference from well-sampled areas, we plotted 5000 random points across the country, and used the Point Sampling Tool in QGIS to link each point to the geographic distance raster, and to raster coverages (2.5’ reso-lution) summarizing annual mean temperature and annual precipitation drawn from the WorldClim climate data archive (Hijmans et al. 2005).
We exported the attributes table associated with the random points, and analyzed it further in Excel. We standardized values of each environ-menttal variable to the overall range of the variable as (xi – xmin) / (xmax - xmin), where xi is the particular observed value in question. We then calculated the environmental distance matrix by obtaining the Euclidean distances for the climate variables between points falling in well-sampled cells (by definition, points having a geo-graphic distance of zero) and the points falling in the remaining cells (those points with non-zero geographic distances). Hence, each random point in incomplete cells was defined by its distance in environmental space to the points in well-sampled cells. Finally, the environmental distances were imported into QGIS, and linked to the random points. The shapefile containing the random points was thus given a z-value that is the environmental distance associated with that point. This vector file was then rasterized to provide continuous coverage across the region.
RESULTS Preliminary
The raw data show a greater concentration of wild palms records in the northwestern and southernmost part of Benin. However, data covered the whole country and did not appear to be particularly concentrated along points of access such as roads or rivers.
Inspecting the relationship between Sobs and various C values, we observed a variation of outputs. For Cc, completeness greater than 0.8 was observed for more than 10 expected species and a number of individuals between 0-50; for other completeness indices, more variation was observed in C values (Figure 3). By definition, cells for which Cm could not be calculated were declared as under-sampled. Well-sampled areas according to the criteria defined in the Methods could in turn be segregated into complete, with all species observed (either valid CM =1 or by expert judgment), and incomplete (0.5<CM <1) (Table 1) sites.
Inventory Completeness There were 49 ½° cells in the entire country, of
which 86% held data. Globally, Benin showed a high value for inventory completeness (0.58<CM ≤1). Most ecosystems hosting palm species in the country appear to be well sampled, except some sections in the northern and western fringes, as well as remote areas with potentially difficult accessibility as seen in low road density (Figure 3), which do not seem to lack records but show low completeness. Based on the consensus for inventory completeness, two-thirds of well-known sites were recognized to be complete, whereas 18% had CM > 0.8 and 21% had 0.5 < CM < 0.8 (Figure 3). One-third of all cells covering the country were finally declared as under-sampled.
Table 1. Decision table for levels of knowledge of palm species across Benin.
Code Frequency Percent Decisions 0 18 37 under-sampled: CM either <0.5 or cannot be calculated, and expert judgment not
available 1 18 37 complete (CM = 1) 2 2 4 complete (based on expert judgment) 3 11 22 incomplete (Sp or Sc >Sobs and CM valid)
townpeterson
Typewritten Text
50

Biodiversity Informatics, 10, 2015, 45-55
Figure 3. Completeness of inventories of palm trees in Benin at ½°spatial resolution and environmental and geographic distances from well-sampled cells. Bar diagrams in each cell represent the number of observed species (Sobs), and upper limit for expected species (Sexp), classified by completeness criteria. The density of shades represent the combination of the environmental distance (reds) and geographic distance (blues) between the shaded area and the well-sampled cells.
townpeterson
Typewritten Text
51

Biodiversity Informatics, 10, 2015, 45-55
We analysed completeness values for the ½° resolution which showed completeness evenly dis-tributed across biogeographic zones in Benin based on the geographic distance map. The environ-mental distance was higher in lowlands beyond the Atacora Mountains (northwestern part of the country), in remote areas, and in border regions.
Comparison of soil types in the country revealed variability across biogeographic zones (Figure 1). Ferralitic soils are found mostly in the southern part (and in the northeast corner) whereas more ferruginous soils are found northwards. Well-known areas covered much of these soil types, suggesting completeness of inventory of palm communities on soil types.
Homogenous, relatively stable climatic condi-tions were encountered across most ecosystems in the country. Annual mean temperature was between 25-29oC and annual precipitation between 700-1300 mm. Regions with higher temperature generally had lower precipi-tation and vice versa (Figure 4). However, some areas were environ-mentally different, especially above 10o N. We calculated distances to well-known cells in climate space, which turned out to be roughly comparable to geographic distances to well-known sites (Figure 3). Combining both distances, we produced a view of areas that seem both poorly known and are both geographically remote and environmen-
tally different from well-known sites (Figure 3).
DISCUSSION This study represents a first attempt in charac-
terizing completeness of knowledge of palm com-munity composition across Benin through the use of data from our fieldwork and data available to the broader scientific community. Inventory com-pleteness was high across the country and most of the country’s ecosystems hosting palm species are thus well sampled. As such, the current state of the inventory of wild palms across ecosystems in Benin is considered reasonably complete. This result comes from the concordance of the findings from different estimates. Although palm records were more concentrated in some areas, these higher concentrations were not linked to accessi-bility features (e.g., roads), as has often been described in whole-region biodiversity studies (e.g., Escala et al. 1997). However, the opposite was not true: the few sections where low completeness existed did not lack records, but often coincided with remote areas having a low density of roads or other access points, or being otherwise harder to reach. Some of these in-complete sectors had also high environmental distances to well-sampled areas, and constituted gaps in sampling and knowledge.
Figure 4. Scatterplot of precipitation vs. temperature at 5000 random points across Benin, classified according to the relative geographic distance to well-sampled cells.
townpeterson
Typewritten Text
52

Biodiversity Informatics, 10, 2015, 45-55
Gap areas are places that have not been well sampled (Kier et al. 2005; Stehmann 2009). Gap analyses mostly focus on a particular taxon and its distribution and diversity across regions, eco-regions, or biomes (Mora et al. 2008). Meanwhile, it is important to know how complete areas of inventories are, in order to apply appropriate levels of confidence (Colwell and Coddington 1994). For Benin, gaps resulting from wild palm inventory assessment are located in remote areas, such as in mountainous regions. These areas have not been previously mentioned as hosting palm biodiversity (Akoègninou et al. 2006). The dryness of the climate could also explain the rarity of palm species in these areas. Contrary to the findings of Soria-Auza and Kessler (2008), palm diversity assessment in Benin was not influenced by uneven collecting effort. The current study was based on intensive fieldwork through different seasons with the help of knowledgeable local people in the field. In addition, wild palms are recognizably distinct species, with little room for identification error: the species have long been described and few taxo-nomic misidentifications have been reported. As such, taxonomic bias is not likely to have affected the inventory, contrary to situations for other taxa (Soberón et al. 2000; Pyke and Ehrlich 2010).
The value of sharing data has been recognized for some time (Nelson 2009). Earlier, data were often safely and jealously kept by their owner (be it an individual, laboratory, or museum) and could only be accessed through remuneration of some sort, e.g. authorship (Scoble 2000; Ponder et al. 2001; Wang et al. 2007). However, recent advan-ces in information technology and an increased willingness to share primary biodiversity data are enabling unprecedented access (Soberón and Peterson 2004), as in case of GBIF. This sea-change makes the research more interesting and easy; as more data are available, more predictions and analyses can be developed. As the bioinfor-matics community pointed out, only by looking at vast databases that describe the whole of the system will we be able to understand the big picture, and find correlations and patterns (Hardis-ty et al. 2013). However, more efforts should be made by data providers to assure the quality of the data that they are sharing, as most of these data require thorough cleaning (Otegui et al. 2013).
This study revealed insightful information that will potentially impact scientific knowledge and
conservation efforts. Even if exhaustive inventories of African palms are somehow feasible objectives for short-term fieldwork, our results demonstrate that, with the addition of digital accessible knowledge on top of existing survey data, a relatively complete picture about the group of interest could be obtained. This observation has important implications for sampling, as combi-nation of available data source reduces the time, effort, and money required for new field surveys, which are nevertheless necessary to gather new data. Further, re-visitation of the already studied areas would provide information to understand and appreciate the level of changes in the landscape where these palms are found.
ACKNOWLEDGMENTS
Data collection for this research was supported by the University of Abomey-Calavi (Republic of Benin) through WILD-PALM project. Analyses were fully developed and implemented through active collaboration with Town Peterson and Lindsay Campbell. We thank Salako Valère, Akpona Jean Didier, and Donou Marcel for their contributions, and two anonymous referees whose comments improved this paper.
REFERENCES Akoègninou, A., W. J. Van der Burg and L. J. G. Van
der Maesen. 2006. Flore analytique du Bénin. Blackhuys Publishers, Cotonou
Aranda, S. C., R. Gabriel, P. A. Borges and J. M. Lobo. 2010. Assessing the completeness of bryophytes inventories: an oceanic island as a case study (Terceira, Azorean archipelago). Biodiversity & Conservation 19: 2469-2484.
Ariño, A. H. 2010. Approaches to estimating the universe of natural history collections data. Biodiversity Informatics 7: 81-92.
Ariño, A. H., C. Belascoáin and R. Jordana. 2008. Optimal sampling for complexity in soil ecosystems. In: Minai A., Bar-Yam Y., Unifying themes in Complex Systems IV. Springer. pp 220-230.
Bruner, A. G., R. E. Gullison, R. E. Rice, and G. A. Da Fonseca. 2001. Effectiveness of parks in protecting tropical biodiversity. Science 291: 125-128.
Cardoso, P., S. S. Henriques, C. Gaspar, L. C. Crespo, R. Carvalho, J. B. Schmidt and T. Szűts. 2009. Species richness and composition assessment of spiders in a Mediterranean scrubland. Journal of Insect Conservation 13: 45-55.
townpeterson
Typewritten Text
53

Biodiversity Informatics, 10, 2015, 45-55
Chao, A. and L. Jost. 2012. Coverage-based rarefaction and extrapolation: standardizing samples by completeness rather than size. Ecology 93: 2533-2547.
Chao, A., W-H. Hwang, Y-C. Chen and C-Y Kuo. 2000. Estimating the number of shared species in two communities. Statistica Sinica 10: 227-246.
Colwell, R. K. and J. A. Coddington. 1994. Estimating terrestrial biodiversity through extrapola-tion. Philosophical Transactions of the Royal Society B, 345: 101-118.
deThoisy, B., S. Brosse and M. A. Dubois. 2008. Assessment of large-vertebrate species richness and relative abundance in Neotropical forest using line-transect censuses: what is the minimal effort required? Biodiversity & Conservation 17: 2627-2644.
Escala, M.C., J.C. Irurzun, A. Rueda and A.H. Ariño. 1997. Atlas of the Insectivora and Rodentia of Navarra: biogeographical analysis. Publicaciones de Biología de la Universidad de Navarra, Serie Zoológica 25: 1-79.
FAO. 2010. Evaluation des ressources forestières mondiales. Rapport principal. Organisation des Nations Unies pour l'alimentation et l'agriculture. Rome, Italie.
Graham, C. H., S. Ferrier, F. Huettman, C. Moritz and A. T. Peterson. 2004. New developments in museum-based informatics and applications in biodiversity analysis. Trends in Ecology and Evolution 19: 497-503.
Guralnick, R. P., J. Wieczorek, R. Beaman, R. J. Hijmans and BioGeomancer Working Group. 2006. BioGeomancer: automated georeferencing to map the world's biodiversity data. PLoS Biology 4: e381.
Hardisty, A., D. Roberts and the Biodiversity Informatics Community. 2013. A decadal view of biodiversity informatics: challenges and priorities. BMC Ecology 13:16.
Hijmans, R.J., S.E. Cameron, J.L. Parra, P.G. Jones and A. Jarvis. 2005. Very high resolution interpolated climate surfaces for global land areas. International Journal of Climatology 25: 1965-1978.
Humphries, C. J., P. H. Willams and R. I. Vane-Wright. 1995. Measuring biodiversity value for conservation. Annual Review of Ecology and Systematics 26: 93-111.
Kier, G., J. Mutke, E. Dinerstein, T.H. Ricketts, W. Küper, H. Kreft and W. Barthlott 2005. Global patterns of plant diversity and floristic knowledge. Journal of Biogeography 32: 1107–1116.
Kjær, A., A. S. Barfod, C. B. Asmussen and O. Seberg. 2004. Investigation of genetic and morphological variation in the sago palm (Metroxylonsagu;
Arecaceae) in Papua New Guinea. Ann Bot-London 94: 109-117.
Lovell, S. J., M. L. Hamer, R. H. Slotow and D. Herber. 2010. Assessment of sampling approaches for a multi-taxa invertebrate survey in a South African savanna-mosaic ecosystem. Austral Ecology 35: 357-370.
Magurran, A.E. 1988. Ecological Diversity and its Measurement. London: North-Holland.
May, R. M. 1988. How many species are there on Earth? Science 241: 1441-1449.
Monteiro, J. M., U. P. de Albuquerque, E. M. de Freitas Lins-Neto, E. L. de Araújo and E. L. C. de Amorim. 2006. Use patterns and knowledge of medicinal species among two rural communities in Brazil's semi-arid northeastern region. Journal of Ethnopharmacology 105: 173-186.
Mora, C. 2008. A clear human footprint in the coral reefs of the Caribbean. Proceedings of the Royal Society of London B 275: 767-773.
Nelson, B. 2009. Data sharing: empty archives. Nature: 461. 160-163
Otegui, J., A. H. Ariño, V. Chavan and S. Gaiji. 2013. On the dates of GBIF-mobilised primary biodiversity records. Biodiversity Informatics 8: 173-184.
Pino-del-Carpio, A., A. H. Ariño and R. Miranda. 2014a. Data exchange gaps in knowledge of biodiversity: implications for the management and conservation of Biosphere Reserves. Biodiversity & Conservation 23: 2239-2258.
Ponder, W. F., G. A. Carter, P. Flemons and R. R. Chapman. 2001. Evaluation of museum collection data for use in biodiversity assessment. Conservation Biology 15: 648-657.
Pyke, G. H. and P. R. Ehrlich. 2010. Biological collections and ecological/environmental research: a review, some observations and a look to the future. Biological Review 85: 247-266.
R Development Core Team. 2013. R: a language and environment for statistical computing. R foundation for statistical computing, Vienna, Austria.
Raven, P.H. and E.O. Wilson. 1992. A fifty-year plan for biodiversity surveys. Science 258: 1099-1100.
Scoble, M. J. 2000. Costs and benefits of Web access to museum data. Trends in Ecology and Evolution 15: 374.
Seber, G. A. F. 1982. The estimation of animal abundance and related parameters. MacMillan, New York.
Soberón, J. M., J. B. Llorente and L. Oñate. 2000. The use of specimen-label databases for conservation purposes: an example using Mexican papilionid and pierid butterflies. Biodiversity & Conservation 9: 1441-1466.
townpeterson
Typewritten Text
54
townpeterson
Typewritten Text
Biodiversity Informatics, 10, 2015, 45-55
Soberón, J., and T. Peterson. 2004. Biodiversity informatics: managing and applying primary biodiversity data. Philosophical Transactions of the Royal Society B 359: 689-698.
Soria-Auza, R. W. and M. Kessler, 2008. The influence of sampling intensity on the perception of the spatial distribution of tropical diversity and endemism: a case study of ferns from Bolivia. Diversity & Distributions 14: 123-130.
Sousa-Baena, M. S., L. C. Garcia and A. T. Peterson. 2014. Completeness of digital accessible knowledge of the plants of Brazil and priorities for survey and inventory. Diversity & Distributions 20: 369-381.
Stehman, S.V. 2009. Sampling designs for accuracy assessment of land cover. International Journal of Remote Sensing 30: 5243–5272.
Thompson, G. G., S. A. Thompson, P. C. Withers and J. Fraser. 2007. Determining adequate trapping effort and species richness using species accumulation curves for environmental impact assessments. Austral Ecology 32: 570-580.
Tomlinson, P. B. 1990. The structural biology of palms. Oxford University Press. Oxford.
Vormisto, J., J. C. Svenning, P. Hall and H. Balslev. 2004. Diversity and dominance in palm (Arecaceae) communities in terra firme forests in the western Amazon basin. Journal of Ecology 92: 577-588.
Wang, Y., L. M. Aroyo, N. Stash and L. Rutledge. 2007. Interactive user modeling for personalized access to museum collections: The Rijksmuseum case study. In: user modeling. 2007 Springer Berlin Heidelberg. pp. 385-389.
townpeterson
Typewritten Text
55