Estimating biomass of economically important palms in Peru ...
68
Estimating biomass of economically important palms in Peru using UAV and satellite remote sensing Responsible Professor: Dr. Ir. Ron van Lammeren Supervisor(s): Dr. Harm Bartholomeus Maria Ximena Tagle Casapia Joey A. P. Zalman (UU ID: 1726102) March, 4 th 2022
-
Upload
khangminh22 -
Category
Documents
-
view
0 -
download
0
Transcript of Estimating biomass of economically important palms in Peru ...
Estimating biomass of economically important palms in Peru using UAV and
satellite remote sensing
Responsible Professor: Dr. Ir. Ron van Lammeren
Supervisor(s): Dr. Harm Bartholomeus
Maria Ximena Tagle Casapia
Joey A. P. Zalman (UU ID: 1726102)
March, 4th 2022

Acknowledgements
This thesis was written in order to fulfil the course requirements of the MSc. Program Geographical Information Management and Applications (GIMA).
I would like to thank my supervisors Dr. Harm Bartholomeus and Maria Ximena Tagle Casapia from Wageningen University, who were very supportive throughout this challenging research process. Thanks to them I was able to successfully finish this report on time.
I would like to thank the forestplot.net team, who made it possible for me to get access to the forest measurement datasets. And also special thanks to the forest plot principle investigators T. Baker, G. Flores Llampazo, H. Coronado, H. Vásquez Vásquez, J. Reyna Huaymacari and J.Cordova Oroche, who gave me permission to use their plot data for this study. I would also like to thanks G. Asner, G. Li, P. Potapov, M. Simard and H. Coronado for providing the forest raster datasets.
Without these researchers sharing their data, this study would not have been possible.
Abstract
Palm swamps in the Amazon are regarded as important carbon-dense ecosystems, with palms regarded as important non-timber forest products for local communities. Knowing the abundance and biomass of palms in these areas allows for better sustainable forest planning, but data collecting in the field is difficult and expensive. However, commercial UAV’s present opportunities for mapping palm abundance and biomass in a cost-effective way. The main objective of this study is to understand how effectively commercial RGB UAV can be used in dense tropical palm forests to detect palms and estimate the biomass. Palm biomass is estimated using allometric models that require palm height as input. The UAV imagery is used to create canopy height maps and is compared with other remote sensing derived height maps to determine which height dataset is best suitable for estimating palm biomass. The UAV derived palm locations from the Tagle Casapia et al. (2020) study are used to extract the palm crown height values from each height map. A total of six height maps were used to estimate palm biomass.
The results showed that the detection rate of the UAV was in important factor when estimating palm biomass in plots. The palm heights mapped by the UAV has large errors and underestimated the palm heights. These UAV errors were mostly caused by the dense and complex canopies of tropical palm forests, where the ground is also not visible or covered by water, making palm crown identification and heights estimations difficult. The palm height maps by Potapov et al. (2021) and Asner (2021) had much lower errors, however all of the height maps underestimated the heights of palms taller than 34m. A linear model was also created to estimate the palm heights by using the UAV, Potapov and Asner maps as input. The Potapov and linear model height data had the lowest errors when estimating biomass.
UAV provides a cost-effective solution for mapping palms and their biomass, but has varying results based on the local forest structure. The RGB UAV palm detection method used for this study could however still be used for forest management and planning purposes, as the UAV is able to give an estimation of the number of palms and their biomass in an area. Remote sensing derived heights can also supplement field data collection, offering an alternative to labor intensive palm height measurements in the field.
Keywords: palm, biomass, forest, UAV, remote sensing, canopy height, Peru
Table of Contents
Contents
List of figures ........................................................................................................................................... 1
List of tables ............................................................................................................................................ 3
List of abbreviations ................................................................................................................................ 4
1 Introduction ..................................................................................................................................... 5
1.1 Research context ..................................................................................................................... 5
1.1.1 Importance of palms in Northern Peru ........................................................................... 5
1.1.2 Remote sensing for palm mapping in Peru ..................................................................... 5
1.1.3 Palm biomass allometry and tree height measurement ................................................. 6
1.2 Objectives and research questions ......................................................................................... 7
1.2.1 Problem statement .......................................................................................................... 7
1.2.2 Research objectives ......................................................................................................... 8
2 Theoretical framework .................................................................................................................... 9
2.1 Mapping palm biomass ........................................................................................................... 9
2.2 Palm detection with UAV ........................................................................................................ 9
2.2.1 Palm detection and identification ................................................................................... 9
2.2.2 Palm detection and species identification in Peru ........................................................ 10
2.2.3 Mapping palm canopy height using UAV photogrammetry .......................................... 11
2.3 Forest plot ground reference data ........................................................................................ 11
2.3.1 Availability of forest plot data ....................................................................................... 11
2.3.2 Data collection and quality control ............................................................................... 11
2.4 Allometric models for estimating palm biomass ................................................................... 12
2.5 Forest canopy height resources ............................................................................................ 13
2.5.1 Availability of canopy height maps ................................................................................ 13
2.5.2 Global GEDI Level L2A map ........................................................................................... 14
2.5.3 Global 30m resolution map based by Potapov et al. (2021) ......................................... 14
2.5.4 Global 1km resolution map by Simard et al. (2011) ...................................................... 14
2.5.5 Global 500m resolution map by Wang et al. (2016) ..................................................... 15
2.5.6 Local 1ha resolution map by Asner (Asner, 2021; Asner et al., 2014). ......................... 15
3 Methodology ................................................................................................................................. 16
3.1 Study area .............................................................................................................................. 16
3.2 Datasets ................................................................................................................................. 16
3.3 Data processing and analysis ................................................................................................. 18
3.3.1 Data processing workflow ............................................................................................. 18
3.3.2 Application of allometric equations .............................................................................. 19
3.3.3 Data cleaning and analysis ............................................................................................ 20
3.3.4 Software used ................................................................................................................ 21
4 Results ........................................................................................................................................... 22
4.1 Plot characteristics and palm occurrence ............................................................................. 22
4.1.1 Palm occurrence per species ......................................................................................... 22
4.1.2 Palm occurrence and detection per plot ....................................................................... 22
4.2 Palm height analysis .............................................................................................................. 25
4.2.1 Palm height distribution ................................................................................................ 25
4.2.2 Palm height per genus ................................................................................................... 26
4.2.3 Comparing stem and total palm height ......................................................................... 27
4.3 Remote sensing height .......................................................................................................... 28
4.3.1 Height map comparison ................................................................................................ 28
4.3.2 Linear model for total height ........................................................................................ 30
4.3.3 Plot level height accuracy .............................................................................................. 31
4.4 Biomass estimation ............................................................................................................... 34
4.4.1 Allometric model comparison ....................................................................................... 34
4.4.2 Biomass estimation accuracy ........................................................................................ 34
4.4.3 Biomass and palm detection rate .................................................................................. 36
4.4.4 Reference and UAV detected biomass compared ........................................................ 38
5 Discussion ...................................................................................................................................... 40
5.1 Palm occurrence and detection rate ..................................................................................... 40
5.2 Palm height estimation with remote sensing ....................................................................... 41
5.3 Biomass comparison .............................................................................................................. 43
5.4 Applications and sustainable forest management ................................................................ 45

Conclusions ............................................................................................................................................ 47
References ............................................................................................................................................. 49
Appendices ............................................................................................................................................ 55
Annex 1: Principle investigators that provided reference data ........................................................ 56
Annex 2: UAV mission details ............................................................................................................ 58
Annex 3: Number of palms detected per plot for each Genus ......................................................... 59
Annex 4: Reference palm height measured per plot ........................................................................ 60
Annex 5: Total biomass per source and plot ..................................................................................... 61
Annex 6: Field and RS biomass compared for sum per plot.............................................................. 62
1
List of figures
Figure 2.1: Results of M. flexuosa crown detection and delineation by Tagle Casapia et al. (2020). The
left image shows the crowns on the orthomosaic and the right image has the detected crowns
overlayed over the orthomosaic. .......................................................................................................... 10
Figure 3.1: Location of the selected forest plots in the region of Loreto, Peru. Background
sourced from google “streetmap”. .................................................................................................... 16
Figure 3.2: Workflow for data processing and analysis ........................................................................ 18
Figure 4.1: Occurrence of palm genera in the reference dataset, with the genera Elaeis, Attalea,
Astrocaryum and Oenocarpus classified as “Other” palms. The absolute count of each palm genus is
shown, followed by the % of the total number of palms the genus represents. .................................. 22
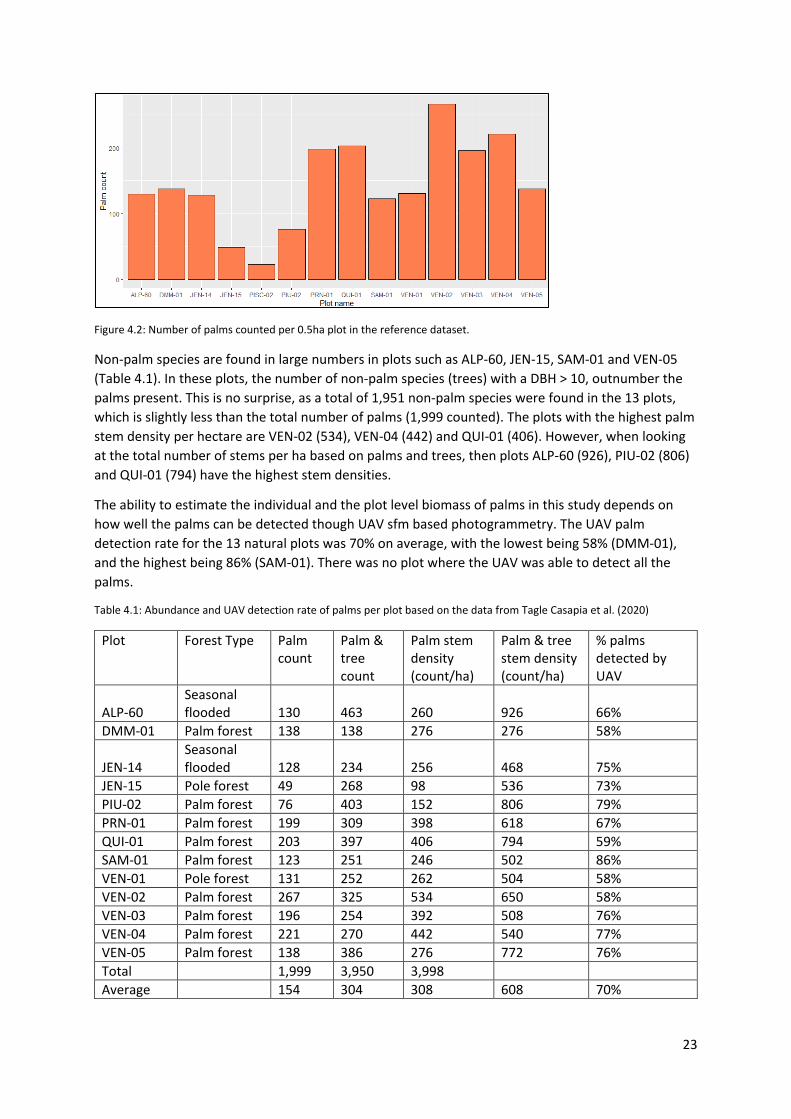
Figure 4.2: Number of palms counted per 0.5ha plot in the reference dataset. .................................. 23
Figure 4.3: Kernel density functions showing the distributions of the heights of the UAV detected and
missed palms based on heights from the reference data. .................................................................... 24
Figure 4.4: Relationship between total stem density (stems/ha) and UAV palm detection rate by per
plot. ....................................................................................................................................................... 24
Figure 4.5: Distribution of palm heights per plot with each genus represented by a color, based on
reference ground data. ......................................................................................................................... 25
Figure 4.6: Distribution of total palm heights per forest type with each genus represented by a color,
using reference data as input. ............................................................................................................... 26
Figure 4.7: Reference data distribution of palm heights per genus presented as boxplots. ................ 27
Figure 4.8: Comparison of stem height and total height per observed palm in the reference dataset,
sorted from the palms with the lowest to the highest stem height. .................................................... 27
Figure 4.9: Distribution of palm heights detected per height map for the 13 natural plots using only
the palms present in all datasets as input. Htot-ref and Hstem-ref refer to the height data from the
reference dataset, and all other height values represent Htot values from height maps. ................... 28
Figure 4.10: Distribution of palm heights detected per height map for the PISC-02 plantation. Htot-ref
and Hstem-ref refer to the height data from the reference dataset, and all other height values
represent Htot values from height maps. ............................................................................................. 29
Figure 4.11: Comparison of all palm heights measured per plot summed for each height source. ..... 31
Figure 4.12: Comparison of genus and family level biomass estimation of palms per plot using data
stem and total palm height from the reference data. .......................................................................... 34
Figure 4.13: Comparison of total biomass of all detected palms per height source based on the family
level allometric model. .......................................................................................................................... 35
2
Figure 4.14: Total biomass estimated per plot using family level allometric model compared for each
height source. ........................................................................................................................................ 36
Figure 4.15: Proportion of missed and detected biomass per plot based on the UAV palm detection
rate, and using reference data total height and the family level allometric model. ............................ 37
Figure 4.16: Comparison of the total reference data biomass with the biomass of the palms detected
by UAV using various height sources as input....................................................................................... 38
Figure 4.17: Plot comparison of the reference biomass with the biomass of the palms detected by
UAV using various remote sensing height sources as input. ................................................................ 39
3
List of tables
Table 2.1: Genus and family level allometric equations for palms proposed by Goodman et al. (2013)
with the best model fit which require genus, Hstem and DBH data as input. ...................................... 12
Table 2.2: Alternative family level allometric models proposed by Goodman et al. (2013) that only
require Htot and dmf data as input. ..................................................................................................... 12
Table 3.1: Overview of data available ................................................................................................... 17
Table 3.2: Genus specific allometric models (Goodman et al., 2013) used to get the most accurate
estimation of the palms in the reference dataset. ................................................................................ 19
Table 4.1: Abundance and UAV detection rate of palms per plot based on the data from Tagle Casapia
et al. (2020) ........................................................................................................................................... 23
Table 4.2: Height statistics for UAV detected and missed palms. ......................................................... 24
Table 4.3: Reference data total palm height statistics per genus. ........................................................ 26
Table 4.4: Total palm height of the reference data compared to that of the remote sensing derived
heights, with related statistics and errors. ............................................................................................ 29
Table 4.5: Comparison of linear models using remote sensing data as independent variables and the
reference palm height as dependent variable. ..................................................................................... 30
Table 4.6: Errors related to linear models using remote sensing data as independent variables and
the reference palm height as dependent variable. ............................................................................... 30
Table 4.7: Comparison of reference and UAV total palm height per plot with related errors. ............ 31
Table 4.8: Comparison of reference and Asner total palm height per plot with related errors. .......... 32
Table 4.9: Comparison of reference and Potapov total palm height per plot with related errors. ...... 33
Table 4.10: Comparison of reference and Model 1 total palm height per plot with related errors. .... 33
Table 4.11: Statistical comparison of reference data biomass with the remote sensing estimated
biomass based on the family level allometric model. ........................................................................... 35
Table 4.12: Biomass comparison of the palms detected and missed by UAV for each plot. ................ 37
4
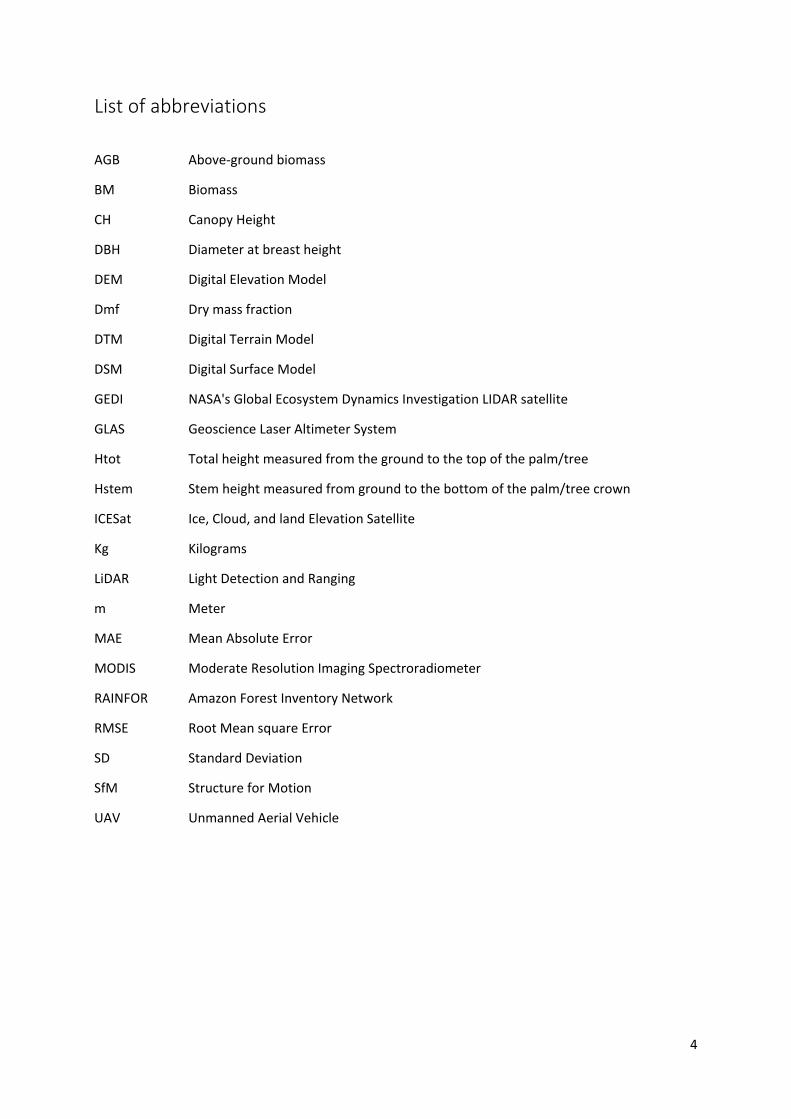
List of abbreviations
AGB Above-ground biomass
BM Biomass
CH Canopy Height
DBH Diameter at breast height
DEM Digital Elevation Model
Dmf Dry mass fraction
DTM Digital Terrain Model
DSM Digital Surface Model
GEDI NASA's Global Ecosystem Dynamics Investigation LIDAR satellite
GLAS Geoscience Laser Altimeter System
Htot Total height measured from the ground to the top of the palm/tree
Hstem Stem height measured from ground to the bottom of the palm/tree crown
ICESat Ice, Cloud, and land Elevation Satellite
Kg Kilograms
LiDAR Light Detection and Ranging
m Meter
MAE Mean Absolute Error
MODIS Moderate Resolution Imaging Spectroradiometer
RAINFOR Amazon Forest Inventory Network
RMSE Root Mean square Error
SD Standard Deviation
SfM Structure for Motion
UAV Unmanned Aerial Vehicle
5
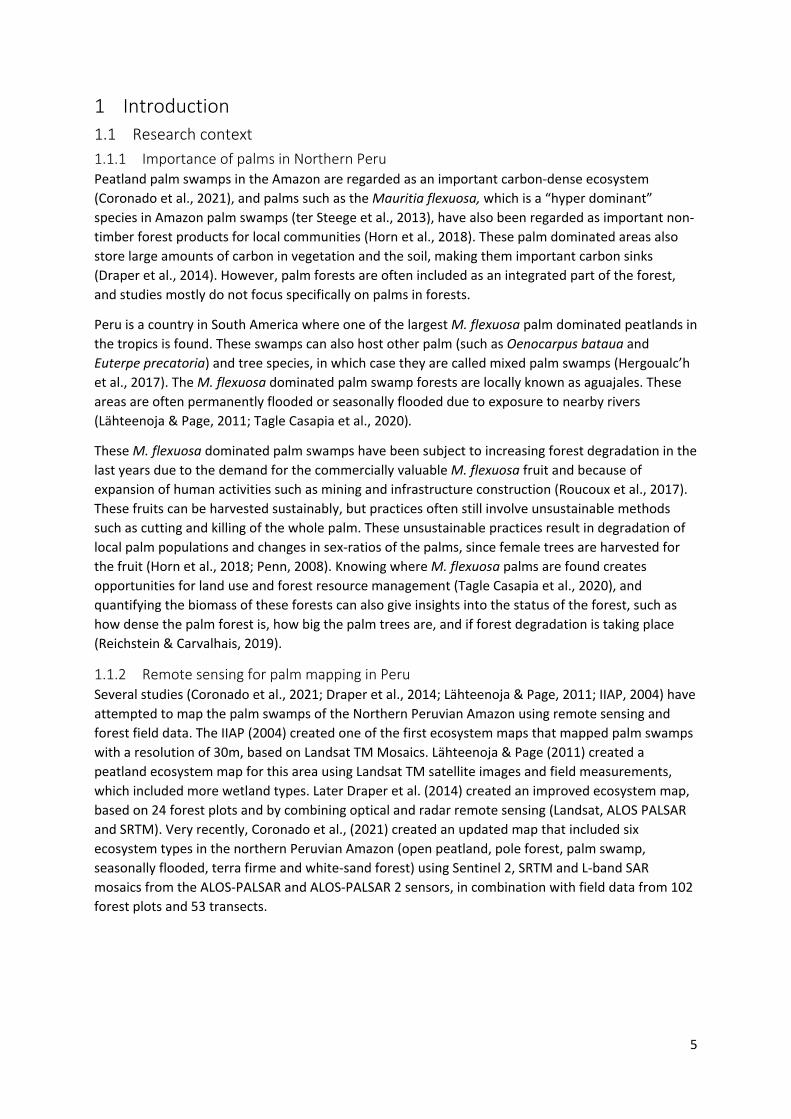
1 Introduction 1.1 Research context 1.1.1 Importance of palms in Northern Peru Peatland palm swamps in the Amazon are regarded as an important carbon-dense ecosystem (Coronado et al., 2021), and palms such as the Mauritia flexuosa, which is a “hyper dominant” species in Amazon palm swamps (ter Steege et al., 2013), have also been regarded as important non-timber forest products for local communities (Horn et al., 2018). These palm dominated areas also store large amounts of carbon in vegetation and the soil, making them important carbon sinks (Draper et al., 2014). However, palm forests are often included as an integrated part of the forest, and studies mostly do not focus specifically on palms in forests.
Peru is a country in South America where one of the largest M. flexuosa palm dominated peatlands in the tropics is found. These swamps can also host other palm (such as Oenocarpus bataua and Euterpe precatoria) and tree species, in which case they are called mixed palm swamps (Hergoualc’h et al., 2017). The M. flexuosa dominated palm swamp forests are locally known as aguajales. These areas are often permanently flooded or seasonally flooded due to exposure to nearby rivers (Lähteenoja & Page, 2011; Tagle Casapia et al., 2020).
These M. flexuosa dominated palm swamps have been subject to increasing forest degradation in the last years due to the demand for the commercially valuable M. flexuosa fruit and because of expansion of human activities such as mining and infrastructure construction (Roucoux et al., 2017). These fruits can be harvested sustainably, but practices often still involve unsustainable methods such as cutting and killing of the whole palm. These unsustainable practices result in degradation of local palm populations and changes in sex-ratios of the palms, since female trees are harvested for the fruit (Horn et al., 2018; Penn, 2008). Knowing where M. flexuosa palms are found creates opportunities for land use and forest resource management (Tagle Casapia et al., 2020), and quantifying the biomass of these forests can also give insights into the status of the forest, such as how dense the palm forest is, how big the palm trees are, and if forest degradation is taking place (Reichstein & Carvalhais, 2019).
1.1.2 Remote sensing for palm mapping in Peru Several studies (Coronado et al., 2021; Draper et al., 2014; Lähteenoja & Page, 2011; IIAP, 2004) have attempted to map the palm swamps of the Northern Peruvian Amazon using remote sensing and forest field data. The IIAP (2004) created one of the first ecosystem maps that mapped palm swamps with a resolution of 30m, based on Landsat TM Mosaics. Lähteenoja & Page (2011) created a peatland ecosystem map for this area using Landsat TM satellite images and field measurements, which included more wetland types. Later Draper et al. (2014) created an improved ecosystem map, based on 24 forest plots and by combining optical and radar remote sensing (Landsat, ALOS PALSAR and SRTM). Very recently, Coronado et al., (2021) created an updated map that included six ecosystem types in the northern Peruvian Amazon (open peatland, pole forest, palm swamp, seasonally flooded, terra firme and white-sand forest) using Sentinel 2, SRTM and L-band SAR mosaics from the ALOS-PALSAR and ALOS-PALSAR 2 sensors, in combination with field data from 102 forest plots and 53 transects.
6
Various studies have attempted to map forest biomass using remote sensing imagery in various forest types around the world (Emilien et al., 2021; Puletti et al., 2020; Shimizu et al., 2020). Draper et al. (2014) attempted to map the total biomass of the peatland ecosystems in Northern Peru, by combining field data with optical and radar remote sensing imagery. Palm swamps showed to have high above ground biomass due to the dominant M. flexuosa palm species, which can grow higher than 30m. This, combined with the high stem densities of more than 150 individuals per ha in some areas resulted in high biomass per hectare. More recently a very high resolution 1ha map of above ground biomass for Peru was created (Asner et al., 2014; Asner, Gregory P. et al., 2021). This was done by combining airborne LIDAR canopy height measurements with a large number of Planet Dove images using a machine learning approach. This produced a map with an R2 of 0.70. These maps are good estimators of global or forest type level forest biomass, but do not map biomass of individual palms or a specific genus/family, as these maps include both trees and palms in their biomass estimation.
When mapping palm forests in the context of conservation, then mapping and detecting forest degradation is often useful. Forest degradation occurs when there is a human-induced decrease of forest biomass in an area. Monitoring forest degradation is much more difficult compared to monitoring of deforestation, even though forest degradation can be a substantial source of carbon emissions (Pearson et al., 2014). Degradation often happens on a small scale, and satellites have to notice very subtle differences in reflectance between natural and degraded forest to detect degradation. This often makes measuring changes of biomass of palms in these palm swamps difficult through satellite remote sensing (Pearson et al., 2017). Hergoualc’h et al. (2017) was able to classify various levels of degraded palm swamp forests and map the related biomass by combining field data, ALOS/PALSAR and Landsat TM imagery on a large scale in the Peruvian Amazon with good accuracy, but included both tree and palm biomass in their estimations. They concluded that “Future research should consider developing additional criteria for identifying degradation, refining biomass loss estimates, measuring peat GHG emissions associated with degradation and evaluating the spatial extent of degradation in the M. flexuosa dominated forests of the Amazon.” Understanding where these palm are found and determining how their biomass can be mapped using remote sensing, is a first step to reaching these goals.
1.1.3 Palm biomass allometry and tree height measurement Allometric models have been developed to estimate biomass of individual trees and palms based on metrics such as wood density, stem diameter at breast height (DBH) and tree height (Chave et al., 2014; Goodman et al., 2013). In the case of palms, allometric equations require the palm height as main estimators of biomass, because palms mostly grow in height and have very limited DBH growth associated with increase in biomass (Goodman et al., 2013). Therefore, it is important to accurately measure palm heights when calculating biomass. Palm swamps average palm heights in Peru are characterized as being higher than 20m, due to the presence of the abundant and tall M. flexuosa palms (Draper et al., 2018).
Traditionally, palm dimension (height and diameter) data collection is done through field data collection in forest plots, where individual tree measurements are done. These measurements include species identification and tree dimension measurements that are required for the allometric biomass models (Chave et al., 2014; Goodman et al., 2013). The biomass measured in these plots can be used to extrapolate the biomass of all surrounding forests or similar forest types.
7
Forest plot field measurements that collect data on the ground produce relatively high quality tree measurement data such as tree height, DBH and species, but only cover a small area and are often very costly. However, even these tree height measurements in the field prove challenging at times, especially in tropical forests where the tree canopies are often closed due to high tree/palm abundance and large crowns. This makes the difficult and time consuming vegetation height measurements even more difficult (Larjavaara & Muller-Landau, 2013; Sullivan et al., 2018). In the last years, remote sensing technology has become more accessible, opening up new possibilities for remotely monitoring large forest areas and estimating forest height. Remote sensing techniques potentially allow for faster and more accurate measurements of height and related biomass (Larjavaara & Muller-Landau, 2013; Vaglio Laurin et al., 2019). Canopy heights are easier to measure than DBH when using remote sensing. Most remote sensing sensors are not able to directly estimate tree heights, but RBG UAV photogrammetry, LIDAR and RADAR have been shown to be effective in measuring forest characteristics related to biomass such as tree height (Larjavaara & Muller-Landau, 2013; Liang et al., 2016; Roşca et al., 2018; Vaglio Laurin et al., 2019). Tree height measurements using remote sensing can effectively be done using airborne LIDAR (on drones or airplanes), but can be costly. Modern RGB unmanned aerial vehicles (UAV’s) offer a low cost alternative to collect very high spatial resolution imagery for small areas, as open source high resolution satellite data is usually not freely available and is often not cloud-free. UAV’s are also compact and easy to transport, allowing frequent data collection, providing images to complement the lower resolution, large scale satellite imagery (Alvarez-Vanhard et al., 2020; Cruzan et al., 2016; Kuenzer et al., 2015). UAV photogrammetry can be used to create Digital Terrain Models (DTM’s) and Digital Surface Models (DSM’s) by applying a Structure from Motion (SfM) algorithm. In this way, UAV photogrammetry can also be used to estimate high resolution canopy heights from UAV RGB imagery (Tagle Casapia et al., 2020). UAV imagery also allows identification of specific palm crowns, as has been proven in Peru (Tagle Casapia et al., 2020). Various canopy height maps have been created, but not all map heights may be suitable for use in allometric equations due to the low spatial resolution of some maps and other limiting factors (Csillik et al., 2019; Potapov et al., 2021; Simard et al., 2011; Wang et al., 2016).
1.2 Objectives and research questions 1.2.1 Problem statement In the context of supporting palm conservation efforts, it is important to have a cost effective way of quantifying palm abundance and biomass. This is especially important now, as species such as M. flexuosa are subject to increased forest degradation due to human activities. Various ecosystem maps have been created, but these do not map locations of economically important palms at a resolution high enough to allow for detailed planning and management. Field data collection through forest inventory plots produce high quality data on palm locations and their biomass, but these only cover a small area and are often very costly and time consuming. UAV imagery plays a key role, as this can be used to map palm locations, while also mapping the canopy heights required for biomass estimations. Several other canopy height models have been developed which can also be used as input for the allometric models. However, it is not yet clear if remote sensing forest height data in combination with RGB UAV can accurately estimate palm biomass in Peru. Understanding this can contribute to the long-term forest conservation efforts in Peru.
8
1.2.2 Research objectives
Research questions
In the previous section the overall context and problem have been described. Based on this, the following research question is presented:
“Can RGB UAV in combination with satellite remote sensing be used to estimate the biomass of palms in forests?”
The following sub-questions will support in answering the main research question.
• How accurate is UAV measured palm height compared to field based measurements and what are the effects on biomass estimations?
• Which forest height maps are available for the estimation of palm height in Peru? • How accurate are forest height map derived palm heights compared to the field based
measurements and what are the effects on biomass estimations? • How much of the palm biomass can be detected and measured using UAV RGB remote
sensing compared to ground measurements? • Which allometric models are best suited for palm biomass estimation based on the available
remote sensing data and how do these compare to those from field based measurements Research Objectives
The objective of this study is to get estimations of the biomass of important palm species such as M. flexuosa using RGB UAV and remote sensing derived palm height, and to determine the accuracy of each method by comparing results to those of the field plot reference datasets. This will result in better insights into how biomass of individual palms can be determined without the time-consuming and costly fieldwork that is traditionally required.
9
2 Theoretical framework 2.1 Mapping palm biomass Several studies have described methods to estimate forest biomass and distinguish forest types by using various sources of remote sensing (Csillik et al., 2019; Draper et al., 2014; Hergoualc’h et al., 2017). At the moment there is no single remote sensing system available that is a good direct predictor of AGB, especially at individual palm level. Studies now use statistical models and input from various sources, including data collected in field plots, to predict biomass for areas with similar forest types (Réjou-Méchain et al., 2019). Spectral data from remote sensing imagery is used to classify forests with various characteristics, such as low and high biomass or based on forest types and land cover. Hergoualc’h et al. (2017) was able to use remote sensing to discriminate between dense palm swamps in Peru that had various levels of forest degradation, with higher levels of degradation being related to lower biomass. This map was made by combining Landsat and ALOS/PALSAR imagery. Draper et al. (2014) used a combination of SRTM, Landsat and ALOS/PALSAR to map biomass of peat land forests in Amazonia. Both these studies used forest plot data as reference data. Radar imagery such as ALOS/PALSAR has also been proven to provide complementary information to the spectral data from multispectral satellites such as Landsat when distinguishing forest characteristics using remote sensing (Saatchi et al., 2011). These studies all mapped forest biomass at resolutions higher than 30m. More detailed mapping of individual palm biomass through use of high resolution UAV imagery would allow for more opportunities for palm conservation and management (Tagle Casapia et al., 2020).
2.2 Palm detection with UAV 2.2.1 Palm detection and identification In order to estimate biomass of individual palms, palms need to be identified and located using remote sensing. Previous studies have mapped ecosystems where palms are abundant in the Loreto area of Peru, such as palm swamps and open peatlands (Coronado et al., 2021; Draper et al., 2018; Lähteenoja & Page, 2011), but there are no high resolution maps showing locations of individual palms. For these ecosystem maps, often open source imagery such as Landsat and Sentinel 2 (which also have high temporal resolutions and large coverage) are used in combination with other remote sensing data such as RADAR and LIDAR. Higher resolution images are necessary for individual palm identification, as detection of individual palm crowns and identification of the crown shape is required. Various high resolution satellites are available, but these are often not open source and are limited by cloud cover. Forests in South America have been shown to be affected by a cloud cover frequency between 30% and 80% (Prudente et al., 2020). UAV’s offer low-cost alternatives for obtaining high resolution imagery, without being affected by the high cloud cover frequency, and have increasingly been used for mapping of vegetation and forests (Cruzan et al., 2016; Z. Liu et al., 2016).
Satellite remote sensing techniques for monitoring of forest characteristics such as biomass, volume and growing stocks have been improving. Satellite imagery was commonly analyzed and processed using standard pixel-based analysis (Dang et al., 2019; Pandey et al., 2020), where the spectral properties of each pixel are used individually. This method has been suitable in many cases, such as those related to large scale landscape mapping, but is less suitable for precise mapping of palm and tree crowns. This is because the spatial characteristics of the pixels are not taken into account during the analysis. Several techniques have been developed for object detection in imagery, such as object-based image analysis (OBIA), valley following, between-tree shadow identification, region grouping, edge detection, watershed segmentation and 3D modeling (Jing et al., 2012). However, not all methods are effective in deciduous and mixed species forests that have dense canopies.
10
The object-based image analysis (OBIA) method is an alternative to the pixel-based method in the case that high-resolution imagery is available. This method also allows for the use of multiple spectral bands in the analysis, while including additional spatial resolution information such as context, scale and size. Another benefit of OBIA is that it requires less computational power during the post-processing step (Blaschke, 2010). Unique palm crown patters have proven to be detectible using an object based image analysis methodology (OBIA), as was proven by Tagle Casapia et al. (2020) and Iglhaut et al., (2019) in tropical forests. Several other studies have also attempted to map forest biomass by combining high resolution satellite imagery with the OBIA method (Gonçalves et al., 2017; Pham & Brabyn, 2017; Wang et al., 2016). These studies use the relationship between ground measurements and delineate canopy projection area (CPA) of individual trees to estimate the forest biomass. However, palms do not grow laterally (crown diameter), but grow in height (Goodman et al., 2013), making these methods unsuitable for application to palm species.
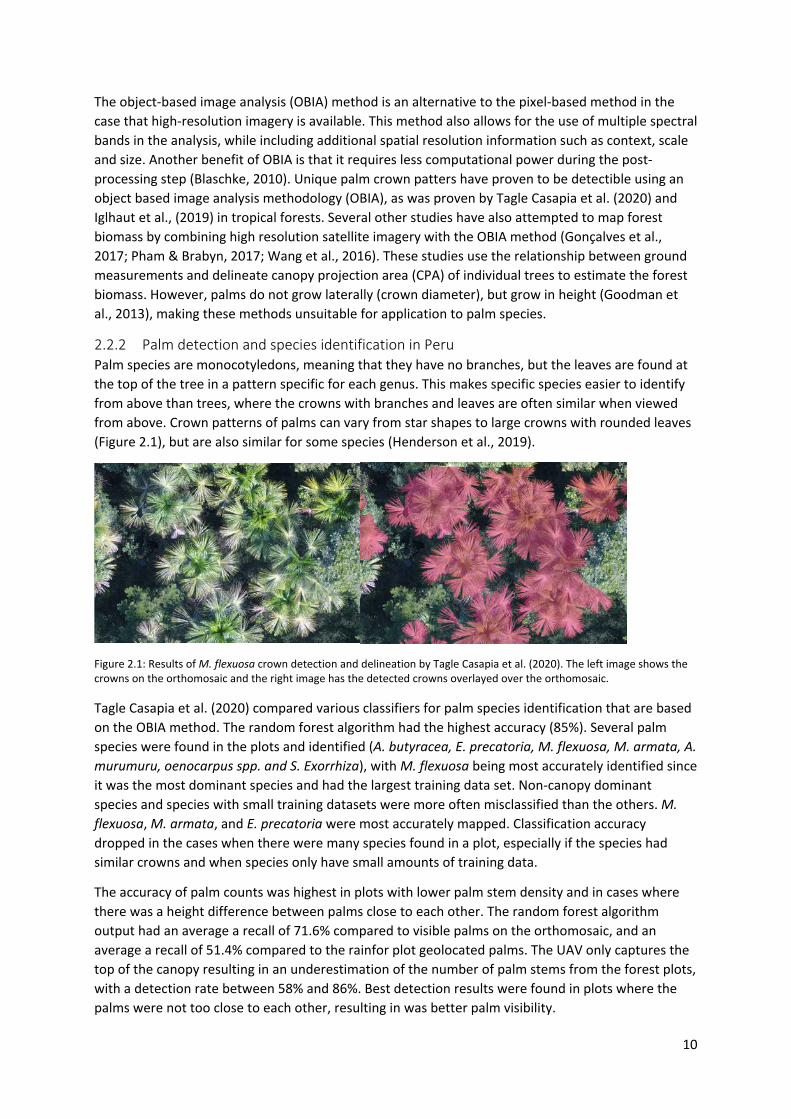
2.2.2 Palm detection and species identification in Peru Palm species are monocotyledons, meaning that they have no branches, but the leaves are found at the top of the tree in a pattern specific for each genus. This makes specific species easier to identify from above than trees, where the crowns with branches and leaves are often similar when viewed from above. Crown patterns of palms can vary from star shapes to large crowns with rounded leaves (Figure 2.1), but are also similar for some species (Henderson et al., 2019).
Figure 2.1: Results of M. flexuosa crown detection and delineation by Tagle Casapia et al. (2020). The left image shows the crowns on the orthomosaic and the right image has the detected crowns overlayed over the orthomosaic.
Tagle Casapia et al. (2020) compared various classifiers for palm species identification that are based on the OBIA method. The random forest algorithm had the highest accuracy (85%). Several palm species were found in the plots and identified (A. butyracea, E. precatoria, M. flexuosa, M. armata, A. murumuru, oenocarpus spp. and S. Exorrhiza), with M. flexuosa being most accurately identified since it was the most dominant species and had the largest training data set. Non-canopy dominant species and species with small training datasets were more often misclassified than the others. M. flexuosa, M. armata, and E. precatoria were most accurately mapped. Classification accuracy dropped in the cases when there were many species found in a plot, especially if the species had similar crowns and when species only have small amounts of training data.
The accuracy of palm counts was highest in plots with lower palm stem density and in cases where there was a height difference between palms close to each other. The random forest algorithm output had an average a recall of 71.6% compared to visible palms on the orthomosaic, and an average a recall of 51.4% compared to the rainfor plot geolocated palms. The UAV only captures the top of the canopy resulting in an underestimation of the number of palm stems from the forest plots, with a detection rate between 58% and 86%. Best detection results were found in plots where the palms were not too close to each other, resulting in was better palm visibility.
11
The species M. armata and M. flexuosa have similar crown shapes, making automatic classification difficult. However, the tree height characteristics and crown sized varied, which still made it possible to distinguish them. These results highlight the challenges when detecting palm species in mixed and dense forests, as previous studies using similar methods had only been done in areas with plantations or open forests where there was high contrast between the ground and the canopy, making crown detection and height estimations more accurate.
2.2.3 Mapping palm canopy height using UAV photogrammetry Optical UAV imagery allows for extraction of 3D image information using the Structure from Motion (sfM) methods. This method is often used in the physical geography field to monitor glacier movements and landslide displacement (Smith et al., 2016), but can also be used for mapping forests (Wallace et al., 2016). The main principle behind this method is that depth and 3D features can be perceived from two points if the relative position is known, but that this can also be done using a single moving observation point. The SfM algorithm, paired with multi-view stereo (MVS) algorithms can be used to create dense point clouds from the images. These dense point clouds can then be used for creating other products such as DSM’s and DTM’s (Iglhaut et al., 2019). The resulting DSM and DTM can be used to create a canopy height map with a very fine resolution of several centimeters. This method has many benefits, as images can have different scales, viewing angles and orientations. A dataset with overlapping unordered and heterogeneous images can still be used effectively, without the need for camera calibration, ground reference points or camera orientation information (Iglhaut et al., 2019; Westoby et al., 2012). This method was used by Tagle Casapia et al. (2020) to create DEM and DSM maps in Peru’s palm forests.
2.3 Forest plot ground reference data 2.3.1 Availability of forest plot data Tropical forests have an important ecological function in the world, and the amount of tree data collected in the tropics is increasing each year. Several databases already existed before 2011 to collect data on vegetation, but these were not focused on tropical regions. In response to this, the ForestPlots.net web portal was developed, which is a repository for tropical forest inventory plots. Here individual tree measurements and remeasurements are registered, allowing for secure storage and access of standardized forest plot data (Peacock et al., 2007). Data is made available in the database and has to be requested formally before use. The final decision regarding the access to the plots is decided by those who submitted the plots, and this process is facilitated by the forestplot database administrators (ForestPlots.net et al., 2021; Lopez-Gonzalez et al., 2011).
2.3.2 Data collection and quality control The forestplot.net data collected focuses on tree species, DBH, height and the mortality status of the trees. This allows for data analysis of changes in stem growth, tree mortality and biomass. Forstplots.net data collection is done using the “RAINFOR Field Manual for Plot Establishment and Remeasurement”, which is available for the public. This manual was created to ensure that all data is collected in a uniform method, allowing for standardization of globally collected data. There is a rigorous verification and validation procedure used in order to assure that the data from the various countries is standardized. This is especially the case for species and DBH verification, with the online tool highlighting inconsistencies when new data is submitted to the database. This data assurance process makes these datasets suitable as reference datasets in forest research (Lopez-Gonzalez et al., 2009, 2011; Malhi et al., 2002).
12
In each plot, every individual tree measured receives a code or tree number which is reused when the plot is measured again. The geographic location of each tree is also mapped by GPS. Tree height is measured when possible and this can be done using various methods. Methods to measure height include estimations by eye, manually with trigonometry (clinometer), laser distance to the tree and direct measurements (e.g. through climbing). Of these methods, the estimation by eye is the least accurate and the direct or laser measurements are the most accurate. The measurement points also vary, and can either be total height or stem height. The data used in this report was always measured using a clinometer, except for the PISC-02 plantation, where the heights were measured with ruler (Lopez-Gonzalez et al., 2009, 2011; Malhi et al., 2002).
2.4 Allometric models for estimating palm biomass To obtain the above ground biomass (AGB) estimation of palms, allometric models can be used. Field data collection in forest plots allows for collection of high quality relevant tree metrics required for allometric models, which are much more difficult to accurately determine using remote sensing. Palms are monocotyledonous plants, meaning that they have very different growth patterns compared to trees. For trees, the allometric equations from (Chave et al., 2014) are applied, which use DBH, wood density and tree height (when the height is available) as the main inputs for the allometric models. Monocotyledonous plants (palms) however, primarily grow in height and not in diameter, resulting in a weak correlation between biomass and diameter. This is especially the case for the Mauritia genus, which has a broad range of heights and a small range of DBH measured (Rich et al., 1986)..
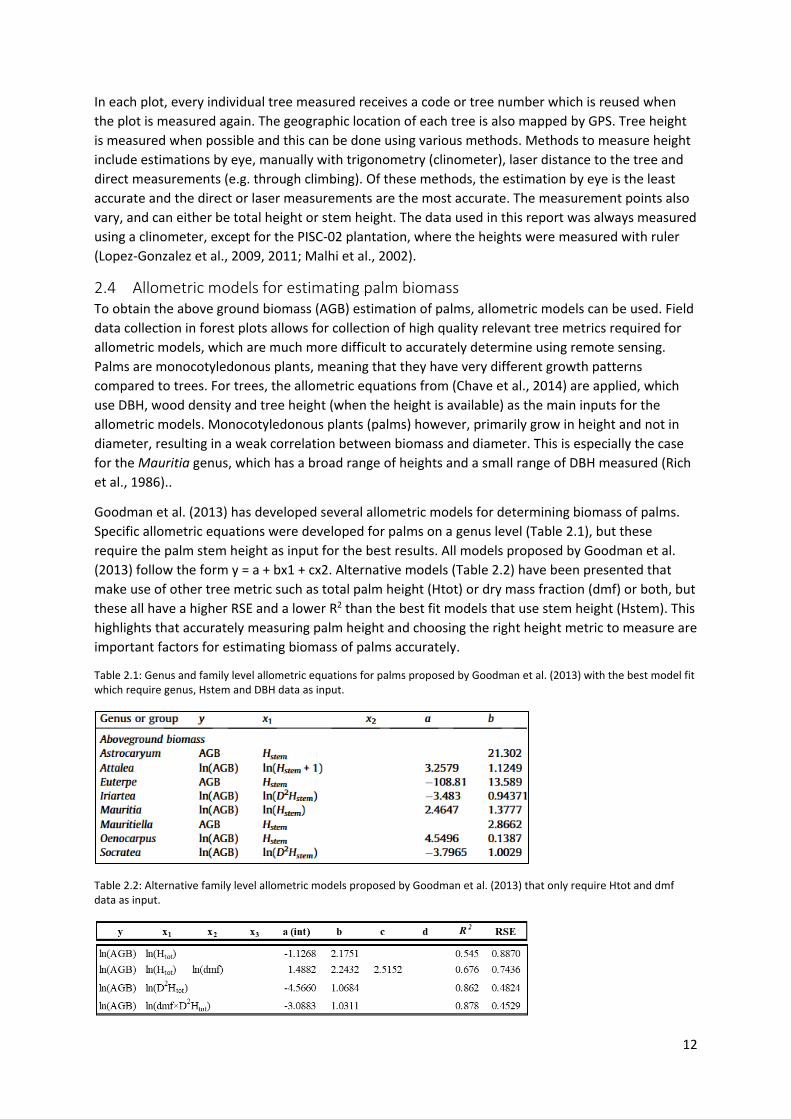
Goodman et al. (2013) has developed several allometric models for determining biomass of palms. Specific allometric equations were developed for palms on a genus level (Table 2.1), but these require the palm stem height as input for the best results. All models proposed by Goodman et al. (2013) follow the form y = a + bx1 + cx2. Alternative models (Table 2.2) have been presented that make use of other tree metric such as total palm height (Htot) or dry mass fraction (dmf) or both, but these all have a higher RSE and a lower R2 than the best fit models that use stem height (Hstem). This highlights that accurately measuring palm height and choosing the right height metric to measure are important factors for estimating biomass of palms accurately.
Table 2.1: Genus and family level allometric equations for palms proposed by Goodman et al. (2013) with the best model fit which require genus, Hstem and DBH data as input.
Table 2.2: Alternative family level allometric models proposed by Goodman et al. (2013) that only require Htot and dmf data as input.

13
The available height metric has an impact on the estimation of the biomass, as different allometric models will result in different biomass estimations. Palm height data measured through UAV and other remote sensing sources mostly result in top of canopy height values (Htot), while field measurements can measure both the Htot and the Hstem. Measuring palm stem height using optical remote sensing such as UAV with a RGB camera is difficult, as these sensors do not allow for penetration through the canopy. In the case of M. flexuosa, there are large differences between the total and stem height of a palm. Goodman et al. (2013) compared the total palm and the stem heights of M. flexuosa palms (n=16) harvested in Loreto Peru, and measured stem heights between 5.1m and 30.5m, and total heights between 9.1m and 38.4m for the same sample of palms. The minimum and maximum stem and total heights measured indicate that the difference between these two height metrics can be up to at least 7m.
In the case of the field measurements, the Hstem, Htot and species information are available, making it possible to use genus specific best fit models. The remote sensing maps provide top of canopy heights, in which case an alternative family level model that uses only total palm height and dmf as input will have to be used. The best fit genus level models performed well, with a very high of R2 (0.90) reported for most species, with a related RSE below 1.0. The Mauritia best fit model has an R2 of 0.897 and an RSE of 0.273. The alternative family level model (not the best model fit) only require total height to be measured, as the dmf is already made available by Goodman et al. (2013), but this model had higher errors reported than the genus level models. Using a family level model is necessary in this study, as species identification is not always accurate with UAV RGB remote sensing.
2.5 Forest canopy height resources 2.5.1 Availability of canopy height maps There are several sources of satellite data available, which can be used to estimate canopy heights, but most do not directly measure the canopy height. However, the ICEsat-2 and more recently launched GEDI space-based altimeters mapped canopy height through direct height measurements (Wang et al., 2016). Remote sensing sources such as RADAR, multispectral imagery and LIDAR have been combined in various ways to create canopy height maps around the world (Csillik et al., 2020; Shimizu et al., 2020; St-Onge & Grandin, 2019), with varying accuracies depending on the forest types and geographic locations. In Canada, a 30m resolution height map was created for a boreal zone using only LIDAR reference plots and Landsat composite data by using an imputation model (Matasci et al., 2018). In Gabon and Switzerland, a 10m resolution canopy height map was created by training a deep convolutional neural network (CNN) to extract spectral and spatial features from Sentinel 2 imagery (Lang et al., 2019). In Brazil, a combination of Sentinel 2, Landsat 8, ALOS-PALSAR SAR (Synthetic Aperture Radar), Sentinel-1 and LIDAR was used and tested with five regression algorithms and three forest types. The random forest regression algorithm had the highest canopy height prediction accuracy, but uncertainty was still highest in moist forests and rainforests (Fagua et al., 2019). In Japan, Multi-Temporal PlanetScope data was used in combination with Landsat 8 and Sentinel 2. Here multi-seasonal composites of high resolution planet scope imagery was used in a random forest model, which showed that multi-seasonal composites produce higher accuracy canopy height maps compared to when single composites are used (Shimizu et al., 2020).
In Peru, Asner (Asner, 2021; Asner et al., 2014) mapped the country’s canopy heights, but this is not the only source for forest canopy heights for the country, as various global canopy maps have also been created (Lefsky, 2010; Potapov et al., 2021; Simard et al., 2011; Wang et al., 2016). These maps have various resolutions and accuracies, which is why not all maps may be suitable for extraction of individual palm crown heights in Peru. The maps included in this study are described in the following chapters below.
14
2.5.2 Global GEDI Level L2A map The Global Ecosystem Dynamics Investigation (GEDI) satellite mission, which was launched in April 2019, is a geodetic-class, light detection and ranging (LIDAR) laser system, that has already shown to be useful for estimating forest canopy heights at large scales (Adam et al., 2020; Fayad et al., 2021). This multibeam, laser altimeter, is deployed on the International Space Station and provides more than 10 billion waveform measurements of the vertical structure of various forest types around the world (Dubayah et al., 2020). This satellite provides direct pixel level data on vertical forest structures for a wide range of areas, but only maps forests in swats. Because of this, GEDI maps needs to be combined with optical or RADAR imagery in order to get wall-to-wall estimates of forest height (Gu et al., 2018; Healey et al., 2020; Qi et al., 2019). GEDI data is freely available for download through the GEDI Finder web service (https://lpdaacsvc.cr.usgs.gov/services/gedifinder). The GEDI Level 2A Geolocated Elevation and Height Metrics product (GEDI02_A) is a processed version of the GEDI01_B received waveform, and the Level 2A includes the height metric, meaning that the users do not have to process the waveforms themselves (Dubayah et al., 2020). This raster data has a spatial resolution of about 1150m per pixel, based on the relative height metric of RH100.The relative height metrics corresponded to percentiles of energy return height relative to the ground for each laser footprint. A relative height metric of RH75 would then correspond to the 75th percentile of energy returned. In Germany, the GEDI was compared to ALS reference data from two sites and MAE values of 3.17m and 2.89m were reported for canopy height estimations (Adam et al., 2020). Another study was done in North America (A. Liu et al., 2021) used a large number of sample locations, in order to get better estimations of the GEDI canopy height accuracy. This showed that GEDI, compared with LIDAR canopy height reference data, had an R2 value of 0.82 and %RMSE values of 30.9%.
2.5.3 Global 30m resolution map based by Potapov et al. (2021) Potapov et al. (2021) combined GEDI data with 30m spatial resolution Landsat data to create a global 30m resolution canopy height map for 2019, which is freely available for the public online (https://glad.umd.edu/dataset/gedi/). Studies have shown that LANDSAT data is suitable for this type of forest structure based research (Hansen et al., 2016; Potapov et al., 2019). Various relative height values were compared using several L2A processing algorithms. The GEDI RH95 metric was most similar to the ALS reference dataset, which is why the RH95 metric was selected to calibrate the global forest height model instead of the RH100. A regression tree model is used to model forest height, as this methods has been successfully used in previous studies (Hansen et al., 2016; Potapov et al., 2019). The final canopy height map was compared with the GEDI validation dataset and resulted in a MRSE of 6.6m, MAE of 4.45m and an R2 of 0.62. There was an overall underestimation of 1m compared to the validation data, with more underestimations occurring for short (<7m) and tall (>30m) forests.
2.5.4 Global 1km resolution map by Simard et al. (2011) Before GEDI was available to provide canopy heights, the Geoscience Laser Altimeter System (GLAS) aboard ICESat (Ice, Cloud, and land Elevation Satellite) was available. Simard et al. (2011) created one of the first global forest canopy height maps with a spatial resolution of 1km. There is only sparse forest LIDAR data available by GLAS, and this data was also limited by cloud coverage. This global map was modelled by using GLAS data in combination with other ancillary data such as data from the Moderate Resolution Imaging Spectroradiometer (MODIS). GLAS RH100 canopy height data was acquired from 2003-2009, with the footprints being 65m, and 170m spaced from each other along long tracks. Ancillary data used include vegetation cover data from MODIS, elevations from SRTM and climate data from the Tropical Rainfall Measuring Mission (TRMM) and Worldclim databases. A regression tree method Random Forest (RF) model was used with the ancillary data variables as input, in order to model the RH100 canopy height where there was no GLAS coverage.
15
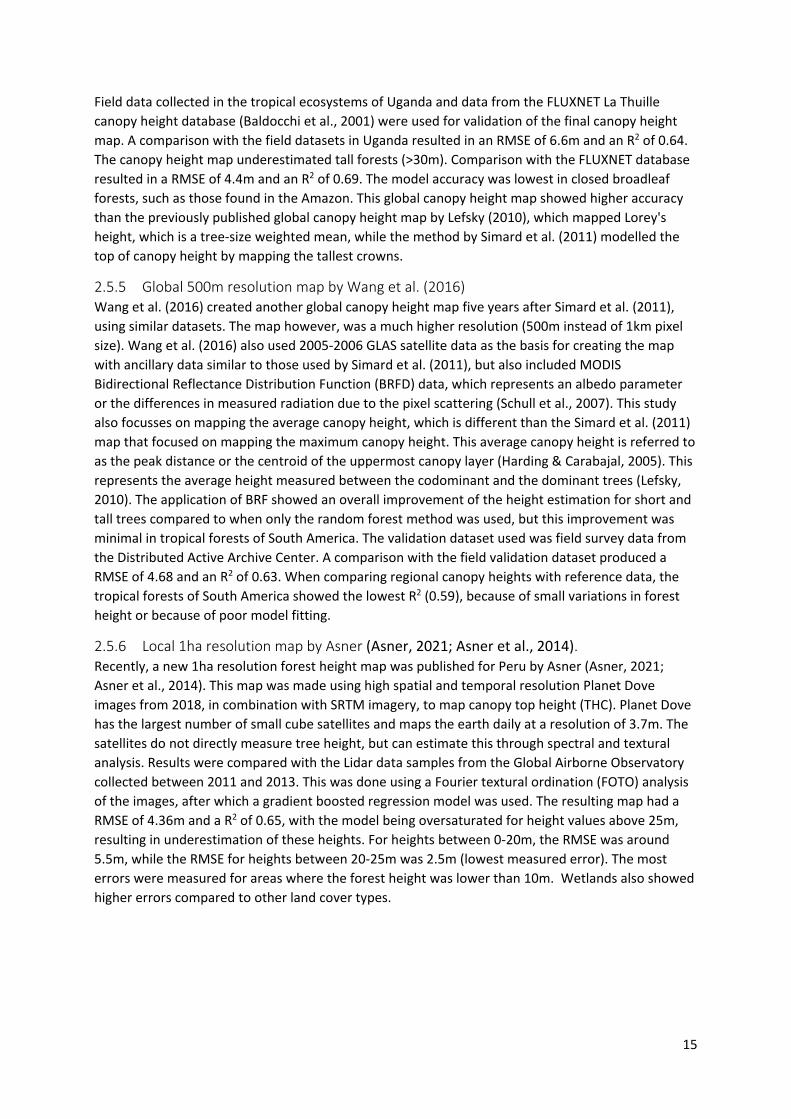
Field data collected in the tropical ecosystems of Uganda and data from the FLUXNET La Thuille canopy height database (Baldocchi et al., 2001) were used for validation of the final canopy height map. A comparison with the field datasets in Uganda resulted in an RMSE of 6.6m and an R2 of 0.64. The canopy height map underestimated tall forests (>30m). Comparison with the FLUXNET database resulted in a RMSE of 4.4m and an R2 of 0.69. The model accuracy was lowest in closed broadleaf forests, such as those found in the Amazon. This global canopy height map showed higher accuracy than the previously published global canopy height map by Lefsky (2010), which mapped Lorey's height, which is a tree-size weighted mean, while the method by Simard et al. (2011) modelled the top of canopy height by mapping the tallest crowns.
2.5.5 Global 500m resolution map by Wang et al. (2016) Wang et al. (2016) created another global canopy height map five years after Simard et al. (2011), using similar datasets. The map however, was a much higher resolution (500m instead of 1km pixel size). Wang et al. (2016) also used 2005-2006 GLAS satellite data as the basis for creating the map with ancillary data similar to those used by Simard et al. (2011), but also included MODIS Bidirectional Reflectance Distribution Function (BRFD) data, which represents an albedo parameter or the differences in measured radiation due to the pixel scattering (Schull et al., 2007). This study also focusses on mapping the average canopy height, which is different than the Simard et al. (2011) map that focused on mapping the maximum canopy height. This average canopy height is referred to as the peak distance or the centroid of the uppermost canopy layer (Harding & Carabajal, 2005). This represents the average height measured between the codominant and the dominant trees (Lefsky, 2010). The application of BRF showed an overall improvement of the height estimation for short and tall trees compared to when only the random forest method was used, but this improvement was minimal in tropical forests of South America. The validation dataset used was field survey data from the Distributed Active Archive Center. A comparison with the field validation dataset produced a RMSE of 4.68 and an R2 of 0.63. When comparing regional canopy heights with reference data, the tropical forests of South America showed the lowest R2 (0.59), because of small variations in forest height or because of poor model fitting.
2.5.6 Local 1ha resolution map by Asner (Asner, 2021; Asner et al., 2014). Recently, a new 1ha resolution forest height map was published for Peru by Asner (Asner, 2021; Asner et al., 2014). This map was made using high spatial and temporal resolution Planet Dove images from 2018, in combination with SRTM imagery, to map canopy top height (THC). Planet Dove has the largest number of small cube satellites and maps the earth daily at a resolution of 3.7m. The satellites do not directly measure tree height, but can estimate this through spectral and textural analysis. Results were compared with the Lidar data samples from the Global Airborne Observatory collected between 2011 and 2013. This was done using a Fourier textural ordination (FOTO) analysis of the images, after which a gradient boosted regression model was used. The resulting map had a RMSE of 4.36m and a R2 of 0.65, with the model being oversaturated for height values above 25m, resulting in underestimation of these heights. For heights between 0-20m, the RMSE was around 5.5m, while the RMSE for heights between 20-25m was 2.5m (lowest measured error). The most errors were measured for areas where the forest height was lower than 10m. Wetlands also showed higher errors compared to other land cover types.
16
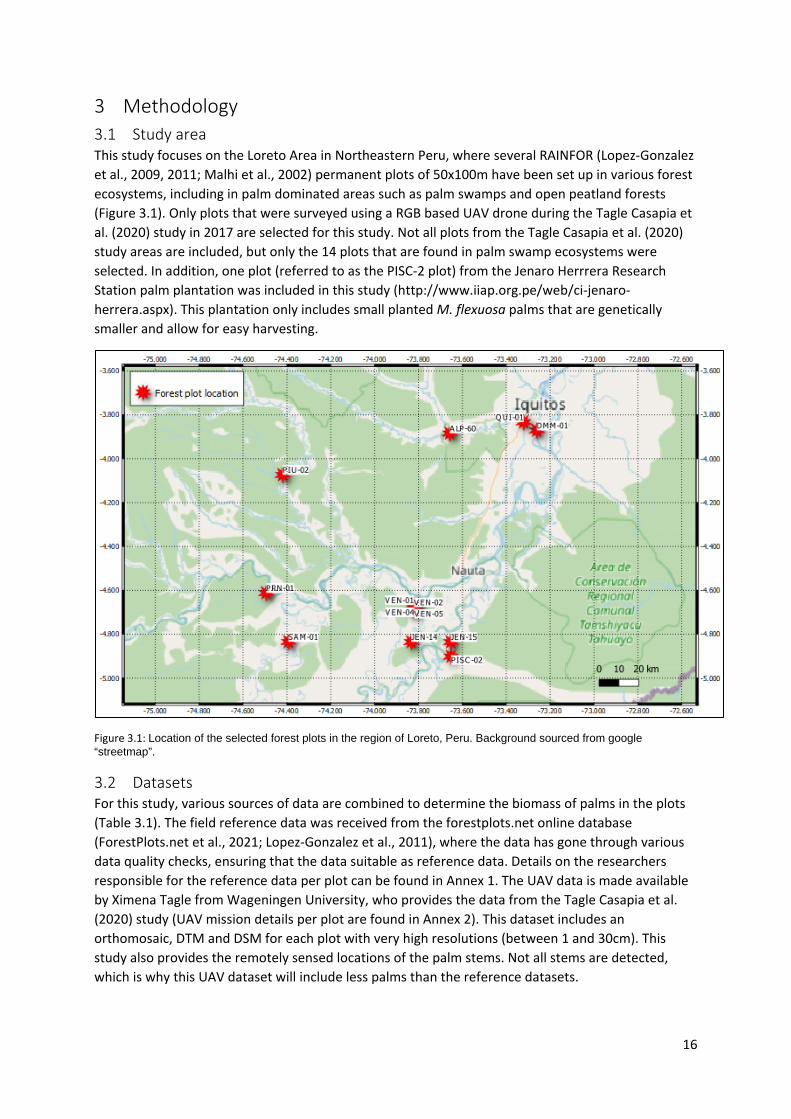
3 Methodology 3.1 Study area This study focuses on the Loreto Area in Northeastern Peru, where several RAINFOR (Lopez-Gonzalez et al., 2009, 2011; Malhi et al., 2002) permanent plots of 50x100m have been set up in various forest ecosystems, including in palm dominated areas such as palm swamps and open peatland forests (Figure 3.1). Only plots that were surveyed using a RGB based UAV drone during the Tagle Casapia et al. (2020) study in 2017 are selected for this study. Not all plots from the Tagle Casapia et al. (2020) study areas are included, but only the 14 plots that are found in palm swamp ecosystems were selected. In addition, one plot (referred to as the PISC-2 plot) from the Jenaro Herrrera Research Station palm plantation was included in this study (http://www.iiap.org.pe/web/ci-jenaro-herrera.aspx). This plantation only includes small planted M. flexuosa palms that are genetically smaller and allow for easy harvesting.
Figure 3.1: Location of the selected forest plots in the region of Loreto, Peru. Background sourced from google “streetmap”.
3.2 Datasets For this study, various sources of data are combined to determine the biomass of palms in the plots (Table 3.1). The field reference data was received from the forestplots.net online database (ForestPlots.net et al., 2021; Lopez-Gonzalez et al., 2011), where the data has gone through various data quality checks, ensuring that the data suitable as reference data. Details on the researchers responsible for the reference data per plot can be found in Annex 1. The UAV data is made available by Ximena Tagle from Wageningen University, who provides the data from the Tagle Casapia et al. (2020) study (UAV mission details per plot are found in Annex 2). This dataset includes an orthomosaic, DTM and DSM for each plot with very high resolutions (between 1 and 30cm). This study also provides the remotely sensed locations of the palm stems. Not all stems are detected, which is why this UAV dataset will include less palms than the reference datasets.
17
Total palm height values are extracted from the UAV CH mosaics, GEDI L2A (Dubayah et al., 2020), Potapov et al. (2021), Simard et al. (2011), Wang et al. (2016) and Asner (Asner et al., 2014; P. et al., 2021) forest height maps. None of these maps are specifically calibrated for palm swamps in Peru, as most are global maps that use various forest types as input data. The Potapov et al. (2021) map is expected to give good results as this has the highest resolution. The GEDI L2A data also collected data in the same period, but has a very low resolution and includes many locations with missing data due to how the image acquisition takes place (swats of forest are sampled). The Simard et al. (2011) and Wang et al. (2016) maps both use ICEsat as input data, which creates a temporal discrepancy, as the ICEsat data was only available before 2010. This could potentially be a cause of errors when comparing these heights with the ground reference datasets. The Wang et al. (2016) map is expected to be more suitable for this study than the Simard et al. (2011) map since it does not only map the canopy heights based on the highest crowns like in the Simard et al. (2011) study, and because it has a higher spatial resolution. The Global Airborne Observatory (Asner et al., 2014; P. et al., 2021) map is the only map specific for Peru. It is expected to give a good palm canopy height estimation due to being calibrated with national data and because of the similar data collection period (around 2017), but the low resolution of 1ha may make it less effective for use in the current study.
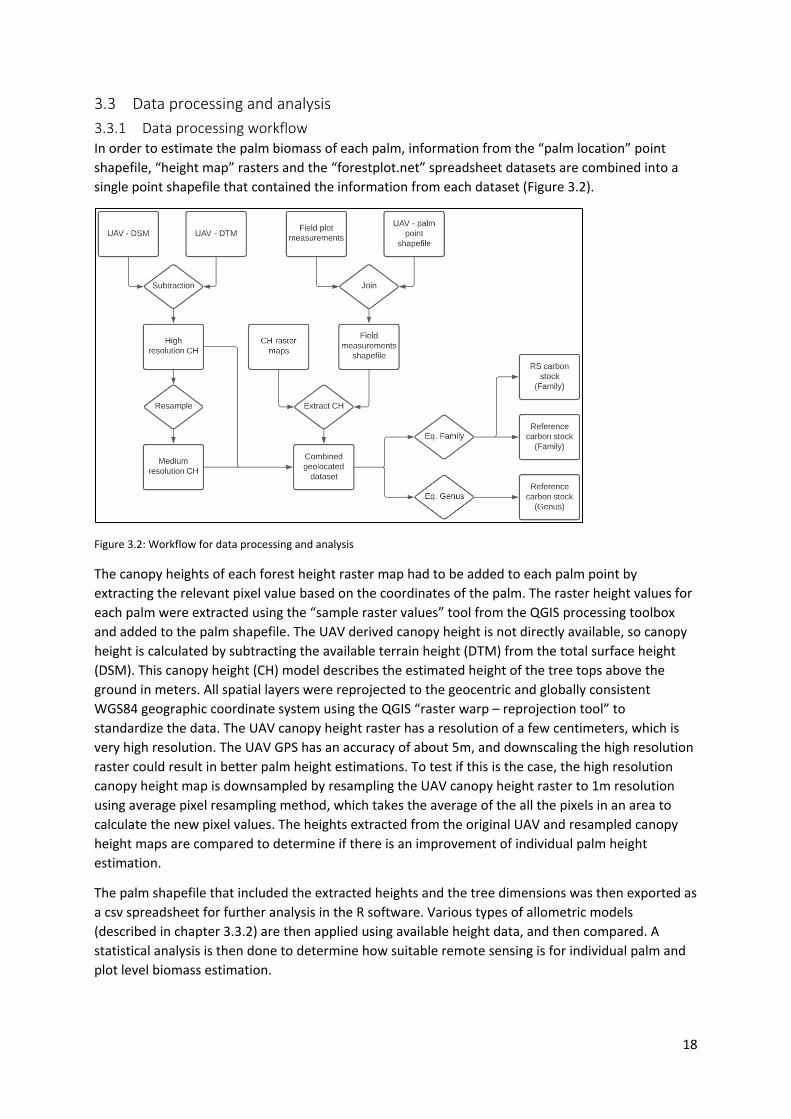
Table 3.1: Overview of data available
Dataset Data Comment source
RAINFOR forest inventory plots
Tabular palm data includes: DHB, species and tree height (total and stem)
Contains information on palms and trees found in each forest plot
(Lopez-Gonzalez et al., 2009, 2011; Malhi et al., 2002).
UAV imagery RGB mosaic, DTM and DEM as rasters.
High spatial resolution (Tagle Casapia et al., 2020)
UAV based palm locations
Point shapefile of UAV detected palm locations
Palms visible on the UAV mosaic
(Tagle Casapia et al., 2020)
GEDI level 2A global CH map
1150m spatial resolution raster Does not cover all plots (Dubayah et al., 2020)
GEDI and Landsat based global CH map
30m spatial resolution raster Highest resolution satellite based forest height map available
(Potapov et al., 2021)
ICEsat based global CH map
1km spatial resolution raster GLAS dataset used is very dated
(Simard et al., 2011)
ICEsat and MODIS BRFD based global CH map
500m spatial resolution raster Improved version of the Simard et al. (2011) map. GLAS dataset used is very dated
(Wang et al., 2016)
Planet Dove Imagery local CH map of Peru
1ha resolution local map Calibrated and created with data from Peru
(Asner, 2021; Asner et al., 2014)
18
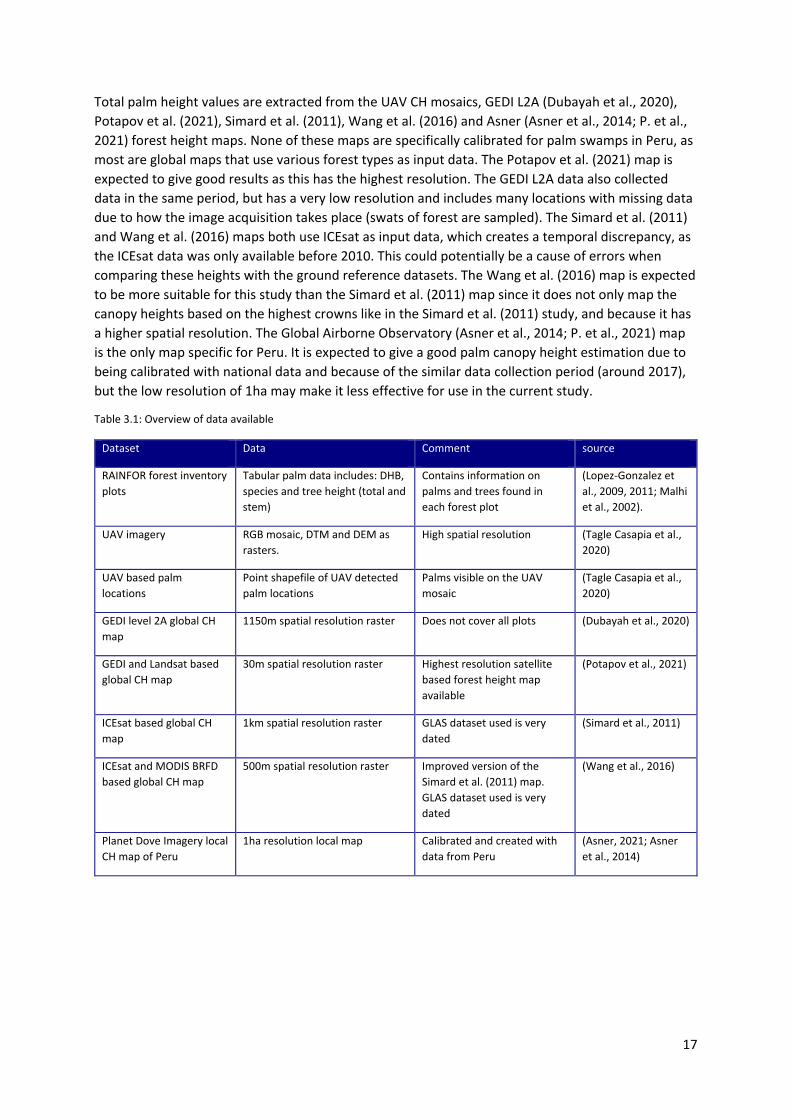
3.3 Data processing and analysis 3.3.1 Data processing workflow In order to estimate the palm biomass of each palm, information from the “palm location” point shapefile, “height map” rasters and the “forestplot.net” spreadsheet datasets are combined into a single point shapefile that contained the information from each dataset (Figure 3.2).
Figure 3.2: Workflow for data processing and analysis
The canopy heights of each forest height raster map had to be added to each palm point by extracting the relevant pixel value based on the coordinates of the palm. The raster height values for each palm were extracted using the “sample raster values” tool from the QGIS processing toolbox and added to the palm shapefile. The UAV derived canopy height is not directly available, so canopy height is calculated by subtracting the available terrain height (DTM) from the total surface height (DSM). This canopy height (CH) model describes the estimated height of the tree tops above the ground in meters. All spatial layers were reprojected to the geocentric and globally consistent WGS84 geographic coordinate system using the QGIS “raster warp – reprojection tool” to standardize the data. The UAV canopy height raster has a resolution of a few centimeters, which is very high resolution. The UAV GPS has an accuracy of about 5m, and downscaling the high resolution raster could result in better palm height estimations. To test if this is the case, the high resolution canopy height map is downsampled by resampling the UAV canopy height raster to 1m resolution using average pixel resampling method, which takes the average of the all the pixels in an area to calculate the new pixel values. The heights extracted from the original UAV and resampled canopy height maps are compared to determine if there is an improvement of individual palm height estimation.
The palm shapefile that included the extracted heights and the tree dimensions was then exported as a csv spreadsheet for further analysis in the R software. Various types of allometric models (described in chapter 3.3.2) are then applied using available height data, and then compared. A statistical analysis is then done to determine how suitable remote sensing is for individual palm and plot level biomass estimation.
19
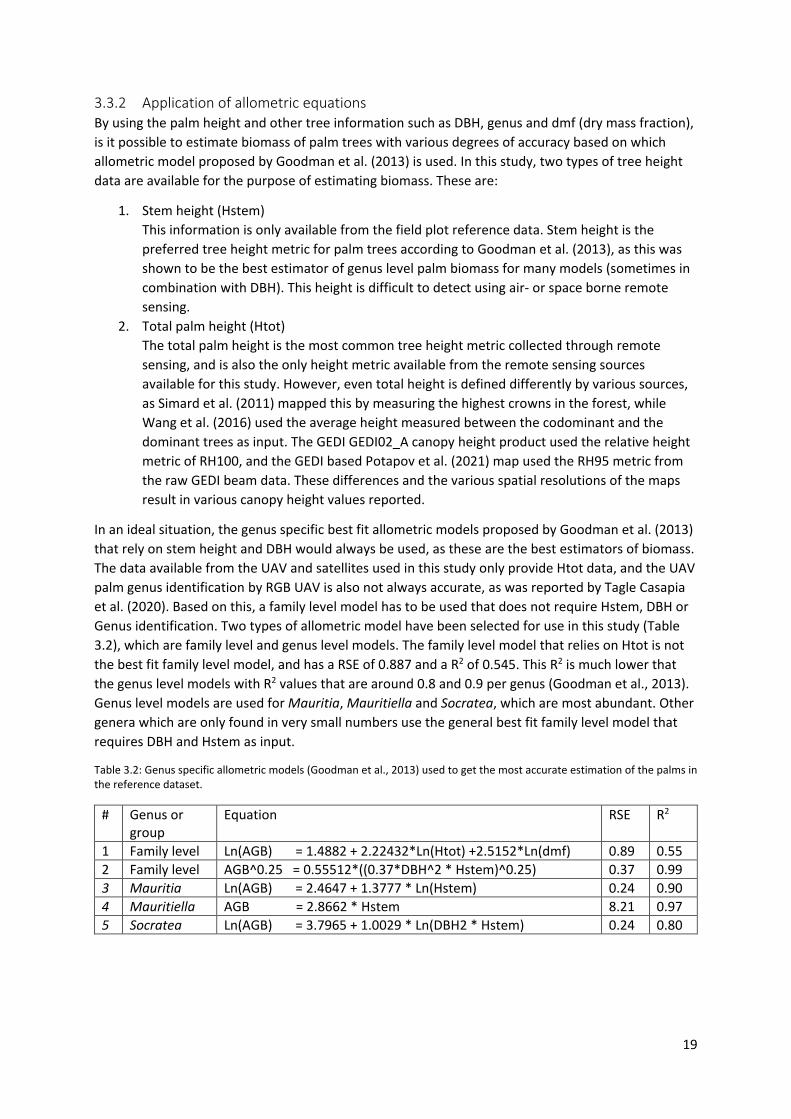
3.3.2 Application of allometric equations By using the palm height and other tree information such as DBH, genus and dmf (dry mass fraction), is it possible to estimate biomass of palm trees with various degrees of accuracy based on which allometric model proposed by Goodman et al. (2013) is used. In this study, two types of tree height data are available for the purpose of estimating biomass. These are:
1. Stem height (Hstem) This information is only available from the field plot reference data. Stem height is the preferred tree height metric for palm trees according to Goodman et al. (2013), as this was shown to be the best estimator of genus level palm biomass for many models (sometimes in combination with DBH). This height is difficult to detect using air- or space borne remote sensing.
2. Total palm height (Htot) The total palm height is the most common tree height metric collected through remote sensing, and is also the only height metric available from the remote sensing sources available for this study. However, even total height is defined differently by various sources, as Simard et al. (2011) mapped this by measuring the highest crowns in the forest, while Wang et al. (2016) used the average height measured between the codominant and the dominant trees as input. The GEDI GEDI02_A canopy height product used the relative height metric of RH100, and the GEDI based Potapov et al. (2021) map used the RH95 metric from the raw GEDI beam data. These differences and the various spatial resolutions of the maps result in various canopy height values reported.
In an ideal situation, the genus specific best fit allometric models proposed by Goodman et al. (2013) that rely on stem height and DBH would always be used, as these are the best estimators of biomass. The data available from the UAV and satellites used in this study only provide Htot data, and the UAV palm genus identification by RGB UAV is also not always accurate, as was reported by Tagle Casapia et al. (2020). Based on this, a family level model has to be used that does not require Hstem, DBH or Genus identification. Two types of allometric model have been selected for use in this study (Table 3.2), which are family level and genus level models. The family level model that relies on Htot is not the best fit family level model, and has a RSE of 0.887 and a R2 of 0.545. This R2 is much lower that the genus level models with R2 values that are around 0.8 and 0.9 per genus (Goodman et al., 2013). Genus level models are used for Mauritia, Mauritiella and Socratea, which are most abundant. Other genera which are only found in very small numbers use the general best fit family level model that requires DBH and Hstem as input.
Table 3.2: Genus specific allometric models (Goodman et al., 2013) used to get the most accurate estimation of the palms in the reference dataset.
# Genus or group
Equation RSE R2
1 Family level Ln(AGB) = 1.4882 + 2.22432*Ln(Htot) +2.5152*Ln(dmf) 0.89 0.55 2 Family level AGB^0.25 = 0.55512*((0.37*DBH^2 * Hstem)^0.25) 0.37 0.99 3 Mauritia Ln(AGB) = 2.4647 + 1.3777 * Ln(Hstem) 0.24 0.90 4 Mauritiella AGB = 2.8662 * Hstem 8.21 0.97 5 Socratea Ln(AGB) = 3.7965 + 1.0029 * Ln(DBH2 * Hstem) 0.24 0.80
20
3.3.3 Data cleaning and analysis Before data analysis was done, several steps were taken to ensure that the data was suitable for analysis. These steps include:
• Ensuring that all the height and tree numbers were valid numerical values. All decimals should be noted using “points” and all text values are removed or corrected.
• Excluding all measurements with missing data, specifically missing height or tree number. • Ensuring that all columns of each plot dataset are standardized, to prevent errors when
combining the datasets. • The values of each raster are checked using a histogram, and all negative values are
corrected and replaced with zero values. This was also done for the calculated UAV derived CH rasters, as negative values can be found where there the DSM and DTM measurements of the ground cover were not accurate. This is often the case in palm swamps, where the ground is seasonally flooded and difficult to accurately map.
The main goal of this study is to determine how accurately the biomass of palms can be measured using remote sensing. For this, it is necessary to report:
• Number of palms detected by UAV. • Accuracy of remote sensing height estimations. • How accurate individual palm biomass can be estimated. • How much of the palm biomass in the total area can be estimated.
Reporting how many of the palms were detected using UAV remote sensing gives an indication of how much of the total palm biomass will be measured. UAV has been proven to be useful for mapping individual palms, but was not able to map all palms according to Tagle Casapia et al. (2020). This is due to several factors such as palm crowns overlapping with other crowns and crowns being too close to each other to distinguish the individual palm crowns with UAV.
The allometric equations by Goodman et al. (2013) are applied, which rely on total or stem height. The remote sensing measured palm heights are compared to the ground reference heights, to determine which source of palm height is most similar to the reference dataset. The Genus level models are used on the ground reference data to get the best reference estimation of the palm biomass. The family level model is then used with the remote sensing derived palm heights to determine the remote sensing derived biomass. The results from the ground measurements and the remote sensing measurement can then be compared and a statistical analysis is done.
Finally, the total palm biomass will be estimated for each plot, using the family level allometric model (Htot) and the reference and remote sensing height data as input. The reference biomass will be determined using all palms from the reference data, while the remote sensing heights will only include palms that were detected by UAV.
21
3.3.4 Software used In this study, open source software are used as much as possible in order to ensure that future researchers will be able to replicate this study without the need for specialized paid software.
Quantum GIS (QGIS) is an open source GIS software and is used for all visualization and processing of spatial datasets, which include the rasters and the shapefiles. Extraction of canopy heights, reprojections, data clipping and the creation of maps were all done using QGIS tools.
Forest plot datasets were available as excel spreadsheets, and were cleaned in Microsoft Excel. All statistical analysis such as determining the RMSE, were done using the open source “R” statistical software. This software was also used for allometric calculations and for creating figures and graphs. Statistical methods used to represent errors in this study are the MAE, R2 and RMSE. These methods are often used in accuracy assessments of maps (Adam et al., 2020; Csillik et al., 2020; Potapov et al., 2019; Simard et al., 2011).
22
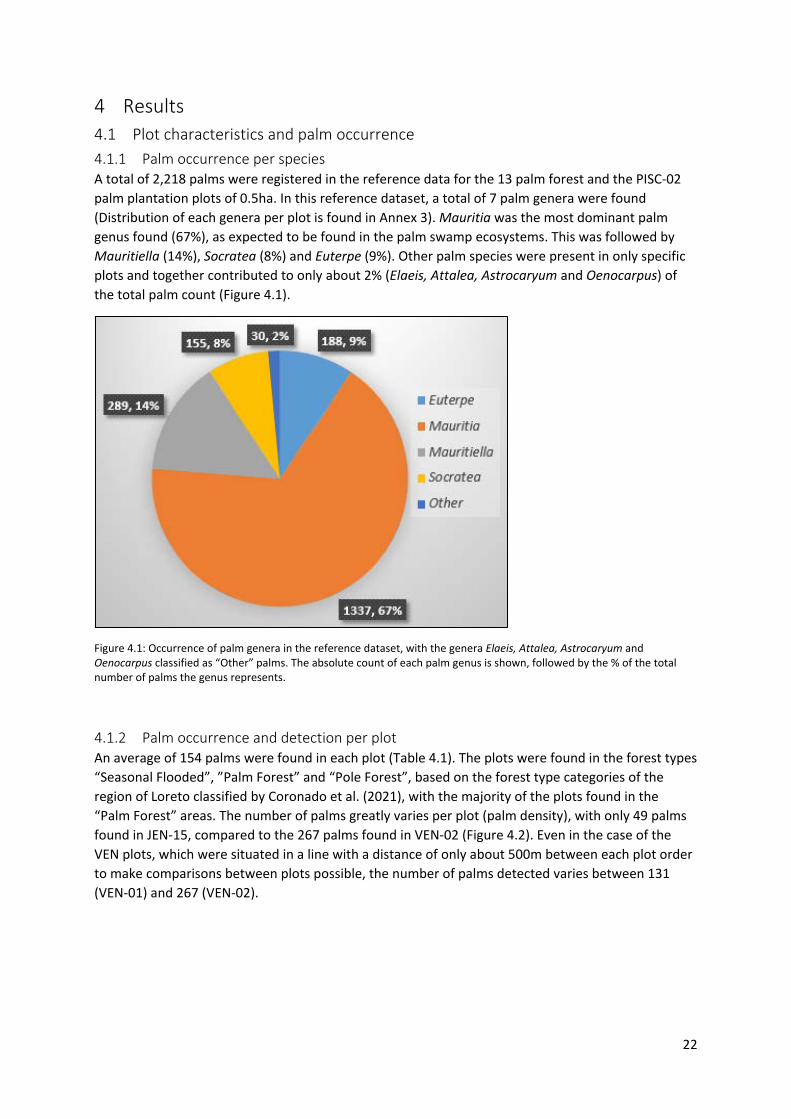
4 Results 4.1 Plot characteristics and palm occurrence 4.1.1 Palm occurrence per species A total of 2,218 palms were registered in the reference data for the 13 palm forest and the PISC-02 palm plantation plots of 0.5ha. In this reference dataset, a total of 7 palm genera were found (Distribution of each genera per plot is found in Annex 3). Mauritia was the most dominant palm genus found (67%), as expected to be found in the palm swamp ecosystems. This was followed by Mauritiella (14%), Socratea (8%) and Euterpe (9%). Other palm species were present in only specific plots and together contributed to only about 2% (Elaeis, Attalea, Astrocaryum and Oenocarpus) of the total palm count (Figure 4.1).
Figure 4.1: Occurrence of palm genera in the reference dataset, with the genera Elaeis, Attalea, Astrocaryum and Oenocarpus classified as “Other” palms. The absolute count of each palm genus is shown, followed by the % of the total number of palms the genus represents.
4.1.2 Palm occurrence and detection per plot An average of 154 palms were found in each plot (Table 4.1). The plots were found in the forest types “Seasonal Flooded”, ”Palm Forest” and “Pole Forest”, based on the forest type categories of the region of Loreto classified by Coronado et al. (2021), with the majority of the plots found in the “Palm Forest” areas. The number of palms greatly varies per plot (palm density), with only 49 palms found in JEN-15, compared to the 267 palms found in VEN-02 (Figure 4.2). Even in the case of the VEN plots, which were situated in a line with a distance of only about 500m between each plot order to make comparisons between plots possible, the number of palms detected varies between 131 (VEN-01) and 267 (VEN-02).
23
Figure 4.2: Number of palms counted per 0.5ha plot in the reference dataset.
Non-palm species are found in large numbers in plots such as ALP-60, JEN-15, SAM-01 and VEN-05 (Table 4.1). In these plots, the number of non-palm species (trees) with a DBH > 10, outnumber the palms present. This is no surprise, as a total of 1,951 non-palm species were found in the 13 plots, which is slightly less than the total number of palms (1,999 counted). The plots with the highest palm stem density per hectare are VEN-02 (534), VEN-04 (442) and QUI-01 (406). However, when looking at the total number of stems per ha based on palms and trees, then plots ALP-60 (926), PIU-02 (806) and QUI-01 (794) have the highest stem densities.
The ability to estimate the individual and the plot level biomass of palms in this study depends on how well the palms can be detected though UAV sfm based photogrammetry. The UAV palm detection rate for the 13 natural plots was 70% on average, with the lowest being 58% (DMM-01), and the highest being 86% (SAM-01). There was no plot where the UAV was able to detect all the palms.
Table 4.1: Abundance and UAV detection rate of palms per plot based on the data from Tagle Casapia et al. (2020)
Plot Forest Type Palm count
Palm & tree count
Palm stem density (count/ha)
Palm & tree stem density (count/ha)
% palms detected by UAV
ALP-60 Seasonal flooded 130 463 260 926 66%
DMM-01 Palm forest 138 138 276 276 58%
JEN-14 Seasonal flooded 128 234 256 468 75%
JEN-15 Pole forest 49 268 98 536 73% PIU-02 Palm forest 76 403 152 806 79% PRN-01 Palm forest 199 309 398 618 67% QUI-01 Palm forest 203 397 406 794 59% SAM-01 Palm forest 123 251 246 502 86% VEN-01 Pole forest 131 252 262 504 58% VEN-02 Palm forest 267 325 534 650 58% VEN-03 Palm forest 196 254 392 508 76% VEN-04 Palm forest 221 270 442 540 77% VEN-05 Palm forest 138 386 276 772 76% Total 1,999 3,950 3,998 Average 154 304 308 608 70%
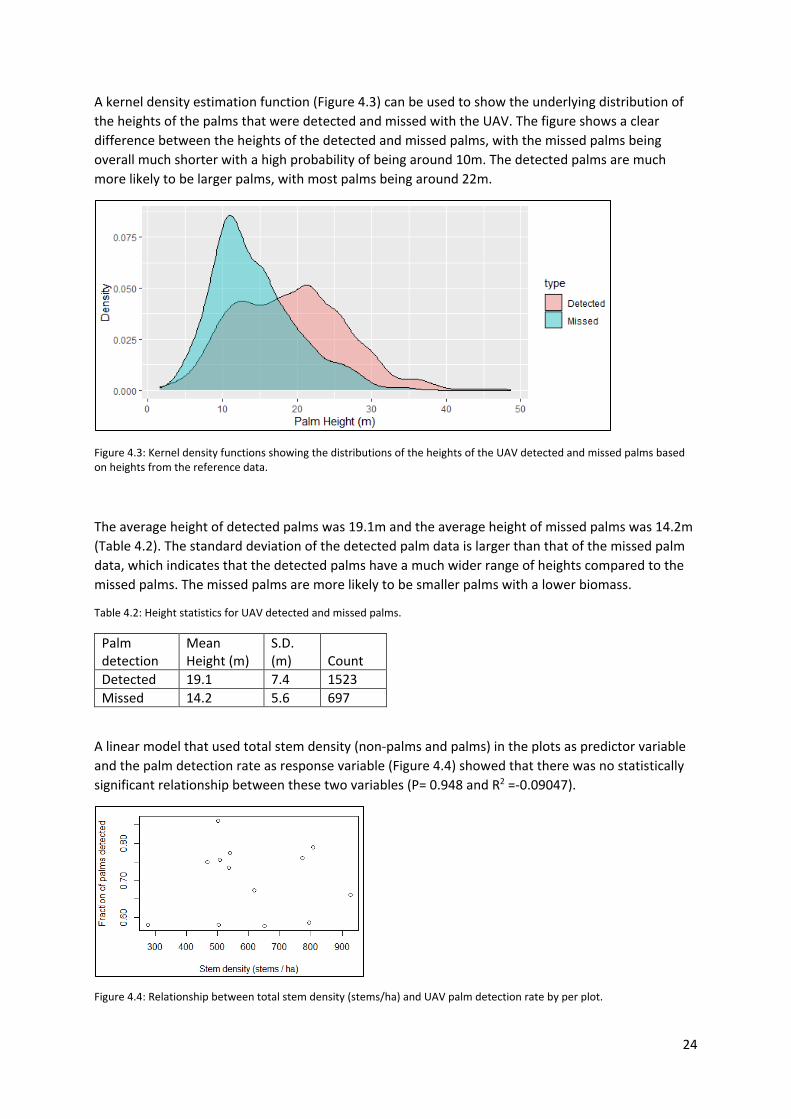
24
A kernel density estimation function (Figure 4.3) can be used to show the underlying distribution of the heights of the palms that were detected and missed with the UAV. The figure shows a clear difference between the heights of the detected and missed palms, with the missed palms being overall much shorter with a high probability of being around 10m. The detected palms are much more likely to be larger palms, with most palms being around 22m.
Figure 4.3: Kernel density functions showing the distributions of the heights of the UAV detected and missed palms based on heights from the reference data.
The average height of detected palms was 19.1m and the average height of missed palms was 14.2m (Table 4.2). The standard deviation of the detected palm data is larger than that of the missed palm data, which indicates that the detected palms have a much wider range of heights compared to the missed palms. The missed palms are more likely to be smaller palms with a lower biomass.
Table 4.2: Height statistics for UAV detected and missed palms.
Palm detection
Mean Height (m)
S.D. (m) Count
Detected 19.1 7.4 1523 Missed 14.2 5.6 697
A linear model that used total stem density (non-palms and palms) in the plots as predictor variable and the palm detection rate as response variable (Figure 4.4) showed that there was no statistically significant relationship between these two variables (P= 0.948 and R2 =-0.09047).
Figure 4.4: Relationship between total stem density (stems/ha) and UAV palm detection rate by per plot.
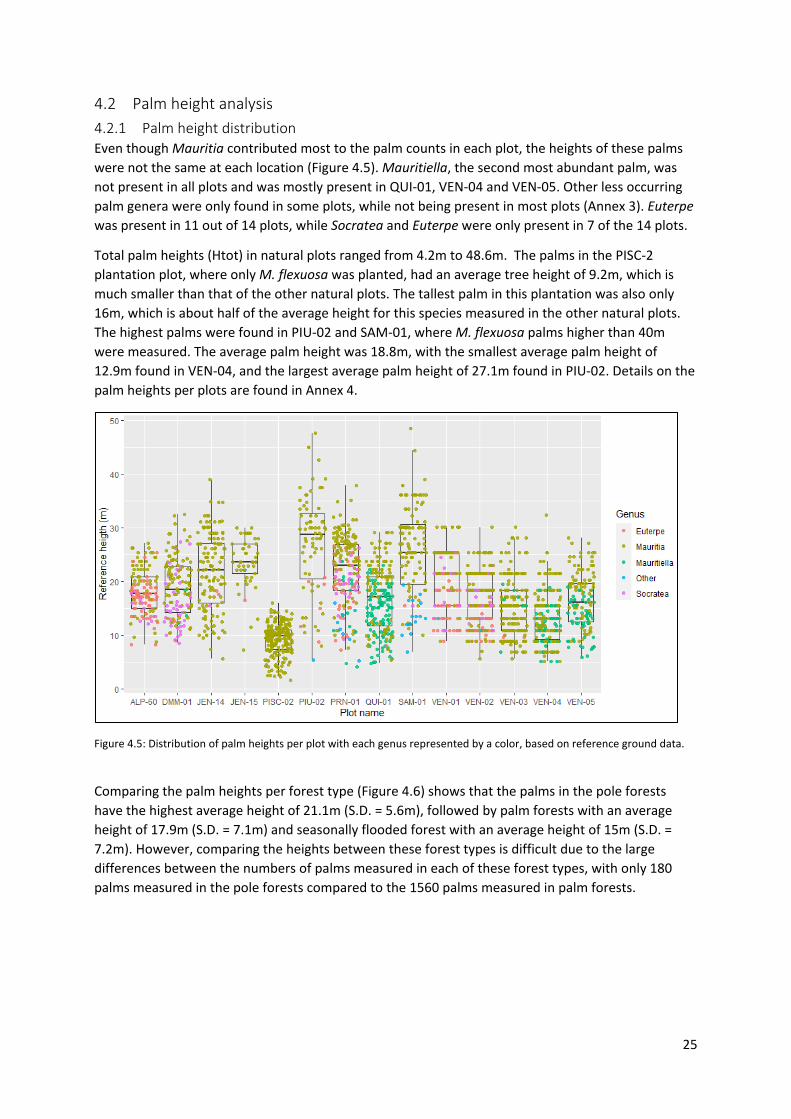
25
4.2 Palm height analysis 4.2.1 Palm height distribution Even though Mauritia contributed most to the palm counts in each plot, the heights of these palms were not the same at each location (Figure 4.5). Mauritiella, the second most abundant palm, was not present in all plots and was mostly present in QUI-01, VEN-04 and VEN-05. Other less occurring palm genera were only found in some plots, while not being present in most plots (Annex 3). Euterpe was present in 11 out of 14 plots, while Socratea and Euterpe were only present in 7 of the 14 plots.
Total palm heights (Htot) in natural plots ranged from 4.2m to 48.6m. The palms in the PISC-2 plantation plot, where only M. flexuosa was planted, had an average tree height of 9.2m, which is much smaller than that of the other natural plots. The tallest palm in this plantation was also only 16m, which is about half of the average height for this species measured in the other natural plots. The highest palms were found in PIU-02 and SAM-01, where M. flexuosa palms higher than 40m were measured. The average palm height was 18.8m, with the smallest average palm height of 12.9m found in VEN-04, and the largest average palm height of 27.1m found in PIU-02. Details on the palm heights per plots are found in Annex 4.
Figure 4.5: Distribution of palm heights per plot with each genus represented by a color, based on reference ground data.
Comparing the palm heights per forest type (Figure 4.6) shows that the palms in the pole forests have the highest average height of 21.1m (S.D. = 5.6m), followed by palm forests with an average height of 17.9m (S.D. = 7.1m) and seasonally flooded forest with an average height of 15m (S.D. = 7.2m). However, comparing the heights between these forest types is difficult due to the large differences between the numbers of palms measured in each of these forest types, with only 180 palms measured in the pole forests compared to the 1560 palms measured in palm forests.
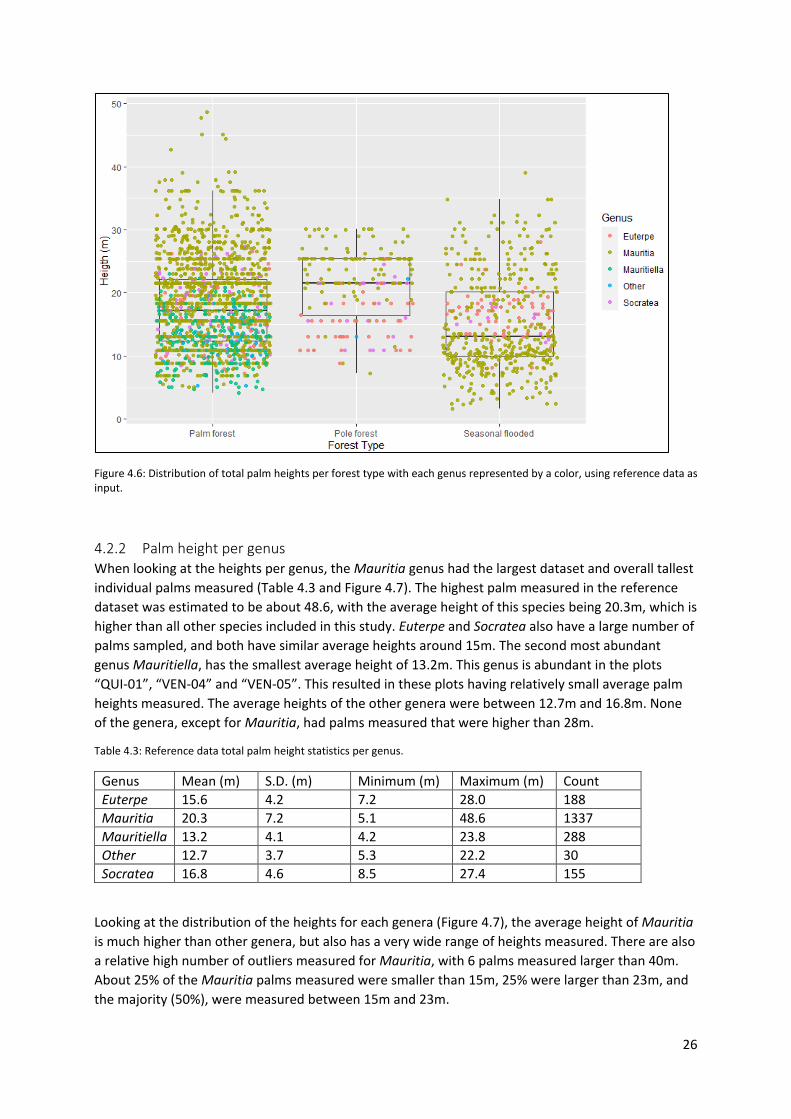
26
Figure 4.6: Distribution of total palm heights per forest type with each genus represented by a color, using reference data as input.
4.2.2 Palm height per genus When looking at the heights per genus, the Mauritia genus had the largest dataset and overall tallest individual palms measured (Table 4.3 and Figure 4.7). The highest palm measured in the reference dataset was estimated to be about 48.6, with the average height of this species being 20.3m, which is higher than all other species included in this study. Euterpe and Socratea also have a large number of palms sampled, and both have similar average heights around 15m. The second most abundant genus Mauritiella, has the smallest average height of 13.2m. This genus is abundant in the plots “QUI-01”, “VEN-04” and “VEN-05”. This resulted in these plots having relatively small average palm heights measured. The average heights of the other genera were between 12.7m and 16.8m. None of the genera, except for Mauritia, had palms measured that were higher than 28m.
Table 4.3: Reference data total palm height statistics per genus.
Genus Mean (m) S.D. (m) Minimum (m) Maximum (m) Count Euterpe 15.6 4.2 7.2 28.0 188 Mauritia 20.3 7.2 5.1 48.6 1337 Mauritiella 13.2 4.1 4.2 23.8 288 Other 12.7 3.7 5.3 22.2 30 Socratea 16.8 4.6 8.5 27.4 155
Looking at the distribution of the heights for each genera (Figure 4.7), the average height of Mauritia is much higher than other genera, but also has a very wide range of heights measured. There are also a relative high number of outliers measured for Mauritia, with 6 palms measured larger than 40m. About 25% of the Mauritia palms measured were smaller than 15m, 25% were larger than 23m, and the majority (50%), were measured between 15m and 23m.
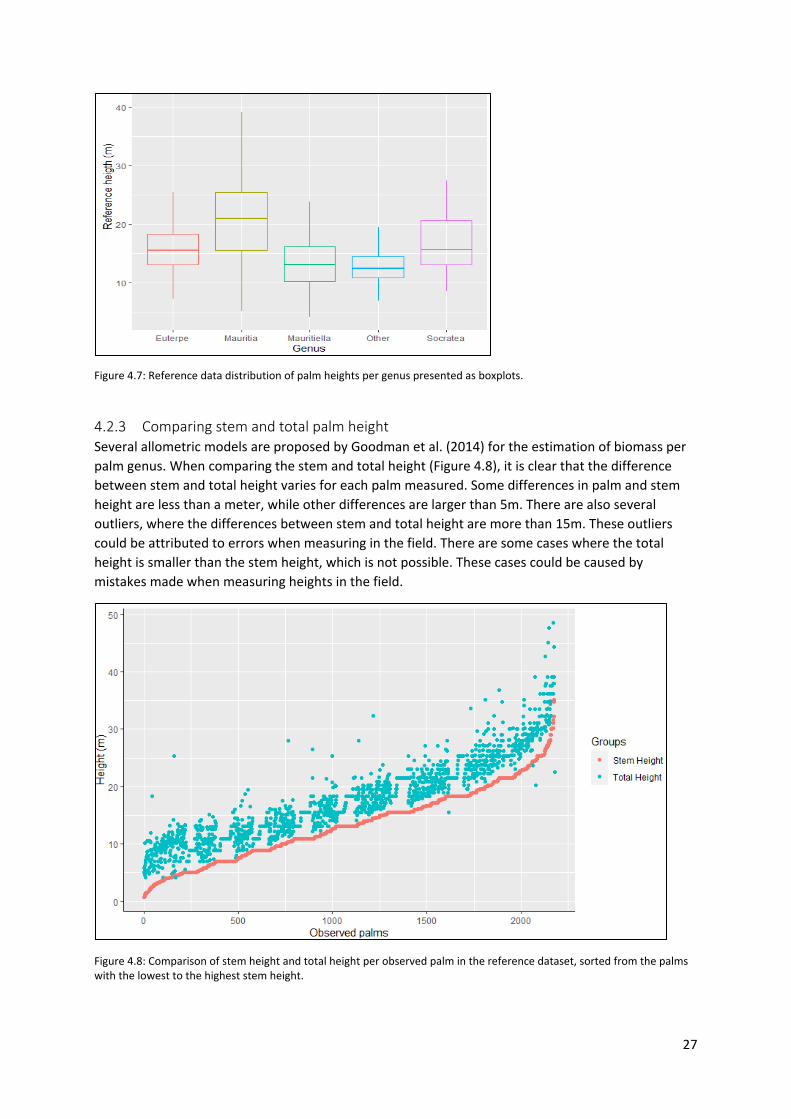
27
Figure 4.7: Reference data distribution of palm heights per genus presented as boxplots.
4.2.3 Comparing stem and total palm height Several allometric models are proposed by Goodman et al. (2014) for the estimation of biomass per palm genus. When comparing the stem and total height (Figure 4.8), it is clear that the difference between stem and total height varies for each palm measured. Some differences in palm and stem height are less than a meter, while other differences are larger than 5m. There are also several outliers, where the differences between stem and total height are more than 15m. These outliers could be attributed to errors when measuring in the field. There are some cases where the total height is smaller than the stem height, which is not possible. These cases could be caused by mistakes made when measuring heights in the field.
Figure 4.8: Comparison of stem height and total height per observed palm in the reference dataset, sorted from the palms with the lowest to the highest stem height.
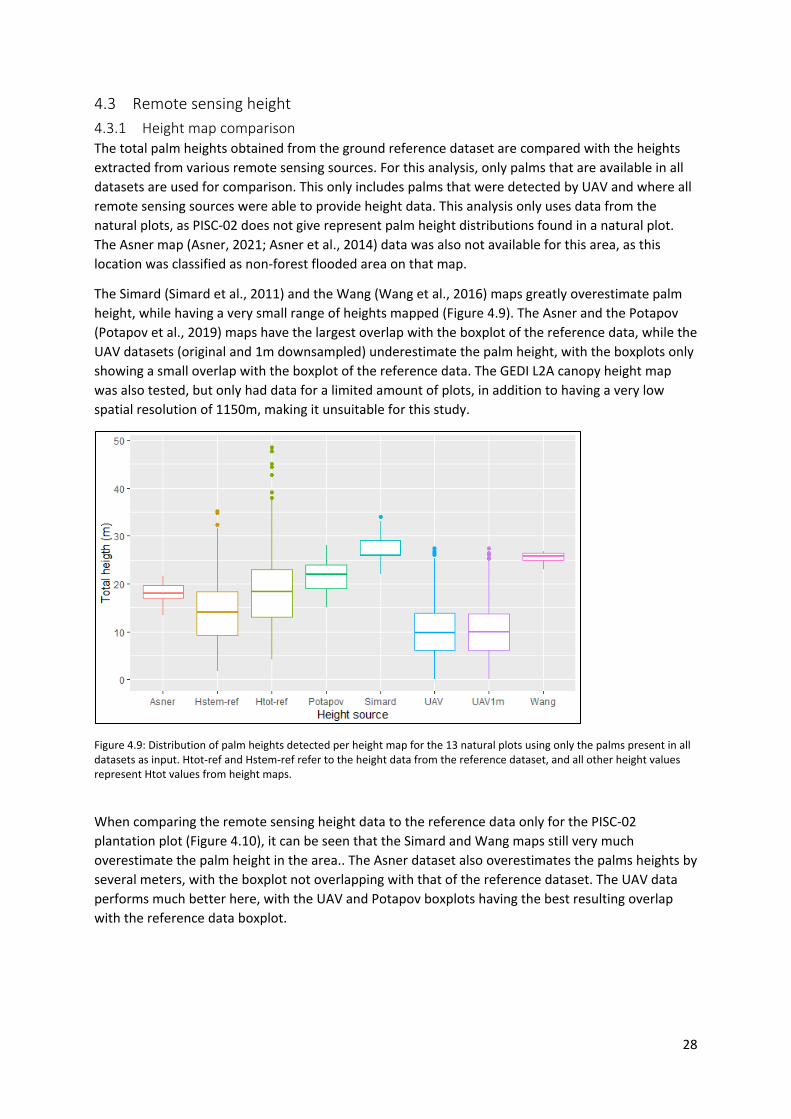
28
4.3 Remote sensing height 4.3.1 Height map comparison The total palm heights obtained from the ground reference dataset are compared with the heights extracted from various remote sensing sources. For this analysis, only palms that are available in all datasets are used for comparison. This only includes palms that were detected by UAV and where all remote sensing sources were able to provide height data. This analysis only uses data from the natural plots, as PISC-02 does not give represent palm height distributions found in a natural plot. The Asner map (Asner, 2021; Asner et al., 2014) data was also not available for this area, as this location was classified as non-forest flooded area on that map.
The Simard (Simard et al., 2011) and the Wang (Wang et al., 2016) maps greatly overestimate palm height, while having a very small range of heights mapped (Figure 4.9). The Asner and the Potapov (Potapov et al., 2019) maps have the largest overlap with the boxplot of the reference data, while the UAV datasets (original and 1m downsampled) underestimate the palm height, with the boxplots only showing a small overlap with the boxplot of the reference data. The GEDI L2A canopy height map was also tested, but only had data for a limited amount of plots, in addition to having a very low spatial resolution of 1150m, making it unsuitable for this study.
Figure 4.9: Distribution of palm heights detected per height map for the 13 natural plots using only the palms present in all datasets as input. Htot-ref and Hstem-ref refer to the height data from the reference dataset, and all other height values represent Htot values from height maps.
When comparing the remote sensing height data to the reference data only for the PISC-02 plantation plot (Figure 4.10), it can be seen that the Simard and Wang maps still very much overestimate the palm height in the area.. The Asner dataset also overestimates the palms heights by several meters, with the boxplot not overlapping with that of the reference dataset. The UAV data performs much better here, with the UAV and Potapov boxplots having the best resulting overlap with the reference data boxplot.
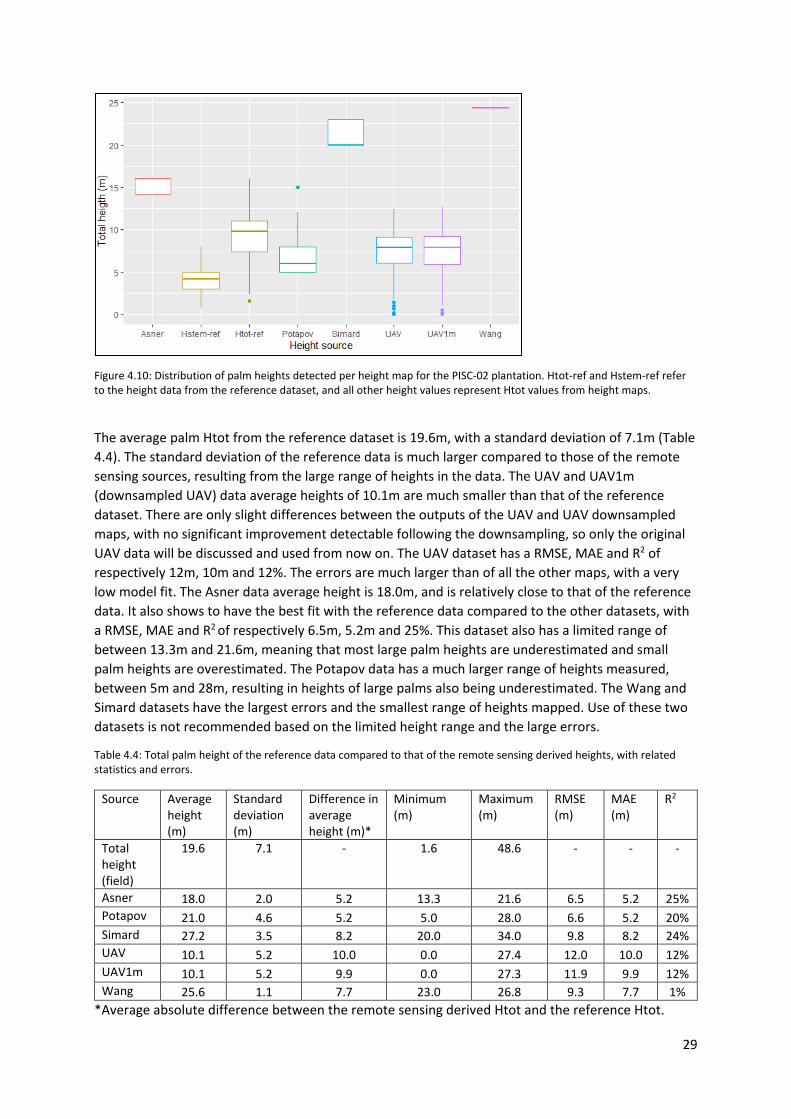
29
Figure 4.10: Distribution of palm heights detected per height map for the PISC-02 plantation. Htot-ref and Hstem-ref refer to the height data from the reference dataset, and all other height values represent Htot values from height maps.
The average palm Htot from the reference dataset is 19.6m, with a standard deviation of 7.1m (Table 4.4). The standard deviation of the reference data is much larger compared to those of the remote sensing sources, resulting from the large range of heights in the data. The UAV and UAV1m (downsampled UAV) data average heights of 10.1m are much smaller than that of the reference dataset. There are only slight differences between the outputs of the UAV and UAV downsampled maps, with no significant improvement detectable following the downsampling, so only the original UAV data will be discussed and used from now on. The UAV dataset has a RMSE, MAE and R2 of respectively 12m, 10m and 12%. The errors are much larger than of all the other maps, with a very low model fit. The Asner data average height is 18.0m, and is relatively close to that of the reference data. It also shows to have the best fit with the reference data compared to the other datasets, with a RMSE, MAE and R2 of respectively 6.5m, 5.2m and 25%. This dataset also has a limited range of between 13.3m and 21.6m, meaning that most large palm heights are underestimated and small palm heights are overestimated. The Potapov data has a much larger range of heights measured, between 5m and 28m, resulting in heights of large palms also being underestimated. The Wang and Simard datasets have the largest errors and the smallest range of heights mapped. Use of these two datasets is not recommended based on the limited height range and the large errors.
Table 4.4: Total palm height of the reference data compared to that of the remote sensing derived heights, with related statistics and errors.
Source Average height (m)
Standard deviation (m)
Difference in average height (m)*
Minimum (m)
Maximum (m)
RMSE (m)
MAE (m)
R2
Total height (field)
19.6 7.1 - 1.6 48.6 - - -
Asner 18.0 2.0 5.2 13.3 21.6 6.5 5.2 25% Potapov 21.0 4.6 5.2 5.0 28.0 6.6 5.2 20% Simard 27.2 3.5 8.2 20.0 34.0 9.8 8.2 24% UAV 10.1 5.2 10.0 0.0 27.4 12.0 10.0 12% UAV1m 10.1 5.2 9.9 0.0 27.3 11.9 9.9 12% Wang 25.6 1.1 7.7 23.0 26.8 9.3 7.7 1%
*Average absolute difference between the remote sensing derived Htot and the reference Htot.
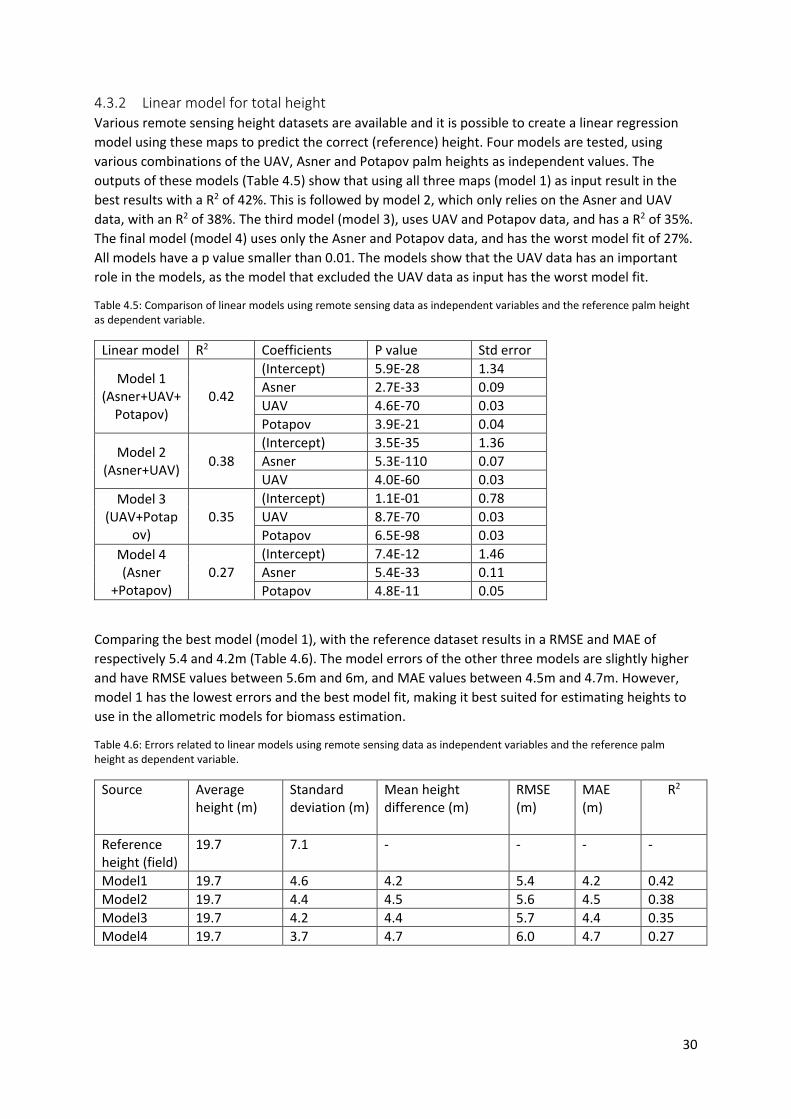
30
4.3.2 Linear model for total height Various remote sensing height datasets are available and it is possible to create a linear regression model using these maps to predict the correct (reference) height. Four models are tested, using various combinations of the UAV, Asner and Potapov palm heights as independent values. The outputs of these models (Table 4.5) show that using all three maps (model 1) as input result in the best results with a R2 of 42%. This is followed by model 2, which only relies on the Asner and UAV data, with an R2 of 38%. The third model (model 3), uses UAV and Potapov data, and has a R2 of 35%. The final model (model 4) uses only the Asner and Potapov data, and has the worst model fit of 27%. All models have a p value smaller than 0.01. The models show that the UAV data has an important role in the models, as the model that excluded the UAV data as input has the worst model fit.
Table 4.5: Comparison of linear models using remote sensing data as independent variables and the reference palm height as dependent variable.
Linear model R2 Coefficients P value Std error
Model 1 (Asner+UAV+
Potapov) 0.42
(Intercept) 5.9E-28 1.34 Asner 2.7E-33 0.09 UAV 4.6E-70 0.03 Potapov 3.9E-21 0.04
Model 2 (Asner+UAV) 0.38
(Intercept) 3.5E-35 1.36 Asner 5.3E-110 0.07 UAV 4.0E-60 0.03
Model 3 (UAV+Potap
ov) 0.35
(Intercept) 1.1E-01 0.78 UAV 8.7E-70 0.03 Potapov 6.5E-98 0.03
Model 4 (Asner
+Potapov) 0.27
(Intercept) 7.4E-12 1.46 Asner 5.4E-33 0.11 Potapov 4.8E-11 0.05
Comparing the best model (model 1), with the reference dataset results in a RMSE and MAE of respectively 5.4 and 4.2m (Table 4.6). The model errors of the other three models are slightly higher and have RMSE values between 5.6m and 6m, and MAE values between 4.5m and 4.7m. However, model 1 has the lowest errors and the best model fit, making it best suited for estimating heights to use in the allometric models for biomass estimation.
Table 4.6: Errors related to linear models using remote sensing data as independent variables and the reference palm height as dependent variable.
Source Average height (m)
Standard deviation (m)
Mean height difference (m)
RMSE (m)
MAE (m)
R2
Reference height (field)
19.7 7.1 - - - -
Model1 19.7 4.6 4.2 5.4 4.2 0.42 Model2 19.7 4.4 4.5 5.6 4.5 0.38 Model3 19.7 4.2 4.4 5.7 4.4 0.35 Model4 19.7 3.7 4.7 6.0 4.7 0.27
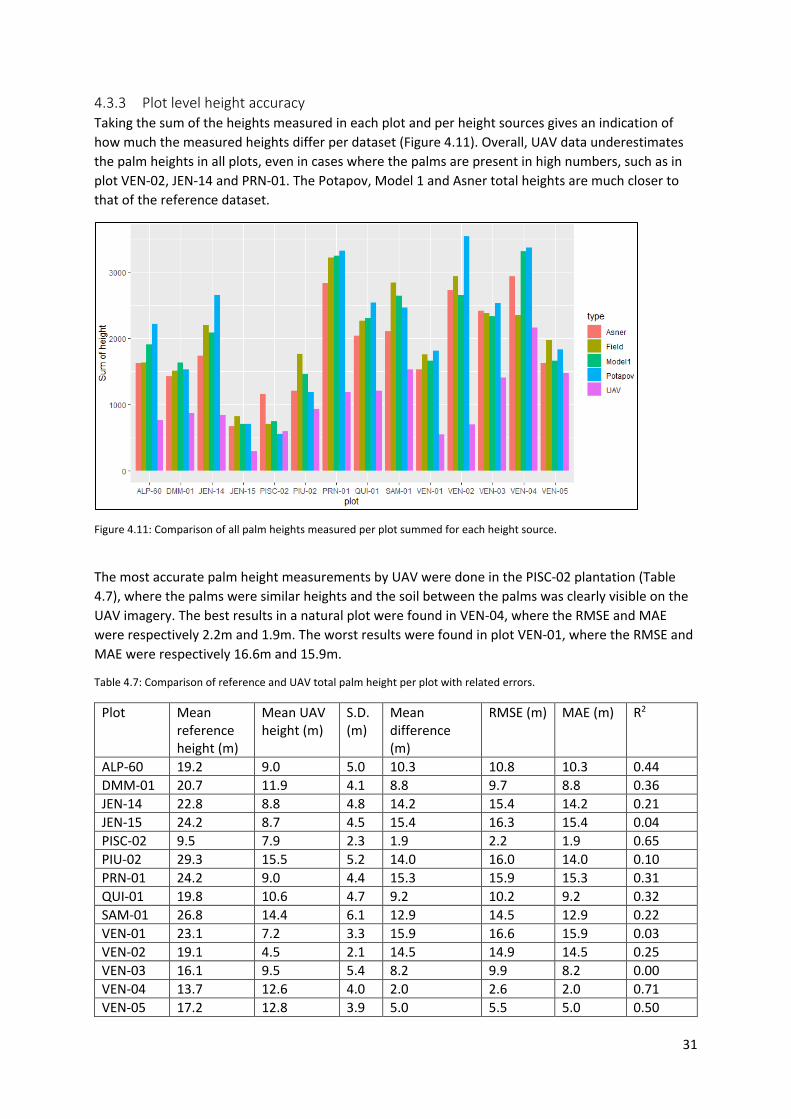
31
4.3.3 Plot level height accuracy Taking the sum of the heights measured in each plot and per height sources gives an indication of how much the measured heights differ per dataset (Figure 4.11). Overall, UAV data underestimates the palm heights in all plots, even in cases where the palms are present in high numbers, such as in plot VEN-02, JEN-14 and PRN-01. The Potapov, Model 1 and Asner total heights are much closer to that of the reference dataset.
Figure 4.11: Comparison of all palm heights measured per plot summed for each height source.
The most accurate palm height measurements by UAV were done in the PISC-02 plantation (Table 4.7), where the palms were similar heights and the soil between the palms was clearly visible on the UAV imagery. The best results in a natural plot were found in VEN-04, where the RMSE and MAE were respectively 2.2m and 1.9m. The worst results were found in plot VEN-01, where the RMSE and MAE were respectively 16.6m and 15.9m.
Table 4.7: Comparison of reference and UAV total palm height per plot with related errors.
Plot Mean reference height (m)
Mean UAV height (m)
S.D. (m)
Mean difference (m)
RMSE (m) MAE (m) R2
ALP-60 19.2 9.0 5.0 10.3 10.8 10.3 0.44 DMM-01 20.7 11.9 4.1 8.8 9.7 8.8 0.36 JEN-14 22.8 8.8 4.8 14.2 15.4 14.2 0.21 JEN-15 24.2 8.7 4.5 15.4 16.3 15.4 0.04 PISC-02 9.5 7.9 2.3 1.9 2.2 1.9 0.65 PIU-02 29.3 15.5 5.2 14.0 16.0 14.0 0.10 PRN-01 24.2 9.0 4.4 15.3 15.9 15.3 0.31 QUI-01 19.8 10.6 4.7 9.2 10.2 9.2 0.32 SAM-01 26.8 14.4 6.1 12.9 14.5 12.9 0.22 VEN-01 23.1 7.2 3.3 15.9 16.6 15.9 0.03 VEN-02 19.1 4.5 2.1 14.5 14.9 14.5 0.25 VEN-03 16.1 9.5 5.4 8.2 9.9 8.2 0.00 VEN-04 13.7 12.6 4.0 2.0 2.6 2.0 0.71 VEN-05 17.2 12.8 3.9 5.0 5.5 5.0 0.50
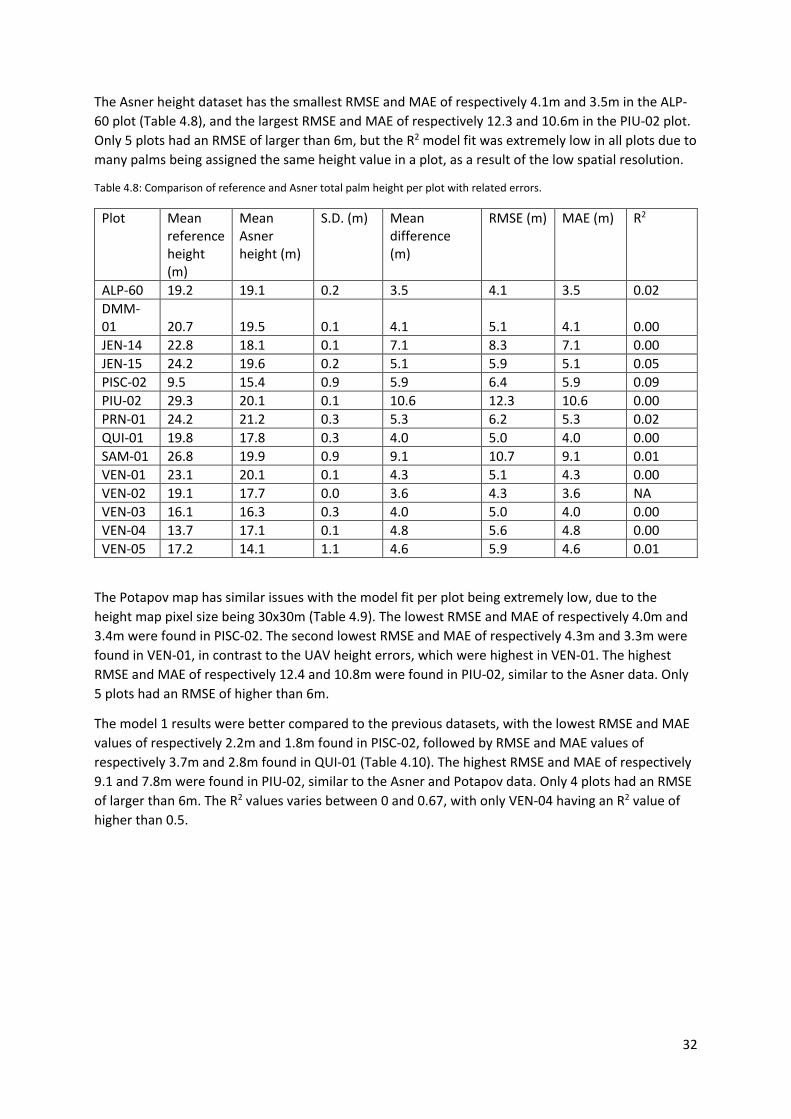
32
The Asner height dataset has the smallest RMSE and MAE of respectively 4.1m and 3.5m in the ALP-60 plot (Table 4.8), and the largest RMSE and MAE of respectively 12.3 and 10.6m in the PIU-02 plot. Only 5 plots had an RMSE of larger than 6m, but the R2 model fit was extremely low in all plots due to many palms being assigned the same height value in a plot, as a result of the low spatial resolution.
Table 4.8: Comparison of reference and Asner total palm height per plot with related errors.
Plot Mean reference height (m)
Mean Asner height (m)
S.D. (m) Mean difference (m)
RMSE (m) MAE (m) R2
ALP-60 19.2 19.1 0.2 3.5 4.1 3.5 0.02 DMM-01 20.7 19.5 0.1 4.1 5.1 4.1 0.00 JEN-14 22.8 18.1 0.1 7.1 8.3 7.1 0.00 JEN-15 24.2 19.6 0.2 5.1 5.9 5.1 0.05 PISC-02 9.5 15.4 0.9 5.9 6.4 5.9 0.09 PIU-02 29.3 20.1 0.1 10.6 12.3 10.6 0.00 PRN-01 24.2 21.2 0.3 5.3 6.2 5.3 0.02 QUI-01 19.8 17.8 0.3 4.0 5.0 4.0 0.00 SAM-01 26.8 19.9 0.9 9.1 10.7 9.1 0.01 VEN-01 23.1 20.1 0.1 4.3 5.1 4.3 0.00 VEN-02 19.1 17.7 0.0 3.6 4.3 3.6 NA VEN-03 16.1 16.3 0.3 4.0 5.0 4.0 0.00 VEN-04 13.7 17.1 0.1 4.8 5.6 4.8 0.00 VEN-05 17.2 14.1 1.1 4.6 5.9 4.6 0.01
The Potapov map has similar issues with the model fit per plot being extremely low, due to the height map pixel size being 30x30m (Table 4.9). The lowest RMSE and MAE of respectively 4.0m and 3.4m were found in PISC-02. The second lowest RMSE and MAE of respectively 4.3m and 3.3m were found in VEN-01, in contrast to the UAV height errors, which were highest in VEN-01. The highest RMSE and MAE of respectively 12.4 and 10.8m were found in PIU-02, similar to the Asner data. Only 5 plots had an RMSE of higher than 6m.
The model 1 results were better compared to the previous datasets, with the lowest RMSE and MAE values of respectively 2.2m and 1.8m found in PISC-02, followed by RMSE and MAE values of respectively 3.7m and 2.8m found in QUI-01 (Table 4.10). The highest RMSE and MAE of respectively 9.1 and 7.8m were found in PIU-02, similar to the Asner and Potapov data. Only 4 plots had an RMSE of larger than 6m. The R2 values varies between 0 and 0.67, with only VEN-04 having an R2 value of higher than 0.5.
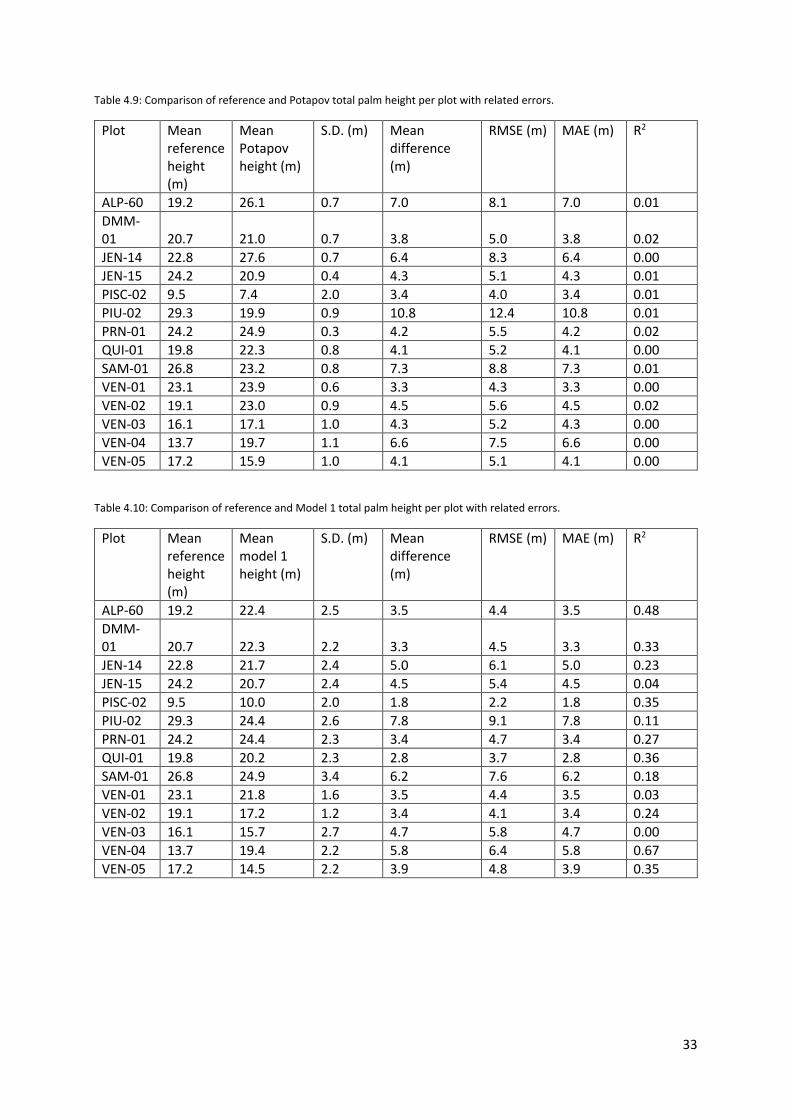
33
Table 4.9: Comparison of reference and Potapov total palm height per plot with related errors.
Plot Mean reference height (m)
Mean Potapov height (m)
S.D. (m) Mean difference (m)
RMSE (m) MAE (m) R2
ALP-60 19.2 26.1 0.7 7.0 8.1 7.0 0.01 DMM-01 20.7 21.0 0.7 3.8 5.0 3.8 0.02 JEN-14 22.8 27.6 0.7 6.4 8.3 6.4 0.00 JEN-15 24.2 20.9 0.4 4.3 5.1 4.3 0.01 PISC-02 9.5 7.4 2.0 3.4 4.0 3.4 0.01 PIU-02 29.3 19.9 0.9 10.8 12.4 10.8 0.01 PRN-01 24.2 24.9 0.3 4.2 5.5 4.2 0.02 QUI-01 19.8 22.3 0.8 4.1 5.2 4.1 0.00 SAM-01 26.8 23.2 0.8 7.3 8.8 7.3 0.01 VEN-01 23.1 23.9 0.6 3.3 4.3 3.3 0.00 VEN-02 19.1 23.0 0.9 4.5 5.6 4.5 0.02 VEN-03 16.1 17.1 1.0 4.3 5.2 4.3 0.00 VEN-04 13.7 19.7 1.1 6.6 7.5 6.6 0.00 VEN-05 17.2 15.9 1.0 4.1 5.1 4.1 0.00
Table 4.10: Comparison of reference and Model 1 total palm height per plot with related errors.
Plot Mean reference height (m)
Mean model 1 height (m)
S.D. (m) Mean difference (m)
RMSE (m) MAE (m) R2
ALP-60 19.2 22.4 2.5 3.5 4.4 3.5 0.48 DMM-01 20.7 22.3 2.2 3.3 4.5 3.3 0.33 JEN-14 22.8 21.7 2.4 5.0 6.1 5.0 0.23 JEN-15 24.2 20.7 2.4 4.5 5.4 4.5 0.04 PISC-02 9.5 10.0 2.0 1.8 2.2 1.8 0.35 PIU-02 29.3 24.4 2.6 7.8 9.1 7.8 0.11 PRN-01 24.2 24.4 2.3 3.4 4.7 3.4 0.27 QUI-01 19.8 20.2 2.3 2.8 3.7 2.8 0.36 SAM-01 26.8 24.9 3.4 6.2 7.6 6.2 0.18 VEN-01 23.1 21.8 1.6 3.5 4.4 3.5 0.03 VEN-02 19.1 17.2 1.2 3.4 4.1 3.4 0.24 VEN-03 16.1 15.7 2.7 4.7 5.8 4.7 0.00 VEN-04 13.7 19.4 2.2 5.8 6.4 5.8 0.67 VEN-05 17.2 14.5 2.2 3.9 4.8 3.9 0.35
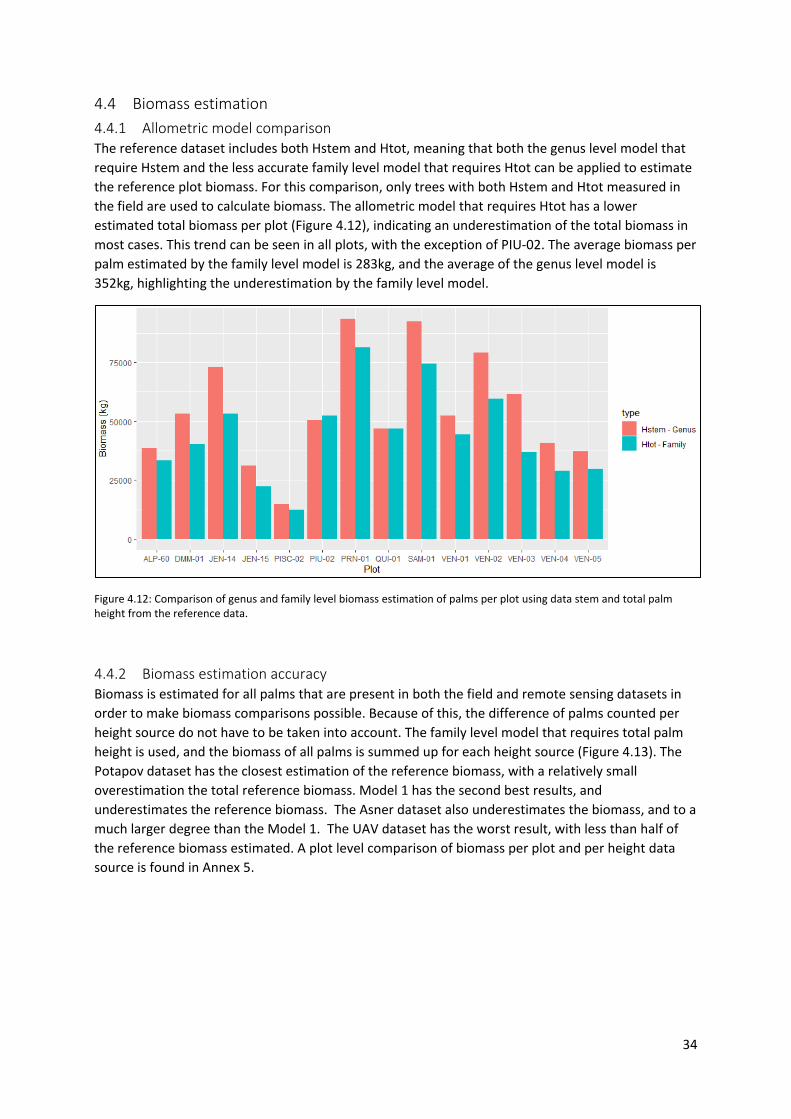
34
4.4 Biomass estimation 4.4.1 Allometric model comparison The reference dataset includes both Hstem and Htot, meaning that both the genus level model that require Hstem and the less accurate family level model that requires Htot can be applied to estimate the reference plot biomass. For this comparison, only trees with both Hstem and Htot measured in the field are used to calculate biomass. The allometric model that requires Htot has a lower estimated total biomass per plot (Figure 4.12), indicating an underestimation of the total biomass in most cases. This trend can be seen in all plots, with the exception of PIU-02. The average biomass per palm estimated by the family level model is 283kg, and the average of the genus level model is 352kg, highlighting the underestimation by the family level model.
Figure 4.12: Comparison of genus and family level biomass estimation of palms per plot using data stem and total palm height from the reference data.
4.4.2 Biomass estimation accuracy Biomass is estimated for all palms that are present in both the field and remote sensing datasets in order to make biomass comparisons possible. Because of this, the difference of palms counted per height source do not have to be taken into account. The family level model that requires total palm height is used, and the biomass of all palms is summed up for each height source (Figure 4.13). The Potapov dataset has the closest estimation of the reference biomass, with a relatively small overestimation the total reference biomass. Model 1 has the second best results, and underestimates the reference biomass. The Asner dataset also underestimates the biomass, and to a much larger degree than the Model 1. The UAV dataset has the worst result, with less than half of the reference biomass estimated. A plot level comparison of biomass per plot and per height data source is found in Annex 5.
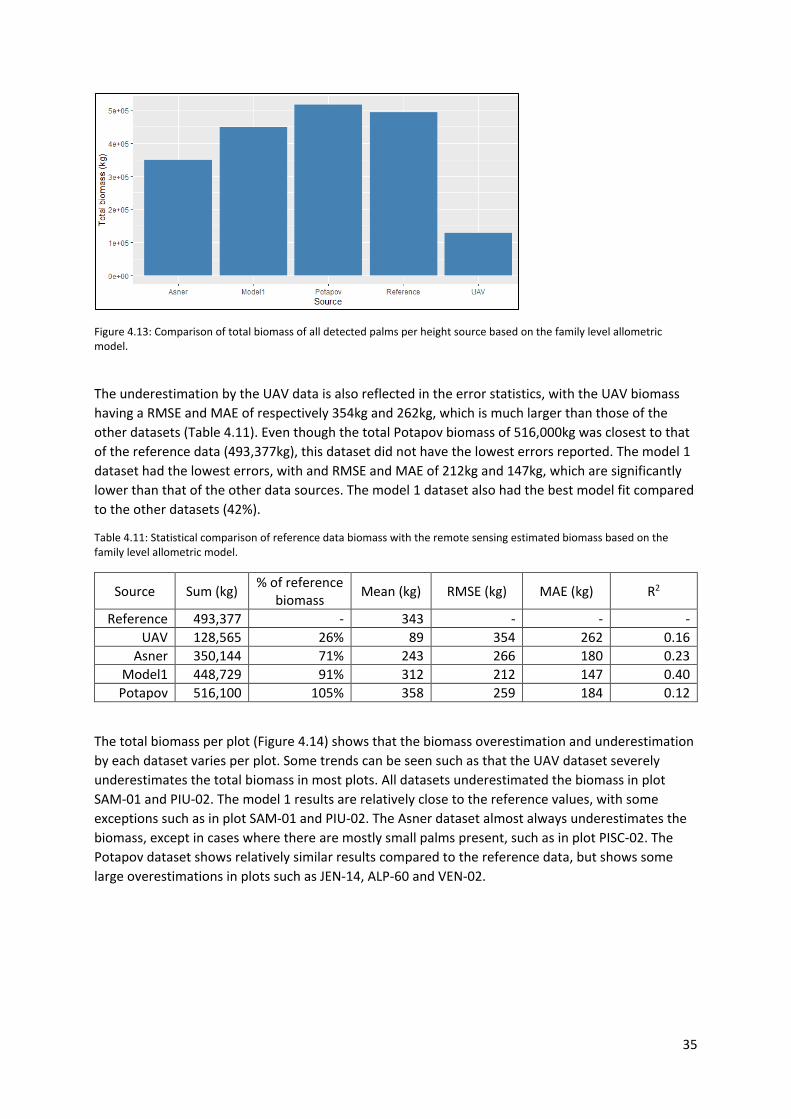
35
Figure 4.13: Comparison of total biomass of all detected palms per height source based on the family level allometric model.
The underestimation by the UAV data is also reflected in the error statistics, with the UAV biomass having a RMSE and MAE of respectively 354kg and 262kg, which is much larger than those of the other datasets (Table 4.11). Even though the total Potapov biomass of 516,000kg was closest to that of the reference data (493,377kg), this dataset did not have the lowest errors reported. The model 1 dataset had the lowest errors, with and RMSE and MAE of 212kg and 147kg, which are significantly lower than that of the other data sources. The model 1 dataset also had the best model fit compared to the other datasets (42%).
Table 4.11: Statistical comparison of reference data biomass with the remote sensing estimated biomass based on the family level allometric model.
Source Sum (kg) % of reference biomass Mean (kg) RMSE (kg) MAE (kg) R2
Reference 493,377 - 343 - - - UAV 128,565 26% 89 354 262 0.16
Asner 350,144 71% 243 266 180 0.23 Model1 448,729 91% 312 212 147 0.40 Potapov 516,100 105% 358 259 184 0.12
The total biomass per plot (Figure 4.14) shows that the biomass overestimation and underestimation by each dataset varies per plot. Some trends can be seen such as that the UAV dataset severely underestimates the total biomass in most plots. All datasets underestimated the biomass in plot SAM-01 and PIU-02. The model 1 results are relatively close to the reference values, with some exceptions such as in plot SAM-01 and PIU-02. The Asner dataset almost always underestimates the biomass, except in cases where there are mostly small palms present, such as in plot PISC-02. The Potapov dataset shows relatively similar results compared to the reference data, but shows some large overestimations in plots such as JEN-14, ALP-60 and VEN-02.
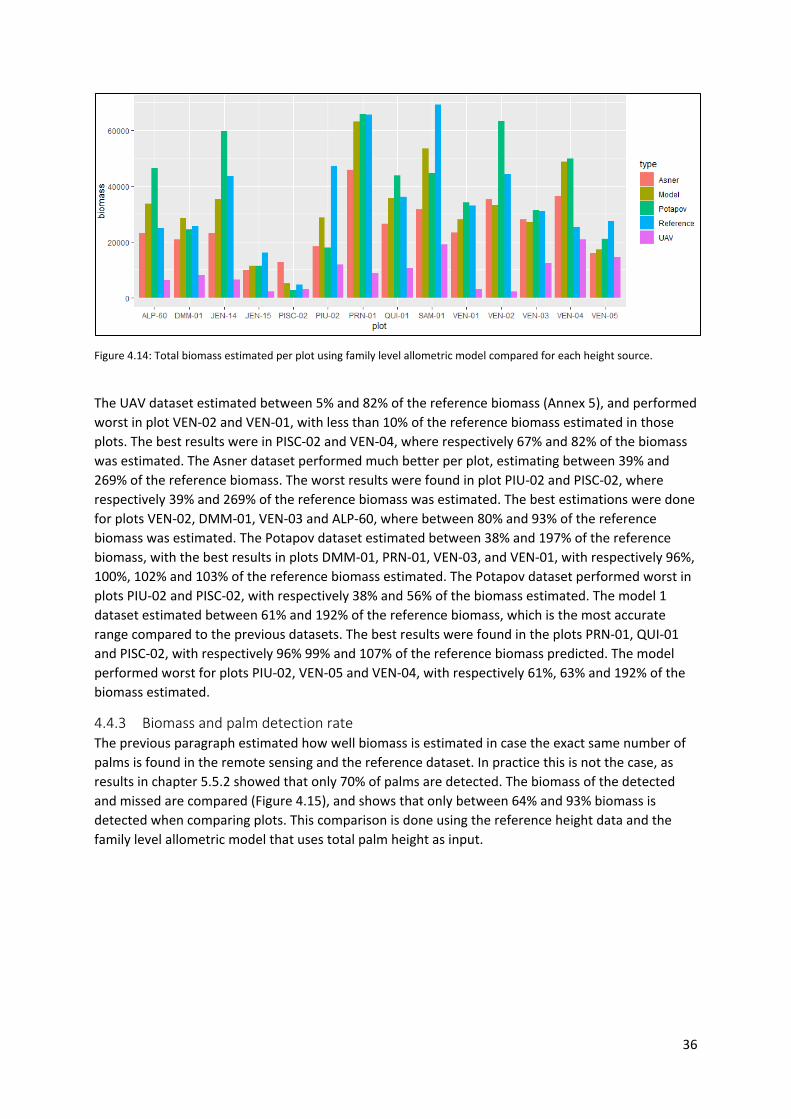
36
Figure 4.14: Total biomass estimated per plot using family level allometric model compared for each height source.
The UAV dataset estimated between 5% and 82% of the reference biomass (Annex 5), and performed worst in plot VEN-02 and VEN-01, with less than 10% of the reference biomass estimated in those plots. The best results were in PISC-02 and VEN-04, where respectively 67% and 82% of the biomass was estimated. The Asner dataset performed much better per plot, estimating between 39% and 269% of the reference biomass. The worst results were found in plot PIU-02 and PISC-02, where respectively 39% and 269% of the reference biomass was estimated. The best estimations were done for plots VEN-02, DMM-01, VEN-03 and ALP-60, where between 80% and 93% of the reference biomass was estimated. The Potapov dataset estimated between 38% and 197% of the reference biomass, with the best results in plots DMM-01, PRN-01, VEN-03, and VEN-01, with respectively 96%, 100%, 102% and 103% of the reference biomass estimated. The Potapov dataset performed worst in plots PIU-02 and PISC-02, with respectively 38% and 56% of the biomass estimated. The model 1 dataset estimated between 61% and 192% of the reference biomass, which is the most accurate range compared to the previous datasets. The best results were found in the plots PRN-01, QUI-01 and PISC-02, with respectively 96% 99% and 107% of the reference biomass predicted. The model performed worst for plots PIU-02, VEN-05 and VEN-04, with respectively 61%, 63% and 192% of the biomass estimated.
4.4.3 Biomass and palm detection rate The previous paragraph estimated how well biomass is estimated in case the exact same number of palms is found in the remote sensing and the reference dataset. In practice this is not the case, as results in chapter 5.5.2 showed that only 70% of palms are detected. The biomass of the detected and missed are compared (Figure 4.15), and shows that only between 64% and 93% biomass is detected when comparing plots. This comparison is done using the reference height data and the family level allometric model that uses total palm height as input.
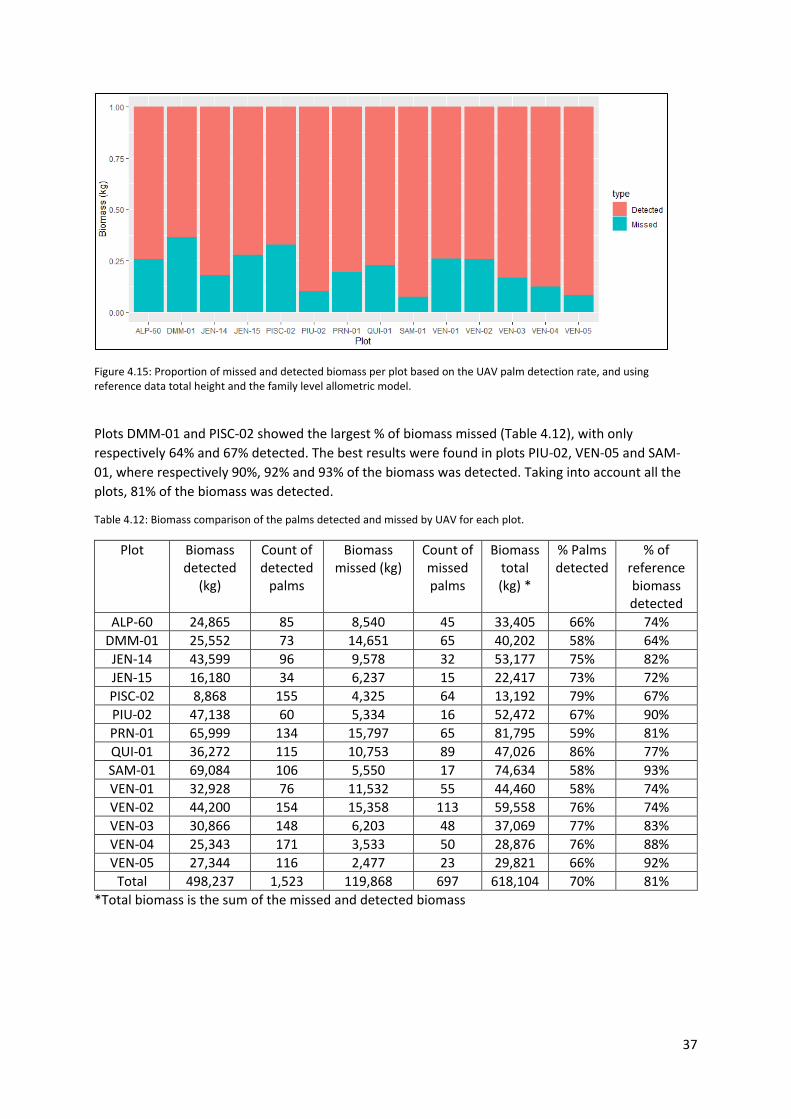
37
Figure 4.15: Proportion of missed and detected biomass per plot based on the UAV palm detection rate, and using reference data total height and the family level allometric model.
Plots DMM-01 and PISC-02 showed the largest % of biomass missed (Table 4.12), with only respectively 64% and 67% detected. The best results were found in plots PIU-02, VEN-05 and SAM-01, where respectively 90%, 92% and 93% of the biomass was detected. Taking into account all the plots, 81% of the biomass was detected.
Table 4.12: Biomass comparison of the palms detected and missed by UAV for each plot.
Plot Biomass detected
(kg)
Count of detected
palms
Biomass missed (kg)
Count of missed palms
Biomass total (kg) *
% Palms detected
% of reference biomass detected
ALP-60 24,865 85 8,540 45 33,405 66% 74% DMM-01 25,552 73 14,651 65 40,202 58% 64% JEN-14 43,599 96 9,578 32 53,177 75% 82% JEN-15 16,180 34 6,237 15 22,417 73% 72% PISC-02 8,868 155 4,325 64 13,192 79% 67% PIU-02 47,138 60 5,334 16 52,472 67% 90% PRN-01 65,999 134 15,797 65 81,795 59% 81% QUI-01 36,272 115 10,753 89 47,026 86% 77% SAM-01 69,084 106 5,550 17 74,634 58% 93% VEN-01 32,928 76 11,532 55 44,460 58% 74% VEN-02 44,200 154 15,358 113 59,558 76% 74% VEN-03 30,866 148 6,203 48 37,069 77% 83% VEN-04 25,343 171 3,533 50 28,876 76% 88% VEN-05 27,344 116 2,477 23 29,821 66% 92%
Total 498,237 1,523 119,868 697 618,104 70% 81% *Total biomass is the sum of the missed and detected biomass
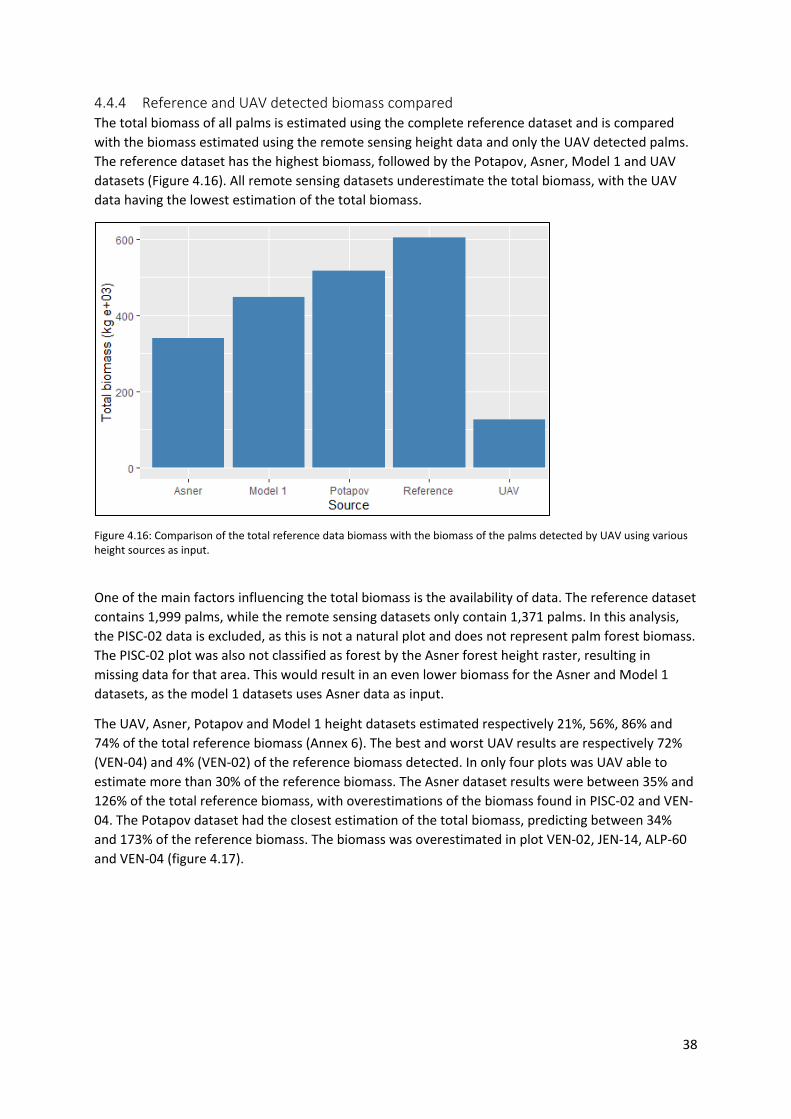
38
4.4.4 Reference and UAV detected biomass compared The total biomass of all palms is estimated using the complete reference dataset and is compared with the biomass estimated using the remote sensing height data and only the UAV detected palms. The reference dataset has the highest biomass, followed by the Potapov, Asner, Model 1 and UAV datasets (Figure 4.16). All remote sensing datasets underestimate the total biomass, with the UAV data having the lowest estimation of the total biomass.
Figure 4.16: Comparison of the total reference data biomass with the biomass of the palms detected by UAV using various height sources as input.
One of the main factors influencing the total biomass is the availability of data. The reference dataset contains 1,999 palms, while the remote sensing datasets only contain 1,371 palms. In this analysis, the PISC-02 data is excluded, as this is not a natural plot and does not represent palm forest biomass. The PISC-02 plot was also not classified as forest by the Asner forest height raster, resulting in missing data for that area. This would result in an even lower biomass for the Asner and Model 1 datasets, as the model 1 datasets uses Asner data as input.
The UAV, Asner, Potapov and Model 1 height datasets estimated respectively 21%, 56%, 86% and 74% of the total reference biomass (Annex 6). The best and worst UAV results are respectively 72% (VEN-04) and 4% (VEN-02) of the reference biomass detected. In only four plots was UAV able to estimate more than 30% of the reference biomass. The Asner dataset results were between 35% and 126% of the total reference biomass, with overestimations of the biomass found in PISC-02 and VEN-04. The Potapov dataset had the closest estimation of the total biomass, predicting between 34% and 173% of the reference biomass. The biomass was overestimated in plot VEN-02, JEN-14, ALP-60 and VEN-04 (figure 4.17).
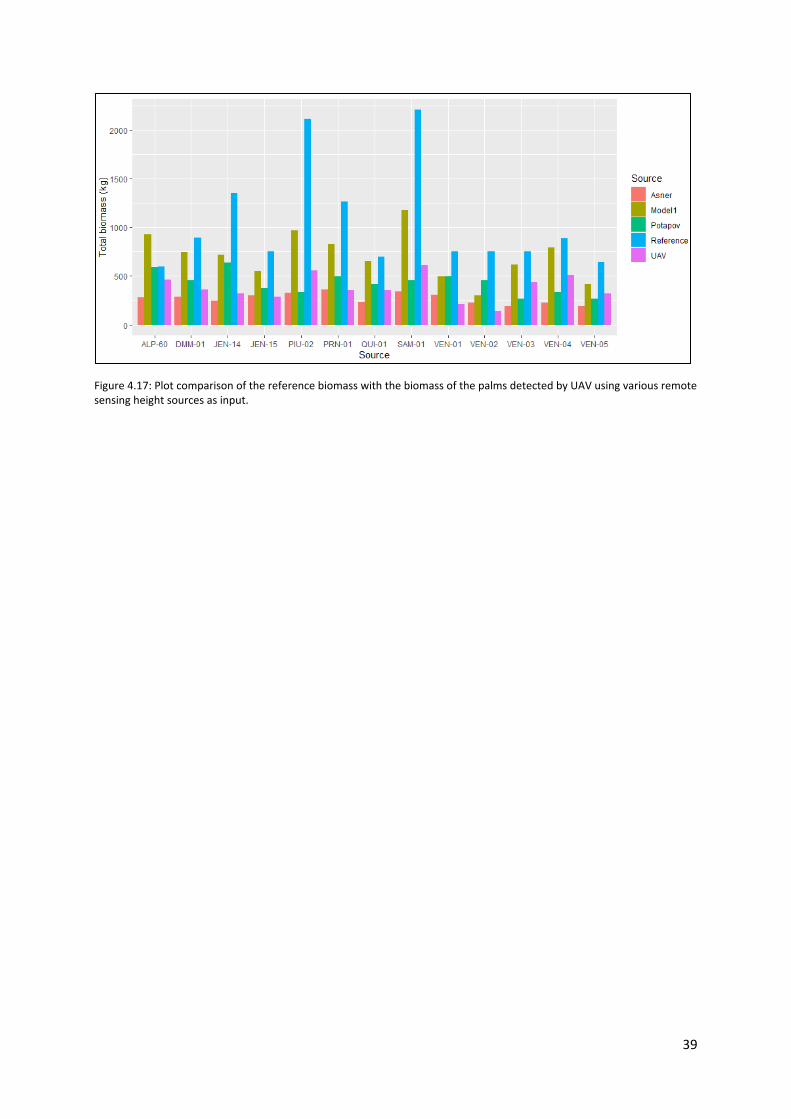
39
Figure 4.17: Plot comparison of the reference biomass with the biomass of the palms detected by UAV using various remote sensing height sources as input.
40
5 Discussion 5.1 Palm occurrence and detection rate The number of palms found per 0.5ha plot was between 49 palms (JEN-15) and 267 (VEN-02), with most of the palms detected being Mauritia (67%), followed by Mauritiella (14%). The abundance of these species per plot is an important factor when estimating the biomass per plot, as Mauritia was by far the tallest palm genus on average (20.3m), followed by Socratea (16.8m). In contrast to this, Mauritiella had one of the lowest average palm heights (13.2m). The abundance of these short palms per plot is reflected in the average palm height per plot, with QUI-01, VEN-04 and VEN-05, where the abundance of Mauritiella is the highest, having the lowest average plot palm height compared to other plots. Mauritia was the tallest palm genus on average, with a relative high number of outliers measured for Mauritia, with 6 palms measured larger than 40m. The presence of these palms can have a relatively big impact on the biomass measured in a plot, as these palms have a relatively high biomass compared to smaller palms. These outliers were found in the PIU-01 and the SAM-01 plots. The maximum heights measured for other genera are much lower, with Euterpe being the highest after Mauritia. These results imply that an area with Mauritia palms is likely to have a higher biomass compared to an area with the same number of palms from another genera. These results indicate that only having information about species abundance in a plot can give an indication of relative biomass when comparing plots.
Palm detection was done using commercial RGB UAV, and results show that there was no natural plot where the UAV was able to detect all the palms, indicating that remote sensing based biomass estimation that relies on detecting individual palms using this type of UAV in dense tropical forests will likely underestimate the plot biomass based on the palm detection rate. Only in the PISC-02 Mauritia plantation the UAV was able to detect all palms, but this area was not comparable to a natural forest due to the palms being planted in a grid with a set distance to each other, making the palm crowns and the soil between palm crowns very visible for UAV detection. The average detection rate per plot was 70%, varying between 58% and 86%. One of the reasons the palm detection rate was low is because the crowns could be overlapping in some cases, resulting in some crowns not being visible from above. The results show that detected palms are much more likely to be larger palms, with most palms being around 22m, while missed palms are mostly around 10m. This indicates that shorter palms are much less likely to be detected. This analysis supports the theory that missed palms are most likely hidden by the canopy, which is also suggested by Tagle Casapia et al. (2020). This suggests that even if the fraction of palms missed is relatively high, the impact on the biomass does not always have to be the same order of magnitude, due to these palms having low biomass (Goodman et al., 2014).
The stem abundance per hectare could give an indication of how many crowns overlap, and here not only palms are taken into account, but also non-palm species (trees), since these can also have crowns that overlap with those of palms. The stem abundance per hectare was plotted against the palm detection rate, but no relationship between the two values was found. More research should be done to determine what other factors influence the palm detection rate, such as clustering of palms. The UAV palm detection method implemented by Tagle Casapia et al. (2020) is one of the first studies to attempt palm detection in a complex Amazonian forest such as this and already identified factors that affect the detection rate such as palm crown visibility. It is beyond the scope of this study to determine how this palm detection methodology could be improved. But it is clear that more research to improve the detection rate will result in better estimations of the palm abundance and the related biomass in these complex forests.
41
5.2 Palm height estimation with remote sensing Better estimation of palm height results in more accurate biomass estimations. Detecting palm heights with remote sensing is challenging and depends on factors such as the resolution of the height maps and the limitations of these maps. Various canopy height maps are available, with UAV having the highest spatial resolution (2-30cm), which is much higher than the other height maps with resolutions of 30m and lower. The results showed that the lower resolution maps such as the global 30m resolution Potapov (Potapov et al., 2021) and the national 100m resolution Asner (Asner, 2021) maps more accurately estimated the palm heights than the high resolution UAV height maps. The UAV derived average height of all palms is was estimated to be about 10m smaller than the actual average height, indicating a significant underestimation of palm heights. One possible reason for the height errors was that the point locations of the palms crowns was not always accurate. This is likely caused by factors such as the location error of the GPS in the UAV, which is about 5m. In this case, there were also no geometrical corrections done, and no ground control points were used. Future studies could incorporate these steps to improve the accuracy and determine if this has a significant effect on the palm detection rate and palm height estimations. The UAV height map raster was also downsampled from a few centimeters to 1m. Heights extracted from this lower resolution UAV height map showed that there was no significant improvement of the heights estimations, making this downsampling unnecessary.
In addition to the overall underestimation of palm height by UAV, some palms were also estimated to have a height of zero or a negative value. This was due to the errors in the DSM and DTM, resulting in the DTM being larger than the DSM at some locations. The result of this is that some palms are not counted in the total plot biomass, and this means that even if palms are detected by the UAV, there is a chance the no biomass is calculated because the height is zero. However, when only taking into account the results of PISC-02 plantation, the UAV has much better results, with the palm height underestimation being only about 3m on average compared the 10m underestimation in the natural plots. The generalizability of these results is however limited by the limited amount of palms found in the single plantation plot, and the fact that these plantation Mauritia palms were genetically small and had similar heights. These results support the literature which describes that it is difficult to get a good DTM from RGB UAV in dense tropical forests, because it is difficult for the UAV to reconstruct the canopies and the forest height when palm crowns overlap and when the ground is not visible on the UAV images (Jiménez-Jiménez et al., 2021). This is especially difficult in areas where the ground is covered by water bodies, as is often the case in swampy forests, since water is homogenous and makes it difficult to detect common points on the images. The spacing between the palms in the PISC-02 plantation and the visibility of the soil between the palms seemed to improve the quality of the DSM and DTM plots. These initial results indicate that UAV is best suited for palm detection and heights estimations in these types of plantation forests, or in forests where there is a lot of visible ground and where the crowns do not overlap.
In natural forest plots, the Potapov height map has an average palm height of 21m, which is closest to that of the reference data (19.6m). Potapov et al. (2021) also reported that the Potapov height map has difficulties mapping small (<7m) and tall trees (>30m), which may influence height accuracy in plots where palms with these heights dominate. The Asner map has an average palm height of 18m. Both maps have similar RMSE (6.5m – 6.6.m) and MAE (5.2m) values, which are much lower compared to that of the UAV data (RMSE of 12m and MAE of 10m). The errors reported for the Asner map in the plots are higher than those reported in the Asner et al. (2014) paper, which describes that height errors are higher in areas with canopies lower than 10m and in tropical forests (such as is the case in the plots).
42
The Simard (Simard et al., 2011) and Wang (Wang et al., 2016) maps showed to be unsuitable for use, as they severely overestimated the palm heights by about 6m. Another important factor when choosing the height maps was the range of heights these maps could measure, with the Wang map having the smallest range (23m – 26.8), followed by the Simard map (20m – 34m). Even though the UAV map has large errors, it is the map with the tallest range of heights measured (0m – 27.4m), which is an important factor seeing how the palms have heights between 1.6m and 48.6m. None of the useful maps however, were able to detect palms heights above 28m. This would implicate that in a plot where palms are larger than 28m, biomass would certainly be underestimated by these amps (UAV, Simard and Asner maps). These maximum heights limits were expected, as they had been reported before (Asner, 2021; Potapov et al., 2019). The minimum height measurement limits of these maps also affects the biomass estimation, as the Asner map estimated the lowest palm height to be 13.3m, which is much larger than that of the reference dataset (smallest palm being 1.6m). The effects of this limitation are clear when looking at results from height mapping in plots with small palms such as PISC-02, where palms have an average height of around 10m. Here all the palm heights are overestimated by the Asner map, with a reported average palm height of 16m. A limitation of this study is that only the palm heights are available as reference height data, while the remote sensing height maps have heights estimated based on all vegetation in that area, which includes trees and palms. The plots in the dataset all include a large amount of trees, making it difficult to determine how much the remote sensing derived canopy heights were influenced by tree heights in the plots. However, it is expected that the height of the trees in the plot will have an impact on the remote sensing detected forest height maps, especially in cases where the tree and the palm heights vary. These results suggest to use a combination of these various heights maps in order that the maps can compensate for the shortcomings of other maps.
Another challenge is the low resolution of the height maps, resulting in the palms in these plots being assigned only one or two height values in the whole plot. This is especially challenging for the Asner map, which has a resolution of 1ha, which is larger than the plot size of 0.5ha. Plot level height error estimations are difficult to calculate due to the low spatial resolution of the raster maps (except UAV). Only the UAV dataset has a high enough resolution to distinguish palm heights of individual palms, even though there were relatively big RMSE and MAE errors. The resolutions of the other maps make them more suitable for height error analysis of larger areas that cover multiple pixels, or when taking data from multiple plots into account such as in this study.
As the comparison of the individual heights maps with the reference data show that the UAV, Asner and Potapov maps have the best results. Linear models were also tested to predict the reference data using these height maps as input. Four linear models were tested using combinations of these three maps, with results showing that a linear model that uses all three maps as independent variables provided the best results with an R2 of 0.42 (model 1). The worst model (model 4) had a R2 of 0.27 and only used the Asner and Potapov maps as input. These results demonstrate that UAV had a significant role in improving the model, most likely due to this map having the largest range of heights mapped, and because the high spatial resolution allowed for each palm to be assigned a separate height value. One benefit of this large height range is that is it possible to map relative differences between individual palm heights, something which is not possible in a small area when using the lower resolution height maps. The model fit of 0.42 is not high, but still an improvement compared to best data fit when using a single map, of which the Asner map had the best R2 model fit of 25%. However, the limitation of this model is that it is dependent on all three height maps, which are not always available for all areas. An example of this is the PISC-02 plot, which had missing data on the Asner map, resulting in it not being possible to use the model for all palms.
43
5.3 Biomass comparison Several allometric models are proposed by Goodman et al. (2013), that can be used based on which data is available. Palms require palm height for biomass estimation, and the most accurate models are genus specific and require stem height as input. However, stem height is very difficult to detect using remote sensing and that data was not available from remote sensing in this study. The height maps provide only total palm height, which can be used for family level allometric models. Even though genus specific models are available that require total height, the use of family level models is recommended, as using the palm genus identified through remote sensing would introduce another level of uncertainty. The difficulty of accurately detecting the genus using RGB UAV varies per plot, and depends on factors such as the canopy density and the species present, since some species had similar crown types (Tagle Casapia et al., 2020). The palm biomass was determined for the palms in the reference data which contained both stem and total height data, and results showed that the family level model estimated about 20% biomass less than the genus level model. This difference can be partially attributed to the errors in measurements in the field, either overestimating the stem height or underestimating the total height. This is supported by various studies (Larjavaara & Muller-Landau, 2013; Sullivan et al., 2018), which report that height measurements in the field are difficult and time consuming in forests where the top of the crowns are not clearly visible due to the dense canopy. This is especially difficult in palm dominated forests, which are often flooded and difficult to traverse. Even though there are differences, other studies have also used family level biomass models that require total height (Coronado et al., 2021) to estimate palm biomass in Peru. However, in the case that more accurate palm genus and stem height data become available, it is recommended to use the genus level mode that has a lower error than the family level model. In case palm height data will be used to estimate biomass changes though palm measurements at various points in time, consistent use of the same allometric model will be necessary to make these comparisons possible.
Total palm biomass is estimated using the total height data obtained from each remote sensing source and compared with the reference data using only the palms available in both the reference data and the remote sensing datasets. This is done in order to compare the biomass without taking into account palms not detected by UAV or that had missing data. The biomass comparisons showed that using the Potapov data resulted in the closest estimation of the reference biomass, overestimating total biomass by only 5%. It was expected that the Potapov map data would give good results, as the Potapov map had a large range of heights measures and had a relatively low height RMSE and MAE. All other maps underestimated the total biomass. The UAV and model 1 datasets estimated respectively 26% and 91% of the reference biomass. The model 1 output was relatively good, but performed slightly worse than the Potapov data. The data indicates that this is likely due to the fact that the UAV data that severely underestimates the palms heights was used as input for the model, in addition the Asner data which also underestimates heights of larger palms. The Asner (Asner, 2021; Asner et al., 2014) height data estimated about 71% of the reference biomass, with the underestimation likely being due to the maximum palm height limitation of 22m, causing it to underestimate biomass of all larger palms.
There are no other studies that estimated the biomass of only palms in this area using remote sensing, but the Peru biomass map (Asner et al., 2014; Asner, Gregory P. et al., 2021) showed similar trends biomass errors as this study, with the largest errors found in plots SAM-01, PRN-01 and PIU-02. These errors are similar to the results in this study, where these plots had relatively high errors. This indicates that some areas are more difficult to map accurately than others. This is likely caused by the relatively large number of outliers in these plots, with several palms measured above 40m high.
44
The plot level biomass estimations give more insights into the limitations of each height map. Here only the palms available in both the reference data and the remote sensing datasets are used for the comparison. The highest reference biomass was measured in plots SAM-01, PRN-01 and PIU-2. A forest carbon map was published by Anser (Asner et al., 2014; Asner, Gregory P. et al., 2021) and also reported relatively high biomass for these locations compared to the other plots. These results indicate a high palm biomass in a plot can result in an overall high forest biomass (includes both palms and trees). This is also supported by the results from Hergoualc’h et al. (2017), who reported that palms represent a significant part of the forest biomass in palm forests.
Plots with very low average palm heights, such as VEN04, had the highest biomass overestimations. Here the Potapov, model 1 and Asner data overestimated the biomass by 43% to 92%. This is likely due to the maps overestimating the heights of small palms. Another possible explanation for this is the presence of trees, which influence the heights reported on these maps. Plots where trees are overall taller will result in the height maps reporting a taller canopy on average. In plots with a very high average palm height, such as PIU-02, the biomass was often underestimated the most. In this plot, the Potapov, model 1 and Asner data only estimated between 39% and 61% of the reference biomass. This is also due to the height mapping limitations of these maps, as big palm heights are always underestimated. However these height limitations of the maps are not the only factors influencing the heights and related biomass, as seen in plot ALP-60, which has an average height of about 19m and no extreme outliers in the height data. In this plot the Potapov, model 1 and Asner had some of the highest biomass values estimated compared to other plots. One possible explanation for this is the high abundance of Euterpe and Socratea palms, which are rarely abundant in other plots. The data on these palm genera is very limited in this study, but these initial results show that it may be useful to do more studies in areas where they are more abundant, in order to understand how they affect height and related biomass estimations.
The proportion of the palms detected determines how much of the actual plot biomass will be estimated. However, the results show that the fraction of palms detected is not the same as the fraction of biomass detected, with on average 69% of palms being detected and 81% of biomass being estimated. This is supported by the previous results which showed that missed palms were mostly smaller palms that contributes less to the total plot biomass. The SAM-01 plot had the highest palm detection rate of 86% which contributed to 93% of the total biomass. In other words, the 14% of palms not detected contributed to only 7% of the plot biomass. This indicates that the UAV does not have to detect all palms in order to still get good estimations of the plot biomass. With the current commercial RGB UAV remote sensing technology used, it has not been proven possible yet to detect all palms in complex tropical forests. Other methods such as those involving LIDAR (airborne or ground), could give much better results, while being more expensive and complex.
When comparing the total palm biomass of the reference data with that of the biomass from the detected palms using the remote sensing derived heights, results show that all remote sensing methods underestimate the total palm height. This was expected, as with current UAV detection methods, about 30% of palms are not detected. The Potapov data has the closest estimation of the reference biomass, detecting about 85%. The lowest estimation is that from the UAV data, which estimated only 21% of the reference biomass.
45
However, the Potapov estimation being closest to the reference biomass does not directly indicate the best results, as these results are a combination of various factors such as the palm detection rate, average height of detected palms, limitations of the height maps and the height variations between the plots. The Potapov map most likely had the highest biomass estimation, due to it overestimating the biomass for many palms. The UAV total biomass has a similar problem, with the palms detected by UAV mostly being tall palms, which often have the height underestimated UAV. As discussed before, factors such as average palm height and species abundance in a plot determines how accurate biomass will be detected. The most important factor however is the palm detection rate, as this determines how much biomass will be underestimated.
5.4 Applications and sustainable forest management Results show that commercial RGB UAV detection of palms is not ideal for accurate biomass estimations, as about 30% of palms on average are not even detected. Determining total palm biomass of plots is difficult with commercial RGB UAV, as the palm detection rate results in biomass missed. Better technology such as LIDAR mounted UAV is available but more expensive, making it a tradeoff between less accurate commercial RGB UAV and the more expensive and complex UAV options. In some cases, this makes the RGB UAV a more cost effective solution, especially when only rough estimations of palm abundance and height the goal. Other studies (Coronado et al., 2021; Hergoualc’h et al., 2017) have attempted to map biomass of palm forests, but these studies also had to include woody trees in the biomass estimations, while the RGB UAV method used in this study provides palm specific information.
In the context of sustainable forest management, detecting all palm biomass might not always be necessary. About 70% of palms can be located and identified remotely by UAV, which already provides valuable information on palm abundance and species presence. This information is useful in the case of forest management planning that is focused on identifying areas with palms or when areas with an abundance of a specific species of palm needs to be identified. One possibility for getting relatively good biomass estimations with less time invested in field data collection, would be to do field data collection only focused on mapping palm locations and then later extracting the height data using remote sensing. According to Sullivan et al. (2018), only about 20-50 palms in a plot should be sampled for height model calibration and validation. In this case the genus identification could be done in the field for all mapped palms in order to make use of low error genus level allometric models possible. Palm heights can be identified relatively accurately using palm locations and biomass can be estimated using the model 1 or Potapov height datasets, which showed to have the best results. Some more research would have to be done to determine the biomass estimation accuracy using this method, as palms that have overlapping canopy crowns would also be included in the dataset. The heights and related biomass of these palms would likely be overestimated as only the canopy of the highest canopy layer would be detected by UAV.
Another use for the UAV detected palm data would be in the context of carbon emissions, where changes of the carbon stocks could be monitored. Hergoualc’h et al. (2017) reported that palm dominated forests, the loss of palms and the following increase in woody trees, resulted in a significant loss of biomass in the forest, highlighting the need to understand where loss of palm biomass takes place. Repeating flights over plots could result in information on palm fatalities due to natural causes or harvesting. This would give some indications of the amount of biomass lost over certain periods of time. This data could then be used for further forest management, as areas with high losses of palms could be identified.
46
This forest monitoring with commercial RGB UAV could be done by local communities, as it has been shown that forest monitoring by local communities can contribute to forest management and forest carbon programs such as REDD+ (Paneque-Gálvez et al., 2014). Other studies have already shown that forest degradation mapping with UAV has potential in tropical forests (Berveglieri et al., 2018; Zahawi et al., 2015), and more research can be done on how these methods can be applied in palm dominated forests. The method tested by (Singh & Kushwaha, 2021), which combined UAV photogrammetry with Sentinel-1 and Sentinel-2 in India to monitor forest degradation can also be tested in Peru since photogrammetry information is already available. However this would not give palm specific degradation information, but rather related to the total forest biomass.
Looking at all the results, there is potential for good biomass estimation by using commercial RGB UAV in combination with other available forest height datasets. This is highly dependent on the palm detection rate, and improving the palm detection rate with better technology or image analysis algorithms would contribute to making better biomass estimations possible. However, with the methods available, there are already some options for integrating these methods for forest management.
47
Conclusions
This research aimed to determine how accurately individual palm and plot level palm biomass could be estimated by detecting palms using RGB UAV in combination with remote sensing derived palm heights. The RGB UAV derived palm heights and palm heights from other remote sensing sources were used to estimate biomass and results were compared. Biomass was estimated by using allometric models which require palm height as input. The remote sensing derived biomass was then compared to the reference data palm biomass, using the data made available by forestplot.net (ForestPlots.net et al., 2021; Lopez-Gonzalez et al., 2011). The overall results showed that it was possible to estimate palm biomass using only RGB UAV in combination with other remote sensing sources of palm height, with various levels of errors.
The RGB UAV was used to map the locations of the palms in the plots and a canopy height model map was made for each plot using the sfm algoritm. The results of the palm detection rate were mixed, with an average detection rate per plot of 70%. This is an important factor, as palm detection is one of the main factors that influences the amount of palm biomass estimated per plot. The detection rate was the highest in the plantation plot, where the ground between the palms was clearly visible and the palm crowns did not overlap. This situation makes it possible for the UAV to detect all palms, but this is usually not the case in dense tropical forests, resulting in the palm detection rate being influenced by the forest structure. Results could be improved by using other types of sensors on the UAV, such as LIDAR, but these are often more expensive and complex, which can make them less cost-effective and accessible.
The UAV canopy height model was made by using the DTM and DSM as input. The resulting canopy height map had a very high spatial resolution, making it possible to map the relative heights of individual palms in a plot. However, the results showed that the palm heights were underestimated in the natural plots by about 10m on average. Results were much better in the plantation plot, where the canopy was not dense and the ground was clearly visible on the UAV. The other canopy height maps had much better results overall. The Asner (Asner, 2021; Asner et al., 2014) and the Potapov et al. (2021) maps had relatively low errors when compared to the reference dataset, and a linear model that was made by using the UAV, Asner and Potapov data as input performed even better. The model had the best model fit when compared to the reference palm height (42%). The maps by Simard et al. (2011), GEDI L2A and Wang et al. (2016) were also tested and results showed that these maps overestimated the palms heights for medium and small sized palms. The range of heights mapped was also too small to be useful for palm height estimations. The GEDI L2A (Fayad et al., 2021) also had only a limited part of the forest mapped. Based on this it was concluded that only the UAV, Potapov and Asner map data were suitable for biomass estimations.
Several allometric models are available for estimating palm biomass (Goodman et al., 2013), and require mainly Htot or Hstem. The models that require Hstem and genus information are the most accurate and recommended to use when Hstem data is available. However data from remote sensing in this study only included Htot information, with the genus of palms also difficult to detect in some cases when using RGB UAV. Based on an analysis of the available remote sensing data, it can be concluded that the allometric model that does not require genus information and only requires Htot has to be applied for best results.
48
Palm biomass per plot was then estimated with the family level allometric model using the Htot from the reference height data, the remote sensing height map datasets and the linear model. Here the only the palms detected by UAV were used for the comparison, and it could be concluded from the results that the Potapov and the linear model data resulted in very close estimations of total palm biomass of the reference dataset. The UAV data had the worst results and the largest underestimation, making the Potapov and linear model estimation much more suitable for use.
However, when also taking into account the palm detection rate, the remote sensing detected biomass was much lower than the reference biomass. This was expected, as the less palms are detected by UAV, the less biomass is detected. The results did however show that the palms that were not detected by UAV had a high chance of being short palms, making their impact on the total plot biomass relatively small in many cases. Large palms were easier to detect and also had a relatively much higher biomass than the missed palms.
The information from the RGB UAV and the other palm height sources cannot predict the total biomass in a dense tropical palm forest due to the limited palm detection rate. But the method can still be very useful for forest management and planning, as UAV data gives an idea of the abundance of palms in an area, with the related biomass. The remote sensing height detection could also make field data collection less expensive and time consuming, by estimating heights of palms mapped in the field instead of doing manual height measurement in the field. The field teams could then only measure the heights of a small portion of the palms in the plot for validation and model calibration purposes. Based on all of the above, it can be concluded that there are still challenges when mapping palm biomass using the discussed method, but that these results can still be useful depending on the context they are used.
49
References
Adam, M., Urbazaev, M., Dubois, C., & Schmullius, C. (2020). Accuracy Assessment of GEDI Terrain Elevation and Canopy
Height Estimates in European Temperate Forests: Influence of Environmental and Acquisition Parameters.
Remote Sensing, 12(23), 3948. https://doi.org/10.3390/rs12233948
Alvarez-Vanhard, E., Houet, T., Mony, C., Lecoq, L., & Corpetti, T. (2020). Can UAVs fill the gap between in situ surveys and
satellites for habitat mapping? Remote Sensing of Environment, 243, 111780.
https://doi.org/10.1016/j.rse.2020.111780
Asner, G. P. (2021). Global Airborne Observatory: Forest Canopy Height of Peruvian Amazon and Andes [Data set]. Zenodo.
https://doi.org/10.5281/zenodo.5722548
Asner, G. P., Knapp, D. E., Martin, R. E., Tupayachi, R., Anderson, C. B., Mascaro, J., Sinca, F., Chadwick, K. D., Higgins, M.,
Farfan, W., Llactayo, W., & Silman, M. R. (2014). Targeted carbon conservation at national scales with high-
resolution monitoring. Proceedings of the National Academy of Sciences, 111(47), E5016–E5022.
https://doi.org/10.1073/pnas.1419550111
Asner, Gregory P., Knapp, David E., Martin, Roberta E., Tupayachi, Raul, Anderson, Christopher B., Mascaro, Joseph, Sinca,
Felipe, Chadwick, K. Dana, Higgins, Mark, Farfan, William, Llactayo, W., & Silman, Miles R. (2021). Global Airborne
Observatory: Forest Carbon Stocks of Peru (1.0) [Data set]. Zenodo. https://doi.org/10.5281/ZENODO.4626309
Baldocchi, D., Falge, E., Gu, L., Olson, R., Hollinger, D., Running, S., Anthoni, P., Bernhofer, C., Davis, K., Evans, R., Fuentes, J.,
Goldstein, A., Katul, G., Law, B., Lee, X., Malhi, Y., Meyers, T., Munger, W., Oechel, W., … Wofsy, S. (2001).
FLUXNET: A New Tool to Study the Temporal and Spatial Variability of Ecosystem-Scale Carbon Dioxide, Water
Vapor, and Energy Flux Densities. Bulletin of the American Meteorological Society, 82(11), 2415–2434.
https://doi.org/10.1175/1520-0477(2001)082<2415:FANTTS>2.3.CO;2
Berveglieri, A., Imai, N. N., Tommaselli, A. M. G., Casagrande, B., & Honkavaara, E. (2018). Successional stages and their
evolution in tropical forests using multi-temporal photogrammetric surface models and superpixels. ISPRS Journal
of Photogrammetry and Remote Sensing, 146, 548–558. https://doi.org/10.1016/j.isprsjprs.2018.11.002
Blaschke, T. (2010). Object based image analysis for remote sensing. ISPRS Journal of Photogrammetry and Remote Sensing,
65(1), 2–16. https://doi.org/10.1016/j.isprsjprs.2009.06.004
Chave, J., Réjou-Méchain, M., Búrquez, A., Chidumayo, E., Colgan, M. S., Delitti, W. B. C., Duque, A., Eid, T., Fearnside, P. M.,
Goodman, R. C., Henry, M., Martínez-Yrízar, A., Mugasha, W. A., Muller-Landau, H. C., Mencuccini, M., Nelson, B.
W., Ngomanda, A., Nogueira, E. M., Ortiz-Malavassi, E., … Vieilledent, G. (2014). Improved allometric models to
estimate the aboveground biomass of tropical trees. Global Change Biology, 20(10), 3177–3190.
https://doi.org/10.1111/gcb.12629
Coronado, E. N. H., Hastie, A., Reyna, J., Flores, G., Grández, J., Lähteenoja, O., Draper, F. C., Åkesson, C. M., Baker, T. R.,
Bhomia, R. K., Cole, L. E. S., Dávila, N., Águila, J. D., Águila, M. D., Torres, D. D. C., Lawson, I. T., Brañas, M. M.,
Mitchard, E. T. A., Monteagudo, A., … Montoya, M. (2021). Intensive field sampling increases the known extent of
carbon-rich Amazonian peatland pole forests. Environmental Research Letters, 16(7), 074048.
https://doi.org/10.1088/1748-9326/ac0e65
Cruzan, M. B., Weinstein, B. G., Grasty, M. R., Kohrn, B. F., Hendrickson, E. C., Arredondo, T. M., & Thompson, P. G. (2016).
Small unmanned aerial vehicles (micro-UAVs, drones) in plant ecology. Applications in Plant Sciences, 4(9),
1600041. https://doi.org/10.3732/apps.1600041
Csillik, O., Kumar, P., & Asner, G. (2020). Challenges in Estimating Tropical Forest Canopy Height from Planet Dove Imagery.
Remote Sensing, 12, 1160. https://doi.org/10.3390/rs12071160
50
Csillik, O., Kumar, P., Mascaro, J., O’Shea, T., & Asner, G. P. (2019). Monitoring tropical forest carbon stocks and emissions
using Planet satellite data. Scientific Reports, 9(1), 17831. https://doi.org/10.1038/s41598-019-54386-6
Dang, A. T. N., Nandy, S., Srinet, R., Luong, N. V., Ghosh, S., & Senthil Kumar, A. (2019). Forest aboveground biomass
estimation using machine learning regression algorithm in Yok Don National Park, Vietnam. Ecological Informatics,
50, 24–32. https://doi.org/10.1016/j.ecoinf.2018.12.010
Draper, F. C., Honorio Coronado, E. N., Roucoux, K. H., Lawson, I. T., A. Pitman, N. C., A. Fine, P. V., Phillips, O. L., Torres
Montenegro, L. A., Valderrama Sandoval, E., Mesones, I., García-Villacorta, R., Arévalo, F. R. R., & Baker, T. R.
(2018). Peatland forests are the least diverse tree communities documented in Amazonia, but contribute to high
regional beta-diversity. Ecography, 41(8), 1256–1269. https://doi.org/10.1111/ecog.03126
Draper, F. C., Roucoux, K. H., Lawson, I. T., Mitchard, E. T. A., Coronado, E. N. H., Lähteenoja, O., Montenegro, L. T.,
Sandoval, E. V., Zaráte, R., & Baker, T. R. (2014). The distribution and amount of carbon in the largest peatland
complex in Amazonia. Environmental Research Letters, 9(12), 124017. https://doi.org/10.1088/1748-
9326/9/12/124017
Dubayah, R., Blair, J. B., Goetz, S., Fatoyinbo, L., Hansen, M., Healey, S., Hofton, M., Hurtt, G., Kellner, J., Luthcke, S.,
Armston, J., Tang, H., Duncanson, L., Hancock, S., Jantz, P., Marselis, S., Patterson, P. L., Qi, W., & Silva, C. (2020).
The Global Ecosystem Dynamics Investigation: High-resolution laser ranging of the Earth’s forests and topography.
Science of Remote Sensing, 1, 100002. https://doi.org/10.1016/j.srs.2020.100002
Emilien, A.-V., Thomas, C., & Thomas, H. (2021). UAV & satellite synergies for optical remote sensing applications: A
literature review. Science of Remote Sensing, 3, 100019. https://doi.org/10.1016/j.srs.2021.100019
Fagua, J. C., Jantz, P., Rodriguez-Buritica, S., Duncanson, L., & Goetz, S. J. (2019). Integrating LiDAR, Multispectral and SAR
Data to Estimate and Map Canopy Height in Tropical Forests. Remote Sensing, 11(22), 2697.
https://doi.org/10.3390/rs11222697
Fayad, I., Baghdadi, N. N., Alvares, C. A., Stape, J. L., Bailly, J. S., Scolforo, H. F., Zribi, M., & Maire, G. L. (2021). Assessment
of GEDI’s LiDAR Data for the Estimation of Canopy Heights and Wood Volume of Eucalyptus Plantations in Brazil.
IEEE Journal of Selected Topics in Applied Earth Observations and Remote Sensing, 14, 7095–7110.
https://doi.org/10.1109/JSTARS.2021.3092836
ForestPlots.net, Blundo, C., Carilla, J., Grau, R., Malizia, A., Malizia, L., Osinaga-Acosta, O., Bird, M., Bradford, M., Catchpole,
D., Ford, A., Graham, A., Hilbert, D., Kemp, J., Laurance, S., Laurance, W., Ishida, F. Y., Marshall, A., Waite, C., …
Tran, H. D. (2021). Taking the pulse of Earth’s tropical forests using networks of highly distributed plots. Biological
Conservation, 260, 108849. https://doi.org/10.1016/j.biocon.2020.108849
Gonçalves, A. C., Sousa, A. M. O., & Mesquita, P. G. (2017). Estimation and dynamics of above ground biomass with very
high resolution satellite images in Pinus pinaster stands. Biomass and Bioenergy, 106, 146–154.
https://doi.org/10.1016/j.biombioe.2017.08.026
Goodman, R. C., Phillips, O. L., & Baker, T. R. (2014). The importance of crown dimensions to improve tropical tree biomass
estimates. Ecological Applications, 24(4), 680–698. https://doi.org/10.1890/13-0070.1
Goodman, R. C., Phillips, O. L., del Castillo Torres, D., Freitas, L., Cortese, S. T., Monteagudo, A., & Baker, T. R. (2013).
Amazon palm biomass and allometry. Forest Ecology and Management, 310(Supplement C), 994–1004.
https://doi.org/10.1016/j.foreco.2013.09.045
Gu, C., Clevers, J. G. P. W., Liu, X., Tian, X., Li, Z., & Li, Z. (2018). Predicting forest height using the GOST, Landsat 7 ETM+,
and airborne LiDAR for sloping terrains in the Greater Khingan Mountains of China. ISPRS Journal of
Photogrammetry and Remote Sensing, 137, 97–111. https://doi.org/10.1016/j.isprsjprs.2018.01.005
51
Hansen, M. C., Potapov, P. V., Goetz, S. J., Turubanova, S., Tyukavina, A., Krylov, A., Kommareddy, A., & Egorov, A. (2016).
Mapping tree height distributions in Sub-Saharan Africa using Landsat 7 and 8 data. Remote Sensing of
Environment, 185, 221–232. https://doi.org/10.1016/j.rse.2016.02.023
Harding, D. J., & Carabajal, C. C. (2005). ICESat waveform measurements of within-footprint topographic relief and
vegetation vertical structure. Geophysical Research Letters, 32(21). https://doi.org/10.1029/2005GL023471
Healey, S. P., Yang, Z., Gorelick, N., & Ilyushchenko, S. (2020). Highly Local Model Calibration with a New GEDI LiDAR Asset
on Google Earth Engine Reduces Landsat Forest Height Signal Saturation. Remote Sensing, 12(17), 2840.
https://doi.org/10.3390/rs12172840
Henderson, A., Bernal, R., & Galeano, G. (2019). Field guide to the palms of the Americas.
Hergoualc’h, K., Gutiérrez-Vélez, V. H., Menton, M., & Verchot, L. V. (2017). Characterizing degradation of palm swamp
peatlands from space and on the ground: An exploratory study in the Peruvian Amazon. Forest Ecology and
Management, 393, 63–73. https://doi.org/10.1016/j.foreco.2017.03.016
Horn, C. M., Vargas Paredes, V. H., Gilmore, M. P., & Endress, B. A. (2018). Spatio-temporal patterns of Mauritia flexuosa
fruit extraction in the Peruvian Amazon: Implications for conservation and sustainability. Applied Geography, 97,
98–108. https://doi.org/10.1016/j.apgeog.2018.05.004
Iglhaut, J., Cabo, C., Puliti, S., Piermattei, L., O’Connor, J., & Rosette, J. (2019). Structure from Motion Photogrammetry in
Forestry: A Review. Current Forestry Reports, 5(3), 155–168. https://doi.org/10.1007/s40725-019-00094-3
IIAP. (2004). Diversidad de Vegetación de la Amazonía Peruana Expresada en un Mosaico de Imágenes de Satélite.
Jiménez-Jiménez, S. I., Ojeda-Bustamante, W., Marcial-Pablo, M. de J., & Enciso, J. (2021). Digital Terrain Models Generated
with Low-Cost UAV Photogrammetry: Methodology and Accuracy. ISPRS International Journal of Geo-Information,
10(5), 285. https://doi.org/10.3390/ijgi10050285
Jing, L., Hu, B., Noland, T., & Li, J. (2012). An individual tree crown delineation method based on multi-scale segmentation of
imagery. ISPRS Journal of Photogrammetry and Remote Sensing, 70, 88–98.
https://doi.org/10.1016/j.isprsjprs.2012.04.003
Kuenzer, C., Dech, S., & Wagner, W. (2015). Remote Sensing Time Series Revealing Land Surface Dynamics: Status Quo and
the Pathway Ahead. In C. Kuenzer, S. Dech, & W. Wagner (Eds.), Remote Sensing Time Series: Revealing Land
Surface Dynamics (pp. 1–24). Springer International Publishing. https://doi.org/10.1007/978-3-319-15967-6_1
Lähteenoja, O., & Page, S. (2011). High diversity of tropical peatland ecosystem types in the Pastaza-Marañón basin,
Peruvian Amazonia. Journal of Geophysical Research: Biogeosciences, 116(G2).
https://doi.org/10.1029/2010JG001508
Lang, N., Schindler, K., & Wegner, J. D. (2019). Country-wide high-resolution vegetation height mapping with Sentinel-2.
Remote Sensing of Environment, 233, 111347. https://doi.org/10.1016/j.rse.2019.111347
Larjavaara, M., & Muller-Landau, H. C. (2013). Measuring tree height: A quantitative comparison of two common field
methods in a moist tropical forest. Methods in Ecology and Evolution, 4(9), 793–801.
https://doi.org/10.1111/2041-210X.12071
Lefsky, M. A. (2010). A global forest canopy height map from the Moderate Resolution Imaging Spectroradiometer and the
Geoscience Laser Altimeter System. Geophysical Research Letters, 37(15). https://doi.org/10.1029/2010GL043622
Liang, X., Kankare, V., Hyyppä, J., Wang, Y., Kukko, A., Haggrén, H., Yu, X., Kaartinen, H., Jaakkola, A., Guan, F., Holopainen,
M., & Vastaranta, M. (2016). Terrestrial laser scanning in forest inventories. ISPRS Journal of Photogrammetry and
Remote Sensing, 115, 63–77. https://doi.org/10.1016/j.isprsjprs.2016.01.006
52
Liu, A., Cheng, X., & Chen, Z. (2021). Performance evaluation of GEDI and ICESat-2 laser altimeter data for terrain and
canopy height retrievals. Remote Sensing of Environment, 264, 112571.
https://doi.org/10.1016/j.rse.2021.112571
Liu, Z., Zhang, Y., Yu, X., & Yuan, C. (2016). Unmanned surface vehicles: An overview of developments and challenges.
Annual Reviews in Control, 41, 71–93. https://doi.org/10.1016/j.arcontrol.2016.04.018
Lopez-Gonzalez, G., Lewis, S. L., Burkitt, M., Baker, T. R., & Phillips, O. L. (2009). ForestPlots.net Database.
www.forestplots.net
Lopez-Gonzalez, G., Lewis, S. L., Burkitt, M., & Phillips, O. L. (2011). ForestPlots.net: A web application and research tool to
manage and analyse tropical forest plot data. Journal of Vegetation Science, 22(4), 610–613.
https://doi.org/10.1111/j.1654-1103.2011.01312.x
Malhi, Y., Phillips, O., Lloyd, J., Baker, T. R., Wright, J., Almeida, S., Arroyo, L., Fredericksen, T., Grace, J., Higuchi, N., Killeen,
T., Laurance, W., Leaño, C., Lewis, S., Meir, P., Monteagudo, A., Neill, D., Vargas, P., Panfil, S., & Barbara, V. (2002).
An international network to monitor the structure, composition and dynamics of Amazonian forests (RAINFOR).
Journal of Vegetation Science, 13, 439–450. https://doi.org/10.1111/j.1654-1103.2002.tb02068.x
Matasci, G., Hermosilla, T., Wulder, M. A., White, J. C., Coops, N. C., Hobart, G. W., & Zald, H. S. J. (2018). Large-area
mapping of Canadian boreal forest cover, height, biomass and other structural attributes using Landsat
composites and lidar plots. Remote Sensing of Environment, 209, 90–106.
https://doi.org/10.1016/j.rse.2017.12.020
P., A., Gregory, Knapp, David E., Martin, Roberta E., Tupayachi, Raul, Anderson, Christopher B., Mascaro, Joseph, Sinca,
Felipe, Chadwick, K. Dana, Higgins, Mark, Farfan, William, Llactayo, W., & Silman, Miles R. (2021). Global Airborne
Observatory: Forest Carbon Stocks of Peru (1.0) [Data set]. Zenodo. https://doi.org/10.5281/ZENODO.4626309
Pandey, S. K., Chand, N., Nandy, S., Muminov, A., Sharma, A., Ghosh, S., & Srinet, R. (2020). High-Resolution Mapping of
Forest Carbon Stock Using Object-Based Image Analysis (OBIA) Technique. Journal of the Indian Society of Remote
Sensing, 48(6), 865–875. https://doi.org/10.1007/s12524-020-01121-8
Paneque-Gálvez, J., McCall, M. K., Napoletano, B. M., Wich, S. A., & Koh, L. P. (2014). Small Drones for Community-Based
Forest Monitoring: An Assessment of Their Feasibility and Potential in Tropical Areas. Forests, 5(6), 1481–1507.
https://doi.org/10.3390/f5061481
Peacock, J., Baker, T. r., Lewis, S. l., Lopez-Gonzalez, G., & Phillips, O. l. (2007). The RAINFOR database: Monitoring forest
biomass and dynamics. Journal of Vegetation Science, 18(4), 535–542. https://doi.org/10.1111/j.1654-
1103.2007.tb02568.x
Pearson, T. R. H., Brown, S., & Casarim, F. M. (2014). Carbon emissions from tropical forest degradation caused by logging.
Environmental Research Letters, 9(3), 034017. https://doi.org/10.1088/1748-9326/9/3/034017
Pearson, T. R. H., Brown, S., Murray, L., & Sidman, G. (2017). Greenhouse gas emissions from tropical forest degradation: An
underestimated source. Carbon Balance and Management, 12(1), 3. https://doi.org/10.1186/s13021-017-0072-2
Penn, J. (2008). Non-timber Forest Products in Peruvian Amazonia: Changing Patterns of Economic Exploitation. Focus on
Geography, 51, 18–25. https://doi.org/10.1111/j.1949-8535.2008.tb00222.x
Pham, L. T. H., & Brabyn, L. (2017). Monitoring mangrove biomass change in Vietnam using SPOT images and an object-
based approach combined with machine learning algorithms. ISPRS Journal of Photogrammetry and Remote
Sensing, 128, 86–97. https://doi.org/10.1016/j.isprsjprs.2017.03.013
Potapov, P., Li, X., Hernandez-Serna, A., Tyukavina, A., Hansen, M. C., Kommareddy, A., Pickens, A., Turubanova, S., Tang,
H., Silva, C. E., Armston, J., Dubayah, R., Blair, J. B., & Hofton, M. (2021). Mapping global forest canopy height
53
through integration of GEDI and Landsat data. Remote Sensing of Environment, 253, 112165.
https://doi.org/10.1016/j.rse.2020.112165
Potapov, P., Tyukavina, A., Turubanova, S., Talero, Y., Hernandez-Serna, A., Hansen, M. C., Saah, D., Tenneson, K., Poortinga,
A., Aekakkararungroj, A., Chishtie, F., Towashiraporn, P., Bhandari, B., Aung, K. S., & Nguyen, Q. H. (2019). Annual
continuous fields of woody vegetation structure in the Lower Mekong region from 2000-2017 Landsat time-series.
Remote Sensing of Environment, 232, 111278. https://doi.org/10.1016/j.rse.2019.111278
Prudente, V. H. R., Martins, V. S., Vieira, D. C., Silva, N. R. de F. e, Adami, M., & Sanches, I. D. (2020). Limitations of cloud
cover for optical remote sensing of agricultural areas across South America. Remote Sensing Applications: Society
and Environment, 20, 100414. https://doi.org/10.1016/j.rsase.2020.100414
Puletti, N., Grotti, M., Ferrara, C., & Chianucci, F. (2020). Lidar-based estimates of aboveground biomass through ground,
aerial, and satellite observation: A case study in a Mediterranean forest. Journal of Applied Remote Sensing, 14(4),
044501. https://doi.org/10.1117/1.JRS.14.044501
Qi, W., Lee, S.-K., Hancock, S., Luthcke, S., Tang, H., Armston, J., & Dubayah, R. (2019). Improved forest height estimation by
fusion of simulated GEDI Lidar data and TanDEM-X InSAR data. Remote Sensing of Environment, 221, 621–634.
https://doi.org/10.1016/j.rse.2018.11.035
Reichstein, M., & Carvalhais, N. (2019). Aspects of Forest Biomass in the Earth System: Its Role and Major Unknowns.
Surveys in Geophysics, 40(4), 693–707. https://doi.org/10.1007/s10712-019-09551-x
Réjou-Méchain, M., Barbier, N., Couteron, P., Ploton, P., Vincent, G., Herold, M., Mermoz, S., Saatchi, S., Chave, J., de
Boissieu, F., Féret, J.-B., Takoudjou, S. M., & Pélissier, R. (2019). Upscaling Forest Biomass from Field to Satellite
Measurements: Sources of Errors and Ways to Reduce Them. Surveys in Geophysics, 40(4), 881–911.
https://doi.org/10.1007/s10712-019-09532-0
Rich, P. M., Helenurm, K., Kearns, D., Morse, S. R., Palmer, M. W., & Short, L. (1986). Height and Stem Diameter
Relationships for Dicotyledonous Trees and Arborescent Palms of Costa Rican Tropical Wet Forest. Bulletin of the
Torrey Botanical Club, 113(3), 241–246. https://doi.org/10.2307/2996362
Roşca, S., Suomalainen, J., Bartholomeus, H., & Herold, M. (2018). Comparing terrestrial laser scanning and unmanned
aerial vehicle structure from motion to assess top of canopy structure in tropical forests. Interface Focus, 8(2),
20170038. https://doi.org/10.1098/rsfs.2017.0038
Roucoux, K. h., Lawson, I. t., Baker, T. r., Del Castillo Torres, D., Draper, F. c., Lähteenoja, O., Gilmore, M. p., Honorio
Coronado, E. n., Kelly, T. j., Mitchard, E. t. a., & Vriesendorp, C. f. (2017). Threats to intact tropical peatlands and
opportunities for their conservation. Conservation Biology, 31(6), 1283–1292. https://doi.org/10.1111/cobi.12925
Saatchi, S., Marlier, M., Chazdon, R. L., Clark, D. B., & Russell, A. E. (2011). Impact of spatial variability of tropical forest
structure on radar estimation of aboveground biomass. Remote Sensing of Environment, 115(11), 2836–2849.
https://doi.org/10.1016/j.rse.2010.07.015
Schull, M. A., Ganguly, S., Samanta, A., Huang, D., Shabanov, N. V., Jenkins, J. P., Chiu, J. C., Marshak, A., Blair, J. B., Myneni,
R. B., & Knyazikhin, Y. (2007). Physical interpretation of the correlation between multi-angle spectral data and
canopy height. Geophysical Research Letters, 34(18). https://doi.org/10.1029/2007GL031143
Shimizu, K., Ota, T., Mizoue, N., & Saito, H. (2020). Comparison of Multi-Temporal PlanetScope Data with Landsat 8 and
Sentinel-2 Data for Estimating Airborne LiDAR Derived Canopy Height in Temperate Forests. Remote Sensing,
12(11), 1876. https://doi.org/10.3390/rs12111876
Simard, M., Pinto, N., Fisher, J. B., & Baccini, A. (2011). Mapping forest canopy height globally with spaceborne lidar. Journal
of Geophysical Research: Biogeosciences, 116(G4). https://doi.org/10.1029/2011JG001708
54
Singh, A., & Kushwaha, S. K. P. (2021). Forest Degradation Assessment Using UAV Optical Photogrammetry and SAR Data.
Journal of the Indian Society of Remote Sensing, 49(3), 559–567. https://doi.org/10.1007/s12524-020-01232-2
Smith, M. W., Carrivick, J. L., & Quincey, D. J. (2016). Structure from motion photogrammetry in physical geography.
Progress in Physical Geography: Earth and Environment, 40(2), 247–275.
https://doi.org/10.1177/0309133315615805
St-Onge, B., & Grandin, S. (2019). Estimating the Height and Basal Area at Individual Tree and Plot Levels in Canadian
Subarctic Lichen Woodlands Using Stereo WorldView-3 Images. Remote Sensing, 11(3), 248.
https://doi.org/10.3390/rs11030248
Sullivan, M. J. P., Lewis, S. L., Hubau, W., Qie, L., Baker, T. R., Banin, L. F., Chave, J., Cuni-Sanchez, A., Feldpausch, T. R.,
Lopez-Gonzalez, G., Arets, E., Ashton, P., Bastin, J.-F., Berry, N. J., Bogaert, J., Boot, R., Brearley, F. Q., Brienen, R.,
Burslem, D. F. R. P., … Phillips, O. L. (2018). Field methods for sampling tree height for tropical forest biomass
estimation. Methods in Ecology and Evolution, 9(5), 1179–1189. https://doi.org/10.1111/2041-210X.12962
Tagle Casapia, X., Falen, L., Bartholomeus, H., Cárdenas, R., Flores, G., Herold, M., Honorio Coronado, E. N., & Baker, T. R.
(2020). Identifying and Quantifying the Abundance of Economically Important Palms in Tropical Moist Forest
Using UAV Imagery. Remote Sensing, 12(1), 9. https://doi.org/10.3390/rs12010009
ter Steege, H., Pitman, N. C. A., Sabatier, D., Baraloto, C., Salomão, R. P., Guevara, J. E., Phillips, O. L., Castilho, C. V.,
Magnusson, W. E., Molino, J.-F., Monteagudo, A., Núñez Vargas, P., Montero, J. C., Feldpausch, T. R., Coronado, E.
N. H., Killeen, T. J., Mostacedo, B., Vasquez, R., Assis, R. L., … Silman, M. R. (2013). Hyperdominance in the
Amazonian Tree Flora. Science, 342(6156), 1243092. https://doi.org/10.1126/science.1243092
Vaglio Laurin, G., Ding, J., Disney, M., Bartholomeus, H., Herold, M., Papale, D., & Valentini, R. (2019). Tree height in tropical
forest as measured by different ground, proximal, and remote sensing instruments, and impacts on above ground
biomass estimates. International Journal of Applied Earth Observation and Geoinformation, 82, 101899.
https://doi.org/10.1016/j.jag.2019.101899
Wallace, L., Lucieer, A., Malenovský, Z., Turner, D., & Vopěnka, P. (2016). Assessment of Forest Structure Using Two UAV
Techniques: A Comparison of Airborne Laser Scanning and Structure from Motion (SfM) Point Clouds. Forests,
7(3), 62. https://doi.org/10.3390/f7030062
Wang, Y., Li, G., Ding, J., Guo, Z., Tang, S., Wang, C., Huang, Q., Liu, R., & Chen, J. M. (2016). A combined GLAS and MODIS
estimation of the global distribution of mean forest canopy height. Remote Sensing of Environment, 174, 24–43.
https://doi.org/10.1016/j.rse.2015.12.005
Westoby, M. J., Brasington, J., Glasser, N. F., Hambrey, M. J., & Reynolds, J. M. (2012). ‘Structure-from-Motion’
photogrammetry: A low-cost, effective tool for geoscience applications. Geomorphology, 179, 300–314.
https://doi.org/10.1016/j.geomorph.2012.08.021
Zahawi, R. A., Dandois, J. P., Holl, K. D., Nadwodny, D., Reid, J. L., & Ellis, E. C. (2015). Using lightweight unmanned aerial
vehicles to monitor tropical forest recovery. Biological Conservation, 186, 287–295.
https://doi.org/10.1016/j.biocon.2015.03.031

55
Appendices
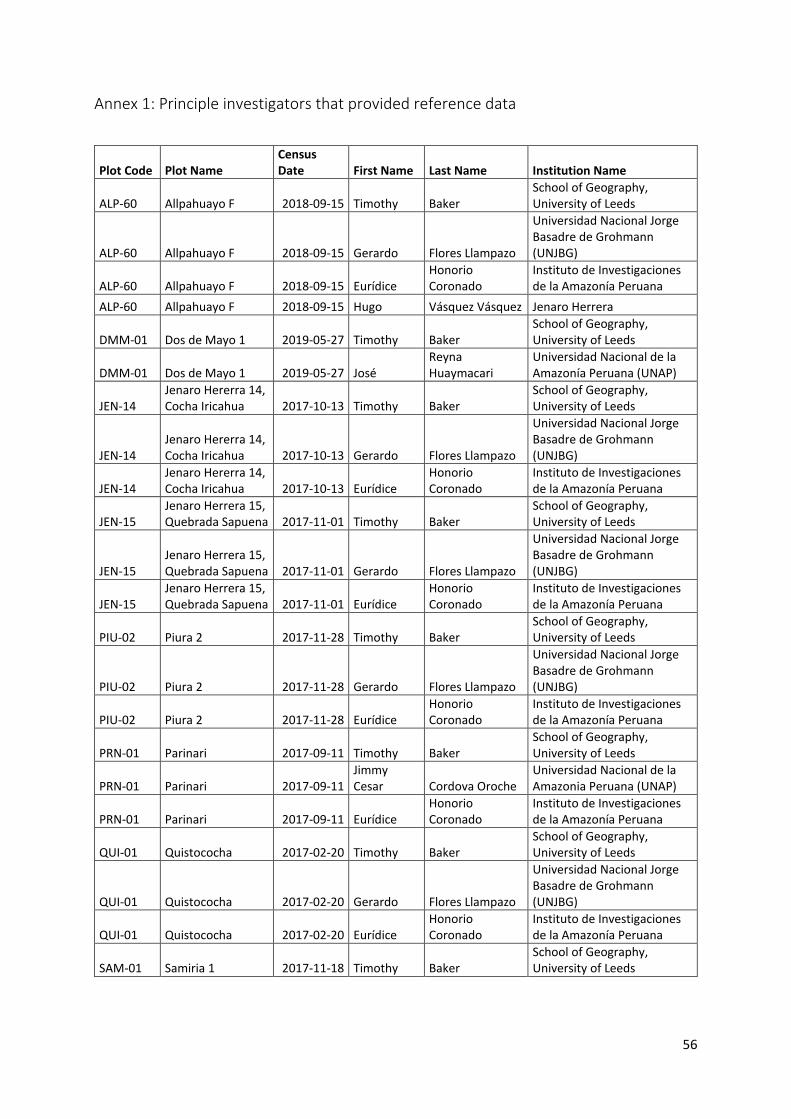
56
Annex 1: Principle investigators that provided reference data
Plot Code Plot Name Census Date First Name Last Name Institution Name
ALP-60 Allpahuayo F 2018-09-15 Timothy Baker School of Geography, University of Leeds
ALP-60 Allpahuayo F 2018-09-15 Gerardo Flores Llampazo
Universidad Nacional Jorge Basadre de Grohmann (UNJBG)
ALP-60 Allpahuayo F 2018-09-15 Eurídice Honorio Coronado
Instituto de Investigaciones de la Amazonía Peruana
ALP-60 Allpahuayo F 2018-09-15 Hugo Vásquez Vásquez Jenaro Herrera
DMM-01 Dos de Mayo 1 2019-05-27 Timothy Baker School of Geography, University of Leeds
DMM-01 Dos de Mayo 1 2019-05-27 José Reyna Huaymacari
Universidad Nacional de la Amazonía Peruana (UNAP)
JEN-14 Jenaro Hererra 14, Cocha Iricahua 2017-10-13 Timothy Baker
School of Geography, University of Leeds
JEN-14 Jenaro Hererra 14, Cocha Iricahua 2017-10-13 Gerardo Flores Llampazo
Universidad Nacional Jorge Basadre de Grohmann (UNJBG)
JEN-14 Jenaro Hererra 14, Cocha Iricahua 2017-10-13 Eurídice
Honorio Coronado
Instituto de Investigaciones de la Amazonía Peruana
JEN-15 Jenaro Herrera 15, Quebrada Sapuena 2017-11-01 Timothy Baker
School of Geography, University of Leeds
JEN-15 Jenaro Herrera 15, Quebrada Sapuena 2017-11-01 Gerardo Flores Llampazo
Universidad Nacional Jorge Basadre de Grohmann (UNJBG)
JEN-15 Jenaro Herrera 15, Quebrada Sapuena 2017-11-01 Eurídice
Honorio Coronado
Instituto de Investigaciones de la Amazonía Peruana
PIU-02 Piura 2 2017-11-28 Timothy Baker School of Geography, University of Leeds
PIU-02 Piura 2 2017-11-28 Gerardo Flores Llampazo
Universidad Nacional Jorge Basadre de Grohmann (UNJBG)
PIU-02 Piura 2 2017-11-28 Eurídice Honorio Coronado
Instituto de Investigaciones de la Amazonía Peruana
PRN-01 Parinari 2017-09-11 Timothy Baker School of Geography, University of Leeds
PRN-01 Parinari 2017-09-11 Jimmy Cesar Cordova Oroche
Universidad Nacional de la Amazonia Peruana (UNAP)
PRN-01 Parinari 2017-09-11 Eurídice Honorio Coronado
Instituto de Investigaciones de la Amazonía Peruana
QUI-01 Quistococha 2017-02-20 Timothy Baker School of Geography, University of Leeds
QUI-01 Quistococha 2017-02-20 Gerardo Flores Llampazo
Universidad Nacional Jorge Basadre de Grohmann (UNJBG)
QUI-01 Quistococha 2017-02-20 Eurídice Honorio Coronado
Instituto de Investigaciones de la Amazonía Peruana
SAM-01 Samiria 1 2017-11-18 Timothy Baker School of Geography, University of Leeds
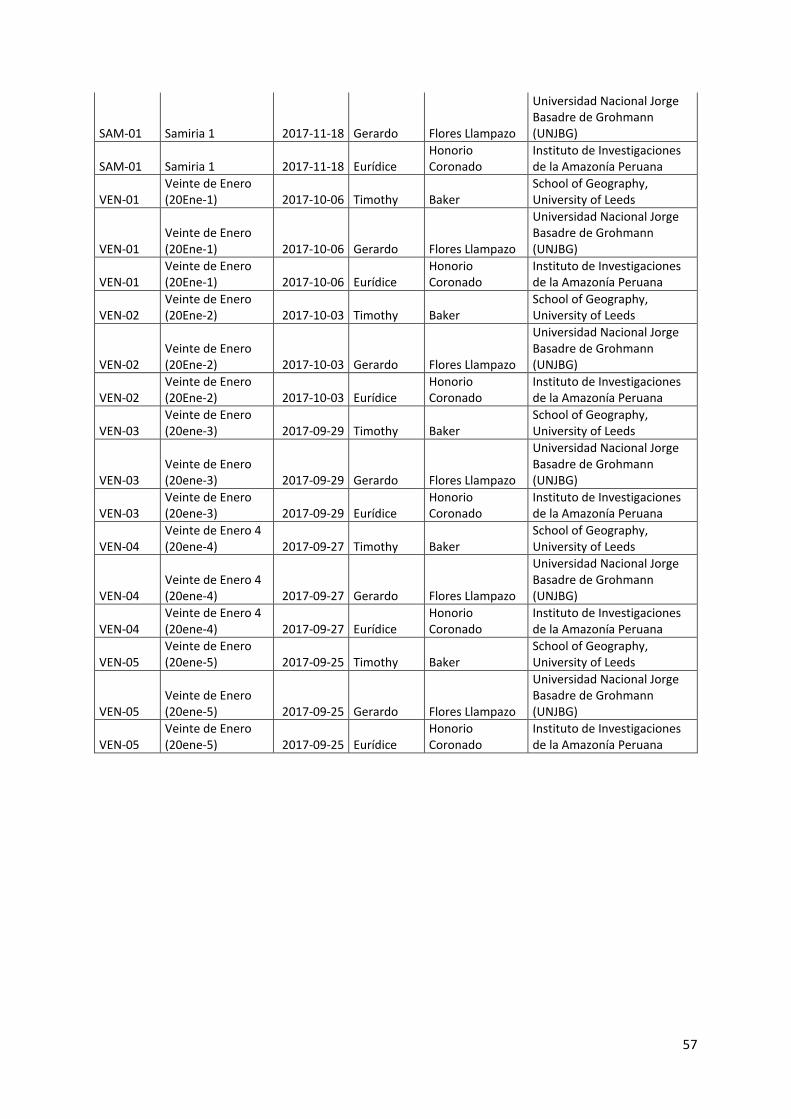
57
SAM-01 Samiria 1 2017-11-18 Gerardo Flores Llampazo
Universidad Nacional Jorge Basadre de Grohmann (UNJBG)
SAM-01 Samiria 1 2017-11-18 Eurídice Honorio Coronado
Instituto de Investigaciones de la Amazonía Peruana
VEN-01 Veinte de Enero (20Ene-1) 2017-10-06 Timothy Baker
School of Geography, University of Leeds
VEN-01 Veinte de Enero (20Ene-1) 2017-10-06 Gerardo Flores Llampazo
Universidad Nacional Jorge Basadre de Grohmann (UNJBG)
VEN-01 Veinte de Enero (20Ene-1) 2017-10-06 Eurídice
Honorio Coronado
Instituto de Investigaciones de la Amazonía Peruana
VEN-02 Veinte de Enero (20Ene-2) 2017-10-03 Timothy Baker
School of Geography, University of Leeds
VEN-02 Veinte de Enero (20Ene-2) 2017-10-03 Gerardo Flores Llampazo
Universidad Nacional Jorge Basadre de Grohmann (UNJBG)
VEN-02 Veinte de Enero (20Ene-2) 2017-10-03 Eurídice
Honorio Coronado
Instituto de Investigaciones de la Amazonía Peruana
VEN-03 Veinte de Enero (20ene-3) 2017-09-29 Timothy Baker
School of Geography, University of Leeds
VEN-03 Veinte de Enero (20ene-3) 2017-09-29 Gerardo Flores Llampazo
Universidad Nacional Jorge Basadre de Grohmann (UNJBG)
VEN-03 Veinte de Enero (20ene-3) 2017-09-29 Eurídice
Honorio Coronado
Instituto de Investigaciones de la Amazonía Peruana
VEN-04 Veinte de Enero 4 (20ene-4) 2017-09-27 Timothy Baker
School of Geography, University of Leeds
VEN-04 Veinte de Enero 4 (20ene-4) 2017-09-27 Gerardo Flores Llampazo
Universidad Nacional Jorge Basadre de Grohmann (UNJBG)
VEN-04 Veinte de Enero 4 (20ene-4) 2017-09-27 Eurídice
Honorio Coronado
Instituto de Investigaciones de la Amazonía Peruana
VEN-05 Veinte de Enero (20ene-5) 2017-09-25 Timothy Baker
School of Geography, University of Leeds
VEN-05 Veinte de Enero (20ene-5) 2017-09-25 Gerardo Flores Llampazo
Universidad Nacional Jorge Basadre de Grohmann (UNJBG)
VEN-05 Veinte de Enero (20ene-5) 2017-09-25 Eurídice
Honorio Coronado
Instituto de Investigaciones de la Amazonía Peruana
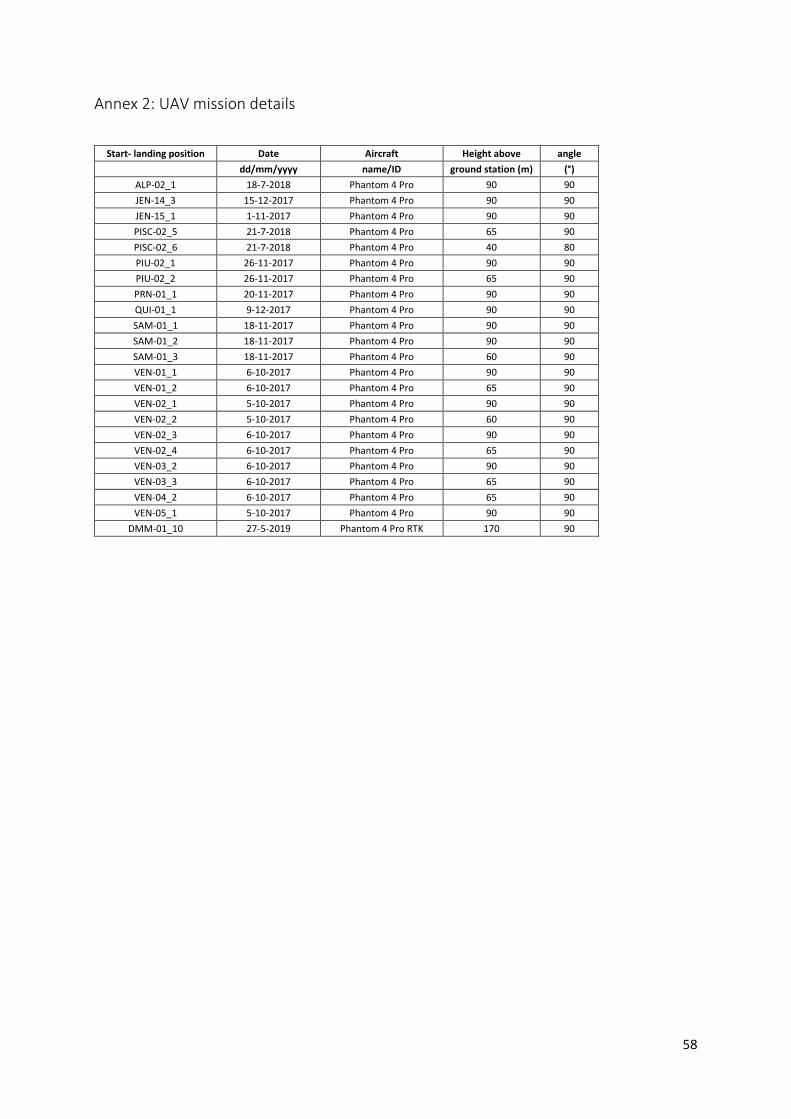
58
Annex 2: UAV mission details
Start- landing position Date Aircraft Height above angle dd/mm/yyyy name/ID ground station (m) (°)
ALP-02_1 18-7-2018 Phantom 4 Pro 90 90 JEN-14_3 15-12-2017 Phantom 4 Pro 90 90 JEN-15_1 1-11-2017 Phantom 4 Pro 90 90 PISC-02_5 21-7-2018 Phantom 4 Pro 65 90 PISC-02_6 21-7-2018 Phantom 4 Pro 40 80 PIU-02_1 26-11-2017 Phantom 4 Pro 90 90 PIU-02_2 26-11-2017 Phantom 4 Pro 65 90 PRN-01_1 20-11-2017 Phantom 4 Pro 90 90 QUI-01_1 9-12-2017 Phantom 4 Pro 90 90 SAM-01_1 18-11-2017 Phantom 4 Pro 90 90 SAM-01_2 18-11-2017 Phantom 4 Pro 90 90 SAM-01_3 18-11-2017 Phantom 4 Pro 60 90 VEN-01_1 6-10-2017 Phantom 4 Pro 90 90 VEN-01_2 6-10-2017 Phantom 4 Pro 65 90 VEN-02_1 5-10-2017 Phantom 4 Pro 90 90 VEN-02_2 5-10-2017 Phantom 4 Pro 60 90 VEN-02_3 6-10-2017 Phantom 4 Pro 90 90 VEN-02_4 6-10-2017 Phantom 4 Pro 65 90 VEN-03_2 6-10-2017 Phantom 4 Pro 90 90 VEN-03_3 6-10-2017 Phantom 4 Pro 65 90 VEN-04_2 6-10-2017 Phantom 4 Pro 65 90 VEN-05_1 5-10-2017 Phantom 4 Pro 90 90
DMM-01_10 27-5-2019 Phantom 4 Pro RTK 170 90
59
Annex 3: Number of palms detected per plot for each Genus
Plot Genus Count of Height ALP-60 130 Euterpe 61 Mauritia 59 Socratea 10 DMM-01 138 Euterpe 2 Mauritia 87 Mauritiella 4 Socratea 45 JEN-14 128 Euterpe 3 Mauritia 124 Socratea 1 JEN-15 49 Astrocaryum 1 Euterpe 1 Mauritia 47 PISC-02 218 Mauritia 218 PIU-02 76 Elaeis 1 Euterpe 6 Mauritia 69 PRN-01 199 Astrocaryum 3 Euterpe 33 Mauritia 109 Mauritiella 14 Oenocarpus 6 Socratea 34 QUI-01 203 Euterpe 1 Mauritia 89 Mauritiella 113 SAM-01 123 Attalea 16 Euterpe 1 Mauritia 103 Socratea 3 VEN-01 131 Euterpe 38 Mauritia 71 Oenocarpus 1 Socratea 21 VEN-02 267 Euterpe 37 Mauritia 184 Mauritiella 3 Oenocarpus 2 Socratea 41 VEN-03 196 Euterpe 5 Mauritia 180 Mauritiella 11 VEN-04 221 Mauritia 129 Mauritiella 92 VEN-05 138 Mauritia 86 Mauritiella 52 Grand Total 2217
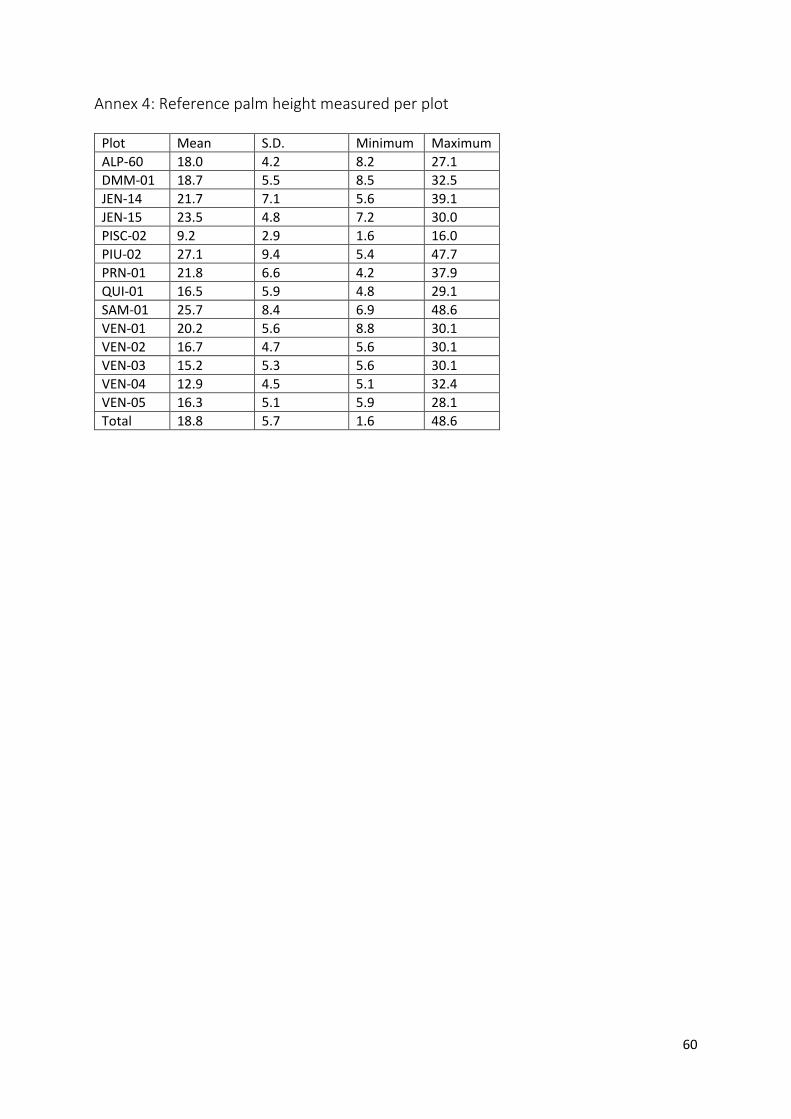
60
Annex 4: Reference palm height measured per plot
Plot Mean S.D. Minimum Maximum ALP-60 18.0 4.2 8.2 27.1 DMM-01 18.7 5.5 8.5 32.5 JEN-14 21.7 7.1 5.6 39.1 JEN-15 23.5 4.8 7.2 30.0 PISC-02 9.2 2.9 1.6 16.0 PIU-02 27.1 9.4 5.4 47.7 PRN-01 21.8 6.6 4.2 37.9 QUI-01 16.5 5.9 4.8 29.1 SAM-01 25.7 8.4 6.9 48.6 VEN-01 20.2 5.6 8.8 30.1 VEN-02 16.7 4.7 5.6 30.1 VEN-03 15.2 5.3 5.6 30.1 VEN-04 12.9 4.5 5.1 32.4 VEN-05 16.3 5.1 5.9 28.1 Total 18.8 5.7 1.6 48.6
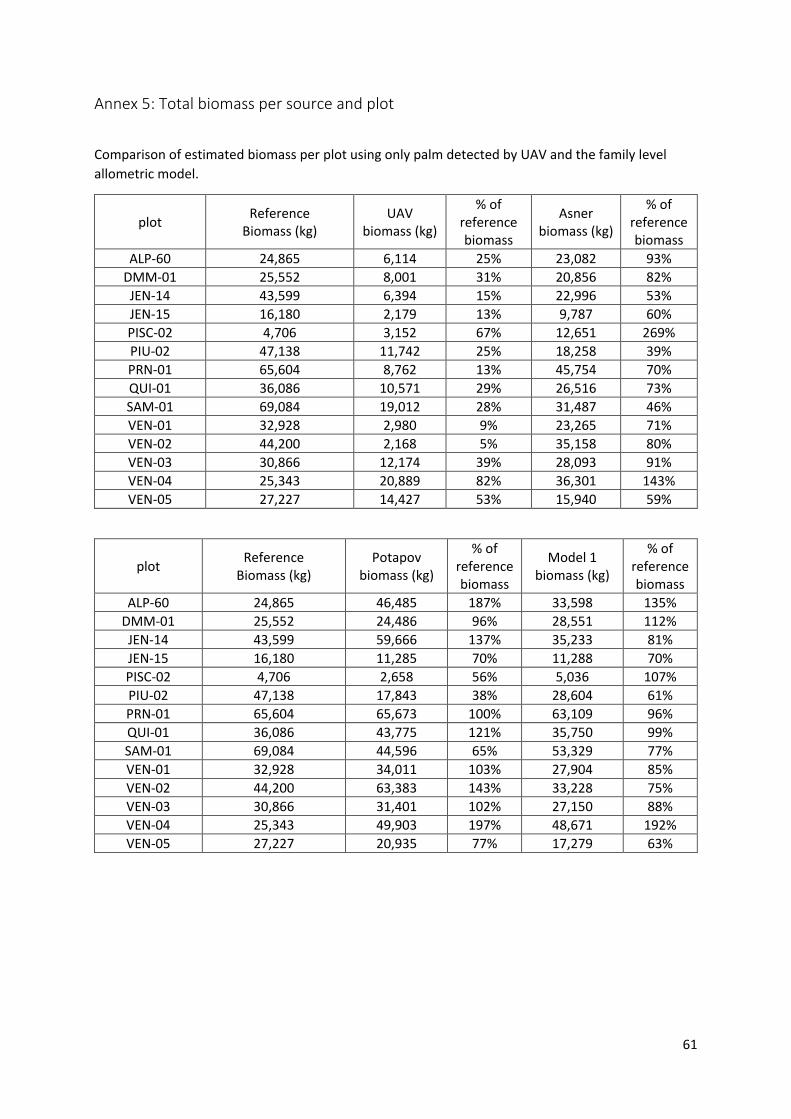
61
Annex 5: Total biomass per source and plot
Comparison of estimated biomass per plot using only palm detected by UAV and the family level allometric model.
plot Reference Biomass (kg)
UAV biomass (kg)
% of reference biomass
Asner biomass (kg)
% of reference biomass
ALP-60 24,865 6,114 25% 23,082 93% DMM-01 25,552 8,001 31% 20,856 82% JEN-14 43,599 6,394 15% 22,996 53% JEN-15 16,180 2,179 13% 9,787 60% PISC-02 4,706 3,152 67% 12,651 269% PIU-02 47,138 11,742 25% 18,258 39% PRN-01 65,604 8,762 13% 45,754 70% QUI-01 36,086 10,571 29% 26,516 73% SAM-01 69,084 19,012 28% 31,487 46% VEN-01 32,928 2,980 9% 23,265 71% VEN-02 44,200 2,168 5% 35,158 80% VEN-03 30,866 12,174 39% 28,093 91% VEN-04 25,343 20,889 82% 36,301 143% VEN-05 27,227 14,427 53% 15,940 59%
plot Reference Biomass (kg)
Potapov biomass (kg)
% of reference biomass
Model 1 biomass (kg)
% of reference biomass
ALP-60 24,865 46,485 187% 33,598 135% DMM-01 25,552 24,486 96% 28,551 112% JEN-14 43,599 59,666 137% 35,233 81% JEN-15 16,180 11,285 70% 11,288 70% PISC-02 4,706 2,658 56% 5,036 107% PIU-02 47,138 17,843 38% 28,604 61% PRN-01 65,604 65,673 100% 63,109 96% QUI-01 36,086 43,775 121% 35,750 99% SAM-01 69,084 44,596 65% 53,329 77% VEN-01 32,928 34,011 103% 27,904 85% VEN-02 44,200 63,383 143% 33,228 75% VEN-03 30,866 31,401 102% 27,150 88% VEN-04 25,343 49,903 197% 48,671 192% VEN-05 27,227 20,935 77% 17,279 63%
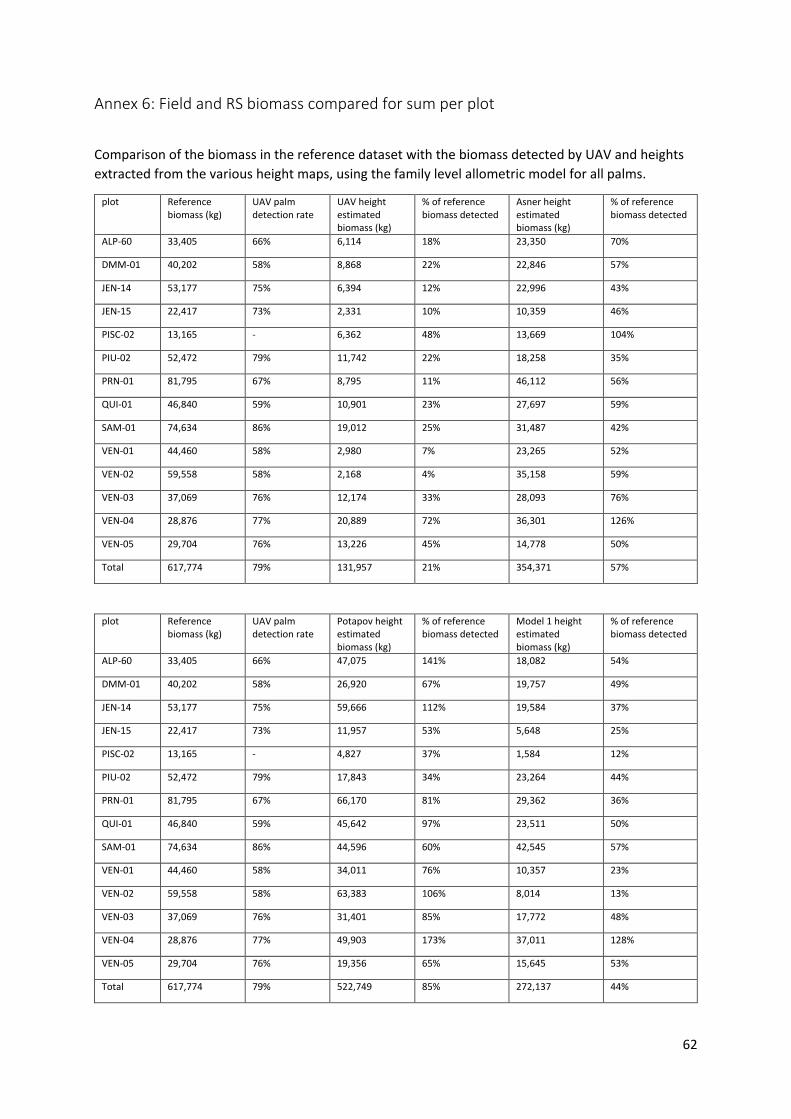
62
Annex 6: Field and RS biomass compared for sum per plot
Comparison of the biomass in the reference dataset with the biomass detected by UAV and heights extracted from the various height maps, using the family level allometric model for all palms.
plot Reference biomass (kg)
UAV palm detection rate
UAV height estimated biomass (kg)
% of reference biomass detected
Asner height estimated biomass (kg)
% of reference biomass detected
ALP-60 33,405 66% 6,114 18% 23,350 70%
DMM-01 40,202 58% 8,868 22% 22,846 57%
JEN-14 53,177 75% 6,394 12% 22,996 43%
JEN-15 22,417 73% 2,331 10% 10,359 46%
PISC-02 13,165 - 6,362 48% 13,669 104%
PIU-02 52,472 79% 11,742 22% 18,258 35%
PRN-01 81,795 67% 8,795 11% 46,112 56%
QUI-01 46,840 59% 10,901 23% 27,697 59%
SAM-01 74,634 86% 19,012 25% 31,487 42%
VEN-01 44,460 58% 2,980 7% 23,265 52%
VEN-02 59,558 58% 2,168 4% 35,158 59%
VEN-03 37,069 76% 12,174 33% 28,093 76%
VEN-04 28,876 77% 20,889 72% 36,301 126%
VEN-05 29,704 76% 13,226 45% 14,778 50%
Total 617,774 79% 131,957 21% 354,371 57%
plot Reference biomass (kg)
UAV palm detection rate
Potapov height estimated biomass (kg)
% of reference biomass detected
Model 1 height estimated biomass (kg)
% of reference biomass detected
ALP-60 33,405 66% 47,075 141% 18,082 54%
DMM-01 40,202 58% 26,920 67% 19,757 49%
JEN-14 53,177 75% 59,666 112% 19,584 37%
JEN-15 22,417 73% 11,957 53% 5,648 25%
PISC-02 13,165 - 4,827 37% 1,584 12%
PIU-02 52,472 79% 17,843 34% 23,264 44%
PRN-01 81,795 67% 66,170 81% 29,362 36%
QUI-01 46,840 59% 45,642 97% 23,511 50%
SAM-01 74,634 86% 44,596 60% 42,545 57%
VEN-01 44,460 58% 34,011 76% 10,357 23%
VEN-02 59,558 58% 63,383 106% 8,014 13%
VEN-03 37,069 76% 31,401 85% 17,772 48%
VEN-04 28,876 77% 49,903 173% 37,011 128%
VEN-05 29,704 76% 19,356 65% 15,645 53%
Total 617,774 79% 522,749 85% 272,137 44%