Towards a Generalized Biogeography of the Southern Ocean Benthos
16
ORIGINAL ARTICLE Towards a generalized biogeography of the Southern Ocean benthos Huw J. Griffiths*, David K. A. Barnes and Katrin Linse British Antarctic Survey, Natural Environmental Research Council, Cambridge, UK *Correspondence: Huw J. Griffiths, British Antarctic Survey, Natural Environmental Research Council, High Cross, Madingley Road, Cambridge CB3 0ET, UK. E-mail: [email protected] ABSTRACT Aim To investigate whether the biogeographical regions proposed by J. W. Hedgpeth and widely adopted by other authors hold true, are an oversimplification or with further data might show a unified Antarctic province. Location Southern Hemisphere. Methods The distributions of 1318 species of bivalves, 4656 species of gastropods, 1465 species of cheilostome and 167 species of cyclostome bryozoans were analysed for 29 regions in the Southern Hemisphere, including South American, South African, Tasmanian, New Zealand, sub-Antarctic and Antarctic regions. We present data on species richness, rates of endemism, patterns of radiation, faunal similarities and multivariate biogeographical analyses. Results The most striking pattern to emerge from our data set of species counts per region was a strong east–west hemispheric asymmetry, with high species numbers in New Zealand, Tasmania and South Africa and low numbers in South America. In contrast, no difference was found in richness between the east and west parts of the Southern Ocean. We compared findings in our model taxa with published data on ascidians, cephalopods and pycnogonids. Further evidence of strong faunal links between the Antarctic and South America is reported in this study, although we found little evidence for a biogeographical relationship between the Antarctic or South America and New Zealand/Tasmania. Strong evidence exists for a long-term influence of the Antarctic Circumpolar Current upon the distribution of Southern Ocean benthos. This is demonstrated by the reduced prevalence of South American species in the Antarctic and sub-Antarctic with increasing distance from South America in the direction of the current. Three of our four study taxa (bivalves, cheilostomes and cyclostomes) show the Southern Ocean as a ‘single functional unit’ with no evidence for a biogeographical split between east and west. Main conclusions Unlike the biogeographical schemes previously proposed, we show that biogeographical regions in the Southern Ocean differ depending upon the class of animals being considered. Despite this we suggest that some general rules are viable, including species endemism rates of around 50%, a single Antarctic province and a definite distinction between the sub-Antarctic islands influenced by South America and those of New Zealand. Keywords Antarctic, Bryozoa, continental shelf, continental slope, endemism, Magellanic, Mollusca, Pycnogonida, richness, zoogeography. Journal of Biogeography (J. Biogeogr.) (2009) 36, 162–177 162 www.blackwellpublishing.com/jbi ª 2008 British Antarctic Survey doi:10.1111/j.1365-2699.2008.01979.x Journal compilation ª 2008 Blackwell Publishing Ltd
-
Upload
antarctica -
Category
Documents
-
view
1 -
download
0
Transcript of Towards a Generalized Biogeography of the Southern Ocean Benthos

ORIGINALARTICLE
Towards a generalized biogeographyof the Southern Ocean benthos
Huw J. Griffiths*, David K. A. Barnes and Katrin Linse
British Antarctic Survey, Natural
Environmental Research Council, Cambridge,
UK
*Correspondence: Huw J. Griffiths, British
Antarctic Survey, Natural Environmental
Research Council, High Cross, Madingley Road,
Cambridge CB3 0ET, UK.
E-mail: [email protected]
ABSTRACT
Aim To investigate whether the biogeographical regions proposed by J. W.
Hedgpeth and widely adopted by other authors hold true, are an
oversimplification or with further data might show a unified Antarctic province.
Location Southern Hemisphere.
Methods The distributions of 1318 species of bivalves, 4656 species of
gastropods, 1465 species of cheilostome and 167 species of cyclostome
bryozoans were analysed for 29 regions in the Southern Hemisphere, including
South American, South African, Tasmanian, New Zealand, sub-Antarctic and
Antarctic regions. We present data on species richness, rates of endemism,
patterns of radiation, faunal similarities and multivariate biogeographical
analyses.
Results The most striking pattern to emerge from our data set of species counts
per region was a strong east–west hemispheric asymmetry, with high species
numbers in New Zealand, Tasmania and South Africa and low numbers in South
America. In contrast, no difference was found in richness between the east and
west parts of the Southern Ocean. We compared findings in our model taxa with
published data on ascidians, cephalopods and pycnogonids. Further evidence of
strong faunal links between the Antarctic and South America is reported in this
study, although we found little evidence for a biogeographical relationship
between the Antarctic or South America and New Zealand/Tasmania. Strong
evidence exists for a long-term influence of the Antarctic Circumpolar Current
upon the distribution of Southern Ocean benthos. This is demonstrated by the
reduced prevalence of South American species in the Antarctic and sub-Antarctic
with increasing distance from South America in the direction of the current.
Three of our four study taxa (bivalves, cheilostomes and cyclostomes) show the
Southern Ocean as a ‘single functional unit’ with no evidence for a
biogeographical split between east and west.
Main conclusions Unlike the biogeographical schemes previously proposed, we
show that biogeographical regions in the Southern Ocean differ depending upon
the class of animals being considered. Despite this we suggest that some general
rules are viable, including species endemism rates of around 50%, a single
Antarctic province and a definite distinction between the sub-Antarctic islands
influenced by South America and those of New Zealand.
Keywords
Antarctic, Bryozoa, continental shelf, continental slope, endemism, Magellanic,
Mollusca, Pycnogonida, richness, zoogeography.
Journal of Biogeography (J. Biogeogr.) (2009) 36, 162–177
162 www.blackwellpublishing.com/jbi ª 2008 British Antarctic Surveydoi:10.1111/j.1365-2699.2008.01979.x Journal compilation ª 2008 Blackwell Publishing Ltd
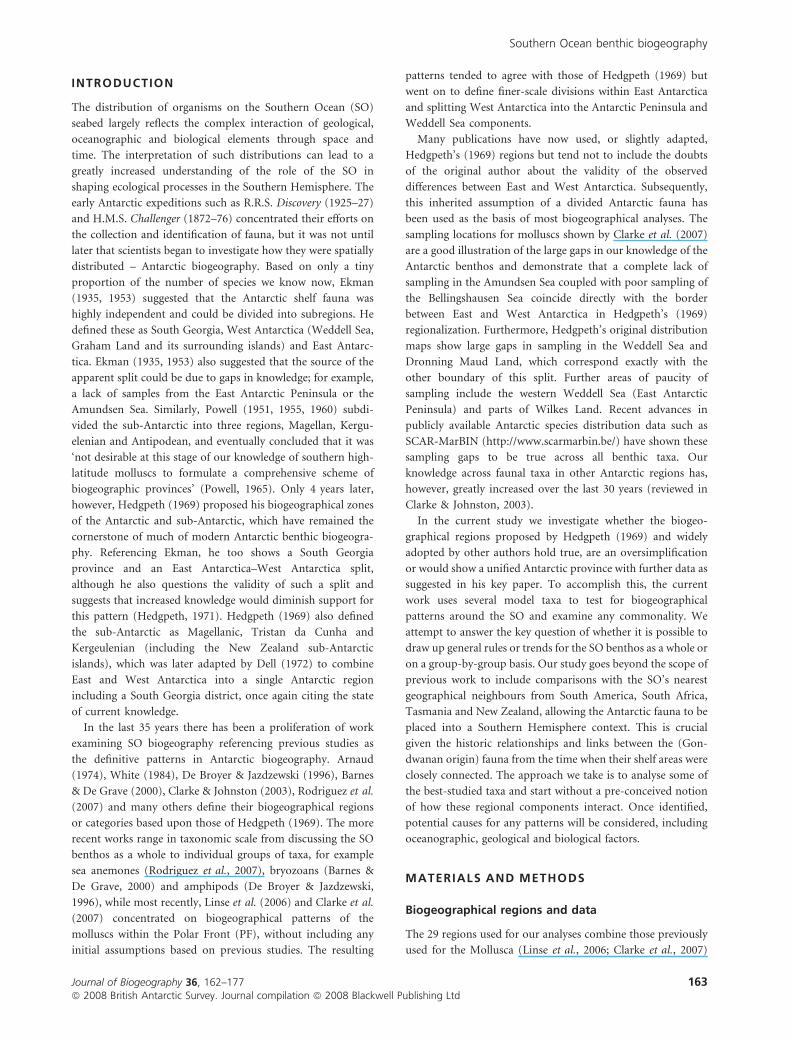
INTRODUCTION
The distribution of organisms on the Southern Ocean (SO)
seabed largely reflects the complex interaction of geological,
oceanographic and biological elements through space and
time. The interpretation of such distributions can lead to a
greatly increased understanding of the role of the SO in
shaping ecological processes in the Southern Hemisphere. The
early Antarctic expeditions such as R.R.S. Discovery (1925–27)
and H.M.S. Challenger (1872–76) concentrated their efforts on
the collection and identification of fauna, but it was not until
later that scientists began to investigate how they were spatially
distributed – Antarctic biogeography. Based on only a tiny
proportion of the number of species we know now, Ekman
(1935, 1953) suggested that the Antarctic shelf fauna was
highly independent and could be divided into subregions. He
defined these as South Georgia, West Antarctica (Weddell Sea,
Graham Land and its surrounding islands) and East Antarc-
tica. Ekman (1935, 1953) also suggested that the source of the
apparent split could be due to gaps in knowledge; for example,
a lack of samples from the East Antarctic Peninsula or the
Amundsen Sea. Similarly, Powell (1951, 1955, 1960) subdi-
vided the sub-Antarctic into three regions, Magellan, Kergu-
elenian and Antipodean, and eventually concluded that it was
‘not desirable at this stage of our knowledge of southern high-
latitude molluscs to formulate a comprehensive scheme of
biogeographic provinces’ (Powell, 1965). Only 4 years later,
however, Hedgpeth (1969) proposed his biogeographical zones
of the Antarctic and sub-Antarctic, which have remained the
cornerstone of much of modern Antarctic benthic biogeogra-
phy. Referencing Ekman, he too shows a South Georgia
province and an East Antarctica–West Antarctica split,
although he also questions the validity of such a split and
suggests that increased knowledge would diminish support for
this pattern (Hedgpeth, 1971). Hedgpeth (1969) also defined
the sub-Antarctic as Magellanic, Tristan da Cunha and
Kergeulenian (including the New Zealand sub-Antarctic
islands), which was later adapted by Dell (1972) to combine
East and West Antarctica into a single Antarctic region
including a South Georgia district, once again citing the state
of current knowledge.
In the last 35 years there has been a proliferation of work
examining SO biogeography referencing previous studies as
the definitive patterns in Antarctic biogeography. Arnaud
(1974), White (1984), De Broyer & Jazdzewski (1996), Barnes
& De Grave (2000), Clarke & Johnston (2003), Rodriguez et al.
(2007) and many others define their biogeographical regions
or categories based upon those of Hedgpeth (1969). The more
recent works range in taxonomic scale from discussing the SO
benthos as a whole to individual groups of taxa, for example
sea anemones (Rodriguez et al., 2007), bryozoans (Barnes &
De Grave, 2000) and amphipods (De Broyer & Jazdzewski,
1996), while most recently, Linse et al. (2006) and Clarke et al.
(2007) concentrated on biogeographical patterns of the
molluscs within the Polar Front (PF), without including any
initial assumptions based on previous studies. The resulting
patterns tended to agree with those of Hedgpeth (1969) but
went on to define finer-scale divisions within East Antarctica
and splitting West Antarctica into the Antarctic Peninsula and
Weddell Sea components.
Many publications have now used, or slightly adapted,
Hedgpeth’s (1969) regions but tend not to include the doubts
of the original author about the validity of the observed
differences between East and West Antarctica. Subsequently,
this inherited assumption of a divided Antarctic fauna has
been used as the basis of most biogeographical analyses. The
sampling locations for molluscs shown by Clarke et al. (2007)
are a good illustration of the large gaps in our knowledge of the
Antarctic benthos and demonstrate that a complete lack of
sampling in the Amundsen Sea coupled with poor sampling of
the Bellingshausen Sea coincide directly with the border
between East and West Antarctica in Hedgpeth’s (1969)
regionalization. Furthermore, Hedgpeth’s original distribution
maps show large gaps in sampling in the Weddell Sea and
Dronning Maud Land, which correspond exactly with the
other boundary of this split. Further areas of paucity of
sampling include the western Weddell Sea (East Antarctic
Peninsula) and parts of Wilkes Land. Recent advances in
publicly available Antarctic species distribution data such as
SCAR-MarBIN (http://www.scarmarbin.be/) have shown these
sampling gaps to be true across all benthic taxa. Our
knowledge across faunal taxa in other Antarctic regions has,
however, greatly increased over the last 30 years (reviewed in
Clarke & Johnston, 2003).
In the current study we investigate whether the biogeo-
graphical regions proposed by Hedgpeth (1969) and widely
adopted by other authors hold true, are an oversimplification
or would show a unified Antarctic province with further data as
suggested in his key paper. To accomplish this, the current
work uses several model taxa to test for biogeographical
patterns around the SO and examine any commonality. We
attempt to answer the key question of whether it is possible to
draw up general rules or trends for the SO benthos as a whole or
on a group-by-group basis. Our study goes beyond the scope of
previous work to include comparisons with the SO’s nearest
geographical neighbours from South America, South Africa,
Tasmania and New Zealand, allowing the Antarctic fauna to be
placed into a Southern Hemisphere context. This is crucial
given the historic relationships and links between the (Gon-
dwanan origin) fauna from the time when their shelf areas were
closely connected. The approach we take is to analyse some of
the best-studied taxa and start without a pre-conceived notion
of how these regional components interact. Once identified,
potential causes for any patterns will be considered, including
oceanographic, geological and biological factors.
MATERIALS AND METHODS
Biogeographical regions and data
The 29 regions used for our analyses combine those previously
used for the Mollusca (Linse et al., 2006; Clarke et al., 2007)
Southern Ocean benthic biogeography
Journal of Biogeography 36, 162–177 163ª 2008 British Antarctic Survey. Journal compilation ª 2008 Blackwell Publishing Ltd

and for the Bryozoa (Barnes & Griffiths, 2008) in recent
biogeographical studies. The data within these regions include
the most recent record updates to SOMBASE (the Southern
Ocean Mollusc Database, Griffiths et al., 2003). For this
comparative study new regions were added for the molluscs,
including South Africa (Costello et al., 2007), Tasmania (Grove
et al., 2006) and the Kermadec Islands (Spencer et al., 2002),
while the lists for New Zealand (Spencer et al., 2002) and
Southern Argentina (Rosenberg, 2005) were updated (Fig. 1).
The bathymetric range of the species occurrence records in
the regions has been modified to cover depths of 0–3000 m.
Some regions used in Linse et al. (2006), Clarke et al. (2007)
and Barnes & Griffiths (2008) were merged to allow for
comparison between the molluscan and bryozoan data sets due
to differing regional boundaries between the data sets. The two
subregions of New Zealand used in Barnes & Griffiths (2008)
have become a single region. Data from the Bounty, Auckland,
Campbell and Macquarie islands were combined to form the
New Zealand sub-Antarctic Island region. The areas around
Antarctica between 45� and 170� E (Linse et al., 2006) were
combined to form a single East Antarctic region. We refer to all
regions within the PF (Fig. 1) as Antarctic. The term Southern
Ocean is used when referring to the Antarctic and the sub-
Antarctic islands, outside, but close to and influenced by, the
PF, e.g. the Prince Edward Islands, Crozet Islands and
Kerguelen Islands.
For each of our designated regions, the area of seafloor
shallower than 3000 m was calculated to analyse the effect of
regional size on the species richness (Table 1).
Taxon counts and endemism
The overall data set included occurrence data on species of two
molluscan classes, Bivalvia and Gastropoda, and two bryozoan
classes, Cyclostomata and Cheilostomata. When referring to
the gastropod molluscs only shelled species have been consid-
ered. The data set was queried to produce a list of species per
class per region, where each species was accounted for only
once regardless of how many times it was found within a
region; the same was done at the genus level for each of the
classes. The regional species and genera lists were used to
produce regional counts of taxa per class (Table 1) and the
regional species lists were also used to calculate regional
endemism rates. For the purposes of our investigation,
endemic species were those found only within a single region
(analysis included occurrences within the data base which fell
outside our defined regions, e.g. deeper than 3000 m). It is
appreciated that data have not been comprehensively included
for sites to the north of the South African and Kermadec
Islands regions (for all classes) and for Southern Argentina,
Southern Chile and Tasmania (for the Gastropoda and
Bivalvia). For these regions, therefore, species may have ranges
Figure 1 The 29 study regions in the Southern Hemisphere. A key to the study regions is included in the figure. Grey dotted line shows the
mean position of the Antarctic Polar Front (from Moore et al., 1999).
H. J. Griffiths et al.
164 Journal of Biogeography 36, 162–177ª 2008 British Antarctic Survey. Journal compilation ª 2008 Blackwell Publishing Ltd
that extend beyond these study areas and may not be truly
endemic, but are not shared between our study regions. From
the numbers of endemic species we produced a percentage of
the total number of species per region that were endemic
(Table 2) and this process was repeated twice, first combining
the Antarctic regions and second the SO regions.
We used the list of endemic species produced during the
previous analyses and counted how many of those species
occurred in each of the regions to measure the regional input
to the overall number of SO endemic species. This was
repeated for all four classes in the study. The proportion of SO
endemic species in each region was measured as a percentage
of the total number of species in the corresponding region.
Trends in percentages of each region made up of SO endemic
species with geography were tested using the Spearman rank
correlation coefficient (rs), calculated by ranking taxon data for
each region in terms of percentages and distance from South
America and then conducting a Pearson correlation between
the ranks.
Biogeographical patterns
Centres of radiation
The relative importance of each region to each genus was
measured and standardized to make genera of different sizes
(low vs. high number of species) comparable by calculating the
maximum number of species from that genus found in any
region. Only genera with three or more species in total were
selected. The total number of species from each genus per
region was calculated as a percentage of this maximum.
Regions showing the maximum number of species per genus
then all had a value of 100%.
primer analysis
The multivariate statistical software primer 5 (Clarke &
Warwick, 2001) was used to analyse faunal similarities between
regions by implementing the Bray–Curtis measure performed
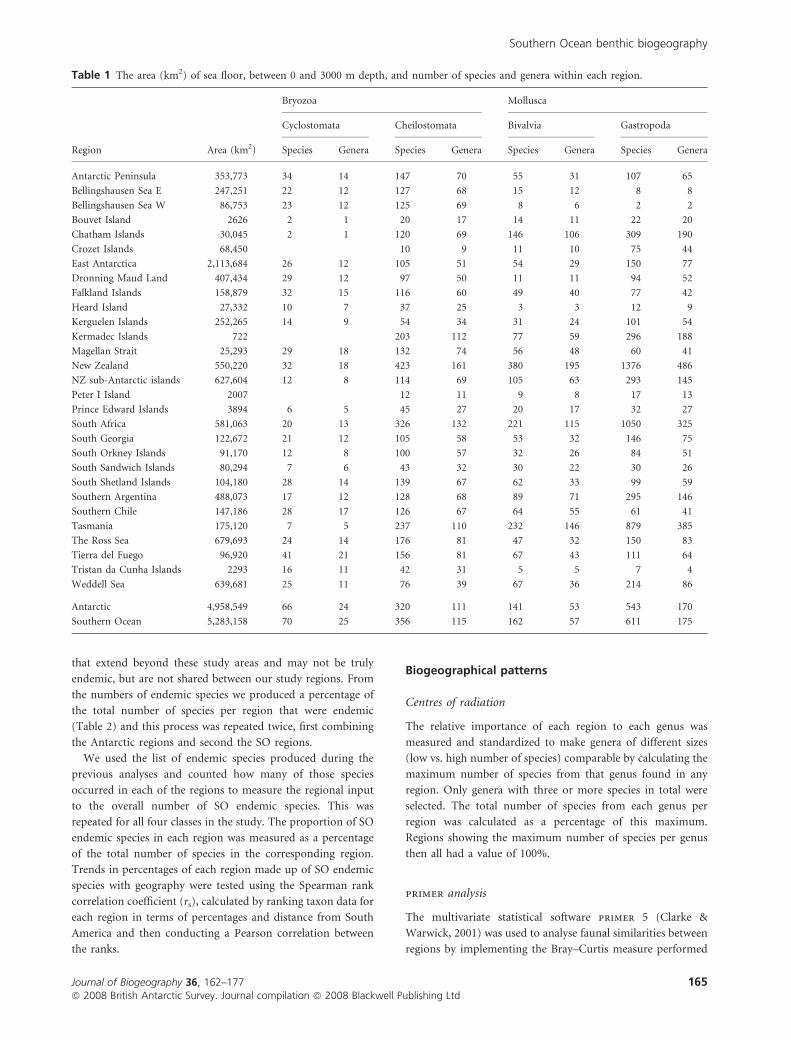
Table 1 The area (km2) of sea floor, between 0 and 3000 m depth, and number of species and genera within each region.
Bryozoa Mollusca
Cyclostomata Cheilostomata Bivalvia Gastropoda
Region Area (km2) Species Genera Species Genera Species Genera Species Genera
Antarctic Peninsula 353,773 34 14 147 70 55 31 107 65
Bellingshausen Sea E 247,251 22 12 127 68 15 12 8 8
Bellingshausen Sea W 86,753 23 12 125 69 8 6 2 2
Bouvet Island 2626 2 1 20 17 14 11 22 20
Chatham Islands 30,045 2 1 120 69 146 106 309 190
Crozet Islands 68,450 10 9 11 10 75 44
East Antarctica 2,113,684 26 12 105 51 54 29 150 77
Dronning Maud Land 407,434 29 12 97 50 11 11 94 52
Falkland Islands 158,879 32 15 116 60 49 40 77 42
Heard Island 27,332 10 7 37 25 3 3 12 9
Kerguelen Islands 252,265 14 9 54 34 31 24 101 54
Kermadec Islands 722 203 112 77 59 296 188
Magellan Strait 25,293 29 18 132 74 56 48 60 41
New Zealand 550,220 32 18 423 161 380 195 1376 486
NZ sub-Antarctic islands 627,604 12 8 114 69 105 63 293 145
Peter I Island 2007 12 11 9 8 17 13
Prince Edward Islands 3894 6 5 45 27 20 17 32 27
South Africa 581,063 20 13 326 132 221 115 1050 325
South Georgia 122,672 21 12 105 58 53 32 146 75
South Orkney Islands 91,170 12 8 100 57 32 26 84 51
South Sandwich Islands 80,294 7 6 43 32 30 22 30 26
South Shetland Islands 104,180 28 14 139 67 62 33 99 59
Southern Argentina 488,073 17 12 128 68 89 71 295 146
Southern Chile 147,186 28 17 126 67 64 55 61 41
Tasmania 175,120 7 5 237 110 232 146 879 385
The Ross Sea 679,693 24 14 176 81 47 32 150 83
Tierra del Fuego 96,920 41 21 156 81 67 43 111 64
Tristan da Cunha Islands 2293 16 11 42 31 5 5 7 4
Weddell Sea 639,681 25 11 76 39 67 36 214 86
Antarctic 4,958,549 66 24 320 111 141 53 543 170
Southern Ocean 5,283,158 70 25 356 115 162 57 611 175
Southern Ocean benthic biogeography
Journal of Biogeography 36, 162–177 165ª 2008 British Antarctic Survey. Journal compilation ª 2008 Blackwell Publishing Ltd

on non-transformed, species presence/absence data. The
similarity matrix was then used for cluster analysis, non-
metric multidimensional scaling (NMDS) and analysis of
similarities (ANOSIM) tests.
Percentage similarity
A matrix was created showing the number of shared species
between each of the regions, and was subsequently used to
produce a further matrix, giving the percentage of the total
species from each region shared with each of the other regions
(see Table S1 in Supporting Information). The resulting
percentage matrix shows the relationship between the regions
and the weighting of that relationship. For example, regions A
and B may share 20 species, constituting 80% of region A but
only 40% of region B, thus implying that the species in region
A are a subset of the species found in region B. Reading the
table as vertical columns shows the percentage shared from
that region’s total with each of the regions in the horizontal
rows. Any relationships showing a shared composition of 50%
or more were drawn on a map as directional arrows pointing
from the region being compared with (rows) towards the
region being considered (columns). Grouping these arrows
allows the identification of large-scale patterns of shared fauna
and areas of community overlap.
RESULTS
Taxon counts and endemism
Our study included geographical occurrence data for 1318
species of bivalves, 4656 species of gastropods, 1465 species of
cheilostomes and 167 species of cyclostomes. For all groups
other than the cyclostome bryozoans, New Zealand had the
highest recorded number of species and genera, followed by
Tasmania and South Africa (Table 1). Within Antarctic waters
the Weddell Sea was a hotspot of species richness for bivalves
(67 species, 36 genera) and gastropods (214 species, 86 genera),
Table 2 The percentage of endemic species per study class and region. Pycnogonid data are from Munilla (in press) and Cephalopoda data
are from Collins & Rodhouse (2006). The regions for which numbers may not reflect the true endemism levels as more northerly
distributions are not accounted for are South Africa and the Kermadec Islands (for all classes) and Southern Argentina, Southern Chile and
Tasmania (for the Gastropoda and Bivalvia).
Cyclostomata Cheilostomata Bivalvia Gastropoda Pycnogona Cephalopoda
Antarctic Peninsula 0.00 3.40 1.82 10.28
Bellingshausen Sea E 0.00 0.00 6.67 37.50
Bellingshausen Sea W 0.00 0.00 12.50 0.00
Bouvet Island 0.00 5.00 14.29 50.00
Chatham Islands 0.00 9.17 8.90 14.24
Crozet Islands 0.00 10.00 18.18 5.33
Dronning Maud Land 0.00 0.00 0.00 21.28
East Antarctica 0.00 2.86 11.11 13.33
Falkland Islands 12.50 4.31 10.20 22.08
Heard Island 0.00 8.11 0.00 0.00
Kerguelen Islands 0.00 3.70 22.58 15.84
Kermadec Islands 0.00 30.54 68.83 70.95
Magellan Strait 3.45 6.06 23.21 8.33
New Zealand 59.38 37.83 52.37 65.55
NZ sub-Antarctic islands 8.33 2.63 23.81 28.67
Peter I Island 0.00 0.00 0.00 11.76
Prince Edward Islands 16.67 11.11 25.00 12.50
South Africa 20.00 21.78 93.67 97.05
South Georgia 4.76 15.24 13.21 36.30
South Orkney Islands 0.00 2.00 0.00 25.00
South Sandwich Islands 0.00 0.00 6.67 26.67
South Shetland Islands 7.14 5.04 3.23 4.04
Southern Argentina 0.00 7.03 65.17 68.47
Southern Chile 10.71 19.84 32.81 29.51
Tasmania 0.00 2.11 93.10 93.29
The Ross Sea 4.17 5.11 0.00 16.00
Tierra del Fuego 9.76 12.18 28.36 18.02
Tristan da Cunha Islands 25.00 16.67 60.00 100.00
Weddell Sea 4.00 5.26 5.97 26.17
Antarctic 46.97 55.63 42.55 73.66 54.70 53.45
Southern Ocean 47.14 53.93 49.38 78.89 56.90 60.00
H. J. Griffiths et al.
166 Journal of Biogeography 36, 162–177ª 2008 British Antarctic Survey. Journal compilation ª 2008 Blackwell Publishing Ltd
while the largest numbers of cyclostomes (34 species, 14
genera) were found along the West Antarctic Peninsula and of
cheilostomes (176 species, 81 genera) in the Ross Sea. The
largest area in this study was the East Antarctic (over 2 million
km2), four times larger than the next largest region. Regions
such as New Zealand, the New Zealand sub-Antarctic islands,
South Africa, the Ross Sea and Weddell Sea are all of
comparable sizes, covering 550,000–650,000 km2. Smaller
island groups and islands cover less than 100,000 km2 and
these areas tended to have the smallest numbers of recorded
species, e.g. Bouvet and the Prince Edward Islands. The
Kermadec Islands, the smallest area included in the study,
showed above average species numbers for the three groups for
which data were available. The relationship between area and
species numbers for the Gastropoda and Cheilostomata was
significant (ANOVA associated with regression: all F1 > 4.6,
P < 0.05); for the Bivalvia this relationship was not significant
(F1 < 7.7, P � 0.05), but was strongly suggestive of an
increasing trend; and for the Cyclostomata there was no clear
relationship (F1 < 4.1, P > 0.05).
The large number of species in New Zealand is also reflected
in its large numbers of species not shared with the other
regions, ranging between 37% and 65% for the different classes
(Table 2), a finding that was also true, to a lesser extent, for the
other northern regions. In contrast, the number of endemic
species (unique to one region) was much lower in regions
within the SO. Remote islands such as the Prince Edward
Islands (11–25%) and the Tristan da Cunha Islands (17–100%)
show high levels of endemic species.
Within the PF, only the Gastropoda showed any regional
endemism, with two geographical exceptions: South Georgia
and the Weddell Sea, both with relatively high rates of
endemism for all four classes. Of all the Antarctic regions,
Bouvet Island showed the highest levels of endemism for both
the Gastropoda (50%) and the Bivalvia (14%). No gastropods,
bivalves or cyclostomes and only c. 8% of cheilostomes
recorded from Heard Island were endemic. Comparison of the
percentage of endemism between the four study classes and,
based on literature data, the pycnogonids and cephalopods,
showed that combining the Antarctic regions into one larger
region dramatically increased the percentage of endemism.
Most rates of Antarctic species endemism ranged between
c. 43% (bivalves) and c. 56% (cheilostomes) with the exception
of the gastropods which showed relatively high endemism at
c. 74%. The percentage endemism for the larger SO zone
(Antarctic and sub-Antarctic Islands) showed the same pattern
as for the Antarctic, with most regions increasing by between
< 1% and > 6%; however, the percentage for the cheilostomes
actually decreased slightly. Once again, Gastropoda (79%)
showed a far higher percentage endemism, almost 19% greater
than the next highest taxon, the Cephalopoda (60%).
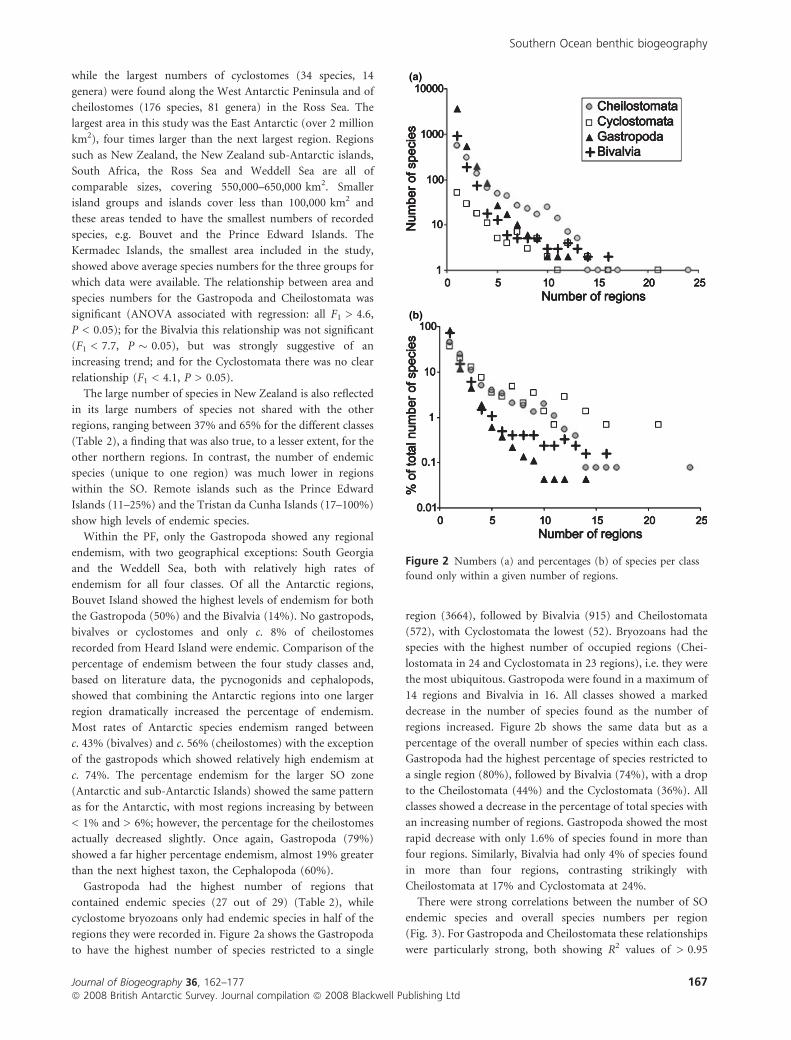
Gastropoda had the highest number of regions that
contained endemic species (27 out of 29) (Table 2), while
cyclostome bryozoans only had endemic species in half of the
regions they were recorded in. Figure 2a shows the Gastropoda
to have the highest number of species restricted to a single
region (3664), followed by Bivalvia (915) and Cheilostomata
(572), with Cyclostomata the lowest (52). Bryozoans had the
species with the highest number of occupied regions (Chei-
lostomata in 24 and Cyclostomata in 23 regions), i.e. they were
the most ubiquitous. Gastropoda were found in a maximum of
14 regions and Bivalvia in 16. All classes showed a marked
decrease in the number of species found as the number of
regions increased. Figure 2b shows the same data but as a
percentage of the overall number of species within each class.
Gastropoda had the highest percentage of species restricted to
a single region (80%), followed by Bivalvia (74%), with a drop
to the Cheilostomata (44%) and the Cyclostomata (36%). All
classes showed a decrease in the percentage of total species with
an increasing number of regions. Gastropoda showed the most
rapid decrease with only 1.6% of species found in more than
four regions. Similarly, Bivalvia had only 4% of species found
in more than four regions, contrasting strikingly with
Cheilostomata at 17% and Cyclostomata at 24%.
There were strong correlations between the number of SO
endemic species and overall species numbers per region
(Fig. 3). For Gastropoda and Cheilostomata these relationships
were particularly strong, both showing R2 values of > 0.95
(a)
(b)
Figure 2 Numbers (a) and percentages (b) of species per class
found only within a given number of regions.
Southern Ocean benthic biogeography
Journal of Biogeography 36, 162–177 167ª 2008 British Antarctic Survey. Journal compilation ª 2008 Blackwell Publishing Ltd
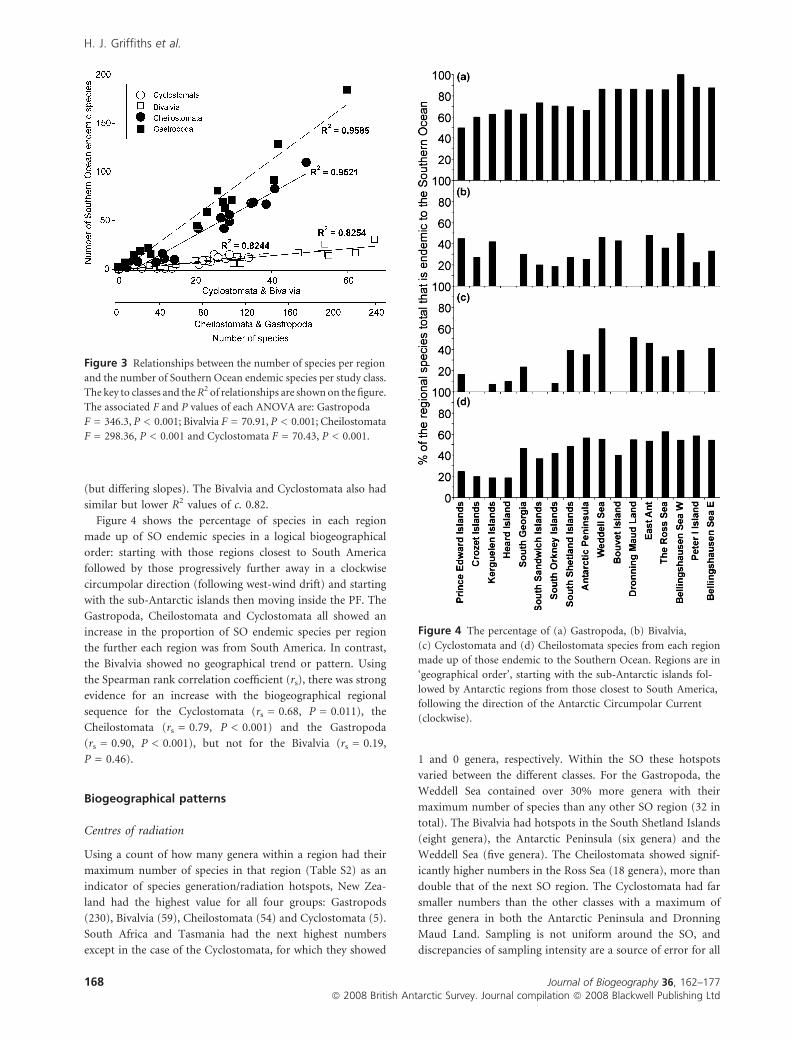
(but differing slopes). The Bivalvia and Cyclostomata also had
similar but lower R2 values of c. 0.82.
Figure 4 shows the percentage of species in each region
made up of SO endemic species in a logical biogeographical
order: starting with those regions closest to South America
followed by those progressively further away in a clockwise
circumpolar direction (following west-wind drift) and starting
with the sub-Antarctic islands then moving inside the PF. The
Gastropoda, Cheilostomata and Cyclostomata all showed an
increase in the proportion of SO endemic species per region
the further each region was from South America. In contrast,
the Bivalvia showed no geographical trend or pattern. Using
the Spearman rank correlation coefficient (rs), there was strong
evidence for an increase with the biogeographical regional
sequence for the Cyclostomata (rs = 0.68, P = 0.011), the
Cheilostomata (rs = 0.79, P < 0.001) and the Gastropoda
(rs = 0.90, P < 0.001), but not for the Bivalvia (rs = 0.19,
P = 0.46).
Biogeographical patterns
Centres of radiation
Using a count of how many genera within a region had their
maximum number of species in that region (Table S2) as an
indicator of species generation/radiation hotspots, New Zea-
land had the highest value for all four groups: Gastropods
(230), Bivalvia (59), Cheilostomata (54) and Cyclostomata (5).
South Africa and Tasmania had the next highest numbers
except in the case of the Cyclostomata, for which they showed
1 and 0 genera, respectively. Within the SO these hotspots
varied between the different classes. For the Gastropoda, the
Weddell Sea contained over 30% more genera with their
maximum number of species than any other SO region (32 in
total). The Bivalvia had hotspots in the South Shetland Islands
(eight genera), the Antarctic Peninsula (six genera) and the
Weddell Sea (five genera). The Cheilostomata showed signif-
icantly higher numbers in the Ross Sea (18 genera), more than
double that of the next SO region. The Cyclostomata had far
smaller numbers than the other classes with a maximum of
three genera in both the Antarctic Peninsula and Dronning
Maud Land. Sampling is not uniform around the SO, and
discrepancies of sampling intensity are a source of error for all
Figure 3 Relationships between the number of species per region
and the number of Southern Ocean endemic species per study class.
The key to classes and the R2 of relationships are shown on the figure.
The associated F and P values of each ANOVA are: Gastropoda
F = 346.3, P < 0.001; Bivalvia F = 70.91, P < 0.001; Cheilostomata
F = 298.36, P < 0.001 and Cyclostomata F = 70.43, P < 0.001.
Figure 4 The percentage of (a) Gastropoda, (b) Bivalvia,
(c) Cyclostomata and (d) Cheilostomata species from each region
made up of those endemic to the Southern Ocean. Regions are in
‘geographical order’, starting with the sub-Antarctic islands fol-
lowed by Antarctic regions from those closest to South America,
following the direction of the Antarctic Circumpolar Current
(clockwise).
H. J. Griffiths et al.
168 Journal of Biogeography 36, 162–177ª 2008 British Antarctic Survey. Journal compilation ª 2008 Blackwell Publishing Ltd
works on biogeography; these are addressed in Clarke et al.
(2007) and are not discussed further in the current study.
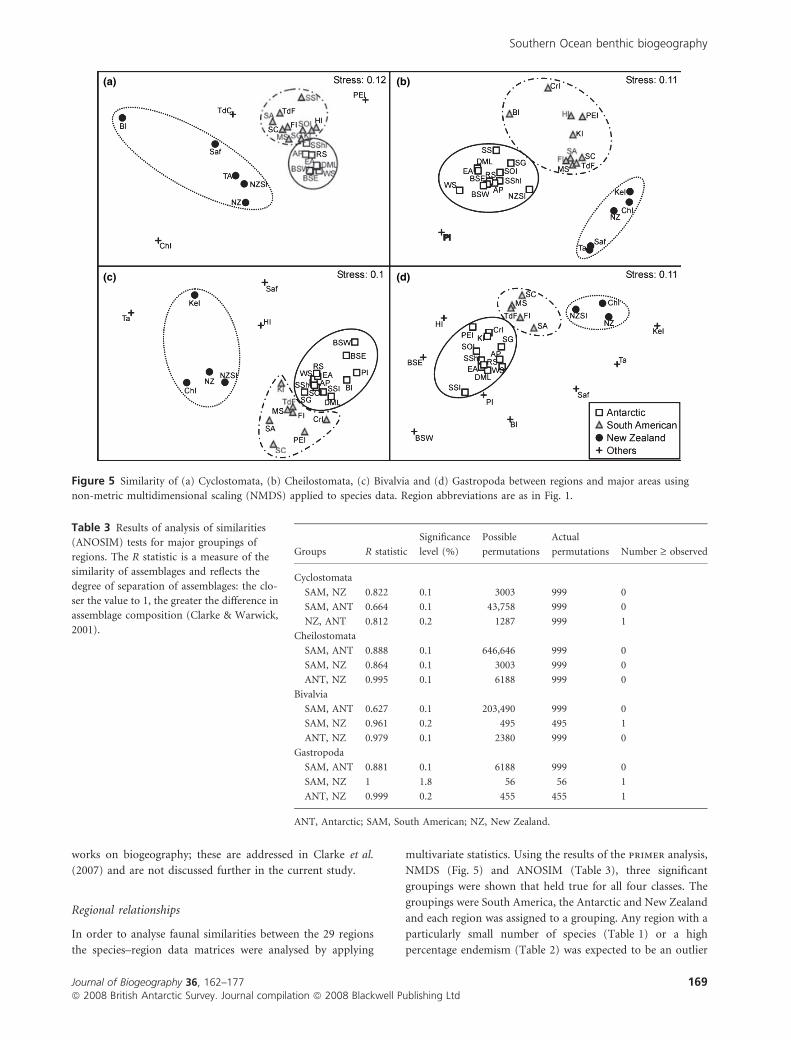
Regional relationships
In order to analyse faunal similarities between the 29 regions
the species–region data matrices were analysed by applying
multivariate statistics. Using the results of the primer analysis,
NMDS (Fig. 5) and ANOSIM (Table 3), three significant
groupings were shown that held true for all four classes. The
groupings were South America, the Antarctic and New Zealand
and each region was assigned to a grouping. Any region with a
particularly small number of species (Table 1) or a high
percentage endemism (Table 2) was expected to be an outlier
(a) (b)
(c) (d)
Figure 5 Similarity of (a) Cyclostomata, (b) Cheilostomata, (c) Bivalvia and (d) Gastropoda between regions and major areas using
non-metric multidimensional scaling (NMDS) applied to species data. Region abbreviations are as in Fig. 1.
Table 3 Results of analysis of similarities
(ANOSIM) tests for major groupings of
regions. The R statistic is a measure of the
similarity of assemblages and reflects the
degree of separation of assemblages: the clo-
ser the value to 1, the greater the difference in
assemblage composition (Clarke & Warwick,
2001).
Groups R statistic
Significance
level (%)
Possible
permutations
Actual
permutations Number ‡ observed
Cyclostomata
SAM, NZ 0.822 0.1 3003 999 0
SAM, ANT 0.664 0.1 43,758 999 0
NZ, ANT 0.812 0.2 1287 999 1
Cheilostomata
SAM, ANT 0.888 0.1 646,646 999 0
SAM, NZ 0.864 0.1 3003 999 0
ANT, NZ 0.995 0.1 6188 999 0
Bivalvia
SAM, ANT 0.627 0.1 203,490 999 0
SAM, NZ 0.961 0.2 495 495 1
ANT, NZ 0.979 0.1 2380 999 0
Gastropoda
SAM, ANT 0.881 0.1 6188 999 0
SAM, NZ 1 1.8 56 56 1
ANT, NZ 0.999 0.2 455 455 1
ANT, Antarctic; SAM, South American; NZ, New Zealand.
Southern Ocean benthic biogeography
Journal of Biogeography 36, 162–177 169ª 2008 British Antarctic Survey. Journal compilation ª 2008 Blackwell Publishing Ltd

and was assigned to the ‘Others’ group (Table S3). The Tristan
da Cunha Islands were judged to be different enough from all
other regions (except in the case of the Cyclostomata) that they
were not included in this analysis. The results of the cluster
analysis (not shown) indicated that for each of the different
classes, some regions, usually islands, showed affinities with
different major groupings (Table S3). Bouvet Island showed
most variation, as the fauna there had differing affinities in all
four possible different groups. Kerguelen, Crozet and the
Prince Edward Islands showed a South American ‘signature’
for most classes, except for the Gastropoda for which they were
classed as Antarctic. The Antarctic islands of South Georgia,
Heard Island, South Orkneys and South Sandwich Islands all
grouped with South America for the Cyclostomata data. The
sub-Antarctic islands of New Zealand grouped with New
Zealand except in the case of the Cheilostomata, for which they
grouped with the Antarctic. The ANOSIM tests (Table 3)
showed that these groupings (South America, the Antarctic
and New Zealand) were statistically strong, with eight results
showing a P-value of less than 0.1%, indicating a significant
difference between the large-scale groupings. A further three
results had a P-value of 0.2%, indicating that the groupings
were strong and significant with a slight increase in the
probability of a type 1 error. The test between New Zealand
and South America for the Gastropoda had a P-value of 1.8%
and a small number of permutations, indicating that the
groupings cannot be distinguished statistically despite being
relatively far apart on the NMDS plot (Fig. 5).
Faunal provinces
Matrices of percentage similarity between the 29 regions for
each of the four classes were used to produce groupings of
regions based upon a 50% or greater similarity level
(Table S1). Mapping the grouped regions identified a total of
six different zones that were not represented by the large-scale
faunal patterns in the bryozoan and molluscan study taxa
(Fig. 6). For comparison, faunal patterns based on biogeo-
graphical data for the Pycnogonida (Munilla, in press) were
displayed in the same way (Fig. 6d). The resulting large-scale
patterns show both similarities and differences between classes.
With the exception of the Gastropoda, all groups show the
Antarctic regions to cluster discretely. The Gastropoda data for
the Antarctic were split between East and West Antarctica,
with areas of overlap in the Weddell and Bellingshausen seas.
New Zealand was not shown to strongly interact or overlap
with the Antarctic or South America for any of our example
classes, and only interacted with South Africa and Tasmania in
the case of the Cyclostomata. The sub-Antarctic islands were
separate groupings for the Pycnogonida and Gastropoda, a
subset of South America for the Cheilostomata, and combi-
nation of Antarctic and South American for the Cyclostomata
(a) (b) (c)
(d) (e)
Figure 6 Large-scale faunal patterns in (a) Cheilostomata, (b) Cyclostomata, (c) Bivalvia, (d) Pycnogonida and (e) Gastropoda. The
patterns are based upon regions being grouped at a 50%, or greater, sharing of species. The key to patterns is included in the figure.
H. J. Griffiths et al.
170 Journal of Biogeography 36, 162–177ª 2008 British Antarctic Survey. Journal compilation ª 2008 Blackwell Publishing Ltd
and Bivalvia. The regional data for South America showed no
interaction with that of the Antarctic for the Gastropoda,
Pycnogonida or Cheilostomata but did show regions of
overlap with islands within and outside the PF for the
Cyclostomata and Bivalvia. Bouvet Island, well within the PF,
had a strong affinity with South Africa for the Cyclostomata.
DISCUSSION
Patterns in southern polar and temperate shelf
richness
The description and underlying causes of a supposed global
latitudinal gradient in species richness generated considerable
ecological discussion throughout the latter half of the last
century. Research in the marine realm in the last decade has
increasingly exposed asymmetry in biodiversity and biogeog-
raphy between the Northern and Southern hemispheres
(Crame, 2000; Valdovinos et al., 2003; Chown et al., 2004;
Barnes & Griffiths, 2008), and these studies, amongst others,
have shown that a strong component of the Northern
Hemisphere/Southern Hemisphere asymmetry is high south-
ern polar richness. The current study focused on the organi-
zation of southern polar richness in several model taxa at
species and genus levels. We show that the most striking
broad-scale patterns to emerge from species counts (of model
taxa) per region are a strong east–west hemispheric asymme-
try, also noted by Crame (2000) and Gray (2001). In bivalve
and gastropod molluscs and cheilostome bryozoans, richness
was typically low within the SO compared with Indo-West
Pacific areas immediately to its north. In our model taxa the
South American regions have a similar or even smaller number
of species to those within the SO, far lower than those regions
found in the Indian and western Pacific Oceans. In contrast to
temperate and tropical regions, the SO shows no sign of this
east–west disparity, possibly due to the homogenizing effect of
the Antarctic Circumpolar Current (ACC) and relatively
uniform water temperatures and physical conditions (Arntz
et al., 1994) or the continuous coastline and continental shelf
around all latitudes. Only the cyclostome bryozoans, the most
poorly studied of our model taxa, showed a relatively uniform
distribution, with no obvious effect of latitude or geography.
In striking contrast to other taxa reported to date, the highest
richness of cyclostomes was in South America and the
Antarctic Peninsula.
Species richness typically increases with geographical area
and decreases with isolation (MacArthur & Wilson, 1967).
Although the number of species in this study did increase with
increasing geographical area (Table 1), this was less extreme in
the South American and SO regions than in the more diverse
Eastern Hemisphere regions. The Kermadec Islands, despite
being the smallest of our described regions, had significantly
more recorded species than all but one of the South American
and the SO regions, which are between c. 3 and c. 3000 times
greater in area, respectively. It seems likely that this is explained
by the Kermadec Islands being close to the Wallacean
biodiversity hotspot of the Indo-West Pacific (Roberts et al.,
2002). In contrast the ‘New Zealand sub-Antarctic islands’
region gives smaller numbers of species than expected for its
apparent size due to the large area of open ocean between the
widely dispersed and relatively small islands; however, most
sampling has been concentrated in close proximity to the land.
The relatively even distribution of species around the SO means
that the East Antarctic region, with its vast area and similar
number of species to smaller, neighbouring regions, does not
appear to fit the rule. The degree to which this reflects sampling
intensity is unclear, but the seas around New Zealand sub-
Antarctic islands and especially East Antarctica are amongst the
more poorly studied.
For our model taxa, and others (e.g. brachiopods; see Walsh,
1996), the seas around New Zealand are very rich. New
Zealand’s shelf has many factors that should promote such
richness, including its geographical proximity to the Indo-
West Pacific diversity hotspot. It has a complex geological
history with a wide range of rock types and ages (Cooper &
Millener, 1993; Swenson et al., 2001) and spans a wide
latitudinal range; factors which tend to increase the number
of niches for its size. Such factors, coupled with New Zealand
having broken away from Gondwana far earlier than the other
study areas at c. 100 Ma (Weaver et al., 1994), make it less
surprising that it has a rich and endemic fauna. McDowall
(2004) suggests that, like the region, the biota of New Zealand
has a highly complex origin, including both the vicariant
speciation of an ancient Gondwanan fauna and the more
recent dispersal from neighbouring Australia. Antarctica and
the SO have long been considered highly isolated due to the
ACC and the PF (but see Clarke et al., 2005) but levels of
regional endemism for our study taxa within these areas are
uniformly lower than found in New Zealand. The simplest
explanation could be that the high endemism of New Zealand
is expected, given its high levels of richness and the strong
relationship between endemism and richness (e.g. Tilbrook &
De Grave, 2005).
Patterns of endemism
High endemism is typically associated with localities old
enough for taxa to have evolved there but isolated enough that
they have not spread elsewhere. In the sea this becomes
complicated by the ability of some propagules to travel
considerable distances, in extreme cases across oceans (Schel-
tema, 1971). Of our model taxa, few bryozoans have plank-
totrophic larvae (which can disperse widely) and at high
latitudes the same is true for gastropod and bivalve molluscs
(Thorson’s rule; see Mileikovsky, 1971). Gastropod molluscs
tend to have particularly high levels of ecological and
geographical endemism (and richness) at isolated localities
(e.g. Bouchet et al., 2002). Our data showed this also holds
true around the Antarctic, with the gastropods having the
highest richness of our model taxa and being the only class to
show any significant regional endemism. South Georgia was
notably rich in endemics, across all studied taxa, and this may
Southern Ocean benthic biogeography
Journal of Biogeography 36, 162–177 171ª 2008 British Antarctic Survey. Journal compilation ª 2008 Blackwell Publishing Ltd

be explained in a similar way to the richness around New
Zealand. Although South Georgia may be isolated now, it was
close to South America just 10 Ma and it is both old and large.
Surprisingly, young Bouvet Island (c. 1.39 Ma) (Engleskjon &
Jørgensen, 1986) showed the highest levels of endemism for the
molluscs within the Antarctic. Linse (2006) found that many of
this small, remote island’s mollusc species had strong connec-
tivity with the deep sea and this apparently high level of
molluscan endemism may reflect a paucity of sampling of the
surrounding deep water, the probable source of much of the
island’s shelf fauna. Heard Island, another remote island
within the PF, displayed unusually low rates of endemism, with
only the Cheilostomata showing any endemic species at all; we
suggest this is due to the continuity of shelf connections of the
Kerguelen Plateau between Heard Island and the Kerguelen
Islands. The majority of species of our studied taxa found at
Heard Island are also recorded at the Kerguelen Islands, a
biogeographical oddity as these islands lie either side of the PF
today (Moore et al., 1999), but in the past both have been on
the same side of the PF as it migrated north and south of its
current position (Gendron-Badou et al., 1997). During ice ages
the shelf around both Heard Island and the Kerguelen Islands
was in the SO and in some interglacial periods they were both
in the southern Indian Ocean. As a result the fauna of Heard
Island seems to be mainly a subset of that around the
Kerguelen Islands.
Ranges of species vary greatly between taxonomic classes,
and this was reflected in our results. The Gastropoda showed
the most limited dispersal, with 80% of species restricted to a
single region and less than 1.6% found in four or more regions.
In strong contrast to the Gastropoda, the Cyclostomata
appeared to be widely dispersed, with only 36% of species
restricted to a single area and 24% of species found in more
than four regions. We suggest that, in part, this is due to the
reproductive strategy of cyclostomes, which involves sexual
reproduction followed by cloning of the zygotes before mass
broadcast release. The Cyclostomata have a short-lived free-
swimming larval stage (Hayward & Ryland, 1985), which could
be extended in Antarctic species (Barnes & Clarke, 1995), and
this method of reproduction may reduce potential variation
between offspring and could lead to low species numbers with
large ranges.
When the Antarctic and the SO are considered as single
units the percentage endemism for both is far greater than
that of their component parts. Past estimates of endemism
south of the PF (Antarctic) by Arntz et al. (1997) and Barnes
& De Grave (2000) suggested endemism of between 75% and
90% for all of our study taxa. New data for the same region
reveal that endemism is significantly lower, except in the
Gastropoda (Table 2). Data for the Pycnogonida (Munilla, in
press) and Cephalopoda (Collins & Rodhouse, 2006) support
a general trend for classes to have Antarctic endemism of
between about 42% and 56%, revealing a previous overes-
timation. Higher levels of endemism in the Gastropoda are
not unexpected, as this class typically shows very high levels
of endemism elsewhere (Bouchet et al., 2002). Typical levels
of endemism of 42–56% are comparable with those of other
large, isolated regions such as New Zealand. These levels
apply well to classes, but patterns can change greatly when
the analysis is done at lower taxonomic levels. For example,
within the class Cephalopoda the orders show very different
polar endemism, as the Teuthida (squid) have just 12.5%
endemism whilst most Octopoda present (79.4%) are
endemic to the Antarctic (Collins & Rodhouse, 2006). This
is a reflection of the ‘lifestyle’ differences between the two
groups: squid are highly mobile and usually pelagic whereas
octopus are usually benthic and non-migratory. It is likely,
however, that the cephalopods represent an extreme example
of differences in lifestyle, but endemism can differ even across
taxonomic levels of groups with similar lifestyle char-
acteristics (e.g. suborders in bryozoans; see Tilbrook &
De Grave, 2005).
New data show that a generalized endemism value of around
50% also holds true for ascidians (44%; see Primo & Vazquez,
2007) and some lower taxonomic levels, e.g. sea anemones
(50% endemic) (Rodriguez et al., 2007), which is comparable
with other large isolated regions such as New Zealand. Isolated
regions where data are sparse, such as Bouvet Island and Peter
I Island, often appear to be outliers. These small regions of
shelf area may be of scientific interest, particularly as they show
the influence of age and isolation on Antarctic faunas,
although even with increased sampling they are unlikely to
change our overall view of SO biogeography. The greatest
unknown lies in the deep sea, a little-studied habitat with a
potentially great influence as a source and dispersal route for
much of the SO fauna (Brandt et al., 2007).
Our view of SO benthos has changed much over the last
decade, including our understanding of their distribution. It is
now clear that many more shelf species occur across wider
ranges and environmental conditions than was previously
thought. Lower levels of endemism have important implica-
tions for issues such as ecosystem structure, functioning and
vulnerability. As endemic species constitute at least half of the
SO benthos we looked for patterns in the distribution of these
species in our studied taxa and found that the numbers of SO
endemic species per region correlated very well with the total
number of species per region in our data. Strong correlation of
endemism with richness has also been reported from similar
taxa at low latitudes (e.g. Tilbrook & De Grave, 2005), and as
previously poorly sampled areas are better studied, we predict
that more endemics will be found in proportion to known
numbers of species. This correlation can be interpreted as
implying that no single region is a hotspot for endemic species
or can be seen as a distinct area of endemic species generation.
The level of SO endemism with its even distribution suggests
that species are being generated all around the SO and disperse
relatively quickly. Alternatively, the poor and very patchy
nature of the fossil record coupled with environmental
homogeneity and strong pan-Antarctic transport makes it
hard to establish whether new species are generated in
particular places and spread, or are evenly generated around
the Antarctic. For example, South Georgia may be a centre of
H. J. Griffiths et al.
172 Journal of Biogeography 36, 162–177ª 2008 British Antarctic Survey. Journal compilation ª 2008 Blackwell Publishing Ltd
high endemism either because isolation limits dispersal
opportunities of the species generated there or due to genuine
higher generation of species, or both.
Several authors (Dell, 1972; Brandt, 1991; Arntz & Rıos,
1999; Linse, 2002) have suggested strong links and exchange of
species between South America and the Antarctic. There are a
number of mechanisms for potential exchange into and out of
the SO and some indigenous species are still in the process of
recolonization since the Last Glacial Maximum (Clarke et al.,
2005; Barnes et al., 2006). Measuring the proportion of species
in each region accounted for by SO endemic species can be
used to assess the influence of other regions upon the SO. The
observed increase in prominence of SO endemic species with
distance from South America coupled with no influence from
the Eastern Hemisphere regions suggests that species are
entering the Antarctic via the Scotia Sea and the sub-Antarctic
islands and are transported clockwise by the ACC. This could
also imply that many species have entered the SO since the
establishment of the ACC and its apparent isolation. No
pattern was observed for the Bivalvia, which can be linked to
the fact that they show the lowest rate of Antarctic endemism
and tended to have species with large latitudinal and longi-
tudinal ranges (Clarke et al., 2007).
Biogeographical patterns
Centres of radiation
In our study, New Zealand stood out as a place of very high
species generation across all groups, an observation that is
probably due to the lengthy isolation and other features of
New Zealand (discussed above) providing time for much
vicariant speciation. Within the SO there was no single
dominant region across taxa – each faunal class showed
different patterns. The Weddell Sea appears to be a significant
area for radiation in the mollusc classes, whereas the Ross Sea
seems to be a focus for the cheilostomes. These two areas
represent the potential meeting points for the ancient faunas of
East and West Antarctica, and this overlap in species could
lead to hotspots of species per genus. Another possible
explanation for the observed hotspots is the effect of the level
of specialist taxonomic expertise that has worked in each
region. The Ross Sea was for a long time a focus for Antarctic
cheilostome work through the combined efforts of American,
New Zealand and Italian expeditions.
Regional relationships
Ordinations, and other similarity analyses, have been an
increasingly utilized and powerful tool to investigate under-
lying trends in biogeography (Ramos, 1999; Barnes & De
Grave, 2000; Linse et al., 2006). Results in the current study
suggested that all our regions clustered into three major
groupings: South America, New Zealand and Antarctic. Our
data support the findings of previous biogeographical studies
over several decades in demonstrating a strong similarity
between South America and the Antarctic (Linse, 2002; Primo
& Vazquez, 2007), far greater than either has with New
Zealand. Although the major components that defined these
groupings remained constant there was considerable variation
between classes when it came to the various island regions;
isolated Bouvet Island was the only region to fit into all three
groupings. The sub-Antarctic islands of Kerguelen, Crozet and
Prince Edward islands showed a South American signature for
the bryozoans and the bivalves, despite all of them being
geographically closer to the Antarctic and South Africa. The
west-wind drift and the ACC disperses organisms in the
Southern Hemisphere in a clockwise direction from South
America towards islands such as Bouvet. The Gastropoda of
the sub-Antarctic islands, however, do not show an affinity
with South America; instead they group with the Antarctic.
The Kerguelen Plateau stretches to within c. 200 km of
continental Antarctica (at 3000 m depth); during its geological
history, spanning c. 110 Myr the Kerguelen Plateau has moved
very little in relation to Antarctica (Frey et al., 2000). It has,
however, changed position relative to sea level, sometimes well
above sea level (Frey et al., 2000), meaning that the seafloor
around the plateau was much shallower in the past and has
since subsided due to cooling of the oceanic crust and upper
mantle with time. This close proximity to the continent,
through relatively shallow water, would possibly allow mobile
(crawling) animals such as the gastropods to colonize the
Kerguelen Plateau from Antarctica, and vice versa. In the more
ubiquitous Cyclostomata, island groups from within the PF
group with South America, including South Georgia, Heard
Island, the South Orkneys and South Sandwich Islands.
It is possible this is related to their unusual reproductive
strategy of polyembryony, but the link or mechanism is not
clear.
The New Zealand sub-Antarctic islands showed a strong
New Zealand signature for three of our study taxa, and also for
echinoderms (Dawson, 1970) and ascidians (Primo & Vaz-
quez, 2007). In contrast, however, the Cheilostomata of the
region clustered strongly with Antarctic regions. The New
Zealand sub-Antarctic islands share 43% of their species with
the Ross Sea, whereas in the other study taxa only 0–17% of
species were shared (Table S1). Although the reason for this is
obscure, it seems likely that it is connected with the prevalent
currents, which flow northwards out of the Ross Sea and East
Antarctica to these islands. It is possible that cheilostomes
rafted on macroalgae in warmer interglacial periods.
Faunal provinces
The similarity between any two given regions can be quantified
as a single, overall figure, although it is often advantageous to
consider the direction of that relationship. Describing the
similarity between the regions as two numbers (the percentage
of one region found at another and vice versa) can indicate
potential points of origin and the direction of species dispersal.
Using this method it is possible to show regions that are of
great importance to others but are not themselves dominated
Southern Ocean benthic biogeography
Journal of Biogeography 36, 162–177 173ª 2008 British Antarctic Survey. Journal compilation ª 2008 Blackwell Publishing Ltd
by the shared components of those regions. Conversely, this
method identifies regions that can be considered as subsets of
other regions, e.g. the relationship between Heard and
Kerguelen islands. It is also possible to highlight groups of
regions that have strong faunal connections and the potential
mechanisms for those connections.
The large-scale patterns observed using this directional
method support the idea of a largely homogeneous Antarctic
fauna. Three of our four studied taxa as well as the
Pycnogonida (Munilla, in press) arguably show the SO as a
‘single functional unit’. Only the Gastropoda showed any
differentiation between (the historically separate) areas of
the Antarctic (East and West). Our results, however, do
not show a clear division between the two areas, and the
Bellingshausen and Weddell seas act as areas of considerable
overlap.
As reported for some other taxa (see Primo & Vazquez,
2007), we found that the Antarctic and South American faunas
did not show strong faunal relationships with New Zealand,
possibly due to its distance from the ACC, the main vector for
species dispersal in the SO. South America’s influence upon
the sub-Antarctic islands via west-wind drift is clearly seen in
three of the model classes: the Cyclostomata, Cheilostomata
and Bivalvia. For the Gastropoda and Pycnogonida these
islands appear to be a separate grouping. A strong Antarctic
influence on the fauna of the Kerguelen Plateau is also
apparent for the cyclostomes and bivalves, while for the
widespread cyclostomes and bivalves the influence of South
America reaches within the PF, affecting the islands in the
north of the Scotia Arc. The only other evidence for external
influences within the PF comes from the Cyclostomata of
Bouvet Island; only two species are currently recorded from
the island, both of which are also found in South Africa. Two
potential mechanisms to explain this are deep-sea dispersal
and the incursion of the Agulhas Current across the PF
(Lutjeharms et al., 2003). Meaningful conclusions are limited
by the small numbers of species involved and the paucity of
sampling in the adjacent deep sea.
CONCLUSIONS
The accepted view of SO benthic biogeography has in some
ways changed little since the key works of Ekman (1935,
1953), Hedgpeth (1971) and Dell (1972). Unlike those ideas
previously proposed, we show regions to differ depending
upon the class of animals being considered (Fig. 6). Excluding
the lack of a South Georgia subprovince, the Gastropoda
show the greatest similarity to the previously suggested zones,
including some differences between east and west. Patterns in
all of the other taxa studied suggested a single Antarctic
province and a definite distinction between the sub-Antarctic
islands influenced by South America and those of New
Zealand, confirming the original suspicions of Ekman and
Hedgpeth that their observed split between the faunas of East
and West Antarctica was an artefact of sample distribution
available at the time.
Although there is clear regional and local variation in the
Antarctic marine fauna (Linse et al., 2006; Clarke et al., 2007)
when compared with its Southern Hemisphere neighbours, the
SO seems to show very few regional patterns. The level of
faunal homogeneity, or at least a lack of common boundaries
to species, implies that very few barriers to dispersal exist
within Antarctic waters. We suggest that much of this
homogeneity is driven by the similarity of conditions and
the ACC which transports animals in a clockwise direction
around the continent. Strong evidence exists for a long-term
influence of the ACC upon SO benthic biogeography. All four
of the current study taxa, as well as echinoids (David et al.,
2005), pycnogonids (Munilla, in press) and ascidians (Primo &
Vazquez, 2007) show varying degrees of influence of the west-
wind drift. Even the highly endemic, mostly non-planktonic,
Gastropoda showed less of an influence of South American
species with increased distance in the direction of the ACC. In
our other study classes (Bivalvia, Cyclostomata and Cheilos-
tomata), the fauna of the sub-Antarctic islands of Prince
Edward, Crozet and Kerguelen were derived from South
American origins. This study supports previous findings of
strong biogeographical links between the Antarctic and South
America, but there is little evidence for a relationship between
either of these regions and New Zealand/Australia (Tasmania).
This is a potential explanation for the comparatively low
species numbers in the SO, with the PF acting as a barrier to
the species from the richer Eastern Hemisphere and no
equivalent of the Scotia Arc or sub-Antarctic islands down-
current to act as a gateway.
Most investigations of biogeography examine patterns in
one particular taxon but then discuss a generalized pattern. A
key aim of the current study was to use multiple classes to
determine degrees of generality and exceptions. Our four
model taxa all showed the potential to be ‘outliers’ during this
study. The Cyclostomata showed a near ‘opposite’ pattern of
richness to the other groups as most species occurred in South
America and the Antarctic Peninsula (Table 1). The Cheilos-
tomata were alone in showing strong links between the New
Zealand sub-Antarctic islands and the Antarctic. Only the
Bivalvia showed no pattern of decreasing influence of South
American species with distance. The Gastropoda alone showed
very high levels of endemism, the sub-Antarctic islands
grouping with the Antarctic and some degree of east–west
split in the Antarctic fauna. In general some biogeographical
commonality emerges. It is now clear that previous estimates
of Antarctic endemism (see, e.g. Arntz et al., 1997) were too
high. For our study classes, a figure in the region of 50%
species endemism seems realistic.
A key biogeographical question is whether the Antarctic is
cut off or just far away from potential colonists. For South
American species to reach the Antarctic requires crossing
large distances of deep water, in some areas aided by a rapid
(10 cm s)1) current in the direction of the Scotia Arc and
sub-Antarctic islands. However, for Eastern Hemisphere
species the Antarctic appears both remote and cut off by
the PF, which acts as a barrier even to any species that could
H. J. Griffiths et al.
174 Journal of Biogeography 36, 162–177ª 2008 British Antarctic Survey. Journal compilation ª 2008 Blackwell Publishing Ltd

cross the deep water. From within the PF the main route out
of the Antarctic would be via Antarctic bottom water that
flows northwards into neighbouring oceans but this (slow)
route would be restricted to species capable of surviving at
abyssal depths.
ACKNOWLEDGEMENTS
The authors would like to thank Lloyd Peck, Stefanie Kaiser,
Stephen Roberts and Lucy Wilson for their constructive
comments. We thank Simon J. Grove, Ron C. Kershaw, Brian
J. Smith and Elizabeth Turner for providing an electronic
version of their mollusc species list for Tasmania. Thanks to
Phil Bock for allowing and aiding access to Australian
bryozoan data bases and distribution records. This paper is a
contribution to British Antarctic Survey core project,
BIOPEARL: BIOdiversity dynamics: Phylogeography,
Evolution And Radiation of Life.
REFERENCES
Arnaud, P.M. (1974) Contribution a la bionomie marine
benthique des regions antarcticques et sub-antarcticques.
Tethys, 6, 465–656.
Arntz, W.E. & Rıos, C. (eds) (1999) Magellan–Antarctic:
ecosystems that drifted apart. Scientia Marina, 63(Suppl. 1).
Arntz, W.E., Brey, T. & Gallardo, V.A. (1994) Antarctic zoo-
benthos. Oceanography and Marine Biology: an Annual
Review, 32, 241–304.
Arntz, W.E., Gutt, J. & Klages, M. (1997) Antarctic marine
biodiversity: an overview. Antarctic communities: species,
structure and survival (ed. by B. Battaglia, J. Valencia and
D.W.H. Walton), pp. 3–14. Cambridge University Press,
Cambridge.
Barnes, D.K.A. & Clarke, A. (1995) Epibiotic communities on
sublittoral macroinvertebrates at Signy Island, Antarctica.
Journal of the Marine Biological Association of the United
Kingdom, 75, 689–703.
Barnes, D.K.A. & De Grave, S. (2000) Biogeography of
southern polar bryozoans. Vie et Milieu, 50, 261–274.
Barnes, D.K.A. & Griffiths, H.J. (2008) Biodiversity and bio-
geography of southern temperate and polar bryozoans.
Global Ecology and Biogeography, 17, 84–99.
Barnes, D.K.A., Hodgson, D.A., Convey, P., Allen, C.S. &
Clarke, A. (2006) Incursion and excursion of Antarctic
biota: past, present and future. Global Ecology and Biogeog-
raphy, 15, 121–142.
Bouchet, P., Lozouet, P., Maestrati, P. & Heros, V. (2002)
Assessing the magnitude of species richness in tropical
marine environments: exceptionally high numbers of mol-
luscs at a New Caledonia site. Biological Journal of the Lin-
naean Society, 75, 421–436.
Brandt, A. (1991) Colonization of the Antarctic shelf by the
Isopoda (Crustacea, Malacostraca). Berichte zur Polarfors-
chung, 91, 1–240.
Brandt, A., Gooday, A.J., Brandao, S.N., Brix, S., Brokeland,
W., Cedhagen, T., Choudhury, M., Cornelius, N., Danis, B.,
De Mesel, I., Diaz, R.J., Gillian, D.C., Ebbe, B., Howe, J.A.,
Janussen, D., Kaiser, S., Linse, K., Malyutina, M., Pawlowski,
J., Raupach, M. & Vanreusel, A. (2007) First insights into the
biodiversity and biogeography of the Southern Ocean deep
sea. Nature, 447, 307–311.
Chown, S.L., Sinclair, B.J., Leinaas, H.P. & Gaston, K.J. (2004)
Hemispheric asymmetries in biodiversity – a serious matter
for ecology. PLoS Biology, 2, e406.
Clarke, A. & Johnston, N.M. (2003) Antarctic marine benthic
diversity. Oceanography and Marine Biology: an Annual
Review, 41, 47–114.
Clarke, A., Barnes, D.K.A. & Hodgson, D.A. (2005) How
isolated is Antarctica? Trends in Ecology and Evolution, 20,
1–3.
Clarke, A., Griffiths, H.J., Linse, K., Barnes, D.K.A. & Crame,
J.A. (2007) How well do we know the Antarctic marine
fauna? A preliminary study of macroecological and bioge-
ographic patterns in Southern Ocean gastropod and bivalve
molluscs. Diversity and Distributions, 13, 620–632.
Clarke, K.R. & Warwick, R.M. (2001) A further biodiversity
index applicable to species lists: variation in taxonomic
distinctness. Marine Ecology Progress Series, 16, 265–278.
Collins, M.A. & Rodhouse, P.G.K. (2006) Southern
Ocean cephalopods. Advances in Marine Biology, 50,
191–265.
Cooper, R.A. & Millener, P.R. (1993) The New Zealand biota:
historical background and new research. Trends in Ecology
and Evolution, 8, 429–433.
Costello, M.J., Stocks, K., Zhang, Y., Grassle, J.F. & Fautin,
D.G. (2007) About the Ocean Biogeographic Information
System. Available at http://www.iobis.org/ (accessed Sep-
tember 2007).
Crame, J.A. (2000) Evolution of taxonomic diversity gradients
in the marine realm: evidence from the composition of
recent bivalve faunas. Paleobiology, 26, 188–214.
David, B., Chone, T., Moo, R. & De Ridder, C. (2005) Antarctic
Echinoidea, Synopses of the Antarctic benthos, Vol. 10 (ed. by
J.W. Wagele and J. Sieg). Koeltz Scientific Books, Konig-
stein.
Dawson, E.W. (1970) Faunal relationships between the New
Zealand Plateau and the New Zealand sector of Antarctica
based on echinoderm distribution. New Zealand Journal of
Marine and Freshwater Research, 4, 126–140.
De Broyer, C. & Jazdzewski, K. (1996) Biodiversity of the
Southern Ocean: towards a new synthesis for the Amphi-
poda (Crustacea). Bolletino del Museo Civico di Storia Nat-
urale, 20, 547–568.
Dell, R.K. (1972) Antarctic benthos. Advances in Marine
Biology, 10, 1–216.
Ekman, S. (1935) Tiergeographie des Meeres. Akademische
Verlagsgeschellschaft, Leipzig, Germany.
Ekman, S. (1953) Zoogeography of the sea. Sidgwick and Jack-
son, London.
Southern Ocean benthic biogeography
Journal of Biogeography 36, 162–177 175ª 2008 British Antarctic Survey. Journal compilation ª 2008 Blackwell Publishing Ltd
Engleskjon, T. & Jørgensen, P.M. (1986) Phytogeographical
relations of the cryptogamic flora of Bouvetøya. Botany of
Bouvetøya, South Atlantic Ocean. I. Cryptogamic taxonomy
and phytogeography, Skrifter Norsk Polarinstitutt 185
(ed. by T. Engleskjon), pp. 71–79. Norsk Polarinstitutt,
Oslo.
Frey, F.A., Coffin, M.F., Wallace, P.J., Weis, D., Zhao, X., Wise,
S.W., Wahnert, V., Teagle, D.A.H., Saccocia, P.J., Reusch,
D.N., Pringle, M.S., Nicolaysen, K.E., Neal, C.R., Muller,
R.D., Moore, C.L., Mahoney, J.J., Keszthelyi, L., Inokuchi,
H., Duncan, R.A., Delius, H., Damuth, J.E., Damasceno, D.,
Coxall, H.K., Borre, M.K., Boehm, F., Barling, J., Arndt,
N.T. & Antretter, M. (2000) Origin and evolution of a
submarine large igneous province: the Kerguelen Plateau
and Broken Ridge, southern Indian Ocean. Earth and
Planetary Science Letters, 176, 73–89.
Gendron-Badou, A., Pichon, J.J. & Frohlich, F. (1997) Enreg-
istrements sedimentologiques des changements climatiques
et oceanographiques au nord-ouest de Kerguelen (ocean
Indien sud) pendant les dernieres 620 000 annees. Comptes
Rendus de l’Academie des Sciences, Serie II. France, Gau-
thier-Villars. Montrouge France. Sciences de la Terre et des
Planetes, 325, 343–349.
Gray, J.S. (2001) Marine diversity: the paradigms in patterns of
species richness examined. Scientia Marina, 65(Suppl. 2),
41–56.
Griffiths, H.J., Linse, K. & Crame, J.A. (2003) SOMBASE –
Southern Ocean Mollusc Database: a tool for biogeographic
analysis in diversity and ecology. Organisms Diversity and
Evolution, 3, 207–213.
Grove, S.J., Kershaw, R.C., Smith, B.J. & Turner, E. (2006) A
systematic list of the marine molluscs of Tasmania. Queen
Victoria Museum and Art Gallery occasional papers, Vol. 8.
Queen Victoria Museum and Art Gallery, Launceston.
Hayward, P.J. & Ryland, J.S. (1985) Cyclostome bryozoans.
Synopses of the British Fauna (New Series), no. 34. The Bath
Press, Avon, UK.
Hedgpeth, J.W. (1969) Introduction to Antarctic zoogeography.
Distribution of selected groups of marine invertebrates in
waters south of 35� S. Antarctic Map Folio Series, Folio 11
(ed. by V.C. Bushnell and J.W. Hedgpeth), pp. 1–29.
American Geographical Society, New York.
Hedgpeth, J.W. (1971) Perspectives of benthic ecology in
Antarctica. Research in the Antarctic (ed. by L.O. Quam),
pp. 93–136. American Association for the Advancement
of Science, Washington, DC.
Linse, K. (2002) The shelled Magellanic Mollusca: with special
reference to biogeographic relations in the Southern Ocean,
Vol. 74. Theses Zoologica, A.R.A. Ganter Verlag, K.G.
Ruggell, Liechtenstein.
Linse, K. (2006) New records of shelled marine molluscs at
Bouvet Island and preliminary assessment of their biogeo-
graphic affinities. Polar Biology, 29, 120–127.
Linse, K., Griffiths, H.J., Barnes, D.K.A. & Clarke, A. (2006)
Biodiversity and biogeography of Antarctic and sub-Ant-
arctic Mollusca. Deep Sea Research, 53, 985–1008.
Lutjeharms, J.R.E., Penven, P. & Roy, C. (2003) Modelling the
shear edge eddies of the southern Agulhas Current. Conti-
nental Shelf Research, 23, 1099–1115.
MacArthur, R.H. & Wilson, E.O. (1967) The theory of island
biogeography. Princeton University Press, Princeton.
McDowall, R.M. (2004) What biogeography is: a place for
process. Journal of Biogeography, 31, 345–351.
Mileikovsky, S.A. (1971) Types of larval development in
marine bottom invertebrates, their distribution and eco-
logical significance: a re-evaluation. Marine Biology, 19, 193–
213.
Moore, J.K., Abbott, M.R. & Richman, J.G. (1999) Location and
dynamics of the Antarctic Polar Front from satellite sea sur-
face temperature data. Journal of Geophysical Research, 104,
3059–3073.
Munilla, T. (in press) Check-list of the Pycnogonids from
Antarctic and sub-Antarctic waters: zoogeographic impli-
cations. Antarctic Science.
Powell, A.W.B. (1951) Antarctic and sub-Antarctic mollusca:
pelecypoda and gastropoda. Discovery Reports, 26, 49–196.
Powell, A.W.B. (1955) Mollusca of the Southern Islands of
New Zealand. Cape Expedition Bulletin, 15, 1–151.
Powell, A.W.B. (1960) Antarctic and sub-Antarctic. Mollusca.
Records of the Auckland Institute and Museum, 5, 117–193.
Powell, A.W.B. (1965) Mollusca of Antarctic and Subantarctic
seas. Biogeography and ecology in Antarctica (ed. by I. Van
Mieghem and P. Van Oye), pp. 333–380. Junk, The Hague.
Primo, C. & Vazquez, E. (2007) Zoogeography of the Antarctic
ascidian fauna in relation to the sub-Antarctic and South
America. Antarctic Science, 19, 321–336.
Ramos, A. (1999) The megazoobenthos of the Scotia Arc is-
lands. Scientia Marina, 63, 171–182.
Roberts, C.M., McClean, D.J., Veron, J.E.N., Hawkins, J.P.,
Allen, G.R., McAllister, D.E., Mittermeier, C.G., Schueler,
F.W., Spalding, M., Wells, F., Vynne, C. & Warner, T.B.
(2002) Marine biodiversity hotspots and conservation pri-
orities for tropical reefs. Science, 295, 1280–1284.
Rodriguez, E., Lopez-Gonzalez, P.J. & Gili, J.M. (2007) Bio-
geography of Antarctic sea anemones (Anthozoa, Actinia-
ria): what do they tell us about the origin of the Antarctic
benthic fauna? Deep-Sea Research II, 54, 1876–1904.
Rosenberg, G. (2005) Malacolog version 4.1.0: a database of
western Atlantic marine Mollusca. Available at http://
www.malacolog.org/ (last accessed September 2007).
Scheltema, R.S. (1971) Larval dispersal as a means of genetic
exchange between geographically separated populations of
shallow water benthic marine gastropods. Biological Bulletin,
140, 284–322.
Spencer, H.G., Willan, R.C., Marshall, B.A. & Murray, T.J.
(2002) Checklist of the Recent Mollusca described from the
New Zealand Exclusive Economic Zone. Available at http://
www.molluscs.otago.ac.nz (last accessed September 2007).
Swenson, U., Backlund, A., McLoughlin, S. & Hill, R.S. (2001)
Nothofagus biogeography revisited with special emphasis on
the enigmatic distribution of subgenus Brassospora in New
Caledonia. Cladistics, 17, 28–47.
H. J. Griffiths et al.
176 Journal of Biogeography 36, 162–177ª 2008 British Antarctic Survey. Journal compilation ª 2008 Blackwell Publishing Ltd
Tilbrook, K.J. & De Grave, S. (2005) A biogeographical analysis
of Indo-West Pacific cheilostome bryozoan faunas. Bryozoan
studies 2004 (ed. by G.H.I. Moyano, J. Cancino and P. Wyse-
Jackson), pp. 341–350. A.A. Balkema, London.
Valdovinos, C., Navarrete, S.A. & Marquet, P.A. (2003) Mollusk
species diversity in the Southeastern Pacific: why are there
more species towards the pole? Ecography, 26, 139–144.
Walsh, J.A. (1996) No second chances? New perspectives on
biotic interactions in post-Paleozoic brachiopod history.
Brachiopods: Proceedings of the Third International Brachio-
pod Congress, Sudbury, ON, Canada (ed. by P. Copper and J.
Jin), pp. 281–288. A.A. Balkema, Rotterdam.
Weaver, S.D., Storey, B.C., Pankhurst, R.J., Mukasa, S.B., Di-
Venere, V.J. & Bradshaw, J.D. (1994) Antarctica–New Zea-
land rifting and Marie Byrd Land lithospheric magmatism
linked to ridge subduction and mantle plume activity.
Geology, 22, 811–814.
White, M.G. (1984) Marine benthos. Antarctic ecology, Vol. 2
(ed. by R.M. Laws), pp. 421–461. Academic Press, London.
SUPPORTING INFORMATION
Additional Supporting Information may be found in the
online version of this article:
Table S1 Matrices showing the percentage of the total
species from each region shared with each of the other
regions.
Table S2 Count of the number of genera per study region that
show the maximum-recorded number of species for that genus
in that area.
Table S3 Large-scale affinities of regions used for NMDS
plots (Fig. 2) and ANOSIM tests (Table 3).
Please note: Wiley-Blackwell is not responsible for
the content or functionality of any supporting materials
supplied by the authors. Any queries (other than missing
material) should be directed to the corresponding author for
the article.
BIOSKETCHES
Huw J. Griffiths created and manages SOMBASE, the Southern Ocean Molluscan Database. He is interested in large-scale
ecological patterns. His focus has been on investigating trends at high latitudes in molluscs, bryozoans and Pycnogonida. He has
started a PhD in Southern Ocean marine biogeography with the British Antarctic Survey (BAS) and the Open University.
David K. A. Barnes is the nearshore marine biology section head at BAS and is interested in the macroecology of the Southern
Ocean. Both he and Huw are investigating zoogeographical patterns and using them to explain the past and help us predict the
response of organisms to warming in the region.
Katrin Linse is the Project Leader of the BIOPEARL (BIOdiversity dynamics: Phylogeography, Evolution And Radiation of Life)
core project at the BAS. Her research interests include the distribution, evolution and systematics of Antarctic marine invertebrates.
She has extensive experience working in the Antarctic marine environment from the intertidal to the abyssal.
Editor: John Lambshead
Southern Ocean benthic biogeography
Journal of Biogeography 36, 162–177 177ª 2008 British Antarctic Survey. Journal compilation ª 2008 Blackwell Publishing Ltd