Phenotypic flexibility as marker of sodium chloride tolerance in sunflower genotypes
10
Environmental and Experimental Botany 42 (1999) 85 – 94 Phenotypic flexibility as marker of sodium chloride tolerance in sunflower genotypes Abdul Wahid *, Iffat Masood, Intshar-ul-Haq Javed, Ejaz Rasul Department of Botany, Uni6ersity of Agriculture, Faisalabad -38040, Pakistan Received 16 August 1998; received in revised form 20 April 1999; accepted 20 April 1999 Abstract Phenotypic flexibility in three high yielding sunflower genotypes (FS 1 , FS 2 and FS 5 ) was taken as marker to determine NaCl tolerance at germination, 20, 35 and 50 days after emergence (DAE) and maturity (70 DAE) stages of growth. Genotypes displayed a substantial variability for salinity tolerance at all growth stages. FS 2 exhibited tolerance at germination and 20 DAE, whereas the most tolerant stages of FS 5 were 35, 50 DAE and maturity. At germination enhanced salt tolerance was expressed by higher germination percentage, greater elongation and dry weight of embryonic tissues and at subsequent stages by reduced tip burning and lack of chlorosis of young leaves, greater stem chlorosis, higher number, area and dry weight of green leaves. Salt-tolerant genotypes showed reductions of relative growth rate (RGR), net assimilation rate (NAR) and relative leaf growth rate (RLGR) and an increase of leaf area ratio (LAR) at 35 DAE, although these trends were reversed at 50 DAE. A positive relationship of RGR and NAR with RLGR revealed that increased leaf growth plays a crucial role in sustaining plant growth that results in higher yield under salinity. Hence, increased RLGR can be regarded as a reliable indicator of salinity tolerance. To conclude, FS 5 showed some important features of salt tolerance that can be successfully exploited in saline lands. The problem of reduced germination can be overcome by enhancing seed rate to achieve an optimum plant population. © 1999 Elsevier Science B.V. All rights reserved. Keywords: Chlorosis; Genotypes; Growth; Helianthus annuus ; Phenotypic flexibility; RLGR; Selection traits www.elsevier.com/locate/envexpbot 1. Introduction Salinization of soils limits plant growth by in- ducing numerous physiological and biochemical changes in cells. These changes are ultimately displayed by reduced growth and other signs of salt damage. Major harmful effects of salinity may be reduced germination, seedling emergence and establishment (Stumpf et al., 1986; Wahid et al., 1999), visible signs of leaf chlorosis (Wahid et al., 1997a) and senescence (Lutts et al., 1996), reduced absolute and relative growth (Curtis and La ¨uchli, 1986; Garcia et al., 1995), and decreased final yield (Francois, 1994; Isla et al., 1998). Salt- tolerant plants display inherent features which are expressed under saline conditions and may not be apparent otherwise (Wahid et al., 1997a; Shabala * Corresponding author. E-mail address: [email protected] (A. Wahid) S0098-8472/99/$ - see front matter © 1999 Elsevier Science B.V. All rights reserved. PII:S0098-8472(99)00020-9
-
Upload
independent -
Category
Documents
-
view
0 -
download
0
Transcript of Phenotypic flexibility as marker of sodium chloride tolerance in sunflower genotypes
Environmental and Experimental Botany 42 (1999) 85–94
Phenotypic flexibility as marker of sodium chloridetolerance in sunflower genotypes
Abdul Wahid *, Iffat Masood, Intshar-ul-Haq Javed, Ejaz RasulDepartment of Botany, Uni6ersity of Agriculture, Faisalabad-38040, Pakistan
Received 16 August 1998; received in revised form 20 April 1999; accepted 20 April 1999
Abstract
Phenotypic flexibility in three high yielding sunflower genotypes (FS1, FS2 and FS5) was taken as marker todetermine NaCl tolerance at germination, 20, 35 and 50 days after emergence (DAE) and maturity (70 DAE) stagesof growth. Genotypes displayed a substantial variability for salinity tolerance at all growth stages. FS2 exhibitedtolerance at germination and 20 DAE, whereas the most tolerant stages of FS5 were 35, 50 DAE and maturity. Atgermination enhanced salt tolerance was expressed by higher germination percentage, greater elongation and dryweight of embryonic tissues and at subsequent stages by reduced tip burning and lack of chlorosis of young leaves,greater stem chlorosis, higher number, area and dry weight of green leaves. Salt-tolerant genotypes showed reductionsof relative growth rate (RGR), net assimilation rate (NAR) and relative leaf growth rate (RLGR) and an increase ofleaf area ratio (LAR) at 35 DAE, although these trends were reversed at 50 DAE. A positive relationship of RGRand NAR with RLGR revealed that increased leaf growth plays a crucial role in sustaining plant growth that resultsin higher yield under salinity. Hence, increased RLGR can be regarded as a reliable indicator of salinity tolerance.To conclude, FS5 showed some important features of salt tolerance that can be successfully exploited in saline lands.The problem of reduced germination can be overcome by enhancing seed rate to achieve an optimum plantpopulation. © 1999 Elsevier Science B.V. All rights reserved.
Keywords: Chlorosis; Genotypes; Growth; Helianthus annuus ; Phenotypic flexibility; RLGR; Selection traits
www.elsevier.com/locate/envexpbot
1. Introduction
Salinization of soils limits plant growth by in-ducing numerous physiological and biochemicalchanges in cells. These changes are ultimatelydisplayed by reduced growth and other signs ofsalt damage. Major harmful effects of salinity
may be reduced germination, seedling emergenceand establishment (Stumpf et al., 1986; Wahid etal., 1999), visible signs of leaf chlorosis (Wahid etal., 1997a) and senescence (Lutts et al., 1996),reduced absolute and relative growth (Curtis andLauchli, 1986; Garcia et al., 1995), and decreasedfinal yield (Francois, 1994; Isla et al., 1998). Salt-tolerant plants display inherent features which areexpressed under saline conditions and may not beapparent otherwise (Wahid et al., 1997a; Shabala
* Corresponding author.E-mail address: [email protected] (A. Wahid)
S0098-8472/99/$ - see front matter © 1999 Elsevier Science B.V. All rights reserved.
PII: S0098 -8472 (99 )00020 -9
A. Wahid et al. / En6ironmental and Experimental Botany 42 (1999) 85–9486
et al., 1998). This, however, depends upon thestage of growth and plant/variety used.
Sunflower, as an important source of oil pro-duction, is moderately responsive to salinity,showing a 5% decrease in yield per unit increasein salinity, above 4.8 dS m−1 (Francois, 1996).In Pakistan, it has suffered a decline in produc-tivity over the past many years (Anonymous,1996), which may be partly related to the in-creased salinization of soil. As an open-polli-nated species, sunflower exhibits great geneticdiversity, which can be exploited for the selec-tion of salt-tolerant materials based on a set ofspecific phenotypic markers. This hypothesis wastested, in this 2-year study, to identify certainqualitative and quantitative features, as indica-tors of salinity tolerance, in newly bred promis-ing sunflower genotypes. In addition to visiblegrowth and other symptoms, germination, drymatter, seed and oil yield and physiologicalgrowth parameters have been taken as indicatorsto determine variability for salt tolerance.
2. Materials and methods
The seeds of sunflower (Helianthus annuus L.)genotypes, viz. FS1, FS2 and FS5 were obtainedfrom Ayub Agricultural Research Institute,Faisalabad. For germination studies, selectedhealthy seeds were surface sterilized with 0.1%(w/v) HgCl2 for 3 min, followed by repeatedwashing with water, and sown in petri disheslined with double layer of Whatman No. 2 filterpaper. The experimental design was completelyrandomized with three replications. Salinity(NaCl) levels, i.e. 20 (control), 40, 80, 120 and160 mmol NaCl l−1 (corresponding to 2 (con-trol), 4, 8, 12 and 16 dS m−1) were added topetri dishes before placing 25 seeds in each dish.The seed were germinated at 25°C in 12-h light/dark cycle. After 12 days, germination percent-age, elongation and dry matter yield of radicleand plumule were determined.
For determination of salt tolerance by apply-ing salinity at 20, 35, 50 days after emergence(DAE) of seedlings and maturity (70 DAE)stages of growth, the plants were raised in pots
containing 10 kg of loam soil and two plantswere maintained per pot. The pots (three repli-cates per treatment) were placed in a wire housein complete randomization, where the ambienttemperature for both the study years ranged be-tween 2094 and 3895°C, relative humidity be-tween 5098 and 7096% and rainfall was68–85 mm. The above NaCl levels were gradu-ally developed based upon full saturation per-centage of soil. Physico-chemical characteristicsof the soil were; organic matter, 1.73%; pH 7.4;electrical conductivity (ECe), 2.0 dS m−1; cationexchange capacity, 14.7 meq l−1; sodium ad-sorption ratio, 0.08 meq l−1; Na+, 4.45 meql−1; Cl−, 7.53 meq l−1; SO4
2−, 1.73 meq l−1;and Ca+Mg, 14.5 meq l−1. Original ECe ofthe soil (equivalent to 20 mmol NaCl l−1) wasaccounted for while developing salt levels. Salin-ity levels were raised daily with the addition of20 mmol NaCl l−1 per pot, until required levelsof 40, 80, 120 and 160 mmol NaCl l−1 wereachieved. At each growth stage, leaf tip burning,chlorosis and signs of salt injury on leaf or stemwere visually noted. The plants were harvested16 days after the onset of salinity at eachgrowth stage. The data were recorded for shootand root length, number and area of greenleaves, dry weight of leaf, stem, root, and theirtotal at initial stages, while head size, 100 seedweight, seed yield per plant and oil percentagewere determined at the end. Salt-tolerance limits,i.e. EC50 values (salt levels in mmol NaCl l−1 atwhich growth and yield is reduced to 50%) werecomputed up to 160 mmol NaCl−1 at the indi-vidual growth stages and their average by themethod described elsewhere (Wahid et al.,1997a).
Physiological growth parameters including rel-ative growth rate (RGR) (using total plant dryweight), leaf area ratio (LAR) and net assimila-tion rate (NAR) were calculated as described byHunt (1982), using the data of non-salinizedplants at the onset of each growth stage as abaseline information. To calculate relative leafgrowth rate (RLGR), the formula of RGR wasused based on dry weight of photosyntheticleaves. Oil content of oven dried seeds was esti-

A. Wahid et al. / En6ironmental and Experimental Botany 42 (1999) 85–94 87
Table 1Changes in some germination characteristics of sunflower genotypes under sodium chloride salinity at 12 days after sowing
Genotypes Germimation (%)Salt levels (mmol NaCl l−1) Elongation (mm) Dry weight (g/100 plant)Radicle Plumule Radicle Plumule
86.5 2.82 3.83 4.31 2.65FS1 Control77.4 2.77 2.8940 3.15 2.01
80 69.5 1.47 2.25 2.81 1.66120 54.5 1.42 1.70 1.95 1.43
87.0 3.70FS2 4.57Control 3.95 2.7886.4 3.61 4.4540 3.10 2.1581.5 2.44 2.5980 2.65 2.06
120 72.4 2.13 2.58 2.28 1.98
FS5 Control 84.6 4.65 4.78 3.98 2.8882.5 3.88 4.1040 3.13 2.4473.580 2.78 3.40 2.51 2.1061.6 2.64 2.34 2.01120 1.82
Summary of significance of variance sources**Genotypes (G) **2 ** * **** ** **3 **Salinity (S) ****GxS **6 ** ** n.s.
* Significant at PB0.05.** Significant at PB0.01; n.s., non-significant.
mated by Soxhlet extraction method, using hex-ane as solvent (AOAC, 1970). The data collectedfor various germination, growth and yield charac-teristics were analyzed statistically using Minitabprogram (Minitab, 1989).
3. Results
Preliminary results revealed that for both studyyears a few seeds of genotypes germinated at 160mmol NaCl l−1. At all other stages, except FS5,
Table 2Symptoms and degree of salt injury in leaves and stem of sunflower genotypes at 120 mmol NaCl l−1 at different growth stages
Degree Growth stages (DAE)Sign of salt injury Plant tissues35 5020
FS5FS2 FS5LowTip burning (a) Young leavesFS2 FS2¡ FS5
FS1 FS1High FS1
FS2 FS1(b) Old leaves Low FS1
FS1 FS5 FS2¡FS5 FS2 FS5High
FS5FS2 FS5LowChlorosis (a) Young leavesFS5 FS2 FS2¡FS1 FS1High FS1
FS1FS1FS2Low(b) Old leavesFS5 FS5 FS2¡
FS5FS2FS1HighFS1 FS1(c) Stem Low FS1
FS2 FS2¡ FS5
FS2 FS5 FS5High
A.
Wahid
etal./
En6ironm
entaland
Experim
entalB
otany42
(1999)85
–94
88
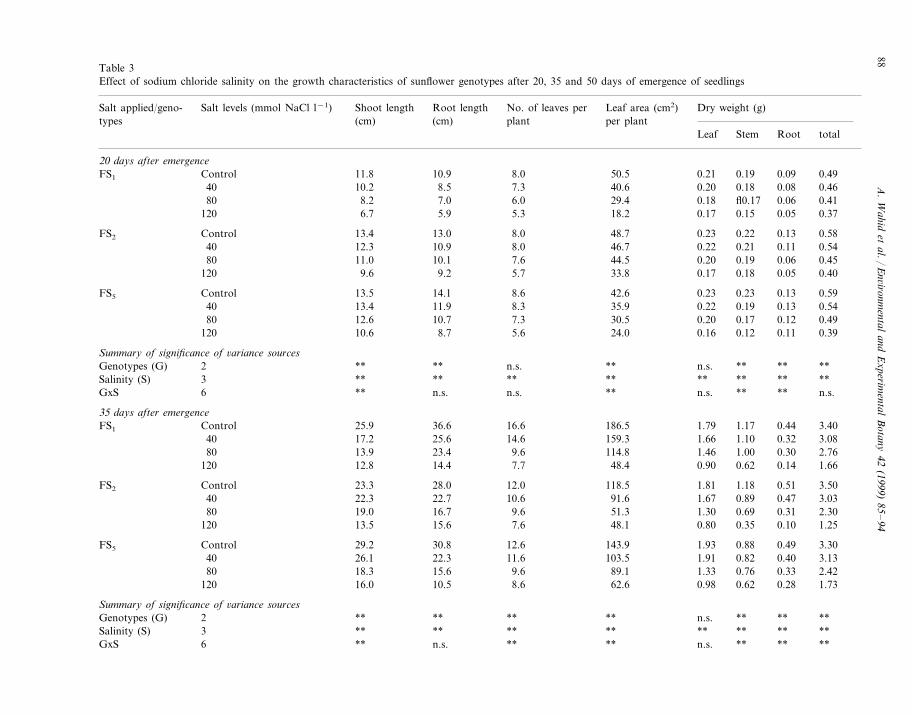
Table 3Effect of sodium chloride salinity on the growth characteristics of sunflower genotypes after 20, 35 and 50 days of emergence of seedlings
Root length No. of leaves per Leaf area (cm2) Dry weight (g)Salt applied/geno- Salt levels (mmol NaCl l−1) Shoot lengthtypes plant(cm) per plant(cm)
Leaf Stem Root total
20 days after emergence0.21 0.19 0.0911.8 0.4910.9ControlFS1 8.0 50.5
7.3 40.6 0.20 0.18 0.08 0.4640 10.2 8.50.18 fl0.17 0.06 0.4129.47.0 6.080 8.2
18.2120 0.17 0.15 0.05 0.376.7 5.9 5.3
0.23 0.22 0.13 0.5848.7FS2 8.013.013.4Control8.0 46.7 0.22 0.21 0.11 0.5440 12.3 10.9
0.20 0.19 0.06 0.4544.511.080 7.610.133.8120 0.17 0.18 0.05 0.409.6 9.2 5.7
Control 42.6 0.23 0.23 0.13 0.5913.5 14.1FS5 8.60.22 0.19 0.13 0.5435.98.311.913.440
7.3 30.5 0.20 0.17 0.12 0.4980 12.6 10.70.16 0.12 0.11 0.3924.08.710.6120 5.6
Summary of significance of 6ariance sourcesn.s. ** n.s. ** ** ****Genotypes (G) **2
Salinity (S) **3 ** ** **** ** ** **n.s. ** ** n.s.**6 ** n.s. n.s.GxS
35 days after emergence16.6 186.5 1.79 1.17 0.44 3.4025.9FS1 36.6Control14.6 159.3 1.66 1.10 0.32 3.0817.2 25.640
1.46 1.00 0.30 2.76114.89.623.413.980120 48.4 0.90 0.62 0.14 1.6612.8 14.4 7.7
1.81 1.18 0.51 3.5012.028.0 118.5FS2 Control 23.31.67 0.89 0.47 3.0340 22.3 22.7 10.6 91.61.30 0.69 0.31 2.3051.39.616.719.080
48.1120 0.80 0.35 0.10 1.2513.5 15.6 7.6
1.93 0.88 0.49 3.3012.6FS5 143.930.829.2Control40 103.5 1.91 0.82 0.40 3.1326.1 22.3 11.680 89.1 1.33 0.76 0.33 2.4218.3 15.6 9.6
0.98 0.62 0.28 1.7362.68.610.516.0120
Summary of significance of 6ariance sourcesn.s. ** **** **** ** **Genotypes (G) 2** ** **Salinity (S) **3 ** ** ** **n.s. ** ** ****GxS **n.s.**6

A.
Wahid
etal./
En6ironm
entaland
Experim
entalB
otany42
(1999)85
–94
89
Table 3 (Continued)
Root length No. of leaves per Leaf area (cm2) Dry weight (g)Salt applied/geno- Salt levels (mmol NaCl l−1) Shoot lengthtypes plant(cm) per plant(cm)
Leaf Stem Root total
50 days after emergence2.51 2.15 1.2044.1 5.8636.5ControlFS1 17.6 218.7
197.240 2.01 1.86 1.03 4.9037.5 31.1 15.01.76 1.67 0.43 3.86140.628.5 13.325.680
106.0120 1.24 0.72 0.16 2.1220.0 18.6 8.7
Control 213.4 2.50 2.33 1.20 6.0348.3 37.0FS2 18.32.13 1.95 1.00 5.08186.316.329.140.640
13.3 170.8 1.88 1.96 0.39 4.2332.380 18.31.52 1.35 0.33 3.20120.127.0120 9.317.3
Control 250.1 2.91 2.52 1.31 6.7452.1 32.6FS5 16.640 230.1 2.74 2.33 1.10 6.1748.0 24.0 14.6
1.91 2.20 0.41 4.52218.312.321.044.6801.79 2.10120 0.37 4.1733.0 13.3 10.3 171.9
Summary of significance of 6ariance sources** ** n.s.** **2 ** n.s. **Genotypes (G)
3 ** ** ** ** **** **Salinity (S) **n.s. ** n.s. n.s. n.s. n.s.GxS 6 ** n.s.
** Significant at PB0.01; n.s., non-significant.
A. Wahid et al. / En6ironmental and Experimental Botany 42 (1999) 85–9490
none of the genotype could survive up to harvesttime, hence the data have been presented up to120 mmol NaCl l−1 only. The results given hereare the average of 2 study years.
3.1. Germination studies
All the genotypes indicated highly significant(PB0.01) differences with respect to germinationand related parameters (Table 1). Under salinity,FS2 had the highest germination percentage, elon-gation and dry matter yield of radicle andplumule over controls and was thus regarded ashighly salt tolerant at this stage followed by FS5.
3.2. Symptoms of salt injury
Genotypes exhibited increased symptoms of saltinjury in the form of tip burning and chlorosis ofleaves and stem chlorosis with a rise in salinity,but the degree of salt damage was greatly variablein the young and old leaves as well as the stem(Table 2). At 20 DAE, FS2 indicated a low degreeof salt damage on young leaves but the injury washigher on stem. In contrast, FS5 at 35 and 50DAE indicated the lowest effect of salt damage on
young leaves but it was greater on the old leavesand stem.
3.3. Growth and yield characteristics
Table 3 shows that at 20, 35, 50 DAE, appliedsalinity highly significantly (PB0.01) reducedmost of the growth and yield parameters, indicat-ing highly significant (PB0.01) genotypic differ-ences. At 20 DAE, FS2 performed best of all thegenotypes and gave greatest root length, numberand area of green leaves, while leaf and total dryweight were highest in FS1 and shoot and totaldry weight were higher in FS5 over respectivecontrols. At 35, 50 DAE and maturity, FS5 wassuperior to all other genotypes in giving greaternumber and area of leaves, dry matter yield ofleaf, stem, root and their total as expressed on thebasis of controls, while highest shoot and rootlength were recorded in FS2 at 35 DAE and inFS1 at 50 DAE.
At 70 DAE, applied salinity highly significantlyreduced (PB0.01) economic yield parameters,with highly significant (PB0.01) interactions ofgenotypes and salt levels (Table 4). Greater head
Table 4Effect of sodium chloride salinity on some yield characteristics of sunflower genotypes
100 seed weight Seed oil contentTotal seed yield perGenotypes Head diameterSalt levels (mmol NaCl(cm) plantl−1) (%)(g)
FS1 Control 8.57 4.96 3.79 33.628.53.003.956.9040
80 5.67 2.93 2.20 23.712 19.24.80 0.84 1.87Control 31.98.17 4.09FS2 3.80
27.13.103.347.13402.90 23.280 6.33 1.46
19.12.100.965.77123.504.99 34.78.30ControlFS5
28.940 7.57 3.30 3.0080 6.43 2.46 2.40 25.112 5.33 1.25 2.21 22.7
Summary of significance of 6ariance sources******2Genotypes (G) **
3 **Salinity (S) ** ** **6 **GxS ** ** **
** Significant at PB0.01; n.s., non-significant.
A. Wahid et al. / En6ironmental and Experimental Botany 42 (1999) 85–94 91
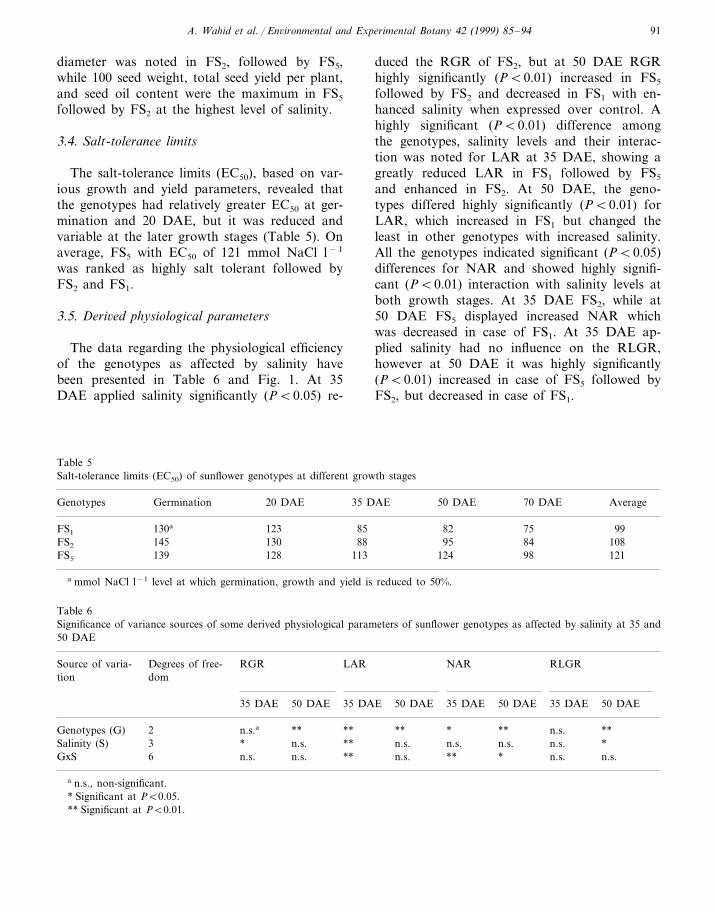
diameter was noted in FS2, followed by FS5,while 100 seed weight, total seed yield per plant,and seed oil content were the maximum in FS5
followed by FS2 at the highest level of salinity.
3.4. Salt-tolerance limits
The salt-tolerance limits (EC50), based on var-ious growth and yield parameters, revealed thatthe genotypes had relatively greater EC50 at ger-mination and 20 DAE, but it was reduced andvariable at the later growth stages (Table 5). Onaverage, FS5 with EC50 of 121 mmol NaCl l−1
was ranked as highly salt tolerant followed byFS2 and FS1.
3.5. Deri6ed physiological parameters
The data regarding the physiological efficiencyof the genotypes as affected by salinity havebeen presented in Table 6 and Fig. 1. At 35DAE applied salinity significantly (PB0.05) re-
duced the RGR of FS2, but at 50 DAE RGRhighly significantly (PB0.01) increased in FS5
followed by FS2 and decreased in FS1 with en-hanced salinity when expressed over control. Ahighly significant (PB0.01) difference amongthe genotypes, salinity levels and their interac-tion was noted for LAR at 35 DAE, showing agreatly reduced LAR in FS1 followed by FS5
and enhanced in FS2. At 50 DAE, the geno-types differed highly significantly (PB0.01) forLAR, which increased in FS1 but changed theleast in other genotypes with increased salinity.All the genotypes indicated significant (PB0.05)differences for NAR and showed highly signifi-cant (PB0.01) interaction with salinity levels atboth growth stages. At 35 DAE FS2, while at50 DAE FS5 displayed increased NAR whichwas decreased in case of FS1. At 35 DAE ap-plied salinity had no influence on the RLGR,however at 50 DAE it was highly significantly(PB0.01) increased in case of FS5 followed byFS2, but decreased in case of FS1.
Table 5Salt-tolerance limits (EC50) of sunflower genotypes at different growth stages
20 DAEGerminationGenotypes Average70 DAE50 DAE35 DAE
130a 123 85 82 75 99FS1
145 130 88FS2 95 10884113 124 98 121FS5 139 128
a mmol NaCl l−1 level at which germination, growth and yield is reduced to 50%.
Table 6Significance of variance sources of some derived physiological parameters of sunflower genotypes as affected by salinity at 35 and50 DAE
RLGRNARLARRGRSource of varia- Degrees of free-tion dom
50 DAE35 DAE50 DAE35 DAE50 DAE35 DAE50 DAE35 DAE
n.s. **2Genotypes (G) n.s.a ** ** ** * ****n.s.*3Salinity (S) *n.s.n.s.n.s.n.s.
n.s.n.s. n.s.n.s.***n.s.6 **GxS
a n.s., non-significant.* Significant at PB0.05.** Significant at PB0.01.

A. Wahid et al. / En6ironmental and Experimental Botany 42 (1999) 85–9492
Fig. 1. Changes in derived growth parameters of sunflower genotypes FS1 (�), FS2 (), FS5 () under sodium chloride salinityat 35 and 50 DAE of seedlings.
A. Wahid et al. / En6ironmental and Experimental Botany 42 (1999) 85–94 93
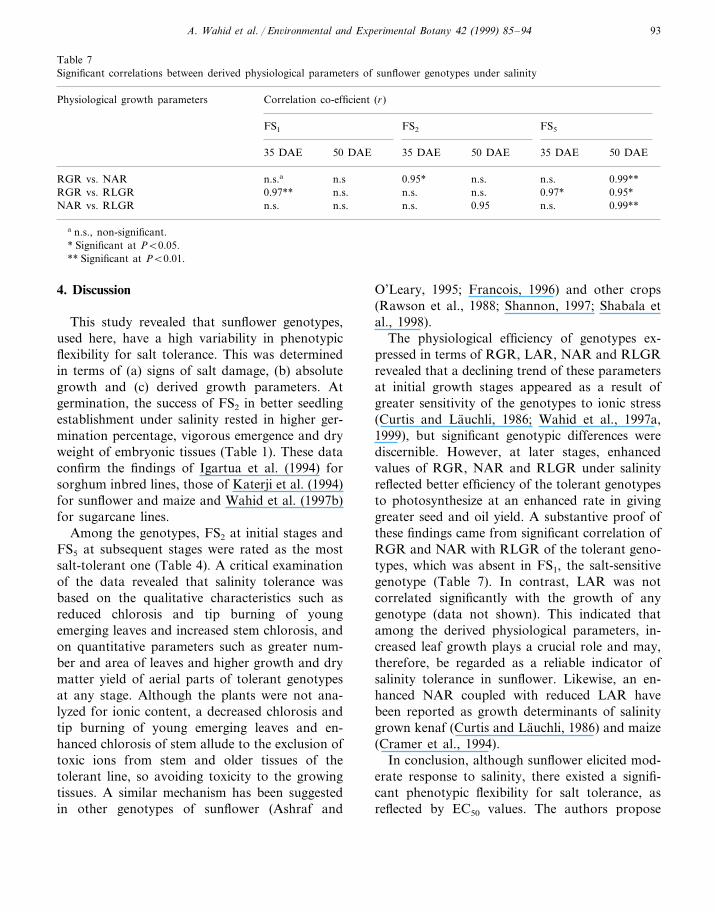
Table 7Significant correlations between derived physiological parameters of sunflower genotypes under salinity
Physiological growth parameters Correlation co-efficient (r)
FS2 FS5FS1
50 DAE 35 DAE 50 DAE 35 DAE 50 DAE35 DAE
n.s 0.95*RGR vs. NAR n.s.n.s.a n.s. 0.99**RGR vs. RLGR 0.97** n.s. n.s. n.s. 0.97* 0.95*NAR vs. RLGR n.s. n.s. n.s. 0.95 n.s. 0.99**
a n.s., non-significant.* Significant at PB0.05.** Significant at PB0.01.
4. Discussion
This study revealed that sunflower genotypes,used here, have a high variability in phenotypicflexibility for salt tolerance. This was determinedin terms of (a) signs of salt damage, (b) absolutegrowth and (c) derived growth parameters. Atgermination, the success of FS2 in better seedlingestablishment under salinity rested in higher ger-mination percentage, vigorous emergence and dryweight of embryonic tissues (Table 1). These dataconfirm the findings of Igartua et al. (1994) forsorghum inbred lines, those of Katerji et al. (1994)for sunflower and maize and Wahid et al. (1997b)for sugarcane lines.
Among the genotypes, FS2 at initial stages andFS5 at subsequent stages were rated as the mostsalt-tolerant one (Table 4). A critical examinationof the data revealed that salinity tolerance wasbased on the qualitative characteristics such asreduced chlorosis and tip burning of youngemerging leaves and increased stem chlorosis, andon quantitative parameters such as greater num-ber and area of leaves and higher growth and drymatter yield of aerial parts of tolerant genotypesat any stage. Although the plants were not ana-lyzed for ionic content, a decreased chlorosis andtip burning of young emerging leaves and en-hanced chlorosis of stem allude to the exclusion oftoxic ions from stem and older tissues of thetolerant line, so avoiding toxicity to the growingtissues. A similar mechanism has been suggestedin other genotypes of sunflower (Ashraf and
O’Leary, 1995; Francois, 1996) and other crops(Rawson et al., 1988; Shannon, 1997; Shabala etal., 1998).
The physiological efficiency of genotypes ex-pressed in terms of RGR, LAR, NAR and RLGRrevealed that a declining trend of these parametersat initial growth stages appeared as a result ofgreater sensitivity of the genotypes to ionic stress(Curtis and Lauchli, 1986; Wahid et al., 1997a,1999), but significant genotypic differences werediscernible. However, at later stages, enhancedvalues of RGR, NAR and RLGR under salinityreflected better efficiency of the tolerant genotypesto photosynthesize at an enhanced rate in givinggreater seed and oil yield. A substantive proof ofthese findings came from significant correlation ofRGR and NAR with RLGR of the tolerant geno-types, which was absent in FS1, the salt-sensitivegenotype (Table 7). In contrast, LAR was notcorrelated significantly with the growth of anygenotype (data not shown). This indicated thatamong the derived physiological parameters, in-creased leaf growth plays a crucial role and may,therefore, be regarded as a reliable indicator ofsalinity tolerance in sunflower. Likewise, an en-hanced NAR coupled with reduced LAR havebeen reported as growth determinants of salinitygrown kenaf (Curtis and Lauchli, 1986) and maize(Cramer et al., 1994).
In conclusion, although sunflower elicited mod-erate response to salinity, there existed a signifi-cant phenotypic flexibility for salt tolerance, asreflected by EC50 values. The authors propose

A. Wahid et al. / En6ironmental and Experimental Botany 42 (1999) 85–9494
that higher germination, vigorous growth ofseedlings, sustained photosynthetic area, raresigns of salt damage in the form of tip burningand chlorosis of young leaves, increased stemchlorosis and increased RLGR are useful criteriaof selection for salinity tolerance. FS5, a highlysalt-tolerant genotype, can be successfully grownin moderately saline areas. The problem of rela-tively reduced germination can be overcome byachieving optimum plant density with the use ofhigh seed rate.
References
Anonymous, 1996. Agricultural Statistics of Pakistan. Min-istry of Food Agriculture and Livestock. Government ofPakistan, Islamabad.
AOAC, 1970. Official method of analysis. Association ofOfficial Analytical Chemists, Washington, DC.
Ashraf, M., O’Leary, J.W., 1995. Distribution of cations inleaves of salt-tolerant and salt-sensitive lines of sunflowerunder saline conditions. J. Plant Nutr. 18, 2379–2388.
Cramer, G.R., Alberico, G.J., Schmidt, C., 1994. Leaf expan-sion limits dry matter accumulation of salt stressed maize.Aust. J. Plant Physiol. 21, 663–674.
Curtis, P.S., Lauchli, A., 1986. The role of leaf area develop-ment and photosynthetic capacity in determining growth ofKenaf under moderate salt stress. Aust. J. Plant Physiol.13, 553–565.
Francois, L.E., 1994. Growth, seed yield and ion content ofcanola grown under saline conditions. Agron. J. 86, 233–237.
Francois, L.E., 1996. Salinity effects on four sunflower hy-brids. Agron. J. 88, 215–219.
Garcia, A., Senadhira, Flowers, T.J., Yeo, A.R., 1995. Theeffect of selection for sodium transport and for agronomiccharacteristics upon salt resistance in rice (Oryza sati6a L.).Theor. Appl. Genet. 90, 1106–1111.
Hunt, R., 1982. Plant growth curves: an introduction tofunctional approach to plant growth analysis. EdwardArnold, London.
Igartua, E., Gracia, M.P., Lasa, J.M., 1994. Characterizationand genetic control of germination: emergence responses ofgrain sorghum to salinity. Euphytica 76, 185–193.
Isla, R., Aragues, R., Royo, A., 1998. Validity of variousphysiological traits as screening criteria for salt tolerance inbarley. Field Crops Res. 58, 663–674.
Katerji, N., van Hoorn, J.W., Hamdy, A., Karam, F., Mastro-rilly, M., 1994. Effect of salinity on emergence and onwater stress and early seedling growth of sunflower andmaize. Agric. Water Manage. 26, 81–91.
Lutts, S., Kinet, J.M., Bouharmont, J., 1996. NaCl inducedsenescence in leaves of rice (Oryza sati6a L.) cultivarsdiffering in salinity resistance. Ann. Bot. 78, 389–398.
Minitab, 1989. Minitab statistical software. Release-7, StateCollege Pennsylvania, PA.
Rawson, H.M., Richards, R.A., Munns, R., 1988. An exami-nation of selection criteria for salt tolerance in wheat,barley and triticale genotypes. Aust. J. Agric. Res. 39,759–772.
Shabala, N.S., Shabala, S.I., Martynenko, A.I., Babourima,O., Newman, I.A., 1998. Salinity effect on the bioelectricactivity, growth, Na+ accumulation and chlorophyllfluorescence of maize leaves: a comparative survey andprospects for screening. Aust. J. Plant Physiol. 25, 609–616.
Shannon, M.C., 1997. Adaptation of plants to salinity. Adv.Agron. 60, 76–199.
Stumpf, D.K., Prisco, J.T., Weeks, J.R., Lindley, V.A.,O’Leary, J.W., 1986. Salinity and Salicornia bigelo6ii Torr.seedling establishment. Water relations. J. Exp. Bot. 37,160–169.
Wahid, A., Rao, A.R., Rasul, E., 1997a. Identification of salttolerance traits in sugarcane lines. Field Crops Res. 54,9–17.
Wahid, A., Rasul, E., Rao, A.R., 1997b. Germination re-sponses of sensitive and tolerant sugarcane lines to sodiumchloride. Seed Sci. Technol. 25, 465–470.
Wahid, A., Rasul, E., Rao, A.R., 1999. Germination of seedsand propagules under salt stress. In: Pessarakli, M. (Ed.),Handbook of Plant and Crop Stress, 2. Marcel Dekker,New York, pp. 153–167.
.