Biodiesel from sunflower oil by using activated calcium oxide
10
Biodiesel from sunflower oil by using activated calcium oxide M. Lo ´pez Granados a, * , M.D. Zafra Poves a , D. Martı ´n Alonso a , R. Mariscal a , F. Cabello Galisteo a , R. Moreno-Tost a , J. Santamarı ´a b , J.L.G. Fierro a a Instituto de Cata ´lisis y Petroleoquı ´mica, CSIC, C/Marie Curie 2, Cantoblanco, 28049 Madrid, Spain b Departamento de Quı ´mica Inorga ´nica, Cristalografı ´a y Mineralogı ´a, Facultad de Ciencias, Universidad de Ma ´laga, Campus de Teatinos, 29071 Ma ´laga, Spain Received 9 October 2006; received in revised form 18 December 2006; accepted 23 December 2006 Available online 9 January 2007 Abstract This work studies the activity of activated CaO as a catalyst in the production of biodiesel by transesterification of triglycerides with methanol. Three basic aspects were investigated: the role of H 2 O and CO 2 in the deterioration of the catalytic performance by contact with room air, the stability of the catalyst by reutilization in successive runs and the heterogeneous character of the catalytic reaction. The characterization by X-ray diffraction (XRD), evolved gas analysis by mass spectrometry (EGA-MS) during heating the sample under programmed temperature, X-ray photoelectron (XPS) and Fourier transform-infrared (FT-IR) spectroscopies allowed to concluding that CaO is rapidly hydrated and carbonated by contact with room air. Few minutes are enough to chemisorb significant amount of H 2 O and CO 2 . It is demonstrated that the CO 2 is the main deactivating agent whereas the negative effect water is less important. As a matter of fact the surface of the activated catalyst is better described as an inner core of CaO particles covered by very few layers of Ca(OH) 2 . The activation by outgassing at temperatures 973 K are required to revert the CO 2 poisoning. The catalyst can be reused for several runs without significant deactivation. The catalytic reaction is the result of the heterogeneous and homogeneous contributions. Part of the reaction takes place on basic sites at the surface of the catalyst, the rest is due to the dissolution of the activated CaO in methanol that creates homogeneous leached active species. # 2007 Elsevier B.V. All rights reserved. Keywords: Lime; CaO; Ca(OH) 2 ; CaCO 3 ; Transesterification; Fatty acid methyl esters (FAME); Heterogeneous basic catalyst 1. Introduction Biodiesel is a non-toxic biodegradable fuel produced from vegetable oils by the transesterification of triglycerides with methanol. Therefore biodiesel can be considered an environ- mental friendly and a renewable fuel arising from biomass [1,2]. With regard to emissions it has been demonstrated that its net CO 2 emissions is rather low taking into account its renewable origin. Other toxic emissions like CO, SO x , unburned hydrocarbons and soot particles are also considerably reduced when burnt in the Diesel engine (the results concerning the NO x emission indicates slightly larger values than conventional diesel) [3]. Other advantages of the biodiesel are its good lubricant properties that extend the engine life, its high cetane number, its high flash point and its acceptable cold filter plugging point (CFPP) which makes it very attractive as a alternative fuel [4]. However the high final cost of the production with respect to that of petroleum-derived diesel fuel limits its widespread use. An important contribution to the final cost arises from the catalytic transesterification reaction. The current technology utilizes homogeneous catalysts (NaOH or KOH dissolved in methanol, a corrosive liquid) [1,5]. The produced biodiesel and glycerine must be separated and purified to remove the basic catalyst what requires time consuming and expensive separa- tion steps [6,7]. Moreover the purification is a non-environ- mental-friendly process because implies the consumption of large amounts of water and the disposal a highly basic streams [1,2]. The utilization of a successful heterogeneous catalyst will cope with most of the economical and environmental draw- backs of a homogeneous process. Thus, the heterogeneous catalyst is not disposed but rapidly separated from the reaction mixture by filtration avoiding the time consuming rinsing steps www.elsevier.com/locate/apcatb Applied Catalysis B: Environmental 73 (2007) 317–326 * Corresponding author. Tel.: +34 91 5854937; fax: +34 91 5854760. E-mail address: [email protected] (M.L. Granados). 0926-3373/$ – see front matter # 2007 Elsevier B.V. All rights reserved. doi:10.1016/j.apcatb.2006.12.017
-
Upload
independent -
Category
Documents
-
view
0 -
download
0
Transcript of Biodiesel from sunflower oil by using activated calcium oxide

www.elsevier.com/locate/apcatb
Applied Catalysis B: Environmental 73 (2007) 317–326
Biodiesel from sunflower oil by using activated calcium oxide
M. Lopez Granados a,*, M.D. Zafra Poves a, D. Martın Alonso a, R. Mariscal a,F. Cabello Galisteo a, R. Moreno-Tost a, J. Santamarıa b, J.L.G. Fierro a
a Instituto de Catalisis y Petroleoquımica, CSIC, C/Marie Curie 2, Cantoblanco, 28049 Madrid, Spainb Departamento de Quımica Inorganica, Cristalografıa y Mineralogıa, Facultad de Ciencias, Universidad de Malaga,
Campus de Teatinos, 29071 Malaga, Spain
Received 9 October 2006; received in revised form 18 December 2006; accepted 23 December 2006
Available online 9 January 2007
Abstract
This work studies the activity of activated CaO as a catalyst in the production of biodiesel by transesterification of triglycerides with methanol.
Three basic aspects were investigated: the role of H2O and CO2 in the deterioration of the catalytic performance by contact with room air, the
stability of the catalyst by reutilization in successive runs and the heterogeneous character of the catalytic reaction. The characterization by X-ray
diffraction (XRD), evolved gas analysis by mass spectrometry (EGA-MS) during heating the sample under programmed temperature, X-ray
photoelectron (XPS) and Fourier transform-infrared (FT-IR) spectroscopies allowed to concluding that CaO is rapidly hydrated and carbonated by
contact with room air. Few minutes are enough to chemisorb significant amount of H2O and CO2. It is demonstrated that the CO2 is the main
deactivating agent whereas the negative effect water is less important. As a matter of fact the surface of the activated catalyst is better described as
an inner core of CaO particles covered by very few layers of Ca(OH)2. The activation by outgassing at temperatures�973 K are required to revert
the CO2 poisoning. The catalyst can be reused for several runs without significant deactivation. The catalytic reaction is the result of the
heterogeneous and homogeneous contributions. Part of the reaction takes place on basic sites at the surface of the catalyst, the rest is due to the
dissolution of the activated CaO in methanol that creates homogeneous leached active species.
# 2007 Elsevier B.V. All rights reserved.
Keywords: Lime; CaO; Ca(OH)2; CaCO3; Transesterification; Fatty acid methyl esters (FAME); Heterogeneous basic catalyst
1. Introduction
Biodiesel is a non-toxic biodegradable fuel produced from
vegetable oils by the transesterification of triglycerides with
methanol. Therefore biodiesel can be considered an environ-
mental friendly and a renewable fuel arising from biomass
[1,2]. With regard to emissions it has been demonstrated that its
net CO2 emissions is rather low taking into account its
renewable origin. Other toxic emissions like CO, SOx,
unburned hydrocarbons and soot particles are also considerably
reduced when burnt in the Diesel engine (the results concerning
the NOx emission indicates slightly larger values than
conventional diesel) [3]. Other advantages of the biodiesel
are its good lubricant properties that extend the engine life, its
high cetane number, its high flash point and its acceptable cold
* Corresponding author. Tel.: +34 91 5854937; fax: +34 91 5854760.
E-mail address: [email protected] (M.L. Granados).
0926-3373/$ – see front matter # 2007 Elsevier B.V. All rights reserved.
doi:10.1016/j.apcatb.2006.12.017
filter plugging point (CFPP) which makes it very attractive as a
alternative fuel [4].
However the high final cost of the production with respect to
that of petroleum-derived diesel fuel limits its widespread use.
An important contribution to the final cost arises from the
catalytic transesterification reaction. The current technology
utilizes homogeneous catalysts (NaOH or KOH dissolved in
methanol, a corrosive liquid) [1,5]. The produced biodiesel and
glycerine must be separated and purified to remove the basic
catalyst what requires time consuming and expensive separa-
tion steps [6,7]. Moreover the purification is a non-environ-
mental-friendly process because implies the consumption of
large amounts of water and the disposal a highly basic streams
[1,2].
The utilization of a successful heterogeneous catalyst will
cope with most of the economical and environmental draw-
backs of a homogeneous process. Thus, the heterogeneous
catalyst is not disposed but rapidly separated from the reaction
mixture by filtration avoiding the time consuming rinsing steps
M.L. Granados et al. / Applied Catalysis B: Environmental 73 (2007) 317–326318
to purify both the biodiesel and the glycerine and preventing the
consumption of large volume of water. And last but not least,
the filtered solid could be re-used. The catalyst is not consumed
in the production process as it is in the homogeneous case in
which a fresh batch of catalyst is loaded for each batch
production. Some solid catalysts, basic or acid, have been tested
in the transesterification reaction of triglycerides with
methanol. Basic catalysts showed higher reaction rate than
acid solids and they have been preferably studied. However,
although several basic catalysts have showed promising
activities like basic zeolites [8], alkali and alkali earth oxides
[9,10], alkali and alkali earth carbonates [11], supported
guanidines [12,13] and basic hydrotalcites [14,15] so far none
have replaced the homogeneous catalyst.
Among the alkali and alkali earth oxides, CaO is one of the
solids that have displayed higher transesterification activity
[16–18]. As any other basic catalyst, its surface sites can be
poisoned by contact with room air due to the adsorption of CO2
and H2O at the surface of the solid as carbonates and hydroxyls
groups [19]. To our knowledge, the effect that this poisoning
mechanism may have on the transesterification rate has not
been investigated yet. The second goal of the study is to test the
stability of the CaO. Thus the CaO was reutilised for several
runs. Finally other alkali earth oxides or hydroxides, like for
instance SrO or Ba(OH)2 present high activity buy they are
fully dissolved in the reaction media that means that in such
cases the catalysis is homogeneous. CaO is only little dissolved
in the reaction media [16] and it is not clear yet whether the
reaction takes place on the basic surface sites of the CaO or
involved the few homogeneous basic species leached to the
reaction media (for instance it seems plausible that soluble Ca
methoxide may be formed in the reaction between methanol
and the surface of CaO). The third goal of this study is to
investigate how important the homogeneous contribution is
versus that occurring at the surface of the solid (heterogenoeus).
The three goals are essential for its industrial application.
2. Experimental
2.1. Sample preparation and storing
The CaO was supplied as a fine powder by Aldrich (99.9% of
the metallic atoms are Ca). The supplier indicates that ca. 10%
of the weight is lost by calcination at 1000 8C that indicates that
CaO is partially carbonated and hydrated. The as received CaO
was stored under vacuum in a desiccator that contains silica gel
and KOH pellets to remove the H2O and CO2 of the residual
desiccator atmosphere. This ‘‘fresh CaO’’ sample was labelled
as CaO.
The CaO, incipiently carbonated and hydrated, was exposed
to room air in a flat plate for different periods of time to extend
the carbonation and hydration processes. After the contacting
with room air for a given period of time the solid was stored
under vacuum in the desiccator. The samples exposed to air
were labelled a-CaO followed by the days in contact with air.
Thus a-CaO-20 means that the fresh CaO was exposed to room
air for 20 days.
2.2. Catalyst characterisation
2.2.1. Evolved gas analysis by mass spectrometry (EGA-
MS)
EGA-MS profiles were obtained from a 50 mg powder
sample placed in a U-shaped quartz reactor, the exit of which
was connected to a Balzer PrismaTM quadrupole mass
spectrometer (QMS 200) for on line gas analysis. The sample
consisted of solid particles in the 0.42–0.5 mm range. The gas
flow rate was 50 mL min�1 (20% O2 in Ar). The analysis was
conducted while heating the sample at 10 K min�1 (298–
1100 K). The signals from CO2 (m/z = 44), CO (m/z = 28) and
H2O (m/z = 18) were continuously monitored by the mass
spectrometer in order to follow the processes of decarbonation
and dehydration of the solid. Gas lines from the reactor to the
inlet of the mass spectrometer were heated to 393 K to avoid
water condensation.
2.2.2. X-ray diffraction and X-ray thermodiffractometry
studies
Powder X-ray diffraction (XRD) patterns were recorded in
the 5–858 2u range in the scan mode (step size 0.028, counting
1 s per step) using a Seifert 3000 XRD diffractometer equipped
with a PW goniometer with Bragg–Brentano u/2u geometry, an
automatic slit, and a bent graphite monochromator. The
samples were stored in an eppendorf filled with N2 until the
recording of the XRD to prevent the contact with room air.
Thermodiffactometric data were recorded on a Siemens
D5000 automated diffractometer with Bragg–Brentano geo-
metry using a graphite monochromator equipped with HTK10
heating chamber that allows heating treatments of the sample
under the flow of an inert gas (ca. 25 mL min�1 of He). Samples
were heated up to a given temperature (5 K min�1). The
patterns were recorded (over the angular range 15–458,counting 1 s per step and a step size of 0.048) after a delay
time of 10 min to ensure sample thermal stabilisation.
2.2.3. X-Ray photoelectron spectroscopy
X-ray photoelectron spectroscopy (XPS) studies were
performed with a VG Escalab 200 R spectrometer equipped
with a hemispherical electron analyzer and a Mg Ka
(1253.6 eV) X-ray source. The sample was first placed in a
copper holder mounted on a sample-rod in the pretreatment
chamber of the spectrometer. It was then outgassed at room
temperature at 473 and at 773 K for 1 h before transferred to the
analysis chamber. In order to study the treatment at 973 K the
following procedure was carried out. Sample was ex situ
outgassed in a quartz cell at 973 K and once at room
temperature, isooctane was added in excess to cover the solid. A
portion of the soaked solid was then mounted in the copper
holder and outgassed at room temperature in the pretreatment
chamber for removing the weakly physisorbed isooctane.
O 1s, Ca 2p and C 1s regions of the XPS spectrum was
scanned a number of times in order to obtain a good signal-to-
noise ratio. For removing the shifts caused by charging effects
the binding energies (BE) were referenced by C 1s level of
carbonates (290.0 eV) as it was presumed that carbonates are
M.L. Granados et al. / Applied Catalysis B: Environmental 73 (2007) 317–326 319
present in the samples. This selection was found to be
consistent as the BE of C 1s level from adventitious
hydrocarbon and the position of O 1s core level from O2�,
OH� and CO32� were in agreement with the values reported in
literature [23–27]. When the carbonate peak was not observed,
then the C 1s peak of saturated hydrocarbon (285.0 eV) was
then used. The areas of the peaks were computed by fitting the
experimental spectra to Gaussian/Lorenztian curves after
removal of the background (use of Shirley function).
2.2.4. Fourier transform-infrared spectra
Infrared spectra of self supported wafers (ca. 12 mg cm�2)
were recorded with a Nicolet 5700 Fourier transform spectro-
photometer equipped with an Hg–Cd–Te cryodetector, working
in the range of wavenumbers 4000–650 cm�1 at a resolution of
4 cm�1. Each spectra was averaged over 256 scans. The
recording of the spectra was carried out in an infrared vacuum
cell equipped with greaseless stopcocks and KBr windows.
This cell allows outgassing of the samples at different
temperatures and the dosing of pulses of gases to submit the
samples to different controlled gas environment.
2.2.5. Catalytic activity measurements and re-utilization of
the catalysts
The catalytic reaction was carried out in a three-necked
jacketed batch reactor. A reflux condenser was connected to one
of the necks, another neck was for introducing the (helix) stirrer
and a dropping funnel was connected to the third one. The
finely grounded sample (ca. 0.5 g) was previously in situ
pretreated at a given temperature for 2 h by outgassing (heating
rate = 5 K min�1). This treatment of the CaO sample results in
a weight loss (ca. 5% at 773 K and ca. 10% at 973 K). Once the
sample was at room temperature, 50 g of oil (refined sunflower
oil, food grade) was added. The solid–oil mixture was heated
under strong agitation (1000 rpm) up to 333 K. Then methanol
previously heated at 333 K was added to the oil–catalyst
mixture by using the dropping funnel (t = 0 min of the catalytic
reaction). The reaction mixture was maintained under static N2
and under vigorous agitation (1000 rpm) while performing the
catalytic reaction. The methanol/oil molar ratio was ca. 13
(more than four times the stoichiometric value) in an attempt to
increase the FAME yield by displacing the equilibrium towards
the FAME formation and to minimize any effect of the
methanol losses. Methanol losses can occur either during the
methanol addition or during sampling of the reaction mixture.
Aliquots (ca. 2 mL) were taken from the agitating reaction
mixtures at different reaction times. The reaction was quenched
by addition to an aqueous HCl solution containing twice the
stoichiometric amount required to neutralize the CaO. After
agitation for few minutes, dichloromethane was added, this
mixture was again agitated and set aside to develop two layers:
the ester layer containing dichloromethane, mono, di and
triglycerides and FAME (and traces of methanol and glycerine)
and the polar layer containing glycerine, methanol, water
dissolved HCl and CaCl2 (and traces of esters). The ester layer
was separated and subjected once more to the treatment with
HCl solution and dichloromethane. The dichloromethane was
then removed from the organic layer by evaporation at 333 K.
In this study the yields to mono and diglycerides were not
determined and it is assumed that the FAME yield was close to
the triglyceride conversion. This can be considered a good
approximation only for conversion larger than 30–40% since
the selectivity to these products are important for lower
triglyceride conversion [5–15]. Their selectivities rapidly
decrease as the reaction proceeds to larger conversion, the
yield to these products become very small for conversion larger
than 30–40% and minor in comparison with the FAME yield.
Consequently it is widely accepted that the yield to FAME is a
reasonable measurement to estimate the catalytic activity of the
solids studied in this work. This approximation is only true for
large conversion but it was valid for the conclusions derived in
this article. The content in FAME of the organic layer was
determined by following the European regulated procedure EN
14103. Basically, 250 mg of the organic layer was added to
5 mL of a heptane solution of the internal standard
methylheptadecanoate (10 g/L of C17 ester in heptane). The
FAME content (wt%) was calculated from the formula:
wt% ¼�ðP
Ai � AMHÞAMH
�CMHVMH � 100
W
whereP
Ai is the total peak area from methyl ester, from
methyl miristate (C14) to methyl nervonate (C24:1); AMH the
area of methyl heptadecanoate, which response factor is equal
to those of FAME; CMH the concentration in mg/mL of the
methyl heptadecanoate (10 mg/mL); VMH the volume in mL of
the methyl heptadecanoate solution (5 mL); W is the weigh in
mg of the sample (250 mg).
This solution was analysed in an Agilent 6890 GC with a HP
INNOwax capillary column. The weight content in FAME of
the organic layer was considered to represent the wt% yield in
FAME of the catalytic reaction assuming that, during the
neutralisation and the rinsing process of the ester phase, only
traces of esters was transferred to the polar phase and that only
the extraction of methanol and glycerine takes place.
The experimental procedure to test the reutilisation of the
catalyst was as follows: the first run was carried out as described
above (1 wt% of catalyst in 50 g of oil, methanol/oil molar
ratio = 13, 333 K, 1000 rpm, reaction time 100 min). Before
stopping the agitation an aliquot was sampled and analysed
following the method described above. Then the agitation was
stopped and the mixture was rapidly centrifuged at 6000 rpm
for 30 min. The solid was recovered and subjected to the
reaction-sampling-analysis-centrifugation sequence for several
successive runs without being subjected to any previous
activation-outgassing step.
3. Results and discussion
3.1. Bulk and surface characterisation of the samples
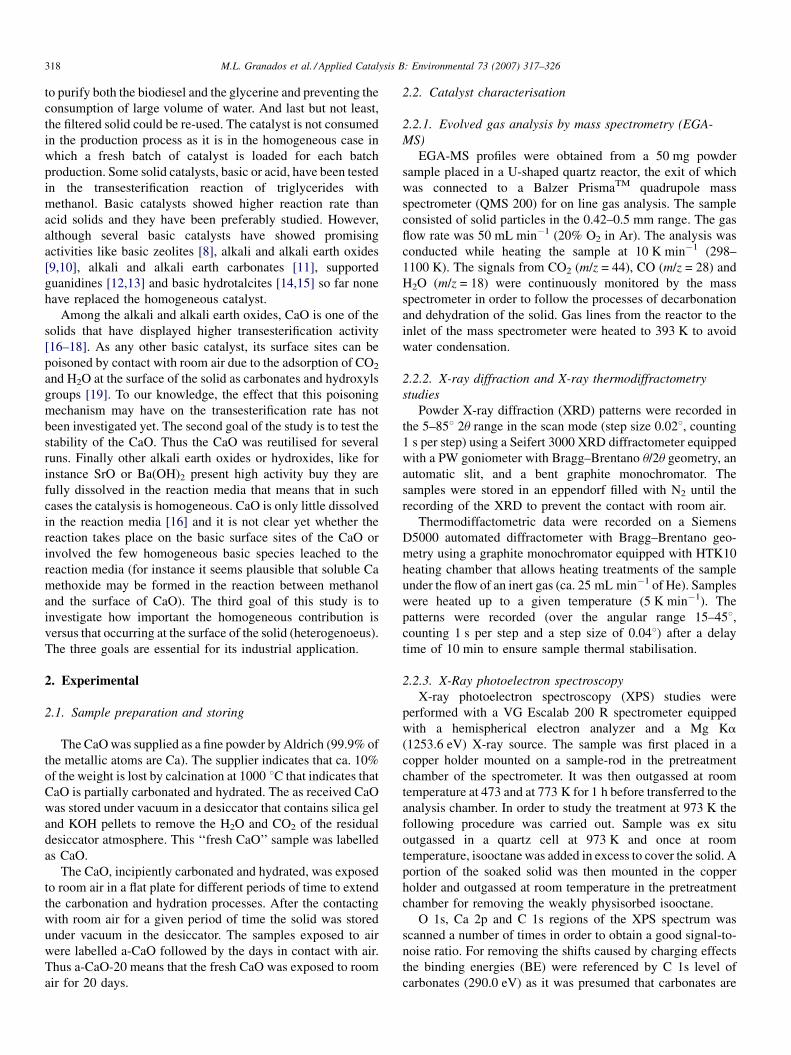
Fig. 1 shows the XRD patterns of the CaO sample and of the
a-CaO samples after exposure to room air for 10, 20, 40 and 120
days. The strongest reflections of the CaO sample are assigned
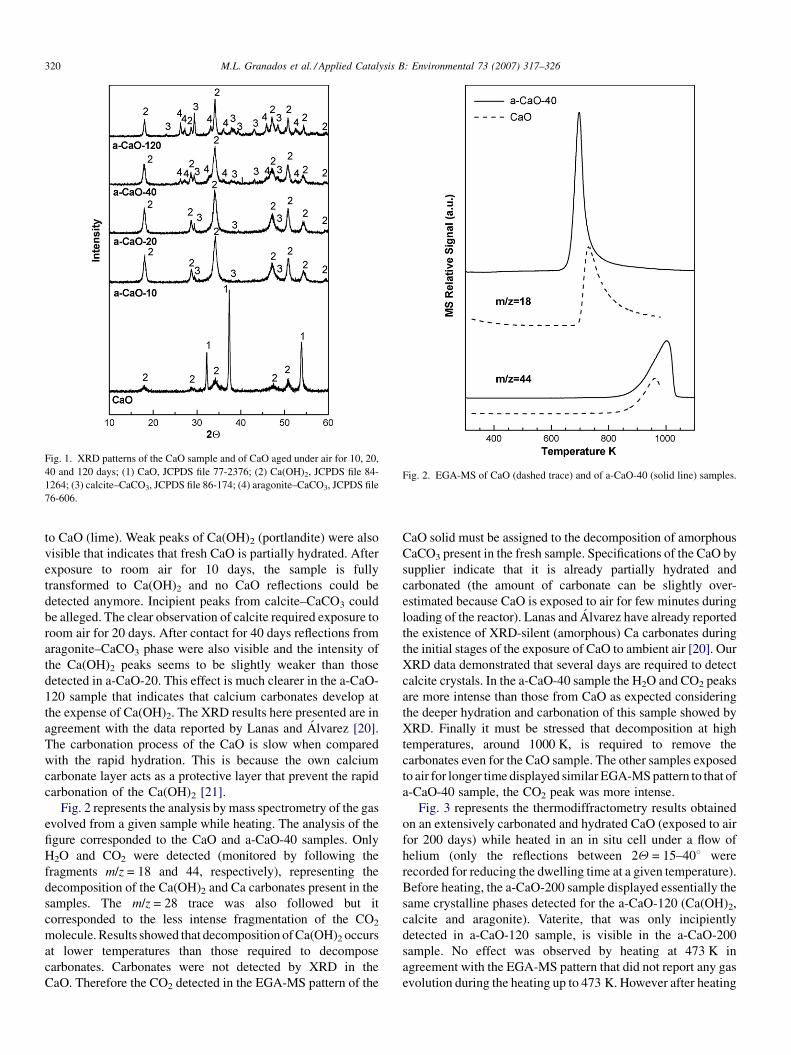
Fig. 1. XRD patterns of the CaO sample and of CaO aged under air for 10, 20,
40 and 120 days; (1) CaO, JCPDS file 77-2376; (2) Ca(OH)2, JCPDS file 84-
1264; (3) calcite–CaCO3, JCPDS file 86-174; (4) aragonite–CaCO3, JCPDS file
76-606.
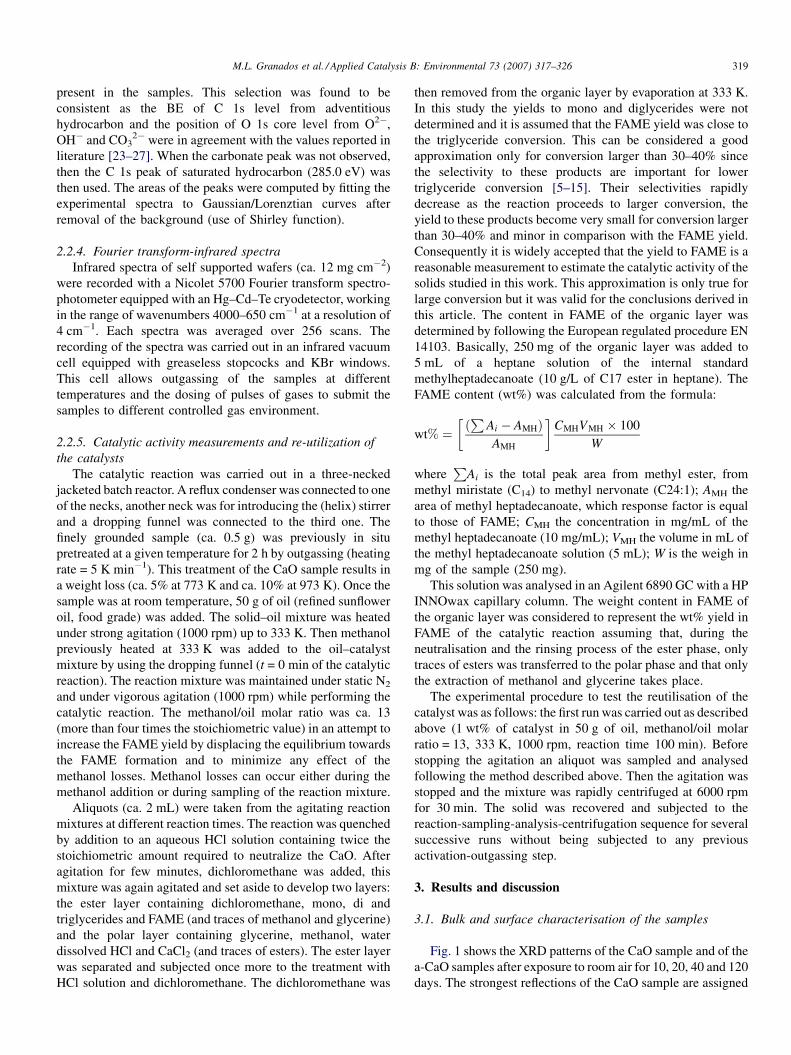
Fig. 2. EGA-MS of CaO (dashed trace) and of a-CaO-40 (solid line) samples.
M.L. Granados et al. / Applied Catalysis B: Environmental 73 (2007) 317–326320
to CaO (lime). Weak peaks of Ca(OH)2 (portlandite) were also
visible that indicates that fresh CaO is partially hydrated. After
exposure to room air for 10 days, the sample is fully
transformed to Ca(OH)2 and no CaO reflections could be
detected anymore. Incipient peaks from calcite–CaCO3 could
be alleged. The clear observation of calcite required exposure to
room air for 20 days. After contact for 40 days reflections from
aragonite–CaCO3 phase were also visible and the intensity of
the Ca(OH)2 peaks seems to be slightly weaker than those
detected in a-CaO-20. This effect is much clearer in the a-CaO-
120 sample that indicates that calcium carbonates develop at
the expense of Ca(OH)2. The XRD results here presented are in
agreement with the data reported by Lanas and Alvarez [20].
The carbonation process of the CaO is slow when compared
with the rapid hydration. This is because the own calcium
carbonate layer acts as a protective layer that prevent the rapid
carbonation of the Ca(OH)2 [21].
Fig. 2 represents the analysis by mass spectrometry of the gas
evolved from a given sample while heating. The analysis of the
figure corresponded to the CaO and a-CaO-40 samples. Only
H2O and CO2 were detected (monitored by following the
fragments m/z = 18 and 44, respectively), representing the
decomposition of the Ca(OH)2 and Ca carbonates present in the
samples. The m/z = 28 trace was also followed but it
corresponded to the less intense fragmentation of the CO2
molecule. Results showed that decomposition of Ca(OH)2 occurs
at lower temperatures than those required to decompose
carbonates. Carbonates were not detected by XRD in the
CaO. Therefore the CO2 detected in the EGA-MS pattern of the
CaO solid must be assigned to the decomposition of amorphous
CaCO3 present in the fresh sample. Specifications of the CaO by
supplier indicate that it is already partially hydrated and
carbonated (the amount of carbonate can be slightly over-
estimated because CaO is exposed to air for few minutes during
loading of the reactor). Lanas and Alvarez have already reported
the existence of XRD-silent (amorphous) Ca carbonates during
the initial stages of the exposure of CaO to ambient air [20]. Our
XRD data demonstrated that several days are required to detect
calcite crystals. In the a-CaO-40 sample the H2O and CO2 peaks
are more intense than those from CaO as expected considering
the deeper hydration and carbonation of this sample showed by
XRD. Finally it must be stressed that decomposition at high
temperatures, around 1000 K, is required to remove the
carbonates even for the CaO sample. The other samples exposed
to air for longer time displayed similar EGA-MS pattern to that of
a-CaO-40 sample, the CO2 peak was more intense.
Fig. 3 represents the thermodiffractometry results obtained
on an extensively carbonated and hydrated CaO (exposed to air
for 200 days) while heated in an in situ cell under a flow of
helium (only the reflections between 2Q = 15–408 were
recorded for reducing the dwelling time at a given temperature).
Before heating, the a-CaO-200 sample displayed essentially the
same crystalline phases detected for the a-CaO-120 (Ca(OH)2,
calcite and aragonite). Vaterite, that was only incipiently
detected in a-CaO-120 sample, is visible in the a-CaO-200
sample. No effect was observed by heating at 473 K in
agreement with the EGA-MS pattern that did not report any gas
evolution during the heating up to 473 K. However after heating
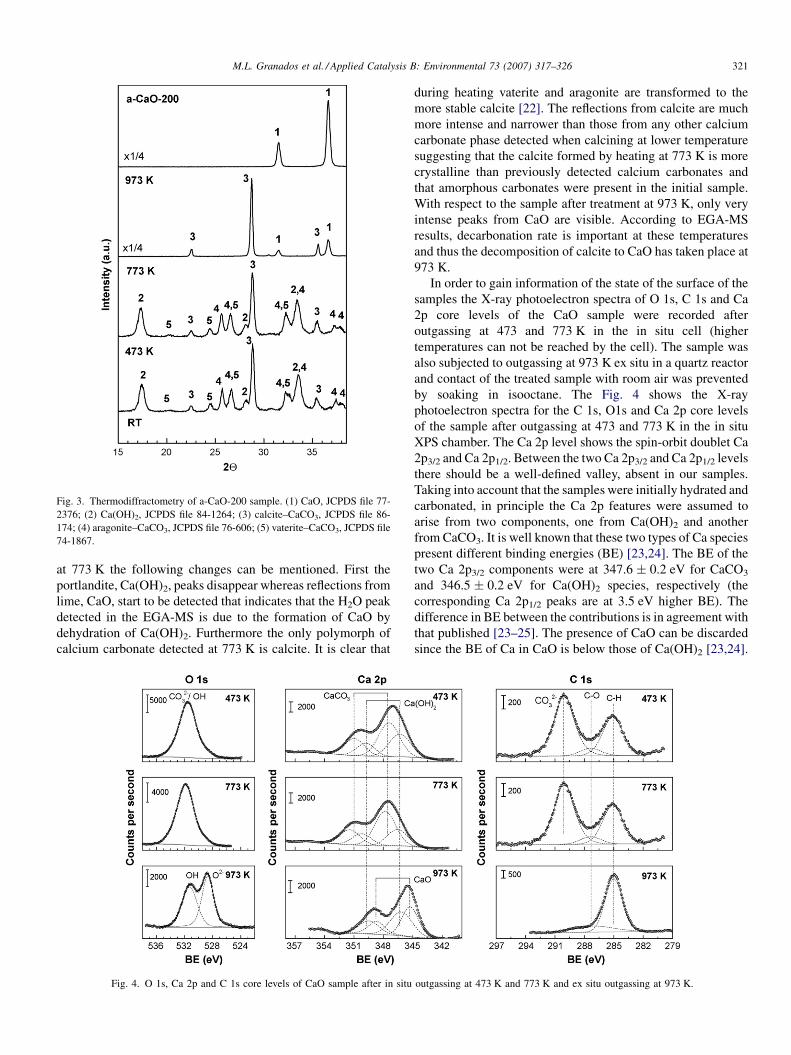
Fig. 3. Thermodiffractometry of a-CaO-200 sample. (1) CaO, JCPDS file 77-
2376; (2) Ca(OH)2, JCPDS file 84-1264; (3) calcite–CaCO3, JCPDS file 86-
174; (4) aragonite–CaCO3, JCPDS file 76-606; (5) vaterite–CaCO3, JCPDS file
74-1867.
M.L. Granados et al. / Applied Catalysis B: Environmental 73 (2007) 317–326 321
at 773 K the following changes can be mentioned. First the
portlandite, Ca(OH)2, peaks disappear whereas reflections from
lime, CaO, start to be detected that indicates that the H2O peak
detected in the EGA-MS is due to the formation of CaO by
dehydration of Ca(OH)2. Furthermore the only polymorph of
calcium carbonate detected at 773 K is calcite. It is clear that
Fig. 4. O 1s, Ca 2p and C 1s core levels of CaO sample after in situ
during heating vaterite and aragonite are transformed to the
more stable calcite [22]. The reflections from calcite are much
more intense and narrower than those from any other calcium
carbonate phase detected when calcining at lower temperature
suggesting that the calcite formed by heating at 773 K is more
crystalline than previously detected calcium carbonates and
that amorphous carbonates were present in the initial sample.
With respect to the sample after treatment at 973 K, only very
intense peaks from CaO are visible. According to EGA-MS
results, decarbonation rate is important at these temperatures
and thus the decomposition of calcite to CaO has taken place at
973 K.
In order to gain information of the state of the surface of the
samples the X-ray photoelectron spectra of O 1s, C 1s and Ca
2p core levels of the CaO sample were recorded after
outgassing at 473 and 773 K in the in situ cell (higher
temperatures can not be reached by the cell). The sample was
also subjected to outgassing at 973 K ex situ in a quartz reactor
and contact of the treated sample with room air was prevented
by soaking in isooctane. The Fig. 4 shows the X-ray
photoelectron spectra for the C 1s, O1s and Ca 2p core levels
of the sample after outgassing at 473 and 773 K in the in situ
XPS chamber. The Ca 2p level shows the spin-orbit doublet Ca
2p3/2 and Ca 2p1/2. Between the two Ca 2p3/2 and Ca 2p1/2 levels
there should be a well-defined valley, absent in our samples.
Taking into account that the samples were initially hydrated and
carbonated, in principle the Ca 2p features were assumed to
arise from two components, one from Ca(OH)2 and another
from CaCO3. It is well known that these two types of Ca species
present different binding energies (BE) [23,24]. The BE of the
two Ca 2p3/2 components were at 347.6 � 0.2 eV for CaCO3
and 346.5 � 0.2 eV for Ca(OH)2 species, respectively (the
corresponding Ca 2p1/2 peaks are at 3.5 eV higher BE). The
difference in BE between the contributions is in agreement with
that published [23–25]. The presence of CaO can be discarded
since the BE of Ca in CaO is below those of Ca(OH)2 [23,24].
outgassing at 473 K and 773 K and ex situ outgassing at 973 K.

M.L. Granados et al. / Applied Catalysis B: Environmental 73 (2007) 317–326322
Therefore it can be concluded that the outermost surface layers
of CaO solid is extensively carbonated and hydrated.
Evacuation at 773 K should have resulted in the dehydroxyla-
tion of the bulk Ca(OH)2 to yield CaO whereas decarbonation
cannot be achieved at these temperatures. However it is well
known that only under very low residual H2O pressure in the
XPS chamber CaO surface can be fully dehydroxylated. It has
been estimated that partial pressure PH2O � 5� 10�9 Torr is
required to fully prevent hydroxylation of the CaO surface
[23,24]. This estimation was done on CaO single crystal but is
still valid for polycrystalline samples. Therefore although the
Ca(OH)2 is transformed to CaO during the treatment at 773 K,
it is expected that, once the sample is cooled down to room
temperature in the in situ XPS chamber, the surface of the
resulting CaO is covered by OH groups in a large extension.
This justifies why if samples were evacuated at temperatures
high enough to decompose the Ca(OH)2, the Ca 2p core level
still shows a contribution from Ca-OH species. The compo-
nents at higher BE (CaCO3) represent in both samples ca. 60%
of the total weighted area whereas that at lower BE (Ca(OH)2)
corresponds to 35–40%.
The BE of the O1s core level of the samples after evacuation
at 473 and 773 K were at 531.7 � 0.2 eV. In principle the O 1s
peak can arise from OH or CO3 groups which peaks are
separated by less than 0.5 eV [23,24] and the width of the peak
clearly indicates that is the result of these contributions. The
deconvolution into two peaks was attempted but none of the
found solutions could be considered statistically definitive.
The C 1s core level depicted in Fig. 4 shows that once the
samples are outgassed at 473 and 773 K two components can
be clearly observed. A very intense contribution at
290.1 � 0.1 eV was assigned to surface carbonate group in
agreement with the Ca 2p results (it was used as a reference for
the rest of the core levels). Another intense peak at
285.1 � 0.1 eV was also clearly visible that is assigned to
carbon from adventitious hydrocarbons (C–H species) [26]. A
third peak (much weaker) was also visible after deconvolution
of the C level and located at 287–288 eV that is due to C present
in carbonyl, alcohols or ether groups (C O or C–O species)
[26]. Therefore the sample is carbonated and hydrocarbon
species are also present at the surface of the solids. Actually,
after evacuation at 773 K the C 1s contribution from
hydrocarbon represents more than 40%. The origin of this
hydrocarbon species is very likely the contamination from the
adventituous hydrocarbon, which presence in the ambient or in
the in situ cell of the XPS spectrophotometer cannot be
avoided.
Fig. 4 also shows the O 1s, C 1s and Ca 2p core levels for the
CaO sample after outgassing (in an ex situ cell) at 973 K. The C
1s level is dominated by peak at 285.0 � 0.2 eV that is due to
the isooctane that cannot be removed by the very low pressures
required for the spectra recording. The very wide and weak
peak at 288.0 eV intends to represent the sum of contributions
from partially oxygenated hydrocarbons (C–O and C O
functionalities). Any attempt of deconvoluting such weak peak
into several contributions was considered questionable and
irrelevant for the conclusions. It must be stressed that the
treatment at 973 K has completely removed the carbonate
groups as there is a lack of contribution from these species at
290 � 0.2 eV. The O 1s core level is clearly composed of two
contributions, both with similar wt%, one at 531.3 � 0.2 eV
that is assigned to Ca-OH species (CO3 groups are absent) and
another peak at 528.7 � 0.1 eV. The latter arises from the CaO
framework O2�, its very low BE is due to the basic character of
such species [25,27]. The Ca 2p core level also confirms the
absence of CO3 species: the peaks of the Ca 2p spin-orbit
doublet at 349.5 and 346.2 eV arise from Ca-OH species
whereas the new peaks at 348.7 and 345.3 eV (ca. 1 eV below
the Ca-OH peaks) clearly arise from CaO species [23–25]. The
weight (%) of the Ca 2p contributions are in agreement with
those found in the O 1s level, both indicate that 50% of the
species detected by XPS are CaO and the other 50% are
Ca(OH)2. Considering that the hydroxylation of CaO cannot be
avoided due to the extremely high reactivity of the CaO surface
to the tiny residual traces of H2O that are always present in any
atmosphere, the surface of the sample after outgassing at very
high temperatures and cooling down to room temperature can
be described as CaO covered by Ca(OH)2. Considering the
inelastic mean free path of the O 1s photoelectrons, it is very
reasonable to assume that several layers of Ca(OH)2 are
covering the fully decarbonated CaO formed by the treatment at
973 K [23,25].
The FWMH of all the peaks were between 2 and 2.5 eV.
These values are in some cases slightly larger than those
published for the bulk pure compounds. This difference can be
due to slight variations in the chemical nature of the surface
species present at the surface of the polycrystalline solids
studied in this work and/or to the amorphous character of some
of the phases.
The surface atomic CO32�/Ca ratio was estimated from the
area of their XPS core levels and by using the sensitivity factors
reported by Sosulnikov and Teterian [25] and in the case of the
CaO evacuated at 473 and 773 K was 0.37 as expected from a
surface partially hydrated and carbonated (fully carbonation
should have been resulted in ratio closer to 1).
Summarising the XPS results it can be said that the surface
of solid after outgassing at 473 and 773 K is dominated by Ca-
OH and CaCO3 groups. The outgassing at very high
temperatures (�973 K) results in the fully decarbonation of
the solid. Then the surface of the resulting activated CaO can be
described as CaO covered by a layer (or several layers) of
Ca(OH)2. Similar situation was found for a CaO sample
exposed to room air for more than 120 days.
In an attempt of tracing how fast a ‘‘clean’’ CaO is
hydrated and carbonated, the a-CaO-120 sample previously
outgassed at 973 K in the IR cell was contacted with room air
at atmospheric pressure for different periods. The Fig. 5
shows the different FTIR spectra obtained. The bottom
spectrum represents the initial situation, the CaO evacuated
at 973 K. Only a band at 3736 cm�1 is detected that can be
assigned to isolated OH groups present at the surface of the
CaO solid. No IR feature is visible in the region of carbonate
stretching vibrations. The spectrum immediately above is
that obtained after the sample was first contacted the room air
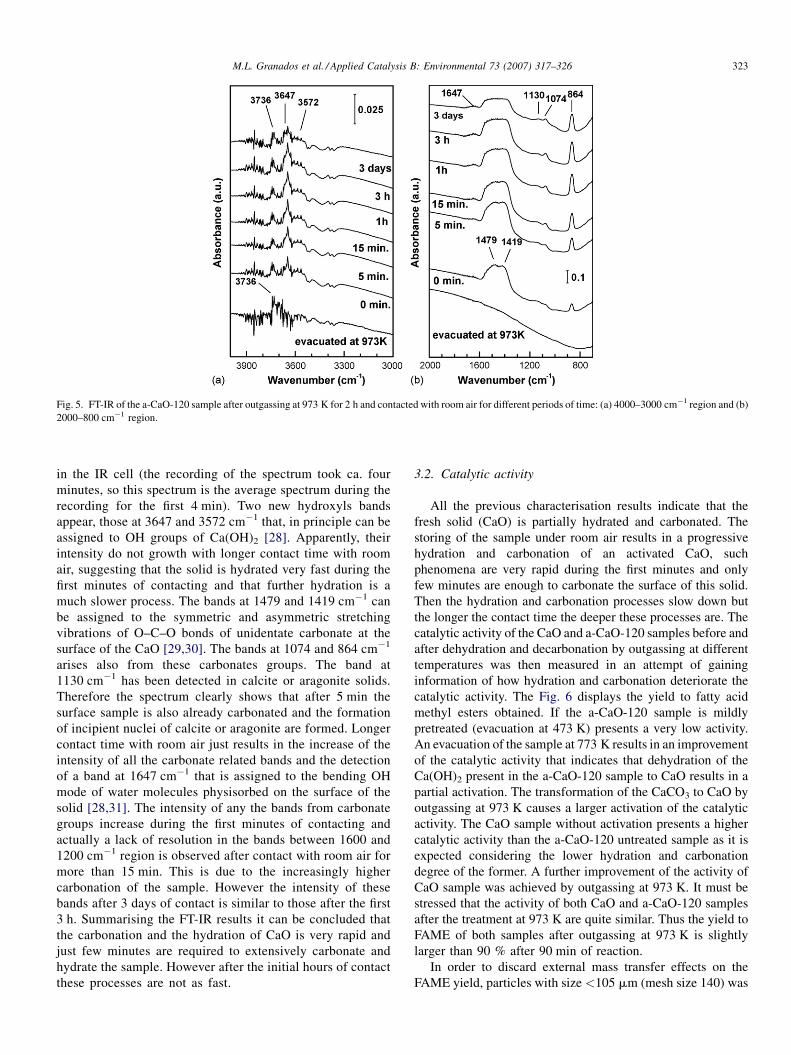
Fig. 5. FT-IR of the a-CaO-120 sample after outgassing at 973 K for 2 h and contacted with room air for different periods of time: (a) 4000–3000 cm�1 region and (b)
2000–800 cm�1 region.
M.L. Granados et al. / Applied Catalysis B: Environmental 73 (2007) 317–326 323
in the IR cell (the recording of the spectrum took ca. four
minutes, so this spectrum is the average spectrum during the
recording for the first 4 min). Two new hydroxyls bands
appear, those at 3647 and 3572 cm�1 that, in principle can be
assigned to OH groups of Ca(OH)2 [28]. Apparently, their
intensity do not growth with longer contact time with room
air, suggesting that the solid is hydrated very fast during the
first minutes of contacting and that further hydration is a
much slower process. The bands at 1479 and 1419 cm�1 can
be assigned to the symmetric and asymmetric stretching
vibrations of O–C–O bonds of unidentate carbonate at the
surface of the CaO [29,30]. The bands at 1074 and 864 cm�1
arises also from these carbonates groups. The band at
1130 cm�1 has been detected in calcite or aragonite solids.
Therefore the spectrum clearly shows that after 5 min the
surface sample is also already carbonated and the formation
of incipient nuclei of calcite or aragonite are formed. Longer
contact time with room air just results in the increase of the
intensity of all the carbonate related bands and the detection
of a band at 1647 cm�1 that is assigned to the bending OH
mode of water molecules physisorbed on the surface of the
solid [28,31]. The intensity of any the bands from carbonate
groups increase during the first minutes of contacting and
actually a lack of resolution in the bands between 1600 and
1200 cm�1 region is observed after contact with room air for
more than 15 min. This is due to the increasingly higher
carbonation of the sample. However the intensity of these
bands after 3 days of contact is similar to those after the first
3 h. Summarising the FT-IR results it can be concluded that
the carbonation and the hydration of CaO is very rapid and
just few minutes are required to extensively carbonate and
hydrate the sample. However after the initial hours of contact
these processes are not as fast.
3.2. Catalytic activity
All the previous characterisation results indicate that the
fresh solid (CaO) is partially hydrated and carbonated. The
storing of the sample under room air results in a progressive
hydration and carbonation of an activated CaO, such
phenomena are very rapid during the first minutes and only
few minutes are enough to carbonate the surface of this solid.
Then the hydration and carbonation processes slow down but
the longer the contact time the deeper these processes are. The
catalytic activity of the CaO and a-CaO-120 samples before and
after dehydration and decarbonation by outgassing at different
temperatures was then measured in an attempt of gaining
information of how hydration and carbonation deteriorate the
catalytic activity. The Fig. 6 displays the yield to fatty acid
methyl esters obtained. If the a-CaO-120 sample is mildly
pretreated (evacuation at 473 K) presents a very low activity.
An evacuation of the sample at 773 K results in an improvement
of the catalytic activity that indicates that dehydration of the
Ca(OH)2 present in the a-CaO-120 sample to CaO results in a
partial activation. The transformation of the CaCO3 to CaO by
outgassing at 973 K causes a larger activation of the catalytic
activity. The CaO sample without activation presents a higher
catalytic activity than the a-CaO-120 untreated sample as it is
expected considering the lower hydration and carbonation
degree of the former. A further improvement of the activity of
CaO sample was achieved by outgassing at 973 K. It must be
stressed that the activity of both CaO and a-CaO-120 samples
after the treatment at 973 K are quite similar. Thus the yield to
FAME of both samples after outgassing at 973 K is slightly
larger than 90 % after 90 min of reaction.
In order to discard external mass transfer effects on the
FAME yield, particles with size <105 mm (mesh size 140) was
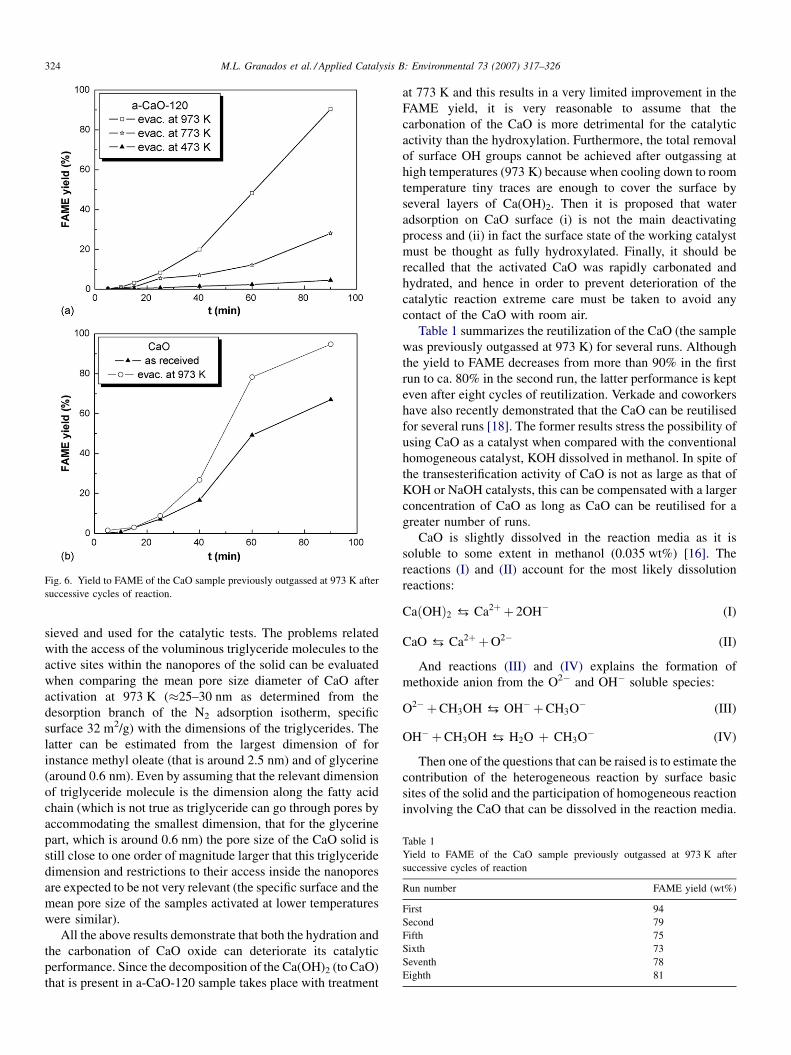
Fig. 6. Yield to FAME of the CaO sample previously outgassed at 973 K after
successive cycles of reaction.
Table 1
Yield to FAME of the CaO sample previously outgassed at 973 K after
successive cycles of reaction
Run number FAME yield (wt%)
First 94
Second 79
Fifth 75
Sixth 73
Seventh 78
Eighth 81
M.L. Granados et al. / Applied Catalysis B: Environmental 73 (2007) 317–326324
sieved and used for the catalytic tests. The problems related
with the access of the voluminous triglyceride molecules to the
active sites within the nanopores of the solid can be evaluated
when comparing the mean pore size diameter of CaO after
activation at 973 K (�25–30 nm as determined from the
desorption branch of the N2 adsorption isotherm, specific
surface 32 m2/g) with the dimensions of the triglycerides. The
latter can be estimated from the largest dimension of for
instance methyl oleate (that is around 2.5 nm) and of glycerine
(around 0.6 nm). Even by assuming that the relevant dimension
of triglyceride molecule is the dimension along the fatty acid
chain (which is not true as triglyceride can go through pores by
accommodating the smallest dimension, that for the glycerine
part, which is around 0.6 nm) the pore size of the CaO solid is
still close to one order of magnitude larger that this triglyceride
dimension and restrictions to their access inside the nanopores
are expected to be not very relevant (the specific surface and the
mean pore size of the samples activated at lower temperatures
were similar).
All the above results demonstrate that both the hydration and
the carbonation of CaO oxide can deteriorate its catalytic
performance. Since the decomposition of the Ca(OH)2 (to CaO)
that is present in a-CaO-120 sample takes place with treatment
at 773 K and this results in a very limited improvement in the
FAME yield, it is very reasonable to assume that the
carbonation of the CaO is more detrimental for the catalytic
activity than the hydroxylation. Furthermore, the total removal
of surface OH groups cannot be achieved after outgassing at
high temperatures (973 K) because when cooling down to room
temperature tiny traces are enough to cover the surface by
several layers of Ca(OH)2. Then it is proposed that water
adsorption on CaO surface (i) is not the main deactivating
process and (ii) in fact the surface state of the working catalyst
must be thought as fully hydroxylated. Finally, it should be
recalled that the activated CaO was rapidly carbonated and
hydrated, and hence in order to prevent deterioration of the
catalytic reaction extreme care must be taken to avoid any
contact of the CaO with room air.
Table 1 summarizes the reutilization of the CaO (the sample
was previously outgassed at 973 K) for several runs. Although
the yield to FAME decreases from more than 90% in the first
run to ca. 80% in the second run, the latter performance is kept
even after eight cycles of reutilization. Verkade and coworkers
have also recently demonstrated that the CaO can be reutilised
for several runs [18]. The former results stress the possibility of
using CaO as a catalyst when compared with the conventional
homogeneous catalyst, KOH dissolved in methanol. In spite of
the transesterification activity of CaO is not as large as that of
KOH or NaOH catalysts, this can be compensated with a larger
concentration of CaO as long as CaO can be reutilised for a
greater number of runs.
CaO is slightly dissolved in the reaction media as it is
soluble to some extent in methanol (0.035 wt%) [16]. The
reactions (I) and (II) account for the most likely dissolution
reactions:
CaðOHÞ2 ? Ca2þ þ 2OH� (I)
CaO ? Ca2þ þO2� (II)
And reactions (III) and (IV) explains the formation of
methoxide anion from the O2� and OH� soluble species:
O2� þCH3OH ? OH� þCH3O� (III)
OH� þCH3OH ? H2O þ CH3O� (IV)
Then one of the questions that can be raised is to estimate the
contribution of the heterogeneous reaction by surface basic
sites of the solid and the participation of homogeneous reaction
involving the CaO that can be dissolved in the reaction media.
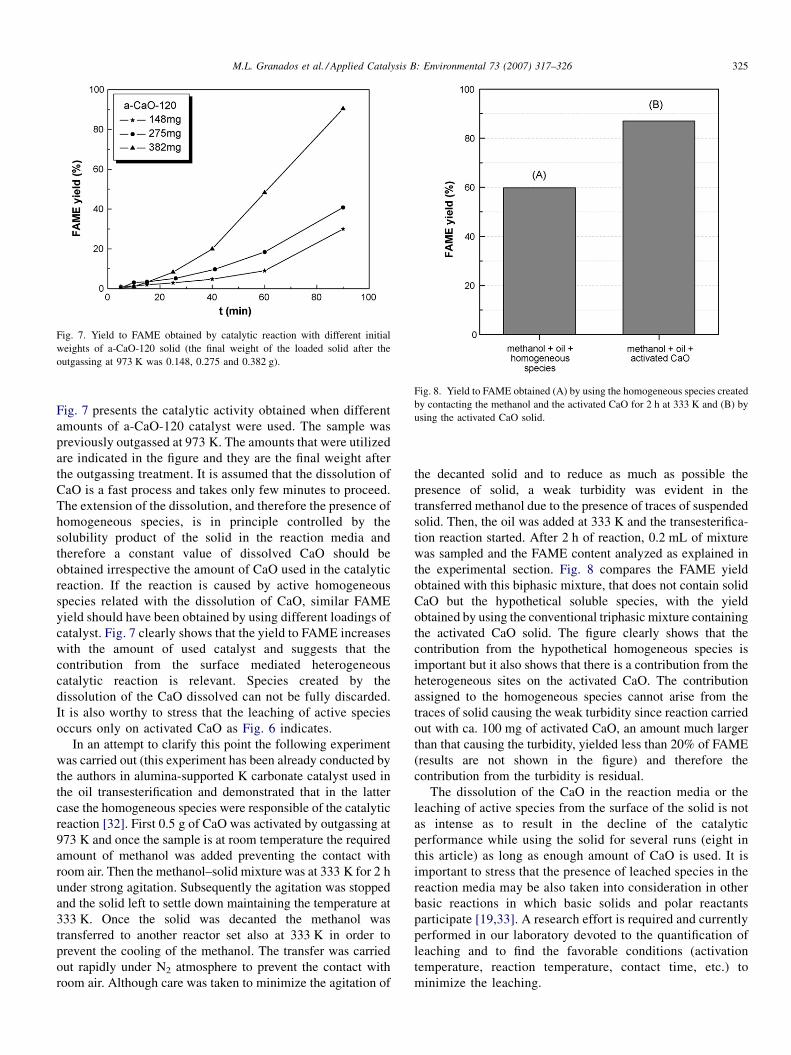
Fig. 7. Yield to FAME obtained by catalytic reaction with different initial
weights of a-CaO-120 solid (the final weight of the loaded solid after the
outgassing at 973 K was 0.148, 0.275 and 0.382 g).
Fig. 8. Yield to FAME obtained (A) by using the homogeneous species created
by contacting the methanol and the activated CaO for 2 h at 333 K and (B) by
using the activated CaO solid.
M.L. Granados et al. / Applied Catalysis B: Environmental 73 (2007) 317–326 325
Fig. 7 presents the catalytic activity obtained when different
amounts of a-CaO-120 catalyst were used. The sample was
previously outgassed at 973 K. The amounts that were utilized
are indicated in the figure and they are the final weight after
the outgassing treatment. It is assumed that the dissolution of
CaO is a fast process and takes only few minutes to proceed.
The extension of the dissolution, and therefore the presence of
homogeneous species, is in principle controlled by the
solubility product of the solid in the reaction media and
therefore a constant value of dissolved CaO should be
obtained irrespective the amount of CaO used in the catalytic
reaction. If the reaction is caused by active homogeneous
species related with the dissolution of CaO, similar FAME
yield should have been obtained by using different loadings of
catalyst. Fig. 7 clearly shows that the yield to FAME increases
with the amount of used catalyst and suggests that the
contribution from the surface mediated heterogeneous
catalytic reaction is relevant. Species created by the
dissolution of the CaO dissolved can not be fully discarded.
It is also worthy to stress that the leaching of active species
occurs only on activated CaO as Fig. 6 indicates.
In an attempt to clarify this point the following experiment
was carried out (this experiment has been already conducted by
the authors in alumina-supported K carbonate catalyst used in
the oil transesterification and demonstrated that in the latter
case the homogeneous species were responsible of the catalytic
reaction [32]. First 0.5 g of CaO was activated by outgassing at
973 K and once the sample is at room temperature the required
amount of methanol was added preventing the contact with
room air. Then the methanol–solid mixture was at 333 K for 2 h
under strong agitation. Subsequently the agitation was stopped
and the solid left to settle down maintaining the temperature at
333 K. Once the solid was decanted the methanol was
transferred to another reactor set also at 333 K in order to
prevent the cooling of the methanol. The transfer was carried
out rapidly under N2 atmosphere to prevent the contact with
room air. Although care was taken to minimize the agitation of
the decanted solid and to reduce as much as possible the
presence of solid, a weak turbidity was evident in the
transferred methanol due to the presence of traces of suspended
solid. Then, the oil was added at 333 K and the transesterifica-
tion reaction started. After 2 h of reaction, 0.2 mL of mixture
was sampled and the FAME content analyzed as explained in
the experimental section. Fig. 8 compares the FAME yield
obtained with this biphasic mixture, that does not contain solid
CaO but the hypothetical soluble species, with the yield
obtained by using the conventional triphasic mixture containing
the activated CaO solid. The figure clearly shows that the
contribution from the hypothetical homogeneous species is
important but it also shows that there is a contribution from the
heterogeneous sites on the activated CaO. The contribution
assigned to the homogeneous species cannot arise from the
traces of solid causing the weak turbidity since reaction carried
out with ca. 100 mg of activated CaO, an amount much larger
than that causing the turbidity, yielded less than 20% of FAME
(results are not shown in the figure) and therefore the
contribution from the turbidity is residual.
The dissolution of the CaO in the reaction media or the
leaching of active species from the surface of the solid is not
as intense as to result in the decline of the catalytic
performance while using the solid for several runs (eight in
this article) as long as enough amount of CaO is used. It is
important to stress that the presence of leached species in the
reaction media may be also taken into consideration in other
basic reactions in which basic solids and polar reactants
participate [19,33]. A research effort is required and currently
performed in our laboratory devoted to the quantification of
leaching and to find the favorable conditions (activation
temperature, reaction temperature, contact time, etc.) to
minimize the leaching.

M.L. Granados et al. / Applied Catalysis B: Environmental 73 (2007) 317–326326
4. Conclusions
The active surface sites of CaO are unavoidably poisoned by
the atmospheric H2O and CO2. The catalytic activity of CaO
can be improved if before the reaction the CaO is subjected to
an activation treatment to remove and to clean the surface of the
main poisoning species (the carbonate groups) and if after this
treatment the contact with room air is prevented. The poisoning
effect of H2O adsorption is less relevant and as matter of fact the
surface the activated CaO can be described as few layers of
Ca(OH)2 covering an inner core of CaO.
CaO is an attractive catalyst for the transesterification reaction
of the sunflower oil with methanol that can be re-used for several
runs without significant deactivation. The basic surface sites
present at the surface of the solid are partly responsible of the
catalytic reaction, the contribution of the homogeneous reaction
due to soluble species created by the dissolution of the solid in
methanol is also important. Thermal activation is required for
both homogeneous and heterogeneous reactions to take place.
The dissolution of the CaO in the reaction media is not as intense
as to result in the decline of the catalytic performance while using
the solid for eight runs providing that enough amount of CaO is
added to the reaction media.
Acknowledgements
Financial support from European Commission Sixth Frame-
work Programme (under project BIOCARD, contract no.
019829), Spanish Ministry of Education and Science
(MAT2003-08348-C04-01 project) and Regional Government
of Madrid (GR/AMB/0686/2004 project) is gratefully acknowl-
edged. D.M. A. and M.D. Z. P. thank to the Regional
Government of Madrid and the Spanish Ministry of Education
and Science, respectively, for their fellowships.
References
[1] F. Ma, M.A. Hanna, Bioresour. Technol. 70 (1999) 1.
[2] A. Srivastava, R. Prasad, Renewable Sustain. Energy Rev. 4 (2000) 111.
[3] C. Carraretto, A. Macor, A. Mirandola, A. Stoppato, S. Tonon, Energy 29
(2004) 2195.
[4] M.S. Graboski, R.L. McCormick, Prog. Energy Combust. Sci. 24 (1998)
125.
[5] J. Van Gerpen, Fuel Process. Technol. 86 (2005) 1097.
[6] Y. Zhang, M.A. Dube, D.D. McLean, M. Kates, Bioresour. Technol. 90
(2003) 229.
[7] Y. Zhang, M.A. Dube, D.D. McLean, M. Kates, Bioresour. Technol. 89
(2003) 1.
[8] G.J. Suppes, M.A. Dasari, E.J. Doskocil, P.J. Mankidy, M.J. Goff, Appl.
Catal. A: Gen. 257 (2004) 213.
[9] H.J. Kim, B.S. Kang, M.J. Kim, Y.M. Park, D.K. Kim, J.S. Lee, K.Y. Lee,
Catal. Today 93–95 (2004) 315.
[10] T. Ebiura, T. Echizen, A. Ishikawa, K. Murai, T. Baba, Appl. Catal. A:
Gen. 283 (2005) 111.
[11] G.J. Suppes, K. Bockwinkel, S. Lucas, J.B. Botts, M.H. Mason, J.A.
Heppert, J. Am. Oil Chem. Soc. 78 (2001) 139.
[12] U. Schuchardt, R.M. Vargas, G. Gelbard, J. Mol. Catal. A: Chem. 109
(1996) 37.
[13] R. Sercheli, R.M. Vargas, U. Schuchardt, J. Am. Oil Chem. Soc. 76 (1999)
1207.
[14] D.G. Cantrell, L.J. Gillie, A.F. Lee, K. Wilson, Appl. Catal. A: Gen. 287
(2005) 183.
[15] W. Xie, H. Peng, L. Chen, J. Mol. Catal. A: Chem. 246 (2006) 24.
[16] S. Gryglewicz, Bioresour. Technol. 70 (1999) 249.
[17] S. Gryglewicz, Appl. Catal. A: Gen. 192 (1999) 23.
[18] C. Reddy, V. Reddy, R. Oshel, J.G. Verkade, Energy Fuels 20 (2006)
1310.
[19] H. Hattori, Chem. Rev. 95 (1995) 537.
[20] J. Lanas, J.I. Alvarez, Thermochim. Acta 423 (2004) 1.
[21] D. Berutto, R. Botter, J. Eur. Ceram. Soc. 20 (2000) 497.
[22] J. Peric, M. Vucak, R. Krstulovic, L. Brecevic, D. Kralj, Thermochim.
Acta 277 (1996) 175.
[23] P. Liu, T. Kendelewicz, G.E. Brown, G.A. Parks, P. Pianetta, Surf. Sci. 416
(1998) 326.
[24] C.S. Doyle, T. Kendelewicz, X. Carrier, G.E. Brown, Surf. Rev. Lett. 6
(1999) 1247.
[25] M.I. Sosulnikov, Y. Teterin, J. Electron Spectr. Relat. Phenom. 59 (1992)
111.
[26] S. Biniak, G. Szymanski, J. Siedlewski, A. Swiatkowski, Carbon 35 (1997)
1799.
[27] V. Dimitrov, T. Komatsu, J. Solid State Chem. 163 (2002) 100.
[28] H.D. Lutz, H. Moller, M. Schmidt, J. Mol. Struct. 328 (1994) 121.
[29] J.C. Lavalley, Catal. Today 27 (1996) 377.
[30] T. Visser, Vibrational Spectr. 33 (2003) 223.
[31] H.A. Al Abadleh, H.A. Hosney, V.H. Grassian, J. Mol. Catal. A: Chem.
228 (2005) 47.
[32] D. Martin, R. Mariscal, R. Moreno-Tost, M. D. Zafra Poves, M. Lopez
Granados, Catal. Commun., submitted for publication.
[33] A. Corma, S. Iborra, Adv. Catal. 49 (2006) 239.