ESEA Flexibility - State of Michigan
674
Amended July 28, 2015 ESEA Flexibility ESEA Flexibility Request Submitted to USED July 9, 2012 Approved by USED on July 19, 2012 Amended on December 17, 2012 Amended on February 28, 2013 Amended on July 24, 2013 Amended on July 24, 2014 (Principles 1 and 2) Amended on July 28, 2015 U.S. Department of Education Washington, DC 20202 OMB Number: 1810-0708 Paperwork Burden Statement According to the Paperwork Reduction Act of 1995, no persons are required to respond to a collection of information unless such collection displays a valid OMB control number. The valid OMB control number for this information collection is 1810-0708. The time required to complete this information collection is estimated to average 336 hours per response, including the time to review instructions, search existing data resources, gather the data needed, and complete and review the information collection. If you have any comments concerning the accuracy of the time estimate or suggestions for improving this form, please write to: U.S. Department of Education, Washington, D.C. 20202-4537
-
Upload
khangminh22 -
Category
Documents
-
view
2 -
download
0
Transcript of ESEA Flexibility - State of Michigan

Amended July 28, 2015
ESEA Flexibility
ESEA Flexibility
Request
Submitted to USED July 9, 2012
Approved by USED on July 19, 2012
Amended on December 17, 2012
Amended on February 28, 2013
Amended on July 24, 2013
Amended on July 24, 2014 (Principles 1 and 2)
Amended on July 28, 2015
U.S. Department of Education
Washington, DC 20202
OMB Number: 1810-0708
Paperwork Burden Statement
According to the Paperwork Reduction Act of 1995, no persons are required to respond to a collection of information
unless such collection displays a valid OMB control number. The valid OMB control number for this information
collection is 1810-0708. The time required to complete this information collection is estimated to average 336 hours per
response, including the time to review instructions, search existing data resources, gather the data needed, and complete
and review the information collection. If you have any comments concerning the accuracy of the time estimate or
suggestions for improving this form, please write to: U.S. Department of Education, Washington, D.C. 20202-4537
Amended July 28, 2015
TABLE OF CONTENTS: ESEA FLEXIBILITY REQUEST
Introduction
ii
General Instructions
iii
Table of Contents
1
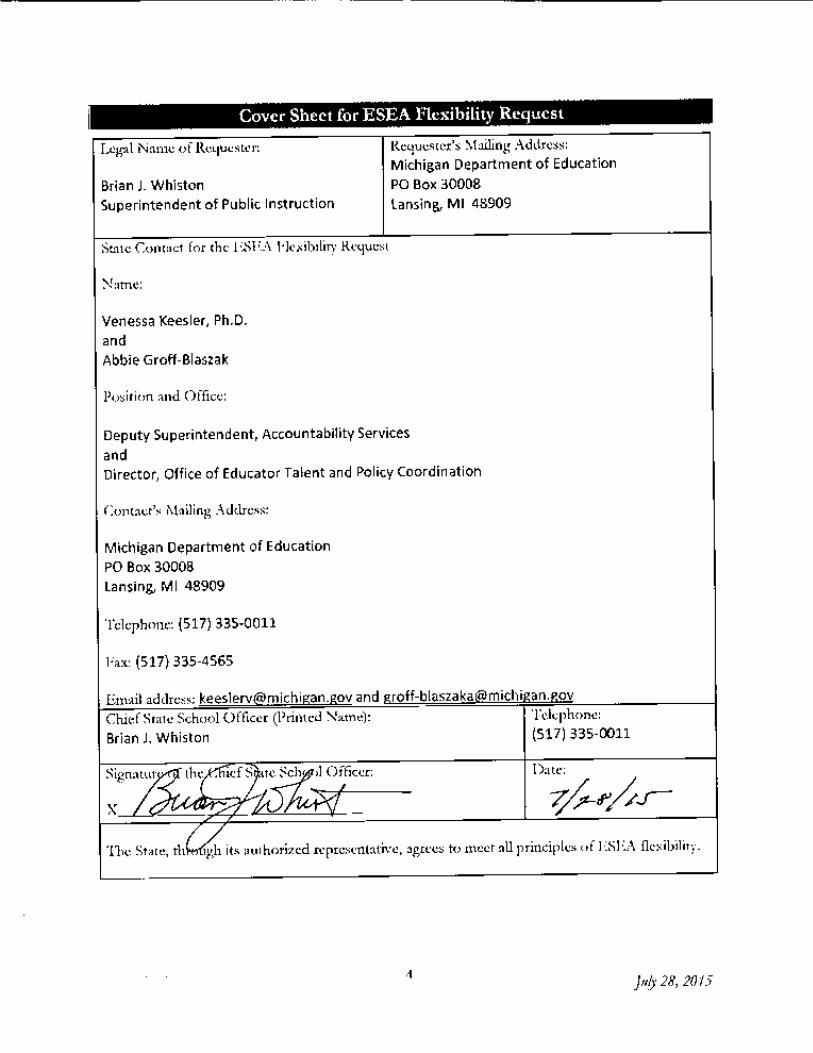
Cover Sheet for ESEA Flexibility Request
4
Waivers
5
Assurances 8
Consultation 11
Evaluation
Overview of SEA’s ESEA Flexibility Request
23
23
Principle 1: College- and Career-Ready Expectations for All Students
26
Principle 2: State-Developed Differentiated Recognition, Accountability, and Support
70
Principle 3: Supporting Effective Instruction and Leadership
190
Sample Plan Template
ii
Amended March 31, 2015
ESEA FLEXIBI LITY – REQ UEST U . S . D EPARTMEN T OF ED UC ATION
INTRODUCTION
The U.S. Department of Education (Department) is offering each State educational agency (SEA) the
opportunity to request flexibility on behalf of itself, its local educational agencies (LEAs), and its schools, in
order to better focus on improving student learning and increasing the quality of instruction. This voluntary
opportunity will provide educators and State and local leaders with flexibility regarding specific requirements
of the No Child Left Behind Act of 2001 (NCLB) in exchange for rigorous and comprehensive State-
developed plans designed to improve educational outcomes for all students, close achievement gaps, increase
equity, and improve the quality of instruction. This flexibility is intended to build on and support the
significant State and local reform efforts already underway in critical areas such as transitioning to college-
and career-ready standards and assessments; developing systems of differentiated recognition, accountability,
and support; and evaluating and supporting teacher and principal effectiveness.
The Department invites interested SEAs to request this flexibility pursuant to the authority in section 9401 of
the Elementary and Secondary Education Act of 1965 (ESEA), which allows the Secretary to waive, with
certain exceptions, any statutory or regulatory requirement of the ESEA for an SEA that receives funds under
a program authorized by the ESEA and requests a waiver. Under this flexibility, the Department would grant
waivers through the 2013−2014 school year, after which time an SEA may request an extension of this
flexibility.
REVIEW AND EVALUATION OF REQUESTS
The Department will use a review process that will include both external peer reviewers and staff reviewers to
evaluate SEA requests for this flexibility. This review process will help ensure that each request for this
flexibility approved by the Department is consistent with the principles described in the document titled
ESEA Flexibility, which are designed to support State efforts to improve student academic achievement and
increase the quality of instruction, and is both educationally and technically sound. Reviewers will evaluate
whether and how each request for this flexibility will support a comprehensive and coherent set of
improvements in the areas of standards and assessments, accountability, and teacher and principal
effectiveness that will lead to improved student outcomes. Each SEA will have an opportunity, if necessary,
to clarify its plans for peer and staff reviewers and to answer any questions reviewers may have. The peer
reviewers will then provide comments to the Department. Taking those comments into consideration, the
Secretary will make a decision regarding each SEA’s request for this flexibility. If an SEA’s request for this
flexibility is not granted, reviewers and the Department will provide feedback to the SEA about the
components of the SEA’s request that need additional development in order for the request to be approved.

iii
Amended March 31, 2015
ESEA FLEXIBI LITY – REQ UEST U . S . D EPARTMEN T OF ED UC ATION
GENERAL INSTRUCTIONS
An SEA seeking approval to implement this flexibility must submit a high-quality request that addresses all
aspects of the principles and waivers and, in each place where a plan is required, includes a high-quality plan.
Consistent with ESEA section 9401(d)(1), the Secretary intends to grant waivers that are included in this
flexibility through the end of the 2013–2014 school year. An SEA will be permitted to request an extension
of the initial period of this flexibility prior to the start of the 2014–2015 school year unless this flexibility is
superseded by reauthorization of the ESEA. The Department is asking SEAs to submit requests that include
plans through the 2014–2015 school year in order to provide a complete picture of the SEA’s reform efforts.
The Department will not accept a request that meets only some of the principles of this flexibility.
This version of the ESEA Flexibility Request replaces the document originally issued on September 23, 2011
and revised on September 28, 2011. Through this revised version, the following section has been removed:
3.A, Option B (Option C has been renamed Option B). Additions have also been made to the following
sections: Waivers and Assurances. Finally, this revised guidance modifies the following sections: Waivers;
Assurances; 2.A.ii; 2.C.i; 2.D.i; 2.E.i; Table 2; 2.G; and 3.A, Options A and B.
High-Quality Request: A high-quality request for this flexibility is one that is comprehensive and coherent in
its approach, and that clearly indicates how this flexibility will help an SEA and its LEAs improve student
achievement and the quality of instruction for students.
A high-quality request will (1) if an SEA has already met a principle, provide a description of how it has done
so, including evidence as required; and (2) if an SEA has not yet met a principle, describe how it will meet the
principle on the required timelines, including any progress to date. For example, an SEA that has not
adopted minimum guidelines for local teacher and principal evaluation and support systems consistent with
Principle 3 by the time it submits its request for the flexibility will need to provide a plan demonstrating that
it will do so by the end of the 2011–2012 school year. In each such case, an SEA’s plan must include, at a
minimum, the following elements for each principle that the SEA has not yet met:
1. Key milestones and activities: Significant milestones to be achieved in order to meet a given principle,
and essential activities to be accomplished in order to reach the key milestones. The SEA should also
include any essential activities that have already been completed or key milestones that have already been
reached so that reviewers can understand the context for and fully evaluate the SEA’s plan to meet a
given principle.
2. Detailed timeline: A specific schedule setting forth the dates on which key activities will begin and be
completed and milestones will be achieved so that the SEA can meet the principle by the required date.
3. Party or parties responsible: Identification of the SEA staff (e.g., position, title, or office) and, as
appropriate, others who will be responsible for ensuring that each key activity is accomplished.
4. Evidence: Where required, documentation to support the plan and demonstrate the SEA’s progress in
implementing the plan. This ESEA Flexibility Request indicates the specific evidence that the SEA must
either include in its request or provide at a future reporting date.

iv
Amended March 31, 2015
ESEA FLEXIBI LITY – REQ UEST U . S . D EPARTMEN T OF ED UC ATION
5. Resources: Resources necessary to complete the key activities, including staff time and additional
funding.
6. Significant obstacles: Any major obstacles that may hinder completion of key milestones and activities
(e.g., State laws that need to be changed) and a plan to overcome them.
Included on page 19 of this document is an example of a format for a table that an SEA may use to submit a
plan that is required for any principle of this flexibility that the SEA has not already met. An SEA that elects
to use this format may also supplement the table with text that provides an overview of the plan.
An SEA should keep in mind the required timelines for meeting each principle and develop credible plans
that allow for completion of the activities necessary to meet each principle. Although the plan for each
principle will reflect that particular principle, as discussed above, an SEA should look across all plans to make
sure that it puts forward a comprehensive and coherent request for this flexibility.
Preparing the Request: To prepare a high-quality request, it is extremely important that an SEA refer to all of
the provided resources, including the document titled ESEA Flexibility, which includes the principles,
definitions, and timelines; the document titled ESEA Flexibility Review Guidance, which includes the criteria
that will be used by the peer reviewers to determine if the request meets the principles of this flexibility; and
the document titled ESEA Flexibility Frequently Asked Questions, which provides additional guidance for SEAs
in preparing their requests.
As used in this request form, the following terms have the definitions set forth in the document titled ESEA
Flexibility: (1) college- and career-ready standards, (2) focus school, (3) high-quality assessment, (4) priority
school, (5) reward school, (6) standards that are common to a significant number of States, (7) State network
of institutions of higher education, (8) student growth, and (9) turnaround principles.
Each request must include:
• A table of contents and a list of attachments, using the forms on pages 1 and 2.
• The cover sheet (p. 3), waivers requested (p. 4-6), and assurances (p. 7-8).
• A description of how the SEA has met the consultation requirements (p. 9).
• Evidence and plans to meet the principles (p. 10-18). An SEA will enter narrative text in the text
boxes provided, complete the required tables, and provide other required evidence. An SEA
may supplement the narrative text in a text box with attachments, which will be included in an
appendix. Any supplemental attachments that are included in an appendix must be referenced in
the related narrative text.
Requests should not include personally identifiable information.
Process for Submitting the Request: An SEA must submit a request to the Department to receive the
flexibility. This request form and other pertinent documents are available on the Department’s Web site at:
http://www.ed.gov/esea/flexibility.

v
Amended March 31, 2015
ESEA FLEXIBI LITY – REQ UEST U . S . D EPARTMEN T OF ED UC ATION
Electronic Submission: The Department strongly prefers to receive an SEA’s request for the flexibility
electronically. The SEA should submit it to the following address: [email protected].
Paper Submission: In the alternative, an SEA may submit the original and two copies of its request for
the flexibility to the following address:
Patricia McKee, Acting Director
Student Achievement and School Accountability Programs
U.S. Department of Education
400 Maryland Avenue, SW, Room 3W320
Washington, DC 20202-6132
Due to potential delays in processing mail sent through the U.S. Postal Service, SEAs are encouraged to use
alternate carriers for paper submissions.
REQUEST SUBMISSION DEADLINE
SEAs have multiple opportunities to submit requests for the flexibility. The submission dates are November
14, 2011, February 28, 2012, and an additional opportunity following the conclusion of the 2011–2012 school
year.
TECHNICAL ASSISTANCE MEETING FOR SEAS
The Department has conducted a number of webinars to assist SEAs in preparing their requests and to
respond to questions. Please visit the Department’s Web site at: http://www.ed.gov/esea/flexibility for
copies of previously conducted webinars and information on upcoming webinars.
FOR FURTHER INFORMATION
If you have any questions, please contact the Department by e-mail at [email protected].
1
Amended July 28, 2015
ESEA FLEXIBI LITY – REQ UEST U . S . D EPARTMEN T OF ED UC ATION
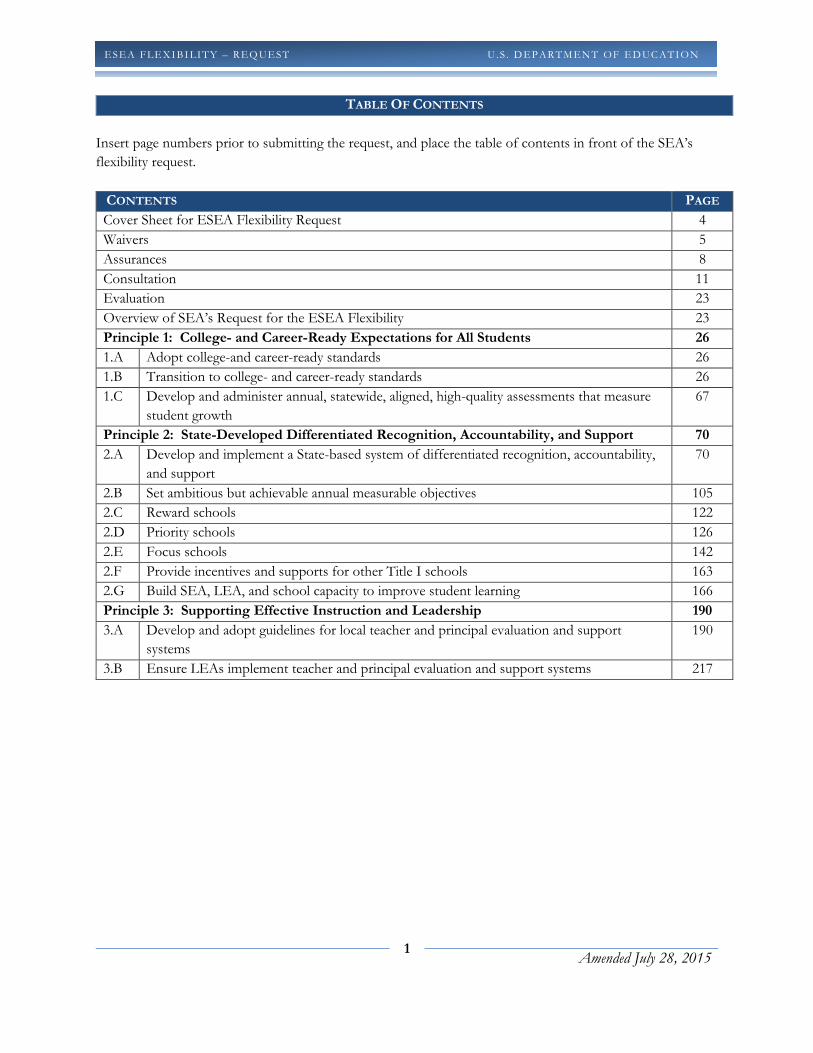
TABLE OF CONTENTS
Insert page numbers prior to submitting the request, and place the table of contents in front of the SEA’s
flexibility request.
CONTENTS PAGE
Cover Sheet for ESEA Flexibility Request 4
Waivers 5
Assurances 8
Consultation 11
Evaluation 23
Overview of SEA’s Request for the ESEA Flexibility 23
Principle 1: College- and Career-Ready Expectations for All Students 26
1.A Adopt college-and career-ready standards 26
1.B Transition to college- and career-ready standards 26
1.C Develop and administer annual, statewide, aligned, high-quality assessments that measure
student growth
67
Principle 2: State-Developed Differentiated Recognition, Accountability, and Support 70
2.A Develop and implement a State-based system of differentiated recognition, accountability,
and support
70
2.B Set ambitious but achievable annual measurable objectives 105
2.C Reward schools 122
2.D Priority schools 126
2.E Focus schools 142
2.F Provide incentives and supports for other Title I schools 163
2.G Build SEA, LEA, and school capacity to improve student learning 166
Principle 3: Supporting Effective Instruction and Leadership 190
3.A Develop and adopt guidelines for local teacher and principal evaluation and support
systems
190
3.B Ensure LEAs implement teacher and principal evaluation and support systems 217
2
Amended July 28, 2015
ESEA FLEXIBI LITY – REQ UEST U . S . D EPARTMEN T OF ED UC ATION
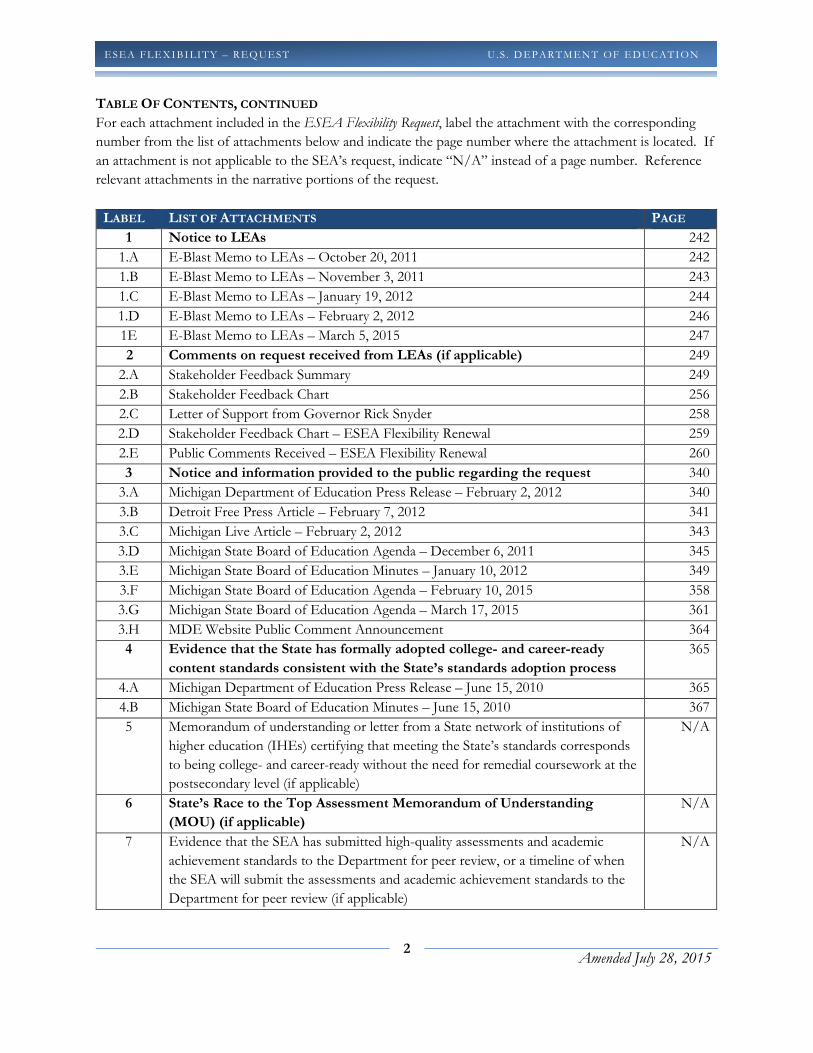
TABLE OF CONTENTS, CONTINUED
For each attachment included in the ESEA Flexibility Request, label the attachment with the corresponding
number from the list of attachments below and indicate the page number where the attachment is located. If
an attachment is not applicable to the SEA’s request, indicate “N/A” instead of a page number. Reference
relevant attachments in the narrative portions of the request.
LABEL LIST OF ATTACHMENTS PAGE
1 Notice to LEAs 242
1.A E-Blast Memo to LEAs – October 20, 2011 242
1.B E-Blast Memo to LEAs – November 3, 2011 243
1.C E-Blast Memo to LEAs – January 19, 2012 244
1.D E-Blast Memo to LEAs – February 2, 2012 246
1E E-Blast Memo to LEAs – March 5, 2015 247
2 Comments on request received from LEAs (if applicable) 249
2.A Stakeholder Feedback Summary 249
2.B Stakeholder Feedback Chart 256
2.C Letter of Support from Governor Rick Snyder 258
2.D Stakeholder Feedback Chart – ESEA Flexibility Renewal 259
2.E Public Comments Received – ESEA Flexibility Renewal 260
3 Notice and information provided to the public regarding the request 340
3.A Michigan Department of Education Press Release – February 2, 2012 340
3.B Detroit Free Press Article – February 7, 2012 341
3.C Michigan Live Article – February 2, 2012 343
3.D Michigan State Board of Education Agenda – December 6, 2011 345
3.E Michigan State Board of Education Minutes – January 10, 2012 349
3.F Michigan State Board of Education Agenda – February 10, 2015 358
3.G Michigan State Board of Education Agenda – March 17, 2015 361
3.H MDE Website Public Comment Announcement 364
4 Evidence that the State has formally adopted college- and career-ready
content standards consistent with the State’s standards adoption process
365
4.A Michigan Department of Education Press Release – June 15, 2010 365
4.B Michigan State Board of Education Minutes – June 15, 2010 367
5 Memorandum of understanding or letter from a State network of institutions of
higher education (IHEs) certifying that meeting the State’s standards corresponds
to being college- and career-ready without the need for remedial coursework at the
postsecondary level (if applicable)
N/A
6 State’s Race to the Top Assessment Memorandum of Understanding
(MOU) (if applicable)
N/A
7 Evidence that the SEA has submitted high-quality assessments and academic
achievement standards to the Department for peer review, or a timeline of when
the SEA will submit the assessments and academic achievement standards to the
Department for peer review (if applicable)
N/A
3
Amended July 28, 2015
ESEA FLEXIBI LITY – REQ UEST U . S . D EPARTMEN T OF ED UC ATION
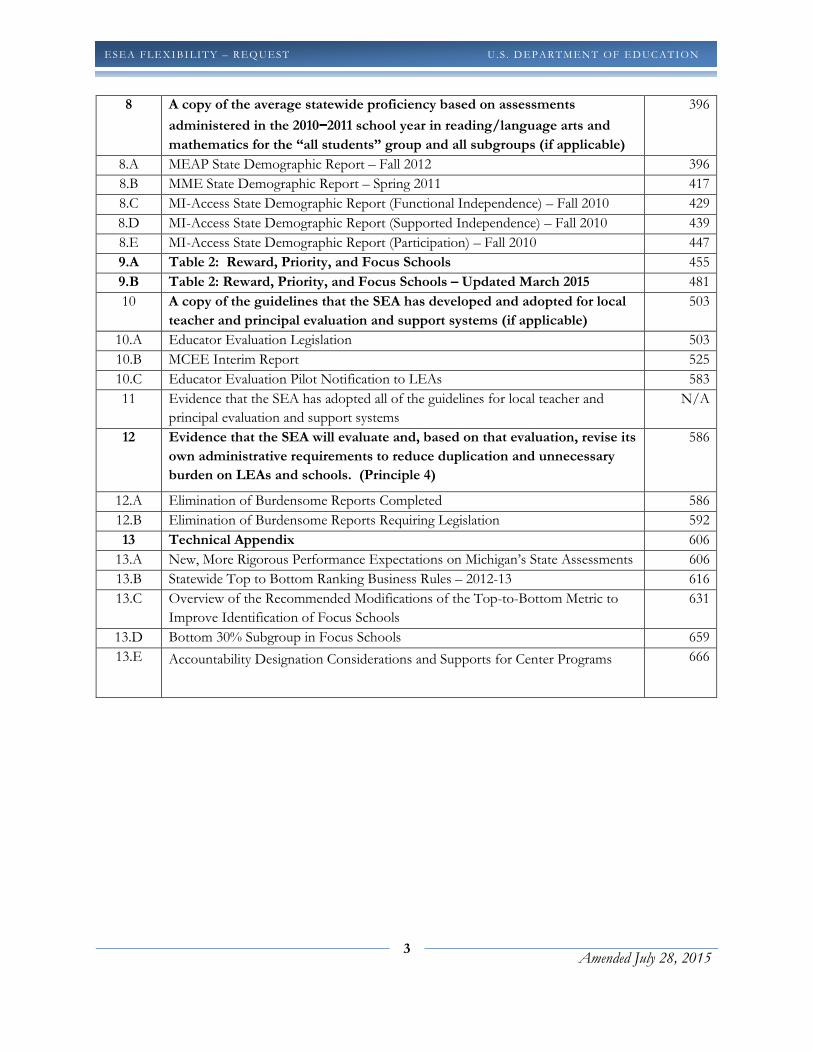
8 A copy of the average statewide proficiency based on assessments
administered in the 2010−−−−2011 school year in reading/language arts and
mathematics for the “all students” group and all subgroups (if applicable)
396
8.A MEAP State Demographic Report – Fall 2012 396
8.B MME State Demographic Report – Spring 2011 417
8.C MI-Access State Demographic Report (Functional Independence) – Fall 2010 429
8.D MI-Access State Demographic Report (Supported Independence) – Fall 2010 439
8.E MI-Access State Demographic Report (Participation) – Fall 2010 447
9.A Table 2: Reward, Priority, and Focus Schools 455
9.B Table 2: Reward, Priority, and Focus Schools – Updated March 2015 481
10 A copy of the guidelines that the SEA has developed and adopted for local
teacher and principal evaluation and support systems (if applicable)
503
10.A Educator Evaluation Legislation 503
10.B MCEE Interim Report 525
10.C Educator Evaluation Pilot Notification to LEAs 583
11 Evidence that the SEA has adopted all of the guidelines for local teacher and
principal evaluation and support systems
N/A
12 Evidence that the SEA will evaluate and, based on that evaluation, revise its
own administrative requirements to reduce duplication and unnecessary
burden on LEAs and schools. (Principle 4)
586
12.A Elimination of Burdensome Reports Completed 586
12.B Elimination of Burdensome Reports Requiring Legislation 592
13 Technical Appendix 606
13.A New, More Rigorous Performance Expectations on Michigan’s State Assessments 606
13.B Statewide Top to Bottom Ranking Business Rules – 2012-13 616
13.C Overview of the Recommended Modifications of the Top-to-Bottom Metric to
Improve Identification of Focus Schools
631
13.D Bottom 30% Subgroup in Focus Schools 659
13.E Accountability Designation Considerations and Supports for Center Programs
666
5
Amended July 28, 2015
ESEA FLEXIBI LITY – REQ UEST U . S . D EPARTMEN T OF ED UC ATION
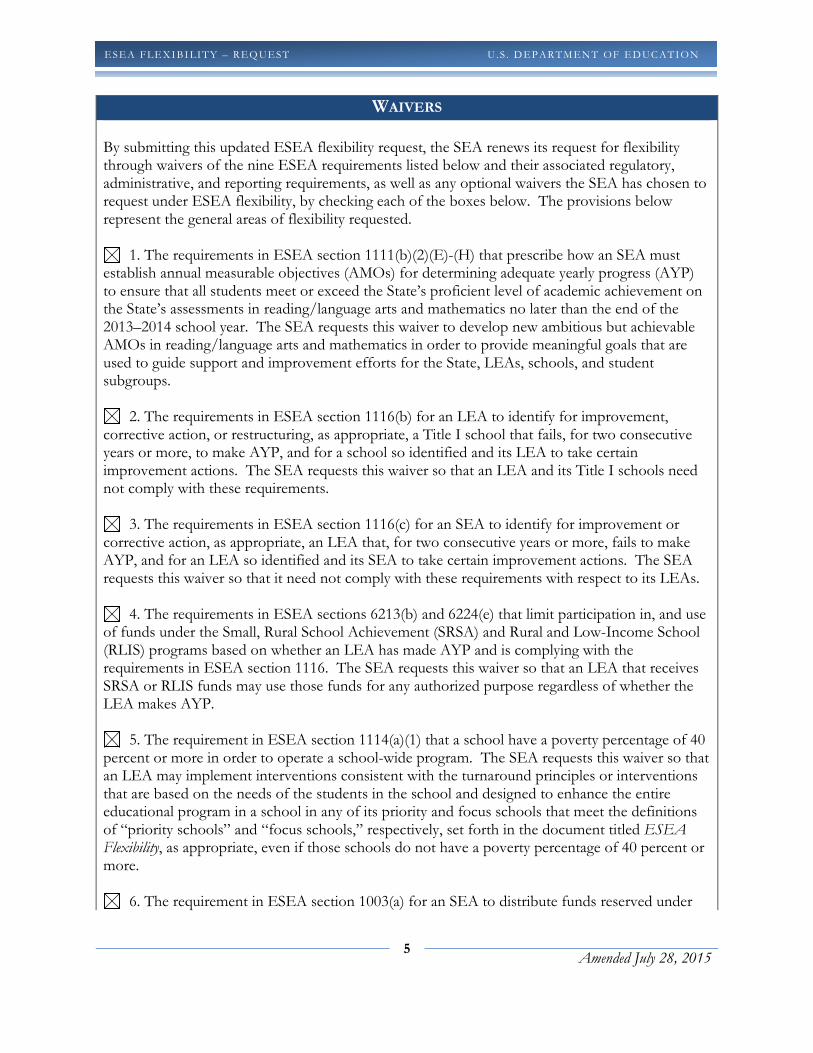
WAIVERS
By submitting this updated ESEA flexibility request, the SEA renews its request for flexibility through waivers of the nine ESEA requirements listed below and their associated regulatory, administrative, and reporting requirements, as well as any optional waivers the SEA has chosen to request under ESEA flexibility, by checking each of the boxes below. The provisions below represent the general areas of flexibility requested.
1. The requirements in ESEA section 1111(b)(2)(E)-(H) that prescribe how an SEA must establish annual measurable objectives (AMOs) for determining adequate yearly progress (AYP) to ensure that all students meet or exceed the State’s proficient level of academic achievement on the State’s assessments in reading/language arts and mathematics no later than the end of the 2013–2014 school year. The SEA requests this waiver to develop new ambitious but achievable AMOs in reading/language arts and mathematics in order to provide meaningful goals that are used to guide support and improvement efforts for the State, LEAs, schools, and student subgroups.
2. The requirements in ESEA section 1116(b) for an LEA to identify for improvement, corrective action, or restructuring, as appropriate, a Title I school that fails, for two consecutive years or more, to make AYP, and for a school so identified and its LEA to take certain improvement actions. The SEA requests this waiver so that an LEA and its Title I schools need not comply with these requirements.
3. The requirements in ESEA section 1116(c) for an SEA to identify for improvement or corrective action, as appropriate, an LEA that, for two consecutive years or more, fails to make AYP, and for an LEA so identified and its SEA to take certain improvement actions. The SEA requests this waiver so that it need not comply with these requirements with respect to its LEAs.
4. The requirements in ESEA sections 6213(b) and 6224(e) that limit participation in, and use of funds under the Small, Rural School Achievement (SRSA) and Rural and Low-Income School (RLIS) programs based on whether an LEA has made AYP and is complying with the requirements in ESEA section 1116. The SEA requests this waiver so that an LEA that receives SRSA or RLIS funds may use those funds for any authorized purpose regardless of whether the LEA makes AYP.
5. The requirement in ESEA section 1114(a)(1) that a school have a poverty percentage of 40 percent or more in order to operate a school-wide program. The SEA requests this waiver so that an LEA may implement interventions consistent with the turnaround principles or interventions that are based on the needs of the students in the school and designed to enhance the entire educational program in a school in any of its priority and focus schools that meet the definitions of “priority schools” and “focus schools,” respectively, set forth in the document titled ESEA Flexibility, as appropriate, even if those schools do not have a poverty percentage of 40 percent or more.
6. The requirement in ESEA section 1003(a) for an SEA to distribute funds reserved under

6
Amended July 28, 2015
ESEA FLEXIBI LITY – REQ UEST U . S . D EPARTMEN T OF ED UC ATION
that section only to LEAs with schools identified for improvement, corrective action, or restructuring. The SEA requests this waiver so that it may allocate section 1003(a) funds to its LEAs in order to serve any of the State’s priority and focus schools that meet the definitions of “priority schools” and “focus schools,” respectively, set forth in the document titled ESEA Flexibility.
7. The provision in ESEA section 1117(c)(2)(A) that authorizes an SEA to reserve Title I, Part A funds to reward a Title I school that (1) significantly closed the achievement gap between subgroups in the school; or (2) has exceeded AYP for two or more consecutive years. The SEA requests this waiver so that it may use funds reserved under ESEA section 1117(c)(2)(A) for any of the State’s reward schools that meet the definition of “reward schools” set forth in the document titled ESEA Flexibility.
8. The requirements in ESEA section 2141(a), (b), and (c) for an LEA and SEA to comply with certain requirements for improvement plans regarding highly qualified teachers. The SEA requests this waiver to allow the SEA and its LEAs to focus on developing and implementing more meaningful evaluation and support systems.
9. The limitations in ESEA section 6123 that limit the amount of funds an SEA or LEA may transfer from certain ESEA programs to other ESEA programs. The SEA requests this waiver so that it and its LEAs may transfer up to 100 percent of the funds it receives under the authorized programs among those programs and into Title I, Part A. Optional Flexibilities: If an SEA chooses to request waivers of any of the following requirements, it should check the corresponding box(es) below:
10. The requirements in ESEA sections 4201(b)(1)(A) and 4204(b)(2)(A) that restrict the activities provided by a community learning center under the Twenty-First Century Community Learning Centers (21st CCLC) program to activities provided only during non-school hours or periods when school is not in session (i.e., before and after school or during summer recess). The SEA requests this waiver so that 21st CCLC funds may be used to support expanded learning time during the school day in addition to activities during non-school hours or periods when school is not in session.
11. The requirements in ESEA sections 1116(a)(1)(A)-(B) and 1116(c)(1)(A) that require LEAs and SEAs to make determinations of adequate yearly progress (AYP) for schools and LEAs, respectively. The SEA requests this waiver because continuing to determine whether an LEA and its schools make AYP is inconsistent with the SEA’s State-developed differentiated recognition, accountability, and support system included in its ESEA flexibility request. The SEA and its LEAs must report on their report cards performance against the AMOs for all subgroups identified in ESEA section 1111(b)(2)(C)(v), and use performance against the AMOs to support continuous improvement in Title I schools.
7
Amended July 28, 2015
ESEA FLEXIBI LITY – REQ UEST U . S . D EPARTMEN T OF ED UC ATION
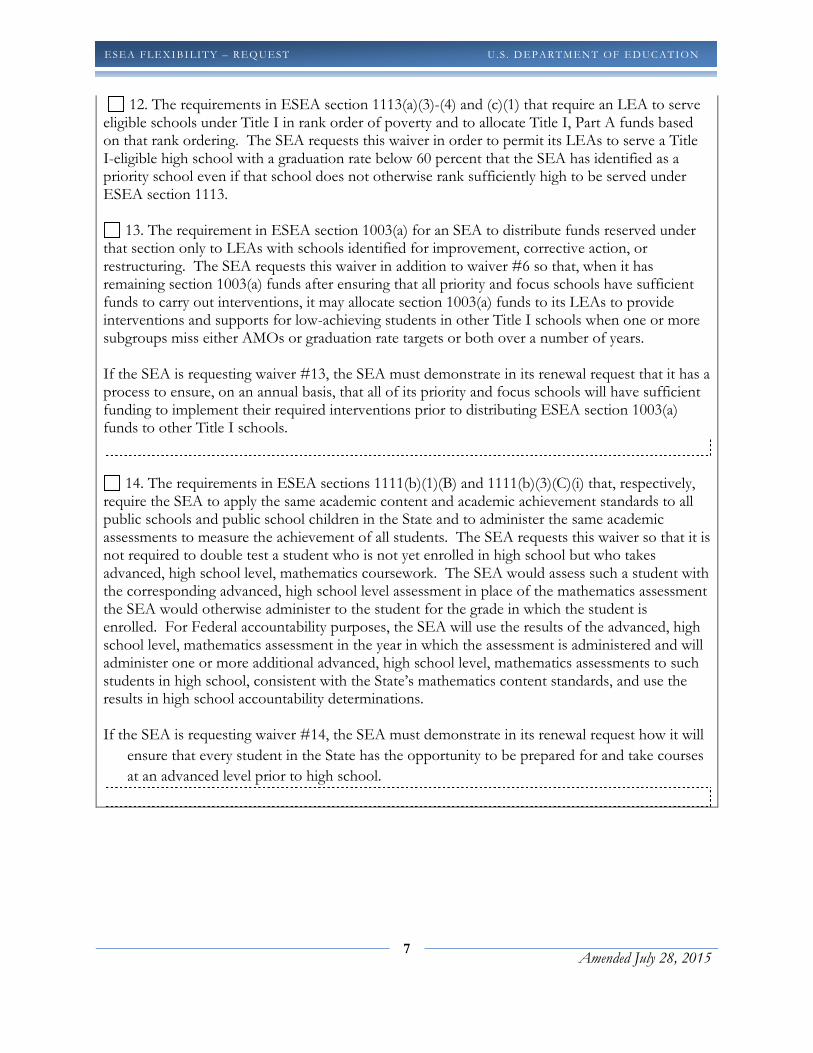
12. The requirements in ESEA section 1113(a)(3)-(4) and (c)(1) that require an LEA to serve eligible schools under Title I in rank order of poverty and to allocate Title I, Part A funds based on that rank ordering. The SEA requests this waiver in order to permit its LEAs to serve a Title I-eligible high school with a graduation rate below 60 percent that the SEA has identified as a priority school even if that school does not otherwise rank sufficiently high to be served under ESEA section 1113.
13. The requirement in ESEA section 1003(a) for an SEA to distribute funds reserved under that section only to LEAs with schools identified for improvement, corrective action, or restructuring. The SEA requests this waiver in addition to waiver #6 so that, when it has remaining section 1003(a) funds after ensuring that all priority and focus schools have sufficient funds to carry out interventions, it may allocate section 1003(a) funds to its LEAs to provide interventions and supports for low-achieving students in other Title I schools when one or more subgroups miss either AMOs or graduation rate targets or both over a number of years. If the SEA is requesting waiver #13, the SEA must demonstrate in its renewal request that it has a process to ensure, on an annual basis, that all of its priority and focus schools will have sufficient funding to implement their required interventions prior to distributing ESEA section 1003(a) funds to other Title I schools.
14. The requirements in ESEA sections 1111(b)(1)(B) and 1111(b)(3)(C)(i) that, respectively,
require the SEA to apply the same academic content and academic achievement standards to all public schools and public school children in the State and to administer the same academic assessments to measure the achievement of all students. The SEA requests this waiver so that it is not required to double test a student who is not yet enrolled in high school but who takes advanced, high school level, mathematics coursework. The SEA would assess such a student with the corresponding advanced, high school level assessment in place of the mathematics assessment the SEA would otherwise administer to the student for the grade in which the student is enrolled. For Federal accountability purposes, the SEA will use the results of the advanced, high school level, mathematics assessment in the year in which the assessment is administered and will administer one or more additional advanced, high school level, mathematics assessments to such students in high school, consistent with the State’s mathematics content standards, and use the results in high school accountability determinations. If the SEA is requesting waiver #14, the SEA must demonstrate in its renewal request how it will
ensure that every student in the State has the opportunity to be prepared for and take courses
at an advanced level prior to high school.
8
Amended July 28, 2015
ESEA FLEXIBI LITY – REQ UEST U . S . D EPARTMEN T OF ED UC ATION
ASSURANCES
By submitting this request, the SEA assures that:
1. It requests waivers of the above-referenced requirements based on its agreement to meet Principles 1 through 4 of ESEA flexibility, as described throughout the remainder of this request.
2. It has adopted English language proficiency (ELP) standards that correspond to the State’s college- and career-ready standards, consistent with the requirement in ESEA section 3113(b)(2), and that reflect the academic language skills necessary to access and meet the State’s college- and career-ready standards. (Principle 1)
3. It will administer no later than the 2014–2015 school year alternate assessments based on grade-level academic achievement standards or alternate assessments based on alternate academic achievement standards for students with the most significant cognitive disabilities that are consistent with 34 C.F.R. § 200.6(a)(2) and are aligned with the State’s college- and career-ready standards. (Principle 1)
4. It will develop and administer ELP assessments aligned with the State’s ELP standards, consistent with the requirements in ESEA sections 1111(b)(7), 3113(b)(2), and 3122(a)(3)(A)(ii) no later than the 2015–2016 school year. (Principle 1)
5. It will report annually to the public on college-going and college credit-accumulation rates for all students and subgroups of students in each LEA and each public high school in the State. (Principle 1)
6. If the SEA includes student achievement on assessments in addition to reading/language arts and mathematics in its differentiated recognition, accountability, and support system and uses achievement on those assessments to identify priority and focus schools, it has technical documentation, which can be made available to the Department upon request, demonstrating that the assessments are administered statewide; include all students, including by providing appropriate accommodations for English Learners and students with disabilities, as well as alternate assessments based on grade-level academic achievement standards or alternate assessments based on alternate academic achievement standards for students with the most significant cognitive disabilities, consistent with 34 C.F.R. § 200.6(a)(2); and are valid and reliable for use in the SEA’s differentiated recognition, accountability, and support system. (Principle 2)
7. It will annually make public its lists of reward schools, priority schools, and focus schools prior to the start of the school year as well as publicly recognize its reward schools, and will update its lists of priority and focus schools at least every three years. (Principle 2) If the SEA is not submitting with its renewal request its updated list of priority and focus schools, based on the most recent available data, for implementation beginning in the 2015–2016 school year, it must also assure that:

9
Amended July 28, 2015
ESEA FLEXIBI LITY – REQ UEST U . S . D EPARTMEN T OF ED UC ATION
8. It will provide to the Department, no later than January 31, 2016, an updated list of priority and focus schools, identified based on school year 2014–2015 data, for implementation beginning in the 2016–2017 school year.
9. It will evaluate and, based on that evaluation, revise its own administrative requirements to reduce duplication and unnecessary burden on LEAs and schools. (Principle 4)
10. It has consulted with its Committee of Practitioners regarding the information set forth in its ESEA flexibility request.
11. Prior to submitting this request, it provided all LEAs with notice and a reasonable opportunity to comment on the request and has attached a copy of that notice (Attachment 1) as well as copies of any comments it received from LEAs. (Attachment 2)
12. Prior to submitting this request, it provided notice and information regarding the request to the public in the manner in which the SEA customarily provides such notice and information to the public (e.g., by publishing a notice in the newspaper; by posting information on its website) and has attached a copy of, or link to, that notice. (Attachment 3)
13. It will provide to the Department, in a timely manner, all required reports, data, and evidence regarding its progress in implementing the plans contained throughout its ESEA flexibility request, and will ensure that all such reports, data, and evidence are accurate, reliable, and complete or, if it is aware of issues related to the accuracy, reliability, or completeness of its reports, data, or evidence, it will disclose those issues.
14. It will report annually on its State report card and will ensure that its LEAs annually report on their local report cards, for the “all students” group, each subgroup described in ESEA section 1111(b)(2)(C)(v)(II), and for any combined subgroup (as applicable): information on student achievement at each proficiency level; data comparing actual achievement levels to the State’s annual measurable objectives; the percentage of students not tested; performance on the other academic indicator for elementary and middle schools; and graduation rates for high schools. In addition, it will annually report, and will ensure that its LEAs annually report, all other information and data required by ESEA section 1111(h)(1)(C) and 1111(h)(2)(B), respectively. It will ensure that all reporting is consistent with State and Local Report Cards Title I, Part A of the Elementary and Secondary Education Act of 1965, as Amended Non-Regulatory Guidance (February 8, 2013).
10
Amended July 28, 2015
ESEA FLEXIBI LITY – REQ UEST U . S . D EPARTMEN T OF ED UC ATION
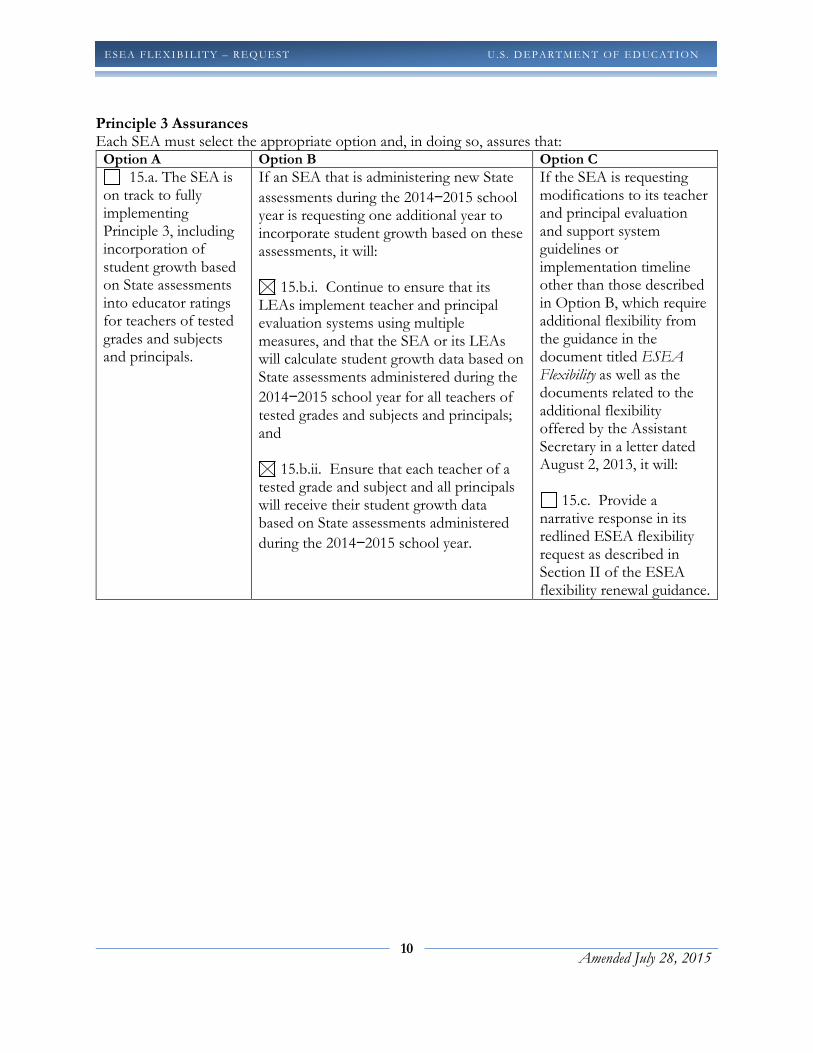
Principle 3 Assurances Each SEA must select the appropriate option and, in doing so, assures that:
Option A Option B Option C
15.a. The SEA is on track to fully implementing Principle 3, including incorporation of student growth based on State assessments into educator ratings for teachers of tested grades and subjects and principals.
If an SEA that is administering new State
assessments during the 2014−2015 school year is requesting one additional year to incorporate student growth based on these assessments, it will:
15.b.i. Continue to ensure that its LEAs implement teacher and principal evaluation systems using multiple measures, and that the SEA or its LEAs will calculate student growth data based on State assessments administered during the
2014−2015 school year for all teachers of tested grades and subjects and principals; and
15.b.ii. Ensure that each teacher of a tested grade and subject and all principals will receive their student growth data based on State assessments administered
during the 2014−2015 school year.
If the SEA is requesting modifications to its teacher and principal evaluation and support system guidelines or implementation timeline other than those described in Option B, which require additional flexibility from the guidance in the document titled ESEA Flexibility as well as the documents related to the additional flexibility offered by the Assistant Secretary in a letter dated August 2, 2013, it will:
15.c. Provide a narrative response in its redlined ESEA flexibility request as described in Section II of the ESEA flexibility renewal guidance.

11
Amended July 28, 2015
ESEA FLEXIBI LITY – REQ UEST U . S . D EPARTMEN T OF ED UC ATION
CONSULTATION
An SEA must meaningfully engage and solicit input from diverse stakeholders and communities in the
development of its request. To demonstrate that an SEA has done so, the SEA must provide an assurance
that it has consulted with the State’s Committee of Practitioners regarding the information set forth in the
request and provide the following:
1. A description of how the SEA meaningfully engaged and solicited input on its request from teachers
and their representatives.
2. A description of how the SEA meaningfully engaged and solicited input on its request from other
diverse communities, such as students, parents, community-based organizations, civil rights
organizations, organizations representing students with disabilities and English Learners, business
organizations, and Indian tribes.
The Michigan Department of Education (MDE) has had active stakeholder engagement on an ongoing
basis, especially during the last several years of intensive education reform efforts. State officials
work closely with organizations of teachers, administrators, higher education representatives, student
advocacy groups, and others whose input continuously shapes and strengthens educational policy and
practice. Throughout the waiver request, examples are provided of stakeholder input and support.
At the time the waiver opportunity was announced, MDE contacted the leaders of the state’s
education stakeholder organizations with critical details and timelines for providing input.
Engagement and input are outlined below by Principle. Examples are given, in this section and
elsewhere, where stakeholder input changed the waiver request.
A complete list of organizations that provided input can be found in Attachment 2 along with a
summary of the input received. Beginning in October, regular phone conversations and meetings
were held with education organizations and others to ensure that all constituencies were involved to
consider strategies and responses. We also conducted webinars and online surveys as a means of
determining feedback across our state.
During our stakeholder engagement, we have considered the feedback of our education “customers”
—parents, families, communities—as well as that of our teachers and practitioners. We reached out
to seek the advice of parents, students, community members, and business leaders, taking care to pay
special attention to traditionally under-represented communities such as minority groups and persons
with disabilities.
MDE also collected and reviewed comments from the general public, which came through a
specialized email account established for this purpose ([email protected]).
12
Amended July 28, 2015
ESEA FLEXIBI LITY – REQ UEST U . S . D EPARTMEN T OF ED UC ATION
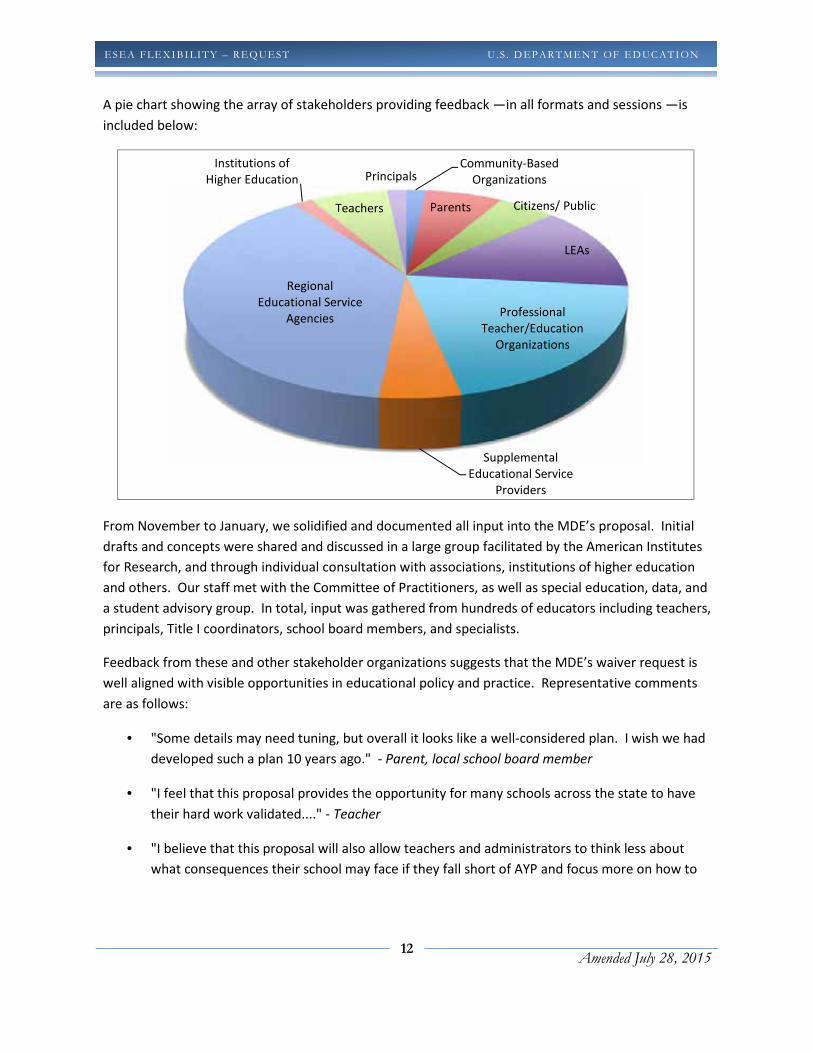
A pie chart showing the array of stakeholders providing feedback —in all formats and sessions —is
included below:
From November to January, we solidified and documented all input into the MDE’s proposal. Initial
drafts and concepts were shared and discussed in a large group facilitated by the American Institutes
for Research, and through individual consultation with associations, institutions of higher education
and others. Our staff met with the Committee of Practitioners, as well as special education, data, and
a student advisory group. In total, input was gathered from hundreds of educators including teachers,
principals, Title I coordinators, school board members, and specialists.
Feedback from these and other stakeholder organizations suggests that the MDE’s waiver request is
well aligned with visible opportunities in educational policy and practice. Representative comments
are as follows:
• "Some details may need tuning, but overall it looks like a well-considered plan. I wish we had
developed such a plan 10 years ago." - Parent, local school board member
• "I feel that this proposal provides the opportunity for many schools across the state to have
their hard work validated...." - Teacher
• "I believe that this proposal will also allow teachers and administrators to think less about
what consequences their school may face if they fall short of AYP and focus more on how to
Community-Based
Organizations
Parents Citizens/ Public
LEAs
Professional
Teacher/Education
Organizations
Supplemental
Educational Service
Providers
Regional
Educational Service
Agencies
Institutions of
Higher Education
Teachers
Principals
13
Amended July 28, 2015
ESEA FLEXIBI LITY – REQ UEST U . S . D EPARTMEN T OF ED UC ATION
proactively close achievement gaps that is needed to beat the odds and restore American
education to the global prominence it once had." - Teacher
• "(A)s a first-year curriculum director...and a parent of two school-aged children, I'd like to say
thank you. Thank you for valuing education enough to raise the bar and hold all students to a
higher standard... When my two young children graduate from high school and the diploma is
placed in their hands, I look forward to knowing that they have earned something great,
something that will prepare them for postsecondary experiences." - Educator, Parent
• "I am ecstatic about the aggressive position that the State of Michigan is taking to raise the
rigor and expectations for academic achievement of all students. I am re-energized by the
recognition that higher academic standards and requirements of proficiency are needed at all
levels in education. The proposed Flexibility Waivers will move us in the right direction
toward closing gaps and improving the quality of public education." - Educator
• "MDE and Superintendent Flanagan should receive consistent thanks for continually pushing
Michigan forward in an effort to provide all levels of learners the skills necessary to be college
and career ready by the time they graduate." - Educator
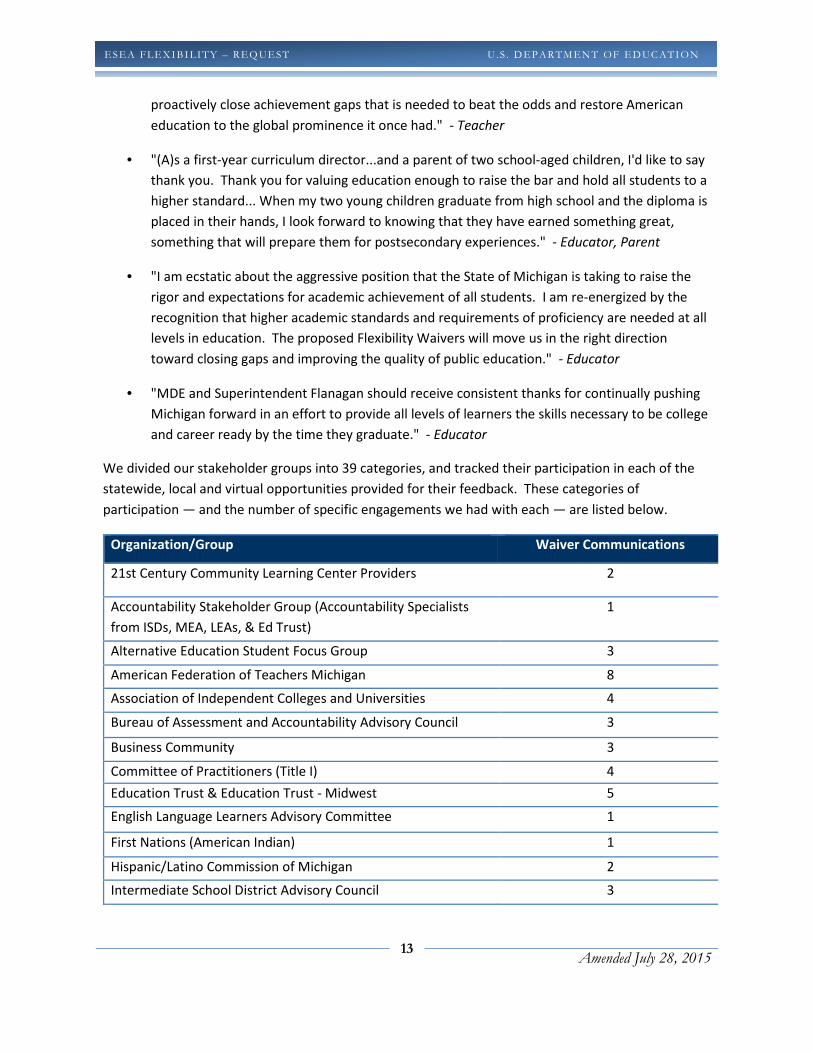
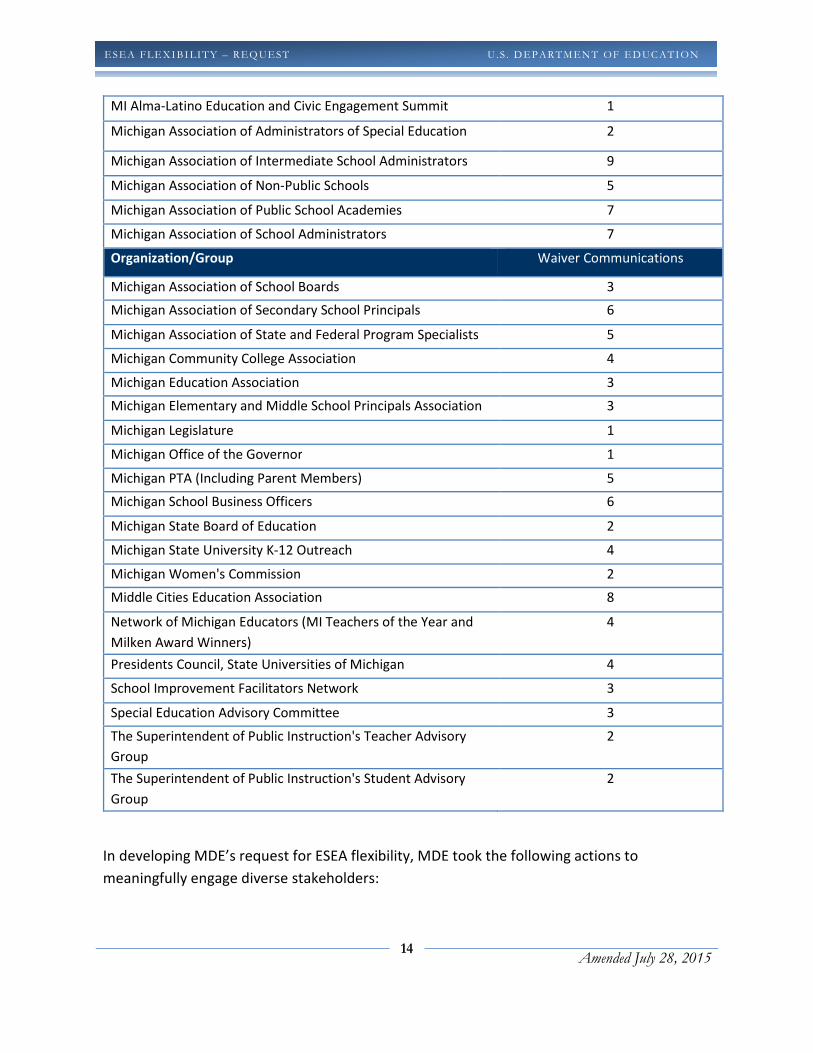
We divided our stakeholder groups into 39 categories, and tracked their participation in each of the
statewide, local and virtual opportunities provided for their feedback. These categories of
participation — and the number of specific engagements we had with each — are listed below.
Organization/Group Waiver Communications
21st Century Community Learning Center Providers 2
Accountability Stakeholder Group (Accountability Specialists
from ISDs, MEA, LEAs, & Ed Trust)
1
Alternative Education Student Focus Group 3
American Federation of Teachers Michigan 8
Association of Independent Colleges and Universities 4
Bureau of Assessment and Accountability Advisory Council 3
Business Community 3
Committee of Practitioners (Title I) 4
Education Trust & Education Trust - Midwest 5
English Language Learners Advisory Committee 1
First Nations (American Indian) 1
Hispanic/Latino Commission of Michigan 2
Intermediate School District Advisory Council 3
14
Amended July 28, 2015
ESEA FLEXIBI LITY – REQ UEST U . S . D EPARTMEN T OF ED UC ATION
MI Alma-Latino Education and Civic Engagement Summit 1
Michigan Association of Administrators of Special Education 2
Michigan Association of Intermediate School Administrators 9
Michigan Association of Non-Public Schools 5
Michigan Association of Public School Academies 7
Michigan Association of School Administrators 7
Organization/Group Waiver Communications
Michigan Association of School Boards 3
Michigan Association of Secondary School Principals 6
Michigan Association of State and Federal Program Specialists 5
Michigan Community College Association 4
Michigan Education Association 3
Michigan Elementary and Middle School Principals Association 3
Michigan Legislature 1
Michigan Office of the Governor 1
Michigan PTA (Including Parent Members) 5
Michigan School Business Officers 6
Michigan State Board of Education 2
Michigan State University K-12 Outreach 4
Michigan Women's Commission 2
Middle Cities Education Association 8
Network of Michigan Educators (MI Teachers of the Year and
Milken Award Winners)
4
Presidents Council, State Universities of Michigan 4
School Improvement Facilitators Network 3
Special Education Advisory Committee 3
The Superintendent of Public Instruction's Teacher Advisory
Group
2
The Superintendent of Public Instruction's Student Advisory
Group
2
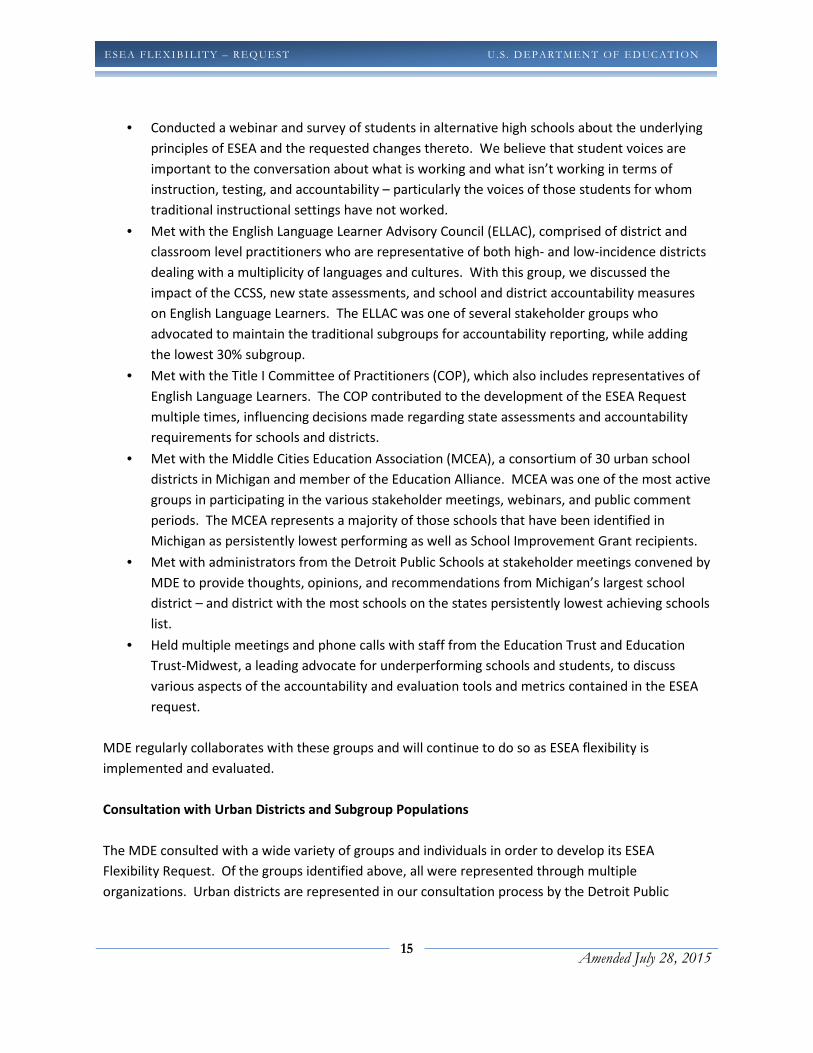
In developing MDE’s request for ESEA flexibility, MDE took the following actions to
meaningfully engage diverse stakeholders:
15
Amended July 28, 2015
ESEA FLEXIBI LITY – REQ UEST U . S . D EPARTMEN T OF ED UC ATION
• Conducted a webinar and survey of students in alternative high schools about the underlying
principles of ESEA and the requested changes thereto. We believe that student voices are
important to the conversation about what is working and what isn’t working in terms of
instruction, testing, and accountability – particularly the voices of those students for whom
traditional instructional settings have not worked.
• Met with the English Language Learner Advisory Council (ELLAC), comprised of district and
classroom level practitioners who are representative of both high- and low-incidence districts
dealing with a multiplicity of languages and cultures. With this group, we discussed the
impact of the CCSS, new state assessments, and school and district accountability measures
on English Language Learners. The ELLAC was one of several stakeholder groups who
advocated to maintain the traditional subgroups for accountability reporting, while adding
the lowest 30% subgroup.
• Met with the Title I Committee of Practitioners (COP), which also includes representatives of
English Language Learners. The COP contributed to the development of the ESEA Request
multiple times, influencing decisions made regarding state assessments and accountability
requirements for schools and districts.
• Met with the Middle Cities Education Association (MCEA), a consortium of 30 urban school
districts in Michigan and member of the Education Alliance. MCEA was one of the most active
groups in participating in the various stakeholder meetings, webinars, and public comment
periods. The MCEA represents a majority of those schools that have been identified in
Michigan as persistently lowest performing as well as School Improvement Grant recipients.
• Met with administrators from the Detroit Public Schools at stakeholder meetings convened by
MDE to provide thoughts, opinions, and recommendations from Michigan’s largest school
district – and district with the most schools on the states persistently lowest achieving schools
list.
• Held multiple meetings and phone calls with staff from the Education Trust and Education
Trust-Midwest, a leading advocate for underperforming schools and students, to discuss
various aspects of the accountability and evaluation tools and metrics contained in the ESEA
request.
MDE regularly collaborates with these groups and will continue to do so as ESEA flexibility is
implemented and evaluated.
Consultation with Urban Districts and Subgroup Populations
The MDE consulted with a wide variety of groups and individuals in order to develop its ESEA
Flexibility Request. Of the groups identified above, all were represented through multiple
organizations. Urban districts are represented in our consultation process by the Detroit Public

16
Amended July 28, 2015
ESEA FLEXIBI LITY – REQ UEST U . S . D EPARTMEN T OF ED UC ATION
Schools and Middle Cities. Detroit Public Schools participated in two meetings for general
stakeholder input and was also represented through several of the educational groups such as the
Committee of Practitioners, the Special Education Advisory Committee, and the English Language
Learner Advisory Council. Middle Cities represents urban centers and has as its stated purpose to
serve as an advocate for member districts to insure quality educational programs for all urban
students. The following districts are among the 33 member school districts: Benton Harbor,
Dearborn, Flint, Grand Rapids, Jackson, Kalamazoo, Lansing, Pontiac, and Saginaw. Middle Cities
participated in four face to face or virtual meetings from October 2011 through February 2012 and
provided comment in each situation. Both Detroit and Middle Cities represent member interests in
African American and Middle Eastern students as well as English Language Learners.
Further consultation was sought through the English Language Learner Advisory Council in order to
assure that the needs of students whose primary language is not English were being considered and
addressed. The Council suggested that there be a very strong role for parents in the formation and
execution of the locally developed reform plans. The Council has representation from district and
classroom level practitioners. These practitioners are representative of both high- and low-incidence
districts dealing with a multiplicity of languages and cultures. The Council meets four times a year and
has representation from Oakland and Wayne counties which make up the largest portion of Middle
Eastern students in the state and the nation.
The Michigan Title I Committee of Practitioners served as another opportunity to gather input
regarding the needs of urban, African American, Middle Eastern students, and English Language
Learners. All facets of the Michigan student population are represented on the committee through
parents, teachers, principals, central office, and superintendents. The Committee met twice and was
generally supportive of the Waiver Request. There were concerns expressed about funding in order
support the rapid turnaround necessary to achieve the learning targets for all students, teacher
preparation, and ongoing professional development. There were no concerns specifically raised
regarding any of the populations mentioned above.
The Michigan Parent Teacher Association organized a face-to-face meeting with parents from across
the state in order to understand the components of the Waiver Request and to provide feedback.
The membership of the group present at the meeting represented all ethnic and racial groups as well
as a spectrum of ages. The feedback from the group included concerns about the ability of the school
to address the specific needs of each child, behavior concerns and the involvement of parents at the
local district level in both the planning and implementation of any reform plans. The parents also
expressed a desire to set the learning targets at 100% proficiency rather than 85%.
Meetings with all groups mentioned above were face-to-face or virtual unless otherwise noted. These
groups as well as others have memberships that work with students from urban settings, are African
17
Amended July 28, 2015
ESEA FLEXIBI LITY – REQ UEST U . S . D EPARTMEN T OF ED UC ATION
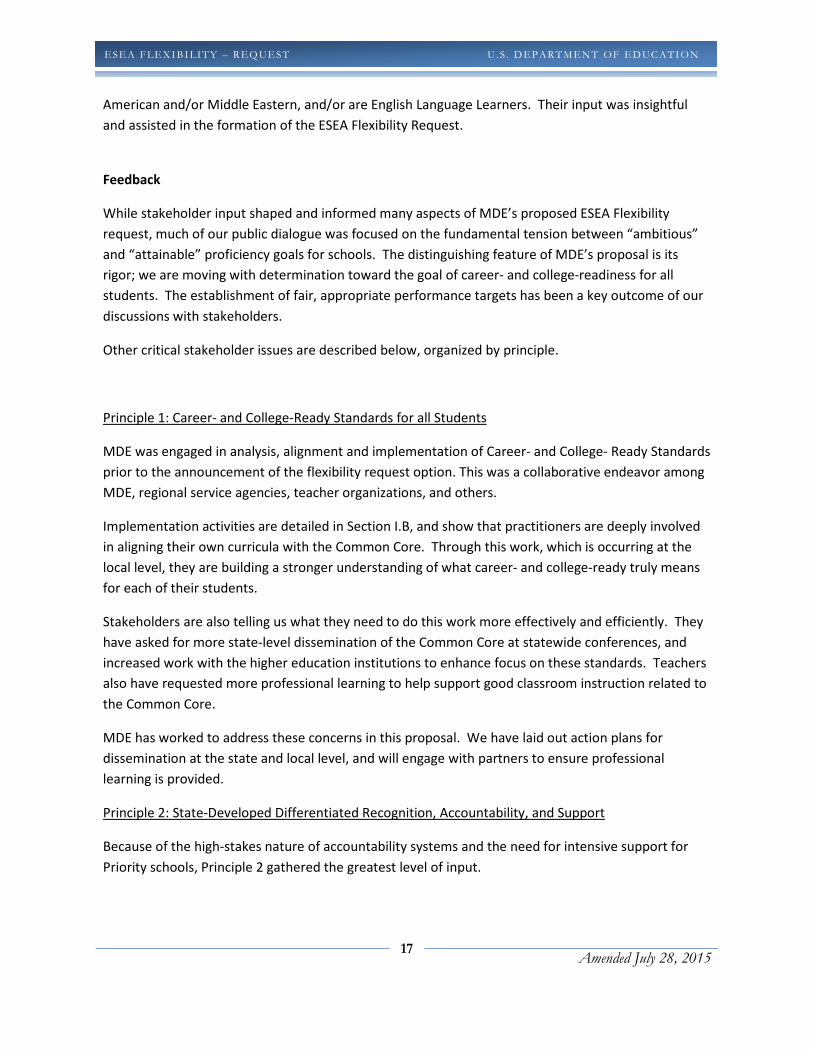
American and/or Middle Eastern, and/or are English Language Learners. Their input was insightful
and assisted in the formation of the ESEA Flexibility Request.
Feedback
While stakeholder input shaped and informed many aspects of MDE’s proposed ESEA Flexibility
request, much of our public dialogue was focused on the fundamental tension between “ambitious”
and “attainable” proficiency goals for schools. The distinguishing feature of MDE’s proposal is its
rigor; we are moving with determination toward the goal of career- and college-readiness for all
students. The establishment of fair, appropriate performance targets has been a key outcome of our
discussions with stakeholders.
Other critical stakeholder issues are described below, organized by principle.
Principle 1: Career- and College-Ready Standards for all Students
MDE was engaged in analysis, alignment and implementation of Career- and College- Ready Standards
prior to the announcement of the flexibility request option. This was a collaborative endeavor among
MDE, regional service agencies, teacher organizations, and others.
Implementation activities are detailed in Section I.B, and show that practitioners are deeply involved
in aligning their own curricula with the Common Core. Through this work, which is occurring at the
local level, they are building a stronger understanding of what career- and college-ready truly means
for each of their students.
Stakeholders are also telling us what they need to do this work more effectively and efficiently. They
have asked for more state-level dissemination of the Common Core at statewide conferences, and
increased work with the higher education institutions to enhance focus on these standards. Teachers
also have requested more professional learning to help support good classroom instruction related to
the Common Core.
MDE has worked to address these concerns in this proposal. We have laid out action plans for
dissemination at the state and local level, and will engage with partners to ensure professional
learning is provided.
Principle 2: State-Developed Differentiated Recognition, Accountability, and Support
Because of the high-stakes nature of accountability systems and the need for intensive support for
Priority schools, Principle 2 gathered the greatest level of input.
18
Amended July 28, 2015
ESEA FLEXIBI LITY – REQ UEST U . S . D EPARTMEN T OF ED UC ATION
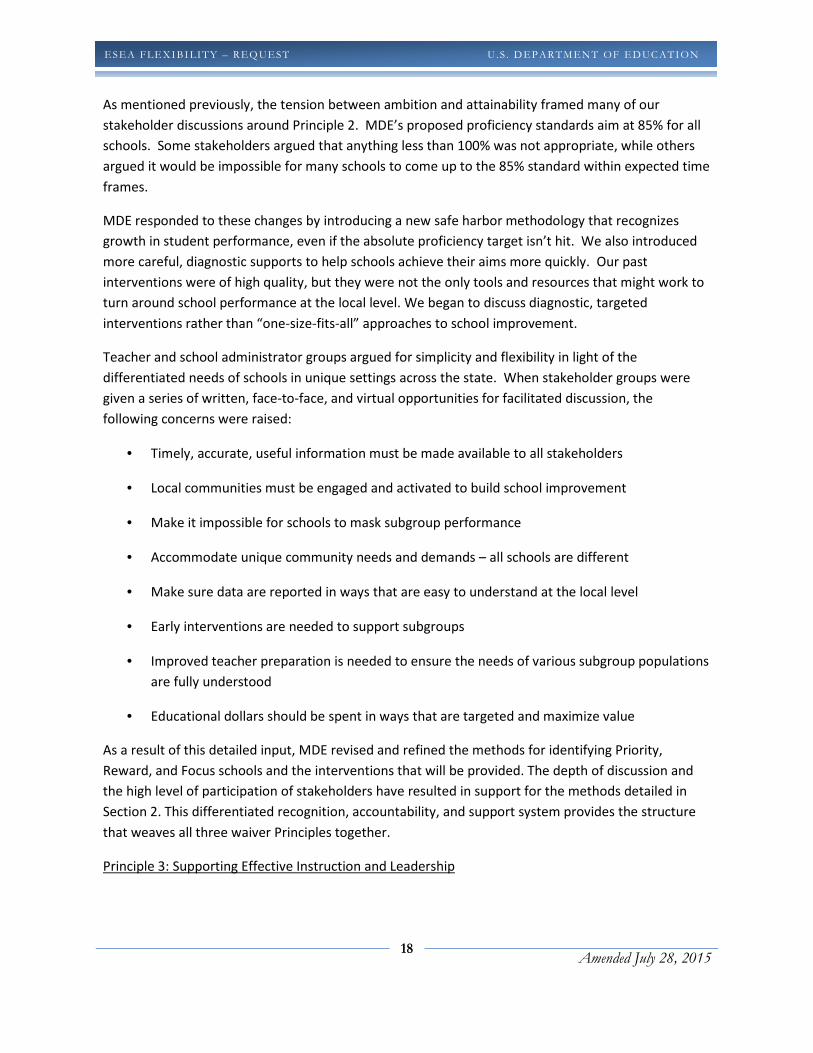
As mentioned previously, the tension between ambition and attainability framed many of our
stakeholder discussions around Principle 2. MDE’s proposed proficiency standards aim at 85% for all
schools. Some stakeholders argued that anything less than 100% was not appropriate, while others
argued it would be impossible for many schools to come up to the 85% standard within expected time
frames.
MDE responded to these changes by introducing a new safe harbor methodology that recognizes
growth in student performance, even if the absolute proficiency target isn’t hit. We also introduced
more careful, diagnostic supports to help schools achieve their aims more quickly. Our past
interventions were of high quality, but they were not the only tools and resources that might work to
turn around school performance at the local level. We began to discuss diagnostic, targeted
interventions rather than “one-size-fits-all” approaches to school improvement.
Teacher and school administrator groups argued for simplicity and flexibility in light of the
differentiated needs of schools in unique settings across the state. When stakeholder groups were
given a series of written, face-to-face, and virtual opportunities for facilitated discussion, the
following concerns were raised:
• Timely, accurate, useful information must be made available to all stakeholders
• Local communities must be engaged and activated to build school improvement
• Make it impossible for schools to mask subgroup performance
• Accommodate unique community needs and demands – all schools are different
• Make sure data are reported in ways that are easy to understand at the local level
• Early interventions are needed to support subgroups
• Improved teacher preparation is needed to ensure the needs of various subgroup populations
are fully understood
• Educational dollars should be spent in ways that are targeted and maximize value
As a result of this detailed input, MDE revised and refined the methods for identifying Priority,
Reward, and Focus schools and the interventions that will be provided. The depth of discussion and
the high level of participation of stakeholders have resulted in support for the methods detailed in
Section 2. This differentiated recognition, accountability, and support system provides the structure
that weaves all three waiver Principles together.
Principle 3: Supporting Effective Instruction and Leadership
19
Amended July 28, 2015
ESEA FLEXIBI LITY – REQ UEST U . S . D EPARTMEN T OF ED UC ATION
In 2009, Michigan passed legislation requiring annual educator evaluations that included student
growth as a “significant part,” the results of which are used to inform decisions about promotion,
retention, placement and compensation. These evaluations were specified to begin during the 2011-
2012 school year. Michigan’s LEAs immediately began preparing to implement this legislation, and
are now in the midst of the first year of implementing these locally-developed annual educator
evaluations for all teachers and administrators. For the first time, every single one of Michigan’s
educators will be evaluated using measures of student growth, and the results of these evaluations
will be reported into MDE’s data systems.
One issue with the original legislation was that it did not provide much in the way of standardization
across districts, in order to ensure both a standard of quality and continuity in ratings. To address this
shortcoming, the Michigan legislature adopted Public Act 102 of 2011 to introduce more
standardization and comparability into both the educator evaluation system and the ratings produced
by this system. Stakeholders now have the opportunity to give testimony before the Michigan Council
on Educator Effectiveness, a statutory panel working to support the statewide development and
implementation of educator evaluation systems. The dean of the University of Michigan’s College of
Education, Dr. Deborah Loewenberg Ball, leads the Council, which consists of two school principals,
data analysts from Michigan State University, a charter school management company, and MDE.
In the last two years, MDE convened a stakeholder group to develop new recommendations regarding
professional learning. This group produced a new policy on professional learning, which the Michigan
State Board of Education adopted in January 2012. This policy is based on the Learning Forward
Standards for Professional Learning, and the intent is to help districts, schools, and educators
appropriately identify professional learning opportunities to support their work. We anticipate the
field can leverage these standards when integrating professional learning into their evaluation
systems, and we intend to produce interim guidelines to assist them with these efforts.
Michigan is one of few states implementing annual educator evaluations that include student growth
as a significant portion in the 2011-2012 school year, due to our proactive and aggressive legislation.
We believe this is a strength for us, even though the evaluations systems differ across districts. We
do know, however, that districts have been having critical conversations with stakeholders, designing
observation rubrics, looking for solutions to integrate growth, developing local assessments,
partnering with foundations or other nonprofit enterprises in their area, and collaborating with each
other as they work to develop a system that is fair and that meets the criteria of the original law. To
support this, MDE hosted two statewide Educator Evaluation Best Practices conferences in 2011 and
2012 focused on student growth, in order to help the field come together and share their best
practices with each other.
Next Steps
20
Amended July 28, 2015
ESEA FLEXIBI LITY – REQ UEST U . S . D EPARTMEN T OF ED UC ATION
MDE plans several ongoing strategies to continuously engage teachers and their representatives:
• Starting in the summer/fall of 2012, MDE will partner with the Michigan Education Association, the
state’s largest teachers’ union, to deliver regular webinars on instructional strategies for successful
implementation of the CCSS.
• Develop, through direct email and social media, outlets for the regular communication with
classroom teachers regarding instruction, assessment, evaluation, and accountability.
• Continue to convene, either in person or virtually, the Superintendent’s Teacher Advisory Panel, to
provide insights and recommendations regarding statewide education and education reform efforts.
• Engage the Network of Michigan Educators, a consortium of Michigan’s National Board Certified
teachers, present and prior teachers of the year, Milken award winners, and others, in an ongoing
conversation regarding and action planning for instructional excellence, professional learning, and
other timely topics and statewide efforts.
• Work with the Michigan Education Alliance to facilitate ongoing dialogue with constituent groups,
including intermediate school districts, teachers, school leaders, board members, and others.
Already, this group has begun to provide written information about their ability to support our work
in the months ahead.
• Finally, we will develop and issue periodic written communications in the form of newsletters,
emails, and memoranda to ensure all educators in Michigan have access to up-to-the minute
information about the progress of our work.
Consultation on ESEA Flexibility Implementation and Renewal
Michigan has remained engaged in dialogue with stakeholders throughout the initial implementation
period of ESEA Flexibility. As evidence of Michigan’s commitment to continuous conversation and
evaluation of the impact of implementation, the MDE has worked with its stakeholders, including LEAs,
ISDs/RESAs, the Education Alliance (representing parents, teachers, administrators, school boards,
higher education, public school academies, non-public schools, and teachers’ representatives in addition
to LEAs and ISDs/RESEAs), the Committee of Practitioners, the Michigan Legislature, Governor’s Office,
and other interested parties to continuously improve the programming to support ESEA Flexibility and
student outcomes through three optional amendment processes and extension request between 2012
and 2014. The initiation of each amendment and approval process was the result of ongoing
engagement between the MDE and stakeholders that resulted in the identification of areas for
improvement.
Throughout the development of the ESEA Flexibility Renewal Request, the MDE has meaningfully
solicited input on the implementation of ESEA Flexibility and proposed changes to its currently approved
Request from LEAs, teachers and their representatives, administrators, students, parents, community-
based organizations, civil rights organizations, organizations representing students with disabilities,

21
Amended July 28, 2015
ESEA FLEXIBI LITY – REQ UEST U . S . D EPARTMEN T OF ED UC ATION
organizations representing English Learners, business organizations, institutions of higher education,
Indian tribes, the Michigan Legislature, the Governor’s Office, the State Board of Education, and other
key stakeholder groups in Michigan, including Education Trust – Midwest, the Michigan College Access
Network, and local and national experts in assessment and accountability. Attachment 2.D provides
information on specific meetings held and outreach mechanisms used with various stakeholder groups.
Examples of the outreach recorded in Attachment 2.D include:
• Presentations to standing groups, including the Special Education Advisory Council (SEAC); the
Committee of Practitioners; the School Improvement Facilitators’ Network; the ISD Advisory; the
General Education Leadership Network; the Michigan Association of State and Federal Programs
Supervisors; the Title III Advisory Committee; and the MDE’s Division of Accountability Services
Technical Advisory Committee;
• Specifically-convened meetings with the Education Alliance, Ed Trust – Midwest, and Michigan’s
Office of Civil Rights;
• Meetings with Michigan Representatives and Senators as well as testimony before Legislative
committees on ESEA Flexibility and the renewal thereof; and
• Public presentations to the Michigan State Board of Education in February and March 2015 (see
attachments 3.F and 3.G).
These meetings and outreach efforts provided the feedback necessary for the MDE to develop the
updates, changes, and amendments reflected in the updates to this ESEA Flexibility Request document.
Michigan’s ESEA Flexibility Renewal Request, as well as a redline version of this document, were
published for public comment from March 9, 2015 through March 23, 2015 (see Attachment 1.E and
3.H). The MDE received 45 comments during the public comment period (see Attachment 2.E),
representing 20 LEAs, seven ISDs/RESAs, and four advocacy/professional organizations (the Michigan
Association of Secondary School Principals, the Education Trust – Midwest, the Michigan Association of
School Administrators, and the Michigan Association of Intermediate School Administrators), as well as
individual teachers, building administrators, parents, and the general public. All comments were read,
analyzed, and considered in preparing Michigan’s final Renewal Request to be submitted on March 31,
2015.
Two key changes were made to Michigan’s Request based on feedback received during the public
comment period:
1. The Renewal Request published by the MDE for public comment proposed that Priority
schools in the 2012 cohort would not be eligible for exit until 2017, despite completing three
full years of intervention and support implementation at the end of the 2015-16 school year.
This delay in exit for 2012 cohort schools was based on the years of transition in state
assessments and continuity in two years of data under a stable assessment system for high-
stakes identification and exit determinations. Public comments received demonstrated an
22
Amended July 28, 2015
ESEA FLEXIBI LITY – REQ UEST U . S . D EPARTMEN T OF ED UC ATION
overwhelming desire to allow 2012 cohort schools meeting exit criteria to exit in 2016. In
consideration of these comments and a re-examination of the original rationale, the MDE has
modified its proposal to make 2012 cohort schools eligible for exit in 2016. High-stakes
accountability decisions regarding identification of Priority schools is fundamentally different
from the demonstration of improvement over time, and thus the MDE is comfortable in the
ability to use state assessment data during transition years for an exit determination.
2. Similarly, the Renewal Request published by the MDE for public comment proposed that
Focus schools in the 2012 cohort be conditionally suspended from status and that Focus
schools in the 2013 and 2014 cohorts be held in their current status for supports and
interventions. Public comments received demonstrated an overwhelming desire to allow
schools from each cohort to exit as soon as they become eligible based on meeting exit
criteria for two consecutive years. In consideration of these comments and a re-examine of
the original rationale, the MDE has modified its proposal to make all cohorts of Focus schools
eligible for exit once they meet exit criteria for two consecutive years, meaning that 2012
cohort schools are eligible this year; 2013 cohort schools in 2015-16; and 2014 cohort schools
in 2016-17. High-stakes accountability decisions regarding identification of Focus schools is
fundamentally different from the demonstration of improvement over time, and thus the
MDE is comfortable in the ability to use state assessment data during transition years for an
exit determination.
A significant number of public comments were also received urging the creation of an annual Parent
Dashboard separate from Priority/Focus/Reward identification and Accountability Scorecard publication.
Based on this feedback, the MDE will work to encourage the formation of stakeholder groups to discuss
the concept and make recommendations for a family-friendly tool to report annually on the status,
progress, and successes of Michigan’s schools.
Although outside the purview of ESEA Flexibility, the MDE also notes that a significant number of
stakeholder comments were received requesting a delay in the requirement to administer state
assessments to English Learners until a student has been living and learning in Michigan for 2-3 years.
The MDE will continue to engage USED, other states, and key stakeholders in this discussion to work
toward the best system for serving English Learners in Michigan.
An online survey of over 500 Michigan parents (of students in grades Pre-K through 12) and over 300
Michigan students (in grades 8-12) representing over 60 counties across the state was conducted
concurrently with the public comment period to solicit feedback from these critical stakeholders. The
survey indicated that parents and students:
• Find the elements of Principle I of Michigan’s ESEA Flexibility Request to be most important to
improving Michigan’s schools, with the most important aspect being Principle I’s new focus on

23
Amended July 28, 2015
ESEA FLEXIBI LITY – REQ UEST U . S . D EPARTMEN T OF ED UC ATION
early intervention when students fall behind and ensuring appropriate training for teachers in
early literacy instruction.
• Agree that holding schools accountable for success, providing trained education experts to
identify problems and provide solutions, and having an Accountability Scorecard are the most
important elements of Principle 2 of Michigan’s ESEA Flexibility Request.
The MDE will continue and continuously improve its collaborative approach to evaluating the impacts of
ESEA Flexibility implementation in Michigan via stakeholder engagement as described in this section and
throughout the Request.
EVALUATION
The Department encourages an SEA that receives approval to implement the flexibility to collaborate with
the Department to evaluate at least one program, practice, or strategy the SEA or its LEAs implement under
principle 1, 2, or 3. Upon receipt of approval of the flexibility, an interested SEA will need to nominate for
evaluation a program, practice, or strategy the SEA or its LEAs will implement under principles 1, 2, or 3.
The Department will work with the SEA to determine the feasibility and design of the evaluation and, if it is
determined to be feasible and appropriate, will fund and conduct the evaluation in partnership with the SEA,
ensuring that the implementation of the chosen program, practice, or strategy is consistent with the
evaluation design.
Check here if you are interested in collaborating with the Department in this evaluation, if your request
for the flexibility is approved.
OVERVIEW OF SEA’S REQUEST FOR THE ESEA FLEXIBILITY
Provide an overview (about 500 words) of the SEA’s request for the flexibility that:
1. explains the SEA’s comprehensive approach to implement the waivers and principles and describes
the SEA’s strategy to ensure this approach is coherent within and across the principles; and
2. describes how the implementation of the waivers and principles will enhance the SEA’s and its
LEAs’ ability to increase the quality of instruction for students and improve student achievement.
Our Theory of Action
If a school’s challenges are accurately diagnosed through data analysis and professional dialogue at the
building and district levels, then the implementation of a focused and customized set of interventions
will result in school and student success. This approach will result in:
∗ Consistent implementation of career- and college-ready standards
24
Amended July 28, 2015
ESEA FLEXIBI LITY – REQ UEST U . S . D EPARTMEN T OF ED UC ATION
∗ Rapid turnaround for schools not meeting annual measurable objectives (AMOs)
∗ Reduction in the achievement gap
∗ Reduction in systemic issues at the district level
∗ Improvements to the instructional core
∗ Better understanding/utilization of data
∗ Improved graduation and attendance rates
∗ Building of/support for effective teaching
∗ Building of/support for school leadership capacity
∗ Effective accomplishment of responsibilities by district leadership
Core Principles
Excellence and equity are the twin underpinnings of our work to improve student achievement in
Michigan. We hold ourselves deeply accountable for providing rigorous, effective learning
opportunities to all children, from infancy to adulthood. Student learning is the center and aim of all
we do.
We believe:
∗ All means all. Every child has an innate capacity for learning, and we must meet the needs of
each and every Michigan student with high-quality systems, tools and resources. Our
expectations for all students must be consistently high.
∗ We must ensure our children are career- and college-ready. We define this as student
preparation that is adequate to allow a student to pass first-year technical training and first-
year college courses in core areas without remediation. Our state is preparing students not
just for the opportunities we know about today, but also for the economic and intellectual
challenges of the future.
∗ Our teachers and administrators are professionals whose talents are equal to the task before
them. We must ensure our systems support their work effectively and allow them to innovate
to meet the needs of their students.
∗ Our work with schools and districts must emphasize careful diagnosis and targeted support, to
maximize all available resources, capitalize on the creativity and analysis of our front-line
professionals, and effectively address the needs of all students.
Recent Changes
In recent years, our advancements relative to educational policy, practice and accountability have
reflected the above-listed principles. Some highlights:

25
Amended July 28, 2015
ESEA FLEXIBI LITY – REQ UEST U . S . D EPARTMEN T OF ED UC ATION
∗ We were among the first in adopting career- and college-ready standards to challenge our
students, and we are extending this work through implementation of the Common Core State
Standards developed through the National Governor’s Association and the Council of Chief
State School Officers.
∗ We already administer rigorous student assessments in grades 3-9, culminating with a high
school assessment that includes the ACT in grade 11. This year, we have raised the cut scores
for these tests, to better reflect how well schools are preparing their students to be on track
for each step of their journey toward careers and/or college. In the coming years, we will
transition to summative assessments being deployed through the SMARTER Balanced
Assessment Consortium, using similarly rigorous cut scores to determine student performance.
∗ Our teachers and staff are being supported through a strong, coherent school improvement
framework. In the coming year, we will revamp our state-level supports for Priority and Focus
schools, to eliminate achievement gaps and ensure high-quality opportunities for all Michigan
children.
Taken together, we believe these changes —all of which are being carried out in partnership with
teachers, policymakers and other stakeholders — create a tighter, more coherent system of
accountability and performance for all Michigan schools and the students they serve.
We view this waiver request as an opportunity to leverage our work in these and other areas. Our
proposed activities include:
• Alignment of our assessment system with new career-and college-ready standards;
• An accountability system that holds schools responsible for student learning of the standards,
and that sharpens our collective focus on closing achievement gaps;
• Achievable but rigorous objectives that move students rapidly toward proficiency in the
standards;
• Supports, incentives, and monitoring that help keep all schools on track to increased student
learning and aid them in meeting the needs of student subgroups; and
• A teacher and administrator evaluation system that uses assessment data to keep the focus on
student learning.
We are confident full implementation of the items specified in this waiver request will enhance our
ability to continue building toward excellence and equity for all Michigan learners.
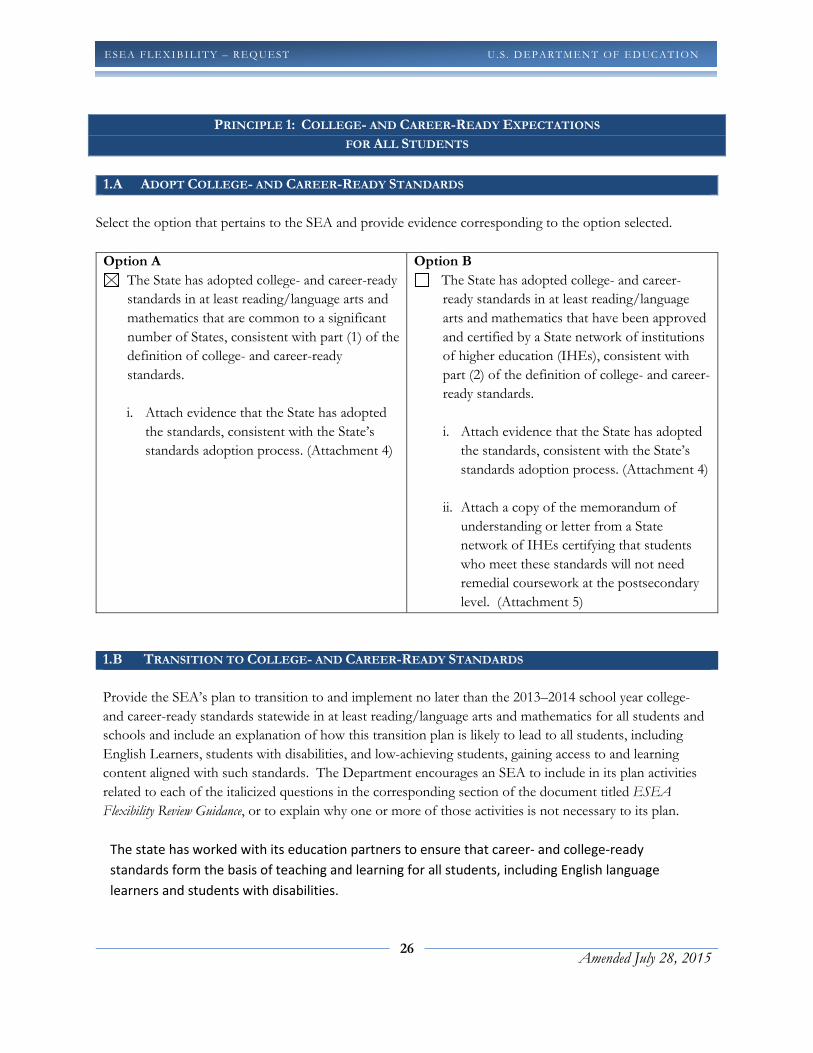
26
Amended July 28, 2015
ESEA FLEXIBI LITY – REQ UEST U . S . D EPARTMEN T OF ED UC ATION
PRINCIPLE 1: COLLEGE- AND CAREER-READY EXPECTATIONS
FOR ALL STUDENTS
1.A ADOPT COLLEGE- AND CAREER-READY STANDARDS
Select the option that pertains to the SEA and provide evidence corresponding to the option selected.
Option A
The State has adopted college- and career-ready
standards in at least reading/language arts and
mathematics that are common to a significant
number of States, consistent with part (1) of the
definition of college- and career-ready
standards.
i. Attach evidence that the State has adopted
the standards, consistent with the State’s
standards adoption process. (Attachment 4)
Option B
The State has adopted college- and career-
ready standards in at least reading/language
arts and mathematics that have been approved
and certified by a State network of institutions
of higher education (IHEs), consistent with
part (2) of the definition of college- and career-
ready standards.
i. Attach evidence that the State has adopted
the standards, consistent with the State’s
standards adoption process. (Attachment 4)
ii. Attach a copy of the memorandum of
understanding or letter from a State
network of IHEs certifying that students
who meet these standards will not need
remedial coursework at the postsecondary
level. (Attachment 5)
1.B TRANSITION TO COLLEGE- AND CAREER-READY STANDARDS
Provide the SEA’s plan to transition to and implement no later than the 2013–2014 school year college-
and career-ready standards statewide in at least reading/language arts and mathematics for all students and
schools and include an explanation of how this transition plan is likely to lead to all students, including
English Learners, students with disabilities, and low-achieving students, gaining access to and learning
content aligned with such standards. The Department encourages an SEA to include in its plan activities
related to each of the italicized questions in the corresponding section of the document titled ESEA
Flexibility Review Guidance, or to explain why one or more of those activities is not necessary to its plan.
The state has worked with its education partners to ensure that career- and college-ready
standards form the basis of teaching and learning for all students, including English language
learners and students with disabilities.
27
Amended July 28, 2015
ESEA FLEXIBI LITY – REQ UEST U . S . D EPARTMEN T OF ED UC ATION
Our intention now is to amplify what we have accomplished in 1.A and 1.B by instituting a
statewide plan to ramp up early literacy and math requirements and postsecondary access
and persistence rates throughout the state.
Our Theory of Action � Principle One1
If a school’s challenges are accurately diagnosed through data analysis and professional
dialogue at the building and district levels, then the implementation of a focused and
customized set of interventions will result in school and student success. This approach will
result in:
∗ Consistent implementation of career- and college-ready standards
∗ Rapid turnaround for schools not meeting annual measurable objectives (AMOs)
∗ Reduction in the achievement gap
∗ Reduction in systemic issues at the district level
∗ Improvements to the instructional core
∗ Better understanding/utilization of data
∗ Improved graduation and attendance rates
∗ Building of/support for effective teaching
∗ Building of/support for school leadership capacity
∗ Effective accomplishment of responsibilities by district leadership
Career and College Readiness Agenda
Our state took a major leap forward in 2004, with the release of new grade level content
expectations in K-8 English Language Arts (ELA) and mathematics. At the time of their release these
expectations were considered some of the most rigorous in the nation. Two years later we adopted
a rigorous new set of statewide graduation requirements designed to ensure that all students
graduate from high school career- and college-ready. No longer is it acceptable to graduate high
school with credit based on seat time. Instead, all Michigan students are required to demonstrate
proficiency in required academic standards in order to receive a diploma.
By the end of 2008, MDE had K-12 content expectations in ELA, mathematics, science, and social
studies as well the visual and performing arts, physical education/health, and world languages.
Subsequent adoption in June 2010 of the Common Core State Standards in mathematics and ELA
served to validate Michigan's already rigorous standards in these content areas, as evidenced by
key crosswalk documents. Although in some cases content shifted grades, essentially the content
1 At the beginning of each section, our Theory of Action is restated. We have bolded the elements that most directly relate to
the Principle being addressed.

28
Amended July 28, 2015
ESEA FLEXIBI LITY – REQ UEST U . S . D EPARTMEN T OF ED UC ATION
required by the Common Core was already represented in MDE’s content expectations. This past
year, in a message to the Michigan Legislature, Governor Snyder proposed a new public school
learning model: students should be able to learn “Any Time, Any Place, Any Way, Any Pace.” These
shifts have put a spotlight on the need for teaching rigorous content with multiple access points
and opportunities for success. Our challenge now is to support schools with instituting systems of
instruction that provide all students with opportunities to learn this content.
To further the focus on a CCR agenda, MDE committed to an early literacy and mathematics
initiative in 2014. Through discussions with literacy and mathematics experts, a vision for
supporting educators to ensure student proficiency in early literacy and mathematics was
developed. The vision supports MDE as the cornerstone for a statewide network to provide
consistent and equitable access of resources to ALL of Michigan’s children to ensure proficiency in
these content areas by the end of 3rd grade.
Organizing to Support Effective Teaching and Learning
Although curricular decisions, including implementation of the CCSS, are the responsibility of the
local school districts, MDE is dedicated to promoting instructional systems that prepare all students
to be career- and college-ready. The adoption of the Common Core has allowed Michigan to be a
part of various multi-state conversations about implementation and assessment of a common set
of standards. Our state’s education agencies and partners have sought to leverage these
opportunities by finding ways to break down silos created by funding sources and task demands.
We also are working together to identify and use the resources, tools and information that best fit
our state’s educational opportunities.
To these ends, an MDE “Career- and College-Ready Core Team” has been developed with the
purpose of developing common messages, complimentary and parallel activities, and the sharing of
expertise. This work will be done through six workgroups:
• Effective Instruction and Interventions
• Effective Educators
• Balanced Assessment
• Accountability and Transparency
• Infrastructure
• P-20 Transitions
Workgroups will initially be used to organize work across MDE offices, but eventually other
stakeholders will be added to groups as the work evolves. These workgroups are parallel to the
State Implementation Elements outlined in Achieve’s “A Strong State Role in Common Core State
Standards Implementation: Rubric and Self-Assessment Tool.” Currently the CCR Core Team is using
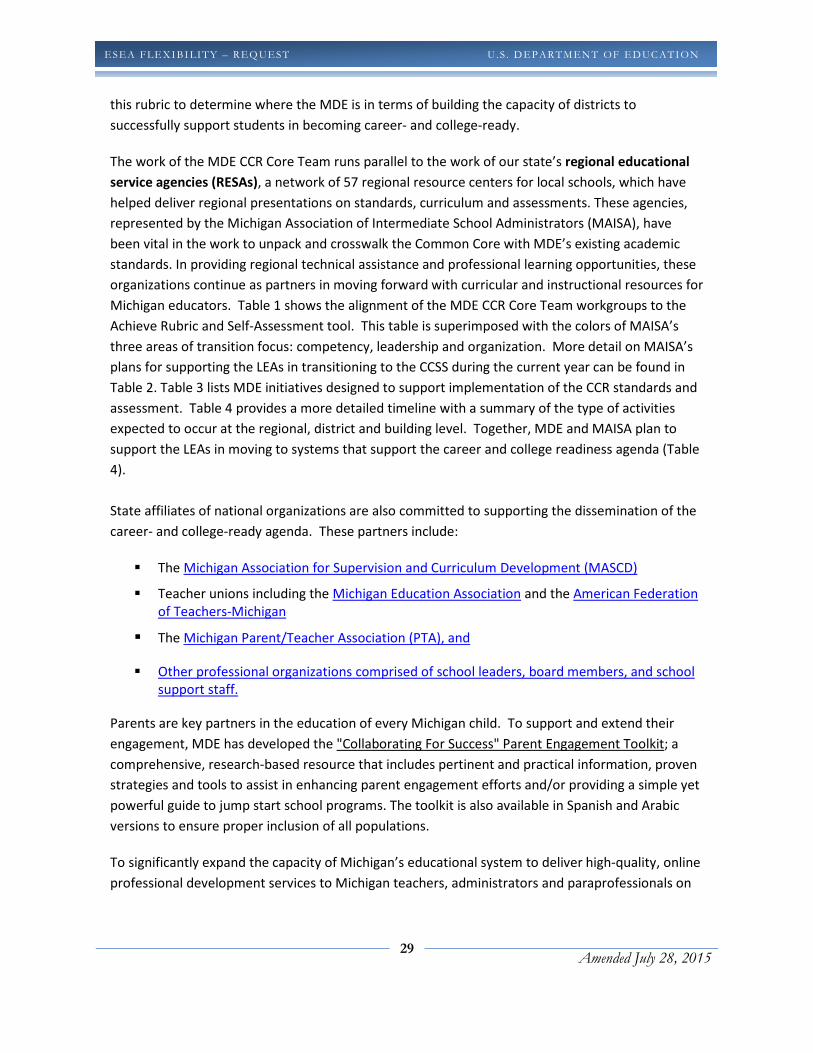
29
Amended July 28, 2015
ESEA FLEXIBI LITY – REQ UEST U . S . D EPARTMEN T OF ED UC ATION
this rubric to determine where the MDE is in terms of building the capacity of districts to
successfully support students in becoming career- and college-ready.
The work of the MDE CCR Core Team runs parallel to the work of our state’s regional educational
service agencies (RESAs), a network of 57 regional resource centers for local schools, which have
helped deliver regional presentations on standards, curriculum and assessments. These agencies,
represented by the Michigan Association of Intermediate School Administrators (MAISA), have
been vital in the work to unpack and crosswalk the Common Core with MDE’s existing academic
standards. In providing regional technical assistance and professional learning opportunities, these
organizations continue as partners in moving forward with curricular and instructional resources for
Michigan educators. Table 1 shows the alignment of the MDE CCR Core Team workgroups to the
Achieve Rubric and Self-Assessment tool. This table is superimposed with the colors of MAISA’s
three areas of transition focus: competency, leadership and organization. More detail on MAISA’s
plans for supporting the LEAs in transitioning to the CCSS during the current year can be found in
Table 2. Table 3 lists MDE initiatives designed to support implementation of the CCR standards and
assessment. Table 4 provides a more detailed timeline with a summary of the type of activities
expected to occur at the regional, district and building level. Together, MDE and MAISA plan to
support the LEAs in moving to systems that support the career and college readiness agenda (Table
4).
State affiliates of national organizations are also committed to supporting the dissemination of the
career- and college-ready agenda. These partners include:
� The Michigan Association for Supervision and Curriculum Development (MASCD)
� Teacher unions including the Michigan Education Association and the American Federation
of Teachers-Michigan
� The Michigan Parent/Teacher Association (PTA), and
� Other professional organizations comprised of school leaders, board members, and school
support staff.
Parents are key partners in the education of every Michigan child. To support and extend their
engagement, MDE has developed the "Collaborating For Success" Parent Engagement Toolkit; a
comprehensive, research-based resource that includes pertinent and practical information, proven
strategies and tools to assist in enhancing parent engagement efforts and/or providing a simple yet
powerful guide to jump start school programs. The toolkit is also available in Spanish and Arabic
versions to ensure proper inclusion of all populations.
To significantly expand the capacity of Michigan’s educational system to deliver high-quality, online
professional development services to Michigan teachers, administrators and paraprofessionals on

30
Amended July 28, 2015
ESEA FLEXIBI LITY – REQ UEST U . S . D EPARTMEN T OF ED UC ATION
an “anytime/anywhere” basis, Michigan Virtual University (MVU) and MDE have created a
statewide communication and professional development portal for use by Michigan’s educators
and members of the K-12 community (Learnport). These efforts continue with support from Title
II—Improving Teacher Quality funds.
Other partners include:
� The Education Alliance of Michigan, an independent, non-profit organization made up of
the executive directors of the statewide teacher unions, and administrator, parent,
postsecondary and school business official associations. This alliance has established
working relationships across stakeholder groups that enable it to exchange ideas and
develop education policy recommendations that improve the design and delivery of
education at all levels from infancy through adulthood.
With these programs and partners, MDE has planted a number of seeds for success in
implementing the Common Core. We are actively working with our partners to encourage their
growth, knowing that educators who are reached by one or more of these initiatives will realize
greater success in improving the quality of the instructional core here in Michigan.
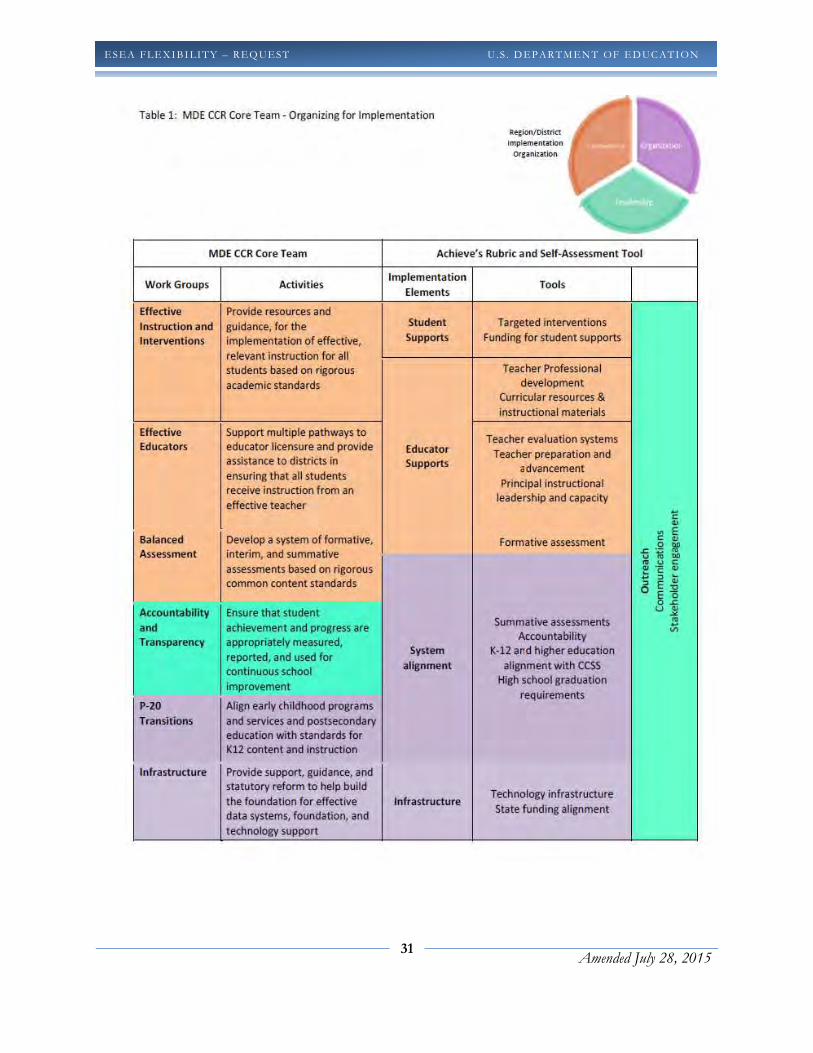
31
Amended July 28, 2015
ESEA FLEXIBI LITY – REQ UEST U . S . D EPARTMEN T OF ED UC ATION
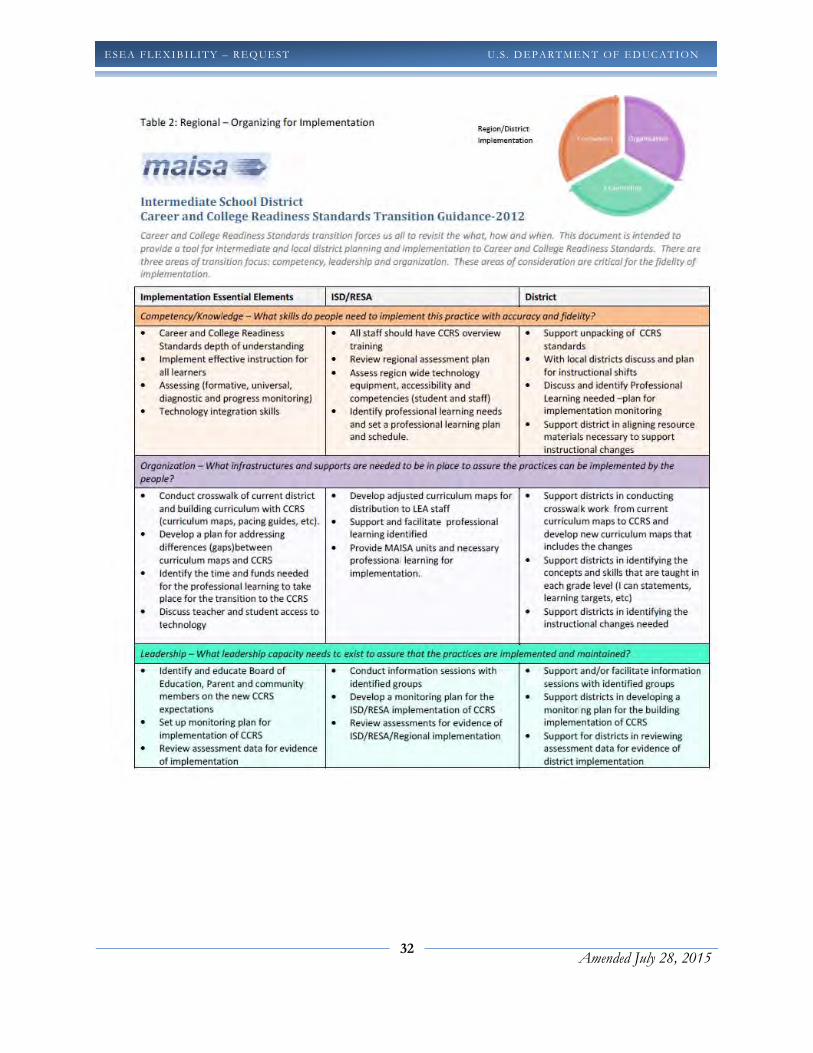
32
Amended July 28, 2015
ESEA FLEXIBI LITY – REQ UEST U . S . D EPARTMEN T OF ED UC ATION

33
Amended July 28, 2015
ESEA FLEXIBI LITY – REQ UEST U . S . D EPARTMEN T OF ED UC ATION
Table 3. MDE Implementation Initiatives
Work Groups Activities Initiatives include:
Effective Instruction
and Interventions
Provide resources and guidance, for the
implementation of effective, relevant
instruction for all students based on
rigorous academic standards
• Career and College Ready Portal
• Hiring additional instructional consultants
• Partnering with MAISA to develop model
instructional units
• Connecting the Dots model academic goals project
• Michigan Online Professional Learning
(MOPLS)modules
• SIOP training for ELL and General Ed teachers
• Reaching and Teaching Struggling Learners
• Title II funded grant projects
• Early literacy and mathematics initiative
• Integration of academics/CCR standards into CTE
instructional programs
Effective Educators Support multiple pathways to educator
licensure and provide assistance to
districts in ensuring that all students
receive instruction from an effective
teacher
• Deciding whether to continue to use the PSMTs
(Professional Standards for Michigan Teachers) or
move to INTASC.
• Revised its endorsement program approval process
to reflect outcome measures, instead of inputs.
• Plan to revise the ESL and bilingual endorsement
standards to reflect the needs of the field and CCSS.
• An EL/Special Education Core Team has begun
discussing how/ what it would look like to include EL
aspects into the Special Education endorsement, as
well as EL and Special Education aspects into all
endorsement standards.
• Considering incorporating aspects cultural
competence, EL, Special Education and instructional
technology within all endorsement standards.
• MI began discussion of CCSS and the relationship
with educator preparation in the Fall of 2011.
• Revising all ELA related endorsement to include
CCSS/CCR
• Plan to revise the elementary endorsement standards
to reflect Math and ELA CCSS, as well as the
elementary and secondary mathematics
endorsement standards.
• Michigan Council on Educator Effectiveness
Balanced
Assessment
Develop a system of formative, interim,
and summative assessments based on
rigorous common content standards
• Michigan Assessment Consortium
• Smarter Balanced Assessment Consortium
• MI-Access
• English Language Proficiency Assessment
Accountability and
Transparency
Ensure that student achievement and
progress are appropriately measured,
reported, and used for continuous
school improvement
• School Improvement Plans
• Connecting the Dots academic goals project
• AdvancED partnership

34
Amended July 28, 2015
ESEA FLEXIBI LITY – REQ UEST U . S . D EPARTMEN T OF ED UC ATION
P-20 Transitions Align early childhood programs and
services and postsecondary education
with standards for K12 content and
instruction
• Office of Great Start
• CTE/Academic standards alignment
• Dual enrollment
• Seat time waivers
• Early colleges
• Michigan Merit Exam
• Michigan Transition Outcomes Project (MI-TOP)
Infrastructure Provide support, guidance, and statutory
reform to help build the foundation for
effective data systems, foundation, and
technology support
• Smarter Balanced Assessment Consortium
• Regional Educational Media Centers (REMC)
• Data warehouses
• Center for Educational Performance and Information
(CEPI)
Table 4. Timeline for Implementing New Standards and Assessments
Workgroups Who 2011-2012 Prepare for Implementation
2012-2013 Implementation
2013-2014 Evaluate/Revise
2014-2015 Test
Effective Instruction and Interventions
MDE Provide resources and guidance, for the implementation of effective, relevant instruction for all students based on rigorous academic standards
ISD/RESA
• Support unpacking of
CCSS standards and
alignment of
resources
• Provide guidance in
implementing a multi-
tiered model of
instruction and
intervention
• Support piloting of new
resources
• Provide technical
assistance to districts
implementing a multi-
tiered model of
instruction and
intervention
• Monitor/support multi-
tiered models of
instruction and
intervention
• Monitor/support in
multi-tiered models
of instruction and
intervention
District
• Support unpacking of
CCSS standards and
alignment of
resources
• Align district
resources
• Work with buildings
to design a multi-
tiered model of
instruction and
intervention
• Support schools in
piloting new resources
• Provide technical
assistance to schools in
implementing a multi-
tiered model of
instruction and
intervention
• Evaluate/revise as
necessary
implementation of new
resources
• Evaluate/revise as
necessary multi-tiered
models of instruction
and intervention
• Monitor/support
implementation of
instructional
resources
• Monitor/support in
multi-tiered models
of instruction and
intervention
Building
• Unpack CCSS
standards
• Align current
resources and identify
needed resources
• Work with district to
design a multi-tiered
model of instruction
and intervention
• Pilot new resources
• Implement a multi-
tiered system of
instruction and
intervention
• Evaluate/revise as
necessary
implementation of new
resources
• Evaluate/revise as
necessary multi-tiered
models of instruction
and intervention
• Continue to
evaluate/revise as
necessary
implementation of
instructional
resources
• Continue to
evaluate/revise as
necessary multi-tiered
models of instruction
Effective Educators MDE
Support multiple pathways to educator licensure and provide assistance to districts in ensuring that all students receive instruction from an effective teacher

35
Amended July 28, 2015
ESEA FLEXIBI LITY – REQ UEST U . S . D EPARTMEN T OF ED UC ATION
ISD/RESA
• Prepare for
professional learning
needs of districts
• Support development
of and/or training in
educator evaluation
tools and processes
• Provide/support
professional learning
opportunities for all
educators, including
principals and teachers
of SWD and ELL students
(i.e. SIOP, effective Tier
1 instruction,
intervention strategies,
coaching)
• Support implementation
of educator evaluation
systems
• Provide/support
professional learning
opportunities for all
educators, including
teachers of SWD and
ELL students (i.e. SIOP,
effective Tier 1
instruction,
intervention strategies,
coaching)
• Monitor/support
implementation of
educator evaluation
systems
• Continue to provide
professional learning
opportunities for all
educators, including
teachers of SWD and
ELL students
• Monitor/support implementation of educator evaluation systems
District
• Plan for professional
learning needs of
buildings
• Develop and/or train
principals to use
educator evaluation
tools and processes
• Provide/support
professional learning
opportunities for all
educators, including
principals and teachers
of SWD and ELL students
(i.e. SIOP, effective Tier
1 instruction,
intervention strategies,
coaching, mentoring
new educators)
• Support implementation
of educator evaluations
• Evaluate/revise as
necessary professional
learning opportunities
for all educators,
including principals and
teachers of SWD and
ELL students
• Monitor/support
implementation of
educator evaluations
• Evaluate/revise as
necessary
professional learning
opportunities for all
educators, including
principals and
teachers of SWD and
ELL students
• Monitor/support
implementation of
educator evaluations
Building
• Identify professional
learning needs of
teachers
• Learn to use educator
evaluation tools
• Implement/support
professional learning
opportunities for all
educators, including
principals and teachers
of SWD and ELL students
• Implement educator
evaluations
• Evaluate/revise as
necessary professional
learning opportunities
• Monitor/support
implementation of
educator evaluations
• Evaluate/revise as
necessary
professional learning
opportunities
• Monitor/support
implementation of
educator evaluations
Balanced Assessment
MDE Develop a system of formative, interim, and summative assessments based on rigorous common content standards
ISD/RESA
• Review regional
assessment plan
• Support implementation
of interim and formative
assessments
• Provide summative
assessments
information [Smarter
Balanced
(SBAC)/Dynamic
Learning Maps
(DLM)/WIDA
• Monitor/support
implementation of
interim and formative
assessments
• Provide SBAC
summative
assessments
information
• Monitor/support
implementation of
interim /formative
assessments
• Support M-STEP
summative
assessment
administration
District
• Review district
assessment plan
• Support building
implementation of
interim and formative
assessments
• Stay informed about
SBAC/DLM/WIDA
summative assessments
• Monitor/support
building
implementation of
interim and formative
assessments
• Stay informed about
SBAC/DLM/WIDA
summative
assessments
• Monitor/support
building
implementation of
interim /formative
assessments
• Support M-STEP/MI-
Access/WIDA
summative
assessments
administration

36
Amended July 28, 2015
ESEA FLEXIBI LITY – REQ UEST U . S . D EPARTMEN T OF ED UC ATION
Building
• Review building
assessment plan
• Begin using interim and
formative assessments
• Stay informed about
SBAC/DLM/WIDA
summative assessments
• Continue to administer
current summative
assessments
• Monitor/revise as
necessary
interim/formative
assessments
• Stay informed about
SBAC/DLM/WIDA
summative
assessments
• Continue to administer
current summative
assessments
• Monitor/revise as
necessary
interim/formative
assessments
• Administer the M-
STEP/MI-
Access/WIDA
summative
assessments
Accountability and Transparency
MDE Ensure that student achievement and progress are appropriately measured, reported, and used for continuous school improvement
ISD/RESA
• Plan for
implementation
monitoring
• Provide support for
developing effective
school improvement
plans
• Monitor/support CCR
implementation
activities
• Provide support for
developing effective
school improvement
plans
• Monitor/support CCR
implementation
activities
• Monitor/support
implementation of
school improvement
plans
• Monitor/support CCR
implementation
activities
• Monitor/support
implementation of
school improvement
plans
District
• Develop district
improvement plans,
including academic
goals based on CCSS
and gap analysis
• Implement district
improvement plans,
including academic goals
based on CCSS and gap
analysis
• Monitor/support
implementation of
school improvement
plans
• Evaluate/revise as
necessary district
improvement plans,
including academic
goals based on CCSS
and gap analysis
• Monitor/support
implementation of
school improvement
plans
• Evaluate/revise as
necessary district
improvement plans,
including academic
goals based on CCSS
and gap analysis
• Monitor/support
implementation of
school improvement
plans
Building
• Develop school
improvement plans,
including academic
goals based on CCSS
and gap analysis
• Implement school
improvement plans
• Evaluate/revise as
necessary school
improvement plans
• Evaluate/revise as
necessary school
improvement plans
P-20 Transitions
MDE Align early childhood programs and services and postsecondary education with standards for K12 content and instruction
ISD/RESA
• Support alignment of
early childhood
programs and services
and postsecondary
education with
standards for K12
content and
instruction
• Support implementation
of early childhood
programs and services
• Support district CCR
implementation/
Postsecondary
articulation
• Monitor/support
implementation of
early childhood
programs and services
• Monitor/support
district CCR
implementation/
Postsecondary
articulation
• Monitor/support
implementation of
early childhood
programs and services
• Monitor/support
district CCR
implementation/
Postsecondary
articulation
District
• Align early childhood
programs and services
and postsecondary
education with
standards for K12
content and
instruction
• Implement early
childhood programs and
services
• Implement CCR
programs and services
• Evaluate/revise as
necessary early
childhood programs
and services
• Evaluate/revise as
necessary CCR
programs and services
• Evaluate/revise as
necessary early
childhood programs
and services
• Evaluate/revise as
necessary CCR
programs and services
Building
• Align early childhood
programs and services
and postsecondary
education with
• Implement early
childhood programs and
services
• Evaluate/revise as
necessary early
childhood programs
and services
• Evaluate/revise as
necessary early
childhood programs
and services
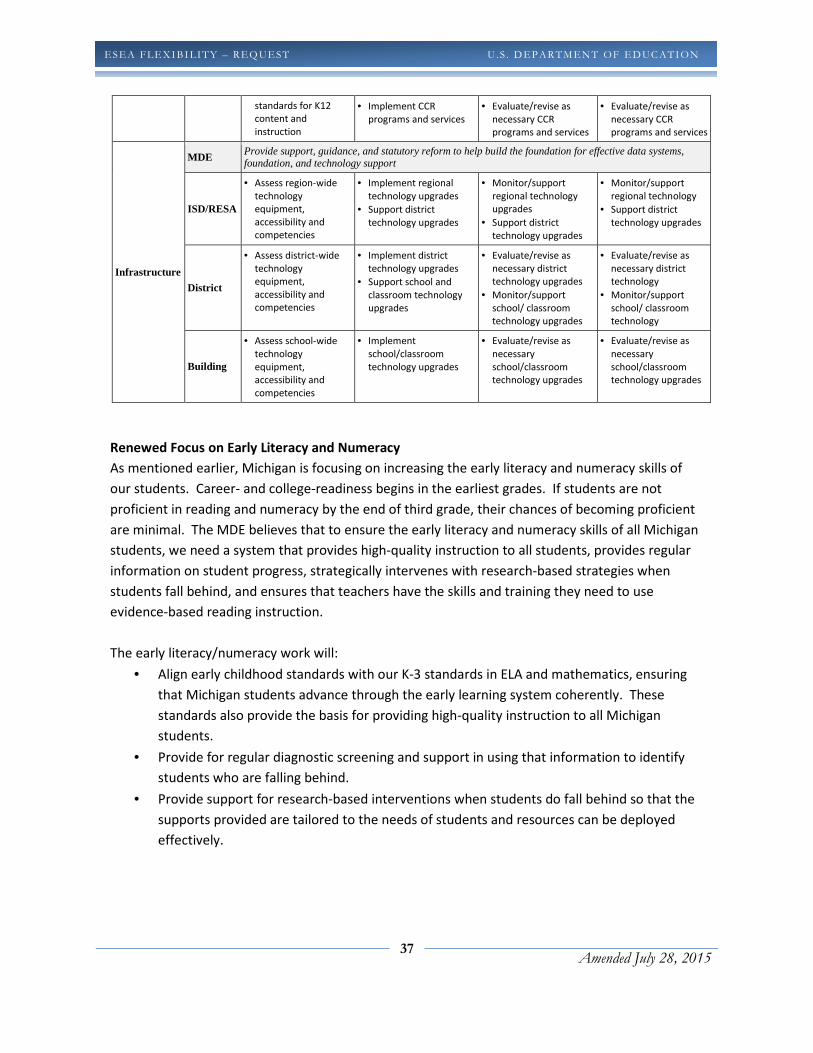
37
Amended July 28, 2015
ESEA FLEXIBI LITY – REQ UEST U . S . D EPARTMEN T OF ED UC ATION
Renewed Focus on Early Literacy and Numeracy
As mentioned earlier, Michigan is focusing on increasing the early literacy and numeracy skills of
our students. Career- and college-readiness begins in the earliest grades. If students are not
proficient in reading and numeracy by the end of third grade, their chances of becoming proficient
are minimal. The MDE believes that to ensure the early literacy and numeracy skills of all Michigan
students, we need a system that provides high-quality instruction to all students, provides regular
information on student progress, strategically intervenes with research-based strategies when
students fall behind, and ensures that teachers have the skills and training they need to use
evidence-based reading instruction.
The early literacy/numeracy work will:
• Align early childhood standards with our K-3 standards in ELA and mathematics, ensuring
that Michigan students advance through the early learning system coherently. These
standards also provide the basis for providing high-quality instruction to all Michigan
students.
• Provide for regular diagnostic screening and support in using that information to identify
students who are falling behind.
• Provide support for research-based interventions when students do fall behind so that the
supports provided are tailored to the needs of students and resources can be deployed
effectively.
standards for K12
content and
instruction
• Implement CCR
programs and services
• Evaluate/revise as
necessary CCR
programs and services
• Evaluate/revise as
necessary CCR
programs and services
Infrastructure
MDE Provide support, guidance, and statutory reform to help build the foundation for effective data systems, foundation, and technology support
ISD/RESA
• Assess region-wide
technology
equipment,
accessibility and
competencies
• Implement regional
technology upgrades
• Support district
technology upgrades
• Monitor/support
regional technology
upgrades
• Support district
technology upgrades
• Monitor/support
regional technology
• Support district
technology upgrades
District
• Assess district-wide
technology
equipment,
accessibility and
competencies
• Implement district
technology upgrades
• Support school and
classroom technology
upgrades
• Evaluate/revise as
necessary district
technology upgrades
• Monitor/support
school/ classroom
technology upgrades
• Evaluate/revise as
necessary district
technology
• Monitor/support
school/ classroom
technology
Building
• Assess school-wide
technology
equipment,
accessibility and
competencies
• Implement
school/classroom
technology upgrades
• Evaluate/revise as
necessary
school/classroom
technology upgrades
• Evaluate/revise as
necessary
school/classroom
technology upgrades

38
Amended July 28, 2015
ESEA FLEXIBI LITY – REQ UEST U . S . D EPARTMEN T OF ED UC ATION
• Help ensure that Michigan teachers have the skills and training they need to understand
the foundations of early literacy and numeracy as well as the training to utilize data
effectively.
This work is a core component of supporting the implementation of career- and college-ready
standards in Michigan, particularly in the early grades. To help us focus more on key drivers of
student achievement, we have integrated an early literacy focus throughout this application. This
also aligns us with Michigan-specific statewide metrics and state-based funding tied to early
literacy.
Rolling Out the Standards
The Common Core State Standards have been cross-walked with the Michigan Merit Curriculum
standards and expectations, and incorporated in to our current guidance documents (i.e. course
descriptions, grade-level descriptors). To reiterate, the CCSS themselves do not represent a
significant change in the content compared to the content expectations they replace. Instead, MDE
is taking this opportunity to message more strongly regarding good Tier I instruction for all
students. The first indication of this substantial change is within MDE. We hired four consultants
whose role is to work with Priority, Focus, low achieving schools and others in the areas of
instruction. The foci of their work will be on intervention, integration, and instructional design for
low socio-economic students, and literacy. Linking the instructional shifts necessary in the
classroom with the work of Michigan Association of Intermediate School Administrators (MAISA),
the organization representing our ISDs/RESAs, and the work of the Smarter Balance Consortium
around formative, interim and summative assessments, will lead to a complete series of models for
administrators and teachers to learn from as they implement the Career and College Ready
Standards.
One of the first projects initiated after the adoption of the CCSS was the initiation of the Career and
College Readiness Model Curriculum Unit project. These plans are designed to be used for
professional development to support the instructional shifts necessary for successful
implementation of the CCSS. The MDE Curriculum and Instruction consultants are actively involved
in the development and piloting of these units. At the same time, the MDE is working with national
and local experts, including staff from the ISDs/RESAs, to provide guidance and support around
Multi-tiered systems of Support (-MTSS). A statewide MTSS grant began during the 2013-2014
school year. ISDs/RESAs were eligible to apply for the grant, thus receiving funds and technical
assistance to support their efforts around MTSS. During the first grant year, 21 ISDs/RESAs applied
and received the grant award, which included intensive trainings and multiple PD opportunities. An
additional seven ISDs/RESAs were part of cohort 2, receiving the same guidance and support
throughout 2014-15.
39
Amended July 28, 2015
ESEA FLEXIBI LITY – REQ UEST U . S . D EPARTMEN T OF ED UC ATION
MDE supports the use of multi-tiered system of instruction, assessment, and intervention designed
to meet the achievement and behavioral health needs of all students. The eleven essential
components of Michigan’s MTSS framework are as follows:
• Implement effective instruction for all learners
• Intervene early
• Provide a multi-tiered model of instruction and intervention
• Use data to make instructional decisions
• Implementation of Evidence-Based Practices
• Use a problem-solving model
• Use assessments for three purposes: universal screening, diagnostics, and progress
monitoring
• Monitor student progress
• Assure a research-based core curriculum aligned to state standards
• Stakeholder engagement
• Implement with fidelity
MTSS is meant to streamline a school’s efforts in order to maximize resources and improve
achievement for all learners. MTSS is easily embedded into the Michigan Continuous School
Improvement Process and can strengthen any improvement strategies by increasing collaboration
and eliminating competing initiatives.
Similarly, the MDE Curriculum and Instruction consultants are working with School Improvement
experts at the regional level, and engaging in cross-office work within MDE, to develop model
academic goals that provide strategies for implementing the CCSS based on targeted areas of
instruction. This project is titled “Connecting the Dots” and is designed to help schools and their
instructional staff incorporate the CCSS and appropriate Tier 1 instruction2 into the planning work
they already are required to do through the School Improvement process. Finally, the MDE staff
meets with MAISA leadership regularly at their leadership meetings to discuss issues related to
promoting the state’s CCR agenda, including resources for professional development,
communications support, etc. The MDEs goals with the above initiatives are to promote
instructional systems that support all students. In order to support students struggling due to
disabilities or language barriers, MDE has worked with partners to develop resources for schools to
use in supporting Tier II and beyond instruction.
2 “Tier 1 instruction” is a term used in MTSS programs, where multi-tiered levels of instruction and intervention are used to reach learners. Tier 1 instruction refers to instruction that is focused on the core curriculum, with instruction and intervention targeted at all students. Tier 2 instruction commonly focuses on small groups of students, and Tier 3 is most intense and often one-on-one.

40
Amended July 28, 2015
ESEA FLEXIBI LITY – REQ UEST U . S . D EPARTMEN T OF ED UC ATION
Boosting STEM Instruction
MDE’s support for Science and Math instruction has been augmented by the work of our education
partners. Teachers who need support in these subject areas have ample tools and strategies at
their disposal.
MDE works closely with a newly formed statewide Michigan STEM Partnership, a network of
business, industry, and education professionals organized into regional hubs linking together STEM
stakeholders across the state. The Michigan STEM Partnership has increased networking to include
the Michigan Economic Development Corporation, the Governor’s Office, and members of the
Michigan Legislature. The broader group is focused on K-6 STEM professional development for
teachers. The ultimate goal is to reduce the gap between STEM job openings and appropriately
prepared Michigan citizens who can fill those jobs.
The Michigan Association for Computer Users in Learning (MACUL), and Michigan Virtual University
(MVU) are using Title IID funds for the STEM MI Champions Project, a statewide project designed to
provide Michigan’s middle school teachers with the instructional strategies and resources they
need to ensure that all students develop the 21st century skills necessary for career and college.
STEM MI Champions Project participants learn how to work across disciplines to build project-
based learning units that focus on science, technology, engineering and mathematics.
State dollars are also currently being used to fund the Science and Mathematics Misconceptions
Management (SAM3), a statewide project designed and delivered by the Math/Science Center
Network, (a system of 33 centers, which bring together STEM professionals from Michigan’s
institutions of higher education, talented faculty members, and other state and regional supports
to transmit effective practices). The project provides sustained, job-embedded professional
development for teams of teachers from high-priority and persistently low achieving schools to
support the implementation of math and science standards required of all students.
In addition, MDE has implemented a statewide Algebra for All project. This important initiative was
designed to support the state’s mathematics standards. The effort was started with Title IID funds
and, following significant expansion, was recently awarded Title IIB funds for another two years.
Support for Literacy Standards
The Regional Literacy Training Centers (RLTC) have worked to support the development of online
and other resources to support ELA achievement. Recently federal Striving Reader funds were used
to develop the Michigan Statewide Comprehensive Literacy Plan (MiLit Plan), which provides a
platform for educators to coordinate efforts with community members for the increased and
41
Amended July 28, 2015
ESEA FLEXIBI LITY – REQ UEST U . S . D EPARTMEN T OF ED UC ATION
sustained literacy achievement of all Michigan students. The MiLit Network was created as a
website that regional teams can use for collaboration.
To provide clear communication to ISDs regarding continued support for literacy standards, MDE is
taking note of research3 revealing that early mathematics is a predictor of later success in
mathematics as far as into high school as well as later success in reading. MDE’s early literacy and
mathematics initiative will recognize that to prepare all students for career and college readiness,
educators must attend to deep cognitive levels of learning for all students and must attend to real
world, engaging practices in the classroom.
Monitoring for Implementation and Disseminating Postsecondary Access and Persistence Data
MDE will engage in an active monitoring effort for implementation of the Career and College Ready
(CCR) Standards by all local education agencies and public school academies in Michigan. This
monitoring serves both to provide evidence to ensure that Michigan’s schools are providing
students with the necessary skills, information, and competencies to be career and college ready
upon graduation, and to gather information on the implementation of the various supports and
instructional programming by districts to meet student needs in these areas. For the latter, MDE
will engage in regular programmatic review efforts to ensure that supports are meeting the needs
of educators and learners throughout the education system, and, where appropriate, to modify,
adapt, or supplement the program of supports described in this section based upon information
gathered during monitoring efforts.
MDE will monitor and review evidence of local implementation of career and college readiness
standards through the following mechanisms:
• Use of the ASSIST Platform (through submission of School and District Improvement Plans).
As a part of their school data analysis, LEAs are required to address their readiness,
knowledge and skills, and opportunities for implementing the career and college ready
standards in mathematics and English language arts (ELA) using a rubric based on the Title I
Program Evaluation tool. The Program Evaluation Tool is a four-point rubric that is being
used with all Title I schools for the 2013-14 school year, and beyond that, is intended to
focus on implementation considerations and outcomes of federally funded programs in
LEAs. This tool is built into the School Improvement Planning tool for Michigan schools,
3 Education Commission of the States. (2013). Math in the Early Years. Progress of Education Reform, 14(5).
Retrieved from: http://www.du.edu/kennedyinstitute/media/documents/math-in-the-early-years.pdf
42
Amended July 28, 2015
ESEA FLEXIBI LITY – REQ UEST U . S . D EPARTMEN T OF ED UC ATION
named ASSIST. Schools will document CCR efforts through both an assurance of
completion of efforts identified in the prior-year School and District Improvement Plans,
and the documentation provided for the program evaluation rubric in ASSIST. This tool is
housed by AdvancEd through a partnership with the Michigan Department of Education.
• Use of the Michigan Technology Readiness Tool (MTRAx). As a part of their technology
readiness planning, LEAs will be required to address their technology readiness efforts that
support career and college ready standards in mathematics and English language arts
(Common Core State Standards). This addresses access to technologies to support both
instruction and assessment of CCR through local and statewide assessment tools.
• MAISA Common Core Professional Development Survey. The Michigan Association of
Intermediate School Administrators (MAISA) administers an annual survey of all
Intermediate School District (ISDs) and district and school administrators and teachers
regarding professional learning needs for implementing Career and College Ready
Standards. The focus of this survey will center on implementation of the Common Core
State Standards and other content standards.
• Title I Onsite Monitoring. All Title I receiving schools in Michigan participate in an onsite
review of federally funded programs once every five years. During this process, consultants
from the Office of Field Services at MDE will ask for evidence from implementation of
supplemental programs to support CCR standards for all students.
• Priority and Focus School monitoring. Monitors from the School Reform Office, as well as
partners from ISDs and the MI-Excel statewide system of support, review the
implementation of reform plans for priority schools. This includes monitoring instructional
programming and curriculum alignment, professional development for educators, and
data-based differentiated instruction around the CCR standards for all students in Priority
schools, which are used to monitor progress in plan implementation. Similarly, ISD and
other partners in the MI-Excel program support Focus schools at the district level by
engaging in a data-dialogue around the instructional needs to close achievement gaps
within the schools. Documentation of these efforts will be a part of the specialized
monitoring efforts for these schools around CCR standards for all students. Additionally for
these schools, ISDs receive Regional Assistance Grants to provide regional training and
support for efforts of Priority and Focus schools in their service area. These ISDs will
incorporate regular documentation of instructional efforts at these schools to provide to
the department as evidence of support for implementation of the CCR standards.
• The Survey of Enacted Curriculum (SEC) is a diagnostic tool that are used by educators to
document and reflect on content taught and instructional strategies used to support CCR
43
Amended July 28, 2015
ESEA FLEXIBI LITY – REQ UEST U . S . D EPARTMEN T OF ED UC ATION
standards in core subject areas. The SEC is completed on an annual basis by core content
teachers in Priority and Focus schools, and is also required of schools participating in
selected grant programs focusing on professional learning supports for content standards,
such as the Math and Science Partnership grants. The SEC is also used by several districts
for school improvement and instructional alignment efforts. The SEC provides a variety of
data tools, including tables and heat maps of individual standards, and shows where
teacher energies are placed for instruction based upon standards or assessments. This tool
can be reviewed online at the state or ISD level for individual subject areas based upon
building, district, ISD or project, and provides evidence of implementation of CCR
standards, as well as tools to support greater implementation through instruction or
alignment of instructional topics.
• Program cohort participation documentation. A number of specialized programs
addressing instructional practices and content for specific goals and/or audiences are
provided through state and federal programs administered by MDE to support CCR
standards. These include support for 42 ISD and LEA teams around the implementation of
Multi-Tiered Systems of Support (MTSS) at the building and classroom level; ISD and LEA
teams participating in the Formative Assessment for Michigan Educators (FAME) project,
which takes place at 9 regional ISDs and focuses on instructional practices and use of data
in a formative assessment model to implement CCR standards; and Sheltered Instructional
Observation Protocol (SIOP) training, which focuses on CCSS implementation specifically in
classrooms with English learners. Each of these programs engages in regular collection and
review of data relevant to their programming efforts as a part of a program evaluation
effort. This data will be utilized in the generation of relevant evidence of implementation
of CCR standards in participating schools.
• Carl D. Perkins CTE monitoring. Each year, recipients of Perkins funds are asked to review
the sutdnet achievement data for mathematics and ELA. Where gaps exist for any student
population, districts must write and improvement plan.
• Collection and reporting of new postsecondary access and persistence data points that will
be shared with stakeholders throughout the state, including:
• The number and percentage of students that apply to any postsecondary
institution (including career and technical institutions).
• Remediation rates in mathematics, reading and writing for community college
students in the classes of 2011 forward

44
Amended July 28, 2015
ESEA FLEXIBI LITY – REQ UEST U . S . D EPARTMEN T OF ED UC ATION
• Success rates for each discipline, meaning that a student went on to earn college
credit in the area in which he or she was remediated
• The number and percentage of students that begin at any postsecondary
institution (including career and technical institutions)
• The number and percentage of students that persist through degree or certificate
at any postsecondary institution (including career and technical institutions)
These data will be pulled from existing collections done by the Center for Education Performance
and Information (CEPI). MDE will conduct the data analysis and work with regional service agencies
(ISDs and RESAs) and local College Access Networks to share the information with LEAs to help
guide local decision-making.
The evidence of implementation of CCR standards through these mechanisms will be reviewed at
least once per year at the department level to identify potential areas of need and support for
implementation of CCR standards statewide. The intent of this analysis is to focus resources and
expertise from both MDE and ISD partners on those LEAs in need of support for effective
implementation of CCR standards. The Curriculum and Instruction unit at MDE will create a
database to incorporate the various evidence and reports from the aforementioned documentation
efforts on an annual basis. This data will be reviewed by a cross-office group at MDE, as well as by
select stakeholder groups, to identify schools, LEAs, ISDs, or regions where implementation of CCR
standards, or some specific subset of the standards, is lacking. Similarly, content areas within the
standards will be analyzed on a standard and strand level to see if specific topics or concepts need
supports or resources developed to support effective implementation for students. MDE will
partner with ISD leadership through our monthly ISD advisory meetings and other structures to
develop a strategic plan to actively support the schools, LEAs and ISD regions around the
problematic topics or content strands. The efforts identified will either be inserted and aligned into
the support efforts for schools (which follow within this section), or supplemental supports by
educators.
Workgroup Progress and Aims
Effective Instruction and Intervention
Keeping in mind that curricular and instructional decisions are in the realm of the districts, and
consistent with our Theory of Action, MDE plans to support districts in their use of the required
school improvement process to analyze multiple sources of data, identify gaps and then develop a
plan to close those gaps.
In furtherance of this work, we have adopted an initiative entitled “Connecting the Dots – Preparing
All Students to be Career- and College-Ready”, the first component of which provides for the
development of model academic goals that schools can use as they develop their annual school
improvement plans. The idea is to leverage schools’ required improvement activities by providing

45
Amended July 28, 2015
ESEA FLEXIBI LITY – REQ UEST U . S . D EPARTMEN T OF ED UC ATION
examples of focused, coherent instructional strategies that successfully implement the Common
Core for all students. In doing so, the work of MDE is coalesced and focused on promoting systems
that are connected and coherent in supporting all students to be career- and college-ready.
It is important to note that MDE believes strongly that districts need to have a system of tiered
support. The model academic goals operate at the Tier 1 level in that they make visible the types of
instructional strategies that need to occur to support the majority of students in the classroom.
MDE has recently developed guidance to districts for implementing a multi-tiered system of
support (MTSS, or, commonly referred to as Response to Intervention systems or RtI). This
guidance includes information on the essential elements of an effective tiered support system and
an annotated list of resources to support implementation. Consultants from the offices of
Educational Improvement and Innovation, Special Education, and Field Services were active
participants in creating this guidance. Furthermore, the State Board of Education recently approved
the revised Professional Learning Policy and the Standards for Professional Learning. These
documents will support the first component of the “Connecting the Dots” work described above.
The following graphic shows the connections among a multi- tiered system of support, the School
Improvement Plan, and MDE initiatives that support district and school implementation of
curriculum, instruction and assessment.
Table 5. Connecting the Dots—Preparing All Students to Be Career and College Ready
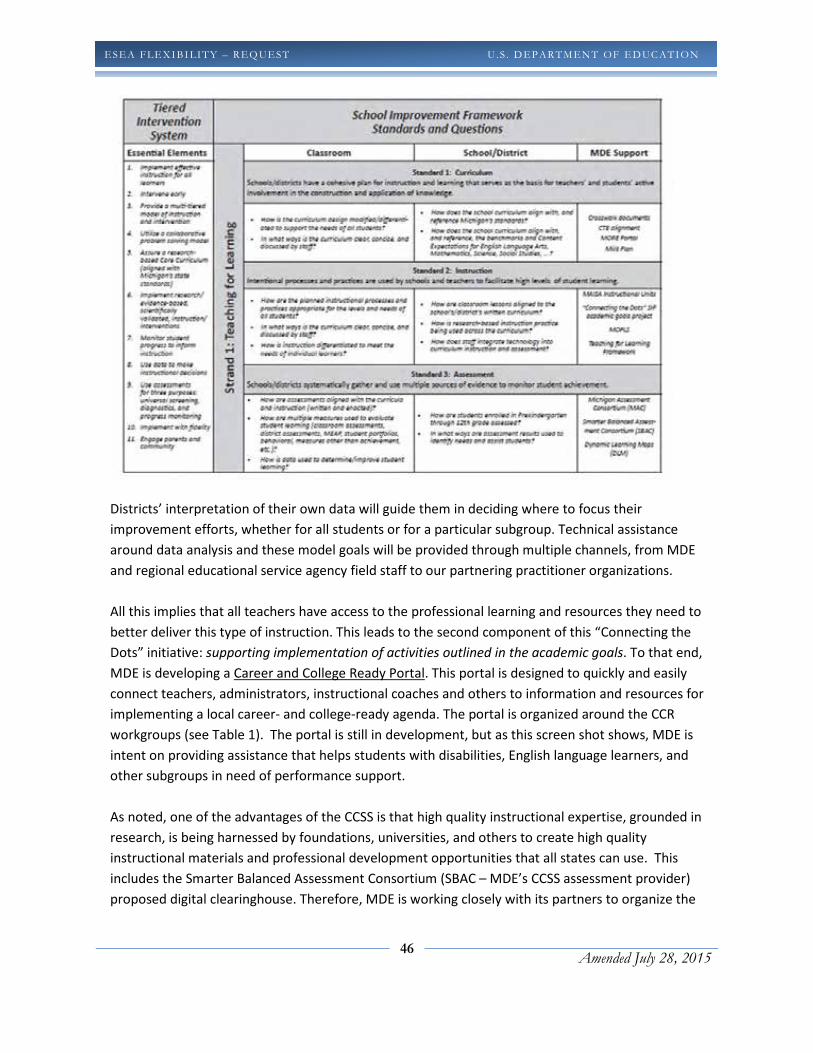
46
Amended July 28, 2015
ESEA FLEXIBI LITY – REQ UEST U . S . D EPARTMEN T OF ED UC ATION
Districts’ interpretation of their own data will guide them in deciding where to focus their
improvement efforts, whether for all students or for a particular subgroup. Technical assistance
around data analysis and these model goals will be provided through multiple channels, from MDE
and regional educational service agency field staff to our partnering practitioner organizations.
All this implies that all teachers have access to the professional learning and resources they need to
better deliver this type of instruction. This leads to the second component of this “Connecting the
Dots” initiative: supporting implementation of activities outlined in the academic goals. To that end,
MDE is developing a Career and College Ready Portal. This portal is designed to quickly and easily
connect teachers, administrators, instructional coaches and others to information and resources for
implementing a local career- and college-ready agenda. The portal is organized around the CCR
workgroups (see Table 1). The portal is still in development, but as this screen shot shows, MDE is
intent on providing assistance that helps students with disabilities, English language learners, and
other subgroups in need of performance support.
As noted, one of the advantages of the CCSS is that high quality instructional expertise, grounded in
research, is being harnessed by foundations, universities, and others to create high quality
instructional materials and professional development opportunities that all states can use. This
includes the Smarter Balanced Assessment Consortium (SBAC – MDE’s CCSS assessment provider)
proposed digital clearinghouse. Therefore, MDE is working closely with its partners to organize the
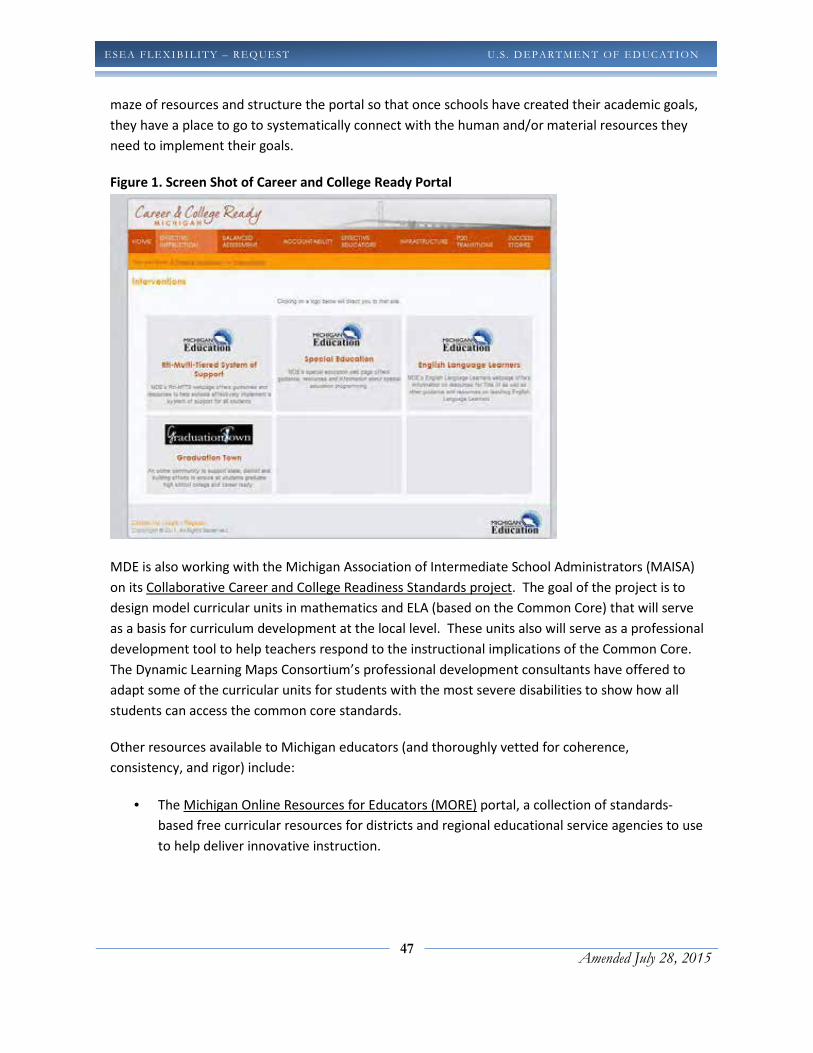
47
Amended July 28, 2015
ESEA FLEXIBI LITY – REQ UEST U . S . D EPARTMEN T OF ED UC ATION
maze of resources and structure the portal so that once schools have created their academic goals,
they have a place to go to systematically connect with the human and/or material resources they
need to implement their goals.
Figure 1. Screen Shot of Career and College Ready Portal
MDE is also working with the Michigan Association of Intermediate School Administrators (MAISA)
on its Collaborative Career and College Readiness Standards project. The goal of the project is to
design model curricular units in mathematics and ELA (based on the Common Core) that will serve
as a basis for curriculum development at the local level. These units also will serve as a professional
development tool to help teachers respond to the instructional implications of the Common Core.
The Dynamic Learning Maps Consortium’s professional development consultants have offered to
adapt some of the curricular units for students with the most severe disabilities to show how all
students can access the common core standards.
Other resources available to Michigan educators (and thoroughly vetted for coherence,
consistency, and rigor) include:
• The Michigan Online Resources for Educators (MORE) portal, a collection of standards-
based free curricular resources for districts and regional educational service agencies to use
to help deliver innovative instruction.

48
Amended July 28, 2015
ESEA FLEXIBI LITY – REQ UEST U . S . D EPARTMEN T OF ED UC ATION
Through a number of other initiatives, the state will continue to guide school districts in the
analysis of student data in order to provide appropriate levels of student assistance and ensure
timely acquisition in meeting the standards. Michigan’s Integrated Behavior and Learning Support
Initiative (MiBLSi), for example, coaches school district personnel on the collection and analysis of
academic and behavioral data, and the implementation of a school-wide tired intervention system.
Additionally, an MDE multi-office team has provided materials and trainings on tiered intervention
to districts not involved in MiBLSi. The core elements of a tiered intervention system have been
integrated into the school improvement process to ensure that any student who is not progressing
toward the standards will receive additional assistance.
Another mandated activities project from the Office of Special Education, Reaching and Teaching
Struggling Learners, strives to ensure positive outcomes for all learners by exploring effective
secondary school practices and their impact on all students. The initiative is designed to reduce the
risk of dropout. Teams support students during their high school experience and foster a culture of
high expectations for all students in the school. The teams share data, observations, and ideas with
each other and their staff as each team works to create positive outcomes for students by
addressing school improvement practices.
The Michigan Transition Outcomes Project (MI-TOP) project facilitates the development of effective
systems that help students with disabilities as they work to achieve postsecondary outcomes. The
project supports effective transition practices to ensure all students with disabilities are prepared
for postsecondary education, employment, and independent living. MI-TOP provides mandatory
professional development to transition coordinators around the state on an ongoing basis.
Title IIA—Improving Teacher Quality funds also provide professional development for special
education/ELL teachers with priority given to English language arts and mathematics projects that
are focused on the Common Core.
While the Connecting the Dots project and others as described above are designed to help priority
and focus schools focus in on instructional strategies that will close the achievement gap, it should
be noted that in recent years, MDE has sought to pioneer new approaches to accelerated and
innovative learning. Not only has MDE initiated the concept of credit that is based on proficiency
with the Michigan Merit Curriculum, but it also has implemented seat time waivers, which allow
schools to provide instruction at any time and at any location, with individual attention to students
working at their own pace. These opportunities are provided through online education programs
and/or work experience that integrates the content standards.
Michigan has developed a series of reports to help districts analyze the quality of their CTE student
performance data and to improve their ability to use their data for program improvement and for

49
Amended July 28, 2015
ESEA FLEXIBI LITY – REQ UEST U . S . D EPARTMEN T OF ED UC ATION
data-based decision making. Many reports allow the districts to drill down to student level data
and can be accessed by secure login.
MDE has also implemented the early/middle college concept with great success. The number of
early/middle colleges and students enrolled in early/middle colleges has dramatically increased
over the past three years. The state is considering strategies for boosting the number of
early/middle college programs working in the state. Currently, early/middle colleges must undergo
a fairly rigorous review process before enrolling pupils and commencing operation. This process is
based solely on past practice rather than any statutory foundation; state leaders are considering
ways to reduce or eliminate the burden of this process in a way that incentivizes growth in the
number of Michigan’s early/middle colleges.
Five colleges in Michigan have voluntarily developed statewide articulation agreements for high
school CTE students. Postsecondary content taught at the high school level is held in escrow until
the student arrives at the college. At that time, courses or credits are waived saving time and
money for the students.
Nearly 13,500 — or more than 7 percent of eligible Michigan students —are participating in dual
enrollment opportunities, a number that we estimate to increase as the state legislature works to
loosen student eligibility requirements. Recent statutory amendments eliminate grade level and
test score requirements that serve as barriers to dual enrollment for many students, and allow non-
public and home-schooled students to take part in these types of opportunities.
Michigan also has nearly 64,500 students participating in advanced and accelerated learning
opportunities, including more than 770 International Baccalaureate program students.
Balanced Assessment
Districts are expected to have the Common Core fully implemented by the fall of 2012. This
timeline ensures schools can adjust their curricula based on student data from interim assessments
and from pilot items for the new assessments. More importantly however, this implementation
timeline gives students nearly 2 full years of instruction based on the Common Core before they
encounter the new assessment.
As shown above, MDE’s corollary professional development and school improvement activities are
on track to meet those deadlines and support student achievement. The next major order of
business in our state will then be the adoption of the SMARTER Balanced Assessment Consortium
summative assessments, which are scheduled to replace the state’s current reading and
mathematics state tests in the spring of 2015. Through these assessments, MDE will ensure robust
measurement of Common Core implementation statewide. As the new assessment is being
developed, MDE is modifying current state summative assessments (Michigan Educational
50
Amended July 28, 2015
ESEA FLEXIBI LITY – REQ UEST U . S . D EPARTMEN T OF ED UC ATION
Assessment Program and Michigan Merit Examination) to support the transition to the Common
Core.
� Prior to implementation of the new assessments, MDE will work through its partners to
build awareness and understanding of the demands of the new assessments. Teachers and
administrators will have an opportunity to experience the new assessment items, discuss
what changes may be needed in their instruction and redesign their lesson plans utilizing
the model lessons created through the MAISA work. Likewise, working with our partners,
MDE will support work with building and district leaders about the initiatives necessary to
support good classroom instruction. MDE will update and conduct further professional
learning as necessary to support schools in meeting these expectations. In addition to the
supports provided by the SBAC, the Michigan Assessment Consortium (MAC) will continue
to provide training in the development and use of formative assessment. The MAC consists
of individuals and organizations that work together to promote the use of balanced
assessment systems in Michigan schools, so that students learn, grow and flourish. MAC is
the only statewide organization helping educators, and their organizations improve student
learning and achievement through aligning systems of coherent curriculum, balanced
assessment and effective instruction.
Through the implementation of the Common Core and the adoption of challenging assessment
measures, Michigan is able to deliver — with rigor— on its promise of excellence and equity for its
learners. Consistent with our commitment to learning for all students, we are cognizant there are
special populations that require additional achievement support: English language learners,
students with disabilities, and other traditionally underserved subgroup populations. How we’ll
deliver on our commitment to these students in particular is a significant part of our story.
Support for Economically Disadvantaged Students (ED)
One of the fastest growing sub groups in Michigan is economically disadvantaged students. The
percentage of children living in poverty rose from 18.3% in 2006 to 24.7% in 2013.4 And Michigan’s
own assessment data shows that 757,756 (48.45%) of all students were economically
disadvantaged in school year 2013-14.
The 5 year trend of reading and math scores for students at grades, 3, 5, 8 and 11, beginning with
2009-10 data, shows that the gap between the students from economically disadvantaged (ED) and
non-economically disadvantaged settings persists ranging from a 23 to 30 percentage point
difference in both reading and math.5 These are serious gaps needing specific attention by
Michigan educators.
4 Zehnder-Merrell, Jane. Kids Count in Michigan Data Book 2015: Child Well-Being in Michigan, its counties and Detroit. Lansing, Michigan: Michigan League for Public Policy. 5 Based on MiSchool Data
51
Amended July 28, 2015
ESEA FLEXIBI LITY – REQ UEST U . S . D EPARTMEN T OF ED UC ATION
Generally the size of the ED student group and the achievement gap associated with this group
suggests that Michigan must significantly improve tier one instruction in the multitier system of
support. We propose to aggressively focus on improving tier one instruction for ED students and
promote the use of the multi-tiered system of supports targeted interventions at tier 2 and
intensive supports at tier three where needed. While the economically disadvantaged subgroup
overlaps with all of the other subgroups, some supports have been specifically proposed in other
areas of the document under the headings for Students with Disabilities, English Learners, and
African Americans and these will benefit the students who are also economically disadvantaged.
All Michigan schools are required to conduct a needs assessment to identify the subgroups that
may need specific supports and interventions. This needs assessment will identify the schools which
need to focus on ED students. Michigan will provide guidance on strategies designed to specifically
address these needs. In an effort to provide guidance for schools, Michigan will provide the
following additional strategies to address the needs of the ED students.
Strategies to help districts close this gap
Professional Development Title IIA
Michigan will identify successful professional development opportunities to address instructional
practices for ED students in:
• Content areas using the multi-tiered system of supports starting with literacy in the early
grades and expanding to other subjects and grade spans.
• Culture/Climate issues impacting student achievement and whole school reforms.
“Effective/Best Practices” Identification -
Michigan will identify and disseminate “Effective, Promising and Best Practices” with a focus on
those strategies that are most effective with schools having significant populations of ED students.
Many have been identified and posted in multiple locations including:
• What Works Clearinghouse
• McREL International
• American Institute for Research
• Center on Innovation and Improvement and
• Practices that are identified in Michigan reward schools and thru analysis of Michigan’s
Program Evaluation Tool.
Increased Schoolwide Flexibility – use of funds—(Title I Schoolwide / State Section 31a)
Michigan will provide expanded opportunities for the implementation of innovative, proven, and
effective teaching and learning strategies as whole school reforms in Schoolwide Title I schools.
These schools will employ maximized flexibility of use of funds to impact ED student achievement
at risk of not attaining high academic standards. This will help students impacted by multiple
factors including poverty. The expanded opportunities for the use of these supplemental funds
should help schools address specific needs of students from economically disadvantaged settings.
Michigan has a plan for piloting maximum Schoolwide flexibility in 2015-16 and scaling it up over
the next three years.
52
Amended July 28, 2015
ESEA FLEXIBI LITY – REQ UEST U . S . D EPARTMEN T OF ED UC ATION
Parent Engagement
MDE will update its’ Parent Engagement Toolkit housed on the MDE website during 2015-16
ensuring that strategies and supports for engaging parents of ED students from are included. MDE
will also disseminate the toolkit via “best practices” conferences sponsored by the MDE partners as
well as during school and district technical assistance.
These strategies addressing ED students will be refined further as part of our State Systemic
Improvement Plan (SSIP) which will be defined during 2015-16 and implemented over the next 5
years.
Support for Students with Disabilities (SWD)
MDE offers assessment alternatives for students with disabilities. MI-Access is Michigan's alternate
assessment system, designed for students with severe cognitive impairments whose IEP
(Individualized Educational Program) Team has determined that MEAP or MEAP-Access assessment,
even with accommodations, would not be appropriate. MI-Access satisfies federal law requiring
that all students with disabilities be assessed at the state level. Looking ahead to assessments
based on the CCSS, MDE has joined the Dynamic Learning Maps Consortium which is developing an
assessment based on the Common Core Essential Elements (CCEEs). The CCEEs were created by
the member states in the DLM Consortium. Special education teachers are currently transitioning
from MDE’s extended grade level expectations to the CCEEs.
It should be noted here that MDE offers an additional alternate assessment based on modified
achievement standards. MEAP-Access is administered in the fall of each year and is intended to
bridge the gap between the MI-Access assessments and the Michigan Educational Assessment
Program for students with disabilities. MEAP-Access assesses students on grade level content
expectations in the core content areas of reading and mathematics for students in grades 3 - 8, and
writing at grades 4 and 7. Accommodations such as scribes, tape recorders and Braillewriters are
available.
Cut scores for MEAP-Access were set and were utilized in the fall 2011 testing, and will continue to
be utilized in fall 2012 and fall 2013. When MDE adopts the Smarter Balanced Assessment
Consortium assessments, all MEAP-Access students will be transitioned to those
assessments. Professional learning and technical assistance will be provided to teachers in order to
help them prepare their students for this transition, and this training will also be included in
teacher preparation institutions.
Currently students with disabilities in Michigan have multiple choices of assessments to
demonstrate what that know and can do. It is expected that the majority of students with
disabilities will be assessed on the general assessment and that only a small percentage of SWDs be

53
Amended July 28, 2015
ESEA FLEXIBI LITY – REQ UEST U . S . D EPARTMEN T OF ED UC ATION
assessed on an alternate assessment. Therefore, teachers of SWDs should be included in all
professional development of CCSSs and CCEEs in order to ensure that all students are progressing
on their individual goals and meet the state proficiency standards. In the past, special educators
were not invited to the robust curriculum professional development opportunities. With the new
teacher effectiveness requirements and clear expectations, special educators need to be active
participants in curricular PD activities. MDE will be supporting teachers to not only understand the
standards but be able to teach to the standards through PD activities provided through the ISDs,
professional development modules offered through Dynamic Learning Maps (DLM), and the
Michigan Online Professional Learning System (MOPLS). MOPLS is described in more detail below.
For all assessments, individual education program teams must determine and document which
assessments are appropriate for students with disabilities. IEP teams are encouraged to use the
“Decision Making Worksheet for Statewide Assessments” to ensure students with disabilities are
participating in the most appropriate statewide assessment. The Michigan Statewide Assessment
Selection Guidelines and accompanying online professional learning module direct IEP Teams to
consider the MEAP/MME first with accommodations as needed. The guidelines support data-based
decision making when determining appropriate assessments for students with disabilities.
MDE will provide specific support to students with disabilities in Priority schools. Each school will be
required to incorporate specific programming decisions for supporting these students through
components of the reform/redesign plan related to differentiated instruction. As a part of the
initial data review and analysis for the creation of the reform/redesign plan, schools will use
Michigan’s RtI-MTSS model to review and further develop a school wide tiered intervention
system. In addition, the MDE will work to integrate project resources if appropriate and available
such as MDE the Reaching and Teaching Struggling Learners program for dropout prevention, and
the Michigan Transition Outcomes Project (MiTOP) program for developing systems to support
postsecondary outcomes into the online professional learning tools for Priority school educators.
Other pedagogical practices focusing on Differentiated Instruction, Universal Design for Learning,
and Co-Teaching will be incorporated into the online learning supports for Priority school
educators.
Development of Michigan’s state-level Technical Assistance System, led by the MDE’s Office of
Special Education, will provide additional supports for all students via a responsive tiered model of
technical assistance to support districts in their capacity to improve student outcomes.
Support for English Language Learners (ELL)
54
Amended July 28, 2015
ESEA FLEXIBI LITY – REQ UEST U . S . D EPARTMEN T OF ED UC ATION
Michigan’s existing system of standards, assessments, accountability and supports for English
language learners is robust, defined in MDE’s current accountability workbook and meets the
federal guidelines. Standards are aligned and MDE has an assessment for ELLs, as described below.
World-Class Instructional Design and Assessment (WIDA) is the annual assessment given to
Michigan’s students who are English language learners. ELPA measures, on an annual basis, the
progress Michigan’s ELLs are making in the acquisition of their English language skills. WIDA reports
on student progress are provided to districts, regional educational service agencies, the state, and
the federal government.
ELLs will take the general assessments, either MEAP or MME, with ELL accommodations that are
recommended and routinely used for their instruction in the content area(s) assessed. ELL students
who have an IEP will take the assessment specified in their IEP, either MEAP/MME, MEAP-Access,
or MI-Access, with the accommodations also specified in the IEP for the assessment.
We use the WIDA to establish annual measurable achievement objectives for progress and
proficiency in English and content achievement. Based on WIDA, Annual Measurable Achievement
Objectives and local data, LEAs adjust school and district improvement plans to better serve ELLs.
Michigan has developed a strong array of services, including intensive professional development,
and is working with various partners to implement improved services across the state for ELLs.
While these supports are effective in helping ELLs as they achieve the state’s existing graduation
requirements, it was generally felt that these materials were in need of refinement. The adoption
of the Common Core, coupled with the ESEA flexibility request opportunity, provides the state with
a timely point of departure to engage in this important work.
MDE’s Title III/EL program office is pursuing membership in the World Class Instructional Design
and Assessment (WIDA) consortium. WIDA has already established research-based ELP standards
and assessments, many professional development tools, and a technical assistance plan. The WIDA
ELP assessments have already been aligned to the Common Core standards and include
assessments for ELL students with disabilities. WIDA has over 27 member states and has received
the federal Enhanced Assessment Grant whose purpose is to develop online ELP assessments for
English learners and improve overall measurement of the Common Core. Michigan has involved its
ELL Advisory Committee (comprised of parents, teachers, and other key stakeholders) in gathering
the necessary information about their ELP standards and considered possible professional
development plans that pertain to the adoption of WIDA standards. Michigan leadership is pursuing
the adoption of WIDA standards and is awaiting required approvals from the state’s Department of
Technology, Management and Budget (DTMB). We are anticipating that MDE’s Title II/EL program
office will carry out a thorough staff development plan during the 2012/2013 school year. The plan
will support current professional development activities and incorporate training on the ELP

55
Amended July 28, 2015
ESEA FLEXIBI LITY – REQ UEST U . S . D EPARTMEN T OF ED UC ATION
standards and the CCSSs simultaneously. Since WIDA has already completed the alignment study
between the ELP standards and the CCSSs, the staff development sessions will also better prepare
teachers of ELLs in incorporating effective strategies so that students can successfully navigate
through complex text, acquire academic vocabulary and meet these rigorous standards.
With assistance from Great Lakes East, MDE launched the Sheltered Instruction Observation
Protocol (SIOP) Model Capacity-Building Professional Development Initiative in 2009, to address the
needs of English learners in the state. The purpose of the initiative is to develop the capacity of the
department to provide sheltered instruction training of trainers across the state that will improve
the achievement of English learners, particularly in content area classes. Each MDE trainer provides
a four-day regional workshop in the summer to about 40-60 educators and provides ongoing job-
embedded professional development with model lessons, debriefing and collegial visits. Such
workshops focus on: a) making content comprehensible through language and content objectives;
b) teaching both ELP and CCSSs in alignment; c) teaching oral language, comprehension and writing
strategies across the curriculum; d) use of balanced assessment to guide and lead instruction.
To support the growing number of English Language Learners in Priority schools, each such school
will need to address specific programming decisions for supporting the needs of these students
within the instructional program component of their reform/redesign plans. The School Reform
Office will collaborate with MDE staff to provide SIOP program access for schools with sizable
populations of English Language Learners. In addition, model programs from school districts
throughout Michigan will be encouraged to share practices that address the needs of specific
populations of English Language Learners.
For Title I schools experiencing difficulty with English Language Learners and not identified as a
Priority or Focus school, the Department will coordinate efforts with the Title III program requiring
that the school’s improvement plan focus on the identified needs of the English Language Learners
in the school. The school initiatives will be coordinated with the existing evidenced-based supports
identified above as well as access to the subject matter experts utilized to support Priority and
Focus Schools.
Federal IDEA funds are being used to complete the Michigan Online Professional Learning System
(MOPLS) — an online, interactive, user-driven program available to all Michigan educators who
want high-quality professional learning options. MOPLS supports teachers as they deliver content
and instruction aligned to the Common Core State Standards, and offers ways to engage students
who struggle with key concepts in ELA and mathematics. A resource section is offered in both
content areas so that educators can extend their understanding of key concepts and
methodologies. These resources have been carefully reviewed and selected so that they align to
the Common Core. The instructional examples provided through MOPLS were created to provide
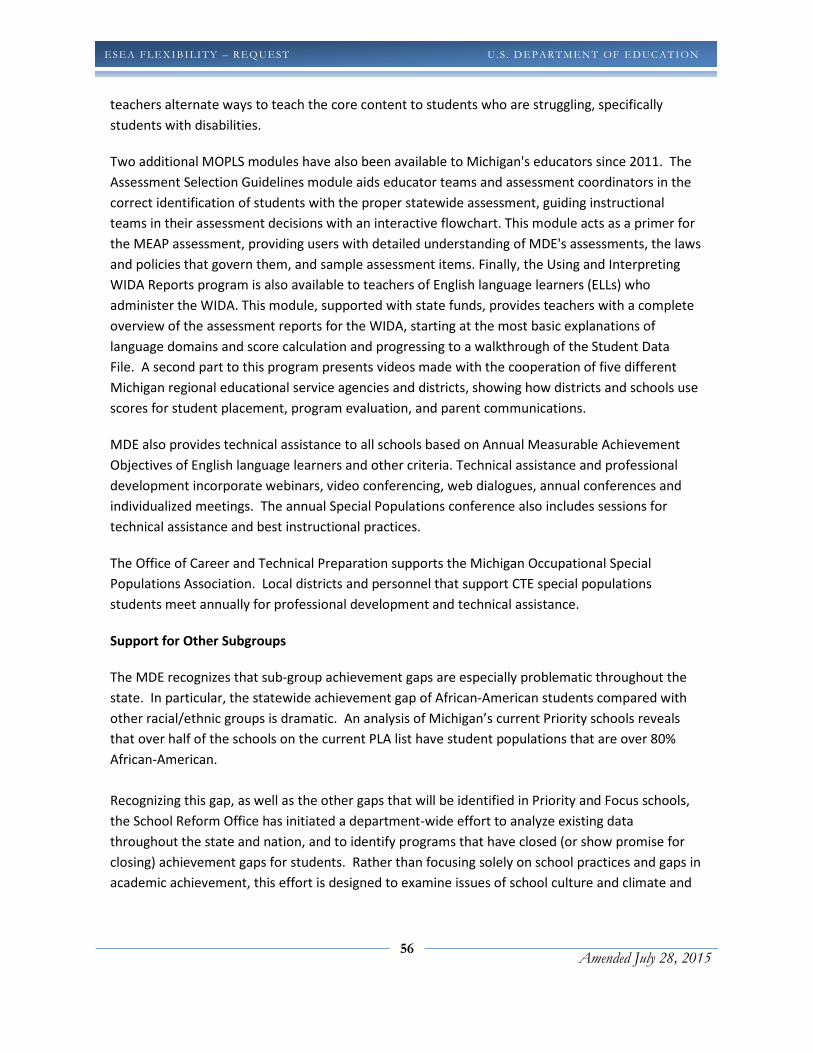
56
Amended July 28, 2015
ESEA FLEXIBI LITY – REQ UEST U . S . D EPARTMEN T OF ED UC ATION
teachers alternate ways to teach the core content to students who are struggling, specifically
students with disabilities.
Two additional MOPLS modules have also been available to Michigan's educators since 2011. The
Assessment Selection Guidelines module aids educator teams and assessment coordinators in the
correct identification of students with the proper statewide assessment, guiding instructional
teams in their assessment decisions with an interactive flowchart. This module acts as a primer for
the MEAP assessment, providing users with detailed understanding of MDE's assessments, the laws
and policies that govern them, and sample assessment items. Finally, the Using and Interpreting
WIDA Reports program is also available to teachers of English language learners (ELLs) who
administer the WIDA. This module, supported with state funds, provides teachers with a complete
overview of the assessment reports for the WIDA, starting at the most basic explanations of
language domains and score calculation and progressing to a walkthrough of the Student Data
File. A second part to this program presents videos made with the cooperation of five different
Michigan regional educational service agencies and districts, showing how districts and schools use
scores for student placement, program evaluation, and parent communications.
MDE also provides technical assistance to all schools based on Annual Measurable Achievement
Objectives of English language learners and other criteria. Technical assistance and professional
development incorporate webinars, video conferencing, web dialogues, annual conferences and
individualized meetings. The annual Special Populations conference also includes sessions for
technical assistance and best instructional practices.
The Office of Career and Technical Preparation supports the Michigan Occupational Special
Populations Association. Local districts and personnel that support CTE special populations
students meet annually for professional development and technical assistance.
Support for Other Subgroups
The MDE recognizes that sub-group achievement gaps are especially problematic throughout the
state. In particular, the statewide achievement gap of African-American students compared with
other racial/ethnic groups is dramatic. An analysis of Michigan’s current Priority schools reveals
that over half of the schools on the current PLA list have student populations that are over 80%
African-American.
Recognizing this gap, as well as the other gaps that will be identified in Priority and Focus schools,
the School Reform Office has initiated a department-wide effort to analyze existing data
throughout the state and nation, and to identify programs that have closed (or show promise for
closing) achievement gaps for students. Rather than focusing solely on school practices and gaps in
academic achievement, this effort is designed to examine issues of school culture and climate and

57
Amended July 28, 2015
ESEA FLEXIBI LITY – REQ UEST U . S . D EPARTMEN T OF ED UC ATION
policy that may impact African-American student performance. The goals of this effort are to
create strategies that result in outcomes that not only reduce the achievement gap in academic
performance, but also reduce the disparity in dropout rate, disciplinary referrals, and special
education placement in Michigan’s schools. While initial efforts will be incorporated into plan
requirements for Priority and Focus schools, these efforts will be expanded broadly to address all
relevant offices and programs in the MDE.
We aim to help all students achieve ambitious, attainable objectives for their learning and growth.
Our work with the above-described assessments in the coming years will strive toward career- and
college-readiness and emphasize the Common Core State Standards for every Michigan child.
Michigan’s New Cut Scores
In spring of 2011, the Michigan State Board of Education authorized MDE to conduct a study linking
proficiency cut scores on its high school assessment (the Michigan Merit Examination) to readiness
for college or technical job training at two- and four-year colleges, and linking proficiency cut scores
on its elementary/middle school assessment (the Michigan Educational Assessment Program) to
being on track to career- and college-readiness in high school. That study was conducted over the
summer of 2011 and the new career- and college-ready cut scores were adopted by the State Board
of Education in the fall of 2011.
This was a bold and courageous move on the part of the Michigan State Board of Education and
MDE, in that the proficiency cut scores increased dramatically in rigor and resulted in substantially
lower percentages of students being considered proficient. The seriousness of the impact and the
level of commitment to career- and college-readiness in Michigan can be seen in the impact data
shown below. The impact data describe below for each grade level and content area the statewide
percentage of students who were considered proficient based on the previous cut scores, and the
statewide percentage of students who would have been considered proficient had the new cut
scores been in place in the 2010-2011 school year. Figure 2 shows the impact for mathematics,
Figure 3 for reading, Figure 4 for science, and Figure 5 for social studies. In addition, Figures 6 and 7
show the shift in distributions of mathematics percent proficient in schools based on the old cut
scores and new cut scores for elementary and middle schools (Figure 6) and high schools (Figure 7).
The same shifts are shown for reading in Figures 8 and 9, science in Figures 10 and 11, and social
studies in Figures 12 and 13.

58
Amended July 28, 2015
ESEA FLEXIBI LITY – REQ UEST U . S . D EPARTMEN T OF ED UC ATION
Figure 2. Impact of new cut scores on statewide proficiency in mathematics.
Figure 3. Impact of new cut scores on statewide proficiency in reading.
9591
8084 85
78
52
35 37 3936 36
29 28
0
10
20
30
40
50
60
70
80
90
100
3 4 5 6 7 8 11
Pe
rce
nt
Me
eti
ng
Pro
fici
en
cy T
arg
ets
Grade
With Old Cut Scores
With New Cut Scores
8784 85 84
7982
6363 64 66 64
56 5754
0
10
20
30
40
50
60
70
80
90
100
3 4 5 6 7 8 11
Pe
rce
nt
Me
eti
ng
Pro
fici
en
cy T
arg
ets
Grade
With Old Cut Scores
With New Cut Scores
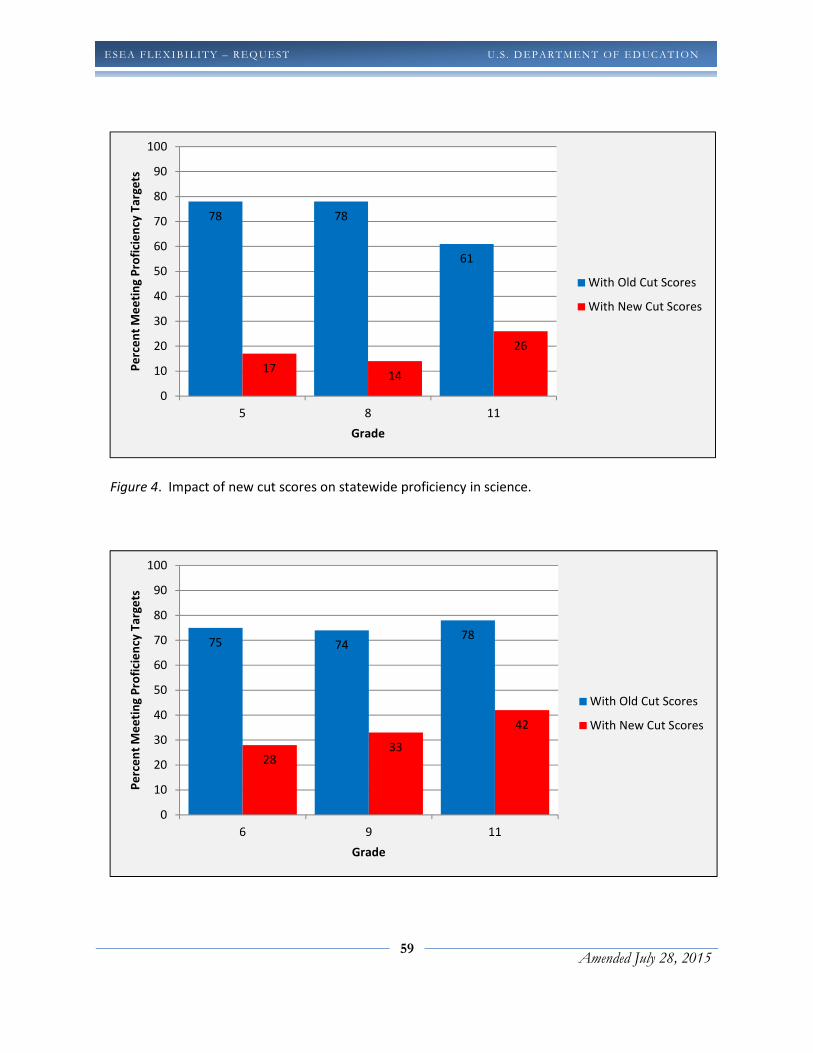
59
Amended July 28, 2015
ESEA FLEXIBI LITY – REQ UEST U . S . D EPARTMEN T OF ED UC ATION
Figure 4. Impact of new cut scores on statewide proficiency in science.
78 78
61
1714
26
0
10
20
30
40
50
60
70
80
90
100
5 8 11
Pe
rce
nt
Me
eti
ng
Pro
fici
en
cy T
arg
ets
Grade
With Old Cut Scores
With New Cut Scores
75 7478
2833
42
0
10
20
30
40
50
60
70
80
90
100
6 9 11
Pe
rce
nt
Me
eti
ng
Pro
fici
en
cy T
arg
ets
Grade
With Old Cut Scores
With New Cut Scores
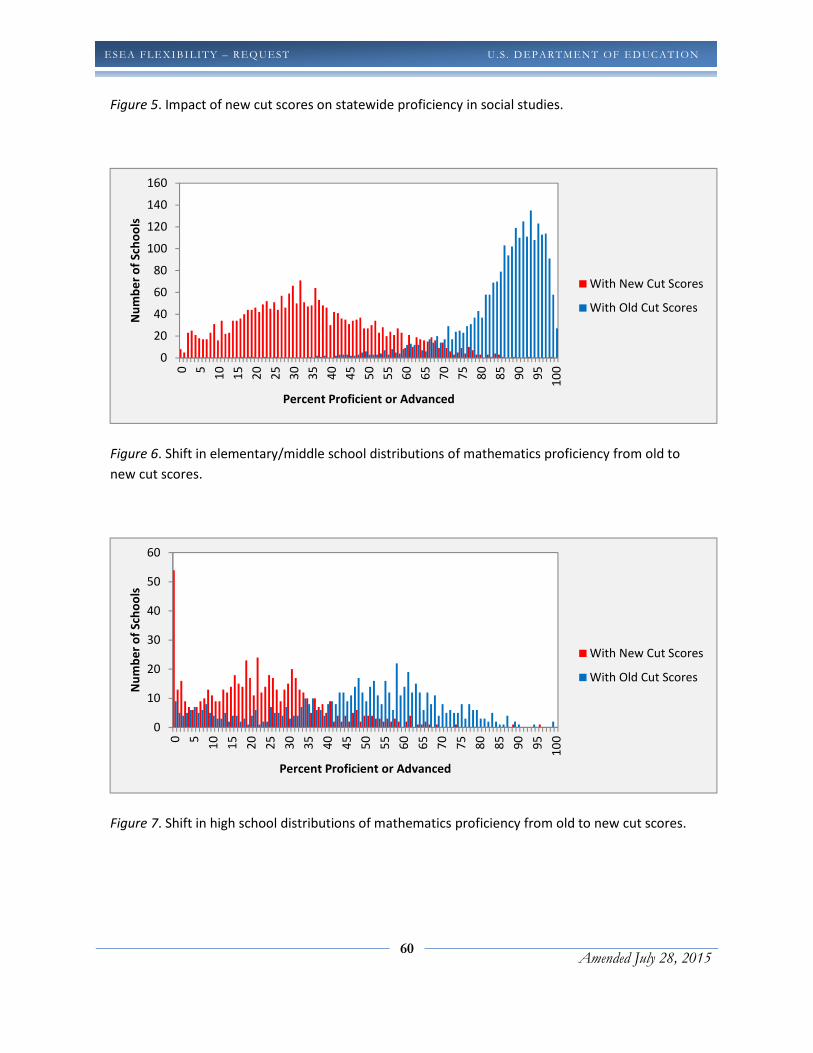
60
Amended July 28, 2015
ESEA FLEXIBI LITY – REQ UEST U . S . D EPARTMEN T OF ED UC ATION
Figure 5. Impact of new cut scores on statewide proficiency in social studies.
Figure 6. Shift in elementary/middle school distributions of mathematics proficiency from old to
new cut scores.
Figure 7. Shift in high school distributions of mathematics proficiency from old to new cut scores.
0
20
40
60
80
100
120
140
1600 5
10
15
20
25
30
35
40
45
50
55
60
65
70
75
80
85
90
95
10
0
Nu
mb
er
of
Sch
oo
ls
Percent Proficient or Advanced
With New Cut Scores
With Old Cut Scores
0
10
20
30
40
50
60
0 5
10
15
20
25
30
35
40
45
50
55
60
65
70
75
80
85
90
95
10
0
Nu
mb
er
of
Sch
oo
ls
Percent Proficient or Advanced
With New Cut Scores
With Old Cut Scores
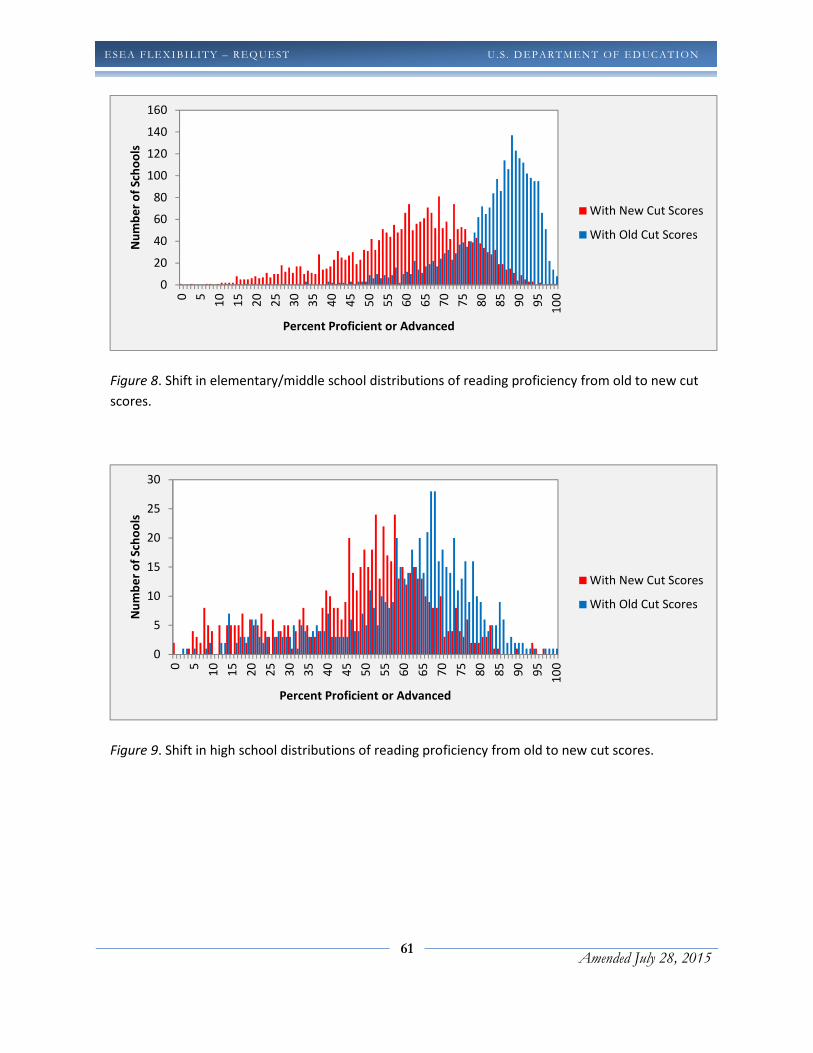
61
Amended July 28, 2015
ESEA FLEXIBI LITY – REQ UEST U . S . D EPARTMEN T OF ED UC ATION
Figure 8. Shift in elementary/middle school distributions of reading proficiency from old to new cut
scores.
Figure 9. Shift in high school distributions of reading proficiency from old to new cut scores.
0
20
40
60
80
100
120
140
160
0 5
10
15
20
25
30
35
40
45
50
55
60
65
70
75
80
85
90
95
10
0
Nu
mb
er
of
Sch
oo
ls
Percent Proficient or Advanced
With New Cut Scores
With Old Cut Scores
0
5
10
15
20
25
30
0 5
10
15
20
25
30
35
40
45
50
55
60
65
70
75
80
85
90
95
10
0
Nu
mb
er
of
Sch
oo
ls
Percent Proficient or Advanced
With New Cut Scores
With Old Cut Scores
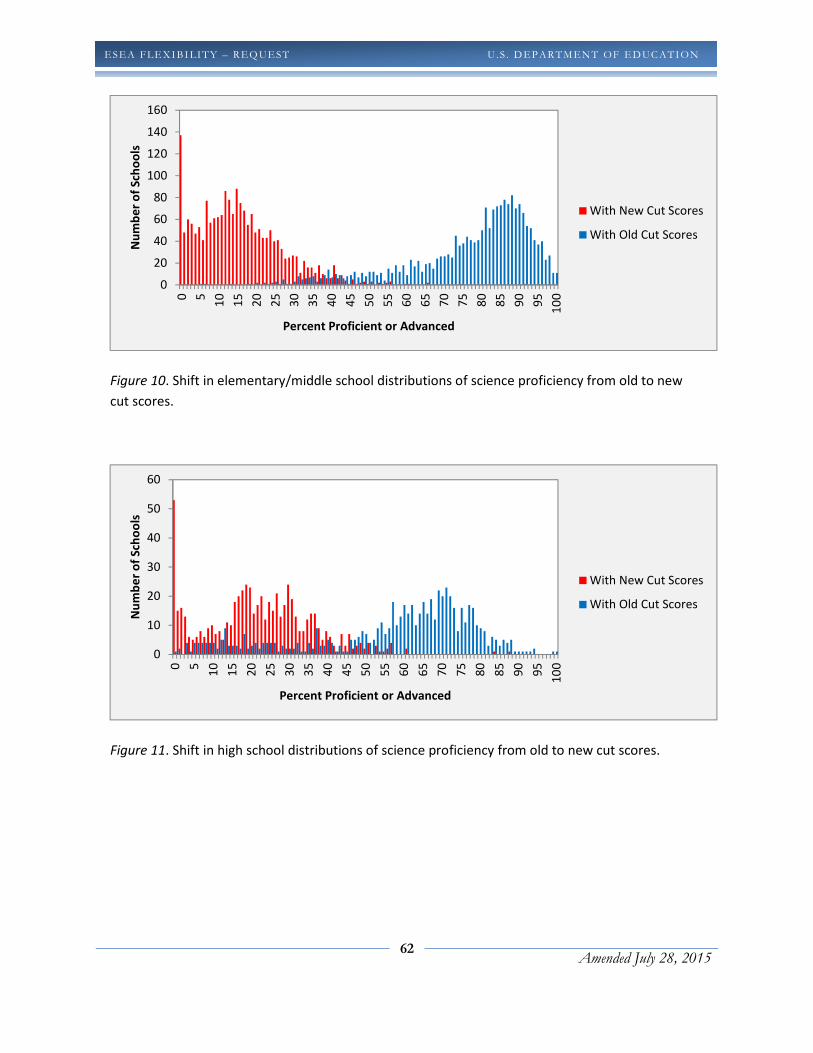
62
Amended July 28, 2015
ESEA FLEXIBI LITY – REQ UEST U . S . D EPARTMEN T OF ED UC ATION
Figure 10. Shift in elementary/middle school distributions of science proficiency from old to new
cut scores.
Figure 11. Shift in high school distributions of science proficiency from old to new cut scores.
0
20
40
60
80
100
120
140
160
0 5
10
15
20
25
30
35
40
45
50
55
60
65
70
75
80
85
90
95
10
0
Nu
mb
er
of
Sch
oo
ls
Percent Proficient or Advanced
With New Cut Scores
With Old Cut Scores
0
10
20
30
40
50
60
0 5
10
15
20
25
30
35
40
45
50
55
60
65
70
75
80
85
90
95
10
0
Nu
mb
er
of
Sch
oo
ls
Percent Proficient or Advanced
With New Cut Scores
With Old Cut Scores

63
Amended July 28, 2015
ESEA FLEXIBI LITY – REQ UEST U . S . D EPARTMEN T OF ED UC ATION
Figure 12. Shift in elementary/middle school distributions of social studies proficiency from old to
new cut scores.
Figure 13. Shift in high school distributions of social studies proficiency from old to new cut scores.
As can be seen from Figures 2 through 13, the rigor of performance expectations on MDE’s
standardized assessments has increased dramatically. For more information about how these cut
scores were derived, please refer to the Technical Appendix (Attachment 13.A).
0
10
20
30
40
50
60
0 5
10
15
20
25
30
35
40
45
50
55
60
65
70
75
80
85
90
95
10
0
Nu
mb
er
of
Sch
oo
ls
Percent Proficient or Advanced
With New Cut Scores
With Old Cut Scores
0
5
10
15
20
25
30
35
40
0 5
10
15
20
25
30
35
40
45
50
55
60
65
70
75
80
85
90
95
10
0
Nu
mb
er
of
Sch
oo
ls
Percent Proficient or Advanced
With New Cut Scores
With Old Cut Scores
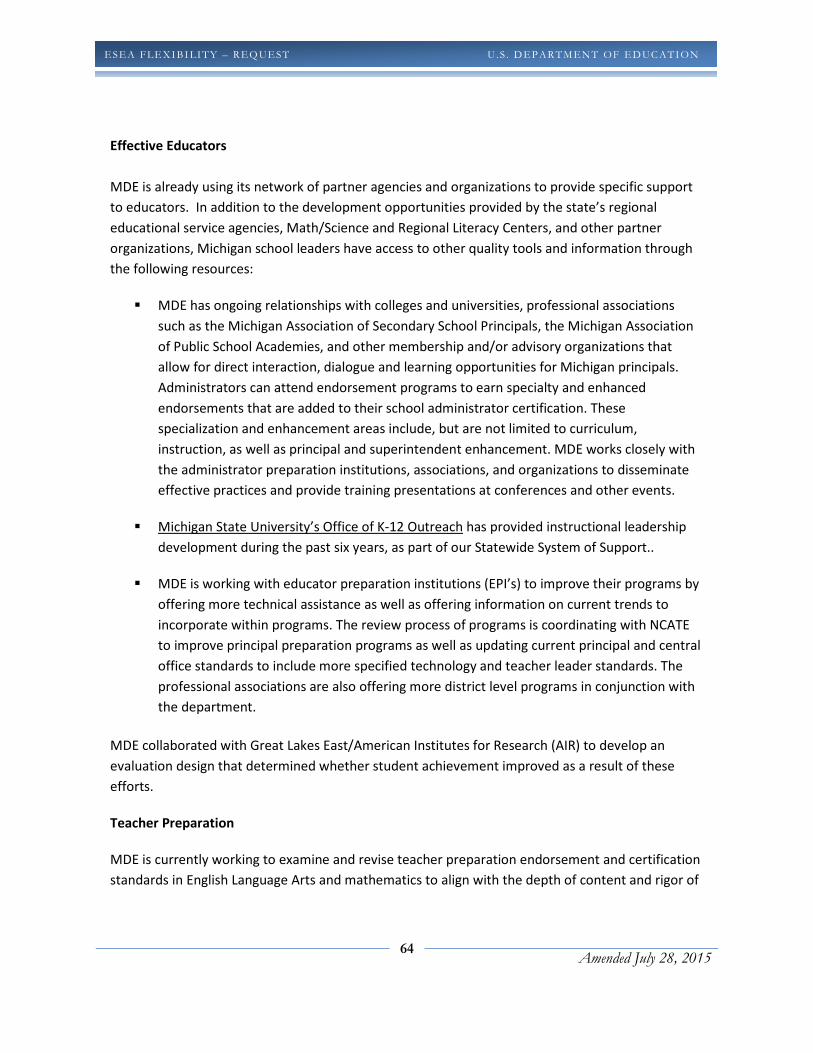
64
Amended July 28, 2015
ESEA FLEXIBI LITY – REQ UEST U . S . D EPARTMEN T OF ED UC ATION
Effective Educators
MDE is already using its network of partner agencies and organizations to provide specific support
to educators. In addition to the development opportunities provided by the state’s regional
educational service agencies, Math/Science and Regional Literacy Centers, and other partner
organizations, Michigan school leaders have access to other quality tools and information through
the following resources:
� MDE has ongoing relationships with colleges and universities, professional associations
such as the Michigan Association of Secondary School Principals, the Michigan Association
of Public School Academies, and other membership and/or advisory organizations that
allow for direct interaction, dialogue and learning opportunities for Michigan principals.
Administrators can attend endorsement programs to earn specialty and enhanced
endorsements that are added to their school administrator certification. These
specialization and enhancement areas include, but are not limited to curriculum,
instruction, as well as principal and superintendent enhancement. MDE works closely with
the administrator preparation institutions, associations, and organizations to disseminate
effective practices and provide training presentations at conferences and other events.
� Michigan State University’s Office of K-12 Outreach has provided instructional leadership
development during the past six years, as part of our Statewide System of Support..
� MDE is working with educator preparation institutions (EPI’s) to improve their programs by
offering more technical assistance as well as offering information on current trends to
incorporate within programs. The review process of programs is coordinating with NCATE
to improve principal preparation programs as well as updating current principal and central
office standards to include more specified technology and teacher leader standards. The
professional associations are also offering more district level programs in conjunction with
the department.
MDE collaborated with Great Lakes East/American Institutes for Research (AIR) to develop an
evaluation design that determined whether student achievement improved as a result of these
efforts.
Teacher Preparation
MDE is currently working to examine and revise teacher preparation endorsement and certification
standards in English Language Arts and mathematics to align with the depth of content and rigor of

65
Amended July 28, 2015
ESEA FLEXIBI LITY – REQ UEST U . S . D EPARTMEN T OF ED UC ATION
instruction required to effectively teach the Common Core State Standards. We will continue to
examine the need for revising endorsement and certification standards as the development of
career and college ready content standards are developed and adopted in additional content
areas. MI has also revised its endorsement program approval process to emphasize outcome
measures, rather than program inputs. This means that each endorsement program must ensure
that their candidates are prepared to effectively teach all students based on certification
examination data.
MDE worked with stakeholders to develop the Professional Standards for Michigan Teachers
(PSMT), adopted by the State Board of Education in 2008. The PSMT work in conjunction with
endorsement and certification standards to guide teacher preparation institutions in developing
programs that prepare teachers to effectively:
• Create supportive learning environments for all students
• Use innovative technology, including online and virtual learning environments
• Demonstrate depth in content knowledge and content specific pedagogy
• Integrate Instructional design and assessment
• Demonstrate professional responsibility and supportive and collaborative relationships
with the student, the school, the district, and the community.
In order to ensure that all parts of the educator preparation program aligns with the knowledge
and skills necessary to effectively deliver instruction and assess learning of career and college ready
content, MI is currently deciding whether to revise and continue to use the PSMT (Professional
Standards for Michigan Teachers) to ensure alignment with the updated endorsement and
certification standards or move to the Interstate Teacher Assessment and Support Consortium
(InTASC) Standards.
As part of the revision of teacher certification standards, we are revising the Michigan Test for
Teacher Certification (MTTC) program to align with the Common Core State Standards (CCSS). All
special education teachers in Michigan are required to obtain a general education teaching
certificate before a special education endorsement is added. In this way, we ensure every Michigan
teacher knows and understands the Common Core. The institutions that prepare special education
teachers will have professional training on the Common Core Essential Elements to ensure that
teachers of students with severe cognitive disabilities graduate with the understanding they’ll need
in their work. MDE will provide this training through the Special Education IHE committee in the
spring of 2012.
Other initiatives include:
66
Amended July 28, 2015
ESEA FLEXIBI LITY – REQ UEST U . S . D EPARTMEN T OF ED UC ATION
• Plans to revise the ESL and bilingual endorsement standards to reflect the needs of
the field and CCSS. Specifically, the standards will include competencies regarding
high incident areas, where it is difficult to distinguish between an EL (language) and
special education issues, as well as data driven decision-making. This work will
most likely begin in early Fall 2012.
• An EL/Special Education Core Team was formed in 2007. Recently, this team has
begun discussing how/ what it would look like to include EL aspects into the Special
Education endorsement, as well as EL and Special Education aspects into all
endorsement standards.
• We are currently revising all secondary English Language Arts related endorsement
standards (i.e. Reading, Reading Specialist, English, Speech, Journalism, and
Communication Arts, and Language Arts) to include CCSS/CCR. The standards have
been drafted and are being reviewed by the committees.
• We are currently working to draft revisions to the elementary endorsement
standards to reflect Math and ELA CCSS, as well as the elementary and secondary
mathematics endorsement standards.
• We are currently reviewing the rules to certify CTE teachers to ensure that they are
adequately prepared to teach all special populations students.
MDE views the adoption of the Common Core State Standards as a catalyst for continued
systematic change. MDE will work closely with representatives of teacher preparation institutions
and key stakeholders to ensure the Common Core is fully supporting career- and college-readiness
for all learners in Michigan.
P-20 Transitions
All the strategies and teams described in this section work together with one singular aim in mind:
effective student preparation and achievement. Every child attending a Michigan school will
experience the best we have to offer in the way of curriculum, instruction, assessment and results.
To this end, we will work with our partners to deliver high-quality systems and support that is
continuously improving for the benefit of all. But it does not stop there. We are also reaching
beyond K-12 to ensure our state addresses the needs of all learners, even those who are not yet old
enough to attend school.
In 2011, the Governor established an Office of Great Start within the MDE. The new office
combines the Department of Human Service’s Office of Child Development and Care and the Head
Start State Collaboration with the Department of Education’s Office of Early Childhood Education
67
Amended July 28, 2015
ESEA FLEXIBI LITY – REQ UEST U . S . D EPARTMEN T OF ED UC ATION
and Family Services. By housing the office in the MDE, the state sends a strong signal about the
importance of early care and education: it’s not about baby-sitting; it’s about learning and
development in ways that allow for adequate stimulation, brain development, and preparation for
school.
The Office of Great Start is responsible for management and leadership for all publicly-funded early
education and care programs, including Child Development and Care, the Head Start Collaboration
Office, state Pre-Kindergarten (Great Start Readiness Program), early intervention (Part C of IDEA,
called Early On in Michigan), early childhood special education (Part B, Section 619), and the state
parent education initiative (Great Parents, Great Start), and is responsible for collaborative efforts
with other offices that use available Title I, Part A funds and state at-risk (Section 31a of the State
School Aid Act), as well as funds for migrant, dual language learning young children, and funds for
homeless children for young children. Bringing these funding streams under one management
authority allows for a coordinated system of standards, assessment and accountability and for
collaborative efforts to develop regional recruitment and enrollment strategies to serve more
vulnerable children in high-quality settings. MDE is working with the Early Childhood Investment
Corporation with Early Learning Advisory Council funds to revise and enhance our Early Childhood
Standards of Quality documents to include alignment from Infant-Toddler through
Preschool/Prekindergarten to K-3 standards. Contracted writers are working with large advisory
groups to complete the alignment and enhanced documents this school year. The standards and
assessments designed to measure program quality are used in all programs and form the basis for
the state's Tiered Quality Rating and Improvement System (Great Start to Quality), which is used for
all licensed, regulated, and child care subsidy programs and settings. Aligning these initiatives with
kindergarten and the primary grades is a necessary foundational step to ensuring that vulnerable
children have a chance to enter school prepared for its rigors, safe, healthy, and eager to succeed.
The Michigan Office of Great Start will manage a coherent system of early learning and
development that aligns, integrates and coordinates Michigan’s investments in critical early
learning and development programs. We are reaching beyond K-12 in our approach, and taking
bold steps to boost readiness and achievement in our schools.
1.C DEVELOP AND ADMINISTER ANNUAL, STATEWIDE, ALIGNED, HIGH-QUALITY
ASSESSMENTS THAT MEASURE STUDENT GROWTH
Select the option that pertains to the SEA and provide evidence corresponding to the option selected.
Option A Option B Option C

68
Amended July 28, 2015
ESEA FLEXIBI LITY – REQ UEST U . S . D EPARTMEN T OF ED UC ATION
The SEA is participating in
one of the two State
consortia that received a
grant under the Race to the
Top Assessment
competition.
i. Attach the State’s
Memorandum of
Understanding (MOU)
under that competition.
(Attachment 6)
The SEA is not participating
in either one of the two State
consortia that received a
grant under the Race to the
Top Assessment competition,
and has not yet developed or
administered statewide
aligned, high-quality
assessments that measure
student growth in
reading/language arts and in
mathematics in at least grades
3-8 and at least once in high
school in all LEAs.
i. Provide the SEA’s plan to
develop and administer
annually, beginning no
later than the 2014−2015
school year, statewide
aligned, high-quality
assessments that measure
student growth in
reading/language arts and
in mathematics in at least
grades 3-8 and at least
once in high school in all
LEAs, as well as set
academic achievement
standards for those
assessments.
The SEA has developed and
begun annually administering
statewide aligned, high-
quality assessments that
measure student growth in
reading/language arts and in
mathematics in at least grades
3-8 and at least once in high
school in all LEAs.
i. Attach evidence that the
SEA has submitted these
assessments and academic
achievement standards to
the Department for peer
review or attach a timeline
of when the SEA will
submit the assessments
and academic
achievement standards to
the Department for peer
review. (Attachment 7)
In June 2014, a change in state law required the Michigan Department of Education (MDE) to develop a
new test for spring 2015, creating a need to reduce a normal three-year test development process to
nine months. The MDE worked relentlessly to accomplish the feat and successfully developed its new
assessment system for implementation in spring 2015, the Michigan Student Test of Educational
Progress, or M-STEP.
The M-STEP includes Michigan’s summative assessments designed to measure student growth
effectively for today’s students. English language arts and mathematics will be assessed in grades 3-8,
science in grades 4 and 7, and social studies in grades 5 and 8. It also includes the Michigan Merit Exam
69
Amended July 28, 2015
ESEA FLEXIBI LITY – REQ UEST U . S . D EPARTMEN T OF ED UC ATION
(MME) in 11th grade, which consists of the ACT Plus Writing, WorkKeys, and M-STEP summative in
English language arts, mathematics, science, and social studies.
When MDE was asked to develop a new test of our current state standards, it was necessary to
investigate all possible solutions to include content that has been properly field-tested in Michigan for
English language arts (ELA) and mathematics, as MDE’s current item pool did not contain items in
mathematics and ELA aligned to our current standards.
MDE discussed options internally and with our assessment partners to identify possible sources of
content for the spring 2015 assessment. The only solution found for ELA and mathematics was to use
content from Smarter Balanced, as it is the only resource that could truly measure Michigan’s standards
in terms of content and nature and were field-tested in Michigan last spring.
By including the rich content available from Smarter Balanced in ELA and mathematics, Michigan is able
to take advantage of the rigorous alignment work Smarter Balanced and its states have put into the
alignment of Smarter Balanced item inventory to the Common Core State Standards. The evidence-
centered design model of the Smarter Balanced claims and targets allows Michigan to administer a valid,
rigorous assessment to use as a gauge of students’ career- and college-readiness. Information on the
Smarter Balanced Content and Item Specifications can be found at
http://www.smarterbalanced.org/smarter-balanced-assessments/#item.
Spring 2015 M-STEP summative tests for grades 3-8 and 11 will include
• ELA (Grades 3-8): Smarter Balanced content plus Michigan-developed field-test items.
This will include a computer adaptive piece, a classroom activity, and a performance
task.
• Mathematics (Grades 3-8): Smarter Balanced content plus Michigan-developed field-
test items. This will include a computer-adaptive piece, a classroom activity, and a
performance task.
• Science (Grades 4 and 7): Michigan-developed assessment of online, fixed-form,
multiple-choice based items.
• Social Studies (Grades 5 and 8): Michigan-developed assessment of online, fixed form,
multiple-choice based items.
• Michigan Merit Exam (MME), Grade 11: ACT Plus Writing, WorkKeys, M-STEP summative
assessment that includes ELA and mathematics comprised of Smarter Balanced content
that will include a computer adaptive piece, a classroom activity, and a performance
task. It will also include Science and Social Studies content comprised of Michigan-
developed online, fixed form, multiple-choice based items.
As described, the M-STEP will be used to deliver a valid, reliable summative assessment measuring
Michigan’s standards for the 2014-15 school year.
70
Amended July 28, 2015
ESEA FLEXIBI LITY – REQ UEST U . S . D EPARTMEN T OF ED UC ATION
In September of 2014 the Michigan legislature required the MDE to produce a new RFP for the 2015-16
school years assessment system. After following the procurement process through the outcome of that
RFP resulted in MDE continuing relationships with our current vendors for statewide assessment for
2015-16 and beyond.
One new component in Michigan is that based on the outcome of a separate RFP for a college entrance
examination for Michigan students is that we will be transitioning from the ACT as a component of our
Michigan Merit Exam to the College Board’s SAT exam. We are eager to work with the College Board and
their redesigned SAT which initial evidence show’s greater alignment to Michigan’s content standards
than our past college entrance exam.
The outcome of these RFP’s will allow us to continue and improve our assessment system as described
above for grades 3-8 and 11 in the 2015-16 school year and subsequent years thereafter.
71
Amended July 28, 2015
ESEA FLEXIBI LITY – REQ UEST U . S . D EPARTMEN T OF ED UC ATION
PRINCIPLE 2: STATE-DEVELOPED DIFFERENTIATED RECOGNITION, ACCOUNTABILITY, AND
SUPPORT
2.A DEVELOP AND IMPLEMENT A STATE-BASED SYSTEM OF DIFFERENTIATED
RECOGNITION, ACCOUNTABILITY, AND SUPPORT
2.A.i Provide a description of the SEA’s differentiated recognition, accountability, and support
system that includes all the components listed in Principle 2, the SEA’s plan for implementation of
the differentiated recognition, accountability, and support system no later than the 2012–2013 school
year, and an explanation of how the SEA’s differentiated recognition, accountability, and support
system is designed to improve student achievement and school performance, close achievement gaps,
and increase the quality of instruction for students.
MDE is taking the opportunity offered by the ESEA Flexibility Request to develop a truly unified and
differentiated system of accountability and support. The proposed accountability system combines:
(i) normative ranking approaches, which allow us to identify those schools most in need of
intervention to increase student performance and close achievement gaps, with (ii) a criterion-
referenced proficiency-based approach that requires all schools to reach ambitious and attainable
proficiency goals and systematically address the needs of every learner. This accountability system
uses an easily accessible diagnostic “scorecard” and intuitive color-coding in order to continue to
leverage the importance of light-of-day reporting and increased information to educators, parents
and community members. The accountability system informs the differentiated system of
recognition and supports, allowing resources and targeted interventions to be accurately deployed
to districts. In all of this, MDE reaffirms our singular focus on increasing student achievement
through the targeted use of strategic interventions and best practices that are informed by data and
accountability.
There is substantial interest from some stakeholders, including the Michigan Legislature, to move
from the color-coding described in this document to a diagnostic scorecard that utilizes an A-F
schema to indicate overall school performance. The MDE will continue to work with stakeholders,
including the Michigan Legislature, over the next year to align state and federal accountability
systems and determine the most meaningful indicators to use, including the steps necessary to
transition from colors to a new schema by the next high-stakes accountability cycle in 2017.
MDE is proposing to implement a three-year identification cycle for Priority and Focus schools. The
Accountability Scorecard will continue to be produced annually, and serve as a diagnostic to
stakeholders. MDE’s normative Top-to-Bottom ranking will be used every three years, starting with
academic year 2016-17, to identify Priority and Focus schools. Resuming in 2015-16, Reward schools
will be identified annually as described in section 2.C. Accountability scorecards will also resume
72
Amended July 28, 2015
ESEA FLEXIBI LITY – REQ UEST U . S . D EPARTMEN T OF ED UC ATION
public reporting in 2015-16. MDE will produce “at-risk” lists annually for stakeholders to use in
diagnosing areas for improvement before an official identification year. “At-risk” lists will be
generated for Priority schools using the lowest 10% of ranked schools. Focus school “at-risk” lists will
consist of the 20% of schools ranked with the widest achievement gaps. MDE will use the most
recent two years of data to identify Priority and Focus schools. In order to be identified in the third
year as a Priority/Focus school, schools must have been identified in the lowest 5% of ranked schools
for Priority status and the largest 10% of achievement gaps for Focus status in the year prior to the
identification year, as well as ranked in the lowest 5% of schools for Priority status or 10% of schools
with largest achievement gaps in the identification year. Sections 2.D-2.G. provide detail on supports
and interventions that occur in interim, non-identification years.
Our Theory of Action � Principle Two
If a school’s challenges are accurately diagnosed through data analysis and professional dialogue
at the building and district levels, then the implementation of a focused and customized set of
interventions will result in school and student success. This approach will result in:
• Consistent implementation of career- and college-ready standards
• Rapid turnaround for schools not meeting annual measurable objectives (AMOs)
• Reduction in the achievement gap
• Reduction in systemic issues at the district level
• Improvements to the instructional core
• Better understanding/utilization of data
• Improved graduation and attendance rates
• Building of/support for effective teaching
• Building of/support for school leadership capacity
• Effective accomplishment of responsibilities by district leadership
Our work on this principle will breathe life into all components of MDE’s Theory of Action, and allow
us to support teaching and learning in customized, diagnostic ways. Our plans build on available
knowledge and resources — standards, instruction and assessment — to make real our twin pillars
of excellence and equity for all Michigan learners.
Here’s how it will work:
• MDE will rank its schools, developing a “Top-to-Bottom” List of schools and their
performance. The ranking will be based on student achievement and student growth over
time/ school improvement over time across all four tested subjects (mathematics, ELA,
73
Amended July 28, 2015
ESEA FLEXIBI LITY – REQ UEST U . S . D EPARTMEN T OF ED UC ATION
science, and social studies,). This list and the methodology used in compiling it are
incorporated throughout the accountability system.6
• MDE will also generate an Accountability Scorecard for every school, showing their
performance on proficiency and improvement targets for all students and for all subgroups.
This scorecard will provide schools with Dark Green, Lime Green, Yellow, Orange or Red
ratings that allow them to assess at a glance where their areas of strengths and weakness
lie.
• One of the key innovations allowing us to focus relentlessly on closing achievement gaps is
the addition of the “Bottom 30%” Subgroup that will be used along with the nine traditional
subgroups. This subgroup consists of the lowest-performing 30% of students in every
school. Its use will ensure that schools are held accountable for increasing the achievement
levels of their lowest performing students, and that all schools testing at least 30 full
academic year students have a subgroup regardless of the demographic composition of their
school. By improving the achievement of the bottom 30% subgroup, a school improves its
overall achievement, improves the achievement of low-performing students in each of the
demographic subgroups, and closes its achievement gaps.
• Schools at the bottom 5% of the Top-to-Bottom list will be identified as Priority schools (or
persistently low achieving schools).
• The 10 percent of schools with the largest achievement gaps in the state and having bottom
30% subroups demonstrating achievement or improvement in achievement below the state
average for the bottom 30% subgroup will be categorized and treated for improvement as
Focus schools. The achievement gap is calculated as the distance between the average
standardized scale score for the top 30% of students and the bottom 30% of students in that
each school. Larger gaps decrease a school’s overall ranking; smaller gaps help raise their
ranking.
• A list of schools Beating the Odds will be developed. A school will be considered as “beating
the odds” when it outperforms its predicted Top-to-Bottom percentile ranking as predicted
by schools’ demographic makeup7, or based on outperforming the 30 most demographically
similar schools in the state.
6 We would like to note that the Top-to-Bottom methodology is a modification of the federally prescribed ranking rules for
school improvement grants to persistently lowest achieving schools. Over the course of the 2010-2011 school year, MDE took
the original methodology for persistently lowest achieving schools, engaged in multiple and repeated conversations with
stakeholders regarding the methodology, and made significant revisions based on that stakeholder feedback. Revisions
included adding the achievement gap to the rankings, standardizing scale scores to better compare students and schools,
adding graduation rate, and a variety of other improvements. The Technical Appendix contains a chart comparing the two
methodologies, along with more detail on the changes made through this iterative process with our stakeholders. Although
that stakeholder feedback was generated prior to the ESEA Flexibility opportunity, we would like to acknowledge that the
yearlong process on the Top-to-Bottom ranking was an important component in helping to position us to submit this flexibility
application. 7 The demographic characteristics used are: grade configuration, state foundation allowance, enrollment, percent racial/ethnic in each
category, percent economically disadvantaged, percent students with disabilities and percent limited English proficient. MDE intends to
74
Amended July 28, 2015
ESEA FLEXIBI LITY – REQ UEST U . S . D EPARTMEN T OF ED UC ATION
• A list of schools making and not making Adequate Yearly Progress. AYP will now be
presented in a scorecard approach, and incorporates proficiency targets on career- and
college-ready cut scores. After 2012, this will not be labeled as Adequate Yearly Progress.
• A list of Reward schools will be identified. Identification will result from the following:
o Making Adequate Yearly Progress (being a Dark Green, Lime Green, Yellow, or
Orange school)
AND
• Achieving one or more of the following distinctions:
� Being in the top 5% of the Top-to-Bottom ranking
� Being in the top 5% of schools on the improvement measures in the Top-to-
Bottom ranking
� Being a school identified as Beating the Odds
� Being a school showing continuous improvement beyond the 2022
proficiency targets (beginning in 2013)
• All Schools in Michigan – whether they are Title I or not — will be subject to state-level
requirements and eligible for various levels of MDE support, assistance, and resources.
Michigan School Classifications— By The Numbers
MDE is able to demonstrate the required number of priority, focus, and reward schools that meet
the respective definitions of those groups of schools.
Priority Schools:
o Step 1: Determine the number of schools it must identify as priority schools
� Michigan: 100 schools must be identified as priority
o Step 2: Identify the schools on the list generated by the overall rating in the
accountability system that are currently-served Tier I or Tier II SIG schools
� Michigan: 52 SIG schools currently served.
o Step 3: Identify the schools on the list generated by the overall rating in the
accountability system that are Title I-participating or eligible high schools that have
had a graduation rate less than 60% over a number of years
� Michigan: 4 schools
continue to refine the Beating the Odds methodology and may add or remove demographic characteristics depending on their usefulness in
identifying similar schools and in differentiating among schools.
We are considering modifications to the matching process, and have been in discussions with the Regional Educational Laboratory-Midwest to
re-evaluate the Beating the Odds methodology. We dropped the Census-based locale coding used in previous years, and are considering using
a Michigan-specific regional measure, as we feel the Census-based codes are not accurately reflecting the realities of experience of schools in
Michigan.

75
Amended July 28, 2015
ESEA FLEXIBI LITY – REQ UEST U . S . D EPARTMEN T OF ED UC ATION
o Step 4: Determine the number of additional schools the SEA needs to identify as
among the lowest-achieving five percent of Title I schools in the State to reach the
minimum number of priority schools it must identify by subtracting the number of
schools identified in steps 2 and 3 from the number identified in step 1
� Michigan: 44 schools (100-52-4 = 44)
o Step 5: Generate a list that rank-orders Title I schools in the State based on the
achievement of the “all students” group in terms of proficiency on the statewide
assessments combined and lack of progress on those assessments over a number of
years. To generate this list, an SEA might use the same method that it used to
identify its PLA schools for purposes of the SIG program, but apply that method to
the pool of all Title I schools in the State.
� Michigan: This was accomplished by taking the ranking system that is used
for our current PLA schools and applying it to all Title I schools, as opposed
to only the Tier I and Tier II pools.
o Step 6: using the list from step 5, identify which schools fall within the lowest-
achieving five percent.
� Michigan: The lowest 5% of schools on that straight Top-to-Bottom list was
identified.
o Step 7: Demonstrate that the list generated based on schools’ overall rating in the
accountability system includes a number of schools at least equal to the number
determined in step 4 that are also on the list of lowest-achieving five percent
schools identified in step 6. Note that the schools counted for this purpose must not
have been counted as currently served SIG schools or low graduation rate schools.
� Michigan: We have 55 schools that are both lowest 5% of the PLA list (using
percent proficient and improvement) AND lowest 5% of our Top-to-Bottom
list, not including SIG or low grad schools. We needed 44 to meet the
threshold.
Although Michigan has a sufficient number of schools identified by both metrics to meet the
demonstration requirements outlined above, we would also like to present conceptual
considerations for USED to review as they consider ranking mechanisms for schools.
MDE has produced and distributed the ranking of all Title I schools that is used to produce the PLA
list for two years. In the initial year that the list was released, MDE engaged in substantial
discussions with stakeholders regarding the ranking methodology, as MDE was integrating this
methodology into our state accreditation system. Stakeholders raised a number of concerns about
the ranking, many of which MDE found to be valid concerns and which resulted in changes in our
ranking calculations, producing the Top-to-Bottom methodology we presented here.
76
Amended July 28, 2015
ESEA FLEXIBI LITY – REQ UEST U . S . D EPARTMEN T OF ED UC ATION
One of the key criticisms was that the use of percent proficient as the achievement component of
the ranking was unfair, because cut scores were differentially difficult at various grade levels. Being
proficient in third grade was easier to obtain than being proficient in eighth grade, so schools with
grade spans that included the higher grades were at a disadvantage. MDE conducted some internal
analyses, and found some validity in the claim—there did seem to be a relationship between grade
span and ranking. Measurement research suggests that this is a common issue with a lack of vertical
articulation of standards across grades. Our modified ranking system relies on a standardized
student scale score, where the student’s scale score on the assessment taken by that student is
compared to the statewide average of all students who took that same assessment in the same
grade and content area. This helps negate the grade-level differences in standards that are present
in any assessment and content standard system, and also makes for a more fair comparison of
schools to each other, where grade span is not as easily conflated with achievement. One additional
benefit is that keying off scale scores provides a more stable ranking methodology because we are
not throwing away information in the scale scores by bifurcating them into proficient/not proficient
categories. Finally, with our new, more rigorous cut scores, it would be difficult to determine
differences in ranking at the lower end of the ranking, as many schools are clustered around a low
percent of students proficient.
We include all full academic year students who take any of our assessments in the Top-to-Bottom
ranking. For students who take our alternate assessment, MI-Access, the way this is accomplished is
that we take the student’s scale score on the assessment they took (the three levels of our alternate
assessment are Functional Independence, Supported Independence, and Participation), and
standardize that scale score against all students who took that same assessment in the same subject,
grade and year. This allows us to standardize scale scores from all assessments and then combine
them into the three components of the Top-to-Bottom ranking. We do not limit the number of
scores from the alternate assessment that can be included in the Top-to-Bottom ranking. See
Appendix 13.E regarding accountability designation for special education centers.
We fully believe our Top-to-Bottom methodology is an improvement over the percent proficient
ranking methodology that was part of the original PLA system, and believe this should be considered
in a more general sense when asking states to rank schools. Although we can demonstrate that we
meet the requirements for number of schools identified under both methods, MDE stands by its
revised ranking methodology as a more accurate and fair way to conduct a school ranking.
Reward Schools
• Generate a list that rank orders Title I schools in the state based on aggregate performance
in reading/language arts and mathematics for the all students group over a number of years.
o Use the original PLA methodology, which ranked schools on percent proficient and
used only reading and mathematics.
77
Amended July 28, 2015
ESEA FLEXIBI LITY – REQ UEST U . S . D EPARTMEN T OF ED UC ATION
o Identified the top 5% of Title I schools as “high-performing”
• Generate a list that rank-orders Title I high schools in the state based on graduation rates.
o Used the graduation rate over four year; identified any school with a graduation rate
over 97% as high-performing.
• For each list, set a cut point.
o Top 5% of the overall PLA list, and over 97% for graduation rate.
• We also generated a list of composite improvement rate for all schools and used only the
reading and mathematics improvement composite, then flagged the top 5% of those schools
as “reward’ schools.
• Remove from the lists all schools not making AYP
o Done
• Remove from the lists schools that have significant achievement gaps
o Removed all Focus schools from this list.
Results:
Looking only at the Title I schools, we identify 109 Title I schools using the steps outlined above and
109 Title I schools using our three methods (high performing on our Top-to-Bottom ranking, high
improvement on the improvement component of the Top-to-Bottom ranking, and beating the odds).
Of those 109, 51 schools (or 47%) are identified by both methodologies. Fifty-eight schools are
identified by our methods that are not identified by USED’s; and 58 are identified by USED’s that are
not identified by ours (53%).
Of those identified by MDE’s methodology that are not by USED’s, 45 of those (78%) are identified
by our Beating the Odds methodology, which looks at schools that can significantly outperform their
expected outcomes or the outcomes of a comparison group of schools. There is no equivalent to
this in the USED system, so therefore we would not expect coherence here.
Of those identified by USED’s methodology that are not identified by USED’s, these are largely
elementary/middle schools (only three standalone high schools), and they are identified as either
high achieving or high performing. We believe this indicates what we had previously stated about
basing a ranking on percents proficient instead of our preferred and more precise formula of ranking
schools based on their standardized student scale scores, improvement, and achievement. We also
believe this reflects the inclusion of four tested subjects as opposed to only two.
It is MDE’s belief that a 47% overlap between our preferred methodologies and the suggested
methodologies of USED is sufficient.
Focus Schools Comparison
• Determine the number of schools that must be identified as focus schools.
o In 2010-2011, we had 2006 Title I schools, so we needed to identify 201 schools as
focus schools
78
Amended July 28, 2015
ESEA FLEXIBI LITY – REQ UEST U . S . D EPARTMEN T OF ED UC ATION
• Identify the schools on the list generated by the overall rating in the accountability system
that are Title I and have a graduation rate less than 60% and are not priority schools.
o Zero.
• Identify additional Title I participating high schools that have graduation rate less than 60%
and have not been identified as priority schools.
o 5
• Determine the remaining number of schools that the SEA needs to identify as focus schools
by subtracting the number of schools identified in steps 2 and 3 from the number identified
in step 1.
o 201-5 = 196
• Generate a list that rank orders Title I schools in the state based on achievement gaps
between subgroups in a school over a number of years; set a cut point that separates
highest achievement gap schools from others.
o This is our focus schools metric; the average achievement gap between the top 30%
and bottom 30% subgroups within each school, across all four tested subjects. The
cut point is the value represented by the Title I school at the 10th percentile of this
ranking.
• Using this method, we identify 340 Focus schools, 206 of which are Title I schools, and 5 of
those are schools with graduation rates below 60% over three years.
Understanding the Top-to-Bottom Methodology
In 2011, MDE produced a comprehensive Top-to-Bottom ranking of all schools in the state. This
ranking was developed based on the original methodology for identifying persistently lowest
achieving schools, following the federal School Improvement Grant ranking formula requirements.
Throughout the 2010-2011 school year, MDE modified the original PLA ranking based on extensive
comments from stakeholders and internal evaluation of the methodology and data. Although the
2011 PLA list was still run using the original methodology (due to a technicality in state legislation),
MDE produced the full Top-to-Bottom list as part of our “light of day” reporting initiatives. It gave
schools a “low-stakes” look at their ranking on the new metric, provided them with important
diagnostic data for their schools, and afforded MDE the opportunity to educate schools and
educators on the metric before it took on a more high-stakes nature.
The Top-to-Bottom list includes all four tested subjects (mathematics, ELA , science, and social
studies) and graduation rate (when available). Each subject is measured using two indices:
achievement andstudent growth/school improvement. Achievement gap is now calculated
separately for purposes of identifying Focus schools.
• Achievement: To obtain a measure of a school’s achievement over all students in various
grades and test types, we standardize each student’s scale score on the test they took. This
79
Amended July 28, 2015
ESEA FLEXIBI LITY – REQ UEST U . S . D EPARTMEN T OF ED UC ATION
gives us a value that tell us how well each student did on that test compared to all others
statewide who took that same test in that same grade and subject in a given year. This
allows us to standardize out potential differences in difficulty of cut scores or tests not
accounted for in the psychometric properties of the test, and also allows us to put all
students on a similar metric so that we can combine it for overall school achievement.
Additionally, given our recent change in cut scores, looking at the percent of students
proficient would have made it impossible to accurately rank at the bottom of the
distribution, as so many schools have zero percent of their students proficient. Using
standardized scale scores makes this truly a normative ranking system, as the proficiency
criteria are not reflected in a school’s ranking.
• Improvement: Improvement is calculated using an error-adjusted mean student growth
percentile (SGP) aggregated at the school level where SGP data exists. Provisions are made
so that higher-performing schools are not penalized if they lack room to show improvement.
• Achievement gap: This gap is calculated as the distance between the average scale score for
the top 30% of students and the bottom 30% of students in that each school. Larger gaps
decrease a school’s overall ranking on the Focus schools list; smaller gaps help raise their
ranking.
For schools with a graduation rate, the school is ranked on both the graduation rate as well as
improvement in graduation rate, and this counts as 10% of the overall school ranking.
Each content index is weighted by the number of student scores in the final ranking, and a school
receives a ranking if it has at least 30 full academic year students in both the current and the
previous year in at least two content areas.
Each content area metric is based on achievement (1/2 of the metric) and improvement (1/2 of the
metric). This creates a tension between high achievement and improvement over time. This
weighting will be monitored during the first 3-year accountability cycle to determine if modifications
to the weighting may be necessary in order to take advantage of new and more accurate measures
of growth.
In 2013-2014, MDE proposes modifications to the Top-to-Bottom Ranking to account for outliers.
Following the implementation of our ESEA Flexibility application in the 2012-2013 school year, MDE
convened a group of stakeholder to discuss the metrics, and in particular, the Focus metric. There
was a concern voiced by the field that schools were being identified as Focus Schools “only” because
they had very high-achieving students. While this was not true in the majority of the cases, the
resulting data analysis and discussions with the field helped MDE identify an issue with our Top-to-
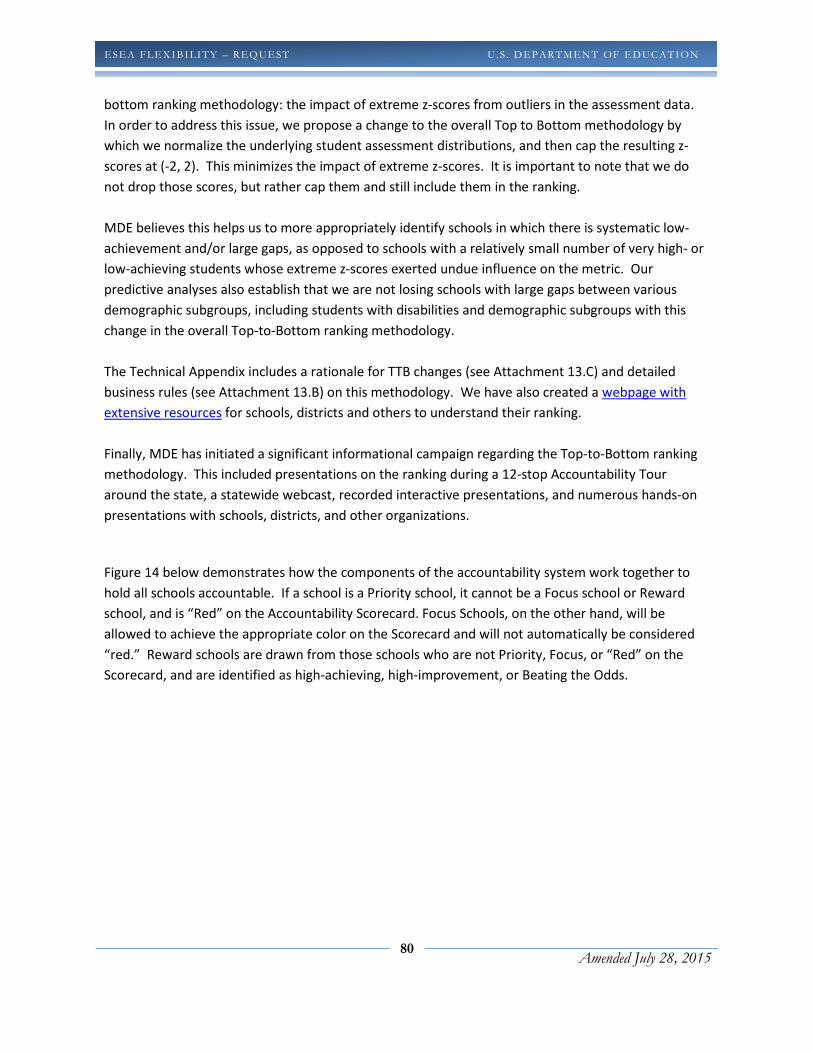
80
Amended July 28, 2015
ESEA FLEXIBI LITY – REQ UEST U . S . D EPARTMEN T OF ED UC ATION
bottom ranking methodology: the impact of extreme z-scores from outliers in the assessment data.
In order to address this issue, we propose a change to the overall Top to Bottom methodology by
which we normalize the underlying student assessment distributions, and then cap the resulting z-
scores at (-2, 2). This minimizes the impact of extreme z-scores. It is important to note that we do
not drop those scores, but rather cap them and still include them in the ranking.
MDE believes this helps us to more appropriately identify schools in which there is systematic low-
achievement and/or large gaps, as opposed to schools with a relatively small number of very high- or
low-achieving students whose extreme z-scores exerted undue influence on the metric. Our
predictive analyses also establish that we are not losing schools with large gaps between various
demographic subgroups, including students with disabilities and demographic subgroups with this
change in the overall Top-to-Bottom ranking methodology.
The Technical Appendix includes a rationale for TTB changes (see Attachment 13.C) and detailed
business rules (see Attachment 13.B) on this methodology. We have also created a webpage with
extensive resources for schools, districts and others to understand their ranking.
Finally, MDE has initiated a significant informational campaign regarding the Top-to-Bottom ranking
methodology. This included presentations on the ranking during a 12-stop Accountability Tour
around the state, a statewide webcast, recorded interactive presentations, and numerous hands-on
presentations with schools, districts, and other organizations.
Figure 14 below demonstrates how the components of the accountability system work together to
hold all schools accountable. If a school is a Priority school, it cannot be a Focus school or Reward
school, and is “Red” on the Accountability Scorecard. Focus Schools, on the other hand, will be
allowed to achieve the appropriate color on the Scorecard and will not automatically be considered
“red.” Reward schools are drawn from those schools who are not Priority, Focus, or “Red” on the
Scorecard, and are identified as high-achieving, high-improvement, or Beating the Odds.
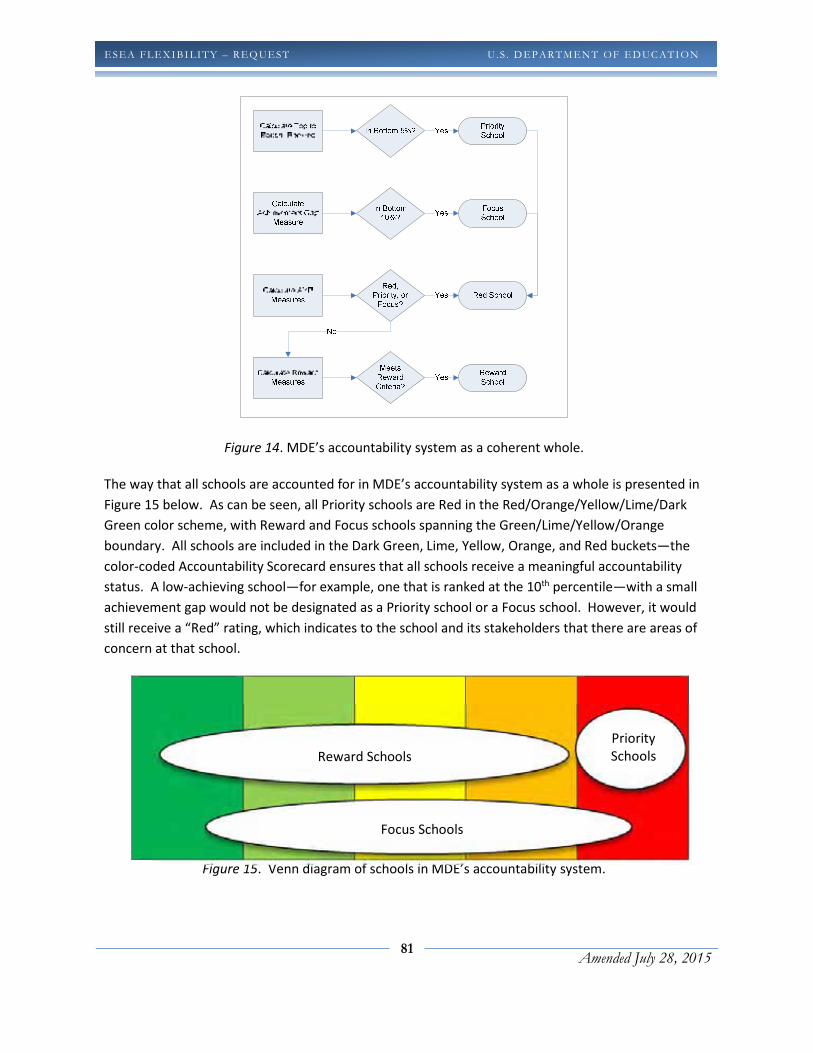
81
Amended July 28, 2015
ESEA FLEXIBI LITY – REQ UEST U . S . D EPARTMEN T OF ED UC ATION
Figure 14. MDE’s accountability system as a coherent whole.
The way that all schools are accounted for in MDE’s accountability system as a whole is presented in
Figure 15 below. As can be seen, all Priority schools are Red in the Red/Orange/Yellow/Lime/Dark
Green color scheme, with Reward and Focus schools spanning the Green/Lime/Yellow/Orange
boundary. All schools are included in the Dark Green, Lime, Yellow, Orange, and Red buckets—the
color-coded Accountability Scorecard ensures that all schools receive a meaningful accountability
status. A low-achieving school—for example, one that is ranked at the 10th percentile—with a small
achievement gap would not be designated as a Priority school or a Focus school. However, it would
still receive a “Red” rating, which indicates to the school and its stakeholders that there are areas of
concern at that school.
Figure 15. Venn diagram of schools in MDE’s accountability system.
Reward Schools
Focus Schools
Priority
Schools
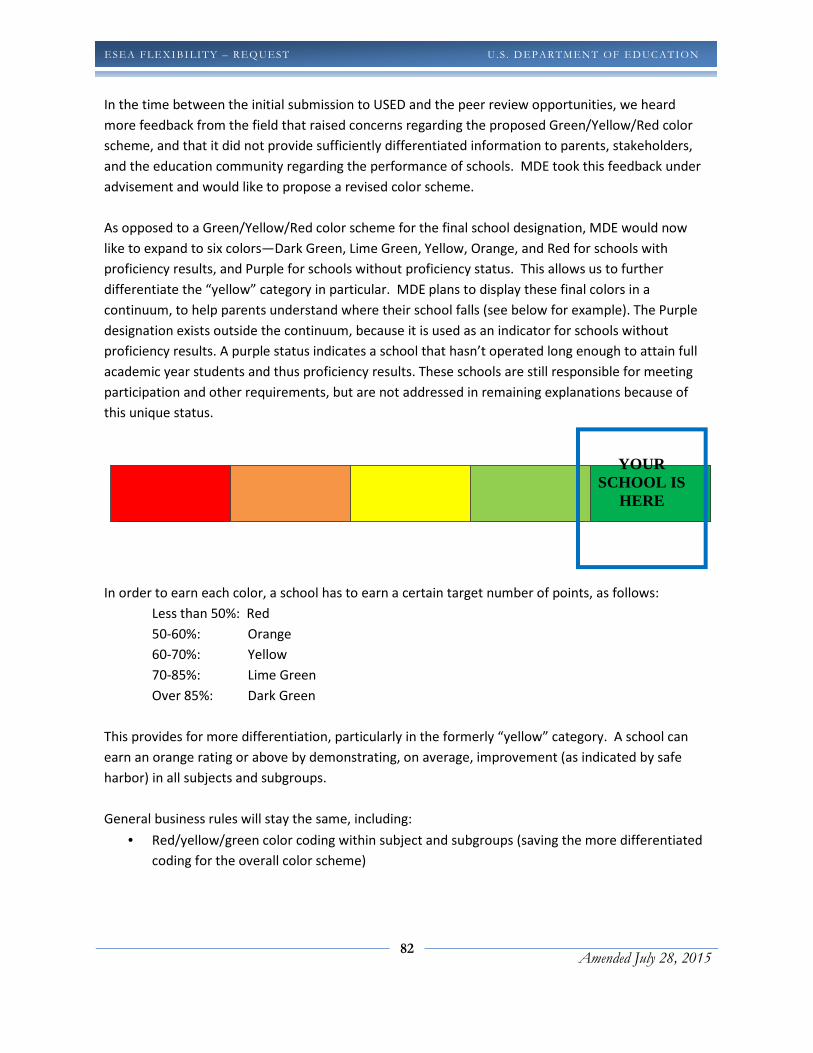
82
Amended July 28, 2015
ESEA FLEXIBI LITY – REQ UEST U . S . D EPARTMEN T OF ED UC ATION
In the time between the initial submission to USED and the peer review opportunities, we heard
more feedback from the field that raised concerns regarding the proposed Green/Yellow/Red color
scheme, and that it did not provide sufficiently differentiated information to parents, stakeholders,
and the education community regarding the performance of schools. MDE took this feedback under
advisement and would like to propose a revised color scheme.
As opposed to a Green/Yellow/Red color scheme for the final school designation, MDE would now
like to expand to six colors—Dark Green, Lime Green, Yellow, Orange, and Red for schools with
proficiency results, and Purple for schools without proficiency status. This allows us to further
differentiate the “yellow” category in particular. MDE plans to display these final colors in a
continuum, to help parents understand where their school falls (see below for example). The Purple
designation exists outside the continuum, because it is used as an indicator for schools without
proficiency results. A purple status indicates a school that hasn’t operated long enough to attain full
academic year students and thus proficiency results. These schools are still responsible for meeting
participation and other requirements, but are not addressed in remaining explanations because of
this unique status.
In order to earn each color, a school has to earn a certain target number of points, as follows:
Less than 50%: Red
50-60%: Orange
60-70%: Yellow
70-85%: Lime Green
Over 85%: Dark Green
This provides for more differentiation, particularly in the formerly “yellow” category. A school can
earn an orange rating or above by demonstrating, on average, improvement (as indicated by safe
harbor) in all subjects and subgroups.
General business rules will stay the same, including:
• Red/yellow/green color coding within subject and subgroups (saving the more differentiated
coding for the overall color scheme)
YOUR
SCHOOL IS HERE
83
Amended July 28, 2015
ESEA FLEXIBI LITY – REQ UEST U . S . D EPARTMEN T OF ED UC ATION
• Participation rules: For each “red” that a school earns in any subgroup/subject combination,
their overall color is lowered one level. If a school earns two reds in the “all students”
category in any two subjects, the school automatically earns an overall “red” rating. This is
to prevent schools from choosing to not assess certain students.
Interactions between Priority, Focus and Reward school status and the Accountability Scorecard stay
the same.
All Schools
All Michigan schools are required to carry out the following action steps each year:
o Complete a Comprehensive Needs Assessment (CNA);
o Complete an EdYes! Report using the School Systems Review or the Self-
Assessment/Interim Self-Assessment for AvancED accredited schools
o Develop or revise a School Improvement Plan;
o Complete the Program Evaluation Tool;
o Provide an Annual Education Report to the public in accordance with Michigan law;
and
o Submit other academic, financial and compliance data to the RESA and state as
required.
MDE’s proposed accountability system, submitted pursuant to this ESEA Flexibility Request
opportunity, will not change the basic activities and submission requirements for schools. Rather,
the new system will build on these basic elements to support rapid improvement and change for
schools that are most in need of support.
Focusing on Achievement Gaps and Low Achieving Subgroups
MDE has developed an innovative strategy to aggressively address our achievement gaps and to
ensure that strategic focus is placed on closing gaps by improving the achievement of those students
who are still being left behind in their schools. To do this, we will add the “bottom 30%” subgroup
to the current nine demographic subgroups already required under NCLB. Here’s how this will
happen:
• Each student’s scale score on a given content area, grade level, and test (e.g. alternate
versus general) is transformed into a z-score in comparison to students taking the same test
in the same content area in the same grade level across the entire state. The z-scoring
allows for comparison of scores across grade levels and test types to assure that all students
84
Amended July 28, 2015
ESEA FLEXIBI LITY – REQ UEST U . S . D EPARTMEN T OF ED UC ATION
are accounted for and to assure that a subgroup is created wherever 30+ Full Academic Year
students take the test regardless of grade level.
The averaging of z-scores means that the system is a fully compensatory system. If all else is
equal, an improvement in any one z-score will result in an improvement in the grand mean
z-score. If all else is equal, a decline in any one z-score will result in a decline in the grand
mean z-score. It also means that a change in a single z-score cannot have an overly large
impact on the grand mean z-score. We find that to be an appropriate outcome, in that
improved achievement in only one area should not result in a dramatic rise in the overall
index, but improved achievement in the majority of areas should.
• The lowest scoring 30% of students are identified in the “bottom 30%” subgroup.
• The school is then expected to make either the proficiency or the improvement targets for
that “bottom 30%” subgroup, in addition to the other nine subgroups and the whole school
targets.8
We believe the addition of this subgroup has many benefits. First, it requires that schools be
strategic and specific about closing the achievement gap by requiring them to improve the
achievement of their lowest performing students, regardless of the demographic subgroup of those
students. If we are serious about closing achievement gaps, we have to identify those students who
are furthest behind and hold schools accountable for doing something about those students.
It helps reduce the “masking” effect that can occur when using only the nine traditional subgroups.
If a low performing student is in a high-performing subgroup, this student will be missed by the
accountability system—the group as a whole will meet the target, and the school will likely focus
their attention elsewhere. By including a bottom 30% subgroup, schools now have to be intentional
about those students.
This methodology also ensures that all schools have at least that subgroup. One criticism of the
current subgroup methodology in AYP is that schools in more diverse areas are penalized for this
diversity, as they now have more targets to meet because they have more subgroups.9 In 2010-
2011, there were over 700 schools in Michigan who did not have a subgroup (beyond the majority
student “subgroup”), and many more who only had one additional subgroup. However, we know
that low-performing students are in every school, and that for many of them, attending a
8 Every school with at least 30 Full Academic Year students will have a bottom 30% subgroup calculated for Accountability
purposes. MDE plans to continue to utilize its current methodology for generating an Accountability status for very small
schools; this methodology makes use of a sliding confidence interval along with multi-year averaging to allow us to identify an
Accountability status for all schools in the state. 9 This is due to the fact that a school is required to have at least 30 Full Academic Year (FAY) students in a particular
demographic subgroup in order to be held accountable on that subgroup.
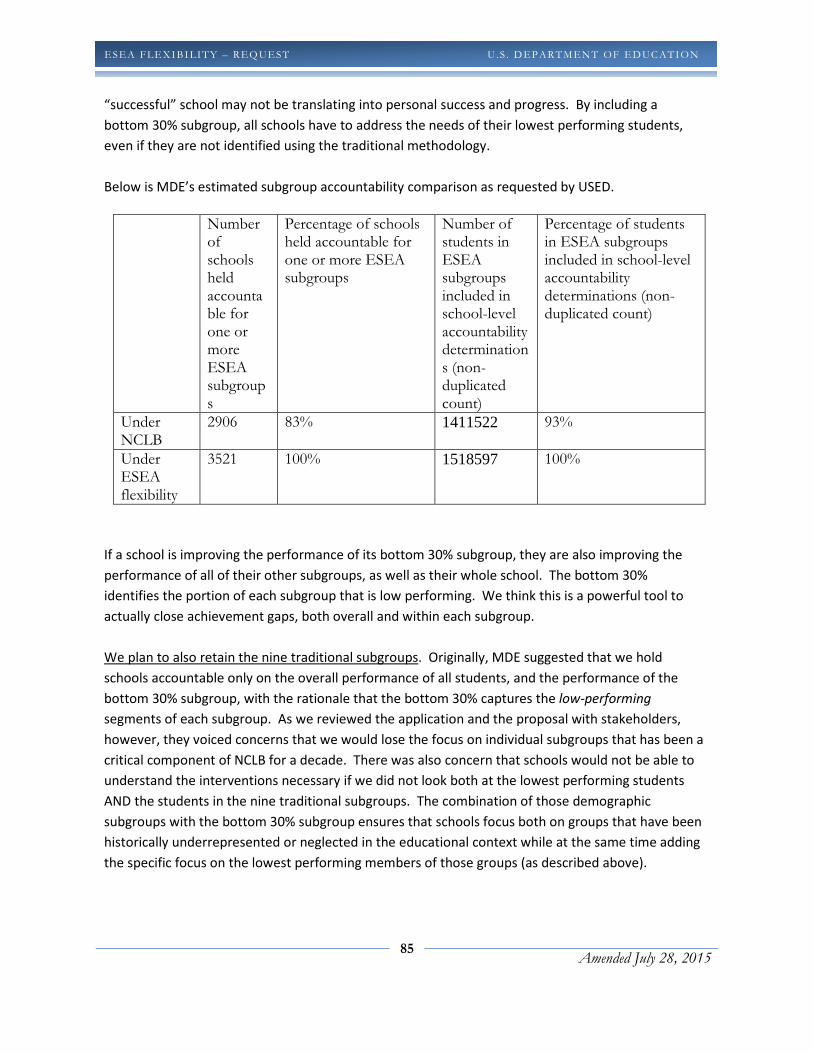
85
Amended July 28, 2015
ESEA FLEXIBI LITY – REQ UEST U . S . D EPARTMEN T OF ED UC ATION
“successful” school may not be translating into personal success and progress. By including a
bottom 30% subgroup, all schools have to address the needs of their lowest performing students,
even if they are not identified using the traditional methodology.
Below is MDE’s estimated subgroup accountability comparison as requested by USED.
Number of schools held accountable for one or more ESEA subgroups
Percentage of schools held accountable for one or more ESEA subgroups
Number of students in ESEA subgroups included in school-level accountability determinations (non-duplicated count)
Percentage of students in ESEA subgroups included in school-level accountability determinations (non-duplicated count)
Under NCLB
2906 83% 1411522
93%
Under ESEA flexibility
3521 100% 1518597
100%
If a school is improving the performance of its bottom 30% subgroup, they are also improving the
performance of all of their other subgroups, as well as their whole school. The bottom 30%
identifies the portion of each subgroup that is low performing. We think this is a powerful tool to
actually close achievement gaps, both overall and within each subgroup.
We plan to also retain the nine traditional subgroups. Originally, MDE suggested that we hold
schools accountable only on the overall performance of all students, and the performance of the
bottom 30% subgroup, with the rationale that the bottom 30% captures the low-performing
segments of each subgroup. As we reviewed the application and the proposal with stakeholders,
however, they voiced concerns that we would lose the focus on individual subgroups that has been a
critical component of NCLB for a decade. There was also concern that schools would not be able to
understand the interventions necessary if we did not look both at the lowest performing students
AND the students in the nine traditional subgroups. The combination of those demographic
subgroups with the bottom 30% subgroup ensures that schools focus both on groups that have been
historically underrepresented or neglected in the educational context while at the same time adding
the specific focus on the lowest performing members of those groups (as described above).
86
Amended July 28, 2015
ESEA FLEXIBI LITY – REQ UEST U . S . D EPARTMEN T OF ED UC ATION
This point merits emphasis. MDE proposes to continue to hold schools accountable on the
performance of all nine ESEA subgroups, as well as on the performance of the new subgroup, the
bottom 30% subgroup. Therefore, schools must not only show improvements with their lowest-
achieving students, regardless of demographics, but they must also monitor performance and show
improvements in each of their demographic subgroups as well. It is a dual structure of unmasking
students—students who may have been masked in one methodology are revealed in the other.
In further analysis of that bottom 30% subgroup across schools, we have found that all nine ESEA
subgroups are represented in that bottom 30% subgroup. What happened in schools is that
students in those subgroups who were previously hidden from accountability because they were in
subgroups that were too small to be detected, or because their performance as masked by higher-
achieving students in those same subgroups. Now, all of those students are picked up and combined
in the bottom 30% subgroup.
Overall Scorecard Compilation
MDE has been engaged in the past several years in a series of initiatives to increase the accessibility
of our data and reporting, to ensure that schools, parents, and other stakeholders can more easily
find and understand information about their school. These projects have included the creation of
more user-friendly “lookup” tools, increased resources on our website, and concerted efforts to
create tools that assist end users with understanding the data and metrics. Additionally, in
coordination with the Center for Educational Performance and Information (Michigan’s education
data agency), MDE has developed and rolled out a new data portal, MiSchoolData.
The MI School Data portal is a critical element that allows us to specify a theory of action that calls
for an accurate diagnosis of school challenges using data analysis and professional dialogue, as it
provides an extensive set of data for stakeholders to access. It includes information about
assessment trends, school demographics, graduation/dropout rates, staffing information and
educator effectiveness.
Building on these initiatives and the lessons learned from them, as well as on MDE’s desire to
leverage “light-of-day” reporting and transparency more efficiently to help communicate important
information about the performance of schools to the public, we will take the opportunity presented
by ESEA Flexibility to redesign our school report card, as described below.
The key elements of this new Accountability Scorecard will be:

87
Amended July 28, 2015
ESEA FLEXIBI LITY – REQ UEST U . S . D EPARTMEN T OF ED UC ATION
• Easy-to-understand color scheme (Red, Orange, Yellow, Lime Green, Dark Green, and
Purple) so that schools can see at a glance where their areas of strength, caution, and
weakness are, and target their efforts appropriately.
• Clear labels for Priority, Focus and Reward schools, helping stakeholders understand how
the two types of metrics fit together.
• The ability to click through and see more detailed information on any given subject or
subgroup, while at the same time retaining a simple, at-a-glance overview.
Determining the Colors
As indicated in section 2.A.i above, the MDE will continue to work with stakeholders, including the
Michigan Legislature, over the next year to align state and federal accountability systems and
determine the most meaningful scorecard indicators to use, including the steps necessary to
transition from colors to a new schema by the next high-stakes accountability cycle in 2017.
Colors will be determined for each school using the following set of business rules:
• The whole school will receive a Red, Orange, Yellow, Lime or Dark Green rating for each
subject. Each subgroup will receive a Red, Yellow, or Green rating for each subject. Each
group/subject Red rating means that a school did not meet the proficiency OR the safe
harbor improvement target. Yellow means the school met the safe harbor improvement
target only. Green means the school met the proficiency target (or that the bottom 30%
subgroup met the safe harbor target).
• Schools and LEAs that have no proficiency results due to having no full academic year (FAY)
students will receive an Accountability Scorecard with existing accountability results
(participation, compliance factors). These schools and LEAs will receive an overall Purple
rating in lieu of a Dark Green or Lime to denote the absence of proficiency results. Red,
Orange, and Yellow may also be earned if the school or LEA does not meet the participation
or reporting requirements.
• In order to recognize the challenges that all Michigan schools face with closing achievement
gaps, the bottom 30% subgroup’s proficiency outcomes will display colors and points in
individual cells based on whether the subgroup met its proficiency or safe harbor target,
however only the points will roll up to the building and LEA Scorecard. This will provide a
more meaningful statewide distribution of overall Scorecard statuses while still providing a
valuable diagnostic to schools. Schools and LEAs with individual Red cells in the Bottom 30%
subgroup will not earn higher than a Lime overall Scorecard status.
• If a school fails to assess at least 95% of their students overall or in a subgroup (with the
exception of the bottom 30% subgroup, as it is only defined once students have already
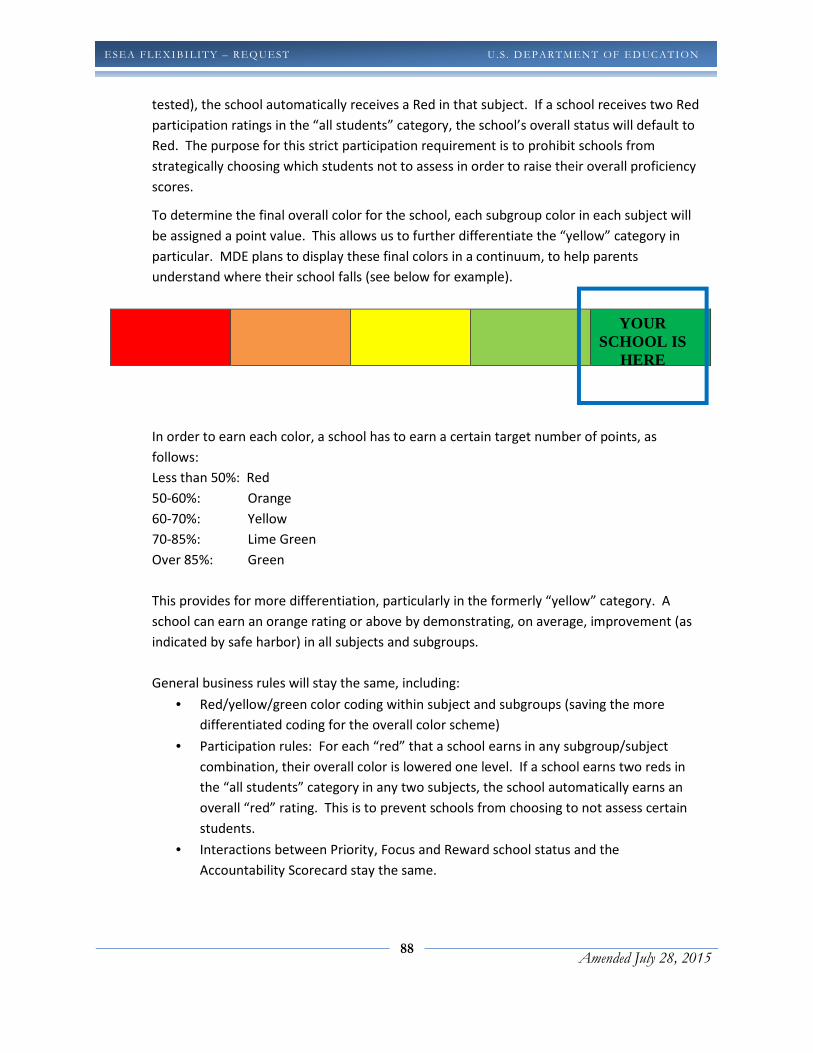
88
Amended July 28, 2015
ESEA FLEXIBI LITY – REQ UEST U . S . D EPARTMEN T OF ED UC ATION
tested), the school automatically receives a Red in that subject. If a school receives two Red
participation ratings in the “all students” category, the school’s overall status will default to
Red. The purpose for this strict participation requirement is to prohibit schools from
strategically choosing which students not to assess in order to raise their overall proficiency
scores.
To determine the final overall color for the school, each subgroup color in each subject will
be assigned a point value. This allows us to further differentiate the “yellow” category in
particular. MDE plans to display these final colors in a continuum, to help parents
understand where their school falls (see below for example).
In order to earn each color, a school has to earn a certain target number of points, as
follows:
Less than 50%: Red
50-60%: Orange
60-70%: Yellow
70-85%: Lime Green
Over 85%: Green
This provides for more differentiation, particularly in the formerly “yellow” category. A
school can earn an orange rating or above by demonstrating, on average, improvement (as
indicated by safe harbor) in all subjects and subgroups.
General business rules will stay the same, including:
• Red/yellow/green color coding within subject and subgroups (saving the more
differentiated coding for the overall color scheme)
• Participation rules: For each “red” that a school earns in any subgroup/subject
combination, their overall color is lowered one level. If a school earns two reds in
the “all students” category in any two subjects, the school automatically earns an
overall “red” rating. This is to prevent schools from choosing to not assess certain
students.
• Interactions between Priority, Focus and Reward school status and the
Accountability Scorecard stay the same.
YOUR
SCHOOL IS HERE

89
Amended July 28, 2015
ESEA FLEXIBI LITY – REQ UEST U . S . D EPARTMEN T OF ED UC ATION
As demonstrated below, Michigan will display and include graduation rates for all traditional
subgroups in the Accountability Scorecard. The Bottom 30% subgroup is based on academic status
and cannot be accurately included on the Accountability Scorecards. Michigan will comply with ED’s
State Report Card Guidance and include a simplified Bottom 30% subgroup cohort graduation rate
and disclaimer on the State and LEA report cards.
Four example Accountability Scorecards are presented below for example schools that achieved an
overall Green (Figure 34), an overall Orange (Figure 35) an overall Red (Figure 36) and an overall
Lime because of having one Red Bottom 30% subgroup cell (Figure 37).
Figure 34. Sample Accountability Scorecard for a school achieving an overall Green.
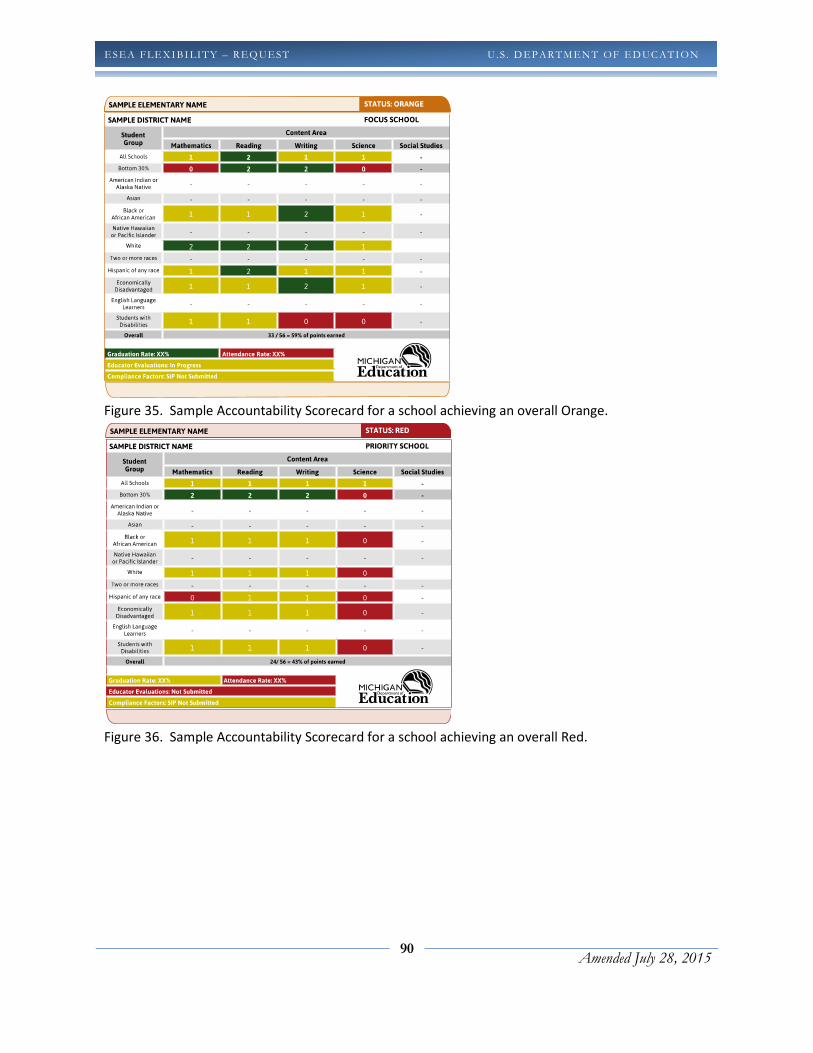
90
Amended July 28, 2015
ESEA FLEXIBI LITY – REQ UEST U . S . D EPARTMEN T OF ED UC ATION
Figure 35. Sample Accountability Scorecard for a school achieving an overall Orange.
Figure 36. Sample Accountability Scorecard for a school achieving an overall Red.
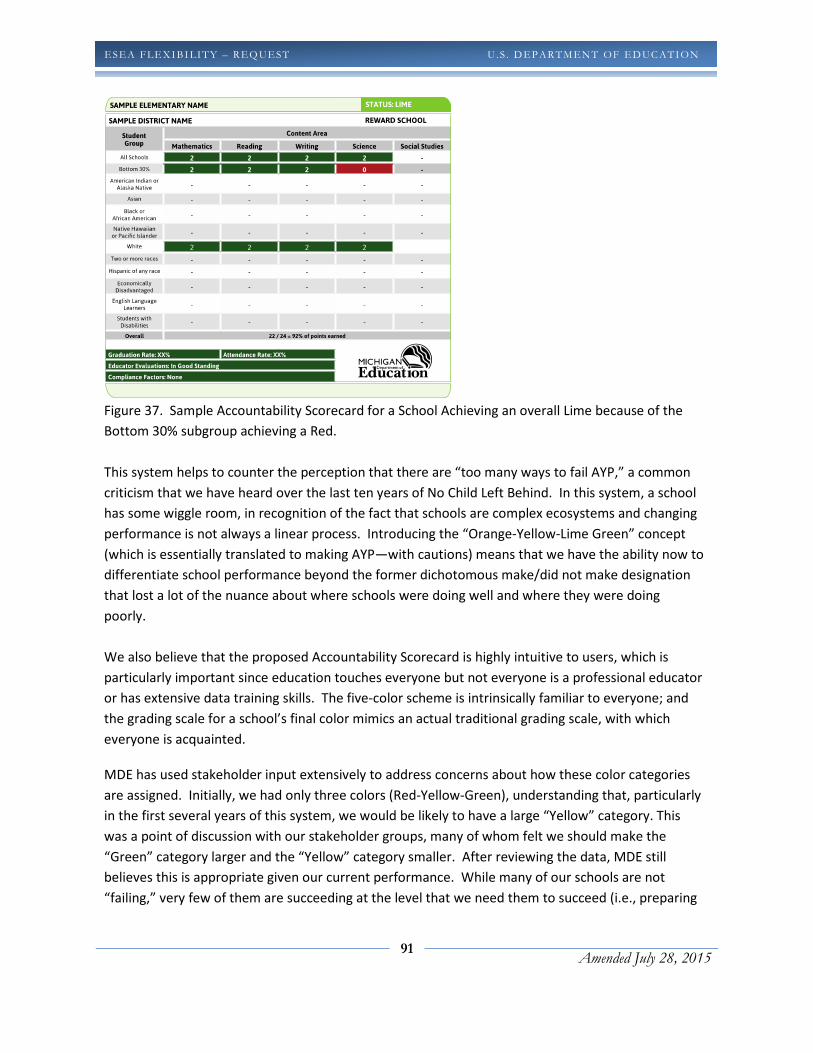
91
Amended July 28, 2015
ESEA FLEXIBI LITY – REQ UEST U . S . D EPARTMEN T OF ED UC ATION
Figure 37. Sample Accountability Scorecard for a School Achieving an overall Lime because of the
Bottom 30% subgroup achieving a Red.
This system helps to counter the perception that there are “too many ways to fail AYP,” a common
criticism that we have heard over the last ten years of No Child Left Behind. In this system, a school
has some wiggle room, in recognition of the fact that schools are complex ecosystems and changing
performance is not always a linear process. Introducing the “Orange-Yellow-Lime Green” concept
(which is essentially translated to making AYP—with cautions) means that we have the ability now to
differentiate school performance beyond the former dichotomous make/did not make designation
that lost a lot of the nuance about where schools were doing well and where they were doing
poorly.
We also believe that the proposed Accountability Scorecard is highly intuitive to users, which is
particularly important since education touches everyone but not everyone is a professional educator
or has extensive data training skills. The five-color scheme is intrinsically familiar to everyone; and
the grading scale for a school’s final color mimics an actual traditional grading scale, with which
everyone is acquainted.
MDE has used stakeholder input extensively to address concerns about how these color categories
are assigned. Initially, we had only three colors (Red-Yellow-Green), understanding that, particularly
in the first several years of this system, we would be likely to have a large “Yellow” category. This
was a point of discussion with our stakeholder groups, many of whom felt we should make the
“Green” category larger and the “Yellow” category smaller. After reviewing the data, MDE still
believes this is appropriate given our current performance. While many of our schools are not
“failing,” very few of them are succeeding at the level that we need them to succeed (i.e., preparing

92
Amended July 28, 2015
ESEA FLEXIBI LITY – REQ UEST U . S . D EPARTMEN T OF ED UC ATION
students for career and college), making Yellow (with its cautionary message) an appropriate color
for these schools. Yellow is also important in terms of being able to utilize the accountability data to
appropriately target supports for continuous improvement of all schools. When a school has an
overall Yellow rating, it becomes necessary to look at the colors within the subjects, and assess the
reasons for that Yellow rating.
However, following the submission of our initial ESEA flexibility request, we determined that we
could get more specific with stakeholders by breaking our three-color categories down still further.
We introduced two new colors, Orange and Lime, which allow for more clarity and detail about how
schools are performing. Thus, our former “Yellow” category is more nuanced and allows for a
clearer picture of school achievement over time.
The Red category will also serve as a warning system for schools with regard to their potential to
become a Priority school. The Red category will include more schools than the lowest 5% of schools.
This is appropriate, because although a school may not be in the lowest 5%, they may be close, and
the Red designation can be used to alert them to the fact that they are in a danger zone.
Importantly, the colors within subjects and subgroups can then help them to target their work more
efficiently so that they can increase achievement, close gaps, and improve subgroup performance
strategically where it is most needed.1011
Determining a Scorecard for LEAs
MDE will produce a scorecard (using the green/yellow/red color scheme described above) for each
LEA as well as each school. All calculations and factors will be the same, but results will be
aggregated to the district level. MDE plans to treat the district as one large school, so to speak,
rather than calculating a green, yellow or red status for each grade level within the
district.12 Treating the district as one unit will help with clarity of results, and will also push districts
to play an active role in the accountability and the supports. This means that subgroups will be
detected more quickly in the district now; the n-size of 30 students will only need to be reached
district-wide for that subgroup to appear on the Scorecard, as opposed to 30 in elementary, middle
and high school. This will be particularly helpful in terms of detecting and holding districts
accountable for the performance of their limited English proficient students. Only 71 of 200 districts
that have LEP students currently receive a district level AYP designation for their LEP subgroup,
because they do not have 30 students at each of the grade levels. This change will now hold more
districts accountable for these students.
10 For determining Accountability in small schools, MDE intends to continue to use its current small schools methodology for
AYP, which includes multi-year averaging, as well as a sliding confidence interval for making Accountability determinations.
11 MDE intends to continue to utilize current calculation practices for the Accountability Scorecard, such as including formerly
special education students and formerly limited English proficient students, multi-year averaging, indexing across grades, and
other technical details to calculate Accountability. 12 This change has been proposed in MDE's 2011-2012 Accountability Workbook and was implemented in 2011-12.
93
Amended July 28, 2015
ESEA FLEXIBI LITY – REQ UEST U . S . D EPARTMEN T OF ED UC ATION
Other Academic Indicators
MDE proposes to include the following elements in the Accountability Scorecard: graduation rate,
attendance, participation, educator evaluations and compliance with state law.
Graduation Rate
As is currently done in AYP, we propose to hold schools accountable for making the 80% graduation
rate target. If the school does not meet the target, it has an opportunity to make it on safe harbor,
which is defined (as previously) as the reduction of 25% of the gap between the current graduation
rate and the 80% target. If a school has the graduation rate of 80%, it will receive a “Green” for
graduation rate; if it makes the graduation rate improvement target, it will receive a “Yellow”; and if
it misses both the rate and the improvement target, they will receive a “Red.” A “Red” on this
indicator will function the same way as any other “Red”—a school cannot be “Green” if it has a
“Red.”
Although graduation rate is an important indicator, MDE feels that placing too much emphasis on
graduation incentivizes schools and districts to graduate students who are not proficient, and
therefore not considered career- and college-ready. Given the demands of MDE’s high school
curriculum, as well as the rigor of our new cut scores, MDE wants all students to be exposed to
rigorous content and to be held accountable for learning that content. If schools and districts are
not held accountable first and foremost for the extent to which students learn that content and
meet those expectations, then the opportunity for inappropriately graduating students is too great.
Keeping the weighting at 16% allows MDE to hold schools accountable for the graduation of their
students, but does not allow graduation to overwhelm the performance, improvement and
achievement gap measures, all of which MDE believes are central to our core mission of improving
the career and college readiness of all students in the state.
Attendance
In order to ensure that schools without a graduation rate have an additional indicator, we will
continue to use attendance rate for elementary/middle schools. This is either a “Green” (the school
met the target) or a “Red” (the school did not meet the target).
Participation
As mentioned previously, participation will be calculated in conjunction with each subject and
subgroup, and a school must assess 95% of students. One “Red” for participation keeps a school
from being “Green” overall; two “Reds” for participation in the “all students” category mean that a
school is automatically “Red” overall. This is to prevent schools from not assessing students,
particularly those low-performing students in subgroups.

94
Amended July 28, 2015
ESEA FLEXIBI LITY – REQ UEST U . S . D EPARTMEN T OF ED UC ATION
One common (and somewhat misleading) comment we received from stakeholders is that it’s too
easy for “one student” to cause a school to miss a participation target. This is only true in schools
with very small subgroups or numbers of students. In a school with 100 students, for example, 95%
participation is 95 out of 100 students, leaving five students who, if not assessed for some reason,
will not hurt the school. It is true that the 6th student to not be assessed would put the school over
their limit, but there are five other students who were not assessed first.
However, to account for the fact that a very small school or very small subgroup can be negatively
impacted by only one student, we propose that if more than 5% of the population OR two students,
whichever is greater, is not assessed, the school fails to meet its participation target. For example: if
a subgroup has 30 students in it, 5% of 30 students is 1.5 students. In this case, we would round up
and say that the school needs to assess 28 of 30 students in order to meet the target.
Educator Evaluations: Reporting Effectiveness Labels
In order to strengthen our ability to ensure compliance from districts in terms of implementing their
local evaluation systems (as well as the state evaluation system), we will give schools credit for
reporting 100% of their educator effectiveness labels and at least 95% of their students in the
Teacher Student Data Link (TSDL) collection. This will be either a “Green” or a “Red” indicator—
either the school reports 100% of its required labels and 95% of its students in the TSDL and receives
a Green, or it does not and receives a Red. Transparency with parents and other stakeholders is
critically important, and including this important measure of quality on the Accountability Scorecard
is a key element to that.
Compliance with State Law
Schools are required by state law to have a school improvement plan, and to complete School
Performance Indicator reports. These data are a necessary element of this systematic diagnosis of
the school, their strengths and weaknesses, and developing and monitoring a plan. Therefore, we
will give a school credit for submitting a school improvement plan and completing their School
Process Rubrics. These data are then used in schools for their data analysis discussions and for
targeting instruction and reforms.
Graduation Rate Proposal for MDE’s Accountability Scorecard
MDE proposes that we integrate graduation rate into the accountability scorecard in the following
manner:
• Treat graduation rate as an additional subject in the scorecard, giving it equal weighting with
the other four tested subjects. This means each subject will be 16.66% of the final score.
• Schools will receive two points for meeting the graduation rate target (80% graduation) in
each applicable subgroup as well as the all students group, one point for meeting the
improvement rate, and zero points for failing to meet either goal.
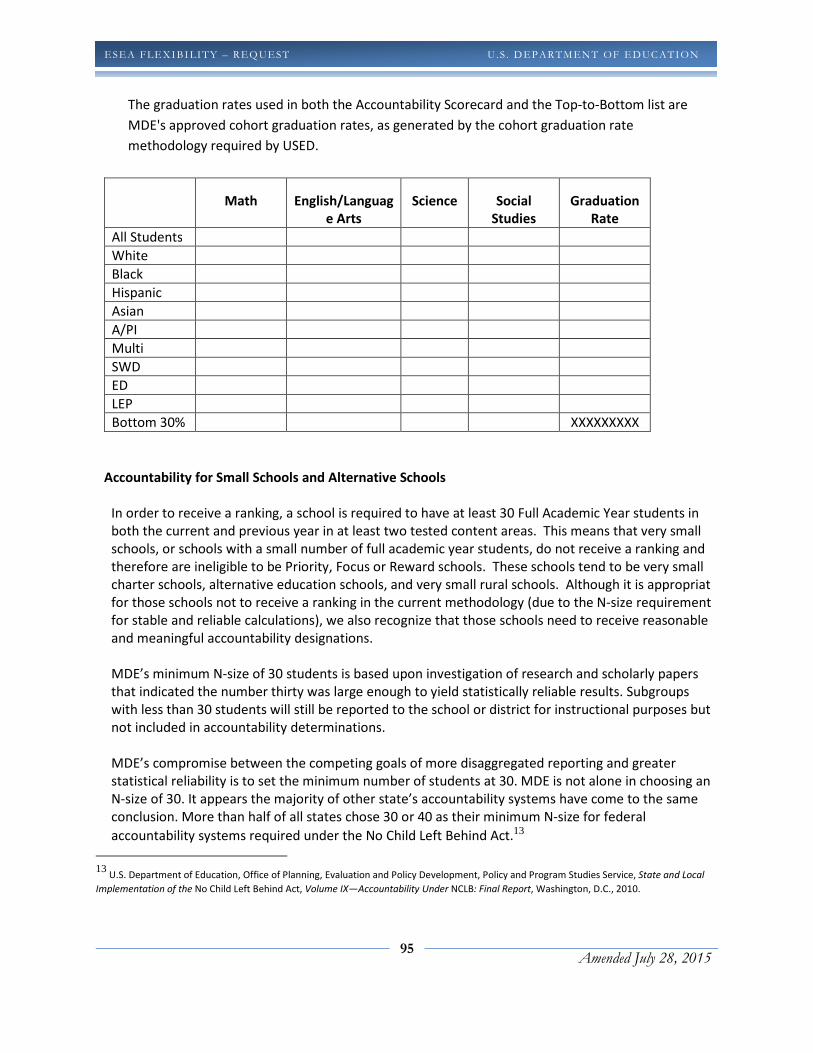
95
Amended July 28, 2015
ESEA FLEXIBI LITY – REQ UEST U . S . D EPARTMEN T OF ED UC ATION
The graduation rates used in both the Accountability Scorecard and the Top-to-Bottom list are
MDE's approved cohort graduation rates, as generated by the cohort graduation rate
methodology required by USED.
Math English/Languag
e Arts
Science Social
Studies
Graduation
Rate
All Students
White
Black
Hispanic
Asian
A/PI
Multi
SWD
ED
LEP
Bottom 30% XXXXXXXXX
Accountability for Small Schools and Alternative Schools
In order to receive a ranking, a school is required to have at least 30 Full Academic Year students in
both the current and previous year in at least two tested content areas. This means that very small
schools, or schools with a small number of full academic year students, do not receive a ranking and
therefore are ineligible to be Priority, Focus or Reward schools. These schools tend to be very small
charter schools, alternative education schools, and very small rural schools. Although it is appropriate
for those schools not to receive a ranking in the current methodology (due to the N-size requirements
for stable and reliable calculations), we also recognize that those schools need to receive reasonable
and meaningful accountability designations.
MDE’s minimum N-size of 30 students is based upon investigation of research and scholarly papers
that indicated the number thirty was large enough to yield statistically reliable results. Subgroups
with less than 30 students will still be reported to the school or district for instructional purposes but
not included in accountability determinations.
MDE’s compromise between the competing goals of more disaggregated reporting and greater
statistical reliability is to set the minimum number of students at 30. MDE is not alone in choosing an
N-size of 30. It appears the majority of other state’s accountability systems have come to the same
conclusion. More than half of all states chose 30 or 40 as their minimum N-size for federal
accountability systems required under the No Child Left Behind Act.13
13
U.S. Department of Education, Office of Planning, Evaluation and Policy Development, Policy and Program Studies Service, State and Local
Implementation of the No Child Left Behind Act, Volume IX—Accountability Under NCLB: Final Report, Washington, D.C., 2010.
96
Amended July 28, 2015
ESEA FLEXIBI LITY – REQ UEST U . S . D EPARTMEN T OF ED UC ATION
In the current Top-to-Bottom ranking, the minimum n-size means that rankings are not produced for
very small schools. However, small schools do receive a scorecard designation. Given the changes in
Michigan’s naming cycle, we propose continuing to produce Scorecard designations for small schools
and continuing to exclude them from the Top-to-Bottom ranking.
However, in terms of alternative schools (of any size), Michigan would like to join other states in
identifying an appropriate accountability system that is meaningful to alternative schools. This fits
with the ESEA Flexibility guiding principle of differentiated accountability and supports. To
accomplish this goal, Michigan proposes the following transition timeline:
Spring 2015: Re-convene stakeholder group; develop a data-based definition of alternative
school. We also hope to potentially work with our legislature regarding putting this definition in
statute.
Fall 2015-Spring 2016: Conduct an internal pilot and seek USED approval on the proposed system.
School Year 2016-2017: Pilot the system for all alternative schools meeting the agreed-upon
definition.
Center-based schools (i.e. those with 100% students with disabilities) are currently removed from our
Top-to-Bottom ranking, but still receive an annual Accountability Scorecard and will remain so under
state law. Alternative schools will not be exempted from the differentiated accountability system
until the fully functioning accountability system for alternative schools, as described above, is fully
functioning following a successful pilot.
Priority Schools
Schools at the bottom 5% of MDE’s Top-to-Bottom list will be identified as Priority schools. Pursuant
to Michigan law, all schools in this category are under the purview of the Michigan School
Reform/Redesign Office (SRO). Priority school supports and interventions, including Title I set-asides
and the Statewide System of Support are described in detail in section 2.D. Evidence of intervention
effectiveness and plan implementation for Priority schools is detailed in section 2.G.
Focus Schools
As stated, the 10% of schools with the largest achievement gaps in the state will be categorized and
treated for improvement as Focus schools. The achievement gap is calculated as the distance
between the average standardized scale score for the top 30% of students and the bottom 30% of
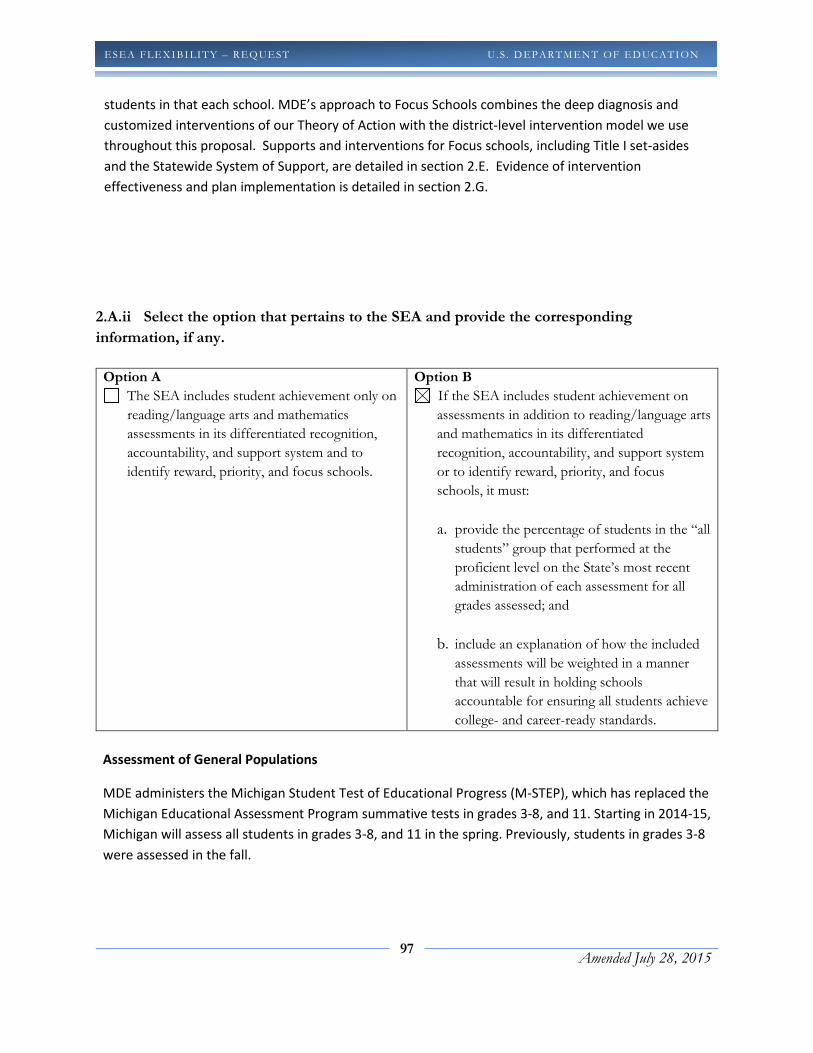
97
Amended July 28, 2015
ESEA FLEXIBI LITY – REQ UEST U . S . D EPARTMEN T OF ED UC ATION
students in that each school. MDE’s approach to Focus Schools combines the deep diagnosis and
customized interventions of our Theory of Action with the district-level intervention model we use
throughout this proposal. Supports and interventions for Focus schools, including Title I set-asides
and the Statewide System of Support, are detailed in section 2.E. Evidence of intervention
effectiveness and plan implementation is detailed in section 2.G.
2.A.ii Select the option that pertains to the SEA and provide the corresponding
information, if any.
Option A
The SEA includes student achievement only on
reading/language arts and mathematics
assessments in its differentiated recognition,
accountability, and support system and to
identify reward, priority, and focus schools.
Option B
If the SEA includes student achievement on
assessments in addition to reading/language arts
and mathematics in its differentiated
recognition, accountability, and support system
or to identify reward, priority, and focus
schools, it must:
a. provide the percentage of students in the “all
students” group that performed at the
proficient level on the State’s most recent
administration of each assessment for all
grades assessed; and
b. include an explanation of how the included
assessments will be weighted in a manner
that will result in holding schools
accountable for ensuring all students achieve
college- and career-ready standards.
Assessment of General Populations
MDE administers the Michigan Student Test of Educational Progress (M-STEP), which has replaced the
Michigan Educational Assessment Program summative tests in grades 3-8, and 11. Starting in 2014-15,
Michigan will assess all students in grades 3-8, and 11 in the spring. Previously, students in grades 3-8
were assessed in the fall.
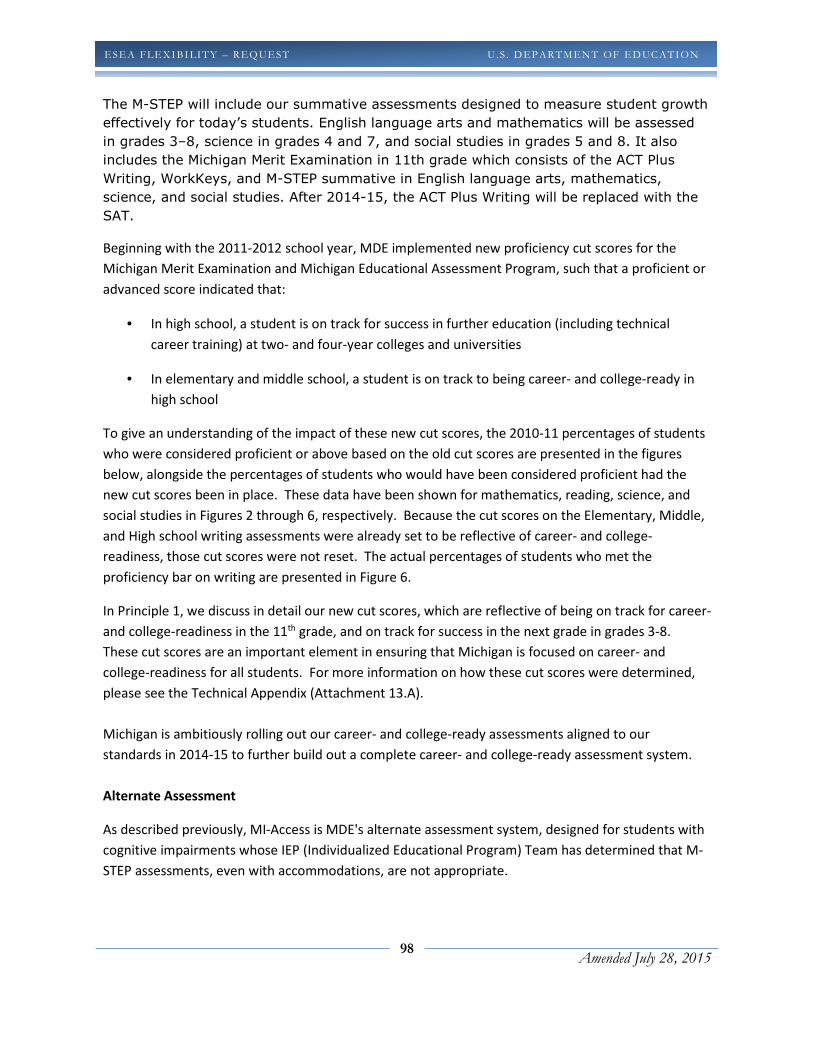
98
Amended July 28, 2015
ESEA FLEXIBI LITY – REQ UEST U . S . D EPARTMEN T OF ED UC ATION
The M-STEP will include our summative assessments designed to measure student growth
effectively for today’s students. English language arts and mathematics will be assessed
in grades 3–8, science in grades 4 and 7, and social studies in grades 5 and 8. It also
includes the Michigan Merit Examination in 11th grade which consists of the ACT Plus
Writing, WorkKeys, and M-STEP summative in English language arts, mathematics,
science, and social studies. After 2014-15, the ACT Plus Writing will be replaced with the
SAT.
Beginning with the 2011-2012 school year, MDE implemented new proficiency cut scores for the
Michigan Merit Examination and Michigan Educational Assessment Program, such that a proficient or
advanced score indicated that:
• In high school, a student is on track for success in further education (including technical
career training) at two- and four-year colleges and universities
• In elementary and middle school, a student is on track to being career- and college-ready in
high school
To give an understanding of the impact of these new cut scores, the 2010-11 percentages of students
who were considered proficient or above based on the old cut scores are presented in the figures
below, alongside the percentages of students who would have been considered proficient had the
new cut scores been in place. These data have been shown for mathematics, reading, science, and
social studies in Figures 2 through 6, respectively. Because the cut scores on the Elementary, Middle,
and High school writing assessments were already set to be reflective of career- and college-
readiness, those cut scores were not reset. The actual percentages of students who met the
proficiency bar on writing are presented in Figure 6.
In Principle 1, we discuss in detail our new cut scores, which are reflective of being on track for career-
and college-readiness in the 11th grade, and on track for success in the next grade in grades 3-8.
These cut scores are an important element in ensuring that Michigan is focused on career- and
college-readiness for all students. For more information on how these cut scores were determined,
please see the Technical Appendix (Attachment 13.A).
Michigan is ambitiously rolling out our career- and college-ready assessments aligned to our
standards in 2014-15 to further build out a complete career- and college-ready assessment system.
Alternate Assessment
As described previously, MI-Access is MDE's alternate assessment system, designed for students with
cognitive impairments whose IEP (Individualized Educational Program) Team has determined that M-
STEP assessments, even with accommodations, are not appropriate.

99
Amended July 28, 2015
ESEA FLEXIBI LITY – REQ UEST U . S . D EPARTMEN T OF ED UC ATION
MDE has three levels of alternate assessment for students with differing levels of significant cognitive
disabilities. These are Functional Independence (for students with mild but significant cognitive
disabilities), Supported Independence (for students with moderate cognitive disabilities), and
Participation (for students with severe cognitive disabilities). The percentages of students scoring at
the attained or surpassed level are presented below in Figures 24 through 26 for mathematics,
accessing print (a combination of reading and writing), and science, respectively.
Figure 19. Statewide proficiency on MI-Access mathematics.
67 67
5558
52 5357
8883 85 86 84
88 86
75
83
72
80
71
79
69
0
10
20
30
40
50
60
70
80
90
100
3 4 5 6 7 8 11Pe
rce
nt
Me
eti
ng
Pro
fici
en
cy T
arg
ets
Grade
Participation
Supported Independence
Functional Independence
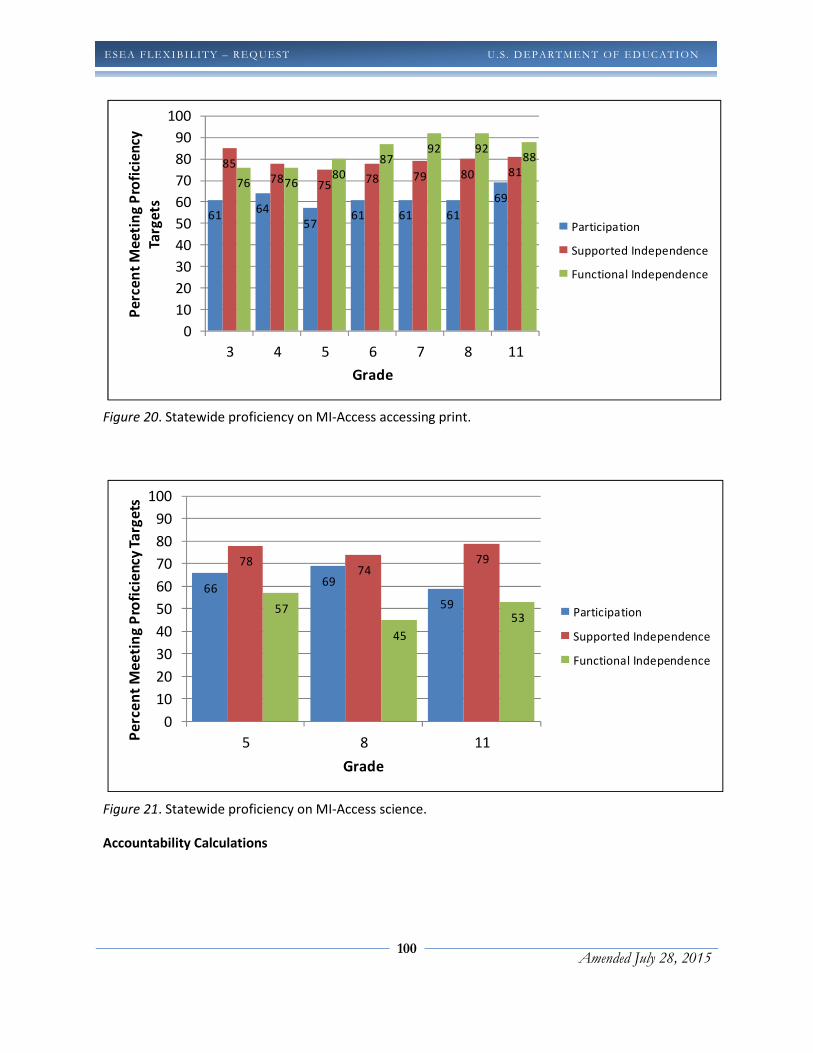
100
Amended July 28, 2015
ESEA FLEXIBI LITY – REQ UEST U . S . D EPARTMEN T OF ED UC ATION
Figure 20. Statewide proficiency on MI-Access accessing print.
Figure 21. Statewide proficiency on MI-Access science.
Accountability Calculations
6164
5761 61 61
69
85
7875
78 79 80 8176 76
80
8792 92
88
0
10
20
30
40
50
60
70
80
90
100
3 4 5 6 7 8 11
Pe
rce
nt
Me
eti
ng
Pro
fici
en
cy
Targ
ets
Grade
Participation
Supported Independence
Functional Independence
6669
59
7874
79
57
45
53
0
10
20
30
40
50
60
70
80
90
100
5 8 11Pe
rce
nt
Me
eti
ng
Pro
fici
en
cy T
arg
ets
Grade
Participation
Supported Independence
Functional Independence

101
Amended July 28, 2015
ESEA FLEXIBI LITY – REQ UEST U . S . D EPARTMEN T OF ED UC ATION
We welcome the opportunity to broaden our focus on student achievement by including all four
tested content areas (mathematics, reading, writing, science and social studies) into both the ranking
calculations as well as the Accountability Scorecard calculations.
Ranking Calculations
Based on the original rules for identifying persistently low achieving schools for federal School
Improvement (SIG) Grants, MDE has developed a Top-to-Bottom ranking methodology. This Top-to-
Bottom list is the baseline list from which Priority and Reward schools will be generated.
This Top-to-Bottom ranking methodology includes all four tested subjects, with each subject weighted
by the number of test scores. This allows schools to be held accountable for the greatest number of
students assessed. In previous iterations of our Top-to-Bottom ranking, a K-5 school would be held
accountable on math, reading, and science equally, even though science was only assessed in one
grade while math and reading were assessed in three grades.
Accountability Scorecard
As described in section 2.A.i above, the MDE will continue to work with stakeholders, including the
Michigan Legislature, over the next year to align state and federal accountability systems and
determine the most meaningful scorecard indicators to use, including the steps necessary to transition
from colors to a new schema by the next high-stakes accountability cycle in 2017.
Currently, MDE uses only reading/language arts and mathematics. Commensurate with our focus on
all five subjects, we propose that we include writing, science and social studies beginning in the 2012-
2013 school year in the Accountability Scorecard. We will establish AMOs for each grade and subject
area.
Starting in 2014-15, MDE is combining writing and reading into ELA. Accountability systems will shift
from using five subjects, to four: math, ELA, science, and social studies.
In addition, the 95% participation requirement will be extended to all tested subjects. The
importance of continuing to ensure full participation in statewide assessments was something that
MDE very carefully considered in our original proposal and discussed extensively with stakeholder
groups. This is why MDE proposes a model where failing to meet participation targets can
automatically turn a school’s scorecard color to Red. It actually prevents schools from being allowed
to compensate for low participation with higher achievement. If a school fails to test at least 95% of
their students in one subject/subgroup combination, their overall color is lowered one level. If they
fail to do in in two subject/subgroup combinations, their overall color is lowered two levels; 3
subgroup/subject combinations, lowered 3 levels, and so forth. If a school fails to assess at least 95%
102
Amended July 28, 2015
ESEA FLEXIBI LITY – REQ UEST U . S . D EPARTMEN T OF ED UC ATION
of their students in the “all students” category in two subjects, they are automatically designated as a
Red school, regardless of proficiency or other performance data.
Participation Rate Clarification and Proposal
Clarification: In the Accountability Scorecard, if a school fails to assess at least 95% of their students
in any subject/subgroup combination, they are automatically considered red for that
subgroup/subject combination. If a school fails to assess at least 95% of students in two or more
subjects in the “all students” category, they are automatically considered red overall.
Addition: To prevent schools from choosing to be “red” for participation by avoiding the assessment
of low-performing students, MDE proposes to add an additional check. If a school receives a “red” for
participation for one school year, they will be placed on a participation “watch list” and will receive
notification from MDE that they are not compliant with state and federal law regarding participation
in state assessments, and that there are consequences for this lack of compliance. If they are “red”
for participation for two consecutive years (or for three years out of five years), they are automatically
named an “Assessment Participation Non-compliant School” and will be subject to supports and
interventions dependent on the severity, duration, and type of low participation. MDE offices
consisting of the Office of Field Services (OFS), Office of Education Improvement and Innovation
(OEII), Office of Evaluation, Strategic Research, and Accountability (OESRA), School Reform Office
(SRO), and the Center for Educational Performance and Information (CEPI) within the Department of
Technology, Management, and Budget (DTMB) will collaborate to identify, analyze, and report on
low-participation schools, and implement effective and meaningful supports and interventions.
Sections 2.F. details the levels of supports and interventions.
The 95% participation data will be for reporting only in the 2011-2012 accountability cycle in writing,
science and social studies, and will then be used in the final Accountability Scorecard and other
accountability determinations beginning in 2012-2013. This is due to the fact that this will be a new
requirement for schools, and fair accountability practices suggest that schools should be notified of
high-stakes requirements prior to their implementation.
Fair practice also drives our approach to the aggregation of student data. Any integration of student
growth data into a school or district average requires averaging growth from all students, producing
some aggregate measure. The key to producing a useful average is to appropriately weight the
different types of student growth in such a way that policy goals are incentivized. MDE feels that our
weighted performance level change (PLC) actually reduces the chance that low-growth can be masked
by high-growth, by awarding negative points for declines in student performance, and by awarding
zero points for students who maintain their proficiency level grade over grade if those students were
previously not proficient. In this way, only desirable growth receives positive point values, and the
school average can be evaluated to see if the majority of students are achieving desirable growth.
Because the weighted PLC is used in a ranking, each school’s weighted PLC is compared to all other
schools’ weighted PLC. All other things equal, schools with more low growth students will have lower
weighted PLC indices, which will produce lower overall rankings.
103
Amended July 28, 2015
ESEA FLEXIBI LITY – REQ UEST U . S . D EPARTMEN T OF ED UC ATION
Starting in 2014-15, MDE will be calculating student growth percentiles (SGPs) for all assessed
students. MDE will continue to count non-proficient students demonstrating adequate growth as
growth proficient on the diagnostic Accountability Scorecard using individual SGPs. When MDE has
enough data to calculate adequate growth percentiles (AGPs), MDE will calibrate the Accountability
Scorecards to use AGPs. MDE will use SGPs to calculate a building-level mean SGP for use in its Top-
to-Bottom ranking improvement measure.
MDE will continue to include science and social studies in the state’s system of differentiated
recognition, accountability, and support as it has in the past two years, with exception to the Focus
metric, which will only include mathematics and ELA in order to drive greater impact with supports
and interventions-. In order to ensure that all students have the opportunity to be appropriately
included in this system, the state is developing an Alternate Assessment based on Alternate
Achievement Standards (AA-AAS) for social studies. MDE already has AA-AAS assessments in
reading/language arts, mathematics and science that have received full approval by the USED as
meeting all ESEA requirements. The state will develop an AA-AAS assessment in social studies that
contains the same level of technical adequacy, stakeholder involvement, and content alignment as its
alternate assessments in the other content areas. This will ensure access for students with significant
cognitive impairment to MDE’s assessment continuum and enable schools and teachers to calculate
valid and reliable individual student growth in a consistent manner for all content areas.
Currently, MDE has social studies assessment results on approximately 350,000 students, obtained
from our MEAP and MME assessments, including the vast majority of our students with disabilities.
Nearly 40,000 of Michigan’s students with disabilities participate in the general assessment with
accommodations. We only lack data from approximately 9,000 students who take the MI-Access
alternate assessment in other subject areas but are not assessed in social studies on a state-delivered
assessment. MDE feels it is in the best interest of students and schools to use currently available
social studies assessment results while we are implementing our plan to develop and implement an
alternate assessment in social studies.
MDE’s plan to develop an alternate assessment in social studies allows us to have a functional
assessment available by 2013-2014. In the interim two years (2011-2012 and 2012-2013), MDE has
begun requiring districts and schools to indicate whether or not students who take the MI-Access
assessment in other subjects have participated in a locally administered social studies
assessment. These students will be part of the 95% participation requirement in the accountability
system starting in the 2012-2013 school year. Prior to that, this information on student participation
in a locally administered social studies alternate assessment will be collected and reported in the
2011-2012 school year (but only for informational purposes in order to give the field appropriate time
to adjust). Districts and schools are also asked to provide information on what type of assessment the
district gave to the student. MDE will enhance their compliance monitoring in the 2011-2012 and

104
Amended July 28, 2015
ESEA FLEXIBI LITY – REQ UEST U . S . D EPARTMEN T OF ED UC ATION
2012-2013 school years and will audit a sample of districts that reported student participation in
alternate social studies assessment. The state will review local documentation, the information
provided to the state and ensure an assessment was administered. MDE will publicize these
enhanced monitoring plans widely, so that even those schools who are not selected are aware of the
potential for this monitoring.
Table 8: Michigan AA-AAS Social Studies Development Plan
Date Task/Event Status
October-
November 2011
Gather information from the 13 states that have developed an
alternate assessment in social studies.
Completed
December 2011 Develop preliminary budget and high-level scope of work Completed
January 2012 Gather Department resources in preparation for developing
extended social studies content standards
In Progress
February 2012 Submit AA-AAS social studies plan to USED as part of ESEA flexibility
request
In Progress
March 2012 Convene standing Students with Disabilities (SWD) advisory
committee to determine resources and stakeholder involvement
opportunities
Specific
Date/Location TBD
March 2012 Revise plan if necessary based on feedback from USED TBD
April 2012 Finalize budget and scope of work TBD
May-June 2012 Develop fully articulated project schedule TBD
July –September
2012
Department staff draft extended social studies standards TBD
October-
December 2012
Stakeholder review and finalization of extended social studies
standards
TBD
January-February
2013
Finalize test design and item development requirements TBD
Spring 2013 AA-AAS social studies item writing and stakeholder review TBD
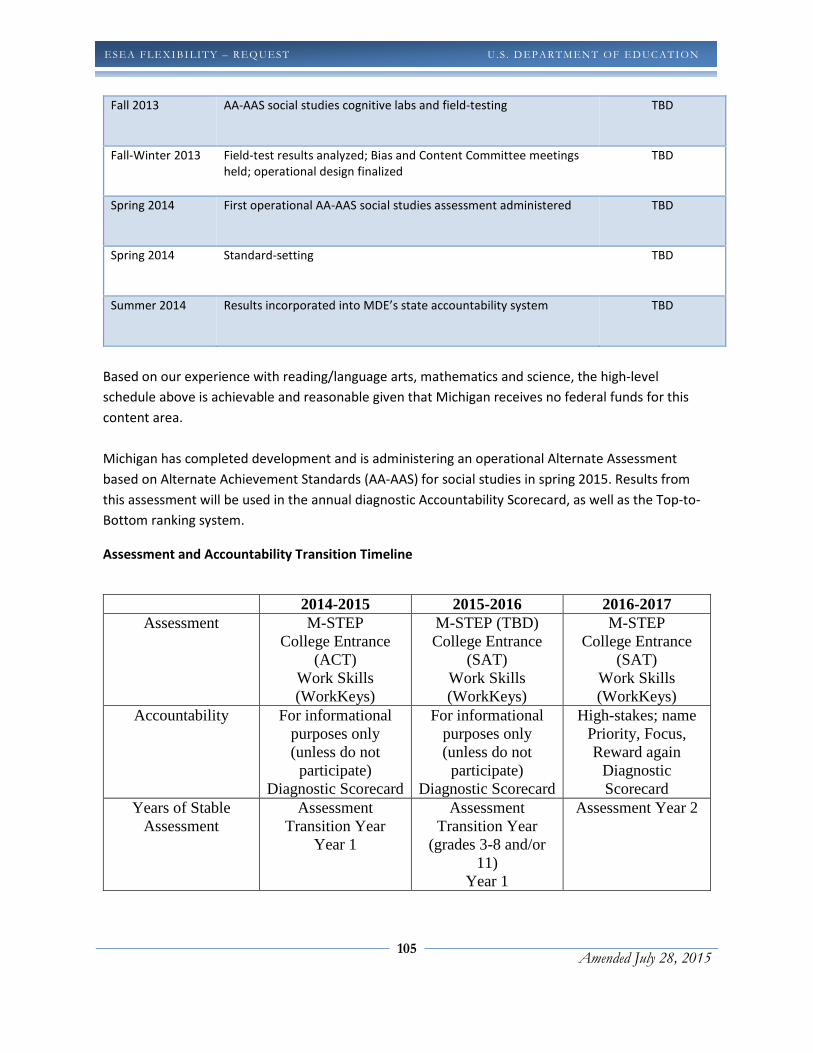
105
Amended July 28, 2015
ESEA FLEXIBI LITY – REQ UEST U . S . D EPARTMEN T OF ED UC ATION
Fall 2013 AA-AAS social studies cognitive labs and field-testing TBD
Fall-Winter 2013 Field-test results analyzed; Bias and Content Committee meetings
held; operational design finalized
TBD
Spring 2014 First operational AA-AAS social studies assessment administered TBD
Spring 2014 Standard-setting TBD
Summer 2014 Results incorporated into MDE’s state accountability system TBD
Based on our experience with reading/language arts, mathematics and science, the high-level
schedule above is achievable and reasonable given that Michigan receives no federal funds for this
content area.
Michigan has completed development and is administering an operational Alternate Assessment
based on Alternate Achievement Standards (AA-AAS) for social studies in spring 2015. Results from
this assessment will be used in the annual diagnostic Accountability Scorecard, as well as the Top-to-
Bottom ranking system.
Assessment and Accountability Transition Timeline
2014-2015 2015-2016 2016-2017 Assessment M-STEP
College Entrance (ACT)
Work Skills (WorkKeys)
M-STEP (TBD) College Entrance
(SAT) Work Skills (WorkKeys)
M-STEP College Entrance
(SAT) Work Skills (WorkKeys)
Accountability For informational purposes only (unless do not participate)
Diagnostic Scorecard
For informational purposes only (unless do not participate)
Diagnostic Scorecard
High-stakes; name Priority, Focus, Reward again
Diagnostic Scorecard
Years of Stable Assessment
Assessment Transition Year
Year 1
Assessment Transition Year
(grades 3-8 and/or 11)
Year 1
Assessment Year 2
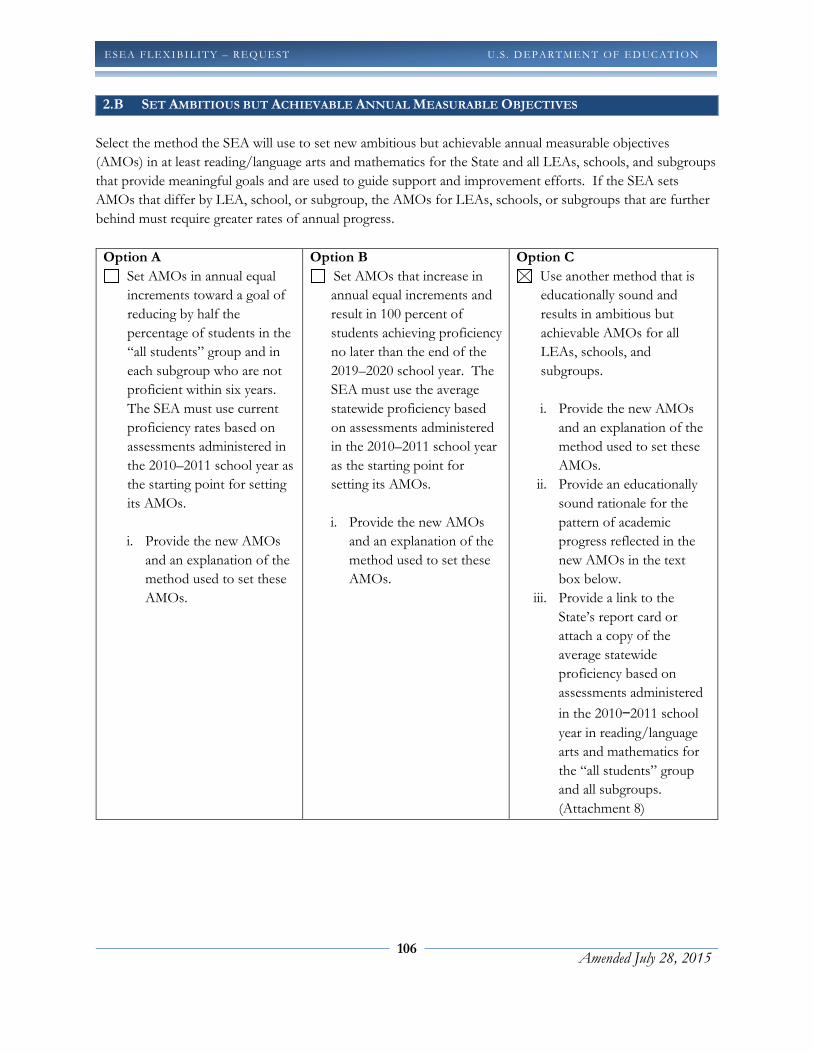
106
Amended July 28, 2015
ESEA FLEXIBI LITY – REQ UEST U . S . D EPARTMEN T OF ED UC ATION
2.B SET AMBITIOUS BUT ACHIEVABLE ANNUAL MEASURABLE OBJECTIVES
Select the method the SEA will use to set new ambitious but achievable annual measurable objectives
(AMOs) in at least reading/language arts and mathematics for the State and all LEAs, schools, and subgroups
that provide meaningful goals and are used to guide support and improvement efforts. If the SEA sets
AMOs that differ by LEA, school, or subgroup, the AMOs for LEAs, schools, or subgroups that are further
behind must require greater rates of annual progress.
Option A
Set AMOs in annual equal
increments toward a goal of
reducing by half the
percentage of students in the
“all students” group and in
each subgroup who are not
proficient within six years.
The SEA must use current
proficiency rates based on
assessments administered in
the 2010–2011 school year as
the starting point for setting
its AMOs.
i. Provide the new AMOs
and an explanation of the
method used to set these
AMOs.
Option B
Set AMOs that increase in
annual equal increments and
result in 100 percent of
students achieving proficiency
no later than the end of the
2019–2020 school year. The
SEA must use the average
statewide proficiency based
on assessments administered
in the 2010–2011 school year
as the starting point for
setting its AMOs.
i. Provide the new AMOs
and an explanation of the
method used to set these
AMOs.
Option C
Use another method that is
educationally sound and
results in ambitious but
achievable AMOs for all
LEAs, schools, and
subgroups.
i. Provide the new AMOs
and an explanation of the
method used to set these
AMOs.
ii. Provide an educationally
sound rationale for the
pattern of academic
progress reflected in the
new AMOs in the text
box below.
iii. Provide a link to the
State’s report card or
attach a copy of the
average statewide
proficiency based on
assessments administered
in the 2010−2011 school
year in reading/language
arts and mathematics for
the “all students” group
and all subgroups.
(Attachment 8)
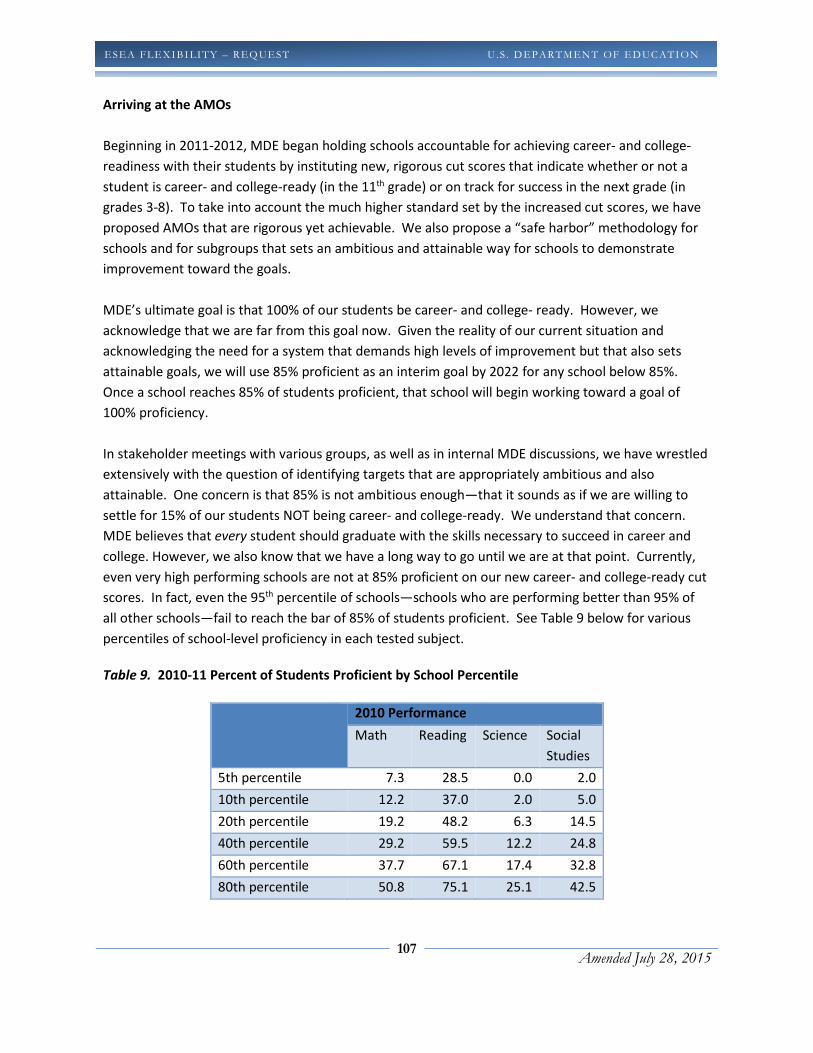
107
Amended July 28, 2015
ESEA FLEXIBI LITY – REQ UEST U . S . D EPARTMEN T OF ED UC ATION
Arriving at the AMOs
Beginning in 2011-2012, MDE began holding schools accountable for achieving career- and college-
readiness with their students by instituting new, rigorous cut scores that indicate whether or not a
student is career- and college-ready (in the 11th grade) or on track for success in the next grade (in
grades 3-8). To take into account the much higher standard set by the increased cut scores, we have
proposed AMOs that are rigorous yet achievable. We also propose a “safe harbor” methodology for
schools and for subgroups that sets an ambitious and attainable way for schools to demonstrate
improvement toward the goals.
MDE’s ultimate goal is that 100% of our students be career- and college- ready. However, we
acknowledge that we are far from this goal now. Given the reality of our current situation and
acknowledging the need for a system that demands high levels of improvement but that also sets
attainable goals, we will use 85% proficient as an interim goal by 2022 for any school below 85%.
Once a school reaches 85% of students proficient, that school will begin working toward a goal of
100% proficiency.
In stakeholder meetings with various groups, as well as in internal MDE discussions, we have wrestled
extensively with the question of identifying targets that are appropriately ambitious and also
attainable. One concern is that 85% is not ambitious enough—that it sounds as if we are willing to
settle for 15% of our students NOT being career- and college-ready. We understand that concern.
MDE believes that every student should graduate with the skills necessary to succeed in career and
college. However, we also know that we have a long way to go until we are at that point. Currently,
even very high performing schools are not at 85% proficient on our new career- and college-ready cut
scores. In fact, even the 95th percentile of schools—schools who are performing better than 95% of
all other schools—fail to reach the bar of 85% of students proficient. See Table 9 below for various
percentiles of school-level proficiency in each tested subject.
Table 9. 2010-11 Percent of Students Proficient by School Percentile
2010 Performance
Math Reading Science Social
Studies
5th percentile 7.3 28.5 0.0 2.0
10th percentile 12.2 37.0 2.0 5.0
20th percentile 19.2 48.2 6.3 14.5
40th percentile 29.2 59.5 12.2 24.8
60th percentile 37.7 67.1 17.4 32.8
80th percentile 50.8 75.1 25.1 42.5
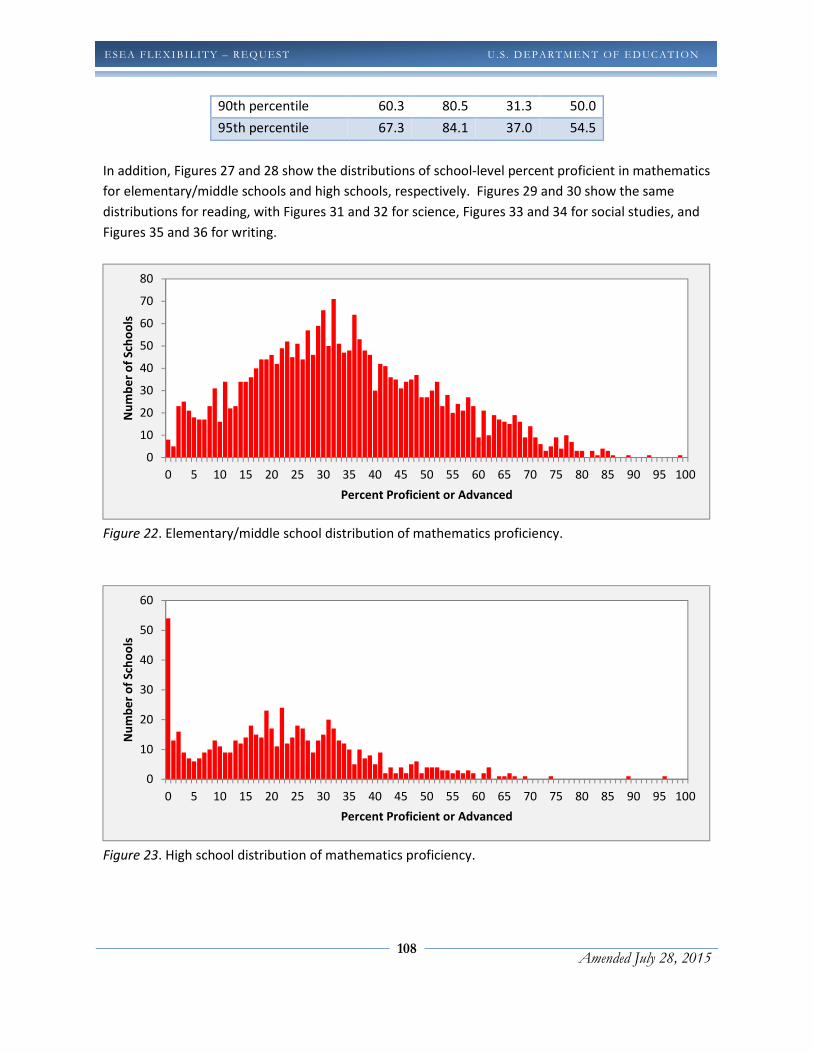
108
Amended July 28, 2015
ESEA FLEXIBI LITY – REQ UEST U . S . D EPARTMEN T OF ED UC ATION
90th percentile 60.3 80.5 31.3 50.0
95th percentile 67.3 84.1 37.0 54.5
In addition, Figures 27 and 28 show the distributions of school-level percent proficient in mathematics
for elementary/middle schools and high schools, respectively. Figures 29 and 30 show the same
distributions for reading, with Figures 31 and 32 for science, Figures 33 and 34 for social studies, and
Figures 35 and 36 for writing.
Figure 22. Elementary/middle school distribution of mathematics proficiency.
Figure 23. High school distribution of mathematics proficiency.
0
10
20
30
40
50
60
70
80
0 5 10 15 20 25 30 35 40 45 50 55 60 65 70 75 80 85 90 95 100
Nu
mb
er
of
Sch
oo
ls
Percent Proficient or Advanced
0
10
20
30
40
50
60
0 5 10 15 20 25 30 35 40 45 50 55 60 65 70 75 80 85 90 95 100
Nu
mb
er
of
Sch
oo
ls
Percent Proficient or Advanced
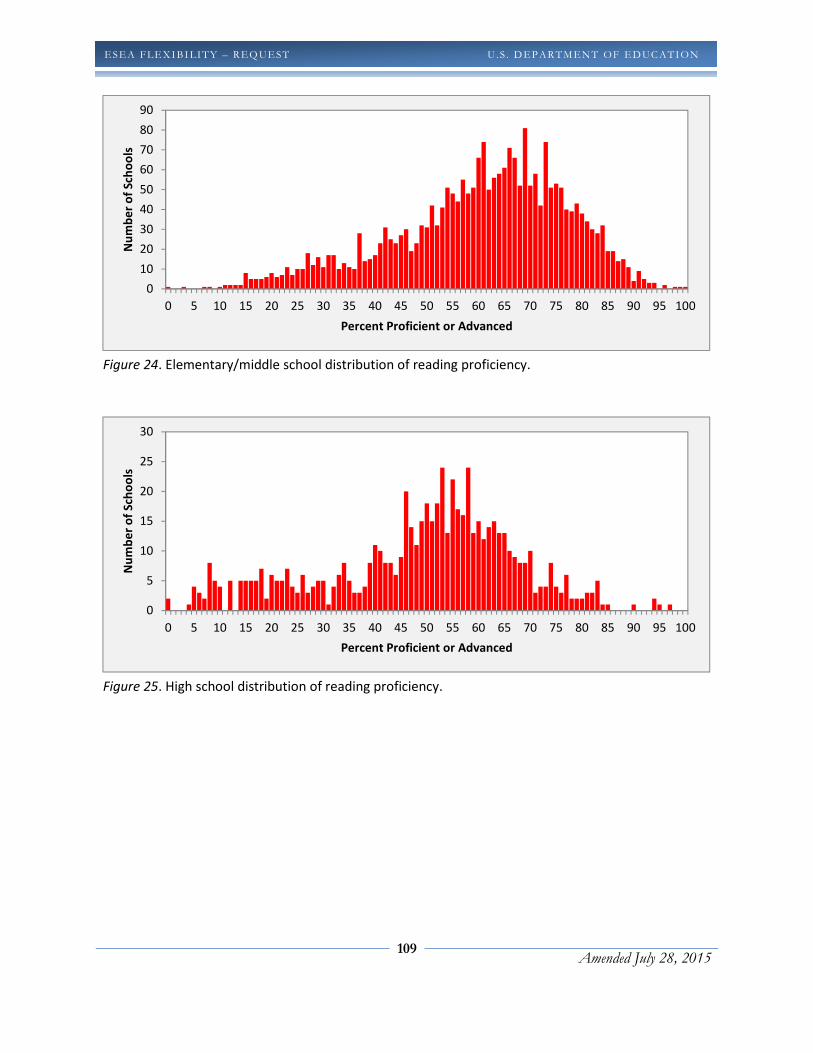
109
Amended July 28, 2015
ESEA FLEXIBI LITY – REQ UEST U . S . D EPARTMEN T OF ED UC ATION
Figure 24. Elementary/middle school distribution of reading proficiency.
Figure 25. High school distribution of reading proficiency.
0
10
20
30
40
50
60
70
80
90
0 5 10 15 20 25 30 35 40 45 50 55 60 65 70 75 80 85 90 95 100
Nu
mb
er
of
Sch
oo
ls
Percent Proficient or Advanced
0
5
10
15
20
25
30
0 5 10 15 20 25 30 35 40 45 50 55 60 65 70 75 80 85 90 95 100
Nu
mb
er
of
Sch
oo
ls
Percent Proficient or Advanced

110
Amended July 28, 2015
ESEA FLEXIBI LITY – REQ UEST U . S . D EPARTMEN T OF ED UC ATION
Figure 26. Elementary/middle school distribution of science proficiency.
Figure 27. High school distribution of science proficiency.
0
20
40
60
80
100
120
140
160
0 5 10 15 20 25 30 35 40 45 50 55 60 65 70 75 80 85 90 95 100
Nu
mb
er
of
Sch
oo
ls
Percent Proficient or Advanced
0
10
20
30
40
50
60
0 5 10 15 20 25 30 35 40 45 50 55 60 65 70 75 80 85 90 95 100
Nu
mb
er
of
Sch
oo
ls
Percent Proficient or Advanced
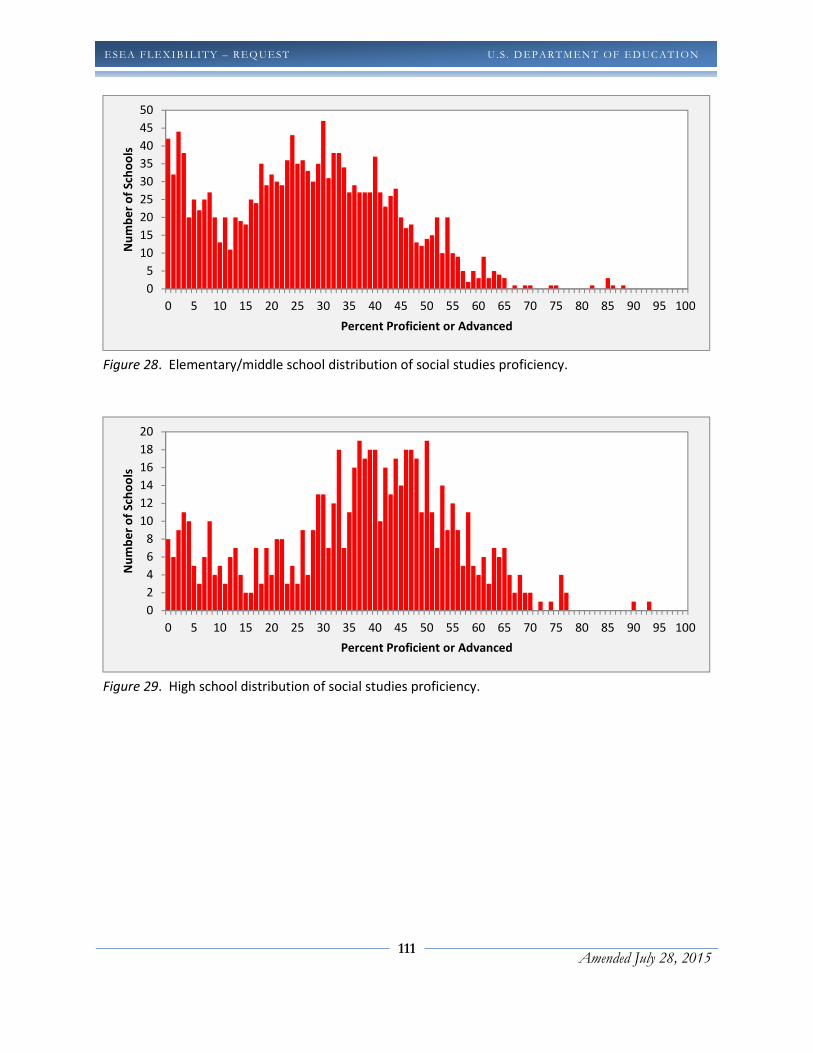
111
Amended July 28, 2015
ESEA FLEXIBI LITY – REQ UEST U . S . D EPARTMEN T OF ED UC ATION
Figure 28. Elementary/middle school distribution of social studies proficiency.
Figure 29. High school distribution of social studies proficiency.
0
5
10
15
20
25
30
35
40
45
50
0 5 10 15 20 25 30 35 40 45 50 55 60 65 70 75 80 85 90 95 100
Nu
mb
er
of
Sch
oo
ls
Percent Proficient or Advanced
0
2
4
6
8
10
12
14
16
18
20
0 5 10 15 20 25 30 35 40 45 50 55 60 65 70 75 80 85 90 95 100
Nu
mb
er
of
Sch
oo
ls
Percent Proficient or Advanced

112
Amended July 28, 2015
ESEA FLEXIBI LITY – REQ UEST U . S . D EPARTMEN T OF ED UC ATION
Figure 30. Elementary/middle school distribution of writing proficiency.
Figure 31. High school distribution of writing proficiency.
Looking at these numbers, we can see the goal of achieving 85% proficiency on the new career-and
college-ready cut scores is highly ambitious. Getting all Michigan schools to a point where 85% of
their students are considered proficient on our new cut scores will represent a significant
achievement and a fundamental shift in how we prepare students for the world beyond K-12
education. We believe we will get there. But we also believe 85% represents the appropriate interim
goal, with 100% still our ultimate goal.
It is important to keep in mind that, for schools to achieve 85% proficiency on our new and very
rigorous cut scores, many schools will have to improve the percent of students who are proficient by
0
10
20
30
40
50
60
0 5 10 15 20 25 30 35 40 45 50 55 60 65 70 75 80 85 90 95 100
Nu
mb
er
of
Sch
oo
ls
Percent Proficient or Advanced
0
5
10
15
20
25
0 5 10 15 20 25 30 35 40 45 50 55 60 65 70 75 80 85 90 95 100
Nu
mb
er
of
Sch
oo
ls
Percent Proficient or Advanced

113
Amended July 28, 2015
ESEA FLEXIBI LITY – REQ UEST U . S . D EPARTMEN T OF ED UC ATION
five, six, seven or even eight percent each year. These rates of improvement are extremely
aggressive.
Indeed, concerns have been raised that our AMOs are too ambitious. For schools to meet these
targets, they will be required to improve the percent of students who are proficient at a rate that has
rarely been demonstrated in the past four years. MDE spent substantial time considering the
possibility of lower proficiency targets, to make them more attainable. After much discussion, we
return to our theory of action—that we believe that the systematic and targeted use of data,
accountability and related supports, coupled with increased expectations for all students, teachers,
administrators, and the SEA, will lead to a fundamental change in student achievement and school
improvement. This is taken in combination with the fact that we have not seen how schools will
behave when shooting for the higher bar of the new cut scores as compared to their behavior in
shooting for the previously lower cut scores. Taken together, we feel it is reasonable to set an initial
target of 85% percent proficient in each content area. What we are proposing is not only a different
accountability system; it is a different system of expectations, supports, consequences, and rewards
that represents a shift in our work as an education enterprise. We want to change the culture of
learning and expectations in the state, and also change the way that we do business as the SEA. We
believe that this will result in changes in achievement, and therefore we choose to keep our targets
where they are currently specified.
However, we acknowledge that it is difficult to predict future performance by looking at past data,
because of the shifts in cut scores, as well as the variety of new interventions. Following a continuous
improvement model, MDE intends to employ a systematic re-evaluation of not only the targets, but
also the efficacy of the system of supports and interventions. Specifically, we plan to monitor the
data and performance of schools until the 2014-2015 school year, at which time MDE’s adoption of
the Smarter Balanced Assessment Consortium (SBAC) assessments will necessitate an evaluation of
the targets and the system. Following that time point, MDE will consider necessary modifications to
the system every three years. If more than 50% of schools have made at least safe harbor targets, but
are failing to make the proficiency targets, we will consider resetting the ultimate AMOs. Conversely,
if over 75% of Michigan schools are consistently meeting the proficiency targets, we will consider
resetting the AMOs with a higher end target. Targets will always be re-evaluated using the
consideration of the equal mandates of ambitious AND attainable. Specifically, if the targets prove
unattainable, targets will be reevaluated to be both ambitious and attainable by identifying targets
attained by some percentage of schools significantly above the state average (e.g., targets attained by
at least 20 percent of schools).
With the transition to new assessments in 2014-15, MDE is exercising its option to evaluate the
targets and system. Given that the new M-STEP assessments are completely different from the
previous MEAP assessments, existing AMOs must be realigned to the new assessments. MDE is also
anticipating a two- year assessment transition due to state legislative requirements, and a change in
114
Amended July 28, 2015
ESEA FLEXIBI LITY – REQ UEST U . S . D EPARTMEN T OF ED UC ATION
the college entrance examination from ACT to SAT. MDE will set 2014-15 AMOs on proficiency levels
attained on the 2014-15 assessments. MDE will continue to use differentiated targets for schools and
districts, and continue to hold all subgroups accountable to the same target as the building or district.
MDE will calculate an annual increment based on an end goal of 85% proficiency by the 2023-24
school year. To ensure a minimum standard, MDE will implement a minimum AMO of 15% in the
initial year (2014-15). Schools and districts that have an initial target of 15% will need to attain an
annual increment of 7% in order to stay on track to 85% proficiency in 2023-24. MDE will not have
assessment data needed in order to set AMOs until late summer 2015 and will submit the new AMOs
to USED before the deadline of January 31, 2016.
For public reporting, Michigan will establish state AMOs for the SY 2014–2015 by computing the State
average proficiency rate for each content area. Michigan will then report on its State report card (and
require that an LEA report on its local report card) actual achievement against the State’s AMOs—the
State average (disaggregated by subgroup). Achievement for the SY 2014–2015, and for SY 2014–2015
reporting only, and will omit the “met” or “not met” designation with regard to achievement as
compared to the AMOs. Report cards will clearly indicate through a column heading, footnote, cover
page, or other notation, that the State average for the SY 2014–2015 is being used to meet the
Federal requirements to have annual measurable objectives (AMOs). No later than January 31, 2016,
Michigan will submit to ED for review and approval, its SY 2014–2015 AMOs—the State average as
well as its AMOs for SY 2015–2016 and beyond.
Additionally, Michigan will ensure that LEAs and schools use performance against the SY 2014–2015
AMOs —the State average — to:
• Inform interventions and supports that are implemented in accordance with
Michigan’s differentiated accountability and support system, particularly for other
Title I schools
AND
• As required by other programs (e.g., Title III AMAO 3, rural programs’ limitations on
participation and use of funds, IDEA APR).
What MDE’s AMOs Look Like
In the past, MDE has set the same targets for each school statewide. Our original idea for the ESEA
Flexibility Request was to continue to set targets in this manner. However, stakeholders indicated that
differentiated targets provide a more meaningful way for a school to consider the improvements they
need to make, and they also ensure that all schools are held to an increasing target each year.
Therefore, in order to differentiate our accountability system, we now propose differentiated targets
for schools. Each school has its own target, which will be set as follows (Figure 32 below helps
illustrate our system of differentiated proficiency targets, or AMOs.):
115
Amended July 28, 2015
ESEA FLEXIBI LITY – REQ UEST U . S . D EPARTMEN T OF ED UC ATION
• Calculate the percent of students who are proficient (on the career- and college-ready cut
scores) in the 2014-15 school year.14
• Calculate the distance for each school between 85% and its current percent proficient, and
divide that distance into ten increments.
• Those increments become the proficiency targets for each school.
• A school’s targets do not reset each year. This way, a school knows what its trajectory needs
to look like and can plan ahead. Having clear goals that are communicated in advance to
schools is an important element in a transparent and useful accountability system.
• When a school reaches 85% proficient and remains there for two years, it is awarded a
“Green” status (see report card explanation in Section 2.A.i above), and given the opportunity
to earn “Reward” status by continuing to show improvement.15 As long as the school remains
above the 85% target, it will not drop below an overall “Green” rating. If the school does
show improvement, it will be named a Reward school. This ensures that schools that meet
this rigorous target are rewarded for this difficult achievement, but are also incentivized to
continue to improve toward a goal of 100% proficiency.
14 We will continue to identify students as “proficient” for the purposes of the Accountability Scorecard if they are: Level 1
(Advanced) or 2 (Proficient); provisionally proficient (within two standard errors of the cut score; or growth proficient (). This is
our current practice in AYP as well. 15 We will define improvement as being a positive four-year slope.
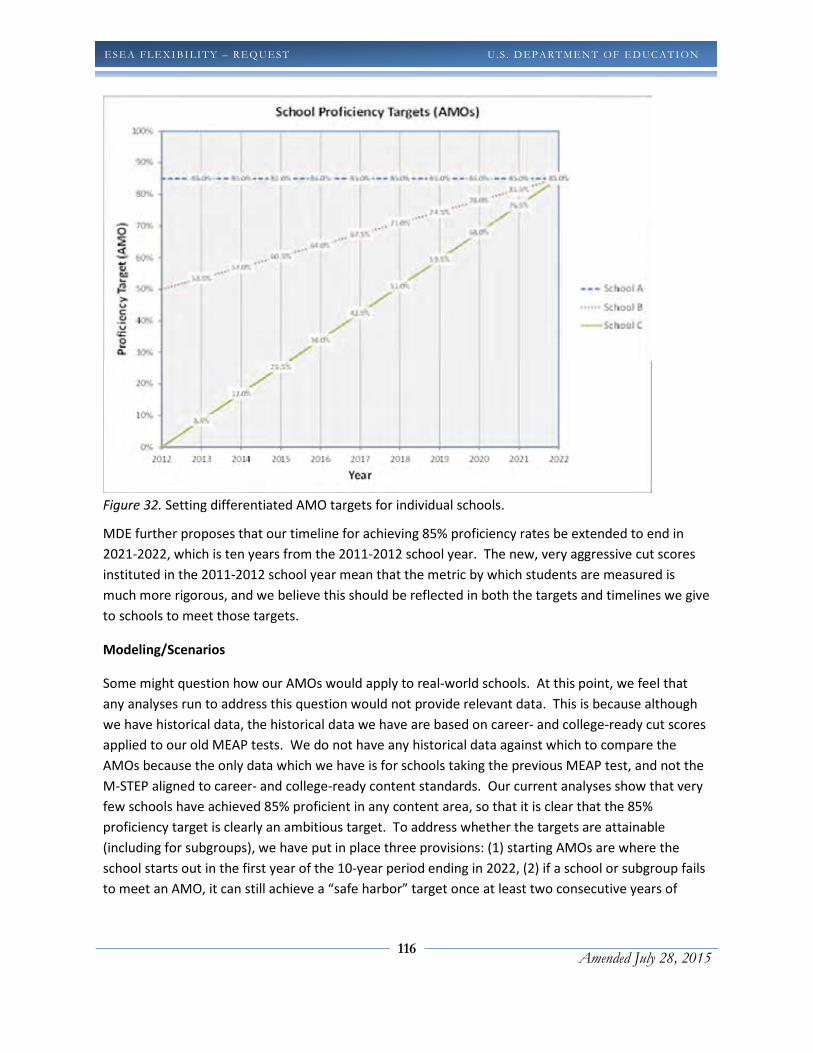
116
Amended July 28, 2015
ESEA FLEXIBI LITY – REQ UEST U . S . D EPARTMEN T OF ED UC ATION
Figure 32. Setting differentiated AMO targets for individual schools.
MDE further proposes that our timeline for achieving 85% proficiency rates be extended to end in
2021-2022, which is ten years from the 2011-2012 school year. The new, very aggressive cut scores
instituted in the 2011-2012 school year mean that the metric by which students are measured is
much more rigorous, and we believe this should be reflected in both the targets and timelines we give
to schools to meet those targets.
Modeling/Scenarios
Some might question how our AMOs would apply to real-world schools. At this point, we feel that
any analyses run to address this question would not provide relevant data. This is because although
we have historical data, the historical data we have are based on career- and college-ready cut scores
applied to our old MEAP tests. We do not have any historical data against which to compare the
AMOs because the only data which we have is for schools taking the previous MEAP test, and not the
M-STEP aligned to career- and college-ready content standards. Our current analyses show that very
few schools have achieved 85% proficient in any content area, so that it is clear that the 85%
proficiency target is clearly an ambitious target. To address whether the targets are attainable
(including for subgroups), we have put in place three provisions: (1) starting AMOs are where the
school starts out in the first year of the 10-year period ending in 2022, (2) if a school or subgroup fails
to meet an AMO, it can still achieve a “safe harbor” target once at least two consecutive years of
117
Amended July 28, 2015
ESEA FLEXIBI LITY – REQ UEST U . S . D EPARTMEN T OF ED UC ATION
testing has occurred, and (3) we have built into the application a review cycle at which time the AMOs
will be evaluated for adequate rigor and attainability.
Safe Harbor
MDE is proposing to update its Safe Harbor definition for use once we have at least two consecutive
years of assessment results. Under the current definition, few schools were able to benefit from Safe
Harbor. MDE will not utilize Safe Harbor for 2014-15 and 2015-16. MDE will develop a more
meaningful and useful Safe Harbor definition to be implemented in 2016-17.
The Need for Safe Harbor
We need to strike the appropriate balance between ambitious proficiency targets and attainable
improvement goals. We believe wholeheartedly in the need to dramatically move Michigan forward
so that many more students are prepared for career and college upon graduation, and we know that
this means that schools need to behave in fundamentally different ways than they have in the past.
This is why we retained ambitious and aggressive proficiency targets in our AMOs.
We also know, however, that schools—particularly those who are furthest behind—need the ability to
make progress and be rewarded for that progress. This is why we propose a new safe harbor
methodology, and a new way of communicating this to schools, districts, and parents.
• For the whole school, as well as for each of the subgroups, schools can make safe harbor if it
demonstrates a high rate of improvement.
• To identify how much improvement is sufficient to make safe harbor, MDE needed to identify
a rate that had been demonstrated by schools, but that was still ambitious and rigorous. To
do this, we look at the distribution of improvement rates for schools in each grade level
(elementary, middle, and/or high school) over the previous four years (using a four-year
improvement slope). We find the improvement rate of a school at the 80th percentile. This
means that 20% of schools had a greater improvement rate, but 80% of schools were
improving at a slower rate. See Figure 29 below for an illustration of how this rate was
determined.
• This improvement rate is then set as the “safe harbor” rate for each grade level and subject.
This rate is calculated in the base year (e.g., 2012-2013) and will remain the safe harbor
improvement rate until scheduled target reevaluations.
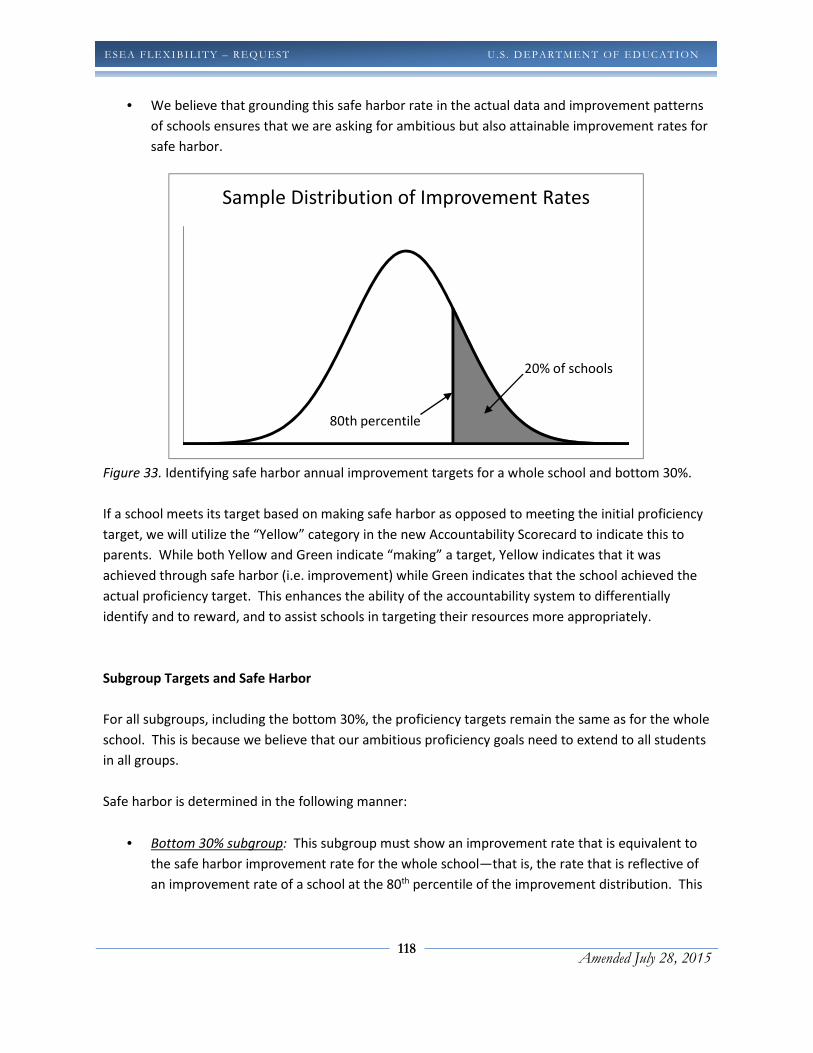
118
Amended July 28, 2015
ESEA FLEXIBI LITY – REQ UEST U . S . D EPARTMEN T OF ED UC ATION
• We believe that grounding this safe harbor rate in the actual data and improvement patterns
of schools ensures that we are asking for ambitious but also attainable improvement rates for
safe harbor.
Figure 33. Identifying safe harbor annual improvement targets for a whole school and bottom 30%.
If a school meets its target based on making safe harbor as opposed to meeting the initial proficiency
target, we will utilize the “Yellow” category in the new Accountability Scorecard to indicate this to
parents. While both Yellow and Green indicate “making” a target, Yellow indicates that it was
achieved through safe harbor (i.e. improvement) while Green indicates that the school achieved the
actual proficiency target. This enhances the ability of the accountability system to differentially
identify and to reward, and to assist schools in targeting their resources more appropriately.
Subgroup Targets and Safe Harbor
For all subgroups, including the bottom 30%, the proficiency targets remain the same as for the whole
school. This is because we believe that our ambitious proficiency goals need to extend to all students
in all groups.
Safe harbor is determined in the following manner:
• Bottom 30% subgroup: This subgroup must show an improvement rate that is equivalent to
the safe harbor improvement rate for the whole school—that is, the rate that is reflective of
an improvement rate of a school at the 80th percentile of the improvement distribution. This
Sample Distribution of Improvement Rates
20% of schools
80th percentile
119
Amended July 28, 2015
ESEA FLEXIBI LITY – REQ UEST U . S . D EPARTMEN T OF ED UC ATION
means we expect the lowest 30% of students to show a rate of improvement that is ambitious
but that has also been demonstrated by at least 20% of schools in the past. It also means that
schools will need to be very purposeful about differentiating instruction and targeting
resources to the students in this subgroup.
If the bottom 30% subgroup meets their improvement target, this will be considered “Green”
in the Accountability Scorecard (as opposed to the “Yellow” that would normally be attributed
to safe harbor). The bottom 30% subgroup is, by definition, the lowest performing 30% of
students in the school, based on a rank ordering of their standardized scale score from the
assessment each student took. Therefore, making the safe harbor improvement target with
this group is a strong achievement and deserves to be rewarded with a green flag instead of a
yellow. This group does not have any “high performers” in it to pull up the average of the
subgroup in the manner of other subgroups. They are only the lowest performing students. If
a school is successful in increasing the percent of students in their bottom 30% subgroup who
are considered proficient, even if they do not meet the school’s AMO, they have achieved a
significantly high level of improvement in the percent of their lowest-performing students
who are proficient.
Bottom 30% subgroups that do not meet the improvement target will show on the
Accountability Scorecard as red. The subgroup will also not earn any points used in the overall
calculation of the Accountability Scorecard status. The individual red cell for the subgroup will
not, however, roll up into the school’s or LEA’s overall status. Schools and LEAs with individual
red cells in the Bottom 30% subgroup will not earn higher than a Lime overall status.
However, with the ESEA subgroups, those groups do not consist only of the lowest-
performing students. There will be a mix of high, average, and low-performing students in
each of the ESEA subgroups. Therefore, it’s appropriate to require that they meet absolute
proficiency targets, or in lieu of meeting those targets, that they show improvements over
time by meeting safe harbor. Given that they already have some proficient students in each
of those ESEA subgroups, it is appropriate to award safe harbor improvement with a yellow as
opposed to the green awarded for meeting the proficiency AMO.
• Nine demographic subgroups: If one of the demographic subgroups does not meet the
proficiency target for the whole school, the safe harbor rate for that subgroup is set at the
safe harbor improvement rate that applied to the whole school (for that particular level and
subject) Again, this improvement rate is reflective of the rate of improvement demonstrated
by a school at the 80th percentile of improvement within a particular level. This is sending the
message that we have the same ambitious proficiency targets and the same ambitious and
attainable safe harbor targets for the whole school and for all demographic groups within the
school.
120
Amended July 28, 2015
ESEA FLEXIBI LITY – REQ UEST U . S . D EPARTMEN T OF ED UC ATION
If one of the demographic subgroups does not meet the proficiency target, and instead meets
the safe harbor improvement target, this subgroup will receive a “Yellow” on the
Accountability Scorecard. This sends the message to the school and to parents and other
stakeholders that, although the school is demonstrating improvements in those subgroups,
their proficiency rates are still below the expected target. Again, we believe this strikes the
balance between ambitious and rigorous expectations for proficiency, while providing
attainable ways for schools to demonstrate progress towards goals. If a school fails to meet
either the proficiency or the improvement target for a subgroup, that subgroup will be “Red”
on the Accountability Scorecard.
Rationale for AMOs
The AMOs we propose reflect the fact that Michigan’s starting point is dramatically different, given
our new career- and college-ready cut scores. The proficiency AMOs require that schools grow by
equal increments each year, remain the same once set, and reflect a school’s starting location. These
were all important modifications that were introduced based on lessons learned from the previous
AMOs. Schools need to have targets that relate to their own situation; they need to be clear on what
the goals are so that they can plan ahead, and they need to be given a steady trajectory to work with,
versus the “stair-step” approach taken previously, where targets remained constant for several years
and then dramatically increased in the years approaching 2014.
The performance change we expect to see in our schools during the next few years is significant.
However, it’s also carefully grounded in extensive research, data analysis, and stakeholder input. As
mentioned previously, we spent considerable time engaged with practitioners and policy groups as
we set forth to build our new AMOs. We also ran volumes of data in an effort to test our assumptions
and results.
We have sought to harness the tension between ambition and attainability, and we believe we have
struck the right balance. We are cognizant of the challenges our schools face, particularly with the
pending change in cut scores, but we believe they are capable of achieving their objectives if they
have the right tools and support. As outlined in this waiver request, we think we can deliver that
support through diagnostic intervention and data-driven approaches.
Perhaps the best support for our thinking, however, relates to the core principles stated at the
beginning of this document:

121
Amended July 28, 2015
ESEA FLEXIBI LITY – REQ UEST U . S . D EPARTMEN T OF ED UC ATION
∗ All means all. Every child has an innate capacity for learning, and we must meet the needs
of each and every Michigan student with high-quality systems, tools and resources. Our
expectations for all students must be consistently high.
∗ The use of for the bottom 30% subgroup for calling out subgroup achievement will allow
us to isolate and address student achievement gaps wherever they exist, not just in
Michigan’s larger schools.
∗ The growth rates we’re targeting are going to propel our students forward at a pace
we’ve never before seen, but think our schools can manage.
∗ The state is prepared to leverage its partnerships and resources to make sure these AMOs
are met. Why? Because of the next core belief, stated below.
∗ We must ensure our children are career- and college-ready. We define this as student
preparation that is adequate to allow a student to pass first-year community college
courses without remediation. Our state is preparing students not just for the opportunities
we know about today, but also for the economic and intellectual challenges of the future.
∗ We cite this quotation, which says it all:
A May 2011 study by the Detroit Regional Workforce Fund found that 47 percent of
adult Detroit residents, or about 200,000 people, are functionally illiterate — which
means that nearly half the adults in the city can’t perform simple tasks such as
reading an instruction book, reading labels on packages or machinery, or filling out a
job application. Depressingly, about 100,000 of those functionally illiterate adults
have either a high school diploma or the GED equivalent. You can stimulate the
Detroit economy all you want, but even if jobs come back, people who can’t read
won’t be able to do them.16
∗ Michigan’s economy, which is among the worst in the nation, needs educational rigor,
innovation, and results. We are using this ESEA Flexibility Request as the next step in our
work to deliver those results.
∗ Our teachers and administrators are professionals whose talents are equal to the task
before them. We must ensure our systems support their work effectively and allow them
to innovate to meet the needs of their students.
∗ We have high-caliber individuals working in classrooms and schools across Michigan. We
owe it to them to set our expectations higher and give them an opportunity to produce
the growth of which they are capable.
16 Friedman, Thomas and Mandelbaum, Michael (2011). That Used to Be Us: How America Fell Behind in the World It Invented
and How We Can Come Back. New York, NY: Farrar, Straus and Giroux
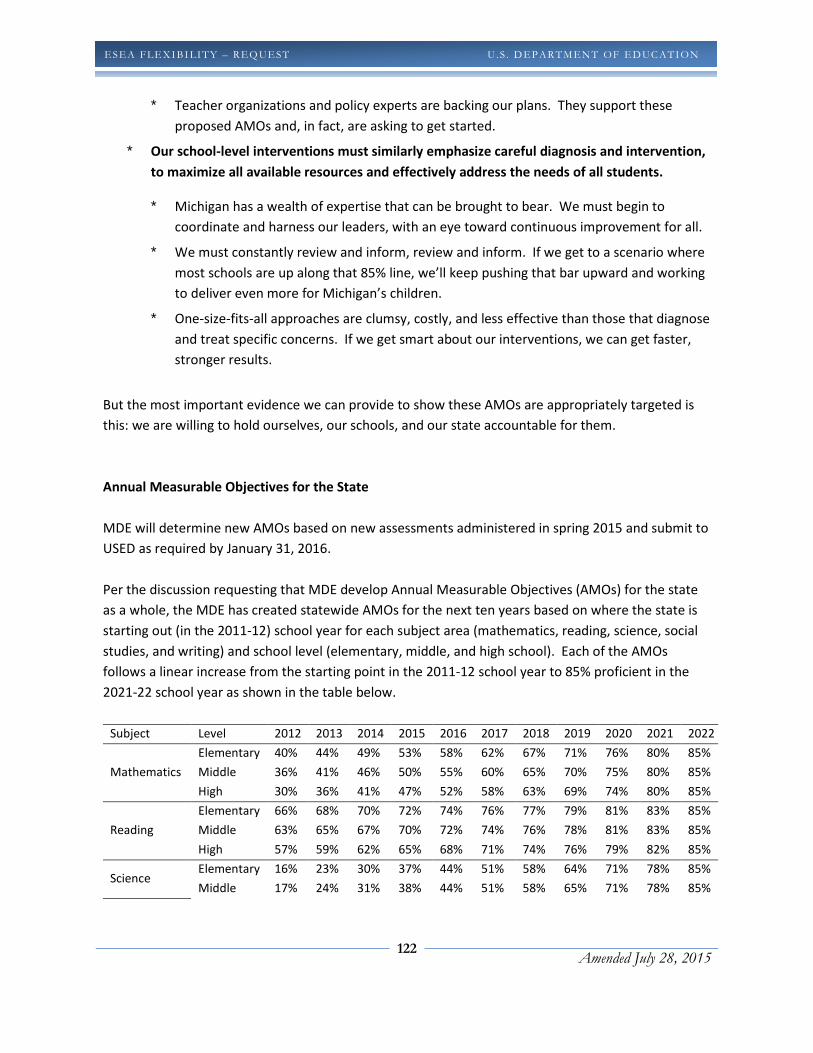
122
Amended July 28, 2015
ESEA FLEXIBI LITY – REQ UEST U . S . D EPARTMEN T OF ED UC ATION
∗ Teacher organizations and policy experts are backing our plans. They support these
proposed AMOs and, in fact, are asking to get started.
∗ Our school-level interventions must similarly emphasize careful diagnosis and intervention,
to maximize all available resources and effectively address the needs of all students.
∗ Michigan has a wealth of expertise that can be brought to bear. We must begin to
coordinate and harness our leaders, with an eye toward continuous improvement for all.
∗ We must constantly review and inform, review and inform. If we get to a scenario where
most schools are up along that 85% line, we’ll keep pushing that bar upward and working
to deliver even more for Michigan’s children.
∗ One-size-fits-all approaches are clumsy, costly, and less effective than those that diagnose
and treat specific concerns. If we get smart about our interventions, we can get faster,
stronger results.
But the most important evidence we can provide to show these AMOs are appropriately targeted is
this: we are willing to hold ourselves, our schools, and our state accountable for them.
Annual Measurable Objectives for the State
MDE will determine new AMOs based on new assessments administered in spring 2015 and submit to
USED as required by January 31, 2016.
Per the discussion requesting that MDE develop Annual Measurable Objectives (AMOs) for the state
as a whole, the MDE has created statewide AMOs for the next ten years based on where the state is
starting out (in the 2011-12) school year for each subject area (mathematics, reading, science, social
studies, and writing) and school level (elementary, middle, and high school). Each of the AMOs
follows a linear increase from the starting point in the 2011-12 school year to 85% proficient in the
2021-22 school year as shown in the table below.
Subject Level 2012 2013 2014 2015 2016 2017 2018 2019 2020 2021 2022
Mathematics
Elementary 40% 44% 49% 53% 58% 62% 67% 71% 76% 80% 85%
Middle 36% 41% 46% 50% 55% 60% 65% 70% 75% 80% 85%
High 30% 36% 41% 47% 52% 58% 63% 69% 74% 80% 85%
Reading
Elementary 66% 68% 70% 72% 74% 76% 77% 79% 81% 83% 85%
Middle 63% 65% 67% 70% 72% 74% 76% 78% 81% 83% 85%
High 57% 59% 62% 65% 68% 71% 74% 76% 79% 82% 85%
Science Elementary 16% 23% 30% 37% 44% 51% 58% 64% 71% 78% 85%
Middle 17% 24% 31% 38% 44% 51% 58% 65% 71% 78% 85%
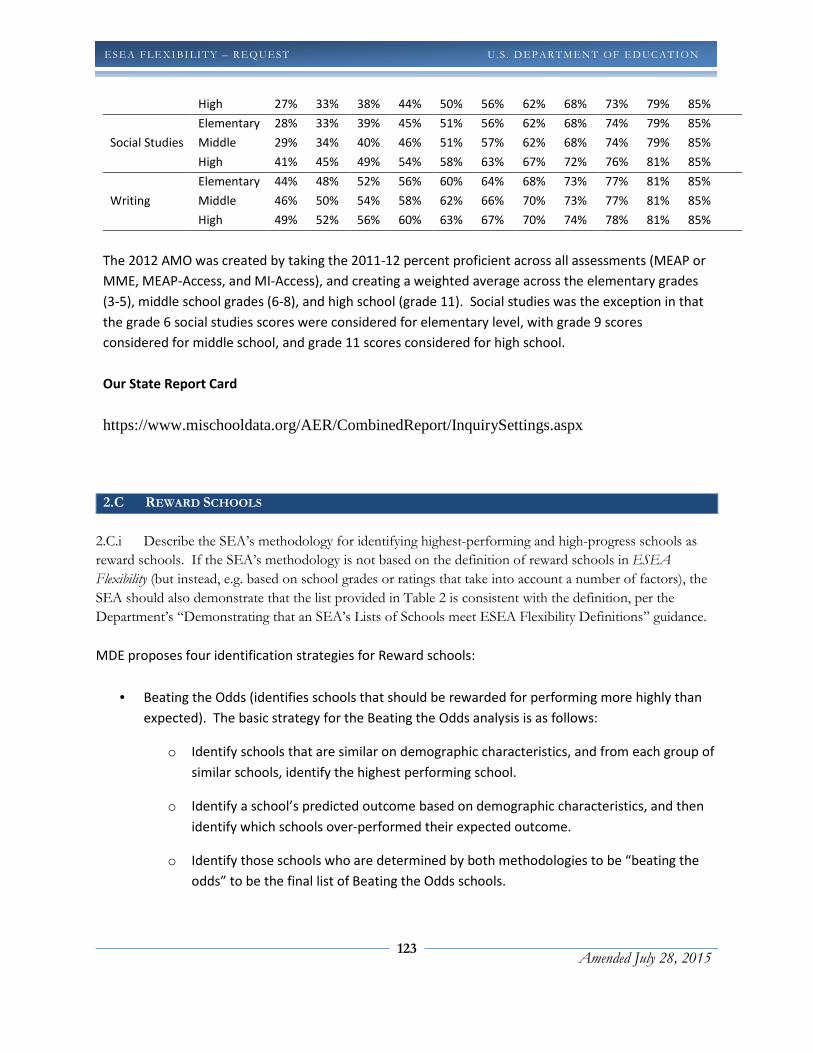
123
Amended July 28, 2015
ESEA FLEXIBI LITY – REQ UEST U . S . D EPARTMEN T OF ED UC ATION
High 27% 33% 38% 44% 50% 56% 62% 68% 73% 79% 85%
Social Studies
Elementary 28% 33% 39% 45% 51% 56% 62% 68% 74% 79% 85%
Middle 29% 34% 40% 46% 51% 57% 62% 68% 74% 79% 85%
High 41% 45% 49% 54% 58% 63% 67% 72% 76% 81% 85%
Writing
Elementary 44% 48% 52% 56% 60% 64% 68% 73% 77% 81% 85%
Middle 46% 50% 54% 58% 62% 66% 70% 73% 77% 81% 85%
High 49% 52% 56% 60% 63% 67% 70% 74% 78% 81% 85%
The 2012 AMO was created by taking the 2011-12 percent proficient across all assessments (MEAP or
MME, MEAP-Access, and MI-Access), and creating a weighted average across the elementary grades
(3-5), middle school grades (6-8), and high school (grade 11). Social studies was the exception in that
the grade 6 social studies scores were considered for elementary level, with grade 9 scores
considered for middle school, and grade 11 scores considered for high school.
Our State Report Card
https://www.mischooldata.org/AER/CombinedReport/InquirySettings.aspx
2.C REWARD SCHOOLS
2.C.i Describe the SEA’s methodology for identifying highest-performing and high-progress schools as
reward schools. If the SEA’s methodology is not based on the definition of reward schools in ESEA
Flexibility (but instead, e.g. based on school grades or ratings that take into account a number of factors), the
SEA should also demonstrate that the list provided in Table 2 is consistent with the definition, per the
Department’s “Demonstrating that an SEA’s Lists of Schools meet ESEA Flexibility Definitions” guidance.
MDE proposes four identification strategies for Reward schools:
• Beating the Odds (identifies schools that should be rewarded for performing more highly than
expected). The basic strategy for the Beating the Odds analysis is as follows:
o Identify schools that are similar on demographic characteristics, and from each group of
similar schools, identify the highest performing school.
o Identify a school’s predicted outcome based on demographic characteristics, and then
identify which schools over-performed their expected outcome.
o Identify those schools who are determined by both methodologies to be “beating the
odds” to be the final list of Beating the Odds schools.
124
Amended July 28, 2015
ESEA FLEXIBI LITY – REQ UEST U . S . D EPARTMEN T OF ED UC ATION
MDE has received some suggestions from stakeholders regarding the Beating the Odds
methodology. Prior to the ESEA Flexibility application, the Beating the Odds list was simply a
report that MDE produced each year in order to encourage schools that were doing better than
expected in terms of their performance. With the increased stakes attached to it via this
application, however, MDE commits to engaging in a series of stakeholder meetings to refine
and revisit the methodology. For example, in some of the clusters of schools, the school with
the highest ranking may not be significantly higher than the mean ranking of that cluster, but
that top-ranked school in the cluster would still be identified as beating the odds. These types
of methodological business rules are best hammered out through thoughtful conversation with
external stakeholders and experts.
What we do know now is that subgroup performance is an important element of this
calculation. The outcome metric for both ways of identifying schools beating the odds is MDE’s
Top-to-Bottom school ranking. We also calculate a ranking of the size of the achievement gap in
each school. Schools with large achievement gaps are pulled down in the gap rankings, and are
therefore unable to be identified as beating the odds. In addition, as a failsafe, schools are
disqualified from being recognized as beating the odds if they are identified as focus schools.
Finally, both methods of identifying schools as beating the odds incorporate demographic risk
factors as either matching variables or covariates. Therefore, schools identified as beating the
odds are by definition outperforming their prediction based on their demographic mix of
students.
• Top 5% of schools on the Top-to-Bottom list of schools (“high performing schools”). Detail on
Top-to-Bottom methodology is included below; the basic strategy for the Top-to-Bottom list is
as follows.
o Using data on all four tested subjects and graduation rate where available, rank schools
from the 99th percentile to the 0th percentile.
o Each content area metric is based on achievement (1/2 of the metric) and improvement
(1/2 of the metric). This creates a tension between high achievement and improvement
over time.
o Once the complete Top-to-Bottom list is identified, the top 5% of that list can be
considered “highest-performing” schools. These are schools with high overall
achievement, who are demonstrating improvement over time, and who are
demonstrating high achievement and improvement in all students as evidenced by their
small achievement gaps (not identified as a Focus school).
• Schools with the top 5% improvement rates (on a composite rate of improvement in all tested
subjects)—for “high progress” schools

125
Amended July 28, 2015
ESEA FLEXIBI LITY – REQ UEST U . S . D EPARTMEN T OF ED UC ATION
o In the complete Top-to-Bottom ranking, an improvement rate is identified for each
content area.
o To determine “high progress” schools, the following steps are conducted:
� Create a composite improvement index based on improvement in all available
tested subjects.
� Rank schools on their composite improvement index.
� Identify the 5% of schools with the highest rates of improvement.
• Schools improving beyond the 85% ultimate proficiency target for the whole school and
remaining a Green school otherwise.
A school cannot be named a Reward school if it is a Priority school or a Focus school, or if it has failed
AYP (i.e. gotten a “Red” overall status on the Accountability Scorecard).
At USED's request Michigan reviewed its Reward school identification business rules to
determine if they were sufficient to ensure Reward schools do not have within-school
achievement or graduation rate gaps that are not closing. Unfortunately this review found
Michigan's previous business rules were not sufficient. Michigan’s previous rules excluded
schools from being labeled Reward schools if they were labeled Priority or Focus in the current
year. But Michigan’s rules also worked out so that a school could not be labeled Focus if they
were part of Priority cohort, even if the school was not labeled Priority in the current year. Thus
schools could have had persistently large achievement gaps or persistently low graduation rates
but since they were not labeled Focus in the current year they could be labeled Reward. This
possibility was only ever realized twice (both during the 2013-14 cycle). The following two
business rules close this unintended loophole by using the metrics behind the Focus label rather
than the label itself.
– A school cannot be named a Reward School if it has an achievement gap large enough to be
named Focus.
– A school cannot be named a Reward School if it has a graduation rate below 60%.
- If a school has “Red” rating on their scorecard, which indicates low performance either overall or in
various subgroups, they cannot by a Reward school. We believe that this audit prohibits individual
schools with large gaps from becoming Reward schools because schools are held accountable for the
absolute performance of all of their traditional subgroups.

126
Amended July 28, 2015
ESEA FLEXIBI LITY – REQ UEST U . S . D EPARTMEN T OF ED UC ATION
2.C.ii Provide the SEA’s list of reward schools in Table 2. 2.C.iii Describe how the SEA will publicly recognize and, if possible, reward highest-performing and high-
progress schools. MDE is working with its partners and stakeholders to identify innovative ways to recognize high-
achieving schools. Although we do not have funds available to reserve under ESEA section 1117(c)(2)(A)
to provide financial incentives to Reward Schools, we have identified other types of recognition that the
MDE, its stakeholders, and partners can provide for Reward schools.
Reward Schools
Reward schools will all receive the same level and type of recognition, regardless of their subcategory
(e.g., Beating the Odds, etc.), including:
• Every school in Michigan is required by state statute to complete an online Annual Education
Report (AER). The AER for Reward Schools will include their reward status and spotlights
their high achievement. Each reward school will be identified using one or more of the
following designations:
� Reward School – Beating the odds
� Reward School – Highest performing
� Reward School – Highest progress
� Reward School – Exceeding 85% Proficiency
• The MDE will provide local media recognition with information on Reward Schools and
encourage coverage telling each school’s unique story. Press releases will identify the criteria
that reward schools met to achieve this status, e.g. Beating the Odds, High performing, High
progress or Exceeding 85% proficiency. Some Reward schools will meet more than one of
these criteria and will be recognized for each one they meet.
• Reward Schools will have their practices highlighted at the MDE’s annual School
Improvement Conference, and will receive other conference and event recognition through
our partner educational organizations. Reward Schools and their teachers will be featured by
giving presentations or panel discussions on their success strategies at MDE and partner
annual meetings. Recognition by partner organizations may highlight schools by elementary
and secondary principal associations, superintendent and school board organizations and
other similar associations. Teachers in Reward schools may be recognized at subject specific
associations (e.g. English Language arts, mathematics, science social studies, etc.), Reward

127
Amended July 28, 2015
ESEA FLEXIBI LITY – REQ UEST U . S . D EPARTMEN T OF ED UC ATION
schools and teachers in these schools will be identified as meeting one or more of the
criteria.
• Reward Schools will receive certificates and banners for display in buildings. The banner, for
example, will include the year of their recognition and the criteria met, e.g. Beating the
Odds, High performing, High progress or Exceeding 85% Proficiency.
• MDE will utilize social media (e.g., Facebook, Pinterest, Google+) to share examples of
schools with common, well diagnosed achievement or gap problems that have been
resolved with specific interventions for other schools in the state. We will also use social
networking applications to allow schools with similar issues to join in conversations, ask and
answer each other’s questions, and expand their learning communities to improve timely
implementation.
• Reward Schools that have been selected as a Blue Ribbon School or have presented their
best practices at an MDE or partner organization conference will be introduced to
demographically similar Focus and Priority schools and asked to provide their presentation
to these schools, either in person or electronically. The focus of these interactions will be on
sharing best practices, identifying challenges and successes. Tools are provided to identify
schools that are similar in demographics, and the MDE Reward Schools web page will offer
videos or podcasts of the presentations.
2.D PRIORITY SCHOOLS
2.D.i Describe the SEA’s methodology for identifying a number of lowest-performing schools equal to at
least five percent of the State’s Title I schools as priority schools. If the SEA’s methodology is not based on
the definition of priority schools in ESEA Flexibility (but instead, e.g. based on school grades or ratings that
take into account a number of factors), the SEA should also demonstrate that the list provided in Table 2 is
consistent with the definition, per the Department’s “Demonstrating that an SEA’s Lists of Schools meet
ESEA Flexibility Definitions” guidance.
The designation of Michigan’s Priority schools will employ the annually applied Top-to-Bottom metric.
(See Section 2.A.i for greater details on the TTB metric.) A three-year cycle of interventions and supports
will be utilized beginning in school year 2015-16; this will be known as Cycle One. Cycle Two and Cycle
Three will follow in school years 2016-17 and 2017-18, respectively. Cycle One will be used for
informational only purposes utilizing the MDE’s Statewide System of Support to provide technical
assistance to LEAs with potentially new priority schools as defined by TTB ranks in the bottom 10%.
Cycle Two will be used to provide greater and more in-depth technical assistance to LEAs with likely new
priority schools as defined by TTB ranks of 0 to 4. (See Section 2.G for greater details on Statewide
System of Support.)

128
Amended July 28, 2015
ESEA FLEXIBI LITY – REQ UEST U . S . D EPARTMEN T OF ED UC ATION
The designation of Priority schools will occur during Cycle Three using a two-step process. Schools will
be designated as a Priority school when their TTB percentile ranks for both Cycles Two and Three are
less than five (5). If the total number of newly identified Priority schools and previously identified
Priority schools that have not yet met exit criteria (described below) does not meet the requirement of
5% of Title I schools, then a two-year aggregate TtB ranking from Cycles 2 and 3 will be utilized to
identify the additional schools.
Schools designated as Priority in 2017 will develop a redesign plan as defined in Section 2.D.iii.
Beginning with schools identified in 2017, Priority school interventions and supports are required for a
minimum three (3) years, after which exit from Priority status will be considered on an annual basis.
(See Section 2.D.v for greater details on Exit Criteria.) Schools that are released will complete the
transition by converting the applicable requirements of their redesign plan to their School Improvement
Plan.
Schools that are deemed not to have made satisfactory progress at the conclusion of the designated
minimum time frame, and/or annually thereafter, will develop a team that includes the LEA
Superintendent (or his/her designee), state, RESA/ISD, union, school, and community representatives.
Within 60 days of the notification that exit criteria have not been met, the team will analyze and make
recommendations to improve the existing redesign plan. This may include revisions to the school’s
redesign plan as described in section 2.D.iii
2.D.ii Provide the SEA’s list of priority schools in Table 2.
2.D.iii Describe the meaningful interventions aligned with the turnaround principles that an LEA with
priority schools will implement.
As described previously, all LEAs with Priority schools will be required to implement one of four
intervention models as described in the US Department of Education Final Requirements for School
Improvement Grants and required by state law (MCL 380.1280c):
• Turnaround Model
• Transformation Model
• Restart Model
• School Closure
A Priority school that implements one of the four School Improvement Grant models satisfies the
turnaround principles. See page 10 of the ESEA September 23, 2011 Flexibility document.
129
Amended July 28, 2015
ESEA FLEXIBI LITY – REQ UEST U . S . D EPARTMEN T OF ED UC ATION
Incremental change brings only gradual improvement in student achievement. Michigan’s Priority
schools need bold, dramatic systemic level change in order to realize rapid, dramatic, and sustainable
increases in student achievement. In order to make and sustain school- and classroom-level
improvement, we need to support districts in developing their capacity to support and monitor schools,
and scaffold state and regional assistance to support district capacity building.
Extraordinary performance gains for low-performing schools will be achieved and sustained through
systemic, innovative, and district-led turnaround. Thus, successful school turnaround efforts must be
built upon credible, substantial, and focused work by the district in support, resources, and
coordination.
Authorities and Responsibilities of the Priority School District Superintendent
The MDE is committed to local district superintendent-led turnaround working in collaboration with
each local school board. Extraordinary performance gains can be obtained and sustained through
systemic, innovative, superintendent-led turnaround. As the CEO, the district’s superintendent must not
only accept the responsibility of leading a priority district through the rapid turnaround process, s/he
must also have the ability to change conditions (e.g., authorities) necessary for schools to engage in
successful turnaround with the autonomy necessary to do the work well.
Redesign Plan
The local superintendent of the district, in collaboration with the local district school board, shall create
a redesign plan. This will apply to schools that are newly designated as Priority in 2017 and subsequent
three-year identification periods (2020, 2023, etc.). Previously identified Priority schools that have not
met exit criteria will be required to analyze and make recommendations to improve the existing
redesign plan.
The redesign plan must include:
• identification of one of four intervention models as listed above;
• Provisions intended to maximize rapid academic achievement of the school’s students;
• Steps to address (1) social, health, and safety needs of students, (2) rapid improvement
toward career- and college-ready benchmarks, (3) rapid academic improvement for low-
achieving students, (4) interventions and supports for English learners and students with
disabilities, and (5) alignment of school and district budget, including state and federal funds,
to redesign plan goals; and
• Measurable annual goals for student achievement

130
Amended July 28, 2015
ESEA FLEXIBI LITY – REQ UEST U . S . D EPARTMEN T OF ED UC ATION
For existing priority schools that have not made satisfactory progress, the above process of developing a
redesign plan will also including evaluating and updating the school’s existing redesign plan to remove
strategies that did not work and replace them with evidence-based interventions.
After the school has been designated as Priority, the local superintendent, in collaboration with the local
district school board, shall convene a focused local stakeholder group to seek input from a broader
group of stakeholder representative of the school community. The broader group of stakeholders
should include substantial representation from the identified school, its leadership, and the community
(inclusive of state, RESA/ISD, union, school, and community representatives). The process and timeline
for stakeholder input will be:
• The local superintendent’s stakeholder group must convene and make recommendations for
the redesign plan;
• Within 90 days of receiving recommendations, the redesign plan is submitted to the state
school reform/redesign office (SSRRO) and may be subject to modifications through an
iterative process between the district and the SSRRO;
• The superintendent will report quarterly in a public format to the school stakeholders on the
progress of their reform efforts.
These protocols provide multiple opportunities for stakeholders, including the union, to propose
“modifications” to the redesign plan and lays out a process and timeline for the submission and review
of modifications by the local superintendent.
The local superintendent, in consultation with the principal of the school, is responsible for annually
reviewing underperforming schools. The purpose of the review is to determine whether the school has
met the annual goals in its redesign plan and to assess the overall implementation of the redesign plan:
• If school has met academic goals, redesign plan continues
• If school has not met academic goals, the superintendent, in collaboration with the local
school board and representative stakeholders, may modify the plan
The local superintendent, in collaboration with the local district school board, is responsible for
reviewing the progress of school turnaround efforts and submitting regular reports to the state. If
necessary, the local superintendent may appoint an examiner to monitor and/or evaluate the schools
and assist in modifying the plan, including appointing an external partner to work with the local
superintendent.
The MDE is responsible for ensuring that Michigan complies with all ESEA flexibility requirements,
including identifying Priority schools and implementing interventions aligned with the turnaround
principles in those schools.

131
Amended July 28, 2015
ESEA FLEXIBI LITY – REQ UEST U . S . D EPARTMEN T OF ED UC ATION
2.D.iv Provide the timeline the SEA will use to ensure that its LEAs that have one or more priority schools
implement meaningful interventions aligned with the turnaround principles in each priority school no
later than the 2014–2015 school year and provide a justification for the SEA’s choice of timeline.
In January 2009, Michigan's legislature passed reform legislation and embodied it in Michigan's School
Code. This law requires the following:
Section 380.1280c
(1) Beginning in 2010, not later than September 1 of each year, the superintendent of public
instruction shall publish a list identifying the public schools in this state that the department has
determined to be among the lowest achieving 5% of all public schools in this state, as defined for the
purposes of the federal incentive grant program created under sections 14005 and 14006 of title XIV
of the American Recovery and Reinvestment act of 2009 Public Law 111-5.
As described in section 2.D.iii above, this law sets out timelines by which LEA's who have schools on
the list must submit reform/redesign plans to Michigan's state school reform/redesign officer.
Schools identified on this list must select as the basis for their plan one of the federal models--
turnaround, transformation, restart, or closure. Plans must include all elements as described in the
federal guidance.
Prior to the initial identification of the Priority schools, MDE will provide early notice technical
assistance events during the winter of Cycle One that target the bottom 10% of schools on the Top-to-
Bottom list. This will aid districts and schools in both making effective funding decisions to support
initial turnaround efforts and in engaging in early data and policy analysis to prepare for the
development of redesign plans if later identified as Priority schools.
MDE will provide early notice technical assistance events during the winter of Cycle Two that target
the bottom 5% of schools on the Top-to-Bottom list. This early technical assistance is designed to
improve the quality and feasibility of implementation of the redesign plan for schools. Potential
Priority schools will engage in introductory needs analysis and planning with MDE/ISD/RESA
facilitators to guide school turnaround. Even if not identified on the Priority schools list in Cycle
Three, this dialogue will engage a broad range of low-performing schools and initiate rapid
turnaround efforts. This also addresses financial set-aside considerations before the school’s
consolidated application is completed, so that reform-specific strategies are incorporated into the
application plan.
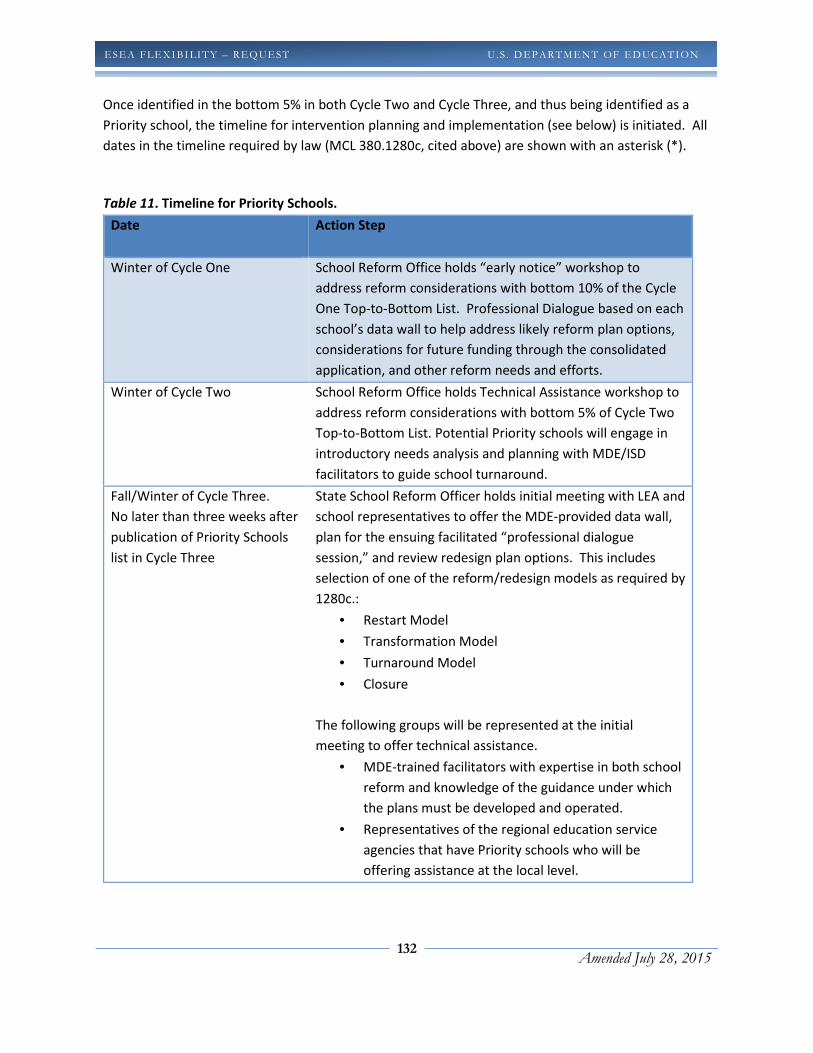
132
Amended July 28, 2015
ESEA FLEXIBI LITY – REQ UEST U . S . D EPARTMEN T OF ED UC ATION
Once identified in the bottom 5% in both Cycle Two and Cycle Three, and thus being identified as a
Priority school, the timeline for intervention planning and implementation (see below) is initiated. All
dates in the timeline required by law (MCL 380.1280c, cited above) are shown with an asterisk (*).
Table 11. Timeline for Priority Schools.
Date
Action Step
Winter of Cycle One School Reform Office holds “early notice” workshop to
address reform considerations with bottom 10% of the Cycle
One Top-to-Bottom List. Professional Dialogue based on each
school’s data wall to help address likely reform plan options,
considerations for future funding through the consolidated
application, and other reform needs and efforts.
Winter of Cycle Two School Reform Office holds Technical Assistance workshop to
address reform considerations with bottom 5% of Cycle Two
Top-to-Bottom List. Potential Priority schools will engage in
introductory needs analysis and planning with MDE/ISD
facilitators to guide school turnaround.
Fall/Winter of Cycle Three.
No later than three weeks after
publication of Priority Schools
list in Cycle Three
State School Reform Officer holds initial meeting with LEA and
school representatives to offer the MDE-provided data wall,
plan for the ensuing facilitated “professional dialogue
session,” and review redesign plan options. This includes
selection of one of the reform/redesign models as required by
1280c.:
• Restart Model
• Transformation Model
• Turnaround Model
• Closure
The following groups will be represented at the initial
meeting to offer technical assistance.
• MDE-trained facilitators with expertise in both school
reform and knowledge of the guidance under which
the plans must be developed and operated.
• Representatives of the regional education service
agencies that have Priority schools who will be
offering assistance at the local level.

133
Amended July 28, 2015
ESEA FLEXIBI LITY – REQ UEST U . S . D EPARTMEN T OF ED UC ATION
• For schools that have been identified Priority in a
precious cycle, members of district intervention
teams with expertise in diagnosing systems problems
at the district level.
(Personnel, budget, procurement, instruction and
instructional strategies, professional development)
Next 90 days of Cycle Three Newly Identified schools hold a “professional dialogue”
session using the MDE-provided data wall, select the
appropriate intervention model and write or revise a draft
redesign plan to submit through AdvancED modified SIP
templates. Title I priority schools will receive assistance for
this work from an MDE-provided intervention specialist who
will:
• Work with school leaders to select the most
appropriate Reform and Redesign model based on
needs
• Identify District system-level improvements needed
to support schools’ rapid turnaround strategies
including:
• Student Achievement/Instruction
• Budget and Financial Practices
• Procurement
• Recruitment, Screening, Hiring and Placement of
Staff
• Select which components of the Statewide System of
Support meet the student and staff needs and be
incorporated into chosen model
Previously Identified and non-exited Priority Schools will
receive assistance in revising and implementing their plan
from an intervention specialist, who will accomplish the
following:
• Participate, if designated by the school reform officer,
in the school’s facilitated “professional dialogue” to
help strengthen the redesign plan to identify root
causes of low student achievement
• Identify and resolve system issues which are barriers
to full plan implementation

134
Amended July 28, 2015
ESEA FLEXIBI LITY – REQ UEST U . S . D EPARTMEN T OF ED UC ATION
In previously identified, non-exited schools with significant
need the districts/schools’ District Intervention Team will play
a more active role. The Intervention Team will do the
following:
• Diagnose problem areas in district level supports and
school implementation capacity and provide
prescription(s) for solutions
• Conduct a needs assessment of the school(s) to select
the most appropriate Reform and Redesign model
• Participate in the school’s “professional dialogue” to
integrate its analysis into the district and school’s
evaluation of Year Two efforts
• Revise the redesign plan
• Budget for the implementation of the plan
• Provide oversight of plan implementation
• Design and coach effective evaluation of teachers and
principals
• Support/mentoring of principals
Previously identified, non-exited schools with the greatest
need may be subject to transfer/receivership under the
authority of the School Reform Officer pursuant to state law
1280c.
Within 90 days after
publication of Priority Schools
list (Cycle Three)
LEA submits draft school(s) redesign plan (s) to State School
Reform Officer
Within 30 days after Reform
and Redesign Plan submission*
(Cycle Three)
State School Reform officer reviews the draft plans and gives
feedback to LEA through AdvancED modified SIP templates.
Within 30 days after the draft
Reform and Redesign Plan is
reviewed and returned to the
LEA (Cycle Three)
LEA must resubmit plan for approval/disapproval:
• If redesign plan is not approved, the school will be
subject to transfer/receivership under the authority
of the School Reform Officer pursuant to state law
1280c
• If the redesign plan is approved, LEA/school uses the
remainder of the school year to put the plan in place

135
Amended July 28, 2015
ESEA FLEXIBI LITY – REQ UEST U . S . D EPARTMEN T OF ED UC ATION
as soon as possible. (At the latest - implementation
must occur the following fall*
Throughout the school year School Support Team and the Intervention Specialist, in
collaboration with the SRO, meets quarterly with Priority
School(s) School Improvement Team to monitor the
continuous improvement processes in the school.
Each school reports quarterly on its plan implementation
progress to the community in a public forum, such as local
school board meeting. This report is also submitted to the
MDE.
Schools that were previously identified, non-exited schools
with significant need schools are monitored at least monthly
by the local district superintendent (or designee) in
collaboration with the local school board to evaluate progress
on the redesign plan. Evaluation reports are shared with
schools to review progress and plan next steps for plan
implementation.
No later than June 30 (Cycle
Three)
1. The LEA district superintendent (or designee) in
collaboration with the local school board and school
must conduct a next-round “professional dialogue”
using its MDE-updated data wall to evaluate efforts to
date and consider whether to continue or adjust
chosen strategies and implementation options.
2. LEA must revise its district plan to indicate how its
Priority schools(s) will receive district supports
3. School must revise its school improvement plan
through AdvancED modified SIP templates to
incorporate components of the RAPID PROGRESS
PLAN to implement in the upcoming year, the
appropriate indicators for progress monitoring, and
the supports chosen to meet its needs.
No later than August 30 (Cycle
Three)
MDE will perform a desk review on both the district and the
school to determine whether the improvement plans have
been appropriately updated and create a file for each school
that contains baseline data for annual measurable student
achievement goals.
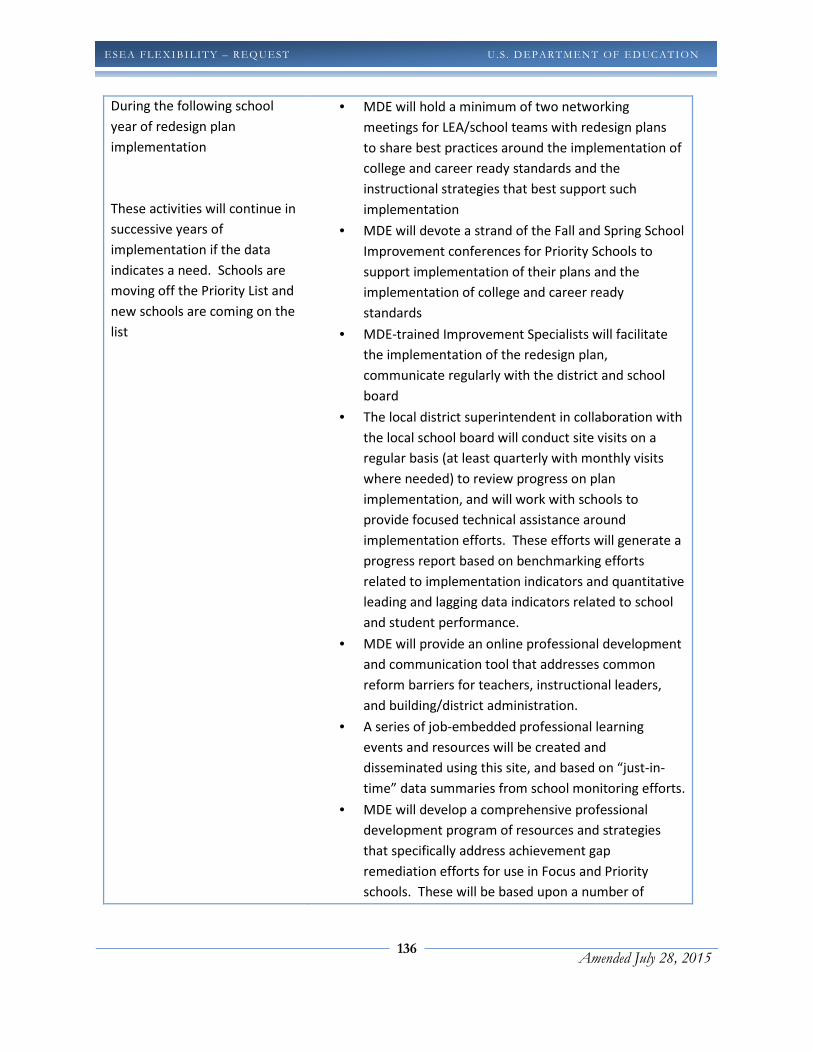
136
Amended July 28, 2015
ESEA FLEXIBI LITY – REQ UEST U . S . D EPARTMEN T OF ED UC ATION
During the following school
year of redesign plan
implementation
These activities will continue in
successive years of
implementation if the data
indicates a need. Schools are
moving off the Priority List and
new schools are coming on the
list
• MDE will hold a minimum of two networking
meetings for LEA/school teams with redesign plans
to share best practices around the implementation of
college and career ready standards and the
instructional strategies that best support such
implementation
• MDE will devote a strand of the Fall and Spring School
Improvement conferences for Priority Schools to
support implementation of their plans and the
implementation of college and career ready
standards
• MDE-trained Improvement Specialists will facilitate
the implementation of the redesign plan,
communicate regularly with the district and school
board
• The local district superintendent in collaboration with
the local school board will conduct site visits on a
regular basis (at least quarterly with monthly visits
where needed) to review progress on plan
implementation, and will work with schools to
provide focused technical assistance around
implementation efforts. These efforts will generate a
progress report based on benchmarking efforts
related to implementation indicators and quantitative
leading and lagging data indicators related to school
and student performance.
• MDE will provide an online professional development
and communication tool that addresses common
reform barriers for teachers, instructional leaders,
and building/district administration.
• A series of job-embedded professional learning
events and resources will be created and
disseminated using this site, and based on “just-in-
time” data summaries from school monitoring efforts.
• MDE will develop a comprehensive professional
development program of resources and strategies
that specifically address achievement gap
remediation efforts for use in Focus and Priority
schools. These will be based upon a number of
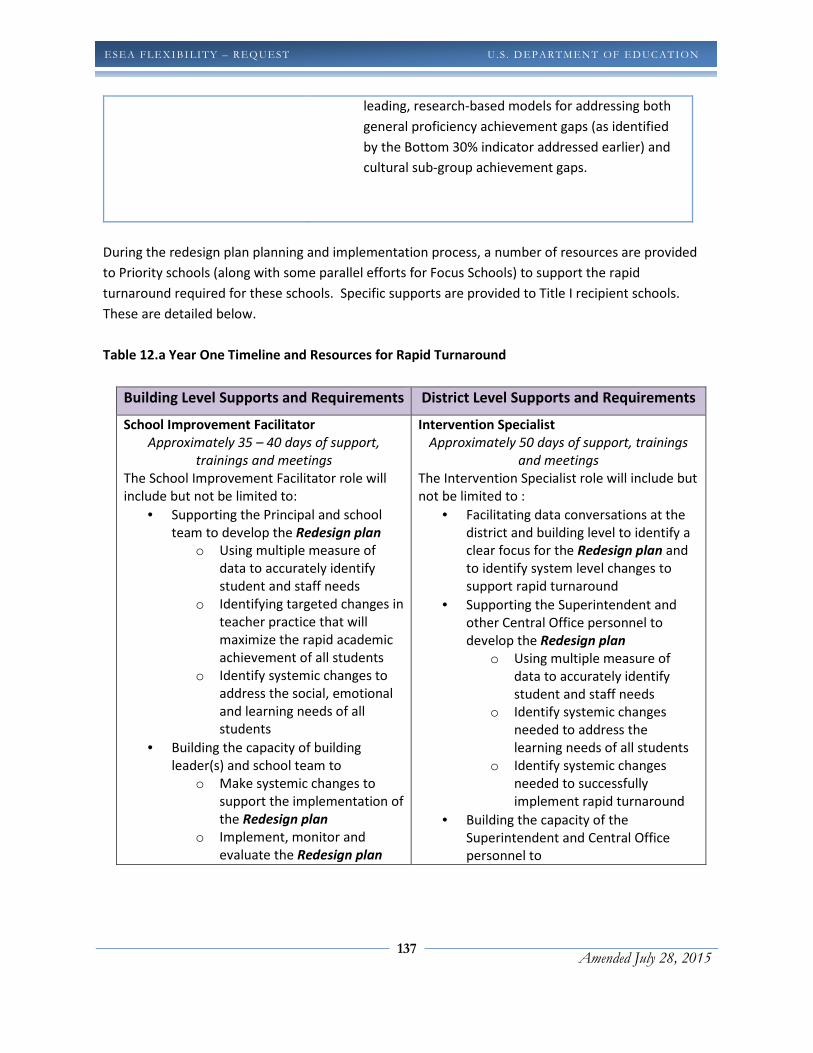
137
Amended July 28, 2015
ESEA FLEXIBI LITY – REQ UEST U . S . D EPARTMEN T OF ED UC ATION
leading, research-based models for addressing both
general proficiency achievement gaps (as identified
by the Bottom 30% indicator addressed earlier) and
cultural sub-group achievement gaps.
During the redesign plan planning and implementation process, a number of resources are provided
to Priority schools (along with some parallel efforts for Focus Schools) to support the rapid
turnaround required for these schools. Specific supports are provided to Title I recipient schools.
These are detailed below.
Table 12.a Year One Timeline and Resources for Rapid Turnaround
Building Level Supports and Requirements District Level Supports and Requirements
School Improvement Facilitator
Approximately 35 – 40 days of support,
trainings and meetings
The School Improvement Facilitator role will
include but not be limited to:
• Supporting the Principal and school
team to develop the Redesign plan
o Using multiple measure of
data to accurately identify
student and staff needs
o Identifying targeted changes in
teacher practice that will
maximize the rapid academic
achievement of all students
o Identify systemic changes to
address the social, emotional
and learning needs of all
students
• Building the capacity of building
leader(s) and school team to
o Make systemic changes to
support the implementation of
the Redesign plan
o Implement, monitor and
evaluate the Redesign plan
Intervention Specialist
Approximately 50 days of support, trainings
and meetings
The Intervention Specialist role will include but
not be limited to :
• Facilitating data conversations at the
district and building level to identify a
clear focus for the Redesign plan and
to identify system level changes to
support rapid turnaround
• Supporting the Superintendent and
other Central Office personnel to
develop the Redesign plan
o Using multiple measure of
data to accurately identify
student and staff needs
o Identify systemic changes
needed to address the
learning needs of all students
o Identify systemic changes
needed to successfully
implement rapid turnaround
• Building the capacity of the
Superintendent and Central Office
personnel to
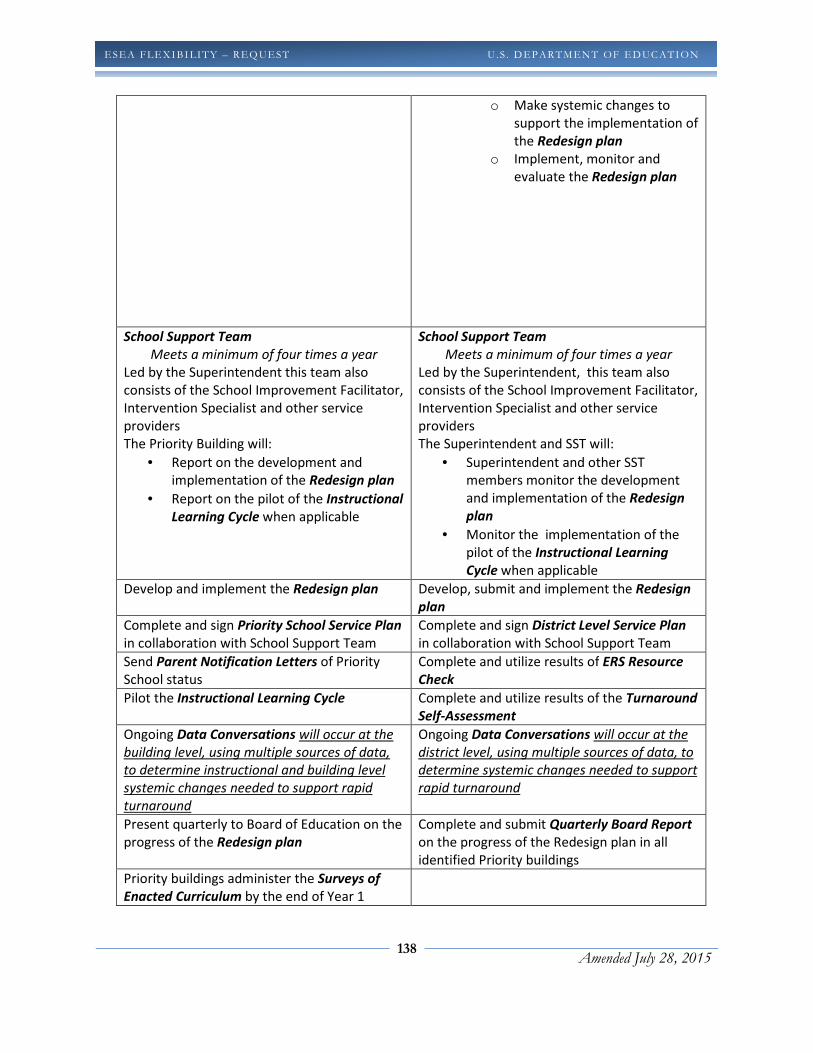
138
Amended July 28, 2015
ESEA FLEXIBI LITY – REQ UEST U . S . D EPARTMEN T OF ED UC ATION
o Make systemic changes to
support the implementation of
the Redesign plan
o Implement, monitor and
evaluate the Redesign plan
School Support Team
Meets a minimum of four times a year
Led by the Superintendent this team also
consists of the School Improvement Facilitator,
Intervention Specialist and other service
providers
The Priority Building will:
• Report on the development and
implementation of the Redesign plan
• Report on the pilot of the Instructional
Learning Cycle when applicable
School Support Team
Meets a minimum of four times a year
Led by the Superintendent, this team also
consists of the School Improvement Facilitator,
Intervention Specialist and other service
providers
The Superintendent and SST will:
• Superintendent and other SST
members monitor the development
and implementation of the Redesign
plan
• Monitor the implementation of the
pilot of the Instructional Learning
Cycle when applicable
Develop and implement the Redesign plan Develop, submit and implement the Redesign
plan
Complete and sign Priority School Service Plan
in collaboration with School Support Team
Complete and sign District Level Service Plan
in collaboration with School Support Team
Send Parent Notification Letters of Priority
School status
Complete and utilize results of ERS Resource
Check
Pilot the Instructional Learning Cycle Complete and utilize results of the Turnaround
Self-Assessment
Ongoing Data Conversations will occur at the
building level, using multiple sources of data,
to determine instructional and building level
systemic changes needed to support rapid
turnaround
Ongoing Data Conversations will occur at the
district level, using multiple sources of data, to
determine systemic changes needed to support
rapid turnaround
Present quarterly to Board of Education on the
progress of the Redesign plan
Complete and submit Quarterly Board Report
on the progress of the Redesign plan in all
identified Priority buildings
Priority buildings administer the Surveys of
Enacted Curriculum by the end of Year 1

139
Amended July 28, 2015
ESEA FLEXIBI LITY – REQ UEST U . S . D EPARTMEN T OF ED UC ATION
Table 12.b Years Two and Three Timeline and Resources for Rapid Turnaround
Building Level Supports and Requirements District Level Supports and Requirements
School Improvement Facilitator
(funded by Regional Assistance Grant)
Approximately 35 – 40 days of support,
trainings and meetings
The School Improvement Facilitator role will
include but not be limited to:
• Supporting the Principal and school
team to implement the Redesign plan
o Using multiple measure of data
to accurately identify student
and staff needs
o Identifying targeted changes in
teacher practice that will
maximize the rapid academic
achievement of all students
o Identify systemic changes to
address the social, emotional
and learning needs of all
students
• Building the capacity of building
leader(s) and school team to
o Implement, monitor and
evaluate the Redesign plan
o Implement, monitor and
evaluate effective instruction at
the classroom level
(Instructional Learning Cycle)
Intervention Specialists
(funded by Regional Assistance Grant)
Approximately 50 days of support, trainings
and meetings
The Intervention Specialist role will include but
not be limited to:
• Facilitating data conversations at the
district and building levels to support
the monitoring and evaluating of the
Redesign plan
• Supporting the Superintendent and
other Central Office personnel to
implement the Redesign plan
o Using multiple measures of
data to accurately identify
student and staff needs
o Identify systemic changes
needed to address the learning
needs of all students
o Identify systemic changes
needed to successfully
implement rapid turnaround
• Building the capacity of the
Superintendent and Central Office
personnel to
o Implement, monitor and
evaluate systemic changes
o Implement, monitor and
evaluate the Redesign plan
o Facilitate School Support Team
Meetings at least quarterly
School Support Team
Meets a minimum of four times a year
Led by the Superintendent this team also
consists of the School Improvement Facilitator,
Intervention Specialist and other service
providers
The Priority Building will:
• Report on the implementation of the
Redesign plan
School Support Team
Meets a minimum of four times a year
Led by the Superintendent this team also
consists of the School Improvement Facilitator,
Intervention Specialist and other service
providers
The Superintendent and SST will:
• Monitor the implementation of the
Redesign plan
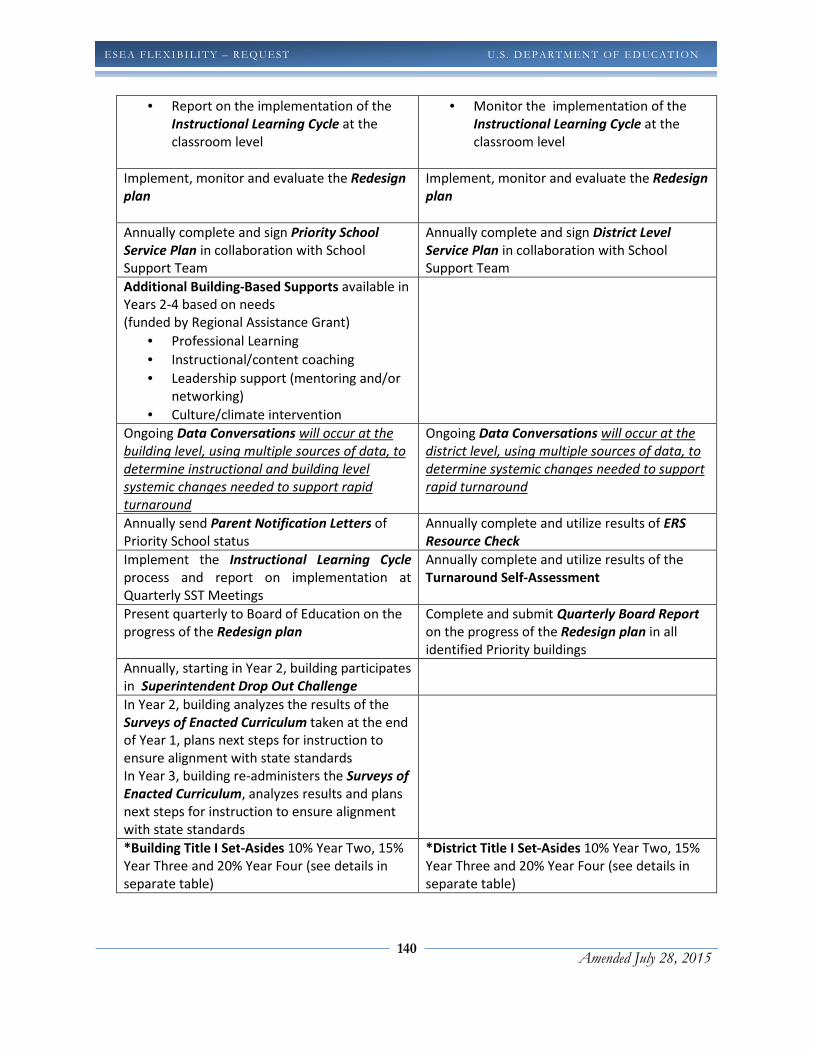
140
Amended July 28, 2015
ESEA FLEXIBI LITY – REQ UEST U . S . D EPARTMEN T OF ED UC ATION
• Report on the implementation of the
Instructional Learning Cycle at the
classroom level
• Monitor the implementation of the
Instructional Learning Cycle at the
classroom level
Implement, monitor and evaluate the Redesign
plan
Implement, monitor and evaluate the Redesign
plan
Annually complete and sign Priority School
Service Plan in collaboration with School
Support Team
Annually complete and sign District Level
Service Plan in collaboration with School
Support Team
Additional Building-Based Supports available in
Years 2-4 based on needs
(funded by Regional Assistance Grant)
• Professional Learning
• Instructional/content coaching
• Leadership support (mentoring and/or
networking)
• Culture/climate intervention
Ongoing Data Conversations will occur at the
building level, using multiple sources of data, to
determine instructional and building level
systemic changes needed to support rapid
turnaround
Ongoing Data Conversations will occur at the
district level, using multiple sources of data, to
determine systemic changes needed to support
rapid turnaround
Annually send Parent Notification Letters of
Priority School status
Annually complete and utilize results of ERS
Resource Check
Implement the Instructional Learning Cycle
process and report on implementation at
Quarterly SST Meetings
Annually complete and utilize results of the
Turnaround Self-Assessment
Present quarterly to Board of Education on the
progress of the Redesign plan
Complete and submit Quarterly Board Report
on the progress of the Redesign plan in all
identified Priority buildings
Annually, starting in Year 2, building participates
in Superintendent Drop Out Challenge
In Year 2, building analyzes the results of the
Surveys of Enacted Curriculum taken at the end
of Year 1, plans next steps for instruction to
ensure alignment with state standards
In Year 3, building re-administers the Surveys of
Enacted Curriculum, analyzes results and plans
next steps for instruction to ensure alignment
with state standards
*Building Title I Set-Asides 10% Year Two, 15%
Year Three and 20% Year Four (see details in
separate table)
*District Title I Set-Asides 10% Year Two, 15%
Year Three and 20% Year Four (see details in
separate table)
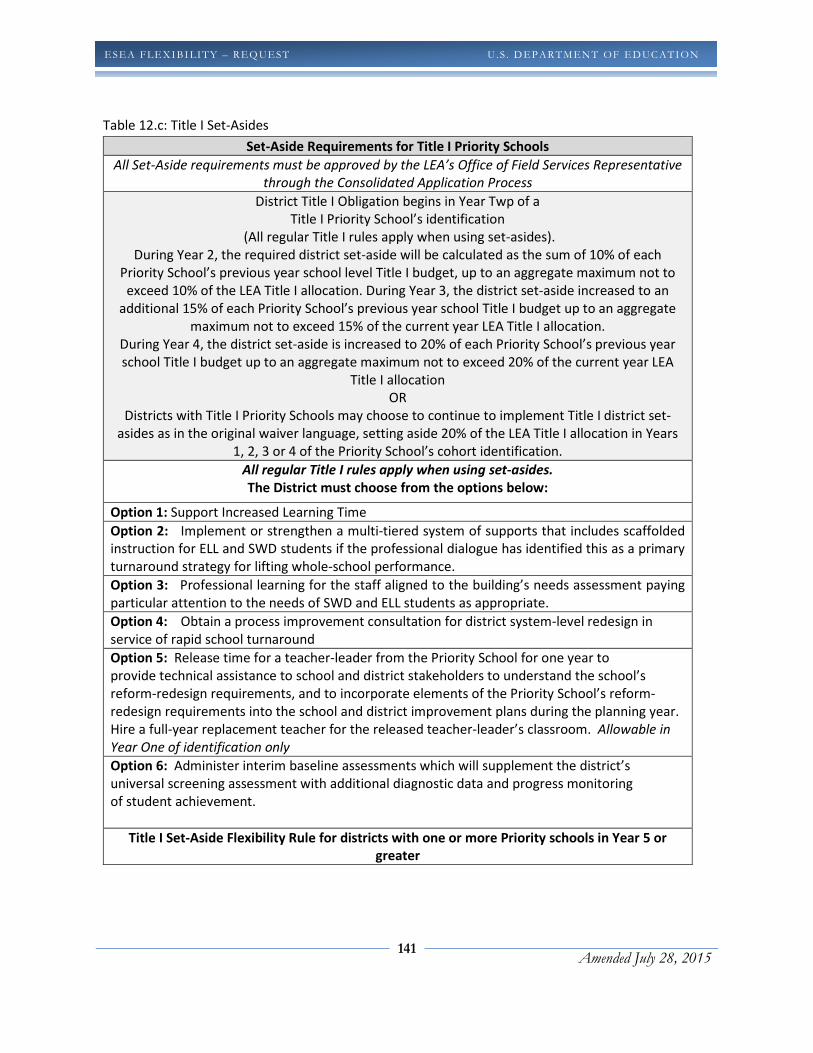
141
Amended July 28, 2015
ESEA FLEXIBI LITY – REQ UEST U . S . D EPARTMEN T OF ED UC ATION
Table 12.c: Title I Set-Asides
Set-Aside Requirements for Title I Priority Schools
All Set-Aside requirements must be approved by the LEA’s Office of Field Services Representative
through the Consolidated Application Process
District Title I Obligation begins in Year Twp of a
Title I Priority School’s identification
(All regular Title I rules apply when using set-asides).
During Year 2, the required district set-aside will be calculated as the sum of 10% of each
Priority School’s previous year school level Title I budget, up to an aggregate maximum not to
exceed 10% of the LEA Title I allocation. During Year 3, the district set-aside increased to an
additional 15% of each Priority School’s previous year school Title I budget up to an aggregate
maximum not to exceed 15% of the current year LEA Title I allocation.
During Year 4, the district set-aside is increased to 20% of each Priority School’s previous year
school Title I budget up to an aggregate maximum not to exceed 20% of the current year LEA
Title I allocation
OR
Districts with Title I Priority Schools may choose to continue to implement Title I district set-
asides as in the original waiver language, setting aside 20% of the LEA Title I allocation in Years
1, 2, 3 or 4 of the Priority School’s cohort identification.
All regular Title I rules apply when using set-asides.
The District must choose from the options below:
Option 1: Support Increased Learning Time
Option 2: Implement or strengthen a multi-tiered system of supports that includes scaffolded
instruction for ELL and SWD students if the professional dialogue has identified this as a primary
turnaround strategy for lifting whole-school performance.
Option 3: Professional learning for the staff aligned to the building’s needs assessment paying
particular attention to the needs of SWD and ELL students as appropriate.
Option 4: Obtain a process improvement consultation for district system-level redesign in
service of rapid school turnaround
Option 5: Release time for a teacher-leader from the Priority School for one year to
provide technical assistance to school and district stakeholders to understand the school’s
reform-redesign requirements, and to incorporate elements of the Priority School’s reform-
redesign requirements into the school and district improvement plans during the planning year.
Hire a full-year replacement teacher for the released teacher-leader’s classroom. Allowable in
Year One of identification only
Option 6: Administer interim baseline assessments which will supplement the district’s
universal screening assessment with additional diagnostic data and progress monitoring of student achievement.
Title I Set-Aside Flexibility Rule for districts with one or more Priority schools in Year 5 or
greater
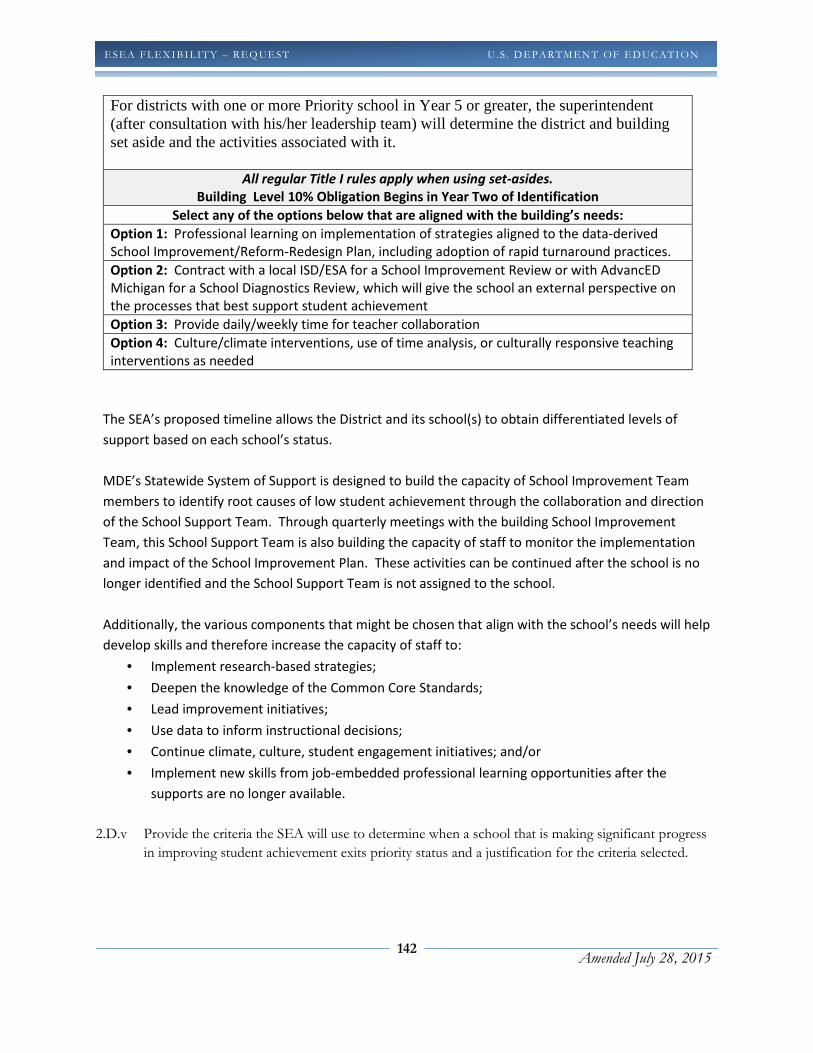
142
Amended July 28, 2015
ESEA FLEXIBI LITY – REQ UEST U . S . D EPARTMEN T OF ED UC ATION
For districts with one or more Priority school in Year 5 or greater, the superintendent (after consultation with his/her leadership team) will determine the district and building set aside and the activities associated with it.
All regular Title I rules apply when using set-asides.
Building Level 10% Obligation Begins in Year Two of Identification
Select any of the options below that are aligned with the building’s needs:
Option 1: Professional learning on implementation of strategies aligned to the data-derived
School Improvement/Reform-Redesign Plan, including adoption of rapid turnaround practices.
Option 2: Contract with a local ISD/ESA for a School Improvement Review or with AdvancED
Michigan for a School Diagnostics Review, which will give the school an external perspective on
the processes that best support student achievement
Option 3: Provide daily/weekly time for teacher collaboration
Option 4: Culture/climate interventions, use of time analysis, or culturally responsive teaching
interventions as needed
The SEA’s proposed timeline allows the District and its school(s) to obtain differentiated levels of
support based on each school’s status.
MDE’s Statewide System of Support is designed to build the capacity of School Improvement Team
members to identify root causes of low student achievement through the collaboration and direction
of the School Support Team. Through quarterly meetings with the building School Improvement
Team, this School Support Team is also building the capacity of staff to monitor the implementation
and impact of the School Improvement Plan. These activities can be continued after the school is no
longer identified and the School Support Team is not assigned to the school.
Additionally, the various components that might be chosen that align with the school’s needs will help
develop skills and therefore increase the capacity of staff to:
• Implement research-based strategies;
• Deepen the knowledge of the Common Core Standards;
• Lead improvement initiatives;
• Use data to inform instructional decisions;
• Continue climate, culture, student engagement initiatives; and/or
• Implement new skills from job-embedded professional learning opportunities after the
supports are no longer available.
2.D.v Provide the criteria the SEA will use to determine when a school that is making significant progress
in improving student achievement exits priority status and a justification for the criteria selected.
143
Amended July 28, 2015
ESEA FLEXIBI LITY – REQ UEST U . S . D EPARTMEN T OF ED UC ATION
In order to exit Priority designation a school must meet all of the following requirements in the same
year:
• Top-to-Bottom Requirement: A school must have Top-to-Bottom Percentile Rank of 5 or
higher in the most recent year for Exit consideration.
• Scorecard Requirement: A school must meet its Annual Measurable Objective for both
subject areas of mathematics and English language arts in the All Students subgroup.
• Assessment Participation Requirement – The school must have a 95% participation rate on all
required state assessments or have otherwise demonstrated satisfactory participation
according their Accountability Scorecard.
While the Top-to-Bottom list in itself is used to identify schools as Priority (schools with percentile
ranks of 0 - 4), the purpose of this exit criteria is to provide a more holistic approach for exiting
schools to ensure that they are on track to meeting proficiency goals for all students and keeping
them from falling back into Priority school status.
The exit criteria described above will be used to exit Priority schools from the 2010 and 2011 cohorts
by the end of the 2014-15 school year.
While the MDE does not intend to use data during the years of transitions to new career- and college-
ready standards-aligned assessments to make high-stakes accountability identification decisions, it is
important that schools identified as Priority using data from previous assessments not be held captive
to a high-stakes identification from which it cannot exit. Therefore, Priority schools identified in the
2012 cohort will also be eligible to exit when data is available from the 2015-2016 state assessments.
Implementation of these exit criteria will be monitored to ensure that they continue to be an
accurate predictor of continued improvement. Should a significant number of exited schools re-enter
the bottom 5%, consideration will be given to requiring that schools meet the exit criteria for two
consecutive years in order to exit Priority status.
2.E FOCUS SCHOOLS
2.E.i Describe the SEA’s methodology for identifying a number of low-performing schools equal to at least
10 percent of the State’s Title I schools as “focus schools.” If the SEA’s methodology is not based on the
definition of focus schools in ESEA Flexibility (but instead, e.g. based on school grades or ratings that take
into account a number of factors), the SEA should also demonstrate that the list provided in Table 2 is
consistent with the definition, per the Department’s “Demonstrating that an SEA’s Lists of Schools meet
ESEA Flexibility Definitions” guidance.
MDE will use the Focus school designation to identify and support schools with the largest achievement
gaps. To do this, MDE proposes to continue using the Bottom 30% subgroup (as described in Section
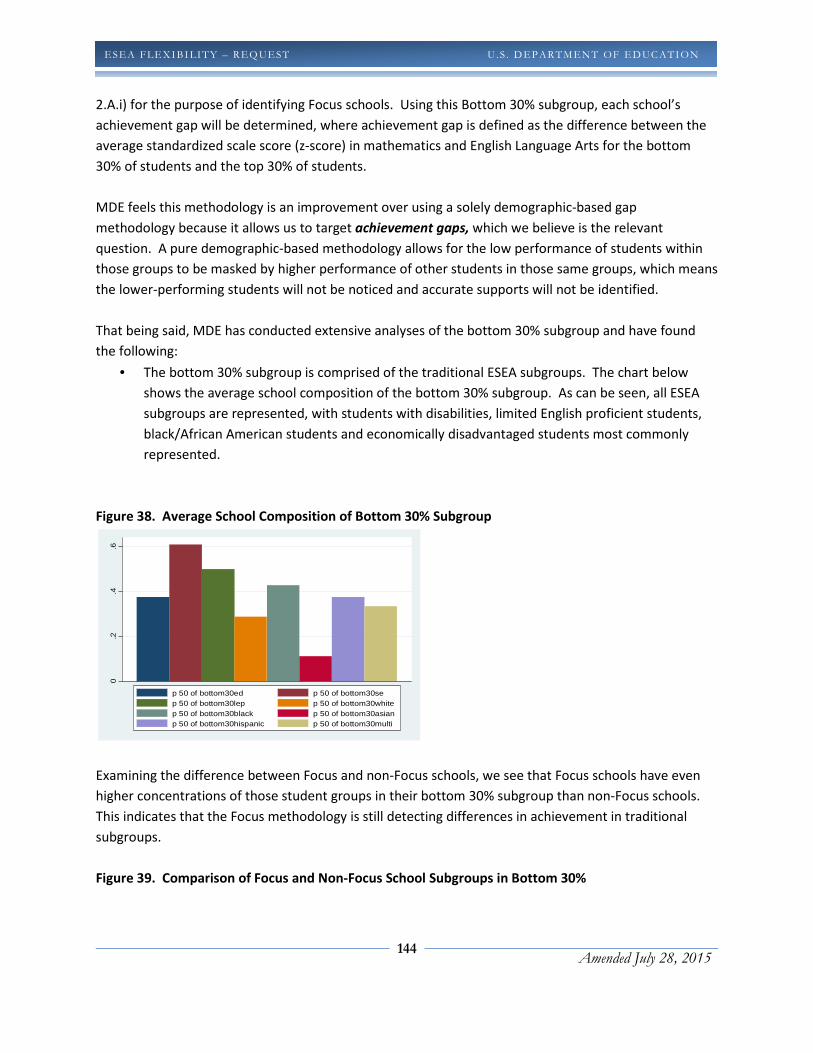
144
Amended July 28, 2015
ESEA FLEXIBI LITY – REQ UEST U . S . D EPARTMEN T OF ED UC ATION
2.A.i) for the purpose of identifying Focus schools. Using this Bottom 30% subgroup, each school’s
achievement gap will be determined, where achievement gap is defined as the difference between the
average standardized scale score (z-score) in mathematics and English Language Arts for the bottom
30% of students and the top 30% of students.
MDE feels this methodology is an improvement over using a solely demographic-based gap
methodology because it allows us to target achievement gaps, which we believe is the relevant
question. A pure demographic-based methodology allows for the low performance of students within
those groups to be masked by higher performance of other students in those same groups, which means
the lower-performing students will not be noticed and accurate supports will not be identified.
That being said, MDE has conducted extensive analyses of the bottom 30% subgroup and have found
the following:
• The bottom 30% subgroup is comprised of the traditional ESEA subgroups. The chart below
shows the average school composition of the bottom 30% subgroup. As can be seen, all ESEA
subgroups are represented, with students with disabilities, limited English proficient students,
black/African American students and economically disadvantaged students most commonly
represented.
Figure 38. Average School Composition of Bottom 30% Subgroup
Examining the difference between Focus and non-Focus schools, we see that Focus schools have even
higher concentrations of those student groups in their bottom 30% subgroup than non-Focus schools.
This indicates that the Focus methodology is still detecting differences in achievement in traditional
subgroups.
Figure 39. Comparison of Focus and Non-Focus School Subgroups in Bottom 30%
0.2
.4.6
p 50 of bottom30ed p 50 of bottom30sep 50 of bottom30lep p 50 of bottom30whitep 50 of bottom30black p 50 of bottom30asianp 50 of bottom30hispanic p 50 of bottom30multi
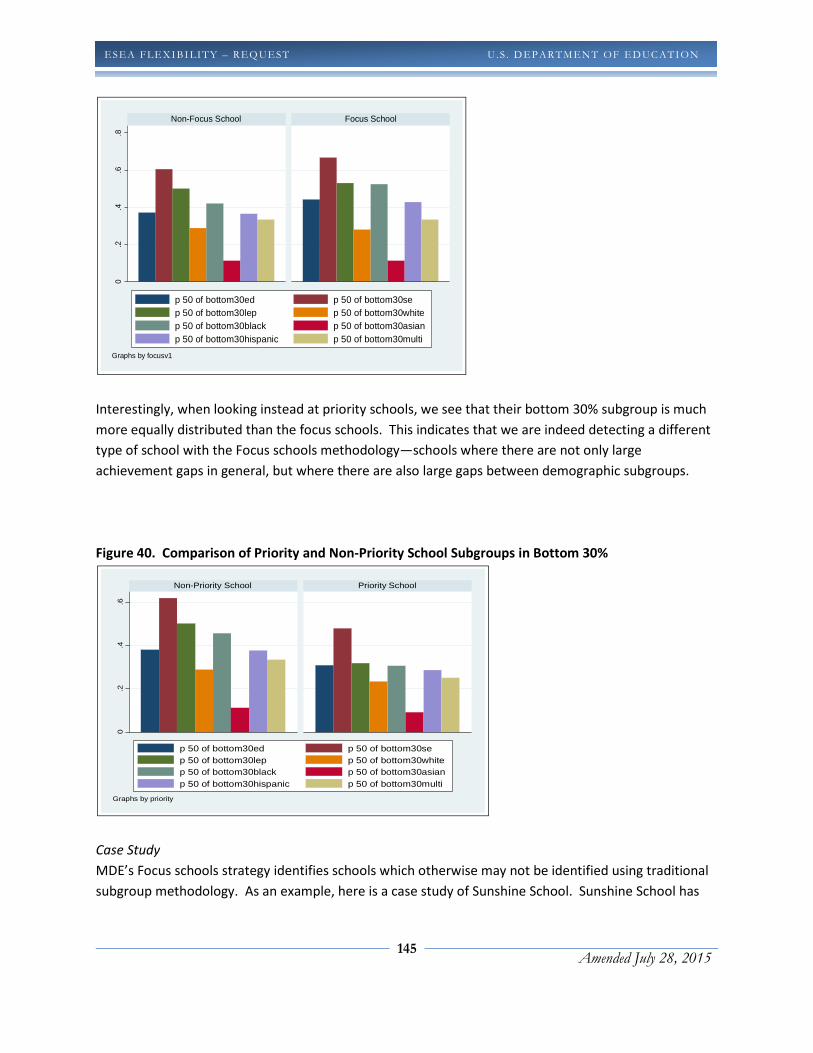
145
Amended July 28, 2015
ESEA FLEXIBI LITY – REQ UEST U . S . D EPARTMEN T OF ED UC ATION
Interestingly, when looking instead at priority schools, we see that their bottom 30% subgroup is much
more equally distributed than the focus schools. This indicates that we are indeed detecting a different
type of school with the Focus schools methodology—schools where there are not only large
achievement gaps in general, but where there are also large gaps between demographic subgroups.
Figure 40. Comparison of Priority and Non-Priority School Subgroups in Bottom 30%
Case Study
MDE’s Focus schools strategy identifies schools which otherwise may not be identified using traditional
subgroup methodology. As an example, here is a case study of Sunshine School. Sunshine School has
0.2
.4.6
.8Non-Focus School Focus School
p 50 of bottom30ed p 50 of bottom30sep 50 of bottom30lep p 50 of bottom30whitep 50 of bottom30black p 50 of bottom30asianp 50 of bottom30hispanic p 50 of bottom30multi
Graphs by focusv1
0.2
.4.6
Non-Priority School Priority School
p 50 of bottom30ed p 50 of bottom30sep 50 of bottom30lep p 50 of bottom30whitep 50 of bottom30black p 50 of bottom30asianp 50 of bottom30hispanic p 50 of bottom30multi
Graphs by priority
146
Amended July 28, 2015
ESEA FLEXIBI LITY – REQ UEST U . S . D EPARTMEN T OF ED UC ATION
167 students, 115 of which are white. In the traditional ESEA subgroup methodology, the school would
only have had an economic disadvantaged subgroup (which includes 67 students); the 21 black students,
1 Native American student, 8 Asian students, 4 Hispanic students, and 18 multiracial students would not
have been detected (as they would not have met the minimum n-size). Also, the 22 students with
disabilities would not have shown up as a valid subgroup.
Using the Focus schools and the bottom 30% methodology, the bottom 30% subgroup consists of 50
students, including 12 black students, 1 Asian student, 3 Hispanic student, 23 white students, and 11
multiracial students, as well as 8 of the 22 students with disabilities and 29 of the 67 economically
disadvantaged students. A couple of notes:
• This methodology actually brings to light 35 students who would not be detected using a
demographic subgroup based methodology.
• In the economic disadvantage subgroup, 29 students are in the bottom 30%. However, if we
were only using the economic disadvantaged demographic criteria, the higher performance of
the other 38 students in the subgroup would likely have masked the lower performance of these
29 students.
• In the students with disabilities subgroup, all of those 22 students would have been hidden
using a straight demographic methodology. However, in this methodology, the school is held
accountable on the performance of 8 of those 22—the eight students who are lowest
performing. This highlights the fact that the bottom 30% subgroup is not exclusively students
with disabilities, and instead, the bottom 30% subgroup consists of the lowest performing
students in those subgroups.
Stakeholders have pointed out that this methodology will identify some schools that are relatively high-
performing overall but also have a large achievement gap and have questioned the appropriateness of
this policy. MDE believes it is appropriate to hold accountable any school for having a large
achievement gap (regardless of whether it is overall high- or low-performing) because, as our core
values state, we want to increase achievement and see growth in ALL of our students. At the same time,
MDE recognizes there will be cases where schools with large achievement gaps between their bottom
30% and top 30% also have high-performing bottom 30% subgroups. Since the intent of the Focus
school status is to incentivize schools to support both their highest and lowest performing students,
work these schools are already doing, an audit to identify high-achieving bottom 30% subgroups was
developed. This audit will be used both to provide an exception to preclude entry to Focus school status
and as exit criteria for identified schools from Focus school status.
Additionally, some stakeholders have pointed out that this methodology will identify some schools
whose gap results from the deliberate juxtaposition of two populations as part of a strategic and
demonstrably successful effort to accelerate the learning trajectory of the lowest achievers. For these
schools, even though the rapid improvement trajectory (for example, successful assimilation of refugee

147
Amended July 28, 2015
ESEA FLEXIBI LITY – REQ UEST U . S . D EPARTMEN T OF ED UC ATION
students into a general population) can be established, the high gap will remain indefinitely (because,
for example, of fresh populations of immigrant students each year).
Supported by stakeholder feedback, the MDE acknowledges that various types of schools with unique
root causes will be identified as Focus schools. Thus, the support system of deep diagnostic data,
facilitated professional dialogue and customized interventions will be used to identify the appropriate
type of interventions and supports for each Focus school. All schools will still be held accountable, but
this approach recognized that not all interventions require transformative strategies; some will consist
of holding steady what is working well while strengthening or deepening efforts with the particular low-
performing population.
We also examined the relationship between the size of the achievement gap and the overall
achievement level of the schools. Looking at Figure 41 below, we can see that there are relatively high
achieving schools with very large gaps—but there are also high-achieving schools WITHOUT large gaps.
Similarly, there are lower achieving schools with large gaps as well.
Figure 41. Distribution of Focus schools by achievement measure.
One final concern about Focus schools that we have heard from stakeholders is that a low-achieving
school may not be identified as a Focus school because it avoids a large gap—but it is in need of
interventions and support. This is where the system of differentiated accountability works together. A
very low-performing school will be identified as a Priority school; schools that are slightly higher than
the bottom 5% but that are still low-performing will likely receive a “Red” on the Accountability
Scorecard, which serves to put them on warning that their achievement levels need to increase in order
for them to avoid the more substantial sanctions associated with Priority schools.
-4.5
-3.5
-2.5
-1.5
-0.5
0.5
1.5
2.5
3.5
-4 -3 -2 -1 0 1 2 3 4
Co
mp
osi
te A
chie
ve
me
nt
Ga
p M
ea
sure
Composite Achievement Measure
Focus Schools
Non-Focus Schools
148
Amended July 28, 2015
ESEA FLEXIBI LITY – REQ UEST U . S . D EPARTMEN T OF ED UC ATION
Focus schools are one of many methods in the system to identify schools in need of
interventions and support, and will be a critical component to Michigan achieving one of our
key goals—to close the achievement gap within schools and reduce the achievement gap
statewide. This will only happen if we hold every school accountable for achieving success
with all of its students.
Criteria for Entering Focus School Identification and Supports
MDE will use achievement gap, defined as the difference between the average standardized scale score
(z-score) in English Language Arts and mathematics for the bottom 30% of students and the top 30% of
students to identify and support schools most struggling to provide equitable outcomes for all students.
Entrance into the Focus school status based upon achievement gaps (Focus-Gaps) will only be
considered every third year, with the next naming to occur in fall 2017.
Entrance into the Focus school status based on graduation rates (Focus-Grad) will be
considered every year.
Each year
o Each eligible school’s achievement gap is determined
o Schools are ranked by their achievement gap and those with gaps larger than or equal to
the lowest 10% of Title I schools are identified
� The data are filtered to include only Title I schools
� Title I schools are ranked by their achievement gap
� A threshold identifying the lowest 10% of Title I schools is set
� The data are unfiltered to include all schools (both Title I and non-Title I)
� Any school below the threshold identifying the lowest 10% of Title I schools is
identified
o Audits are applied to allow exceptions for schools having large achievement gaps but
which are already meeting the exit criteria described below (i.e., they are already
engaged in behaviors Focus school status is meant to incentivize).
o For schools that graduate students,
� The most recent two years of graduation rates are determined
� Schools that have two consecutive years of graduation rates below 60% will be
named Focus schools
• In Focus-Gap non-naming years (Cycle 1 and Cycle 2), schools having the largest achievement
gaps and not meeting any of the audit exceptions will be notified that they are “At-Risk” of
potentially being named Focus schools in the upcoming high-stakes naming year so that they
can take appropriate action.
• In Focus-Gap naming years (Cycle 3), schools identified in the lowest 10% in both Cycle 2 and
Cycle 3 (and that have not met any exception audits) will be identified as Focus schools and
added to the existing group of Focus schools that have not met exit criteria (described below).

149
Amended July 28, 2015
ESEA FLEXIBI LITY – REQ UEST U . S . D EPARTMEN T OF ED UC ATION
Should the total number of newly identified and continuing Focus schools not meet the 10%
threshold, additional schools from Cycle 3 will be added, starting at the bottom of the Cycle 3
ranking until the 10% threshold has been met.
2.E.ii Provide the SEA’s list of focus schools in Table 2.
2.E.iii Describe the process and timeline the SEA will use to ensure that its LEAs that have one or more
focus schools will identify the specific needs of the SEA’s focus schools and their students and
provide examples of and justifications for the interventions focus schools will be required to
implement to improve the performance of students who are the furthest behind.
All schools in Michigan are required to participate in a robust data analysis process to identify the
specific needs of their students. The MDE provides all schools with the tools to conduct this data
analysis, including
• MISchoolData (www.mischooldata.org): an online data portal that all schools can access to
review various reports, including state-level student achievement data, student enrollment,
teacher staffing, and graduation rates.
• School Data Analysis: a required school improvement process to guide schools in analyzing
achievement, demographic, process, and perceptual data.
• School Systems Review or Interim Self-Assessment/Self-Assessment (AdvancED accredited
schools): a self-assessment of the research-based processes in place schoolwide to support
student achievement in four strands: Teaching for Learning; Leading for Learning; Professional
Learning; and School, Family, and Community Relations.
In addition, Focus schools are additionally required to use the Achievement Gap Tool developed by the MDE to
analyze the student groups that are over- and under-represented in the bottom 30% subgroup. This
data tool gives the leadership team focus in their data conversations to adapt the teaching and
learning priorities that increase access for students around gap areas for their school improvement
process.
Focus School Requirements and Supports
MDE views the district as the primary point of intervention for Focus Schools. These schools have
partially proficient systems in place, as evidenced by many of their students achieving success.
Districts must have data conversations at the district level that include a self-assessment using the
MDE District Systems Review or the District Self-Assessment/Interim Self-Assessment (for AdvancED
accredited districts) and/or the Education Resource Strategies Resource Check or School Check to
determine district priorities in:
• Teaching and Learning
• Leadership for Learning

150
Amended July 28, 2015
ESEA FLEXIBI LITY – REQ UEST U . S . D EPARTMEN T OF ED UC ATION
• Professional Learning
• Family, School and Community Relations
Beginning in Year One Re-identified (see Table 14 below), districts will also take the appropriate
Education Resource Strategies self-assessment. Districts may choose to also take an ERS self-
assessment in earlier identification years.
Over the past three years, MDE has documented that approximately 38% of Focus Schools are not
identified a second year and therefore have had their requirements and supports conditionally
suspended. With the guidance and supports that have been provided to districts, many schools have
figured out how to better serve their bottom 30%. In light of what has been learned in the initial
years of implementation for supports and interventions to Focus schools, the MDE is structuring the
requirements and supports to apply increasing pressure and accountability on the district to improve
systems of support to its Focus Schools while maintaining flexibility in the earlier years of
identification. Table 14 below shows the increasing levels of supports and requirements over the new
identification cycle:
• Year One Schools are newly identified schools in the three year identification cycle
• Year Two Schools continue as Focus due to the requirement of meeting the exit criteria for
two consecutive years.
• Year Three Schools did not meet the exit criteria in the third year of the identification cycle.
Given that the exit criteria will not be available until after the start of the school year, the
school will begin the school year as a Year Two School. If the school meets the Exit Criteria for
the second consecutive year, it may be released from Focus School supports and requirements
mid-year OR it may continue operating as a Focus School continuing all supports and
requirements to build sustainability through the end of the school year. If the school does not
meet the Exit Criteria, it begins operating as a Year Three School.
• Year One Reidentified Schools are again identified as Focus in the three year identification
cycle. Given that the exit criteria will not be available until after the start of the school year,
the school will begin the school year as a Year Three School. If the school meets the Exit
Criteria for the second consecutive year it may be released from Focus School supports and
requirements mid-year OR it may continue operating as a Focus School continuing all supports
and requirements to build sustainability through the end of the school year. If the school does
not meet the Exit Criteria, it begins operating as a Year One Reidentified School.
• Year Two Reidentified Schools did not meet the exit criteria for the fourth year in a row.
Given that the exit criteria will not be available until after the start of the school year, the
school will begin the school year as a Year One Reidentified School. If the school meets the Exit
Criteria for the second consecutive year it may be released from Focus School supports and
requirements mid-year OR it may continue operating as a Focus School continuing all supports

151
Amended July 28, 2015
ESEA FLEXIBI LITY – REQ UEST U . S . D EPARTMEN T OF ED UC ATION
and requirements to build sustainability through the end of the school year. If it does not
meet the exit criteria, it moves to a Year Three Reidentified School.
The components of the requirements and support are described below in Table 14, which adds
further details to the timeline of implementation as well as demonstrates the flexibility in the earlier
years of identification and the increasing accountability in later years of identification.
The 2012, 2013 and 2014 cohorts of Focus Schools will continue to implement the same requirements
and supports that they implemented in the 2014-15 school year. These requirements and supports
will continue with currently identified Focus Schools in SY 2015-16 and SY 2016-17. Newly identified
Focus Schools next identified in 2017-18 will begin implementation of requirements and supports in
2017-18 as detailed in Table 14 below.
Table 14: Timeline for Focus School Requirements and Supports beginning with the 2017/18
Identification Cycle
An X indicates the requirement for all Focus Schools. Title I indicates that these requirements and
supports are only for Title I schools. The Title I supports are provided through the Statewide System of
Support.
Requirements and
Supports
Year
One
Year
Two
Year
Three
Year One Reidentified
Year Two Reidentified
Parent Notification Letters Title I Title I Title I Title I Title I
District Level Service Plans Title I Title I Title I Title I Title I
Data Analysis and
Diagnostic Conversations
including using the
Achievement Gap Tool to
identify Teaching and
Learning Priorities
X
X
X
X
X
Post identified Teaching
and Learning Priorities in
ASSIST
X X X X X
School Improvement Plan is
revised
X X X X X
MTSS (see descriptions
below)
X Universal
X Universal
X Targeted
X Intensive
X Intensive
Surveys of Enacted
Curriculum
Title I Title I Title I
MI Toolkit X X X X X

152
Amended July 28, 2015
ESEA FLEXIBI LITY – REQ UEST U . S . D EPARTMEN T OF ED UC ATION
District Systems Review or
Interim SA/SA at central
office
X X X X X
ERS Resource Check at
central office optional in
Years One, Two and Three
X X
District Improvement Plan
is revised
X X X X X
Quarterly Board Reports X X X X X
District Improvement
Facilitator
Title 1
40 hours
Title I
40 hours
Title I
160 hours
Title I
160 hours
Title I
160 hours
Program Evaluation Tool
must evaluate the
implementation of MTSS
focusing on the efficacy of
Tier One strategies in SIP
X
X
X
X
X
Title I Set-Asides (increase
as school progresses in
years) –see Table 15 below
Title I
District
& School
Title I
District &
School
Title I
District &
School
Title I
District &
School
Superintendent’s Dropout
Challenge Optional in Years
One and Two if students’
social/emotional needs are
currently part of school’s
MTSS screening/structure
X X X
District Intervention Team Title I Title I Title I
Table 15: Title I Set-Asides
Set-Aside Requirements for Title I Focus Schools
District Title I Obligation begins in Year 2 of a Focus School’s identification
(All regular Title I rules apply when using set-asides).
The required district set-aside will be calculated as the sum of 10% of each Focus School’s
previous year Title I budget, up to a maximum 10% district set-aside. During Year 3, the district
set-aside increased to an additional 5% of each Focus School’s previous year Title I budget up to
a maximum of 15% district set-aside. During Year One Reidentification, the district set-aside
increases to an additional 5% of each Focus School’s previous year Title I budget up to a
maximum of 20% set-aside. This maximum remains in place for any Reidentification Year.
A District may choose from the options below:

153
Amended July 28, 2015
ESEA FLEXIBI LITY – REQ UEST U . S . D EPARTMEN T OF ED UC ATION
Option 1: Provide a multi-tiered system of supports that includes scaffolded instruction for
SWD and ELL students if the school does not currently implement one. If the school implements
such a system, deepen or broaden the scope or enhance the fidelity of its implementation.
Option 2: Professional learning on research-based interventions aligned to building’s
comprehensive needs assessment, including coaching and support for administration
Building Level 10% Obligation beginning in Year 2 of identification
Select at least one of the options below:
Option 1: Professional development on implementation of multi-tiered system of supports
including meeting academic and behavioral/health needs of all students, including coaching and
support for administration
Option 2: Provide weekly/daily time for teacher collaboration
Option 3: Contract for the administration of Surveys of Enacted Curriculum
Option 4: Contract with the local ISD/ESA for a School Improvement Review or AdvancEd
Michigan for a School Diagnostic Review, which will give the school an external perspective on
processes that best support student achievement
Option 5: Professional learning on the alternate achievement standards for students that take
an alternate assessment
Option 6: Use of a research/evidence-based intervention that demonstrates a coherent and
comprehensive approach for improve academic proficiency for English language learners.
Option 7: Culture/climate interventions or culturally-responsive teaching interventions as
needed
Description of Requirements and Supports
Note that the bolded items are referenced in Table 14 above.
During each year in which one or more of its schools is identified as a Focus School, a district is
required to ensure that the school:
• Conducts facilitated, diagnostic data conversations to identify one or two major changes in
teaching and learning practices capable of increasing achievement levels among the lowest
performing students and post these conclusions in the ASSIST Focus School Diagnostic.

154
Amended July 28, 2015
ESEA FLEXIBI LITY – REQ UEST U . S . D EPARTMEN T OF ED UC ATION
• Revises its School Improvement Plan (SIP) to reflect the Teaching and Learning Priorities and
describes how the MTSS is being strengthened to deepen the fidelity of its implementation of
Tier One instruction so that 85% of students are successful and describes how learning is
differentiated for the 15% of students requiring Tiers Two or Three instruction.
• Uses the required MDE Program Evaluation Tool to evaluate the success of Tier One
instruction. Criteria will include the local student achievement data that indicates proficiency
in achievement and behavioral expectations for 85% of students.
• Participates in the Superintendent’s Dropout Challenge (SDC); required beginning in Year
Three of identification. The SDC is optional in Years One and Two if the school’s MTSS
screening/structure supports students’ social and emotional needs. The intended focus of the
SDC has expanded to all Michigan students as part of their MTSS. As districts and schools
build their systems, they will provide both academic and behavioral supports to ALL students
to keep them on track for graduation. The identification of 10 – 15 students is the minimum
requirement of the SDC with the intent that districts/schools will view this work at the
systems level to build in multiple levels of instruction, interventions, and assessments.
While the superintendent* is ensuring that the Focus School is implementing the above requirements
and supports to increase the achievement of the bottom 30% of students, the district itself also has
requirements and supports:
• Hold its own professional data conversations to identify the system changes needed to
support their Focus Schools in implementing its teaching/learning changes. All districts are
required to complete the MDE District Systems Review (DSR) or Self-Assessment/Interim Self-
Assessment (SA/Interim SA is for AdvancED accredited districts.) An optional self-assessment
for districts with Years One, Two and Three Focus Schools is the Education Resource
Strategies Resource Check tool http://www.erstrategies.org/library/resourcecheck or the
Education Resource Strategies School Check
http://www.erstrategies.org/assessments/school_check , both of which are available at no
cost. These ERS self-assessments are required beginning in Year One Reidentification.
• Revise its District Improvement Plan to specify one or two major changes in its school
support system for Focus Schools and potentially amend its consolidated application if shifts
in budgeting are needed.
• Monitor and evaluate the Focus School’s School Improvement Plan to ensure that the
teaching and learning priorities that were identified to increase the achievement of the
bottom 30% of students are being implemented with fidelity and validated with adult
implementation data as well as classroom-level student achievement data.
• Use the online MI Toolkit (http://mitoolkit.org) to identify resources to share with schools in
support of special populations and tools to enhance district support of its Focus Schools.
• Provide progress reports on the implementation of the Focus School supports, interventions,
and achievement increases of the bottom 30% of students to the LEA school board using the

155
Amended July 28, 2015
ESEA FLEXIBI LITY – REQ UEST U . S . D EPARTMEN T OF ED UC ATION
Quarterly Board Report template. These districts will upload these reports into the MDE
MEGS+ system quarterly.
Title I schools receive supports in addition to those described above through the Statewide System of
Support. Since MDE expects that the district will be the primary point of support and intervention
for Focus Schools, a state-funded and trained District Improvement Facilitator (DIF) supports the
district superintendent* in the requirements and supports that are required of all schools as
described above as well as with the specific Title I requirements and supports described below. This
DIF works with the superintendent* approximately 40 hours a year for Years One and Two schools
and approximately 160 hours a year for Years Three and higher schools to provide technical
assistance in all of the Focus School and district tasks. Some specific areas of support to the
superintendent include:
• Helping to identify the teachers delivering math and reading instruction so that they take the
Surveys of Enacted Curriculum (SEC) at the end of the first and third year of identification.
Teachers are asked to take the surveys in five areas: Instructional Content, Instructional
Activities, Teachers’ Characteristics, Opinions and Beliefs and Professional Learning. Using
the results of the SEC adds value to dialogues, decisions and actions related to classroom
instruction, curriculum alignment and increasing the achievement of the Bottom 30% of
students.
• Assisting in the analysis of the Surveys of Enacted Curriculum results.
• Reviewing the Title I Set-Aside choices at both the school and district levels, as described in
Table 15 above and providing technical assistance in appropriate choices, based on district
and school needs.
• Working with a District Intervention Team (at Years 3 and 4.) There are two configurations of
this team:
o A District Improvement Facilitator, an ISD/RESA Continuous Improvement
Monitoring Systems (CIMS) monitor and a regional Office of Field Services Consultant
o The above team plus membership from across MDE based on the district and school
needs. The members of the “plus” team will be drawn, at a minimum, from:
� Office of Education Improvement and Innovation (OEII)
� Office of Special Education (OFS)
� Office of Evaluation, Strategic Research and Accountability (OESRA)
� Office of Field Services (Special Pops Unit)
This team will review the results of the MDE District Systems Review or AdvancED Self-
Assessment, and/or the ERS Resource Check or School Check (if appropriate), the results of
the Surveys of Enacted Curriculum, and the Focus School achievement data to identify the
barriers to adequate district support and fidelity of implementation of MTSS at the Focus
School and create an action plan to remove these barriers. This District Intervention Team

156
Amended July 28, 2015
ESEA FLEXIBI LITY – REQ UEST U . S . D EPARTMEN T OF ED UC ATION
will monitor the implementation of the action plan during Year 3 and evaluate its
effectiveness at the end of Years One and Two Re-identification
*For Public School Academies that do not have a superintendent, the School Board President, a
representative from the Management Company, or a representative from the Authorizer must fill this
role.
The Model of Support: Universal
MDE continues to rely on the effectiveness of a Multi-Tiered System of Support (MTSS) as the primary
intervention for Focus Schools. As MDE works to build their internal capacity to support local districts,
multiple offices are working together to support a tiered model of support. For the universal level of
support to districts, MDE utilizes the statewide training on MTSS. The content of this training
includes:
• Practices that are evidence-based and matched to the needs of students
• Implementation supports that ensure that the practices are implemented with fidelity
• Evaluation for validation that what is being done is the right thing and also for continuous
improvement
• Systems that create “host” environments to make this all happen – allocation of resources
and alignment of components
Once Focus schools have completed a deep diagnosis of their data, MDE’s expectation is that they will
use the results in the implementation of a tiered system of intentional instruction and interventions,
Michigan has provided statewide training on a MTSS and research has shown us that when MTSS is
embedded into the school improvement process, it provides a framework for meeting the needs of all
students.
This MTSS framework provides all students with the best opportunities to succeed in school both
academically and behaviorally. MTSS focuses on providing high quality Tier I instruction and
supporting Tier II and Tier III interventions matched to student needs, monitoring progress frequently
to make appropriate changes in instruction. Data are used to allocate resources to improve student
learning and support staff implementation of effective practices at all tier levels. In Michigan, Focus
Schools are not among the lowest performing schools but they do have the largest achievement gaps
between the top and bottom 30% of students. MDE’s expectation is that the use of an MTSS
structure will enable staff to better understand the needs of the bottom 30% of students within the
context of their total student population and implement the system that supports the needs of all
students.
MDE’s statewide MTSS training has stressed that Tier One instruction must be rich and explicit and
teachers provide scaffolding and differentiation to meet students’ needs so that the achievement
157
Amended July 28, 2015
ESEA FLEXIBI LITY – REQ UEST U . S . D EPARTMEN T OF ED UC ATION
gaps among all students as well as subgroups of students is minimized. As of 2014, 68% of Michigan’s
intermediate school districts have been trained in the essential components of MTSS through the
statewide training. 55% of schools in a Focus School cohort in 2014 are within the boundaries of an
ISD that has been trained in MTSS through the statewide training.
The Model of Support: Targeted
Schools that reach Year 3 described in Table 14 above will receive targeted MTSS supports. These
schools have been unable to move the achievement of the bottom 30% of students through universal
supports. MDE will organize and deploy a multi-disciplinary team to do a comprehensive review of
district level systems, supports, resource allocation and School Systemic Improvement Plan (SSIP)
infrastructure components.
The screeners for this comprehensive review will be tools that districts with Focus Schools are
required to complete:
• District Systems Review available at: http://www.michigan.gov/mde/0,4615,7-140-
6530_30334_37563-340775--,00.html or
• Self-Assessment or Interim Self-Assessment for AdvancED accredited districts available at:
http://advanc-ed.org/partnership/mde
If districts have chosen to complete the Education Resource Strategies Resource Check
available at: http://www.erstrategies.org/assessments/resource_check or Education
Resource Strategies School Check (for single building districts) available at:
http://www.erstrategies.org/assessments/school_check, this data may also be reviewed by
the team.
This team will be assembled based on a review of the above results as well as additional district and
school data. Also, the team will work with the district to evaluate the fidelity of the implementation
of the current MTSS structure and review the progress of student achievement and adult
implementation to date. This multi-disciplinary team, called a District Intervention Team, will have
two structures depending on the number of Title I Focus Schools in the district:
District Intervention Team (DIT):
• A District Improvement Facilitator, an ISD/RESA Continuous Improvement Monitoring
Systems (CIMS) monitor and a regional Office of Field Services Consultant
• This DIT will be deployed into the majority of districts in the state with Title I Focus Schools
District Intervention Team Plus
• The above team plus membership from across MDE based on the district and school needs.
The members of the “plus” team will be drawn from:
o Office of Education Improvement and Innovation (OEII)
158
Amended July 28, 2015
ESEA FLEXIBI LITY – REQ UEST U . S . D EPARTMEN T OF ED UC ATION
o Office of Special Education (OSE)
o Office of Evaluation, Strategic Research, and Accountability (OESRA)
o Office of Field Services (Special Pops Unit)
o Other MDE offices as needed
• The District Intervention Team Plus will be deployed to the five districts in the state with the
highest number of Focus Schools in need of targeted support
As a result of this technical assistance, the DIT will help the district revise its District Improvement
Plan to reflect the implementation of system changes identified in the district’s self-assessment(s),
the monitoring process to assess fidelity of implementation and the outcome measures that will
indicate that the system changes have been effective. The District Improvement Facilitator will play a
key role to support the superintendent* in getting ready for, implementing, monitoring and
evaluating these systemic improvements.
Model of Support: Intensive
Schools that are in need of more intensive support will be directed to an endorsed model of MTSS.
MDE expects that Tier One instruction will be effective for 85% of students and the access to
additional tiers of support for the unsuccessful 15% of students will be timely and systematic so as to
close the individual achievement gaps(s). In order to produce significant change in student outcomes,
educators need to implement with fidelity effective interventions matched to student needs. Sugai
and Horner (2009) identify six core components of MTSS which have been integral components of
MDE’s trainings:
1. Interventions that are supported by scientifically based research
2. Interventions that are organized along a tiered continuum that increases in intensity (e.g.
frequency, duration, individualization, specialized support, etc.)
3. Standardized problem-solving protocols for assessment and instructional decision-making
4. Explicit data-based decision rules for assessing student progress and making instructional and
intervention adjustments.
5. Emphasis on assessing and ensuring implementation integrity
6. Regular and systemic screening for early identification of the 15% of students whose
performance is not responsive to Tier One instruction.
When a school reaches Year One Reidentified, MDE will develop and support teams at the school and
district level to implement the MTSS framework. These teams will receive training, technical
assistance and coaching in MTSS practices and how to support these practices. This intensive level
process involves focused support that is strategically applied based on an assessment of need at
school and district levels, individualized support is formalized and documented in an implementation
plan that focuses on coordination, allocation of resources, professional learning and evaluation.
159
Amended July 28, 2015
ESEA FLEXIBI LITY – REQ UEST U . S . D EPARTMEN T OF ED UC ATION
This support process utilizes implementation frameworks such as stages of implementation and focus
on implementation drivers to promote fidelity of implementation. Schools are at different stages of
readiness to implement. Implementation supports will be differentiated based on schools’ readiness
in order to effectively promote and sustain systems change for MTSS.
As one example, Michigan's Integrated Behavior and Learning Support Initiative (MiBLSi) began as a
U.S. Department of Education Model Demonstration project in 2000. MiBLSi has been functioning as a
technical assistance model for MTSS in an integrated behavior and reading model since 2003 with
building level implementation supports happening between the years of 2004-2010. During this time,
MiBLSi supported individual buildings in scaling up their supports for students in a tiered model. Out
of this model came the learning that the buildings were unlikely to sustain these structures without
the support of their districts and ISDs. Beginning in 2011, MiBLSi changed their statewide structure to
focus on supporting the district and ISD level to increase local capacity to implement an integrated
behavior and academic multi-tiered system of support with fidelity that is durable and salable. After
working with regional coordinators and supporting over 600 schools in this model, MiBLSi has
collected the following data:
• Schools have demonstrated an average increase of 5% each year in students scoring at grade
level based on Curriculum-Based Measurement reading assessments.
• Schools have demonstrated a 10% average reduction in the rate of major discipline referrals
per year.
• Sampling of schools that implement positive behavior support with fidelity report 7% more
students meeting or exceeding standards on MEAP reading component (this means
approximately 25 more students per school achieve the standards)
• Schools have demonstrated an average reduction of 3% each year in students requiring
intensive reading supports.
• Schools implementing with fidelity saw an increase in 3rd grade reading proficiency while the
state average saw a decrease between 2010 and 2013.
For Focus Schools that were identified due to a graduation rate lower than 60% for two
consecutive years, these schools will be required to include a goal in its SIP to increase the
graduation rate. The Measurable Objective for this Goal will specifically indicate the targets
needed to reach at least the 60% graduation rate goal within two years. Additionally, these
schools will participate in the Superintendent’s Dropout Challenge to support the increase of
the graduation rate.
When a school is graduating less than 60% of its students, the district, in collaboration with
the school, will take a closer look at the demographics of this graduation cohort. Through
data analysis and data conversations, the question that must be answered is:
• How do the demographics of the students who are graduating on time compare with the
demographics of the students who are not graduating on time?

160
Amended July 28, 2015
ESEA FLEXIBI LITY – REQ UEST U . S . D EPARTMEN T OF ED UC ATION
If the population of the students not graduating differs significantly from the population that
graduates on time, the strategies under the School Improvement Goal on increasing the
graduation rate must address how to better engage these students and professional learning
for staff in how to better support/communicate with these students and their families.
2.E.iv Provide the criteria the SEA will use to determine when a school that is making significant progress
in improving student achievement and narrowing achievement gaps exits focus status and a
justification for the criteria selected.
MDE will allow schools to exit from Focus school status when the underlying issues which caused them
to be named Focus schools have been resolved.
• For Focus-Gap schools
o For two consecutive years, schools must meet one of two audit exceptions. These same
exceptions were applied at the time of naming so that schools already meeting exit
criteria were never entered into Focus School status.
� Improvement of the school’s bottom 30% is greater than the statewide average
of bottom 30% subgroup improvement.
� Achievement of the schools’ bottom 30% is greater than the statewide average
of bottom 30% subgroup achievement.
o It is not required that schools meet the same audit in both years. That is, schools could
meet the improvement audit for one year, the achievement audit the next year, and
would be eligible for exit.
• For Focus-Grad schools
o For two consecutive years, schools must have a graduation rate at or above 60%.
The consistent exit criteria above will ensure that Focus Schools remain within the system of support
(with its incrementally increased pressure to attain these results) until the conditions are met.
While the MDE does not intend to use data during the years of transitions to new career- and
college-ready standards-aligned assessments to make high-stakes accountability identification
decisions, it is important that schools identified as Focus using data from previous assessments
not be held captive to a high-stakes identification from which it cannot exit. Thus MDE
proposes the following actions regarding the existing cohorts of Focus Schools:
• Focus School Cohort 2012

161
Amended July 28, 2015
ESEA FLEXIBI LITY – REQ UEST U . S . D EPARTMEN T OF ED UC ATION
o This cohort will be eligible for exit during the 2014-2015 school year based on two years
of data from prior state assessments.
• Focus School Cohort 2013
o This cohort will be eligible for exit during the 2015-2016 school year based on one year
of data from prior state assessments and one year of data from the new 2014-2015
state assessments.
• Focus School Cohort 2014
o This cohort will be eligible for exit during the 2016-2017 school year based on two years
of data from new state assessments.
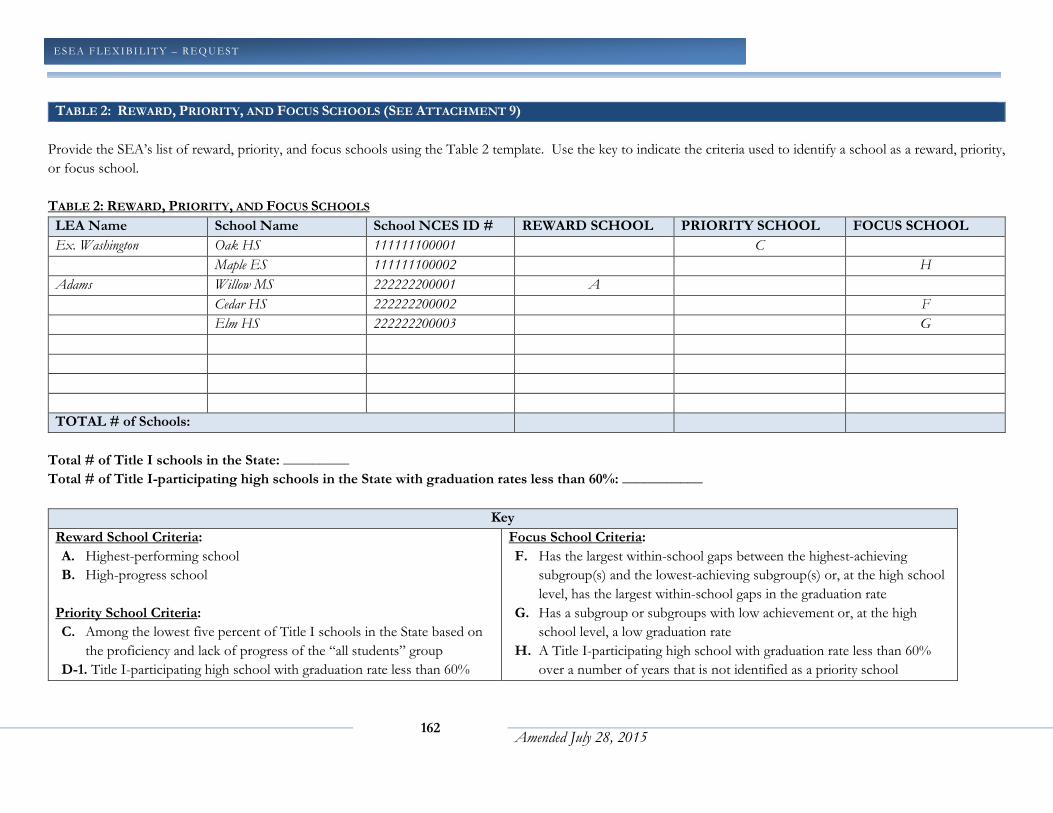
162
Amended July 28, 2015
ESEA FLEXIBI LITY – REQ UEST U .S . DEPARTMENT OF EDUCATION
TABLE 2: REWARD, PRIORITY, AND FOCUS SCHOOLS (SEE ATTACHMENT 9)
Provide the SEA’s list of reward, priority, and focus schools using the Table 2 template. Use the key to indicate the criteria used to identify a school as a reward, priority,
or focus school.
TABLE 2: REWARD, PRIORITY, AND FOCUS SCHOOLS
LEA Name School Name School NCES ID # REWARD SCHOOL PRIORITY SCHOOL FOCUS SCHOOL
Ex. Washington Oak HS 111111100001 C
Maple ES 111111100002 H
Adams Willow MS 222222200001 A
Cedar HS 222222200002 F
Elm HS 222222200003 G
TOTAL # of Schools:
Total # of Title I schools in the State: _________
Total # of Title I-participating high schools in the State with graduation rates less than 60%: ___________
Key
Reward School Criteria:
A. Highest-performing school
B. High-progress school
Priority School Criteria:
C. Among the lowest five percent of Title I schools in the State based on
the proficiency and lack of progress of the “all students” group
D-1. Title I-participating high school with graduation rate less than 60%
Focus School Criteria:
F. Has the largest within-school gaps between the highest-achieving
subgroup(s) and the lowest-achieving subgroup(s) or, at the high school
level, has the largest within-school gaps in the graduation rate
G. Has a subgroup or subgroups with low achievement or, at the high
school level, a low graduation rate
H. A Title I-participating high school with graduation rate less than 60%
over a number of years that is not identified as a priority school
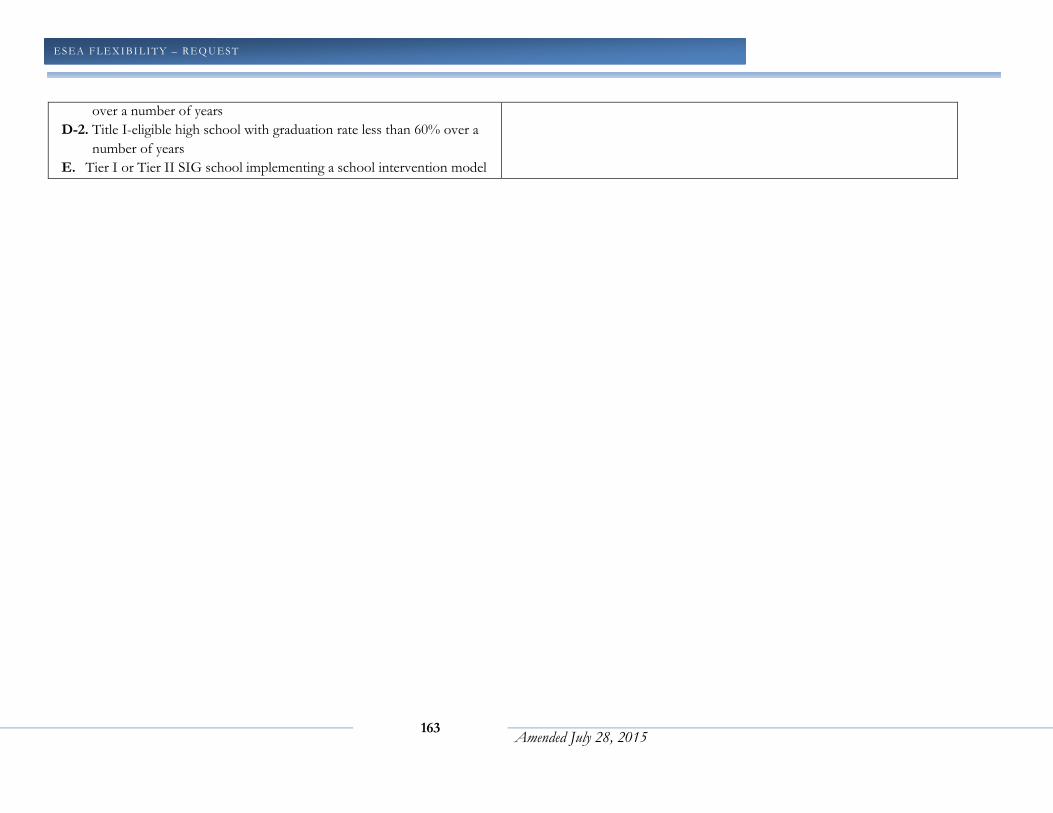
163
Amended July 28, 2015
ESEA FLEXIBI LITY – REQ UEST U .S . DEPARTMENT OF EDUCATION
over a number of years
D-2. Title I-eligible high school with graduation rate less than 60% over a
number of years
E. Tier I or Tier II SIG school implementing a school intervention model
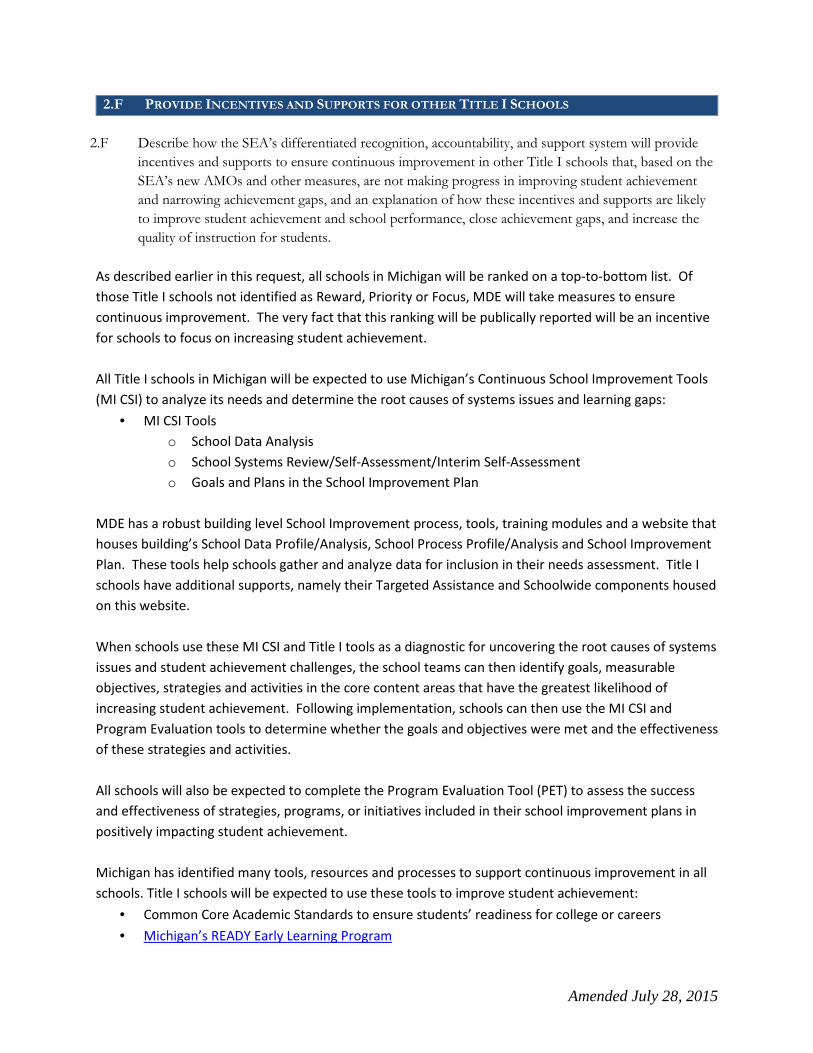
Amended July 28, 2015
2.F PROVIDE INCENTIVES AND SUPPORTS FOR OTHER TITLE I SCHOOLS
2.F Describe how the SEA’s differentiated recognition, accountability, and support system will provide
incentives and supports to ensure continuous improvement in other Title I schools that, based on the
SEA’s new AMOs and other measures, are not making progress in improving student achievement
and narrowing achievement gaps, and an explanation of how these incentives and supports are likely
to improve student achievement and school performance, close achievement gaps, and increase the
quality of instruction for students.
As described earlier in this request, all schools in Michigan will be ranked on a top-to-bottom list. Of
those Title I schools not identified as Reward, Priority or Focus, MDE will take measures to ensure
continuous improvement. The very fact that this ranking will be publically reported will be an incentive
for schools to focus on increasing student achievement.
All Title I schools in Michigan will be expected to use Michigan’s Continuous School Improvement Tools
(MI CSI) to analyze its needs and determine the root causes of systems issues and learning gaps:
• MI CSI Tools
o School Data Analysis
o School Systems Review/Self-Assessment/Interim Self-Assessment
o Goals and Plans in the School Improvement Plan
MDE has a robust building level School Improvement process, tools, training modules and a website that
houses building’s School Data Profile/Analysis, School Process Profile/Analysis and School Improvement
Plan. These tools help schools gather and analyze data for inclusion in their needs assessment. Title I
schools have additional supports, namely their Targeted Assistance and Schoolwide components housed
on this website.
When schools use these MI CSI and Title I tools as a diagnostic for uncovering the root causes of systems
issues and student achievement challenges, the school teams can then identify goals, measurable
objectives, strategies and activities in the core content areas that have the greatest likelihood of
increasing student achievement. Following implementation, schools can then use the MI CSI and
Program Evaluation tools to determine whether the goals and objectives were met and the effectiveness
of these strategies and activities.
All schools will also be expected to complete the Program Evaluation Tool (PET) to assess the success
and effectiveness of strategies, programs, or initiatives included in their school improvement plans in
positively impacting student achievement.
Michigan has identified many tools, resources and processes to support continuous improvement in all
schools. Title I schools will be expected to use these tools to improve student achievement:
• Common Core Academic Standards to ensure students’ readiness for college or careers
• Michigan’s READY Early Learning Program
165
Amended July 28, 2015
ESEA FLEXIBI LITY – REQ UEST U . S . D EPARTMEN T OF ED UC ATION
• Modules to improve instruction available at no charge through Michigan Virtual University at
Learnport
• Michigan’s Literacy Plan
• Michigan Online Resources for Educators for professional development in how to integrate
technology into instruction of the Common Core Academic Standards
• Michigan’s elibrary resources
• Michigan’s School Data Portal, MISchoolData
• Michigan’s MORE technology portal
• Regional Data Initiatives
• Parent Involvement Toolkit
• English learners Training of Trainers – Best Practices/Technical Assistance
• Michigan Standards of Professional Learning • Participation in the Superintendent’s Dropout Challenge to identify students at risk of dropping
out of school and implementation of research-based supports and student level interventions to
reduce the dropout rate
• Michigan’s Online Professional Learning System (MOPLS) is a series of interactive learning
programs designed to guide educators in recommending assessments for students and using
assessment results to assist students who are struggling with concepts in ELA and/or math.
MDE has partnered with the Michigan Association of Intermediate School Administrators (MAISA) to
develop units, lessons and resources based on the Career and College Ready Standards. These units
range from Kindergarten to 11th grade in ELA and math. These resources are available online at no
charge to teachers in English Language Arts and Mathematics.
Title I schools also have Technical Assistance from Office of Field Services (OFS) consultants at the
district level to address supports for the root causes. Title I schools will also receive technical assistance
from the Office of Field Services, Special Populations unit consultants regarding English language
learners and similar support from the Office of Special Education consultants regarding students with
disabilities. OFS, in an effort to enhance support provided for the students of Michigan, has developed
pilot School Improvement Partnerships where consultants act as an additional resource for schools by
joining volunteer School Improvement Teams in the districts they serve. This work with a number of
partner organizations extends MDE’s capacity to help these schools develop strong, data driven needs
assessments and school or district improvement plans.
For those schools not designated as “red,” these supports will prove satisfactory. For those Title I
schools designated “red,” MDE will take a more active role. These schools will receive technical
assistance from their regional educational service centers – RESAs - to ensure that the proper root
causes are being addressed in appropriate research-based ways.

166
Amended July 28, 2015
ESEA FLEXIBI LITY – REQ UEST U . S . D EPARTMEN T OF ED UC ATION
In the first year of receiving a “red” school designation (therefore not meeting Accountability targets),
Title I schools not meeting Accountability targets will be required to implement their annual School
Improvement Plan to address the needs of the identified subgroup(s). The consequences for Title I
schools not meeting Accountability targets for the first year will include the following:
• Review and revise the existing School Improvement Plan to include the evidenced-based
supports provided to those subgroups not meeting Accountability targets
• Review and revise the Consolidated Application to include the evidenced-based supports
provided to those populations not meeting Accountability targets
During the second consecutive year that a Title I school is designated “red” (does not meet
Accountability targets) overall, OFS will conduct an onsite monitoring visit with the district to assist with
greater focus on the achievement of struggling subgroups. Findings could necessitate a redirection of
funds to address areas of need for students in these struggling subgroups.
During the third and subsequent consecutive years that a Title I school is designated “red” (does not
meet Accountability targets) overall, the school will set-aside up to 10% of the district’s Title I allocation
for the identified schools(s) as necessary to accelerate student achievement for at least one of the
following options:
• to purchase data workshop services from a state-approved consultant to further identify
root causes of the subgroup performance
• to provide funding to conduct diagnostic data work to identify root causes of subgroup
performance
• to provide professional learning for staff to address root causes identified in diagnostic
analysis
to contract with facilitator or consultant to assist the school in implementing School Improvement strategies focused on the identified subgroup
As described in section 2.A, schools receiving a “red” for participation for one school year will be placed
on a participation “watch list” and will be notified by MDE that they are out of compliance with state
and federal laws regarding participation in state assessments. If they are”red” for participation for two
consecutive years (or for three years out of five years), they are named an “Assessment Participation
Non-Compliant School.” These schools will be subject to the levels of supports and interventions listed
below:
• Year 1: School will receive a “Letter of Warning” outlining escalating consequences for years 2-4
of non-compliance.
• Year 2: School will receive a MDE/DAS investigation and be required to develop a plan to
address root causes for low participation that will require MDE/DAS approval.
• Year 3: Technical assistance will be provided to adjust and implement the approved plan and an
additional district set-aside of 3-5% of Title I funds to address identified causes will be required.
The set-aside range is required to differentiate effective interventions depending on the size and
nature of the problem(s) and what it will take to solve it. This represents an increase over the
1% set-aside required by ESEA for parent engagement and other district set-asides required by
ESEA and ESEA Flexibility.
167
Amended July 28, 2015
ESEA FLEXIBI LITY – REQ UEST U . S . D EPARTMEN T OF ED UC ATION
• Year 4: The plan will be updated as needed and there will be a continuation of the set-aside for
implementation with an increased withholding of 25% of Title I funds until benchmarks are
reached. Percentages may be escalated in subsequent years if needed.
• If at any time MDE determines that the student lack of participation infraction becomes
egregious, the school may be place under the authority of the State of Michigan School Reform
Office.
MDE has confidence in this array of supports, incentives and interventions because we see that the
systematic school improvement cycle works in the vast majority of Michigan schools.
2.G BUILD SEA, LEA, AND SCHOOL CAPACITY TO IMPROVE STUDENT LEARNING
2.G Describe the SEA’s process for building SEA, LEA, and school capacity to improve student learning
in all schools and, in particular, in low-performing schools and schools with the largest achievement
gaps, including through:
i. timely and comprehensive monitoring of, and technical assistance for, LEA implementation
of interventions in priority and focus schools;
ii. ensuring sufficient support for implementation of interventions in priority schools, focus
schools, and other Title I schools identified under the SEA’s differentiated recognition,
accountability, and support system (including through leveraging funds the LEA was
previously required to reserve under ESEA section 1116(b)(10), SIG funds, and other
Federal funds, as permitted, along with State and local resources); and
iii. holding LEAs accountable for improving school and student performance, particularly for
turning around their priority schools.
Explain how this process is likely to succeed in improving SEA, LEA, and school capacity.
The Michigan Department of Education (MDE) is actively working on building internal SEA capacity by
aligning programming, supports, systems, standards, and communications to address the mission of
ensuring that all students in Michigan emerge from their PK-12 experience career, college, and
community ready. In order to achieve this, the state agency, in partnership with the various levels of
organization that make up Michigan’s education infrastructure, needs to build more robust support
processes and procedures and incorporate an active continuous improvement framework.
MDE relies upon four primary levels of support for teaching and learning to prepare students for
careers, college, and civic life. These are outlined in the following diagram, with teaching and learning
taking place at the base and levels of support in the four layers above:
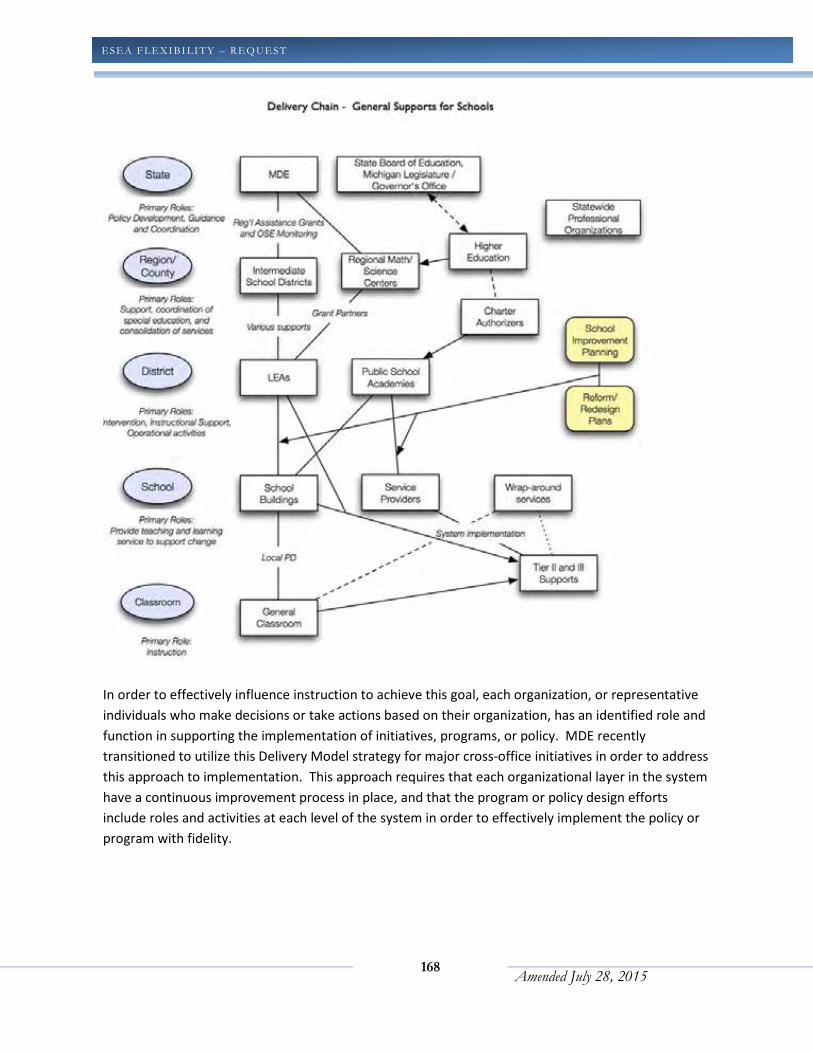
168
Amended July 28, 2015
ESEA FLEXIBI LITY – REQ UEST U . S . D EPARTMEN T OF ED UC ATION
In order to effectively influence instruction to achieve this goal, each organization, or representative
individuals who make decisions or take actions based on their organization, has an identified role and
function in supporting the implementation of initiatives, programs, or policy. MDE recently
transitioned to utilize this Delivery Model strategy for major cross-office initiatives in order to address
this approach to implementation. This approach requires that each organizational layer in the system
have a continuous improvement process in place, and that the program or policy design efforts
include roles and activities at each level of the system in order to effectively implement the policy or
program with fidelity.
169
Amended July 28, 2015
ESEA FLEXIBI LITY – REQ UEST U . S . D EPARTMEN T OF ED UC ATION
The organizations and structure of the Delivery Model for Michigan schools relies on an infrastructure
analysis and system design that addresses seven specific issues at the outset of implementation. They
are:
1. Governance. This includes the organizational structures of local, regional, and statewide
organizations, as well as processes for making decisions regarding resource allocation,
implementation, and program revision following analysis of outcome and diagnostic data.
2. Fiscal. Financial considerations that impact statewide infrastructure and delivery include
the overall limitation of available funds to support various statewide program
implementation, as well as the inefficient allocation of funds due to regulation and
documentation restrictions. For some districts, inability to proactively plan for changes in
revenue due to fluctuating enrollment is an added challenge, with an outcome of loss of
fund balance or overall deficit.
3. Quality Standards. This addresses the comprehensive nature of systems, and the
interconnected nature of the other components listed here. Challenges include “silos”
based on strict adherence to program requirements or narrow design considerations for
interventions or reforms.
4. Professional Learning and Technical Assistance. This is the primary means of informing
changes and support for change in classrooms, districts, and other organizations.
Considerations include transitions to job-embedded professional learning, and multi-
tiered systems of professional learning and technical assistance for all levels of the
delivery chain.
5. Data . In order to make informed decisions and evaluate outcomes of programming and
support, data and data systems are critical considerations at the outset of
implementation of any intervention. This includes considerations for addressing the
appropriate research or evaluation questions, and formative analysis of data to inform or
alter implementation as needed.
6. Monitoring and Accountability. In addition to the data systems in the previous item,
systems for review and accountability need to be implemented that are systematized and
based upon clearly identified metrics or indicators.
7. Communications. All elements of the state infrastructure for support of schools and
student learning require appropriate understanding of the components and clear
articulation of actions and activities being implemented. Communications mechanisms
that reach all stakeholders with appropriate information are required to be able to best
inform about activities or interventions to improve the system.
MDE is currently engaged in this state-level capacity building process as a part of the Statewide
Systemic Improvement Plan (SSIP) as required by the U.S. Department of Education’s Office of Special
Education Programs. To date, this effort has utilized a range of data collection and analysis efforts,
including infrastructure surveys, structured root cause analysis, and intensive stakeholder dialogue.
Existing data and infrastructure reviews identified statewide infrastructure as a critical barrier to

170
Amended July 28, 2015
ESEA FLEXIBI LITY – REQ UEST U . S . D EPARTMEN T OF ED UC ATION
implementation of quality programming on a statewide level. Opportunities for improvement were
identified for each of the seven components of implementation identified above, including the
following:
• Governance – respondents focused on themes of increased coordination between MDE, ISDs,
and LEAs. Specific strategies such as “cross-pollinating” meetings with other groups, creating
a common vision and position on critical issues, and restructuring of interactions and
decision-making to “break down silos” are identified as key opportunities to improve
statewide infrastructure and collaboration.
• Fiscal – respondents noted a general lack of resources or coordination of resources for
targeted needs, such as early childhood or literacy programs. Respondents also notes
challenges with general lack of support, unequal financial support across the state, and
limited external support for non-academic needs for students in families with limited income
or financial resources.
• Professional Learning and Technical Assistance – respondents noted a lack of consistency and
adequacy for targeted programs, such as early literacy interventions.
• Data – respondents noted these very widely, and that there are inconsistencies in data
reported or used to make intervention decisions. Respondents also noted that systems varied
widely by district or ISD, and that local data was often inconsistent with state achievement
data.
• Communication – respondents noted a lack of understanding of all components of the
system, or interconnectedness of interventions and supports. This is different than not
agreeing with interconnectedness, and largely pointed to issues of incomplete information
being shared, or information being irrelevant to particular stakeholders.
As a result of this initial analysis, MDE will be working with stakeholders at all levels of the education
system to develop a plan for development of statewide capacity through the SSIP effort. To
determine the effectiveness of this system change effort, data will be collected and reported on a
particular indicator (percent of k-3 students in participating schools that are achieving benchmark
status).
Timeline for Review and Improvement
Michigan utilizes an annual cycle for program evaluation and continuous improvement at nearly all
levels of service and programming within the state’s K-12 education system. This is mostly aligned to
both legislative requirements for individual schools and LEAs, as well as the regularity of the academic
year for school operations. The primary activities that take place on an annual basis are based upon
state law and an annual assessment cycle for student achievement at the state level. This drives the
following actions, addressed earlier in this document:
1. School and district level accountability reporting (including identification of Priority, Focus,
and Reward designations)
171
Amended July 28, 2015
ESEA FLEXIBI LITY – REQ UEST U . S . D EPARTMEN T OF ED UC ATION
2. School improvement (addressed in following section)
3. District improvement (addressed in following sections) and consolidated application for state
and federal funds for targeted and school-wide programs
4. Educator evaluation (addressed in Principle 3)
5. Program Evaluation (addressed in Principle 2, Section F)
These are illustrated in the annual evaluation and continuous improvement cycle, identified in
Timeline A (following page). However, in order to ensure proper progress in implementation,
identified as a research-based turnaround strategy, additional components are incorporated in the
Priority school (and district) implementation plan, as well as other high-risk support plans identified
by state and federal education agencies for districts receiving additional interventions. These include
districts that qualify for special designation and requirements per PA 436 (2012), which requires
districts that cannot meet financial requirements of a deficit elimination plan to develop and
implement a special education plan, which includes quarterly benchmarks for progress and evaluation
of next steps in their strategic plan.
The following activities take place in Priority schools and PA 436 districts to ensure that progress is
made on a more urgent timeline, and that these schools or districts, when not meeting these
benchmarks, receive additional supports and intervention to ensure they “learn” from the process
and develop strategies for the next review period to cause positive change.
• Convening of School Support Team (SST) on a quarterly basis
• Instructional Learning Cycle (ILC) activities (connected to professional learning communities)
are reviewed on a quarterly basis (coordinated with SST review)
• Leading indicator progress review for PA 436 districts on a quarterly basis
• Academic benchmark progress review for PA 436 districts on a quarterly basis
• Ongoing monitoring of reform/redesign plan per identified review cycle for each requirement
/indicator (varies based on status level)
At a statewide level, the annual review cycle for continuous improvement is also extended to evaluate
progress over time for both implementation successes for targeted supports for Priority and Focus
schools, and for Pilot programs that are intended to identify potential statewide programs that
require a scaled learning approach to identify potential barriers to implementation. Pilot programs
are designed for implementation in Pilot-status over a three-year period. Similarly, Priority and Focus
programming utilizes a similar long-term schedule in order to ensure proper time for implementation
and evaluation to inform possible changes in the planning and implementation efforts based on
progress to date. These schedules also gradually increase the level of support over time for those
schools and districts that are not seeing progress on intermediate or benchmark indicators.
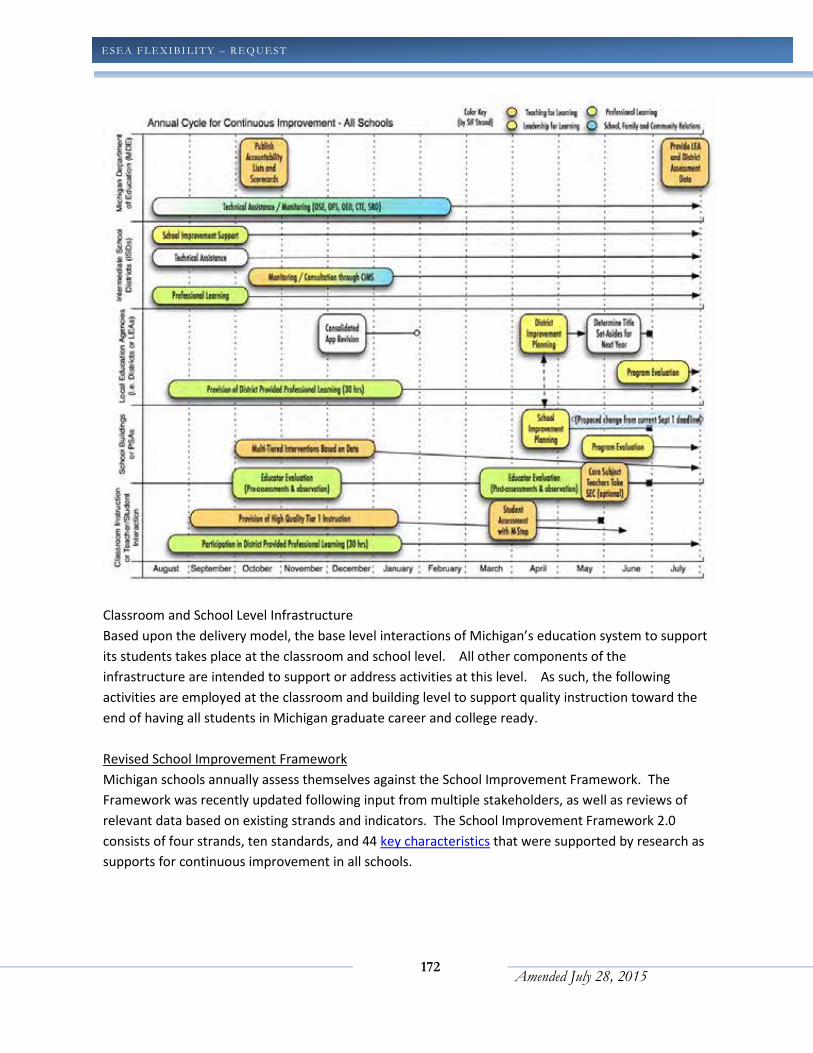
172
Amended July 28, 2015
ESEA FLEXIBI LITY – REQ UEST U . S . D EPARTMEN T OF ED UC ATION
Classroom and School Level Infrastructure
Based upon the delivery model, the base level interactions of Michigan’s education system to support
its students takes place at the classroom and school level. All other components of the
infrastructure are intended to support or address activities at this level. As such, the following
activities are employed at the classroom and building level to support quality instruction toward the
end of having all students in Michigan graduate career and college ready.
Revised School Improvement Framework
Michigan schools annually assess themselves against the School Improvement Framework. The
Framework was recently updated following input from multiple stakeholders, as well as reviews of
relevant data based on existing strands and indicators. The School Improvement Framework 2.0
consists of four strands, ten standards, and 44 key characteristics that were supported by research as
supports for continuous improvement in all schools.
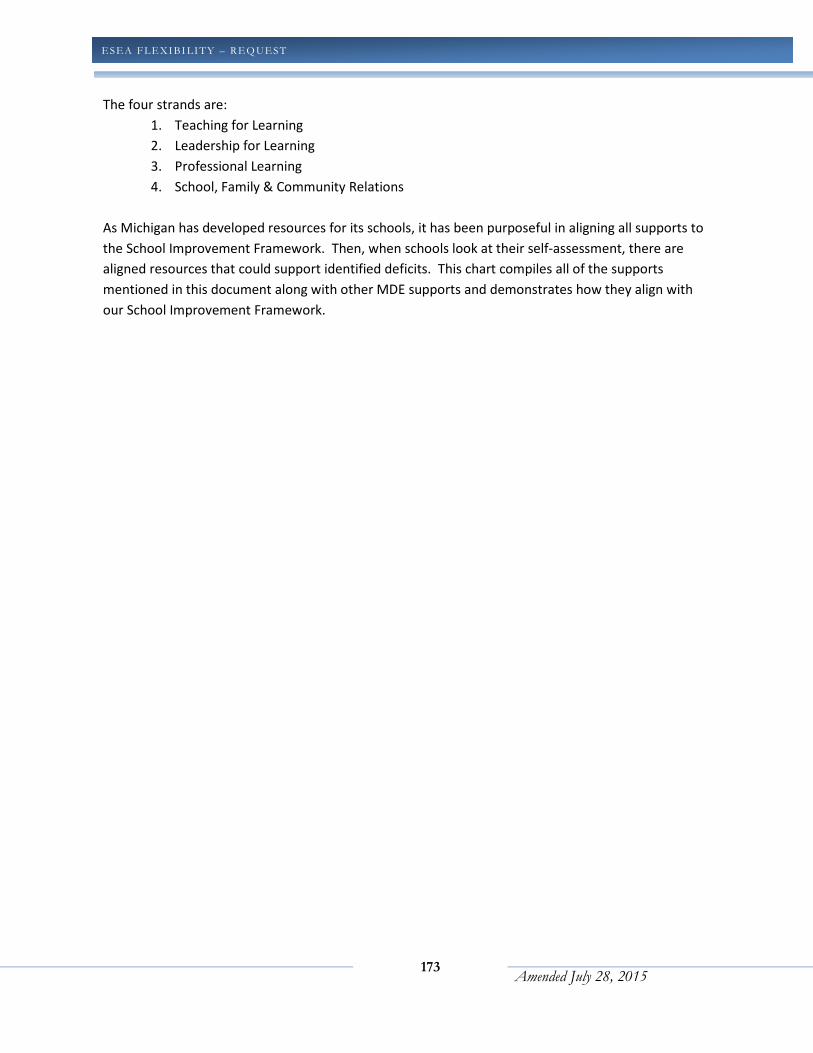
173
Amended July 28, 2015
ESEA FLEXIBI LITY – REQ UEST U . S . D EPARTMEN T OF ED UC ATION
The four strands are: 1. Teaching for Learning
2. Leadership for Learning
3. Professional Learning
4. School, Family & Community Relations
As Michigan has developed resources for its schools, it has been purposeful in aligning all supports to
the School Improvement Framework. Then, when schools look at their self-assessment, there are
aligned resources that could support identified deficits. This chart compiles all of the supports
mentioned in this document along with other MDE supports and demonstrates how they align with
our School Improvement Framework.
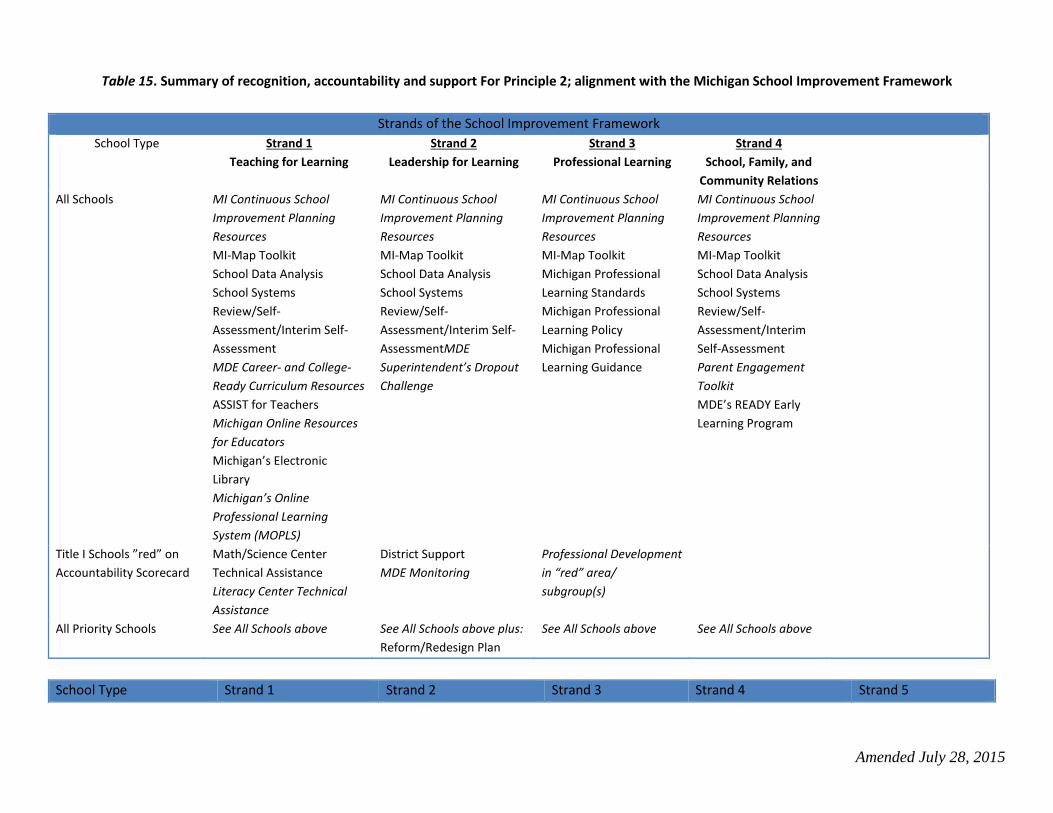
Amended July 28, 2015
Table 15. Summary of recognition, accountability and support For Principle 2; alignment with the Michigan School Improvement Framework
Strands of the School Improvement Framework
School Type Strand 1
Teaching for Learning
Strand 2
Leadership for Learning
Strand 3
Professional Learning
Strand 4
School, Family, and
Community Relations
All Schools MI Continuous School
Improvement Planning
Resources
MI-Map Toolkit
School Data Analysis
School Systems
Review/Self-
Assessment/Interim Self-
Assessment
MDE Career- and College-
Ready Curriculum Resources
ASSIST for Teachers
Michigan Online Resources
for Educators
Michigan’s Electronic
Library
Michigan’s Online
Professional Learning
System (MOPLS)
MI Continuous School
Improvement Planning
Resources
MI-Map Toolkit
School Data Analysis
School Systems
Review/Self-
Assessment/Interim Self-
AssessmentMDE
Superintendent’s Dropout
Challenge
MI Continuous School
Improvement Planning
Resources
MI-Map Toolkit
Michigan Professional
Learning Standards
Michigan Professional
Learning Policy
Michigan Professional
Learning Guidance
MI Continuous School
Improvement Planning
Resources
MI-Map Toolkit
School Data Analysis
School Systems
Review/Self-
Assessment/Interim
Self-Assessment
Parent Engagement
Toolkit
MDE’s READY Early
Learning Program
Title I Schools ”red” on
Accountability Scorecard
Math/Science Center
Technical Assistance
Literacy Center Technical
Assistance
District Support
MDE Monitoring
Professional Development
in “red” area/
subgroup(s)
All Priority Schools
See All Schools above See All Schools above plus:
Reform/Redesign Plan
See All Schools above See All Schools above
School Type Strand 1 Strand 2 Strand 3 Strand 4 Strand 5
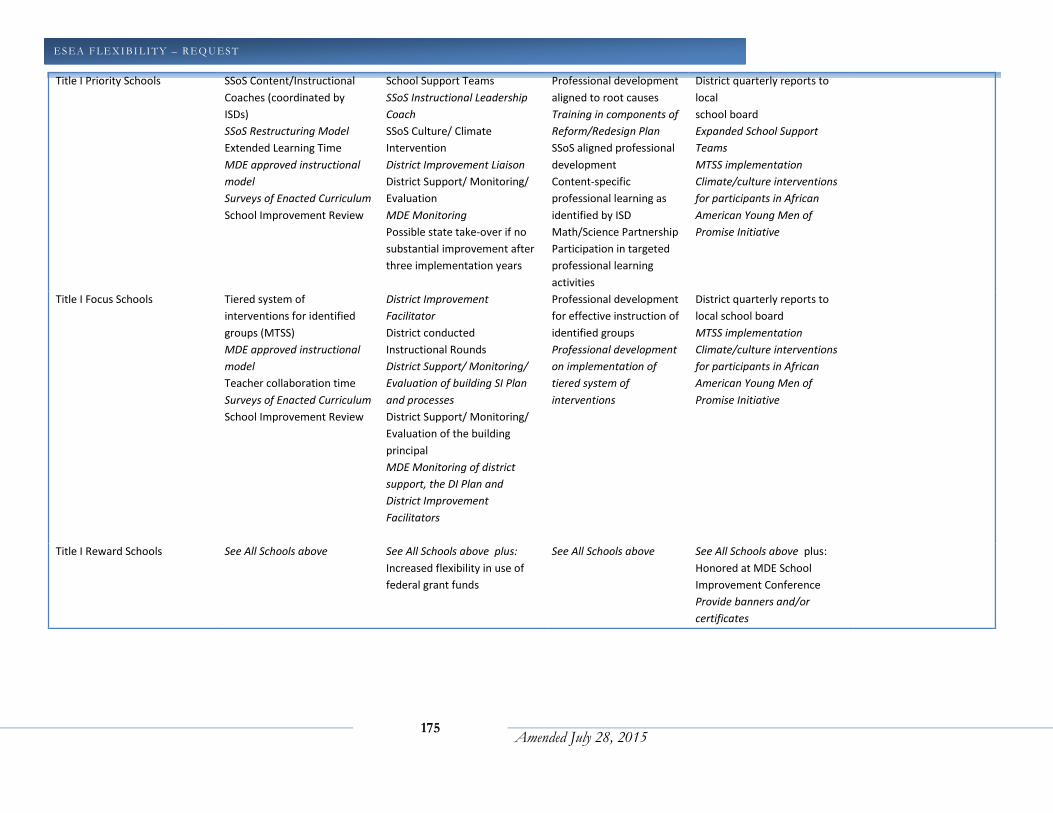
175
Amended July 28, 2015
ESEA FLEXIBI LITY – REQ UEST U .S . DEPARTMENT OF EDUCATION
Title I Priority Schools SSoS Content/Instructional
Coaches (coordinated by
ISDs)
SSoS Restructuring Model
Extended Learning Time
MDE approved instructional
model
Surveys of Enacted Curriculum
School Improvement Review
School Support Teams
SSoS Instructional Leadership
Coach
SSoS Culture/ Climate
Intervention
District Improvement Liaison
District Support/ Monitoring/
Evaluation
MDE Monitoring
Possible state take-over if no
substantial improvement after
three implementation years
Professional development
aligned to root causes
Training in components of
Reform/Redesign Plan
SSoS aligned professional
development
Content-specific
professional learning as
identified by ISD
Math/Science Partnership
Participation in targeted
professional learning
activities
District quarterly reports to
local
school board
Expanded School Support
Teams
MTSS implementation
Climate/culture interventions
for participants in African
American Young Men of
Promise Initiative
Title I Focus Schools Tiered system of
interventions for identified
groups (MTSS)
MDE approved instructional
model
Teacher collaboration time
Surveys of Enacted Curriculum
School Improvement Review
District Improvement
Facilitator
District conducted
Instructional Rounds
District Support/ Monitoring/
Evaluation of building SI Plan
and processes
District Support/ Monitoring/
Evaluation of the building
principal
MDE Monitoring of district
support, the DI Plan and
District Improvement
Facilitators
Professional development
for effective instruction of
identified groups
Professional development
on implementation of
tiered system of
interventions
District quarterly reports to
local school board
MTSS implementation
Climate/culture interventions
for participants in African
American Young Men of
Promise Initiative
Title I Reward Schools See All Schools above See All Schools above plus:
Increased flexibility in use of
federal grant funds
See All Schools above See All Schools above plus:
Honored at MDE School
Improvement Conference
Provide banners and/or
certificates
176
Amended July 28, 2015
ESEA FLEXIBI LITY – REQ UEST U . S . D EPARTMEN T OF ED UC ATION
MDE has had success with its Title I schools no longer being identified after being in the SSoS for several
years. However, there are also many Title I schools that have been in the SSoS for many years, some
since 2006. Our building level supports have not been able improve their chronic low achievement.
Many of these schools are now identified as Priority schools. These schools have not benefited from a
continuous improvement focus – they need rapid turnaround. This flexibility waiver opportunity has
given us the opportunity to reexamine our SSoS, look at the research on improving achievement in low-
performing schools and alter our approach to this important work.
This change in focus has led us to target intervention at a district level. Systemic issues have prevented
many schools from implementing successful improvement efforts. By supporting district-level
improvements, we hope to build consistency, capacity, and leadership across troubled systems, to
ensure that all schools get the timely, effective resources they need.
Program Evaluation (Building Level)
Starting in 2014-15, MDE requires all Title I schools to engage in the program evaluation process to
determine the impact of an identified program or activity by the school to address one of the academic
goals of the School Improvement Plan. MDE has worked with stakeholders to develop and pilot this
process over the last four years, and now requires use of the tool at the end of the current (2014-15)
school year. The goal of this effort is to ensure that the efforts that schools are spending Title funds to
implement are having the desired impact. In the event that such efforts are not having impact, the
process helps schools identify potential barriers to implementation, or limits or constraints of the
program in addressing the desired goal. Following this pilot year, schools that cannot demonstrate
(through the program evaluation process) that their programming for the evaluated activity is having an
impact to meet the desired outcome, schools will no longer be able to program for that activity, and will
need to identify alternate efforts to achieve academic goals of the SIP.
Priority Schools: Supports and Interventions
MDE is taking a diagnostic approach to resolving school challenges, particularly when it comes to
chronically low-performing buildings or those with significant achievement gaps. These schools will
receive intensive, personalized support to ensure fast results. Specific information on this topic is
provided in section 2.D.
MDE is currently in the process of evaluating the impacts of its use highly skilled Intervention Specialist
(ISs) in districts with Title I schools that have been identified as Priority Schools. As described, each
district with a Priority School will be assigned an Intervention Specialist. Intervention specialists work in
districts with Priority schools to help revisit, revise and diagnostically deepen reform/redesign plans.
These plans will be informed by data and guided by the following research-based district level
competencies:
177
Amended July 28, 2015
ESEA FLEXIBI LITY – REQ UEST U . S . D EPARTMEN T OF ED UC ATION
1. Leadership that Combines Passion with Competence. Superintendents, principals, other
administrators, and even lead teachers effectively cultivate not only a sense of urgency but also
a sense of possibility, built on demonstrated expertise among people in key positions and their
commitment to continuous improvement.
2. Clear, Shared Conceptions of Effective Instruction. The district identifies key ideas concerning
effective instructional and supervisory practice, and works to establish them as a “common
language” for approaching instructional improvement.
3. Streamlined and Coherent Curriculum. The district purposefully selects curriculum materials
and places some restrictions on school and teacher autonomy in curriculum decisions. The
district also provides tools (including technology) and professional development to support
classroom-level delivery of specific curricula.
4. Organizational Structures and Personnel that Embody Capacity to Teach and Motivate Adults.
The district maintains routines and structures within which adult educators (sometimes
consultants) engage teachers and administrators in continuous improvement of instructional
and supervisory practices. Coaching, observing, and sharing make it difficult for individuals to
avoid the change process, and the push for adaptive change spurs resisters to leave their
comfort zones or eventually depart from the district.
5. Patient but Tough Accountability. The district develops tools and routines for monitoring
teaching practices and learning outcomes, targeting assistance where needed, and sometimes
replacing teachers or administrators who fail to improve.
6. Data-Driven Decision Making and Transparency. Teachers and administrators analyze student
performance for individuals and summarize data by grade level, special education status, English
as a second language status, race/ethnicity, and gender. The district publicizes strategic goals for
raising achievement levels and reducing gaps, and tracks progress in visible ways. Administrators
identify, examine, and often emulate practices from successful schools.
7. Community Involvement and Resources. The district engages a range of stakeholders, including
school board members, local businesses, and parents, to do their part toward achieving well-
formulated strategic goals.
The Intervention Specialist conducts a review of the district’s capacity to support rapid individual
building turnaround efforts. At a minimum, the Intervention Specialist addresses the following areas:
• District business practices, including but not limited to:
o Human resource policies and practice
o Contracting policies and procedures
o Procurement policies and procedures
• District support of instructional programs
• District support of building principals
• District communication policy and practice
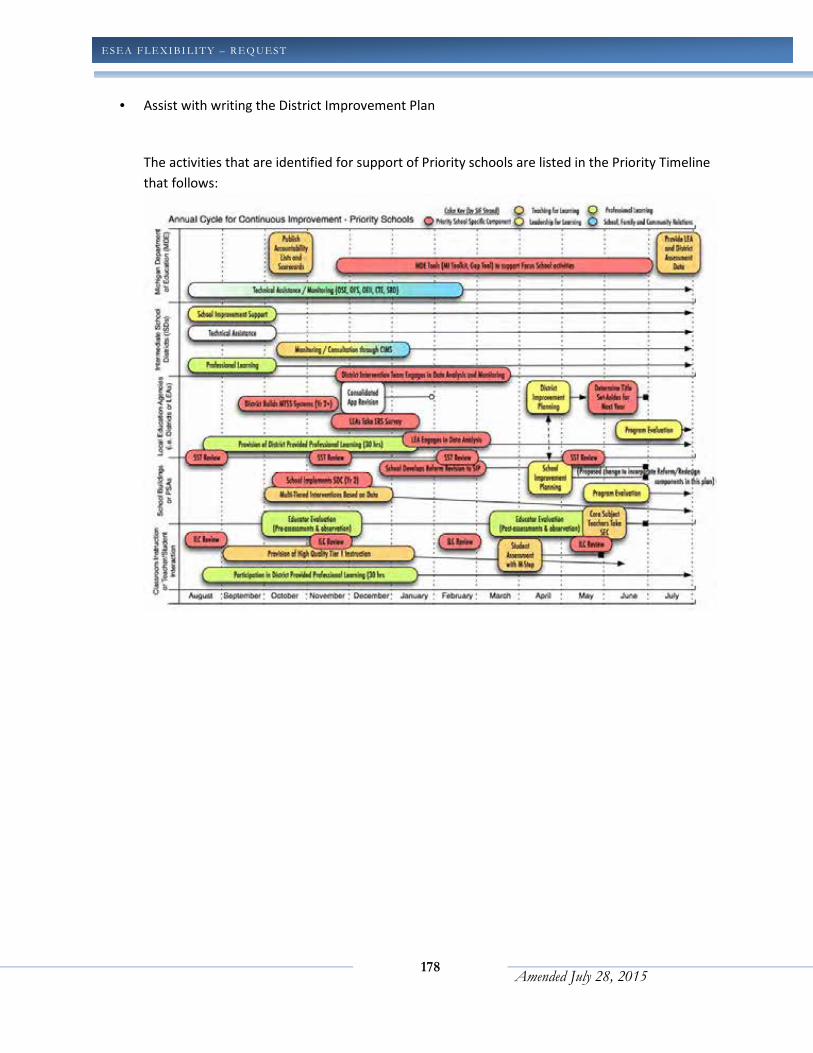
178
Amended July 28, 2015
ESEA FLEXIBI LITY – REQ UEST U . S . D EPARTMEN T OF ED UC ATION
• Assist with writing the District Improvement Plan
The activities that are identified for support of Priority schools are listed in the Priority Timeline
that follows:
179
Amended July 28, 2015
ESEA FLEXIBI LITY – REQ UEST U . S . D EPARTMEN T OF ED UC ATION
School Support Teams
Each Title I Priority School will receive a School Support Team (SST) as defined in Title I, Part A, Section
1117(a)(5).
The SST will provide technical assistance to the Priority School to select the appropriate intervention
model. The support team will:
• Attend a data-based Professional Dialogue with Priority School staff and conduct a needs
assessment using MDE’s Comprehensive Needs Assessment (CNA). The CNA in conjunction with
other data will identify the root causes of low student performance.
• Use the results of the needs assessment to help the Priority School choose a Reform and
Redesign Plan /intervention model that best meets the school’s needs and choose the
components of the Statewide System of Support that aligns with the chosen plan
• Incorporate the elements of the Reform and Redesign Plan into the revision of the School
Improvement Plan
The SST will monitor the school’s implementation of the School Improvement Plan through a minimum
of four quarterly meetings with the building School Improvement Team. These will be scheduled to
utilize outcomes of Instructional Learning Cycles and/or Benchmark Reviews as a part of the monitoring
process. This information will be used by the school district to inform both implementation
considerations and adjustments to the planned reform efforts.
An MDE-trained Intervention Specialist from the intermediate school district will make sure that the
components of the Reform and Redesign Plan/selected intervention model are being implemented as
written and that benchmarks are being met.
MDE will approve or disapprove all Reform and Redesign Plans and perform a desk audit on a sample of
District and School Improvement Plans to determine the revisions include the components of the
Reform and Redesign Plans.
Accountability
LEA Accountability
LEA central office staff will meet regularly with the Reform/Redesign school liaison from the Priority
school. Regular updates will be presented to the LEA school board. As noted previously, the
Reform/Redesign liaison will be responsible for monitoring and evaluating the Reform and Redesign
Plans/intervention model. The LEA will also be responsible for submitting biannual monitoring reports to
the SEA.
180
Amended July 28, 2015
ESEA FLEXIBI LITY – REQ UEST U . S . D EPARTMEN T OF ED UC ATION
State Accountability
MDE will ensure that quarterly board reports are submitted as required.
As noted previously, Michigan statute requires a State School Reform Office to oversee the submission
and approval of Reform and Redesign Plans, under the auspices of the State Reform Officer.
MDE reviews Priority Schools’ improvement plans for alignment with their needs assessments and the
implementation of career- and college-ready standards.
If LEAs are unable to provide sufficient technical assistance and support to its Priority Schools so that
they are no longer identified as Priority Schools after three years of Reform and Redesign Plan
implementation, these schools may be moved to a higher level of Priority school supports and
interventions under the supervision of the Reform and Redesign Officer who administers the state’s
Reform and Redesign School District as described in Section 1280c of Michigan’s Revised School Code.
Priority School Funding
Priority schools have flexibility in leveraging Title I set-aside funds through the following mechanisms:
Statewide System of Support Funding
MDE currently utilizes a portion of its 1003(a) funds to support the implementation of the interventions
identified earlier in this section. While MDE has previously granted funds to a central agency (Michigan
State University) to provide these supports, the state reviewed feedback from participating districts and
their supporting intermediate school districts, and developed a new model for implementation support
that would more effectively align Priority specific supports of the SST with other efforts taking place
through the ISD. The Regional Assistance Grant program was developed to provide specific funds to
ISDs to implement the supports in alignment with their existing supports and initiatives, based on a
funding formula generated from analysis of expenditures by Michigan State University on the MI- Excel
implementation from 2012 – 2014. This transition was initiated as a pilot in the 2013-4 school year, and
was implemented fully to replace the centrally-organized model starting in 2015.
District Level Infrastructure
MDE continues to shift its focus toward the district level. This necessitates a paradigm shift from a strict
professional learning model and to a more directive approach in the form of the Intervention Specialists,
working with LEA personnel out of the Intermediate School Districts (ISDs) for each LEA, to support
district level reviews and implementation supports for Priority schools. This is done in coordination with
School Improvement Facilitators at the building level, also out of the ISDs.
In a revision of the prior model, MDE provides regional assistance grants to ISDs to employ and
supervise the Intervention Specialists under the direction of MDE. These individuals are now placed by a
district’s ISD, and are provided to support training and implementation in reform-specific strategies and
efforts related to the reform plan (for Priority schools) or the SIP (Focus schools) to address targeted
needs.
181
Amended July 28, 2015
ESEA FLEXIBI LITY – REQ UEST U . S . D EPARTMEN T OF ED UC ATION
School Support Team Funding
School Support Teams are funded through grants to Regional Educational Service Agencies via MDE’s
Section 1003(a) 4% reservation for schools in improvement (as waived to be used for Priority Schools).
Funding for Priority Schools
Title I set-asides will be required to support Priority school interventions, as described in Section 2D.
Funding to Priority Schools: 1003(a) Funds
Regional educational service agencies will use 1003(a) funds to support needs-based supports for
Priority Schools. As noted previously, the Intervention Specialist (LEA level) and School Support Team
will assist the Priority School in selecting the supports as detailed in the plans for the Reform and
Redesign plans/selected intervention model. These supports may include:
School Support Teams (REQUIRED)
Instructional Content Coaches
Supports to address cultural and climate issues, use of time analysis and issues, and cultural
relevant teaching issues, as needed.
Restructuring/Turnaround services through third party vendors (screened/hired by the RESA)
Professional development (supplements the professional development funds granted directly
to LEAs as outlined below)
MDE will also grant 1003(a) dollars directly to the LEA to fund targeted professional development that
supports implementation of the Reform and Redesign Plan/intervention model.
Progress to date of Priority Schools
As part of Michigan’s continuous improvement efforts, data are reviewed annually for evaluation of
programming decisions and progress on implementation of Priority schools. This takes place through
multiple means, including the following:
• Review of data outcomes from Intervention Specialists and School Improvement Facilitators.
• Review of annual service plans for Title I Priority Schools.
• Annual review of academic achievement data from Priority schools through development of the
Legislative Report.
• Third-party evaluation in 2013 (by the American Institute for Research) of Priority school
supports and progress.
• Third-party evaluations (annual) by West-Ed of School Improvement Grant (SIG) program.
• Review of targeted data on instruction and culture/climate considerations for schools
participating in pilot programming for Priority schools (such as the African American Young Men
of Promise Initiative, or AAYMPI)
• Review of targeted data on instruction, academic progress, and professional learning for Priority
schools participating in targeted content-area programs, such as the Math-Science Partnership
Grant programs.
182
Amended July 28, 2015
ESEA FLEXIBI LITY – REQ UEST U . S . D EPARTMEN T OF ED UC ATION
A review of progress on academic indicators of Priority schools is generated for a state-required
legislative report from the School Reform Office, and this data is also used to address overall
effectiveness of the SSoS for Priority schools. Findings from the 2014 report, as well as additional
analysis used to generate the report, show the following outcomes for Priority schools:
• Of the 92 identified schools in the 2010 cohort of Priority schools, 32 have closed. Of the
remaining only 21 of these are still in the bottom 5% of schools. 12 of these 21 are in the
Education Achievement Authority. Of those that are no longer in the bottom 5%, schools range
from the 5th to 92nd percentile on the 2014 TtB list.
• Over half of the schools in the 2010 cohort that remain open have had aggregate student
growth above the statewide average in all subject areas.
• Of the 41 new schools added in the 2011 cohort, only 6 remain in the bottom 5%. Over 2/3 of
schools in this cohort showed growth above statewide averages.
• In the 2012 cohort, 25 schools closed, 34 schools have exited the bottom 5% (ranging from 5 to
92% on the 2014 TtB list), and 24 remain in the bottom 5%.
• In the 2013 cohort, 56% (25 schools) of those newly identified remained in the bottom 5% on
the 2014 TtB list.
This suggests that the significant growth and turnaround efforts take multiple years to implement in
ways that show significant growth in student achievement. This analysis suggests that it requires at
least two years from initial identification to see significant growth for the majority of schools, and that
additional supports for lack of progress require at least two years of reform implementation before such
progress is likely to be identified.
Focus Schools
For districts with Focus Schools, MDE will provide a toolkit, based on Michigan’s improvement process
and tools so that the district may assess its capacity to support its Focus School. For Title I schools, MDE
will also provide 40 hours of consultation with an MDE-trained and funded District Improvement
Facilitator to assist the district in preparing to conduct required data-based professional dialogues that
will identify strategic intervention plans.
These districts will be required to report to their school boards quarterly on the results of its self-
assessment and its ensuing support of its Focus School. This quarterly review is also utilized by the ISD
and MDE to determine specific strategies and supports that may be required on a broader scale across
the state. Such reviews have led to modifications of other tools, such as the Superintendent’s Dropout
Challenge, a grant program to develop local and regional capacity around implementation of Multi-
Tiered Systems of Support, and Focus school involvement in a statewide pilot of the African American
Young Men of Promise Initiative.
Supports and School Accountability
For districts with identified Title I Focus Schools, MDE provides support and training to ISDs to provide
the services of a trained District Improvement Facilitator (DIF) with central office or related experience
183
Amended July 28, 2015
ESEA FLEXIBI LITY – REQ UEST U . S . D EPARTMEN T OF ED UC ATION
to provide technical assistance to central office and the school board in order to assist them in providing
more effective support to their Focus Schools through:
• Guiding them in how to conduct a needs assessment using MDE’s Comprehensive Needs
Assessment and the school’s individualized data analysis, including the Achievement Gap Tool to
identify the root causes of low student performance that could be improved by district support
• Revising the District Improvement Plan to incorporate supports to the Focus School(s.)
• Setting district-level benchmarks for the support of Focus schools
• Monitoring and Evaluating the Focus Schools’ Improvement Plans and district-level benchmarks
providing a structure of differentiated supports to all students, focusing on the lowest
performing student subgroups.
Additionally, during each year of Title I Focus School identification, MDE’s District Improvement
Facilitators will provide documentation to MDE to confirm that:
• The Teaching and Learning Priorities uploaded into the online ASSIST data collection diagnostic
are reflective of the school’s data analysis of the bottom 30%
• The Teaching and Learning Priorities are documented in the Focus School’s School
Improvement Plan and clearly address the needs of students in the bottom 30%
After Focus schools are identified for the third year in a row (not meeting exit criteria), the District
Improvement Facilitator support will increase to 160 hours of support per year. This is to provide
additional support as needed per diagnostic reviews from years 1 and 2.
The timeline of requirements and supports for Focus schools follows:
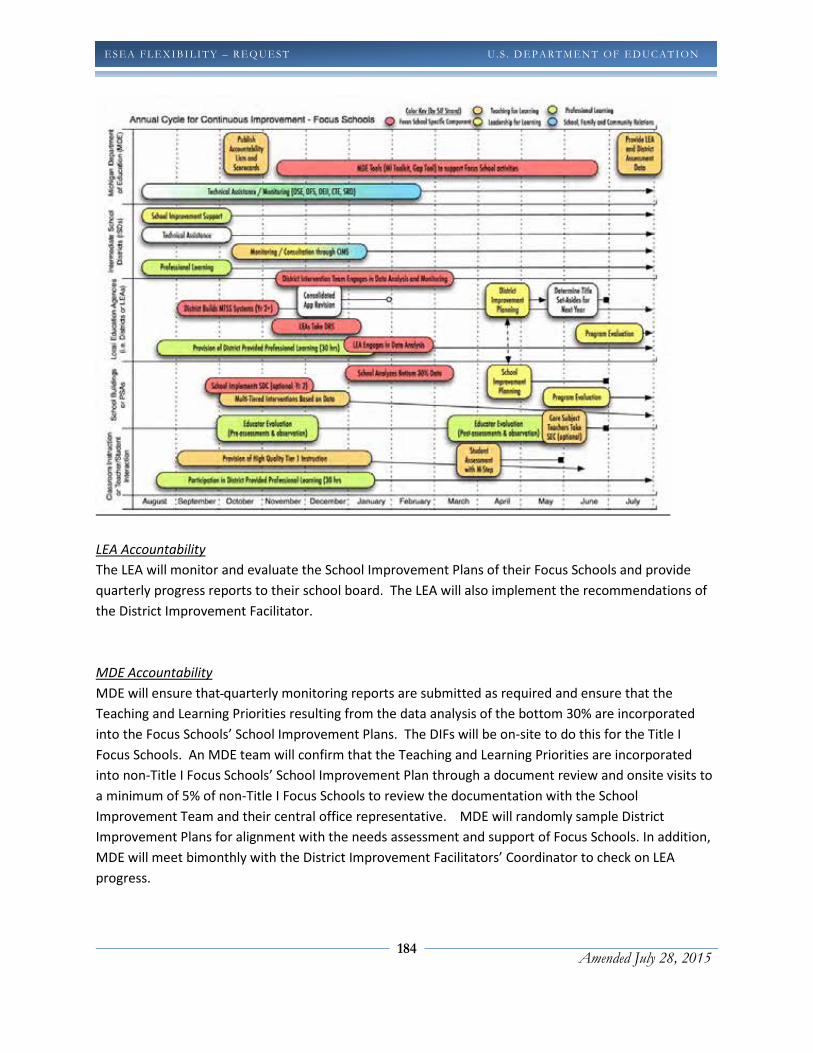
184
Amended July 28, 2015
ESEA FLEXIBI LITY – REQ UEST U . S . D EPARTMEN T OF ED UC ATION
LEA Accountability
The LEA will monitor and evaluate the School Improvement Plans of their Focus Schools and provide
quarterly progress reports to their school board. The LEA will also implement the recommendations of
the District Improvement Facilitator.
MDE Accountability
MDE will ensure that quarterly monitoring reports are submitted as required and ensure that the
Teaching and Learning Priorities resulting from the data analysis of the bottom 30% are incorporated
into the Focus Schools’ School Improvement Plans. The DIFs will be on-site to do this for the Title I
Focus Schools. An MDE team will confirm that the Teaching and Learning Priorities are incorporated
into non-Title I Focus Schools’ School Improvement Plan through a document review and onsite visits to
a minimum of 5% of non-Title I Focus Schools to review the documentation with the School
Improvement Team and their central office representative. MDE will randomly sample District
Improvement Plans for alignment with the needs assessment and support of Focus Schools. In addition,
MDE will meet bimonthly with the District Improvement Facilitators’ Coordinator to check on LEA
progress.
185
Amended July 28, 2015
ESEA FLEXIBI LITY – REQ UEST U . S . D EPARTMEN T OF ED UC ATION
Focus School Funding
Focus Schools have flexibility in leveraging Title I set-aside funds as described in Section 2E.
Funding for the Focus School: Section 1003(a)
MDE has expanded the Regional Assistance Grant to regional educational service agencies to support
the Focus schools. The service agencies (ISDs) offer similar types of supports and services at the district
level planned for Priority schools. Following the same process used for Priority schools, the District
Improvement Facilitator will assist the Focus school in determining where their needs lie, as based on
achievement data and the results of the Comprehensive Needs Assessment (CNA).
Progress to Date on Focus Schools
While the level of support and intervention for Focus schools is not as significant as for Priority schools,
MDE continues to examine progress in meeting the academic needs of students in the bottom 30%,
both as a means to determine progress on implementation in Focus schools, and to utilize information
for continuous improvement of the SSoS for supports to Focus schools. Three evaluation mechanisms
are currently employed to review progress and determine potential modifications to the supports.
• An annual review of Focus school designation gives an overall metric of progress through
implementation of the Focus school supports. Of the 338 schools identified as Focus schools in
2012, 157 were not identified in the bottom 10% for achievement gaps in 2013, and 197 were
not identified in 2014. (This data cannot be wholly reflective of progress due to interventions or
district activities, but is also due, in part, to modifications to the metric made in 2013.)
• District Intervention Facilitators from the SSoS have documented progress on key intervention
strategies, including data analysis, implementation of programmatic or system supports, and
district allocation of resources. These qualitative data provide a lens on components of the SSoS
activities and training that have resulted in ongoing improvement of the system.
• Select Focus schools have participated in a targeted pilot program (AAYMPI) on needs of
minority youth have undergone external evaluation, including focus group discussions, student
and educator surveys. Outcomes of this analysis for Focus schools have identified system level
constraints that have impacted second and third year programming for these projects to focus
on development of appropriate Tier 1 instruction and establishment of data review systems by
schools to support the broader initiatives of Focus school interventions.
Regional and State Level Infrastructure Outside of the Michigan Department of Education
In addition to the Priority and Focus school supports identified earlier in this section, schools and
districts also receive support from a range of stakeholders at the regional/state level who are outside of
the specific authority of the Michigan Department of Education. These organizations are a critical
component of the statewide infrastructure for schools in Michigan, and all have targeted roles that can
impact schools’ abilities to effectively provide instruction and support to ensure that all students are
186
Amended July 28, 2015
ESEA FLEXIBI LITY – REQ UEST U . S . D EPARTMEN T OF ED UC ATION
career and college ready. Each is identified below, along with its role, and considerations for
accountability and continuous improvement and integration into the statewide infrastructure for
supporting education efforts in public schools.
Intermediate School Districts (ISDs) and Regional Educational Service Agencies (RESAs)
Michigan utilizes a regional support structure for addressing school district needs around a variety of
academic and operational concerns. This support structure relies on 55 Intermediate School Districts
(ISDs), or Regional Educational Service Agencies (RESAs) as they are known in some locations, to provide
support to LEAs and PSAs on a range of issues that are more easily addressed at a regional level in order
to achieve efficiencies in the state infrastructure. These include some that are identified in state law,
such as monitoring and support for special education services, and others that are provided as means of
broad support for educators, students, or schools, such as processing of data, coordination of
technology infrastructures, provision of specialized academic programming, such as career technical
education programs, and general academic support for schools. Because these latter items are not
systematized in state legislation, there are no specific accountability mechanisms for ISDs around these
activities that are applied statewide. However, there are a number of mechanisms that are used at this
level to systematize the supports where possible, including:
• Regional assistance grants to ISDs to provide supports for Priority and Focus schools. Receipt of
support is based on a formula based on numbers of identified Title I receiving schools, and this
requires collection of specific data related to the supports provided, and participation in
required training for all individuals involved, so that statewide supports are consistent across
multiple ISDs/RESAs.
• IDEA monitoring through CIMS. Because special education programming is coordinated at the
ISD level, all ISDs are monitored by the state for provision of services through IDEA funding.
• School Improvement Facilitator networks. ISDs support the school improvement and district
improvement processes identified earlier in this section, and all facilitators of this work are part
of a structured network of individuals who receive training and develop common practices,
tools, and standards of practice for this work.
• Various academic area networks. Most ISDs have content area specialists who provide targeted
support to schools in the ISD service area through various means. Each of these has
mechanisms for addressing the programming and support needs in systemic ways throughout
the state, including the following groups:
o General Education Leadership Network (GELN) – a group of directors of general
education programming at the ISD level
o Math/Science Centers and related groups – a network of 33 centers that provide
curricular, professional learning, and student programming support in mathematics and
science. Many are based at ISDs, and are organized to support one or multiple ISDs.
o MI-Lit Literacy Network – a network of ELA and student literacy support providers
throughout the state that are involved in statewide literacy initiatives and programming.
187
Amended July 28, 2015
ESEA FLEXIBI LITY – REQ UEST U . S . D EPARTMEN T OF ED UC ATION
Charter School Authorizers
Michigan’s legislation for public school academies (charter schools) allows for multiple organizations to
be able to authorize the creation of such schools through a structured authorization process. As such,
Michigan currently has 39 such organizations that have established charter schools in the state, with
Michigan currently having 302 such schools in operation in the 2014-15 school year.
MDE has limited oversight of such authorizing activities, other than that identified in MCL 380.502 – 507.
Michigan utilizes both the National Association of Charter School Authorizer (NACSA) standards and
MDE identified practices and accountability considerations based upon legal requirements of all schools
as guidance to address the following:
• Charter contract quality
• Portfolio achievement (including academics, financials, operations and compliance, and
transparency)
• Assurance and Verification Program
• Mandatory revocation of charters for non-performance
In order to provide the highest quality outcomes possible with respect to the authorization of new
schools, MDE will continue to review and “assurance and verification program” to increase the emphasis
on the achievement of rigorous educational goals, narrowing achievement gaps, and leading students to
career and college readiness. MDE will continue to work toward establishing and maintaining charter
authorizer practices that are aligned with NACSA standards, including the issuance of quality charter
contracts. This alignment will be enhanced by MDE’s implementation of a targeted authorizer technical
assistance program which will ultimately lead to improvements in authorizer achievement as it related
to academics, finance, operations and compliance, and transparency. Additionally, MDE will develop
clear guidelines to prove the State Superintendent with the information needed to make decisions
regarding the mandatory closure of charter schools, and the suspension of charter authorizing bodies
that fail to engage in appropriate continuous oversight.
Statewide Professional Organizations
Michigan has a number of professional organizations supporting specific roles in state, regional, and
local education, including leadership organizations (Michigan Association of School Administrators,
Michigan Association of Intermediate School Administrators, Michigan Association for Supervision and
Curriculum Directors, Michigan Association of Secondary School Principals, etc.), educator organizations
(Michigan Science Teachers Association, Michigan Council for Social Studies, etc.), and educational
policy organizations (Michigan Education Association, Michigan Association of Charter School
Authorizers, Ed-Trust Midwest, etc.) that all provide input and support for educators and organizations
throughout the Delivery Chain. While Michigan has no specific authority over these organizations and
the work they support, they are all considered valuable partners in guiding policy and supporting
implementation at the state and local level. MDE utilizes these organizations as valued partners in the
188
Amended July 28, 2015
ESEA FLEXIBI LITY – REQ UEST U . S . D EPARTMEN T OF ED UC ATION
Education Alliance, a stakeholder group that provides ongoing feedback on policies and practices. MDE
also works with select organizations to support targeted implementation of efforts through supports
and coordination of recourses that these organizations might provide directly to members or schools.
Improving MDE and School Capacity
MDE will build its capacity because it will have a better sense of the performance of all schools due to
the dual identification of the Top-to-Bottom list and the identification of the largest gaps. This will allow
MDE to better provide services, tools and products to meet the needs of schools.
The LEAs with Priority schools will build their capacity to understand how to use MDE’s School Data
Analysis, School Systems Review/Self-Assessment/Interim Self-Assessment and Goals and Plans in the
School Improvement Plan to identify root causes of why schools are not achieving. In collaborating with
the regional educational service agency consultants on School Support Teams, LEAs will build their
collaboration skills, planning skills, monitoring skills and evaluation skills. Identifying which components
of the Statewide System of Support best meets the needs of its Priority schools has the potential of
building the LEA’s capacity to form partnerships with the providers of the components.
The LEAs with Focus schools will build their capacity to understand how to use MDE’s, District Systems
Review/Self-Assessment/Interim Self-Assessment and Goals and Plans in the District Improvement Plan
to identify the root causes of where their district falls short in being able to support a school with large
achievement gaps. The District Improvement Facilitator will spend a minimum number of days with
central office staff to build their capacity related to many core leadership functions, including how to:
• Identify priorities;
• Remove barriers to effective teaching and learning;
• Meet the professional development needs of teachers;
• Use the evaluation system to focus on instructional improvement; and
• Monitor and evaluate school improvement plans.
• Implement multi-tiered systems of support to address individual learning needs
With the support of their central office and the District Improvement Facilitator, schools will build their
capacity to make the connection among student achievement data (summative and formative,) school
demographic data, school process data, school perceptual data and what they do with students in the
classroom. Schools will increase their capacity to monitor the implementation of school improvement
plans and the impact of this implementation on student achievement.
In order to support continuous improvement, MDE engages in regular program evaluation of support
programs and services, and conducts internal analyses and research to determine impact on teaching
and learning for a variety of programs and efforts. Specific to statewide programs, MDE has engaged in
third-party evaluation activities for all priority and focus school supports, as well as for grand funding

189
Amended July 28, 2015
ESEA FLEXIBI LITY – REQ UEST U . S . D EPARTMEN T OF ED UC ATION
programs, such as the Math-Science Partnership grants, and SIG program for individual schools. MDE
has implemented these through competitive bidding processes for most programs, and has worked with
partners such as the American Institute for Research, West-Ed, SRI, and other statewide evaluation
programs to determine impacts and opportunities for growth.
MDE also developed pilot programs as a means of determining possible impact of statewide
implementation of programs and supports. These include the African American Young Men of Promise
Initiative, a new pilot program in MTSS implementation, and the Program Evaluation pilots that have
taken place over the last two years. Additionally, MDE pilots modifications to program requirements,
such as the transfer of new requests or data assurances in ASSIST (for school improvement) through the
use of small samples and field-test groups, as well as with a regular convening of the committee of
practitioners and the ISD Advisory Council.
MDE has recently reviewed the range of supports and requirements provided to Priority and Focus
schools, in order to align program requirements and provide coherence to participating schools. The
following table illustrates the review process, which includes analysis of primary stakeholders, focus of
programming, and timeline requirements. These analyses have resulted in a significant reduction in
required data collection and plan requirements that address similar functions.
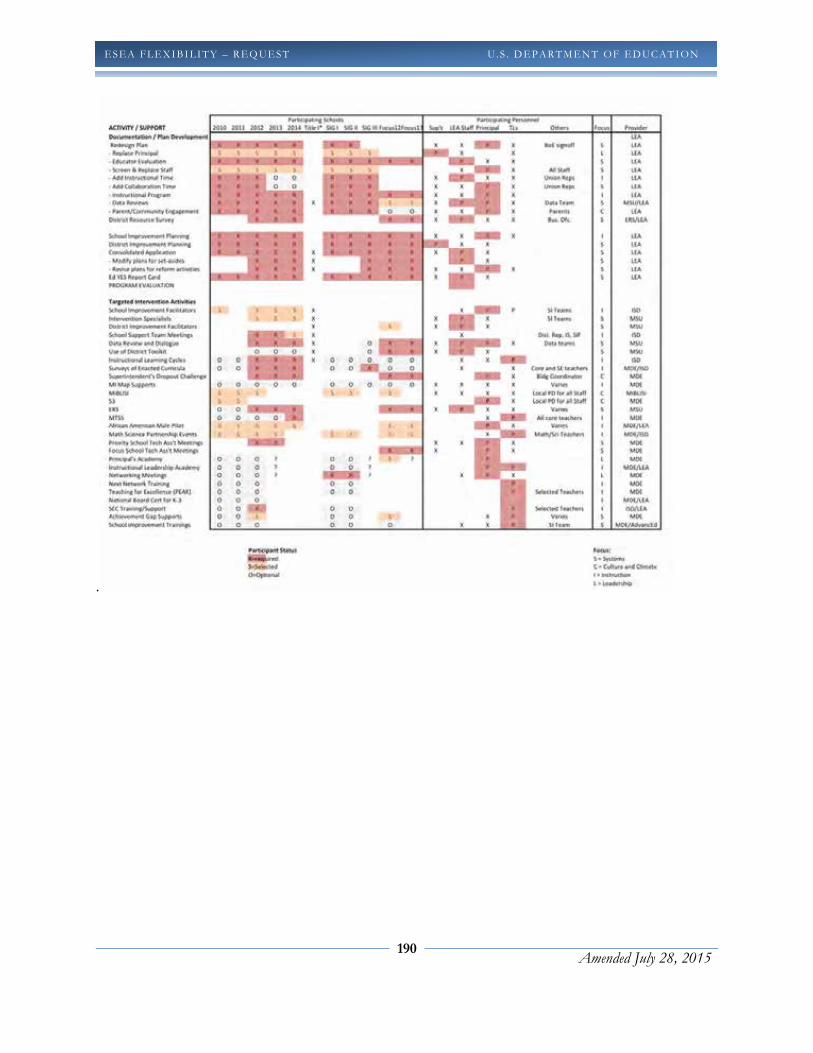
190
Amended July 28, 2015
ESEA FLEXIBI LITY – REQ UEST U . S . D EPARTMEN T OF ED UC ATION
.

191
Amended July 28, 2015
ESEA FLEXIBI LITY – REQ UEST U . S . D EPARTMEN T OF ED UC ATION
PRINCIPLE 3: SUPPORTING EFFECTIVE INSTRUCTION
AND LEADERSHIP
3.A DEVELOP AND ADOPT GUIDELINES FOR LOCAL TEACHER AND PRINCIPAL EVALUATION AND SUPPORT SYSTEMS
Select the option that pertains to the SEA and provide the corresponding description and evidence, as
appropriate, for the option selected.
Option A
If the SEA has not already developed and
adopted all of the guidelines consistent with
Principle 3, provide:
i. the SEA’s plan to develop and adopt
guidelines for local teacher and principal
evaluation and support systems by the end
of the 2011–2012 school year;
ii. a description of the process the SEA will use
to involve teachers and principals in the
development of these guidelines; and
iii. an assurance that the SEA will submit to the
Department a copy of the guidelines that it
will adopt by the end of the 2011–2012
school year (see Assurance 14).
Option B
If the SEA has developed and adopted all of
the guidelines consistent with Principle 3,
provide:
i. a copy of the guidelines the SEA has
adopted (Attachment 10) and an
explanation of how these guidelines are
likely to lead to the development of
evaluation and support systems that
improve student achievement and the
quality of instruction for students;
ii. evidence of the adoption of the guidelines
(Attachment 11); and
iii. a description of the process the SEA used
to involve teachers and principals in the
development of these guidelines.
Local Teacher and Principal Evaluation Guidelines
MDE believes in improving the quality of teaching, of leadership at the building and district levels, and
also believes in rewarding excellence in our educators and enhancing the professionalism of teachers
in our state.
Our Theory of Action � Principle Three
If a school’s challenges are accurately diagnosed through data analysis and professional
dialogue at the building and district levels, then the implementation of a focused and

192
Amended July 28, 2015
ESEA FLEXIBI LITY – REQ UEST U . S . D EPARTMEN T OF ED UC ATION
customized set of interventions will result in school and student success. This approach will
result in:
• Consistent implementation of career- and college-ready standards
• Rapid turnaround for schools not meeting annual measurable objectives (AMOs)
• Reduction in the achievement gap
• Reduction in systemic issues at the district level
• Improvements to the instructional core
• Better understanding/utilization of data
• Improved graduation and attendance rates
• Building of/support for effective teaching
• Building of/support for school leadership capacity
• Effective accomplishment of responsibilities by district leadership
As outlined in our theory of action, educators working in tandem with students, bolstered by a system
of accountability and supports, are key elements in allowing Michigan to reach our goals of career-
and college-readiness for all students and a reduction in the achievement gap around the state. To
support this work, MDE has been engaged in systematically implementing educator evaluations
statewide, in efforts that include legislation, locally-driven initiatives, and initiatives supported by
MDE. These efforts will eventually result in Michigan having a statewide evaluation model not only
for teachers, but also for administrators. It is important to note that MDE specifically extends
responsibility and evaluations beyond the principal and into central office leadership, believing that
quality education practices must be evident at all levels of the organization.
As MDE works to develop a statewide evaluation model, we are simultaneously implementing locally-
developed evaluation systems, which provide for a laboratory of ideas and opportunities for piloting
local initiatives, and also ensure that we begin changing the quality of instruction and educational
leadership in Michigan immediately.
Educator Evaluations: Legislative and Policy Background
In 2009, Michigan passed legislation requiring annual educator evaluations that included student
growth as a “significant part,” the results of which are used to inform decisions about promotion,
retention, placement and compensation. These evaluations were specified to begin during the 2011-
2012 school year. Michigan’s LEAs immediately began preparing to implement this legislation, and
are now in the midst of the fourth year of implementing these locally-developed annual educator
evaluations for all teachers and administrators. Every single one of Michigan’s educators are
evaluated using measures of student growth, and the results of these evaluations are reported into
MDE’s data systems.
193
Amended July 28, 2015
ESEA FLEXIBI LITY – REQ UEST U . S . D EPARTMEN T OF ED UC ATION
One issue with the original legislation was that it did not standardize the process across districts, in
order to ensure both a standard of quality and continuity in ratings. To address this shortcoming, the
Michigan legislature revisited the original statute in the summer of 2011 and revised it in order to
introduce more standardization and comparability into both the educator evaluation system and the
ratings produced by this system.
This legislation now provides MDE with a statutory template for implementing a statewide system of
teacher and administrator evaluation and support systems. Legislation serves as MDE’s educator
evaluation guidelines.Michigan was one of few states implementing annual educator evaluations that
include student growth as a significant portion in the 2011-2012 school year and thereafter, due to its
proactive and aggressive legislation. This is strength for Michigan, even though to-date evaluation
systems differ across districts. We do know, however, that districts have been having critical
conversations with stakeholders, designing observation rubrics, looking for solutions to integrate
growth, developing local assessments, partnering with foundations or other nonprofit enterprises in
their area, and collaborating with each other as they work to develop a system that is fair and that
meets the criteria of the original law.
From autumn 2013 through early summer 2014, the Michigan Legislature continued to pursue policy
changes for educator evaluation as a result of the Michigan Council on Educator Effectiveness (MCEE)
recommendation report. The MCEE was tasked by Public Act 102 of 2011 with providing
recommendations on a statewide evaluation model for both teachers and administrators. The MCEE
was expected to report in June 2012, but took an extra year to pilot programs in Michigan schools.
The final report was made public in July 2013 and can be found here: http://mcede.org/.
After much debate surrounding the MCEE recommendations, the Michigan Legislature again
introduced legislation in 2013 in the form of House Bills 5223-5224. This bipartisan package moved
from the Michigan House, but ultimately could not find support in the Senate. A compromise was
reached in June 2014 and the legislature amended the educator evaluation laws by passing Senate Bill
817/Public Act 257 of 2014. This legislation required LEAs, for the 2014-2015 school year and for
grades and subjects in which state assessments are administered in compliance with federal law, to
measure student growth, at least in part, using the state assessments when available. This new law
also pushed back the implementation timeline for a more uniform system to the 2015-2016 school
year.
As the MDE continues to work with the Michigan Legislature on educator evaluations, it will begin
implementing two important new tools in 2014-15: student growth percentile (SGP) and student
learning objectives (SLO).
194
Amended July 28, 2015
ESEA FLEXIBI LITY – REQ UEST U . S . D EPARTMEN T OF ED UC ATION
Student Growth Percentile (SGP)
MDE’s continuing effort to provide schools with the best available data for educator evaluations
includes calculating and reporting Student Growth Percentiles (SGPs) for Michigan students. SGPs will
be calculated starting in 2014-2015 for all students with two consecutive valid state assessments.
Current state educator evaluation law requires districts to use student growth on state assessments
as a significant factor in educator evaluations. SGPs represent one powerful way of quantifying
student academic growth from year to year. As such, beginning with the 2014-15 school year,
Michigan will use SGPs as the unified statewide approach to measuring student growth on state
assessments.
Conceptually, SGPs communicate student growth in a particular domain, compared to a group of
academic peers who had a comparable score on the previous test (or multiple previous tests) in that
subject. In order to calculate SGPs, students are grouped with academic peers throughout the state
who had comparable score patterns on past tests. Students in each academic peer group are then
ordered based on their scores on the current year test. Each student then receives a percentile rank,
compared to their academic peers.
While SGPs are an important component of Michigan’s accountability plans, they also provide
valuable information that can be used to promote and evaluate educator effectiveness. SGPs provide
a context in which to interpret student achievement scores based on statewide growth patterns for
students with comparable starting points.
Schools will receive SGPs for students with consecutive tests in each of the four state-assessed
content areas: English language arts, math, science and social studies. These SGPs can easily be
aggregated and used as a component of teacher and principal evaluation. The most common SGP
aggregation methods for educator evaluation are median SGP and mean SGP. Either of these
methods indicates the average growth for a group of students, compared to academically-comparable
peers across the state.
Existing Michigan legislation calls for “at least 50% of the annual year-end evaluations shall be based
on student growth and assessment data. All student growth and assessment data shall be measured
using the student growth assessment tool that is required under legislation enacted by the legislature
after review of the recommendations contained in the report of the former Michigan council for
educator effectiveness” (MI Senate Bill 817/Public Act 257, enacted June 30, 2014).
195
Amended July 28, 2015
ESEA FLEXIBI LITY – REQ UEST U . S . D EPARTMEN T OF ED UC ATION
Michigan will provide student growth percentile (SGP) data from our state assessments to every
district in Michigan. We will also provide guidance regarding how to use that SGP data in educator
evaluation and support systems, and ensure through our educator evaluation survey and review of
school improvement plans that districts are utilizing this guidance. Michigan will ensure and provide
evidence that, for teachers of tested grades and subjects, at least one SLO is based on student results
on the state assessment. Michigan will also ensure that SGP data from the state assessments is used
as a validation point against those SLOs that are based on the state assessment, and, where
appropriate, may also be used as validation against other SLOs based on local assessment data or
other forms of growth data utilized by districts for teachers of tested grades and subjects. This
validation will be based upon comparison of individual teachers’ median SGP to (1) that teacher’s
summative rating or (2) that teacher’s SLO-based growth to identify substantial discrepancies. The
SEA will annually identify any schools with a substantial number or percentage of teachers with such
discrepancies, and will then provide support to districts and schools designed to address those
discrepancies.
In addition, MDE is currently collaborating with CEPI to develop a system for tracking teachers’ rosters
at the state level. This could eventually lead to Michigan providing aggregate SGPs at the teacher level
as an additional measure of support for schools’ efforts with educator evaluation.
There are districts in Michigan currently operating under a waiver from using the state system for
educator evaluations. Those with this waiver are required to have a system equivalent to the state
system. Going forward, MDE will provide and ensure usage of the guidance regarding state
assessment data and other aspects for all districts, as districts with a waiver are required to be
equivalent to the state system.
Student Learning Objectives (SLO)
Student learning Objectives (SLO), are one way to measure the academic growth of students. While
the use of SLOs is not required, the Michigan Department of Education (MDE) endorses SLOs as one
way to measure student growth, and will provide guidance documents that may be used to support
local implementation.
An SLO is a measurable, long term, academic goal, informed by available data, that a teacher or
teacher team sets at the beginning of the year for all students. SLOs are used widely by schools across
the nation as one measure in the educator evaluation system because of the strengths of the SLO
process.
Student learning Objectives are:
• Versatile—SLOs can be used to measure student growth for all teachers, not just those
teachers in tested grades and subjects.

196
Amended July 28, 2015
ESEA FLEXIBI LITY – REQ UEST U . S . D EPARTMEN T OF ED UC ATION
• Teacher Driven—Teachers understand their students best; the use of SLOs allows teachers to
set goals for their students, thus playing a critical role in their evaluations.
• Adaptable—Finally SLOs can be flexible and adaptable; as schools implement new standards
and curriculum, SLOs can still be used to measure student learning.
MDE has been working since Fall of 2014 towards Student Learning Objective (SLO) guidelines and
guidance. The SLO work group consists of representatives of the following departments within MDE---
Office of Educational Improvement and Innovation (OEII), Office of Special Education (OSE), Office of
Field Services (OFS), Office of Career and Technical Education (OCTE), and Office of Educational
Assessment and Accountability (OEAA) participation of four Intermediate school districts Ottawa Area
ISD, Washtenaw ISD, Livingston ESA and Eastern Upper Peninsula ISD.
The SLO work group has produced an SLO Template, checklists and FAQ document. These outputs will
guide local districts in incorporating SLOs into their evaluation system.
The SLO work group will complete its work in spring 2015. The work group will be prepared to present
recommendations that will go into effect in the Fall of 2015. The workgroup will share these
resources at various venues around the state, regularly scheduled webinars and web-based guidance
so that LEAs will be prepared to use them in the fall.
Resources & Final Guidelines
One of the key elements of the second round of educator evaluation legislation was the creation of
the Michigan Council on Educator Effectiveness (MCEE), a two-year appointed body tasked with the
creation of a statewide evaluation model for both teachers and administrators.
The MCEE consisted of three members appointed by the Governor, including Deborah Loewenberg
Ball (dean of the University of Michigan School of Education), Mark Reckase (professor of
Measurement and Quantitative Methods at Michigan State University) and Nicholas Sheltrown
(director of measurement, research and accountability at National Heritage Academies in Grand
Rapids). The council has two additional members appointed by the Senate Majority Leader and
Speaker of the House, respectively; David Vensel, the principal of Jefferson High School in Monroe,
MI, and Jennifer Hammond, principal of Grand Blanc High School. Finally, MCEE includes a designee of
the Superintendent of Public Instruction as a non-voting member; this individual is Joseph Martineau,
Executive Director of the Bureau of Assessment and Accountability for the MDE. The statute required
that the members of the Council have expertise in psychometrics, measurement, performance-based
educator evaluation models, educator effectiveness, or development of educator evaluation
197
Amended July 28, 2015
ESEA FLEXIBI LITY – REQ UEST U . S . D EPARTMEN T OF ED UC ATION
frameworks in other states, and the selected Council is well-qualified and highly respected in these
fields.
The MCEE met regularly, and completedthe critical task of determining the key elements of a
statewide evaluation system. The Council reported these recommendations to the Legislature, the
State Board of Education, the Governor, and other education stakeholders in a report published July
2013. This report is accessible at http://www.mcede.org/reports.
MDE, following the recommendations of the MCEE, supports the following teacher and administrator
evaluation models:
Teacher Evaluation Models
• Transform Teacher Evaluation with The Thoughtful Classroom:
The Thoughtful Classroom Teacher Effectiveness Framework
• 5 Dimensions of Teaching and Learning
• Charlotte Danielson Framework for Teaching
• Marzano Teacher Evaluation Model
Administrator Evaluation Models
• Marzano School Leader Evaluation Model
• MASA’s School Advance Administrator Evaluation Instrument
• Reeve Leadership Performance Rubric
MDE will support school districts with professional learning opportunities with the models listed
above and/or other models as set forth in state law.
Teachers of students with disabilities
Michigan's legislation on educator evaluation makes clear two main principles: 1) that the student
growth and assessment tool that will be recommended by the Council must include assessments that
can be used with students with disabilities and 2) that the statewide evaluation system must be able
to be used to evaluate teachers of students with disabilities. We acknowledge the need for high
standards for student growth for students with disabilities, and also acknowledge the need for some
flexibility in how that growth is defined and measured. The evaluation system will utilize growth data
from state assessments.
Michigan’s educator evaluation law requires that every educator be evaluated annually, using student
growth data as a significant part. This means that each teacher is responsible for the growth
experienced by students in his or her classroom, regardless of whether they are students with
198
Amended July 28, 2015
ESEA FLEXIBI LITY – REQ UEST U . S . D EPARTMEN T OF ED UC ATION
disabilities or ELLs. Through our Teacher-Student Data Link, we have provided districts with lists of
every teacher in their district, with all students for whom they were the teacher of record for some
class, and their relevant assessment data, attached. Districts must apply local rules regarding student
attribution, attendance, etc., to that file, and can then integrate those growth data into the teacher’s
evaluation. We have also developed a tool to help them analyze these data and determine the
average weighted growth index of students by each teacher, school and district (where more growth
receives a higher weight and declines receive a lower weight). At the present time, the growth data
that can be provided from state assessments is limited to reading and mathematics in grades three
through seven, both on the MEAP and the MI-Access (Functional Independence). We have also
provided districts with student results from the English Language Proficiency Assessment (ELPA),
linked to their teacher of record, and a district can choose to factor those data into a general
education teacher’s evaluation.
MDE Support for Implementation
As MDE adopts assessments aligned to career- and college- ready standards and develops additional
interim benchmark measures, more growth data from state assessments will be available for use.
MDE will support what is specifically required in the legislation, and will base its supporting resources
on best practices from the field and from nationwide research.
Our resources will support:
• Integration of student growth from state assessments into evaluations (offering ways to
evaluate local and national assessment tools for their ability to measure growth);
• Development of an observation protocol (steps involved, quality checks necessary, how to
evaluate the tool for appropriateness);
• Important elements of training for evaluators. For this, we will use the Measures of Effective
Teaching findings as well as partner with organizations like the Michigan Education
Association to help districts identify the key elements of a high-quality training program for
their evaluators;
• Inclusion of suggestions, ideas, and cautions for developing final metrics that combine
multiple measures.
MDE reiterates that these resources are developed and provided to support our districts while the
Council continues its work; These resources will provide an intermediary step in helping to introduce
consistency across district systems.
MDE plans to leverage two sources when developing resources:
• State legislation regarding the requirements of the statewide evaluation system in order to
align the interim guidelines with the final requirements; and
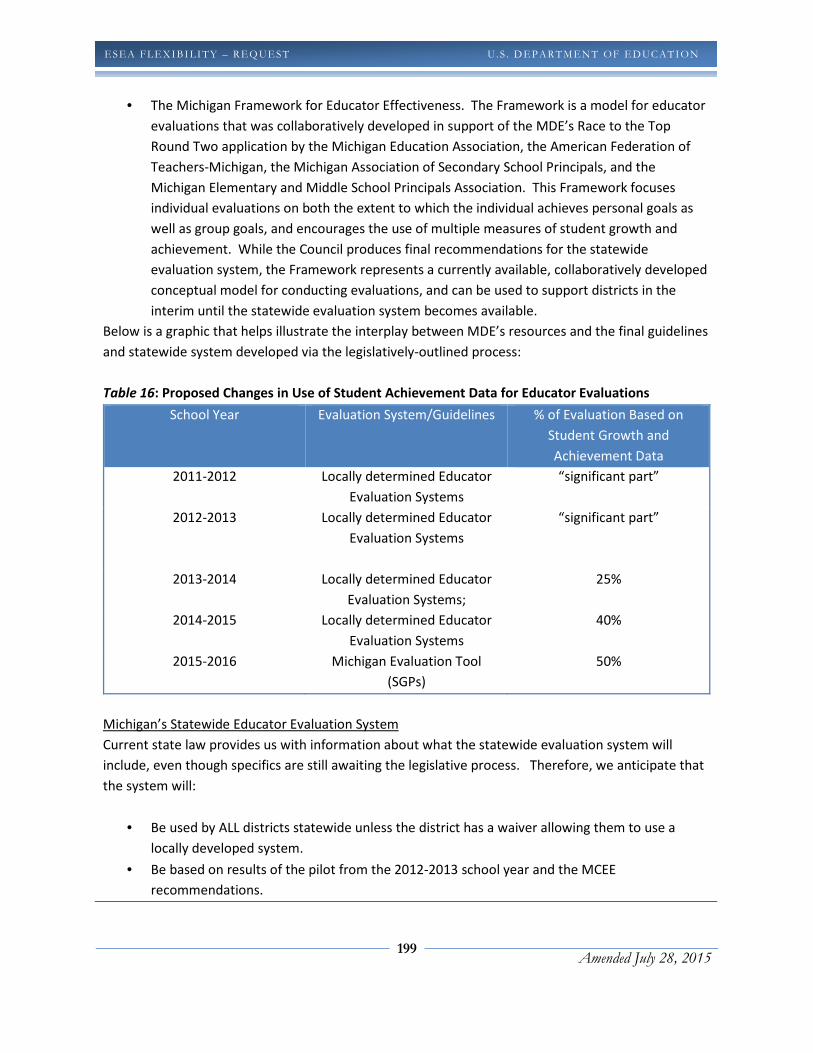
199
Amended July 28, 2015
ESEA FLEXIBI LITY – REQ UEST U . S . D EPARTMEN T OF ED UC ATION
• The Michigan Framework for Educator Effectiveness. The Framework is a model for educator
evaluations that was collaboratively developed in support of the MDE’s Race to the Top
Round Two application by the Michigan Education Association, the American Federation of
Teachers-Michigan, the Michigan Association of Secondary School Principals, and the
Michigan Elementary and Middle School Principals Association. This Framework focuses
individual evaluations on both the extent to which the individual achieves personal goals as
well as group goals, and encourages the use of multiple measures of student growth and
achievement. While the Council produces final recommendations for the statewide
evaluation system, the Framework represents a currently available, collaboratively developed
conceptual model for conducting evaluations, and can be used to support districts in the
interim until the statewide evaluation system becomes available.
Below is a graphic that helps illustrate the interplay between MDE’s resources and the final guidelines
and statewide system developed via the legislatively-outlined process:
Table 16: Proposed Changes in Use of Student Achievement Data for Educator Evaluations
School Year Evaluation System/Guidelines % of Evaluation Based on
Student Growth and
Achievement Data
2011-2012 Locally determined Educator
Evaluation Systems
“significant part”
2012-2013 Locally determined Educator
Evaluation Systems
“significant part”
2013-2014 Locally determined Educator
Evaluation Systems;
25%
2014-2015 Locally determined Educator
Evaluation Systems
40%
2015-2016 Michigan Evaluation Tool
(SGPs)
50%
Michigan’s Statewide Educator Evaluation System
Current state law provides us with information about what the statewide evaluation system will
include, even though specifics are still awaiting the legislative process. Therefore, we anticipate that
the system will:
• Be used by ALL districts statewide unless the district has a waiver allowing them to use a
locally developed system.
• Be based on results of the pilot from the 2012-2013 school year and the MCEE
recommendations.
200
Amended July 28, 2015
ESEA FLEXIBI LITY – REQ UEST U . S . D EPARTMEN T OF ED UC ATION
• Be used for continual improvement of instruction. The current statute specifies that “the
annual year-end evaluation shall include specific performance goals that will assist in
improving effectiveness for the next school year and are developed by the school
administrator... in consultation with the teacher, that would assist the teacher in meeting
those goals” (PA 102of 2011) Additionally, Michigan’s new tenure laws (passed in
conjunction with this evaluation legislation) require that decisions related to promotion,
retention, placement, and tenure be based solely on effectiveness, not length of service. This
provides a high-stakes reason for educators to use the results of their annual evaluations to
improve instruction, as there is now an incentive/consequence structure attached to these
efforts.
• Differentiate performance using four performance levels. The current statute requires that
educators receive one of four ratings: ineffective, minimally effective, effective and highly
effective (PA 102 of 2011) for teachers and for principals and other school administrators.
• Use multiple valid measures, including a significant factor on student growth. These
measures will include student growth as provided in state administered assessments. SGPs
are Michigan’s statewide approach to measuring growth on state assessments.
o The legislation requires that evaluation systems will include student growth
assessment data as a significant factor. The legislation requires the following:
� 2013-2014: 25% of the annual year-end evaluation based on student growth
and assessment data.
� 2014-2015: 40% of annual year-end evaluation based on student growth and
assessment data.
� 2015-2016: 50% of annual year-end evaluation based on student growth and
assessment data.
o For teachers, the current legislation requires that evaluation systems include, at a
minimum: student growth and assessment data and multiple classroom
observations.
o For administrators, the current legislation requires that the evaluation systems
include, at a minimum: student growth data (aggregate student growth data used in
teacher evaluations), a principal or administrator’s proficiency in evaluating teachers,
progress made by the school or district in meeting the goals set forth in the school’s
school improvement plan, pupil attendance, student, parent and teacher feedback,
and other information considered relevant [PA 102 of 2011].
o Requires that all student growth and assessment data shall be measured using the
“student growth assessment tool that is required under legislation enacted by the
legislature after review of the recommendations contained in the report of the
Michigan Council” [PA 102 of 2011]. Since the “student growth assessment tool” is
required to provide a way to assess all students in all grades, including students with

201
Amended July 28, 2015
ESEA FLEXIBI LITY – REQ UEST U . S . D EPARTMEN T OF ED UC ATION
disabilities and English language learners, student growth data for all students will be
included in the evaluation system.
• Include a process for ensuring that all measures that are included are valid measures.
o The Michigan Council hasrecommended four models for classroom observation
protocols.
o The Michigan Council has also recommended that the state should “produce value-
added modeling (VAM) scores for educators on state-provided assessments in the
core content areas” in cases where it is professionally responsible to do so.
o The Michigan Coundil has also provided guidelines for the state’s process for
approving local evaluation tools for teachers and principals.
• Define a statewide approach for measuring student growth in grades and subjects that are
not currently tested.
o The clear intention of the legislation is that MDE will expand its portfolio of state
assessments to provide growth data in all grades and subjects; or will expand its
portfolio of approved national or local assessment tools that can be validly used to
determine growth in all grades and subjects.
• Require that teachers and principals be evaluated on a regular basis:
o The statute currently requires annual evaluations for all educators.
o The statute also requires multiple classroom observations, which means the
evaluation system will, at a minimum, have to give teachers feedback at two or more
time points throughout the year.
o For provisional teachers, as well as teachers who have been rated as ineffective, a
midyear progress report is required.
o The legislation that is already in place and that governs the evaluation work in 2011-
2012 and 2012-2013 requires that all educators be evaluated annually.
• Provide clear, timely, and useful feedback, including feedback that identifies needs and
guides professional development.
As stated previously, the statute requires that “the annual year-end evaluation shall
include specific performance goals that will assist in improving effectiveness for the next
school year and are developed by the school administrator... in consultation with the
teacher, that would assist the teacher in meeting those goals” [PA 102 of 2011].
Teacher and Principal Inclusion in the Process
The MDE followed a three-pronged approach to involve principals and teachers in the process of
developing guidelines for a state system: 1) through the legislatively-mandated process and 2) by
including representatives from these stakeholder groups in the work of the MCEE and 3) through
more iterative and hands-on interactions with stakeholders through MDE’s technical assistance and
support to the field. We believe that the combination of these processes hasengagedprincipals and
teachers in multiple ways.

202
Amended July 28, 2015
ESEA FLEXIBI LITY – REQ UEST U . S . D EPARTMEN T OF ED UC ATION
The state legislation specifies involvement of principals and teachers in the process. This includes:
• Two principals serve on the five-member Michigan Council on Educator Effectiveness.
• The 14-person advisory committee to the Michigan Council has to include teachers,
administrators and parents.
• As noted above (recommendation (b)(ii) of the Michigan Council), the Council must seek input
from school districts, Regional Educational Service Agencies, and charter schools that have
already developed and implemented successful, effective performance evaluation systems.
• The final report of the Michigan Council was submitted to the legislature and the State Board
of Education in July 2013, both of which solicit feedback from various stakeholders.
Additionally, MDE supported the work of the Council and acted as a conduit for best practices,
examples from the field, and stakeholder feedback. MDE conducted the following activities with
teachers and principals:
• Hosted a “best practices” conference in April 2011 for districts, schools and professional
organizations in Michigan to demonstrate to other districts and schools, as well as to MDE,
educator evaluation systems or components of these systems. This was an opportunity for
MDE, as well as the education community, to hear feedback from those engaged in this work.
The conference was attended by over 600 individuals from around the state.
• MDE hosted a second conference in February 2012 focusing specifically on three topics
related to student growth:
• How to use the growth data from state assessments in evaluation systems;
• How to measure student growth in currently non-tested subjects and grades; and
• How to combine multiple measures when determining a final effectiveness level.
This conference is in specific response to feedback ME received from districts and schools
regarding their questions, concerns and needs, and will again feature “best practices” from
districts that have identified ways to integrate student growth for all educators.
• Offer continual and ongoing technical assistance to districts upon request, reviewing their
proposed systems, offering suggestions or providing resources, and collecting information on
the needs of the field in terms of developing rigorous systems.
• Present in multiple venues statewide to groups of stakeholders to share information on the
legislative timelines, as well as to gather information and feedback from attendees regarding
their concerns, suggestions and activities to develop these systems in their local context.
This work by MDE, in addition to providing support to LEAs and schools as they navigate this process,
allows us to gather feedback on a micro-level from stakeholders, both regarding challenges and
concerns but also regarding best practices and successful strategies. MDE plans to continually share

203
Amended July 28, 2015
ESEA FLEXIBI LITY – REQ UEST U . S . D EPARTMEN T OF ED UC ATION
this feedback with the Michigan Council, to supplement the formal methods outlined in statute for
principals and teachers.
Table 17. Timeline for Implementation of Educator Evaluation System
MICHIGAN’S EDUCATOR EFFECTIVENESS GUIDELINES & MDE SUPPORT
Date Requirements based
on Michigan Law
USED
Requir
ements
Party
Responsibl
e
Evidence Resources Obstacles
School
Year
2010-
2011
State Fiscal
Stabilization Fund
requirement:
administrator
effectiveness labels
must be publicly
reported on
www.mischooldata.or
g.
N/A www.michig
an.gov/misc
hooldata
March
2011
MDE develops an
“Educator
Evaluations” tab on its
website as a location
for the latest
information regarding
evaluations and
effectiveness in
Michigan, resources
from across the
country, and other
evaluation-related
information.
N/A MDE - BAA www.michig
an.gov/baa
April
2011
MDE hosts an
Educator Effectiveness
Conference for district
participation to
understand the laws,
to assist with
development of local
evaluation systems, to
showcase districts
already in the process
of developing and/or
N/A MDE - BAA Assistance
from Great
Lakes East;
BAA staff
organizer
Securing
funding to
get the
conference
planning
underway.
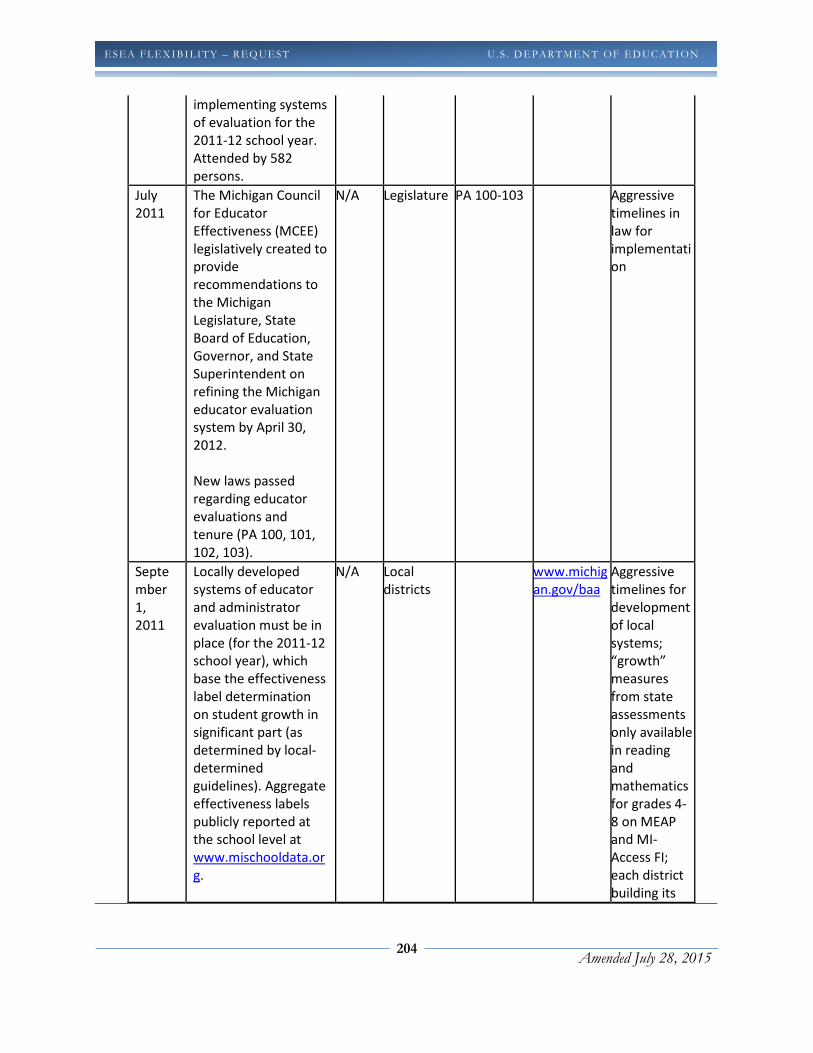
204
Amended July 28, 2015
ESEA FLEXIBI LITY – REQ UEST U . S . D EPARTMEN T OF ED UC ATION
implementing systems
of evaluation for the
2011-12 school year.
Attended by 582
persons.
July
2011
The Michigan Council
for Educator
Effectiveness (MCEE)
legislatively created to
provide
recommendations to
the Michigan
Legislature, State
Board of Education,
Governor, and State
Superintendent on
refining the Michigan
educator evaluation
system by April 30,
2012.
New laws passed
regarding educator
evaluations and
tenure (PA 100, 101,
102, 103).
N/A Legislature PA 100-103 Aggressive
timelines in
law for
implementati
on
Septe
mber
1,
2011
Locally developed
systems of educator
and administrator
evaluation must be in
place (for the 2011-12
school year), which
base the effectiveness
label determination
on student growth in
significant part (as
determined by local-
determined
guidelines). Aggregate
effectiveness labels
publicly reported at
the school level at
www.mischooldata.or
g.
N/A Local
districts
www.michig
an.gov/baa
Aggressive
timelines for
development
of local
systems;
“growth”
measures
from state
assessments
only available
in reading
and
mathematics
for grades 4-
8 on MEAP
and MI-
Access FI;
each district
building its
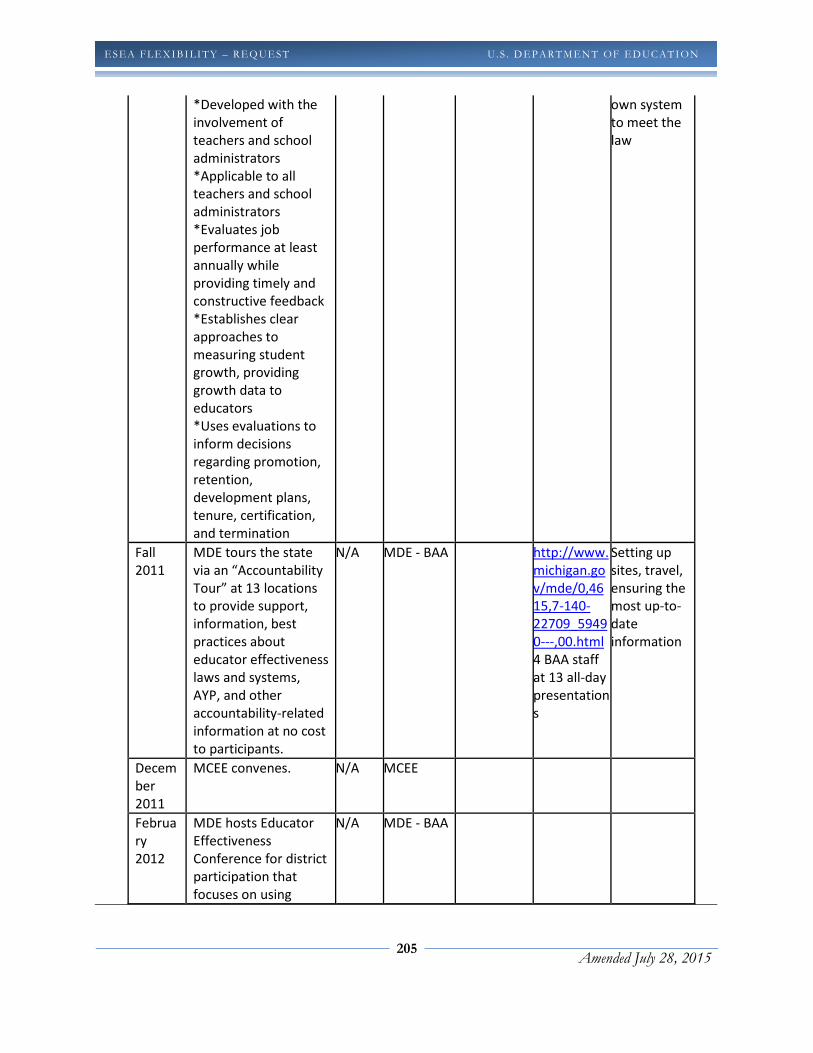
205
Amended July 28, 2015
ESEA FLEXIBI LITY – REQ UEST U . S . D EPARTMEN T OF ED UC ATION
*Developed with the
involvement of
teachers and school
administrators
*Applicable to all
teachers and school
administrators
*Evaluates job
performance at least
annually while
providing timely and
constructive feedback
*Establishes clear
approaches to
measuring student
growth, providing
growth data to
educators
*Uses evaluations to
inform decisions
regarding promotion,
retention,
development plans,
tenure, certification,
and termination
own system
to meet the
law
Fall
2011
MDE tours the state
via an “Accountability
Tour” at 13 locations
to provide support,
information, best
practices about
educator effectiveness
laws and systems,
AYP, and other
accountability-related
information at no cost
to participants.
N/A MDE - BAA http://www.
michigan.go
v/mde/0,46
15,7-140-
22709_5949
0---,00.html
4 BAA staff
at 13 all-day
presentation
s
Setting up
sites, travel,
ensuring the
most up-to-
date
information
Decem
ber
2011
MCEE convenes. N/A MCEE
Februa
ry
2012
MDE hosts Educator
Effectiveness
Conference for district
participation that
focuses on using
N/A MDE - BAA
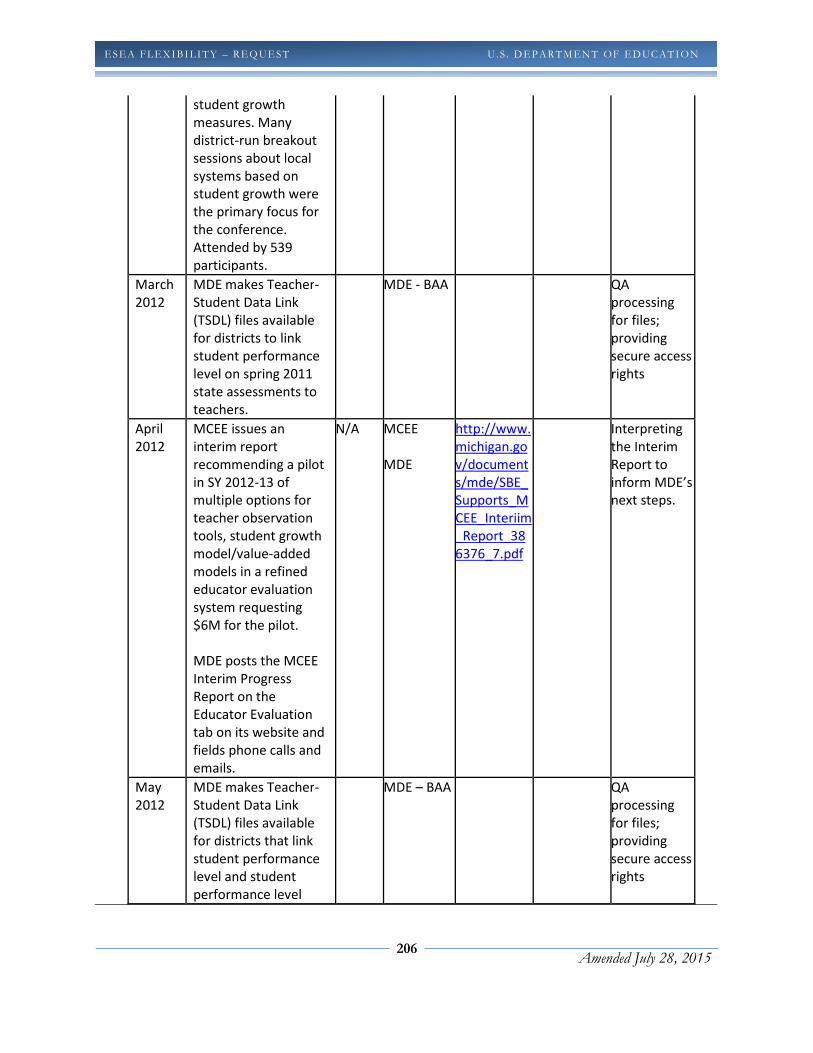
206
Amended July 28, 2015
ESEA FLEXIBI LITY – REQ UEST U . S . D EPARTMEN T OF ED UC ATION
student growth
measures. Many
district-run breakout
sessions about local
systems based on
student growth were
the primary focus for
the conference.
Attended by 539
participants.
March
2012
MDE makes Teacher-
Student Data Link
(TSDL) files available
for districts to link
student performance
level on spring 2011
state assessments to
teachers.
MDE - BAA QA
processing
for files;
providing
secure access
rights
April
2012
MCEE issues an
interim report
recommending a pilot
in SY 2012-13 of
multiple options for
teacher observation
tools, student growth
model/value-added
models in a refined
educator evaluation
system requesting
$6M for the pilot.
MDE posts the MCEE
Interim Progress
Report on the
Educator Evaluation
tab on its website and
fields phone calls and
emails.
N/A MCEE
MDE
http://www.
michigan.go
v/document
s/mde/SBE_
Supports_M
CEE_Interiim
_Report_38
6376_7.pdf
Interpreting
the Interim
Report to
inform MDE’s
next steps.
May
2012
MDE makes Teacher-
Student Data Link
(TSDL) files available
for districts that link
student performance
level and student
performance level
MDE – BAA
QA
processing
for files;
providing
secure access
rights
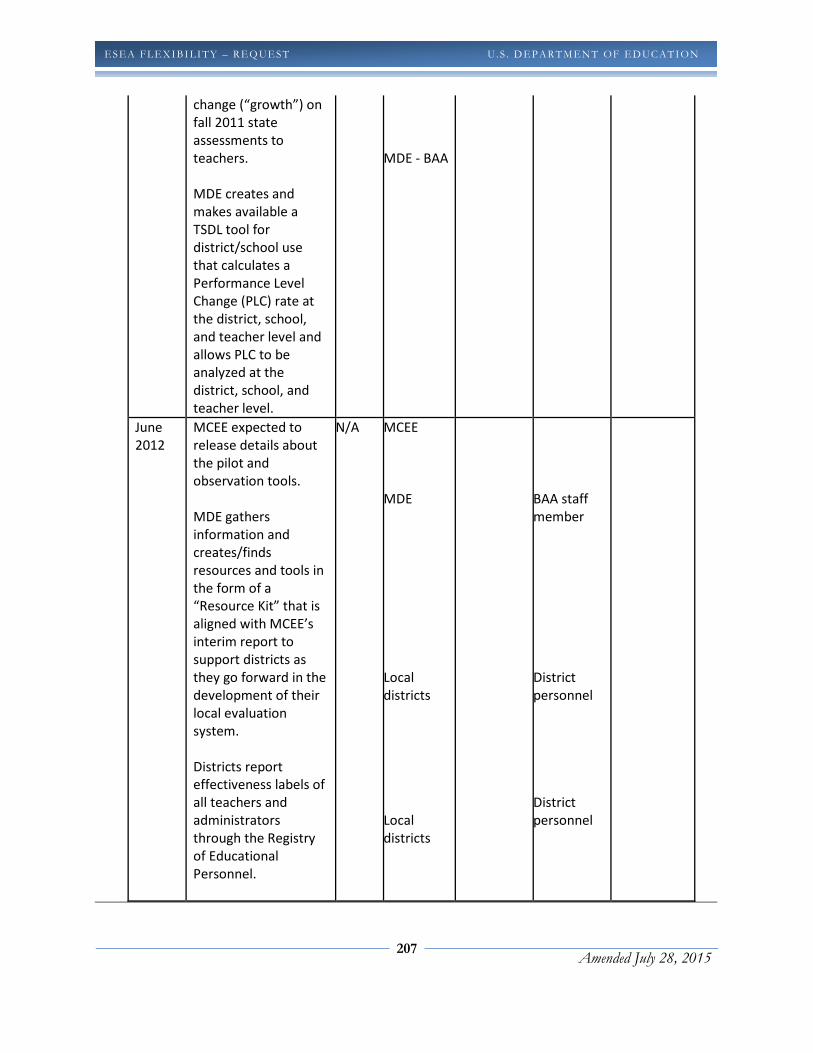
207
Amended July 28, 2015
ESEA FLEXIBI LITY – REQ UEST U . S . D EPARTMEN T OF ED UC ATION
change (“growth”) on
fall 2011 state
assessments to
teachers.
MDE creates and
makes available a
TSDL tool for
district/school use
that calculates a
Performance Level
Change (PLC) rate at
the district, school,
and teacher level and
allows PLC to be
analyzed at the
district, school, and
teacher level.
MDE - BAA
June
2012
MCEE expected to
release details about
the pilot and
observation tools.
MDE gathers
information and
creates/finds
resources and tools in
the form of a
“Resource Kit” that is
aligned with MCEE’s
interim report to
support districts as
they go forward in the
development of their
local evaluation
system.
Districts report
effectiveness labels of
all teachers and
administrators
through the Registry
of Educational
Personnel.
N/A MCEE
MDE
Local
districts
Local
districts
BAA staff
member
District
personnel
District
personnel
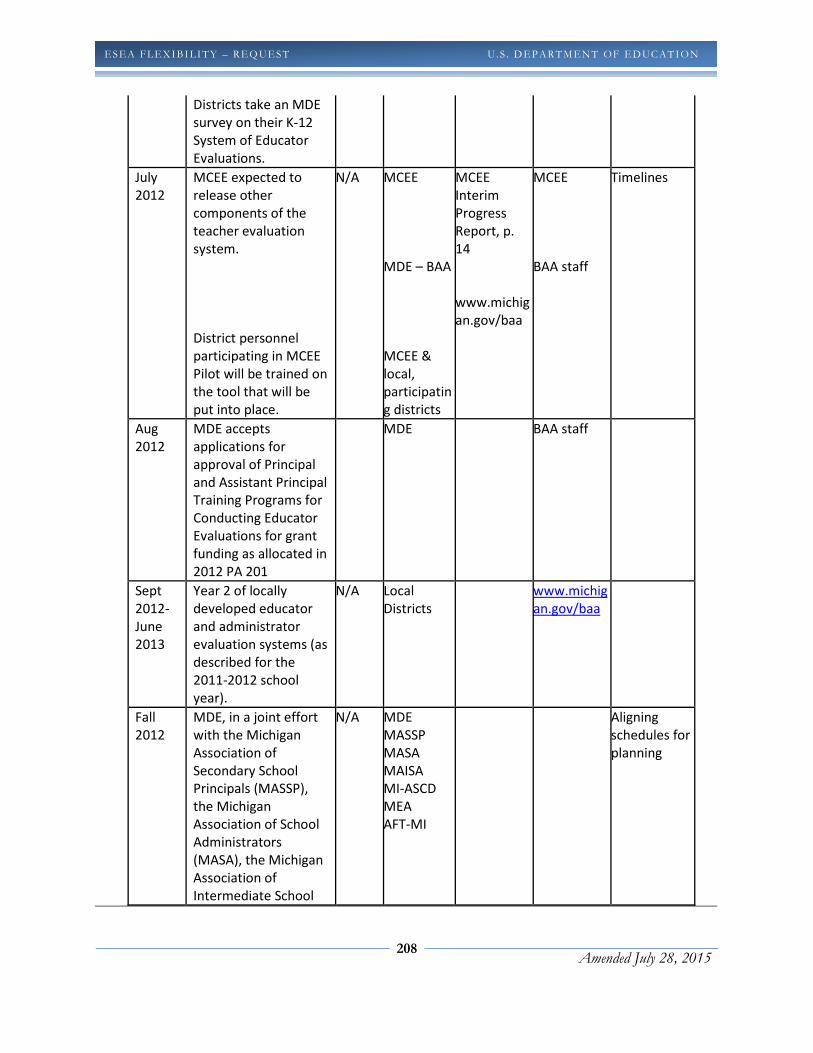
208
Amended July 28, 2015
ESEA FLEXIBI LITY – REQ UEST U . S . D EPARTMEN T OF ED UC ATION
Districts take an MDE
survey on their K-12
System of Educator
Evaluations.
July
2012
MCEE expected to
release other
components of the
teacher evaluation
system.
District personnel
participating in MCEE
Pilot will be trained on
the tool that will be
put into place.
N/A MCEE
MDE – BAA
MCEE &
local,
participatin
g districts
MCEE
Interim
Progress
Report, p.
14
www.michig
an.gov/baa
MCEE
BAA staff
Timelines
Aug
2012
MDE accepts
applications for
approval of Principal
and Assistant Principal
Training Programs for
Conducting Educator
Evaluations for grant
funding as allocated in
2012 PA 201
MDE BAA staff
Sept
2012-
June
2013
Year 2 of locally
developed educator
and administrator
evaluation systems (as
described for the
2011-2012 school
year).
N/A Local
Districts
www.michig
an.gov/baa
Fall
2012
MDE, in a joint effort
with the Michigan
Association of
Secondary School
Principals (MASSP),
the Michigan
Association of School
Administrators
(MASA), the Michigan
Association of
Intermediate School
N/A MDE
MASSP
MASA
MAISA
MI-ASCD
MEA
AFT-MI
Aligning
schedules for
planning

209
Amended July 28, 2015
ESEA FLEXIBI LITY – REQ UEST U . S . D EPARTMEN T OF ED UC ATION
Administrators
(MAISA), the Michigan
Association for
Supervision and
Curriculum
Development (MI-
ASCD), the Michigan
Education Association
(MEA), and the
American Federation
of Teachers-Michigan
(AFT-MI), will host
two-day workshops at
various locations
across the state
regarding best
practices and
processes for
conducting
evaluations across
levels and in
accordance with MI
laws.
Sept
2012-
June
2013*
MCEE implements a
pilot project of
selected evaluation
systems* (including
multiple options for
classroom
observations and for
value-added models)
in Michigan school
districts consistent
with the
recommendations of
MCEE’s Interim
Progress Report.
N/A MCEE
Oct
2012
MCEE expected to
release student
growth model.
N/A MCEE
Oct
2012
MDE analyzes
effectiveness labels
submitted by districts
in June.
N/A MDE – BAA BAA staff Availability of
file from CEPI
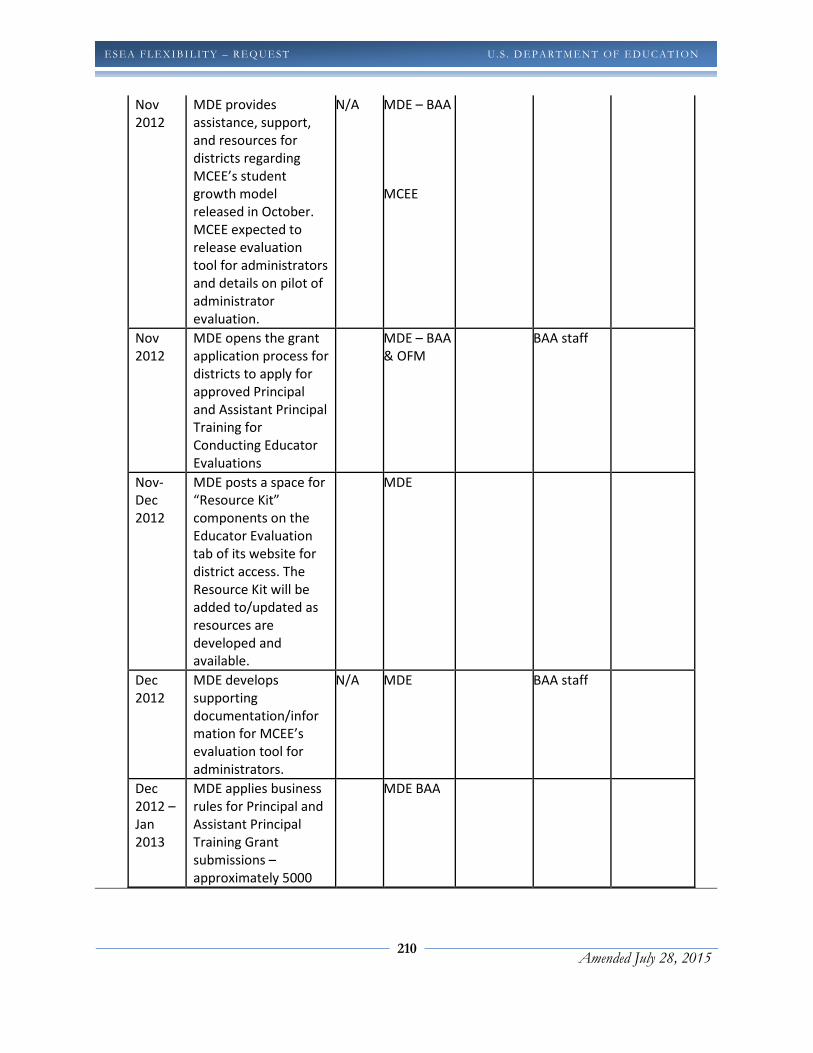
210
Amended July 28, 2015
ESEA FLEXIBI LITY – REQ UEST U . S . D EPARTMEN T OF ED UC ATION
Nov
2012
MDE provides
assistance, support,
and resources for
districts regarding
MCEE’s student
growth model
released in October.
MCEE expected to
release evaluation
tool for administrators
and details on pilot of
administrator
evaluation.
N/A MDE – BAA
MCEE
Nov
2012
MDE opens the grant
application process for
districts to apply for
approved Principal
and Assistant Principal
Training for
Conducting Educator
Evaluations
MDE – BAA
& OFM
BAA staff
Nov-
Dec
2012
MDE posts a space for
“Resource Kit”
components on the
Educator Evaluation
tab of its website for
district access. The
Resource Kit will be
added to/updated as
resources are
developed and
available.
MDE
Dec
2012
MDE develops
supporting
documentation/infor
mation for MCEE’s
evaluation tool for
administrators.
N/A MDE BAA staff
Dec
2012 –
Jan
2013
MDE applies business
rules for Principal and
Assistant Principal
Training Grant
submissions –
approximately 5000
MDE BAA
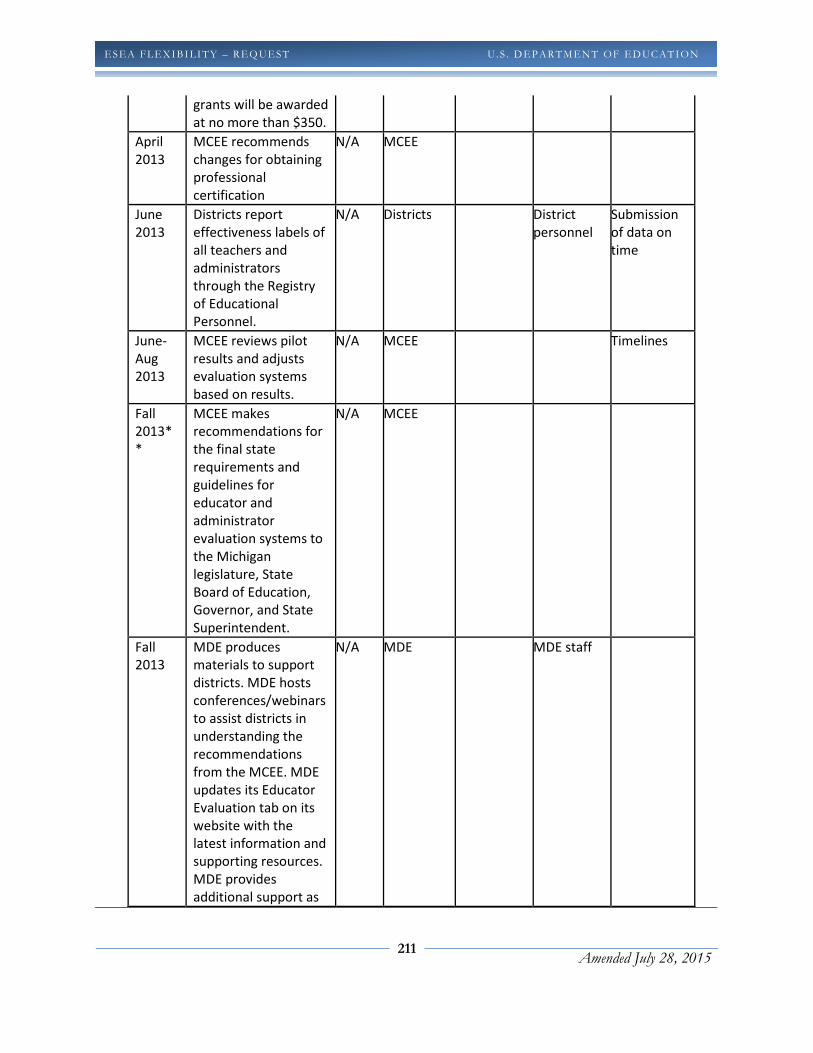
211
Amended July 28, 2015
ESEA FLEXIBI LITY – REQ UEST U . S . D EPARTMEN T OF ED UC ATION
grants will be awarded
at no more than $350.
April
2013
MCEE recommends
changes for obtaining
professional
certification
N/A MCEE
June
2013
Districts report
effectiveness labels of
all teachers and
administrators
through the Registry
of Educational
Personnel.
N/A Districts District
personnel
Submission
of data on
time
June-
Aug
2013
MCEE reviews pilot
results and adjusts
evaluation systems
based on results.
N/A MCEE Timelines
Fall
2013*
*
MCEE makes
recommendations for
the final state
requirements and
guidelines for
educator and
administrator
evaluation systems to
the Michigan
legislature, State
Board of Education,
Governor, and State
Superintendent.
N/A MCEE
Fall
2013
MDE produces
materials to support
districts. MDE hosts
conferences/webinars
to assist districts in
understanding the
recommendations
from the MCEE. MDE
updates its Educator
Evaluation tab on its
website with the
latest information and
supporting resources.
MDE provides
additional support as
N/A MDE MDE staff
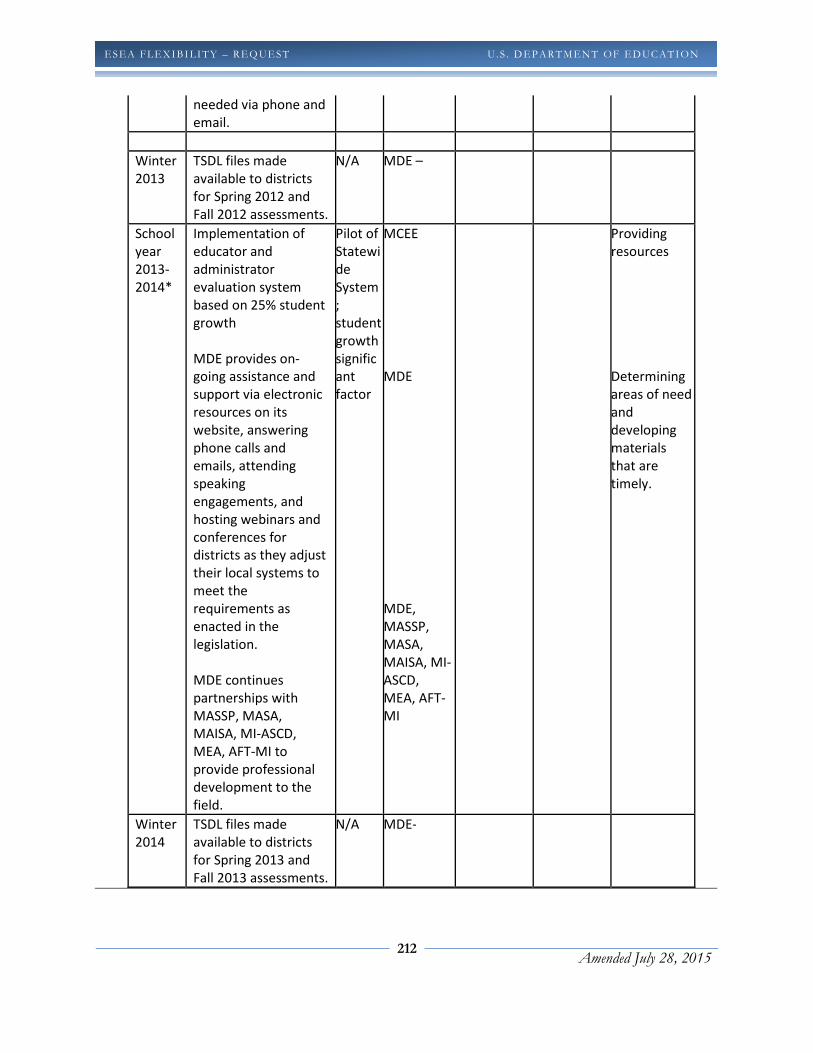
212
Amended July 28, 2015
ESEA FLEXIBI LITY – REQ UEST U . S . D EPARTMEN T OF ED UC ATION
needed via phone and
email.
Winter
2013
TSDL files made
available to districts
for Spring 2012 and
Fall 2012 assessments.
N/A MDE –
School
year
2013-
2014*
Implementation of
educator and
administrator
evaluation system
based on 25% student
growth
MDE provides on-
going assistance and
support via electronic
resources on its
website, answering
phone calls and
emails, attending
speaking
engagements, and
hosting webinars and
conferences for
districts as they adjust
their local systems to
meet the
requirements as
enacted in the
legislation.
MDE continues
partnerships with
MASSP, MASA,
MAISA, MI-ASCD,
MEA, AFT-MI to
provide professional
development to the
field.
Pilot of
Statewi
de
System
;
student
growth
signific
ant
factor
MCEE
MDE
MDE,
MASSP,
MASA,
MAISA, MI-
ASCD,
MEA, AFT-
MI
Providing
resources
Determining
areas of need
and
developing
materials
that are
timely.
Winter
2014
TSDL files made
available to districts
for Spring 2013 and
Fall 2013 assessments.
N/A MDE-

213
Amended July 28, 2015
ESEA FLEXIBI LITY – REQ UEST U . S . D EPARTMEN T OF ED UC ATION
June
2014
Districts report
effectiveness labels of
all teachers and
administrators
through the Registry
of Educational
Personnel.
N/A District District
personnel
August
2014
N/A MDE MDE staff
School
Year
2014-
15
Implementation of
educator and
administrator
evaluation system
based on 40% student
growth.
MDE provides on-
going assistance and
support via electronic
resources on its
website, answering
phone calls and
emails, attending
speaking
engagements, and
hosting webinars and
conferences for.
MDE continues
partnerships with
MASSP, MASA,
MAISA, MI-ASCD,
MEA, AFT-MI to
provide professional
development to the
field.
Michigan Student Test
of Educational
Progress (M-STEP)
goes into place;
Implem
entatio
n of
Statewi
de
System
;
student
growth
signific
ant
factor
Local
Districts
MDE
MDE,
MASSP,
MASA,
MAISA, MI-
ASCD,
MEA, AFT-
MI
MDE -
June
2015
Districts report
effectiveness labels of
all teachers and
administrators
N/A Districts District
personnel

214
Amended July 28, 2015
ESEA FLEXIBI LITY – REQ UEST U . S . D EPARTMEN T OF ED UC ATION
through the Registry
of Educational
Personnel.
August
2015
MDE analyzes results
of effectiveness labels
reported.
N/A MDE - BAA
School
Year
2015-
16
Implementation of
final, statewide
educator and
administrator
evaluation system
based on 50% student
growth.
MDE provides on-
going assistance and
support via electronic
resources on its
website, answering
phone calls and
emails, attending
speaking
engagements, and
hosting webinars and
conferences for
districts.
MDE continues
partnerships with
MASSP, MASA,
MAISA, MI-ASCD,
MEA, AFT-MI to
provide professional
development to the
field.
Implem
entatio
n of
Statewi
de
System
;
student
growth
signific
ant
facto
Local
Districts
MDE
MDE,
MASSP,
MASA,
MAISA, MI-
ASCD,
MEA, AFT-
MI
District
personnel
MDE staff
June
2016
Districts report
effectiveness labels of
all teachers and
administrators
through the Registry
of Educational
Personnel.
N/A Local
Districts
District
personnel
August
2016
MDE analyzes results
of effectiveness labels
reported.
N/A MDE MDE staff

215
Amended July 28, 2015
ESEA FLEXIBI LITY – REQ UEST U . S . D EPARTMEN T OF ED UC ATION
*Michigan’s Pilot and statewide implementation are both one year ahead of USED Requirements.
**MDE projected timeline, but is dependent upon actions of MCEE and the Michigan legislature.
Gathering Input from Stakeholders
While the Michigan Council for Educator Effectiveness does not include teachers (although it does
include principals), there is an Advisory Committee to the MCEE as established by PA 102 of 2011.
The Advisory Council to the MCEE is comprised of Governor-appointed teachers, district leaders, and
members of education associations.
This committee has responded to questions submitted by the council, and has provided input on the
observation and student growth components of the council’s charge. Below is a list of members.
Table 20. List of MCEE Advisory Committee Members
Name Position Organization Representing
Dan L. DeGrow,
Chair Superintendent St. Clair County RESA
public school
administrators
Amber M. Arellano Executive Director The Education Trust-
Midwest
education advocacy
group
Ernst A. Bauer
Research, Evaluation
and Assessment
Consultant
Oakland Schools public school
administrators
William C.
Chilman, IV Superintendent Beal City Public Schools
parents of public school
pupils
Barbara F. Mays Vice-Chair Barton Elementary School
Parent Organization
parents of public school
pupils
Mary A. Kovari Principal Detroit Institute of
Technology High School
public school
administrators
Kirstin G. Queen HR Manager Ford Motor Credit
Company
parents of public school
pupils
John F. Haan Elementary Teacher Charlevoix Public Schools public school teachers
Tonya Allen
Chief Operating
Officer
and Vice President
Program for The Skillman
Foundation
parents of public school
pupils
Ingrid J. Guerra-
Lopez Director
Wayne State University
Institute for Learning and
Performance Improvement
public school teachers
Krista L.
Hunsanger Teacher Grand Ledge Public Schools public school teachers
Colin Ripmaster Principal Mattawan High School public school
administrators
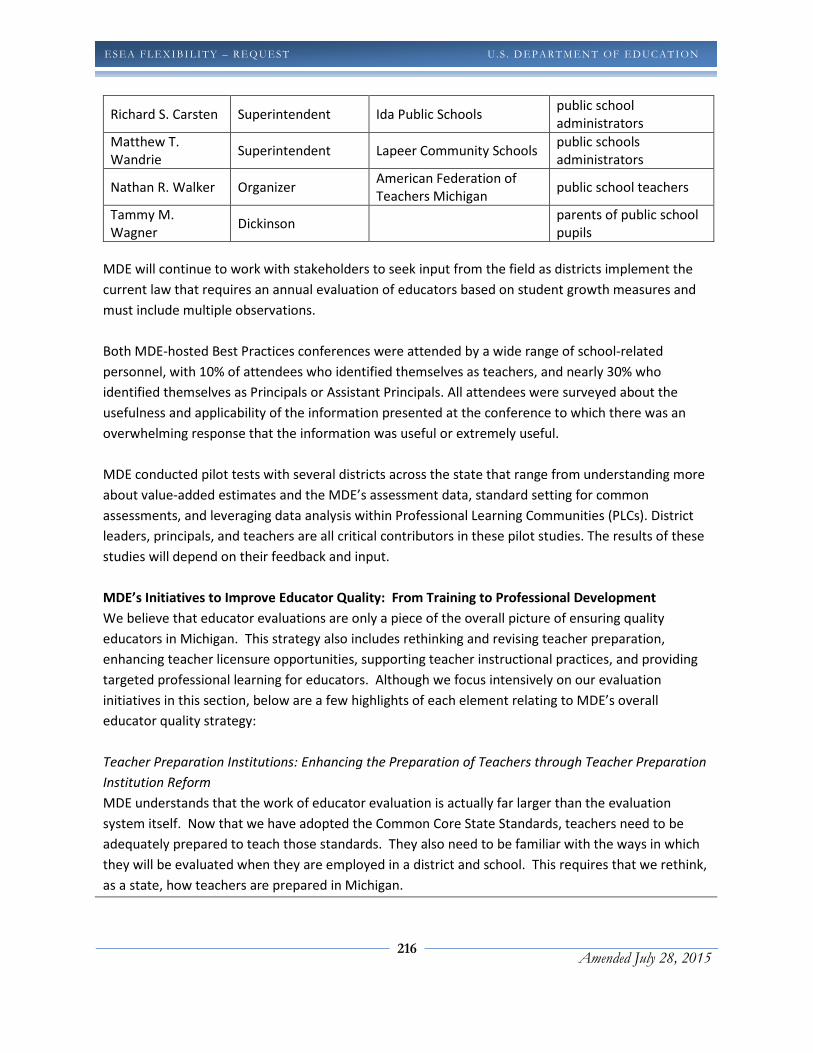
216
Amended July 28, 2015
ESEA FLEXIBI LITY – REQ UEST U . S . D EPARTMEN T OF ED UC ATION
Richard S. Carsten Superintendent Ida Public Schools public school
administrators
Matthew T.
Wandrie Superintendent Lapeer Community Schools
public schools
administrators
Nathan R. Walker Organizer American Federation of
Teachers Michigan public school teachers
Tammy M.
Wagner Dickinson
parents of public school
pupils
MDE will continue to work with stakeholders to seek input from the field as districts implement the
current law that requires an annual evaluation of educators based on student growth measures and
must include multiple observations.
Both MDE-hosted Best Practices conferences were attended by a wide range of school-related
personnel, with 10% of attendees who identified themselves as teachers, and nearly 30% who
identified themselves as Principals or Assistant Principals. All attendees were surveyed about the
usefulness and applicability of the information presented at the conference to which there was an
overwhelming response that the information was useful or extremely useful.
MDE conducted pilot tests with several districts across the state that range from understanding more
about value-added estimates and the MDE’s assessment data, standard setting for common
assessments, and leveraging data analysis within Professional Learning Communities (PLCs). District
leaders, principals, and teachers are all critical contributors in these pilot studies. The results of these
studies will depend on their feedback and input.
MDE’s Initiatives to Improve Educator Quality: From Training to Professional Development
We believe that educator evaluations are only a piece of the overall picture of ensuring quality
educators in Michigan. This strategy also includes rethinking and revising teacher preparation,
enhancing teacher licensure opportunities, supporting teacher instructional practices, and providing
targeted professional learning for educators. Although we focus intensively on our evaluation
initiatives in this section, below are a few highlights of each element relating to MDE’s overall
educator quality strategy:
Teacher Preparation Institutions: Enhancing the Preparation of Teachers through Teacher Preparation
Institution Reform
MDE understands that the work of educator evaluation is actually far larger than the evaluation
system itself. Now that we have adopted the Common Core State Standards, teachers need to be
adequately prepared to teach those standards. They also need to be familiar with the ways in which
they will be evaluated when they are employed in a district and school. This requires that we rethink,
as a state, how teachers are prepared in Michigan.
217
Amended July 28, 2015
ESEA FLEXIBI LITY – REQ UEST U . S . D EPARTMEN T OF ED UC ATION
MDE is currently involved in utilizing the linked data between the teachers and their teacher
preparation institutions to understand how many graduates from each institution are employed, if
they are employed in high-need schools, and more importantly, if they are effective in their roles. We
are also planning to redesign our teacher preparation institution rubric in order to hold the
institutions more accountable for the outcomes of their students. Finally, we will be changing our
certification tests, both to increase the rigor of their cut scores to be reflective of the increased rigor
required of students with new student cut scores, and to assess potential teachers more directly on
their ability to understand and teach content. We are identifying ways for student teachers to be
evaluated by the evaluation system of the district in which they are working, to provide an
assessment of pedagogy as an exit criterion for the student teacher and also to familiarize them with
the process of being evaluated using student growth.
Changes to Teacher and Administrator Certification and Licensure
MDE has undertaken two initiatives related to teacher and administrator certification. The first is that
MDE now requires certification of all administrators, to ensure all administrators have appropriate
preparation and training. MDE has also established alternate routes to administrator certification.
Second, MDE has revised its teacher licensure rules, in order to create a three-tiered licensure
system. This system is in the final stages of rule-making and will go into effect when this process is
completed. The three-tiered licensure system allows teachers to advance from the provisional to the
professional license, and then have the option to continue on to an advanced professional license
based on the demonstrated effectiveness. MDE did this in order to help incentivize high-quality
teachers to stay in the classroom while at the same time creating professional pathways for
advancement.
Supporting Instruction
MDE’s efforts to support effective instruction have been described at length in Principle 1 and 2; here
we briefly highlight a few key initiatives.
MDE has hosted two Best Practices conferences, both of which have featured sessions on evaluating
teachers of students with disabilities and English Language Learners. We make available resources on
our website for districts to choose from. We are also seeking a partner district or districts who are
engaged in this work to participate in a pilot study with MDE to identify local assessment tools that
provide meaningful measures of growth for students with disabilities and ELLs so that we can make
that information available to all of our districts.
We also note the resources available through the Michigan Online Professional Learning System
218
Amended July 28, 2015
ESEA FLEXIBI LITY – REQ UEST U . S . D EPARTMEN T OF ED UC ATION
(MOPLS). MOPLS is a series of interactive learning programs designed to guide educators in
recommending assessments for students and using assessment results to assist students who are
struggling with concepts in mathematics and English language arts. MOPLS learning modules are
funded under a federal grant for the development of MDE’s MI-Access assessment.
MDE also maintains standards for principals and administrators. These school employees also are
subject to educator evaluation requirements and will be included in the framework designed by the
Michigan Council on Educator Effectiveness.
For more information about resources available to support teachers and instructional leaders, please
refer to Section 1B.
Professional Learning Opportunities and Ongoing Education
In the last two years, MDE convened a stakeholder group to develop new recommendations
regarding professional learning. This group produced a new policy on professional learning, which the
Michigan State Board of Education adopted in January 2012. This policy is based on the Learning
Forward Standards for Professional Learning, and the intent is to help districts, schools, and educators
appropriately identify professional learning opportunities to support their work. We anticipate the
field can leverage these standards when integrating professional learning into their evaluation
systems, and we intend to produce interim guidelines to assist them with these efforts.
3.B ENSURE LEAS IMPLEMENT TEACHER AND PRINCIPAL EVALUATION AND SUPPORT SYSTEMS
3.B Provide the SEA’s process for ensuring that each LEA develops, adopts, pilots, and implements,
with the involvement of teachers and principals, including mechanisms to review, revise, and
improve, high-quality teacher and principal evaluation and support systems consistent with the
SEA’s adopted guidelines.
This section is organized as follows:
• Adoption of guidelines
• Michigan’s Pilot
• MDE Resource Kit and Other Supports
• Compliance
ADOPTION OF GUIDELINES
Michigan’s strong educator evaluation legislation provides a legislative mandate by which the majority
of this work will be accomplished. State law [PA 257 (2014)], requires each LEA to adopt the state
evaluation system, or to have a high-quality system in place that meets all requirements by 2015-2016.

219
Amended July 28, 2015
ESEA FLEXIBI LITY – REQ UEST U . S . D EPARTMEN T OF ED UC ATION
This provides the legislative “muscle” necessary to begin the process of ensuring that these systems are
implemented. It will include components to support a variety of aspects of educator evaluations
including observations, student growth measures, data collection, and evaluation of the system itself,
and training evaluators for observations.
MDE recognizes that legislation is only the beginning step in ensuring successful implementation of
these evaluations, and that additional efforts are need both to provide supports for implementation and
to ensure compliance from our districts.
MICHIGAN’S PILOT: Establishing an official pilot year
The MCEE has, since the original submission of Michigan’s ESEA Flexibility request, recommended a pilot
year. From the MCEE Interim Guidelines, the pilot year recommendation is outlined below. Additionally,
the Michigan Legislature has approved the request of MCEE to conduct an official pilot study of
evaluation tools and systems during the 2012-2013 school year that will provide the basis for MCEE’s
final recommendation.
In MDE's educator evaluation pilot, student growth is included in several ways. Growth based on the
state assessment will be included, but MDE also plans to pilot growth measures from additional types of
assessments, such as off-the-shelf assessments to allow for multiple measures of student growth to be
incorporated into educator evaluations. Growth data from these assessments will then be integrated
into final effectiveness labels at the prescribed rates to evaluate how those measures function in the
overall designation. Students will, of course, take the state assessments on the regular schedule but will
also take the following: (1) a computer adaptive assessment in English Language Arts and mathematics
in grades K-6 three times during the school year, and (2) the EXPLORE/PLAN/ACT series as a pre/post
measure in grades 7-12. In this way, all students will take both the state test and a pre/post assessment
using an off the shelf test. Value added models based on both the state tests and the off-the-shelf tests
will be calculated for incorporation into educator evaluations.
**Text excerpted from the MCEE Interim Progress Report, released April 27, 2012, is shaded in light
yellow.**
Next Steps: 2012- 2013 Pilot
After investigating educator evaluation reforms across the country, the MCEE has concluded that a pilot
test is not only important, but imperative. Such a pilot test will allow a set of recommended tools and
approaches to be tried out in a small number of districts and schools for a year in order to learn about
how well they work and to uncover any problems that should be remedied before implementing a
system wholesale in all Michigan schools. While postponing the implementation of the “final” system
might seem wasteful, not doing so would be reckless, both fiscally and technically.
220
Amended July 28, 2015
ESEA FLEXIBI LITY – REQ UEST U . S . D EPARTMEN T OF ED UC ATION
A pilot year will provide data on implementation and validity, and crucial feedback from education
professionals using the tools and approaches. During a pilot, technical and logistical challenges could be
confronted and resolved, and the resources necessary to put a statewide system into place could be
developed (including a communication system, materials for teachers and administrators, and a
database for storing information), increasing the likelihood of our state succeeding in this complex but
vitally important undertaking. Building a rigorous evaluation system that holds all Michigan educators
accountable for student learning depends on understanding how well it works in practice and designing
it to be fair, reliable, and defensible. New Jersey, Rhode Island, Washington, and Colorado have all used
pilots or phase-in years to learn more about their proposed state evaluation systems, and each state has
been able to adjust these systems based on the feedback and ideas generated from pilot-participating
districts and schools. We want nothing less for our state’s educators and the 1.5 million children they
teach each year.
General Design
The council recommends a pilot study of evaluation tools in 12 school districts to be carried out during
the 2012-13 school year. The pilot study is crucial because it will allow the state to learn about educator
evaluation as it takes place in school settings and to accommodate practical and technical issues that
arise in the pilot test. It will also take advantage of the fact that many school districts have already
begun the hard work of institutionalizing rigorous, regular observation systems in their teacher
evaluations. Districts in Michigan will be invited to apply to be part of the pilot study, and the 12
districts will be selected to represent the range of districts and schools in the state—in terms of context,
geography, governance, size, and resources. The pilot will precede the implementation of educator
evaluation in Michigan, and will be used to develop the final recommendations of the Michigan Council
for Educator Effectiveness. Below are specifications as currently known for the pilot study of evaluation
tools.
Teacher Observation Tools
The council recommends studying three teacher observation tools in the pilot study, specifically looking
at each tool implemented in four different districts of different sizes—one large, one medium, and two
smaller districts—for a total of twelve participating districts. The tools, which the MCEE will select in the
coming few weeks, will be the most promising (in terms of evidence and feasibility) and most likely to fit
Michigan’s needs.
Before the pilot begins in the fall of 2012, educators in pilot districts will be trained in the use of the tool
identified for study in their district. Districts will not be asked to cover the costs of training,
implementation, or data analysis for the pilot. The MCEE will specify exact details about the
implementation of the pilot and will oversee the project to ensure a well-designed study that maximizes
its contributions to the progress of designing a strong educator evaluation system. Lessons learned
221
Amended July 28, 2015
ESEA FLEXIBI LITY – REQ UEST U . S . D EPARTMEN T OF ED UC ATION
during the pilot study will also lead to the development of responsible criteria for granting waivers, as it
will be important to the credibility of the state’s educator evaluation system to have rigorous standards
for granting exceptions to the final recommendations from the council.
Student Growth Model/Value-Added Model Pilot
In addition to the studies of the observation tools, the council recommends a pilot of several alternative
student growth models and value-added models in the 12 pilot districts. The MCEE plans to conduct a
pilot using existing assessments such as MEAP in grades 3 through 8, new assessments in high school
(possibly EXPLORE, PLAN, and ACT), computer adaptive assessments in grades where tests are available,
and local assessments in non-tested grades and subjects. Such a set of pilot studies will help prepare for
new assessments that are being developed now and will provide crucial information about the different
types of growth models and value added models that could be implemented in Michigan.
Piloting a student growth model will allow educators to examine both the student growth data and
teacher and administrator observation data to understand better how evaluation will work when it is
implemented in Michigan. The pilot study will likely highlight strengths and weaknesses in the tools and
in the data they yield. This will help in the continued design of MDE’s educator evaluation system.
Administrator Evaluation Pilot
Although this report focuses on teacher evaluation tools, the MCEE has already begun gathering
comparable information about administrator tools. It is also likely that the challenges associated with
teacher observations are similar for administrators, and thus work on recommending administrator
tools will be informed and accelerated by the council’s deliberations about teacher observation and
evaluation tools. The council will be recommending one or two tools for evaluating administrators in
October 2012 and will incorporate them into the pilot study. As with the teacher observation pilot,
districts will not be asked to cover the costs of training, implementation, or data analysis for the pilot.
The MCEE will provide more information about this aspect of the pilot in upcoming months.
Process for Implementing Pilot and Analyzing Results
The MCEE recommends that four full-time staff be dedicated to the pilot study: an Education Consultant
Manager, two Education Research Consultants, and a Secretary. The team will be located in the MDE,
but will be accountable to the MCEE during the pilot study. It will distribute applications to districts, and
will then select districts for inclusion from the applications received. The staff will aim to select a diverse
group of districts to participate and will consider geography, urbanicity, socioeconomic status, size,
governance, and other characteristics of districts in the state. Districts will be assigned to an observation
tool by the team so each tool is implemented in varied settings.
222
Amended July 28, 2015
ESEA FLEXIBI LITY – REQ UEST U . S . D EPARTMEN T OF ED UC ATION
District faculty and administrators will receive training from experts provided by observation tool
vendors. Throughout the pilot study, members from MDE’s evaluation staff will offer support and
guidance in using the tools.
The council recommends that an outside research organization be employed under the oversight of the
MDE to analyze the data from the pilot study. The organizations providing observation tools also provide
data collection protocols. The outside research group will be given the collected data from the
observation tools for evaluation. At the same time, administrators in pilot districts will use the
observation data to complete that portion of the teacher evaluation.
The research group will also conduct focus group or other interviews to understand better how well
school personnel understood the tools and how to use them, whether the tools were feasible for use in
a school setting, how systematically and rigorously the tools and processes were implemented, and how
reliable and valid the data from the tools appeared to be.
In addition, the outside research group would match data from the pilot of the student growth tool(s)
and the administrator evaluation tool(s) with the teacher observation data. This task will highlight how
well the tools work in concert, and whether there are any reliability and validity concerns that should be
addressed.
All data analysis from the pilot study will be provided to the MCEE, which may use it to inform its final
recommendations.
Budget
The council has consulted with several states about their design and implementation of teacher
evaluation, including their pilot studies. Based on what we have learned from these states, we
recommend that the state include $6,054,418 in the FY 2013 budget to cover the cost of the pilot in the
2012-13 school year. That amount includes the cost of training, implementation, data analysis, staff
support, and reporting, as well as other expenses that the state and districts involved in the pilot will
incur.
**End excerpt from Interim Progress Report of the MCEE**
MDE RESOURCE KIT & SUPPORTS FOR IMPLEMENTING EDUCATOR EVALUATIONS
MDE is currently engaged in a number of efforts to support districts as they implement their local
evaluation systems. These include:
• Educating the field on the requirements of the legislation currently (2011-2012 and 2012-
2013) and in the future with the statewide system. MDE has conducted nearly 30

223
Amended July 28, 2015
ESEA FLEXIBI LITY – REQ UEST U . S . D EPARTMEN T OF ED UC ATION
presentations statewide, including webinars and other virtual resources, aimed at educating
the field in the requirements of the law, and providing them with access to best practice.
We developed a web resource to support districts.
• Educating the field on the elements that will be required in the final system so that they can
align their local systems with the upcoming statewide requirements whenever possible.
• In conjunction with the Center for Educational Performance and Information (CEPI), MDE
now has information on teachers linked to the students they taught in the 2010-2011 school
year. This enables us to provide this linked teacher/student data and all available student
assessment data back to districts for potential inclusion in their local systems. MDE will
release both the high school assessment results (the Michigan Merit Examination, and the
MI-Access assessment) as well as the elementary/middle school assessment (MEAP, MEAP-
Access, and MI-Access) to districts by early March 2012.
The only state-provided assessments that provide actual student growth are the
elementary/middle school MEAP and MI-Access, in grades 3-7, reading and mathematics, as
this is where adjacent grade testing is currently available (see Principle 1 for a further
discussion of MDE’s plans to adopt additional measures of student growth in the next
several years). To support the use of this growth data, MDE developed an easy-to-use tool
that allows district to summarize the number of students who are demonstrating growth.
• In February 2012, MDE hosted our second annual statewide Educator Evaluation Best
Practices conference, with a specific focus on integrating student growth into educator
evaluations. Educators from around the state who have more mature systems in place for
educator evaluations shared topics regarding how they are using student growth measures,
how they are using local assessments for student growth, ways to automate the data
collection necessary for a good system, and how they’ve developed, piloted and refined
observation rubrics. MDE experts in research, evaluation, and measurement also offered
findings and recommendations regarding the use of state assessment data in educator
evaluations, and what to keep in mind in terms of establishing the validity and reliability of
tools and measures.
• MDE has begun a partnership with one of our larger regional education agencies to assist
them in conducting standard setting on their common assessments, in order to utilize those
assessments for determining growth at the local level. We plan to publish both the
procedure and the findings from this exercise, so that other districts can engage in similar
efforts to set standards on their own common assessments. This helps increase the rigor of
the local assessments being used to measure growth, and allows MDE to provide some of
the measurement expertise that we have at the department to the field, via a pilot example.

224
Amended July 28, 2015
ESEA FLEXIBI LITY – REQ UEST U . S . D EPARTMEN T OF ED UC ATION
• MDE is engaged in a pilot study with another large urban district to use their historical
teacher/student data link (as the statewide link contains only one year of data, and at least
three are required for value-added modeling) to estimate a variety of value-added models
using the state assessment data (the MEAP), and to provide some guidelines to the field
about specifying and using these value-added models. Very little is known at this time
about the accuracy of these models to classify teachers into the appropriate effectiveness
categories, particularly when using the state assessment data. We plan to make this
information available to the field, but also to the Michigan Council to help inform their
decisions regarding a new student growth and assessment tool to be used in the statewide
evaluation system. Having good information and evidence will greatly enhance our ability as
a state to develop a high-quality statewide system. MDE believes that leveraging these
smaller pilots is an efficient way to help generate some of that information.
• MDE will produce guidelines for selecting “off-the-shelf” assessments, including elements of
a high-quality assessment and how a district or regional service agency can evaluate the
assessment’s ability to measure student growth to assist districts during the locally-
developed educator evaluation years.
• MDE will produce guidelines for the use of locally-developed interim benchmark and
formative assessments, again to assist districts until the statewide evaluation tool is
developed and implemented.
• In conjunction with producing resources of support, MDE will gather information, resources,
and details about MCEE’s selected observation protocols for districts to better understand
how to use that protocol. This will be a “best practices” tool that districts can utilize or can
reference in their own work in the interim years until the Council recommendations can be
implemented.
• One of our larger districts is planning to make use of student, parent and teacher surveys, as
done in the Measures of Effective Teaching (MET) project. We plan to partner with them to
evaluate the consistency of ratings generated from value-added measurements,
observations, and the survey data, and make that information available to districts, as well
as to the Council to inform their decision-making process.
• A key concern of many districts is how to document and defend their system, once they
have developed it. MDE has a great deal of experience in establishing business rules and
building comprehensive accountability systems in which all decisions are documented and
applied, and we plan to produce a “best practices” toolkit regarding the steps necessary to
document and defend each decision in the evaluation system, as well as suggestions for how
to collect, store, and utilize the data collected. MDE has begun conversations with the
Michigan Association of School Administrators (MASA), the Michigan Association of

225
Amended July 28, 2015
ESEA FLEXIBI LITY – REQ UEST U . S . D EPARTMEN T OF ED UC ATION
Secondary School Principals (MASSP), the Michigan Association of Intermediate School
Administrators (MI-AISD), the Michigan Education Association (MEA), and the American
Federation of Teachers-Michigan (AFT_MI) to provide districts with a framework for
providing training for evaluators in the form of a jointly-developed two-day series of
workshops. Evaluators (principals and others) need to be trained in how to do an
evaluation, regardless of which evaluation system they are using. We will also produce
guidelines for districts to utilize as they develop their local training programs for their local
evaluation systems. Again, this information will be made available to MCEEto assist them
with their development and recommendation efforts. MDE has identified a large
intermediate school district that is currently engaged in developing extensive training for
principals and other evaluators, and plans to partner with this ISD in order to leverage their
thinking and expand our supports based on this initial work.
• We are also assisting the Persistently Lowest Achieving (which will now be priority schools
as well) with the implementation of their educator evaluation systems through the
intervention of the State School Reform Office (SSRO), and the hands-on assistance provided
to those schools who fall under the purview of the Statewide System of Support. The
Intervention Teams, district-level facilitators, and other leaders engaged in the process of
turning around low-performing schools will ensure that teacher evaluation and support is
carefully woven into their diagnostic treatment of performance issues.
MDE RESOURCE KIT AND OTHER SUPPORTS
**All Resource Kit plans are inserted into the MCEE Interim Progress Report text and are denoted in
italics and with a RK���� symbol**
**Text from the Interim Progress Report of the Michigan Council for Educator Effectiveness has
background shading of light yellow.**
Released April 27, 2012
The following common vision grounds the efforts of the MCEE:
The Michigan Council for Educator Effectiveness will develop a fair, transparent, and feasible evaluation
system for teachers and school administrators. The system will be based on rigorous standards of
professional practice and of measurement. The goal of this system is to contribute to enhanced
instruction, improve student achievement, and support ongoing professional learning.
Design Principles for an Educator Evaluation System
226
Amended July 28, 2015
ESEA FLEXIBI LITY – REQ UEST U . S . D EPARTMEN T OF ED UC ATION
It is essential that MDE have a clear set of design principles for the development of its educator
evaluation system:
• Expectations should be clear and rigorous.
• The system should involve multiple measures.
• The system should enhance performance.
• The system should be committed to and structured to support ongoing educator learning and
development.
Criteria for Selecting Observation Processes and Tools
With these design principles in mind, the MCEE recommends five criteria for the selection and review of
observation instruments and related materials to be used by Michigan school districts:
• The instruments should be aligned with relevant state and national standards for educators.
In Michigan, there are three relevant frameworks that need to be aligned with the educator
evaluation system: the Teaching for Learning Framework (Appendix I), the School Improvement
Program framework (Appendix J), and the Professional Standards for Michigan Teachers (see
Appendix K). In addition, as new policies and reforms are embraced by the state, (e.g., the
Common Core State Standards), educator evaluation systems must be aligned to support
teachers who are adjusting curriculum and instruction to these new mandates. There are also
myriad standards for teaching issued by professional organizations (e.g., the National Council for
Teachers of Mathematics, the National Council for Social Studies, etc.) that are relevant.
RK� Copies of each of the Frameworks listed above
RK�A checklist/thought process for evaluating alignment of a given observation
instruments to each of the three frameworks listed
RK�Resources to evaluate alignment of educator evaluation system to the Common
Core State Standards (drawn from other states)
RK�Copies of other standards for teaching
• The instruments should be used both for describing practice and supporting ongoing educator
learning/development.
Although one goal of the educator evaluation system is to identify weak or underperforming
teachers, the power of the system will lie in its potential to improve continually the capacity of
Michigan’s educator workforce. Thus the system should be designed to support teacher and
principal learning over time.

227
Amended July 28, 2015
ESEA FLEXIBI LITY – REQ UEST U . S . D EPARTMEN T OF ED UC ATION
RK�examples of professional learning opportunities and strategies, tied both to content
and to practice
RK�Checklist/thought process for evaluating a district’s current system to determine
the extent to which it is supporting teacher and principal learning over time
RK�Survey tool that districts can choose to use with teachers and principals to
determine self-identified professional development needs
• The instruments should be accompanied by a rigorous and ongoing training program for
evaluators.
The documentation of teaching is only as good as the observer. Observers need to be trained to
observe carefully, attend rigorously to the key elements of instruction, to be thorough and
accurate in their note taking and assessments, and responsible in the conclusions they draw
from their observations. This takes training, and every commercially available observation
protocol includes substantial training. Several require annual retraining as well.
RK� Standardized process for training evaluators (key activities and steps, checklists,
items for consideration)
RK� Descriptions of Principal and Assistant Principal Training Programs keyed to
specific observation instruments (externally developed; MDE will simply link)for which
districts can choose to attend and apply for grant funding.
• Independent research on the reliability and the validity of the instruments should be available.
Although locally developed measures or adaptations of widely used measures might be
appealing to many educators, an educator evaluation system involves high-stakes decisions
about employment and credentialing. Over time, therefore, it is essential that any locally
developed observation instrument be rigorously examined for its reliability and validity. It is also
essential to monitor fidelity of districts’ use of any common state-wide protocol. Although any
tool recommended as the common tool for the state will already be supported by evidence of
validity, it will nevertheless depend on proper local implementation to be reliable and fair.
RK� Sample process that can be followed to establish the reliability of an instrument
RK� Sample process that can be followed to establish (or investigate) the validity of an
instrument
RK� Tools to support districts in leveraging their data to establish reliability and validity
of instruments. For example—standardized Excel spreadsheets into which data can be
entered to assist districts in conventional reliability calculations.
228
Amended July 28, 2015
ESEA FLEXIBI LITY – REQ UEST U . S . D EPARTMEN T OF ED UC ATION
RK� Information on the methodological steps and challenges in addressing reliability
and validity; raise the collective data literacy of the profession in order to consider these
types of questions more thoroughly
RK� Standardized process for conducting standard setting on common assessments
• The demands of the process should be feasible (in terms of personnel, time, and financial cost).
Institutionalizing educator evaluation for every teacher in every school multiple times across the
year will require major changes in the work of the principal. Rigorous observation systems
require pre- and post-conferences with teachers, extended and brief observations, time to
review and analyze the observational data (along with additional material), and time to
conference with every teacher. Efforts to short circuit and truncate these components will
compromise the quality and defensibility of the evaluation system. Thus concerns for adopting a
system that is feasible in terms of time, personnel, money, and other human and material
resources are critical.
Observation/Evaluation Systems
Many observation and evaluation systems are currently available. Some have been developed by
researchers, others by professional developers, others by educators committed to providing sound
support for early career teachers. Several states—Rhode Island, North Carolina, and Colorado, for
example—have developed their own protocols (often adapting aspects of other widely used observation
tools). Most of these materials are not accompanied by credible research on their reliability and validity.
In addition to hearing from several Michigan school principals about their observation systems, the
MCEE carefully examined the following tools:
• The Marzano Observation Protocol (Marzano Research Laboratory)
• The Thoughtful Classroom (Silver Strong & Associates)
• The Five Dimensions of Teaching and Learning (The University of Washington, Center for
Educational Leadership)
• Charlotte Danielson’s Framework for Teaching Proficiency Test Instrument (Outcomes
Associates, Inc.)
• The Classroom Assessment Scoring System (CLASS, Teachstone, Inc.)
• The TAP Rubric (National Institute for Excellence in Teaching)
All of the existing protocols are potentially aligned with MDE standards for teachers, although they differ
substantially in level of detail and relevance to all grade levels and subject areas:
229
Amended July 28, 2015
ESEA FLEXIBI LITY – REQ UEST U . S . D EPARTMEN T OF ED UC ATION
RK� Provide extensive information on these six observation tools, including information
produced by the company, any external research or information, and
reflections/observations from districts currently using these models.
RK� Showcase MCEE pilot district results using one of these six observation tools at
conferences, in online profiles and case studies, and in other public venues where
appropriate.
Some of the observation protocols focus exclusively on what observers might see in a classroom; others
include professional responsibilities such as collaborating with other teachers, working well with
parents, planning and reflecting on lessons. Very few of them have been the subject of independent
research; only the Danielson Framework for Teaching and the Classroom Assessment Scoring System
have substantial research in terms of instrument validity and reliability.
Lessons Learned
All of the state commissioners whom we interviewed and all of the observation system vendors
emphasized several important issues. We summarize the main ones here:
• Pilot phase: A system of educator evaluation will only work to improve student learning if there
is extensive buy in, understanding, and local learning. Every state commission recommended a
pilot testing year, during which proposed tools and approaches can be tried out and their
feasibility and fairness analyzed. Such pilot testing enables appropriate adaptations to be
developed, as well more communication and buy in. Pilot testing is also essential for assessing
the feasibility of the processes proposed.
• Phasing in: Educators and evaluators cannot use a system with fidelity if they do not understand
it. Each observation system involves considerable mastery of tools and processes, by both
teachers and their evaluators. All vendors recommend phasing their system in. Two aims were
identified:
o Learning the tool. The observation tool is an essential catalyst for stimulating learning in the
system. Principals and teachers need time to acquaint themselves with the tool, adopt the
new technical vocabulary that accompanies any educator evaluation system, and reorient
themselves to the changes in their responsibilities that are required by the system.
o Training the evaluators. Every vendor emphasized the necessity of taking time to train (and
in some cases, certify) the evaluators before launching the process. Untrained evaluators
significantly threaten the integrity and fidelity of the implementation, which in turn
compromises both its capacity to improve student learning as well as its validity and
reliability.
• One observation is not enough and walkthroughs are not sufficient. Research on how many
observations are needed to develop a sound description of a teacher’s practice makes it clear
that one observation is not sufficient, and can actually provide inaccurate information on the

230 Amended July 28, 2015
ESEA FLEXIBI LITY – REQ UEST U.S . D EPARTMEN T OF ED UC ATION
quality of instruction. While there is no definitive answer to the question “How many
observations of what length are sufficient?”, researchers conducting the Measures of Effective
Teaching study have found that multiple observations lead to higher levels of reliability, and
recommend that, when the data will be used for high-stakes evaluation, teachers must be
observed during more than one lesson. Study authors also suggest that state and local
education authorities regularly audit reliability by having outside observers conduct
observations on a subset of teachers and compare scores to those from observations by school
administrators.17
• There is a larger system of policies, practices, and resources that accompany the educator
observation tools. This includes:
o Training/retraining for the evaluators/principals
o Appeals processes
o Handbooks for teachers
o Handbooks for principals
o Rubrics for summative evaluations based on multiple observations
o Technology to support observations (e.g., iPads and apps)
o Technology to support data entry and management (including interfaces for multiple system
users—for example, principals who are doing evaluations and teachers who are entering
information—linked also to student assessment information)
o Technical studies: Every tool needs to be evaluated for its quality. This involves conducting
research on the reliability and validity of instruments (e.g., testing whether different
observers using the same instrument and observing the same teacher will produce similar
ratings and examining the correlation between evaluations based on observation
instruments and evaluations using other empirical data).
o Communication network for ongoing educator education
o Pilot study and subsequent revisions
RK�As outlined above, we will seek to produce or gather and provide these sorts of
supporting policies, practice,s and resources for the observation tools and other elements
that support MCEE’s work.
Challenges
17 Kane, Thomas & Staiger, Douglas (2012) “Gathering feedback for teaching: Combining high-quality observations with student surveys and
achievement gains.” Measures of Effective Teaching project, pp. 38-40.
http://www.metproject.org/downloads/MET_Gathering_Feedback_Research_Paper.pdf
231
Amended July 28, 2015
ESEA FLEXIBI LITY – REQ UEST U . S . D EPARTMEN T OF ED UC ATION
In reviewing research and interviewing relevant actors in other states, the MCEE has identified several
important challenges that will have to be confronted when making recommendations about the
observation tool to be used.
� Challenge 1: Being fiscally and practically feasible. Only two instruments have independent,
persuasive data associated with them about their reliable use (Framework for Teaching and
CLASS). Both are labor intensive, and require multiple observations, as well as considerable
material and personnel resources. A fair system requires the use of tested instruments that
result in defensible observations and subsequent evaluations, but this costs both money and
time.
� Challenge 2: Ensuring fairness and reliability. No matter what tool is selected, considerations of
feasibility are important, but must be balanced by an overriding concern for fairness.
Determining how many observations are required, how many observers there should be, the
number of dimensions and sub-dimensions on which teachers should be evaluated, and what
the necessary training and expertise of evaluations should be are crucial considerations. All of
the available evidence suggests that multiple observations are needed and multiple observers
need to be trained. Some of the available instruments (that do not have independent evidence
associated with them) are shorter or have been streamlined for the purposes of briefer, more
efficient observations, but these instruments may not produce observations that are of high
enough quality to make high-stakes decisions. Principals do not have the time needed to
conduct multiple observations for every teacher (in addition to end of the year conferences),
nor do they have the content expertise to be qualified to make sound judgments across all
content domains.
� Challenge 3: Assessing the fidelity of protocol implementation. Given the high-stakes nature of
the decisions that will be made based on these observations, it is imperative that there be a
rigorous system in place to check that instruments and procedures are implemented with
integrity and rigor. Every vendor with whom we spoke emphasized the importance of observer
training and retraining. As the use of these observations goes to scale in thousands of teachers’
classrooms, data must be collected and analyses conducted to appraise whether tools are being
used accurately and whether protocols for implementation are being followed.
RK� Produce informational/educational materials to help stakeholders (like teachers
and principals) understand the concept of fidelity of protocol implementation, its
importance, and strategies to ensure that fidelity.
� Challenge 4: Determining the equivalence of different instruments. If the state grants waivers
to school districts to use a range of observation and evaluation tools, it is imperative that
evidence is collected concerning the equivalence of instruments. That is, it would be
232
Amended July 28, 2015
ESEA FLEXIBI LITY – REQ UEST U . S . D EPARTMEN T OF ED UC ATION
unacceptable for teachers in one district to be held to a standard that is higher or lower than
another district. Thus, the state will also need to collect information to demonstrate the
equivalence of judgments made using different tools.
Observations of teaching might seem straightforward and commonsensical to many. However, the
council’s research makes clear the need to be vigilant in demanding the rigorous and accurate use of
instruments that have also been submitted to critical research and review. Doing anything less would
jeopardize the integrity of the entire process, limit the policy’s capacity to improve schooling for
Michigan’s children, and compromise the entire reason for this initiative.
Teacher Evaluation: Student Growth Model
The central purpose of teaching is to help students learn, and student growth measures can provide
valuable insights into teachers’ effectiveness in doing so, particularly when coupled with other measures
of teaching efficacy. Given the central place that student learning holds in the initiative to develop an
excellent educator evaluation system in Michigan, the MCEE is examining ways in which accounting for
student growth can be effectively incorporated into the state’s approach to evaluating educators. As this
brief update will illustrate, much work has been done on this important component and much work
remains to be completed before any recommendations can be made.
One of the first challenges for the MCEE has been to clarify exactly what is meant by “student growth.”
Despite its apparent simplicity, it is actually a term that has taken on a range of meanings around the
country. An early task of the council was to survey the field to understand different ways this term is
being used in education policy. This review has included consulting with various experts in learning
measurement and modeling, reviewing work done by other states, meeting with service providers, and
consulting with local school districts.
The council has found wide variance in the ways in which organizations describe student growth
measurement. They differ in (1) the tests used to assess student growth, (2) the actual analytic
techniques for quantifying student growth, and (3) the measures of value-added by educators to
student growth. These are based on different assumptions and vary in their accuracy and reliability.
Each of these three is explained briefly below.
Tests Used to Measure Student Growth
The MCEE has reviewed a range of assessments that can be used to produce estimates of student
growth. These include teacher-made assessments, state tests (such as the Michigan Educational
Assessment Program, or MEAP), and national norm-referenced tests (such as Northwest Evaluation
Association’s [NWEA] Measures of Academic Progress [MAP] or Scantron Performance Series). Specific
characteristics of each assessment affect what it means to track students’ growth.
Quantitative Measures of Student Growth
233
Amended July 28, 2015
ESEA FLEXIBI LITY – REQ UEST U . S . D EPARTMEN T OF ED UC ATION
The council’s investigations so far have allowed for a broad definition of student growth, including
proxies for student growth (e.g., students’ percentile ranks conditioned on pretest scores), which are
often used as measures of student progress. Measures of student growth and progress that are
currently in use for accountability purposes around the U.S. vary from the simple to the statistically
complex. Simple examples include:
• Difference scores based on pre-test vs. post-test administrations of the same test in the same
grade (not in use on a large scale).
• Transition tables tracking student performance levels from one grade to the next (such as those
used in Delaware, Iowa, Minnesota, and Michigan).
More complex examples include:
• Difference scores based on pre- vs. post-test administrations, where the difficulty level of the
test is calibrated on a vertical scale18 to individual students’ achievement levels at the time of
the pre- or post-assessment (this approach is not in widespread use, but available through such
instruments as the NWEA MAP).
• Difference scores based on vertically scaled tests from one grade to the next (such as those used
in some states with vertically scaled assessments).
• Student growth percentile models such as those used in Arizona, Colorado, Indiana, and
Massachusetts. In these models, percentile ranks of students’ post-test scores are given for
students who started out with similar scores on the pre-test.
Although each of these approaches satisfies a broad definition of measuring student growth, an
important task of the MCEE will be to pilot these models to determine which are the most valid and
reliable for use in evaluating educators.
RK�Produce and disseminate informational materials to districts and schools on these
approaches to measuring student growth; pros/cons; cautions in use.
RK� Tool for using Michigan’s current growth data, available from the MEAP assessments.
MDE has already made this available to districts, and will continue to refine this tool. Known as
the MDE Weighted PLC Tool, it helps districts and schools take their performance level change
data from the MEAP assessments in reading and math in grades 3-8 that has been linked by
MDE to teachers of record, and analyze it at the teacher, school, and district level. Districts and
schools are able to cut and paste their linked student/teacher file into the tool, and the tool
produces aggregate values using a weighted performance level change system. Districts are
able to change the weights on the various performance level changes, and are also able to make
18 Vertical scales attempt to place test scores of students across grades on a common scale. For example, all students taking a particular test
(regardless of grade) may fall on a vertical scale of 0 to 1000. Leveraging a common scale across grades is supposed to allow educators to
compare student test score movement between adjacent grades as a way to estimate student growth. Thus, a helpful feature of vertical scales
is that they allow the comparisons of test scores easily between grades. Vertical scales are not without their limitations, however. It is
important to note that there is legitimate scholarly disagreement regarding the validity of vertical scales, and the council will need to consider
these disagreements when making its recommendations.

234
Amended July 28, 2015
ESEA FLEXIBI LITY – REQ UEST U . S . D EPARTMEN T OF ED UC ATION
decisions regarding the application of rules about student attendance or other student
attributional issues.
MDE has been working with districts and schools to get this tool in their hands. Early responses
from the field indicate that people find it useful. One school leader has indicated that she is
seeing differences in elementary school teacher “ratings” in math and reading, and that these
ratings correspond to what they would expect to see in terms of teacher strengths and
weaknesses, based on observations and teachers’ minors. Understanding these differences is
allowing the school to help target professional development more appropriately—more reading
professional development for some teachers, more math professional development for others.
MDE plans to continue and expand the use of this tool and related materials, as well as continue
to work with districts using the tool to gather information on best practices and utility and to
share these with other districts.
Value-Added Measures
Value-added measures (VAM) attempt to isolate the effects of individual educators on the achievement
or growth demonstrated by their students. VAM may be based on measures of student growth or
vertical scales, but do not need to be. This is because measures of value added for an individual teacher
are based on the deviation of that teacher’s students’ scores (or growth or progress) from the scores (or
growth or progress) those students were expected to achieve based on previous achievement (and
possibly other factors).
There are many different approaches to measuring the “added value” of an individual teacher’s impact
on students’ growth, but there is legitimate and important scholarly disagreement over the
appropriateness of these various approaches. Some researchers are skeptical about VAM in general
because they question the validity of making causal claims about the impact of individual educators on
student outcomes. The MCEE is committed to a thorough review and pilot of existing and emerging
approaches, before making a final recommendation about the value-added component in MDE’s
educator evaluations. Although it seems common sense to be able to identify the impact a particular
teacher has on students’ progress, it is far from simple to do and the risks of doing it unreliably and
improperly are obvious threats to the goal of this initiative to develop a strong system to evaluate and
improve educator effectiveness in Michigan.
RK�Continue to produce and disseminate informational materials to districts, schools and other
stakeholders regarding value-added models, how to use them, strengths/cautions, and
methodological challenges.
RK� MDE has already forged a partnership with two different groups—one large district, and
one statewide initiative—to begin running value-added models on their data in order to begin to
evaluate these models in practice. We will continue these partnerships, and will produce white
papers and technical documents to share with other districts as they grapple with issues related
to value added modeling. We will also share these findings with the MCEE, to help inform their
work.

235
Amended July 28, 2015
ESEA FLEXIBI LITY – REQ UEST U . S . D EPARTMEN T OF ED UC ATION
Plans for the Future of Michigan Assessment
Because measures of growth are highly dependent on the measures of achievement used to calculate
student growth, the MCEE has taken a serious interest in the direction of state testing in Michigan as
led by the Bureau of Assessment and Accountability (BAA). BAA has provided the MCEE with a
detailed overview of the MDE’s plan to develop additional standardized measures in the coming years
and guide Michigan as the state moves to the Common Core State Standards and the supporting suite
of assessments. (See Appendix L for a high-level overview of the next five years of planned testing
development in Michigan.)
As the MCEE continues to investigate current work being done on measuring student growth, council
members with technical expertise have also begun to evaluate how specific approaches to growth
modeling would operate using state assessment data. The council will continue this work in the coming
months and will include their findings in a future report.
Challenges to Resolve
Measurement of student growth and “value added” are important components of educator evaluation.
However, the different possible approaches present challenges that require more research and
evaluation. Attributing student growth to individual educators in ways that are both fair and valid is a
daunting task. MCEE is committed to addressing the challenges, and to incorporating the necessary
safeguards in their recommendations. In addition to the issues entailed by the measurement of student
growth and educators’ added value, the MCEE has identified additional challenges that require further
discussion and review:
� Challenge 1: Measurement error in standardized and local measurements. The MCEE recognizes
that data collected from local and standardized assessments include some degree of random
measurement error, some significant enough to lead to gross miscalculation of teachers’ impact
on student growth. It will be crucial to account for such measurement error in any responsible
approach to including student growth and VAM in educator evaluation.
� Challenge 2: Balancing fairness toward educators with fairness toward students. The MCEE
recognizes that there are significant issues to consider regarding whether demographic
information should be incorporated into the statistical models used for VAM. Including such
information will result in different expectations for certain groups of students based on their
backgrounds, which in turn may result in maintaining or even increasing achievement gaps.
While this is less fair to students, it is fairer to educators to take into account the background
characteristics of their students in setting expectations for growth. Not including demographics
in setting expectations for student growth is fairer toward students, but is less fair toward
236
Amended July 28, 2015
ESEA FLEXIBI LITY – REQ UEST U . S . D EPARTMEN T OF ED UC ATION
educators. It is important to design a system that balances fairness toward educators and
students.
RK� MDE’s ongoing partnership with a large Michigan district will allow us to provide
the MCEE with quantitative evidence on the impact of including demographic
characteristics in the models.
� Challenge 3: Non-tested grades and subjects. Performing student growth calculations depends
on having good measures in place. Measuring growth in non-tested subjects, such as art,
physical education, music, etc. is a significant issue for the MCEE to address in its
recommendation. An additional issue is the fact that many teachers do not teach in grades that
are tested.
� Challenge 4: Tenuous roster connections between students and teachers. Fundamental to
describing a teacher’s influence on the learning outcomes of students is knowing which students
he or she teaches, and to what degree each teacher is responsible for the instruction of each
student. Based on discussions with local districts and state agencies, and national policy work,
the MCEE recognizes that the student-teacher rostering relationship has a number of important
challenges that need to be addressed. Repeatedly states have reported difficulties in simply
determining which students were associated with which teachers.
� Challenge 5: Number of years of data. Teachers’ assignments change regularly, some more than
others. Teachers’ work shifts as changes arise in their assignments to grade levels, subject areas,
schools, and students. Instructional effectiveness must be geared to specifics of the context.
Teachers also retire, while others enter the workforce. Like observations, assessments of value
added are only as good as the data available, and for many teachers in tested grades and subject
areas there is considerable variability in how many years of data are available.
In the coming months, the MCEE will continue to investigate these and other important issues as they
relate to using student growth data to inform educator evaluation.
Combining Observation and Student Growth Scores
As this document has revealed, challenges exist in the selection of observational and student growth
tools. The council has found that it is also important to consider carefully how values produced from
observational and student growth tools are combined into a final evaluation score. The MCEE has
reviewed the approach for combining evaluation scores in states such as New York, Ohio, Tennessee,

237
Amended July 28, 2015
ESEA FLEXIBI LITY – REQ UEST U . S . D EPARTMEN T OF ED UC ATION
Ohio, North Carolina, and Colorado. From these states’ teacher evaluation systems, two approaches
have emerged: formulaic and rubric.
In the formulaic approach (Tennessee and New York), inputs such as student growth and teacher
observation are given weights and combined into a single teaching performance score by means of a
formula. Combined scores are then mapped to a labeling scheme, which provides descriptions of
teaching performance. For example, in New York 60 points of the evaluation are based on nationally
recognized measures of teacher performance. The other 40 points are based on growth, giving a total
possible of 100 points. The number of points a teacher earns is then mapped onto the following
performance standards:
Ineffective: 0 – 64
Developing: 65 – 74
Effective: 75 – 90
Highly Effective: 91 – 100
Other states chose to use a rubric approach, where teacher observation data and student growth data
are both independently mapped to standards of performance. For example, teachers may score a 5 in
student growth, but only a 1 from observations of their teaching. The two scores are mapped to a rubric
to determine the overall evaluation rating (“Partially Effective”). The rubric below is an illustrative
example provided by Colorado:
Figure 42. Sample Rubric
Each of these approaches to combining scores presents challenges and opportunities. Naturally, a
constraint of the rubric approach is that it is best applied to evaluation systems that equally weight two
components (such as observation and growth). However, the rubric approach has intuitive appeal to
educators, and is likely easier to understand than a formulaic approach. Approaches that use a formula
are fairly flexible in their weighting and the number of factors employed, but may communicate a false
238
Amended July 28, 2015
ESEA FLEXIBI LITY – REQ UEST U . S . D EPARTMEN T OF ED UC ATION
degree of precision. The MCEE considers the combining of component scores to be an important
challenge that requires more discussion.
Other Potential Components of the Educator Evaluation System
Observations and student test scores are only two of the components of educator evaluation systems
that are being developed. Other components include documents that support the observations, as well
as other materials contributed by teachers, principals, students, or parents. Among the other
components used in other states are the following:
• Pre-observation conferences
• Post-observation conferences
• Summative evaluation conferences
• Teacher self-assessments
• Professional accountabilities (e.g., National Heritage Academies’ mid- and year-end evaluations)
• Educator growth plans (developed by teachers or administrators)
• Locally developed assessments of student learning
• Structured review of student work
• Teacher artifacts using portfolio or evidence binder processes
• Feedback from students, parents, and/or other teachers using structured survey tools
• Teacher self-reflection and progress on professional growth goals
The MCEE will continue to consider the other components that should be included in MDE’s educator
evaluation system.
RK� Provide districts and schools with concrete examples of these components, along with any
available evidence on their use
Timeline
PA 102 of 2011 set out goals for a rigorous evaluation system intended to enhance instruction and
support professional learning in Michigan. The MCEE understands the urgency of such reform, but also
acknowledges the high stakes involved in restructuring educator evaluation. In order to ensure that
MDE provides policy and direction that will empower teachers and leaders to meet the needs of
students and improve student outcomes, the MCEE has designed the following timeline. This will allow
for the thought, research, and collaboration necessary to make responsible, fair, and feasible
recommendations.

239
Amended July 28, 2015
ESEA FLEXIBI LITY – REQ UEST U . S . D EPARTMEN T OF ED UC ATION
Table 19. Estimated Timeline for Completing Recommendations
Month/Year Recommendation
June 2012 Observation tool(s)
Details regarding the 2012-2013 pilot year
July 2012 Other components of teacher evaluation systems
October 2012 Student growth model
November 2012 Evaluation tool for school administrators
Details regarding the pilot of administrator evaluations
District waiver processes and principles
April 2013 Professional certificate
June 2013 Review all recommendations and adjust based on new data and information
Looking Forward
Evidence shows that skillful instruction can dramatically increase the probability that students will learn.
Such teaching is sensitive to students’ environments, good at buffering interferences, and adept at
promoting students’ academic engagement as well as their social and emotional development. Being
able to achieve our ambitious educational agenda in this state depends on building and supporting a
system that can ensure that the teachers who serve in our classrooms have the requisite professional
skills and know how to use them with the diversity of Michigan’s 1.5 million schoolchildren.
As such, the charge presented to the MCEE is ambitious and historically significant, as it could lead to
revolutionary changes in how educators are evaluated in Michigan. The council is committed to moving
quickly on this charge and to learning as much from other states as possible about how to create the
infrastructure, procedures, and tools necessary to create this new system.
***********End excerpt from MCEE Interim Report*****
ENSURING COMPLIANCE
In the current legislation, MDE is not given specific authority with regard to compliance with educator
evaluations. MCEE will be making determinations regarding monitoring and compliance to ensure that
LEAs are appropriate implementing evaluation systems. MDE has strongly recommended to MCEE, the
Governor, and the Legislature that any legislation for the final statewide educator evaluation system
includes provisions and funding for MDE compliance monitoring of schools and districts to ensure their
systems meet requirements and are implemented with fidelity. Given the high stakes of the evaluation
system for teachers and administrators, we will also recommend that legislation specifies consequences
for being out of compliance.

240
Amended July 28, 2015
ESEA FLEXIBI LITY – REQ UEST U . S . D EPARTMEN T OF ED UC ATION
MDE also has tools available to encourage compliance. Foremost among them is the power of “light of
day” reporting. In our theory of action, we make the role of data and information a central piece of the
conversations that the education community will have in order to drive their work. MDE has
substantially increased our reporting efforts in the past several years, providing more information
regarding how districts and schools are doing, even if it is not for a formal accountability system or
required report. We plan to leverage this focus on dashboards, public transparency, and reporting to
help ensure compliance. Key activities will include:
1. Publishing the educator effectiveness labels in the aggregate by school and district, using the
MiSchoolData portal.
2. Hold schools accountable for submitting 100% of their required effectiveness labels in the new
Accountability Scorecard. This gives schools credit for submitting their labels (after conducting
evaluations).
4. Use available state assessment data and the teacher-student data link to cross-reference
reported educator effectiveness labels with available data. If a district is reporting all highly
effective teachers, but the district, school, grade and/or individual level data suggest otherwise,
this suggests the district may need to better align its system with rigorous evaluation principles.
As required by the State Fiscal Stabilization Fund, through an Evaluation System Factor Survey
that asks districts to respond to their progress in development and implementation, the
components included in the evaluation system, and the uses of the results. The results of this
factor survey will be published broadly, both at the aggregate level and with generalized findings
from survey analysis.
5. Collection and review of local evaluation systems (see below for more detail).
As part of MDE’s overall approach to improving educator effectiveness, which includes more than only
the educator evaluation component, workgroups have been formed in order to implement a series of
recommendations regarding professional learning, preservice training, and other components of an
overall educator effectiveness plan.
MDE will continue to work with stakeholders to seek input from the field as districts implement the
current law that requires an annual evaluation of educators based on student growth measures and
must include multiple observations.
MDE plans to conduct a voluntary review of educator evaluation systems across the state as a means of
monitoring progress of development and implementation of evaluation as described below.
Overview
MDE will institute a review process whereby districts voluntarily submit their evaluation plans (along
with samples, timelines, and all materials related) for a comprehensive review of their educator
241
Amended July 28, 2015
ESEA FLEXIBI LITY – REQ UEST U . S . D EPARTMEN T OF ED UC ATION
evaluation systems. This would provide the districts feedback on their system that is customized and
categorized into what’s working with the system and what needs work.
Given the timeline for development and implementation of evaluation systems, the necessity for the
system to work in a high stakes environment (public reporting of effectiveness labels), and the need to
revise while putting the system into place, we believe this “beating the odds” approach that highlights
districts good work would be incentive to continue their work to comply with state law.
This type of review would also allow MDE to highlight districts that have designed and are implementing
rigorous evaluation systems against an MDE-developed evaluation protocol.
This would potentially allow for a more in depth study following the review through site visits and
interviews. This would allow MDE to publish case study information. In addition to providing positive
“light of day” reporting for districts across the state, MDE will write a summary review explaining and
describing key practices across the state, as well as areas for development across systems in the state.
Purpose
Monitoring and reporting
Timeline
June 2012 – Develop communication documentation regarding the review process
July 2012 - Request for evaluation system submissions for review
August 2012 – Collect systems and begin review
September 2012 – Review paper submissions
October – Report findings
November 2012– Conduct further research via site visits and interviews with district leaders of the
February 2013 “top performing” or “highest quality” or “most comprehensive” evaluation
Systems
April 2013 – Publish case studies and overall findings via www.michigan.gov/baa
Resources available to support the work of educator evaluations
242
Amended July 28, 2015
ESEA FLEXIBI LITY – REQ UEST U . S . D EPARTMEN T OF ED UC ATION
Districts and schools have access to several resources, including the ones named above. In addition, the
systems of supports outlined throughout this application will foster diagnostic leadership on the part of
school leaders and improvement specialists alike. This is an important feature of MDE’s program design,
in that it weaves our state’s system of support back through the delivery of daily classroom instruction,
and ensures the content we intend to deliver (career- and college-ready standards, as established
through the Common Core) —and, indeed, are intervening to deliver in diagnostic, personalized ways, as
described in Principle Two —is being achieved at the classroom level. We consider teacher evaluation to
be a school improvement tool as much as any other intervention described in our waiver request.
Our Statewide System of Support will work with building- and district- level leaders to provide hands-on,
specific assistance with teacher evaluation processes. As diagnostic improvement decisions are made,
local leaders can use the teacher evaluation process to support staff in achieving critical results. MDE
and other intervention specialists will be actively engaged in supporting local schools as they accomplish
this work.
Michigan’s strong educator evaluation legislation provides a legislative mandate by which the majority
of this work will be accomplished. At the present time, each LEA is required to adopt the state
evaluation system, or to have a high-quality system in place that meets all requirements by the 2013-
2014. This provides the legislative “muscle” necessary to begin the process of ensuring that these
systems are implemented.
SAMPLE FORMAT FOR PLAN
Below is one example of a format an SEA may use to provide a plan to meet a particular principle in the
ESEA Flexibility.
Key Milestone
or Activity
Detailed
Timeline
Party or
Parties
Responsible
Evidence
(Attachment)
Resources
(e.g., staff
time,
additional
funding)
Significant
Obstacles
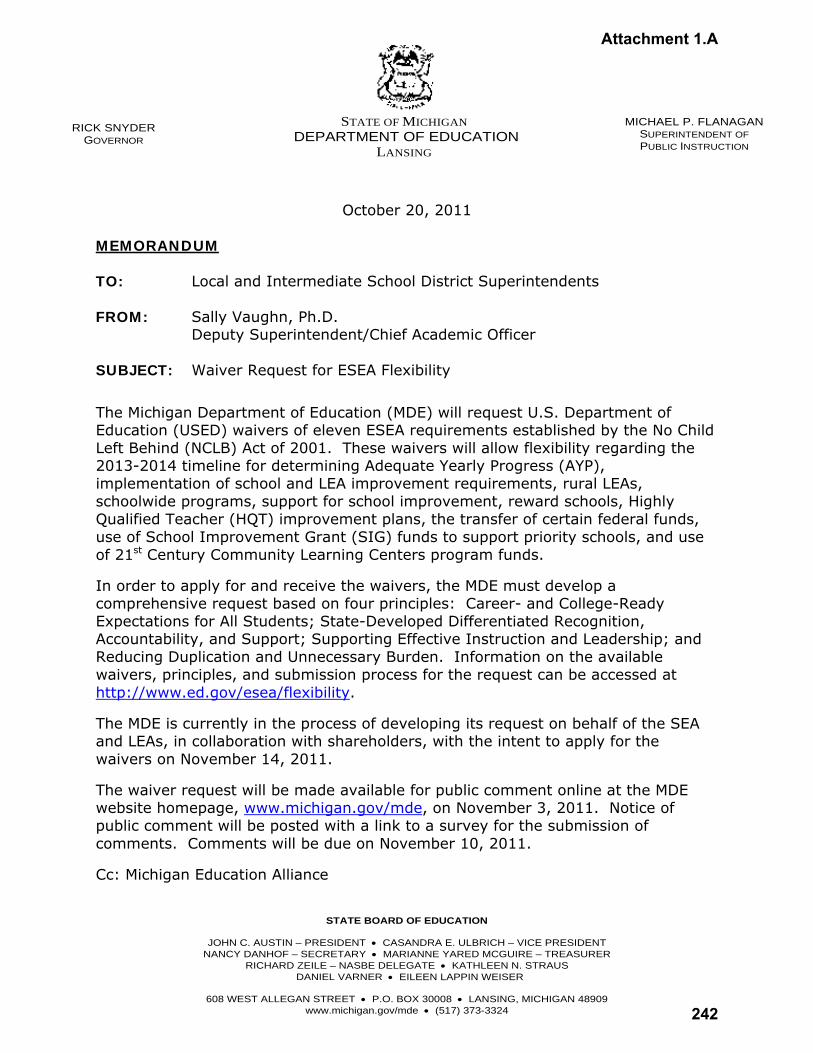
STATE BOARD OF EDUCATION
JOHN C. AUSTIN – PRESIDENT • CASANDRA E. ULBRICH – VICE PRESIDENT NANCY DANHOF – SECRETARY • MARIANNE YARED MCGUIRE – TREASURER
RICHARD ZEILE – NASBE DELEGATE • KATHLEEN N. STRAUS DANIEL VARNER • EILEEN LAPPIN WEISER
608 WEST ALLEGAN STREET • P.O. BOX 30008 • LANSING, MICHIGAN 48909
www.michigan.gov/mde • (517) 373-3324
RICK SNYDER GOVERNOR
MICHAEL P. FLANAGAN SUPERINTENDENT OF PUBLIC INSTRUCTION
October 20, 2011
MEMORANDUM TO: Local and Intermediate School District Superintendents FROM: Sally Vaughn, Ph.D. Deputy Superintendent/Chief Academic Officer SUBJECT: Waiver Request for ESEA Flexibility
The Michigan Department of Education (MDE) will request U.S. Department of Education (USED) waivers of eleven ESEA requirements established by the No Child Left Behind (NCLB) Act of 2001. These waivers will allow flexibility regarding the 2013-2014 timeline for determining Adequate Yearly Progress (AYP), implementation of school and LEA improvement requirements, rural LEAs, schoolwide programs, support for school improvement, reward schools, Highly Qualified Teacher (HQT) improvement plans, the transfer of certain federal funds, use of School Improvement Grant (SIG) funds to support priority schools, and use of 21st Century Community Learning Centers program funds.
In order to apply for and receive the waivers, the MDE must develop a comprehensive request based on four principles: Career- and College-Ready Expectations for All Students; State-Developed Differentiated Recognition, Accountability, and Support; Supporting Effective Instruction and Leadership; and Reducing Duplication and Unnecessary Burden. Information on the available waivers, principles, and submission process for the request can be accessed at http://www.ed.gov/esea/flexibility.
The MDE is currently in the process of developing its request on behalf of the SEA and LEAs, in collaboration with shareholders, with the intent to apply for the waivers on November 14, 2011.
The waiver request will be made available for public comment online at the MDE website homepage, www.michigan.gov/mde, on November 3, 2011. Notice of public comment will be posted with a link to a survey for the submission of comments. Comments will be due on November 10, 2011.
Cc: Michigan Education Alliance
STATE OF MICHIGAN
DEPARTMENT OF EDUCATION LANSING
Attachment 1.A
242
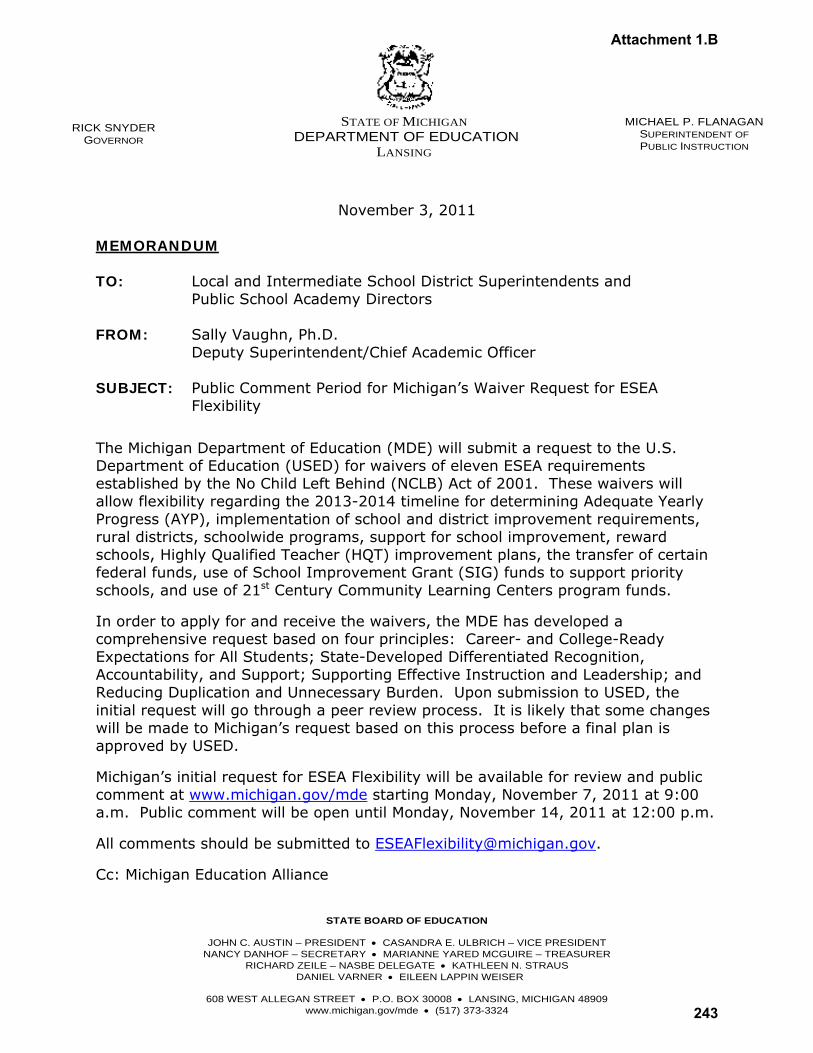
STATE BOARD OF EDUCATION
JOHN C. AUSTIN – PRESIDENT • CASANDRA E. ULBRICH – VICE PRESIDENT NANCY DANHOF – SECRETARY • MARIANNE YARED MCGUIRE – TREASURER
RICHARD ZEILE – NASBE DELEGATE • KATHLEEN N. STRAUS DANIEL VARNER • EILEEN LAPPIN WEISER
608 WEST ALLEGAN STREET • P.O. BOX 30008 • LANSING, MICHIGAN 48909
www.michigan.gov/mde • (517) 373-3324
RICK SNYDER GOVERNOR
MICHAEL P. FLANAGAN SUPERINTENDENT OF PUBLIC INSTRUCTION
November 3, 2011
MEMORANDUM TO: Local and Intermediate School District Superintendents and Public School Academy Directors FROM: Sally Vaughn, Ph.D. Deputy Superintendent/Chief Academic Officer SUBJECT: Public Comment Period for Michigan’s Waiver Request for ESEA
Flexibility
The Michigan Department of Education (MDE) will submit a request to the U.S. Department of Education (USED) for waivers of eleven ESEA requirements established by the No Child Left Behind (NCLB) Act of 2001. These waivers will allow flexibility regarding the 2013-2014 timeline for determining Adequate Yearly Progress (AYP), implementation of school and district improvement requirements, rural districts, schoolwide programs, support for school improvement, reward schools, Highly Qualified Teacher (HQT) improvement plans, the transfer of certain federal funds, use of School Improvement Grant (SIG) funds to support priority schools, and use of 21st Century Community Learning Centers program funds.
In order to apply for and receive the waivers, the MDE has developed a comprehensive request based on four principles: Career- and College-Ready Expectations for All Students; State-Developed Differentiated Recognition, Accountability, and Support; Supporting Effective Instruction and Leadership; and Reducing Duplication and Unnecessary Burden. Upon submission to USED, the initial request will go through a peer review process. It is likely that some changes will be made to Michigan’s request based on this process before a final plan is approved by USED.
Michigan’s initial request for ESEA Flexibility will be available for review and public comment at www.michigan.gov/mde starting Monday, November 7, 2011 at 9:00 a.m. Public comment will be open until Monday, November 14, 2011 at 12:00 p.m.
All comments should be submitted to [email protected].
Cc: Michigan Education Alliance
STATE OF MICHIGAN
DEPARTMENT OF EDUCATION LANSING
Attachment 1.B
243

STATE BOARD OF EDUCATION
JOHN C. AUSTIN – PRESIDENT CASANDRA E. ULBRICH – VICE PRESIDENT
NANCY DANHOF – SECRETARY MARIANNE YARED MCGUIRE – TREASURER
RICHARD ZEILE – NASBE DELEGATE KATHLEEN N. STRAUS
DANIEL VARNER EILEEN LAPPIN WEISER
608 WEST ALLEGAN STREET P.O. BOX 30008 LANSING, MICHIGAN 48909
www.michigan.gov/mde (517) 373-3324
RICK SNYDER GOVERNOR
MICHAEL P. FLANAGAN SUPERINTENDENT OF PUBLIC INSTRUCTION
January 19, 2012
MEMORANDUM
TO: Local and Intermediate School District Superintendents and Public
School Academy Directors
FROM: Sally Vaughn, Ph.D. Deputy Superintendent/Chief Academic Officer
SUBJECT: Elementary and Secondary Education Act (ESEA) Waiver Webinar
Attached please find an announcement on the Michigan Department of Education’s webinar on the state’s ESEA Flexibility Waiver, which will be submitted to the
United States Department of Education (USED) by February 21, 2012.
If you have questions about this event, please contact the Evaluation Research & Accountability Unit at [email protected] or 877-560-8378, option 6.
Attachment
cc: Michigan Education Alliance
STATE OF MICHIGAN
DEPARTMENT OF EDUCATION LANSING
Attachment 1.C
244
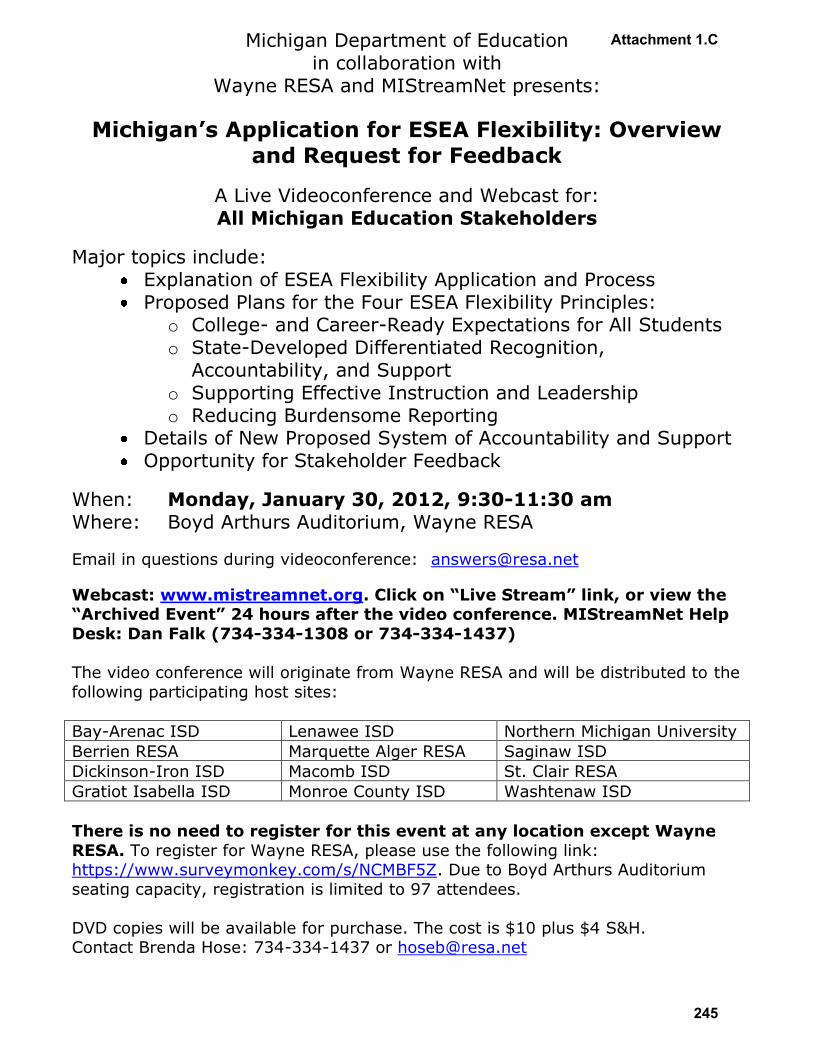
Michigan Department of Education in collaboration with
Wayne RESA and MIStreamNet presents:
Michigan’s Application for ESEA Flexibility: Overview
and Request for Feedback
A Live Videoconference and Webcast for: All Michigan Education Stakeholders
Major topics include: Explanation of ESEA Flexibility Application and Process Proposed Plans for the Four ESEA Flexibility Principles:
o College- and Career-Ready Expectations for All Students
o State-Developed Differentiated Recognition, Accountability, and Support
o Supporting Effective Instruction and Leadership o Reducing Burdensome Reporting
Details of New Proposed System of Accountability and Support Opportunity for Stakeholder Feedback
When: Monday, January 30, 2012, 9:30-11:30 am Where: Boyd Arthurs Auditorium, Wayne RESA
Email in questions during videoconference: [email protected]
Webcast: www.mistreamnet.org. Click on “Live Stream” link, or view the “Archived Event” 24 hours after the video conference. MIStreamNet Help
Desk: Dan Falk (734-334-1308 or 734-334-1437)
The video conference will originate from Wayne RESA and will be distributed to the
following participating host sites:
Bay-Arenac ISD Lenawee ISD Northern Michigan University
Berrien RESA Marquette Alger RESA Saginaw ISD
Dickinson-Iron ISD Macomb ISD St. Clair RESA
Gratiot Isabella ISD Monroe County ISD Washtenaw ISD
There is no need to register for this event at any location except Wayne
RESA. To register for Wayne RESA, please use the following link: https://www.surveymonkey.com/s/NCMBF5Z. Due to Boyd Arthurs Auditorium
seating capacity, registration is limited to 97 attendees.
DVD copies will be available for purchase. The cost is $10 plus $4 S&H. Contact Brenda Hose: 734-334-1437 or [email protected]
Attachment 1.C
245

STATE BOARD OF EDUCATION
JOHN C. AUSTIN – PRESIDENT CASANDRA E. ULBRICH – VICE PRESIDENT
NANCY DANHOF – SECRETARY MARIANNE YARED MCGUIRE – TREASURER
RICHARD ZEILE – NASBE DELEGATE KATHLEEN N. STRAUS
DANIEL VARNER EILEEN LAPPIN WEISER
608 WEST ALLEGAN STREET P.O. BOX 30008 LANSING, MICHIGAN 48909
www.michigan.gov/mde (517) 373-3324
RICK SNYDER GOVERNOR
MICHAEL P. FLANAGAN SUPERINTENDENT OF PUBLIC INSTRUCTION
February 2, 2012
MEMORANDUM
TO: Local and Intermediate School District Superintendents and Public School Academy Directors
FROM: Sally Vaughn, Ph.D. Deputy Superintendent/Chief Academic Officer
SUBJECT: Public Comment Period for Michigan’s Waiver Request for ESEA Flexibility
The Michigan Department of Education (MDE) will submit a request to the U.S. Department of Education (USED) for waivers of ten ESEA requirements established by the No Child Left Behind (NCLB) Act of 2001. These waivers will allow flexibility
regarding the 2013-2014 timeline for determining Adequate Yearly Progress (AYP), implementation of school and district improvement requirements, rural districts,
schoolwide programs, support for school improvement, reward schools, Highly Qualified Teacher (HQT) improvement plans, the transfer of certain federal funds, and use of School Improvement Grant (SIG) funds to support priority schools.
In order to apply for and receive the waivers, the MDE has developed a comprehensive request based on four principles: Career- and College-Ready Expectations for All Students; State-Developed Differentiated Recognition, Accountability, and Support; Supporting Effective Instruction and Leadership; and Reducing Duplication and
Unnecessary Burden.
Michigan’s Request for ESEA Flexibility is now available for review and public comment at www.michigan.gov/mde. Public comment will be open until February 9, 2012.
All comments should be submitted to [email protected].
cc: Michigan Education Alliance
STATE OF MICHIGAN
DEPARTMENT OF EDUCATION LANSING
Attachment 1.D
246
RICK SNYDER GOVERNOR
MICHAEL P. FLANAGAN STATE SUPERINTENDENT
March 5, 2015
MEMORANDUM
TO: Local and Intermediate School District Superintendents and Public School Academy Directors
FROM: Natasha Baker Deputy Superintendent of Education Services and
State School Reform Officer
Venessa A. Keesler, Ph.D. Deputy Superintendent, Accountability Services
SUBJECT: Public Comment Period for Michigan’s Renewal Request for ESEA
Flexibility
In July 2012, the U.S. Department of Education (USED) approved Michigan’s request for flexibility in implementing certain requirements of the Elementary
and Secondary Education Act (ESEA), also known as the No Child Left Behind Act of 2001 (NCLB).
This flexibility approval allows local school districts more freedom in how they use some federal dollars to improve student achievement and close achievement gaps; recognizes schools that are meeting or exceeding achievement goals;
ensures that all students have access to effective educators; and includes an accountability scorecard to measure student achievement and growth in schools and districts. Moreover, the approved ESEA flexibility alleviates the impending
consequences of the NCLB requirement that 100% of students demonstrate academic proficiency by 2014, replacing the mandate and subsequent
consequences with an appropriate timeline and targeted supports to meet student growth and proficiency goals.
The current approval expires at the end of the current (2014-2015) school year.
STATE OF MICHIGAN
DEPARTMENT OF EDUCATION LANSING
Attachment 1.E
247
Page 2 March 5, 2015
The USED has provided a process for states to apply for a renewal of ESEA
Flexibility to extend through the 2017-2018 school year. The requirements of the renewal process are outlined in the Renewal Form, which will be posted with a redlined version of Michigan’s current approved ESEA Flexibility Request at
http://www.michigan.gov/mde/0,4615,7-140-37818_60094---,00.html starting on Monday, March 9, 2015. The Renewal Form provides an overview and
reference to changes proposed in the redline document and is a useful tool to understand and respond to the proposed changes.
The Renewal Form and redlined Request will be available starting Monday,
March 9, 2015 for review and public comment through Monday, March 23, 2015 at 5:00 p.m.
All comments should be submitted to [email protected].
cc: Michigan Education Alliance
Attachment 1.E
248
ESEA Flexibility Request
Michigan Department of Education
Stakeholder Feedback Summary
During the period of development of the ESEA Flexibility Request (September 2011 – February 2012), the Michigan Department of Education (MDE) hosted or participated in numerous meetings, webinars, and conferences (see Attachment 2.B) to engage in conversation, solicit feedback, and answer questions from a diverse set of stakeholders statewide in order to develop, revise, and finalize the Request for submission to USED in February 2012. The summary below includes information on the feedback received, with key feedback from specific stakeholder groups as well as feedback received during the official Public Comment periods. MDE’s Request for ESEA Flexibility highlights how this feedback was used to inform, shape, and change the design of the various systems and programs addressed in the Request.
The Michigan Education Alliance
The Michigan Education Alliance (EdAlliance) is a group comprised of many of the state’s professional and education advocacy organizations, including
• American Federation of Teachers – Michigan • Association of Independent Colleges and Universities • Michigan Association of Intermediate School Administrators • Michigan Association of Nonpublic Schools • Michigan Association of Public School Academies • Michigan Association of School Administrators • Michigan Association of Secondary School Principals • Michigan Association of School Boards • Michigan Community Colleges Association • Michigan Education Association • Michigan Elementary and Middle School Principals Association • Michigan Parent Teacher Association • Michigan School Business Officers • Michigan State University K‐12 Outreach • Middle Cities • Presidents Council, State Universities of Michigan
The EdAlliance suggested more MDE dissemination of the Common Core State Standards at regional and statewide conferences and increased work with the higher education institutions to enhance focus on the standards, provide additional seat time waivers, and strengthen STEM initiatives. They emphasized encouraging all students to take Explore and Plan assessments and for MDE to find incentives for schools to make these tests a requirement. Due to the alignment of the proposed federal accountability system and the recommended state accreditation system, the Michigan Education Association (MEA) suggested that Michigan simply drop its current system in favor of the proposed one. There was general
Attachment 2.A
249

support for the methodology of identifying schools as priority, focus, or reward schools, with the suggestion that focus and priority schools be notified as early as possible in order for increased action planning time. MEA recommended additional positive recognitions for schools. The group reviewed the methodology for reporting annual yearly progress (AYP) and supported AYP reflecting rigorous annual measurable objectives (AMO) in assessments covering all content areas and the alignment of 2012‐2022 proficiency targets with Career and College Ready (CCR) cut scores. There was expressed concern regarding the AMO measure measures for subgroups and recommendation was made to provide differentiated targets, with Safe Harbor, for each subgroup.
The Committee of Practitioners
The Committee of Practitioners (COP), required by ESEA, is comprised of teachers, administrators, parents, members of school boards, private school representatives, adult and technical education representatives, as well as representatives of various groups representing specific subgroups, including English Language Learners and American Indian Tribes. The COP expressed general support for the consistency related to the use of the Top‐to‐Bottom methodology, student growth methodology, and teacher and leader evaluation/effectiveness methodology. Specific recommendations indicated that
• LEAs should be required to conduct assessments twice per year;
• Michigan should raise expectations from the current ACT state cut score;
• Assessments in common native languages be developed for math, science and social studies content areas; and
• MDE consider modifying accountability requirements for ELL students.
The committee expressed funding concerns in supporting priority and focus school interventions, recommending using a coordinated state, ISD, LEA, and school effort to allocate resources in a cohesive and focused way. There was some concern that the optional 21st Century program waiver could lead some LEAs to abuse the flexibility. Support was expressed for more emphasis to be placed on beating‐the‐odds schools and high growth schools in identifying “reward schools”. The group provided recommendations for recognizing such reward schools. Many supported the safe harbor methodology and generally liked the coordination of the teacher/leader effectiveness proposal with the state’s legislature. The committee expressed concern with teacher/administrator quality, both with teacher preparation and ongoing professional development.
The English Language Learner Advisory Council
The English Language Learner Advisory Council (ELLAC) is a group convened by the MDE, comprised of both MDE staff and external members. The ELLAC suggested that parents and the community have a strong role in the planning, monitoring and implementation for priority, focus, and all other schools. Concerns were raised about the methodology for subgroup gaps in assessment results, possibly masking the traditional subgroup performance and diverting attention to improving student performance.
Attachment 2.A
250
The Special Education Advisory Committee
The Special Education Advisory Committee (SEAC) is the advisory group required by federal IDEA law to advise the MDE and Michigan State Board of Education on matters relating to the education of students with disabilities. SEAC membership includes educators, service providers, advocates, and parents. SEAC expressed support for accountability based on the performance of all students – particularly focusing on the lowest performing 30% of students, believing this strategy to help remove the proverbial ‘target’ from students with disabilities as the source of not making AYP. They also supported the shift to a focus on achievement gaps and strategies to close the gaps. The committee suggested that the waiver should grant schools/districts increased flexibility in how they use at‐risk funds. Finally, the committee believes that ESEA flexibility will support transparency in public reporting of student achievement, with this approach serving to unmask many students who have been underperforming yet under‐served under No Child Left Behind.
The Bureau of Assessment and Accountability Advisory Council
The Bureau of Assessment and Accountability Advisory Council (BAC) identified the need to continue to refine the methodology for identifying Reward Schools. They also indicated that it will be important to continue to reevaluate the 85% achievement target over time, given the ongoing tension between “ambitious” and “attainable” and the implementation of new state assessments developed by the Smarter Balanced Assessment Consortium in 2015. Members advocated that it would strengthen the application as a whole to recognize and identify that there are issues around accountability that require more study and that we plan to conduct ongoing study to ensure that the proposed system produces the intended outcomes. The BAC also suggested that the MDE should develop interim educator evaluation guidelines while the work of the Governor’s Council is being conducted in order to support districts and schools in the interim.
Teachers
Teacher input and feedback was solicited and received through public comment, MEA and AFT‐Michigan comments (described above), webinar and survey, and a presentation to teachers at the annual MEA conference in February 2012.
Generally, teachers were supportive of the transition to the Common Core State Standards (CCSS). However, they express that more professional learning is needed to support good instruction in the CCSS at the classroom level.
Concern was expressed about the development of teacher evaluations through the Governor’s Council. Teachers frequently cited the importance of teacher input in the development of evaluation tools as well as the need for principals to be properly trained in using the new evaluations.
Feedback on the revised accountability system was mixed. Some teachers strongly support more rigorous cut scores, the redesigned AYP system, and the move to focus on Priority and Focus schools.
Attachment 2.A
251
Others feel that too many schools will be identified as “yellow” or “red” and that the consequences and interventions for Priority and Focus schools are too dire.
Parents
In addition to feedback solicited through the EdAlliance and Public Comment, the MDE worked with the Michigan PTA to convene a focus group of parents in Southeast Michigan to provide a forum for targeted discussion and feedback on the ESEA Flexibility Request.
Feedback from parents included
• The importance of focusing on the needs of every child, not just on groups of students and school and district performance;
• The need to emphasize supports for students with disabilities; and
• A preference for a 100% proficiency target for all students, rather than 85%.
Parents suggested that one intervention for Priority schools should focus on student behavior. They emphasized the importance of involving parents in a substantive way at the school and district levels in decision‐making. Parents also encouraged the sharing of best practices with Priority schools so that they have a model from which they can build their improvement plans.
Students
Student input and feedback was solicited through a webinar specifically targeted to students and a survey sent to members of both the Superintendent’s Student Advisory and an Alternative Education Student focus group and participants in the webinar.
Feedback from students indicated that
• Many students express that they would like more time to prepare for state assessments with suggestions for one‐on‐one work, tutoring, more hands‐on learning, and increased test preparation. One student would like more breaks on the longer sections of the test, stating that “I know I get bored with what I’m reading, and get lazy and guess sometimes, because I just can’t focus long enough to read all the material.”
• Some students do not feel their school is doing enough work to prepare them for careers and going to college. A few students further explained that there are no course offerings tailored to their specific interests.
• Many students state that their school is working to prepare them for careers and college. Some students are enrolled in online courses or alternative math and career‐based elective courses that they find important for college preparation. One student states that their school even has a
Attachment 2.A
252
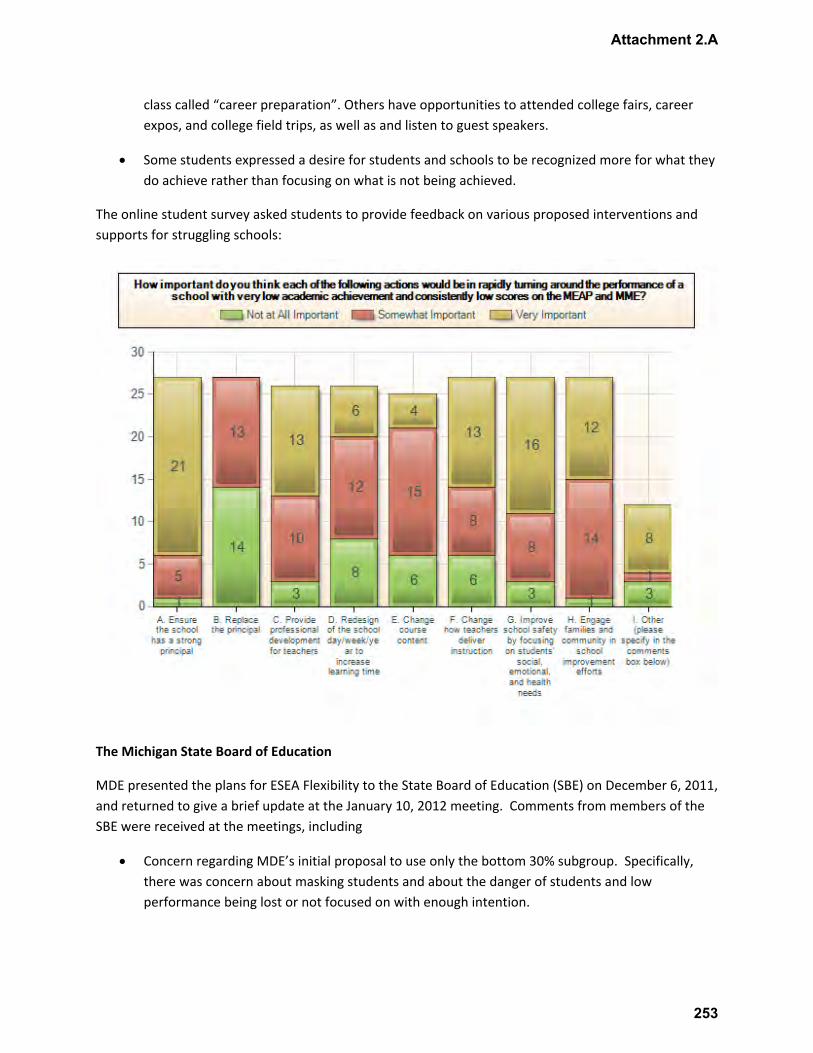
class called “career preparation”. Others have opportunities to attended college fairs, career expos, and college field trips, as well as and listen to guest speakers.
• Some students expressed a desire for students and schools to be recognized more for what they do achieve rather than focusing on what is not being achieved.
The online student survey asked students to provide feedback on various proposed interventions and supports for struggling schools:
The Michigan State Board of Education
MDE presented the plans for ESEA Flexibility to the State Board of Education (SBE) on December 6, 2011, and returned to give a brief update at the January 10, 2012 meeting. Comments from members of the SBE were received at the meetings, including
• Concern regarding MDE’s initial proposal to use only the bottom 30% subgroup. Specifically, there was concern about masking students and about the danger of students and low performance being lost or not focused on with enough intention.
Attachment 2.A
253
• Concern about the end target being set at 85% instead of 100% of students proficient on state assessments. SBE members were specifically concerned about this in the context of eliminating the nine original subgroups, and worried that the 15% who were not proficient would be those in disadvantaged groups.
The Superintendent of Public Instruction, Mike Flanagan, gave the Board a brief update in the January 2012 meeting. The Board was pleased with the progress of the application and specifically noted that it was a positive move to have all five subjects included and to retaining the nine traditional subgroups while adding the bottom 30% subgroup.
Governor Rick Snyder
Michigan’s Governor, Rick Snyder, submitted a letter of support for Michigan’s ESEA Flexibility Request to Secretary Arne Duncan (see Attachment 2.C).
PUBLIC COMMENT
Because Michigan originally intended to submit its ESEA Flexibility Request in November 2011, the MDE conducted two public comment periods – one in November 2011 and one in February 2012.
First Public Comment Period – November 2011
All but one of the 24 public comments addressed the optional 11th waiver allowing flexibility in the use of funds for 21st Century Learning Centers. The respondents advocated for the MDE to refrain from pursuing this optional 11th waiver. One comment stated that “the vagueness of the guidelines for the waiver would lead to a higher risk of fund being used inappropriately.” Many of the comments indicated that parents and students appreciate and benefit from the programs offered and do not wish them to be eliminated from lack of funds. Others expressed that this provision would not serve as a general funding solution as “syphoning money away from 21st CCLC programs is unsound and does not present any clear solution to the educational struggles Michigan is facing.”
The additional comment came from an administrator of a private parochial school. The respondent emphasized that any local allocation of Title I funds needs to ensure equitable services are offered to eligible private school students as well public school students.
Second Public Comment Period – February 2012
Thirty submissions were received via Public Comment in February 2012 from a diverse group of stakeholders including parents, teacher, principals, Institutions of Higher Education, professional organizations, advocacy groups, community‐based organizations, local education agencies, regional education service agencies, and members of the public. The majority of comments (79%) focused on Principle 2. Respondents were generally supportive of the Request for ESEA Flexibility, citing the
Attachment 2.A
254

benefits of higher expectations for students and schools as well as a clearer, more transparent, and fair system of accountability.
Comments indicated that
• There is a fundamental tension between “ambitious” and “attainable.” Some respondents insisted that 85% proficiency in ten years in not achievable, while others argued that nothing less than a 100% proficiency target is acceptable.
• Strong supports for Focus and Priority schools are essential, and the application would benefit from greater detail about these supports.
• Reward schools will be a good way to recognize achievement, which has been a mechanism lacking in the accountability system under the current iteration of ESEA.
• The Request for ESEA Flexibility supports and complements other education reform efforts currently in place in Michigan. As one respondent, a teacher and parent, indicated in the public comment submission,
"I am ecstatic about the aggressive position that the State of Michigan is taking to raise the rigor and expectations for academic achievement of all students. I am re‐energized by the recognition that higher academic standards and requirements of proficiency are needed at all levels in education. The proposed Flexibility Waivers will move us in the right direction toward closing gaps and improving the quality of public education."
Attachment 2.A
255
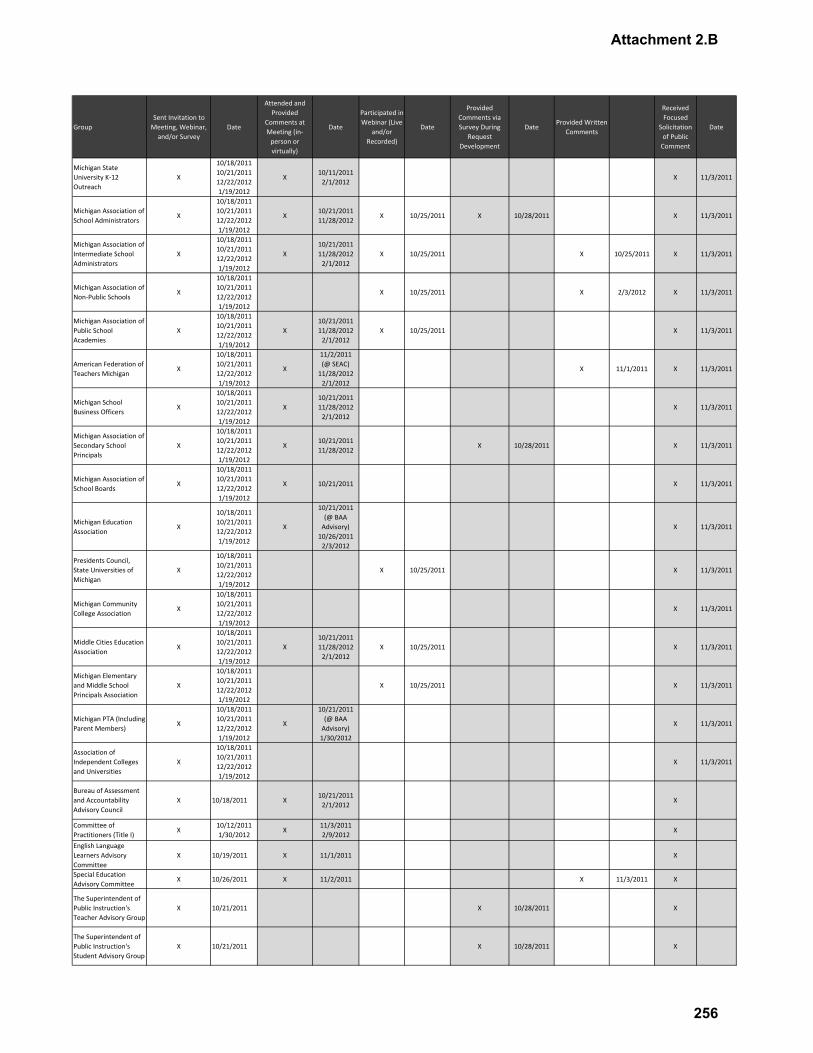
GroupSent Invitation to Meeting, Webinar, and/or Survey
Date
Attended and Provided
Comments at Meeting (in‐person or virtually)
Date
Participated in Webinar (Live
and/or Recorded)
Date
Provided Comments via Survey During
Request Development
DateProvided Written
Comments
Received Focused
Solicitation of Public Comment
Date
Michigan State University K‐12 Outreach
X
10/18/201110/21/201112/22/20121/19/2012
X10/11/20112/1/2012
X 11/3/2011
Michigan Association of School Administrators
X
10/18/201110/21/201112/22/20121/19/2012
X10/21/201111/28/2012
X 10/25/2011 X 10/28/2011 X 11/3/2011
Michigan Association of Intermediate School Administrators
X
10/18/201110/21/201112/22/20121/19/2012
X10/21/201111/28/20122/1/2012
X 10/25/2011 X 10/25/2011 X 11/3/2011
Michigan Association of Non‐Public Schools
X
10/18/201110/21/201112/22/20121/19/2012
X 10/25/2011 X 2/3/2012 X 11/3/2011
Michigan Association of Public School Academies
X
10/18/201110/21/201112/22/20121/19/2012
X10/21/201111/28/20122/1/2012
X 10/25/2011 X 11/3/2011
American Federation of Teachers Michigan
X
10/18/201110/21/201112/22/20121/19/2012
X
11/2/2011(@ SEAC)11/28/20122/1/2012
X 11/1/2011 X 11/3/2011
Michigan School Business Officers
X
10/18/201110/21/201112/22/20121/19/2012
X10/21/201111/28/20122/1/2012
X 11/3/2011
Michigan Association of Secondary School Principals
X
10/18/201110/21/201112/22/20121/19/2012
X10/21/201111/28/2012
X 10/28/2011 X 11/3/2011
Michigan Association of School Boards
X
10/18/201110/21/201112/22/20121/19/2012
X 10/21/2011 X 11/3/2011
Michigan Education Association
X
10/18/201110/21/201112/22/20121/19/2012
X
10/21/2011 (@ BAA Advisory)10/26/20112/3/2012
X 11/3/2011
Presidents Council, State Universities of Michigan
X
10/18/201110/21/201112/22/20121/19/2012
X 10/25/2011 X 11/3/2011
Michigan Community College Association
X
10/18/201110/21/201112/22/20121/19/2012
X 11/3/2011
Middle Cities Education Association
X
10/18/201110/21/201112/22/20121/19/2012
X10/21/201111/28/20122/1/2012
X 10/25/2011 X 11/3/2011
Michigan Elementary and Middle School Principals Association
X
10/18/201110/21/201112/22/20121/19/2012
X 10/25/2011 X 11/3/2011
Michigan PTA (Including Parent Members)
X
10/18/201110/21/201112/22/20121/19/2012
X
10/21/2011 (@ BAA Advisory)1/30/2012
X 11/3/2011
Association of Independent Colleges and Universities
X
10/18/201110/21/201112/22/20121/19/2012
X 11/3/2011
Bureau of Assessment and Accountability Advisory Council
X 10/18/2011 X10/21/20112/1/2012
X
Committee of Practitioners (Title I)
X10/12/20111/30/2012
X11/3/20112/9/2012
X
English Language Learners Advisory Committee
X 10/19/2011 X 11/1/2011 X
Special Education Advisory Committee
X 10/26/2011 X 11/2/2011 X 11/3/2011 X
The Superintendent of Public Instruction's Teacher Advisory Group
X 10/21/2011 X 10/28/2011 X
The Superintendent of Public Instruction's Student Advisory Group
X 10/21/2011 X 10/28/2011 X
Attachment 2.B
256
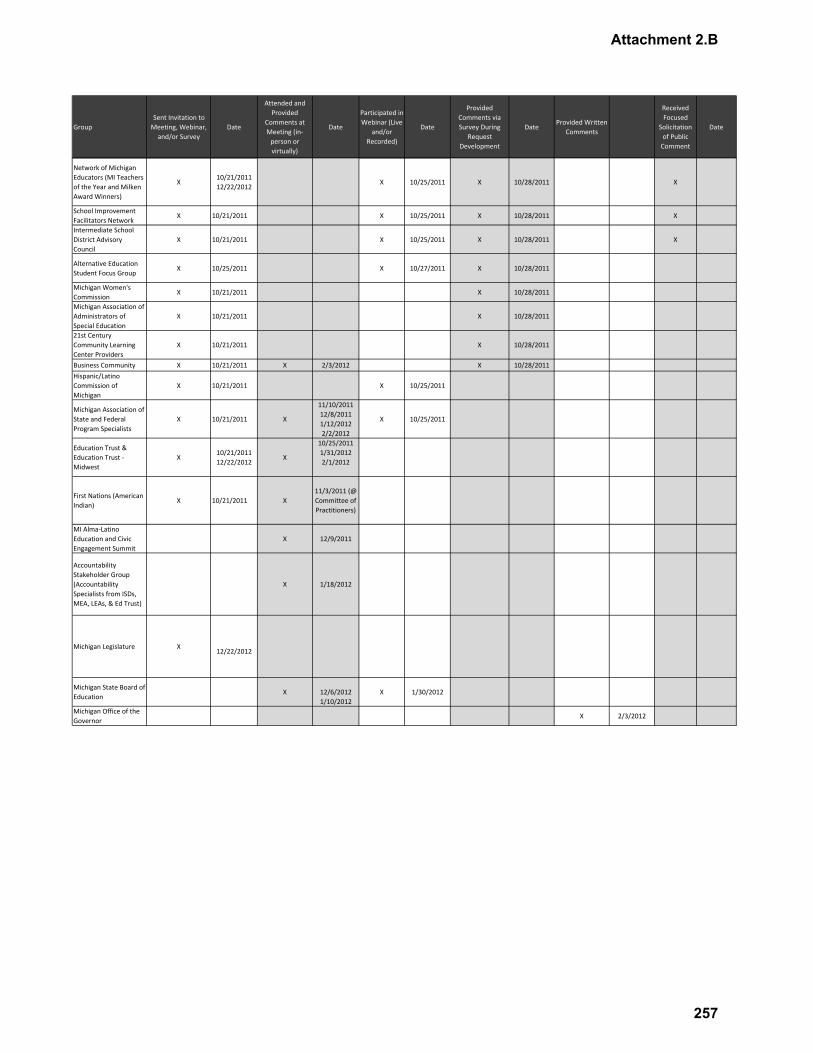
GroupSent Invitation to Meeting, Webinar, and/or Survey
Date
Attended and Provided
Comments at Meeting (in‐person or virtually)
Date
Participated in Webinar (Live
and/or Recorded)
Date
Provided Comments via Survey During
Request Development
DateProvided Written
Comments
Received Focused
Solicitation of Public Comment
Date
Network of Michigan Educators (MI Teachers of the Year and Milken Award Winners)
X10/21/201112/22/2012
X 10/25/2011 X 10/28/2011 X
School Improvement Facilitators Network
X 10/21/2011 X 10/25/2011 X 10/28/2011 X
Intermediate School District Advisory Council
X 10/21/2011 X 10/25/2011 X 10/28/2011 X
Alternative Education Student Focus Group
X 10/25/2011 X 10/27/2011 X 10/28/2011
Michigan Women's Commission
X 10/21/2011 X 10/28/2011
Michigan Association of Administrators of Special Education
X 10/21/2011 X 10/28/2011
21st Century Community Learning Center Providers
X 10/21/2011 X 10/28/2011
Business Community X 10/21/2011 X 2/3/2012 X 10/28/2011Hispanic/Latino Commission of Michigan
X 10/21/2011 X 10/25/2011
Michigan Association of State and Federal Program Specialists
X 10/21/2011 X
11/10/201112/8/20111/12/20122/2/2012
X 10/25/2011
Education Trust & Education Trust ‐ Midwest
X10/21/201112/22/2012
X
10/25/20111/31/20122/1/2012
First Nations (American Indian)
X 10/21/2011 X11/3/2011 (@ Committee of Practitioners)
MI Alma‐Latino Education and Civic Engagement Summit
X 12/9/2011
Accountability Stakeholder Group (Accountability Specialists from ISDs, MEA, LEAs, & Ed Trust)
X 1/18/2012
Michigan Legislature X12/22/2012
Michigan State Board of Education
X 12/6/20121/10/2012
X 1/30/2012
Michigan Office of the Governor
X 2/3/2012
Attachment 2.B
257
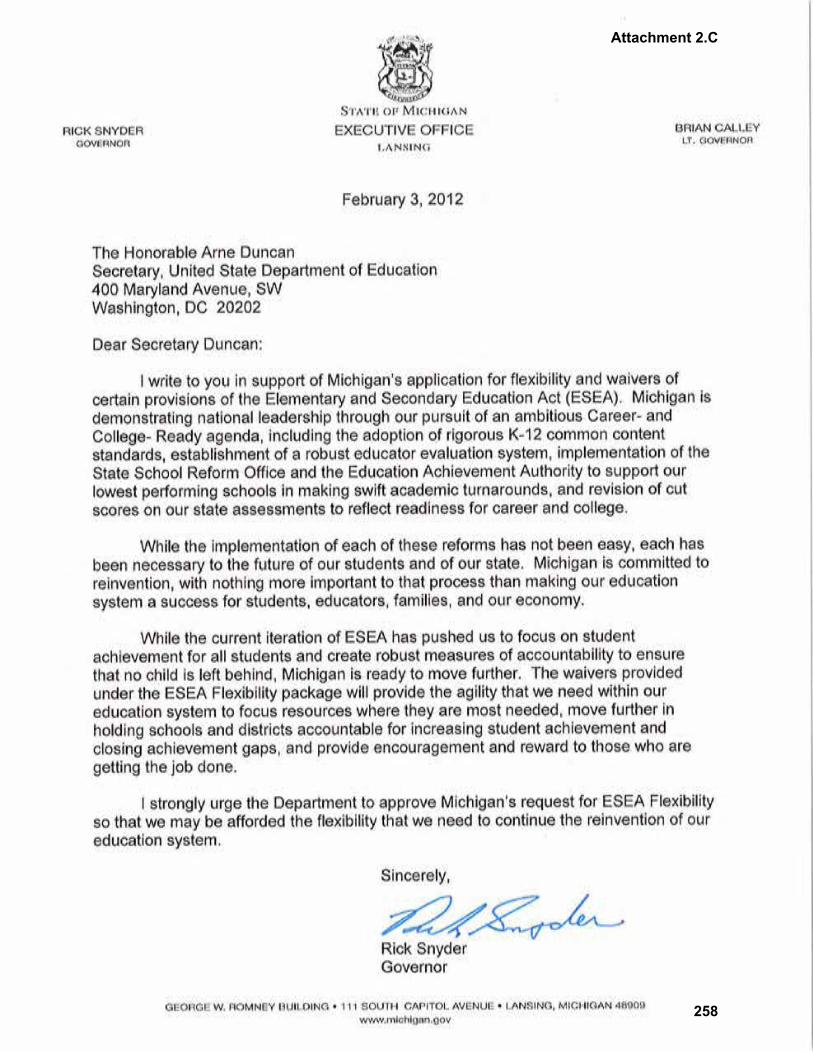
Attachment 2.C
258
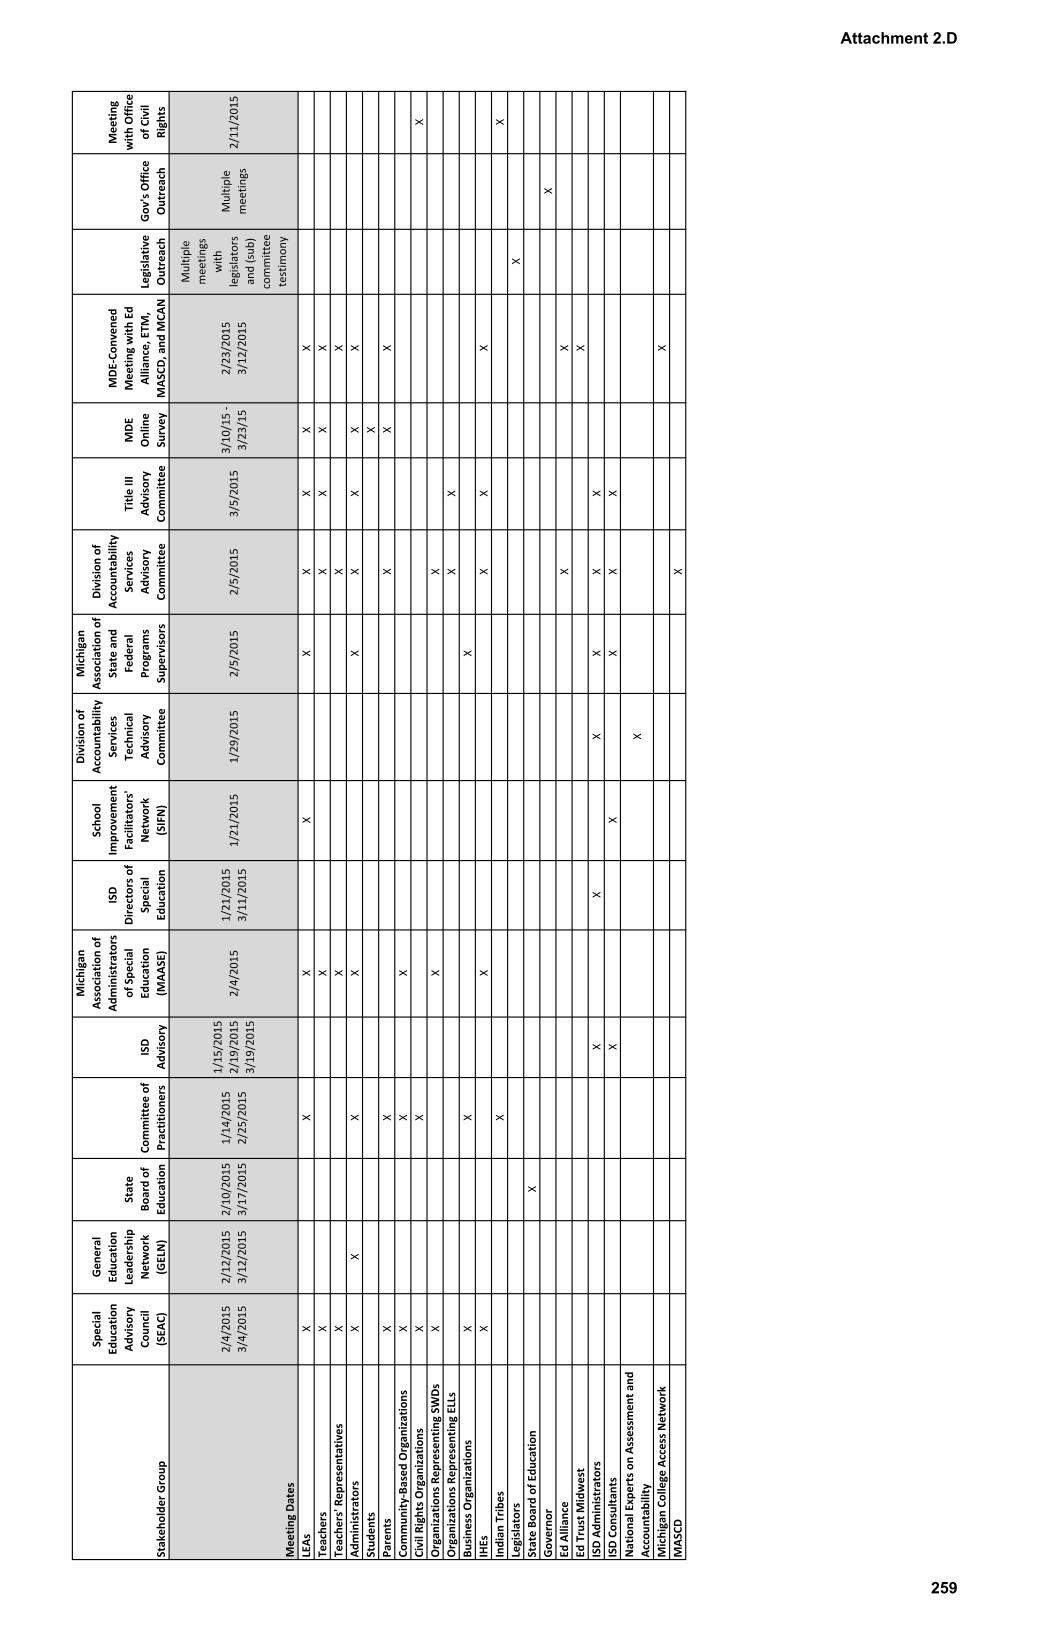
Sta
ke
ho
lde
r G
rou
p
Sp
eci
al
Ed
uca
tio
n
Ad
vis
ory
Co
un
cil
(SE
AC
)
Ge
ne
ral
Ed
uca
tio
n
Lea
de
rsh
ip
Ne
two
rk
(GE
LN)
Sta
te
Bo
ard
of
Ed
uca
tio
n
Co
mm
itte
e o
f
Pra
ctit
ion
ers
ISD
Ad
vis
ory
Mic
hig
an
Ass
oci
ati
on
of
Ad
min
istr
ato
rs
of
Sp
eci
al
Ed
uca
tio
n
(MA
AS
E)
ISD
Dir
ect
ors
of
Sp
eci
al
Ed
uca
tio
n
Sch
oo
l
Imp
rov
em
en
t
Fa
cili
tato
rs'
Ne
two
rk
(SIF
N)
Div
isio
n o
f
Acc
ou
nta
bil
ity
Se
rvic
es
Te
chn
ica
l
Ad
vis
ory
Co
mm
itte
e
Mic
hig
an
Ass
oci
ati
on
of
Sta
te a
nd
Fe
de
ral
Pro
gra
ms
Su
pe
rvis
ors
Div
isio
n o
f
Acc
ou
nta
bil
ity
Se
rvic
es
Ad
vis
ory
Co
mm
itte
e
Tit
le I
II
Ad
vis
ory
Co
mm
itte
e
MD
E
On
lin
e
Su
rve
y
MD
E-C
on
ve
ne
d
Me
eti
ng
wit
h E
d
All
ian
ce,
ET
M,
MA
SC
D,
an
d M
CA
N
Leg
isla
tiv
e
Ou
tre
ach
Go
v's
Off
ice
Ou
tre
ach
Me
eti
ng
wit
h O
ffic
e
of
Civ
il
Rig
hts
Me
eti
ng
Da
tes
2/4
/20
15
3/4
/20
15
2/1
2/2
01
5
3/1
2/2
01
5
2/1
0/2
01
5
3/1
7/2
01
5
1/1
4/2
01
5
2/2
5/2
01
5
1/1
5/2
01
5
2/1
9/2
01
5
3/1
9/2
01
5
2/4
/20
15
1/2
1/2
01
5
3/1
1/2
01
51
/21
/20
15
1/2
9/2
01
52
/5/2
01
52
/5/2
01
53
/5/2
01
53
/10
/15
-
3/2
3/1
5
2/2
3/2
01
5
3/1
2/2
01
5
Mu
ltip
le
me
eti
ng
s
wit
h
leg
isla
tors
an
d (
sub
)
com
mit
tee
test
imo
ny
Mu
ltip
le
me
eti
ng
s2
/11
/20
15
LEA
sX
XX
XX
XX
XX
Te
ach
ers
XX
XX
XX
Te
ach
ers
' R
ep
rese
nta
tiv
es
XX
XX
Ad
min
istr
ato
rsX
XX
XX
XX
XX
Stu
de
nts
X
Pa
ren
tsX
XX
XX
Co
mm
un
ity
-Ba
sed
Org
an
iza
tio
ns
XX
X
Civ
il R
igh
ts O
rga
niz
ati
on
sX
XX
Org
an
iza
tio
ns
Re
pre
sen
tin
g S
WD
sX
XX
Org
an
iza
tio
ns
Re
pre
sen
tin
g E
LLs
XX
Bu
sin
ess
Org
an
iza
tio
ns
XX
X
IHE
sX
XX
XX
Ind
ian
Tri
be
sX
X
Leg
isla
tors
X
Sta
te B
oa
rd o
f E
du
cati
on
X
Go
ve
rno
rX
Ed
All
ian
ceX
X
Ed
Tru
st M
idw
est
X
ISD
Ad
min
istr
ato
rsX
XX
XX
X
ISD
Co
nsu
lta
nts
XX
XX
X
Na
tio
na
l E
xp
ert
s o
n A
sse
ssm
en
t a
nd
Acc
ou
nta
bil
ity
X
Mic
hig
an
Co
lle
ge
Acc
ess
Ne
two
rkX
MA
SC
DX
Attachment 2.D
259

1
ESEAFlexibility
From: Mr. Theo A. Kerhoulas <>
Sent: Wednesday, March 11, 2015 8:16 AM
To: ESEAFlexibility
Subject: Stop Extension of Priority Status
Port Huron Schools are excelling. Our students, staff, and community are focused and seeing positive results. We have
welcomed MDE support regarding our "Priority and Focus" schools and embraced this process at every level. Recently
the wind has been stolen from our sails with the possibility that schools "on the list" will remain on the list for another
3 years due to metric technicalities.
I caution MDE to remember the lens of our children and communities. It is incredibly difficult for our students and
their families to attend a "listed" school. Like it or not, a priority school's identity changes when on the list. Knowing
that after four years a school can become "normal" again makes this somewhat tolerable. By no means am I saying that
the school stops the interventions and systems that were put in place ... that work certainly continues. I am focused on
allowing our students and families to be proud of their school again by returning the school's identity as planned. Port
Huron has a priority school scheduled to come off the list this year ... not allowing for this will in many ways negate the
work done and cripple that school's culture for another three years.
I encourage you to allow Central Middle School (and others) to come off the list as planned. Let the students, staff, and
community celebrate their journey, validate their work, and remove their scarlet letter.
Mr. Theo A. Kerhoulas
Executive Director, Port Huron Schools
Attachment 2.E
260

1
ESEAFlexibility
From: Beth Carr <>
Sent: Friday, March 13, 2015 1:24 PM
To: ESEAFlexibility
Subject: Inaccurate representation of the MCEE Report
Attachments: MCEE Final Report 2013 Executive Summary.pdf
Good afternoon,
In reviewing the ESEA Flexibility Request Draft, I see an inaccurate representation of the MCEE Final Report on Page
294. As is currently posted on the MDE website the final draft recommendation of the MCEE Report Executive
Summary includes the evaluation systems Page 1 of the Executive Summary and throughout the report the Marzano
Teacher Evaluation Model. There is NO reference to the “The Marzano Observation Protocol (Marzano Research
Laboratory)” as identified on page 294 of the ESEA Flexibility Request Draft. Additionally the ESEA Flexibility Request
Draft includes on Page 294 two models that were NOT approved by MCEE in their Final Report posted on the MDE
website.
Further, no districts in Michigan use the Marzano Observation Protocol for teacher evaluation. They use the Marzano
Teacher Evaluation Model (Learning Sciences Marzano Center). http://michigan.gov/mde/0,4615,7-140-22709_57992-
--,00.html
If you replace the MCEE Interim Report with the MCEE Final Report or add the MCEE Final Report or add some
additional reference to the 4 models approved you will prevent MDE from adding confusion and inadvertently
appearing to approve evaluation models that districts are not using and that were not approved by MCEE. All of MI has
invested enormous time in the process of selecting one of the 4 approved models as identified in the MCEE Final
Report (Charlotte Danielson’s Framework for Teaching, Marzano Teacher Evaluation Model, The Thoughtful Classroom, or 5 Dimensions of Teaching and Learning). http://www.mcede.org/
I worked with MCEE and the university through the pilot and have supported districts across Michigan for many years
with their educator evaluation systems. It is very confusing when these types of errors occur and waste precious
resources districts cannot afford to lose.
Thank you for hearing our concern. Please let me know if you are able to make this update.
Beth Carr Director of District Partnerships
powered by iObservation
Learning Sciences International www.LearningSciences.com
www.marzanoconference.com
"Join us for a Journey to Rigor! Registration is open for Marzano Building Expertise
Conference, June 17-19, 2015.”
Attachment 2.E
261
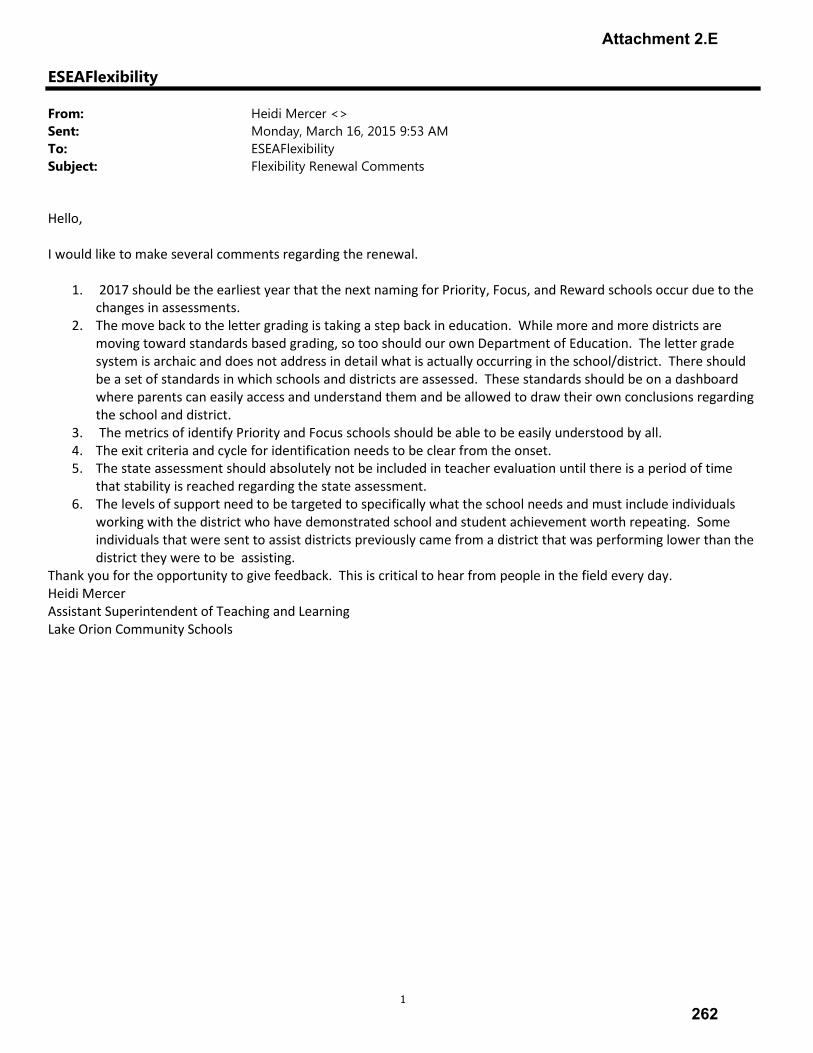
1
ESEAFlexibility
From: Heidi Mercer <>
Sent: Monday, March 16, 2015 9:53 AM
To: ESEAFlexibility
Subject: Flexibility Renewal Comments
Hello,
I would like to make several comments regarding the renewal.
1. 2017 should be the earliest year that the next naming for Priority, Focus, and Reward schools occur due to the
changes in assessments.
2. The move back to the letter grading is taking a step back in education. While more and more districts are
moving toward standards based grading, so too should our own Department of Education. The letter grade
system is archaic and does not address in detail what is actually occurring in the school/district. There should
be a set of standards in which schools and districts are assessed. These standards should be on a dashboard
where parents can easily access and understand them and be allowed to draw their own conclusions regarding
the school and district.
3. The metrics of identify Priority and Focus schools should be able to be easily understood by all.
4. The exit criteria and cycle for identification needs to be clear from the onset.
5. The state assessment should absolutely not be included in teacher evaluation until there is a period of time
that stability is reached regarding the state assessment.
6. The levels of support need to be targeted to specifically what the school needs and must include individuals
working with the district who have demonstrated school and student achievement worth repeating. Some
individuals that were sent to assist districts previously came from a district that was performing lower than the
district they were to be assisting.
Thank you for the opportunity to give feedback. This is critical to hear from people in the field every day.
Heidi Mercer
Assistant Superintendent of Teaching and Learning
Lake Orion Community Schools
Attachment 2.E
262
1
ESEAFlexibility
From: Mark Fuhrman <>
Sent: Monday, March 16, 2015 10:55 AM
To: ESEAFlexibility
Subject: ESEA Flexibility Waiver Comments
To whom it may concern: I am writing to comment on the ESEA Flexibility Waiver for the spring of 2015. I am especially concerned about the exit criteria of Focus and Priority schools. As it is written, the Pinconning Area Schools is in favor of the current criteria to exit the Focus and Priority Schools, especially the Priority School status as follows: 2.D.v Provide the criteria the SEA will use to determine when a school that is making significant progress in improving student achievement exits priority status and a justification for the criteria selected. In order to exit Priority designation a school must meet all of the following requirements: · 1. Top-to-Bottom Requirement: A school must have Top-to-Bottom Percentile Rank of 5 or higher in the most recent year for Exit consideration. · 2. Scorecard Requirement: A school must meet its Annual Measurable Objective for both subject areas of mathematics and English language arts in the All Students subgroup. · 3. Assessment Participation Requirement – The school must have a 95% participation rate on all required state assessments or have otherwise demonstrated satisfactory participation according their Accountability Scorecard. While the Top-to-Bottom list in itself is used to identify schools as Priority (schools with percentile ranks of 0 - 4), the purpose of this exit criteria is to provide a more holistic approach for exiting schools to ensure that they are on track to meeting proficiency goals for all students and keeping them from falling back into Priority school status. If you should have any further questions, you can contact us at 989-308-0504. Thank you Mark Fuhrman, Assistant Superintendent Pinconning Area Schools -- "If we are to obtain results never before achieved, we must expect to employ methods never before attempted.” Sir Francis Bacon Pinconning Area Schools Mission Statement: To provide students with the knowledge, skills, and confidence to be successful.
Access the Pinconning Area Schools Curriculum, Testing and Grant Page by using this QR Code:Right-click here to download pictures. To help protect your privacy, Outlo ok prevented
auto matic download of this pictu re from the In ternet.
This email and any attached files are confidential and intended solely for the intended recipient(s). If you are not the named recipient you should not read, distribute, copy or alter this email. Any views or opinions expressed in this email are those of the author and do not represent those of Pinconning Area Schools. Warning: Although precautions have been taken to make sure no viruses are present in this email, Pinconning Area Schools cannot accept responsibility for any loss or damage that arise from the use of this email or attachments.
Attachment 2.E
263

1
ESEAFlexibility
From: Jason Frink <>
Sent: Monday, March 16, 2015 12:36 PM
To: ESEAFlexibility
Subject: Proposed Changes
As a high school assistant principal, I support the ESEA changes proposed by the Michigan Department of Education. These changes will allow more accurate accountability. It is critical to have multi-year data from the same measurement tool in order to demonstrate trending rather than anomalies or the impact of testing mechanics. Thank you,
Jason Frink
Assistant Principal
Portage Central High School
We…. Work • Learn • Lead • Teach • Care • Commit • Excel
We are diverse. We are one community. We are MUSTANGS.
Attachment 2.E
264

1
ESEAFlexibility
From: Lena Montgomery <>
Sent: Wednesday, March 18, 2015 11:29 AM
To: ESEAFlexibility
Subject: Public comment
Dear Public Comment Reader:
Comments follow:
How will MDE ensure the achievement gap for English learners will be closed? Please ensure that the Flex Waiver mentions how MDE will increase state funding for English learners since Title III amounts to $95 per student.
How will priority and focus school staff be trained on L2? It is critical that priority and focus school staff participate in professional learning opportunities addressing best practices for English learners.
How might we ensure all teachers of ELs participate in L2 Professional Development?
What activities might help us coordinate and leverage state and federal funds to support Els across Wayne County?
Please strongly encourage and request waiving any testing of Els who have been in the US for less than 2-3 years. Currently newly arrived ELs are forced to take a state assessment they do not understand. We would like MDE to consider requesting a waiver from US department of ED to exempt ELs from such assessments for at least 2-3 years.
In closing, ELs are making progress due to the initial support systems implemented. We want to make sure the Flex Waiver reinforces the need to coordinate all state and federal funds to support English learners.
LenaLenaLenaLena Lena Harutunian Montgomery Manager Early Intervention & English Learner (EL) Services Wayne RESA 33500 Van Born Rd. Wayne, MI 48184
Attachment 2.E
265

1
ESEAFlexibility
From: Kristina Harmon <>
Sent: Wednesday, March 18, 2015 11:55 AM
To: ESEAFlexibility
Subject: Public Comment Regarding English Language Learners
I am writing as an educator in a school district that services our English Language Learners. Our district values the data we receive from our state assessments, however I strongly encourage thought be given to requesting a waiver for any testing for our English Language Learners who have been in the U.S. for less than 2-3 years. Our new arrivals are forced to take a state assessment they do not understand. Please consider a delay in testing for these students until they have had a chance to gain skills as English Language Learners. Our English Language Learners are making progress due to our support systems we have in place. We are able to provide these supports with thoughtful coordination of local, state, and federal funds, please be sure the FLEX Waiver mentions how MDE will increase the state funding for English Language Learners to $95.00 per student. MDE cannot be expected to close the achievement gap for these students without continued federal funds such asTitle III funding in addition to state and local funds. It is important to consider providing professional development for teachers in all schools with English Language Learners to address best practices in teaching these students effectively to maintain the progress we are currently experiencing. Title II funding can ba allocated for this purpose and we need to continue that funding source as well. I appreciate the opportunity to provide in put on behalf of these students who come to us for a variety of reasons and ability levels. Our experience has been positive in supporting their efforts to learn to read, write and speak English and learn core content. It is not an easy task and continued financing staff training and student language development support from trained staff is key for the success of this effort. Dr.Kristina Harmon Assistant Superintendent Curriculum/Instruction South Redford School District 26141 Schoolcraft Redford, MI 48239
Attachment 2.E
266
1
ESEAFlexibility
From: Bob Kefgen <>
Sent: Wednesday, March 18, 2015 4:41 PM
To: ESEAFlexibility
Cc: Wendy Zdeb; Chelsey Martinez
Subject: MASSP Feedback on ESEA Flexibility Waiver Renewal Request
Attachments: MASSP Flex Waiver Feedback.pdf
Please see the attached document, which is the Michigan Association of Secondary School Principals’ feedback on
MDE’s proposed ESEA Flexibility Waiver renewal request.
If you have any questions or concerns, please do not hesitate to contact us further.
Sincerely,
Bob Kefgen
Assistant Director for Government Relations Michigan Association of Secondary School Principals
1001 Centennial Way, Suite 100
Lansing, MI 48917
Attachment 2.E
267
March 18, 2015 To Whom It May Concern: We are writing today to provide feedback on Michigan's proposed ESEA Flexibility Waiver renewal request. On behalf of our 1,800 secondary school principal members from across the state who are often not in a position to advocate on their own behalf, but who are nevertheless directly affected by these proposed changes, we want to thank you for this opportunity. MASSP offers the following:
• MASSP supports MDE's proposal to differentiate between accountability systems (Top-to-Bottom list, Priority and Focus Schools) for low performing schools and a separate school dashboard that would provide relevant information about all schools to students and parents.
• Given the differentiation between accountability and transparency proposed by MDE, MASSP
believes that both the current color-based system and the A-F letter grade system proposed by some legislators fall short of providing an accurate measure of school performance. Instead, we would support the use of descriptive labels, similar to those used in other states.
• MASSP supports MDE's proposal to transition to a three-year identification cycle for Priority and
Focus schools.
• The removal of the current gap measure for identifying Priority Schools combined with the weight placed on proficiency could significantly disadvantage schools (especially secondary schools) that are driving student improvement, but whose students are behind grade level. To correct this, MASSP would urge that more weight be place on growth (75%) than proficiency (25%).
• MASSP supports the move to differentiate the weighting of different subjects based on the number
of student scores in those subjects, but believes that this does not go far enough. We would urge MDE to eliminate the use of science and social studies scores in determining Priority School status and focus exclusively on ELA and math scores, consistent with what is being recommended for the Focus School metric.
Attachment 2.E
268
• MDE's proposal to transition to aggregate Student Growth Percentiles for calculating building level growth raises concerns for secondary principals in that SGPs are untested in Michigan and it will be at least two years before the state has sufficient assessment data to run preliminary calculations. While we do not have specific objections to the SGP methodology proposed, MASSP has concerns about locking the state into using an untested growth modeling tool without first subjecting this theoretical process to a practical test using actual data.
• MASSP supports the proposed modification of only using ELA and mathematics scores for
identifying Focus Schools.
• MASSP supports the inclusion of clearly defined exit criteria for both Priority and Focus schools.
• While we are encouraged that MDE intends to use the proposed criteria to exit schools from the 2010 and 2011 Priority School cohorts by the end of the 2014-15 school year, we would expect that the same opportunity be extended to schools in the 2012, 2013, and 2014 cohorts as soon as evidence of two consecutive years of AMO progress is available.
• MASSP believes the proposal to retain the 2012-2014 Focus School cohorts until 2017 with no
possibility of exiting should be reconsidered. Schools showing progress toward gap closure, improved graduation rates, or whose students are above state proficiency/growth averages and can demonstrate that progress should not be held over for want of a state assessment.
• MASSP supports the MDE proposal to delay the use of state assessment data for teacher and
administrator accountability purposes until two years of data under the same assessment system are available.
• We also believe the focus on Student Learning Objectives (SLOs) as an alternative student growth
measure is important and support MDE's efforts to expand the use of SLOs for growth measurement purposes.
Thank you again for the opportunity to provide feedback. If you have any questions, please do not hesitate to contact us further. Sincerely,
Wendy Zdeb-Roper Executive Director
Attachment 2.E
269

1
ESEAFlexibility
From: Doug Greer <>
Sent: Wednesday, March 18, 2015 4:50 PM
To: ESEAFlexibility
Cc: 'Doug Greer'
Subject: Feedback for Flex Waiver 2015
On March 17, Chris Janzer facilitated a great session at the School Improvement Conference. He presented an overview of the proposal in the ESEA Flex Waiver, specific to Principal 2. One of the suggestions that was warmly received from the audience was the labels for schools. Currently we have five colors and essentially three labels from the Federal government (Reward, Priority and Focus). Of course, most schools do not have a label, only a color and ranking. Please re-consider the use of letter grades that is currently proposed, as this seems to have a negative connotation. Instead, consider the labels the legislation has already approved for teachers who are responsible for a collection of students. It would only make sense to use the same labels for schools who are responsible for a larger collection of students. For example:
• Highly Effective (Reward schools and top 20% of schools, no “Red” schools) • Effective (Top to Bottom rank between 20th and 80th percentile, no Priority, no Focus, no “Red”
schools) • Minimally Effective (Bottom 20%, Focus Schools, Red Schools, no Priority) • Ineffective (Bottom 5%, Priority Schools)
I believe consistency would be well received across educators and the community. This suggestion was among others that were formulated into a document from the General Ed Leadership Network, a link to the document also listed below. Sincerely, Doug Greer Sch. Imp./Inst. Data Ottawa Area ISD
“Is what we’re doing in education working to improve teaching and learning; and how do we know?” (Essential Question) On Thu, Jan 22, 2015 at 9:56 PM, Doug Greer <[email protected]> wrote:
The General Education Leadership Network was asked by the Michigan Department of Education to provide ideas and recommendations for the renewal of the ESEA Flexibility Waiver. Our hope is that you will find some or all of these considerations useful when providing feedback to MDE. Through an input process at our January 8th meeting, followed up by work from a small GELN task-force, a number of considerations were developed: Key Points of Consideration for Michigan's New Flex Waiver with the U.S. Federal Government
Attachment 2.E
270
1
ESEAFlexibility
From: Jill Chochol <>
Sent: Wednesday, March 18, 2015 9:04 PM
To: ESEAFlexibility
Subject: Flexibility with testing of ELs
I am writing to advocate and support the delay of assessment of English Language learners on high stakes state testing
until ELs have been in the US for at least 3 years. The research on second language acquisition is clear: it takes 5-7
years for an EL to acquire the language and academic vocabulary to successfully compete with their same age peers.
Language assessments (WIDA) should be completed annually and growth required for every student until they exit.
Jill Chochol, Ph.D.
Executive Director Elementary
Dearborn Public Schools
18700 Audette
Dearborn, MI 48124
Attachment 2.E
271

1
ESEAFlexibility
From: David Griesing <>
Sent: Thursday, March 19, 2015 7:10 AM
To: ESEAFlexibility
Subject: Vassar High School Science Department
I have a son Jacob Griesing enrolled in Vassar High School. He has been an all A student for the last 3 ½ years. He
transferred from Grand Ledge School System this year. (Excellent School) He still is getting all A’s but he states it is a
struggle in Biology because the teachers don’t teach effectively. What is taught in class is not the same thing that Is on
their tests. The three teachers get together and create the test together. Jacob is extremely intelligent and is struggling
to get an A. What can be done to fix this. I am hearing the same things about the Chemistry class also. Please let me
know what can be done. Jacob’s goal is to complete High School with a 4.0 GPA and it may be tough in this school
system.
Thanks
David Griesing LDT Central Engineering Spare Parts Coordinator
�
Nothing in this message is intended to constitute an electronic signature unless a specific statement to the contrary is included in this message. Confidentiality Note: This message is intended only for the person or entity to which it is addressed. It may contain confidential and/or privileged material. Any review, transmission, dissemination or other use, or taking of any action in reliance upon this message by persons or entities other than the intended recipient is prohibited and may be unlawful. If you received this message in error, please contact the sender and delete it from your computer.
Attachment 2.E
272
1
ESEAFlexibility
From: Brian Gutman <>
Sent: Thursday, March 19, 2015 10:08 AM
To: ESEAFlexibility
Subject: Comment by The Education Trust-Midwest on Michigan's ESEA Flexibility Renewal
Request
Attachments: The Education Trust-Midwest ESEA Flexibility Waiver Public Comment_March 19
2015.pdf
To Whom It May Concern:
Please find a public comment from The Education Trust-Midwest on Michigan’s ESEA Flexibility Renewal Request
attached to this email.
Any additional questions regarding this comment should be directed to:
Sunil Joy, Data & Policy Analyst
The Education Trust-Midwest
Thank you for your consideration,
Brian Gutman
--
Brian R. Gutman
Director of Public Engagement
The Education Trust - Midwest
www.edtrustmidwest.org
306 South Washington Ave., Suite 400
Royal Oak, Michigan 48067
Connect with us on Facebook
Follow us on Twitter
Attachment 2.E
273
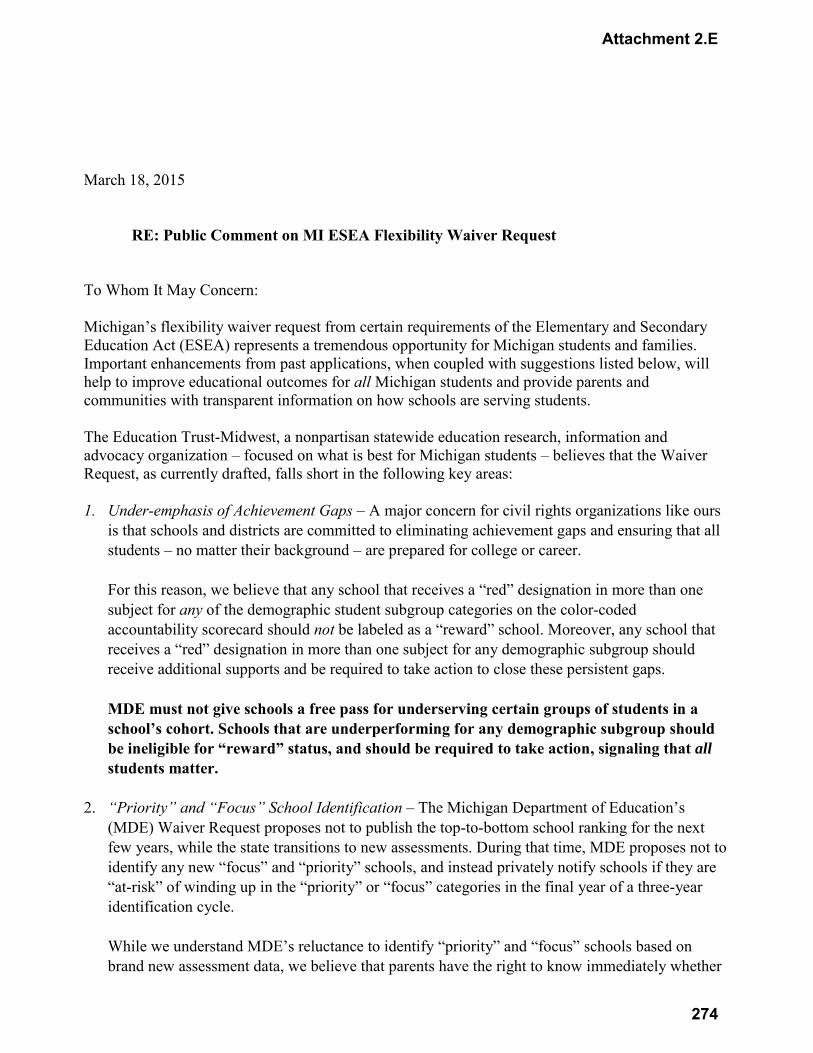
March 18, 2015 RE: Public Comment on MI ESEA Flexibility Waiver Request To Whom It May Concern: Michigan’s flexibility waiver request from certain requirements of the Elementary and Secondary Education Act (ESEA) represents a tremendous opportunity for Michigan students and families. Important enhancements from past applications, when coupled with suggestions listed below, will help to improve educational outcomes for all Michigan students and provide parents and communities with transparent information on how schools are serving students. The Education Trust-Midwest, a nonpartisan statewide education research, information and advocacy organization – focused on what is best for Michigan students – believes that the Waiver Request, as currently drafted, falls short in the following key areas: 1. Under-emphasis of Achievement Gaps – A major concern for civil rights organizations like ours
is that schools and districts are committed to eliminating achievement gaps and ensuring that all students – no matter their background – are prepared for college or career. For this reason, we believe that any school that receives a “red” designation in more than one subject for any of the demographic student subgroup categories on the color-coded accountability scorecard should not be labeled as a “reward” school. Moreover, any school that receives a “red” designation in more than one subject for any demographic subgroup should receive additional supports and be required to take action to close these persistent gaps. MDE must not give schools a free pass for underserving certain groups of students in a school’s cohort. Schools that are underperforming for any demographic subgroup should be ineligible for “reward” status, and should be required to take action, signaling that all students matter.
2. “Priority” and “Focus” School Identification – The Michigan Department of Education’s
(MDE) Waiver Request proposes not to publish the top-to-bottom school ranking for the next few years, while the state transitions to new assessments. During that time, MDE proposes not to identify any new “focus” and “priority” schools, and instead privately notify schools if they are “at-risk” of winding up in the “priority” or “focus” categories in the final year of a three-year identification cycle. While we understand MDE’s reluctance to identify “priority” and “focus” schools based on brand new assessment data, we believe that parents have the right to know immediately whether
Attachment 2.E
274
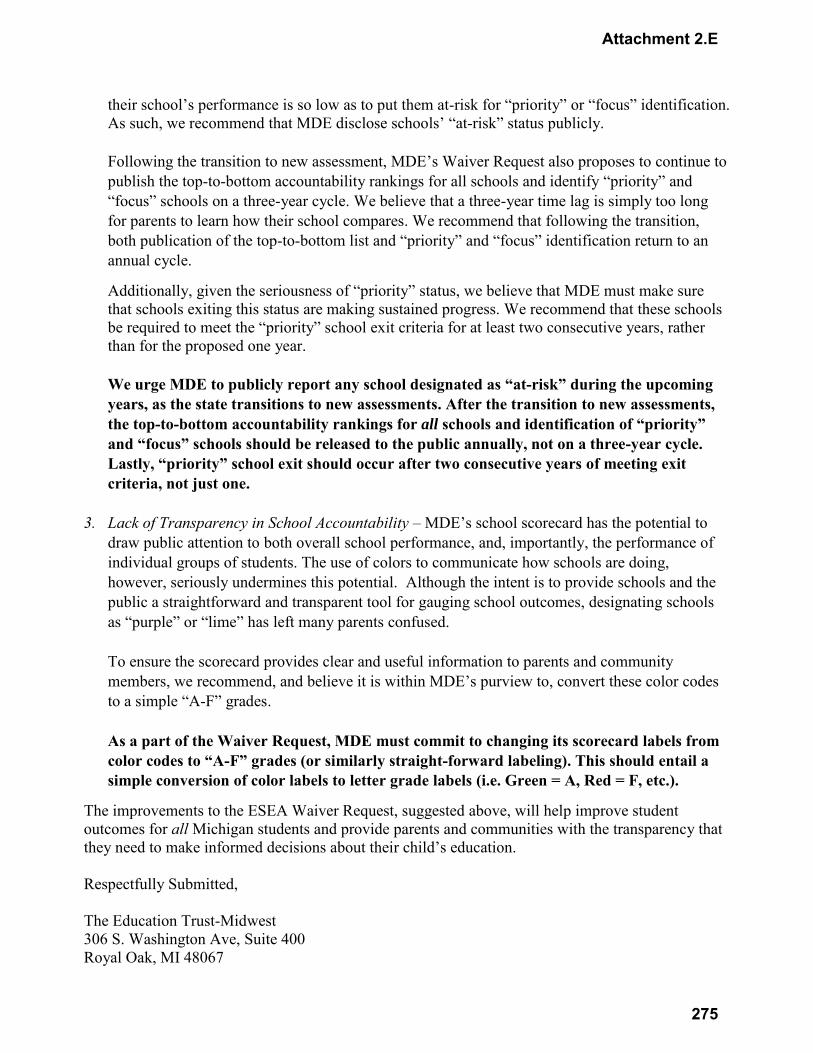
their school’s performance is so low as to put them at-risk for “priority” or “focus” identification. As such, we recommend that MDE disclose schools’ “at-risk” status publicly. Following the transition to new assessment, MDE’s Waiver Request also proposes to continue to publish the top-to-bottom accountability rankings for all schools and identify “priority” and “focus” schools on a three-year cycle. We believe that a three-year time lag is simply too long for parents to learn how their school compares. We recommend that following the transition, both publication of the top-to-bottom list and “priority” and “focus” identification return to an annual cycle.
Additionally, given the seriousness of “priority” status, we believe that MDE must make sure that schools exiting this status are making sustained progress. We recommend that these schools be required to meet the “priority” school exit criteria for at least two consecutive years, rather than for the proposed one year.
We urge MDE to publicly report any school designated as “at-risk” during the upcoming years, as the state transitions to new assessments. After the transition to new assessments, the top-to-bottom accountability rankings for all schools and identification of “priority” and “focus” schools should be released to the public annually, not on a three-year cycle. Lastly, “priority” school exit should occur after two consecutive years of meeting exit criteria, not just one.
3. Lack of Transparency in School Accountability – MDE’s school scorecard has the potential to draw public attention to both overall school performance, and, importantly, the performance of individual groups of students. The use of colors to communicate how schools are doing, however, seriously undermines this potential. Although the intent is to provide schools and the public a straightforward and transparent tool for gauging school outcomes, designating schools as “purple” or “lime” has left many parents confused. To ensure the scorecard provides clear and useful information to parents and community members, we recommend, and believe it is within MDE’s purview to, convert these color codes to a simple “A-F” grades. As a part of the Waiver Request, MDE must commit to changing its scorecard labels from color codes to “A-F” grades (or similarly straight-forward labeling). This should entail a simple conversion of color labels to letter grade labels (i.e. Green = A, Red = F, etc.).
The improvements to the ESEA Waiver Request, suggested above, will help improve student outcomes for all Michigan students and provide parents and communities with the transparency that they need to make informed decisions about their child’s education. Respectfully Submitted, The Education Trust-Midwest 306 S. Washington Ave, Suite 400 Royal Oak, MI 48067
Attachment 2.E
275
1
ESEAFlexibility
From: Nate Beelen <>
Sent: Friday, March 20, 2015 12:04 PM
To: ESEAFlexibility
Subject: Public Comment
As a member of the general public and also an employee of MDE-OFS I am concerned with a few provisions in the waiver request. First, the title reward school for all types of schools is misleading. Although we do separate out beating the odds, from high achieving the general group name is what tends to stick in public perception. It would be better to use separate designations that more accurately reflect why each school is being recognized so that the public clearly understands that even though they may be getting recognized, they still have much work to do. I am also concerned about the plan to possibly suppress school level data as we transition to a new assessment. The data is what it is and should be shared. Even though outside accountability in terms of focus or priority school status may not be assigned, the public still has a right to know how their school did compared to others. So long as we are all being measured with the same tool thee is no value to suppressing the resulting data. As an employee at OFS who works directly with schools in approving how they utilize federal funds. I am also concerned about the narrow role we have been assigned on the support teams to assist identified schools. It seems, as written, that only special populations consultants will be included on these teams, when there should be a clear requirement to include the regional consultant in the support structure. Finally, I am concerned about how the evaluation tool is being referenced. For the tool to have value we need to make sure districts and schools are using it without fear of having that self assessment used against them. It is one thing to say that schools can use the tool to demonstrate that their current strategies are working. It is another to say that if the tool does not show they are working they must be discontinued. If a school is not seeing an improvement in student achievement it may be enough to suggest that they will be required to demonstrate the effectiveness of their strategies and leave it to the school to use the evaluation tool or some other format to demonstrate that their supplemental funds should continue to be used as they had historically been. Nate Beelen
"A mind that is stretched by a new experience can never go back to its old dimensions."
- Oliver Wendell Holmes
Attachment 2.E
276
1
ESEAFlexibility
From: Samira Husseini <>
Sent: Friday, March 20, 2015 3:48 PM
To: ESEAFlexibility
Subject: ESEA FLEXIBILITY
I strongly encourage and request waiving any testing of Els who have been in the US
for less than 2-3 years. Currently newly arrived ELs are forced to take a state assessment
they do not understand. We would like MDE to consider requesting a waiver from US
department of ED to exempt ELs from such assessments for at least 2-3 years. ELS students deserve to have a chance to improve themselves first before they get tested. 2-3 years is fair enough for them to make that progress. ELs areareareare making progress due to the initial support systems implemented. We want to make sure the Flex Waiver reinforces the need to coordinate all state and federal funds to support English learners. From my positi on as ESL paraprofessional I have seen many students are improving during the first year but it is not enough time to them to be tested. Please take this in consideration. Thank you for your concern.
Samira Husseini
ESL paraprofessional at The Dearborn Academy
*** This Email was sent by an educator in Dearborn Academy.
Attachment 2.E
277
1
ESEAFlexibility
From: Kathleen Mcbroom <>
Sent: Friday, March 20, 2015 5:17 PM
To: ESEAFlexibility
Subject: Waiver Concerns
Hello - I am writing to express my concerns about some aspects of the current proposed ESEA waiver. Before I get into specifics, however, I do want to emphasize that I think the majority of proposed changes are positive, achievable, and make sense, and that overall we are headed in the right direction. However, some concerns: 1. The new FAY designation is problematic. October is not the start of the school year. Every student should have the benefit of proper placement and any indicated interventions from the first day of school. New students often arrive without documentation or paperwork, and districts can have difficulty in completing all intake testing and assessments in as timely a manner as desired. A child who arrives just in time for first semester count day has not had the benefits of a full academic year. Another concern is that the child would not show the growth that might occur with benefit of timely interventions (e.g. summer school, accommodations, targeted instruction). Additionally, as proposed, foreign exchange students would be included in testing and figure into results. And, as mentioned so many times before, the participation requirement alone is punitive for ELL/newcomers, let alone the inclusion of their scores after one FAY. 2. And, talking about participation - schools cannot control parents. Schools can demonstrate efforts to inform and encourage parents to support testing, and provide evidence of explaining consequences of non-participation, but, beyond that, cannot forbid or ignore assessment exemptions. The Priority School consequences for not meeting the 95% participation levels seem unduly harsh. 3. Conversely, the two years' failure to achieve 60% graduation rates Focus School designation seems too lenient. Shouldn't a high school who graduates less than 60% of their students for two consecutive years merit Priority designation? (perhaps allowances could be made for alternative programs). 4. Beginning on page 36, there are references to interventions "designed to meet the achievement and behavioral health needs of all students". Perhaps the examples that follow could be extended to include pastoral, wrap-around care initiatives, such as positive behavior modification (e.g. PBIS, Restorative Practices), drug/substance abuse education, anti-bullying, and even supplemental staff positions (e.g. family liaisons, family social workers, graduation interventionists). 5. I have concerns regarding the proposed accountability phase-in, which indicates that testing for 2014-2015 and 2015-2016 is for "information only", and that high stakes testing resumes in 2016-2017, and yet calls for 50% of our 2017 TTB scores to be based on "improvement". Can improvement rates determined by "information only" tests really yield reliable results? 6. Finally, I have serious concerns about the proposal to "freeze" 2013 and 2014 cohort Focus Schools in Focus School status until 2017. This seems unfair, and will seriously undermine momentum and have a negative impact on student morale. Our district has five 2013 and 2014 cohort schools that have been working diligently to achieve conditionally suspended status. Over the past three years, we have had six other schools that achieved suspended status, and this is the goal of every current Focus School. Additionally, it will be difficult to justify why our 2012 cohort school gets automatic suspension simply based on a timeline. When I brought this issue up at an informational meeting, I was told that the 2013 and 2014 cohort decision was based on the need to have two years' worth of "stable data". Does this refer to the "information only" assessment results? Wouldn't it be possible to determine comparative annual achievement gaps no matter what testing instrument was used? Again, it seems unfair for the 2013 and 2014 cohorts, basically since the rules have changed in the middle of the game.
Attachment 2.E
278

2
Despite this rather long missive, I do want to reiterate that I believe that the majority of proposed changes will be beneficial, and that I do appreciate the work of MDE on behalf of our students and our schools. Thank you very much - Kathleen McBroom Kathleen McBroom Director of Compensatory Education and School Improvement Dearborn Public Schools 18700 Audette Dearborn. MI 48124
Attachment 2.E
279
1
ESEAFlexibility
From: SYBIL LENZI <>
Sent: Saturday, March 21, 2015 2:04 PM
To: ESEAFlexibility
Subject: Commentary on the Proposed Changes
Superintendent Dropout Challenge: This is a powerful intervention, but MDE has not provided ongoing training or support for its implementation. Please keep this included--but provide MORE support so that schools understand it, and DIFs, ISs, SIFs can assist schools in carrying it out. There needs to be training for DIFs, ISs, SIFs as well---to ensure we have many approaches for helping a school carry this out---not just as a requirement, but as an intensive Tier 3 intervention with students who we will lose someday because there is no vehicle/approach for helping them. Continuation of FOCUS Schools identified in 2014: Continuation of this identification should not include any financial consequences, only supports. The schools should not have to tell their community that they are still FOCUS because there is no valid test data from 2015 that indicates that they should still be considered "actively" FOCUS. Responsibility of Superintendents: Without a STRONG presence of MDE with central office and Boards, this will not be successful. Based on my experiences with this effort since 2007--and as a previous Office of Field Services consultant, someone with actual clout and authority has to stay on top of the supt and Board to ensure that they understand what needs to be done and open their doors to meet with IS and DIF. Has there been any consideration of withholding a portion of the district's Title I allocation if superintendent and Board of said district/school have not taken charge? District Intervention Team "plus": After being in this initiative since 2007, I can tell you that getting all the members listed on page 211 of the request is next to impossible. Do you have a commitment from the Office of Field Services? It was nearly impossible in the past to coordinate schedules with our consultants to be able to attend any SST meetings. The OFS consultant would be a great member, since all of this is rooted in Title I, but there must be a commitment on the part of OFS to do this as a priority. They have their own priorities with On Site Reviews and their own increased accountability (now including Program Evaluation in addition to School Improvement Plans, Consolidated Grant, etc). Unpacking Tool: This should never have been started---and has caused great confusion. The Priority Schools should have been trained and guided to incorporate their redesign initiatives INTO their goals and SIPs.....not create a separate document in lieu of the goals. The SIP goals can include issues outside of the redesign plan. The Tool is kept separate from the rest of their SIP---it is not even in ASSIST. The whole thing made no sense. Yes, you need something to evaluate the progress of the redesign plan's implementation, but that could be done through the use of the SRO's IAF form without a separate Unpacking Tool and other SIP pieces located elsewhere. To me, this showed an unwillingness of SRO leadership at the time to work WITH existing structures from MDE. SIF and IS roles: I still have yet to understand why we needed BOTH of these roles. I truly see the work as ONE person. Perhaps in districts with many schools identified, it would be too much for one person. However, the lines are often blurred and don't seem to be clear to some. We shouldn't be paying two people to work with the school; yet because the supts don't often "open their doors", the IS is in the schools more than in the central office. Then we can have SIF and IS "bumping into" each other. The other piece is having some regular exchange--working together. Some ISs still have the feeling that they don't need to work WITH the SIF. I am finding that my work in one county as both the IS and SIF works very well. In another, we are still not "in sync". Somehow, the message that ISs work with the DISTRICT and SIFs work with the SCHOOL is not very clear. I feel the number of days is out of whack as well.
Attachment 2.E
280
2
Recruiting NEW and more DIFs, SIFs, ISs and Content Coaches from Retirees: While I know this is not in the waiver request, PLEASE do something about the restriction from MPSERS regarding retirees being contractors. We need people with experience and credibility to fill the roles, yet our own retirement system makes it next to impossible. This has got to change if we are going to place the most knowledgeable people in these roles. Thank you for the opportunity to comment.
Sybil Lenzi
School Improvement Facilitator
Intervention Specialist
District Improvement Facilitator
Mi Excel SSoS
SCCRESA
School Improvement Facilitator
Mi Excel SSoS
Genesee ISD
Attachment 2.E
281
1
ESEAFlexibility
From: Conway, Amy <>
Sent: Saturday, March 21, 2015 2:19 PM
To: ESEAFlexibility
Subject: re: input on the ESEA Flexibility waiver
Hello,
Below are three concerns that I have about the waiver. I would appreciate the careful review of these items:
• Letter grades have a very negative connotation – consider using an alternative system such as a dashboard that
articulates whether or not standards are being met at the local level as well as actions being taken to address
challenges. This dashboard could also be used to highlight the research based strategies that are being
implemented and having success at the local level.
• Please consider issues taking place at the local level regarding parent opt outs of testing. Special consideration
should be given with respect to the 95% participation rule. Districts and schools are doing everything possible
to administer state required assessment but have difficulty requiring parents to make their children take an
assessment. A waiver option should be considered for schools that fall below the 95% due to opt out demands.
• Please consider the stability of baseline data as it relates to M-Step and it’s first couple years of administration.
We want to be sure accountability is stable for purposes of making high stakes decisions and would like to be
able to understand metrics in order to provide explanation to our boards and communities.
Thanks,
Amy Conway
Amy Conway, Ed.S.
Assistant Superintendent of School Improvement
Gibraltar School District
Attachment 2.E
282
1
ESEAFlexibility
From: Jill Pastor <>
Sent: Saturday, March 21, 2015 4:53 PM
To: ESEAFlexibility
Subject: Comments on Renewal
Flexibility Element = 2.A.i, pages 67-68 Please consider the stability of the baseline data as it relates to M-STEP. This assessment was developed in a nine month timeframe and it’s the beginning of the administration of this type of assessment based on our new standards. Please consider that for the purposes of accountability we want a stable process. This process should contain metrics that can easily be explained to all stakeholders. Flexibility Element 2.A.i, pages 205-206 Graduation rates are mentioned for Focus School identification, what considerations will be given for alternative high schools that traditionally have transient and struggling student populations? Flexibility Element 2.D.v, pages 193-194 What considerations are going to be given at the local level regarding parent opt out of testing issues. Special considerations should be given with respect to the 95% participation rule. Districts and schools are doing everything possible to administer the required assessments, but district can’t really REQUIRE parents to make their students take the assessment. Thank You!
Jill Pastor Curriculum/Federal Programs Director
Attachment 2.E
283
1
ESEAFlexibility
From: Mae Awada <>
Sent: Friday, March 20, 2015 4:03 PM
To: ESEAFlexibility
Subject: Requesting a Waiver for ELLs
As an educator and an ESL teacher, I request waiving all testing for ELLs who have been in the country for less than three years. If MDE increase state funding for English language Learners since Title III amounts to $95 per student, schools will be able to provide more training for their staff on how to better serve ELLs and address their needs.
Educators and staff serving ELLs need to be trained on how to use effective strategies and latest technology to facilitate ELLs learning and enhance their language development and academic achievement. Teachers need special training on how to teach ELLs the academic language which they need to understand and master in order to perform well on the different state tests. I f Schools receive enough funding, they can easily develop as professional communities and provide for good opportunities for all staff mainly those serving ELLs to grow as professionals and stay informed of the best teaching strategies and practices. This will positively impact ELLs’ attitude toward school and improve their performance.
What ELLs need is special programs, resources and materials that enhance their language acquisition and consequently their academic achievement. If schools get enough funding, they can afford buying educational programs that are designed for ELLs and which can make a difference in their learning experience and better prepare them for the state educational system and tests.
To make sure we provide equal learning opportunities for all students, we need to allow ELLs enough time to master the language and then test them in the different subject areas. If we test ELLs one year after their arrival at the States, we might frustrate the majority of these ELLs who come to the States with no previous experience with or exposure to the English Language.
*** This Email was sent by an educator in Dearborn Academy.
Attachment 2.E
284

1
ESEAFlexibility
From: Lisa Swingle <>
Sent: Sunday, March 22, 2015 9:37 AM
To: ESEAFlexibility
Subject: ELL State testing
Hello & good morning, I am currently a curriculum coordinator at a K-8 school with a 64% ELL population. We have just completed our annual WIDA testing and are now working on scheduling both M-STEP and NWEA MAP spring assessment. Both assessments focus on reading and math (M-STEP including additional areas such as writing, science, and/or social studies). When trying to create testing sessions and groups for the multitude of state or charter required assessments it saddens me to know that my 64% ELL population, especially those who have been in the country for over a year and a day, will be force to take an examination on skills and background knowledge well beyond their current capabilities. Not only do the students feel as failures, but so do my staff who push themselves and their students everyday. We need to give our ELL students time and an environment in which they feel safe to grow and make successes. Please give our ELL students 2-3 years in their new home environment to get over the culture shock, learn the spoken and written language of our great country they and their families have chosen to be a part of, and have an opportunity to explore and gain the necessary thinking skills and strategies that they will need to become successful young people. Without this support, that state is choosing to create not only an academic divide, where ELL students continue to fail, but a social and cultural divide as well. We, as teachers, administrators, parents, and neighbors need the chance celebrate our ELL growth over time so that in turn, these young children can become successful leaders of our future. Lisa M. Swingle The Dearborn Academy Curriculum Coordinator *** This Email was sent by an educator in Dearborn Academy.
Attachment 2.E
285

1
ESEAFlexibility
From: Shannon Peterson <>
Sent: Sunday, March 22, 2015 2:00 PM
To: ESEAFlexibility
Subject: Waiver
To Whom It May Concern, Thank you for working to improve the accountability system for Michigan schools. No one can argue the need for checks and balances to ensure our children get the best possible education. However, it is imperative to make sure the system in place gathers data we can use to improve instruction and student achievement. Please consider the following:
• Letter grades have a very negative connotation and many individuals have different understandings of what they actually mean. Please consider using an alternative system such as a dashboard that articulates whether or not standards are being met at the local level as well as actions being taken to address challenges. This dashboard could be used to highlight research based strategies being implemented and successes to date. It is also important that a dashboard identify the success of all students and the different subgroups.
• For Focus school cohort 2012, what does conditionally suspended mean? Would funds be conditionally suspended too?
• Please consider issues taking place at the local level regarding parent opt outs of testing. Special consideration should be given with respect to the 95% participation rule. Districts and schools are doing everything possible to administer state required assessment but have difficulty requiring parents to make their children take an assessment. A waiver option should be considered for schools that fall below the 95% due to opt out demands.
• Thank you, for removing the Gap from the Priority School label. Schools in the bottom 5% tend to have little or no gap. Most of the lowest performing schools did not have a gap.
• Please consider the stability of baseline data as it relates to M-Step and it’s first couple years of administration. We want to be sure accountability is stable for purposes of making high stakes decisions and would like to be able to understand metrics in order to provide explanation to our boards and communities.
• As it relates to the graduation requirements for Focus schools, what considerations will be given for alternative high schools that traditionally have struggling student populations. Considerations must be made to allow alternative high schools some level of flexibility or removal from the Focus School designation altogether.
• Thank you, for making changes to the identification cycle. We appreciate allowing districts to have a consistent focus support, a stable group of schools without constantly changing “the list”.
• Greater flexibility and considerations should be given for transient populations and newcomers. • Changing the FAY to two count days, only gives a school 6 months to truly identify a new student's
needs and show improvement. This doesn't seem fair to the student or the school. • Please consider removal of the 2013 and 2014 Focus School designation when appropriate
improvements have been made. Requiring schools identified to remain in the cohort until 2017 seems contradictory to the exit criteria’s intention.
Attachment 2.E
286
2
Respectfully, -- Shannon Peterson, Ed. S. Executive Director of Secondary Education Dearborn Public Schools
Attachment 2.E
287
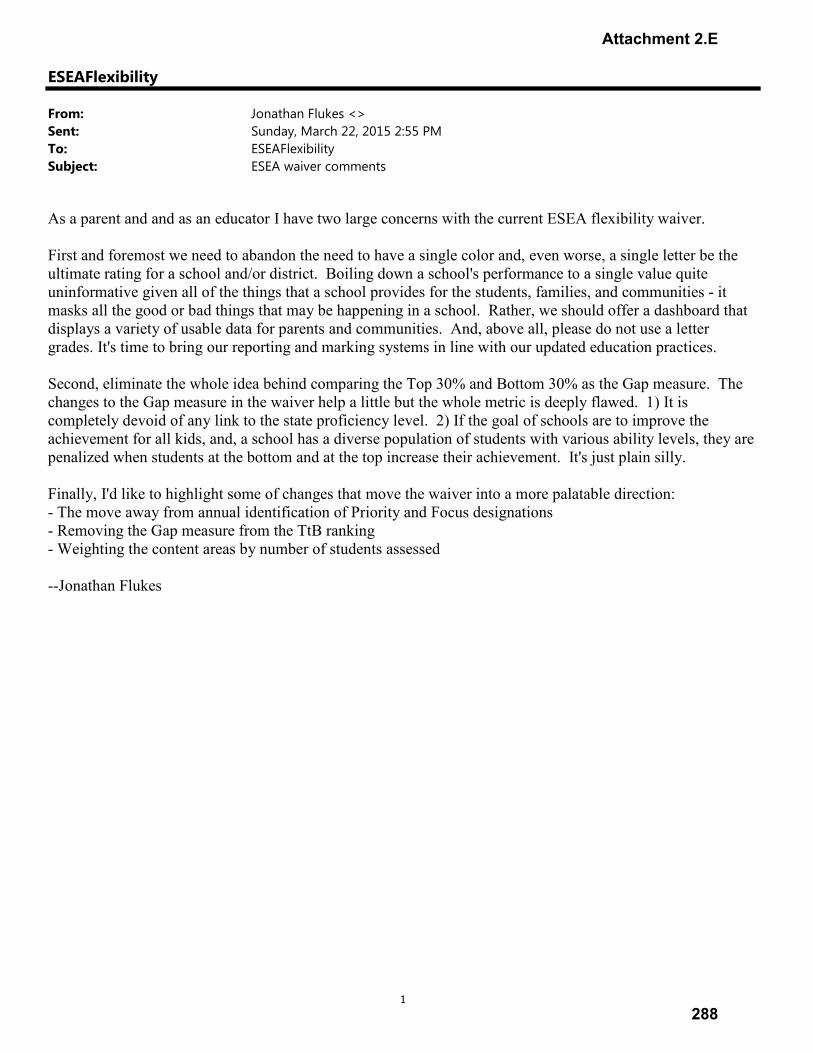
1
ESEAFlexibility
From: Jonathan Flukes <>
Sent: Sunday, March 22, 2015 2:55 PM
To: ESEAFlexibility
Subject: ESEA waiver comments
As a parent and and as an educator I have two large concerns with the current ESEA flexibility waiver. First and foremost we need to abandon the need to have a single color and, even worse, a single letter be the ultimate rating for a school and/or district. Boiling down a school's performance to a single value quite uninformative given all of the things that a school provides for the students, families, and communities - it masks all the good or bad things that may be happening in a school. Rather, we should offer a dashboard that displays a variety of usable data for parents and communities. And, above all, please do not use a letter grades. It's time to bring our reporting and marking systems in line with our updated education practices. Second, eliminate the whole idea behind comparing the Top 30% and Bottom 30% as the Gap measure. The changes to the Gap measure in the waiver help a little but the whole metric is deeply flawed. 1) It is completely devoid of any link to the state proficiency level. 2) If the goal of schools are to improve the achievement for all kids, and, a school has a diverse population of students with various ability levels, they are penalized when students at the bottom and at the top increase their achievement. It's just plain silly. Finally, I'd like to highlight some of changes that move the waiver into a more palatable direction: - The move away from annual identification of Priority and Focus designations - Removing the Gap measure from the TtB ranking - Weighting the content areas by number of students assessed --Jonathan Flukes
Attachment 2.E
288
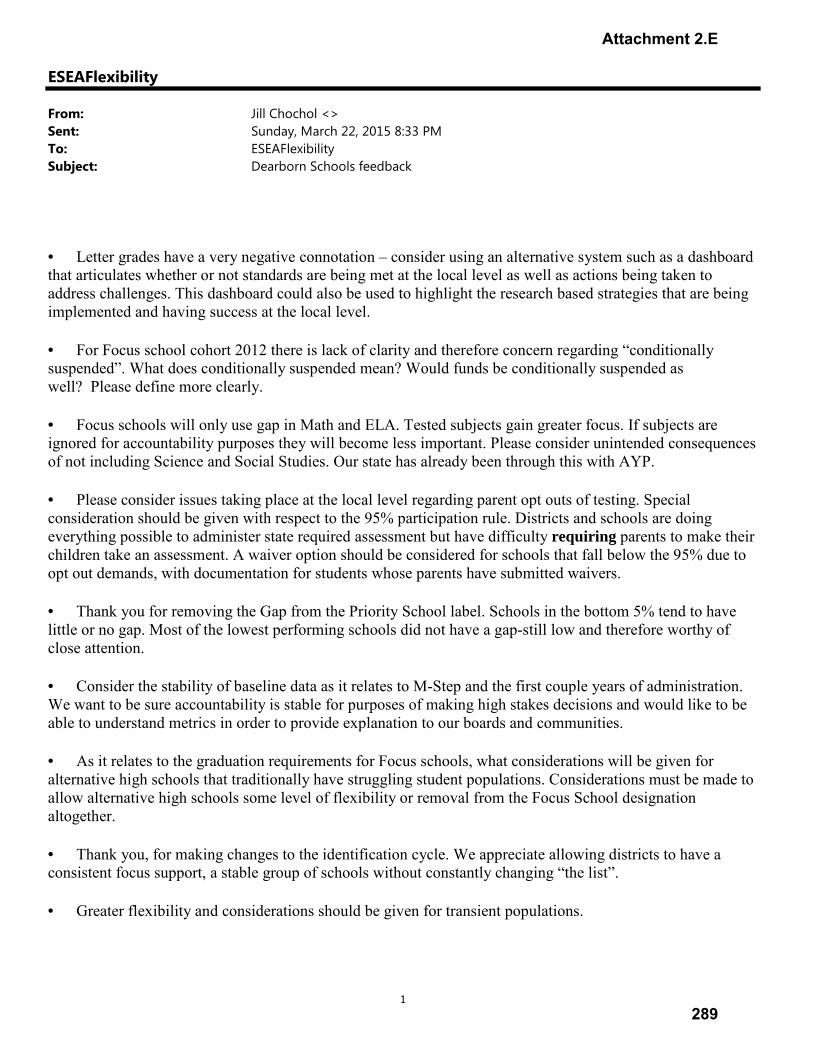
1
ESEAFlexibility
From: Jill Chochol <>
Sent: Sunday, March 22, 2015 8:33 PM
To: ESEAFlexibility
Subject: Dearborn Schools feedback
• Letter grades have a very negative connotation – consider using an alternative system such as a dashboard that articulates whether or not standards are being met at the local level as well as actions being taken to address challenges. This dashboard could also be used to highlight the research based strategies that are being implemented and having success at the local level.
• For Focus school cohort 2012 there is lack of clarity and therefore concern regarding “conditionally suspended”. What does conditionally suspended mean? Would funds be conditionally suspended as well? Please define more clearly.
• Focus schools will only use gap in Math and ELA. Tested subjects gain greater focus. If subjects are ignored for accountability purposes they will become less important. Please consider unintended consequences of not including Science and Social Studies. Our state has already been through this with AYP.
• Please consider issues taking place at the local level regarding parent opt outs of testing. Special consideration should be given with respect to the 95% participation rule. Districts and schools are doing everything possible to administer state required assessment but have difficulty requiring parents to make their children take an assessment. A waiver option should be considered for schools that fall below the 95% due to opt out demands, with documentation for students whose parents have submitted waivers.
• Thank you for removing the Gap from the Priority School label. Schools in the bottom 5% tend to have little or no gap. Most of the lowest performing schools did not have a gap-still low and therefore worthy of close attention.
• Consider the stability of baseline data as it relates to M-Step and the first couple years of administration. We want to be sure accountability is stable for purposes of making high stakes decisions and would like to be able to understand metrics in order to provide explanation to our boards and communities.
• As it relates to the graduation requirements for Focus schools, what considerations will be given for alternative high schools that traditionally have struggling student populations. Considerations must be made to allow alternative high schools some level of flexibility or removal from the Focus School designation altogether.
• Thank you, for making changes to the identification cycle. We appreciate allowing districts to have a consistent focus support, a stable group of schools without constantly changing “the list”.
• Greater flexibility and considerations should be given for transient populations.
Attachment 2.E
289

2
• Please consider removal of the 2013 and 2014 Focus School designation when appropriate improvements have been made. Requiring schools identified to remain in the cohort until 2017 seems contradictory to the exit
Attachment 2.E
290
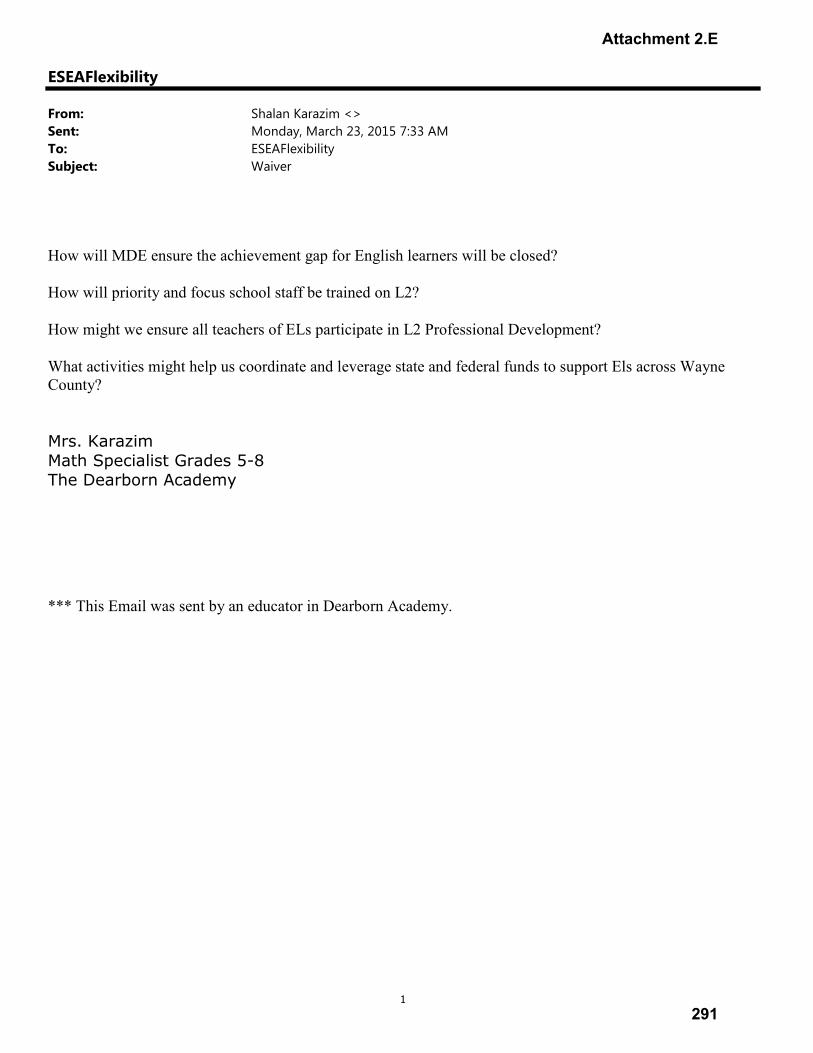
1
ESEAFlexibility
From: Shalan Karazim <>
Sent: Monday, March 23, 2015 7:33 AM
To: ESEAFlexibility
Subject: Waiver
How will MDE ensure the achievement gap for English learners will be closed?
How will priority and focus school staff be trained on L2?
How might we ensure all teachers of ELs participate in L2 Professional Development?
What activities might help us coordinate and leverage state and federal funds to support Els across Wayne County?
Mrs. Karazim
Math Specialist Grades 5-8
The Dearborn Academy
*** This Email was sent by an educator in Dearborn Academy.
Attachment 2.E
291
1
ESEAFlexibility
From: Sheila Alles <>
Sent: Monday, March 23, 2015 9:00 AM
To: ESEAFlexibility
Subject: Feedback on the MI ESEA Waiver
• To whom it may concern,
I would like to provide the following feedback regarding the proposed ESEA Flexibility Waiver for Michigan,
Letter grades have a very negative connotation – consider using an alternative system such as a dashboard that articulates whether or not standards are being met at the local level as well as actions being taken to address challenges. This dashboard could also be used to highlight the research based strategies that are being implemented and having success at the local level.
• For Focus school cohort 2012 there is lack of clarity and therefore concern regarding “conditionally suspended”. What does conditionally suspended mean? Would funds be conditionally suspended as well? Please define more clearly.
• Focus schools will only use gap in Math and ELA. Tested subjects gain greater focus. If subjects are ignored for accountability purposes they will become less important. Please consider unintended consequences of not including Science and Social Studies.
• Please consider issues taking place at the local level regarding parent opt outs of testing. Special consideration should be given with respect to the 95% participation rule. Districts and schools are doing everything possible to administer state required assessment but have difficulty requiring parents to make their children take an assessment. A waiver option should be considered for schools that fall below the 95% due to opt out demands.
• Thank you, for removing the Gap from the Priority School label. Schools in the bottom 5% tend to have little or no gap. Most of the lowest performing schools did not have a gap.
• Please consider the stability of baseline data as it relates to M-Step and it’s first couple years of administration. We want to be sure accountability is stable for purposes of making high stakes decisions and would like to be able to understand metrics in order to provide explanation to our boards and communities.
As it relates to the graduation requirements for Focus schools, what considerations will be given for alternative high
schools that traditionally have struggling student populations. Thank you for the opportunity to provide feedback. Should you have any questions, feel free to contact me, Sheila Alles Director of Academic Services Livonia Public Schools 15125 Farmington Rd. Livonia, Michigan 48154
Attachment 2.E
292
1
ESEAFlexibility
From: Brad Biladeau <>
Sent: Monday, March 23, 2015 10:11 AM
To: ESEAFlexibility
Cc: Chris Wigent; William Miller
Subject: ESEA Waiver Public Comment
Attachments: MASA - MAISA ESEA Waiver commentary-2015.pdf
On behalf of the Michigan Association of School Administrators and Michigan Association of Intermediate School
Administrators, please accept the following feedback on Michigan's proposed ESEA Flexibility Waiver renewal request.
We want to thank you for this opportunity.
Brad Biladeau
Associate Executive Director
Michigan Association of School Administrators
Michigan Association of Intermediate School Administrators
Attachment 2.E
293
1001 Centennial Way, Suite 300, Lansing, MI 48917 | 517-327-5910
March 20, 2015
To Whom It May Concern:
The purpose of this letter is to provide feedback on Michigan's proposed ESEA Flexibility Waiver renewal request. On behalf of the superintendents and assistant superintendents of Michigan’s 545 School Districts and 56 Intermediate School Districts, we want to thank you for this opportunity.
The feedback of our two organizations includes the following:
• It is the position of MASA/MAISA that and the A-F letter grade system proposed by some legislators is an inappropriate and inaccurate way of communicating school performance. We would prefer the color-based system over A-F letter grads; however, we believe a preferred system would use dashboard metrics, similar to systems used in other states.
• MASA/MAISA fully support MDE's proposed transition to a three-year identification cycle for Priority and Focus schools.
• MASA/MAISA support the proposed modification of only using ELA and mathematics
scores for identifying Focus Schools.
• MASA/MAISA support the modified metrics for determining the Top-to-Bottom list.
• While MASA/MAISA supports the shift to differentiate the weighting of different subjects based on the number of student scores in those subjects; we would also urge MDE to eliminate the use of science and social studies scores in determining Priority School status and exclusively use only ELA and math scores, which is consistent with what is being recommended for the Focus School metric.
• MASA/MAISA support the inclusion of clearly defined and appropriate exit criteria for both Priority and Focus schools.
• While we are encouraged that MDE intends to use the proposed criteria to exit schools from the 2010 and 2011 Priority School cohorts by the end of the 2014-15 school year, MASA/MAISA would expect that the same opportunity be extended to schools in the
Attachment 2.E
294
1001 Centennial Way, Suite 300, Lansing, MI 48917 | 517-327-5910
2012, 2013, and 2014 cohorts as soon as evidence of two consecutive years of AMO progress is available.
• MASA/MAISA suggest the proposal to retain the 2012-2014 Focus School cohorts until 2017 with no possibility of exiting should be reconsidered. Schools showing progress toward gap closure and improved graduation rates, or whose students are above state proficiency/growth averages and can demonstrate that progress, should not be held due to the lack of a consistent state assessment.
• MASA/MAISA fully support the MDE proposal to delay the use of state assessment data for teacher and administrator accountability purposes until two years of data under the same assessment system are available.
We appreciate the opportunity to provide this ESEA Flexibility Waiver feedback. If you have any questions, please do not hesitate to contact us further.
Sincerely,
Christopher A. Wigent Executive Director, MASA
William Miller Executive Dirctor, MAISA
Attachment 2.E
295

1
ESEAFlexibility
From: bolussalah . <>
Sent: Monday, March 23, 2015 10:21 AM
To: ESEAFlexibility
Subject: Flex Waiver Feedback
Dear MDE, Please consider the following items as you make revisions to the flex waiver.
• Letter grades have a very negative connotation – consider using an alternative system such as a dashboard that articulates whether or not standards are being met at the local level as well as actions being taken to address challenges. This dashboard could also be used to highlight the research based strategies that are being implemented and having success at the local level.
• For Focus school cohort 2012 there is lack of clarity and therefore concern regarding “conditionally
suspended”. What does conditionally suspended mean? Would funds be conditionally suspended as
well? Please define more clearly.
• Focus schools will only use gap in Math and ELA. Tested subjects gain greater focus. If subjects are ignored for
accountability purposes they will become less important. Please consider unintended consequences of not
including Science and Social Studies.
• Please consider issues taking place at the local level regarding parent opt outs of testing. Special consideration
should be given with respect to the 95% participation rule. Districts and schools are doing everything possible
to administer state required assessment but have difficulty requiring parents to make their children take an
assessment. A waiver option should be considered for schools that fall below the 95% due to opt out demands.
• Thank you, for removing the Gap from the Priority School label. Schools in the bottom 5% tend to have little or
no gap. Most of the lowest performing schools did not have a gap.
• Please consider the stability of baseline data as it relates to M-Step and it’s first couple years of administration.
We want to be sure accountability is stable for purposes of making high stakes decisions and would like to be
able to understand metrics in order to provide explanation to our boards and communities.
• As it relates to the graduation requirements for Focus schools, what considerations will be given for alternative
high schools that traditionally have struggling student populations. Considerations must be made to allow
alternative high schools some level of flexibility or removal from the Focus School designation altogether.
• Thank you, for making changes to the identification cycle. We appreciate allowing districts to have a consistent
focus support, a stable group of schools without constantly changing “the list”.
• Greater flexibility and considerations should be given for transient populations.
• Please consider removal of the 2013 and 2014 Focus School designation when appropriate improvements have
been made. Requiring schools identified to remain in the cohort until 2017 seems contradictory to the exit
criteria’s intention.
Thank you, Paul Salah Associate Superintendent/Educational Services Wayne RESA -- Paul
Attachment 2.E
296

1
ESEAFlexibility
From: Lori Pearson <>
Sent: Monday, March 23, 2015 10:18 AM
To: ESEAFlexibility
Subject: Waiver Feedback
To Whom It May Concern;
I am writing today to provide feedback on Michigan's proposed ESEA Flexibility Waiver renewal request. On behalf of
the three counties I represent with 9,000 students, who are often not in a position to advocate on their own behalf,
but who are nevertheless directly affected by these proposed changes, I offer the following feedback:
I support MDE's proposal to differentiate between accountability systems (Top-to-Bottom list, Priority and
Focus Schools) for low performing schools and a separate school dashboard that would provide relevant information
about all schools to students and parents.
I support MDE's proposal to transition to a three-year identification cycle for Priority and Focus schools.
I recommend for consideration the removal of the current gap measure for identifying Priority Schools
combined with the weight placed on proficiency could significantly disadvantage schools that are driving student
improvement, but whose students are behind grade level. To correct this, I would urge that more weight be place on
growth (75%) than proficiency (25%).
I recommend for consideration, to eliminate the use of science and social studies scores in determining Priority
School status and focus exclusively on ELA and math scores, consistent with what is being recommended for the Focus
School metric.
I support the proposed modification of only using ELA and mathematics scores for identifying Focus Schools.
I support and commend the inclusion of clearly defined exit criteria for both Priority and Focus schools.
I believe the proposal to retain the 2012-2014 Focus School cohorts until 2017 with no possibility of exiting
should be reconsidered. Schools showing progress toward gap closure, improved graduation rates, or whose students
are above state proficiency/growth averages and can demonstrate that progress should not be held over for want of a
state assessment.
I support the MDE proposal to delay the use of state assessment data for teacher and administrator
accountability purposes until two years of data under the same assessment system are available.
I do not support the use of mandatory standardized programs for all schools designated as a Priority or a Focus
school. One size does not fit all. I do support an audit or external review of designated schools to determine
interventions from a menu of evidenced based interventions.
Thank you again for the opportunity to provide feedback. If you have any questions, please do not hesitate to contact
me further.
Sincerely,
Lori Pearson, Director of Learning Services COPESD
Attachment 2.E
297
1
ESEAFlexibility
From: Sara Alrayyashi <>
Sent: Monday, March 23, 2015 10:43 AM
To: ESEAFlexibility
Cc: Afrin Alavi
Subject: Flexibility renewal
Good morning,
To whom it may concern;
My name is Sara Alrayyashi, I work at The Dearborn Academy it's a charter school with Title 1 priority with many EL
students. These students come with little to no English. Allowing them time to gain a stronger English foundation will
assist us in knowing where their weaknesses lie and adhere to those weaknesses. Thank you for you time and efforts.
God Bless,
Ms. Sara Alrayyashi
RTI Interventionist
The Dearborn Academy
*** This Email was sent by an educator.
Attachment 2.E
298
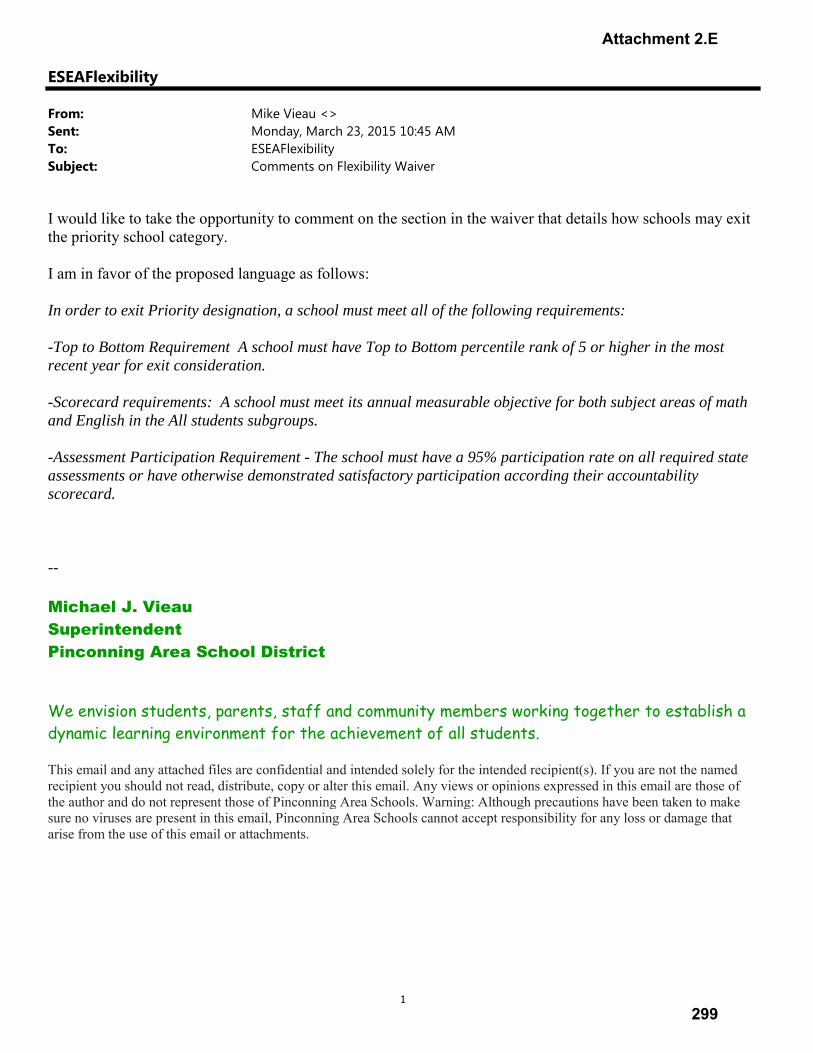
1
ESEAFlexibility
From: Mike Vieau <>
Sent: Monday, March 23, 2015 10:45 AM
To: ESEAFlexibility
Subject: Comments on Flexibility Waiver
I would like to take the opportunity to comment on the section in the waiver that details how schools may exit the priority school category. I am in favor of the proposed language as follows: In order to exit Priority designation, a school must meet all of the following requirements: -Top to Bottom Requirement A school must have Top to Bottom percentile rank of 5 or higher in the most recent year for exit consideration. -Scorecard requirements: A school must meet its annual measurable objective for both subject areas of math and English in the All students subgroups. -Assessment Participation Requirement - The school must have a 95% participation rate on all required state assessments or have otherwise demonstrated satisfactory participation according their accountability scorecard. -- Michael J. Vieau Superintendent Pinconning Area School District We envision students, parents, staff and community members working together to establish a
dynamic learning environment for the achievement of all students. This email and any attached files are confidential and intended solely for the intended recipient(s). If you are not the named recipient you should not read, distribute, copy or alter this email. Any views or opinions expressed in this email are those of the author and do not represent those of Pinconning Area Schools. Warning: Although precautions have been taken to make sure no viruses are present in this email, Pinconning Area Schools cannot accept responsibility for any loss or damage that arise from the use of this email or attachments.
Attachment 2.E
299
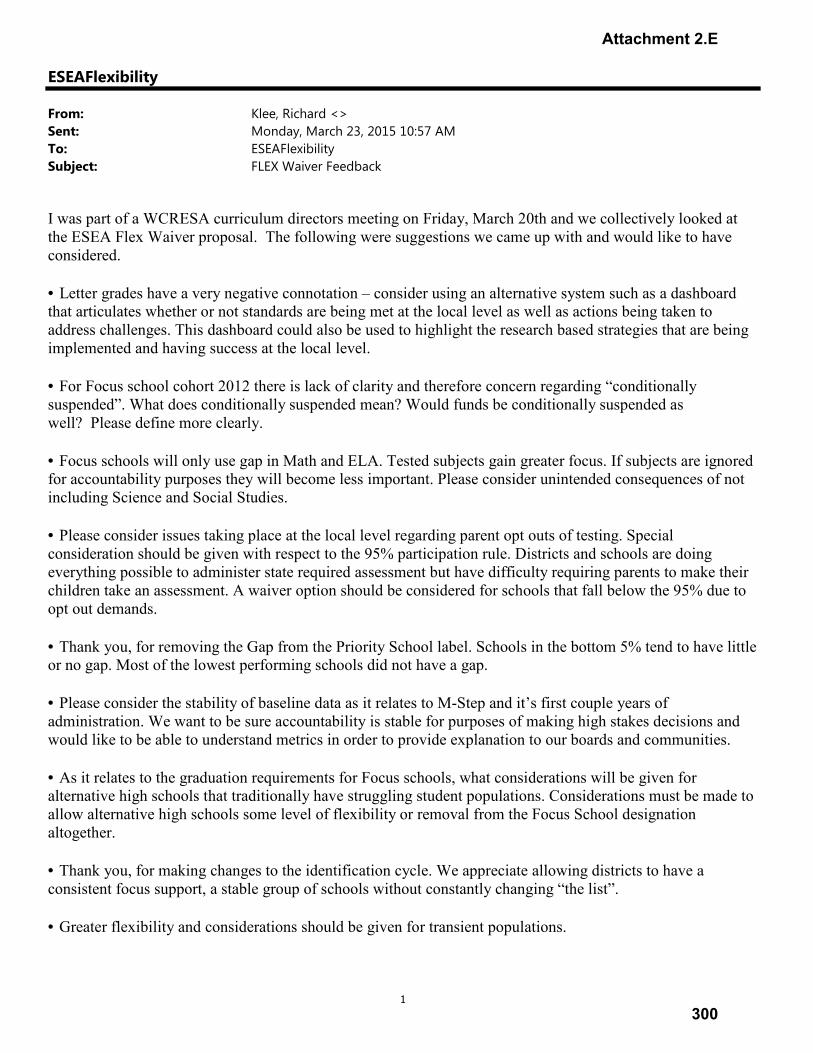
1
ESEAFlexibility
From: Klee, Richard <>
Sent: Monday, March 23, 2015 10:57 AM
To: ESEAFlexibility
Subject: FLEX Waiver Feedback
I was part of a WCRESA curriculum directors meeting on Friday, March 20th and we collectively looked at the ESEA Flex Waiver proposal. The following were suggestions we came up with and would like to have considered. • Letter grades have a very negative connotation – consider using an alternative system such as a dashboard that articulates whether or not standards are being met at the local level as well as actions being taken to address challenges. This dashboard could also be used to highlight the research based strategies that are being implemented and having success at the local level. • For Focus school cohort 2012 there is lack of clarity and therefore concern regarding “conditionally suspended”. What does conditionally suspended mean? Would funds be conditionally suspended as well? Please define more clearly. • Focus schools will only use gap in Math and ELA. Tested subjects gain greater focus. If subjects are ignored for accountability purposes they will become less important. Please consider unintended consequences of not including Science and Social Studies. • Please consider issues taking place at the local level regarding parent opt outs of testing. Special consideration should be given with respect to the 95% participation rule. Districts and schools are doing everything possible to administer state required assessment but have difficulty requiring parents to make their children take an assessment. A waiver option should be considered for schools that fall below the 95% due to opt out demands. • Thank you, for removing the Gap from the Priority School label. Schools in the bottom 5% tend to have little or no gap. Most of the lowest performing schools did not have a gap. • Please consider the stability of baseline data as it relates to M-Step and it’s first couple years of administration. We want to be sure accountability is stable for purposes of making high stakes decisions and would like to be able to understand metrics in order to provide explanation to our boards and communities. • As it relates to the graduation requirements for Focus schools, what considerations will be given for alternative high schools that traditionally have struggling student populations. Considerations must be made to allow alternative high schools some level of flexibility or removal from the Focus School designation altogether. • Thank you, for making changes to the identification cycle. We appreciate allowing districts to have a consistent focus support, a stable group of schools without constantly changing “the list”. • Greater flexibility and considerations should be given for transient populations.
Attachment 2.E
300

2
• Please consider removal of the 2013 and 2014 Focus School designation when appropriate improvements have been made. Requiring schools identified to remain in the cohort until 2017 seems contradictory to the exit criteria’s intention. -- Richard E. Klee, Ph.D. Director of Curriculum & Instruction
"Always do your best. What you plant now, you will harvest later." - Og Mandino
Attachment 2.E
301
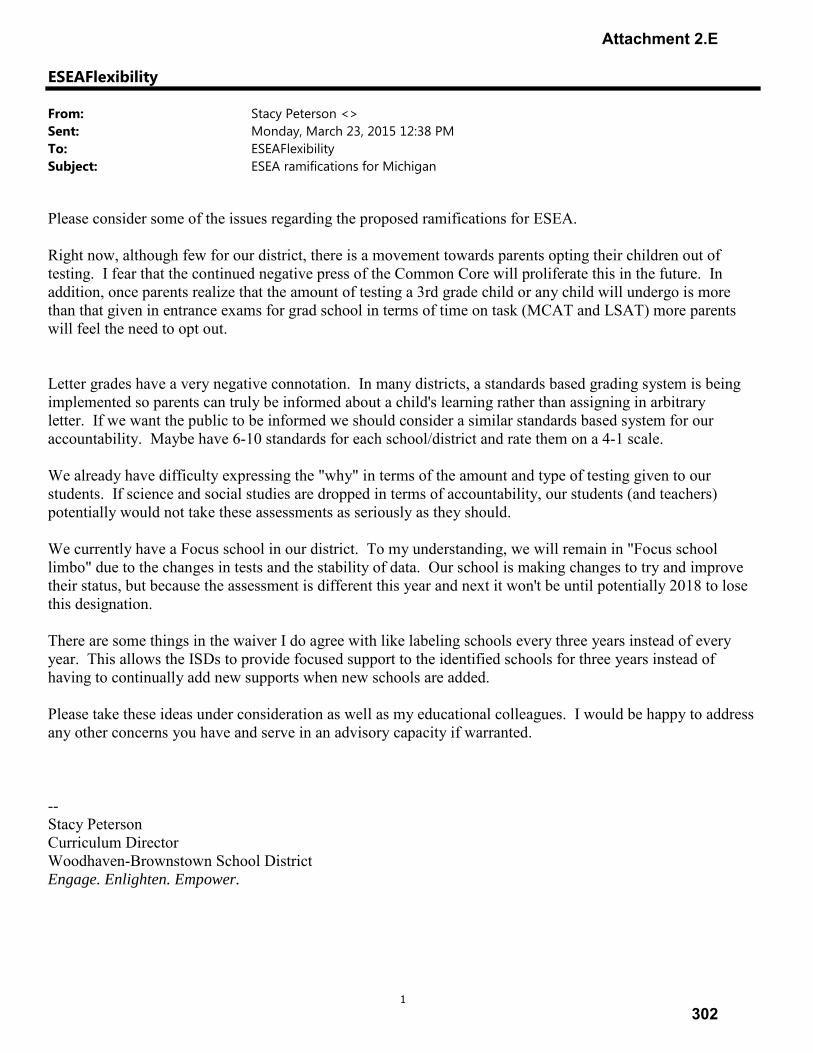
1
ESEAFlexibility
From: Stacy Peterson <>
Sent: Monday, March 23, 2015 12:38 PM
To: ESEAFlexibility
Subject: ESEA ramifications for Michigan
Please consider some of the issues regarding the proposed ramifications for ESEA. Right now, although few for our district, there is a movement towards parents opting their children out of testing. I fear that the continued negative press of the Common Core will proliferate this in the future. In addition, once parents realize that the amount of testing a 3rd grade child or any child will undergo is more than that given in entrance exams for grad school in terms of time on task (MCAT and LSAT) more parents will feel the need to opt out. Letter grades have a very negative connotation. In many districts, a standards based grading system is being implemented so parents can truly be informed about a child's learning rather than assigning in arbitrary letter. If we want the public to be informed we should consider a similar standards based system for our accountability. Maybe have 6-10 standards for each school/district and rate them on a 4-1 scale. We already have difficulty expressing the "why" in terms of the amount and type of testing given to our students. If science and social studies are dropped in terms of accountability, our students (and teachers) potentially would not take these assessments as seriously as they should. We currently have a Focus school in our district. To my understanding, we will remain in "Focus school limbo" due to the changes in tests and the stability of data. Our school is making changes to try and improve their status, but because the assessment is different this year and next it won't be until potentially 2018 to lose this designation. There are some things in the waiver I do agree with like labeling schools every three years instead of every year. This allows the ISDs to provide focused support to the identified schools for three years instead of having to continually add new supports when new schools are added. Please take these ideas under consideration as well as my educational colleagues. I would be happy to address any other concerns you have and serve in an advisory capacity if warranted. -- Stacy Peterson Curriculum Director Woodhaven-Brownstown School District Engage. Enlighten. Empower.
Attachment 2.E
302
1
ESEAFlexibility
From: Monique.Beels
Sent: Monday, March 23, 2015 12:39 PM
To: ESEAFlexibility
Subject: A Flexibility uRequest
Attachments: scan.pdf
Attachment 2.E
303

Attachment 2.E
304
Attachment 2.E
305
Attachment 2.E
306
1
ESEAFlexibility
From: Rod Rock <>
Sent: Monday, March 23, 2015 2:27 PM
To: ESEAFlexibility
Subject: Assessment
Attachments: M-STEP Forward - Google Docs.pdf
I request that the ESEA Flexibility Waiver includes: An alternative assessment system that is consistent with the one used by the State of New Hampshire, including student-performance assessments (administered by classroom teachers) and fewer students assessed annually, online. Here are some documents that support the New Hampshire model: http://www.governor.nh.gov/media/news/2015/pr-2015-03-05-pace.htm http://education.nh.gov/accountability-system/documents/concept-paper.pdf The superintendents of Oakland County will work with MDE to develop these performance assessments. Further, I request that the educator evaluation system associated with assessments is geared more toward research on performance feedback, including direct, ongoing conversations related to growth-over-time. These conversations should be team-based and reflective a groups work toward common objectives (https://hbr.org/2015/04/reinventing-performance-management). I further request a discontinuation of rank ordering schools and districts in favor of a seeking of equity of opportunity and expectations for all students, as reflected in the Finnish Model of education (http://www.cimo.fi/instancedata/prime_product_julkaisu/cimo/embeds/cimowwwstructure/25534_American_educator_spring2012.pdf). Attached is a resolution that lists the inhibitors created by the M-STEP processes along with suggestions for future improvement. Thank you. -- Rod Rock, Ed.D. Superintendent Clarkston Community Schools: Passion. Emotion. Relationships. Inspiration
Cultivating thinkers, learners, and positive contributors to a global society. Recently Read or Reading Books: Creating Cultures of Thinking, Ron Ritchhart The Alchemist, Paulo Coelho Finnish Lessons 2.0, Pasi Sahlberg This Idea Must Die, John Brockman (Ed.) Who is Afraid of the Big Bad Dragon by Yong Zhao Truth, Beauty, and Goodness Reframed by Howard Gardner "What Do You Care What Other People Think?" by Richard P. Feynman Future Wise by David N. Perkins World Class Learners by Yong Zhao The Necessary Revolution by Peter Senge, Bryan Smith, Nina Kruschwitz, Joe Laur, and Sara Schley Quiet: The Power of Introverts in a World that Can't Stop Talking by Susan Cain
Attachment 2.E
307
2
The End of Poverty by Jeffrey SachsQuiet Strength by Tony Dungy and Nathan WhitakerLong Walk to Freedom by Nelson MandelaThe Price of Civilization by Jeffrey SachsReign of Error by Diane RavitchMaking Thinking Visible by Ron Ritchhart, Mark Church, and Karin MorrisonHenry Ford by Vincent CurcioChurchill: The Prophetic Statesman by James C. HumesThe Smartest Kids in the World by Amanda RipleyTo Move the World by Jeff SachsUngifted by Scott Barry KaufmanCreating Innovators by Tony WagnerHow Children Succeed by Paul ToughThe Fourth Way by Andy Hargreaves and Dennis ShirleyFinnish Lessons by Pasi SahlbergThe Global Achievement Gap by Tony Wagner
"Here's to the kids who are different,
The kids who don't always get A's
The kids who have ears twice the size of their peers,
And noses that go on for days ...
Here's to the kids who are different,
The kids they call crazy or dumb,
The kids who don't fit, with the guts and the grit,
Who dance to a different drum ...
Here's to the kids who are different,
The kids with the mischievous streak,
For when they have grown, as history's shown,
It's their difference that makes them unique."
-Digby Wolfe, "Kids who are Different"
Thank you to everyone who made possible Clarkston's Project Zero Perspectives Conference in November 2012, which featured Howard Gardner, David Perkins, Ron Ritchhart, and over 800 educators from around the world. Find more information at: http://www.clarkston.k12.mi.us/education/components/scrapbook/default.php?sectionid=1
Attachment 2.E
308
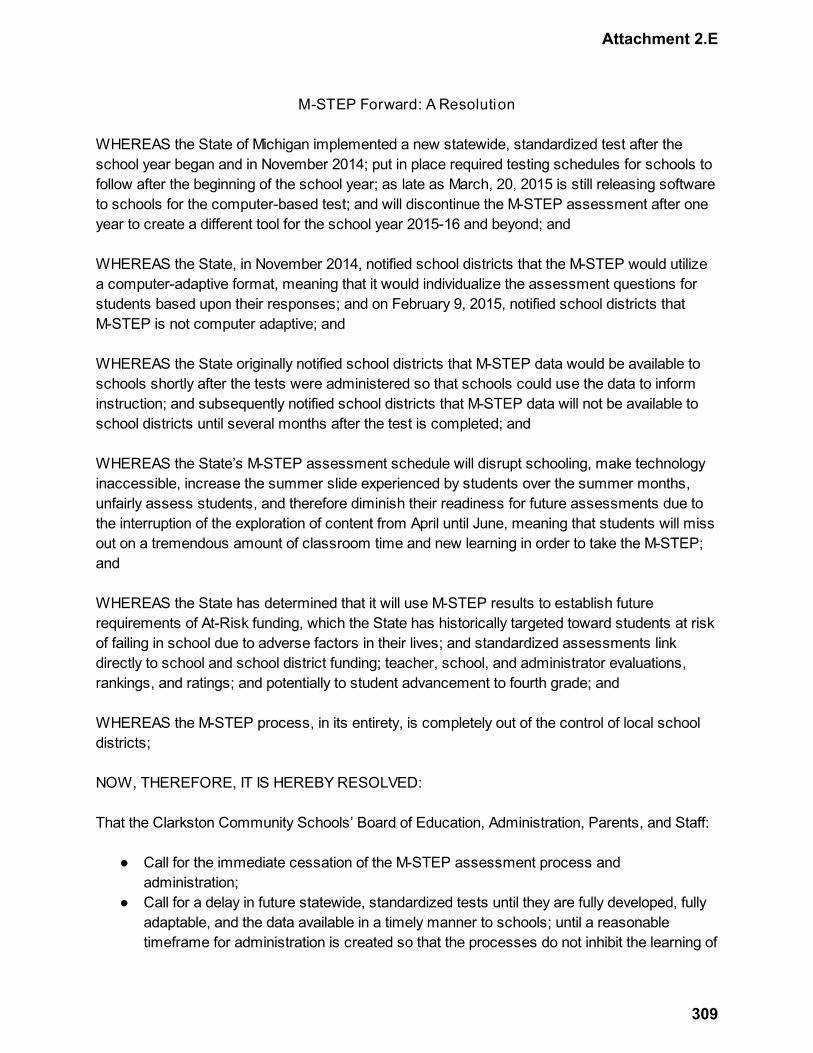
M-STEP Forward: A Resolution
WHEREAS the State of Michigan implemented a new statewide, standardized test after the school year began and in November 2014; put in place required testing schedules for schools to follow after the beginning of the school year; as late as March, 20, 2015 is still releasing software to schools for the computer-based test; and will discontinue the M-STEP assessment after one year to create a different tool for the school year 2015-16 and beyond; and WHEREAS the State, in November 2014, notified school districts that the M-STEP would utilize a computer-adaptive format, meaning that it would individualize the assessment questions for students based upon their responses; and on February 9, 2015, notified school districts that M-STEP is not computer adaptive; and WHEREAS the State originally notified school districts that M-STEP data would be available to schools shortly after the tests were administered so that schools could use the data to inform instruction; and subsequently notified school districts that M-STEP data will not be available to school districts until several months after the test is completed; and WHEREAS the State’s M-STEP assessment schedule will disrupt schooling, make technology inaccessible, increase the summer slide experienced by students over the summer months, unfairly assess students, and therefore diminish their readiness for future assessments due to the interruption of the exploration of content from April until June, meaning that students will miss out on a tremendous amount of classroom time and new learning in order to take the M-STEP; and WHEREAS the State has determined that it will use M-STEP results to establish future requirements of At-Risk funding, which the State has historically targeted toward students at risk of failing in school due to adverse factors in their lives; and standardized assessments link directly to school and school district funding; teacher, school, and administrator evaluations, rankings, and ratings; and potentially to student advancement to fourth grade; and WHEREAS the M-STEP process, in its entirety, is completely out of the control of local school districts; NOW, THEREFORE, IT IS HEREBY RESOLVED: That the Clarkston Community Schools’ Board of Education, Administration, Parents, and Staff:
● Call for the immediate cessation of the M-STEP assessment process and administration;
● Call for a delay in future statewide, standardized tests until they are fully developed, fully adaptable, and the data available in a timely manner to schools; until a reasonable timeframe for administration is created so that the processes do not inhibit the learning of
Attachment 2.E
309
essential content, extend the summer slide, or disrupt the focus of the entire school; until there is an equity of technology in every Michigan school district in advance of any future, computer-based standardized assessments;
● Call for the State to begin a collaborative process, with willing districts, to: 1.allow flexibility in student performance assessments that reflect the local values and visions, and the development of essential, non-cognitive skills; define mastery of learning objectives; and think first of the well-being of children; 2.develop teacher and administrator evaluation systems consistent with research and related to standardized tests in manners that advance student, teacher, administrator, school, and district learning; 3. establish rankings that reflect growth over time and the cummulative experiences had by students within school systems.
Attachment 2.E
310
1
ESEAFlexibility
From: Gerald Hill <>
Sent: Monday, March 23, 2015 3:09 PM
To: ESEAFlexibility
Subject: ESEA Flexibility Waiver Feedback from WBSD
Attachments: Feedback on Michigan’s ESEA Flexibility Request 3-23-15.pdf; Dashboard Sample.pdf
copy.pdf
To Whom It May Concern, Please see the two attached documents. Regards, -- Gerald D. Hill, Ph.D. Superintendent West Bloomfield School District 5810 Commerce Road West Bloomfield, MI 48324
Attachment 2.E
311
5810 COMMERCE ROAD, WEST BLOOMFIELD, MICHIGAN 48324 TELEPHONE (248) 865-6485 FAX (248) 865-6481 E-MAIL: [email protected]
GERALD D. HILL, PH.D. SUPERINTENDENT
memo To: Michigan Department of Education From: Dr. Gerald D. Hill, Superintendent WBSD
Date: March 23, 2015
Re: Feedback on Michigan’s ESEA Flexibility Request
West Bloomfield School district is affiliated with Oakland Schools. Over the past few months, we have discussed various elements of the ESEA Flexibility Waiver with school leaders around the state through the Michigan Association of Intermediate School Administrators (MAISA) and their instructional group, the General Education Leadership (GELN) Network. Oakland Schools and the 28 local school districts strongly support the feedback that was sent earlier this year, titled “Key Points of Consideration for Michigan’s New Flex Waiver with the United States Federal Government.”
In addition to Oakland Schools’ participation in the process to develop the MAISA GELN feedback, they also engaged our county school leaders in further dialogue about the ESEA Flexibility Waiver Request the MDE sent out for public comment earlier this month. The following is feedback from Oakland Schools and the 28 school districts related to the Accountability Indicator that includes the Overall Indicator and Public Reporting components (as outlined in the MDE Accountability presentation at the School Improvement Conference last week). To meet the requirement for an Accountability Indicator, we support the use of a parent-‐friendly dashboard that includes an Overall Indicator as one of the components (see attached sample). We propose that the category for the Overall Indicator be placed as a required element on the dashboard and be labeled as something like, “STANDARDS MET” where either a checkmark/x or a yes/no would serve as the indicator of whether a school or district met or did not meet standards.
Attachment 2.E
312

5810 COMMERCE ROAD, WEST BLOOMFIELD, MICHIGAN 48324 TELEPHONE (248) 865-6485 FAX (248) 865-6481 E-MAIL: [email protected]
GERALD D. HILL, PH.D. SUPERINTENDENT We are opposed to other Accountability/Overall Indicators that have been discussed and proposed, including A-‐F letter grades, 1-‐5 number ratings, or most recently, effectiveness ratings tied back to either letter grades (HE=A, E=B or C, ME=D, NE=F) or school labels (Priority, Focus, and Reward Schools). We understand that the U.S. Education Department requires states to report an Accountability Indicator. In our opinion this can best be accomplished through generating a dashboard for each school/district that includes the Overall Indicator (Did or Did Not Meet Standards). We believe a well-‐designed dashboard (see attached sample) that contains the Overall Indicator component and performance data, that can be customized by districts to also provide unique information about their schools, is the best vehicle to report on school quality factors to meet the Public Reporting requirement. At the request of the local districts, Oakland Schools is in the process of developing such a dashboard and is willing to collaborate with the MDE in the design and/or development process. Please consider this request carefully as the Oakland County Superintendents Association and Teaching and Learning Council representing our district and instructional leaders who serve 28 districts, over 200 schools and 190,000 students support an Accountability Indicator in the form of a customizable, parent-‐friendly dashboard as outlined above. I appreciate the opportunity to submit feedback on the MDE’s Flexibility Waiver Request. Rationale for this feedback is summarized in Appendix A on the following page. Please let me know if you have questions, need clarification on any point or require additional information.
Attachment 2.E
313
5810 COMMERCE ROAD, WEST BLOOMFIELD, MICHIGAN 48324 TELEPHONE (248) 865-6485 FAX (248) 865-6481 E-MAIL: [email protected]
GERALD D. HILL, PH.D. SUPERINTENDENT Appendix A Rationale for our Feedback Related to Elements that we Support and Oppose: Support for a Dashboard: Educating students is a complex process. We believe that the best way to report to the public about our schools and districts is through a dashboard that displays information and performance indicators about schools in an easy to understand format. A dashboard is a more genuine and transparent way to communicate with the public about our schools; allowing parents access to the information they feel is most important to them in their decision-‐making process. We believe this type of public reporting is far more useful than having the state’s accountability system produce an overall indicator that comes out in the form of a color, number or letter grade. One problem with these overall indicators is that people don’t share the same understanding about what they mean. For example, a letter grade of “C” for some people is synonymous with failing while others have long understood that the letter grade of “C” is the middle grade and indicates average performance. Opposition to labels: We are strongly opposed to unfairly labeling schools with a letter, number or color as it does not adequately reflect the many factors that contribute to a quality education (but that a dashboard does well). These labels will not help families better understand their local schools; instead they have the potential of creating a negative perception about our schools that is inaccurate at best and damaging at worst.
Attachment 2.E
314
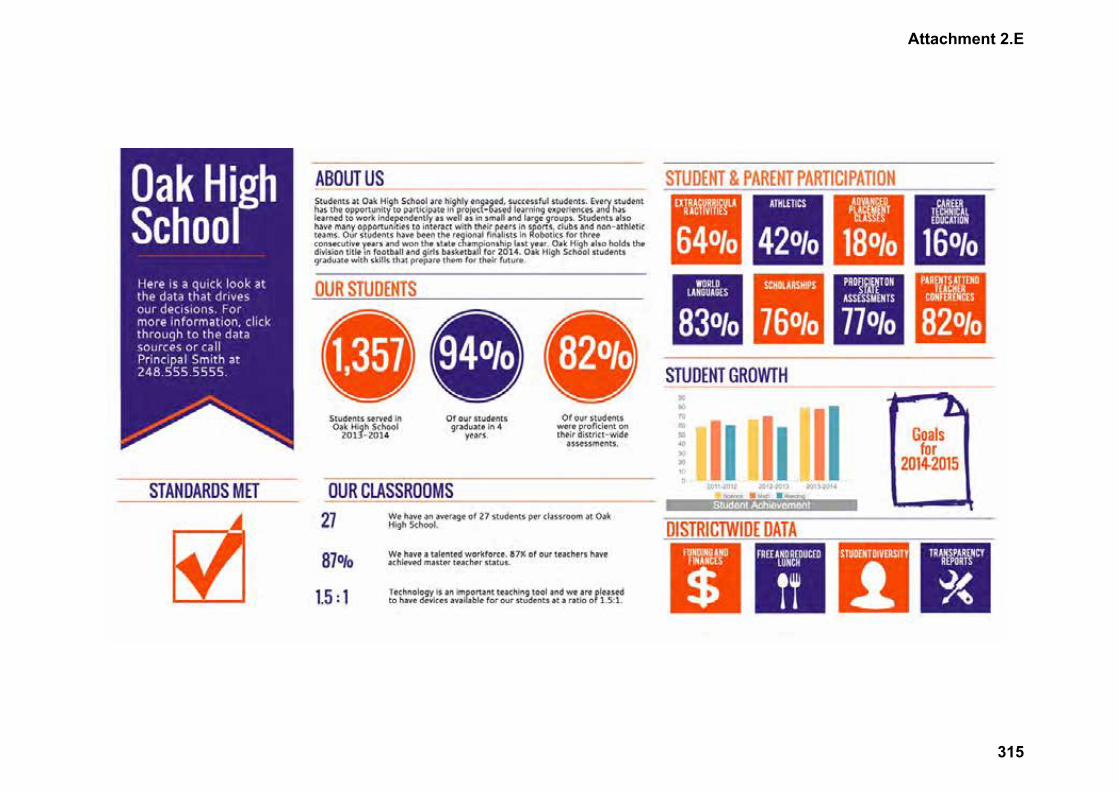
Attachment 2.E
315

1
ESEAFlexibility
From: Paul Shepich <>
Sent: Monday, March 23, 2015 3:31 PM
To: ESEAFlexibility
Subject: Clarenceville School District Feedback to MDE on the ESEA Flexibility Waiver Request
Attachments: CSD Feedback on ESEA Flex Request 2015.docx; Dashboard Sample.pdf
Good Afternoon, Please read the attached documents regarding the ESEA Flex Waiver as it pertains to school and district accountabilitystandards. Respectfully, Paul K. Shepich Superintendent Clarenceville School District Building Stronger Schools....Together
Attachment 2.E
316
Matthew Boettcher, President Mark Brooks, Vice-President Sharon Simpson, Secretary Brenda Uren, Treasurer Cindy Immonen, Trustee Richard Tannous, Trustee Steve Massie, Trustee
MEMO To: Michigan Department of Education
From: Paul K. Shepich, Superintendent
Date: March 24, 2015
Re: Clarenceville School District’s Feedback on Michigan’s ESEA
Flexibility Request
Over the past few months, I have discussed various elements of the ESEA
Flexibility Waiver with my school administrators and Board of Education
members. The Clarenceville School District and the other 27 local school
districts of Oakland County strongly support the feedback that was sent earlier
this year, titled “Key Points of Consideration for Michigan’s New Flex Waiver
with the United States Federal Government.”
Clarenceville School District has participated in the Oakland Schools’ process to
develop the MAISA GELN feedback. I was also engaged with other county school
leaders in further dialogue about the ESEA Flexibility Waiver Request the MDE
sent out for public comment earlier this month. The following is feedback from
the Clarenceville School District and the other 27 school districts related to the
Accountability Indicator that includes the Overall Indicator and Public Reporting
components (as outlined in the MDE Accountability presentation at the School
Improvement Conference last week).
To meet the requirement for an Accountability Indicator, the Clarenceville
School District supports the use of a parent-friendly dashboard that includes an
Overall Indicator as one of the components (see attached sample). We propose
that the category for the Overall Indicator be placed as a required element on the
dashboard and be labeled as something like, “STANDARDS MET” where either a
checkmark/x or a yes/no would serve as the indicator of whether a school or
district met or did not meet standards.
Paul K. Shepich Superintendent
David G. Bergeron Assistant Superintendent
Business/Support Services/Finance
Carol A. Anthony Director
Curriculum/Instruction/Assessment
Neil A. Thomas Director Special Education
Student Services
Attachment 2.E
317
Matthew Boettcher, President Mark Brooks, Vice-President Sharon Simpson, Secretary Brenda Uren, Treasurer Cindy Immonen, Trustee Richard Tannous, Trustee Steve Massie, Trustee
The Clarenceville School District is opposed to other
Accountability/Overall Indicators that have been discussed and proposed,
including A-F letter grades, 1-5 number ratings, or most recently, effectiveness
ratings tied back to either letter grades (HE=A, E=B or C, ME=D, NE=F) or school
labels (Priority, Focus, and Reward Schools).
We understand that the U.S. Education Department requires states to
report an Accountability Indicator. In our opinion this can best be
accomplished through generating a dashboard for each school/district that
includes the Overall Indicator (Did or Did Not Meet Standards). We believe a
well-designed dashboard (see attached sample) that contains the Overall
Indicator component and performance data, that can be customized by districts
to also provide unique information about their schools, is the best vehicle to
report on school quality factors to meet the Public Reporting requirement. My
superintendent colleagues and I requested Oakland Schools to begin the process
of developing such a dashboard and within that process be willing to collaborate
with the MDE in the design and/or development process.
Please consider this request carefully. Clarenceville represents one of the 28
school districts in Oakland County who has worked diligently as a part of the
Superintendents’ Association along with our Teaching and Learning Council
members who represent our district and instructional leaders across Oakland
County who serve 28 districts, over 200 schools and 190,000 students. We are
united in our support for an Accountability Indicator in the form of a
customizable, parent-friendly dashboard as outlined above.
I appreciate the opportunity to submit feedback via my input through Oakland
Schools on the MDE’s Flexibility Waiver Request. Rationale for this feedback is
summarized in Appendix A on the following page. Please let me know if you have
questions, need clarification on any point or require additional information.
Attachment 2.E
318
Matthew Boettcher, President Mark Brooks, Vice-President Sharon Simpson, Secretary Brenda Uren, Treasurer Cindy Immonen, Trustee Richard Tannous, Trustee Steve Massie, Trustee
Appendix A
Rationale for our Feedback Related to Elements that we Support and Oppose:
Support for a Dashboard: Educating students is a complex process. The
Clarenceville School District believes that the best way to report to our school
community about our schools and district is through a dashboard that displays
information and performance indicators about schools in an easy to understand
format.
A dashboard is a more genuine and transparent way to communicate with our
school community about our schools; allowing parents access to the information
they feel is most important to them in their decision-making process. We believe
this type of public reporting is far more useful than having the state’s
accountability system produce an overall indicator that comes out in the form of
a color, number or letter grade. One problem with these overall indicators is that
people don’t share the same understanding about what they mean. For example,
a letter grade of “C” for some people is synonymous with failing while others
have long understood that the letter grade of “C” is the middle grade and
indicates average performance. The Clarenceville School District believes it can
tell its educational story much more clearly through a local dashboard approach.
Opposition to labels: The Clarenceville School District is strongly opposed to
unfairly labeling schools with a letter, number or color as it does not adequately
reflect the many factors that contribute to a quality education (but that a
dashboard does well). These labels will not help families better understand our
schools; instead they have the potential of creating a negative perception about
our schools that is inaccurate at best and damaging at worst.
Attachment 2.E
319

Attachment 2.E
320
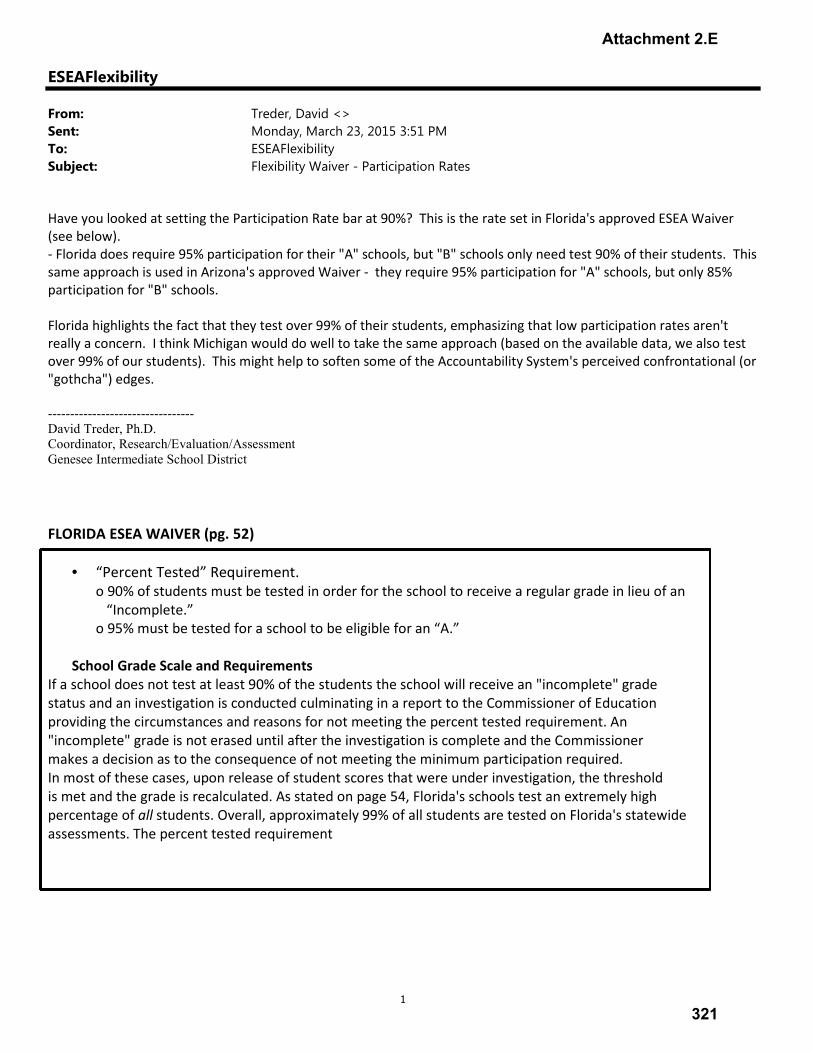
1
ESEAFlexibility
From: Treder, David <>
Sent: Monday, March 23, 2015 3:51 PM
To: ESEAFlexibility
Subject: Flexibility Waiver - Participation Rates
Have you looked at setting the Participation Rate bar at 90%? This is the rate set in Florida's approved ESEA Waiver
(see below).
- Florida does require 95% participation for their "A" schools, but "B" schools only need test 90% of their students. This
same approach is used in Arizona's approved Waiver - they require 95% participation for "A" schools, but only 85%
participation for "B" schools.
Florida highlights the fact that they test over 99% of their students, emphasizing that low participation rates aren't
really a concern. I think Michigan would do well to take the same approach (based on the available data, we also test
over 99% of our students). This might help to soften some of the Accountability System's perceived confrontational (or
"gothcha") edges.
--------------------------------- David Treder, Ph.D. Coordinator, Research/Evaluation/Assessment Genesee Intermediate School District
FLORIDA ESEA WAIVER (pg. 52)
• “Percent Tested” Requirement.
o 90% of students must be tested in order for the school to receive a regular grade in lieu of an
“Incomplete.”
o 95% must be tested for a school to be eligible for an “A.”
School Grade Scale and Requirements
If a school does not test at least 90% of the students the school will receive an "incomplete" grade
status and an investigation is conducted culminating in a report to the Commissioner of Education
providing the circumstances and reasons for not meeting the percent tested requirement. An
"incomplete" grade is not erased until after the investigation is complete and the Commissioner
makes a decision as to the consequence of not meeting the minimum participation required.
In most of these cases, upon release of student scores that were under investigation, the threshold
is met and the grade is recalculated. As stated on page 54, Florida's schools test an extremely high
percentage of all students. Overall, approximately 99% of all students are tested on Florida's statewide
assessments. The percent tested requirement
Attachment 2.E
321
1
ESEAFlexibility
From: Spencer, Terri <>
Sent: Monday, March 23, 2015 4:12 PM
To: ESEAFlexibility
Subject: Oakland Schools Feedback Re: Accountability
Attachments: Flex Waiver Request - Accountability Memo.pdf; Dashboard Sample.pdf
Importance: High
We appreciate the opportunity to submit feedback on the MDE’s Flexibility Waiver
Request. Attached you will find a memorandum outlining areas that we would like
considered for revision.
Please consider this request carefully, as our Oakland County Superintendents
Association and Teaching and Learning Council support an accountability system with
the elements addressed in the attached communication. We hope that the impact of this
feedback is noted as significant since the district and instructional leaders of these
groups serve 28 districts, over 200 schools and about 190,000 students.
Thanks again for the opportunity to submit feedback for consideration in finalizing the
MDE’s ESEA Flexibility Request that will be submitted soon. Please let me know if you
have questions, require clarification or any additional information related to the attached
memorandum.
Terri
Dr. Terri Spencer Deputy Superintendent
Oakland Schools: Learning today. Transforming tomorrow.
� Please consider the environment before printing this email.
Confidentiality Statement: This message (including any attachments) is intended only for the individual or entity to which it is addressed. It may contain privileged, confidential information that is exempt from disclosure under applicable laws. If you are not the intended recipient, please note that you are strictly prohibited from disseminating or distributing this information (other than to the intended recipient) or copying this information. If you have received this communication in error, please notify us immediately by e-mail or by telephone at (248) 209.2433.
Attachment 2.E
322
2111 Pontiac Lake Road Waterford, MI 48328-2736 Telephone: 248.209.2000 Facsimile: 248.209. 2206 www.oakland.k12.mi.us
memo To: Michigan Department of Education From: Dr. Terri Spencer, Deputy Superintendent Date: March 23, 2015 Re: OS Feedback on Michigan’s ESEA Flexibility Request Over the past few months, we have discussed various elements of the ESEA Flexibility Waiver with school leaders around the state through the Michigan Association of Intermediate School Administrators (MAISA) and their instructional group, the General Education Leadership (GELN) Network. Oakland Schools and our 28 local school districts strongly support the feedback that was sent earlier this year, titled “Key Points of Consideration for Michigan’s New Flex Waiver with the United States Federal Government.”
In addition to Oakland Schools’ participation in the process to develop the MAISA GELN feedback, we also engaged our county school leaders in further dialogue about the ESEA Flexibility Waiver Request the MDE sent out for public comment earlier this month. The following is feedback from Oakland Schools and our 28 school districts related to the Accountability Indicator that includes the Overall Indicator and Public Reporting components (as outlined in the MDE Accountability presentation at the School Improvement Conference last week). To meet the requirement for an Accountability Indicator, we support the use of a parent-friendly dashboard that includes an Overall Indicator as one of the components (see attached sample). We propose that the category for the Overall Indicator be placed as a required element on the dashboard and be labeled as something like, “STANDARDS MET” where either a checkmark/x or a yes/no would serve as the indicator of whether a school or district met or did not meet standards.
Attachment 2.E
323
We are opposed to other Accountability/Overall Indicators that have been discussed and proposed, including A-F letter grades, 1-5 number ratings, or most recently, effectiveness ratings tied back to either letter grades (HE=A, E=B or C, ME=D, NE=F) or school labels (Priority, Focus, and Reward Schools). We understand that the U.S. Education Department requires states to report an Accountability Indicator. In our opinion this can best be accomplished through generating a dashboard for each school/district that includes the Overall Indicator (Did or Did Not Meet Standards). We believe a well-designed dashboard (see attached sample) that contains the Overall Indicator component and performance data, that can be customized by districts to also provide unique information about their schools, is the best vehicle to report on school quality factors to meet the Public Reporting requirement. At the request of our local districts, Oakland Schools is in the process of developing such a dashboard and is willing to collaborate with the MDE in the design and/or development process. Please consider this request carefully as our Oakland County Superintendents Association and Teaching and Learning Council representing our district and instructional leaders who serve 28 districts, over 200 schools and 190,000 students support an Accountability Indicator in the form of a customizable, parent-friendly dashboard as outlined above. We appreciate the opportunity to submit feedback on the MDE’s Flexibility Waiver Request. Rationale for this feedback is summarized in Appendix A on the following page. Please let us know if you have questions, need clarification on any point or require additional information.
Attachment 2.E
324
Appendix A Rationale for our Feedback Related to Elements that we Support and Oppose: Support for a Dashboard: Educating students is a complex process. We believe that the best way to report to the public about our schools and districts is through a dashboard that displays information and performance indicators about schools in an easy to understand format. A dashboard is a more genuine and transparent way to communicate with the public about our schools; allowing parents access to the information they feel is most important to them in their decision-making process. We believe this type of public reporting is far more useful than having the state’s accountability system produce an overall indicator that comes out in the form of a color, number or letter grade. One problem with these overall indicators is that people don’t share the same understanding about what they mean. For example, a letter grade of “C” for some people is synonymous with failing while others have long understood that the letter grade of “C” is the middle grade and indicates average performance. Opposition to labels: We are strongly opposed to unfairly labeling schools with a letter, number or color as it does not adequately reflect the many factors that contribute to a quality education (but that a dashboard does well). These labels will not help families better understand their local schools; instead they have the potential of creating a negative perception about our schools that is inaccurate at best and damaging at worst.
Attachment 2.E
325

Attachment 2.E
326
1
ESEAFlexibility
From: Holmes, Judy <>
Sent: Monday, March 23, 2015 4:40 PM
To: ESEAFlexibility
Cc: Machesky, Richard
Subject: Flex Waiver Request
Attachments: Troy Schools Flexibility Waiver Request.pdf; DashboardSample.pdf
Importance: High
Please see attached from memo Troy School District Superintendent, Dr. Richard Machesky.
Thank you!
Judy Holmes
Secretary to the Superintendent
Attachment 2.E
327
TO: Michigan Department of Education FROM: Richard M. Machesky, Ed.D. RE: Troy Schools Feedback on Michigan’s ESEA Flexibility Request DATE: March 23, 2015
Over the past few months, we have discussed various elements of the ESEA Flexibility Waiver with school leaders around the state through the Michigan Association of Intermediate School Administrators (MAISA) and their instructional group, the General Education Leadership (GELN) Network. Troy School District strongly supports the feedback that was sent earlier this year, titled “Key Points of Consideration for Michigan’s New Flex Waiver with the United States Federal Government.”
In addition to Troy School’s participation in the process to develop the MAISA GELN feedback, we also engaged our county school leaders in further dialogue about the ESEA Flexibility Waiver Request the MDE sent out for public comment earlier this month. The following is feedback from Troy Schools related to the Accountability Indicator that includes the Overall Indicator and Public Reporting components (as outlined in the MDE Accountability presentation at the School Improvement Conference last week). To meet the requirement for an Accountability Indicator, we support the use of a parent-friendly dashboard that includes an Overall Indicator as one of the components (see attached sample). We propose that the category for the Overall Indicator be placed as a required element on the dashboard and be labeled as something like, “STANDARDS MET” where either a checkmark/x or a yes/no would serve as the indicator of whether a school or district met or did not meet standards. We are opposed to other Accountability/Overall Indicators that have been discussed and proposed, including A-F letter grades, 1-5 number ratings, or most recently, effectiveness ratings tied back to either letter grades (HE=A, E=B or C, ME=D, NE=F) or school labels (Priority, Focus, and Reward Schools). We understand that the U.S. Education Department requires states to report an Accountability Indicator. In our opinion this can best be accomplished through generating a dashboard for each school/district that includes the Overall Indicator (Did or Did Not Meet Standards). We believe a well-designed dashboard (see attached sample) that contains the Overall Indicator component and performance data, that can be customized by districts to also provide unique information about their schools, is the best vehicle to report on school quality factors to meet the Public Reporting requirement. At the request of Troy Schools, Oakland Schools is in the process of developing such a dashboard and is willing to collaborate with the MDE in the design and/or development process. Please consider this request carefully on behalf of our Troy School community representing over 12,500 students and 1200 educators and administrators. We appreciate the opportunity to submit feedback on the MDE’s Flexibility Waiver Request. Please let me know if you have questions, need clarification on any point or require additional information.
Office of the Superintendent
4400 Livernois Troy, MI 48098
Ph: 248.823.4003 Fax: 248.823.4012
Memorandum Attachment 2.E
328
Appendix A Rationale for our Feedback Related to Elements that we Support and Oppose: Support for a Dashboard: Educating students is a complex process. We believe that the best way to report to the public about our schools and districts is through a dashboard that displays information and performance indicators about schools in an easy to understand format. A dashboard is a more genuine and transparent way to communicate with the public about our schools; allowing parents access to the information they feel is most important to them in their decision-making process. We believe this type of public reporting is far more useful than having the state’s accountability system produce an overall indicator that comes out in the form of a color, number or letter grade. One problem with these overall indicators is that people don’t share the same understanding about what they mean. For example, a letter grade of “C” for some people is synonymous with failing while others have long understood that the letter grade of “C” is the middle grade and indicates average performance. Opposition to labels: We are strongly opposed to unfairly labeling schools with a letter, number or color as it does not adequately reflect the many factors that contribute to a quality education (but that a dashboard does well). These labels will not help families better understand their local schools; instead they have the potential of creating a negative perception about our schools that is inaccurate at best and damaging at worst.
Attachment 2.E
329
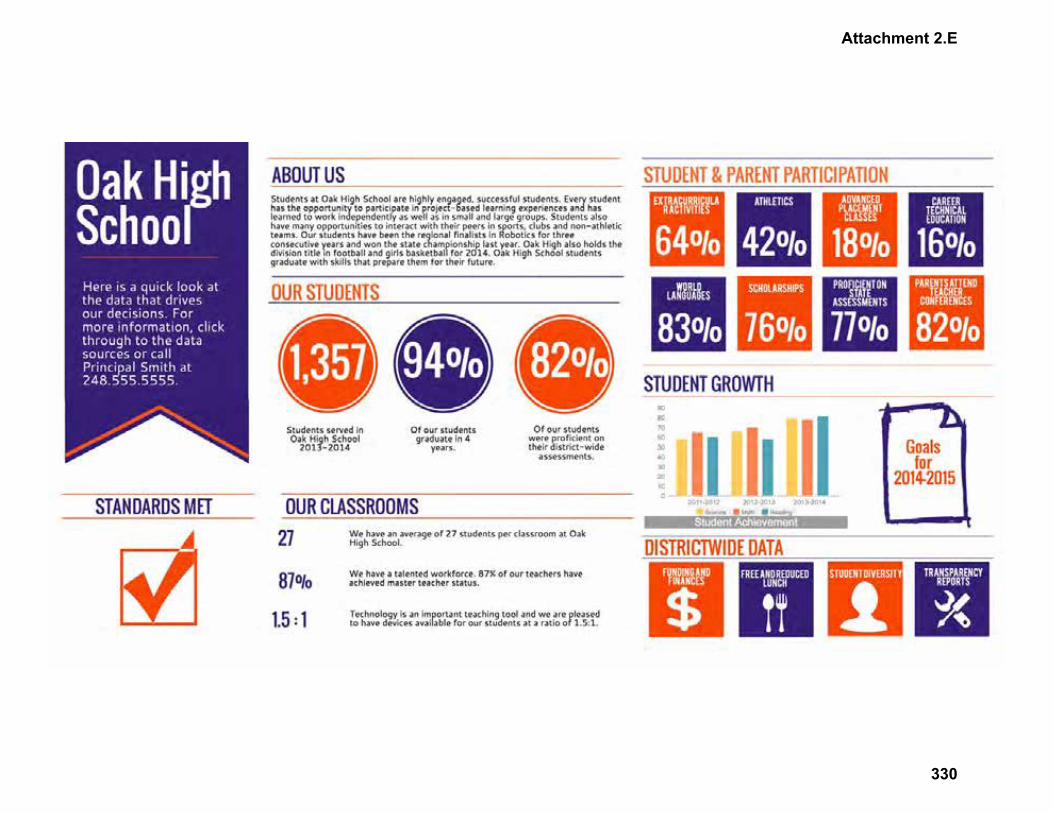
Attachment 2.E
330
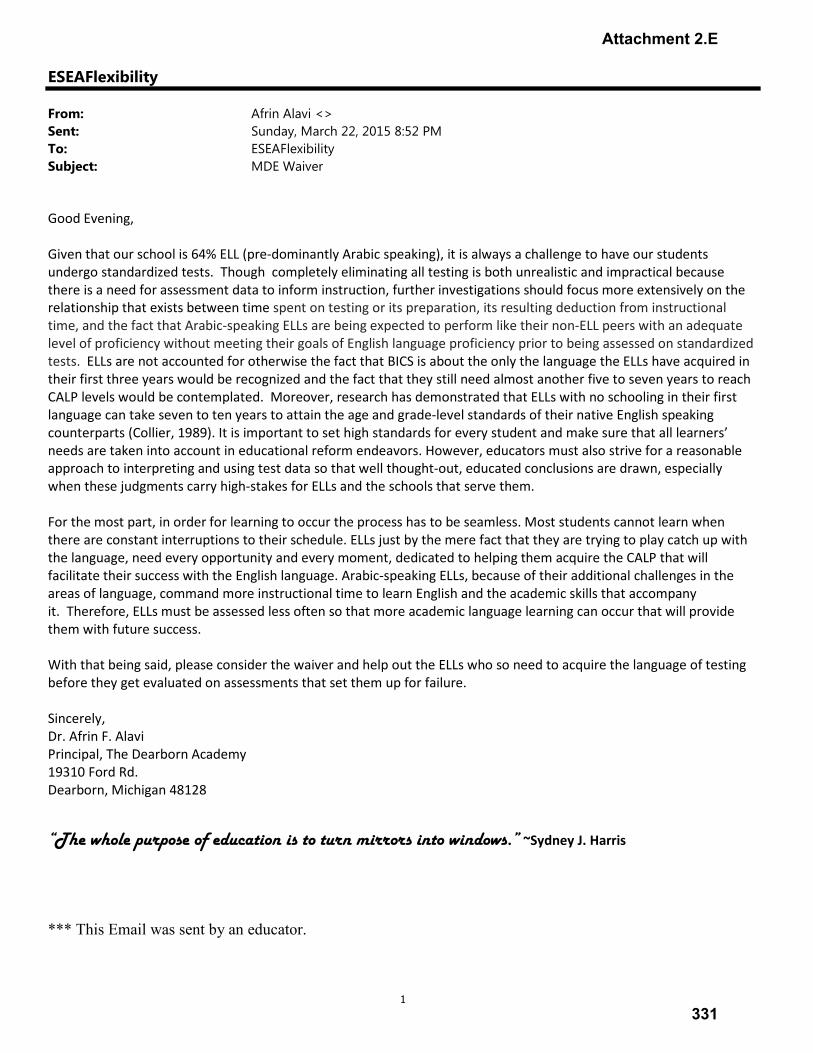
1
ESEAFlexibility
From: Afrin Alavi <>
Sent: Sunday, March 22, 2015 8:52 PM
To: ESEAFlexibility
Subject: MDE Waiver
Good Evening,
Given that our school is 64% ELL (pre-dominantly Arabic speaking), it is always a challenge to have our students
undergo standardized tests. Though completely eliminating all testing is both unrealistic and impractical because
there is a need for assessment data to inform instruction, further investigations should focus more extensively on the
relationship that exists between time spent on testing or its preparation, its resulting deduction from instructional
time, and the fact that Arabic-speaking ELLs are being expected to perform like their non-ELL peers with an adequate
level of proficiency without meeting their goals of English language proficiency prior to being assessed on standardized
tests. ELLs are not accounted for otherwise the fact that BICS is about the only the language the ELLs have acquired in
their first three years would be recognized and the fact that they still need almost another five to seven years to reach
CALP levels would be contemplated. Moreover, research has demonstrated that ELLs with no schooling in their first
language can take seven to ten years to attain the age and grade-level standards of their native English speaking
counterparts (Collier, 1989). It is important to set high standards for every student and make sure that all learners’
needs are taken into account in educational reform endeavors. However, educators must also strive for a reasonable
approach to interpreting and using test data so that well thought-out, educated conclusions are drawn, especially
when these judgments carry high-stakes for ELLs and the schools that serve them.
For the most part, in order for learning to occur the process has to be seamless. Most students cannot learn when
there are constant interruptions to their schedule. ELLs just by the mere fact that they are trying to play catch up with
the language, need every opportunity and every moment, dedicated to helping them acquire the CALP that will
facilitate their success with the English language. Arabic-speaking ELLs, because of their additional challenges in the
areas of language, command more instructional time to learn English and the academic skills that accompany
it. Therefore, ELLs must be assessed less often so that more academic language learning can occur that will provide
them with future success.
With that being said, please consider the waiver and help out the ELLs who so need to acquire the language of testing
before they get evaluated on assessments that set them up for failure.
Sincerely,
Dr. Afrin F. Alavi
Principal, The Dearborn Academy
19310 Ford Rd.
Dearborn, Michigan 48128
“The whole purpose of education is to turn mirrors into windows.” ~Sydney J. Harris
*** This Email was sent by an educator.
Attachment 2.E
331
1
ESEAFlexibility
From: Spencer, Terri <>
Sent: Monday, March 23, 2015 4:59 PM
To: ESEAFlexibility
Subject: Oakland Schools Feedback Re: Exit Criteria
Attachments: ESEA Flexibility Waiver Request- Priority and Focus Schools.pdf
Importance: High
We appreciate the opportunity to submit feedback on the MDE’s Flexibility Waiver Request.
Attached you will find a memorandum for consideration regarding exit criteria for 2010 and
2011 Persistently Lowest Achieving Schools.
Please let us know if you have questions, need clarification on any point or require additional
information.
Terri Dr. Terri Spencer Deputy Superintendent
Attachment 2.E
332

Administration
2111 Pontiac Lake Road Waterford, MI 48328-2736
Telephone: 248.209.2000 Facsimile: 248.209. 2206 www.oakland.k12.mi.us
memo To: Michigan Department of Education
From: Dr. Terri Spencer, Deputy Superintendent
Date: March 23, 2015
Re: OS Feedback on Michigan’s ESEA Flexibility Waiver Request- Priority and Focus Schools, 2010 and 2011
Oakland Schools sought input from our experts in the school improvement process
related to Priority and Focus Schools and received the following feedback related to
the new exit criteria and schools that were originally identified as Persistently
Lowest Achieving (PLA) in 2010 and 2011. Their feedback and recommendation is as
follows:
We like the fact that there are clear exit criteria for schools that are identified as
Priority and Focus. However, schools labeled, as PLA (Persistently Low Achieving) in
2010 and 2011 should not be held to the new exit criteria. The initial oversight of
these schools was for four years under the State Reform Officer (SRO). Keeping the
same exit criteria listed below is a fair methodology because schools understood
what criteria they needed to meet in order to exit the system. We have eliminated
the use of the implementation data because 2010 schools had no monitor therefore
implementation data was not collected. For the 2011 PLA schools, the change in the
assessments make it implausible that AMO’s could be met because the MDE will be
using this year’s data as an initial baseline. It is inappropriate, from our viewpoint to
Attachment 2.E
333

Administration
change the exit criteria at the end of their four year cycle. We recommend that the
MDE adhere to the original criteria given to the 2010 and 2011 PLA schools at the
time that they were identified (see criteria below).
Original Exit Criteria given to 2010 and 2011 PLA Schools:
“For a school to exit priority school status, they have to receive a Green, Lime,
Yellow or Orange on the Accountability Scorecard at the close of their third year in
the priority school intervention. In order to do this, a school must either meet
aggressive proficiency targets, which are set in order for the school to obtain 85% of
students proficient by the year 2022, or must have demonstrated significant
improvement. This proficiency and/or improvement gains must be demonstrated
not only in the all students group, but in each of the nine traditional ESEA subgroups
as well as in the new bottom 30% subgroup.
This means that a priority school who achieves a Green, Lime, Yellow or Orange on
the Accountability Scorecard and exits priority status has:
Met all interim measurements of progress for priority schools (approved plan,
leading and lagging indicators).
Met proficiency and/or improvement targets on average as a school.
Increased the proficiency rate of all traditional subgroups
Increased the proficiency rate of their very lowest performing students.”
We appreciate the opportunity to submit feedback on the MDE’s Flexibility Waiver
Request. Please let us know if you have questions, need clarification on any point or
require additional information.
Attachment 2.E
334
1
ESEAFlexibility
From: Lisa Westbrooks <>
Sent: Sunday, March 22, 2015 8:17 AM
To: ESEAFlexibility
Subject: ELL's
To Whom It May Concern: I have been working in the ESL community since 2006. It greatly concerns me that there are current constraints which does not allow ELL students to be successful.An even greater concern is that many ESL and Bilingual Bi-cultural programs have been discarded. What does this say about a country that has been built on the backs of immigrants? How can we ensure that today's immigrants receive a fair chance to become independent if we do not have programs to assist them to become self sufficient? Clearly we have a great number of immigrants who are in seek of a better life. Currently, new school age immigrants are force to take English tests that they are not prepared for. How can we expect success with those who are no speakers of English or those who do not speak English at all? Immigrant students should have a mandatory waiting period of three years before they can take state mandated test. Concrete studies show that it takes approximately two years for students to gain social language and five to ten years to gain academic language. Additionally, the law should enforce that only highly qualified teachers should teach these new language learners. There are many gaps in the education system that allows unqualified persons to teach these students. If there were more qualified teachers teaching ELL's they would receive educational services that are grounded in theory. Therefore, the law must include a clause which states that teachers, who are endorsed in ESL must teach our immigrant children. I am strongly requesting that you consider extending the length of time that ELL's must take state assessments and that highly qualified teachers are teaching ELL's. Regards, Lisa M. Westbrooks, BGS, MAT Middle School ESL Teacher [email protected] *** This Email was sent by an educator in Dearborn Academy.
Attachment 2.E
335
1
ESEAFlexibility
From: MacGregor, Erin <>
Sent: Monday, March 23, 2015 5:14 PM
To: ESEAFlexibility
Subject: Feedback
• Letter grades have a very negative connotation – consider using an alternative
system such as a dashboard that articulates whether or not standards are being met at the local level as well as actions being taken to address challenges. This dashboard
could also be used to highlight the research based strategies that are being implemented and having success at the local level.
• For Focus school cohort 2012 there is lack of clarity, and therefore, concern
regarding “conditionally suspended”. What does conditionally suspended mean? Would
funds be conditionally suspended as well? Please define more clearly.
• Focus schools will only use gap in Math and ELA. Tested subjects gain greater focus.
If subjects are ignored for accountability purposes they will become less important.
Please consider unintended consequences of not including Science and Social Studies.
• Please consider issues taking place at the local level regarding parent opt outs of
testing. Special consideration should be given with respect to the 95% participation rule. Districts and schools are doing everything possible to administer state required
assessment but have difficulty requiring parents to make their children take an assessment. A waiver option should be considered for schools that fall below the 95%
due to opt out demands.
• Please consider the stability of baseline data as it relates to M-STEP and it’s first
couple years of administration. We want to be sure accountability is stable for purposes
of making high stakes decisions and would like to be able to understand metrics in order to provide explanation to our board and community.
• As it relates to the graduation requirements for Focus schools, what considerations
will be given for alternative high schools that traditionally have struggling student
populations. Considerations must be made to allow alternative high schools some level of flexibility or removal from the Focus School designation altogether.
• Thank you, for making changes to the identification cycle. We appreciate allowing
districts to have a consistent focus support, a stable group of schools without
constantly changing “the list”.
• Greater flexibility and considerations should be given for transient populations
Attachment 2.E
336
2
Please consider removal of the 2013 and 2014 Focus School designation when appropriate improvements have been
made. Requiring schools identified to remain in the cohort until 2017 seems contradictory to the exit criteria’s
intention.
Best, -- Mr. Erin J. MacGregor Assistant Superintendent, Teaching & Learning Plymouth-Canton Community Schools
Right-click here to download pictures. To help protect your privacy, Outlook prevented automatic download of this picture from the Internet.
Attachment 2.E
337
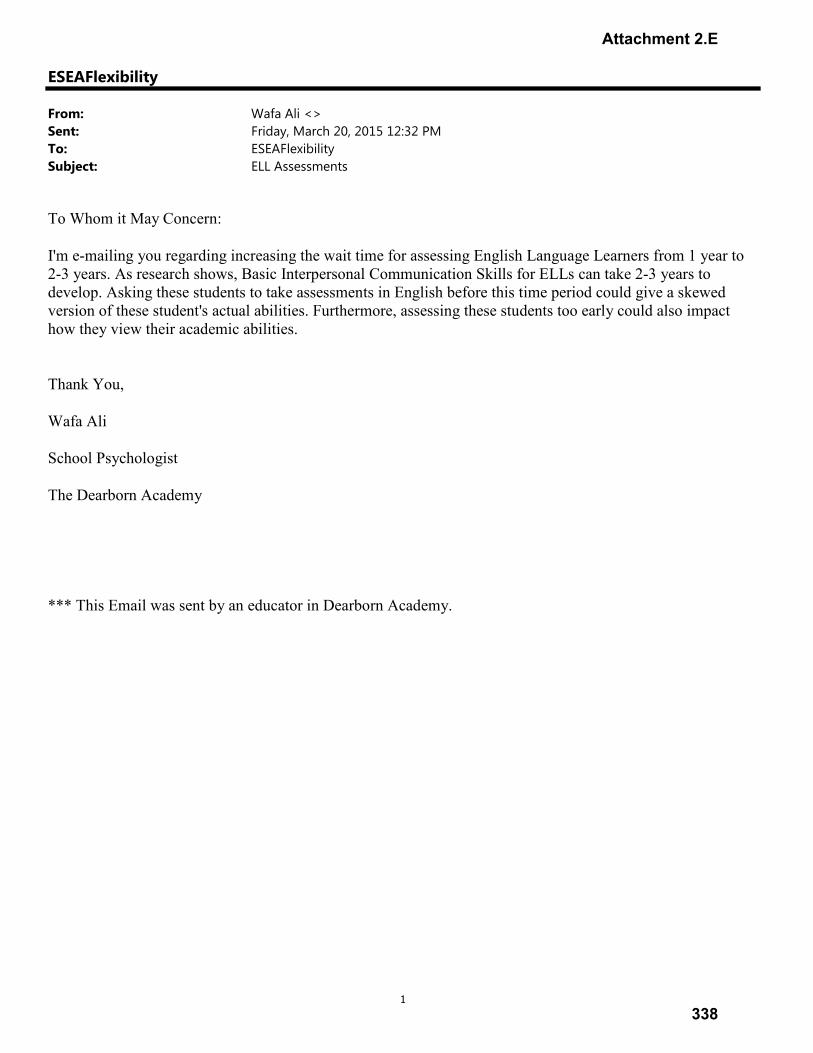
1
ESEAFlexibility
From: Wafa Ali <>
Sent: Friday, March 20, 2015 12:32 PM
To: ESEAFlexibility
Subject: ELL Assessments
To Whom it May Concern:
I'm e-mailing you regarding increasing the wait time for assessing English Language Learners from 1 year to 2-3 years. As research shows, Basic Interpersonal Communication Skills for ELLs can take 2-3 years to develop. Asking these students to take assessments in English before this time period could give a skewed version of these student's actual abilities. Furthermore, assessing these students too early could also impact how they view their academic abilities.
Thank You,
Wafa Ali
School Psychologist
The Dearborn Academy
*** This Email was sent by an educator in Dearborn Academy.
Attachment 2.E
338

1
ESEAFlexibility
From: Amanda Batcha <>
Sent: Monday, March 23, 2015 8:47 PM
To: ESEAFlexibility
Subject: ELL Testing
Please waive testing for ELLs who have been in the country less than 2-3 years.
Sent from my iPhone
Attachment 2.E
339
News Release Contact: Martin Ackley, Director of Communications, (517) 241-4395
Public Welcome to Review and Comment on State’s Federal Flexibility Waiver Request
February 2, 2012
LANSING – The Michigan Department of Education (MDE) has opened for public review and comment its proposed federal waiver application of 10 requirements established by the No Child Left Behind (NCLB) Act of 2001.
These waivers will allow needed flexibility for public schools in Michigan regarding the 2013-2014 timeline for determining Adequate Yearly Progress (AYP); implementation of school and district improvement requirements; rural districts; school-wide programs; support for school improvement; Reward Schools; Highly Qualified Teacher (HQT) improvement plans; the transfer of certain federal funds; and use of School Improvement Grant (SIG) funds to support priority schools.
In order to apply for and receive the waivers, the MDE has developed a comprehensive request based on four principles: Career- and College-Ready Expectations for All Students; State-Developed Differentiated Recognition, Accountability, and Support; Supporting Effective Instruction and Leadership; and Reducing Duplication and Unnecessary Burden.
Michigan's request for federal Elementary and Secondary Education Act (ESEA) flexibility is available now for review at: http://www.michigan.gov/documents/mde/ESEA_Flex_Waivers_Summary_372801_7.pdf
Public comment will be open until February 9, 2012 and should be submitted to: [email protected]
# # #
Attachment 3.A
340

State seeks waivers on some No Child Left Behind rules for schools
The Michigan Department of Education is seeking public comment through Thursday on its application to receive waivers from some of the rules of the federal No Child Left Behind law. The waivers would, among other things, allow the state to set lower proficiency goals for schools, for now, make more schools accountable and better intervene in the schools that most need help. No Child Left Behind -- the 10-year-old law that governs elementary and secondary education in the U.S. -- requires states to identify schools for improvement and penalize them if they don't meet academic goals, known as adequate yearly progress. The goal is that all students in the U.S. pass state exams in reading and math by the 2013-14 school year. But a growing number of schools -- nearly half nationwide this year and about 21% in Michigan -- are failing to meet the mandates. The Obama administration is encouraging states to apply for waivers. There are strings attached, though. Michigan and other states would have to provide evidence that they're working to
turn around failing schools, provide incentives to high-achieving schools, strengthen teacher and administration evaluations and provide data about college-readiness. Last fall, 11 states applied for waivers. Michigan and other applicants must have their requests in by Feb. 21. Among the changes Michigan would make in complying with the law: • The state would create a system in which individual goals are set for each school, rather than the current practice of expecting all 4,000 or so schools to meet the same goals. Some like this approach. "You want to be acknowledging and giving credit to schools that are making improvements from where they are," said Robert Floden, co-director of the Education Policy Center at Michigan State University.
Advertisement
Page 1 of 2Format Dynamics :: CleanPrint :: http://www.freep.com/apps/pbcs.dll/article?AID=20122...
2/21/2012http://www.freep.com/fdcp/?unique=1329846095519
Attachment 3.B
341
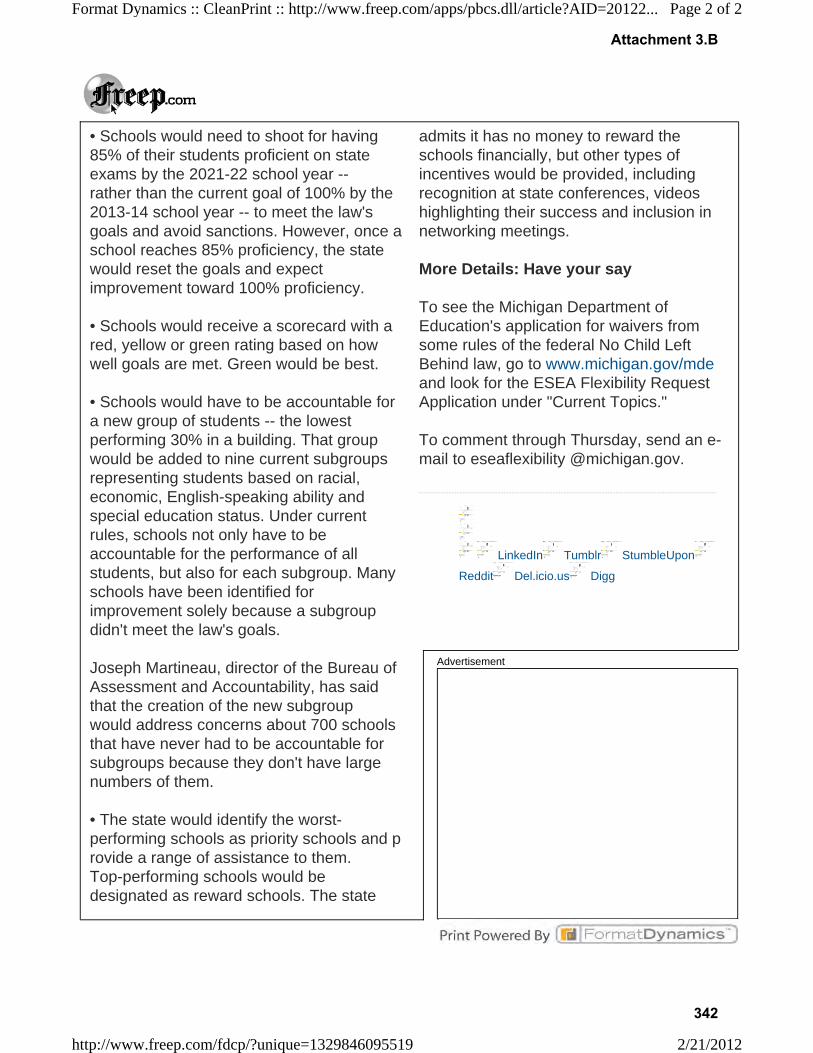
• Schools would need to shoot for having 85% of their students proficient on state exams by the 2021-22 school year -- rather than the current goal of 100% by the 2013-14 school year -- to meet the law's goals and avoid sanctions. However, once a school reaches 85% proficiency, the state would reset the goals and expect improvement toward 100% proficiency. • Schools would receive a scorecard with a red, yellow or green rating based on how well goals are met. Green would be best. • Schools would have to be accountable for a new group of students -- the lowest performing 30% in a building. That group would be added to nine current subgroups representing students based on racial, economic, English-speaking ability and special education status. Under current rules, schools not only have to be accountable for the performance of all students, but also for each subgroup. Many schools have been identified for improvement solely because a subgroup didn't meet the law's goals. Joseph Martineau, director of the Bureau of Assessment and Accountability, has said that the creation of the new subgroup would address concerns about 700 schools that have never had to be accountable for subgroups because they don't have large numbers of them. • The state would identify the worst- performing schools as priority schools and p rovide a range of assistance to them. Top-performing schools would be designated as reward schools. The state
admits it has no money to reward the schools financially, but other types of incentives would be provided, including recognition at state conferences, videos highlighting their success and inclusion in networking meetings. More Details: Have your say To see the Michigan Department of Education's application for waivers from some rules of the federal No Child Left Behind law, go to www.michigan.gov/mde and look for the ESEA Flexibility Request Application under "Current Topics." To comment through Thursday, send an e- mail to eseaflexibility @michigan.gov.
LinkedIn Tumblr StumbleUpon
Reddit Del.icio.us Digg
Advertisement
Page 2 of 2Format Dynamics :: CleanPrint :: http://www.freep.com/apps/pbcs.dll/article?AID=20122...
2/21/2012http://www.freep.com/fdcp/?unique=1329846095519
Attachment 3.B
342
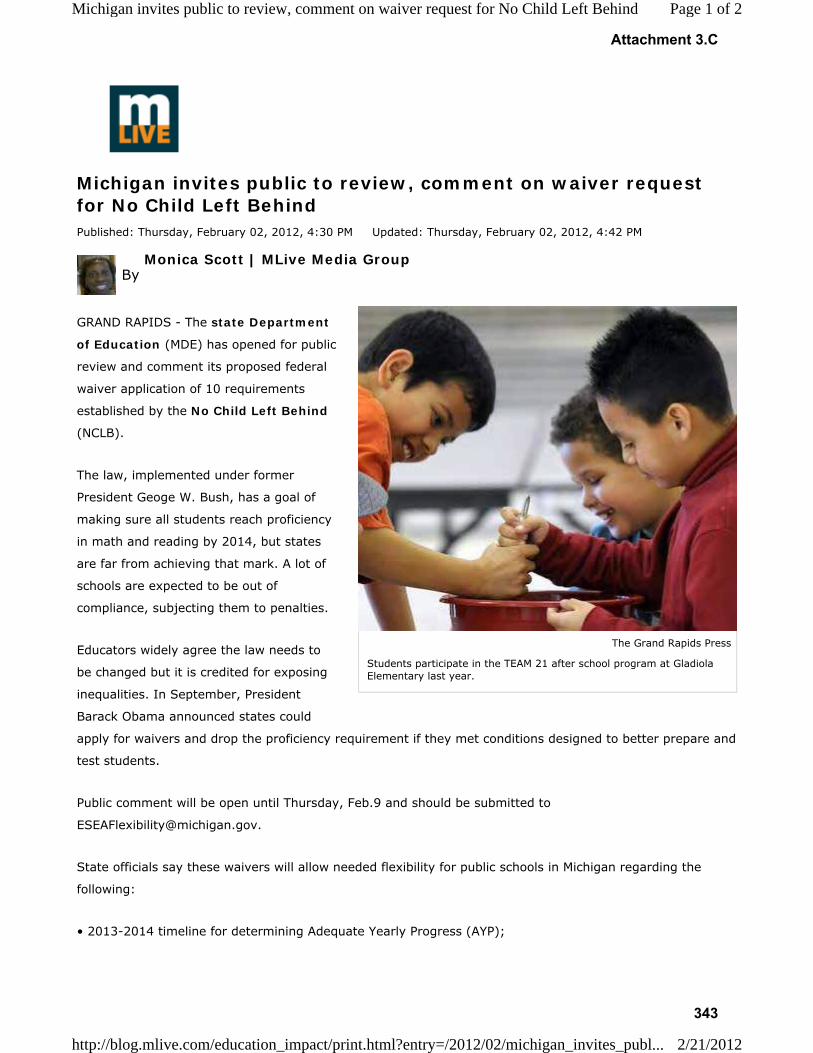
The Grand Rapids Press
Students participate in the TEAM 21 after school program at Gladiola Elementary last year.
Michigan invites public to review, comment on waiver request for No Child Left Behind Published: Thursday, February 02, 2012, 4:30 PM Updated: Thursday, February 02, 2012, 4:42 PM
By
Monica Scott | MLive Media Group
GRAND RAPIDS - The state Department
of Education (MDE) has opened for public
review and comment its proposed federal
waiver application of 10 requirements
established by the No Child Left Behind
(NCLB).
The law, implemented under former
President Geoge W. Bush, has a goal of
making sure all students reach proficiency
in math and reading by 2014, but states
are far from achieving that mark. A lot of
schools are expected to be out of
compliance, subjecting them to penalties.
Educators widely agree the law needs to
be changed but it is credited for exposing
inequalities. In September, President
Barack Obama announced states could
apply for waivers and drop the proficiency requirement if they met conditions designed to better prepare and
test students.
Public comment will be open until Thursday, Feb.9 and should be submitted to
State officials say these waivers will allow needed flexibility for public schools in Michigan regarding the
following:
• 2013-2014 timeline for determining Adequate Yearly Progress (AYP);
Page 1 of 2Michigan invites public to review, comment on waiver request for No Child Left Behind
2/21/2012http://blog.mlive.com/education_impact/print.html?entry=/2012/02/michigan_invites_publ...
Attachment 3.C
343
•implementation of school and district improvement requirements;
•rural districts;
•school-wide programs;
•support for school improvement;
•Reward Schools;
•Highly Qualified Teacher (HQT) improvement plans;
•the transfer of certain federal funds; and
•use of School Improvement Grant (SIG) funds to support priority schools.
Michigan's request for federal Elementary and Secondary Education Act (ESEA) flexibility is available now for
review on the statewebsite.
In order to apply for and receive the waivers, the MDE officials say it has developed a comprehensive
request based on four principles: Career- and College-Ready expectations for all students; state-developed
differentiated recognition, accountability, and support; supporting effective instruction and leadership; and
reducing duplication and unnecessary burden.
Email:Monica Scott at [email protected] and follow her on Twitter at Twitter.com/GRPScotty.
© 2012 MLive.com. All rights reserved.
Page 2 of 2Michigan invites public to review, comment on waiver request for No Child Left Behind
2/21/2012http://blog.mlive.com/education_impact/print.html?entry=/2012/02/michigan_invites_publ...
Attachment 3.C
344

NOTE: The public will be given an opportunity to comment prior to a vote. Because it is impossible to project an exact time for each item, the public is encouraged to attend the entire meeting to be assured an opportunity to comment on a specific item.
The State Board of Education agenda and material are available on the web at
www.michigan.gov/mde
State Board of Education meetings are open to the public. Persons with disabilities needing accommodations for effective participation in the meeting should contact the Office of the State Board of Education at 517/373-3902 (voice) or 517/373-9434 (TDD) a week in advance to request mobility, visual, hearing, or other assistance.
AGENDA
MICHIGAN
STATE BOARD OF EDUCATION
Ladislaus B. Dombrowski Board Room Fourth Floor, John A. Hannah Building
608 West Allegan Lansing, Michigan
December 6, 2011
9:30 a.m.
I. CALL TO ORDER
II. APPROVAL OF AGENDA AND ORDER OF PRIORITY
COMMITTEE OF THE WHOLE MEETING
III. DISCUSSION ITEMS
A. Presentation on Elementary and Secondary Education Act Flexibility (Education Improvement and Innovation – Linda Forward; Assessment and Accountability – Joseph Martineau)
B. Presentation on Smarter/Balanced Assessment Consortium (SBAC)
(Assessment and Accountability – Joseph Martineau)
C. Discussion Regarding Criteria for Grant Program
Criteria for the Title II Part A(1): Improving Teacher and Principal Quality Grant, No Child Left Behind Act
(Professional Preparation Services – Flora Jenkins) Criteria for Evaluation for the 21st Century Community
Learning Centers Program (Early Childhood Education and
Family Services – Lindy Buch)
IV. RECESS
Attachment 3.D
345

2
REGULAR MEETING
V. CALL TO ORDER
VI. APPROVAL OF STATE BOARD OF EDUCATION MINUTES
D. Approval of Minutes of Regular and Committee of the Whole Meeting
of November 8, 2011
VII. PRESIDENT’S REPORT
VIII. REPORT OF THE SUPERINTENDENT (Items on the Report of the Superintendent
include information on administrative decisions made by the Superintendent. The documents are provided to the members of the Board for their information.)
Report
E. Human Resources Report
Grants
F. Report on Grant Awards
2010-2011 21st Century Community Learning Centers (21st CCLC) Before- and After-School Summer Program
Expansion Grant – Amendment (Early Childhood and Family Services – Lindy Buch)
2011-2012 Mathematics and Science Centers – Initial
(Education Improvement and Innovation – Linda Forward) 2011-2012 State School Aid Act Section 99(6) Mathematics
and Science Centers – Initial (Education Improvement and Innovation – Linda Forward)
2010-2011 ARRA Title I School Improvement Grant –
Amendment (Education Improvement and Innovation – Linda Forward)
2011-2012 Title I, Part D – Prevention and Intervention for Neglected and Delinquent – Amendment (Field Services – Mike Radke)
2011-2012 Title I, Part D – Prevention and Intervention for Neglected and Delinquent – Amendment (Field Services –
Mike Radke) 2011-2012 Title III, Part A, Immigrant Program – Initial
(Field Services – Mike Radke)
2011-2012 Title III – English Language Acquisition Program – Initial (Field Services – Mike Radke)
2011-2012 McKinney-Vento Homeless Students Assistance Grant – Initial (Field Services – Mike Radke)
IX. REPORT OF MICHIGAN TEACHER OF THE YEAR
X. PUBLIC PARTICIPATION IN STATE BOARD OF EDUCATION MEETING
Attachment 3.D
346

3
XI. DISCUSSION/ACTION ITEMS
G. State Board of Education 2012-2013 Education Budget Recommendations, and 2013-14 Budget Recommendations Planning Process
H. State and Federal Legislative Update (Legislative Director – Lisa
Hansknecht)
XII. CONSENT AGENDA (Items are on the consent agenda to be voted on as a
single item by the Board. Board members may remove items from the consent agenda prior to the vote. Items removed from the consent agenda
will be discussed individually.) Criteria
I. Approval of Criteria for the Title II Part A(1): Improving Teacher
and Principal Quality Grant, No Child Left Behind Act (Professional Preparation Services – Flora Jenkins)
J. Approval of Criteria for Evaluation for the 21st Century Community
Learning Centers Program (Early Childhood Education and Family
Services – Lindy Buch)
XIII. COMMENTS BY STATE BOARD OF EDUCATION MEMBERS XIV. FUTURE MEETING DATES
A. Tuesday, January 10, 2012 (9:30 a.m.)
B. Tuesday, February 14, 2012 (9:30 a.m.) C. Tuesday, March 13, 2012 (9:30 a.m.) D. Tuesday, April 10, 2012 (9:30 a.m.)
XV. ADJOURNMENT
Attachment 3.D
347

4
INFORMATIONAL FOLDER ITEM
Information on Nominations to the Special Education Advisory Committee (SEAC)
Information on the Early Childhood Investment Corporation (ECIC) Great Start Collaboratives Legislative Report
Attachment 3.D
348

1
MINUTES
STATE BOARD OF EDUCATION
Ladislaus B. Dombrowski Board Room John A. Hannah Building
608 West Allegan
Lansing, Michigan
January 10, 2012 9:30 a.m.
Present: Mr. Michael P. Flanagan, Chairman Mr. John C. Austin, President
Dr. Casandra E. Ulbrich, Vice President Mrs. Nancy Danhof, Secretary
Mrs. Marianne Yared McGuire, Treasurer (via telephone)
Dr. Richard Zeile, NASBE Delegate Mrs. Kathleen N. Straus
Mr. Daniel Varner Mrs. Eileen Weiser
Also Present: Mr. Paul Galbenski, 2011-2012 Michigan Teacher of the Year
REGULAR MEETING
I. CALL TO ORDER
Mr. Flanagan called the meeting to order at 9:42 a.m.
II. AGENDA FOLDER ITEMS
A. Minutes of the Regular and Committee of the Whole Meeting of
December 6, 2011, as revised
III. APPROVAL OF AGENDA AND ORDER OF PRIORITY
Mr. Austin moved, seconded by Mrs. Weiser, that the State Board of Education approve the agenda and order of priority.
The vote was taken on the motion.
Ayes: Austin, McGuire, Straus, Ulbrich, Varner, Weiser, Zeile Absent: Danhof
The motion carried.
Attachment 3.E
349

2
IV. INTRODUCTION OF STATE BOARD OF EDUCATION MEMBERS AND MICHIGAN TEACHER OF THE YEAR
Mrs. Marilyn Schneider, State Board Executive, introduced members of the
State Board of Education and the Michigan Teacher of the Year.
V. PERSONAL PRIVILEGE – MICHAEL P. FLANAGAN
Mr. Flanagan offered condolences to Mrs. Elizabeth Bauer, former State
Board of Education member, on the recent passing of her husband, George.
VI. RECESS
The Board recessed the Regular Meeting at 9:44 a.m.
COMMITTEE OF THE WHOLE MEETING
VII. CALL TO ORDER
Mr. Flanagan called the Committee of the Whole Meeting to order at 9:45 a.m.
VIII. PRESENTATION ON MI SCHOOL DATA
Dr. Sally Vaughn, Deputy Superintendent and Chief Academic Officer; Dr. David Judd, Director of Psychometrics, Accountability, Research
and Evaluation in the Bureau of Assessment and Accountability; Mr. Tom Howell, Director, Center for Educational Performance and Information; and Mr. Paul Bielawski, School Data Manager, Center for
Educational Performance and Information; presented MI School Data.
Mr. Flanagan said the MI School Data portal provides Michigan education data to help educators, parents, and community members make informed educational decisions to help improve instruction and
enable school systems to prepare a higher percentage of students to succeed in rigorous high school courses, college and careers.
Mr. Howell and Mr. Bielawski provided information via a PowerPoint presentation.
Board members said they appreciate the rich source of data available
through www.MISchoolData.org. They asked clarifying questions and offered suggestions for improvement. There was discussion regarding the balance of sharing complex data and making the website user
friendly.
Attachment 3.E
350

3
IX. PRESENTATION ON THE REVISED STANDARDS FOR THE PREPARATION
OF TEACHERS OF LIBRARY MEDIA (ND)
Dr. Sally Vaughn, Deputy Superintendent and Chief Academic Officer; Dr. John VanWagoner, Interim Assistant Director, Professional Preparation Services; and Mr. Thomas Bell, Higher Education
Consultant; presented the Revised Standards for the Preparation of Teachers of Library Media (ND).
Mr. Flanagan said in order to prepare teachers to meet the needs of P-12 school districts, the Library Media standards have been revised
to show the adoption of the national standards for Library Media by the American Library Association. He said a referent committee was
responsible for reviewing the national standards and making the recommendation for adoption.
Board members asked clarifying questions, and suggested edits. There was discussion regarding the amount of time allowed for field
review before documents are approved by the Board.
Following field review, the standards will be presented to the Board for approval in March.
X. PERSONAL PRIVILEGE – MICHAEL P. FLANAGAN
Mr. Flanagan introduced Ms. Susan Broman, Deputy Superintendent, Office of Great Start, who was in attendance at the meeting. He said Ms. Broman will officially join the Department on January 23, 2012.
XI. PRESENTATION ON STATUS OF 2011-2012 STATE BOARD OF EDUCATION/
MICHIGAN DEPARTMENT OF EDUCATION REFORM PRIORITIES
Dr. Sally Vaughn, Deputy Superintendent and Chief Academic Officer,
presented Status of 2011-2012 State Board of Education/Michigan Department of Education Reform Priorities.
Mr. Flanagan said this is a review of the progress made on the State Board of Education/Michigan Department of Education Reform Priorities for 2011-
2012, as adopted by the Board on June 14, 2011. He said a progress review will be presented annually at the January Board meeting.
Dr. Vaughn reviewed the priorities noting progress and completion.
Mr. Austin said he appreciates the work done by staff to complete priority items. He said he is eager to make progress on opportunities for students
to participate in early and middle colleges; dual enrollment; and Any Time, Any Place, Any Way, Any Pace. He said it is also important to advance
Attachment 3.E
351

4
teacher quality support efforts. Mr. Flanagan said those topics are under discussion, and he suggested that they be topics for the Board’s retreat.
Mrs. Weiser said digital learning requires a discussion at the state level
regarding special education and other supports to allow the experience to be successful. Mr. Flanagan said there is a group working on the topic.
XII. PRESENTATION ON THE NATIONAL ASSESSMENT OF EDUCATIONAL PROGRESS AND TRIAL URBAN DISTRICT ASSESSMENT RESULTS
Dr. Sally Vaughn, Deputy Superintendent and Chief Academic Officer; and Dr. Joseph Martineau, Director, Bureau of Assessment and Accountability;
presented National Assessment of Educational Progress and Trial Urban District Assessment Results.
Mr. Flanagan said Mrs. Weiser requested this presentation.
Mrs. Weiser said the Trial Urban District Assessment (TUDA) is the only assessment in the National Assessment of Educational Progress (NAEP)
that attributes data to specific city school districts. She said it is done by request of the Council of Great City Schools, and large city school
districts volunteer to participate. Dr. Martineau said NAEP is sponsored by the U.S. Department of
Education and provides periodic report cards on a number of subjects. He said the Nation’s Report Card compares performance among states,
urban districts, private and public schools, and student demographic groups. He said the governing body is the National Assessment Governing Board, and Mrs. Weiser is a member.
Dr. Martineau said TUDA began in 2002 and is designed to explore using
NAEP to measure performance at the large district level. He said Detroit volunteered to participate in the past two assessments in 2009 and 2011.
Dr. Martineau provided information via a PowerPoint presentation.
Mrs. Weiser said while Detroit is starting at the bottom of U.S. cities, they are starting to show increased student progress on TUDA which we hope will lead to significant gains soon. Mrs. Weiser said the full TUDA Report
is available at http://nationsreportcard.gov, and Pieces of the Puzzle – Factors in the Improvement of Urban School Districts on the National
Assessment of Educational Progress is available at www.cgcs.org. Mrs. McGuire asked if the same Detroit schools were assessed in 2009 and
2011. Dr. Martineau said they were not the same schools, but through random representative samplings they are statistically comparable.
Attachment 3.E
352

5
XIII. DISCUSSION REGARDING CRITERIA FOR GRANT PROGRAM
There were no Board member comments regarding grant criteria.
XIV. ADJOURNMENT
The Board adjourned the Committee of the Whole at 12:02 p.m. and
reconvened the Regular Meeting at 1:02 p.m.
Mrs. McGuire ended her telephone connection at 12:02 p.m.
REGULAR MEETING
XV. APPROVAL OF STATE BOARD OF EDUCATION MINUTES
Approval of Minutes of Committee of the Whole and Regular Meeting of December 6, 2011
Mrs. Danhof moved, seconded by Dr. Ulbrich, that the State
Board of Education approve the Minutes of the Committee of the Whole and Regular Meeting of December 6, 2011.
Mr. Austin said the agenda folder contains edits to the Minutes which will be incorporated into the final version.
The vote was taken on the motion.
Ayes: Austin, Danhof, Straus, Ulbrich, Varner, Weiser, Zeile Absent During Vote: McGuire
The motion carried.
XVI. PUBLIC PARTICIPATION IN STATE BOARD OF EDUCATION MEETING
A. Dr. Kristin Fontichiaro, Ann Arbor, Michigan. Dr. Fontichiaro, University of Michigan School of Information, provided verbal
comments in support of K-12 library learning standards.
B. Ms. Sandra York, Ann Arbor, Michigan. Ms. York, Executive
Director, Michigan Parent Teacher Association (PTA), provided verbal comments on the PTA Reflections Program where Michigan
students will have artwork displayed at the U.S. Department of Education in Washington, DC.
C. Mr. John Lauve, Holly, Michigan. Mr. Lauve provided verbal and written comments regarding his annual report.
Mrs. McGuire resumed her telephone connection at 1:15 p.m.
Attachment 3.E
353

6
XVII. PRESIDENT’S REPORT
Mr. Austin said the Board unanimously approved Budget Priority
Recommendations at its December meeting. He said there is a budget surplus, and he is reinforcing the importance of strategically investing in education priorities.
Mr. Austin said at its December meeting, the Board also approved a
process for taking a comprehensive look at the education funding system. He said he will report on that at a future meeting.
Mr. Austin said with the passage of legislation expanding charter schools and choice, he personally is concerned that all schools be schools of
quality. He said there also is a need to challenge charter schools to develop quality high schools. He said he heralds the accountability and transparency provisions in the legislation.
XVIII. REPORT OF THE SUPERINTENDENT
Reports
E. Human Resources Update
F. Report on the Department of Education Cosponsorship
Grants H. Report on Grant Awards
2010-2011 William F. Goodling Even Start Family Literacy
Program Grants – Amendment 2011-2012 Safe and Supportive Schools Grant – Amendment 2011-2012 U.S. Dept. of Agriculture (USDA) Fresh Fruit and
Vegetable Program (FFVP) – Amendment 2010-2011 ARRA Title I School Improvement Grant –
Amendment 2011-2012 Mathematics and Science Partnership (MSP)
Grant Program (Title II, Part B) – Initial
2009-2010 Enhancing Education Through Technology, Title II, Part D, Competitive Program, Regional Data Initiatives
Continuation Grant – Initial 2010-2011 Enhancing Education Through Technology, Title II,
Part D, Competitive Program, Regional Data Initiatives
Continuation Grant – Initial 2009-2010 Enhancing Education Through Technology, Title II,
Part D, Competitive Program, Michigan Education Data Portal Grant – Amendment
Attachment 3.E
354

7
2011-2012 Title I, Part D – Prevention and Intervention for Neglected and Delinquent – Amendment
2010-2011 Title III – English Language Acquisition Program – Amendment
Mr. Flanagan provided an update on the Department’s application for Elementary and Secondary Education Act Flexibility that is being submitted
to the U.S. Department of Education in mid-February.
Mr. Flanagan said Benton Harbor Area Schools should be acknowledged for working diligently to make significant progress on the elimination of its deficit.
Mr. Flanagan said school districts in Michigan received their Fall 2011 MEAP
student-level results the week of December 12, 2011. He said this is the third consecutive year that schools have received the data prior to winter break.
Mrs. Danhof left the meeting at 2:00 p.m.
XIX. REPORT OF THE MICHIGAN TEACHER OF THE YEAR
Mr. Paul Galbenski, 2011-2012 Michigan Teacher of the Year, presented the Report of the Michigan Teacher of the Year. He provided a verbal
update to his written report including Widening Advancement for Youth, Southfield-Lathrup High School presentation on career and technical
education programs, America’s Marketing High School – Super Bowl Project, Oakland Counselors Association Meeting, School Improvement Conference, Governor’s Council on Educator Effectiveness, Network of
Michigan Educators Meeting, Oakland Schools Education Foundation Board Meeting, and Oakland County Transition Coordinators Meeting.
XX. STATE AND FEDERAL LEGISLATIVE UPDATE
Ms. Lisa Hansknecht, State and Federal Legislative Director, presented the State and Federal Legislative Update.
Ms. Hansknecht said the School Quality Workgroup is a bipartisan, bicameral workgroup that has been established as a requirement of the charter school
expansion bill. She said the members must make recommendations to the Education committees in both chambers on measures to be taken to improve
educational quality in all public schools. She said the workgroup will submit its recommendations by March 30, 2012.
Dr. Ulbrich asked if the State Board of Education and the education community will be asked to provide input in the School Quality Workgroup.
There was Board consensus that the State Board of Education Legislative Committee will look for common ground to provide input.
Attachment 3.E
355

8
Ms. Hansknecht provided an update on dual enrollment and shared time legislation, cyber schools legislation, burdensome reports,
accreditation, and the budget.
Mrs. Straus asked if the State Board of Education’s Model Anti-Bullying
Policy will be made available to school districts as they review and develop policies prohibiting bullying, as required by the passage of Matt’s Safe School Law (MCL 380.1310b). Mr. Flanagan said
superintendents will receive a reminder notice.
XXI. CONSENT AGENDA
Approval
J. Approval of Professional Learning Policy and Standards
Criteria
K. Approval of Criteria for the Training and Technical Assistance Grant for the 21st Century Community Learning Centers Program
Mr. Austin moved, seconded by Dr. Zeile, that the State Board of Education approve the Consent Agenda as follows:
J. approve the Michigan Department of Education Professional
Learning Policy and the Michigan Department of Education
Standards for Professional Learning, as attached to the Superintendent’s memorandum dated January 3, 2012; and
K. approve the Criteria for Training and Technical Assistance
Grant for the 21st Century Community Learning Centers
Program, as described in the Superintendent’s memorandum dated December 11, 2011.
Mr. Austin said Mrs. Danhof, prior to leaving the meeting, asked him to convey her concerns regarding the continuum of professional learning.
He said he trusts it is included in the Professional Learning Policy and Standards.
Mrs. Straus suggested that the definition of “job embedded” be more clearly defined in the guidance document.
The vote was taken on the motion.
Ayes: Austin, McGuire, Straus, Ulbrich, Varner, Weiser, Zeile
Absent: Danhof The motion carried.
Attachment 3.E
356

9
XXII. COMMENTS BY STATE BOARD OF EDUCATION MEMBERS
There were no additional comments by State Board of Education members.
XXIII. TENTATIVE AGENDA FOR NEXT MEETING
Mr. Flanagan said Board members may contact a member of the Agenda Planning Committee comprised of Mr. Austin, Dr. Ulbrich, and Mrs. Danhof
with suggestions for agenda topics.
XXIV. FUTURE MEETING DATES
A. Tuesday, February 14, 2012 (9:30 a.m.)
B. Tuesday, March 13, 2012 (9:30 a.m.) C. Tuesday, April 10, 2012 (9:30 a.m.) D. Tuesday, May 8, 2012 (9:30 a.m.)
XXV. ADJOURNMENT
The meeting adjourned at 2:35 p.m.
The video archive of the meeting is available at www.michigan.gov/sbe.
Respectfully submitted,
Nancy Danhof Secretary
Attachment 3.E
357
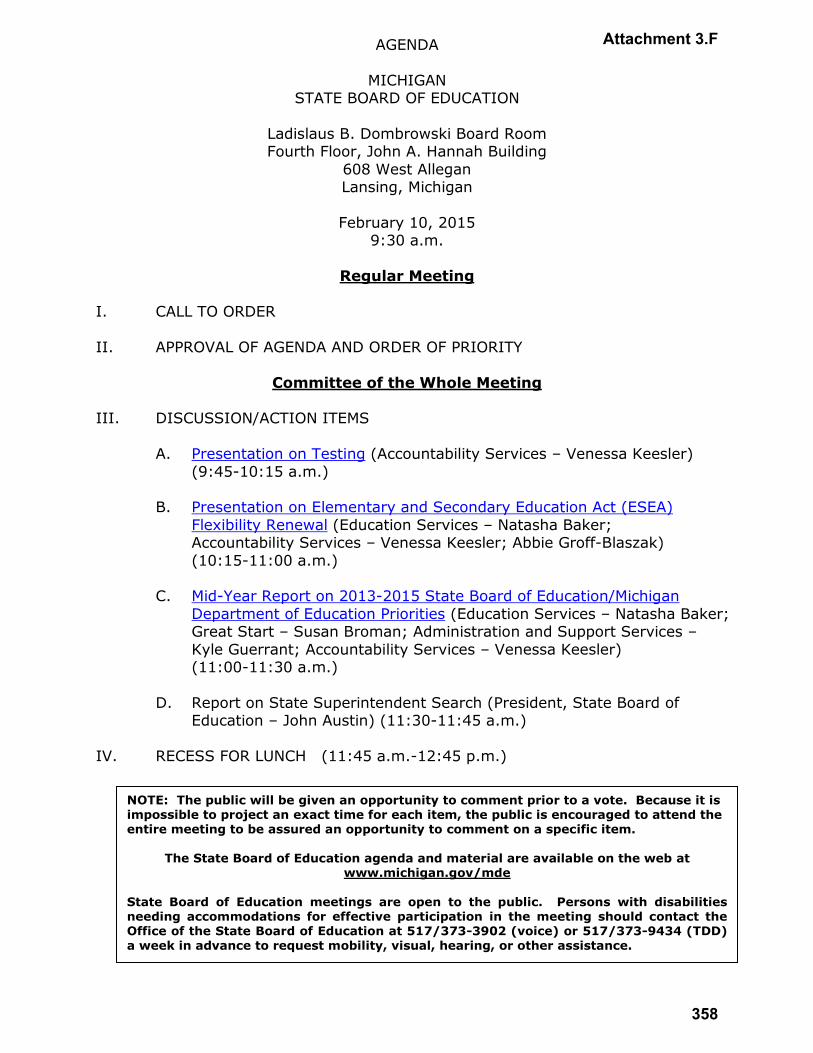
NOTE: The public will be given an opportunity to comment prior to a vote. Because it is impossible to project an exact time for each item, the public is encouraged to attend the entire meeting to be assured an opportunity to comment on a specific item.
The State Board of Education agenda and material are available on the web at www.michigan.gov/mde
State Board of Education meetings are open to the public. Persons with disabilities needing accommodations for effective participation in the meeting should contact the Office of the State Board of Education at 517/373-3902 (voice) or 517/373-9434 (TDD) a week in advance to request mobility, visual, hearing, or other assistance.
AGENDA
MICHIGAN STATE BOARD OF EDUCATION
Ladislaus B. Dombrowski Board Room Fourth Floor, John A. Hannah Building
608 West Allegan Lansing, Michigan
February 10, 2015
9:30 a.m.
Regular Meeting
I. CALL TO ORDER
II. APPROVAL OF AGENDA AND ORDER OF PRIORITY
Committee of the Whole Meeting III. DISCUSSION/ACTION ITEMS
A. Presentation on Testing (Accountability Services – Venessa Keesler)
(9:45-10:15 a.m.)
B. Presentation on Elementary and Secondary Education Act (ESEA)
Flexibility Renewal (Education Services – Natasha Baker; Accountability Services – Venessa Keesler; Abbie Groff-Blaszak)
(10:15-11:00 a.m.)
C. Mid-Year Report on 2013-2015 State Board of Education/Michigan
Department of Education Priorities (Education Services – Natasha Baker; Great Start – Susan Broman; Administration and Support Services –
Kyle Guerrant; Accountability Services – Venessa Keesler) (11:00-11:30 a.m.)
D. Report on State Superintendent Search (President, State Board of
Education – John Austin) (11:30-11:45 a.m.)
IV. RECESS FOR LUNCH (11:45 a.m.-12:45 p.m.)
Attachment 3.F
358

2
Regular Meeting
V. CALL TO ORDER VI. PUBLIC PARTICIPATION IN STATE BOARD OF EDUCATION MEETING
(12:45-1:15 p.m.)
Committee of the Whole Meeting III. DISCUSSION ITEMS (continued)
E. Presentation on Innovative Education Programs (PerformancED –
Rogelio Landin; Southeast Michigan Council of Governments – Bob Morris and Naheed Huq; Michigan Pro-Public Educators – Karen Twomey and Tom Pedroni) (1:15-2:15 p.m.)
F. Recognition of Education Award Winner Michele Anderson
(2:15-2:25 p.m.)
Regular Meeting
VII. APPROVAL OF STATE BOARD OF EDUCATION MINUTES (2:25 p.m.)
G. Approval of Minutes of Regular and Committee of the Whole Meeting
of January 13, 2015
VIII. PRESIDENT’S REPORT (2:30-2:45 p.m.)
IX. REPORT OF THE SUPERINTENDENT (Items on the Report of the
Superintendent include information on administrative decisions made by
the Superintendent. The documents are provided to the members of the Board for their information.)
Report (2:45-3:00 p.m.)
H. Human Resources Report
Grants
I. Report on Grant Awards
1. 2014-2015 State School Aid Act Section 61a. (3) Integration of
Michigan Merit Curriculum Content Standards – Initial; $1,000,000 (Education Services – Natasha Baker; Career and Technical
Education – Patty Cantu) 2. 2014-2015 Regional Assistance to High Priority Schools –
Amendment; $13,580,925 (Education Services – Natasha Baker; Education Improvement and Innovation – Linda Forward)
Attachment 3.F
359

3
3. 2014-2015 Section 99h: Competitive FIRST Robotics Grants – Amendment; $2,062,400 (Education Services – Natasha Baker;
Education Improvement and Innovation – Linda Forward) 4. 2013-2014 Title III, Part A, English Language Acquisition Program –
Amendment; $8,222,352 (Education Services – Natasha Baker; Field Services – Mike Radke)
5. 2013-2014 Title III, Part A, Immigrant Students Program –
Amendment; $1,460,915 (Education Services – Natasha Baker;
Field Services – Mike Radke)
6. 2014-2015 Title I, Part A - Improving Basic Programs – Amendment; $486,522,747 (Education Services – Natasha Baker; Field Services – Mike Radke)
7. 2014-2015 Title I, Part C Regular Year Migrant Program
Allocations – Amendment; $3,639,380 (Education Services – Natasha Baker; Field Services – Mike Radke)
X. REPORT OF MICHIGAN TEACHER OF THE YEAR (3:00-3:15 p.m.)
XI. DISCUSSION/ACTION ITEMS
J. State and Federal Legislative Update (Office of Public and
Governmental Affairs – Martin Ackley; Chair, SBE Legislative Committee – Casandra Ulbrich) (3:15-3:45 p.m.)
XII. CONSENT AGENDA (Items are on the consent agenda to be voted on as
a single item by the Board. Board members may remove items from the
consent agenda prior to the vote. Items removed from the consent agenda will be discussed individually.)
K. Approval of State Board of Education and Michigan Department of
Education Cosponsorships (Great Start – Susan Broman; Early Childhood Development and Family Education – Reneé DeMars-Johnson; Out-of-School Time Learning – Richard Lower)
XIII. COMMENTS BY STATE BOARD OF EDUCATION MEMBERS (3:45-4:00 p.m.)
XIV. FUTURE MEETING DATES
A. Tuesday, March 17, 2015 (9:30 a.m.) B. Tuesday, April 14, 2015 (9:30 a.m.)
C. Tuesday, May 12, 2015 (9:30 a.m.)
XV. ADJOURNMENT (4:00 p.m.)
Attachment 3.F
360
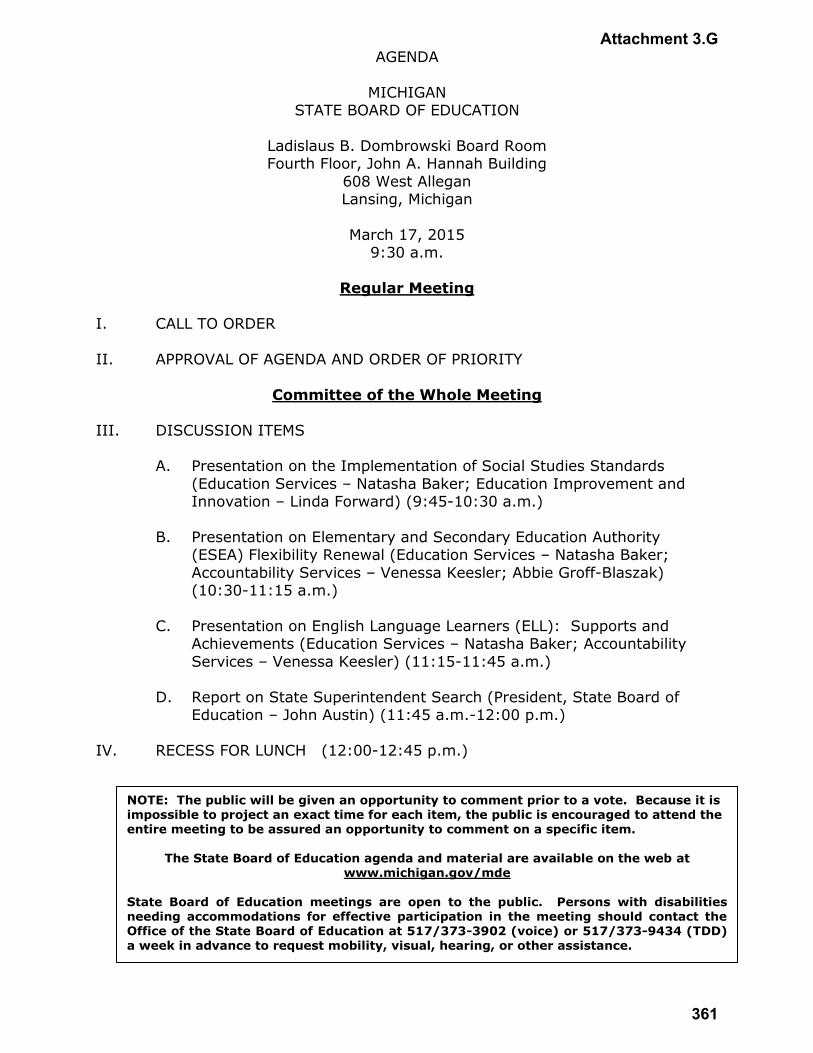
NOTE: The public will be given an opportunity to comment prior to a vote. Because it is impossible to project an exact time for each item, the public is encouraged to attend the entire meeting to be assured an opportunity to comment on a specific item.
The State Board of Education agenda and material are available on the web at www.michigan.gov/mde
State Board of Education meetings are open to the public. Persons with disabilities needing accommodations for effective participation in the meeting should contact the Office of the State Board of Education at 517/373-3902 (voice) or 517/373-9434 (TDD) a week in advance to request mobility, visual, hearing, or other assistance.
AGENDA
MICHIGAN STATE BOARD OF EDUCATION
Ladislaus B. Dombrowski Board Room Fourth Floor, John A. Hannah Building
608 West Allegan Lansing, Michigan
March 17, 2015
9:30 a.m.
Regular Meeting
I. CALL TO ORDER
II. APPROVAL OF AGENDA AND ORDER OF PRIORITY
Committee of the Whole Meeting
III. DISCUSSION ITEMS
A. Presentation on the Implementation of Social Studies Standards
(Education Services – Natasha Baker; Education Improvement and Innovation – Linda Forward) (9:45-10:30 a.m.)
B. Presentation on Elementary and Secondary Education Authority
(ESEA) Flexibility Renewal (Education Services – Natasha Baker;
Accountability Services – Venessa Keesler; Abbie Groff-Blaszak) (10:30-11:15 a.m.)
C. Presentation on English Language Learners (ELL): Supports and
Achievements (Education Services – Natasha Baker; Accountability
Services – Venessa Keesler) (11:15-11:45 a.m.)
D. Report on State Superintendent Search (President, State Board of Education – John Austin) (11:45 a.m.-12:00 p.m.)
IV. RECESS FOR LUNCH (12:00-12:45 p.m.)
Attachment 3.G
361
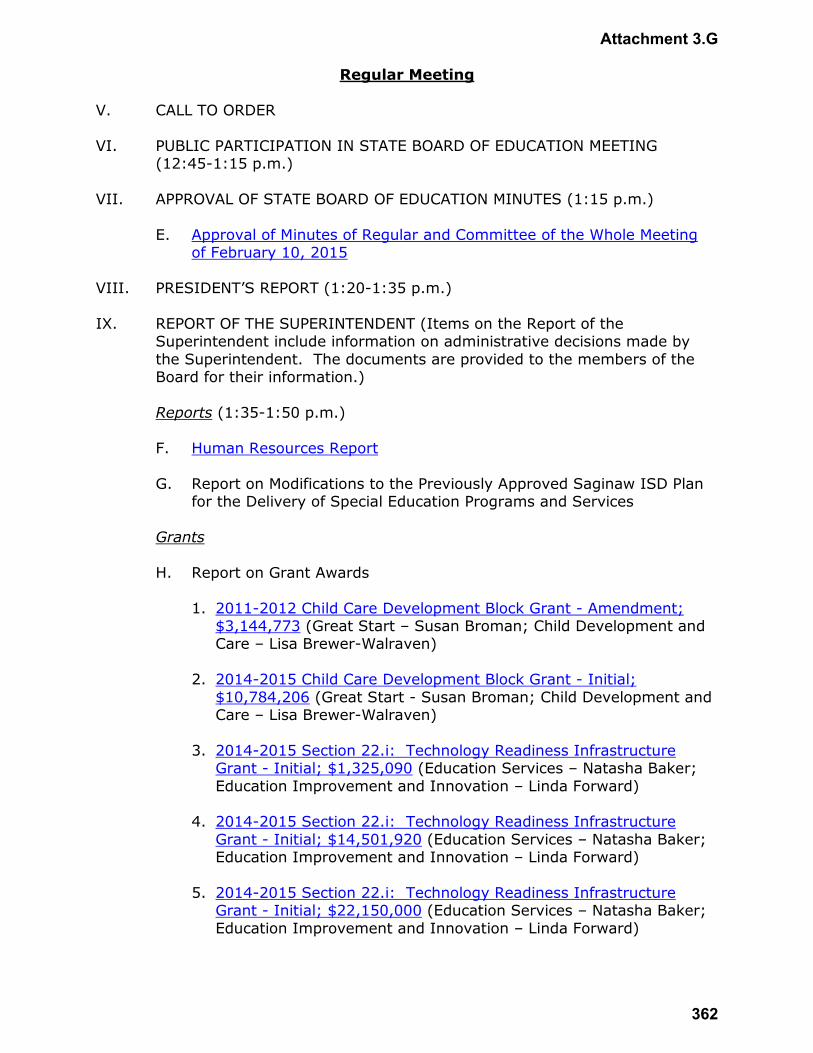
Regular Meeting
V. CALL TO ORDER
VI. PUBLIC PARTICIPATION IN STATE BOARD OF EDUCATION MEETING
(12:45-1:15 p.m.)
VII. APPROVAL OF STATE BOARD OF EDUCATION MINUTES (1:15 p.m.)
E. Approval of Minutes of Regular and Committee of the Whole Meeting
of February 10, 2015
VIII. PRESIDENT’S REPORT (1:20-1:35 p.m.)
IX. REPORT OF THE SUPERINTENDENT (Items on the Report of the
Superintendent include information on administrative decisions made by
the Superintendent. The documents are provided to the members of the Board for their information.)
Reports (1:35-1:50 p.m.)
F. Human Resources Report
G. Report on Modifications to the Previously Approved Saginaw ISD Plan for the Delivery of Special Education Programs and Services
Grants
H. Report on Grant Awards
1. 2011-2012 Child Care Development Block Grant - Amendment; $3,144,773 (Great Start – Susan Broman; Child Development and Care – Lisa Brewer-Walraven)
2. 2014-2015 Child Care Development Block Grant - Initial;
$10,784,206 (Great Start - Susan Broman; Child Development and Care – Lisa Brewer-Walraven)
3. 2014-2015 Section 22.i: Technology Readiness Infrastructure Grant - Initial; $1,325,090 (Education Services – Natasha Baker;
Education Improvement and Innovation – Linda Forward) 4. 2014-2015 Section 22.i: Technology Readiness Infrastructure
Grant - Initial; $14,501,920 (Education Services – Natasha Baker; Education Improvement and Innovation – Linda Forward)
5. 2014-2015 Section 22.i: Technology Readiness Infrastructure
Grant - Initial; $22,150,000 (Education Services – Natasha Baker;
Education Improvement and Innovation – Linda Forward)
Attachment 3.G
362
6. 2013-2014 Consolidation of Operations or Services Grant - Amendment; $4,301,807 (Administration and Support Services –
Kyle Guerrant; State Aid and School Finance – Dan Hanrahan)
7. 2014-2015 Project AWARE to Advance Wellness and Resilience in Education - Initial; $1,273,446 (Administration and Support Services – Kyle Guerrant; School Support Services – Marla Moss)
8. 2014-2015 Promoting Adolescent Health in Michigan Through
School -Based HIV/STD Prevention and School-Based Surveillance - Initial; $29,038 (Administration and Support Services – Kyle Guerrant; School Support Services – Marla Moss)
9. 2014-2015 Safe Schools/Healthy Students State Planning, Local
Educ. Agencies, & Local Communities - Amendment; $171,400 (Administration and Support Services – Kyle Guerrant; School Support Services – Marla Moss)
X. REPORT OF MICHIGAN TEACHER OF THE YEAR (1:50-2:05 p.m.)
XI. DISCUSSION/ACTION ITEMS
I. Approval of Nominations to the Special Education Advisory Committee
(Education Services – Natasha Baker; Special Education – Teri Johnson
Chapman) (2:05-2:30 p.m.)
J. State and Federal Legislative Update (Office of Public and Governmental Affairs – Martin Ackley; Chair, SBE Legislative Committee – Casandra Ulbrich) (2:30-3:00 p.m.)
Approval of the 2013-2014 Annual Legislative Report for School
Improvement Plans XII. CONSENT AGENDA (Items are on the consent agenda to be voted on as
a single item by the Board. Board members may remove items from the consent agenda prior to the vote. Items removed from the consent
agenda will be discussed individually.)
K. Approval of State Board of Education and Michigan Department of
Education Cosponsorship (Administration and Support Services – Kyle Guerrant; School Support Services – Marla Moss)
XIII. COMMENTS BY STATE BOARD OF EDUCATION MEMBERS (3:00-3:15 p.m.)
XIV. FUTURE MEETING DATES
A. Wednesday, March 18, 2015 Special Meeting (9:30 a.m.) B. Tuesday, April 14, 2015 Regular Meeting (9:30 a.m.) C. Tuesday, May 12, 2015 Regular Meeting (9:30 a.m.)
XV. ADJOURNMENT (3:15 p.m.)
Attachment 3.G
363

Attachment 3.H
364
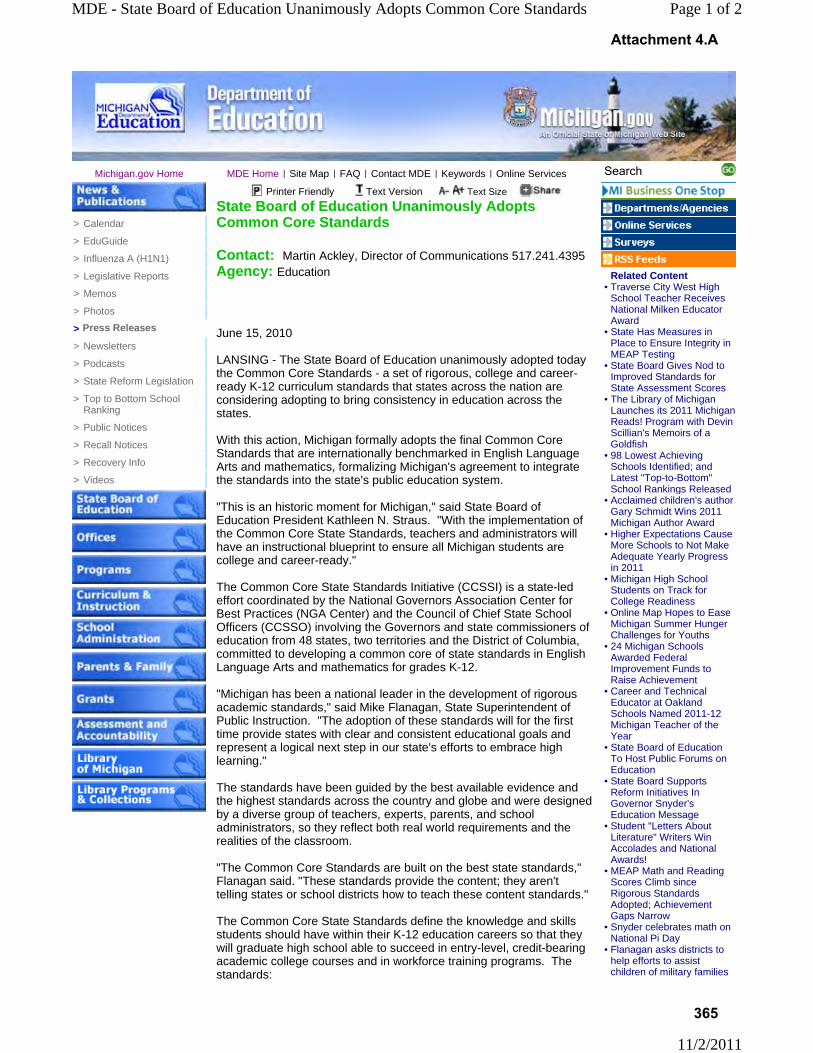
Michigan.gov Home MDE Home | Site Map | FAQ | Contact MDE | Keywords | Online Services Search
> Calendar
> EduGuide
> Influenza A (H1N1)
> Legislative Reports
> Memos
> Photos
> Press Releases
> Newsletters
> Podcasts
> State Reform Legislation
> Top to Bottom School Ranking
> Public Notices
> Recall Notices
> Recovery Info
> Videos
Printer Friendly Text Version Text Size
State Board of Education Unanimously Adopts Common Core Standards
Contact: Martin Ackley, Director of Communications 517.241.4395 Agency: Education
June 15, 2010
LANSING - The State Board of Education unanimously adopted today the Common Core Standards - a set of rigorous, college and career-ready K-12 curriculum standards that states across the nation are considering adopting to bring consistency in education across the states.
With this action, Michigan formally adopts the final Common Core Standards that are internationally benchmarked in English Language Arts and mathematics, formalizing Michigan's agreement to integrate the standards into the state's public education system.
"This is an historic moment for Michigan," said State Board of Education President Kathleen N. Straus. "With the implementation of the Common Core State Standards, teachers and administrators will have an instructional blueprint to ensure all Michigan students are college and career-ready."
The Common Core State Standards Initiative (CCSSI) is a state-led effort coordinated by the National Governors Association Center for Best Practices (NGA Center) and the Council of Chief State School Officers (CCSSO) involving the Governors and state commissioners of education from 48 states, two territories and the District of Columbia, committed to developing a common core of state standards in English Language Arts and mathematics for grades K-12.
"Michigan has been a national leader in the development of rigorous academic standards," said Mike Flanagan, State Superintendent of Public Instruction. "The adoption of these standards will for the first time provide states with clear and consistent educational goals and represent a logical next step in our state's efforts to embrace high learning."
The standards have been guided by the best available evidence and the highest standards across the country and globe and were designed by a diverse group of teachers, experts, parents, and school administrators, so they reflect both real world requirements and the realities of the classroom.
"The Common Core Standards are built on the best state standards," Flanagan said. "These standards provide the content; they aren't telling states or school districts how to teach these content standards."
The Common Core State Standards define the knowledge and skills students should have within their K-12 education careers so that they will graduate high school able to succeed in entry-level, credit-bearing academic college courses and in workforce training programs. The standards:
Related Content• Traverse City West High
School Teacher ReceivesNational Milken EducatorAward
• State Has Measures inPlace to Ensure Integrity inMEAP Testing
• State Board Gives Nod toImproved Standards forState Assessment Scores
• The Library of MichiganLaunches its 2011 MichiganReads! Program with DevinScillian's Memoirs of aGoldfish
• 98 Lowest AchievingSchools Identified; andLatest "Top-to-Bottom"School Rankings Released
• Acclaimed children's authorGary Schmidt Wins 2011Michigan Author Award
• Higher Expectations CauseMore Schools to Not MakeAdequate Yearly Progressin 2011
• Michigan High SchoolStudents on Track forCollege Readiness
• Online Map Hopes to EaseMichigan Summer HungerChallenges for Youths
• 24 Michigan SchoolsAwarded FederalImprovement Funds toRaise Achievement
• Career and TechnicalEducator at OaklandSchools Named 2011-12Michigan Teacher of theYear
• State Board of EducationTo Host Public Forums onEducation
• State Board SupportsReform Initiatives InGovernor Snyder'sEducation Message
• Student "Letters AboutLiterature" Writers WinAccolades and NationalAwards!
• MEAP Math and ReadingScores Climb sinceRigorous StandardsAdopted; AchievementGaps Narrow
• Snyder celebrates math onNational Pi Day
• Flanagan asks districts tohelp efforts to assistchildren of military families
Page 1 of 2MDE - State Board of Education Unanimously Adopts Common Core Standards
11/2/2011
Attachment 4.A
365

Are aligned with college and work expectations. Are clear, understandable and consistent. Include rigorous content and application of knowledge through higher order skills. Build upon strengths and lessons of current state standards. Are informed by other top performing countries, so that all students are prepared to succeed in our global economy and society. Are evidence-based.
Michigan implemented new nationally recognized K-8 grade level content expectations in 2004 and high school content expectations in 2006 for English Language Arts and mathematics. Both are closely aligned to the Common Core State Standards which will minimize instructional changes and adjustments.
"I see this as that next step in our education system," said State Board of Education Vice President John C. Austin. "It's really an extension of the work we've done here over the past several years. These Common Core Standards are consistent with the high expectations we've hold here in Michigan."
To help teachers successfully implement the standards, the Michigan Department of Education, Intermediate School Districts and other partner groups will provide support and training starting in the fall of 2010. Teachers will begin to provide instruction related to the standards by the fall of 2012. It is anticipated that students will be assessed on the Common Core Standards beginning in 2014.
The Common Core State Standards will enable participating states to:
Articulate to parents, teachers, and the general public expectations for students. Align textbooks, digital media and curricula to the internationally benchmarked standards. Ensure professional development for educators is based on identified need and best practices. Develop and implement an assessment system to measure student performance against the common core state standards. Evaluate policy changes needed to help students and educators meet the common core state college and career readiness standards.
More information about the Common Core State Standards initiative including key points for both English language arts and mathematics is available at http://www.corestandards.org/.
• State Board ApprovesReform Priorities
• Hunger Doesn't Take ASummer Vacation - MoreSponsors Needed To MakeA Real Difference in theLives of Hundreds ofThousands of HungryMichigan Children
• College Goal Sunday HelpsStudents, Families File forCollege Financial Aid
Michigan.gov Home | MDE Home | Site Map | State Web Sites | CompliancePrivacy Policy | Link Policy | Accessibility Policy | Security Policy | Michigan News | Michigan.gov Survey
Copyright © 2001-2011 State of Michigan
Page 2 of 2MDE - State Board of Education Unanimously Adopts Common Core Standards
11/2/2011
Attachment 4.A
366

MINUTES
STATE BOARD OF EDUCATION
Ladislaus B. Dombrowski Board Room John A. Hannah Building
608 West Allegan Lansing, Michigan
June 15, 2010 9:30 a.m.
Present: Mr. Michael P. Flanagan, Chairman Mrs. Kathleen N. Straus, President Mr. John C. Austin, Vice President Mrs. Carolyn L. Curtin, Secretary Mrs. Marianne Yared McGuire, Treasurer Mrs. Nancy Danhof, NASBE Delegate Mrs. Elizabeth W. Bauer Ms. Casandra E. Ulbrich Mr. Michael Zeig, representing Governor Jennifer M. Granholm, ex officio
Absent: Mr. Reginald M. Turner
Also Present: Mr. Rob Stephenson, 2009-2010 Michigan Teacher of the Year
REGULAR MEETING
I. CALL TO ORDER
Mr. Flanagan called the meeting to order at 9:38 a.m.
II. INFORMATIONAL FOLDER ITEMS
A. Information on Special Education Advisory Committee Quick Notes – Meetings of April 7, 2010 and May 5, 2010
B. Information on the Three-Year Report on the Michigan Test for Teacher Certification Results for 2006-2009
III. APPROVAL OF AGENDA AND ORDER OF PRIORITY
A. Adoption of Resolution Honoring Lucia Campbell (Item W) – added to agenda
1
Attachment 4.B
367
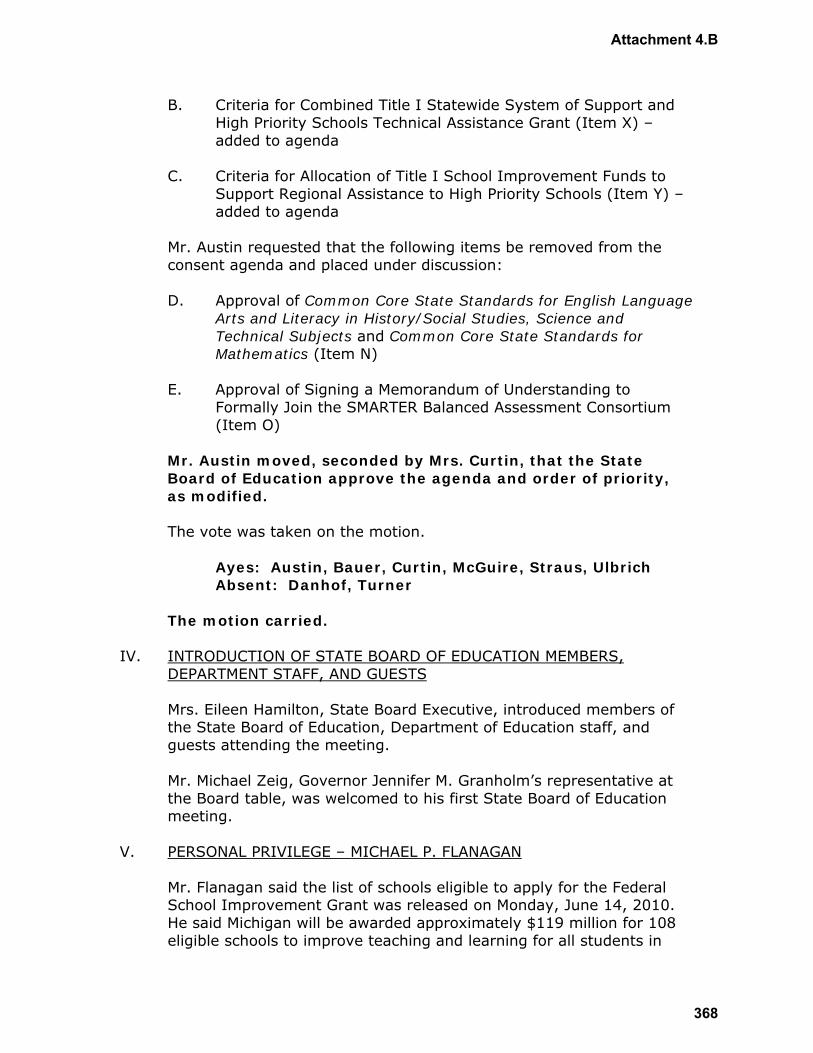
B. Criteria for Combined Title I Statewide System of Support and High Priority Schools Technical Assistance Grant (Item X) – added to agenda
C. Criteria for Allocation of Title I School Improvement Funds to
Support Regional Assistance to High Priority Schools (Item Y) – added to agenda
Mr. Austin requested that the following items be removed from the consent agenda and placed under discussion: D. Approval of Common Core State Standards for English Language
Arts and Literacy in History/Social Studies, Science and Technical Subjects and Common Core State Standards for Mathematics (Item N)
E. Approval of Signing a Memorandum of Understanding to
Formally Join the SMARTER Balanced Assessment Consortium (Item O)
Mr. Austin moved, seconded by Mrs. Curtin, that the State Board of Education approve the agenda and order of priority, as modified. The vote was taken on the motion. Ayes: Austin, Bauer, Curtin, McGuire, Straus, Ulbrich Absent: Danhof, Turner The motion carried.
IV. INTRODUCTION OF STATE BOARD OF EDUCATION MEMBERS, DEPARTMENT STAFF, AND GUESTS
Mrs. Eileen Hamilton, State Board Executive, introduced members of the State Board of Education, Department of Education staff, and guests attending the meeting. Mr. Michael Zeig, Governor Jennifer M. Granholm’s representative at the Board table, was welcomed to his first State Board of Education meeting.
V. PERSONAL PRIVILEGE – MICHAEL P. FLANAGAN Mr. Flanagan said the list of schools eligible to apply for the Federal School Improvement Grant was released on Monday, June 14, 2010. He said Michigan will be awarded approximately $119 million for 108 eligible schools to improve teaching and learning for all students in
2
Attachment 4.B
368

persistently low achieving schools. He said the School Improvement Grant is part of the American Recovery and Reinvestment Act. Mr. Flanagan said this is an opportunity for the schools that are struggling the most to use time and resources to begin their improvement plans before the state identifies the list of lowest performing schools affected by the state school reform law this fall.
VI. CONSENT AGENDA
A. Adoption of Resolution Honoring the 2009-2010 Michigan Teacher of the Year
B. Adoption of Resolution Honoring the 2010-2011 Michigan
Teacher of the Year Mrs. Straus moved, seconded by Mrs. Bauer, that the State Board of Education approve the Superintendent’s recommendations for the consent agenda as follows: A. adopt the resolution attached to the Superintendent’s
memorandum dated May 26, 2010, honoring the 2009-2010 Michigan Teacher of the Year; and
B. adopt the resolution attached to the Superintendent’s
memorandum dated May 26, 2010, honoring the 2010-2011 Michigan Teacher of the Year.
The vote was taken on the motion. Ayes: Austin, Bauer, Curtin, McGuire, Straus, Ulbrich Absent: Danhof, Turner The motion carried. The resolution honoring the 2009-2010 Michigan Teacher of the Year, Robert Stephenson, is attached as Exhibit A. The resolution honoring the 2010-2011 Michigan Teacher of the Year, Matinga Ragatz, is attached as Exhibit B.
VII. POINT OF THE DAY Mr. Martin Ackley, Director of Communications, presented the Point of the Day that focused on the history of the Michigan Teacher of the Year Program.
3
Attachment 4.B
369

VIII. PRESENTATION ON MICHIGAN TEACHER OF THE YEAR PROGRAM
Mr. Robert Stephenson provided his final report as the 2009-2010 Michigan Teacher of the Year. He sang while presenting a PowerPoint report that included highlights of the many events he has participated in during the past year. Mr. Stephenson said the Board has been an example of bipartisanship that should be a model for all. Mrs. Straus presented Mr. Stephenson with a resolution honoring him as the 2009-2010 Michigan Teacher of the Year. Mrs. Straus said he has been a fabulous teacher to everyone, and she congratulated him on being one of four finalists for National Teacher of the Year. Mr. Austin said Mr. Stephenson has been very instrumental in his role as the Michigan Teacher of the Year, and his perspective at the Board table has been extremely valuable. Mr. Stephenson introduced his wife, Jamie; and their children, Andrew and Rebecca.
IX. AWARDS AND RECOGNITIONS
A. 2010-2011 Michigan Teacher of the Year and State Level Finalists
Ms. Jean Shane, Special Assistant, Awards and Recognitions Program, presented the 2010-2011 Michigan Teacher of the Year and State Level Finalists. Ms. Shane said 390 teachers were nominated for the 2010-2011 Michigan Teacher of the Year. Ms. Shane said Mrs. Curtin read applications and Ms. Ulbrich served on the interview team. Ms. Shane said Mrs. Curtin attended the May 26, 2010, surprise notification by Mr. Flanagan at Grand Ledge High School announcing Ms. Matinga Ragatz, Global Studies teacher, as the 2010-2011 Michigan Teacher of the Year. A video clip of the announcement was shown. Ms. Shane introduced Ms. Ragatz and her guests. Ms. Ragatz said she is thankful for this phenomenal opportunity to honor teachers. She said her mother was the first woman in Equatorial Guinea, a small country on the coast of Central West Africa, to obtain a college education. Ms. Ragatz said her mother became a teacher, and retired as the dean of a university after a long career in teaching the same week that Matinga was named the 2010-2011 Michigan Teacher of the Year. Ms. Ragatz said it is the best time to be a teacher, because it is the dawn of a new way for education and the beginning of learning for both teachers and students. She said
4
Attachment 4.B
370

teaching will no longer be the same. She said she is thankful for the trust placed in her with the huge responsibility to represent Michigan teachers. She said she has the best job in the world, because she sees the miracles that happen in the classroom every day. She said Rob Stephenson is an inspiration, and she is honored to be in the company of Jamie Dudash and David Legg, the finalists for Michigan Teacher of the Year. Ms. Shane introduced Katie Clippert of MEEMIC, the insurance company that provides corporate support for the Michigan Teacher of the Year program. Ms. Shane said MEEMIC presented a check for $1,000 to Grand Ledge High School for educational projects for students. She said MEEMIC will also provide Ms. Ragatz with the use of a car for one year. Ms. Shane introduced the state level finalists Mr. Jamie Dudash, Social Studies Teacher, Dexter High School; and Mr. David Legg, Language Arts/Broadcasting Teacher, Novi High School, and their guests. Ms. Shane said MEEMIC representatives will visit Dexter High School and Novi High School to presents checks in the fall. Mrs. Straus presented Ms. Ragatz with the resolution honoring the 2010-2011 Michigan Teacher of the Year. Mrs. Straus said public education initially began to educate citizens so that they could participate in a democratic form of government. She said public education is essential and teachers are vital in keeping our democracy strong. Ms. Ragatz was presented a sculpture by Ms. Ulbrich, a lapel pin by Mrs. Curtin, and a letter from Governor Granholm read by Mr. Zeig. Mr. Flanagan presented Grand Ledge Public Schools Superintendent Steve Matthews and Principal Steve Gabriel with a plaque to display in Grand Ledge High School commemorating Matinga Ragatz as the 2010-2011 Michigan Teacher of the Year. Mr. Jamie Dudash and Mr. David Legg were presented with certificates in their honor and lapel pins. Ms. Ulbrich said all three finalists exhibited traits of engagement and creativity which will foster engaged and creative students and citizens. Mr. Flanagan said year after year Teachers of the Year and finalists give credit to others for their success. He said when given the opportunity to meet the students it is apparent they love their teachers.
5
Attachment 4.B
371

X. RECESS
The Board recessed the Regular Meeting at 10:45 a.m.
COMMITTEE OF THE WHOLE MEETING XI. CALL TO ORDER
Mr. Flanagan called the Committee of the Whole Meeting to order at 11:00 a.m.
XII. DISCUSSION ITEMS
A. Presentation on Common Core State Standards for English Language Arts and Literacy in History/Social Studies, Science and Technical Subjects and Common Core State Standards for Mathematics
The following individuals presented: • Dr. Sally Vaughn, Deputy Superintendent and Chief
Academic Officer • Ms. Linda Forward, Interim Director, Office of Education
Improvement and Innovation • Ms. Deborah Clemmons, Supervisor of Curriculum and
Instruction The Common Core State Standards Initiative is a state-led effort coordinated by the National Governors Association Center for Best Practices and the Council of Chief State School Officers. Drafts of the College and Career Readiness Standards were released for public comment in September 2009, and the draft K-12 Common Core State Standards were released for public comment in March 2010. Alignment to Michigan content expectations as well as public comments to the March draft of the Common Core State Standards were presented to the Board with a copy of the final K-12 Common Core Standards in math and English language arts/literacy. The Board will be asked to take action on this item later in the meeting. If the Standards are approved, the U.S. Department of Education will be notified via an addendum to Michigan’s Race to the Top application. A PowerPoint presentation was shown.
6
Attachment 4.B
372

Board member comments and clarifications included: 1. glad to see English language arts includes social studies
and science; that will be an improvement – yes; 2. common core standards is the logical next step in taking
high learning expectations to the national level; Michigan is a leader in high standards;
3. there was previous push back from other states regarding
the rigor of Science, Technology, Engineering and Mathematics (STEM); STEM went back into the document – yes; and
4. children will not be tested on things they have not been
taught; is the National Assessment of Educational Progress (NAEP) going to be the interim test of choice – Dr. Joseph Martineau, Director, Office of Educational Assessment and Accountability, came to table; NAEP will continue to measure the NAEP framework; the NAEP framework will likely be revised in the future; there will continue to be a disconnect between the NAEP framework and the common core state standards but there is now greater overlap than previously.
B. Presentation on Signing a Memorandum of Understanding to
Formally Join the SMARTER Balanced Assessment Consortium
The following individuals presented: • Dr. Sally Vaughn, Deputy Superintendent and Chief
Academic Officer • Dr. Joseph Martineau, Director, Office of Educational
Assessment and Accountability
The Michigan Department of Education has joined the SMARTER Balanced Assessment Consortium which is currently preparing a multi-state application under the Race to the Top assessment competition. The competition is specifically for consortia of states to submit joint applications for funding the development of assessments measuring the College- and Career-Readiness Standards and the Common Core State Standards that are comparable across states within the consortia. The joint application will be submitted on June 23, 2010, to the U.S. Department of Education to compete for up to $320 million in funding. Michigan’s participation is contingent upon a Memorandum of Understanding signed by the Governor, State
7
Attachment 4.B
373

Board of Education President, Superintendent of Public Instruction, and the state’s Chief Procurement Officer.
The Board will be asked to take action on this item later in the meeting.
Board member comments and clarifications included: 1. if every state signs on to the Common Core Standards,
and there is an assessment consortium, will NAEP still be needed if it is measuring something that has not been taught – at the NAEP spring meeting there was discussion regarding NAEP’s purpose now that states are going toward Common Core Standards;
2. why are there two consortia for the Common Core
assessment – Michigan was one of several states that wanted a single consortium; other states believed that if there are two consortia, one is likely to succeed; application guidelines state that up to two consortia will be funded;
3. who is in Michigan’s consortium – currently 30 states are
participating in the consortium that Michigan is part of; 20 to 25 states are in the other consortium; Michigan chose to be one of 17 governing states that are in a leadership role with significant input; governing states cannot be a member of both consortia; participating states can participate in both consortia; moving toward online assessment and immediate feedback and results and a strong focus on professional development for formative assessment and implementing some interim benchmark assessments to determine the likelihood of passing before the final test;
4. there are states that do not support the Common Core
Standards; why is there a greater number of states that want to be part of the assessment – some states and territories have signed on to both consortia;
5. why would states want to be a member of two consortia –
states that are members of two consortia will be able to watch what is happening in both consortia and then at a later date choose which test to administer; states choosing that option are not allowed any level of control and sacrifice the ability to provide significant input into what the final product looks like;
8
Attachment 4.B
374
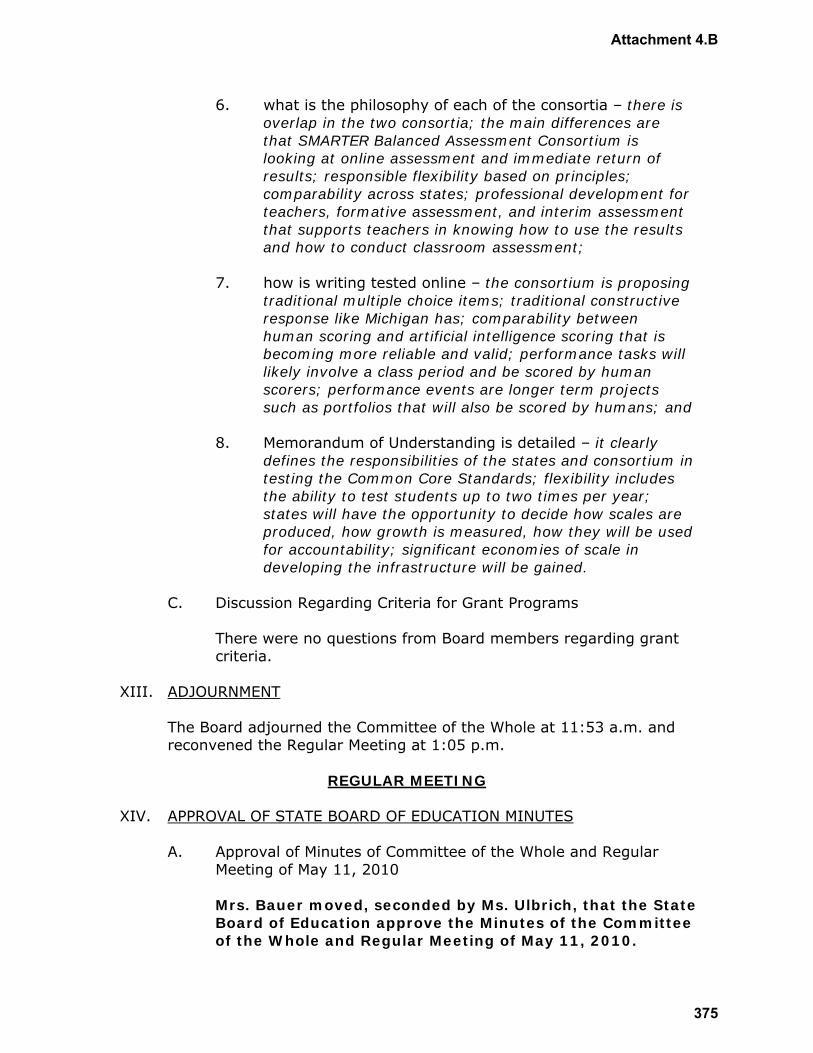
6. what is the philosophy of each of the consortia – there is overlap in the two consortia; the main differences are that SMARTER Balanced Assessment Consortium is looking at online assessment and immediate return of results; responsible flexibility based on principles; comparability across states; professional development for teachers, formative assessment, and interim assessment that supports teachers in knowing how to use the results and how to conduct classroom assessment;
7. how is writing tested online – the consortium is proposing
traditional multiple choice items; traditional constructive response like Michigan has; comparability between human scoring and artificial intelligence scoring that is becoming more reliable and valid; performance tasks will likely involve a class period and be scored by human scorers; performance events are longer term projects such as portfolios that will also be scored by humans; and
8. Memorandum of Understanding is detailed – it clearly
defines the responsibilities of the states and consortium in testing the Common Core Standards; flexibility includes the ability to test students up to two times per year; states will have the opportunity to decide how scales are produced, how growth is measured, how they will be used for accountability; significant economies of scale in developing the infrastructure will be gained.
C. Discussion Regarding Criteria for Grant Programs There were no questions from Board members regarding grant
criteria.
XIII. ADJOURNMENT
The Board adjourned the Committee of the Whole at 11:53 a.m. and reconvened the Regular Meeting at 1:05 p.m.
REGULAR MEETING
XIV. APPROVAL OF STATE BOARD OF EDUCATION MINUTES
A. Approval of Minutes of Committee of the Whole and Regular Meeting of May 11, 2010
Mrs. Bauer moved, seconded by Ms. Ulbrich, that the State Board of Education approve the Minutes of the Committee of the Whole and Regular Meeting of May 11, 2010.
9
Attachment 4.B
375

The vote was taken on the motion. Ayes: Austin, Bauer, Curtin, McGuire, Straus, Ulbrich Absent: Danhof, Turner
The motion carried.
XV. PRESIDENT’S REPORT
A. Follow Up Meetings with Legislators to Discuss "Recommendations to Better Support Michigan's Education System - Reforms, Restructuring, and Revenues"
Mrs. Straus said that Board members have begun to meet with Representatives and Senators to discuss the document the Board approved at its May 11, 2010, meeting, "Recommendations to Better Support Michigan's Education System – Reforms, Restructuring, and Revenues." Mrs. Straus said legislators have not yet provided endorsements, but indicated they are looking forward to studying the document. She said additional meetings will be scheduled with legislators and newspaper editorial boards. Mrs. Straus said she has heard from some people that do not agree with certain aspects of the Board’s report. She said the report is a result of a bi-partisan effort in which everyone compromised to reach consensus. She said policy is supposed to be made in a give and take fashion that results in a compromise.
B. Drivers Against Texting and Talking
Mrs. Straus said Senator Samuel (Buzz) Thomas asked Mrs. Straus to support Drivers Against Texting and Talking. She said she was contacted by the organization to determine if the Michigan Department of Education can assist in educating drivers. Mrs. Straus said she may also request the Board’s endorsement at a future meeting. She said she will obtain additional information
C. National Farm to Cafeteria Conference
Mrs. Straus said she attended the National Farm to Cafeteria Conference in Detroit to encourage healthier eating and support for the local economy by eating farm fresh products that are locally grown. She said there were many participants from school districts. She said Traverse City has participated in the program for six years and there are eight schools in Detroit
10
Attachment 4.B
376

using urban farms to supply fresh fruits and vegetables. She said this program fits well with Michigan’s National Association of State Boards of Education grant to promote effective nutrition policies in Michigan schools. Mrs. Curtin said her local school district in Evart built a greenhouse and grows produce that is used in meals prepared in the school cafeteria.
D. NASBE Healthy Eating Grant
Mrs. Straus said she participated in a multi-state virtual meeting on the National Association of State Boards of Education Healthy Eating Grant with participants from Pennsylvania, Arkansas, Mississippi and California. She said new state participants included Alabama, Kentucky, Georgia and North Carolina. She said it was an interesting and productive session and participants learned what other states are doing. She said the Michigan team will be meeting shortly to plan for the second year of the grant.
E. NASBE Study Groups
Mrs. Straus said she and Mrs. Danhof attended National Association of State Boards of Education Study Group meetings on June 10-12, 2010. Mrs. Straus said Mrs. Danhof is a member of the 21st Century Educator Study Group and she is a member of the Structure of Schools Study Group. Mrs. Straus said there was a presentation on international benchmarking with the focus on teacher preparation. She said Finland accepts only the top 10 percent of students into the teacher training institutions, and Singapore accepts the top 20 percent. She said teachers are recognized as being very valuable members of society. Mrs. Straus said there was general agreement to replace seat time and Carnegie units with mastery and competence. Mrs. Straus said the report will be available in October. Mrs. Straus said one of her fellow study group members is a professor of physics at the University of Maryland. She said he is also a member of an advisory committee on Science, Technology, Engineering and Mathematics (STEM) which will present recommendations to the President of the United States shortly.
11
Attachment 4.B
377
Mrs. Straus said the Council of Chief State School Officers (CCSSO) has a program called Next Generation Learners: Delivering on our Promise to Educate Every Child. She said there are six lab states: Maine, New York, West Virginia, Ohio, Kentucky and Wisconsin. She said these 6 states were selected from 27 states that responded to an invitation from CCSSO.
F. School Visits
Mrs. Bauer has visited many schools and she writes thorough reports that she shares with State Board of Education members. Mrs. Straus said she appreciates the reports.
XVI. REPORT OF THE SUPERINTENDENT
Reports G. Human Resources Report H. Report on Wayne County Regional Educational Service Agency
Plan for the Delivery of Special Education Programs and Services I. Report on Ottawa Area Intermediate School District Plan for the
Delivery of Special Education Programs and Services Grants J. Report on Grant Awards
• 2009-2010 Middle College High School Health Partnership Grant – Initial
• 2010-2011 Secondary CTE Perkins Grant Program – Initial • 2010-2011 Tech Prep Grant Program – Initial • 2008-2009 Individuals with Disabilities Education Act, Part B
Formula Grants – Amendment • 2009-2010 Title I Accountability/School Improvement –
Amendment Mr. Flanagan provided a verbal report on: A. Mr. Austin’s Presentation at Wayne State University Class
Mr. Flanagan said he teaches a graduate class at Wayne State University and Mr. Austin visited his class on June 14 to discuss the Board’s report, "Recommendations to Better Support Michigan's Education System - Reforms, Restructuring, and Revenues." Mr. Flanagan said Mr. Austin represented the
12
Attachment 4.B
378

Board well in the discussion that included the bipartisan manner in which the State Board of Education develops policy.
B. School Improvement Grant
Mr. Flanagan said he mentioned the School Improvement Grant (SIG) earlier in the meeting. He said the SIG funds are for the persistently low achieving schools as defined by the Federal government. Mr. Flanagan said all Michigan citizens have the right to see information on how schools are performing. He said the focus of education should not be just on the lowest-performing schools, but also on those schools that are excelling. He said the Michigan Public School Top to Bottom Ranking is available on the Michigan Department of Education website. Mr. Flanagan said the schools eligible for the federal SIG funds were identified based on state testing data for student achievement (2007-2009) and academic growth (2006-2009). He said to develop the list of schools as required by the state school reform law the state will be adding data from 2009-2010 for student achievement and academic growth, and dropping the 2006-2007 data.
C. Michigan School for the Deaf Graduation Mr. Flanagan said Mrs. Bauer and he attended the Michigan School for the Deaf graduation ceremony of five proud graduates.
D. Wyoming and Godwin Heights School Visit
Mr. Flanagan said he visited Wyoming and Godwin Heights School Districts on May 20. He said he was impressed by many things including that the community’s two school districts shared a superintendent and a business officer. He said bus services are also shared with some of the private schools in the area. He said they anticipated change and got community support to get in front of budget, facility, and academic issues. He said he was also impressed by the leadership of the local board of education and the superintendent. Mr. Flanagan said a seat time waiver was granted for the Wyoming Frontiers Program which is an online program. He said two graduates of the program spoke of their experiences when he visited and he invited them to speak to the Board. Mr. Flanagan
13
Attachment 4.B
379

introduced Program Director Allen Vigh, and students Ryan Strayhorn and Holly Jansma. Mr. Strayhorn said he had health problems, managed his own business of 26 employees, dual enrolled in college while in high school, graduated early with a good grade point average, and received a scholarship while in the Frontiers Program. He said a laptop computer is given to each student who has good attendance and behavior, and if the student graduates they keep the laptop. He said students want to come to the lab which is a welcoming environment with computers and couches. Mr. Vigh said there are the equivalent of 2.25 certified staff members in two labs who also work with students on other issues such as time management. He said students earn time away from the lab by demonstrating that they can use the time effectively. Ms. Jansma said the teachers are so eager and willing to help, and students have a personal relationship with the teachers. She said she was able to move at her own pace. She said she continued to play sports while involved in the program and finished early. She said she was able to have a job and she is training to be an optician. Mr. Vigh said the program has helped reach students of many different abilities and circumstances. He said it has been customized to the student and helped many people be successful. Mr. Vigh said the program has just completed its second year and has gone from 10 to 70 students.
E. Michigan-Shiga Sister State Visiting Official
Mr. Flanagan introduced Mr. Junichi Tanoue, the Michigan-Shiga Sister State Visiting Official who represents the Shiga Province and does a research project while in Michigan. Mr. Tanoue said he is very honored to have the opportunity to attend the Board meeting.
XVII. PUBLIC PARTICIPATION IN STATE BOARD OF EDUCATION MEETING
A. Ms. Sandra York, Ann Arbor, Michigan. Ms. York, representing the Michigan Congress of Parents, Teachers, and Students, provided verbal comments on Michigan winners of the National PTA Reflections Program.
14
Attachment 4.B
380

B. Mrs. Mary Wood, Warren, Michigan. Mrs. Wood provided verbal comments on charter school issues.
Mrs. Danhof arrived at 1:55 p.m. C. Ms. Murcy Jones-Lewis, Ms. Dominque Jacques, Ms. Shaundra
Morgan, Ms. Chandra Morgan, and Ms. Benrita Smith, representing Colin Powell Academy, Detroit, provided verbal comments and written information.
XVIII. STATE AND FEDERAL LEGISLATIVE REPORT
Dr. Sally Vaughn, Deputy Superintendent and Chief Academic Officer; and Ms. Lisa Hansknecht, Legislative Director; presented State and Federal Legislative Report. Ms. Hansknecht said Public Act 75 of 2010, the public school employee retirement legislation, was signed by the Governor. She said it is anticipated that 17,000 to 18,000 school employees will retire. She said the Legislature was hoping that 28,000 would retire, and without the legislation it is estimated that between 5,000-6,000 school employees would have retired. Ms. Hansknecht said there has been discussion by Governor Granholm, Senator Bishop, and others regarding using the School Aid funds for higher education, but there is opposition in the K-12 community. Ms. Hansknecht said the pending Federal Education Jobs Bill provides for investment in teachers and school employees to prevent job loss and help the economy. She said the Economic Policy Institute released a report on the economic impact of the education jobs fund in relation to the Gross Domestic Product. Ms. Hansknecht said the National Association of State Boards of Education may have a suggested letter that the State Board of Education can address to the Michigan Congressional Delegation in support of the Education Jobs Bill. Ms. Hansknecht said Senator Michael F. Bennet from Colorado has introduced the Federal School Turnaround Bill, regarding training for school leaders to implement the intervention models that are part of Race to the Top and the reauthorization of the Elementary and Secondary Education Act (ESEA). She said she will provide the Board with additional information at a later date. Mrs. Straus asked for an update on legislation to revised Public Act 72. Ms. Hansknecht said the changes are specific to the municipality side and not the education side. Ms. Hansknecht said she will continue to monitor the legislation.
15
Attachment 4.B
381
XIX. CONSENT AGENDA
Approvals L. Approval of American Sign Language Standards M. Approval of School Counselor Standards N. Approval of Common Core State Standards for English Language
Arts and Literacy in History/Social Studies, Science and Technical Subjects and Common Core State Standards for Mathematics
O. Approval of Signing a Memorandum of Understanding to
Formally Join the SMARTER Balanced Assessment Consortium P. Approval of Appointments to the Professional Standards
Commission for Teachers Q. Approval of Nominations to the Special Education Advisory
Committee Criteria R. Approval of Criteria for the Great Parents/Great Start Program
Grants S. Approval of Criteria for Individuals with Disabilities Education
Act Preschool Indicators Grant X. Approval of Criteria for Combined Title I Statewide System of
Support and High Priority Schools Technical Assistance Grant Y. Approval of Criteria for Allocation of Title I School Improvement
Funds to Support Regional Assistance to High Priority Schools Resolutions T. Adoption of Resolution Honoring Paula Wood U. Adoption of Resolution Honoring Gayle Guillen V. Adoption of Resolution Regarding Michigan School Bus Safety
Week W. Adoption of Resolution Honoring Lucia Campbell
16
Attachment 4.B
382

Mrs. Straus moved, seconded by Mrs. Danhof, that the State Board of Education approve the Superintendent’s recommendations for the consent agenda as follows: L. approve the Standards for the Preparation of Teachers
of American Sign Language (FS), as attached to the Superintendent’s memorandum dated May 24, 2010;
M. approve the Standards for the Preparation of School
Counselors, as attached to the Superintendent’s memorandum dated May 24, 2010;
N. (this item was moved to discussion); O. (this item was moved to discussion); P. approve the appointments of Mary H. Brown, Ronald J.
Collins, Jennifer Brown, Sherry Cormier-Kuhn, Jan Van Gasse, and Jermaine D. Evans, and the re-appointment of Elaine C. Collins to the Professional Standards Commission for Teachers for a four-year term ending June 30, 2014, as discussed in the Superintendent’s memorandum dated May 24, 2010;
Q. approve the nominees listed in Attachment B of the
superintendent’s memorandum of May 24, 2010, and appoint those individuals to serve as members of the Special Education Advisory Committee for the respective terms specified;
R. approve the criteria for the Great Parents, Great Start
Program Grants, as described in the Superintendent’s memorandum dated May 24, 2010;
S. approve the criteria for the Individuals with Disabilities
Education Act Preschool Indicators Grant, as described in the Superintendent’s memorandum dated May 24, 2010;
X. approve the criteria for the Combined Title I Statewide
System of Support and High Priority Schools Technical Assistance Grant, as attached to the Superintendent’s memorandum dated June 3, 2010;
Y. approve the criteria for allocation of Title I School
Improvement funds to Support Regional Assistance to High Priority Schools, as described in the Superintendent’s memorandum dated June 3, 2010;
17
Attachment 4.B
383
T. adopt the resolution honoring Paula C. Wood, attached to the Superintendent’s memorandum dated May 24, 2010;
U. adopt the resolution honoring Gayle Guillen, as attached to
the Superintendent’s memorandum dated June 3, 2010; V. adopt the resolution regarding Michigan School Bus Safety
Week, October 18-22, 2010, as attached to the Superintendent’s memorandum dated May 24, 2010; and
W. adopt the resolution honoring Lucia Campbell, as attached
to the Superintendent’s memorandum dated June 3, 2010. The vote was taken on the motion. Ayes: Austin, Bauer, Curtin, Danhof, McGuire, Straus, Ulbrich Absent: Turner The motion carried. The resolution honoring Paula Wood is attached as Exhibit C. The resolution honoring Gayle Guillen is attached as Exhibit D. The resolution regarding Michigan School Bus Safety Week is attached as Exhibit E. The resolution honoring Lucia Campbell is attached as Exhibit F.
XX. PERSONAL PRIVILEGE – MR. MICHAEL P. FLANAGAN Mr. Flanagan said a referent group of experts in American Sign Language (ASL) was convened and designed the ASL (FS) standards using the framework for the approved world language standards. He thanked the members of the referent group that were present and said the ASL Standards were approved on the consent agenda.
XXI. PRESENTATION ON COMMON CORE STATE STANDARDS FOR ENGLISH LANGUAGE ARTS AND LITERACY IN HISTORY/SOCIAL STUDIES, SCIENCE AND TECHNICAL SUBJECTS AND COMMON CORE STATE STANDARDS FOR MATHEMATICS
This item was removed from the consent agenda and placed under discussion. It was presented and discussed earlier in the meeting during the Committee of the Whole. Dr. Sally Vaughn, Deputy Superintendent and Chief Academic Officer; Ms. Deborah Clemmons, Supervisor of Curriculum and Instruction; and
18
Attachment 4.B
384

Dr. Joseph Martineau, Director, Office of Educational Assessment and Accountability; returned to the Board table. Mrs. Danhof said she was unable to participate in the Committee of the Whole, and she appreciated the opportunity to discuss the item further.
Mrs. Danhof asked how alignment will be done between Michigan’s past and present Common Core Standards. Ms. Clemmons said much of the alignment has been done by Department staff and posted to the website. She said ACHIEVE has just made available an excellent computer based alignment tool. Dr. Vaughn said there is close alignment. Mrs. Danhof asked if teachers will feel assured that they are covering the material. Ms. Clemmons said there is a roll out strategy to help them understand the alignment and provide more supports, and the ACHIEVE tool will be helpful.
Mrs. Danhof asked if the Common Core State Standards are as rigorous as Michigan’s current standards. Ms. Clemmons said the Common Core State Standards are value added, more comprehensive, have learning progressions, and there are many things about the standards that enhance Michigan’s current standards. Ms. Clemmons said the rigor is not significantly compromised. Mr. Austin said previously there was push back by some states to take the rigor out of math and STEM and that has been overcome and the rigor remains and is consistent with Michigan’s high expectations.
Mrs. Danhof said one of the criticisms has been that Michigan has too many core content expectations. Ms. Clemmons said there are fewer in mathematics; English language arts does not have fewer because it now includes anchor standards for college and career ready, and the K-12 standards and literacy skills for history/social studies, science and technical subjects. She said there are good ideas for how to organize the work across content areas to build instructional units that address multiple standards.
Mr. Stephenson said the document is good, and will lead the teacher to better cross integration across content. He said it is developmentally appropriate and not so broad that it is incomprehensible.
Mrs. Danhof asked if the work that has been done with teacher preparation institutions regarding what teachers need to be taught will be jeopardized. Dr. Vaughn said there may need to be some realignment, but it is so closely aligned that it will not be a huge shift. She said universities can also realize cost benefits, because all states will be using the Common Core State Standards.
19
Attachment 4.B
385
Ms. Clemmons said roll outs are being planned with intermediate school district colleagues. She said the four large statewide roll outs will begin in October, and intermediate school districts will provide more detailed sessions. Ms. Clemmons said that in June “Technical Subjects” were added to the Common Core State Standards, so it will need to be added to the motion for approval.
Mrs. Straus moved, seconded by Mrs. Bauer, that the State Board of Education approve the Common Core State Standards for English Language Arts and Literacy in History/Social Studies, Science and Technical Subjects and Common Core State Standards for Mathematics, as described in the Superintendent’s memorandum dated June 8, 2010, and direct the Department to proceed in collaboration with LEAs and ISDs to implement internationally benchmarked college- and career-readiness K-12 standards. The vote was taken on the motion. Ayes: Austin, Bauer, Curtin, Danhof, McGuire, Straus, Ulbrich Absent: Turner The motion carried.
XXII. PRESENTATION ON SIGNING A MEMORANDUM OF UNDERSTANDING
TO FORMALLY JOIN THE SMARTER BALANCED ASSESSMENT CONSORTIUM
This item was removed from the consent agenda and placed under discussion. It was presented and discussed earlier in the meeting during the Committee of the Whole. Dr. Sally Vaughn, Deputy Superintendent and Chief Academic Officer; Ms. Deborah Clemmons, Supervisor of Curriculum and Instruction; and Dr. Joseph Martineau, Director, Office of Educational Assessment and Accountability; returned to the Board table. Mr. Austin moved, seconded by Mrs. Bauer, that the State Board of Education endorse the signing of the SMARTER Balanced Assessment Consortium Memorandum of Understanding by the President of the State Board of Education to allow the state to jointly submit the application for federal funding, as described in the Superintendent’s memorandum dated June 3, 2010.
20
Attachment 4.B
386
Mrs. Danhof asked how current Michigan assessments will be blended with the new assessments. Dr. Martineau said because there is strong overlap between Michigan content standards and common core standards, there should be reasonable alignment between existing and new assessments in English language arts and mathematics. He said current assessments will be used until the new assessments become operational in the 2014-15 school year. He said bridge studies will be of assistance in helping states transition from current assessments to consortium general assessments. He said alternate assessments still need to be addressed. Dr. Martineau said in the new assessments high school expectations will be set to predict college and career readiness. Dr. Vaughn said MEAP assessment for social studies and science would be maintained since the consortium is for English language arts and mathematics. Mrs. Danhof said the current growth model data are over a period of three years. She asked how common data sets will be obtained. Dr. Martineau said the theory of action for the consortium is responsible flexibility based on principles. He said there will be bridging assistance in terms of scales and growth models. The vote was taken on the motion. Ayes: Austin, Bauer, Curtin, Danhof, McGuire, Straus, Ulbrich Absent: Turner The motion carried.
XXIII. COMMENTS BY STATE BOARD OF EDUCATION MEMBERS
A. Universal Education Policy Framework – Mrs. Elizabeth Bauer
Mrs. Bauer said she is proud to be a member of a group that has a universal education framework for policy making that is operationalized, and she appreciates the work of Department staff and people in the field.
B. Response to Intervention – Mrs. Elizabeth Bauer
Mrs. Bauer said she visited three schools last week and she provided written reports to the Board. She said she saw how school personnel use data to drive instruction to move students forward to reach their potential. She said she saw Response to Intervention activities where students were engaged and teachers were happy. She said it is a wonderful model.
21
Attachment 4.B
387
C. Universal Education and the Digital Divide – Mrs. Nancy Danhof
Mrs. Danhof said universal education is throughout the National Association of State Boards of Education (NASBE) 21st Century Educator Study Group Report. Mrs. Danhof said members of the NASBE Study Group noted that the digital divide needs to be addressed so that students without resources don’t get left behind. She said teacher training and broadband infrastructure also need to be addressed.
Mrs. Bauer suggested that technological connectivity and licenses should be an agenda topic at the Board Retreat.
D. Alternative Schools – Mrs. Kathleen Straus
Mrs. Straus said she is concerned that the closing of schools in Detroit will include some alternative schools where students are making progress in a smaller setting.
E. NASBE Nominating Committee – Mrs. Carolyn Curtin
Mrs. Curtin said she participated via telephone in the National Association of State Boards of Education Nominating Committee meeting on June 11. She said it is common for constituents to believe that State Board of Education members have control over local issues.
XXIV. TENTATIVE AGENDA FOR NEXT MEETING
Mrs. Bauer moved, seconded by Mrs. Danhof, that the State Board of Education cancel its July 13, 2010, meeting.
The vote was taken on the motion.
Ayes: Austin, Bauer, Curtin, Danhof, McGuire, Straus, Ulbrich Absent: Turner
The motion carried. Mr. Flanagan said Board members may contact a member of the Agenda Planning Committee comprised of Mrs. Straus, Mr. Austin, and Mrs. Curtin with suggestions for agenda topics.
22
Attachment 4.B
388
XXV. FUTURE MEETING DATES
A. Tuesday, July 13, 2010 CANCELLED B. Tuesday, August 10, 2010 C. Tuesday, September 14, 2010 D. Tuesday, October 12, 2010 E. Tuesday, November 9, 2010
XXVI. ADJOURNMENT
The meeting adjourned at 3:03 p.m. Respectfully submitted, Carolyn Curtin Secretary
23
Attachment 4.B
389
Exhibit A STATE OF MICHIGAN
STATE BOARD OF EDUCATION
RESOLUTION
ROBERT L. STEPHENSON 2009-2010 MICHIGAN TEACHER OF THE YEAR
WHEREAS, Robert L. Stephenson received a Bachelor of Arts degree in Theater and a
Master of Education degree in Early Childhood from Kent State University; and
WHEREAS, Rob Stephenson has been a third grade teacher for 16 years at Wardcliff Elementary School in the Okemos Public Schools; and
WHEREAS, the State Board of Education and the Michigan Department of Education honored Robert L. Stephenson as the 2009-2010 Michigan Teacher of the Year; and
WHEREAS, Mr. Stephenson has shared his passion for the teaching profession, his passion for the preservation of innovation and creativity in the classroom, and his passion for early literacy throughout his tenure as the Michigan Teacher of the Year; and
WHEREAS, Mr. Stephenson has mentored and inspired many student teachers; and
WHEREAS, Mr. Stephenson was honored as one of four finalists for the 2010 National Teacher of the Year Award; as a Presidential Awardee for Excellence in Science Teaching in 2006; and as the 2005 Michigan Elementary Science Teacher of the Year; and
WHEREAS, the State Board of Education has continually supported teachers with several quality initiatives, including the Michigan Teacher of Year program and the Milken National Educator Award; and
WHEREAS, the State Board of Education, through its Task Force on Ensuring Excellent Educators, recognizes the need for elevating the profile of the teaching profession; now therefore be it
RESOLVED, That the State Board of Education expresses its deepest appreciation and gratitude to Mr. Stephenson and the thousands of educators around the great State of Michigan for their outstanding work; and be it finally
RESOLVED, That the State Board of Education supports all efforts, training, and resources available to our state's educators so that they may continue to educate and positively influence the children of today as they become the leaders of tomorrow.
_______________________________________ Kathleen N. Straus, President
Adopted June 15, 2010 _______________________________________ Michael P. Flanagan, Chairman and Superintendent of Public Instruction
Attachment 4.B
390
Exhibit B STATE OF MICHIGAN
STATE BOARD OF EDUCATION
RESOLUTION
MATINGA RAGATZ MICHIGAN TEACHER OF THE YEAR
2010-2011
WHEREAS, throughout Michigan and across the country, teachers open children’s minds to the magic of ideas, knowledge, and dreams; and WHEREAS, teachers keep American democracy alive by laying the foundation for good citizenship and their hard work and efforts are directly responsible for creating the leaders of tomorrow; and
WHEREAS, teachers fill many roles, as listeners, explorers, role models, motivators, and mentors; and
WHEREAS, teachers continue to influence us long after our school days are only memories; and
WHEREAS, the State Board of Education has continually supported teachers with several quality initiatives, including the Michigan Teacher of the Year program and the Milken National Educator Award; and
WHEREAS, the State Board of Education and the Michigan Department of Education have named Matinga Ragatz, Global Studies teacher at Grand Ledge High School, Grand Ledge Public Schools, with 21 years of teaching experience, as the 2010-2011 Michigan Teacher of the Year; now, therefore, be it
RESOLVED, that the State Board of Education expresses its deepest appreciation and gratitude to Matinga Ragatz and the thousands of educators around the great State of Michigan for their outstanding work; and be it finally
RESOLVED, that the State Board of Education supports all efforts, training, and resources available to our state’s educators so that they may continue to educate and positively influence the children of today as they become the leaders of tomorrow.
_______________________________________ Kathleen N. Straus, President
Adopted June 15, 2010 _______________________________________ Michael P. Flanagan, Chairman and Superintendent of Public Instruction
Attachment 4.B
391
Exhibit C STATE OF MICHIGAN
STATE BOARD OF EDUCATION
RESOLUTION
DR. PAULA C. WOOD Dean of the College of Education (Retiring)
Wayne State University
WHEREAS, Dr. Paula C. Wood has served as Dean of the College of Education at Wayne State University (WSU) in Detroit, Michigan since October, 1993, providing outstanding leadership, scholarship, and community service; and
WHEREAS, Dr. Wood’s many positive contributions to the field of education and teacher preparation have been demonstrated by her selection as the chair of the Michigan Deans’ Council (2004-05); appointment to the Michigan State Board of Education Ensuring Excellent Educators Task Force (2002); Chairmanship of the Merrill-Palmer Institute Advisory Group (ongoing); appointment as co-chair of the WSU Academic Achievement Task Force that produced a White Paper on “Academic Achievement of the Youth of the City of Detroit” (2003); appointment as Interim Provost of Wayne State University (April-June 2003); recipient of the WSU President’s Award for Excellence in Teaching (1987); and Phi Delta Kappa Educator of the Year (1995); and
WHEREAS, Wayne State University’s College of Education is approved as a teacher preparation institution by the State Board of Education and is recognized as one of the largest teacher preparation institutions in the nation; now therefore, be it
RESOLVED, That the State Board of Education expresses its deepest appreciation and gratitude to Dr. Wood for her outstanding leadership to Wayne State University’s College of Education and her contributions to the teaching profession in Michigan and our nation; and be it finally
RESOLVED, That the State Board of Education extends its wish that Dean Wood enjoys a well-deserved retirement and that she continues to be an active and valued member of Michigan’s educational community when she returns to her faculty position in the Teacher Education Division of the College of Education at Wayne State University.
______________________________________ Kathleen N. Straus, President
Adopted June 15, 2010 ______________________________________ Michael P. Flanagan, Chairman and Superintendent of Public Instruction
Attachment 4.B
392
Exhibit D STATE OF MICHIGAN
STATE BOARD OF EDUCATION
RESOLUTION
GAYLE (MONROE) GUILLEN
WHEREAS, Gayle Guillen began her career in the Michigan Department of Treasury as a Data Entry Operator for the Income Tax Division on January 21, 1979; and
WHEREAS, Gayle then transferred to the Michigan Department of Education in the Driver’s Education Unit as a Secretary 8 on June 16, 1996; and
WHEREAS, in 1997, Gayle was assigned as the Lead Secretary to the Supervisor of Child and Adult Care Program, serving for thirteen years as the “go to” resource for staff, childcare sponsors, and childcare centers on all matters related to the Program; and
WHEREAS, Gayle has shared her many talents of quilting, bead work, and jewelry design by donating to the many fundraisers the Michigan Department of Education has sponsored; and
WHEREAS, Gayle and her sister Penny are co-owners of a small business, Two Sisters Beading; Gayle and Penny travel across the state to sell their designer jewelry at craft shows; and Gayle will now have much more time to meet with her weekly quilting group and design more jewelry; and
WHEREAS, Gayle Guillen is the new bride of Tony Guillen, being married on April 27, 2010, in Las Vegas; Gayle and Tony are avid gardeners and their lush acres are covered with self designed flower gardens; and Gayle has shared her gifts of gardening by brightening the desk of her co-workers with beautiful bouquets over the years; and
WHEREAS, Gayle is a loving and devoted grandmother to her two grandsons, Anthony, age 11, and Dreon, age 8; being a child at heart herself, Gayle enjoys biking, playing basketball and soccer with her grandsons, and her most recently acquired skill, marshmallow gun wars (a fun and sticky time was had by all); now, therefore, be it
RESOLVED, That the State Board of Education express its deepest appreciation and gratitude to Gayle Guillen for the dedication she has shown throughout her career at the Michigan Department of Education; and be it further
RESOLVED, That the State Board of Education wishes Gayle Guillen a retirement that holds satisfying and fulfilling experiences and accomplishments.
_______________________________________ Kathleen N. Straus, President
Adopted June 15, 2010 _______________________________________ Michael P. Flanagan, Chairman and Superintendent of Public Instruction
Attachment 4.B
393
Exhibit E STATE OF MICHIGAN
STATE BOARD OF EDUCATION
RESOLUTION
Michigan School Bus Safety Week October 18-22, 2010
WHEREAS, the State Board of Education recognizes that the importance of protecting the safety of Michigan’s school children extends beyond the classroom walls and the building; and
WHEREAS, the State Board of Education has great respect for the accomplishments of
Michigan’s school bus drivers, mechanics, supervisors, and all school transportation personnel in providing the safest transportation possible for children to and from school and home; and
WHEREAS, each day over 17,000 Michigan school bus drivers transport more than
850,000 students, traveling over 184 million miles annually; and WHEREAS, coordinating the countless routes over so many miles, and supervising the
dozens of students on each bus, requires an outstanding effort put forth by thousands of exemplary professionals who have devoted their careers to transporting children safely; and
WHEREAS, the State Board of Education continues to recognize and takes great
pleasure in commending the men and women who accept and meet the challenge of school transportation; now, therefore, be it
RESOLVED, That the week of October 18-22, 2010, be designated as Michigan School
Bus Safety Week; and be it further RESOLVED, That this week be devoted to the recognition of everyone who contributes
to the successful operation of the state’s school buses; and be it finally RESOLVED, That this special week serve as a fitting time to urge all Michigan drivers to
become more aware of school bus safety regulations, and encourage all citizens to be alert and drive carefully near school buses.
_______________________________________ Kathleen N. Straus, President
Adopted June 15, 2010 _______________________________________ Michael P. Flanagan, Chairman and Superintendent of Public Instruction
Attachment 4.B
394
Exhibit F STATE OF MICHIGAN
STATE BOARD OF EDUCATION
RESOLUTION
LUCIA CAMPBELL
WHEREAS, Lucia Campbell, a granddaughter of tavern keepers and restaurant owners in the Upper Peninsula, daughter of a State of Michigan Assistant Attorney General, a product of Lansing schools (Willow, Holy Cross, and Sexton) and Lansing Community College, received her Bachelor of Arts Degree in Hotel, Restaurant, and Institutional Management from Michigan State University; and
WHEREAS, Lucia began her career in food service with St. Lawrence Hospital, Schuler’s Grate Steak Restaurant, Long’s of Lansing, The Clarion Hotel Conference Center, Michigan State University Food Service, and Meijer’s Lansing Area Distribution Center in the 1970’s and 1980’s; and
WHEREAS, in 1988, Lucia began her work as an Account Technician and then became a Departmental Analyst with the Department of Education’s Food Distribution Program, supporting the distribution of United States Department of Agriculture Foods in the household and school commodity programs to children and adults across the State of Michigan; and
WHEREAS, Lucia has enjoyed and achieved tremendous job satisfaction while working with many people in the State of Michigan who were committed to feeding school children, less advantaged families, and senior citizens; and
WHEREAS, Lucia has announced her retirement from the Michigan Department of Education on July 1, 2010; now, therefore be it
RESOLVED, That the State Board of Education receive with deep regret the news of the well-deserved retirement of this honored and distinguished employee; and be it further
RESOLVED, That the State Board of Education hereby express its gratitude, respect, and appreciation to this exceptional individual; and be it finally
RESOLVED, That in addition to its respect and gratitude, the State Board of Education extends to Lucia its highest regard, and its best wishes for the future.
_______________________________________ Kathleen N. Straus, President
Adopted June 15, 2010 _______________________________________ Michael P. Flanagan, Chairman and Superintendent of Public Instruction
Attachment 4.B
395
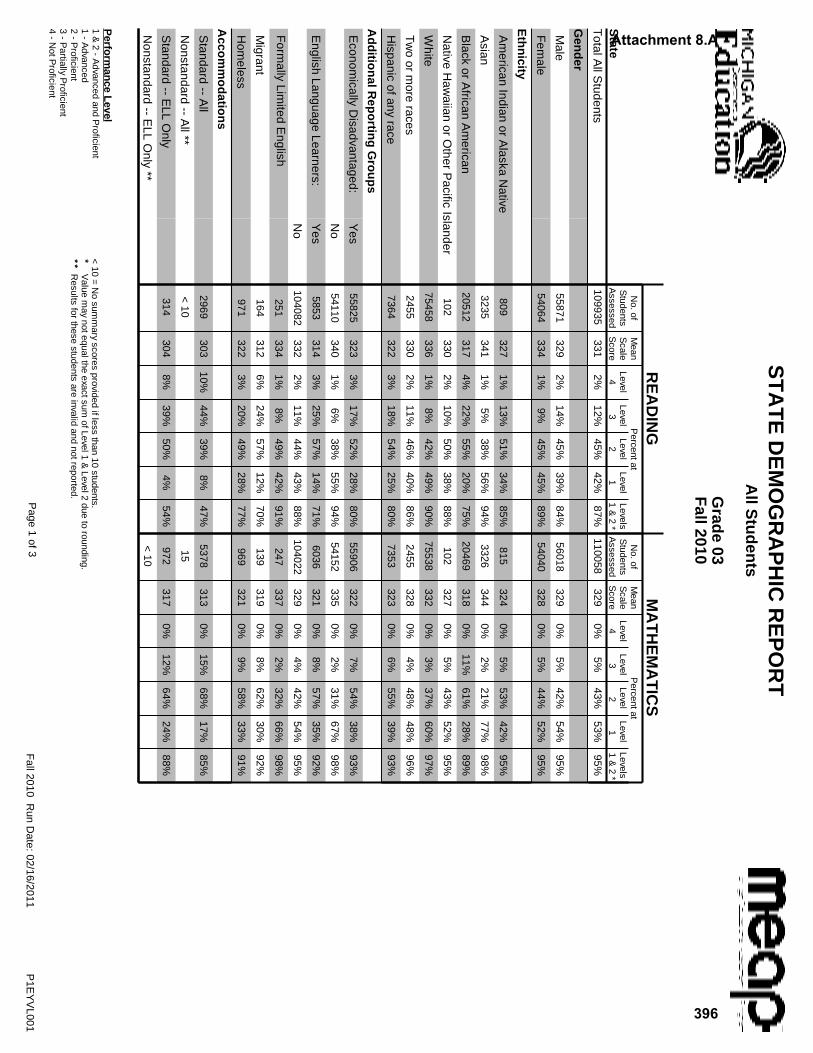
Perfo
rman
ceL
evel1
&2
-A
dvancedand
Proficient
1-
Advanced
2-
Proficient
3-
Partially
Proficient
4-
NotP
roficient
<10
=N
osum
mary
scoresprovided
iflessthan
10students.
*V
aluem
aynotequalthe
exactsumofLevel1
&Level2
dueto
rounding.**
Results
forthese
studentsare
invalidand
notreported.
ST
AT
ED
EM
OG
RA
PH
ICR
EP
OR
TA
llStu
den
ts
Grad
e03
Fall2010
RE
AD
ING
MA
TH
EM
AT
ICS
Fall2010
Run
Date:02/16/2011
Page
1of3
P1E
YV
L001
No.of
Mean
Percentat
No.of
Mean
Percentat
State
Students
Assessed
Scale
Score
Level4
Level3
Level2
Level1
Levels1
&2
*S
tudentsA
ssessedS
caleS
coreLevel
4Level
3Level
2Level
1Levels1
&2
*
TotalA
llStudents
109935331
2%12%
45%42%
87%110058
3290%
5%43%
53%95%
Gen
der
Male
55871329
2%14%
45%39%
84%56018
3290%
5%42%
54%95%
Fem
ale54064
3341%
9%45%
45%89%
54040328
0%5%
44%52%
95%
Eth
nicity
Am
ericanIndian
orA
laskaN
ative809
3271%
13%51%
34%85%
815324
0%5%
53%42%
95%
Asian
3235341
1%5%
38%56%
94%3326
3440%
2%21%
77%98%
Black
orA
fricanA
merican
20512317
4%22%
55%20%
75%20469
3180%
11%61%
28%89%
Native
Haw
aiianor
Other
Pacific
Islander102
3302%
10%50%
38%88%
102327
0%5%
43%52%
95%
White
75458336
1%8%
42%49%
90%75538
3320%
3%37%
60%97%
Tw
oor
more
races2455
3302%
11%46%
40%86%
2455328
0%4%
48%48%
96%
Hispanic
ofanyrace
7364322
3%18%
54%25%
80%7353
3230%
6%55%
39%93%
Ad
ditio
nalR
epo
rting
Gro
up
s
Econom
icallyD
isadvantaged:Y
es55825
3233%
17%52%
28%80%
55906322
0%7%
54%38%
93%
No
54110340
1%6%
38%55%
94%54152
3350%
2%31%
67%98%
English
LanguageLearners:
Yes
5853314
3%25%
57%14%
71%6036
3210%
8%57%
35%92%
No
104082332
2%11%
44%43%
88%104022
3290%
4%42%
54%95%
Form
allyLim
itedE
nglish251
3341%
8%49%
42%91%
247337
0%2%
32%66%
98%
Migrant
164312
6%24%
57%12%
70%139
3190%
8%62%
30%92%
Hom
eless971
3223%
20%49%
28%77%
969321
0%9%
58%33%
91%
Acco
mm
od
ation
s
Standard
--A
ll2969
30310%
44%39%
8%47%
5378313
0%15%
68%17%
85%
Nonstandard
--A
ll**<
1015
Standard
--E
LLO
nly314
3048%
39%50%
4%54%
972317
0%12%
64%24%
88%
Nonstandard
--E
LLO
nly**
<10
Attachment 8.A
396
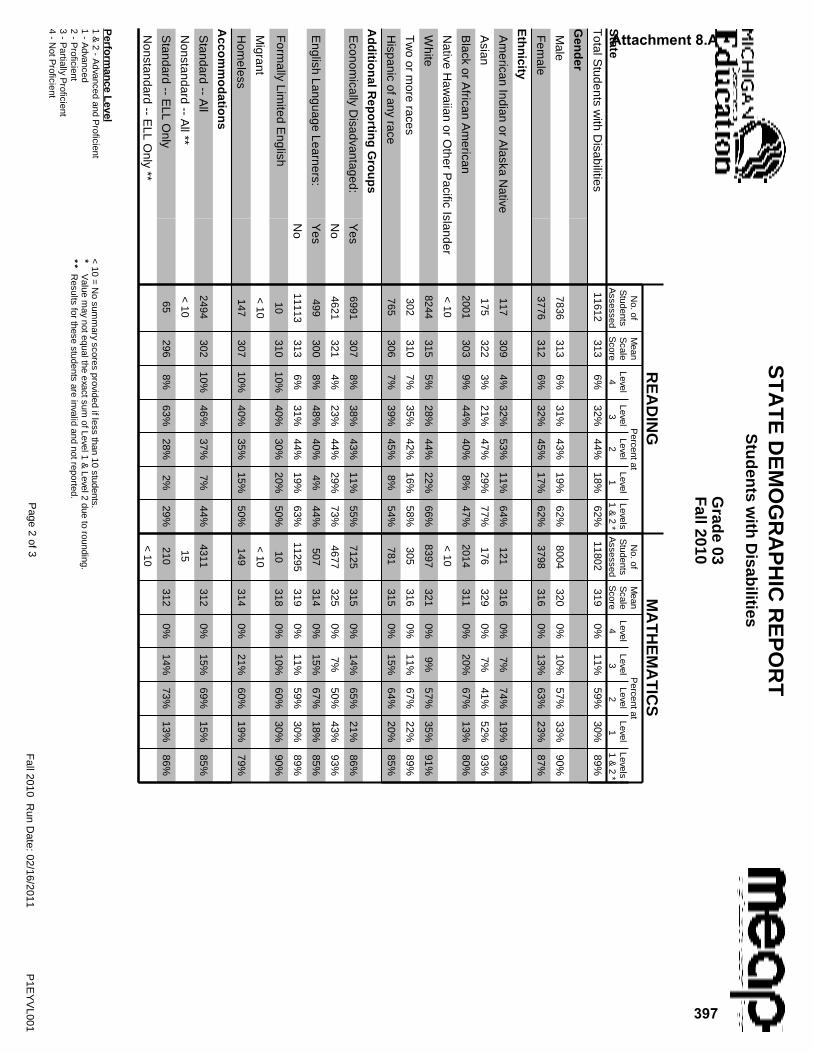
Perfo
rman
ceL
evel1
&2
-A
dvancedand
Proficient
1-
Advanced
2-
Proficient
3-
Partially
Proficient
4-
NotP
roficient
<10
=N
osum
mary
scoresprovided
iflessthan
10students.
*V
aluem
aynotequalthe
exactsumofLevel1
&Level2
dueto
rounding.**
Results
forthese
studentsare
invalidand
notreported.
ST
AT
ED
EM
OG
RA
PH
ICR
EP
OR
TS
tud
ents
with
Disab
ilities
Grad
e03
Fall2010
RE
AD
ING
MA
TH
EM
AT
ICS
Fall2010
Run
Date:02/16/2011
Page
2of3
P1E
YV
L001
No.of
Mean
Percentat
No.of
Mean
Percentat
State
Students
Assessed
Scale
Score
Level4
Level3
Level2
Level1
Levels1
&2
*S
tudentsA
ssessedS
caleS
coreLevel
4Level
3Level
2Level
1Levels1
&2
*
TotalS
tudentsw
ithD
isabilities11612
3136%
32%44%
18%62%
11802319
0%11%
59%30%
89%
Gen
der
Male
7836313
6%31%
43%19%
62%8004
3200%
10%57%
33%90%
Fem
ale3776
3126%
32%45%
17%62%
3798316
0%13%
63%23%
87%
Eth
nicity
Am
ericanIndian
orA
laskaN
ative117
3094%
32%53%
11%64%
121316
0%7%
74%19%
93%
Asian
175322
3%21%
47%29%
77%176
3290%
7%41%
52%93%
Black
orA
fricanA
merican
2001303
9%44%
40%8%
47%2014
3110%
20%67%
13%80%
Native
Haw
aiianor
Other
Pacific
Islander<
10<
10
White
8244315
5%28%
44%22%
66%8397
3210%
9%57%
35%91%
Tw
oor
more
races302
3107%
35%42%
16%58%
305316
0%11%
67%22%
89%
Hispanic
ofanyrace
765306
7%39%
45%8%
54%781
3150%
15%64%
20%85%
Ad
ditio
nalR
epo
rting
Gro
up
s
Econom
icallyD
isadvantaged:Y
es6991
3078%
38%43%
11%55%
7125315
0%14%
65%21%
86%
No
4621321
4%23%
44%29%
73%4677
3250%
7%50%
43%93%
English
LanguageLearners:
Yes
499300
8%48%
40%4%
44%507
3140%
15%67%
18%85%
No
11113313
6%31%
44%19%
63%11295
3190%
11%59%
30%89%
Form
allyLim
itedE
nglish10
31010%
40%30%
20%50%
10318
0%10%
60%30%
90%
Migrant
<10
<10
Hom
eless147
30710%
40%35%
15%50%
149314
0%21%
60%19%
79%
Acco
mm
od
ation
s
Standard
--A
ll2494
30210%
46%37%
7%44%
4311312
0%15%
69%15%
85%
Nonstandard
--A
ll**<
1015
Standard
--E
LLO
nly65
2968%
63%28%
2%29%
210312
0%14%
73%13%
86%
Nonstandard
--E
LLO
nly**
<10
Attachment 8.A
397
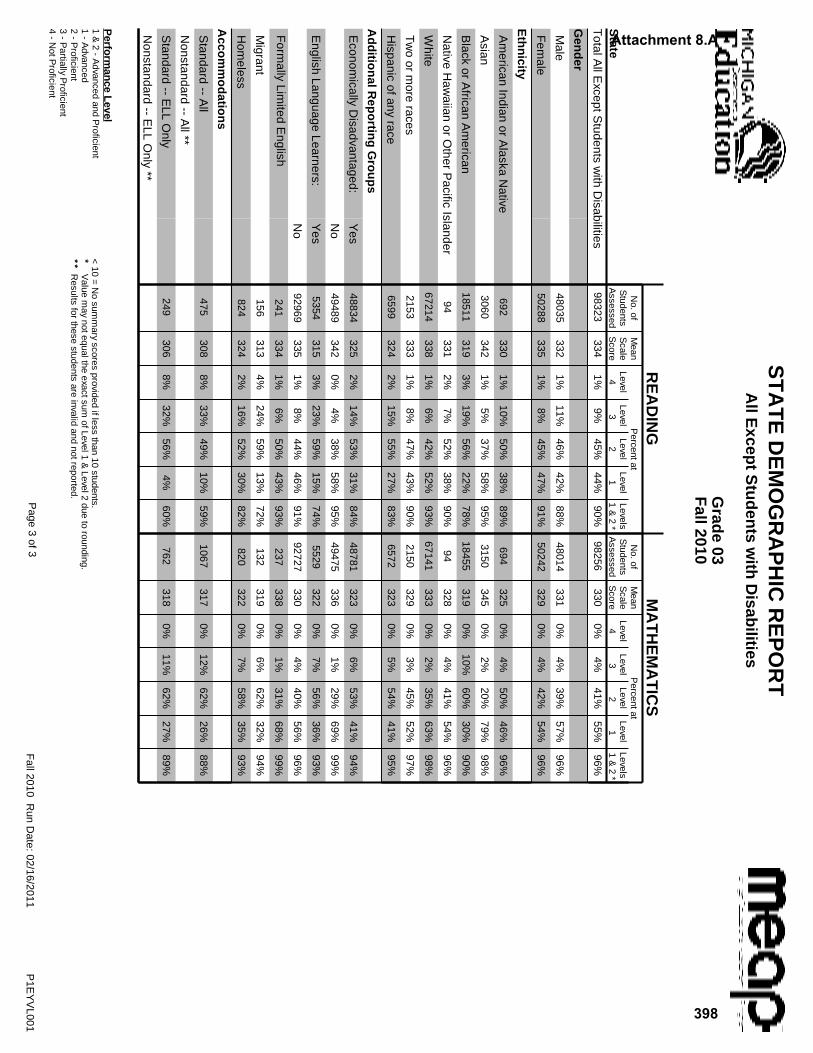
Perfo
rman
ceL
evel1
&2
-A
dvancedand
Proficient
1-
Advanced
2-
Proficient
3-
Partially
Proficient
4-
NotP
roficient
<10
=N
osum
mary
scoresprovided
iflessthan
10students.
*V
aluem
aynotequalthe
exactsumofLevel1
&Level2
dueto
rounding.**
Results
forthese
studentsare
invalidand
notreported.
ST
AT
ED
EM
OG
RA
PH
ICR
EP
OR
TA
llExcep
tS
tud
ents
with
Disab
ilities
Grad
e03
Fall2010
RE
AD
ING
MA
TH
EM
AT
ICS
Fall2010
Run
Date:02/16/2011
Page
3of3
P1E
YV
L001
No.of
Mean
Percentat
No.of
Mean
Percentat
State
Students
Assessed
Scale
Score
Level4
Level3
Level2
Level1
Levels1
&2
*S
tudentsA
ssessedS
caleS
coreLevel
4Level
3Level
2Level
1Levels1
&2
*
TotalA
llExceptS
tudentsw
ithD
isabilities98323
3341%
9%45%
44%90%
98256330
0%4%
41%55%
96%
Gen
der
Male
48035332
1%11%
46%42%
88%48014
3310%
4%39%
57%96%
Fem
ale50288
3351%
8%45%
47%91%
50242329
0%4%
42%54%
96%
Eth
nicity
Am
ericanIndian
orA
laskaN
ative692
3301%
10%50%
38%89%
694325
0%4%
50%46%
96%
Asian
3060342
1%5%
37%58%
95%3150
3450%
2%20%
79%98%
Black
orA
fricanA
merican
18511319
3%19%
56%22%
78%18455
3190%
10%60%
30%90%
Native
Haw
aiianor
Other
Pacific
Islander94
3312%
7%52%
38%90%
94328
0%4%
41%54%
96%
White
67214338
1%6%
42%52%
93%67141
3330%
2%35%
63%98%
Tw
oor
more
races2153
3331%
8%47%
43%90%
2150329
0%3%
45%52%
97%
Hispanic
ofanyrace
6599324
2%15%
55%27%
83%6572
3230%
5%54%
41%95%
Ad
ditio
nalR
epo
rting
Gro
up
s
Econom
icallyD
isadvantaged:Y
es48834
3252%
14%53%
31%84%
48781323
0%6%
53%41%
94%
No
49489342
0%4%
38%58%
95%49475
3360%
1%29%
69%99%
English
LanguageLearners:
Yes
5354315
3%23%
59%15%
74%5529
3220%
7%56%
36%93%
No
92969335
1%8%
44%46%
91%92727
3300%
4%40%
56%96%
Form
allyLim
itedE
nglish241
3341%
6%50%
43%93%
237338
0%1%
31%68%
99%
Migrant
156313
4%24%
59%13%
72%132
3190%
6%62%
32%94%
Hom
eless824
3242%
16%52%
30%82%
820322
0%7%
58%35%
93%
Acco
mm
od
ation
s
Standard
--A
ll475
3088%
33%49%
10%59%
1067317
0%12%
62%26%
88%
Nonstandard
--A
ll**
Standard
--E
LLO
nly249
3068%
32%56%
4%60%
762318
0%11%
62%27%
89%
Nonstandard
--E
LLO
nly**
Attachment 8.A
398

Perfo
rman
ceL
evel1
&2
-A
dvancedand
Proficient
1-
Advanced
2-
Proficient
3-
Partially
Proficient
4-
NotP
roficient
<10
=N
osum
mary
scoresprovided
iflessthan
10students.
*V
aluem
aynotequalthe
exactsumofLevel1
&Level2
dueto
rounding.**
Results
forthese
studentsare
invalidand
notreported.
ST
AT
ED
EM
OG
RA
PH
ICR
EP
OR
TA
llStu
den
ts
Grad
e04
Fall2010
RE
AD
ING
WR
ITIN
GM
AT
HE
MA
TIC
S
Fall2010
Run
Date:02/16/2011
Page
1of3
P1E
YV
L002
No.of
Mean
Percentat
No.of
Mean
Percentat
No.of
Mean
Percentat
State
Students
Assessed
Scale
Score
Level4
Level3
Level2
Level1
Levels1
&2
*S
tudentsA
ssessedS
caleS
coreLevel
4Level
3Level
2Level
1Levels1
&2
*S
tudentsA
ssessedS
caleS
coreLevel
4Level
3Level
2Level
1Levels1
&2
*
TotalA
llStudents
112549430
2%14%
53%31%
84%112452
3985%
48%36%
11%47%
112919429
0%8%
49%43%
91%
Gen
der
Male
57355427
3%16%
53%28%
81%57302
3937%
54%32%
8%39%
57655430
0%9%
47%44%
91%
Fem
ale55194
4331%
12%52%
35%87%
55150403
3%41%
40%16%
56%55264
4280%
8%51%
41%92%
Eth
nicity
Am
ericanIndian
orA
laskaN
ative886
4234%
19%57%
21%77%
883390
8%58%
29%4%
34%889
4220%
11%60%
29%89%
Asian
3207442
1%7%
43%49%
92%3208
4132%
27%42%
28%71%
3284447
0%3%
26%71%
97%
Black
orA
fricanA
merican
21076415
4%26%
55%14%
69%21061
38710%
62%24%
4%28%
21094416
0%19%
62%19%
81%
Native
Haw
aiianor
Other
Pacific
Islander95
4390%
9%49%
41%91%
95402
5%41%
42%12%
54%96
4320%
3%45%
52%97%
White
77822435
1%10%
52%36%
88%77798
4013%
44%39%
13%53%
78085432
0%6%
45%49%
94%
Tw
oor
more
races2357
4292%
14%55%
29%84%
2354398
4%50%
34%11%
45%2360
4280%
9%51%
40%91%
Hispanic
ofanyrace
7106421
3%19%
59%19%
78%7053
3927%
57%30%
6%36%
7111422
0%11%
61%28%
89%
Ad
ditio
nalR
epo
rting
Gro
up
s
Econom
icallyD
isadvantaged:Y
es56244
4213%
21%57%
19%76%
56168390
8%59%
28%5%
33%56502
4210%
13%59%
28%87%
No
56305440
1%7%
49%43%
92%56284
4062%
37%43%
18%61%
56417436
0%4%
39%57%
96%
English
LanguageLearners:
Yes
5040411
4%29%
59%8%
66%5006
38610%
64%23%
3%26%
5211418
0%15%
63%22%
85%
No
107509431
2%13%
53%32%
85%107446
3995%
47%36%
12%48%
107708429
0%8%
48%44%
92%
Form
allyLim
itedE
nglish611
4380%
5%57%
38%95%
611410
0%32%
48%20%
68%610
4410%
3%32%
65%97%
Migrant
166414
6%25%
58%10%
69%145
38318%
52%27%
3%30%
134422
0%8%
64%28%
92%
Hom
eless827
4195%
22%57%
16%73%
821388
9%63%
23%5%
28%823
4200%
16%57%
27%84%
Acco
mm
od
ation
s
Standard
--A
ll3644
39911%
47%37%
5%42%
3834372
24%68%
7%1%
8%6757
4100%
29%60%
11%71%
Nonstandard
--A
ll**<
1011
15
Standard
--E
LLO
nly286
4037%
42%46%
5%51%
259374
20%69%
10%1%
10%792
4140%
23%60%
17%77%
Nonstandard
--E
LLO
nly**
<10
<10
Attachment 8.A
399

Perfo
rman
ceL
evel1
&2
-A
dvancedand
Proficient
1-
Advanced
2-
Proficient
3-
Partially
Proficient
4-
NotP
roficient
<10
=N
osum
mary
scoresprovided
iflessthan
10students.
*V
aluem
aynotequalthe
exactsumofLevel1
&Level2
dueto
rounding.**
Results
forthese
studentsare
invalidand
notreported.
ST
AT
ED
EM
OG
RA
PH
ICR
EP
OR
TS
tud
ents
with
Disab
ilities
Grad
e04
Fall2010
RE
AD
ING
WR
ITIN
GM
AT
HE
MA
TIC
S
Fall2010
Run
Date:02/16/2011
Page
2of3
P1E
YV
L002
No.of
Mean
Percentat
No.of
Mean
Percentat
No.of
Mean
Percentat
State
Students
Assessed
Scale
Score
Level4
Level3
Level2
Level1
Levels1
&2
*S
tudentsA
ssessedS
caleS
coreLevel
4Level
3Level
2Level
1Levels1
&2
*S
tudentsA
ssessedS
caleS
coreLevel
4Level
3Level
2Level
1Levels1
&2
*
TotalS
tudentsw
ithD
isabilities12840
4089%
37%43%
11%54%
12832378
19%64%
14%3%
17%13132
4160%
22%57%
20%77%
Gen
der
Male
8518407
9%37%
43%11%
54%8507
37621%
64%13%
2%15%
8764417
0%21%
57%22%
79%
Fem
ale4322
4088%
37%44%
11%55%
4325381
15%65%
16%4%
20%4368
4130%
26%58%
17%74%
Eth
nicity
Am
ericanIndian
orA
laskaN
ative148
39914%
43%39%
5%44%
148370
26%68%
5%1%
6%152
4100%
26%65%
9%74%
Asian
163418
6%24%
52%18%
71%163
39010%
58%23%
9%32%
165426
0%8%
54%38%
92%
Black
orA
fricanA
merican
2321396
13%50%
33%3%
36%2319
36832%
61%6%
1%7%
2375407
0%35%
57%7%
64%
Native
Haw
aiianor
Other
Pacific
Islander10
4220%
40%30%
30%60%
10375
30%50%
20%0%
20%11
4180%
9%64%
27%91%
White
9063411
7%33%
47%13%
60%9060
38116%
65%16%
3%20%
9264418
0%19%
57%24%
81%
Tw
oor
more
races315
4068%
39%43%
10%52%
315377
17%71%
10%2%
12%319
4150%
21%61%
17%78%
Hispanic
ofanyrace
820401
11%45%
38%6%
44%817
37423%
67%8%
2%10%
846411
0%28%
59%12%
72%
Ad
ditio
nalR
epo
rting
Gro
up
s
Econom
icallyD
isadvantaged:Y
es7607
40111%
44%40%
6%46%
7602373
24%66%
8%1%
10%7821
4120%
27%60%
13%73%
No
5233416
5%28%
49%18%
67%5230
38612%
61%22%
5%27%
5311422
0%15%
54%31%
84%
English
LanguageLearners:
Yes
535396
13%49%
36%2%
38%534
37127%
67%5%
1%6%
552410
0%32%
58%10%
68%
No
12305408
8%37%
44%11%
55%12298
37819%
64%14%
3%17%
12580416
0%22%
57%21%
78%
Form
allyLim
itedE
nglish23
4250%
22%65%
13%78%
23396
0%52%
35%13%
48%23
4290%
4%57%
39%96%
Migrant
15384
33%60%
7%0%
7%12
35850%
50%0%
0%0%
13407
0%31%
62%8%
69%
Hom
eless132
39915%
41%41%
3%44%
132372
20%76%
4%0%
4%137
4090%
33%59%
8%67%
Acco
mm
od
ation
s
Standard
--A
ll3199
39812%
48%36%
4%40%
3363371
25%69%
6%1%
7%5827
4090%
30%60%
9%70%
Nonstandard
--A
ll**<
10<
1013
Standard
--E
LLO
nly58
39117%
55%28%
0%28%
57362
39%61%
0%0%
0%210
4070%
35%60%
5%65%
Nonstandard
--E
LLO
nly**
<10
<10
Attachment 8.A
400

Perfo
rman
ceL
evel1
&2
-A
dvancedand
Proficient
1-
Advanced
2-
Proficient
3-
Partially
Proficient
4-
NotP
roficient
<10
=N
osum
mary
scoresprovided
iflessthan
10students.
*V
aluem
aynotequalthe
exactsumofLevel1
&Level2
dueto
rounding.**
Results
forthese
studentsare
invalidand
notreported.
ST
AT
ED
EM
OG
RA
PH
ICR
EP
OR
TA
llExcep
tS
tud
ents
with
Disab
ilities
Grad
e04
Fall2010
RE
AD
ING
WR
ITIN
GM
AT
HE
MA
TIC
S
Fall2010
Run
Date:02/16/2011
Page
3of3
P1E
YV
L002
No.of
Mean
Percentat
No.of
Mean
Percentat
No.of
Mean
Percentat
State
Students
Assessed
Scale
Score
Level4
Level3
Level2
Level1
Levels1
&2
*S
tudentsA
ssessedS
caleS
coreLevel
4Level
3Level
2Level
1Levels1
&2
*S
tudentsA
ssessedS
caleS
coreLevel
4Level
3Level
2Level
1Levels1
&2
*
TotalA
llExceptS
tudentsw
ithD
isabilities99709
4331%
11%54%
34%88%
99620401
3%46%
39%13%
51%99787
4300%
7%48%
46%93%
Gen
der
Male
48837431
2%12%
55%31%
86%48795
3964%
52%35%
9%43%
48891432
0%6%
45%48%
94%
Fem
ale50872
4351%
9%53%
37%90%
50825405
2%39%
42%17%
59%50896
4290%
7%50%
43%93%
Eth
nicity
Am
ericanIndian
orA
laskaN
ative738
4272%
14%60%
24%84%
735394
5%56%
34%5%
39%737
4240%
8%59%
33%92%
Asian
3044444
1%6%
43%50%
93%3045
4152%
25%43%
29%73%
3119448
0%3%
24%73%
97%
Black
orA
fricanA
merican
18755417
3%23%
58%15%
73%18742
3897%
62%26%
5%31%
18719417
0%17%
62%21%
83%
Native
Haw
aiianor
Other
Pacific
Islander85
4410%
6%52%
42%94%
85405
2%40%
45%13%
58%85
4340%
2%42%
55%98%
White
68759438
1%7%
53%39%
92%68738
4042%
41%42%
15%57%
68821434
0%4%
43%53%
96%
Tw
oor
more
races2042
4331%
10%57%
32%88%
2039401
2%47%
38%13%
51%2041
4300%
7%49%
44%93%
Hispanic
ofanyrace
6286424
2%16%
62%21%
82%6236
3945%
56%33%
7%40%
6265423
0%9%
61%30%
91%
Ad
ditio
nalR
epo
rting
Gro
up
s
Econom
icallyD
isadvantaged:Y
es48637
4242%
17%60%
21%81%
48566393
5%58%
31%6%
37%48681
4230%
11%59%
31%89%
No
51072442
0%5%
49%46%
95%51054
4081%
34%46%
19%65%
51106438
0%3%
37%60%
97%
English
LanguageLearners:
Yes
4505413
3%27%
61%9%
70%4472
3888%
64%25%
3%28%
4659419
0%13%
63%23%
86%
No
95204434
1%10%
54%35%
89%95148
4013%
45%39%
13%52%
95128431
0%6%
47%47%
94%
Form
allyLim
itedE
nglish588
4380%
5%56%
39%95%
588410
0%31%
48%20%
69%587
4410%
3%31%
66%97%
Migrant
151417
3%22%
64%11%
75%133
38515%
53%29%
3%32%
121423
0%6%
64%30%
94%
Hom
eless695
4223%
19%60%
19%79%
689391
6%61%
27%6%
33%686
4220%
13%57%
30%87%
Acco
mm
od
ation
s
Standard
--A
ll445
4077%
38%46%
9%56%
471380
15%67%
14%3%
18%930
4160%
21%58%
21%79%
Nonstandard
--A
ll**<
10<
10<
10
Standard
--E
LLO
nly228
4065%
38%50%
7%57%
202378
15%72%
12%1%
13%582
4170%
19%60%
21%81%
Nonstandard
--E
LLO
nly**
Attachment 8.A
401

Perfo
rman
ceL
evel1
&2
-A
dvancedand
Proficient
1-
Advanced
2-
Proficient
3-
Partially
Proficient
4-
NotP
roficient
<10
=N
osum
mary
scoresprovided
iflessthan
10students.
*V
aluem
aynotequalthe
exactsumofLevel1
&Level2
dueto
rounding.**
Results
forthese
studentsare
invalidand
notreported.
ST
AT
ED
EM
OG
RA
PH
ICR
EP
OR
TA
llStu
den
ts
Grad
e05
Fall2010
RE
AD
ING
MA
TH
EM
AT
ICS
SC
IEN
CE
Fall2010
Run
Date:02/16/2011
Page
1of3
P1E
YV
L003
No.of
Mean
Percentat
No.of
Mean
Percentat
No.of
Mean
Percentat
State
Students
Assessed
Scale
Score
Level4
Level3
Level2
Level1
Levels1
&2
*S
tudentsA
ssessedS
caleS
coreLevel
4Level
3Level
2Level
1Levels1
&2
*S
tudentsA
ssessedS
caleS
coreLevel
4Level
3Level
2Level
1Levels1
&2
*
TotalA
llStudents
113922531
5%9%
41%44%
85%114234
5263%
18%35%
45%80%
114368524
5%17%
40%38%
78%
Gen
der
Male
57569529
7%11%
41%42%
83%57816
5273%
18%33%
46%80%
57881525
5%17%
38%40%
78%
Fem
ale56353
5334%
8%40%
47%88%
56418524
2%17%
37%43%
80%56487
5234%
17%42%
37%79%
Eth
nicity
Am
ericanIndian
orA
laskaN
ative906
5257%
10%50%
33%83%
909517
3%23%
42%32%
74%908
5186%
20%45%
30%75%
Asian
3144544
3%5%
29%63%
92%3239
5551%
7%17%
75%92%
3236536
3%9%
33%54%
87%
Black
orA
fricanA
merican
21435517
11%17%
46%26%
72%21440
5106%
33%39%
22%61%
21450504
12%35%
39%13%
53%
Native
Haw
aiianor
Other
Pacific
Islander122
5382%
7%37%
55%92%
123538
0%11%
28%61%
89%123
5334%
8%37%
51%88%
White
78957535
4%7%
39%50%
89%79153
5302%
13%34%
51%85%
79269530
3%12%
39%46%
85%
Tw
oor
more
races2355
5305%
10%43%
42%85%
2354524
2%20%
36%41%
78%2361
5224%
19%42%
35%77%
Hispanic
ofanyrace
7003522
8%14%
48%30%
79%7016
5173%
23%43%
31%73%
7021513
7%26%
46%22%
68%
Ad
ditio
nalR
epo
rting
Gro
up
s
Econom
icallyD
isadvantaged:Y
es55644
5219%
14%47%
30%77%
55884515
4%26%
41%30%
70%55957
5138%
26%43%
24%67%
No
58278540
2%5%
34%58%
92%58350
5361%
10%30%
59%89%
58411535
2%9%
36%53%
89%
English
LanguageLearners:
Yes
4236509
15%22%
51%13%
63%4406
5125%
31%42%
22%65%
4403500
13%38%
41%8%
49%
No
109686532
5%9%
40%46%
86%109828
5272%
17%35%
46%81%
109965525
5%16%
40%40%
79%
Form
allyLim
itedE
nglish780
5331%
4%54%
41%95%
776538
1%7%
28%63%
92%778
5261%
11%53%
35%88%
Migrant
167512
10%22%
52%16%
68%146
5163%
20%49%
28%77%
145503
8%35%
50%8%
57%
Hom
eless798
51812%
16%47%
26%73%
799513
5%28%
40%27%
67%797
5129%
24%44%
22%67%
Acco
mm
od
ation
s
Standard
--A
ll4027
50027%
28%36%
9%45%
7469499
12%47%
31%10%
41%7522
50115%
37%38%
10%48%
Nonstandard
--A
ll**<
10<
10<
10
Standard
--E
LLO
nly187
49727%
31%36%
6%42%
649505
11%40%
32%17%
49%653
49519%
41%34%
6%40%
Nonstandard
--E
LLO
nly**
<10
Attachment 8.A
402

Perfo
rman
ceL
evel1
&2
-A
dvancedand
Proficient
1-
Advanced
2-
Proficient
3-
Partially
Proficient
4-
NotP
roficient
<10
=N
osum
mary
scoresprovided
iflessthan
10students.
*V
aluem
aynotequalthe
exactsumofLevel1
&Level2
dueto
rounding.**
Results
forthese
studentsare
invalidand
notreported.
ST
AT
ED
EM
OG
RA
PH
ICR
EP
OR
TS
tud
ents
with
Disab
ilities
Grad
e05
Fall2010
RE
AD
ING
MA
TH
EM
AT
ICS
SC
IEN
CE
Fall2010
Run
Date:02/16/2011
Page
2of3
P1E
YV
L003
No.of
Mean
Percentat
No.of
Mean
Percentat
No.of
Mean
Percentat
State
Students
Assessed
Scale
Score
Level4
Level3
Level2
Level1
Levels1
&2
*S
tudentsA
ssessedS
caleS
coreLevel
4Level
3Level
2Level
1Levels1
&2
*S
tudentsA
ssessedS
caleS
coreLevel
4Level
3Level
2Level
1Levels1
&2
*
TotalS
tudentsw
ithD
isabilities13159
50622%
25%38%
15%53%
13357505
9%41%
33%18%
50%13489
50613%
33%38%
16%54%
Gen
der
Male
8551506
23%24%
37%16%
53%8729
5088%
38%34%
20%54%
8792508
13%30%
39%18%
57%
Fem
ale4608
50522%
25%40%
13%53%
4628501
11%46%
31%13%
44%4697
50214%
37%38%
11%49%
Eth
nicity
Am
ericanIndian
orA
laskaN
ative139
50128%
27%36%
9%45%
144499
11%47%
33%8%
42%145
49820%
36%37%
8%44%
Asian
175516
14%26%
34%26%
60%181
5217%
25%33%
35%68%
179510
12%28%
40%20%
60%
Black
orA
fricanA
merican
2519495
34%30%
30%6%
37%2546
49516%
51%26%
7%33%
2551490
25%46%
25%4%
29%
Native
Haw
aiianor
Other
Pacific
Islander<
10<
10<
10
White
9236509
19%23%
41%18%
58%9382
5087%
37%35%
21%55%
9500510
10%28%
42%20%
62%
Tw
oor
more
races273
50521%
22%43%
14%57%
275504
6%45%
32%17%
49%281
50511%
34%42%
12%54%
Hispanic
ofanyrace
811498
32%27%
32%8%
41%823
49913%
45%30%
11%41%
827497
17%43%
33%7%
40%
Ad
ditio
nalR
epo
rting
Gro
up
s
Econom
icallyD
isadvantaged:Y
es7922
50027%
27%36%
9%45%
8090500
11%47%
31%11%
42%8165
50016%
38%36%
10%46%
No
5237514
15%20%
41%24%
65%5267
5146%
31%36%
28%63%
5324514
9%25%
42%25%
67%
English
LanguageLearners:
Yes
521491
38%30%
29%2%
31%532
49811%
49%31%
8%39%
532493
19%49%
30%3%
33%
No
12638506
22%24%
38%16%
54%12825
5069%
40%33%
18%51%
12957506
13%32%
39%16%
55%
Form
allyLim
itedE
nglish30
51417%
13%50%
20%70%
29512
10%21%
52%17%
69%30
51210%
23%53%
13%67%
Migrant
10480
60%40%
0%0%
0%10
48910%
80%10%
0%10%
<10
Hom
eless138
49536%
31%24%
9%33%
144496
16%50%
26%8%
34%144
49917%
40%35%
8%43%
Acco
mm
od
ation
s
Standard
--A
ll3657
49927%
29%35%
8%43%
6680498
12%49%
31%9%
40%6748
50115%
37%39%
10%48%
Nonstandard
--A
ll**<
10<
10<
10
Standard
--E
LLO
nly55
48940%
33%27%
0%27%
211496
12%54%
28%7%
35%213
49416%
48%31%
4%35%
Nonstandard
--E
LLO
nly**
Attachment 8.A
403

Perfo
rman
ceL
evel1
&2
-A
dvancedand
Proficient
1-
Advanced
2-
Proficient
3-
Partially
Proficient
4-
NotP
roficient
<10
=N
osum
mary
scoresprovided
iflessthan
10students.
*V
aluem
aynotequalthe
exactsumofLevel1
&Level2
dueto
rounding.**
Results
forthese
studentsare
invalidand
notreported.
ST
AT
ED
EM
OG
RA
PH
ICR
EP
OR
TA
llExcep
tS
tud
ents
with
Disab
ilities
Grad
e05
Fall2010
RE
AD
ING
MA
TH
EM
AT
ICS
SC
IEN
CE
Fall2010
Run
Date:02/16/2011
Page
3of3
P1E
YV
L003
No.of
Mean
Percentat
No.of
Mean
Percentat
No.of
Mean
Percentat
State
Students
Assessed
Scale
Score
Level4
Level3
Level2
Level1
Levels1
&2
*S
tudentsA
ssessedS
caleS
coreLevel
4Level
3Level
2Level
1Levels1
&2
*S
tudentsA
ssessedS
caleS
coreLevel
4Level
3Level
2Level
1Levels1
&2
*
TotalA
llExceptS
tudentsw
ithD
isabilities100763
5343%
7%41%
48%89%
100877529
2%15%
36%48%
84%100879
5274%
15%40%
41%81%
Gen
der
Male
49018532
4%8%
42%46%
88%49087
5312%
14%33%
51%84%
49089528
4%15%
37%44%
81%
Fem
ale51745
5363%
7%41%
50%91%
51790526
2%15%
38%45%
83%51790
5253%
15%42%
39%81%
Eth
nicity
Am
ericanIndian
orA
laskaN
ative767
5293%
7%53%
37%90%
765520
2%18%
43%37%
80%763
5223%
17%46%
34%80%
Asian
2969545
2%4%
29%65%
94%3058
5571%
6%16%
77%94%
3057538
3%8%
33%56%
89%
Black
orA
fricanA
merican
18916520
8%15%
48%28%
76%18894
5125%
30%41%
24%65%
18899506
11%33%
41%15%
56%
Native
Haw
aiianor
Other
Pacific
Islander116
5402%
3%38%
57%95%
117539
0%11%
26%63%
89%117
5344%
6%37%
53%90%
White
69721538
2%5%
39%54%
93%69771
5331%
10%34%
55%89%
69769533
2%10%
39%50%
89%
Tw
oor
more
races2082
5333%
8%43%
46%89%
2079527
2%17%
37%45%
81%2080
5253%
16%42%
38%80%
Hispanic
ofanyrace
6192525
5%12%
50%33%
83%6193
5192%
20%45%
33%78%
6194515
5%23%
48%24%
72%
Ad
ditio
nalR
epo
rting
Gro
up
s
Econom
icallyD
isadvantaged:Y
es47722
5256%
12%49%
34%83%
47794518
3%22%
42%33%
75%47792
5156%
23%44%
26%70%
No
53041543
1%4%
34%61%
95%53083
5381%
8%30%
62%92%
53087537
1%7%
36%55%
91%
English
LanguageLearners:
Yes
3715511
11%21%
54%14%
68%3874
5134%
28%44%
24%68%
3871501
12%37%
42%9%
51%
No
97048535
3%7%
41%49%
90%97003
5292%
14%35%
49%84%
97008528
3%14%
40%43%
82%
Form
allyLim
itedE
nglish750
5341%
3%54%
42%96%
747539
1%7%
27%65%
93%748
5271%
10%53%
36%89%
Migrant
157514
7%21%
55%17%
72%136
5182%
15%52%
30%82%
136504
8%32%
52%8%
60%
Hom
eless660
5237%
12%52%
30%81%
655517
3%23%
43%31%
75%653
5157%
21%46%
25%72%
Acco
mm
od
ation
s
Standard
--A
ll370
50722%
18%43%
17%59%
789507
10%38%
32%20%
52%774
49917%
36%36%
10%47%
Nonstandard
--A
ll**<
10
Standard
--E
LLO
nly132
50021%
30%39%
9%48%
438509
11%33%
34%22%
56%440
49620%
38%35%
7%42%
Nonstandard
--E
LLO
nly**
<10
Attachment 8.A
404

Perfo
rman
ceL
evel1
&2
-A
dvancedand
Proficient
1-
Advanced
2-
Proficient
3-
Partially
Proficient
4-
NotP
roficient
<10
=N
osum
mary
scoresprovided
iflessthan
10students.
*V
aluem
aynotequalthe
exactsumofLevel1
&Level2
dueto
rounding.**
Results
forthese
studentsare
invalidand
notreported.
ST
AT
ED
EM
OG
RA
PH
ICR
EP
OR
TA
llStu
den
ts
Grad
e06
Fall2010
RE
AD
ING
MA
TH
EM
AT
ICS
SO
CIA
LS
TU
DIE
S
Fall2010
Run
Date:02/16/2011
Page
1of3
P1E
YV
L004
No.of
Mean
Percentat
No.of
Mean
Percentat
No.of
Mean
Percentat
State
Students
Assessed
Scale
Score
Level4
Level3
Level2
Level1
Levels1
&2
*S
tudentsA
ssessedS
caleS
coreLevel
4Level
3Level
2Level
1Levels1
&2
*S
tudentsA
ssessedS
caleS
coreLevel
4Level
3Level
2Level
1Levels1
&2
*
TotalA
llStudents
113971628
5%11%
47%37%
84%114137
6231%
14%38%
46%84%
114479612
8%17%
38%38%
75%
Gen
der
Male
57956625
6%13%
47%34%
81%58088
6232%
16%37%
46%83%
58286613
9%17%
35%39%
74%
Fem
ale56015
6303%
10%47%
40%87%
56049623
1%13%
39%47%
86%56193
6127%
16%40%
36%77%
Eth
nicity
Am
ericanIndian
orA
laskaN
ative961
6226%
14%50%
30%80%
961617
1%19%
45%36%
81%965
6099%
21%41%
29%70%
Asian
2918638
3%6%
39%53%
91%2977
6460%
5%19%
76%95%
2975620
5%10%
31%54%
86%
Black
orA
fricanA
merican
21514612
10%22%
51%17%
68%21469
6103%
28%46%
23%69%
21520601
18%30%
37%15%
52%
Native
Haw
aiianor
Other
Pacific
Islander103
6362%
9%40%
50%89%
102630
0%12%
24%65%
88%104
6186%
9%34%
52%86%
White
79610632
3%8%
45%44%
89%79751
6261%
10%36%
53%89%
80009616
5%13%
37%45%
82%
Tw
oor
more
races2260
6265%
12%48%
35%83%
2259621
1%16%
41%42%
83%2270
6118%
19%39%
34%73%
Hispanic
ofanyrace
6605618
8%17%
52%23%
75%6618
6152%
19%46%
33%79%
6636607
11%22%
44%24%
67%
Ad
ditio
nalR
epo
rting
Gro
up
s
Econom
icallyD
isadvantaged:Y
es55039
6187%
17%52%
24%76%
55153614
2%22%
45%31%
77%55426
60613%
24%40%
23%63%
No
58932637
2%6%
42%50%
92%58984
6311%
7%32%
60%92%
59053619
4%10%
35%52%
87%
English
LanguageLearners:
Yes
3286601
17%32%
45%6%
51%3439
6103%
29%46%
21%68%
3435598
23%33%
35%9%
44%
No
110685628
4%11%
47%38%
85%110698
6231%
14%38%
47%85%
111044613
8%16%
38%39%
76%
Form
allyLim
itedE
nglish800
6271%
8%61%
30%91%
797631
1%5%
31%63%
94%796
6143%
12%45%
40%85%
Migrant
123612
12%19%
52%17%
69%107
6163%
17%48%
33%80%
104604
13%28%
38%22%
60%
Hom
eless802
61610%
18%51%
21%72%
796613
2%25%
47%26%
74%811
60514%
26%38%
21%60%
Acco
mm
od
ation
s
Standard
--A
ll3204
59822%
35%36%
7%43%
7252601
6%46%
38%9%
48%7344
59626%
35%31%
8%39%
Nonstandard
--A
ll**20
21
Standard
--E
LLO
nly146
59034%
37%28%
1%29%
405605
6%44%
34%15%
49%437
59040%
37%19%
5%23%
Nonstandard
--E
LLO
nly**
Attachment 8.A
405

Perfo
rman
ceL
evel1
&2
-A
dvancedand
Proficient
1-
Advanced
2-
Proficient
3-
Partially
Proficient
4-
NotP
roficient
<10
=N
osum
mary
scoresprovided
iflessthan
10students.
*V
aluem
aynotequalthe
exactsumofLevel1
&Level2
dueto
rounding.**
Results
forthese
studentsare
invalidand
notreported.
ST
AT
ED
EM
OG
RA
PH
ICR
EP
OR
TS
tud
ents
with
Disab
ilities
Grad
e06
Fall2010
RE
AD
ING
MA
TH
EM
AT
ICS
SO
CIA
LS
TU
DIE
S
Fall2010
Run
Date:02/16/2011
Page
2of3
P1E
YV
L004
No.of
Mean
Percentat
No.of
Mean
Percentat
No.of
Mean
Percentat
State
Students
Assessed
Scale
Score
Level4
Level3
Level2
Level1
Levels1
&2
*S
tudentsA
ssessedS
caleS
coreLevel
4Level
3Level
2Level
1Levels1
&2
*S
tudentsA
ssessedS
caleS
coreLevel
4Level
3Level
2Level
1Levels1
&2
*
TotalS
tudentsw
ithD
isabilities12723
60220%
32%39%
9%49%
12833604
5%41%
40%15%
54%13205
59923%
32%32%
13%45%
Gen
der
Male
8260601
21%31%
39%10%
48%8382
6055%
39%39%
16%55%
8593600
23%30%
33%14%
47%
Fem
ale4463
60218%
32%40%
9%49%
4451603
5%43%
40%12%
52%4612
59723%
35%32%
10%42%
Eth
nicity
Am
ericanIndian
orA
laskaN
ative135
59923%
33%37%
7%44%
136602
2%46%
41%11%
52%142
59524%
41%30%
5%35%
Asian
129611
14%25%
40%22%
61%132
6215%
20%30%
44%74%
132604
17%22%
38%23%
61%
Black
orA
fricanA
merican
2626592
29%39%
28%3%
31%2635
5978%
54%32%
6%38%
2707592
38%36%
21%4%
26%
Native
Haw
aiianor
Other
Pacific
Islander<
10<
10<
10
White
8750605
16%29%
43%12%
55%8841
6074%
36%42%
17%59%
9101601
19%30%
36%16%
52%
Tw
oor
more
races303
59920%
35%37%
7%44%
301603
5%43%
40%12%
52%314
59723%
39%28%
10%38%
Hispanic
ofanyrace
774595
27%35%
33%5%
38%782
6006%
47%39%
7%47%
801595
26%37%
31%6%
37%
Ad
ditio
nalR
epo
rting
Gro
up
s
Econom
icallyD
isadvantaged:Y
es7885
59724%
35%36%
6%41%
7952601
6%47%
38%9%
47%8241
59628%
35%29%
8%37%
No
4838609
14%26%
45%15%
60%4881
6104%
31%42%
23%65%
4964604
16%26%
37%21%
58%
English
LanguageLearners:
Yes
478587
36%43%
20%1%
21%487
6006%
49%38%
7%45%
494591
35%40%
22%3%
25%
No
12245602
19%31%
40%10%
50%12346
6045%
40%40%
15%54%
12711599
23%31%
33%13%
46%
Form
allyLim
itedE
nglish32
6079%
31%47%
13%59%
33614
6%21%
42%30%
73%33
6076%
30%48%
15%64%
Migrant
12595
17%50%
33%0%
33%11
6009%
27%64%
0%64%
11594
18%45%
36%0%
36%
Hom
eless163
59825%
36%33%
7%40%
160602
6%49%
37%9%
46%175
59527%
40%23%
10%33%
Acco
mm
od
ation
s
Standard
--A
ll2918
59822%
36%36%
6%42%
6628601
6%47%
39%9%
47%6705
59626%
35%32%
8%40%
Nonstandard
--A
ll**12
14
Standard
--E
LLO
nly40
58353%
38%10%
0%10%
104598
10%47%
39%4%
43%97
59037%
38%22%
3%25%
Nonstandard
--E
LLO
nly**
Attachment 8.A
406

Perfo
rman
ceL
evel1
&2
-A
dvancedand
Proficient
1-
Advanced
2-
Proficient
3-
Partially
Proficient
4-
NotP
roficient
<10
=N
osum
mary
scoresprovided
iflessthan
10students.
*V
aluem
aynotequalthe
exactsumofLevel1
&Level2
dueto
rounding.**
Results
forthese
studentsare
invalidand
notreported.
ST
AT
ED
EM
OG
RA
PH
ICR
EP
OR
TA
llExcep
tS
tud
ents
with
Disab
ilities
Grad
e06
Fall2010
RE
AD
ING
MA
TH
EM
AT
ICS
SO
CIA
LS
TU
DIE
S
Fall2010
Run
Date:02/16/2011
Page
3of3
P1E
YV
L004
No.of
Mean
Percentat
No.of
Mean
Percentat
No.of
Mean
Percentat
State
Students
Assessed
Scale
Score
Level4
Level3
Level2
Level1
Levels1
&2
*S
tudentsA
ssessedS
caleS
coreLevel
4Level
3Level
2Level
1Levels1
&2
*S
tudentsA
ssessedS
caleS
coreLevel
4Level
3Level
2Level
1Levels1
&2
*
TotalA
llExceptS
tudentsw
ithD
isabilities101248
6313%
9%48%
41%88%
101304625
1%11%
38%50%
88%101274
6146%
15%38%
41%79%
Gen
der
Male
49696629
3%10%
48%39%
87%49706
6261%
12%37%
51%88%
49693615
7%15%
35%44%
79%
Fem
ale51552
6332%
8%47%
43%90%
51598625
1%10%
39%50%
89%51581
6136%
15%41%
39%80%
Eth
nicity
Am
ericanIndian
orA
laskaN
ative826
6263%
11%52%
34%86%
825619
0%14%
45%40%
86%823
6117%
17%43%
33%76%
Asian
2789639
2%5%
39%54%
93%2845
6480%
4%19%
77%96%
2843621
4%9%
31%56%
87%
Black
orA
fricanA
merican
18888615
7%20%
55%19%
73%18834
6122%
25%48%
25%73%
18813602
16%29%
39%16%
55%
Native
Haw
aiianor
Other
Pacific
Islander97
6382%
6%40%
52%92%
96631
0%8%
24%68%
92%96
6203%
7%34%
55%90%
White
70860636
1%6%
45%48%
93%70910
6290%
7%35%
57%93%
70908618
3%11%
37%48%
86%
Tw
oor
more
races1957
6303%
8%49%
40%89%
1958624
0%12%
41%46%
88%1956
6135%
16%41%
38%79%
Hispanic
ofanyrace
5831621
5%15%
55%26%
80%5836
6171%
16%47%
36%83%
5835608
9%20%
46%26%
72%
Ad
ditio
nalR
epo
rting
Gro
up
s
Econom
icallyD
isadvantaged:Y
es47154
6225%
14%55%
26%81%
47201617
1%17%
47%35%
81%47185
60710%
22%42%
25%68%
No
54094639
1%4%
41%53%
95%54103
6330%
5%31%
64%94%
54089620
2%8%
34%55%
89%
English
LanguageLearners:
Yes
2808604
13%30%
49%7%
56%2952
6122%
26%48%
24%72%
2941599
21%32%
38%10%
48%
No
98440632
2%8%
48%42%
89%98352
6261%
10%38%
51%89%
98333615
6%14%
38%42%
80%
Form
allyLim
itedE
nglish768
6281%
7%61%
31%92%
764632
1%5%
30%64%
95%763
6153%
12%45%
41%86%
Migrant
111614
12%15%
54%19%
73%96
6182%
16%46%
36%82%
93605
12%26%
38%25%
62%
Hom
eless639
6216%
14%55%
25%80%
636615
1%19%
50%31%
81%636
60711%
22%42%
25%67%
Acco
mm
od
ation
s
Standard
--A
ll286
60419%
30%38%
13%51%
624606
5%43%
34%18%
52%639
59432%
36%24%
8%32%
Nonstandard
--A
ll**<
10<
10
Standard
--E
LLO
nly106
59327%
37%35%
1%36%
301608
5%44%
33%19%
51%340
59041%
36%18%
5%23%
Nonstandard
--E
LLO
nly**
Attachment 8.A
407
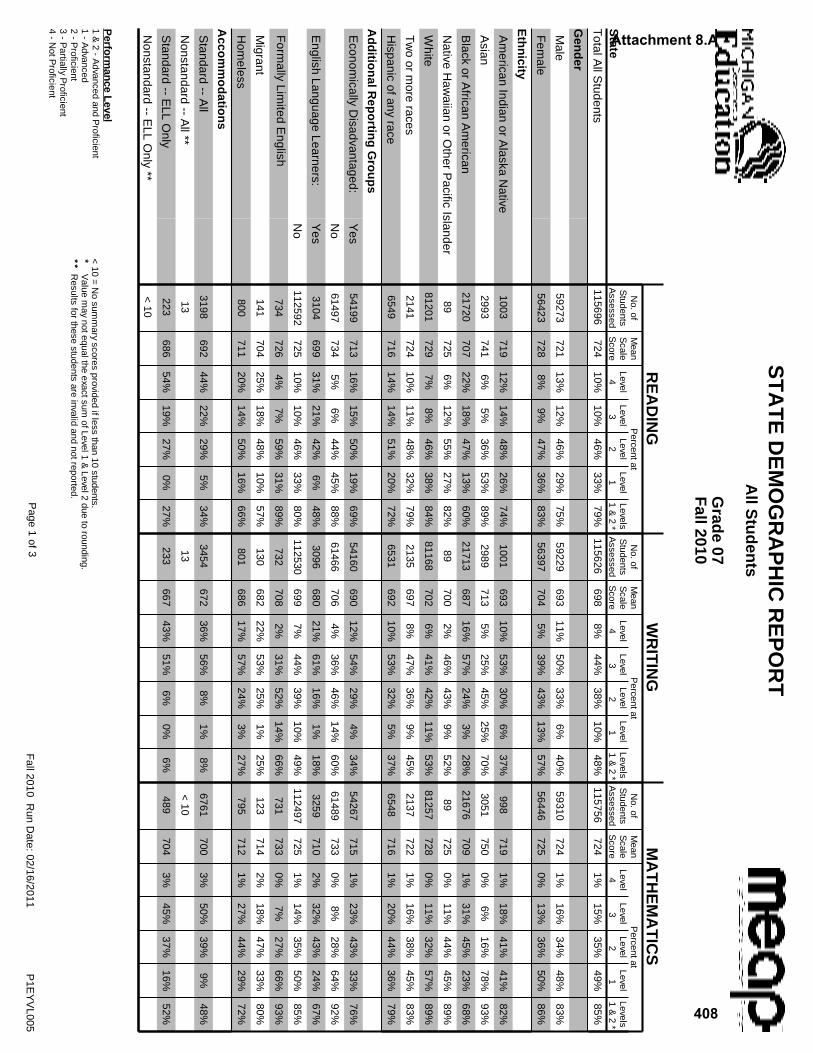
Perfo
rman
ceL
evel1
&2
-A
dvancedand
Proficient
1-
Advanced
2-
Proficient
3-
Partially
Proficient
4-
NotP
roficient
<10
=N
osum
mary
scoresprovided
iflessthan
10students.
*V
aluem
aynotequalthe
exactsumofLevel1
&Level2
dueto
rounding.**
Results
forthese
studentsare
invalidand
notreported.
ST
AT
ED
EM
OG
RA
PH
ICR
EP
OR
TA
llStu
den
ts
Grad
e07
Fall2010
RE
AD
ING
WR
ITIN
GM
AT
HE
MA
TIC
S
Fall2010
Run
Date:02/16/2011
Page
1of3
P1E
YV
L005
No.of
Mean
Percentat
No.of
Mean
Percentat
No.of
Mean
Percentat
State
Students
Assessed
Scale
Score
Level4
Level3
Level2
Level1
Levels1
&2
*S
tudentsA
ssessedS
caleS
coreLevel
4Level
3Level
2Level
1Levels1
&2
*S
tudentsA
ssessedS
caleS
coreLevel
4Level
3Level
2Level
1Levels1
&2
*
TotalA
llStudents
115696724
10%10%
46%33%
79%115626
6988%
44%38%
10%48%
115756724
1%15%
35%49%
85%
Gen
der
Male
59273721
13%12%
46%29%
75%59229
69311%
50%33%
6%40%
59310724
1%16%
34%48%
83%
Fem
ale56423
7288%
9%47%
36%83%
56397704
5%39%
43%13%
57%56446
7250%
13%36%
50%86%
Eth
nicity
Am
ericanIndian
orA
laskaN
ative1003
71912%
14%48%
26%74%
1001693
10%53%
30%6%
37%998
7191%
18%41%
41%82%
Asian
2993741
6%5%
36%53%
89%2989
7135%
25%45%
25%70%
3051750
0%6%
16%78%
93%
Black
orA
fricanA
merican
21720707
22%18%
47%13%
60%21713
68716%
57%24%
3%28%
21676709
1%31%
45%23%
68%
Native
Haw
aiianor
Other
Pacific
Islander89
7256%
12%55%
27%82%
89700
2%46%
43%9%
52%89
7250%
11%44%
45%89%
White
81201729
7%8%
46%38%
84%81168
7026%
41%42%
11%53%
81257728
0%11%
32%57%
89%
Tw
oor
more
races2141
72410%
11%48%
32%79%
2135697
8%47%
36%9%
45%2137
7221%
16%38%
45%83%
Hispanic
ofanyrace
6549716
14%14%
51%20%
72%6531
69210%
53%32%
5%37%
6548716
1%20%
44%36%
79%
Ad
ditio
nalR
epo
rting
Gro
up
s
Econom
icallyD
isadvantaged:Y
es54199
71316%
15%50%
19%69%
54160690
12%54%
29%4%
34%54267
7151%
23%43%
33%76%
No
61497734
5%6%
44%45%
88%61466
7064%
36%46%
14%60%
61489733
0%8%
28%64%
92%
English
LanguageLearners:
Yes
3104699
31%21%
42%6%
48%3096
68021%
61%16%
1%18%
3259710
2%32%
43%24%
67%
No
112592725
10%10%
46%33%
80%112530
6997%
44%39%
10%49%
112497725
1%14%
35%50%
85%
Form
allyLim
itedE
nglish734
7264%
7%59%
31%89%
732708
2%31%
52%14%
66%731
7330%
7%27%
66%93%
Migrant
141704
25%18%
48%10%
57%130
68222%
53%25%
1%25%
123714
2%18%
47%33%
80%
Hom
eless800
71120%
14%50%
16%66%
801686
17%57%
24%3%
27%795
7121%
27%44%
29%72%
Acco
mm
od
ation
s
Standard
--A
ll3198
69244%
22%29%
5%34%
3454672
36%56%
8%1%
8%6761
7003%
50%39%
9%48%
Nonstandard
--A
ll**13
13<
10
Standard
--E
LLO
nly223
68654%
19%27%
0%27%
233667
43%51%
6%0%
6%489
7043%
45%37%
16%52%
Nonstandard
--E
LLO
nly**
<10
Attachment 8.A
408
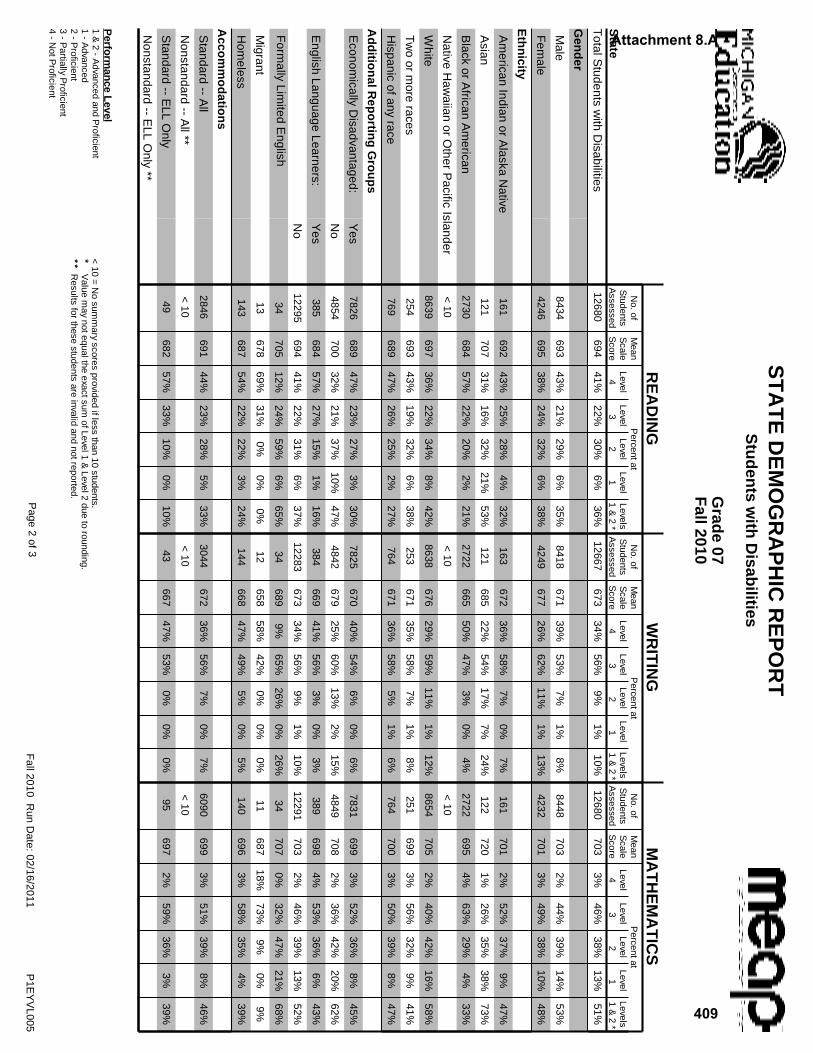
Perfo
rman
ceL
evel1
&2
-A
dvancedand
Proficient
1-
Advanced
2-
Proficient
3-
Partially
Proficient
4-
NotP
roficient
<10
=N
osum
mary
scoresprovided
iflessthan
10students.
*V
aluem
aynotequalthe
exactsumofLevel1
&Level2
dueto
rounding.**
Results
forthese
studentsare
invalidand
notreported.
ST
AT
ED
EM
OG
RA
PH
ICR
EP
OR
TS
tud
ents
with
Disab
ilities
Grad
e07
Fall2010
RE
AD
ING
WR
ITIN
GM
AT
HE
MA
TIC
S
Fall2010
Run
Date:02/16/2011
Page
2of3
P1E
YV
L005
No.of
Mean
Percentat
No.of
Mean
Percentat
No.of
Mean
Percentat
State
Students
Assessed
Scale
Score
Level4
Level3
Level2
Level1
Levels1
&2
*S
tudentsA
ssessedS
caleS
coreLevel
4Level
3Level
2Level
1Levels1
&2
*S
tudentsA
ssessedS
caleS
coreLevel
4Level
3Level
2Level
1Levels1
&2
*
TotalS
tudentsw
ithD
isabilities12680
69441%
22%30%
6%36%
12667673
34%56%
9%1%
10%12680
7033%
46%38%
13%51%
Gen
der
Male
8434693
43%21%
29%6%
35%8418
67139%
53%7%
1%8%
8448703
2%44%
39%14%
53%
Fem
ale4246
69538%
24%32%
6%38%
4249677
26%62%
11%1%
13%4232
7013%
49%38%
10%48%
Eth
nicity
Am
ericanIndian
orA
laskaN
ative161
69243%
25%28%
4%32%
163672
36%58%
7%0%
7%161
7012%
52%37%
9%47%
Asian
121707
31%16%
32%21%
53%121
68522%
54%17%
7%24%
122720
1%26%
35%38%
73%
Black
orA
fricanA
merican
2730684
57%22%
20%2%
21%2722
66550%
47%3%
0%4%
2722695
4%63%
29%4%
33%
Native
Haw
aiianor
Other
Pacific
Islander<
10<
10<
10
White
8639697
36%22%
34%8%
42%8638
67629%
59%11%
1%12%
8654705
2%40%
42%16%
58%
Tw
oor
more
races254
69343%
19%32%
6%38%
253671
35%58%
7%1%
8%251
6993%
56%32%
9%41%
Hispanic
ofanyrace
769689
47%26%
25%2%
27%764
67136%
58%5%
1%6%
764700
3%50%
39%8%
47%
Ad
ditio
nalR
epo
rting
Gro
up
s
Econom
icallyD
isadvantaged:Y
es7826
68947%
23%27%
3%30%
7825670
40%54%
6%0%
6%7831
6993%
52%36%
8%45%
No
4854700
32%21%
37%10%
47%4842
67925%
60%13%
2%15%
4849708
2%36%
42%20%
62%
English
LanguageLearners:
Yes
385684
57%27%
15%1%
16%384
66941%
56%3%
0%3%
389698
4%53%
36%6%
43%
No
12295694
41%22%
31%6%
37%12283
67334%
56%9%
1%10%
12291703
2%46%
39%13%
52%
Form
allyLim
itedE
nglish34
70512%
24%59%
6%65%
34689
9%65%
26%0%
26%34
7070%
32%47%
21%68%
Migrant
13678
69%31%
0%0%
0%12
65858%
42%0%
0%0%
11687
18%73%
9%0%
9%
Hom
eless143
68754%
22%22%
3%24%
144668
47%49%
5%0%
5%140
6963%
58%35%
4%39%
Acco
mm
od
ation
s
Standard
--A
ll2846
69144%
23%28%
5%33%
3044672
36%56%
7%0%
7%6090
6993%
51%39%
8%46%
Nonstandard
--A
ll**<
10<
10<
10
Standard
--E
LLO
nly49
68257%
33%10%
0%10%
43667
47%53%
0%0%
0%95
6972%
59%36%
3%39%
Nonstandard
--E
LLO
nly**
Attachment 8.A
409

Perfo
rman
ceL
evel1
&2
-A
dvancedand
Proficient
1-
Advanced
2-
Proficient
3-
Partially
Proficient
4-
NotP
roficient
<10
=N
osum
mary
scoresprovided
iflessthan
10students.
*V
aluem
aynotequalthe
exactsumofLevel1
&Level2
dueto
rounding.**
Results
forthese
studentsare
invalidand
notreported.
ST
AT
ED
EM
OG
RA
PH
ICR
EP
OR
TA
llExcep
tS
tud
ents
with
Disab
ilities
Grad
e07
Fall2010
RE
AD
ING
WR
ITIN
GM
AT
HE
MA
TIC
S
Fall2010
Run
Date:02/16/2011
Page
3of3
P1E
YV
L005
No.of
Mean
Percentat
No.of
Mean
Percentat
No.of
Mean
Percentat
State
Students
Assessed
Scale
Score
Level4
Level3
Level2
Level1
Levels1
&2
*S
tudentsA
ssessedS
caleS
coreLevel
4Level
3Level
2Level
1Levels1
&2
*S
tudentsA
ssessedS
caleS
coreLevel
4Level
3Level
2Level
1Levels1
&2
*
TotalA
llExceptS
tudentsw
ithD
isabilities103016
7287%
9%48%
36%84%
102959702
4%43%
42%11%
53%103076
7270%
11%35%
54%89%
Gen
der
Male
50839726
8%10%
48%33%
82%50811
6976%
49%38%
7%45%
50862727
0%12%
34%54%
88%
Fem
ale52177
7315%
8%48%
39%87%
52148706
3%37%
46%14%
60%52214
7270%
10%36%
54%89%
Eth
nicity
Am
ericanIndian
orA
laskaN
ative842
7246%
12%52%
30%82%
838697
5%53%
35%8%
42%837
7220%
11%41%
47%88%
Asian
2872742
5%5%
36%55%
91%2868
7144%
24%46%
25%72%
2929752
0%5%
15%79%
94%
Black
orA
fricanA
merican
18990710
17%18%
51%14%
66%18991
69011%
58%27%
4%31%
18954711
1%26%
47%26%
73%
Native
Haw
aiianor
Other
Pacific
Islander83
7274%
10%58%
29%87%
83702
1%43%
46%10%
55%83
7270%
7%46%
47%93%
White
72562733
4%7%
47%42%
90%72530
7053%
39%46%
12%58%
72603731
0%7%
31%62%
93%
Tw
oor
more
races1887
7286%
10%50%
35%85%
1882701
4%45%
40%10%
50%1886
7250%
11%39%
50%89%
Hispanic
ofanyrace
5780719
10%12%
55%23%
78%5767
6956%
53%35%
6%41%
5784719
0%16%
44%39%
84%
Ad
ditio
nalR
epo
rting
Gro
up
s
Econom
icallyD
isadvantaged:Y
es46373
71711%
14%53%
22%75%
46335694
7%54%
33%5%
38%46436
7171%
18%44%
38%82%
No
56643737
3%5%
44%48%
92%56624
7082%
34%49%
15%64%
56640735
0%6%
27%67%
94%
English
LanguageLearners:
Yes
2719701
27%21%
46%7%
52%2712
68219%
62%18%
2%20%
2870712
1%29%
43%27%
70%
No
100297729
6%9%
48%37%
85%100247
7024%
43%42%
11%53%
100206728
0%11%
35%55%
89%
Form
allyLim
itedE
nglish700
7273%
6%59%
32%90%
698709
2%30%
53%15%
68%697
7350%
6%26%
68%94%
Migrant
128707
20%16%
52%11%
63%118
68418%
54%27%
1%28%
112717
0%13%
51%37%
88%
Hom
eless657
71612%
12%56%
19%75%
657690
10%58%
28%4%
32%655
7160%
20%45%
34%79%
Acco
mm
od
ation
s
Standard
--A
ll352
69641%
14%37%
8%45%
410676
30%52%
15%3%
18%671
7063%
39%39%
19%58%
Nonstandard
--A
ll**<
10<
10
Standard
--E
LLO
nly174
68653%
15%32%
0%32%
190667
43%50%
7%0%
7%394
7064%
41%37%
19%55%
Nonstandard
--E
LLO
nly**
<10
Attachment 8.A
410
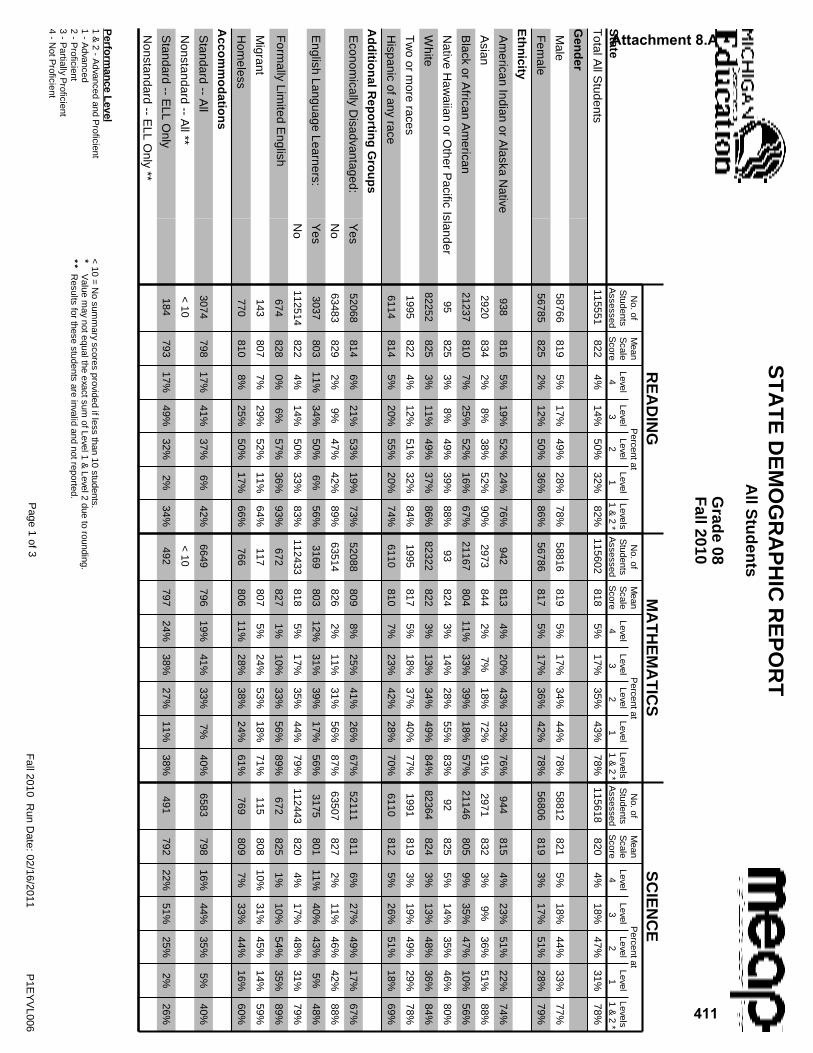
Perfo
rman
ceL
evel1
&2
-A
dvancedand
Proficient
1-
Advanced
2-
Proficient
3-
Partially
Proficient
4-
NotP
roficient
<10
=N
osum
mary
scoresprovided
iflessthan
10students.
*V
aluem
aynotequalthe
exactsumofLevel1
&Level2
dueto
rounding.**
Results
forthese
studentsare
invalidand
notreported.
ST
AT
ED
EM
OG
RA
PH
ICR
EP
OR
TA
llStu
den
ts
Grad
e08
Fall2010
RE
AD
ING
MA
TH
EM
AT
ICS
SC
IEN
CE
Fall2010
Run
Date:02/16/2011
Page
1of3
P1E
YV
L006
No.of
Mean
Percentat
No.of
Mean
Percentat
No.of
Mean
Percentat
State
Students
Assessed
Scale
Score
Level4
Level3
Level2
Level1
Levels1
&2
*S
tudentsA
ssessedS
caleS
coreLevel
4Level
3Level
2Level
1Levels1
&2
*S
tudentsA
ssessedS
caleS
coreLevel
4Level
3Level
2Level
1Levels1
&2
*
TotalA
llStudents
115551822
4%14%
50%32%
82%115602
8185%
17%35%
43%78%
115618820
4%18%
47%31%
78%
Gen
der
Male
58766819
5%17%
49%28%
78%58816
8195%
17%34%
44%78%
58812821
5%18%
44%33%
77%
Fem
ale56785
8252%
12%50%
36%86%
56786817
5%17%
36%42%
78%56806
8193%
17%51%
28%79%
Eth
nicity
Am
ericanIndian
orA
laskaN
ative938
8165%
19%52%
24%76%
942813
4%20%
43%32%
76%944
8154%
23%51%
22%74%
Asian
2920834
2%8%
38%52%
90%2973
8442%
7%18%
72%91%
2971832
3%9%
36%51%
88%
Black
orA
fricanA
merican
21237810
7%25%
52%16%
67%21167
80411%
33%39%
18%57%
21146805
9%35%
47%10%
56%
Native
Haw
aiianor
Other
Pacific
Islander95
8253%
8%49%
39%88%
93824
3%14%
28%55%
83%92
8255%
14%35%
46%80%
White
82252825
3%11%
49%37%
86%82322
8223%
13%34%
49%84%
82364824
3%13%
48%36%
84%
Tw
oor
more
races1995
8224%
12%51%
32%84%
1995817
5%18%
37%40%
77%1991
8193%
19%49%
29%78%
Hispanic
ofanyrace
6114814
5%20%
55%20%
74%6110
8107%
23%42%
28%70%
6110812
5%26%
51%18%
69%
Ad
ditio
nalR
epo
rting
Gro
up
s
Econom
icallyD
isadvantaged:Y
es52068
8146%
21%53%
19%73%
52088809
8%25%
41%26%
67%52111
8116%
27%49%
17%67%
No
63483829
2%9%
47%42%
89%63514
8262%
11%31%
56%87%
63507827
2%11%
46%42%
88%
English
LanguageLearners:
Yes
3037803
11%34%
50%6%
56%3169
80312%
31%39%
17%56%
3175801
11%40%
43%5%
48%
No
112514822
4%14%
50%33%
83%112433
8185%
17%35%
44%79%
112443820
4%17%
48%31%
79%
Form
allyLim
itedE
nglish674
8280%
6%57%
36%93%
672827
1%10%
33%56%
89%672
8251%
10%54%
35%89%
Migrant
143807
7%29%
52%11%
64%117
8075%
24%53%
18%71%
115808
10%31%
45%14%
59%
Hom
eless770
8108%
25%50%
17%66%
766806
11%28%
38%24%
61%769
8097%
33%44%
16%60%
Acco
mm
od
ation
s
Standard
--A
ll3074
79817%
41%37%
6%42%
6649796
19%41%
33%7%
40%6583
79816%
44%35%
5%40%
Nonstandard
--A
ll**<
10<
10
Standard
--E
LLO
nly184
79317%
49%32%
2%34%
492797
24%38%
27%11%
38%491
79222%
51%25%
2%26%
Nonstandard
--E
LLO
nly**
Attachment 8.A
411

Perfo
rman
ceL
evel1
&2
-A
dvancedand
Proficient
1-
Advanced
2-
Proficient
3-
Partially
Proficient
4-
NotP
roficient
<10
=N
osum
mary
scoresprovided
iflessthan
10students.
*V
aluem
aynotequalthe
exactsumofLevel1
&Level2
dueto
rounding.**
Results
forthese
studentsare
invalidand
notreported.
ST
AT
ED
EM
OG
RA
PH
ICR
EP
OR
TS
tud
ents
with
Disab
ilities
Grad
e08
Fall2010
RE
AD
ING
MA
TH
EM
AT
ICS
SC
IEN
CE
Fall2010
Run
Date:02/16/2011
Page
2of3
P1E
YV
L006
No.of
Mean
Percentat
No.of
Mean
Percentat
No.of
Mean
Percentat
State
Students
Assessed
Scale
Score
Level4
Level3
Level2
Level1
Levels1
&2
*S
tudentsA
ssessedS
caleS
coreLevel
4Level
3Level
2Level
1Levels1
&2
*S
tudentsA
ssessedS
caleS
coreLevel
4Level
3Level
2Level
1Levels1
&2
*
TotalS
tudentsw
ithD
isabilities12679
79817%
40%37%
6%43%
12701798
17%39%
33%10%
44%12797
80114%
42%37%
8%44%
Gen
der
Male
8379797
19%39%
35%7%
42%8423
79916%
38%34%
12%46%
8475802
14%40%
37%9%
46%
Fem
ale4300
80014%
40%40%
6%46%
4278796
19%43%
32%7%
39%4322
79814%
46%36%
4%41%
Eth
nicity
Am
ericanIndian
orA
laskaN
ative149
79617%
48%32%
3%35%
152796
14%49%
32%6%
38%154
79912%
46%36%
6%42%
Asian
115806
13%25%
52%10%
62%114
80910%
27%37%
26%63%
115810
8%25%
55%12%
67%
Black
orA
fricanA
merican
2651791
25%47%
26%2%
28%2634
79224%
49%24%
3%27%
2662791
24%52%
22%2%
24%
Native
Haw
aiianor
Other
Pacific
Islander<
10<
10<
10
White
8780800
15%37%
40%8%
48%8814
80015%
36%36%
13%49%
8879804
11%38%
41%10%
51%
Tw
oor
more
races257
79918%
37%39%
7%46%
260798
16%41%
36%8%
43%257
80111%
45%36%
8%44%
Hispanic
ofanyrace
718796
17%44%
34%4%
38%718
79519%
43%33%
5%38%
721797
16%47%
33%4%
37%
Ad
ditio
nalR
epo
rting
Gro
up
s
Econom
icallyD
isadvantaged:Y
es7677
79521%
44%31%
4%36%
7695795
20%44%
31%6%
37%7760
79718%
46%32%
5%36%
No
5002803
13%33%
44%10%
54%5006
80213%
33%38%
16%54%
5037806
9%35%
44%12%
56%
English
LanguageLearners:
Yes
379791
24%46%
30%1%
30%375
79321%
47%30%
3%33%
382793
18%57%
23%1%
24%
No
12300798
17%39%
37%7%
43%12326
79817%
39%34%
10%44%
12415801
14%41%
37%8%
45%
Form
allyLim
itedE
nglish28
8080%
36%54%
11%64%
28800
14%29%
39%18%
57%28
8047%
50%32%
11%43%
Migrant
15786
20%60%
20%0%
20%13
79031%
46%23%
0%23%
13790
31%46%
15%8%
23%
Hom
eless155
79421%
48%25%
6%31%
153794
22%44%
27%7%
34%158
79818%
47%28%
6%35%
Acco
mm
od
ation
s
Standard
--A
ll2730
79717%
41%36%
5%42%
6003796
19%41%
33%7%
40%5909
79815%
44%36%
5%41%
Nonstandard
--A
ll**<
10<
10
Standard
--E
LLO
nly27
78926%
48%26%
0%26%
90791
26%44%
30%0%
30%80
79218%
60%23%
0%23%
Nonstandard
--E
LLO
nly**
Attachment 8.A
412

Perfo
rman
ceL
evel1
&2
-A
dvancedand
Proficient
1-
Advanced
2-
Proficient
3-
Partially
Proficient
4-
NotP
roficient
<10
=N
osum
mary
scoresprovided
iflessthan
10students.
*V
aluem
aynotequalthe
exactsumofLevel1
&Level2
dueto
rounding.**
Results
forthese
studentsare
invalidand
notreported.
ST
AT
ED
EM
OG
RA
PH
ICR
EP
OR
TA
llExcep
tS
tud
ents
with
Disab
ilities
Grad
e08
Fall2010
RE
AD
ING
MA
TH
EM
AT
ICS
SC
IEN
CE
Fall2010
Run
Date:02/16/2011
Page
3of3
P1E
YV
L006
No.of
Mean
Percentat
No.of
Mean
Percentat
No.of
Mean
Percentat
State
Students
Assessed
Scale
Score
Level4
Level3
Level2
Level1
Levels1
&2
*S
tudentsA
ssessedS
caleS
coreLevel
4Level
3Level
2Level
1Levels1
&2
*S
tudentsA
ssessedS
caleS
coreLevel
4Level
3Level
2Level
1Levels1
&2
*
TotalA
llExceptS
tudentsw
ithD
isabilities102872
8252%
11%51%
35%87%
102901821
3%14%
35%47%
82%102821
8223%
15%49%
34%82%
Gen
der
Male
50387822
3%13%
52%32%
84%50393
8223%
14%34%
49%83%
50337824
3%15%
45%37%
82%
Fem
ale52485
8271%
9%51%
38%89%
52508819
4%15%
37%45%
81%52484
8212%
15%53%
30%83%
Eth
nicity
Am
ericanIndian
orA
laskaN
ative789
8202%
14%56%
28%84%
790816
2%15%
45%37%
83%790
8182%
18%54%
25%80%
Asian
2805835
1%7%
38%54%
92%2859
8452%
6%18%
74%92%
2856833
2%9%
36%53%
89%
Black
orA
fricanA
merican
18586813
5%22%
56%17%
73%18533
8059%
30%41%
20%61%
18484807
7%32%
50%11%
61%
Native
Haw
aiianor
Other
Pacific
Islander86
8292%
2%52%
43%95%
84827
2%11%
27%60%
87%83
8281%
13%36%
49%86%
White
73472828
1%8%
50%40%
90%73508
8242%
10%34%
54%88%
73485826
2%10%
49%40%
88%
Tw
oor
more
races1738
8262%
9%53%
36%89%
1735820
3%15%
37%45%
82%1734
8222%
15%50%
32%83%
Hispanic
ofanyrace
5396817
3%17%
58%22%
79%5392
8125%
21%43%
31%74%
5389814
4%23%
53%20%
73%
Ad
ditio
nalR
epo
rting
Gro
up
s
Econom
icallyD
isadvantaged:Y
es44391
8174%
17%57%
22%79%
44393811
6%22%
42%30%
72%44351
8144%
24%52%
20%72%
No
58481831
1%7%
47%45%
92%58508
8282%
9%30%
60%90%
58470829
1%9%
46%44%
90%
English
LanguageLearners:
Yes
2658804
9%32%
53%7%
59%2794
80511%
29%41%
19%59%
2793802
10%38%
45%6%
51%
No
100214825
2%11%
51%36%
87%100107
8213%
14%35%
48%83%
100028823
2%14%
49%34%
83%
Form
allyLim
itedE
nglish646
8290%
5%57%
38%95%
644828
1%9%
33%57%
90%644
8261%
8%55%
36%91%
Migrant
128809
5%26%
56%13%
69%104
8092%
21%57%
20%77%
102810
7%29%
49%15%
64%
Hom
eless615
8145%
19%56%
20%75%
613808
8%23%
40%28%
68%611
8124%
29%49%
18%67%
Acco
mm
od
ation
s
Standard
--A
ll344
80113%
41%38%
9%47%
646799
20%38%
27%15%
42%674
79618%
47%29%
5%34%
Nonstandard
--A
ll**<
10<
10
Standard
--E
LLO
nly157
79416%
49%32%
3%35%
402798
24%37%
26%13%
39%411
79223%
49%25%
2%27%
Nonstandard
--E
LLO
nly**
Attachment 8.A
413

Perfo
rman
ceL
evel1
&2
-A
dvancedand
Proficient
1-
Advanced
2-
Proficient
3-
Partially
Proficient
4-
NotP
roficient
<10
=N
osum
mary
scoresprovided
iflessthan
10students.
*V
aluem
aynotequalthe
exactsumofLevel1
&Level2
dueto
rounding.**
Results
forthese
studentsare
invalidand
notreported.
ST
AT
ED
EM
OG
RA
PH
ICR
EP
OR
TA
llStu
den
ts
Grad
e09
Fall2010
SO
CIA
LS
TU
DIE
S
Fall2010
Run
Date:02/16/2011
Page
1of3
P1E
YV
L007
No.of
Mean
Percentat
State
Students
Assessed
Scale
Score
Level4
Level3
Level2
Level1
Levels1
&2
*
TotalA
llStudents
123284916
5%22%
44%29%
73%
Gen
der
Male
62773917
5%22%
40%33%
73%
Fem
ale60511
9145%
23%47%
25%73%
Eth
nicity
Am
ericanIndian
orA
laskaN
ative1127
9125%
26%49%
20%69%
Asian
2937928
3%12%
36%49%
85%
Black
orA
fricanA
merican
22727900
12%42%
40%7%
46%
Native
Haw
aiianor
Other
Pacific
Islander117
9223%
15%38%
44%81%
White
88124920
3%17%
45%35%
80%
Tw
oor
more
races1862
9144%
23%47%
26%72%
Hispanic
ofanyrace
6390908
7%30%
46%17%
63%
Ad
ditio
nalR
epo
rting
Gro
up
s
Econom
icallyD
isadvantaged:Y
es53998
9068%
33%44%
15%59%
No
69286923
2%14%
44%40%
84%
English
LanguageLearners:
Yes
3347897
15%46%
35%5%
39%
No
119937916
5%22%
44%30%
74%
Form
allyLim
itedE
nglish732
9212%
13%49%
36%85%
Migrant
106904
9%35%
44%11%
56%
Hom
eless738
9059%
35%44%
12%56%
Acco
mm
od
ation
s
Standard
--A
ll5987
89615%
49%31%
5%35%
Nonstandard
--A
ll**<
10
Standard
--E
LLO
nly355
89120%
54%25%
1%26%
Nonstandard
--E
LLO
nly**
Attachment 8.A
414
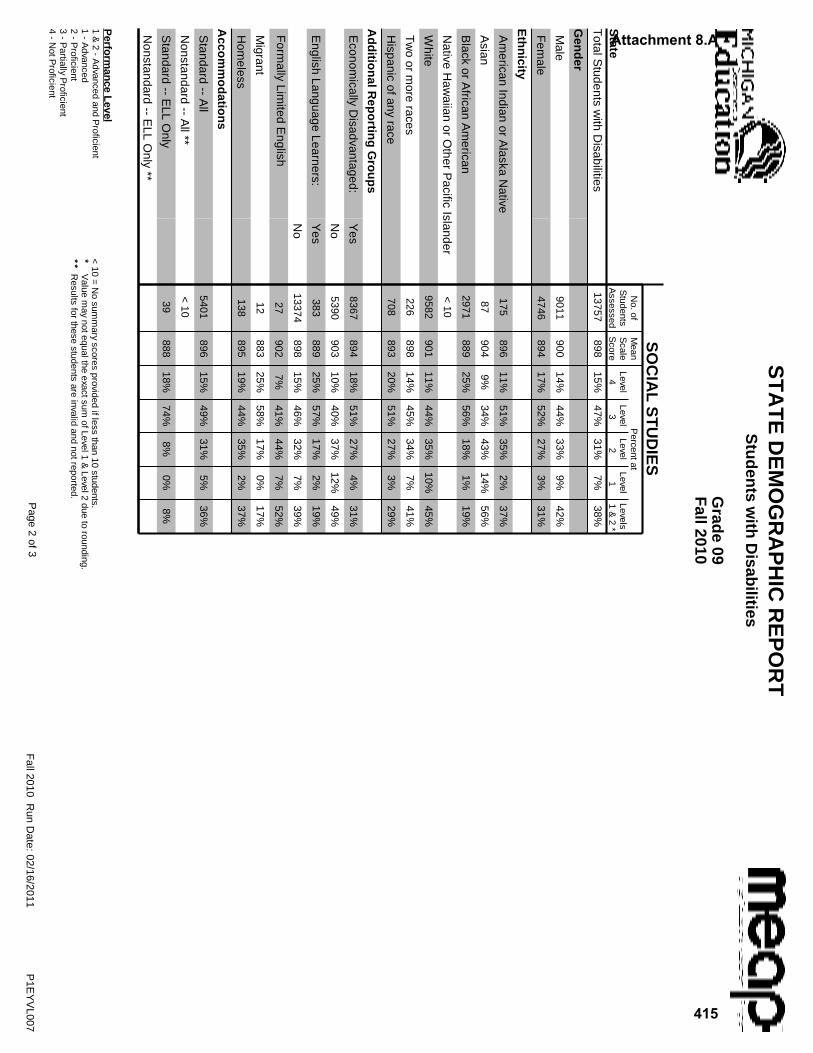
Perfo
rman
ceL
evel1
&2
-A
dvancedand
Proficient
1-
Advanced
2-
Proficient
3-
Partially
Proficient
4-
NotP
roficient
<10
=N
osum
mary
scoresprovided
iflessthan
10students.
*V
aluem
aynotequalthe
exactsumofLevel1
&Level2
dueto
rounding.**
Results
forthese
studentsare
invalidand
notreported.
ST
AT
ED
EM
OG
RA
PH
ICR
EP
OR
TS
tud
ents
with
Disab
ilities
Grad
e09
Fall2010
SO
CIA
LS
TU
DIE
S
Fall2010
Run
Date:02/16/2011
Page
2of3
P1E
YV
L007
No.of
Mean
Percentat
State
Students
Assessed
Scale
Score
Level4
Level3
Level2
Level1
Levels1
&2
*
TotalS
tudentsw
ithD
isabilities13757
89815%
47%31%
7%38%
Gen
der
Male
9011900
14%44%
33%9%
42%
Fem
ale4746
89417%
52%27%
3%31%
Eth
nicity
Am
ericanIndian
orA
laskaN
ative175
89611%
51%35%
2%37%
Asian
87904
9%34%
43%14%
56%
Black
orA
fricanA
merican
2971889
25%56%
18%1%
19%
Native
Haw
aiianor
Other
Pacific
Islander<
10
White
9582901
11%44%
35%10%
45%
Tw
oor
more
races226
89814%
45%34%
7%41%
Hispanic
ofanyrace
708893
20%51%
27%3%
29%
Ad
ditio
nalR
epo
rting
Gro
up
s
Econom
icallyD
isadvantaged:Y
es8367
89418%
51%27%
4%31%
No
5390903
10%40%
37%12%
49%
English
LanguageLearners:
Yes
383889
25%57%
17%2%
19%
No
13374898
15%46%
32%7%
39%
Form
allyLim
itedE
nglish27
9027%
41%44%
7%52%
Migrant
12883
25%58%
17%0%
17%
Hom
eless138
89519%
44%35%
2%37%
Acco
mm
od
ation
s
Standard
--A
ll5401
89615%
49%31%
5%36%
Nonstandard
--A
ll**<
10
Standard
--E
LLO
nly39
88818%
74%8%
0%8%
Nonstandard
--E
LLO
nly**
Attachment 8.A
415
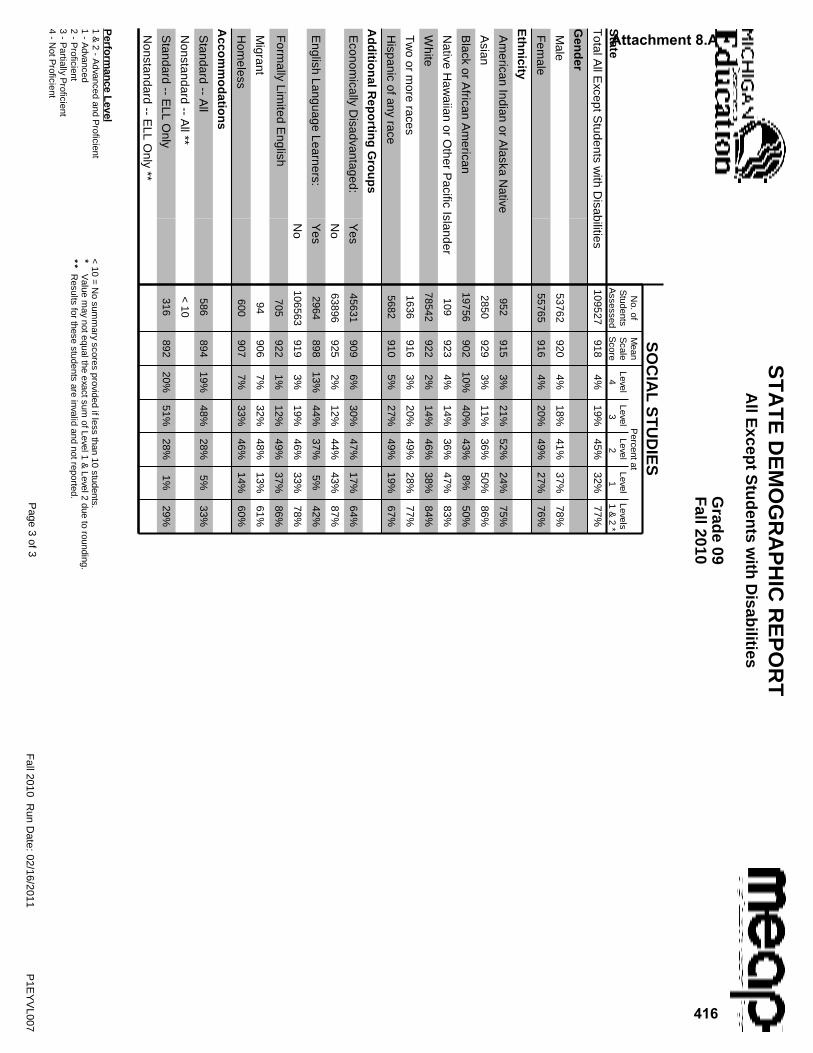
Perfo
rman
ceL
evel1
&2
-A
dvancedand
Proficient
1-
Advanced
2-
Proficient
3-
Partially
Proficient
4-
NotP
roficient
<10
=N
osum
mary
scoresprovided
iflessthan
10students.
*V
aluem
aynotequalthe
exactsumofLevel1
&Level2
dueto
rounding.**
Results
forthese
studentsare
invalidand
notreported.
ST
AT
ED
EM
OG
RA
PH
ICR
EP
OR
TA
llExcep
tS
tud
ents
with
Disab
ilities
Grad
e09
Fall2010
SO
CIA
LS
TU
DIE
S
Fall2010
Run
Date:02/16/2011
Page
3of3
P1E
YV
L007
No.of
Mean
Percentat
State
Students
Assessed
Scale
Score
Level4
Level3
Level2
Level1
Levels1
&2
*
TotalA
llExceptS
tudentsw
ithD
isabilities109527
9184%
19%45%
32%77%
Gen
der
Male
53762920
4%18%
41%37%
78%
Fem
ale55765
9164%
20%49%
27%76%
Eth
nicity
Am
ericanIndian
orA
laskaN
ative952
9153%
21%52%
24%75%
Asian
2850929
3%11%
36%50%
86%
Black
orA
fricanA
merican
19756902
10%40%
43%8%
50%
Native
Haw
aiianor
Other
Pacific
Islander109
9234%
14%36%
47%83%
White
78542922
2%14%
46%38%
84%
Tw
oor
more
races1636
9163%
20%49%
28%77%
Hispanic
ofanyrace
5682910
5%27%
49%19%
67%
Ad
ditio
nalR
epo
rting
Gro
up
s
Econom
icallyD
isadvantaged:Y
es45631
9096%
30%47%
17%64%
No
63896925
2%12%
44%43%
87%
English
LanguageLearners:
Yes
2964898
13%44%
37%5%
42%
No
106563919
3%19%
46%33%
78%
Form
allyLim
itedE
nglish705
9221%
12%49%
37%86%
Migrant
94906
7%32%
48%13%
61%
Hom
eless600
9077%
33%46%
14%60%
Acco
mm
od
ation
s
Standard
--A
ll586
89419%
48%28%
5%33%
Nonstandard
--A
ll**<
10
Standard
--E
LLO
nly316
89220%
51%28%
1%29%
Nonstandard
--E
LLO
nly**
Attachment 8.A
416
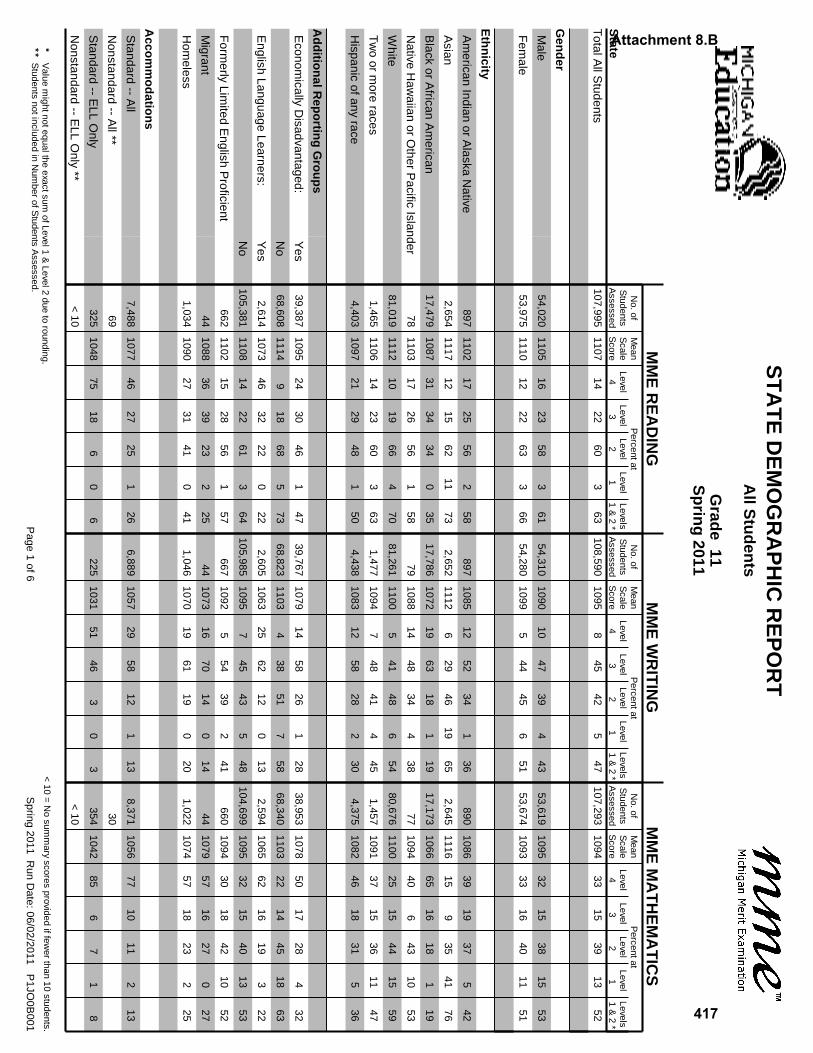
<10
=N
osum
mary
scoresprovided
iffewer
than10
students.*
Value
mightnotequalthe
exactsumofLevel1
&Level2
dueto
rounding.**
Students
notincludedin
Num
berofS
tudentsA
ssessed.
ST
AT
ED
EM
OG
RA
PH
ICR
EP
OR
TA
llStu
den
ts
Grad
e11
Sp
ring
2011
MM
ER
EA
DIN
GM
ME
WR
ITIN
GM
ME
MA
TH
EM
AT
ICS
Page
1of6
Spring
2011R
unD
ate:06/02/2011P
1JO0B
001
No.of
Mean
Percentat
No.of
Mean
Percentat
No.of
Mean
Percentat
State
Students
Assessed
Scale
Score
Level4
Level3
Level2
Level1
Levels1
&2
*S
tudentsA
ssessedS
caleS
coreLevel
4Level
3Level
2Level
1Levels1
&2
*S
tudentsA
ssessedS
caleS
coreLevel
4Level
3Level
2Level
1Levels1
&2
*
TotalA
llStudents
107,9951107
1422
603
63108,590
10958
4542
547
107,2931094
3315
3913
52
Gen
der
Male
54,0201105
1623
583
6154,310
109010
4739
443
53,6191095
3215
3815
53
Fem
ale53,975
111012
2263
366
54,2801099
544
456
5153,674
109333
1640
1151
Eth
nicity
Am
ericanIndian
orA
laskaN
ative897
110217
2556
258
8971085
1252
341
36890
108639
1937
542
Asian
2,6541117
1215
6211
732,652
11126
2946
1965
2,6451116
159
3541
76
Black
orA
fricanA
merican
17,4791087
3134
340
3517,786
107219
6318
119
17,1731066
6516
181
19
Native
Haw
aiianor
Other
Pacific
Islander78
110317
2656
158
791088
1448
344
3877
109440
643
1053
White
81,0191112
1019
664
7081,261
11005
4148
654
80,6761100
2515
4415
59
Tw
oor
more
races1,465
110614
2360
363
1,4771094
748
414
451,457
109137
1536
1147
Hispanic
ofanyrace
4,4031097
2129
481
504,438
108312
5828
230
4,3751082
4618
315
36
Ad
ditio
nalR
epo
rting
Gro
up
s
Econom
icallyD
isadvantaged:Y
es39,387
109524
3046
147
39,7671079
1458
261
2838,953
107850
1728
432
No
68,6081114
918
685
7368,823
11034
3851
758
68,3401103
2214
4518
63
English
LanguageLearners:
Yes
2,6141073
4632
220
222,605
106325
6212
013
2,5941065
6216
193
22
No
105,3811108
1422
613
64105,985
10957
4543
548
104,6991095
3215
4013
53
Form
erlyLim
itedE
nglishP
roficient662
110215
2856
157
6671092
554
392
41660
109430
1842
1052
Migrant
441088
3639
232
2544
107316
7014
014
441079
5716
270
27
Hom
eless1,034
109027
3141
041
1,0461070
1961
190
201,022
107457
1823
225
Acco
mm
od
ation
s
Standard
--A
ll7,488
107746
2725
126
6,8891057
2958
121
138,371
105677
1011
213
Nonstandard
--A
ll**69
30
Standard
--E
LLO
nly325
104875
186
06
2251031
5146
30
3354
104285
67
18
Nonstandard
--E
LLO
nly**
<10
<10
Attachment 8.B
417

*V
aluem
ightnotequaltheexactsum
ofLevel1&
Level2due
torounding.
**S
tudentsnotincluded
inN
umber
ofStudents
Assessed.
<10
=N
osum
mary
scoresprovided
iffewer
than10
students.
ST
AT
ED
EM
OG
RA
PH
ICR
EP
OR
TA
llStu
den
ts
Grad
e11
Sp
ring
2011
MM
ES
CIE
NC
EM
ME
SO
CIA
LS
TU
DIE
S
Page
2of6
Spring
2011R
unD
ate:06/02/2011P
1JO0B
001
No.of
Mean
Percentat
No.of
Mean
Percentat
State
Students
Assessed
Scale
Score
Level4
Level3
Level2
Level1
Levels1
&2
*S
tudentsA
ssessedS
caleS
coreLevel
4Level
3Level
2Level
1Levels1
&2
*
TotalA
llStudents
107,6531103
2415
529
61107,757
11238
1536
4178
Gen
der
Male
53,8321104
2514
5012
6253,895
11258
1433
4578
Fem
ale53,821
110224
1653
760
53,8621120
715
4037
77
Eth
nicity
Am
ericanIndian
orA
laskaN
ative891
109729
1849
553
8981118
917
3934
73
Asian
2,6511119
1410
5125
762,659
11345
927
5986
Black
orA
fricanA
merican
17,3421077
5322
241
2517,386
110418
2841
1353
Native
Haw
aiianor
Other
Pacific
Islander77
110225
2344
852
771122
521
3935
74
White
80,8431109
1814
5811
6980,871
11276
1135
4883
Tw
oor
more
races1,463
110126
1650
758
1,4691121
716
4038
77
Hispanic
ofanyrace
4,3861091
3519
423
454,397
11159
2043
2871
Ad
ditio
nalR
epo
rting
Gro
up
s
Econom
icallyD
isadvantaged:Y
es39,185
108839
1939
342
39,2641112
1322
4124
65
No
68,4681112
1613
5913
7268,493
11295
1034
5185
English
LanguageLearners:
Yes
2,6031071
6018
211
222,622
110121
3137
1048
No
105,0501104
2315
529
62105,135
11237
1436
4278
Form
erlyLim
itedE
nglishP
roficient661
109924
1855
358
6591119
614
4734
80
Migrant
441091
4316
392
4145
11099
2949
1362
Hom
eless1,031
108246
2132
133
1,0381109
1522
4518
63
Acco
mm
od
ation
s
Standard
--A
ll8,311
106865
1518
220
8,2831102
2529
3511
46
Nonstandard
--A
ll**33
44
Standard
--E
LLO
nly339
104386
94
04
3561092
3635
281
29
Nonstandard
--E
LLO
nly**
<10
<10
Attachment 8.B
418

<10
=N
osum
mary
scoresprovided
iffewer
than10
students.*
Value
mightnotequalthe
exactsumofLevel1
&Level2
dueto
rounding.**
Students
notincludedin
Num
berofS
tudentsA
ssessed.
ST
AT
ED
EM
OG
RA
PH
ICR
EP
OR
TS
tud
ents
with
Disab
ilities
Grad
e11
Sp
ring
2011
MM
ER
EA
DIN
GM
ME
WR
ITIN
GM
ME
MA
TH
EM
AT
ICS
Page
3of6
Spring
2011R
unD
ate:06/02/2011P
1JO0B
001
No.of
Mean
Percentat
No.of
Mean
Percentat
No.of
Mean
Percentat
State
Students
Assessed
Scale
Score
Level4
Level3
Level2
Level1
Levels1
&2
*S
tudentsA
ssessedS
caleS
coreLevel
4Level
3Level
2Level
1Levels1
&2
*S
tudentsA
ssessedS
caleS
coreLevel
4Level
3Level
2Level
1Levels1
&2
*
TotalS
tudentsw
ithD
isabilities9,996
107547
2923
124
9,9721054
3258
100
109,889
105379
1010
111
Gen
der
Male
6,4531074
4828
241
246,418
105135
5411
011
6,3901055
7611
122
13
Fem
ale3,543
107746
3123
024
3,5541059
2764
90
93,499
104984
87
18
Eth
nicity
Am
ericanIndian
orA
laskaN
ative112
107353
2721
021
1121046
4151
80
8111
104284
610
010
Asian
721073
4631
221
2471
105630
5514
115
701056
7311
114
16
Black
orA
fricanA
merican
2,0041059
6525
100
102,009
103550
473
03
1,9411031
943
30
3
Native
Haw
aiianor
Other
Pacific
Islander<
10<
10<
10
White
7,1981080
4230
281
297,173
106027
6012
113
7,1581060
7412
122
14
Tw
oor
more
races150
107546
2924
125
1471056
2565
100
10148
105178
1012
012
Hispanic
ofanyrace
4521070
5628
170
17452
104836
595
05
4531046
849
70
7
Ad
ditio
nalR
epo
rting
Gro
up
s
Econom
icallyD
isadvantaged:Y
es5,145
106855
2817
017
5,1231045
3955
60
65,075
104487
76
06
No
4,8511082
3930
301
314,849
106325
6014
115
4,8141063
7112
142
17
English
LanguageLearners:
Yes
2101058
6823
90
9211
103450
491
01
2091038
914
50
5
No
9,7861075
4729
241
249,761
105432
5810
011
9,6801054
7910
101
12
Form
erlyLim
itedE
nglishP
roficient13
107038
4615
015
131056
2369
80
813
104292
08
08
Migrant
<10
<10
<10
Hom
eless183
106756
3410
010
1841037
4552
30
3182
103993
42
02
Acco
mm
od
ation
s
Standard
--A
ll6,751
107548
2823
124
6,2971055
3060
100
117,531
105380
109
111
Nonstandard
--A
ll**64
28
Standard
--E
LLO
nly157
105869
2110
010
1471036
4949
20
2166
103992
35
05
Nonstandard
--E
LLO
nly**
<10
<10
Attachment 8.B
419
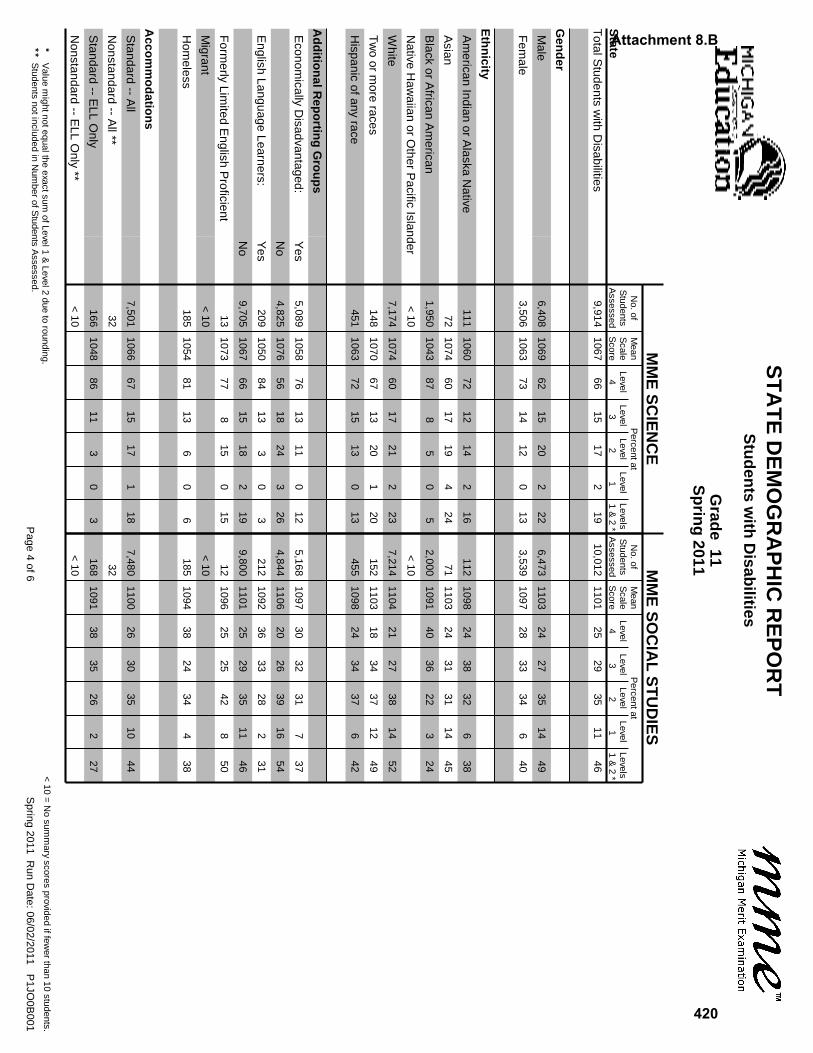
*V
aluem
ightnotequaltheexactsum
ofLevel1&
Level2due
torounding.
**S
tudentsnotincluded
inN
umber
ofStudents
Assessed.
<10
=N
osum
mary
scoresprovided
iffewer
than10
students.
ST
AT
ED
EM
OG
RA
PH
ICR
EP
OR
TS
tud
ents
with
Disab
ilities
Grad
e11
Sp
ring
2011
MM
ES
CIE
NC
EM
ME
SO
CIA
LS
TU
DIE
S
Page
4of6
Spring
2011R
unD
ate:06/02/2011P
1JO0B
001
No.of
Mean
Percentat
No.of
Mean
Percentat
State
Students
Assessed
Scale
Score
Level4
Level3
Level2
Level1
Levels1
&2
*S
tudentsA
ssessedS
caleS
coreLevel
4Level
3Level
2Level
1Levels1
&2
*
TotalS
tudentsw
ithD
isabilities9,914
106766
1517
219
10,0121101
2529
3511
46
Gen
der
Male
6,4081069
6215
202
226,473
110324
2735
1449
Fem
ale3,506
106373
1412
013
3,5391097
2833
346
40
Eth
nicity
Am
ericanIndian
orA
laskaN
ative111
106072
1214
216
1121098
2438
326
38
Asian
721074
6017
194
2471
110324
3131
1445
Black
orA
fricanA
merican
1,9501043
878
50
52,000
109140
3622
324
Native
Haw
aiianor
Other
Pacific
Islander<
10<
10
White
7,1741074
6017
212
237,214
110421
2738
1452
Tw
oor
more
races148
107067
1320
120
1521103
1834
3712
49
Hispanic
ofanyrace
4511063
7215
130
13455
109824
3437
642
Ad
ditio
nalR
epo
rting
Gro
up
s
Econom
icallyD
isadvantaged:Y
es5,089
105876
1311
012
5,1681097
3032
317
37
No
4,8251076
5618
243
264,844
110620
2639
1654
English
LanguageLearners:
Yes
2091050
8413
30
3212
109236
3328
231
No
9,7051067
6615
182
199,800
110125
2935
1146
Form
erlyLim
itedE
nglishP
roficient13
107377
815
015
121096
2525
428
50
Migrant
<10
<10
Hom
eless185
105481
136
06
1851094
3824
344
38
Acco
mm
od
ation
s
Standard
--A
ll7,501
106667
1517
118
7,4801100
2630
3510
44
Nonstandard
--A
ll**32
32
Standard
--E
LLO
nly166
104886
113
03
1681091
3835
262
27
Nonstandard
--E
LLO
nly**
<10
<10
Attachment 8.B
420

<10
=N
osum
mary
scoresprovided
iffewer
than10
students.*
Value
mightnotequalthe
exactsumofLevel1
&Level2
dueto
rounding.**
Students
notincludedin
Num
berofS
tudentsA
ssessed.
ST
AT
ED
EM
OG
RA
PH
ICR
EP
OR
TA
llExcep
tS
tud
ents
with
Disab
ilities
Grad
e11
Sp
ring
2011
MM
ER
EA
DIN
GM
ME
WR
ITIN
GM
ME
MA
TH
EM
AT
ICS
Page
5of6
Spring
2011R
unD
ate:06/02/2011P
1JO0B
001
No.of
Mean
Percentat
No.of
Mean
Percentat
No.of
Mean
Percentat
State
Students
Assessed
Scale
Score
Level4
Level3
Level2
Level1
Levels1
&2
*S
tudentsA
ssessedS
caleS
coreLevel
4Level
3Level
2Level
1Levels1
&2
*S
tudentsA
ssessedS
caleS
coreLevel
4Level
3Level
2Level
1Levels1
&2
*
TotalA
llExceptS
tudentsw
ithD
isabilities97,999
111111
2264
467
98,6181099
544
455
5197,404
109828
1642
1456
Gen
der
Male
47,5671109
1222
623
6647,892
10957
4642
547
47,2291100
2615
4216
58
Fem
ale50,432
111210
2165
469
50,7261102
442
486
5450,175
109629
1742
1254
Eth
nicity
Am
ericanIndian
orA
laskaN
ative785
110712
2462
264
7851090
852
382
40779
109233
2041
647
Asian
2,5821118
1115
6311
742,581
11145
2946
2066
2,5751118
149
3542
78
Black
orA
fricanA
merican
15,4751091
2735
380
3815,777
107715
6520
121
15,2321070
6217
192
21
Native
Haw
aiianor
Other
Pacific
Islander70
110516
2360
161
711092
1345
384
4269
109833
748
1259
White
73,8211115
718
704
7474,088
11043
3951
658
73,5181104
2016
4716
64
Tw
oor
more
races1,315
111010
2364
367
1,3301098
546
445
491,309
109533
1639
1251
Hispanic
ofanyrace
3,9511100
1730
522
533,986
10879
5831
233
3,9221086
4120
336
39
Ad
ditio
nalR
epo
rting
Gro
up
s
Econom
icallyD
isadvantaged:Y
es34,242
109919
3050
151
34,6441084
1059
301
3133,878
108345
1932
436
No
63,7571117
717
715
7663,974
11063
3654
861
63,5261106
1915
4819
67
English
LanguageLearners:
Yes
2,4041075
4433
230
232,394
106523
6413
014
2,3851068
6017
203
23
No
95,5951111
1021
654
6996,224
10995
4346
652
95,0191099
2716
4314
57
Form
erlyLim
itedE
nglishP
roficient649
110215
2757
158
6541093
554
402
42647
109529
1943
1053
Migrant
401090
3340
253
2840
107413
7315
015
401082
5318
300
30
Hom
eless851
109521
3148
048
8621078
1364
230
23840
108249
2128
330
Acco
mm
od
ation
s
Standard
--A
ll737
109032
1945
449
5921083
1547
344
38840
107949
1329
938
Nonstandard
--A
ll**<
10<
10
Standard
--E
LLO
nly168
103881
163
03
781022
5541
40
4188
104479
1010
211
Nonstandard
--E
LLO
nly**
<10
Attachment 8.B
421

*V
aluem
ightnotequaltheexactsum
ofLevel1&
Level2due
torounding.
**S
tudentsnotincluded
inN
umber
ofStudents
Assessed.
<10
=N
osum
mary
scoresprovided
iffewer
than10
students.
ST
AT
ED
EM
OG
RA
PH
ICR
EP
OR
TA
llExcep
tS
tud
ents
with
Disab
ilities
Grad
e11
Sp
ring
2011
MM
ES
CIE
NC
EM
ME
SO
CIA
LS
TU
DIE
S
Page
6of6
Spring
2011R
unD
ate:06/02/2011P
1JO0B
001
No.of
Mean
Percentat
No.of
Mean
Percentat
State
Students
Assessed
Scale
Score
Level4
Level3
Level2
Level1
Levels1
&2
*S
tudentsA
ssessedS
caleS
coreLevel
4Level
3Level
2Level
1Levels1
&2
*
TotalA
llExceptS
tudentsw
ithD
isabilities97,739
110720
1555
1065
97,7451125
613
3744
81
Gen
der
Male
47,4241109
1914
5413
6747,422
11286
1233
5082
Fem
ale50,315
110520
1756
763
50,3231122
614
4039
80
Eth
nicity
Am
ericanIndian
orA
laskaN
ative780
110222
1954
559
7861121
715
4038
78
Asian
2,5791120
1310
5225
772,588
11354
927
6087
Black
orA
fricanA
merican
15,3921081
4923
271
2815,386
110616
2743
1457
Native
Haw
aiianor
Other
Pacific
Islander69
110422
2248
957
691124
420
3639
75
White
73,6691113
1313
6212
7373,657
11294
1035
5186
Tw
oor
more
races1,315
110421
1754
862
1,3171123
514
4040
81
Hispanic
ofanyrace
3,9351095
3120
463
493,942
11177
1844
3074
Ad
ditio
nalR
epo
rting
Gro
up
s
Econom
icallyD
isadvantaged:Y
es34,096
109334
2043
346
34,0961114
1020
4327
69
No
63,6431115
1212
6214
7563,649
11314
933
5487
English
LanguageLearners:
Yes
2,3941073
5819
231
232,410
110220
3138
1149
No
95,3451108
1915
5610
6695,335
11256
1337
4582
Form
erlyLim
itedE
nglishP
roficient648
110023
1856
359
6471120
613
4734
81
Migrant
401094
3818
433
4541
11117
2949
1563
Hom
eless846
108838
2338
239
8531112
1022
4722
68
Acco
mm
od
ation
s
Standard
--A
ll810
108543
1634
742
8031113
1621
3726
63
Nonstandard
--A
ll**<
1012
Standard
--E
LLO
nly173
103987
85
05
1881092
3535
291
30
Nonstandard
--E
LLO
nly**
Attachment 8.B
422
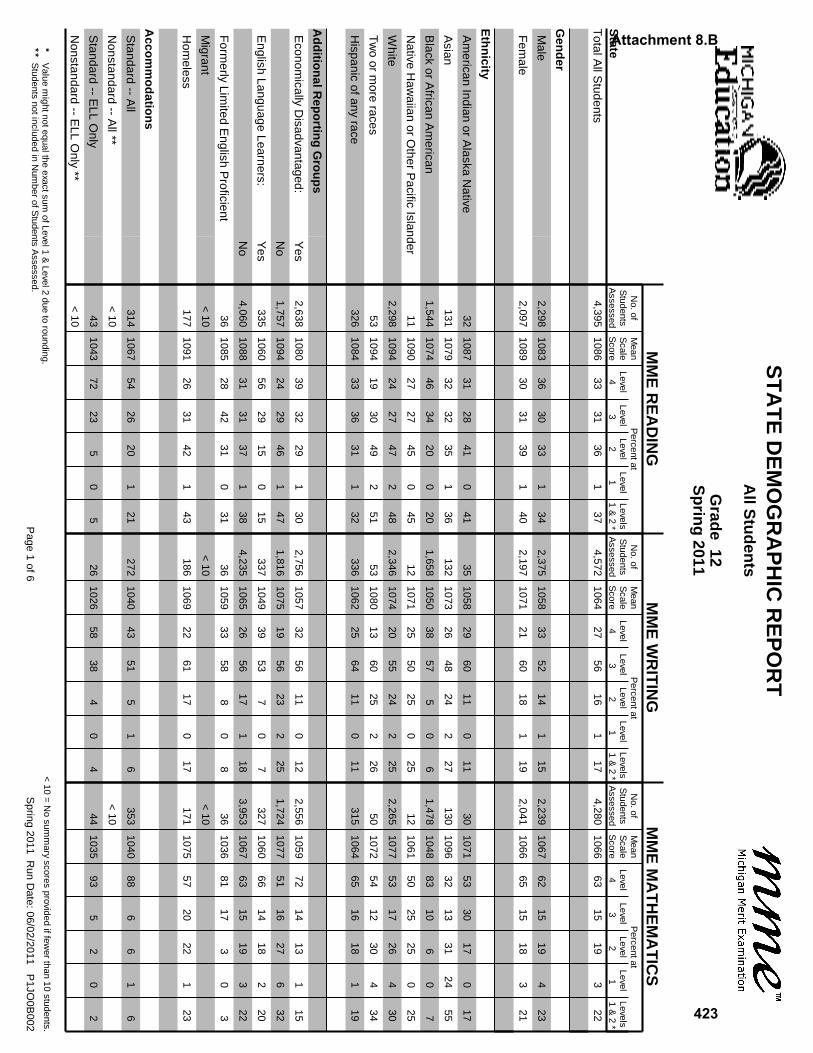
<10
=N
osum
mary
scoresprovided
iffewer
than10
students.*
Value
mightnotequalthe
exactsumofLevel1
&Level2
dueto
rounding.**
Students
notincludedin
Num
berofS
tudentsA
ssessed.
ST
AT
ED
EM
OG
RA
PH
ICR
EP
OR
TA
llStu
den
ts
Grad
e12
Sp
ring
2011
MM
ER
EA
DIN
GM
ME
WR
ITIN
GM
ME
MA
TH
EM
AT
ICS
Page
1of6
Spring
2011R
unD
ate:06/02/2011P
1JO0B
002
No.of
Mean
Percentat
No.of
Mean
Percentat
No.of
Mean
Percentat
State
Students
Assessed
Scale
Score
Level4
Level3
Level2
Level1
Levels1
&2
*S
tudentsA
ssessedS
caleS
coreLevel
4Level
3Level
2Level
1Levels1
&2
*S
tudentsA
ssessedS
caleS
coreLevel
4Level
3Level
2Level
1Levels1
&2
*
TotalA
llStudents
4,3951086
3331
361
374,572
106427
5616
117
4,2801066
6315
193
22
Gen
der
Male
2,2981083
3630
331
342,375
105833
5214
115
2,2391067
6215
194
23
Fem
ale2,097
108930
3139
140
2,1971071
2160
181
192,041
106665
1518
321
Eth
nicity
Am
ericanIndian
orA
laskaN
ative32
108731
2841
041
351058
2960
110
1130
107153
3017
017
Asian
1311079
3232
351
36132
107326
4824
227
1301096
3213
3124
55
Black
orA
fricanA
merican
1,5441074
4634
200
201,658
105038
575
06
1,4781048
8310
60
7
Native
Haw
aiianor
Other
Pacific
Islander11
109027
2745
045
121071
2550
250
2512
106150
2525
025
White
2,2981094
2427
472
482,346
107420
5524
225
2,2651077
5317
264
30
Tw
oor
more
races53
109419
3049
251
531080
1360
252
2650
107254
1230
434
Hispanic
ofanyrace
3261084
3336
311
32336
106225
6411
011
3151064
6516
181
19
Ad
ditio
nalR
epo
rting
Gro
up
s
Econom
icallyD
isadvantaged:Y
es2,638
108039
3229
130
2,7561057
3256
110
122,556
105972
1413
115
No
1,7571094
2429
461
471,816
107519
5623
225
1,7241077
5116
276
32
English
LanguageLearners:
Yes
3351060
5629
150
15337
104939
537
07
3271060
6614
182
20
No
4,0601088
3131
371
384,235
106526
5617
118
3,9531067
6315
193
22
Form
erlyLim
itedE
nglishP
roficient36
108528
4231
031
361059
3358
80
836
103681
173
03
Migrant
<10
<10
<10
Hom
eless177
109126
3142
143
1861069
2261
170
17171
107557
2022
123
Acco
mm
od
ation
s
Standard
--A
ll314
106754
2620
121
2721040
4351
51
6353
104088
66
16
Nonstandard
--A
ll**<
10<
10
Standard
--E
LLO
nly43
104372
235
05
261026
5838
40
444
103593
52
02
Nonstandard
--E
LLO
nly**
<10
Attachment 8.B
423

*V
aluem
ightnotequaltheexactsum
ofLevel1&
Level2due
torounding.
**S
tudentsnotincluded
inN
umber
ofStudents
Assessed.
<10
=N
osum
mary
scoresprovided
iffewer
than10
students.
ST
AT
ED
EM
OG
RA
PH
ICR
EP
OR
TA
llStu
den
ts
Grad
e12
Sp
ring
2011
MM
ES
CIE
NC
EM
ME
SO
CIA
LS
TU
DIE
S
Page
2of6
Spring
2011R
unD
ate:06/02/2011P
1JO0B
002
No.of
Mean
Percentat
No.of
Mean
Percentat
State
Students
Assessed
Scale
Score
Level4
Level3
Level2
Level1
Levels1
&2
*S
tudentsA
ssessedS
caleS
coreLevel
4Level
3Level
2Level
1Levels1
&2
*
TotalA
llStudents
4,3541074
5517
262
284,364
110619
2737
1754
Gen
der
Male
2,2771074
5516
272
292,287
110720
2635
2054
Fem
ale2,077
107455
1925
126
2,0771104
1928
4013
54
Eth
nicity
Am
ericanIndian
orA
laskaN
ative31
108258
1626
026
301110
1330
3323
57
Asian
1311084
4012
444
48133
111017
2239
2362
Black
orA
fricanA
merican
1,5271057
7514
100
111,528
109629
3532
436
Native
Haw
aiianor
Other
Pacific
Islander12
106658
1725
025
131109
1531
2331
54
White
2,2831085
4318
363
392,295
111213
2240
2565
Tw
oor
more
races50
109040
2038
240
501113
1220
4424
68
Hispanic
ofanyrace
3201072
5723
191
20315
110517
2941
1455
Ad
ditio
nalR
epo
rting
Gro
up
s
Econom
icallyD
isadvantaged:Y
es2,608
106863
1719
120
2,6191101
2330
3611
47
No
1,7461084
4318
363
391,745
111214
2239
2564
English
LanguageLearners:
Yes
3301055
7214
140
14330
109726
3532
738
No
4,0241076
5417
272
294,034
110619
2638
1855
Form
erlyLim
itedE
nglishP
roficient36
105961
2514
014
361103
2519
3917
56
Migrant
<10
<10
Hom
eless175
107554
1429
231
1721107
1628
3719
56
Acco
mm
od
ation
s
Standard
--A
ll353
105179
118
19
3491096
3132
307
37
Nonstandard
--A
ll**<
10<
10
Standard
--E
LLO
nly43
101695
22
02
431092
3733
282
30
Nonstandard
--E
LLO
nly**
Attachment 8.B
424
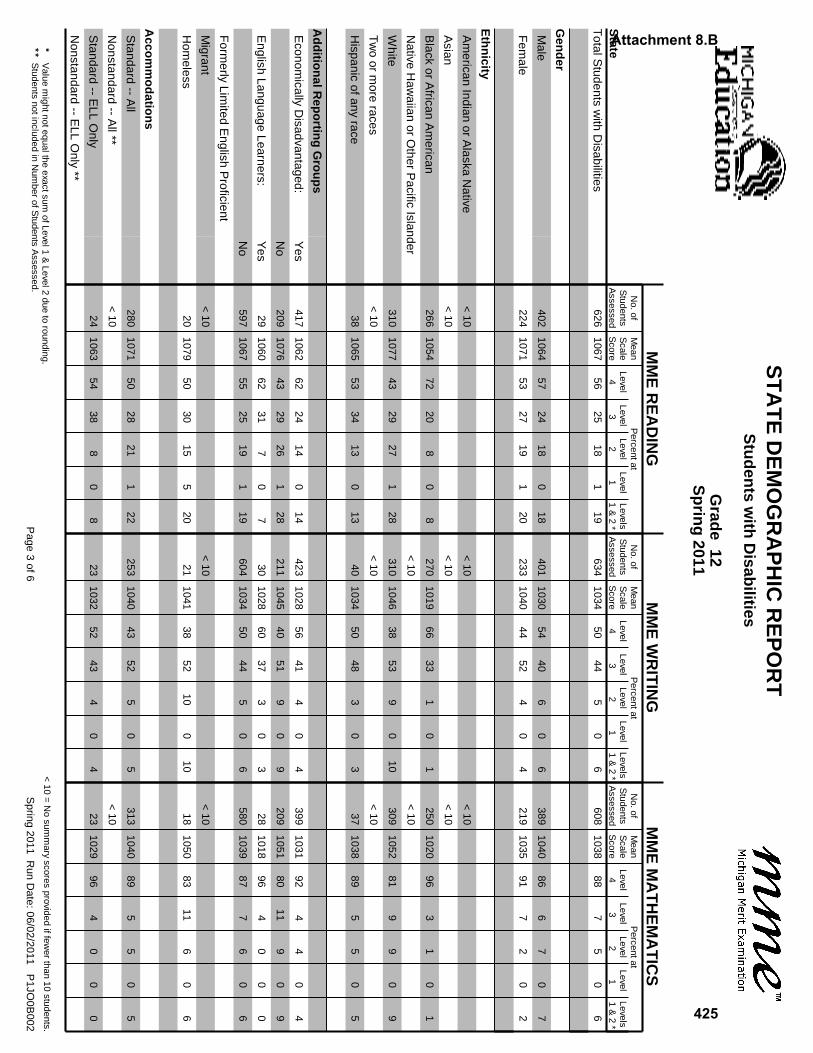
<10
=N
osum
mary
scoresprovided
iffewer
than10
students.*
Value
mightnotequalthe
exactsumofLevel1
&Level2
dueto
rounding.**
Students
notincludedin
Num
berofS
tudentsA
ssessed.
ST
AT
ED
EM
OG
RA
PH
ICR
EP
OR
TS
tud
ents
with
Disab
ilities
Grad
e12
Sp
ring
2011
MM
ER
EA
DIN
GM
ME
WR
ITIN
GM
ME
MA
TH
EM
AT
ICS
Page
3of6
Spring
2011R
unD
ate:06/02/2011P
1JO0B
002
No.of
Mean
Percentat
No.of
Mean
Percentat
No.of
Mean
Percentat
State
Students
Assessed
Scale
Score
Level4
Level3
Level2
Level1
Levels1
&2
*S
tudentsA
ssessedS
caleS
coreLevel
4Level
3Level
2Level
1Levels1
&2
*S
tudentsA
ssessedS
caleS
coreLevel
4Level
3Level
2Level
1Levels1
&2
*
TotalS
tudentsw
ithD
isabilities626
106756
2518
119
6341034
5044
50
6608
103888
75
06
Gen
der
Male
4021064
5724
180
18401
103054
406
06
3891040
866
70
7
Fem
ale224
107153
2719
120
2331040
4452
40
4219
103591
72
02
Eth
nicity
Am
ericanIndian
orA
laskaN
ative<
10<
10<
10
Asian
<10
<10
<10
Black
orA
fricanA
merican
2661054
7220
80
8270
101966
331
01
2501020
963
10
1
Native
Haw
aiianor
Other
Pacific
Islander<
10<
10
White
3101077
4329
271
28310
104638
539
010
3091052
819
90
9
Tw
oor
more
races<
10<
10<
10
Hispanic
ofanyrace
381065
5334
130
1340
103450
483
03
371038
895
50
5
Ad
ditio
nalR
epo
rting
Gro
up
s
Econom
icallyD
isadvantaged:Y
es417
106262
2414
014
4231028
5641
40
4399
103192
44
04
No
2091076
4329
261
28211
104540
519
09
2091051
8011
90
9
English
LanguageLearners:
Yes
291060
6231
70
730
102860
373
03
281018
964
00
0
No
5971067
5525
191
19604
103450
445
06
5801039
877
60
6
Form
erlyLim
itedE
nglishP
roficient
Migrant
<10
<10
<10
Hom
eless20
107950
3015
520
211041
3852
100
1018
105083
116
06
Acco
mm
od
ation
s
Standard
--A
ll280
107150
2821
122
2531040
4352
50
5313
104089
55
05
Nonstandard
--A
ll**<
10<
10
Standard
--E
LLO
nly24
106354
388
08
231032
5243
40
423
102996
40
00
Nonstandard
--E
LLO
nly**
Attachment 8.B
425

*V
aluem
ightnotequaltheexactsum
ofLevel1&
Level2due
torounding.
**S
tudentsnotincluded
inN
umber
ofStudents
Assessed.
<10
=N
osum
mary
scoresprovided
iffewer
than10
students.
ST
AT
ED
EM
OG
RA
PH
ICR
EP
OR
TS
tud
ents
with
Disab
ilities
Grad
e12
Sp
ring
2011
MM
ES
CIE
NC
EM
ME
SO
CIA
LS
TU
DIE
S
Page
4of6
Spring
2011R
unD
ate:06/02/2011P
1JO0B
002
No.of
Mean
Percentat
No.of
Mean
Percentat
State
Students
Assessed
Scale
Score
Level4
Level3
Level2
Level1
Levels1
&2
*S
tudentsA
ssessedS
caleS
coreLevel
4Level
3Level
2Level
1Levels1
&2
*
TotalS
tudentsw
ithD
isabilities618
105378
138
19
6221095
3433
267
33
Gen
der
Male
3951054
7515
91
10402
109633
3226
935
Fem
ale223
105183
107
07
2201094
3534
274
31
Eth
nicity
Am
ericanIndian
orA
laskaN
ative<
10<
10
Asian
<10
<10
Black
orA
fricanA
merican
2581036
917
20
2262
108747
3714
317
Native
Haw
aiianor
Other
Pacific
Islander<
10<
10
White
3111066
6619
132
15311
110124
2836
1248
Tw
oor
more
races<
10<
10
Hispanic
ofanyrace
361054
868
60
637
109524
4627
330
Ad
ditio
nalR
epo
rting
Gro
up
s
Econom
icallyD
isadvantaged:Y
es407
104883
124
05
4101092
3934
215
26
No
2111062
6815
152
17212
110123
3036
1147
English
LanguageLearners:
Yes
271030
960
40
427
108948
3019
422
No
5911054
7714
81
9595
109533
3327
734
Form
erlyLim
itedE
nglishP
roficient<
10
Migrant
<10
<10
Hom
eless18
106072
176
611
181098
2250
1711
28
Acco
mm
od
ation
s
Standard
--A
ll314
105579
128
19
3111097
3231
307
38
Nonstandard
--A
ll**<
10<
10
Standard
--E
LLO
nly22
103495
05
05
221091
4132
235
27
Nonstandard
--E
LLO
nly**
Attachment 8.B
426
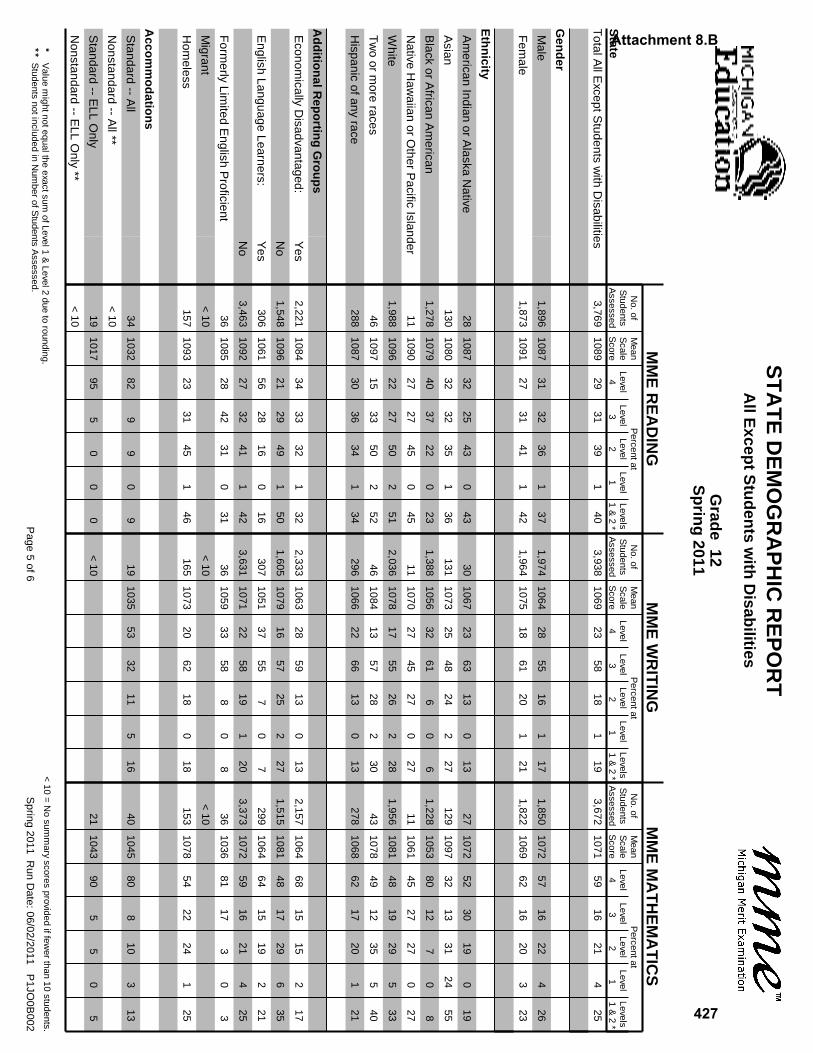
<10
=N
osum
mary
scoresprovided
iffewer
than10
students.*
Value
mightnotequalthe
exactsumofLevel1
&Level2
dueto
rounding.**
Students
notincludedin
Num
berofS
tudentsA
ssessed.
ST
AT
ED
EM
OG
RA
PH
ICR
EP
OR
TA
llExcep
tS
tud
ents
with
Disab
ilities
Grad
e12
Sp
ring
2011
MM
ER
EA
DIN
GM
ME
WR
ITIN
GM
ME
MA
TH
EM
AT
ICS
Page
5of6
Spring
2011R
unD
ate:06/02/2011P
1JO0B
002
No.of
Mean
Percentat
No.of
Mean
Percentat
No.of
Mean
Percentat
State
Students
Assessed
Scale
Score
Level4
Level3
Level2
Level1
Levels1
&2
*S
tudentsA
ssessedS
caleS
coreLevel
4Level
3Level
2Level
1Levels1
&2
*S
tudentsA
ssessedS
caleS
coreLevel
4Level
3Level
2Level
1Levels1
&2
*
TotalA
llExceptS
tudentsw
ithD
isabilities3,769
108929
3139
140
3,9381069
2358
181
193,672
107159
1621
425
Gen
der
Male
1,8961087
3132
361
371,974
106428
5516
117
1,8501072
5716
224
26
Fem
ale1,873
109127
3141
142
1,9641075
1861
201
211,822
106962
1620
323
Eth
nicity
Am
ericanIndian
orA
laskaN
ative28
108732
2543
043
301067
2363
130
1327
107252
3019
019
Asian
1301080
3232
351
36131
107325
4824
227
1291097
3213
3124
55
Black
orA
fricanA
merican
1,2781079
4037
220
231,388
105632
616
06
1,2281053
8012
70
8
Native
Haw
aiianor
Other
Pacific
Islander11
109027
2745
045
111070
2745
270
2711
106145
2727
027
White
1,9881096
2227
502
512,036
107817
5526
228
1,9561081
4819
295
33
Tw
oor
more
races46
109715
3350
252
461084
1357
282
3043
107849
1235
540
Hispanic
ofanyrace
2881087
3036
341
34296
106622
6613
013
2781068
6217
201
21
Ad
ditio
nalR
epo
rting
Gro
up
s
Econom
icallyD
isadvantaged:Y
es2,221
108434
3332
132
2,3331063
2859
130
132,157
106468
1515
217
No
1,5481096
2129
491
501,605
107916
5725
227
1,5151081
4817
296
35
English
LanguageLearners:
Yes
3061061
5628
160
16307
105137
557
07
2991064
6415
192
21
No
3,4631092
2732
411
423,631
107122
5819
120
3,3731072
5916
214
25
Form
erlyLim
itedE
nglishP
roficient36
108528
4231
031
361059
3358
80
836
103681
173
03
Migrant
<10
<10
<10
Hom
eless157
109323
3145
146
1651073
2062
180
18153
107854
2224
125
Acco
mm
od
ation
s
Standard
--A
ll34
103282
99
09
191035
5332
115
1640
104580
810
313
Nonstandard
--A
ll**<
10
Standard
--E
LLO
nly19
101795
50
00
<10
211043
905
50
5
Nonstandard
--E
LLO
nly**
<10
Attachment 8.B
427

*V
aluem
ightnotequaltheexactsum
ofLevel1&
Level2due
torounding.
**S
tudentsnotincluded
inN
umber
ofStudents
Assessed.
<10
=N
osum
mary
scoresprovided
iffewer
than10
students.
ST
AT
ED
EM
OG
RA
PH
ICR
EP
OR
TA
llExcep
tS
tud
ents
with
Disab
ilities
Grad
e12
Sp
ring
2011
MM
ES
CIE
NC
EM
ME
SO
CIA
LS
TU
DIE
S
Page
6of6
Spring
2011R
unD
ate:06/02/2011P
1JO0B
002
No.of
Mean
Percentat
No.of
Mean
Percentat
State
Students
Assessed
Scale
Score
Level4
Level3
Level2
Level1
Levels1
&2
*S
tudentsA
ssessedS
caleS
coreLevel
4Level
3Level
2Level
1Levels1
&2
*
TotalA
llExceptS
tudentsw
ithD
isabilities3,736
107851
1829
231
3,7421107
1726
3918
58
Gen
der
Male
1,8821078
5116
313
331,885
110917
2537
2259
Fem
ale1,854
107752
2027
128
1,8571105
1727
4214
56
Eth
nicity
Am
ericanIndian
orA
laskaN
ative27
108452
1930
030
271111
1526
3326
59
Asian
1301084
3912
454
48132
111016
2239
2362
Black
orA
fricanA
merican
1,2691062
7216
120
121,266
109725
3536
540
Native
Haw
aiianor
Other
Pacific
Islander11
107255
1827
027
121110
1733
1733
50
White
1,9721087
3918
393
421,984
111312
2141
2768
Tw
oor
more
races43
109435
1944
247
431116
719
4728
74
Hispanic
ofanyrace
2841074
5325
211
22278
110616
2642
1558
Ad
ditio
nalR
epo
rting
Gro
up
s
Econom
icallyD
isadvantaged:Y
es2,201
107160
1722
123
2,2091103
2029
3913
51
No
1,5351087
4018
393
421,533
111313
2140
2766
English
LanguageLearners:
Yes
3031057
7015
150
15303
109824
3633
740
No
3,4331079
5018
302
323,439
110816
2540
1959
Form
erlyLim
itedE
nglishP
roficient36
105961
2514
014
351103
2617
4017
57
Migrant
<10
<10
Hom
eless157
107752
1432
234
1541108
1526
4019
59
Acco
mm
od
ation
s
Standard
--A
ll39
102185
510
010
381094
2939
265
32
Nonstandard
--A
ll**
Standard
--E
LLO
nly21
99895
50
00
211092
3333
330
33
Nonstandard
--E
LLO
nly**
Attachment 8.B
428

Fall 2
01
0
STA
TE D
EM
OG
RA
PH
IC
R
EP
OR
T
Grad
e 3
Fu
nctio
nal In
dep
en
den
ce
No. of
No. of
Students
Assessed
Scale
Score
Scale
Surpassed
Attained
Em
erging
#%
#%
#%
Accessin
g P
rin
tM
ath
em
atics
Students
Assessed
Mean
Mean
Score
Attained
Em
erging
#%
#%
#%
Surpassed
State
All Students
2317
2314
432
23.7
398
25.3
457
25.1
931
51.2
395
25.1
780
49.6
1820
1573
Gen
der
Male
2317
2316
294
23.9
253
24.7
307
25.0
628
51.1
242
23.6
530
51.7
1229
1025
Fem
ale
2317
2312
138
23.4
145
26.5
150
25.4
303
51.3
153
27.9
250
45.6
591
548
Eth
nicity
Am
erican Indian or Alaska N
ative
2315
2317
523.8
318.8
628.6
10
47.6
531.3
850.0
21
16
Asian
2313
2307
216.7
436.4
433.3
650.0
327.3
436.4
12
11
Black or African Am
erican
2312
2309
121
29.2
133
34.3
120
29.0
173
41.8
89
22.9
166
42.8
414
388
Native H
aw
aiian or O
ther Pacific Islander
**
**
**
**
**
**
**
**
White
2318
2316
265
22.2
229
22.9
280
23.5
649
54.4
253
25.3
519
51.8
1194
1001
Tw
o or M
ore Races
2324
2316
922.0
718.9
717.1
25
61.0
10
27.0
20
54.1
41
37
Hispanic of Any Race
2316
2316
30
22.2
22
18.8
39
28.9
66
48.9
34
29.1
61
52.1
135
117
Ad
ditio
nal R
ep
ortin
g G
ro
up
s
Econom
ically D
isadvantaged: Yes
2316
2314
329
24.8
297
25.8
333
25.1
667
50.2
288
25.0
565
49.1
1329
1150
Econom
ically D
isadvantaged: N
o2319
2315
103
21.0
101
23.9
124
25.3
264
53.8
107
25.3
215
50.8
491
423
English Language Learners: Yes
2311
2310
26
28.6
25
31.6
29
31.9
36
39.6
22
27.8
32
40.5
91
79
English Language Learners: N
o2317
2315
406
23.5
373
25.0
428
24.8
895
51.8
373
25.0
748
50.1
1729
1494
Form
erly Lim
ited English Proficient
2317
2313
218.2
218.2
327.3
654.5
545.5
436.4
11
11
Migrant
**
**
**
**
**
**
**
**
Hom
eless
2320
2318
310.0
311.5
516.7
22
73.3
830.8
15
57.7
30
26
Acco
mm
od
atio
ns
Standard - All
2318
2314
287
22.5
285
24.4
298
23.3
692
54.2
303
26.0
579
49.6
1277
1167
Nonstandard - All †
(*)
(*)
Standard ELL O
nly
2312
2310
20
29.4
20
31.3
21
30.9
27
39.7
18
28.1
26
40.6
68
64
Nonstandard ELL O
nly †
(*)
(*)
* <
10 students assessed
Page 1 of 1
† Results for these students are invalid and not reported.
Note: See reverse for additional inform
ation
() These students are not included in "All Students."
Attachment 8.C
429

Fall 2
01
0
STA
TE D
EM
OG
RA
PH
IC
R
EP
OR
T
Grad
e 4
Fu
nctio
nal In
dep
en
den
ce
No. of
No. of
Students
Assessed
Scale
Score
Scale
Surpassed
Attained
Em
erging
#%
#%
#%
Accessin
g P
rin
tM
ath
em
atics
Students
Assessed
Mean
Mean
Score
Attained
Em
erging
#%
#%
#%
Surpassed
State
All Students
2416
2423
532
24.2
322
17.1
575
26.2
1089
49.6
483
25.6
1083
57.4
2196
1888
Gen
der
Male
2416
2424
367
24.6
192
15.7
374
25.1
749
50.3
305
24.9
729
59.5
1490
1226
Fem
ale
2415
2420
165
23.4
130
19.6
201
28.5
340
48.2
178
26.9
354
53.5
706
662
Eth
nicity
Am
erican Indian or Alaska N
ative
2419
2421
520.8
419.0
833.3
11
45.8
523.8
12
57.1
24
21
Asian
2410
2421
520.8
418.2
937.5
10
41.7
522.7
13
59.1
24
22
Black or African Am
erican
2412
2419
171
30.6
105
20.9
154
27.5
234
41.9
143
28.5
254
50.6
559
502
Native H
aw
aiian or O
ther Pacific Islander
**
**
**
**
**
**
**
**
White
2417
2424
311
22.2
187
15.7
345
24.6
744
53.1
286
24.1
715
60.2
1400
1188
Tw
o or M
ore Races
2416
2419
818.6
616.2
15
34.9
20
46.5
12
32.4
19
51.4
43
37
Hispanic of Any Race
2415
2424
31
21.8
15
13.0
44
31.0
67
47.2
31
27.0
69
60.0
142
115
Ad
ditio
nal R
ep
ortin
g G
ro
up
s
Econom
ically D
isadvantaged: Yes
2415
2423
419
25.9
232
16.7
417
25.8
779
48.2
358
25.7
802
57.6
1615
1392
Econom
ically D
isadvantaged: N
o2418
2422
113
19.4
90
18.1
158
27.2
310
53.4
125
25.2
281
56.7
581
496
English Language Learners: Yes
2411
2419
26
28.9
16
21.3
27
30.0
37
41.1
18
24.0
41
54.7
90
75
English Language Learners: N
o2416
2423
506
24.0
306
16.9
548
26.0
1052
50.0
465
25.6
1042
57.5
2106
1813
Form
erly Lim
ited English Proficient
**
**
**
**
**
**
**
**
Migrant
**
**
**
**
**
**
**
**
Hom
eless
2415
2424
717.1
514.3
14
34.1
20
48.8
10
28.6
20
57.1
41
35
Acco
mm
od
atio
ns
Standard - All
2417
2423
320
21.4
222
16.1
401
26.9
772
51.7
354
25.7
801
58.2
1493
1377
Nonstandard - All †
(*)
(*)
Standard ELL O
nly
2414
2420
16
26.7
12
20.7
16
26.7
28
46.7
14
24.1
32
55.2
60
58
Nonstandard ELL O
nly †
(*)
(*)
* <
10 students assessed
Page 1 of 2
† Results for these students are invalid and not reported.
Note: See reverse for additional inform
ation
() These students are not included in "All Students."
Attachment 8.C
430

Fall 2
01
0
STA
TE D
EM
OG
RA
PH
IC
R
EP
OR
T
Grad
e 4
Fu
nctio
nal In
dep
en
den
ce
No. of
Students
Assessed
Scale
Score
Surpassed
Attained
Em
erging
#%
#%
#%
Scien
ce
Mean
Students
Assessed
Earned
Points
Earned Point 2
Earned Point 1
Earned Point 0
#%
#%
#%
Exp
ressin
g Id
eas
Mean
Earned Point 3
#%
Earned Point 4
#%
No. of
State
All Students
**
**
**
**
352
16.7
107
5.1
56
2.6
501
23.7
1098
51.9
2114
2.0
Gen
der
Male
**
**
**
**
225
15.7
59
4.1
39
2.7
372
26.0
734
51.4
1429
1.9
Fem
ale
**
**
**
**
127
18.5
48
7.0
17
2.5
129
18.8
364
53.1
685
2.1
Eth
nicity
Am
erican Indian or Alaska N
ative
**
**
**
**
14.2
00.0
14.2
416.7
18
75.0
24
1.8
Asian
**
**
**
**
417.4
313.0
00.0
28.7
14
60.9
23
2.3
Black or African Am
erican
**
**
**
**
97
18.3
18
3.4
61.1
140
26.5
268
50.7
529
2.0
Native H
aw
aiian or O
ther Pacific Islander
**
**
**
**
**
**
**
**
**
**
White
**
**
**
**
219
16.2
72
5.3
46
3.4
319
23.5
699
51.6
1355
2.0
Tw
o or M
ore Races
**
**
**
**
819.0
37.1
00.0
11
26.2
20
47.6
42
2.1
Hispanic of Any Race
**
**
**
**
23
16.7
11
8.0
32.2
25
18.1
76
55.1
138
2.1
Ad
ditio
nal R
ep
ortin
g G
ro
up
s
Econom
ically D
isadvantaged: Yes
**
**
**
**
238
15.3
79
5.1
39
2.5
380
24.5
818
52.6
1554
2.0
Econom
ically D
isadvantaged: N
o*
**
**
**
*114
20.4
28
5.0
17
3.0
121
21.6
280
50.0
560
2.0
English Language Learners: Yes
**
**
**
**
18
20.0
10
11.1
33.3
88.9
51
56.7
90
2.3
English Language Learners: N
o*
**
**
**
*334
16.5
97
4.8
53
2.6
493
24.4
1047
51.7
2024
2.0
Form
erly Lim
ited English Proficient
**
**
**
**
**
**
**
**
**
**
Migrant
**
**
**
**
**
**
**
**
**
**
Hom
eless
**
**
**
**
512.8
12.6
00.0
820.5
25
64.1
39
2.0
Acco
mm
od
atio
ns
Standard - All
**
**
**
**
235
16.3
70
4.8
36
2.5
354
24.5
749
51.9
1444
2.0
Nonstandard - All †
(*)
**
**
**
**
**
**
Standard ELL O
nly
**
**
**
**
13
21.7
58.3
35.0
610.0
33
55.0
60
2.2
Nonstandard ELL O
nly †
(*)
**
**
**
**
**
**
* <
10 students assessed
Page 2 of 2
† Results for these students are invalid and not reported.
Note: See reverse for additional inform
ation
() These students are not included in "All Students."
Attachment 8.C
431

Fall 2
01
0
STA
TE D
EM
OG
RA
PH
IC
R
EP
OR
T
Grad
e 5
Fu
nctio
nal In
dep
en
den
ce
No. of
No. of
Students
Assessed
Scale
Score
Scale
Surpassed
Attained
Em
erging
#%
#%
#%
Accessin
g P
rin
tM
ath
em
atics
Students
Assessed
Mean
Mean
Score
Attained
Em
erging
#%
#%
#%
Surpassed
State
All Students
2520
2512
448
20.5
564
28.4
338
15.5
1397
64.0
578
29.1
842
42.4
2183
1984
Gen
der
Male
2521
2514
298
20.5
329
25.6
218
15.0
938
64.5
369
28.7
586
45.6
1454
1284
Fem
ale
2520
2509
150
20.6
235
33.6
120
16.5
459
63.0
209
29.9
256
36.6
729
700
Eth
nicity
Am
erican Indian or Alaska N
ative
2520
2505
617.1
11
37.9
514.3
24
68.6
827.6
10
34.5
35
29
Asian
2522
2513
516.1
728.0
516.1
21
67.7
832.0
10
40.0
31
25
Black or African Am
erican
2517
2508
136
25.9
177
35.5
90
17.1
300
57.0
154
30.9
167
33.5
526
498
Native H
aw
aiian or O
ther Pacific Islander
**
**
**
**
**
**
**
**
White
2522
2514
264
18.8
334
26.4
203
14.4
940
66.8
356
28.2
574
45.4
1407
1264
Tw
o or M
ore Races
2521
2516
713.5
815.7
11
21.2
34
65.4
20
39.2
23
45.1
52
51
Hispanic of Any Race
2517
2514
29
22.1
27
23.3
24
18.3
78
59.5
31
26.7
58
50.0
131
116
Ad
ditio
nal R
ep
ortin
g G
ro
up
s
Econom
ically D
isadvantaged: Yes
2521
2513
317
19.9
375
26.3
257
16.1
1019
64.0
423
29.6
629
44.1
1593
1427
Econom
ically D
isadvantaged: N
o2520
2510
131
22.2
189
33.9
81
13.7
378
64.1
155
27.8
213
38.2
590
557
English Language Learners: Yes
2517
2513
14
19.4
18
29.0
14
19.4
44
61.1
15
24.2
29
46.8
72
62
English Language Learners: N
o2521
2512
434
20.6
546
28.4
324
15.3
1353
64.1
563
29.3
813
42.3
2111
1922
Form
erly Lim
ited English Proficient
2519
2523
00.0
00.0
640.0
960.0
642.9
857.1
15
14
Migrant
**
**
**
**
**
**
**
**
Hom
eless
2515
2515
718.9
722.6
718.9
23
62.2
929.0
15
48.4
37
31
Acco
mm
od
atio
ns
Standard - All
2522
2512
259
17.9
391
27.2
214
14.8
973
67.3
441
30.7
605
42.1
1446
1437
Nonstandard - All †
(*)
(*)
Standard ELL O
nly
2519
2514
815.4
11
23.4
11
21.2
33
63.5
12
25.5
24
51.1
52
47
Nonstandard ELL O
nly †
(*)
(*)
* <
10 students assessed
Page 1 of 2
† Results for these students are invalid and not reported.
Note: See reverse for additional inform
ation
() These students are not included in "All Students."
Attachment 8.C
432
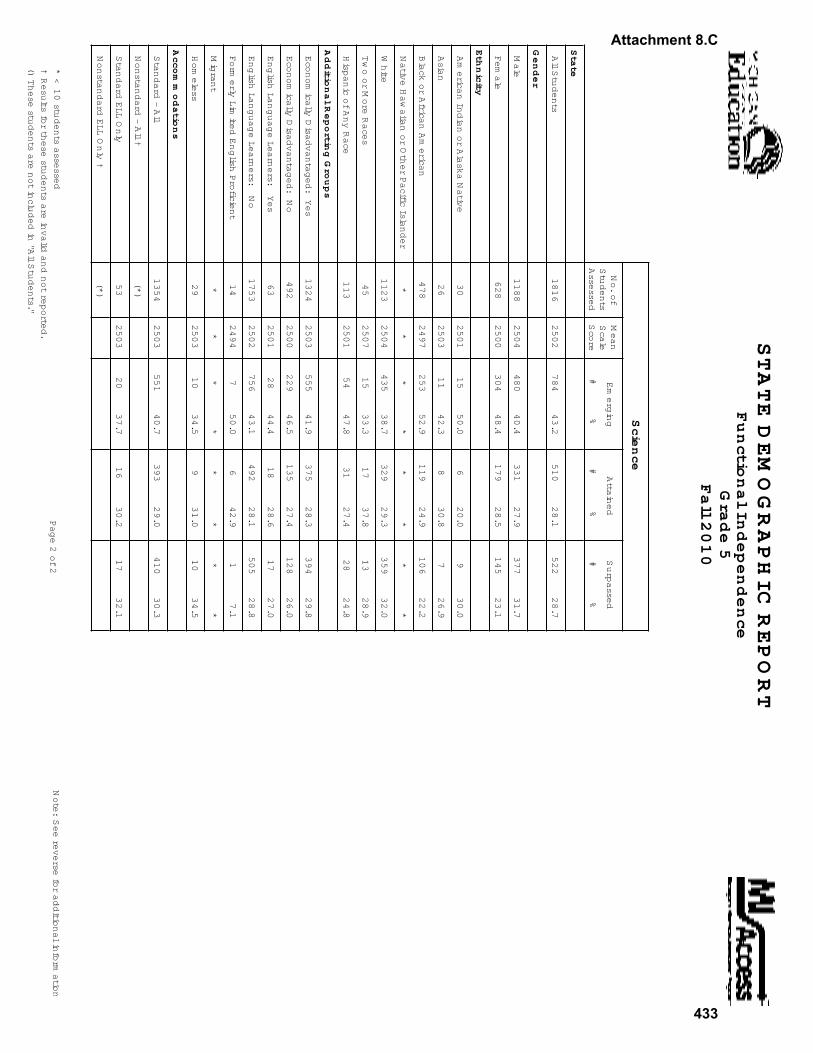
Fall 2
01
0
STA
TE D
EM
OG
RA
PH
IC
R
EP
OR
T
Grad
e 5
Fu
nctio
nal In
dep
en
den
ce
No. of
Students
Assessed
Scale
Score
Surpassed
Attained
Em
erging
#%
#%
#%
Scien
ce
Mean
State
All Students
2502
784
43.2
510
28.1
522
28.7
1816
Gen
der
Male
2504
480
40.4
331
27.9
377
31.7
1188
Fem
ale
2500
304
48.4
179
28.5
145
23.1
628
Eth
nicity
Am
erican Indian or Alaska N
ative
2501
15
50.0
620.0
930.0
30
Asian
2503
11
42.3
830.8
726.9
26
Black or African Am
erican
2497
253
52.9
119
24.9
106
22.2
478
Native H
aw
aiian or O
ther Pacific Islander
**
**
**
**
White
2504
435
38.7
329
29.3
359
32.0
1123
Tw
o or M
ore Races
2507
15
33.3
17
37.8
13
28.9
45
Hispanic of Any Race
2501
54
47.8
31
27.4
28
24.8
113
Ad
ditio
nal R
ep
ortin
g G
ro
up
s
Econom
ically D
isadvantaged: Yes
2503
555
41.9
375
28.3
394
29.8
1324
Econom
ically D
isadvantaged: N
o2500
229
46.5
135
27.4
128
26.0
492
English Language Learners: Yes
2501
28
44.4
18
28.6
17
27.0
63
English Language Learners: N
o2502
756
43.1
492
28.1
505
28.8
1753
Form
erly Lim
ited English Proficient
2494
750.0
642.9
17.1
14
Migrant
**
**
**
**
Hom
eless
2503
10
34.5
931.0
10
34.5
29
Acco
mm
od
atio
ns
Standard - All
2503
551
40.7
393
29.0
410
30.3
1354
Nonstandard - All †
(*)
Standard ELL O
nly
2503
20
37.7
16
30.2
17
32.1
53
Nonstandard ELL O
nly †
(*)
* <
10 students assessed
Page 2 of 2
† Results for these students are invalid and not reported.
Note: See reverse for additional inform
ation
() These students are not included in "All Students."
Attachment 8.C
433
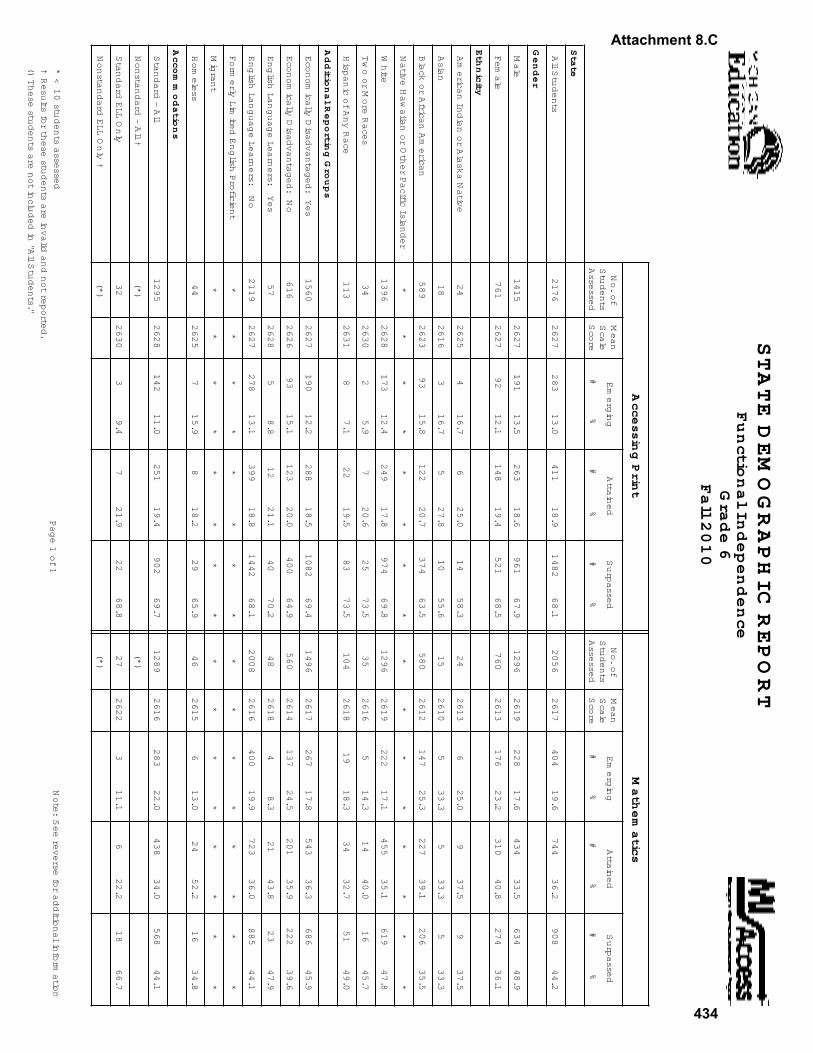
Fall 2
01
0
STA
TE D
EM
OG
RA
PH
IC
R
EP
OR
T
Grad
e 6
Fu
nctio
nal In
dep
en
den
ce
No. of
No. of
Students
Assessed
Scale
Score
Scale
Surpassed
Attained
Em
erging
#%
#%
#%
Accessin
g P
rin
tM
ath
em
atics
Students
Assessed
Mean
Mean
Score
Attained
Em
erging
#%
#%
#%
Surpassed
State
All Students
2627
2617
283
13.0
404
19.6
411
18.9
1482
68.1
744
36.2
908
44.2
2176
2056
Gen
der
Male
2627
2619
191
13.5
228
17.6
263
18.6
961
67.9
434
33.5
634
48.9
1415
1296
Fem
ale
2627
2613
92
12.1
176
23.2
148
19.4
521
68.5
310
40.8
274
36.1
761
760
Eth
nicity
Am
erican Indian or Alaska N
ative
2625
2613
416.7
625.0
625.0
14
58.3
937.5
937.5
24
24
Asian
2616
2610
316.7
533.3
527.8
10
55.6
533.3
533.3
18
15
Black or African Am
erican
2623
2612
93
15.8
147
25.3
122
20.7
374
63.5
227
39.1
206
35.5
589
580
Native H
aw
aiian or O
ther Pacific Islander
**
**
**
**
**
**
**
**
White
2628
2619
173
12.4
222
17.1
249
17.8
974
69.8
455
35.1
619
47.8
1396
1296
Tw
o or M
ore Races
2630
2616
25.9
514.3
720.6
25
73.5
14
40.0
16
45.7
34
35
Hispanic of Any Race
2631
2618
87.1
19
18.3
22
19.5
83
73.5
34
32.7
51
49.0
113
104
Ad
ditio
nal R
ep
ortin
g G
ro
up
s
Econom
ically D
isadvantaged: Yes
2627
2617
190
12.2
267
17.8
288
18.5
1082
69.4
543
36.3
686
45.9
1560
1496
Econom
ically D
isadvantaged: N
o2626
2614
93
15.1
137
24.5
123
20.0
400
64.9
201
35.9
222
39.6
616
560
English Language Learners: Yes
2628
2618
58.8
48.3
12
21.1
40
70.2
21
43.8
23
47.9
57
48
English Language Learners: N
o2627
2616
278
13.1
400
19.9
399
18.8
1442
68.1
723
36.0
885
44.1
2119
2008
Form
erly Lim
ited English Proficient
**
**
**
**
**
**
**
**
Migrant
**
**
**
**
**
**
**
**
Hom
eless
2625
2615
715.9
613.0
818.2
29
65.9
24
52.2
16
34.8
44
46
Acco
mm
od
atio
ns
Standard - All
2628
2616
142
11.0
283
22.0
251
19.4
902
69.7
438
34.0
568
44.1
1295
1289
Nonstandard - All †
(*)
(*)
Standard ELL O
nly
2630
2622
39.4
311.1
721.9
22
68.8
622.2
18
66.7
32
27
Nonstandard ELL O
nly †
(*)
(*)
* <
10 students assessed
Page 1 of 1
† Results for these students are invalid and not reported.
Note: See reverse for additional inform
ation
() These students are not included in "All Students."
Attachment 8.C
434

Fall 2
01
0
STA
TE D
EM
OG
RA
PH
IC
R
EP
OR
T
Grad
e 7
Fu
nctio
nal In
dep
en
den
ce
No. of
No. of
Students
Assessed
Scale
Score
Scale
Surpassed
Attained
Em
erging
#%
#%
#%
Accessin
g P
rin
tM
ath
em
atics
Students
Assessed
Mean
Mean
Score
Attained
Em
erging
#%
#%
#%
Surpassed
State
All Students
2730
2712
178
8.2
621
29.0
330
15.1
1676
76.7
596
27.9
921
43.1
2184
2138
Gen
der
Male
2729
2712
132
9.4
384
28.3
221
15.8
1049
74.8
359
26.5
612
45.2
1402
1355
Fem
ale
2732
2710
46
5.9
237
30.3
109
13.9
627
80.2
237
30.3
309
39.5
782
783
Eth
nicity
Am
erican Indian or Alaska N
ative
2741
2717
00.0
315.0
15.3
18
94.7
525.0
12
60.0
19
20
Asian
2725
2715
317.6
426.7
211.8
12
70.6
533.3
640.0
17
15
Black or African Am
erican
2725
2707
73
11.7
237
38.4
117
18.7
435
69.6
184
29.8
196
31.8
625
617
Native H
aw
aiian or O
ther Pacific Islander
**
**
**
**
**
**
**
**
White
2732
2714
92
6.8
327
24.7
185
13.6
1082
79.6
356
26.9
639
48.3
1359
1322
Tw
o or M
ore Races
2731
2712
24.0
16
30.8
816.0
40
80.0
11
21.2
25
48.1
50
52
Hispanic of Any Race
2728
2709
87.0
34
30.4
17
14.9
89
78.1
35
31.3
43
38.4
114
112
Ad
ditio
nal R
ep
ortin
g G
ro
up
s
Econom
ically D
isadvantaged: Yes
2730
2712
128
8.2
430
28.2
228
14.6
1207
77.2
429
28.2
664
43.6
1563
1523
Econom
ically D
isadvantaged: N
o2731
2711
50
8.1
191
31.1
102
16.4
469
75.5
167
27.2
257
41.8
621
615
English Language Learners: Yes
2726
2708
610.0
18
33.3
813.3
46
76.7
19
35.2
17
31.5
60
54
English Language Learners: N
o2730
2712
172
8.1
603
28.9
322
15.2
1630
76.7
577
27.7
904
43.4
2124
2084
Form
erly Lim
ited English Proficient
**
**
**
**
**
**
**
**
Migrant
**
**
**
**
**
**
**
**
Hom
eless
2733
2714
39.1
10
30.3
39.1
27
81.8
927.3
14
42.4
33
33
Acco
mm
od
atio
ns
Standard - All
2730
2711
90
6.9
361
28.4
200
15.4
1010
77.7
370
29.1
539
42.4
1300
1270
Nonstandard - All †
(*)
(*)
Standard ELL O
nly
2728
2710
37.9
928.1
513.2
30
78.9
13
40.6
10
31.3
38
32
Nonstandard ELL O
nly †
(*)
(*)
* <
10 students assessed
Page 1 of 2
† Results for these students are invalid and not reported.
Note: See reverse for additional inform
ation
() These students are not included in "All Students."
Attachment 8.C
435

Fall 2
01
0
STA
TE D
EM
OG
RA
PH
IC
R
EP
OR
T
Grad
e 7
Fu
nctio
nal In
dep
en
den
ce
No. of
Students
Assessed
Scale
Score
Surpassed
Attained
Em
erging
#%
#%
#%
Scien
ce
Mean
Students
Assessed
Earned
Points
Earned Point 2
Earned Point 1
Earned Point 0
#%
#%
#%
Exp
ressin
g Id
eas
Mean
Earned Point 3
#%
Earned Point 4
#%
No. of
State
All Students
**
**
**
**
357
17.0
74
3.5
72
3.4
375
17.8
1225
58.3
2103
2.0
Gen
der
Male
**
**
**
**
202
15.0
28
2.1
53
3.9
277
20.5
790
58.5
1350
1.9
Fem
ale
**
**
**
**
155
20.6
46
6.1
19
2.5
98
13.0
435
57.8
753
2.1
Eth
nicity
Am
erican Indian or Alaska N
ative
**
**
**
**
631.6
00.0
15.3
210.5
10
52.6
19
2.1
Asian
**
**
**
**
320.0
00.0
16.7
16.7
10
66.7
15
2.0
Black or African Am
erican
**
**
**
**
84
14.1
23
3.9
21
3.5
119
20.0
348
58.5
595
1.9
Native H
aw
aiian or O
ther Pacific Islander
**
**
**
**
**
**
**
**
**
**
White
**
**
**
**
241
18.3
47
3.6
45
3.4
220
16.7
762
57.9
1315
2.0
Tw
o or M
ore Races
**
**
**
**
612.0
12.0
24.0
11
22.0
30
60.0
50
1.9
Hispanic of Any Race
**
**
**
**
17
15.6
32.8
21.8
22
20.2
65
59.6
109
2.0
Ad
ditio
nal R
ep
ortin
g G
ro
up
s
Econom
ically D
isadvantaged: Yes
**
**
**
**
245
16.1
47
3.1
54
3.6
265
17.5
907
59.7
1518
2.0
Econom
ically D
isadvantaged: N
o*
**
**
**
*112
19.1
27
4.6
18
3.1
110
18.8
318
54.4
585
2.0
English Language Learners: Yes
**
**
**
**
12
20.3
35.1
00.0
915.3
35
59.3
59
2.2
English Language Learners: N
o*
**
**
**
*345
16.9
71
3.5
72
3.5
366
17.9
1190
58.2
2044
2.0
Form
erly Lim
ited English Proficient
**
**
**
**
**
**
**
**
**
**
Migrant
**
**
**
**
**
**
**
**
**
**
Hom
eless
**
**
**
**
721.2
13.0
00.0
824.2
17
51.5
33
2.0
Acco
mm
od
atio
ns
Standard - All
**
**
**
**
195
15.6
38
3.0
39
3.1
226
18.1
752
60.2
1250
2.0
Nonstandard - All †
(*)
**
**
**
**
**
**
Standard ELL O
nly
**
**
**
**
616.2
25.4
00.0
513.5
24
64.9
37
2.1
Nonstandard ELL O
nly †
(*)
**
**
**
**
**
**
* <
10 students assessed
Page 2 of 2
† Results for these students are invalid and not reported.
Note: See reverse for additional inform
ation
() These students are not included in "All Students."
Attachment 8.C
436

Fall 2
01
0
STA
TE D
EM
OG
RA
PH
IC
R
EP
OR
T
Grad
e 8
Fu
nctio
nal In
dep
en
den
ce
No. of
No. of
Students
Assessed
Scale
Score
Scale
Surpassed
Attained
Em
erging
#%
#%
#%
Accessin
g P
rin
tM
ath
em
atics
Students
Assessed
Mean
Mean
Score
Attained
Em
erging
#%
#%
#%
Surpassed
State
All Students
2833
2816
181
8.4
438
21.0
488
22.5
1496
69.1
660
31.7
984
47.3
2165
2082
Gen
der
Male
2833
2817
139
9.8
255
19.3
322
22.8
951
67.4
391
29.7
672
51.0
1412
1318
Fem
ale
2834
2813
42
5.6
183
24.0
166
22.0
545
72.4
269
35.2
312
40.8
753
764
Eth
nicity
Am
erican Indian or Alaska N
ative
2838
2816
27.7
522.7
27.7
22
84.6
522.7
12
54.5
26
22
Asian
2830
2817
00.0
210.0
631.6
13
68.4
630.0
12
60.0
19
20
Black or African Am
erican
2829
2812
75
12.2
163
27.3
153
24.8
388
63.0
198
33.2
236
39.5
616
597
Native H
aw
aiian or O
ther Pacific Islander
**
**
**
**
**
**
**
**
White
2836
2817
89
6.5
235
17.9
292
21.3
987
72.1
417
31.8
661
50.3
1368
1313
Tw
o or M
ore Races
2839
2816
13.8
520.0
519.2
20
76.9
832.0
12
48.0
26
25
Hispanic of Any Race
2829
2814
14
13.0
28
27.2
29
26.9
65
60.2
26
25.2
49
47.6
108
103
Ad
ditio
nal R
ep
ortin
g G
ro
up
s
Econom
ically D
isadvantaged: Yes
2833
2815
127
8.7
279
19.9
330
22.5
1010
68.8
458
32.7
662
47.3
1467
1399
Econom
ically D
isadvantaged: N
o2834
2816
54
7.7
159
23.3
158
22.6
486
69.6
202
29.6
322
47.1
698
683
English Language Learners: Yes
2826
2811
610.5
18
32.7
14
24.6
37
64.9
12
21.8
25
45.5
57
55
English Language Learners: N
o2834
2816
175
8.3
420
20.7
474
22.5
1459
69.2
648
32.0
959
47.3
2108
2027
Form
erly Lim
ited English Proficient
2839
*1
10.0
**
220.0
770.0
**
**
10
*
Migrant
**
**
**
**
**
**
**
**
Hom
eless
2835
2812
414.8
621.4
311.1
20
74.1
12
42.9
10
35.7
27
28
Acco
mm
od
atio
ns
Standard - All
2833
2815
86
7.3
232
20.6
276
23.4
819
69.3
361
32.1
533
47.3
1181
1126
Nonstandard - All †
(*)
(*)
Standard ELL O
nly
2827
2813
38.6
13
37.1
925.7
23
65.7
38.6
19
54.3
35
35
Nonstandard ELL O
nly †
(*)
(*)
* <
10 students assessed
Page 1 of 2
† Results for these students are invalid and not reported.
Note: See reverse for additional inform
ation
() These students are not included in "All Students."
Attachment 8.C
437

Fall 2
01
0
STA
TE D
EM
OG
RA
PH
IC
R
EP
OR
T
Grad
e 8
Fu
nctio
nal In
dep
en
den
ce
No. of
Students
Assessed
Scale
Score
Surpassed
Attained
Em
erging
#%
#%
#%
Scien
ce
Mean
State
All Students
2799
1077
55.1
316
16.2
563
28.8
1956
Gen
der
Male
2800
650
52.1
187
15.0
410
32.9
1247
Fem
ale
2796
427
60.2
129
18.2
153
21.6
709
Eth
nicity
Am
erican Indian or Alaska N
ative
2801
11
52.4
523.8
523.8
21
Asian
2793
11
57.9
421.1
421.1
19
Black or African Am
erican
2790
386
67.8
72
12.7
111
19.5
569
Native H
aw
aiian or O
ther Pacific Islander
**
**
**
**
White
2803
589
48.2
213
17.4
421
34.4
1223
Tw
o or M
ore Races
2804
936.0
936.0
728.0
25
Hispanic of Any Race
2792
69
71.1
13
13.4
15
15.5
97
Ad
ditio
nal R
ep
ortin
g G
ro
up
s
Econom
ically D
isadvantaged: Yes
2798
736
56.0
206
15.7
373
28.4
1315
Econom
ically D
isadvantaged: N
o2799
341
53.2
110
17.2
190
29.6
641
English Language Learners: Yes
2786
36
75.0
510.4
714.6
48
English Language Learners: N
o2799
1041
54.6
311
16.3
556
29.1
1908
Form
erly Lim
ited English Proficient
**
**
**
**
Migrant
**
**
**
**
Hom
eless
2794
14
60.9
28.7
730.4
23
Acco
mm
od
atio
ns
Standard - All
2799
621
54.5
188
16.5
331
29.0
1140
Nonstandard - All †
(*)
Standard ELL O
nly
2785
23
74.2
516.1
39.7
31
Nonstandard ELL O
nly †
(*)
* <
10 students assessed
Page 2 of 2
† Results for these students are invalid and not reported.
Note: See reverse for additional inform
ation
() These students are not included in "All Students."
Attachment 8.C
438

Fall 2
01
0
STA
TE D
EM
OG
RA
PH
IC
R
EP
OR
T
Grad
e 3
Su
pp
orted
In
dep
en
den
ce
No. of
No. of
Students
Assessed
Earned
Points
Earned
Surpassed
Attained
Em
erging
#%
#%
#%
En
glish
Lan
gu
ag
e A
rts
Math
em
atics
Students
Assessed
Mean
Mean
Points
Attained
Em
erging
#%
#%
#%
Surpassed
State
All Students
37
36
76
14.8
64
12.5
225
43.9
212
41.3
231
45.2
216
42.3
513
511
Gen
der
Male
37
35
54
15.0
49
13.6
167
46.4
139
38.6
175
48.6
136
37.8
360
360
Fem
ale
39
39
22
14.4
15
9.9
58
37.9
73
47.7
56
37.1
80
53.0
153
151
Eth
nicity
Am
erican Indian or Alaska N
ative
**
**
**
**
**
**
**
**
Asian
**
**
**
**
**
**
**
**
Black or African Am
erican
37
37
18
15.0
16
13.6
51
42.5
51
42.5
48
40.7
54
45.8
120
118
Native H
aw
aiian or O
ther Pacific Islander
**
**
**
**
**
**
**
**
White
38
36
49
14.1
41
11.8
157
45.1
142
40.8
163
46.8
144
41.4
348
348
Tw
o or M
ore Races
**
**
**
**
**
**
**
**
Hispanic of Any Race
38
37
621.4
310.7
828.6
14
50.0
13
46.4
12
42.9
28
28
Ad
ditio
nal R
ep
ortin
g G
ro
up
s
Econom
ically D
isadvantaged: Yes
38
37
38
13.5
36
12.9
113
40.1
131
46.5
113
40.4
131
46.8
282
280
Econom
ically D
isadvantaged: N
o36
35
38
16.5
28
12.1
112
48.5
81
35.1
118
51.1
85
36.8
231
231
English Language Learners: Yes
**
**
**
**
**
**
**
**
English Language Learners: N
o37
36
75
14.9
64
12.7
221
43.8
208
41.3
226
45.0
212
42.2
504
502
Form
erly Lim
ited English Proficient
**
**
**
**
**
**
**
**
Migrant
**
**
**
**
**
**
**
**
Hom
eless
**
**
**
**
**
**
**
**
* <
10 students assessed
Page 1 of 1
† Results for these students are invalid and not reported.
Note: See reverse for additional inform
ation
() These students are not included in "All Students."
Attachment 8.D
439

Fall 2
01
0
STA
TE D
EM
OG
RA
PH
IC
R
EP
OR
T
Grad
e 4
Su
pp
orted
In
dep
en
den
ce
No. of
No. of
Students
Assessed
Earned
Points
Earned
Surpassed
Attained
Em
erging
#%
#%
#%
En
glish
Lan
gu
ag
e A
rts
Math
em
atics
Students
Assessed
Mean
Mean
Points
Attained
Em
erging
#%
#%
#%
Surpassed
State
All Students
40
38
114
22.2
85
16.6
210
40.9
189
36.8
217
42.5
209
40.9
513
511
Gen
der
Male
40
38
77
21.9
62
17.7
146
41.6
128
36.5
153
43.7
135
38.6
351
350
Fem
ale
40
39
37
22.8
23
14.3
64
39.5
61
37.7
64
39.8
74
46.0
162
161
Eth
nicity
Am
erican Indian or Alaska N
ative
**
**
**
**
**
**
**
**
Asian
44
40
216.7
216.7
325.0
758.3
325.0
758.3
12
12
Black or African Am
erican
39
39
32
25.4
23
18.4
48
38.1
46
36.5
47
37.6
55
44.0
126
125
Native H
aw
aiian or O
ther Pacific Islander
**
**
**
**
**
**
**
**
White
40
37
74
22.2
56
16.9
143
42.9
116
34.8
152
45.8
124
37.3
333
332
Tw
o or M
ore Races
**
**
**
**
**
**
**
**
Hispanic of Any Race
42
40
516.1
412.9
12
38.7
14
45.2
11
35.5
16
51.6
31
31
Ad
ditio
nal R
ep
ortin
g G
ro
up
s
Econom
ically D
isadvantaged: Yes
40
39
57
20.1
44
15.6
118
41.7
108
38.2
114
40.4
124
44.0
283
282
Econom
ically D
isadvantaged: N
o39
37
57
24.8
41
17.9
92
40.0
81
35.2
103
45.0
85
37.1
230
229
English Language Learners: Yes
**
**
**
**
**
**
**
**
English Language Learners: N
o40
38
113
22.4
84
16.7
206
40.8
186
36.8
213
42.3
206
41.0
505
503
Form
erly Lim
ited English Proficient
**
**
**
**
**
**
**
**
Migrant
**
**
**
**
**
**
**
**
Hom
eless
**
**
**
**
**
**
**
**
* <
10 students assessed
Page 1 of 1
† Results for these students are invalid and not reported.
Note: See reverse for additional inform
ation
() These students are not included in "All Students."
Attachment 8.D
440

Fall 2
01
0
STA
TE D
EM
OG
RA
PH
IC
R
EP
OR
T
Grad
e 5
Su
pp
orted
In
dep
en
den
ce
No. of
No. of
Students
Assessed
Earned
Points
Earned
Surpassed
Attained
Em
erging
#%
#%
#%
En
glish
Lan
gu
ag
e A
rts
Math
em
atics
Students
Assessed
Mean
Mean
Points
Attained
Em
erging
#%
#%
#%
Surpassed
State
All Students
42
40
121
24.8
75
15.4
195
40.0
172
35.2
235
48.4
176
36.2
488
486
Gen
der
Male
42
41
82
24.3
52
15.5
135
39.9
121
35.8
161
47.9
123
36.6
338
336
Fem
ale
42
40
39
26.0
23
15.3
60
40.0
51
34.0
74
49.3
53
35.3
150
150
Eth
nicity
Am
erican Indian or Alaska N
ative
**
**
**
**
**
**
**
**
Asian
**
**
**
**
**
**
**
**
Black or African Am
erican
42
41
34
25.8
20
15.3
51
38.6
47
35.6
56
42.7
55
42.0
132
131
Native H
aw
aiian or O
ther Pacific Islander
**
**
**
**
**
**
**
**
White
42
40
82
26.4
51
16.5
121
38.9
108
34.7
156
50.3
103
33.2
311
310
Tw
o or M
ore Races
**
**
**
**
**
**
**
**
Hispanic of Any Race
45
45
39.7
26.5
16
51.6
12
38.7
14
45.2
15
48.4
31
31
Ad
ditio
nal R
ep
ortin
g G
ro
up
s
Econom
ically D
isadvantaged: Yes
44
43
52
19.5
32
12.0
107
40.1
108
40.4
121
45.5
113
42.5
267
266
Econom
ically D
isadvantaged: N
o39
37
69
31.2
43
19.5
88
39.8
64
29.0
114
51.8
63
28.6
221
220
English Language Learners: Yes
**
**
**
**
**
**
**
**
English Language Learners: N
o42
40
120
25.1
75
15.7
189
39.5
170
35.5
230
48.2
172
36.1
479
477
Form
erly Lim
ited English Proficient
**
**
**
**
**
**
**
**
Migrant
**
**
**
**
**
**
**
**
Hom
eless
**
**
**
**
**
**
**
**
* <
10 students assessed
Page 1 of 2
† Results for these students are invalid and not reported.
Note: See reverse for additional inform
ation
() These students are not included in "All Students."
Attachment 8.D
441

Fall 2
01
0
STA
TE D
EM
OG
RA
PH
IC
R
EP
OR
T
Grad
e 5
Su
pp
orted
In
dep
en
den
ce
No. of
Students
Assessed
Earned
Points
Surpassed
Attained
Em
erging
#%
#%
#%
Scien
ce
Mean
State
All Students
47
102
21.8
284
60.7
82
17.5
468
Gen
der
Male
47
72
22.5
188
58.8
60
18.8
320
Fem
ale
48
30
20.3
96
64.9
22
14.9
148
Eth
nicity
Am
erican Indian or Alaska N
ative
**
**
**
**
Asian
**
**
**
**
Black or African Am
erican
46
32
25.4
68
54.0
26
20.6
126
Native H
aw
aiian or O
ther Pacific Islander
**
**
**
**
White
48
64
21.4
184
61.5
51
17.1
299
Tw
o or M
ore Races
**
**
**
**
Hispanic of Any Race
49
39.7
24
77.4
412.9
31
Ad
ditio
nal R
ep
ortin
g G
ro
up
s
Econom
ically D
isadvantaged: Yes
50
37
14.3
162
62.8
59
22.9
258
Econom
ically D
isadvantaged: N
o44
65
31.0
122
58.1
23
11.0
210
English Language Learners: Yes
**
**
**
**
English Language Learners: N
o47
101
22.0
277
60.3
81
17.6
459
Form
erly Lim
ited English Proficient
**
**
**
**
Migrant
**
**
**
**
Hom
eless
**
**
**
**
* <
10 students assessed
Page 2 of 2
† Results for these students are invalid and not reported.
Note: See reverse for additional inform
ation
() These students are not included in "All Students."
Attachment 8.D
442

Fall 2
01
0
STA
TE D
EM
OG
RA
PH
IC
R
EP
OR
T
Grad
e 6
Su
pp
orted
In
dep
en
den
ce
No. of
No. of
Students
Assessed
Earned
Points
Earned
Surpassed
Attained
Em
erging
#%
#%
#%
En
glish
Lan
gu
ag
e A
rts
Math
em
atics
Students
Assessed
Mean
Mean
Points
Attained
Em
erging
#%
#%
#%
Surpassed
State
All Students
36
32
104
22.2
66
14.1
164
35.0
201
42.9
227
48.5
175
37.4
469
468
Gen
der
Male
36
32
67
22.5
39
13.1
107
35.9
124
41.6
148
49.7
111
37.2
298
298
Fem
ale
37
31
37
21.6
27
15.9
57
33.3
77
45.0
79
46.5
64
37.6
171
170
Eth
nicity
Am
erican Indian or Alaska N
ative
**
**
**
**
**
**
**
**
Asian
36
37
212.5
00.0
10
62.5
425.0
743.8
956.3
16
16
Black or African Am
erican
34
30
24
24.5
20
20.4
39
39.8
35
35.7
44
44.9
34
34.7
98
98
Native H
aw
aiian or O
ther Pacific Islander
**
**
**
**
**
**
**
**
White
37
32
65
20.4
38
11.9
103
32.4
150
47.2
157
49.4
123
38.7
318
318
Tw
o or M
ore Races
**
**
**
**
**
**
**
**
Hispanic of Any Race
33
29
829.6
725.9
12
44.4
725.9
14
51.9
622.2
27
27
Ad
ditio
nal R
ep
ortin
g G
ro
up
s
Econom
ically D
isadvantaged: Yes
36
32
54
20.5
41
15.5
95
36.0
115
43.6
121
45.8
102
38.6
264
264
Econom
ically D
isadvantaged: N
o35
31
50
24.4
25
12.3
69
33.7
86
42.0
106
52.0
73
35.8
205
204
English Language Learners: Yes
**
**
**
**
**
**
**
**
English Language Learners: N
o36
32
102
22.1
63
13.7
160
34.7
199
43.2
225
48.9
172
37.4
461
460
Form
erly Lim
ited English Proficient
**
**
**
**
**
**
**
**
Migrant
**
**
**
**
**
**
**
**
Hom
eless
**
**
**
**
**
**
**
**
* <
10 students assessed
Page 1 of 1
† Results for these students are invalid and not reported.
Note: See reverse for additional inform
ation
() These students are not included in "All Students."
Attachment 8.D
443

Fall 2
01
0
STA
TE D
EM
OG
RA
PH
IC
R
EP
OR
T
Grad
e 7
Su
pp
orted
In
dep
en
den
ce
No. of
No. of
Students
Assessed
Earned
Points
Earned
Surpassed
Attained
Em
erging
#%
#%
#%
En
glish
Lan
gu
ag
e A
rts
Math
em
atics
Students
Assessed
Mean
Mean
Points
Attained
Em
erging
#%
#%
#%
Surpassed
State
All Students
39
34
104
21.3
80
16.5
190
38.9
194
39.8
232
47.8
173
35.7
488
485
Gen
der
Male
38
35
74
23.0
53
16.6
130
40.4
118
36.6
146
45.6
121
37.8
322
320
Fem
ale
41
33
30
18.1
27
16.4
60
36.1
76
45.8
86
52.1
52
31.5
166
165
Eth
nicity
Am
erican Indian or Alaska N
ative
**
**
**
**
**
**
**
**
Asian
**
**
**
**
**
**
**
**
Black or African Am
erican
39
34
26
22.2
21
17.9
44
37.6
47
40.2
55
47.0
41
35.0
117
117
Native H
aw
aiian or O
ther Pacific Islander
**
**
**
**
**
**
**
**
White
39
35
67
20.7
48
14.9
129
39.8
128
39.5
155
48.0
120
37.2
324
323
Tw
o or M
ore Races
**
**
**
**
**
**
**
**
Hispanic of Any Race
40
33
622.2
622.2
725.9
14
51.9
11
40.7
10
37.0
27
27
Ad
ditio
nal R
ep
ortin
g G
ro
up
s
Econom
ically D
isadvantaged: Yes
41
36
51
19.2
33
12.5
95
35.8
119
44.9
120
45.3
112
42.3
265
265
Econom
ically D
isadvantaged: N
o37
32
53
23.8
47
21.4
95
42.6
75
33.6
112
50.9
61
27.7
223
220
English Language Learners: Yes
39
*0
0.0
**
880.0
220.0
**
**
10
*
English Language Learners: N
o39
34
104
21.8
80
16.8
182
38.1
192
40.2
227
47.7
169
35.5
478
476
Form
erly Lim
ited English Proficient
**
**
**
**
**
**
**
**
Migrant
**
**
**
**
**
**
**
**
Hom
eless
**
**
**
**
**
**
**
**
* <
10 students assessed
Page 1 of 1
† Results for these students are invalid and not reported.
Note: See reverse for additional inform
ation
() These students are not included in "All Students."
Attachment 8.D
444

Fall 2
01
0
STA
TE D
EM
OG
RA
PH
IC
R
EP
OR
T
Grad
e 8
Su
pp
orted
In
dep
en
den
ce
No. of
No. of
Students
Assessed
Earned
Points
Earned
Surpassed
Attained
Em
erging
#%
#%
#%
En
glish
Lan
gu
ag
e A
rts
Math
em
atics
Students
Assessed
Mean
Mean
Points
Attained
Em
erging
#%
#%
#%
Surpassed
State
All Students
41
37
100
19.6
61
11.9
197
38.6
214
41.9
240
46.9
211
41.2
511
512
Gen
der
Male
41
37
70
21.9
36
11.3
119
37.2
131
40.9
152
47.5
132
41.3
320
320
Fem
ale
42
36
30
15.7
25
13.0
78
40.8
83
43.5
88
45.8
79
41.1
191
192
Eth
nicity
Am
erican Indian or Alaska N
ative
**
**
**
**
**
**
**
**
Asian
34
34
330.0
110.0
660.0
110.0
770.0
220.0
10
10
Black or African Am
erican
42
38
18
16.1
13
11.5
44
39.3
50
44.6
45
39.8
55
48.7
112
113
Native H
aw
aiian or O
ther Pacific Islander
**
**
**
**
**
**
**
**
White
41
37
69
19.5
41
11.6
135
38.2
149
42.2
170
48.2
142
40.2
353
353
Tw
o or M
ore Races
**
**
**
**
**
**
**
**
Hispanic of Any Race
37
32
936.0
624.0
624.0
10
40.0
10
40.0
936.0
25
25
Ad
ditio
nal R
ep
ortin
g G
ro
up
s
Econom
ically D
isadvantaged: Yes
43
39
43
15.8
20
7.3
101
37.0
129
47.3
127
46.5
126
46.2
273
273
Econom
ically D
isadvantaged: N
o39
35
57
23.9
41
17.2
96
40.3
85
35.7
113
47.3
85
35.6
238
239
English Language Learners: Yes
**
**
**
**
**
**
**
**
English Language Learners: N
o41
37
100
19.9
61
12.1
194
38.6
208
41.4
235
46.7
207
41.2
502
503
Form
erly Lim
ited English Proficient
**
**
**
**
**
**
**
**
Migrant
**
**
**
**
**
**
**
**
Hom
eless
**
**
**
**
**
**
**
**
* <
10 students assessed
Page 1 of 2
† Results for these students are invalid and not reported.
Note: See reverse for additional inform
ation
() These students are not included in "All Students."
Attachment 8.D
445

Fall 2
01
0
STA
TE D
EM
OG
RA
PH
IC
R
EP
OR
T
Grad
e 8
Su
pp
orted
In
dep
en
den
ce
No. of
Students
Assessed
Earned
Points
Surpassed
Attained
Em
erging
#%
#%
#%
Scien
ce
Mean
State
All Students
46
132
26.5
231
46.4
135
27.1
498
Gen
der
Male
46
86
27.7
133
42.8
92
29.6
311
Fem
ale
46
46
24.6
98
52.4
43
23.0
187
Eth
nicity
Am
erican Indian or Alaska N
ative
**
**
**
**
Asian
**
**
**
**
Black or African Am
erican
46
24
22.2
58
53.7
26
24.1
108
Native H
aw
aiian or O
ther Pacific Islander
**
**
**
**
White
47
89
25.7
159
46.0
98
28.3
346
Tw
o or M
ore Races
**
**
**
**
Hispanic of Any Race
40
10
41.7
729.2
729.2
24
Ad
ditio
nal R
ep
ortin
g G
ro
up
s
Econom
ically D
isadvantaged: Yes
49
54
20.6
124
47.3
84
32.1
262
Econom
ically D
isadvantaged: N
o44
78
33.1
107
45.3
51
21.6
236
English Language Learners: Yes
**
**
**
**
English Language Learners: N
o46
129
26.4
227
46.4
133
27.2
489
Form
erly Lim
ited English Proficient
**
**
**
**
Migrant
**
**
**
**
Hom
eless
**
**
**
**
* <
10 students assessed
Page 2 of 2
† Results for these students are invalid and not reported.
Note: See reverse for additional inform
ation
() These students are not included in "All Students."
Attachment 8.D
446
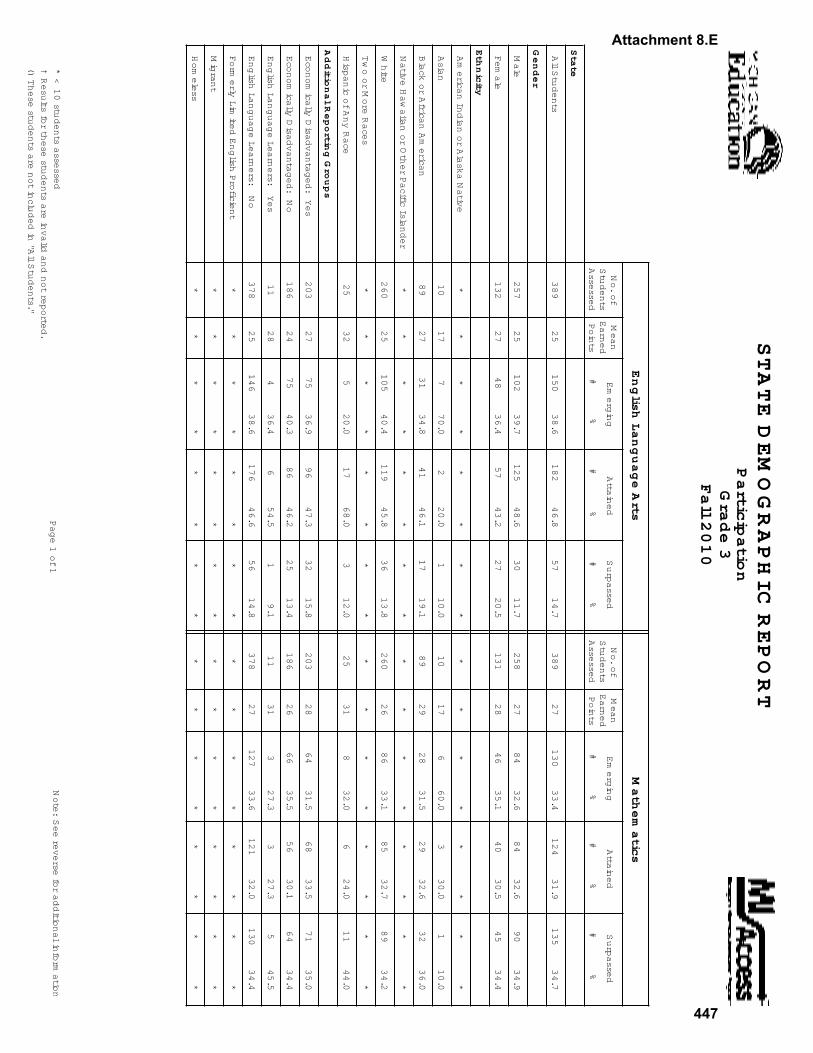
Fall 2
01
0
STA
TE D
EM
OG
RA
PH
IC
R
EP
OR
T
Grad
e 3
Particip
atio
n
No. of
No. of
Students
Assessed
Earned
Points
Earned
Surpassed
Attained
Em
erging
#%
#%
#%
En
glish
Lan
gu
ag
e A
rts
Math
em
atics
Students
Assessed
Mean
Mean
Points
Attained
Em
erging
#%
#%
#%
Surpassed
State
All Students
25
27
150
38.6
130
33.4
182
46.8
57
14.7
124
31.9
135
34.7
389
389
Gen
der
Male
25
27
102
39.7
84
32.6
125
48.6
30
11.7
84
32.6
90
34.9
257
258
Fem
ale
27
28
48
36.4
46
35.1
57
43.2
27
20.5
40
30.5
45
34.4
132
131
Eth
nicity
Am
erican Indian or Alaska N
ative
**
**
**
**
**
**
**
**
Asian
17
17
770.0
660.0
220.0
110.0
330.0
110.0
10
10
Black or African Am
erican
27
29
31
34.8
28
31.5
41
46.1
17
19.1
29
32.6
32
36.0
89
89
Native H
aw
aiian or O
ther Pacific Islander
**
**
**
**
**
**
**
**
White
25
26
105
40.4
86
33.1
119
45.8
36
13.8
85
32.7
89
34.2
260
260
Tw
o or M
ore Races
**
**
**
**
**
**
**
**
Hispanic of Any Race
32
31
520.0
832.0
17
68.0
312.0
624.0
11
44.0
25
25
Ad
ditio
nal R
ep
ortin
g G
ro
up
s
Econom
ically D
isadvantaged: Yes
27
28
75
36.9
64
31.5
96
47.3
32
15.8
68
33.5
71
35.0
203
203
Econom
ically D
isadvantaged: N
o24
26
75
40.3
66
35.5
86
46.2
25
13.4
56
30.1
64
34.4
186
186
English Language Learners: Yes
28
31
436.4
327.3
654.5
19.1
327.3
545.5
11
11
English Language Learners: N
o25
27
146
38.6
127
33.6
176
46.6
56
14.8
121
32.0
130
34.4
378
378
Form
erly Lim
ited English Proficient
**
**
**
**
**
**
**
**
Migrant
**
**
**
**
**
**
**
**
Hom
eless
**
**
**
**
**
**
**
**
* <
10 students assessed
Page 1 of 1
† Results for these students are invalid and not reported.
Note: See reverse for additional inform
ation
() These students are not included in "All Students."
Attachment 8.E
447

Fall 2
01
0
STA
TE D
EM
OG
RA
PH
IC
R
EP
OR
T
Grad
e 4
Particip
atio
n
No. of
No. of
Students
Assessed
Earned
Points
Earned
Surpassed
Attained
Em
erging
#%
#%
#%
En
glish
Lan
gu
ag
e A
rts
Math
em
atics
Students
Assessed
Mean
Mean
Points
Attained
Em
erging
#%
#%
#%
Surpassed
State
All Students
27
29
122
36.1
112
33.1
155
45.9
61
18.0
120
35.5
106
31.4
338
338
Gen
der
Male
27
30
86
37.7
73
32.0
99
43.4
43
18.9
83
36.4
72
31.6
228
228
Fem
ale
28
28
36
32.7
39
35.5
56
50.9
18
16.4
37
33.6
34
30.9
110
110
Eth
nicity
Am
erican Indian or Alaska N
ative
**
**
**
**
**
**
**
**
Asian
**
**
**
**
**
**
**
**
Black or African Am
erican
30
30
26
33.8
26
33.8
33
42.9
18
23.4
26
33.8
25
32.5
77
77
Native H
aw
aiian or O
ther Pacific Islander
**
**
**
**
**
**
**
**
White
27
29
80
35.9
69
31.1
107
48.0
36
16.1
83
37.4
70
31.5
223
222
Tw
o or M
ore Races
**
**
**
**
**
**
**
**
Hispanic of Any Race
25
29
10
40.0
10
40.0
10
40.0
520.0
728.0
832.0
25
25
Ad
ditio
nal R
ep
ortin
g G
ro
up
s
Econom
ically D
isadvantaged: Yes
29
31
59
33.5
54
30.9
80
45.5
37
21.0
54
30.9
67
38.3
176
175
Econom
ically D
isadvantaged: N
o26
27
63
38.9
58
35.6
75
46.3
24
14.8
66
40.5
39
23.9
162
163
English Language Learners: Yes
35
33
323.1
538.5
538.5
538.5
215.4
646.2
13
13
English Language Learners: N
o27
29
119
36.6
107
32.9
150
46.2
56
17.2
118
36.3
100
30.8
325
325
Form
erly Lim
ited English Proficient
**
**
**
**
**
**
**
**
Migrant
**
**
**
**
**
**
**
**
Hom
eless
**
**
**
**
**
**
**
**
* <
10 students assessed
Page 1 of 1
† Results for these students are invalid and not reported.
Note: See reverse for additional inform
ation
() These students are not included in "All Students."
Attachment 8.E
448

Fall 2
01
0
STA
TE D
EM
OG
RA
PH
IC
R
EP
OR
T
Grad
e 5
Particip
atio
n
No. of
No. of
Students
Assessed
Earned
Points
Earned
Surpassed
Attained
Em
erging
#%
#%
#%
En
glish
Lan
gu
ag
e A
rts
Math
em
atics
Students
Assessed
Mean
Mean
Points
Attained
Em
erging
#%
#%
#%
Surpassed
State
All Students
25
26
140
43.1
145
44.8
138
42.5
47
14.5
108
33.3
71
21.9
325
324
Gen
der
Male
25
26
90
42.1
92
43.0
94
43.9
30
14.0
73
34.1
49
22.9
214
214
Fem
ale
26
26
50
45.0
53
48.2
44
39.6
17
15.3
35
31.8
22
20.0
111
110
Eth
nicity
Am
erican Indian or Alaska N
ative
**
**
**
**
**
**
**
**
Asian
**
**
**
**
**
**
**
**
Black or African Am
erican
27
27
33
38.8
39
46.4
36
42.4
16
18.8
22
26.2
23
27.4
85
84
Native H
aw
aiian or O
ther Pacific Islander
**
**
**
**
**
**
**
**
White
25
26
92
44.0
90
43.1
88
42.1
29
13.9
76
36.4
43
20.6
209
209
Tw
o or M
ore Races
**
**
**
**
**
**
**
**
Hispanic of Any Race
18
23
12
63.2
11
57.9
631.6
15.3
526.3
315.8
19
19
Ad
ditio
nal R
ep
ortin
g G
ro
up
s
Econom
ically D
isadvantaged: Yes
25
26
74
43.5
74
43.8
69
40.6
27
15.9
60
35.5
35
20.7
170
169
Econom
ically D
isadvantaged: N
o26
26
66
42.6
71
45.8
69
44.5
20
12.9
48
31.0
36
23.2
155
155
English Language Learners: Yes
28
30
433.3
541.7
758.3
18.3
433.3
325.0
12
12
English Language Learners: N
o25
26
136
43.5
140
44.9
131
41.9
46
14.7
104
33.3
68
21.8
313
312
Form
erly Lim
ited English Proficient
**
**
**
**
**
**
**
**
Migrant
**
**
**
**
**
**
**
**
Hom
eless
**
**
**
**
**
**
**
**
* <
10 students assessed
Page 1 of 2
† Results for these students are invalid and not reported.
Note: See reverse for additional inform
ation
() These students are not included in "All Students."
Attachment 8.E
449
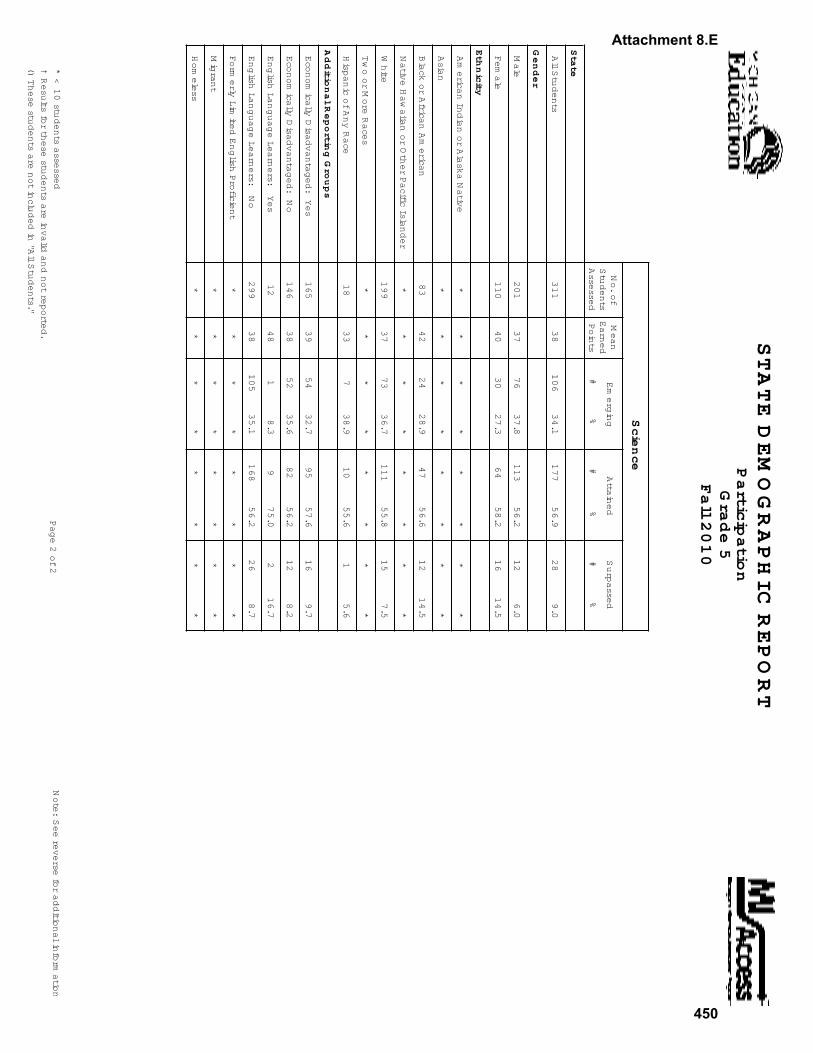
Fall 2
01
0
STA
TE D
EM
OG
RA
PH
IC
R
EP
OR
T
Grad
e 5
Particip
atio
n
No. of
Students
Assessed
Earned
Points
Surpassed
Attained
Em
erging
#%
#%
#%
Scien
ce
Mean
State
All Students
38
106
34.1
177
56.9
28
9.0
311
Gen
der
Male
37
76
37.8
113
56.2
12
6.0
201
Fem
ale
40
30
27.3
64
58.2
16
14.5
110
Eth
nicity
Am
erican Indian or Alaska N
ative
**
**
**
**
Asian
**
**
**
**
Black or African Am
erican
42
24
28.9
47
56.6
12
14.5
83
Native H
aw
aiian or O
ther Pacific Islander
**
**
**
**
White
37
73
36.7
111
55.8
15
7.5
199
Tw
o or M
ore Races
**
**
**
**
Hispanic of Any Race
33
738.9
10
55.6
15.6
18
Ad
ditio
nal R
ep
ortin
g G
ro
up
s
Econom
ically D
isadvantaged: Yes
39
54
32.7
95
57.6
16
9.7
165
Econom
ically D
isadvantaged: N
o38
52
35.6
82
56.2
12
8.2
146
English Language Learners: Yes
48
18.3
975.0
216.7
12
English Language Learners: N
o38
105
35.1
168
56.2
26
8.7
299
Form
erly Lim
ited English Proficient
**
**
**
**
Migrant
**
**
**
**
Hom
eless
**
**
**
**
* <
10 students assessed
Page 2 of 2
† Results for these students are invalid and not reported.
Note: See reverse for additional inform
ation
() These students are not included in "All Students."
Attachment 8.E
450

Fall 2
01
0
STA
TE D
EM
OG
RA
PH
IC
R
EP
OR
T
Grad
e 6
Particip
atio
n
No. of
No. of
Students
Assessed
Earned
Points
Earned
Surpassed
Attained
Em
erging
#%
#%
#%
En
glish
Lan
gu
ag
e A
rts
Math
em
atics
Students
Assessed
Mean
Mean
Points
Attained
Em
erging
#%
#%
#%
Surpassed
State
All Students
25
27
119
39.4
126
41.9
124
41.1
59
19.5
104
34.6
71
23.6
302
301
Gen
der
Male
26
28
67
36.6
75
41.2
79
43.2
37
20.2
59
32.4
48
26.4
183
182
Fem
ale
24
26
52
43.7
51
42.9
45
37.8
22
18.5
45
37.8
23
19.3
119
119
Eth
nicity
Am
erican Indian or Alaska N
ative
**
**
**
**
**
**
**
**
Asian
**
**
**
**
**
**
**
**
Black or African Am
erican
27
28
24
34.8
27
39.7
30
43.5
15
21.7
22
32.4
19
27.9
69
68
Native H
aw
aiian or O
ther Pacific Islander
**
**
**
**
**
**
**
**
White
25
28
85
40.9
82
39.4
84
40.4
39
18.8
77
37.0
49
23.6
208
208
Tw
o or M
ore Races
**
**
**
**
**
**
**
**
Hispanic of Any Race
16
17
650.0
866.7
541.7
18.3
325.0
18.3
12
12
Ad
ditio
nal R
ep
ortin
g G
ro
up
s
Econom
ically D
isadvantaged: Yes
28
30
50
35.2
51
36.2
61
43.0
31
21.8
53
37.6
37
26.2
142
141
Econom
ically D
isadvantaged: N
o23
25
69
43.1
75
46.9
63
39.4
28
17.5
51
31.9
34
21.3
160
160
English Language Learners: Yes
**
**
**
**
**
**
**
**
English Language Learners: N
o25
27
118
39.5
124
41.6
122
40.8
59
19.7
103
34.6
71
23.8
299
298
Form
erly Lim
ited English Proficient
**
**
**
**
**
**
**
**
Migrant
**
**
**
**
**
**
**
**
Hom
eless
**
**
**
**
**
**
**
**
* <
10 students assessed
Page 1 of 1
† Results for these students are invalid and not reported.
Note: See reverse for additional inform
ation
() These students are not included in "All Students."
Attachment 8.E
451
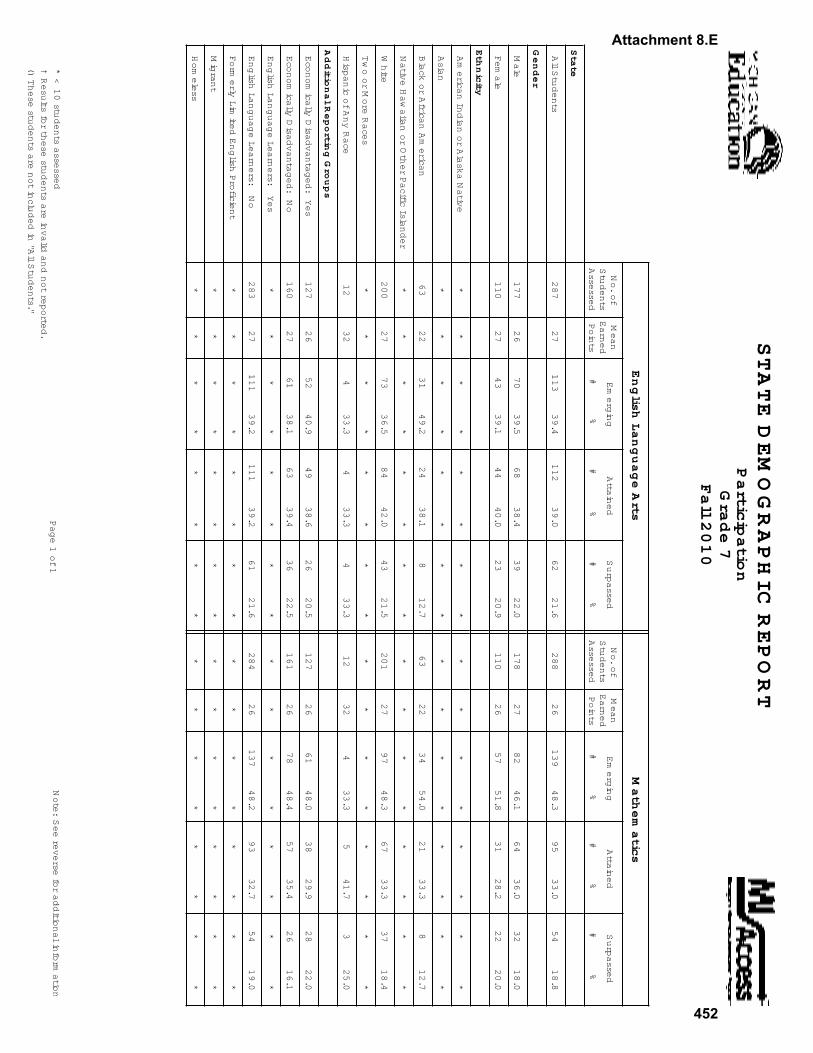
Fall 2
01
0
STA
TE D
EM
OG
RA
PH
IC
R
EP
OR
T
Grad
e 7
Particip
atio
n
No. of
No. of
Students
Assessed
Earned
Points
Earned
Surpassed
Attained
Em
erging
#%
#%
#%
En
glish
Lan
gu
ag
e A
rts
Math
em
atics
Students
Assessed
Mean
Mean
Points
Attained
Em
erging
#%
#%
#%
Surpassed
State
All Students
27
26
113
39.4
139
48.3
112
39.0
62
21.6
95
33.0
54
18.8
287
288
Gen
der
Male
26
27
70
39.5
82
46.1
68
38.4
39
22.0
64
36.0
32
18.0
177
178
Fem
ale
27
26
43
39.1
57
51.8
44
40.0
23
20.9
31
28.2
22
20.0
110
110
Eth
nicity
Am
erican Indian or Alaska N
ative
**
**
**
**
**
**
**
**
Asian
**
**
**
**
**
**
**
**
Black or African Am
erican
22
22
31
49.2
34
54.0
24
38.1
812.7
21
33.3
812.7
63
63
Native H
aw
aiian or O
ther Pacific Islander
**
**
**
**
**
**
**
**
White
27
27
73
36.5
97
48.3
84
42.0
43
21.5
67
33.3
37
18.4
200
201
Tw
o or M
ore Races
**
**
**
**
**
**
**
**
Hispanic of Any Race
32
32
433.3
433.3
433.3
433.3
541.7
325.0
12
12
Ad
ditio
nal R
ep
ortin
g G
ro
up
s
Econom
ically D
isadvantaged: Yes
26
26
52
40.9
61
48.0
49
38.6
26
20.5
38
29.9
28
22.0
127
127
Econom
ically D
isadvantaged: N
o27
26
61
38.1
78
48.4
63
39.4
36
22.5
57
35.4
26
16.1
160
161
English Language Learners: Yes
**
**
**
**
**
**
**
**
English Language Learners: N
o27
26
111
39.2
137
48.2
111
39.2
61
21.6
93
32.7
54
19.0
283
284
Form
erly Lim
ited English Proficient
**
**
**
**
**
**
**
**
Migrant
**
**
**
**
**
**
**
**
Hom
eless
**
**
**
**
**
**
**
**
* <
10 students assessed
Page 1 of 1
† Results for these students are invalid and not reported.
Note: See reverse for additional inform
ation
() These students are not included in "All Students."
Attachment 8.E
452
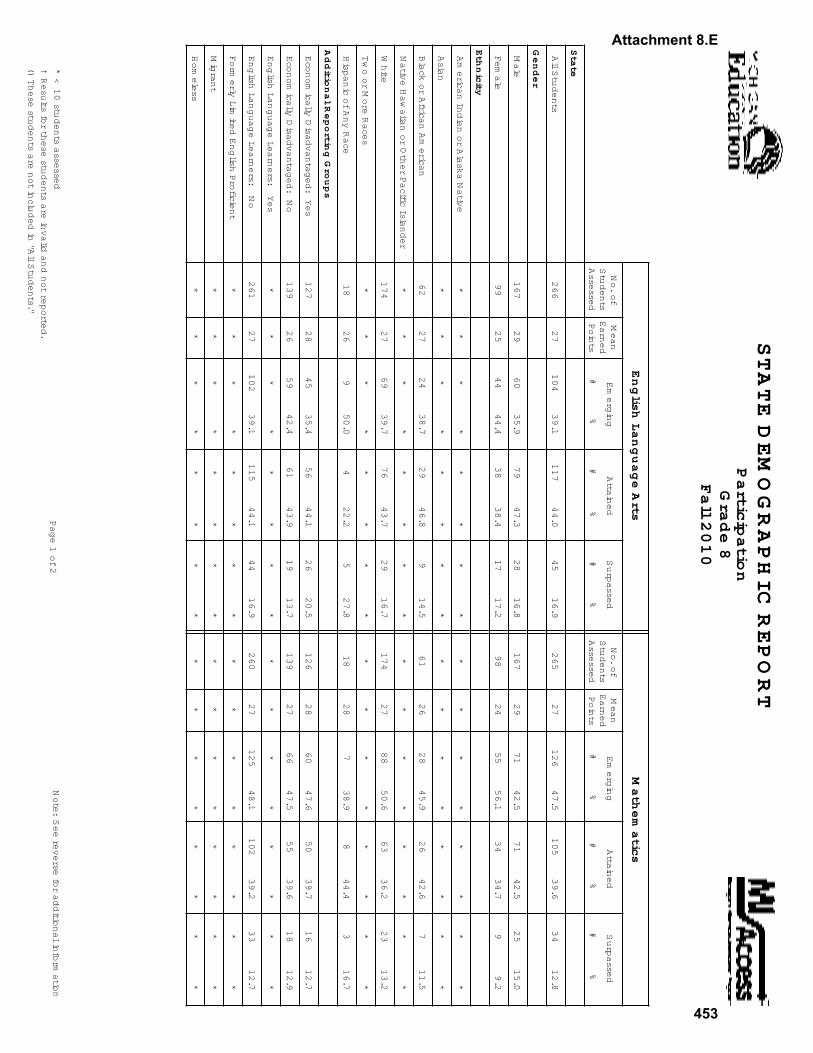
Fall 2
01
0
STA
TE D
EM
OG
RA
PH
IC
R
EP
OR
T
Grad
e 8
Particip
atio
n
No. of
No. of
Students
Assessed
Earned
Points
Earned
Surpassed
Attained
Em
erging
#%
#%
#%
En
glish
Lan
gu
ag
e A
rts
Math
em
atics
Students
Assessed
Mean
Mean
Points
Attained
Em
erging
#%
#%
#%
Surpassed
State
All Students
27
27
104
39.1
126
47.5
117
44.0
45
16.9
105
39.6
34
12.8
266
265
Gen
der
Male
29
29
60
35.9
71
42.5
79
47.3
28
16.8
71
42.5
25
15.0
167
167
Fem
ale
25
24
44
44.4
55
56.1
38
38.4
17
17.2
34
34.7
99.2
99
98
Eth
nicity
Am
erican Indian or Alaska N
ative
**
**
**
**
**
**
**
**
Asian
**
**
**
**
**
**
**
**
Black or African Am
erican
27
26
24
38.7
28
45.9
29
46.8
914.5
26
42.6
711.5
62
61
Native H
aw
aiian or O
ther Pacific Islander
**
**
**
**
**
**
**
**
White
27
27
69
39.7
88
50.6
76
43.7
29
16.7
63
36.2
23
13.2
174
174
Tw
o or M
ore Races
**
**
**
**
**
**
**
**
Hispanic of Any Race
26
28
950.0
738.9
422.2
527.8
844.4
316.7
18
18
Ad
ditio
nal R
ep
ortin
g G
ro
up
s
Econom
ically D
isadvantaged: Yes
28
28
45
35.4
60
47.6
56
44.1
26
20.5
50
39.7
16
12.7
127
126
Econom
ically D
isadvantaged: N
o26
27
59
42.4
66
47.5
61
43.9
19
13.7
55
39.6
18
12.9
139
139
English Language Learners: Yes
**
**
**
**
**
**
**
**
English Language Learners: N
o27
27
102
39.1
125
48.1
115
44.1
44
16.9
102
39.2
33
12.7
261
260
Form
erly Lim
ited English Proficient
**
**
**
**
**
**
**
**
Migrant
**
**
**
**
**
**
**
**
Hom
eless
**
**
**
**
**
**
**
**
* <
10 students assessed
Page 1 of 2
† Results for these students are invalid and not reported.
Note: See reverse for additional inform
ation
() These students are not included in "All Students."
Attachment 8.E
453

Fall 2
01
0
STA
TE D
EM
OG
RA
PH
IC
R
EP
OR
T
Grad
e 8
Particip
atio
n
No. of
Students
Assessed
Earned
Points
Surpassed
Attained
Em
erging
#%
#%
#%
Scien
ce
Mean
State
All Students
42
78
30.8
149
58.9
26
10.3
253
Gen
der
Male
45
42
26.6
97
61.4
19
12.0
158
Fem
ale
37
36
37.9
52
54.7
77.4
95
Eth
nicity
Am
erican Indian or Alaska N
ative
**
**
**
**
Asian
**
**
**
**
Black or African Am
erican
42
20
33.9
32
54.2
711.9
59
Native H
aw
aiian or O
ther Pacific Islander
**
**
**
**
White
42
51
30.7
99
59.6
16
9.6
166
Tw
o or M
ore Races
**
**
**
**
Hispanic of Any Race
42
531.3
10
62.5
16.3
16
Ad
ditio
nal R
ep
ortin
g G
ro
up
s
Econom
ically D
isadvantaged: Yes
43
43
35.8
60
50.0
17
14.2
120
Econom
ically D
isadvantaged: N
o42
35
26.3
89
66.9
96.8
133
English Language Learners: Yes
**
**
**
**
English Language Learners: N
o42
77
31.0
146
58.9
25
10.1
248
Form
erly Lim
ited English Proficient
**
**
**
**
Migrant
**
**
**
**
Hom
eless
**
**
**
**
* <
10 students assessed
Page 2 of 2
† Results for these students are invalid and not reported.
Note: See reverse for additional inform
ation
() These students are not included in "All Students."
Attachment 8.E
454
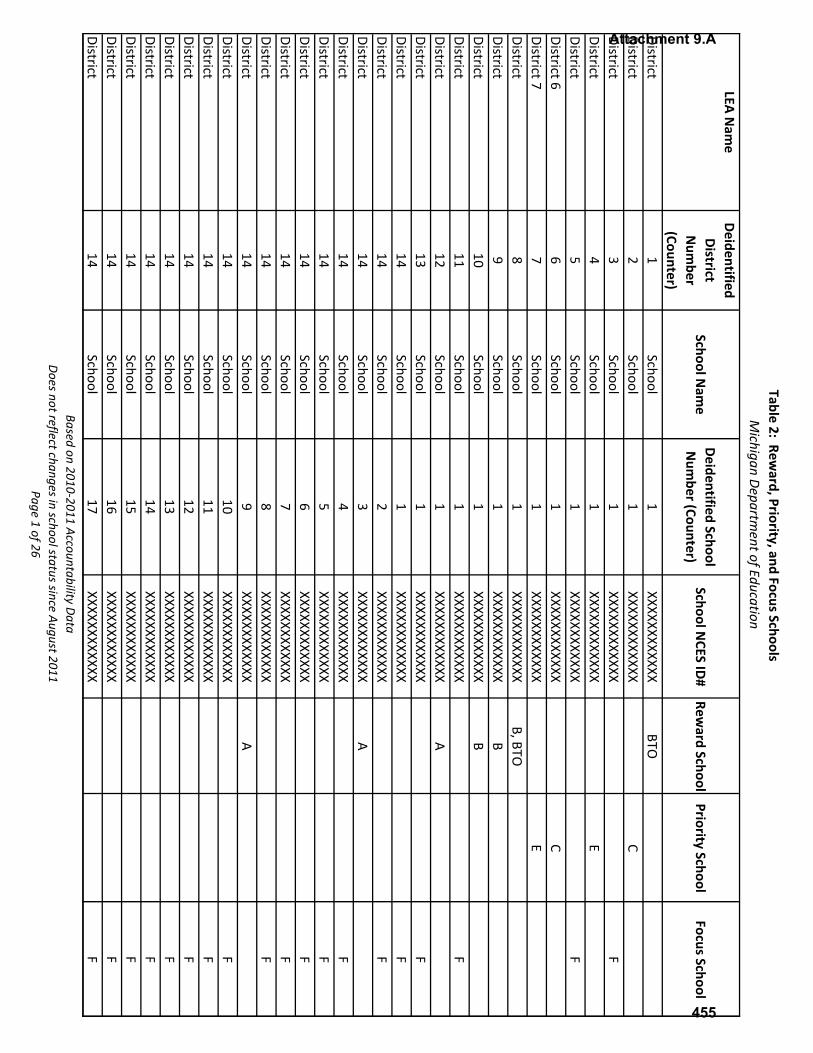
Table 2: Reward, Priority, and Focus Schools
Michigan Departm
ent of Education
LEA Nam
eDeidentified District
Num
ber (Counter)
School Nam
eDeidentified School Num
ber (Counter)School N
CES ID#
Reward School
Priority SchoolFocus School
District1
School1
XXXXXXXXXXXXBTO
District 2
School1
XXXXXXXXXXXXC
District3
School1
XXXXXXXXXXXXF
District 4
School1
XXXXXXXXXXXXE
District 5
School1
XXXXXXXXXXXXF
District 66
School1
XXXXXXXXXXXXC
District 77
School1
XXXXXXXXXXXXE
District 8
School1
XXXXXXXXXXXXB, BTO
District9
School1
XXXXXXXXXXXXB
District10
School1
XXXXXXXXXXXXB
District11
School1
XXXXXXXXXXXXF
District12
School1
XXXXXXXXXXXXA
District13
School1
XXXXXXXXXXXXF
District14
School1
XXXXXXXXXXXXF
District14
School2
XXXXXXXXXXXXF
District14
School3
XXXXXXXXXXXXA
District14
School4
XXXXXXXXXXXXF
District14
School5
XXXXXXXXXXXXF
District14
School6
XXXXXXXXXXXXF
District14
School7
XXXXXXXXXXXXF
District14
School8
XXXXXXXXXXXXF
District14
School9
XXXXXXXXXXXXA
District14
School10
XXXXXXXXXXXXF
District14
School11
XXXXXXXXXXXXF
District14
School12
XXXXXXXXXXXXF
District14
School13
XXXXXXXXXXXXF
District14
School14
XXXXXXXXXXXXF
District14
School15
XXXXXXXXXXXXF
District14
School16
XXXXXXXXXXXXF
District14
School17
XXXXXXXXXXXXF
Based on 2010‐2011 Accountability DataDoes not reflect changes in school status since August 2011
Page 1 of 26
Attachment 9.A
455

Table 2: Reward, Priority, and Focus Schools
Michigan Departm
ent of Education
LEA Nam
eDeidentified District
Num
ber (Counter)
School Nam
eDeidentified School Num
ber (Counter)School N
CES ID#
Reward School
Priority SchoolFocus School
District14
School18
XXXXXXXXXXXXF
District14
School19
XXXXXXXXXXXXF
District14
School20
XXXXXXXXXXXXF
District14
School21
XXXXXXXXXXXXF
District14
School22
XXXXXXXXXXXXF
District14
School23
XXXXXXXXXXXXF
District14
School24
XXXXXXXXXXXXF
District14
School25
XXXXXXXXXXXXF
District14
School26
XXXXXXXXXXXXF
District14
School27
XXXXXXXXXXXXF
District14
School28
XXXXXXXXXXXXF
District14
School29
XXXXXXXXXXXXF
District15
School1
XXXXXXXXXXXXB
District16
School1
XXXXXXXXXXXXB
District17
School1
XXXXXXXXXXXXBTO
District18
School1
XXXXXXXXXXXXF
District18
School2
XXXXXXXXXXXXF
District18
School3
XXXXXXXXXXXXF
District19
School1
XXXXXXXXXXXXC
District20
School1
XXXXXXXXXXXXF
District21
School1
XXXXXXXXXXXXF
District21
School2
XXXXXXXXXXXXC
District21
School3
XXXXXXXXXXXXBTO
District21
School4
XXXXXXXXXXXXF
District21
School5
XXXXXXXXXXXXC
District22
School1
XXXXXXXXXXXXF
District22
School2
XXXXXXXXXXXXF
District22
School3
XXXXXXXXXXXXA, B, BTO
District23
School1
XXXXXXXXXXXXC
District24
School1
XXXXXXXXXXXXC
Based on 2010‐2011 Accountability DataDoes not reflect changes in school status since August 2011
Page 2 of 26
Attachment 9.A
456

Table 2: Reward, Priority, and Focus Schools
Michigan Departm
ent of Education
LEA Nam
eDeidentified District
Num
ber (Counter)
School Nam
eDeidentified School Num
ber (Counter)School N
CES ID#
Reward School
Priority SchoolFocus School
District24
School2
XXXXXXXXXXXXC
District25
School1
XXXXXXXXXXXXF
District26
School1
XXXXXXXXXXXXB
District27
School1
XXXXXXXXXXXXF
District28
School1
XXXXXXXXXXXXC
District28
School2
XXXXXXXXXXXXC
District28
School3
XXXXXXXXXXXXBTO
District28
School4
XXXXXXXXXXXXC
District28
School5
XXXXXXXXXXXXC
District28
School6
XXXXXXXXXXXXC
District29
School1
XXXXXXXXXXXXB
District29
School2
XXXXXXXXXXXXB, BTO
District29
School3
XXXXXXXXXXXXBTO
District30
School1
XXXXXXXXXXXXA, BTO
District30
School2
XXXXXXXXXXXXF
District30
School3
XXXXXXXXXXXXF
District31
School1
XXXXXXXXXXXXF
District32
School1
XXXXXXXXXXXXF
District33
School1
XXXXXXXXXXXXF
District34
School1
XXXXXXXXXXXXF
District35
School1
XXXXXXXXXXXXF
District35
School2
XXXXXXXXXXXXA, BTO
District35
School3
XXXXXXXXXXXXA
District35
School4
XXXXXXXXXXXXA
District35
School5
XXXXXXXXXXXXA
District35
School6
XXXXXXXXXXXXF
District35
School7
XXXXXXXXXXXXA,B
District35
School8
XXXXXXXXXXXXA
District36
School1
XXXXXXXXXXXXF
District37
School1
XXXXXXXXXXXXB
Based on 2010‐2011 Accountability DataDoes not reflect changes in school status since August 2011
Page 3 of 26
Attachment 9.A
457
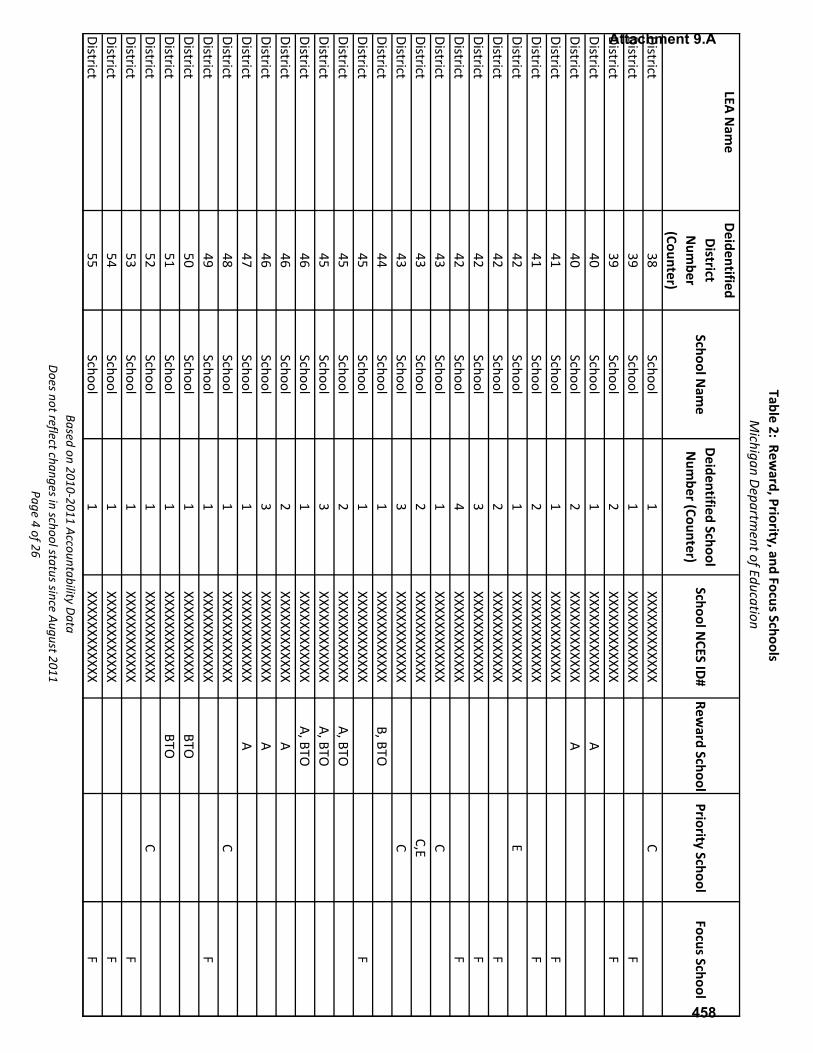
Table 2: Reward, Priority, and Focus Schools
Michigan Departm
ent of Education
LEA Nam
eDeidentified District
Num
ber (Counter)
School Nam
eDeidentified School Num
ber (Counter)School N
CES ID#
Reward School
Priority SchoolFocus School
District38
School1
XXXXXXXXXXXXC
District39
School1
XXXXXXXXXXXXF
District39
School2
XXXXXXXXXXXXF
District40
School1
XXXXXXXXXXXXA
District40
School2
XXXXXXXXXXXXA
District41
School1
XXXXXXXXXXXXF
District41
School2
XXXXXXXXXXXXF
District42
School1
XXXXXXXXXXXXE
District42
School2
XXXXXXXXXXXXF
District42
School3
XXXXXXXXXXXXF
District42
School4
XXXXXXXXXXXXF
District43
School1
XXXXXXXXXXXXC
District43
School2
XXXXXXXXXXXXC,E
District43
School3
XXXXXXXXXXXXC
District44
School1
XXXXXXXXXXXXB, BTO
District45
School1
XXXXXXXXXXXXF
District45
School2
XXXXXXXXXXXXA, BTO
District45
School3
XXXXXXXXXXXXA, BTO
District46
School1
XXXXXXXXXXXXA, BTO
District46
School2
XXXXXXXXXXXXA
District46
School3
XXXXXXXXXXXXA
District47
School1
XXXXXXXXXXXXA
District48
School1
XXXXXXXXXXXXC
District49
School1
XXXXXXXXXXXXF
District50
School1
XXXXXXXXXXXXBTO
District51
School1
XXXXXXXXXXXXBTO
District52
School1
XXXXXXXXXXXXC
District53
School1
XXXXXXXXXXXXF
District54
School1
XXXXXXXXXXXXF
District55
School1
XXXXXXXXXXXXF
Based on 2010‐2011 Accountability DataDoes not reflect changes in school status since August 2011
Page 4 of 26
Attachment 9.A
458
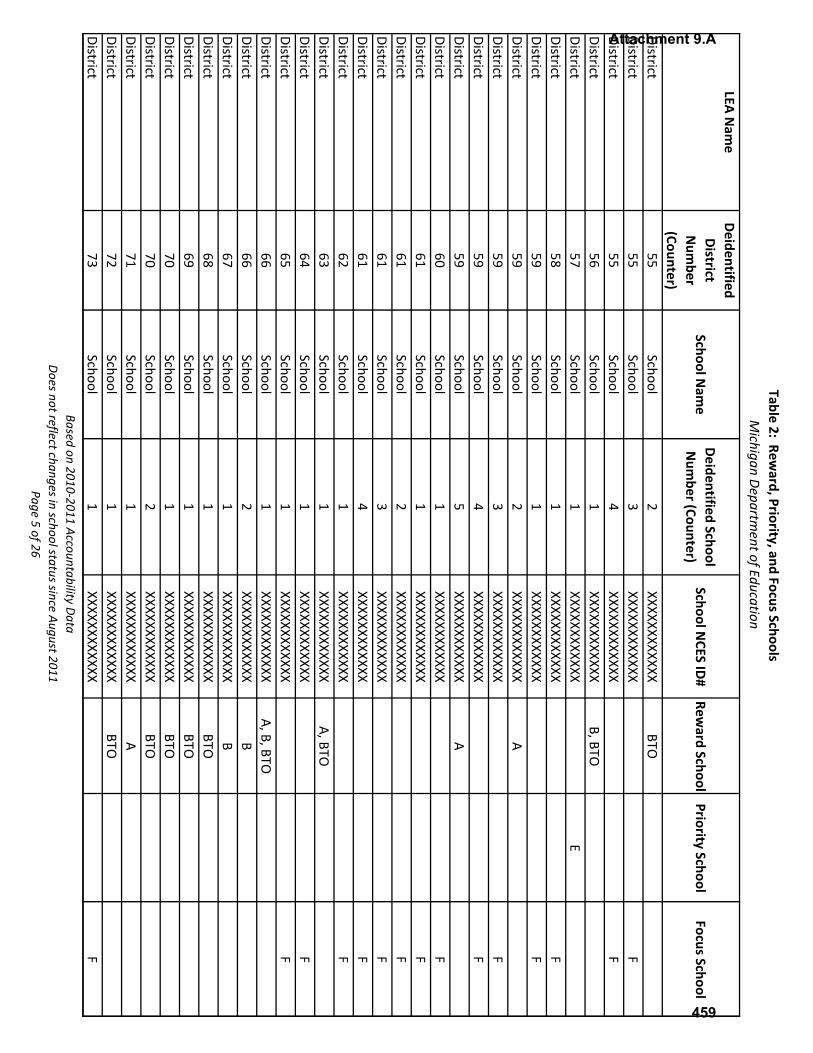
Table 2: Reward, Priority, and Focus Schools
Michigan Departm
ent of Education
LEA Nam
eDeidentified District
Num
ber (Counter)
School Nam
eDeidentified School Num
ber (Counter)School N
CES ID#
Reward School
Priority SchoolFocus School
District55
School2
XXXXXXXXXXXXBTO
District55
School3
XXXXXXXXXXXXF
District55
School4
XXXXXXXXXXXXF
District56
School1
XXXXXXXXXXXXB, BTO
District57
School1
XXXXXXXXXXXXE
District58
School1
XXXXXXXXXXXXF
District59
School1
XXXXXXXXXXXXF
District59
School2
XXXXXXXXXXXXA
District59
School3
XXXXXXXXXXXXF
District59
School4
XXXXXXXXXXXXF
District59
School5
XXXXXXXXXXXXA
District60
School1
XXXXXXXXXXXXF
District61
School1
XXXXXXXXXXXXF
District61
School2
XXXXXXXXXXXXF
District61
School3
XXXXXXXXXXXXF
District61
School4
XXXXXXXXXXXXF
District62
School1
XXXXXXXXXXXXF
District63
School1
XXXXXXXXXXXXA, BTO
District64
School1
XXXXXXXXXXXXF
District65
School1
XXXXXXXXXXXXF
District66
School1
XXXXXXXXXXXXA, B, BTO
District66
School2
XXXXXXXXXXXXB
District67
School1
XXXXXXXXXXXXB
District68
School1
XXXXXXXXXXXXBTO
District69
School1
XXXXXXXXXXXXBTO
District70
School1
XXXXXXXXXXXXBTO
District70
School2
XXXXXXXXXXXXBTO
District71
School1
XXXXXXXXXXXXA
District72
School1
XXXXXXXXXXXXBTO
District73
School1
XXXXXXXXXXXXF
Based on 2010‐2011 Accountability DataDoes not reflect changes in school status since August 2011
Page 5 of 26
Attachment 9.A
459
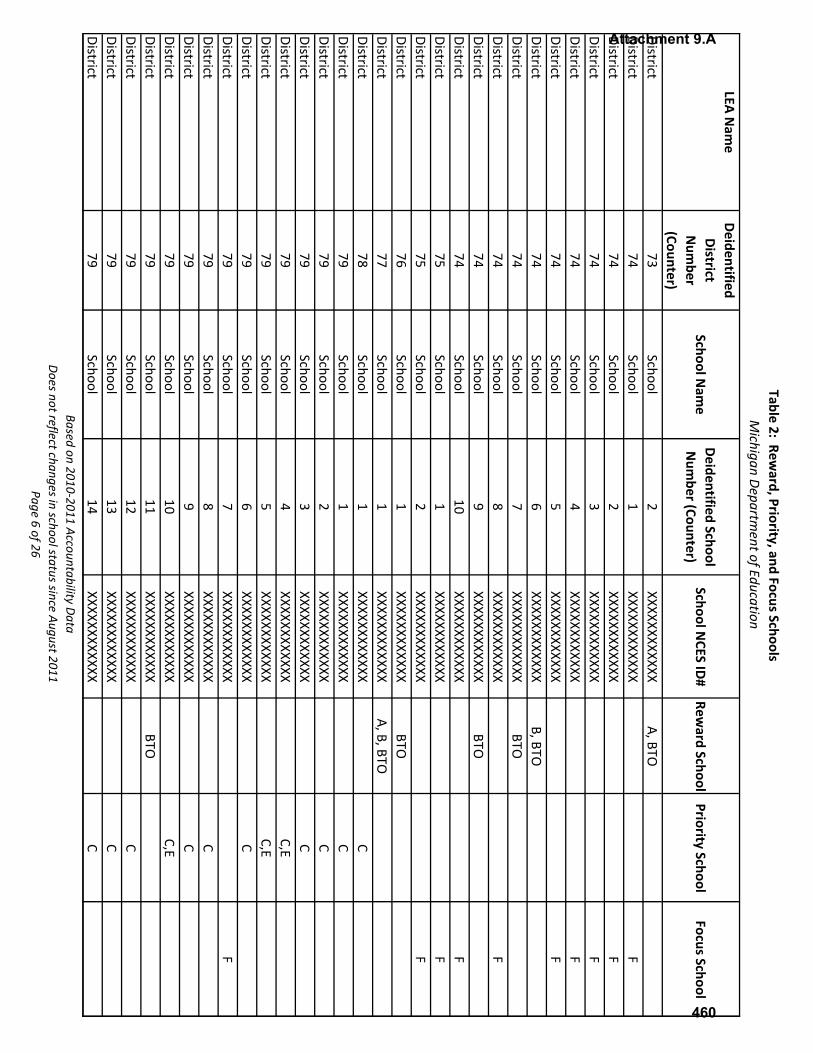
Table 2: Reward, Priority, and Focus Schools
Michigan Departm
ent of Education
LEA Nam
eDeidentified District
Num
ber (Counter)
School Nam
eDeidentified School Num
ber (Counter)School N
CES ID#
Reward School
Priority SchoolFocus School
District73
School2
XXXXXXXXXXXXA, BTO
District74
School1
XXXXXXXXXXXXF
District74
School2
XXXXXXXXXXXXF
District74
School3
XXXXXXXXXXXXF
District74
School4
XXXXXXXXXXXXF
District74
School5
XXXXXXXXXXXXF
District74
School6
XXXXXXXXXXXXB, BTO
District74
School7
XXXXXXXXXXXXBTO
District74
School8
XXXXXXXXXXXXF
District74
School9
XXXXXXXXXXXXBTO
District74
School10
XXXXXXXXXXXXF
District75
School1
XXXXXXXXXXXXF
District75
School2
XXXXXXXXXXXXF
District76
School1
XXXXXXXXXXXXBTO
District77
School1
XXXXXXXXXXXXA, B, BTO
District78
School1
XXXXXXXXXXXXC
District79
School1
XXXXXXXXXXXXC
District79
School2
XXXXXXXXXXXXC
District79
School3
XXXXXXXXXXXXC
District79
School4
XXXXXXXXXXXXC,E
District79
School5
XXXXXXXXXXXXC,E
District79
School6
XXXXXXXXXXXXC
District79
School7
XXXXXXXXXXXXF
District79
School8
XXXXXXXXXXXXC
District79
School9
XXXXXXXXXXXXC
District79
School10
XXXXXXXXXXXXC,E
District79
School11
XXXXXXXXXXXXBTO
District79
School12
XXXXXXXXXXXXC
District79
School13
XXXXXXXXXXXXC
District79
School14
XXXXXXXXXXXXC
Based on 2010‐2011 Accountability DataDoes not reflect changes in school status since August 2011
Page 6 of 26
Attachment 9.A
460

Table 2: Reward, Priority, and Focus Schools
Michigan Departm
ent of Education
LEA Nam
eDeidentified District
Num
ber (Counter)
School Nam
eDeidentified School Num
ber (Counter)School N
CES ID#
Reward School
Priority SchoolFocus School
District79
School15
XXXXXXXXXXXXE
District79
School16
XXXXXXXXXXXXC
District79
School17
XXXXXXXXXXXXC
District79
School18
XXXXXXXXXXXXC
District79
School19
XXXXXXXXXXXXC
District79
School20
XXXXXXXXXXXXC
District79
School21
XXXXXXXXXXXXC,E
District79
School22
XXXXXXXXXXXXC
District79
School23
XXXXXXXXXXXXC
District79
School24
XXXXXXXXXXXXC
District79
School25
XXXXXXXXXXXXC
District79
School26
XXXXXXXXXXXXC
District79
School27
XXXXXXXXXXXXC
District79
School28
XXXXXXXXXXXXC
District79
School29
XXXXXXXXXXXXC
District79
School30
XXXXXXXXXXXXC
District79
School31
XXXXXXXXXXXXC,E
District79
School32
XXXXXXXXXXXXC
District79
School33
XXXXXXXXXXXXC
District79
School34
XXXXXXXXXXXXF
District79
School35
XXXXXXXXXXXXC
District79
School36
XXXXXXXXXXXXA,B
District79
School37
XXXXXXXXXXXXC,E
District79
School38
XXXXXXXXXXXXC
District79
School39
XXXXXXXXXXXXE
District79
School40
XXXXXXXXXXXXBTO
District79
School41
XXXXXXXXXXXXC
District79
School42
XXXXXXXXXXXXC,E
District79
School43
XXXXXXXXXXXXC
District79
School44
XXXXXXXXXXXXC
Based on 2010‐2011 Accountability DataDoes not reflect changes in school status since August 2011
Page 7 of 26
Attachment 9.A
461
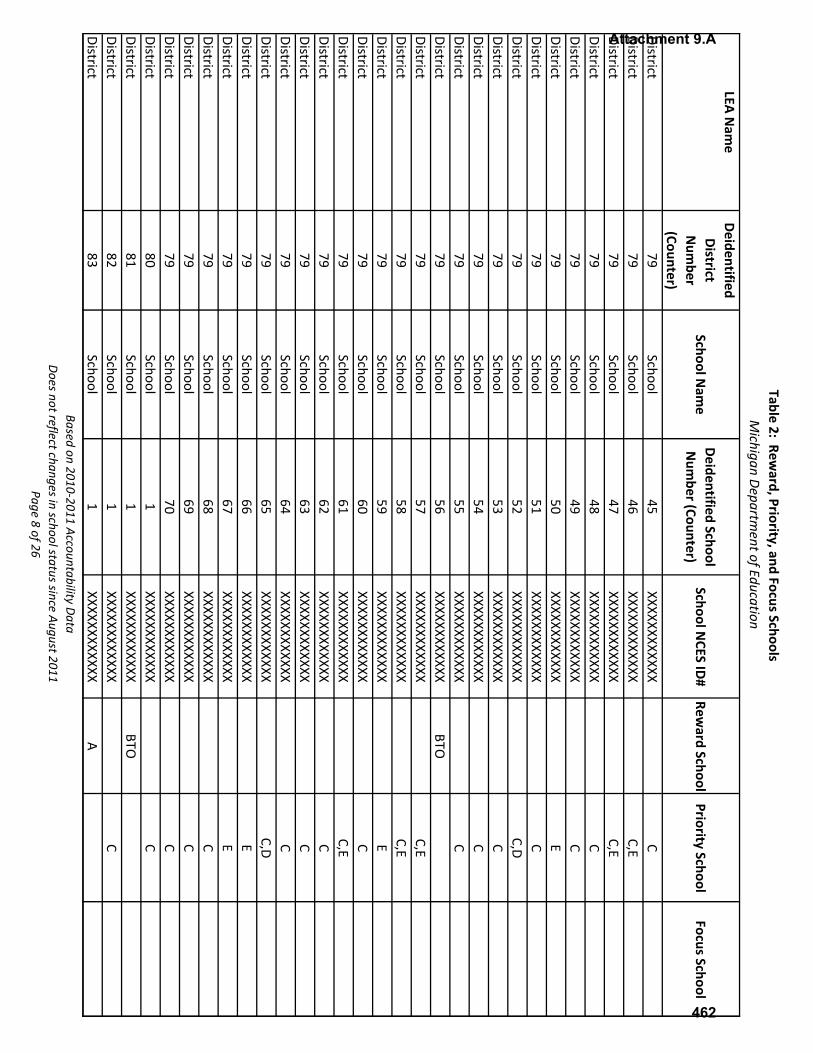
Table 2: Reward, Priority, and Focus Schools
Michigan Departm
ent of Education
LEA Nam
eDeidentified District
Num
ber (Counter)
School Nam
eDeidentified School Num
ber (Counter)School N
CES ID#
Reward School
Priority SchoolFocus School
District79
School45
XXXXXXXXXXXXC
District79
School46
XXXXXXXXXXXXC,E
District79
School47
XXXXXXXXXXXXC,E
District79
School48
XXXXXXXXXXXXC
District79
School49
XXXXXXXXXXXXC
District79
School50
XXXXXXXXXXXXE
District79
School51
XXXXXXXXXXXXC
District79
School52
XXXXXXXXXXXXC,D
District79
School53
XXXXXXXXXXXXC
District79
School54
XXXXXXXXXXXXC
District79
School55
XXXXXXXXXXXXC
District79
School56
XXXXXXXXXXXXBTO
District79
School57
XXXXXXXXXXXXC,E
District79
School58
XXXXXXXXXXXXC,E
District79
School59
XXXXXXXXXXXXE
District79
School60
XXXXXXXXXXXXC
District79
School61
XXXXXXXXXXXXC,E
District79
School62
XXXXXXXXXXXXC
District79
School63
XXXXXXXXXXXXC
District79
School64
XXXXXXXXXXXXC
District79
School65
XXXXXXXXXXXXC,D
District79
School66
XXXXXXXXXXXXE
District79
School67
XXXXXXXXXXXXE
District79
School68
XXXXXXXXXXXXC
District79
School69
XXXXXXXXXXXXC
District79
School70
XXXXXXXXXXXXC
District80
School1
XXXXXXXXXXXXC
District81
School1
XXXXXXXXXXXXBTO
District82
School1
XXXXXXXXXXXXC
District83
School1
XXXXXXXXXXXXA
Based on 2010‐2011 Accountability DataDoes not reflect changes in school status since August 2011
Page 8 of 26
Attachment 9.A
462

Table 2: Reward, Priority, and Focus Schools
Michigan Departm
ent of Education
LEA Nam
eDeidentified District
Num
ber (Counter)
School Nam
eDeidentified School Num
ber (Counter)School N
CES ID#
Reward School
Priority SchoolFocus School
District83
School2
XXXXXXXXXXXXF
District84
School1
XXXXXXXXXXXXB
District85
School1
XXXXXXXXXXXXBTO
District86
School1
XXXXXXXXXXXXF
District86
School2
XXXXXXXXXXXXA
District86
School3
XXXXXXXXXXXXA, BTO
District87
School1
XXXXXXXXXXXXF
District87
School2
XXXXXXXXXXXXF
District87
School3
XXXXXXXXXXXXF
District87
School4
XXXXXXXXXXXXF
District87
School5
XXXXXXXXXXXXF
District87
School6
XXXXXXXXXXXXF
District87
School7
XXXXXXXXXXXXF
District88
School1
XXXXXXXXXXXXBTO
District89
School1
XXXXXXXXXXXXC
District89
School1
XXXXXXXXXXXXC
District90
School1
XXXXXXXXXXXXBTO
District91
School1
XXXXXXXXXXXXBTO
District92
School1
XXXXXXXXXXXXF
District92
School2
XXXXXXXXXXXXB
District93
School1
XXXXXXXXXXXXF
District94
School1
XXXXXXXXXXXXF
District95
School1
XXXXXXXXXXXXF
District95
School2
XXXXXXXXXXXXF
District95
School3
XXXXXXXXXXXXF
District95
School4
XXXXXXXXXXXXF
District95
School5
XXXXXXXXXXXXF
District95
School6
XXXXXXXXXXXXA, BTO
District95
School7
XXXXXXXXXXXXF
District95
School8
XXXXXXXXXXXXF
Based on 2010‐2011 Accountability DataDoes not reflect changes in school status since August 2011
Page 9 of 26
Attachment 9.A
463

Table 2: Reward, Priority, and Focus Schools
Michigan Departm
ent of Education
LEA Nam
eDeidentified District
Num
ber (Counter)
School Nam
eDeidentified School Num
ber (Counter)School N
CES ID#
Reward School
Priority SchoolFocus School
District95
School9
XXXXXXXXXXXXF
District95
School10
XXXXXXXXXXXXF
District95
School11
XXXXXXXXXXXXF
District95
School12
XXXXXXXXXXXXF
District96
School1
XXXXXXXXXXXXF
District96
School2
XXXXXXXXXXXXF
District96
School3
XXXXXXXXXXXXC
District97
School1
XXXXXXXXXXXXE
District98
School1
XXXXXXXXXXXXB
District99
School1
XXXXXXXXXXXXC
District99
School2
XXXXXXXXXXXXC
District99
School3
XXXXXXXXXXXXF
District99
School4
XXXXXXXXXXXXC
District99
School5
XXXXXXXXXXXXC
District99
School6
XXXXXXXXXXXXC
District99
School7
XXXXXXXXXXXXE
District100
School1
XXXXXXXXXXXXF
District101
School1
XXXXXXXXXXXXA, BTO
District101
School2
XXXXXXXXXXXXA
District101
School3
XXXXXXXXXXXXA, BTO
District101
School4
XXXXXXXXXXXXA, B, BTO
District101
School5
XXXXXXXXXXXXA
District101
School6
XXXXXXXXXXXXA, BTO
District101
School7
XXXXXXXXXXXXA
District101
School8
XXXXXXXXXXXXA, B, BTO
District101
School9
XXXXXXXXXXXXA
District101
School10
XXXXXXXXXXXXA
District101
School11
XXXXXXXXXXXXA
District101
School12
XXXXXXXXXXXXA
District101
School13
XXXXXXXXXXXXA
Based on 2010‐2011 Accountability DataDoes not reflect changes in school status since August 2011
Page 10 of 26
Attachment 9.A
464
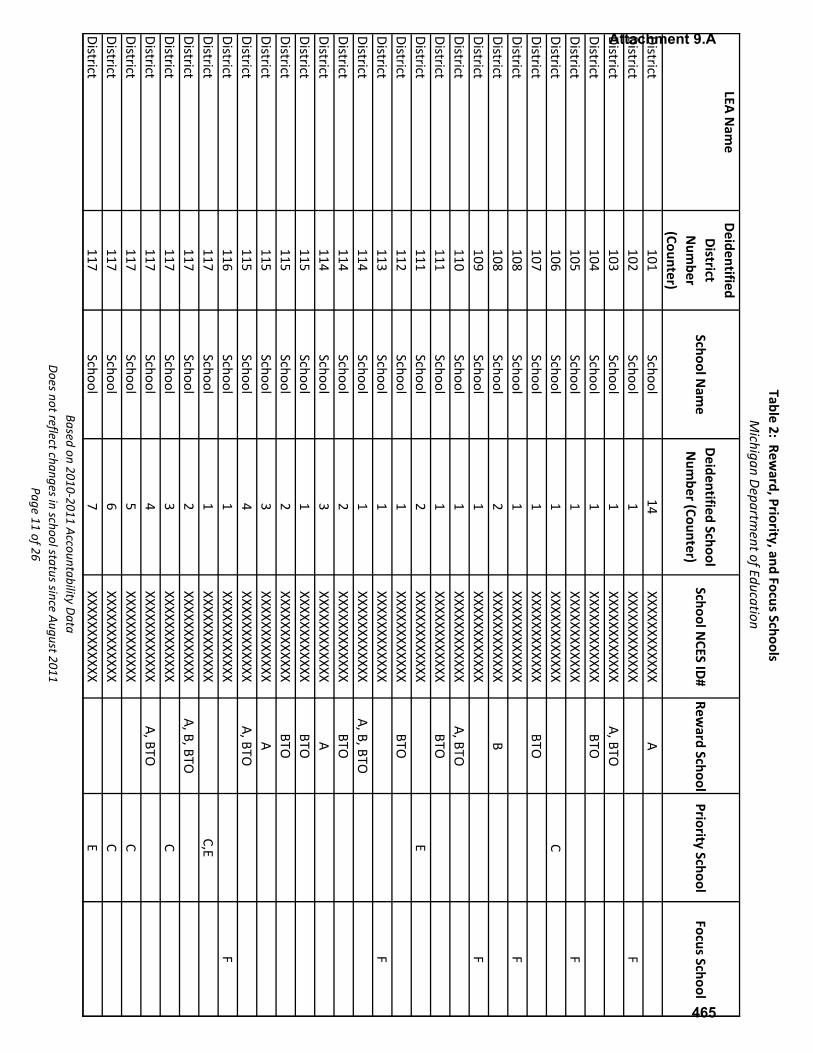
Table 2: Reward, Priority, and Focus Schools
Michigan Departm
ent of Education
LEA Nam
eDeidentified District
Num
ber (Counter)
School Nam
eDeidentified School Num
ber (Counter)School N
CES ID#
Reward School
Priority SchoolFocus School
District101
School14
XXXXXXXXXXXXA
District102
School1
XXXXXXXXXXXXF
District103
School1
XXXXXXXXXXXXA, BTO
District104
School1
XXXXXXXXXXXXBTO
District105
School1
XXXXXXXXXXXXF
District106
School1
XXXXXXXXXXXXC
District107
School1
XXXXXXXXXXXXBTO
District108
School1
XXXXXXXXXXXXF
District108
School2
XXXXXXXXXXXXB
District109
School1
XXXXXXXXXXXXF
District110
School1
XXXXXXXXXXXXA, BTO
District111
School1
XXXXXXXXXXXXBTO
District111
School2
XXXXXXXXXXXXE
District112
School1
XXXXXXXXXXXXBTO
District113
School1
XXXXXXXXXXXXF
District114
School1
XXXXXXXXXXXXA, B, BTO
District114
School2
XXXXXXXXXXXXBTO
District114
School3
XXXXXXXXXXXXA
District115
School1
XXXXXXXXXXXXBTO
District115
School2
XXXXXXXXXXXXBTO
District115
School3
XXXXXXXXXXXXA
District115
School4
XXXXXXXXXXXXA, BTO
District116
School1
XXXXXXXXXXXXF
District117
School1
XXXXXXXXXXXXC,E
District117
School2
XXXXXXXXXXXXA, B, BTO
District117
School3
XXXXXXXXXXXXC
District117
School4
XXXXXXXXXXXXA, BTO
District117
School5
XXXXXXXXXXXXC
District117
School6
XXXXXXXXXXXXC
District117
School7
XXXXXXXXXXXXE
Based on 2010‐2011 Accountability DataDoes not reflect changes in school status since August 2011
Page 11 of 26
Attachment 9.A
465

Table 2: Reward, Priority, and Focus Schools
Michigan Departm
ent of Education
LEA Nam
eDeidentified District
Num
ber (Counter)
School Nam
eDeidentified School Num
ber (Counter)School N
CES ID#
Reward School
Priority SchoolFocus School
District117
School8
XXXXXXXXXXXXA, B, BTO
District117
School9
XXXXXXXXXXXXC
District117
School10
XXXXXXXXXXXXC
District117
School11
XXXXXXXXXXXXF
District117
School12
XXXXXXXXXXXXE
District117
School13
XXXXXXXXXXXXF
District117
School14
XXXXXXXXXXXXC
District117
School15
XXXXXXXXXXXXC,E
District117
School16
XXXXXXXXXXXXE
District118
School1
XXXXXXXXXXXXB
District119
School1
XXXXXXXXXXXXF
District119
School2
XXXXXXXXXXXXA, BTO
District119
School3
XXXXXXXXXXXXBTO
District120
School1
XXXXXXXXXXXXE
District121
School1
XXXXXXXXXXXXA
District121
School2
XXXXXXXXXXXXF
District121
School3
XXXXXXXXXXXXF
District121
School4
XXXXXXXXXXXXBTO
District121
School5
XXXXXXXXXXXXA
District121
School6
XXXXXXXXXXXXA
District121
School7
XXXXXXXXXXXXF
District121
School8
XXXXXXXXXXXXA
District122
School1
XXXXXXXXXXXXF
District123
School1
XXXXXXXXXXXXBTO
District124
School1
XXXXXXXXXXXXA, BTO
District124
School2
XXXXXXXXXXXXBTO
District125
School1
XXXXXXXXXXXXF
District125
School2
XXXXXXXXXXXXC
District126
School1
XXXXXXXXXXXXBTO
District127
School1
XXXXXXXXXXXXBTO
Based on 2010‐2011 Accountability DataDoes not reflect changes in school status since August 2011
Page 12 of 26
Attachment 9.A
466
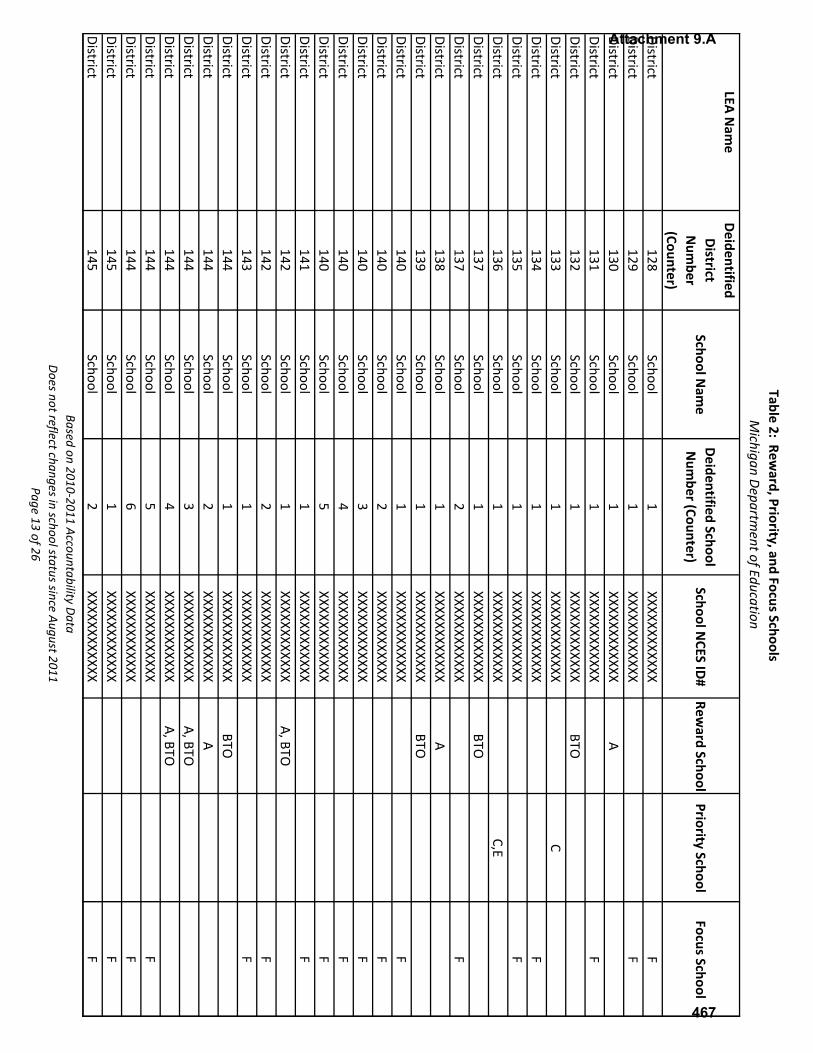
Table 2: Reward, Priority, and Focus Schools
Michigan Departm
ent of Education
LEA Nam
eDeidentified District
Num
ber (Counter)
School Nam
eDeidentified School Num
ber (Counter)School N
CES ID#
Reward School
Priority SchoolFocus School
District128
School1
XXXXXXXXXXXXF
District129
School1
XXXXXXXXXXXXF
District130
School1
XXXXXXXXXXXXA
District131
School1
XXXXXXXXXXXXF
District132
School1
XXXXXXXXXXXXBTO
District133
School1
XXXXXXXXXXXXC
District134
School1
XXXXXXXXXXXXF
District135
School1
XXXXXXXXXXXXF
District136
School1
XXXXXXXXXXXXC,E
District137
School1
XXXXXXXXXXXXBTO
District137
School2
XXXXXXXXXXXXF
District138
School1
XXXXXXXXXXXXA
District139
School1
XXXXXXXXXXXXBTO
District140
School1
XXXXXXXXXXXXF
District140
School2
XXXXXXXXXXXXF
District140
School3
XXXXXXXXXXXXF
District140
School4
XXXXXXXXXXXXF
District140
School5
XXXXXXXXXXXXF
District141
School1
XXXXXXXXXXXXF
District142
School1
XXXXXXXXXXXXA, BTO
District142
School2
XXXXXXXXXXXXF
District143
School1
XXXXXXXXXXXXF
District144
School1
XXXXXXXXXXXXBTO
District144
School2
XXXXXXXXXXXXA
District144
School3
XXXXXXXXXXXXA, BTO
District144
School4
XXXXXXXXXXXXA, BTO
District144
School5
XXXXXXXXXXXXF
District144
School6
XXXXXXXXXXXXF
District145
School1
XXXXXXXXXXXXF
District145
School2
XXXXXXXXXXXXF
Based on 2010‐2011 Accountability DataDoes not reflect changes in school status since August 2011
Page 13 of 26
Attachment 9.A
467
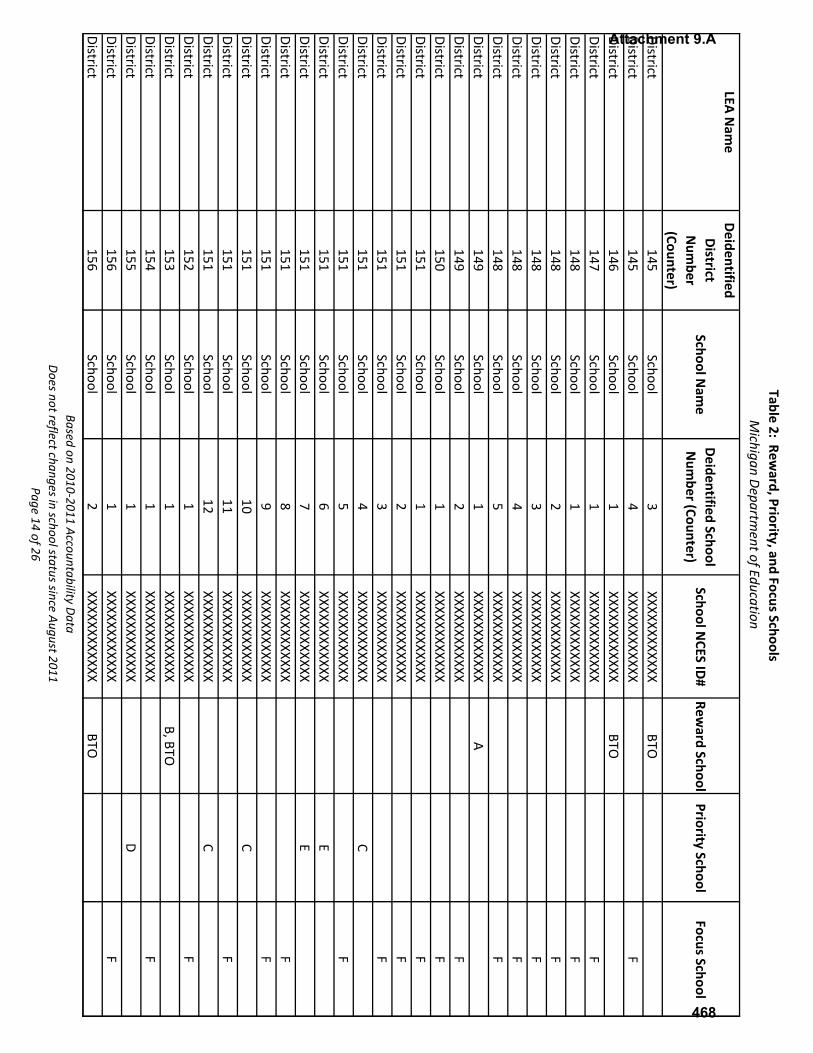
Table 2: Reward, Priority, and Focus Schools
Michigan Departm
ent of Education
LEA Nam
eDeidentified District
Num
ber (Counter)
School Nam
eDeidentified School Num
ber (Counter)School N
CES ID#
Reward School
Priority SchoolFocus School
District145
School3
XXXXXXXXXXXXBTO
District145
School4
XXXXXXXXXXXXF
District146
School1
XXXXXXXXXXXXBTO
District147
School1
XXXXXXXXXXXXF
District148
School1
XXXXXXXXXXXXF
District148
School2
XXXXXXXXXXXXF
District148
School3
XXXXXXXXXXXXF
District148
School4
XXXXXXXXXXXXF
District148
School5
XXXXXXXXXXXXF
District149
School1
XXXXXXXXXXXXA
District149
School2
XXXXXXXXXXXXF
District150
School1
XXXXXXXXXXXXF
District151
School1
XXXXXXXXXXXXF
District151
School2
XXXXXXXXXXXXF
District151
School3
XXXXXXXXXXXXF
District151
School4
XXXXXXXXXXXXC
District151
School5
XXXXXXXXXXXXF
District151
School6
XXXXXXXXXXXXE
District151
School7
XXXXXXXXXXXXE
District151
School8
XXXXXXXXXXXXF
District151
School9
XXXXXXXXXXXXF
District151
School10
XXXXXXXXXXXXC
District151
School11
XXXXXXXXXXXXF
District151
School12
XXXXXXXXXXXXC
District152
School1
XXXXXXXXXXXXF
District153
School1
XXXXXXXXXXXXB, BTO
District154
School1
XXXXXXXXXXXXF
District155
School1
XXXXXXXXXXXXD
District156
School1
XXXXXXXXXXXXF
District156
School2
XXXXXXXXXXXXBTO
Based on 2010‐2011 Accountability DataDoes not reflect changes in school status since August 2011
Page 14 of 26
Attachment 9.A
468
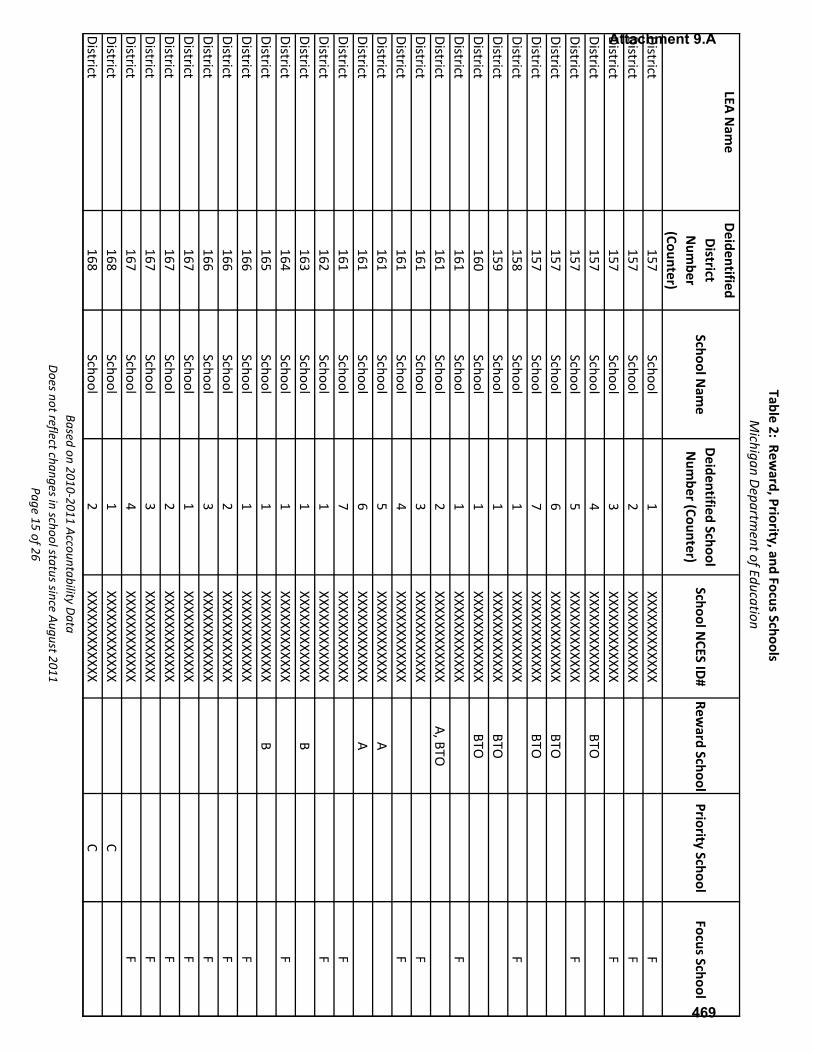
Table 2: Reward, Priority, and Focus Schools
Michigan Departm
ent of Education
LEA Nam
eDeidentified District
Num
ber (Counter)
School Nam
eDeidentified School Num
ber (Counter)School N
CES ID#
Reward School
Priority SchoolFocus School
District157
School1
XXXXXXXXXXXXF
District157
School2
XXXXXXXXXXXXF
District157
School3
XXXXXXXXXXXXF
District157
School4
XXXXXXXXXXXXBTO
District157
School5
XXXXXXXXXXXXF
District157
School6
XXXXXXXXXXXXBTO
District157
School7
XXXXXXXXXXXXBTO
District158
School1
XXXXXXXXXXXXF
District159
School1
XXXXXXXXXXXXBTO
District160
School1
XXXXXXXXXXXXBTO
District161
School1
XXXXXXXXXXXXF
District161
School2
XXXXXXXXXXXXA, BTO
District161
School3
XXXXXXXXXXXXF
District161
School4
XXXXXXXXXXXXF
District161
School5
XXXXXXXXXXXXA
District161
School6
XXXXXXXXXXXXA
District161
School7
XXXXXXXXXXXXF
District162
School1
XXXXXXXXXXXXF
District163
School1
XXXXXXXXXXXXB
District164
School1
XXXXXXXXXXXXF
District165
School1
XXXXXXXXXXXXB
District166
School1
XXXXXXXXXXXXF
District166
School2
XXXXXXXXXXXXF
District166
School3
XXXXXXXXXXXXF
District167
School1
XXXXXXXXXXXXF
District167
School2
XXXXXXXXXXXXF
District167
School3
XXXXXXXXXXXXF
District167
School4
XXXXXXXXXXXXF
District168
School1
XXXXXXXXXXXXC
District168
School2
XXXXXXXXXXXXC
Based on 2010‐2011 Accountability DataDoes not reflect changes in school status since August 2011
Page 15 of 26
Attachment 9.A
469
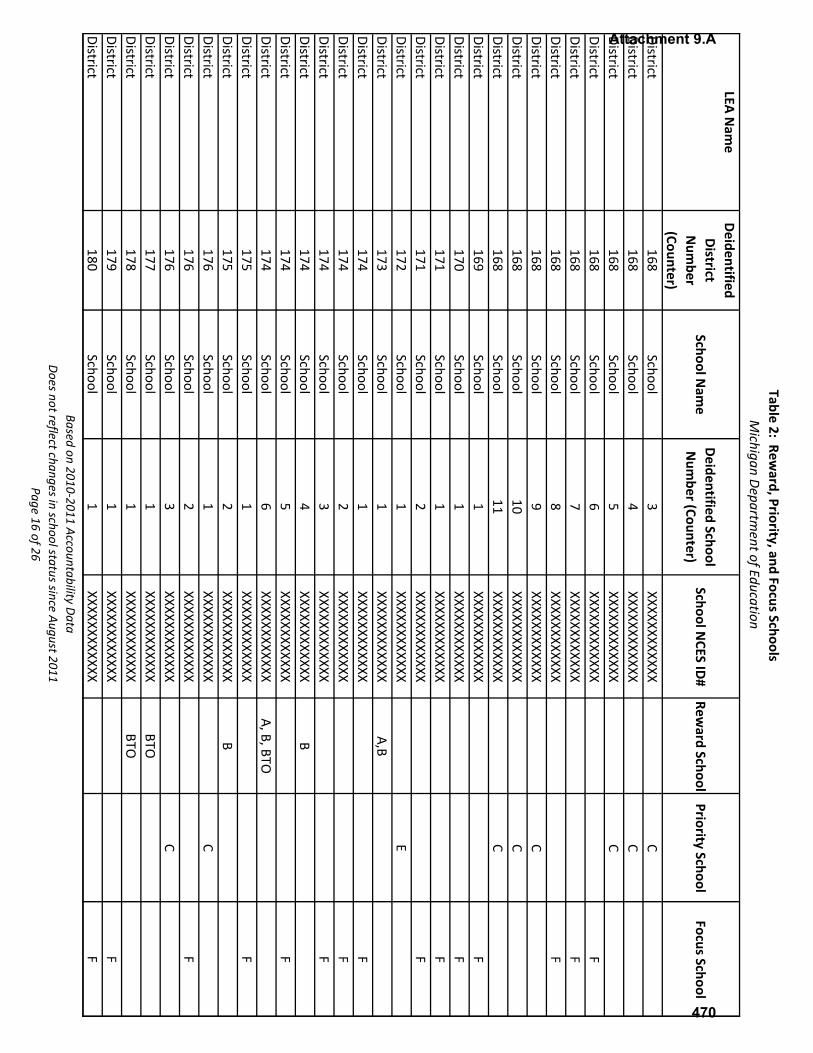
Table 2: Reward, Priority, and Focus Schools
Michigan Departm
ent of Education
LEA Nam
eDeidentified District
Num
ber (Counter)
School Nam
eDeidentified School Num
ber (Counter)School N
CES ID#
Reward School
Priority SchoolFocus School
District168
School3
XXXXXXXXXXXXC
District168
School4
XXXXXXXXXXXXC
District168
School5
XXXXXXXXXXXXC
District168
School6
XXXXXXXXXXXXF
District168
School7
XXXXXXXXXXXXF
District168
School8
XXXXXXXXXXXXF
District168
School9
XXXXXXXXXXXXC
District168
School10
XXXXXXXXXXXXC
District168
School11
XXXXXXXXXXXXC
District169
School1
XXXXXXXXXXXXF
District170
School1
XXXXXXXXXXXXF
District171
School1
XXXXXXXXXXXXF
District171
School2
XXXXXXXXXXXXF
District172
School1
XXXXXXXXXXXXE
District173
School1
XXXXXXXXXXXXA,B
District174
School1
XXXXXXXXXXXXF
District174
School2
XXXXXXXXXXXXF
District174
School3
XXXXXXXXXXXXF
District174
School4
XXXXXXXXXXXXB
District174
School5
XXXXXXXXXXXXF
District174
School6
XXXXXXXXXXXXA, B, BTO
District175
School1
XXXXXXXXXXXXF
District175
School2
XXXXXXXXXXXXB
District176
School1
XXXXXXXXXXXXC
District176
School2
XXXXXXXXXXXXF
District176
School3
XXXXXXXXXXXXC
District177
School1
XXXXXXXXXXXXBTO
District178
School1
XXXXXXXXXXXXBTO
District179
School1
XXXXXXXXXXXXF
District180
School1
XXXXXXXXXXXXF
Based on 2010‐2011 Accountability DataDoes not reflect changes in school status since August 2011
Page 16 of 26
Attachment 9.A
470

Table 2: Reward, Priority, and Focus Schools
Michigan Departm
ent of Education
LEA Nam
eDeidentified District
Num
ber (Counter)
School Nam
eDeidentified School Num
ber (Counter)School N
CES ID#
Reward School
Priority SchoolFocus School
District181
School1
XXXXXXXXXXXXF
District182
School1
XXXXXXXXXXXXB, BTO
District183
School1
XXXXXXXXXXXXF
District184
School1
XXXXXXXXXXXXF
District185
School1
XXXXXXXXXXXXB
District186
School1
XXXXXXXXXXXXBTO
District186
School2
XXXXXXXXXXXXF
District186
School3
XXXXXXXXXXXXF
District186
School4
XXXXXXXXXXXXF
District186
School5
XXXXXXXXXXXXB
District186
School6
XXXXXXXXXXXXA
District187
School1
XXXXXXXXXXXXF
District187
School2
XXXXXXXXXXXXF
District187
School3
XXXXXXXXXXXXF
District188
School1
XXXXXXXXXXXXC
District189
School1
XXXXXXXXXXXXBTO
District190
School1
XXXXXXXXXXXXC
District191
School1
XXXXXXXXXXXXB
District192
School1
XXXXXXXXXXXXC,E
District192
School2
XXXXXXXXXXXXF
District193
School1
XXXXXXXXXXXXE
District194
School1
XXXXXXXXXXXXF
District194
School2
XXXXXXXXXXXXBTO
District194
School3
XXXXXXXXXXXXF
District195
School1
XXXXXXXXXXXXF
District196
School1
XXXXXXXXXXXXC
District196
School2
XXXXXXXXXXXXC
District197
School1
XXXXXXXXXXXXC
District197
School2
XXXXXXXXXXXXC
District197
School3
XXXXXXXXXXXXC
Based on 2010‐2011 Accountability DataDoes not reflect changes in school status since August 2011
Page 17 of 26
Attachment 9.A
471
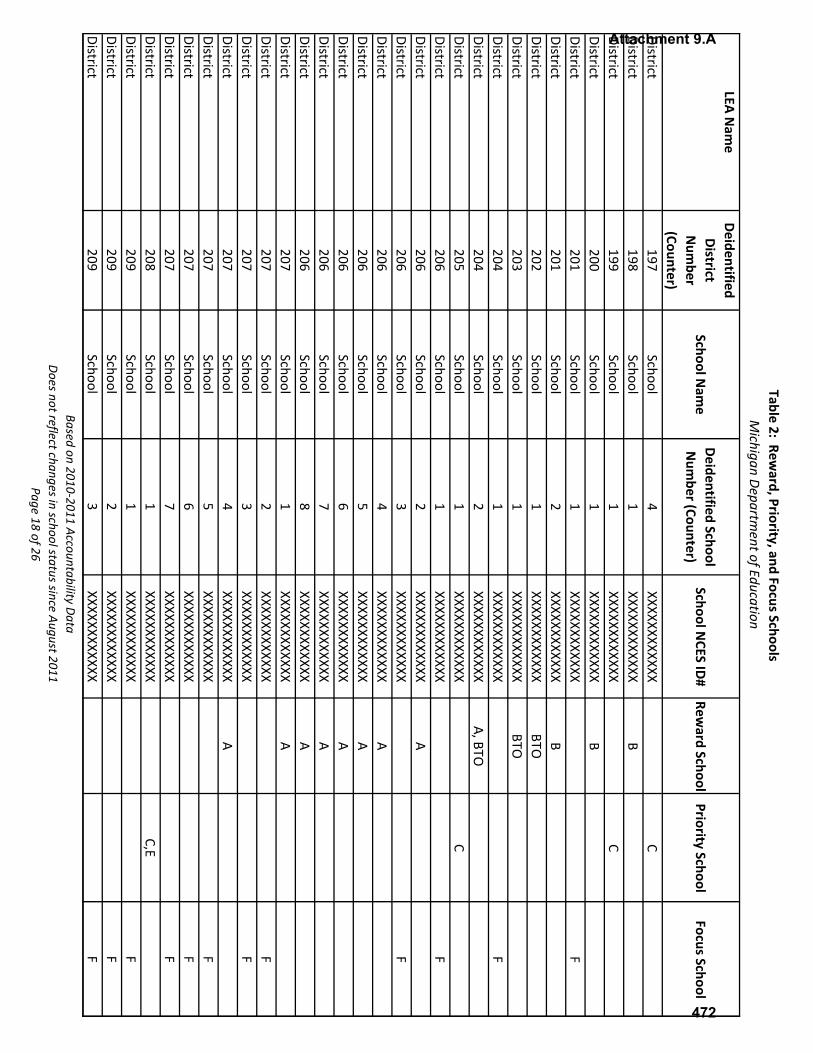
Table 2: Reward, Priority, and Focus Schools
Michigan Departm
ent of Education
LEA Nam
eDeidentified District
Num
ber (Counter)
School Nam
eDeidentified School Num
ber (Counter)School N
CES ID#
Reward School
Priority SchoolFocus School
District197
School4
XXXXXXXXXXXXC
District198
School1
XXXXXXXXXXXXB
District199
School1
XXXXXXXXXXXXC
District200
School1
XXXXXXXXXXXXB
District201
School1
XXXXXXXXXXXXF
District201
School2
XXXXXXXXXXXXB
District202
School1
XXXXXXXXXXXXBTO
District203
School1
XXXXXXXXXXXXBTO
District204
School1
XXXXXXXXXXXXF
District204
School2
XXXXXXXXXXXXA, BTO
District205
School1
XXXXXXXXXXXXC
District206
School1
XXXXXXXXXXXXF
District206
School2
XXXXXXXXXXXXA
District206
School3
XXXXXXXXXXXXF
District206
School4
XXXXXXXXXXXXA
District206
School5
XXXXXXXXXXXXA
District206
School6
XXXXXXXXXXXXA
District206
School7
XXXXXXXXXXXXA
District206
School8
XXXXXXXXXXXXA
District207
School1
XXXXXXXXXXXXA
District207
School2
XXXXXXXXXXXXF
District207
School3
XXXXXXXXXXXXF
District207
School4
XXXXXXXXXXXXA
District207
School5
XXXXXXXXXXXXF
District207
School6
XXXXXXXXXXXXF
District207
School7
XXXXXXXXXXXXF
District208
School1
XXXXXXXXXXXXC,E
District209
School1
XXXXXXXXXXXXF
District209
School2
XXXXXXXXXXXXF
District209
School3
XXXXXXXXXXXXF
Based on 2010‐2011 Accountability DataDoes not reflect changes in school status since August 2011
Page 18 of 26
Attachment 9.A
472

Table 2: Reward, Priority, and Focus Schools
Michigan Departm
ent of Education
LEA Nam
eDeidentified District
Num
ber (Counter)
School Nam
eDeidentified School Num
ber (Counter)School N
CES ID#
Reward School
Priority SchoolFocus School
District209
School4
XXXXXXXXXXXXF
District209
School5
XXXXXXXXXXXXF
District209
School6
XXXXXXXXXXXXF
District209
School7
XXXXXXXXXXXXF
District209
School8
XXXXXXXXXXXXF
District209
School9
XXXXXXXXXXXXF
District210
School1
XXXXXXXXXXXXF
District211
School1
XXXXXXXXXXXXF
District211
School2
XXXXXXXXXXXXC
District211
School3
XXXXXXXXXXXXF
District212
School1
XXXXXXXXXXXXA,B
District213
School1
XXXXXXXXXXXXF
District213
School2
XXXXXXXXXXXXBTO
District214
School1
XXXXXXXXXXXXF
District215
School1
XXXXXXXXXXXXA
District216
School1
XXXXXXXXXXXXF
District217
School1
XXXXXXXXXXXXF
District218
School1
XXXXXXXXXXXXF
District219
School1
XXXXXXXXXXXXBTO
District220
School1
XXXXXXXXXXXXB
District221
School1
XXXXXXXXXXXXBTO
District221
School2
XXXXXXXXXXXXF
District222
School1
XXXXXXXXXXXXA,B
District222
School2
XXXXXXXXXXXXF
District222
School3
XXXXXXXXXXXXF
District222
School4
XXXXXXXXXXXXA
District222
School5
XXXXXXXXXXXXF
District222
School6
XXXXXXXXXXXXA
District223
School1
XXXXXXXXXXXXF
District224
School1
XXXXXXXXXXXXC
Based on 2010‐2011 Accountability DataDoes not reflect changes in school status since August 2011
Page 19 of 26
Attachment 9.A
473

Table 2: Reward, Priority, and Focus Schools
Michigan Departm
ent of Education
LEA Nam
eDeidentified District
Num
ber (Counter)
School Nam
eDeidentified School Num
ber (Counter)School N
CES ID#
Reward School
Priority SchoolFocus School
District224
School2
XXXXXXXXXXXXC
District224
School3
XXXXXXXXXXXXC
District224
School4
XXXXXXXXXXXXC
District224
School5
XXXXXXXXXXXXC
District225
School1
XXXXXXXXXXXXC
District225
School2
XXXXXXXXXXXXF
District225
School3
XXXXXXXXXXXXF
District226
School1
XXXXXXXXXXXXA
District226
School2
XXXXXXXXXXXXF
District226
School3
XXXXXXXXXXXXF
District226
School4
XXXXXXXXXXXXBTO
District227
School1
XXXXXXXXXXXXF
District228
School1
XXXXXXXXXXXXBTO
District229
School1
XXXXXXXXXXXXF
District230
School1
XXXXXXXXXXXXF
District230
School2
XXXXXXXXXXXXF
District231
School1
XXXXXXXXXXXXF
District232
School1
XXXXXXXXXXXXC
District232
School2
XXXXXXXXXXXXC,E
District233
School1
XXXXXXXXXXXXF
District233
School2
XXXXXXXXXXXXA, BTO
District233
School3
XXXXXXXXXXXXF
District233
School4
XXXXXXXXXXXXA,B
District233
School5
XXXXXXXXXXXXF
District233
School6
XXXXXXXXXXXXF
District233
School7
XXXXXXXXXXXXA
District233
School8
XXXXXXXXXXXXA,B
District233
School9
XXXXXXXXXXXXF
District233
School10
XXXXXXXXXXXXF
District233
School11
XXXXXXXXXXXXF
Based on 2010‐2011 Accountability DataDoes not reflect changes in school status since August 2011
Page 20 of 26
Attachment 9.A
474
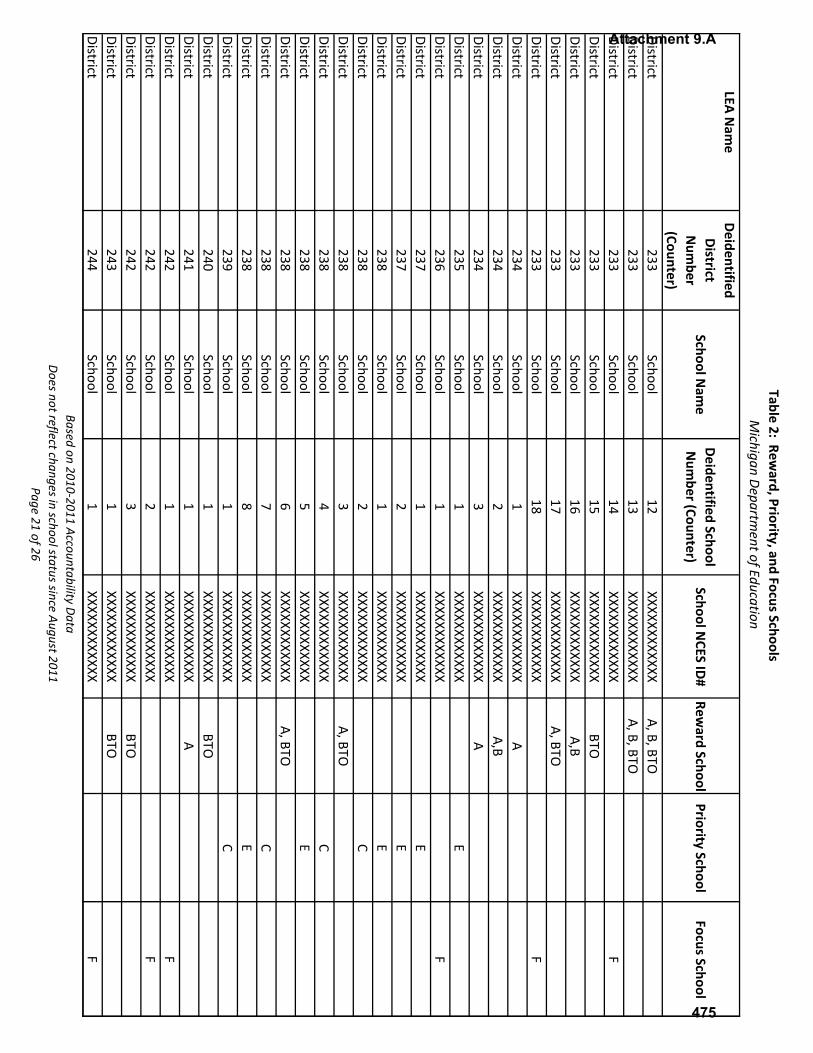
Table 2: Reward, Priority, and Focus Schools
Michigan Departm
ent of Education
LEA Nam
eDeidentified District
Num
ber (Counter)
School Nam
eDeidentified School Num
ber (Counter)School N
CES ID#
Reward School
Priority SchoolFocus School
District233
School12
XXXXXXXXXXXXA, B, BTO
District233
School13
XXXXXXXXXXXXA, B, BTO
District233
School14
XXXXXXXXXXXXF
District233
School15
XXXXXXXXXXXXBTO
District233
School16
XXXXXXXXXXXXA,B
District233
School17
XXXXXXXXXXXXA, BTO
District233
School18
XXXXXXXXXXXXF
District234
School1
XXXXXXXXXXXXA
District234
School2
XXXXXXXXXXXXA,B
District234
School3
XXXXXXXXXXXXA
District235
School1
XXXXXXXXXXXXE
District236
School1
XXXXXXXXXXXXF
District237
School1
XXXXXXXXXXXXE
District237
School2
XXXXXXXXXXXXE
District238
School1
XXXXXXXXXXXXE
District238
School2
XXXXXXXXXXXXC
District238
School3
XXXXXXXXXXXXA, BTO
District238
School4
XXXXXXXXXXXXC
District238
School5
XXXXXXXXXXXXE
District238
School6
XXXXXXXXXXXXA, BTO
District238
School7
XXXXXXXXXXXXC
District238
School8
XXXXXXXXXXXXE
District239
School1
XXXXXXXXXXXXC
District240
School1
XXXXXXXXXXXXBTO
District241
School1
XXXXXXXXXXXXA
District242
School1
XXXXXXXXXXXXF
District242
School2
XXXXXXXXXXXXF
District242
School3
XXXXXXXXXXXXBTO
District243
School1
XXXXXXXXXXXXBTO
District244
School1
XXXXXXXXXXXXF
Based on 2010‐2011 Accountability DataDoes not reflect changes in school status since August 2011
Page 21 of 26
Attachment 9.A
475
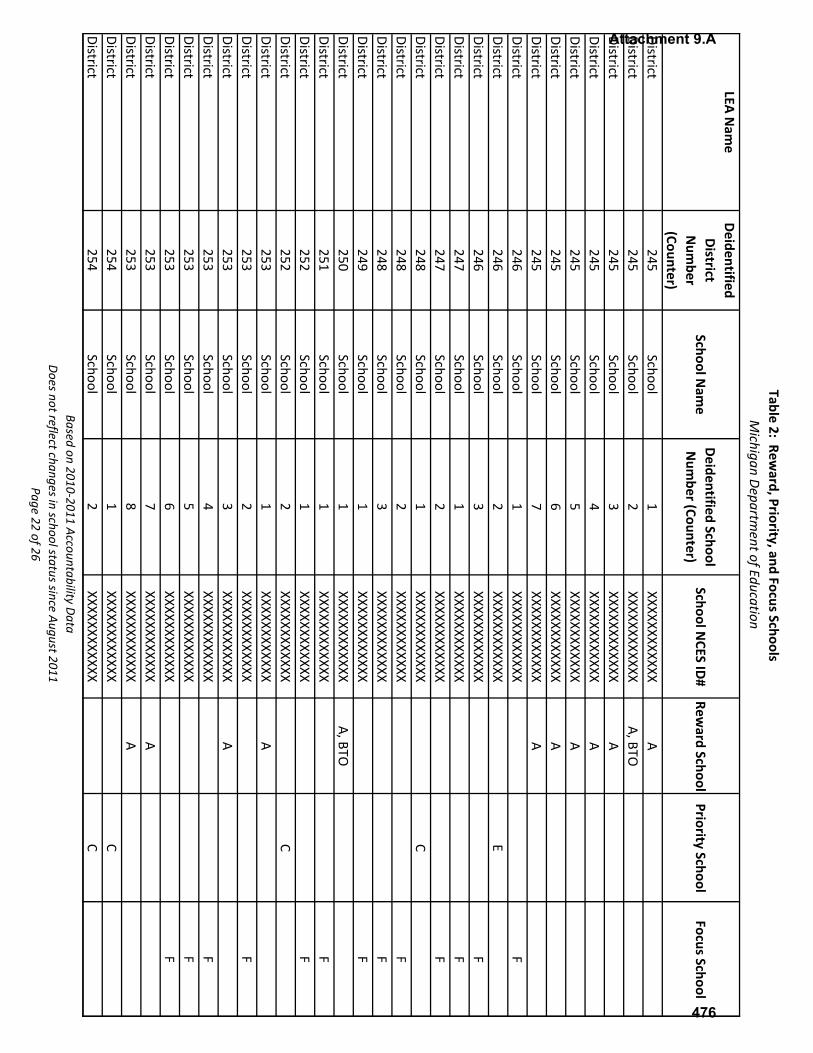
Table 2: Reward, Priority, and Focus Schools
Michigan Departm
ent of Education
LEA Nam
eDeidentified District
Num
ber (Counter)
School Nam
eDeidentified School Num
ber (Counter)School N
CES ID#
Reward School
Priority SchoolFocus School
District245
School1
XXXXXXXXXXXXA
District245
School2
XXXXXXXXXXXXA, BTO
District245
School3
XXXXXXXXXXXXA
District245
School4
XXXXXXXXXXXXA
District245
School5
XXXXXXXXXXXXA
District245
School6
XXXXXXXXXXXXA
District245
School7
XXXXXXXXXXXXA
District246
School1
XXXXXXXXXXXXF
District246
School2
XXXXXXXXXXXXE
District246
School3
XXXXXXXXXXXXF
District247
School1
XXXXXXXXXXXXF
District247
School2
XXXXXXXXXXXXF
District248
School1
XXXXXXXXXXXXC
District248
School2
XXXXXXXXXXXXF
District248
School3
XXXXXXXXXXXXF
District249
School1
XXXXXXXXXXXXF
District250
School1
XXXXXXXXXXXXA, BTO
District251
School1
XXXXXXXXXXXXF
District252
School1
XXXXXXXXXXXXF
District252
School2
XXXXXXXXXXXXC
District253
School1
XXXXXXXXXXXXA
District253
School2
XXXXXXXXXXXXF
District253
School3
XXXXXXXXXXXXA
District253
School4
XXXXXXXXXXXXF
District253
School5
XXXXXXXXXXXXF
District253
School6
XXXXXXXXXXXXF
District253
School7
XXXXXXXXXXXXA
District253
School8
XXXXXXXXXXXXA
District254
School1
XXXXXXXXXXXXC
District254
School2
XXXXXXXXXXXXC
Based on 2010‐2011 Accountability DataDoes not reflect changes in school status since August 2011
Page 22 of 26
Attachment 9.A
476

Table 2: Reward, Priority, and Focus Schools
Michigan Departm
ent of Education
LEA Nam
eDeidentified District
Num
ber (Counter)
School Nam
eDeidentified School Num
ber (Counter)School N
CES ID#
Reward School
Priority SchoolFocus School
District254
School3
XXXXXXXXXXXXF
District255
School1
XXXXXXXXXXXXA, B, BTO
District255
School2
XXXXXXXXXXXXA, B, BTO
District255
School3
XXXXXXXXXXXXA
District256
School1
XXXXXXXXXXXXE
District257
School1
XXXXXXXXXXXXA
District258
School1
XXXXXXXXXXXXB
District259
School1
XXXXXXXXXXXXA, BTO
District260
School1
XXXXXXXXXXXXBTO
District261
School1
XXXXXXXXXXXXBTO
District262
School1
XXXXXXXXXXXXBTO
District263
School1
XXXXXXXXXXXXB
District264
School1
XXXXXXXXXXXXF
District265
School1
XXXXXXXXXXXXF
District265
School2
XXXXXXXXXXXXB
District266
School1
XXXXXXXXXXXXBTO
District267
School1
XXXXXXXXXXXXF
District268
School1
XXXXXXXXXXXXBTO
District269
School1
XXXXXXXXXXXXC
District270
School1
XXXXXXXXXXXXC
District271
School1
XXXXXXXXXXXXBTO
District272
School1
XXXXXXXXXXXXF
District272
School2
XXXXXXXXXXXXA,B
District272
School3
XXXXXXXXXXXXF
District272
School4
XXXXXXXXXXXXF
District272
School5
XXXXXXXXXXXXA
District272
School6
XXXXXXXXXXXXF
District272
School7
XXXXXXXXXXXXA
District272
School8
XXXXXXXXXXXXF
District272
School9
XXXXXXXXXXXXF
Based on 2010‐2011 Accountability DataDoes not reflect changes in school status since August 2011
Page 23 of 26
Attachment 9.A
477
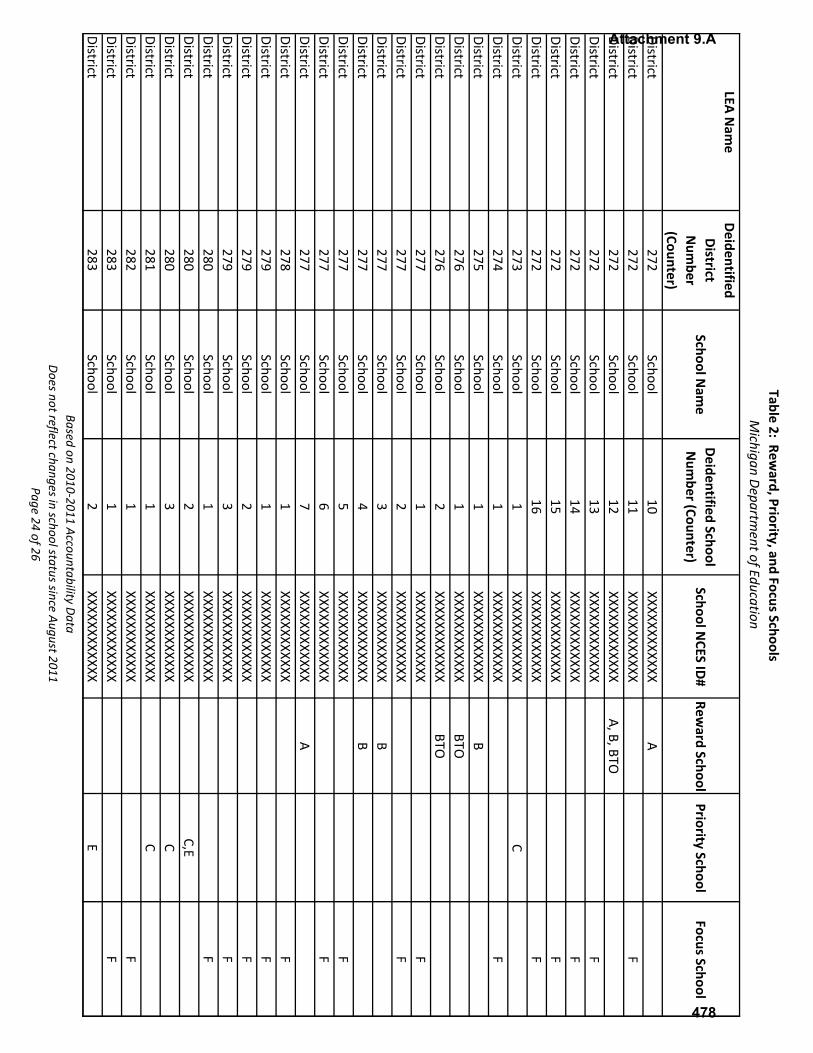
Table 2: Reward, Priority, and Focus Schools
Michigan Departm
ent of Education
LEA Nam
eDeidentified District
Num
ber (Counter)
School Nam
eDeidentified School Num
ber (Counter)School N
CES ID#
Reward School
Priority SchoolFocus School
District272
School10
XXXXXXXXXXXXA
District272
School11
XXXXXXXXXXXXF
District272
School12
XXXXXXXXXXXXA, B, BTO
District272
School13
XXXXXXXXXXXXF
District272
School14
XXXXXXXXXXXXF
District272
School15
XXXXXXXXXXXXF
District272
School16
XXXXXXXXXXXXF
District273
School1
XXXXXXXXXXXXC
District274
School1
XXXXXXXXXXXXF
District275
School1
XXXXXXXXXXXXB
District276
School1
XXXXXXXXXXXXBTO
District276
School2
XXXXXXXXXXXXBTO
District277
School1
XXXXXXXXXXXXF
District277
School2
XXXXXXXXXXXXF
District277
School3
XXXXXXXXXXXXB
District277
School4
XXXXXXXXXXXXB
District277
School5
XXXXXXXXXXXXF
District277
School6
XXXXXXXXXXXXF
District277
School7
XXXXXXXXXXXXA
District278
School1
XXXXXXXXXXXXF
District279
School1
XXXXXXXXXXXXF
District279
School2
XXXXXXXXXXXXF
District279
School3
XXXXXXXXXXXXF
District280
School1
XXXXXXXXXXXXF
District280
School2
XXXXXXXXXXXXC,E
District280
School3
XXXXXXXXXXXXC
District281
School1
XXXXXXXXXXXXC
District282
School1
XXXXXXXXXXXXF
District283
School1
XXXXXXXXXXXXF
District283
School2
XXXXXXXXXXXXE
Based on 2010‐2011 Accountability DataDoes not reflect changes in school status since August 2011
Page 24 of 26
Attachment 9.A
478

Table 2: Reward, Priority, and Focus Schools
Michigan Departm
ent of Education
LEA Nam
eDeidentified District
Num
ber (Counter)
School Nam
eDeidentified School Num
ber (Counter)School N
CES ID#
Reward School
Priority SchoolFocus School
District284
School1
XXXXXXXXXXXXA
District284
School2
XXXXXXXXXXXXA
District284
School3
XXXXXXXXXXXXF
District284
School4
XXXXXXXXXXXXF
District284
School5
XXXXXXXXXXXXA,B
District284
School6
XXXXXXXXXXXXF
District284
School7
XXXXXXXXXXXXF
District284
School8
XXXXXXXXXXXXA,B
District284
School9
XXXXXXXXXXXXF
District284
School10
XXXXXXXXXXXXF
District284
School11
XXXXXXXXXXXXF
District285
School1
XXXXXXXXXXXXF
District285
School2
XXXXXXXXXXXXF
District285
School3
XXXXXXXXXXXXF
District285
School4
XXXXXXXXXXXXF
District286
School1
XXXXXXXXXXXXF
District287
School1
XXXXXXXXXXXXF
District288
School1
XXXXXXXXXXXXE
District288
School2
XXXXXXXXXXXXF
District289
School1
XXXXXXXXXXXXF
District290
School1
XXXXXXXXXXXXF
District290
School2
XXXXXXXXXXXXF
District290
School3
XXXXXXXXXXXXF
District290
School4
XXXXXXXXXXXXF
District290
School5
XXXXXXXXXXXXC
District291
School1
XXXXXXXXXXXXF
District291
School2
XXXXXXXXXXXXF
District291
School3
XXXXXXXXXXXXF
District291
School4
XXXXXXXXXXXXF
District291
School5
XXXXXXXXXXXXF
Based on 2010‐2011 Accountability DataDoes not reflect changes in school status since August 2011
Page 25 of 26
Attachment 9.A
479

Table 2: Reward, Priority, and Focus Schools
Michigan Departm
ent of Education
LEA Nam
eDeidentified District
Num
ber (Counter)
School Nam
eDeidentified School Num
ber (Counter)School N
CES ID#
Reward School
Priority SchoolFocus School
District291
School6
XXXXXXXXXXXXF
District292
School1
XXXXXXXXXXXXF
District293
School1
XXXXXXXXXXXXF
District293
School2
XXXXXXXXXXXXF
District293
School3
XXXXXXXXXXXXF
District293
School4
XXXXXXXXXXXXF
District293
School5
XXXXXXXXXXXXF
District294
School1
XXXXXXXXXXXXB, BTO
District294
School2
XXXXXXXXXXXXF
District295
School1
XXXXXXXXXXXXE
District296
School1
XXXXXXXXXXXXF
District296
School2
XXXXXXXXXXXXF
District297
School1
XXXXXXXXXXXXBTO
District298
School1
XXXXXXXXXXXXC
District298
School2
XXXXXXXXXXXXC
District298
School3
XXXXXXXXXXXXD
District299
School1
XXXXXXXXXXXXF
District299
School2
XXXXXXXXXXXXB
Total Num
ber of Schools:243
185340
Title I Schools:109
141206
Total Num
ber of Title I Schools in the State: 2006Total N
umber of Title I Participating H
igh Schools in the State with G
raduation Rates Less than 60%: 5
Based on 2010‐2011 Accountability DataDoes not reflect changes in school status since August 2011
Page 26 of 26
Attachment 9.A
480
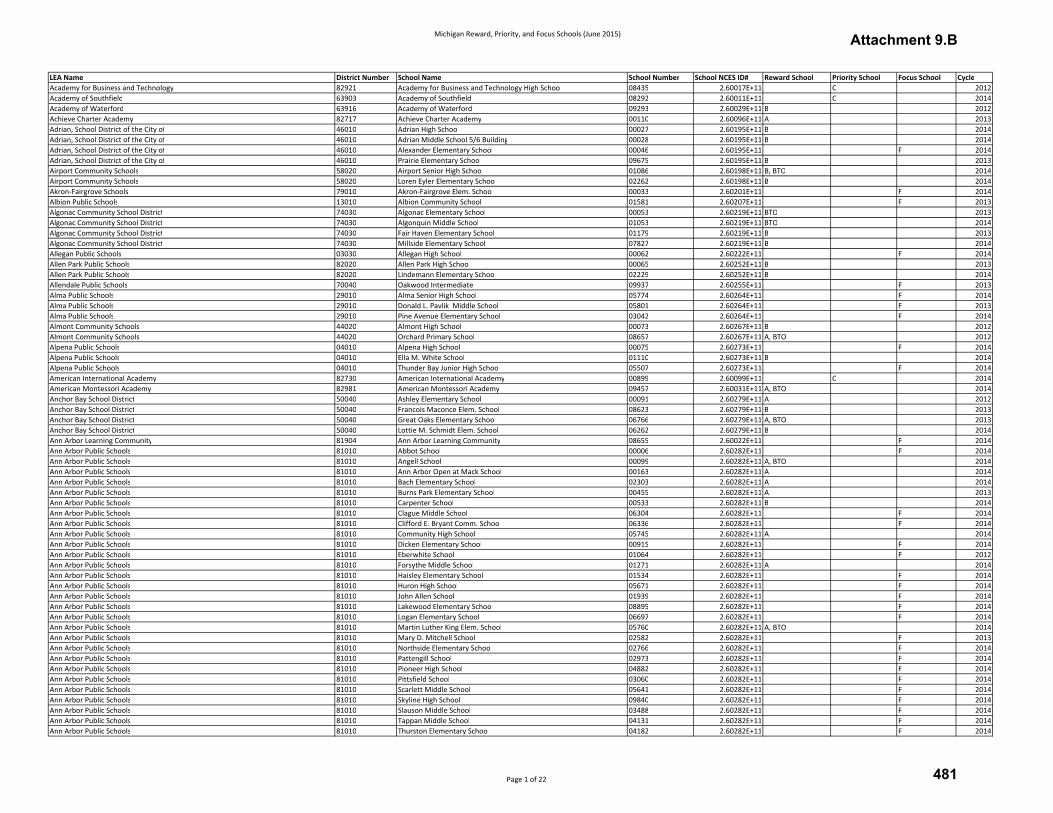
Michigan Reward, Priority, and Focus Schools (June 2015)
LEA Name District Number School Name School Number School NCES ID# Reward School Priority School Focus School Cycle
Academy for Business and Technology 82921 Academy for Business and Technology High School 08435 2.60017E+11 C 2012
Academy of Southfield 63903 Academy of Southfield 08292 2.60011E+11 C 2014
Academy of Waterford 63916 Academy of Waterford 09293 2.60029E+11 B 2012
Achieve Charter Academy 82717 Achieve Charter Academy 00110 2.60096E+11 A 2013
Adrian, School District of the City of 46010 Adrian High School 00027 2.60195E+11 B 2014
Adrian, School District of the City of 46010 Adrian Middle School 5/6 Building 00028 2.60195E+11 B 2014
Adrian, School District of the City of 46010 Alexander Elementary School 00046 2.60195E+11 F 2014
Adrian, School District of the City of 46010 Prairie Elementary School 09675 2.60195E+11 B 2013
Airport Community Schools 58020 Airport Senior High School 01086 2.60198E+11 B, BTO 2014
Airport Community Schools 58020 Loren Eyler Elementary School 02262 2.60198E+11 B 2014
Akron-Fairgrove Schools 79010 Akron-Fairgrove Elem. School 00033 2.60201E+11 F 2014
Albion Public Schools 13010 Albion Community School 01581 2.60207E+11 F 2013
Algonac Community School District 74030 Algonac Elementary School 00053 2.60219E+11 BTO 2013
Algonac Community School District 74030 Algonquin Middle School 01053 2.60219E+11 BTO 2014
Algonac Community School District 74030 Fair Haven Elementary School 01179 2.60219E+11 B 2013
Algonac Community School District 74030 Millside Elementary School 07827 2.60219E+11 B 2014
Allegan Public Schools 03030 Allegan High School 00062 2.60222E+11 F 2014
Allen Park Public Schools 82020 Allen Park High School 00065 2.60252E+11 B 2013
Allen Park Public Schools 82020 Lindemann Elementary School 02229 2.60252E+11 B 2014
Allendale Public Schools 70040 Oakwood Intermediate 09937 2.60255E+11 F 2013
Alma Public Schools 29010 Alma Senior High School 05774 2.60264E+11 F 2014
Alma Public Schools 29010 Donald L. Pavlik Middle School 05801 2.60264E+11 F 2013
Alma Public Schools 29010 Pine Avenue Elementary School 03042 2.60264E+11 F 2014
Almont Community Schools 44020 Almont High School 00073 2.60267E+11 B 2012
Almont Community Schools 44020 Orchard Primary School 08657 2.60267E+11 A, BTO 2012
Alpena Public Schools 04010 Alpena High School 00075 2.60273E+11 F 2014
Alpena Public Schools 04010 Ella M. White School 01110 2.60273E+11 B 2014
Alpena Public Schools 04010 Thunder Bay Junior High School 05507 2.60273E+11 F 2014
American International Academy 82730 American International Academy 00899 2.60099E+11 C 2014
American Montessori Academy 82981 American Montessori Academy 09457 2.60031E+11 A, BTO 2014
Anchor Bay School District 50040 Ashley Elementary School 00091 2.60279E+11 A 2012
Anchor Bay School District 50040 Francois Maconce Elem. School 08623 2.60279E+11 B 2013
Anchor Bay School District 50040 Great Oaks Elementary School 06766 2.60279E+11 A, BTO 2013
Anchor Bay School District 50040 Lottie M. Schmidt Elem. School 06262 2.60279E+11 B 2014
Ann Arbor Learning Community 81904 Ann Arbor Learning Community 08655 2.60022E+11 F 2014
Ann Arbor Public Schools 81010 Abbot School 00006 2.60282E+11 F 2014
Ann Arbor Public Schools 81010 Angell School 00099 2.60282E+11 A, BTO 2014
Ann Arbor Public Schools 81010 Ann Arbor Open at Mack School 00163 2.60282E+11 A 2014
Ann Arbor Public Schools 81010 Bach Elementary School 02303 2.60282E+11 A 2014
Ann Arbor Public Schools 81010 Burns Park Elementary School 00455 2.60282E+11 A 2013
Ann Arbor Public Schools 81010 Carpenter School 00533 2.60282E+11 B 2014
Ann Arbor Public Schools 81010 Clague Middle School 06304 2.60282E+11 F 2014
Ann Arbor Public Schools 81010 Clifford E. Bryant Comm. School 06336 2.60282E+11 F 2014
Ann Arbor Public Schools 81010 Community High School 05745 2.60282E+11 A 2014
Ann Arbor Public Schools 81010 Dicken Elementary School 00915 2.60282E+11 F 2014
Ann Arbor Public Schools 81010 Eberwhite School 01064 2.60282E+11 F 2012
Ann Arbor Public Schools 81010 Forsythe Middle School 01271 2.60282E+11 A 2014
Ann Arbor Public Schools 81010 Haisley Elementary School 01534 2.60282E+11 F 2014
Ann Arbor Public Schools 81010 Huron High School 05671 2.60282E+11 F 2014
Ann Arbor Public Schools 81010 John Allen School 01939 2.60282E+11 F 2014
Ann Arbor Public Schools 81010 Lakewood Elementary School 08895 2.60282E+11 F 2014
Ann Arbor Public Schools 81010 Logan Elementary School 06697 2.60282E+11 F 2014
Ann Arbor Public Schools 81010 Martin Luther King Elem. School 05760 2.60282E+11 A, BTO 2014
Ann Arbor Public Schools 81010 Mary D. Mitchell School 02582 2.60282E+11 F 2013
Ann Arbor Public Schools 81010 Northside Elementary School 02766 2.60282E+11 F 2014
Ann Arbor Public Schools 81010 Pattengill School 02973 2.60282E+11 F 2014
Ann Arbor Public Schools 81010 Pioneer High School 04882 2.60282E+11 F 2014
Ann Arbor Public Schools 81010 Pittsfield School 03060 2.60282E+11 F 2014
Ann Arbor Public Schools 81010 Scarlett Middle School 05641 2.60282E+11 F 2014
Ann Arbor Public Schools 81010 Skyline High School 09840 2.60282E+11 F 2014
Ann Arbor Public Schools 81010 Slauson Middle School 03488 2.60282E+11 F 2014
Ann Arbor Public Schools 81010 Tappan Middle School 04131 2.60282E+11 F 2014
Ann Arbor Public Schools 81010 Thurston Elementary School 04182 2.60282E+11 F 2014
Page 1 of 22
Attachment 9.B
481
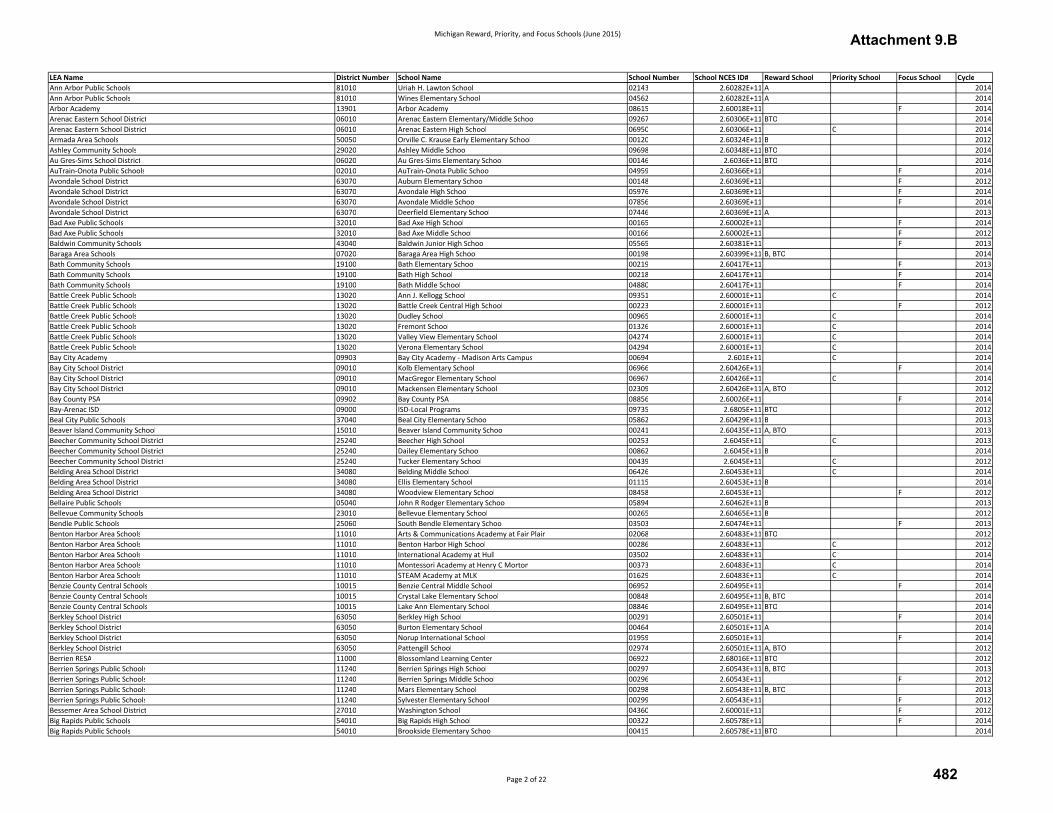
Michigan Reward, Priority, and Focus Schools (June 2015)
LEA Name District Number School Name School Number School NCES ID# Reward School Priority School Focus School Cycle
Ann Arbor Public Schools 81010 Uriah H. Lawton School 02143 2.60282E+11 A 2014
Ann Arbor Public Schools 81010 Wines Elementary School 04562 2.60282E+11 A 2014
Arbor Academy 13901 Arbor Academy 08615 2.60018E+11 F 2014
Arenac Eastern School District 06010 Arenac Eastern Elementary/Middle School 09267 2.60306E+11 BTO 2014
Arenac Eastern School District 06010 Arenac Eastern High School 06950 2.60306E+11 C 2014
Armada Area Schools 50050 Orville C. Krause Early Elementary School 00120 2.60324E+11 B 2012
Ashley Community Schools 29020 Ashley Middle School 09698 2.60348E+11 BTO 2014
Au Gres-Sims School District 06020 Au Gres-Sims Elementary School 00146 2.6036E+11 BTO 2014
AuTrain-Onota Public Schools 02010 AuTrain-Onota Public School 04959 2.60366E+11 F 2014
Avondale School District 63070 Auburn Elementary School 00148 2.60369E+11 F 2012
Avondale School District 63070 Avondale High School 05976 2.60369E+11 F 2014
Avondale School District 63070 Avondale Middle School 07856 2.60369E+11 F 2014
Avondale School District 63070 Deerfield Elementary School 07446 2.60369E+11 A 2013
Bad Axe Public Schools 32010 Bad Axe High School 00165 2.60002E+11 F 2014
Bad Axe Public Schools 32010 Bad Axe Middle School 00166 2.60002E+11 F 2012
Baldwin Community Schools 43040 Baldwin Junior High School 05565 2.60381E+11 F 2013
Baraga Area Schools 07020 Baraga Area High School 00198 2.60399E+11 B, BTO 2014
Bath Community Schools 19100 Bath Elementary School 00219 2.60417E+11 F 2013
Bath Community Schools 19100 Bath High School 00218 2.60417E+11 F 2014
Bath Community Schools 19100 Bath Middle School 04880 2.60417E+11 F 2014
Battle Creek Public Schools 13020 Ann J. Kellogg School 09351 2.60001E+11 C 2014
Battle Creek Public Schools 13020 Battle Creek Central High School 00223 2.60001E+11 F 2012
Battle Creek Public Schools 13020 Dudley School 00965 2.60001E+11 C 2014
Battle Creek Public Schools 13020 Fremont School 01326 2.60001E+11 C 2014
Battle Creek Public Schools 13020 Valley View Elementary School 04274 2.60001E+11 C 2014
Battle Creek Public Schools 13020 Verona Elementary School 04294 2.60001E+11 C 2014
Bay City Academy 09903 Bay City Academy - Madison Arts Campus 00694 2.601E+11 C 2014
Bay City School District 09010 Kolb Elementary School 06966 2.60426E+11 F 2014
Bay City School District 09010 MacGregor Elementary School 06967 2.60426E+11 C 2014
Bay City School District 09010 Mackensen Elementary School 02309 2.60426E+11 A, BTO 2012
Bay County PSA 09902 Bay County PSA 08856 2.60026E+11 F 2014
Bay-Arenac ISD 09000 ISD-Local Programs 09735 2.6805E+11 BTO 2012
Beal City Public Schools 37040 Beal City Elementary School 05862 2.60429E+11 B 2013
Beaver Island Community School 15010 Beaver Island Community School 00241 2.60435E+11 A, BTO 2013
Beecher Community School District 25240 Beecher High School 00253 2.6045E+11 C 2013
Beecher Community School District 25240 Dailey Elementary School 00862 2.6045E+11 B 2014
Beecher Community School District 25240 Tucker Elementary School 00439 2.6045E+11 C 2012
Belding Area School District 34080 Belding Middle School 06426 2.60453E+11 C 2014
Belding Area School District 34080 Ellis Elementary School 01115 2.60453E+11 B 2014
Belding Area School District 34080 Woodview Elementary School 08458 2.60453E+11 F 2012
Bellaire Public Schools 05040 John R Rodger Elementary School 05894 2.60462E+11 B 2013
Bellevue Community Schools 23010 Bellevue Elementary School 00265 2.60465E+11 B 2012
Bendle Public Schools 25060 South Bendle Elementary School 03503 2.60474E+11 F 2013
Benton Harbor Area Schools 11010 Arts & Communications Academy at Fair Plain 02068 2.60483E+11 BTO 2012
Benton Harbor Area Schools 11010 Benton Harbor High School 00286 2.60483E+11 C 2012
Benton Harbor Area Schools 11010 International Academy at Hull 03502 2.60483E+11 C 2014
Benton Harbor Area Schools 11010 Montessori Academy at Henry C Morton 00373 2.60483E+11 C 2014
Benton Harbor Area Schools 11010 STEAM Academy at MLK 01629 2.60483E+11 C 2014
Benzie County Central Schools 10015 Benzie Central Middle School 06952 2.60495E+11 F 2014
Benzie County Central Schools 10015 Crystal Lake Elementary School 00848 2.60495E+11 B, BTO 2014
Benzie County Central Schools 10015 Lake Ann Elementary School 08846 2.60495E+11 BTO 2014
Berkley School District 63050 Berkley High School 00291 2.60501E+11 F 2014
Berkley School District 63050 Burton Elementary School 00464 2.60501E+11 A 2014
Berkley School District 63050 Norup International School 01959 2.60501E+11 F 2014
Berkley School District 63050 Pattengill School 02974 2.60501E+11 A, BTO 2012
Berrien RESA 11000 Blossomland Learning Center 06922 2.68016E+11 BTO 2012
Berrien Springs Public Schools 11240 Berrien Springs High School 00297 2.60543E+11 B, BTO 2013
Berrien Springs Public Schools 11240 Berrien Springs Middle School 00296 2.60543E+11 F 2012
Berrien Springs Public Schools 11240 Mars Elementary School 00298 2.60543E+11 B, BTO 2013
Berrien Springs Public Schools 11240 Sylvester Elementary School 00299 2.60543E+11 F 2012
Bessemer Area School District 27010 Washington School 04360 2.60001E+11 F 2012
Big Rapids Public Schools 54010 Big Rapids High School 00322 2.60578E+11 F 2014
Big Rapids Public Schools 54010 Brookside Elementary School 00415 2.60578E+11 BTO 2014
Page 2 of 22
Attachment 9.B
482
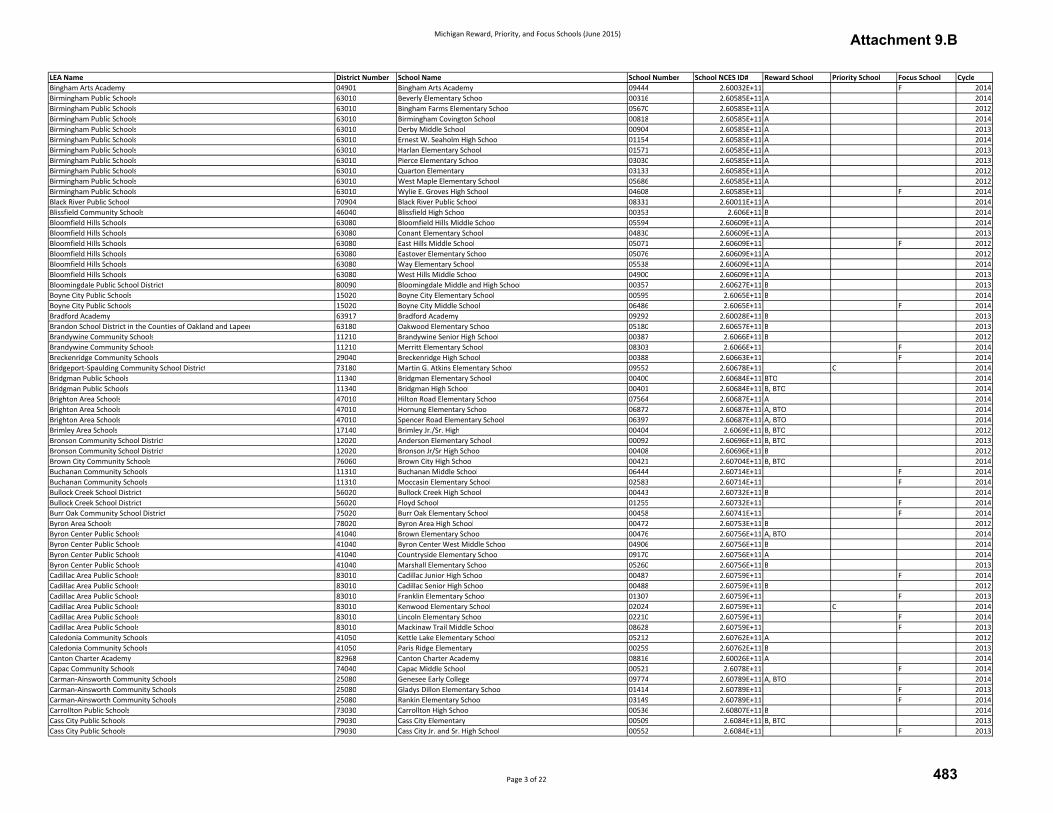
Michigan Reward, Priority, and Focus Schools (June 2015)
LEA Name District Number School Name School Number School NCES ID# Reward School Priority School Focus School Cycle
Bingham Arts Academy 04901 Bingham Arts Academy 09444 2.60032E+11 F 2014
Birmingham Public Schools 63010 Beverly Elementary School 00316 2.60585E+11 A 2014
Birmingham Public Schools 63010 Bingham Farms Elementary School 05670 2.60585E+11 A 2012
Birmingham Public Schools 63010 Birmingham Covington School 00818 2.60585E+11 A 2014
Birmingham Public Schools 63010 Derby Middle School 00904 2.60585E+11 A 2013
Birmingham Public Schools 63010 Ernest W. Seaholm High School 01154 2.60585E+11 A 2014
Birmingham Public Schools 63010 Harlan Elementary School 01571 2.60585E+11 A 2013
Birmingham Public Schools 63010 Pierce Elementary School 03030 2.60585E+11 A 2013
Birmingham Public Schools 63010 Quarton Elementary 03133 2.60585E+11 A 2012
Birmingham Public Schools 63010 West Maple Elementary School 05686 2.60585E+11 A 2012
Birmingham Public Schools 63010 Wylie E. Groves High School 04608 2.60585E+11 F 2014
Black River Public School 70904 Black River Public School 08331 2.60011E+11 A 2014
Blissfield Community Schools 46040 Blissfield High School 00353 2.606E+11 B 2014
Bloomfield Hills Schools 63080 Bloomfield Hills Middle School 05594 2.60609E+11 A 2014
Bloomfield Hills Schools 63080 Conant Elementary School 04830 2.60609E+11 A 2013
Bloomfield Hills Schools 63080 East Hills Middle School 05071 2.60609E+11 F 2012
Bloomfield Hills Schools 63080 Eastover Elementary School 05076 2.60609E+11 A 2012
Bloomfield Hills Schools 63080 Way Elementary School 05538 2.60609E+11 A 2014
Bloomfield Hills Schools 63080 West Hills Middle School 04900 2.60609E+11 A 2013
Bloomingdale Public School District 80090 Bloomingdale Middle and High School 00357 2.60627E+11 B 2013
Boyne City Public Schools 15020 Boyne City Elementary School 00595 2.6065E+11 B 2014
Boyne City Public Schools 15020 Boyne City Middle School 06486 2.6065E+11 F 2014
Bradford Academy 63917 Bradford Academy 09292 2.60028E+11 B 2013
Brandon School District in the Counties of Oakland and Lapeer 63180 Oakwood Elementary School 05180 2.60657E+11 B 2013
Brandywine Community Schools 11210 Brandywine Senior High School 00387 2.6066E+11 B 2012
Brandywine Community Schools 11210 Merritt Elementary School 08303 2.6066E+11 F 2014
Breckenridge Community Schools 29040 Breckenridge High School 00388 2.60663E+11 F 2014
Bridgeport-Spaulding Community School District 73180 Martin G. Atkins Elementary School 09552 2.60678E+11 C 2014
Bridgman Public Schools 11340 Bridgman Elementary School 00400 2.60684E+11 BTO 2014
Bridgman Public Schools 11340 Bridgman High School 00401 2.60684E+11 B, BTO 2014
Brighton Area Schools 47010 Hilton Road Elementary School 07564 2.60687E+11 A 2014
Brighton Area Schools 47010 Hornung Elementary School 06872 2.60687E+11 A, BTO 2014
Brighton Area Schools 47010 Spencer Road Elementary School 06397 2.60687E+11 A, BTO 2014
Brimley Area Schools 17140 Brimley Jr./Sr. High 00404 2.6069E+11 B, BTO 2012
Bronson Community School District 12020 Anderson Elementary School 00092 2.60696E+11 B, BTO 2013
Bronson Community School District 12020 Bronson Jr/Sr High School 00408 2.60696E+11 B 2012
Brown City Community Schools 76060 Brown City High School 00421 2.60704E+11 B, BTO 2014
Buchanan Community Schools 11310 Buchanan Middle School 06444 2.60714E+11 F 2014
Buchanan Community Schools 11310 Moccasin Elementary School 02583 2.60714E+11 F 2014
Bullock Creek School District 56020 Bullock Creek High School 00443 2.60732E+11 B 2014
Bullock Creek School District 56020 Floyd School 01255 2.60732E+11 F 2014
Burr Oak Community School District 75020 Burr Oak Elementary School 00458 2.60741E+11 F 2014
Byron Area Schools 78020 Byron Area High School 00472 2.60753E+11 B 2012
Byron Center Public Schools 41040 Brown Elementary School 00476 2.60756E+11 A, BTO 2014
Byron Center Public Schools 41040 Byron Center West Middle School 04906 2.60756E+11 B 2014
Byron Center Public Schools 41040 Countryside Elementary School 09170 2.60756E+11 A 2014
Byron Center Public Schools 41040 Marshall Elementary School 05260 2.60756E+11 B 2013
Cadillac Area Public Schools 83010 Cadillac Junior High School 00487 2.60759E+11 F 2014
Cadillac Area Public Schools 83010 Cadillac Senior High School 00488 2.60759E+11 B 2012
Cadillac Area Public Schools 83010 Franklin Elementary School 01307 2.60759E+11 F 2013
Cadillac Area Public Schools 83010 Kenwood Elementary School 02024 2.60759E+11 C 2014
Cadillac Area Public Schools 83010 Lincoln Elementary School 02210 2.60759E+11 F 2014
Cadillac Area Public Schools 83010 Mackinaw Trail Middle School 08628 2.60759E+11 F 2013
Caledonia Community Schools 41050 Kettle Lake Elementary School 05212 2.60762E+11 A 2012
Caledonia Community Schools 41050 Paris Ridge Elementary 00259 2.60762E+11 B 2013
Canton Charter Academy 82968 Canton Charter Academy 08816 2.60026E+11 A 2014
Capac Community Schools 74040 Capac Middle School 00521 2.6078E+11 F 2014
Carman-Ainsworth Community Schools 25080 Genesee Early College 09774 2.60789E+11 A, BTO 2014
Carman-Ainsworth Community Schools 25080 Gladys Dillon Elementary School 01414 2.60789E+11 F 2013
Carman-Ainsworth Community Schools 25080 Rankin Elementary School 03149 2.60789E+11 F 2014
Carrollton Public Schools 73030 Carrollton High School 00536 2.60807E+11 B 2014
Cass City Public Schools 79030 Cass City Elementary 00509 2.6084E+11 B, BTO 2013
Cass City Public Schools 79030 Cass City Jr. and Sr. High School 00552 2.6084E+11 F 2013
Page 3 of 22
Attachment 9.B
483

Michigan Reward, Priority, and Focus Schools (June 2015)
LEA Name District Number School Name School Number School NCES ID# Reward School Priority School Focus School Cycle
Cedar Springs Public Schools 41070 Beach Elementary School 09956 2.60852E+11 F 2014
Center Line Public Schools 50010 Crothers Elementary School 00842 2.60858E+11 F 2012
Center Line Public Schools 50010 May V. Peck Elementary School 02445 2.60858E+11 F 2014
Center Line Public Schools 50010 Wolfe Middle School 04575 2.60858E+11 F 2014
Central Academy 81902 Central Academy 08333 2.60016E+11 B 2013
Centreville Public Schools 75030 Centreville Jr. /Sr. High School 00627 2.60867E+11 B 2013
Cesar Chavez Academy 82918 Cesar Chavez Academy Elementary 08347 2.60014E+11 C 2014
Chandler Park Academy 82923 Chandler Park Academy - Elementary 08915 2.60017E+11 BTO 2013
Chandler Park Academy 82923 Chandler Park Academy - High School 09825 2.60017E+11 B, BTO 2014
Chandler Woods Charter Academy 41920 Chandler Woods Charter Academy 08719 2.60021E+11 B 2014
Charlotte Public Schools 23030 Charlotte Middle School 00649 2.60877E+11 F 2014
Charlotte Public Schools 23030 Charlotte Upper Elementary 00774 2.60877E+11 F 2014
Charlotte Public Schools 23030 Parkview Elementary School 05797 2.60877E+11 F 2014
Charlotte Public Schools 23030 Washington Elementary School 04386 2.60877E+11 F 2014
Charyl Stockwell Academy 47902 Charyl Stockwell Academy 08327 2.6001E+11 B 2013
Cheboygan Area Schools 16015 Cheboygan Area High School 00655 2.60891E+11 B 2014
Chelsea School District 81040 Beach Middle School 00657 2.60894E+11 F 2012
Chelsea School District 81040 North Creek Elementary School 02720 2.60894E+11 B 2014
Chelsea School District 81040 South Meadows Elementary School 03507 2.60894E+11 B 2014
Chesaning Union Schools 73110 Chesaning Middle School 06774 2.60915E+11 BTO 2013
Chesaning Union Schools 73110 Chesaning Union High School 00666 2.60915E+11 B 2012
Chippewa Hills School District 54025 Barryton Elementary School 05902 2.60956E+11 BTO 2014
Chippewa Hills School District 54025 Chippewa Hills High School 06178 2.60956E+11 B, BTO 2012
Chippewa Hills School District 54025 Mecosta Elementary School 02503 2.60956E+11 BTO 2014
Chippewa Valley Schools 50080 Cherokee Elementary School 07986 2.60957E+11 B 2012
Chippewa Valley Schools 50080 Ottawa Elementary School 05326 2.60957E+11 BTO 2013
Clarenceville School District 63090 Clarenceville High School 00700 2.60984E+11 C 2014
Clarkston Community School District 63190 Andersonville Elementary School 00095 2.6099E+11 F 2014
Clarkston Community School District 63190 Independence Elementary School 08714 2.6099E+11 A 2012
Clarkston Community School District 63190 Pine Knob Elementary School 03054 2.6099E+11 B, BTO 2014
Clarkston Community School District 63190 Sashabaw Middle School 05692 2.6099E+11 F 2013
Clawson Public Schools 63270 Clawson Middle School 00711 2.60993E+11 F 2014
Clawson Public Schools 63270 Kenwood Elementary School 02023 2.60993E+11 F 2014
Clawson Public Schools 63270 Paul A. Schalm School 02978 2.60993E+11 B 2012
Clinton Community Schools 46060 Clinton Elementary School 00724 2.61005E+11 F 2014
Clinton Community Schools 46060 Clinton High School 06184 2.61005E+11 A, BTO 2013
Clinton Community Schools 46060 Clinton Middle School 00725 2.61005E+11 B 2012
Clintondale Community Schools 50070 Charles C. McGlinnen School 04103 2.61008E+11 F 2014
Clintondale Community Schools 50070 Clintondale Middle School 05031 2.61008E+11 F 2013
Clintondale Community Schools 50070 Rainbow Elementary School 06183 2.61008E+11 C 2013
Clio Area School District 25150 George R. Carter Middle School 01391 2.61011E+11 F 2014
Coldwater Community Schools 12010 Coldwater High School 00744 2.61014E+11 F 2014
Coldwater Community Schools 12010 Lakeland Elementary School 02091 2.61014E+11 F 2014
Coldwater Community Schools 12010 Larsen Elementary School 01080 2.61014E+11 F 2014
Coloma Community Schools 11330 Coloma High School 00753 2.61038E+11 B 2012
Colon Community School District 75040 Colon High School 05036 2.61041E+11 B 2014
Colon Community School District 75040 Leonidas School 05231 2.61041E+11 BTO 2014
Columbia School District 38040 Columbia Central High School 05884 2.60699E+11 B 2014
Commonwealth Community Development Academy 82919 Commonwealth Community Development Academy 08656 2.60014E+11 C 2013
Comstock Public Schools 39030 Comstock High School 00765 2.61059E+11 F 2014
Conner Creek Academy East 50902 Conner Creek Academy East - MI Collegiate High 09089 2.60021E+11 B, BTO 2014
Constantine Public School District 75050 Constantine High School 00775 2.61075E+11 B 2012
Coopersville Area Public School District 70120 Coopersville East Elementary 09939 2.61083E+11 B 2012
Coopersville Area Public School District 70120 Coopersville Middle School 04802 2.61083E+11 F 2013
Countryside Academy 11901 Countryside Academy - Elementary 09427 2.60014E+11 BTO 2012
Covert Public Schools 80040 Covert Elementary School 00816 2.61098E+11 BTO 2014
Covert Public Schools 80040 Covert Middle School 07237 2.61098E+11 BTO 2012
Crawford AuSable Schools 20015 Grayling High School 01482 2.61103E+11 B, BTO 2013
Crawford AuSable Schools 20015 Grayling Middle School 06355 2.61103E+11 BTO 2012
Creative Technologies Academy 41918 Creative Technologies Academy 08633 2.60021E+11 F 2014
Crescent Academy 63921 Crescent Academy Middle School 09445 2.6003E+11 BTO 2013
Crestwood School District 82230 Crestwood Accelerated Program 00042 2.60002E+11 A, BTO 2014
Crestwood School District 82230 Kinloch Elementary School 02046 2.60002E+11 BTO 2013
Page 4 of 22
Attachment 9.B
484
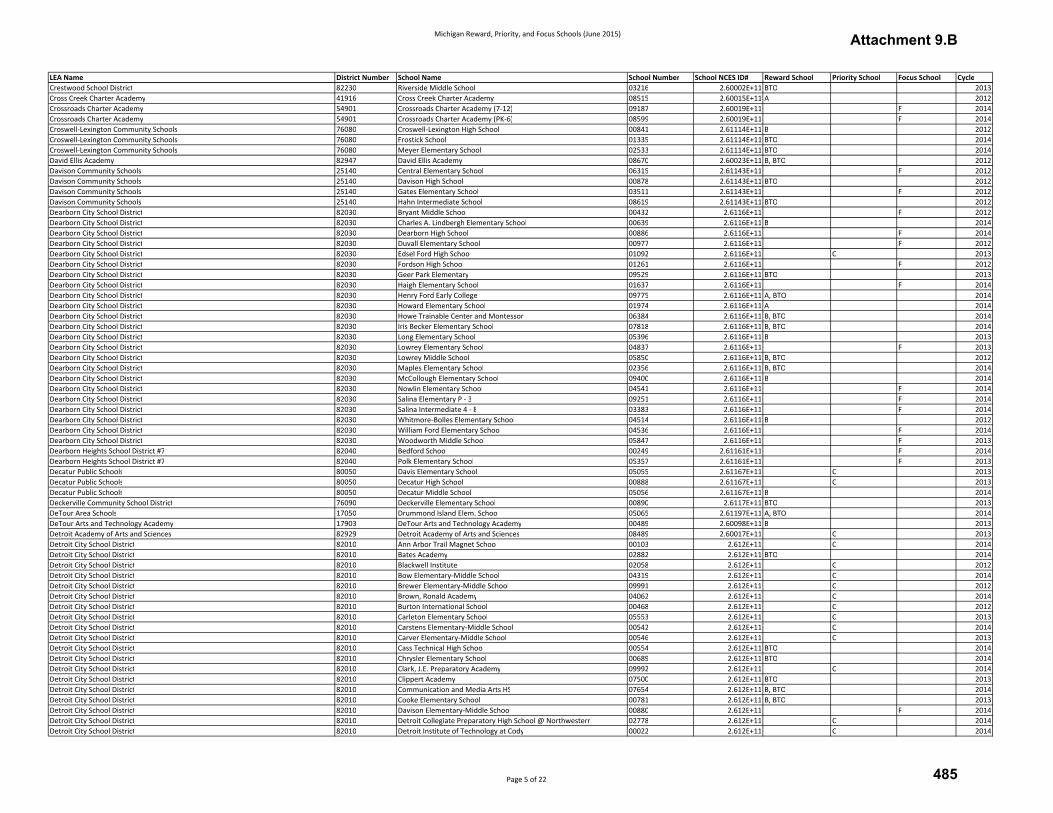
Michigan Reward, Priority, and Focus Schools (June 2015)
LEA Name District Number School Name School Number School NCES ID# Reward School Priority School Focus School Cycle
Crestwood School District 82230 Riverside Middle School 03216 2.60002E+11 BTO 2013
Cross Creek Charter Academy 41916 Cross Creek Charter Academy 08515 2.60015E+11 A 2012
Crossroads Charter Academy 54901 Crossroads Charter Academy (7-12) 09187 2.60019E+11 F 2014
Crossroads Charter Academy 54901 Crossroads Charter Academy (PK-6) 08599 2.60019E+11 F 2014
Croswell-Lexington Community Schools 76080 Croswell-Lexington High School 00841 2.61114E+11 B 2012
Croswell-Lexington Community Schools 76080 Frostick School 01335 2.61114E+11 BTO 2014
Croswell-Lexington Community Schools 76080 Meyer Elementary School 02533 2.61114E+11 BTO 2014
David Ellis Academy 82947 David Ellis Academy 08670 2.60023E+11 B, BTO 2012
Davison Community Schools 25140 Central Elementary School 06315 2.61143E+11 F 2012
Davison Community Schools 25140 Davison High School 00878 2.61143E+11 BTO 2012
Davison Community Schools 25140 Gates Elementary School 03511 2.61143E+11 F 2012
Davison Community Schools 25140 Hahn Intermediate School 08619 2.61143E+11 BTO 2012
Dearborn City School District 82030 Bryant Middle School 00432 2.6116E+11 F 2012
Dearborn City School District 82030 Charles A. Lindbergh Elementary School 00639 2.6116E+11 B 2014
Dearborn City School District 82030 Dearborn High School 00886 2.6116E+11 F 2014
Dearborn City School District 82030 Duvall Elementary School 00977 2.6116E+11 F 2012
Dearborn City School District 82030 Edsel Ford High School 01092 2.6116E+11 C 2013
Dearborn City School District 82030 Fordson High School 01261 2.6116E+11 F 2012
Dearborn City School District 82030 Geer Park Elementary 09529 2.6116E+11 BTO 2013
Dearborn City School District 82030 Haigh Elementary School 01637 2.6116E+11 F 2014
Dearborn City School District 82030 Henry Ford Early College 09775 2.6116E+11 A, BTO 2014
Dearborn City School District 82030 Howard Elementary School 01974 2.6116E+11 A 2014
Dearborn City School District 82030 Howe Trainable Center and Montessori 06384 2.6116E+11 B, BTO 2014
Dearborn City School District 82030 Iris Becker Elementary School 07818 2.6116E+11 B, BTO 2014
Dearborn City School District 82030 Long Elementary School 05396 2.6116E+11 B 2013
Dearborn City School District 82030 Lowrey Elementary School 04837 2.6116E+11 F 2013
Dearborn City School District 82030 Lowrey Middle School 05850 2.6116E+11 B, BTO 2012
Dearborn City School District 82030 Maples Elementary School 02356 2.6116E+11 B, BTO 2014
Dearborn City School District 82030 McCollough Elementary School 09400 2.6116E+11 B 2014
Dearborn City School District 82030 Nowlin Elementary School 04541 2.6116E+11 F 2014
Dearborn City School District 82030 Salina Elementary P - 3 09251 2.6116E+11 F 2014
Dearborn City School District 82030 Salina Intermediate 4 - 8 03383 2.6116E+11 F 2014
Dearborn City School District 82030 Whitmore-Bolles Elementary School 04514 2.6116E+11 B 2012
Dearborn City School District 82030 William Ford Elementary School 04536 2.6116E+11 F 2014
Dearborn City School District 82030 Woodworth Middle School 05847 2.6116E+11 F 2013
Dearborn Heights School District #7 82040 Bedford School 00249 2.61161E+11 F 2014
Dearborn Heights School District #7 82040 Polk Elementary School 05357 2.61161E+11 F 2013
Decatur Public Schools 80050 Davis Elementary School 05055 2.61167E+11 C 2013
Decatur Public Schools 80050 Decatur High School 00888 2.61167E+11 C 2013
Decatur Public Schools 80050 Decatur Middle School 05056 2.61167E+11 B 2014
Deckerville Community School District 76090 Deckerville Elementary School 00890 2.6117E+11 BTO 2013
DeTour Area Schools 17050 Drummond Island Elem. School 05065 2.61197E+11 A, BTO 2014
DeTour Arts and Technology Academy 17903 DeTour Arts and Technology Academy 00489 2.60098E+11 B 2013
Detroit Academy of Arts and Sciences 82929 Detroit Academy of Arts and Sciences 08489 2.60017E+11 C 2013
Detroit City School District 82010 Ann Arbor Trail Magnet School 00103 2.612E+11 C 2014
Detroit City School District 82010 Bates Academy 02882 2.612E+11 BTO 2014
Detroit City School District 82010 Blackwell Institute 02058 2.612E+11 C 2012
Detroit City School District 82010 Bow Elementary-Middle School 04319 2.612E+11 C 2014
Detroit City School District 82010 Brewer Elementary-Middle School 09991 2.612E+11 C 2012
Detroit City School District 82010 Brown, Ronald Academy 04062 2.612E+11 C 2014
Detroit City School District 82010 Burton International School 00468 2.612E+11 C 2012
Detroit City School District 82010 Carleton Elementary School 05553 2.612E+11 C 2013
Detroit City School District 82010 Carstens Elementary-Middle School 00542 2.612E+11 C 2014
Detroit City School District 82010 Carver Elementary-Middle School 00546 2.612E+11 C 2013
Detroit City School District 82010 Cass Technical High School 00554 2.612E+11 BTO 2014
Detroit City School District 82010 Chrysler Elementary School 00689 2.612E+11 BTO 2014
Detroit City School District 82010 Clark, J.E. Preparatory Academy 09992 2.612E+11 C 2014
Detroit City School District 82010 Clippert Academy 07500 2.612E+11 BTO 2013
Detroit City School District 82010 Communication and Media Arts HS 07654 2.612E+11 B, BTO 2014
Detroit City School District 82010 Cooke Elementary School 00781 2.612E+11 B, BTO 2013
Detroit City School District 82010 Davison Elementary-Middle School 00880 2.612E+11 F 2014
Detroit City School District 82010 Detroit Collegiate Preparatory High School @ Northwestern 02778 2.612E+11 C 2014
Detroit City School District 82010 Detroit Institute of Technology at Cody 00022 2.612E+11 C 2014
Page 5 of 22
Attachment 9.B
485
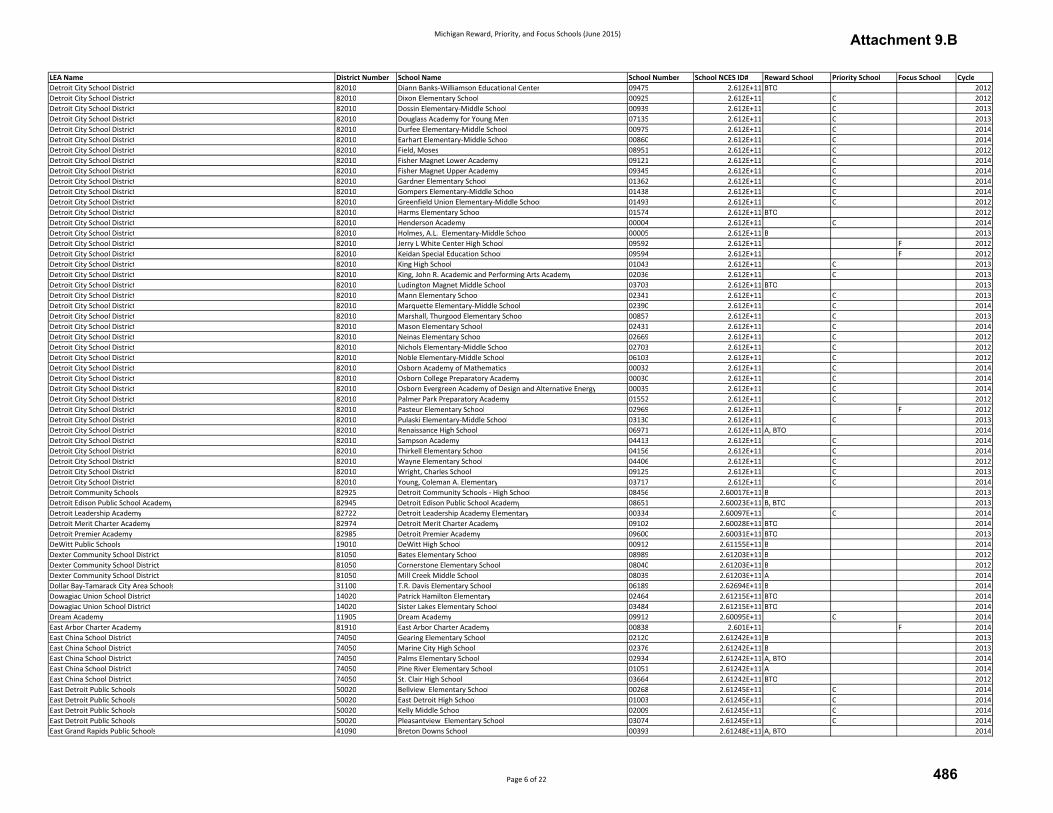
Michigan Reward, Priority, and Focus Schools (June 2015)
LEA Name District Number School Name School Number School NCES ID# Reward School Priority School Focus School Cycle
Detroit City School District 82010 Diann Banks-Williamson Educational Center 09475 2.612E+11 BTO 2012
Detroit City School District 82010 Dixon Elementary School 00925 2.612E+11 C 2012
Detroit City School District 82010 Dossin Elementary-Middle School 00939 2.612E+11 C 2013
Detroit City School District 82010 Douglass Academy for Young Men 07135 2.612E+11 C 2013
Detroit City School District 82010 Durfee Elementary-Middle School 00975 2.612E+11 C 2014
Detroit City School District 82010 Earhart Elementary-Middle School 00860 2.612E+11 C 2014
Detroit City School District 82010 Field, Moses 08951 2.612E+11 C 2012
Detroit City School District 82010 Fisher Magnet Lower Academy 09121 2.612E+11 C 2014
Detroit City School District 82010 Fisher Magnet Upper Academy 09345 2.612E+11 C 2014
Detroit City School District 82010 Gardner Elementary School 01362 2.612E+11 C 2014
Detroit City School District 82010 Gompers Elementary-Middle School 01438 2.612E+11 C 2014
Detroit City School District 82010 Greenfield Union Elementary-Middle School 01493 2.612E+11 C 2012
Detroit City School District 82010 Harms Elementary School 01574 2.612E+11 BTO 2012
Detroit City School District 82010 Henderson Academy 00004 2.612E+11 C 2014
Detroit City School District 82010 Holmes, A.L. Elementary-Middle School 00005 2.612E+11 B 2013
Detroit City School District 82010 Jerry L White Center High School 09592 2.612E+11 F 2012
Detroit City School District 82010 Keidan Special Education School 09594 2.612E+11 F 2012
Detroit City School District 82010 King High School 01043 2.612E+11 C 2013
Detroit City School District 82010 King, John R. Academic and Performing Arts Academy 02036 2.612E+11 C 2013
Detroit City School District 82010 Ludington Magnet Middle School 03703 2.612E+11 BTO 2013
Detroit City School District 82010 Mann Elementary School 02341 2.612E+11 C 2013
Detroit City School District 82010 Marquette Elementary-Middle School 02390 2.612E+11 C 2014
Detroit City School District 82010 Marshall, Thurgood Elementary School 00857 2.612E+11 C 2013
Detroit City School District 82010 Mason Elementary School 02431 2.612E+11 C 2014
Detroit City School District 82010 Neinas Elementary School 02669 2.612E+11 C 2012
Detroit City School District 82010 Nichols Elementary-Middle School 02703 2.612E+11 C 2012
Detroit City School District 82010 Noble Elementary-Middle School 06103 2.612E+11 C 2012
Detroit City School District 82010 Osborn Academy of Mathematics 00032 2.612E+11 C 2014
Detroit City School District 82010 Osborn College Preparatory Academy 00030 2.612E+11 C 2014
Detroit City School District 82010 Osborn Evergreen Academy of Design and Alternative Energy 00035 2.612E+11 C 2014
Detroit City School District 82010 Palmer Park Preparatory Academy 01552 2.612E+11 C 2012
Detroit City School District 82010 Pasteur Elementary School 02969 2.612E+11 F 2012
Detroit City School District 82010 Pulaski Elementary-Middle School 03130 2.612E+11 C 2013
Detroit City School District 82010 Renaissance High School 06971 2.612E+11 A, BTO 2014
Detroit City School District 82010 Sampson Academy 04413 2.612E+11 C 2014
Detroit City School District 82010 Thirkell Elementary School 04156 2.612E+11 C 2014
Detroit City School District 82010 Wayne Elementary School 04406 2.612E+11 C 2012
Detroit City School District 82010 Wright, Charles School 09125 2.612E+11 C 2013
Detroit City School District 82010 Young, Coleman A. Elementary 03717 2.612E+11 C 2014
Detroit Community Schools 82925 Detroit Community Schools - High School 08456 2.60017E+11 B 2013
Detroit Edison Public School Academy 82945 Detroit Edison Public School Academy 08651 2.60023E+11 B, BTO 2013
Detroit Leadership Academy 82722 Detroit Leadership Academy Elementary 00334 2.60097E+11 C 2014
Detroit Merit Charter Academy 82974 Detroit Merit Charter Academy 09102 2.60028E+11 BTO 2014
Detroit Premier Academy 82985 Detroit Premier Academy 09600 2.60031E+11 BTO 2013
DeWitt Public Schools 19010 DeWitt High School 00912 2.61155E+11 B 2014
Dexter Community School District 81050 Bates Elementary School 08989 2.61203E+11 B 2012
Dexter Community School District 81050 Cornerstone Elementary School 08040 2.61203E+11 B 2012
Dexter Community School District 81050 Mill Creek Middle School 08039 2.61203E+11 A 2014
Dollar Bay-Tamarack City Area Schools 31100 T.R. Davis Elementary School 06189 2.62694E+11 B 2014
Dowagiac Union School District 14020 Patrick Hamilton Elementary 02464 2.61215E+11 BTO 2014
Dowagiac Union School District 14020 Sister Lakes Elementary School 03484 2.61215E+11 BTO 2014
Dream Academy 11905 Dream Academy 09912 2.60095E+11 C 2014
East Arbor Charter Academy 81910 East Arbor Charter Academy 00838 2.601E+11 F 2014
East China School District 74050 Gearing Elementary School 02120 2.61242E+11 B 2013
East China School District 74050 Marine City High School 02376 2.61242E+11 B 2013
East China School District 74050 Palms Elementary School 02934 2.61242E+11 A, BTO 2014
East China School District 74050 Pine River Elementary School 01051 2.61242E+11 A 2014
East China School District 74050 St. Clair High School 03664 2.61242E+11 BTO 2012
East Detroit Public Schools 50020 Bellview Elementary School 00268 2.61245E+11 C 2014
East Detroit Public Schools 50020 East Detroit High School 01003 2.61245E+11 C 2014
East Detroit Public Schools 50020 Kelly Middle School 02009 2.61245E+11 C 2014
East Detroit Public Schools 50020 Pleasantview Elementary School 03074 2.61245E+11 C 2014
East Grand Rapids Public Schools 41090 Breton Downs School 00393 2.61248E+11 A, BTO 2014
Page 6 of 22
Attachment 9.B
486
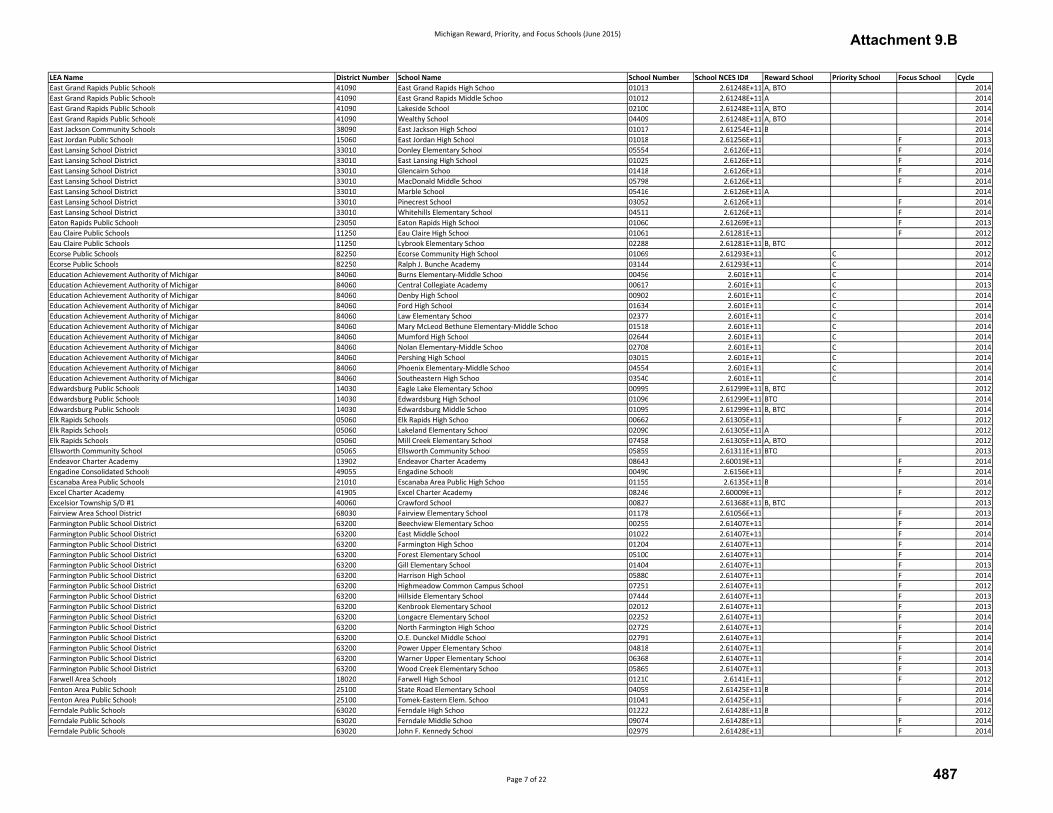
Michigan Reward, Priority, and Focus Schools (June 2015)
LEA Name District Number School Name School Number School NCES ID# Reward School Priority School Focus School Cycle
East Grand Rapids Public Schools 41090 East Grand Rapids High School 01013 2.61248E+11 A, BTO 2014
East Grand Rapids Public Schools 41090 East Grand Rapids Middle School 01012 2.61248E+11 A 2014
East Grand Rapids Public Schools 41090 Lakeside School 02100 2.61248E+11 A, BTO 2014
East Grand Rapids Public Schools 41090 Wealthy School 04409 2.61248E+11 A, BTO 2014
East Jackson Community Schools 38090 East Jackson High School 01017 2.61254E+11 B 2014
East Jordan Public Schools 15060 East Jordan High School 01018 2.61256E+11 F 2013
East Lansing School District 33010 Donley Elementary School 05554 2.6126E+11 F 2014
East Lansing School District 33010 East Lansing High School 01025 2.6126E+11 F 2014
East Lansing School District 33010 Glencairn School 01418 2.6126E+11 F 2014
East Lansing School District 33010 MacDonald Middle School 05798 2.6126E+11 F 2014
East Lansing School District 33010 Marble School 05416 2.6126E+11 A 2014
East Lansing School District 33010 Pinecrest School 03052 2.6126E+11 F 2014
East Lansing School District 33010 Whitehills Elementary School 04511 2.6126E+11 F 2014
Eaton Rapids Public Schools 23050 Eaton Rapids High School 01060 2.61269E+11 F 2013
Eau Claire Public Schools 11250 Eau Claire High School 01061 2.61281E+11 F 2012
Eau Claire Public Schools 11250 Lybrook Elementary School 02288 2.61281E+11 B, BTO 2012
Ecorse Public Schools 82250 Ecorse Community High School 01069 2.61293E+11 C 2012
Ecorse Public Schools 82250 Ralph J. Bunche Academy 03144 2.61293E+11 C 2014
Education Achievement Authority of Michigan 84060 Burns Elementary-Middle School 00456 2.601E+11 C 2014
Education Achievement Authority of Michigan 84060 Central Collegiate Academy 00617 2.601E+11 C 2013
Education Achievement Authority of Michigan 84060 Denby High School 00902 2.601E+11 C 2014
Education Achievement Authority of Michigan 84060 Ford High School 01634 2.601E+11 C 2014
Education Achievement Authority of Michigan 84060 Law Elementary School 02377 2.601E+11 C 2014
Education Achievement Authority of Michigan 84060 Mary McLeod Bethune Elementary-Middle School 01518 2.601E+11 C 2014
Education Achievement Authority of Michigan 84060 Mumford High School 02644 2.601E+11 C 2014
Education Achievement Authority of Michigan 84060 Nolan Elementary-Middle School 02708 2.601E+11 C 2014
Education Achievement Authority of Michigan 84060 Pershing High School 03015 2.601E+11 C 2014
Education Achievement Authority of Michigan 84060 Phoenix Elementary-Middle School 04554 2.601E+11 C 2014
Education Achievement Authority of Michigan 84060 Southeastern High School 03540 2.601E+11 C 2014
Edwardsburg Public Schools 14030 Eagle Lake Elementary School 00995 2.61299E+11 B, BTO 2012
Edwardsburg Public Schools 14030 Edwardsburg High School 01096 2.61299E+11 BTO 2014
Edwardsburg Public Schools 14030 Edwardsburg Middle School 01095 2.61299E+11 B, BTO 2014
Elk Rapids Schools 05060 Elk Rapids High School 00662 2.61305E+11 F 2012
Elk Rapids Schools 05060 Lakeland Elementary School 02090 2.61305E+11 A 2012
Elk Rapids Schools 05060 Mill Creek Elementary School 07458 2.61305E+11 A, BTO 2012
Ellsworth Community School 05065 Ellsworth Community School 05859 2.61311E+11 BTO 2013
Endeavor Charter Academy 13902 Endeavor Charter Academy 08643 2.60019E+11 F 2014
Engadine Consolidated Schools 49055 Engadine Schools 00490 2.6156E+11 F 2014
Escanaba Area Public Schools 21010 Escanaba Area Public High School 01155 2.6135E+11 B 2014
Excel Charter Academy 41905 Excel Charter Academy 08246 2.60009E+11 F 2012
Excelsior Township S/D #1 40060 Crawford School 00827 2.61368E+11 B, BTO 2013
Fairview Area School District 68030 Fairview Elementary School 01178 2.61056E+11 F 2013
Farmington Public School District 63200 Beechview Elementary School 00255 2.61407E+11 F 2014
Farmington Public School District 63200 East Middle School 01022 2.61407E+11 F 2014
Farmington Public School District 63200 Farmington High School 01204 2.61407E+11 F 2014
Farmington Public School District 63200 Forest Elementary School 05100 2.61407E+11 F 2014
Farmington Public School District 63200 Gill Elementary School 01404 2.61407E+11 F 2013
Farmington Public School District 63200 Harrison High School 05880 2.61407E+11 F 2014
Farmington Public School District 63200 Highmeadow Common Campus School 07251 2.61407E+11 F 2012
Farmington Public School District 63200 Hillside Elementary School 07444 2.61407E+11 F 2013
Farmington Public School District 63200 Kenbrook Elementary School 02012 2.61407E+11 F 2013
Farmington Public School District 63200 Longacre Elementary School 02252 2.61407E+11 F 2014
Farmington Public School District 63200 North Farmington High School 02729 2.61407E+11 F 2014
Farmington Public School District 63200 O.E. Dunckel Middle School 02791 2.61407E+11 F 2014
Farmington Public School District 63200 Power Upper Elementary School 04818 2.61407E+11 F 2014
Farmington Public School District 63200 Warner Upper Elementary School 06368 2.61407E+11 F 2014
Farmington Public School District 63200 Wood Creek Elementary School 05865 2.61407E+11 F 2013
Farwell Area Schools 18020 Farwell High School 01210 2.6141E+11 F 2012
Fenton Area Public Schools 25100 State Road Elementary School 04059 2.61425E+11 B 2014
Fenton Area Public Schools 25100 Tomek-Eastern Elem. School 01041 2.61425E+11 F 2014
Ferndale Public Schools 63020 Ferndale High School 01222 2.61428E+11 B 2012
Ferndale Public Schools 63020 Ferndale Middle School 09074 2.61428E+11 F 2014
Ferndale Public Schools 63020 John F. Kennedy School 02979 2.61428E+11 F 2014
Page 7 of 22
Attachment 9.B
487
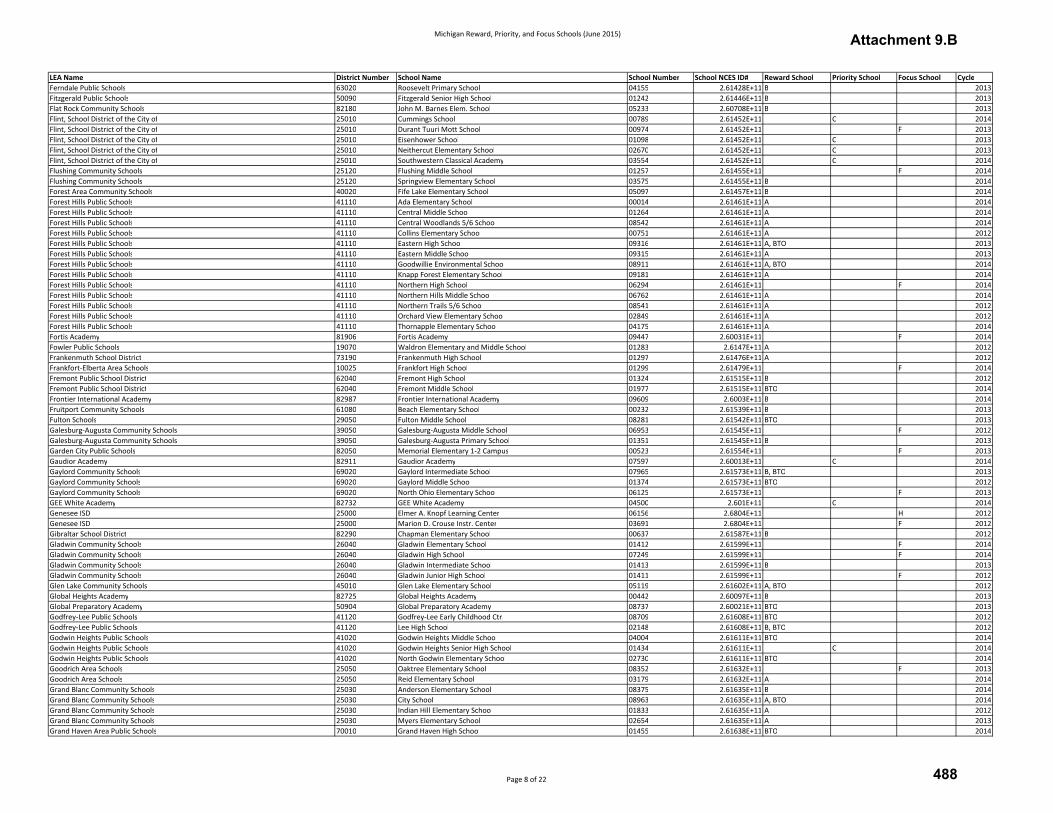
Michigan Reward, Priority, and Focus Schools (June 2015)
LEA Name District Number School Name School Number School NCES ID# Reward School Priority School Focus School Cycle
Ferndale Public Schools 63020 Roosevelt Primary School 04155 2.61428E+11 B 2013
Fitzgerald Public Schools 50090 Fitzgerald Senior High School 01242 2.61446E+11 B 2013
Flat Rock Community Schools 82180 John M. Barnes Elem. School 05233 2.60708E+11 B 2013
Flint, School District of the City of 25010 Cummings School 00789 2.61452E+11 C 2014
Flint, School District of the City of 25010 Durant Tuuri Mott School 00974 2.61452E+11 F 2013
Flint, School District of the City of 25010 Eisenhower School 01098 2.61452E+11 C 2013
Flint, School District of the City of 25010 Neithercut Elementary School 02670 2.61452E+11 C 2013
Flint, School District of the City of 25010 Southwestern Classical Academy 03554 2.61452E+11 C 2014
Flushing Community Schools 25120 Flushing Middle School 01257 2.61455E+11 F 2014
Flushing Community Schools 25120 Springview Elementary School 03575 2.61455E+11 B 2014
Forest Area Community Schools 40020 Fife Lake Elementary School 05097 2.61457E+11 B 2014
Forest Hills Public Schools 41110 Ada Elementary School 00014 2.61461E+11 A 2014
Forest Hills Public Schools 41110 Central Middle School 01264 2.61461E+11 A 2014
Forest Hills Public Schools 41110 Central Woodlands 5/6 School 08542 2.61461E+11 A 2014
Forest Hills Public Schools 41110 Collins Elementary School 00751 2.61461E+11 A 2012
Forest Hills Public Schools 41110 Eastern High School 09316 2.61461E+11 A, BTO 2013
Forest Hills Public Schools 41110 Eastern Middle School 09315 2.61461E+11 A 2013
Forest Hills Public Schools 41110 Goodwillie Environmental School 08911 2.61461E+11 A, BTO 2014
Forest Hills Public Schools 41110 Knapp Forest Elementary School 09181 2.61461E+11 A 2014
Forest Hills Public Schools 41110 Northern High School 06294 2.61461E+11 F 2014
Forest Hills Public Schools 41110 Northern Hills Middle School 06762 2.61461E+11 A 2014
Forest Hills Public Schools 41110 Northern Trails 5/6 School 08541 2.61461E+11 A 2012
Forest Hills Public Schools 41110 Orchard View Elementary School 02849 2.61461E+11 A 2012
Forest Hills Public Schools 41110 Thornapple Elementary School 04175 2.61461E+11 A 2014
Fortis Academy 81906 Fortis Academy 09447 2.60031E+11 F 2014
Fowler Public Schools 19070 Waldron Elementary and Middle School 01283 2.6147E+11 A 2012
Frankenmuth School District 73190 Frankenmuth High School 01297 2.61476E+11 A 2012
Frankfort-Elberta Area Schools 10025 Frankfort High School 01299 2.61479E+11 F 2014
Fremont Public School District 62040 Fremont High School 01324 2.61515E+11 B 2012
Fremont Public School District 62040 Fremont Middle School 01977 2.61515E+11 BTO 2014
Frontier International Academy 82987 Frontier International Academy 09609 2.6003E+11 B 2014
Fruitport Community Schools 61080 Beach Elementary School 00232 2.61539E+11 B 2013
Fulton Schools 29050 Fulton Middle School 08281 2.61542E+11 BTO 2013
Galesburg-Augusta Community Schools 39050 Galesburg-Augusta Middle School 06953 2.61545E+11 F 2012
Galesburg-Augusta Community Schools 39050 Galesburg-Augusta Primary School 01351 2.61545E+11 B 2013
Garden City Public Schools 82050 Memorial Elementary 1-2 Campus 00523 2.61554E+11 F 2013
Gaudior Academy 82911 Gaudior Academy 07597 2.60013E+11 C 2014
Gaylord Community Schools 69020 Gaylord Intermediate School 07965 2.61573E+11 B, BTO 2013
Gaylord Community Schools 69020 Gaylord Middle School 01374 2.61573E+11 BTO 2012
Gaylord Community Schools 69020 North Ohio Elementary School 06125 2.61573E+11 F 2013
GEE White Academy 82732 GEE White Academy 04500 2.601E+11 C 2014
Genesee ISD 25000 Elmer A. Knopf Learning Center 06156 2.6804E+11 H 2012
Genesee ISD 25000 Marion D. Crouse Instr. Center 03691 2.6804E+11 F 2012
Gibraltar School District 82290 Chapman Elementary School 00637 2.61587E+11 B 2012
Gladwin Community Schools 26040 Gladwin Elementary School 01412 2.61599E+11 F 2014
Gladwin Community Schools 26040 Gladwin High School 07249 2.61599E+11 F 2014
Gladwin Community Schools 26040 Gladwin Intermediate School 01413 2.61599E+11 B 2013
Gladwin Community Schools 26040 Gladwin Junior High School 01411 2.61599E+11 F 2012
Glen Lake Community Schools 45010 Glen Lake Elementary School 05119 2.61602E+11 A, BTO 2012
Global Heights Academy 82725 Global Heights Academy 00442 2.60097E+11 B 2013
Global Preparatory Academy 50904 Global Preparatory Academy 08737 2.60021E+11 BTO 2013
Godfrey-Lee Public Schools 41120 Godfrey-Lee Early Childhood Ctr. 08709 2.61608E+11 BTO 2012
Godfrey-Lee Public Schools 41120 Lee High School 02148 2.61608E+11 B, BTO 2012
Godwin Heights Public Schools 41020 Godwin Heights Middle School 04004 2.61611E+11 BTO 2014
Godwin Heights Public Schools 41020 Godwin Heights Senior High School 01434 2.61611E+11 C 2014
Godwin Heights Public Schools 41020 North Godwin Elementary School 02730 2.61611E+11 BTO 2014
Goodrich Area Schools 25050 Oaktree Elementary School 08352 2.61632E+11 F 2013
Goodrich Area Schools 25050 Reid Elementary School 03179 2.61632E+11 A 2014
Grand Blanc Community Schools 25030 Anderson Elementary School 08375 2.61635E+11 B 2014
Grand Blanc Community Schools 25030 City School 08963 2.61635E+11 A, BTO 2014
Grand Blanc Community Schools 25030 Indian Hill Elementary School 01833 2.61635E+11 A 2012
Grand Blanc Community Schools 25030 Myers Elementary School 02654 2.61635E+11 A 2013
Grand Haven Area Public Schools 70010 Grand Haven High School 01455 2.61638E+11 BTO 2014
Page 8 of 22
Attachment 9.B
488
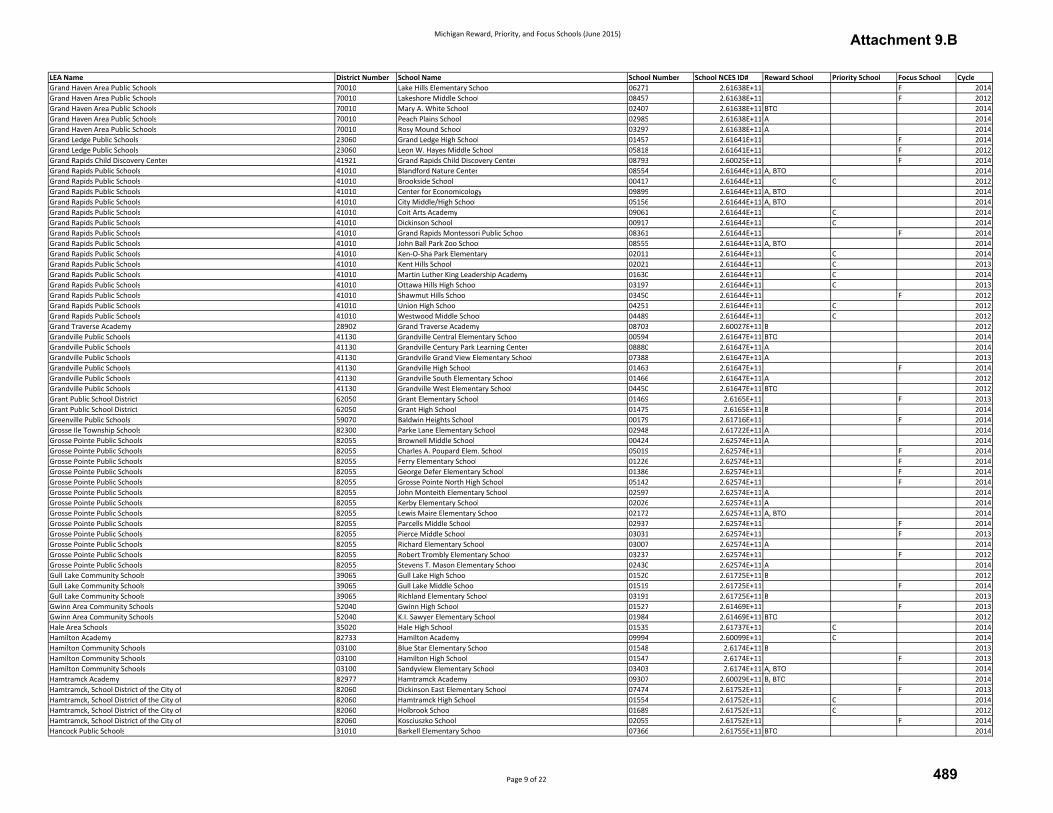
Michigan Reward, Priority, and Focus Schools (June 2015)
LEA Name District Number School Name School Number School NCES ID# Reward School Priority School Focus School Cycle
Grand Haven Area Public Schools 70010 Lake Hills Elementary School 06271 2.61638E+11 F 2014
Grand Haven Area Public Schools 70010 Lakeshore Middle School 08457 2.61638E+11 F 2012
Grand Haven Area Public Schools 70010 Mary A. White School 02407 2.61638E+11 BTO 2014
Grand Haven Area Public Schools 70010 Peach Plains School 02985 2.61638E+11 A 2014
Grand Haven Area Public Schools 70010 Rosy Mound School 03297 2.61638E+11 A 2014
Grand Ledge Public Schools 23060 Grand Ledge High School 01457 2.61641E+11 F 2014
Grand Ledge Public Schools 23060 Leon W. Hayes Middle School 05818 2.61641E+11 F 2012
Grand Rapids Child Discovery Center 41921 Grand Rapids Child Discovery Center 08793 2.60025E+11 F 2014
Grand Rapids Public Schools 41010 Blandford Nature Center 08554 2.61644E+11 A, BTO 2014
Grand Rapids Public Schools 41010 Brookside School 00417 2.61644E+11 C 2012
Grand Rapids Public Schools 41010 Center for Economicology 09899 2.61644E+11 A, BTO 2014
Grand Rapids Public Schools 41010 City Middle/High School 05156 2.61644E+11 A, BTO 2014
Grand Rapids Public Schools 41010 Coit Arts Academy 09061 2.61644E+11 C 2014
Grand Rapids Public Schools 41010 Dickinson School 00917 2.61644E+11 C 2014
Grand Rapids Public Schools 41010 Grand Rapids Montessori Public School 08361 2.61644E+11 F 2014
Grand Rapids Public Schools 41010 John Ball Park Zoo School 08555 2.61644E+11 A, BTO 2014
Grand Rapids Public Schools 41010 Ken-O-Sha Park Elementary 02011 2.61644E+11 C 2014
Grand Rapids Public Schools 41010 Kent Hills School 02021 2.61644E+11 C 2013
Grand Rapids Public Schools 41010 Martin Luther King Leadership Academy 01630 2.61644E+11 C 2014
Grand Rapids Public Schools 41010 Ottawa Hills High School 03197 2.61644E+11 C 2013
Grand Rapids Public Schools 41010 Shawmut Hills School 03450 2.61644E+11 F 2012
Grand Rapids Public Schools 41010 Union High School 04251 2.61644E+11 C 2012
Grand Rapids Public Schools 41010 Westwood Middle School 04489 2.61644E+11 C 2012
Grand Traverse Academy 28902 Grand Traverse Academy 08703 2.60027E+11 B 2012
Grandville Public Schools 41130 Grandville Central Elementary School 00594 2.61647E+11 BTO 2014
Grandville Public Schools 41130 Grandville Century Park Learning Center 08880 2.61647E+11 A 2014
Grandville Public Schools 41130 Grandville Grand View Elementary School 07388 2.61647E+11 A 2013
Grandville Public Schools 41130 Grandville High School 01463 2.61647E+11 F 2014
Grandville Public Schools 41130 Grandville South Elementary School 01466 2.61647E+11 A 2012
Grandville Public Schools 41130 Grandville West Elementary School 04450 2.61647E+11 BTO 2012
Grant Public School District 62050 Grant Elementary School 01469 2.6165E+11 F 2013
Grant Public School District 62050 Grant High School 01475 2.6165E+11 B 2014
Greenville Public Schools 59070 Baldwin Heights School 00179 2.61716E+11 F 2014
Grosse Ile Township Schools 82300 Parke Lane Elementary School 02948 2.61722E+11 A 2014
Grosse Pointe Public Schools 82055 Brownell Middle School 00424 2.62574E+11 A 2014
Grosse Pointe Public Schools 82055 Charles A. Poupard Elem. School 05019 2.62574E+11 F 2014
Grosse Pointe Public Schools 82055 Ferry Elementary School 01226 2.62574E+11 F 2014
Grosse Pointe Public Schools 82055 George Defer Elementary School 01386 2.62574E+11 F 2014
Grosse Pointe Public Schools 82055 Grosse Pointe North High School 05142 2.62574E+11 F 2014
Grosse Pointe Public Schools 82055 John Monteith Elementary School 02597 2.62574E+11 A 2014
Grosse Pointe Public Schools 82055 Kerby Elementary School 02026 2.62574E+11 A 2014
Grosse Pointe Public Schools 82055 Lewis Maire Elementary School 02172 2.62574E+11 A, BTO 2014
Grosse Pointe Public Schools 82055 Parcells Middle School 02937 2.62574E+11 F 2014
Grosse Pointe Public Schools 82055 Pierce Middle School 03031 2.62574E+11 F 2013
Grosse Pointe Public Schools 82055 Richard Elementary School 03007 2.62574E+11 A 2014
Grosse Pointe Public Schools 82055 Robert Trombly Elementary School 03237 2.62574E+11 F 2012
Grosse Pointe Public Schools 82055 Stevens T. Mason Elementary School 02430 2.62574E+11 A 2014
Gull Lake Community Schools 39065 Gull Lake High School 01520 2.61725E+11 B 2012
Gull Lake Community Schools 39065 Gull Lake Middle School 01519 2.61725E+11 F 2014
Gull Lake Community Schools 39065 Richland Elementary School 03191 2.61725E+11 B 2013
Gwinn Area Community Schools 52040 Gwinn High School 01527 2.61469E+11 F 2013
Gwinn Area Community Schools 52040 K.I. Sawyer Elementary School 01984 2.61469E+11 BTO 2012
Hale Area Schools 35020 Hale High School 01535 2.61737E+11 C 2014
Hamilton Academy 82733 Hamilton Academy 09994 2.60099E+11 C 2014
Hamilton Community Schools 03100 Blue Star Elementary School 01548 2.6174E+11 B 2013
Hamilton Community Schools 03100 Hamilton High School 01547 2.6174E+11 F 2013
Hamilton Community Schools 03100 Sandyview Elementary School 03403 2.6174E+11 A, BTO 2014
Hamtramck Academy 82977 Hamtramck Academy 09307 2.60029E+11 B, BTO 2014
Hamtramck, School District of the City of 82060 Dickinson East Elementary School 07474 2.61752E+11 F 2013
Hamtramck, School District of the City of 82060 Hamtramck High School 01554 2.61752E+11 C 2014
Hamtramck, School District of the City of 82060 Holbrook School 01689 2.61752E+11 C 2012
Hamtramck, School District of the City of 82060 Kosciuszko School 02055 2.61752E+11 F 2014
Hancock Public Schools 31010 Barkell Elementary School 07366 2.61755E+11 BTO 2014
Page 9 of 22
Attachment 9.B
489

Michigan Reward, Priority, and Focus Schools (June 2015)
LEA Name District Number School Name School Number School NCES ID# Reward School Priority School Focus School Cycle
Hancock Public Schools 31010 Hancock Central High School 01555 2.61755E+11 B 2013
Hanover-Horton School District 38100 Hanover-Horton High School 01561 2.61764E+11 B 2014
Harbor Beach Community Schools 32060 Harbor Beach Elementary School 06115 2.60001E+11 B, BTO 2014
Harbor Beach Community Schools 32060 Harbor Beach Middle School 08487 2.60001E+11 B, BTO 2014
Harbor Springs School District 24020 Blackbird Elementary School 07741 2.6177E+11 B 2014
Harbor Springs School District 24020 Harbor Springs High School 01564 2.6177E+11 A 2014
Harper Creek Community Schools 13070 Beadle Lake Elementary School 00234 2.61773E+11 F 2014
Harper Creek Community Schools 13070 Harper Creek High School 01576 2.61773E+11 F 2014
Harper Creek Community Schools 13070 Wattles Park Elementary School 04400 2.61773E+11 B 2012
Harper Woods, The School District of the City of 82320 Harper Woods High School 01578 2.61776E+11 C 2013
Harrison Community Schools 18060 Harrison Middle School 05811 2.61782E+11 F 2013
Harrison Community Schools 18060 Robert M. Larson Elementary School 06392 2.61782E+11 B 2012
Hart Public School District 64040 Spitler Elementary School 03566 2.61786E+11 B, BTO 2014
Hartford Public Schools 80120 Red Arrow Elementary School 02721 2.61788E+11 B, BTO 2013
Hartford Public Schools 80120 Woodside Elementary School 01599 2.61788E+11 BTO 2014
Hartland Consolidated Schools 47060 Creekside Elementary School 09048 2.61791E+11 A 2012
Hartland Consolidated Schools 47060 Hartland Farms Intermediate School 05789 2.61791E+11 A 2012
Hartland Consolidated Schools 47060 Hartland Lakes Elementary School 06874 2.61791E+11 B 2013
Haslett Public Schools 33060 Haslett Middle School 01604 2.61794E+11 A 2013
Haslett Public Schools 33060 Murphy Elementary School 01530 2.61794E+11 A, BTO 2014
Hastings Area School District 08030 Hastings Middle School 01607 2.61797E+11 F 2013
Hastings Area School District 08030 Northeastern Elementary School 00077 2.61797E+11 F 2014
Hastings Area School District 08030 Star Elementary School 08469 2.61797E+11 BTO 2014
Hazel Park, School District of the City of 63130 Hazel Park Adult Education 07680 2.61803E+11 C 2013
Hazel Park, School District of the City of 63130 Hazel Park High School 01616 2.61803E+11 B, BTO 2014
Hazel Park, School District of the City of 63130 Hoover Elementary School 01753 2.61803E+11 F 2014
Hemlock Public School District 73210 Hemlock Elementary School 01624 2.61818E+11 F 2012
Hemlock Public School District 73210 Hemlock High School 01625 2.61818E+11 A 2012
Hemlock Public School District 73210 Hemlock Middle School 05152 2.61818E+11 F 2014
Hesperia Community Schools 62060 Hesperia High School 01655 2.61827E+11 B 2012
Hesperia Community Schools 62060 Hesperia Middle School 06427 2.61827E+11 B 2012
Highland Park Public School Academy System 82749 Highland Park Community H.S. 01666 2.60101E+11 C 2013
Hillman Community Schools 60020 Hillman Elementary School 08495 2.61836E+11 BTO 2013
Hillsdale Community Schools 30020 Hillsdale High School 01685 2.61839E+11 B 2014
Holland City School District 70020 East 07577 2.61842E+11 F 2014
Holland City School District 70020 Holland Heights 09275 2.61842E+11 B 2012
Holland City School District 70020 Holland High School 01697 2.61842E+11 F 2014
Holland City School District 70020 Jefferson 09965 2.61842E+11 F 2014
Holland City School District 70020 West 09964 2.61842E+11 F 2014
Holly Academy 63911 Holly Academy 08734 2.60022E+11 A 2014
Holly Area School District 63210 Davisburg Elementary School 00877 2.61845E+11 A, BTO 2013
Holly Area School District 63210 Holly Middle School 06398 2.61845E+11 F 2013
Holt Public Schools 33070 Dimondale Elementary School 00918 2.61848E+11 F 2014
Holt Public Schools 33070 Elliott Elementary School 01112 2.61848E+11 F 2014
Holt Public Schools 33070 Holt Junior High School 09301 2.61848E+11 F 2014
Holt Public Schools 33070 Hope Middle School 06663 2.61848E+11 F 2014
Holt Public Schools 33070 Midway Early Childhood Center 02557 2.61848E+11 F 2013
Holt Public Schools 33070 Sycamore Elementary School 04118 2.61848E+11 F 2014
Holt Public Schools 33070 Washington Woods Middle School 07797 2.61848E+11 F 2012
Holt Public Schools 33070 Wilcox Elementary School 05669 2.61848E+11 F 2014
Holton Public Schools 61120 Holton Elementary School 01712 2.61851E+11 F 2014
Homer Community School District 13080 Homer Community High School 01748 2.61854E+11 B, BTO 2014
Honey Creek Community School 81901 Honey Creek Community School 08241 2.60012E+11 F 2013
Hope Academy 82942 Hope Academy 08637 2.60023E+11 C 2014
Hope Academy of West Michigan 41926 Hope Academy of West Michigan 00709 2.60099E+11 C 2014
Hope of Detroit Academy 82957 Hope of Detroit Academy 08722 2.60024E+11 B 2013
Hopkins Public Schools 03070 Hopkins High School 01757 2.61857E+11 B 2013
Hopkins Public Schools 03070 Sycamore Elementary School 06025 2.61857E+11 A 2013
Houghton Lake Community Schools 72020 Collins Elementary School 00750 2.6186E+11 F 2012
Houghton Lake Community Schools 72020 Houghton Lake Middle School 06930 2.6186E+11 F 2014
Houghton-Portage Township School District 31110 Houghton Central High School 01766 2.62889E+11 F 2013
Houghton-Portage Township School District 31110 Houghton Elementary School 06411 2.62889E+11 F 2014
Houghton-Portage Township School District 31110 Houghton Middle School 08558 2.62889E+11 F 2014
Page 10 of 22
Attachment 9.B
490
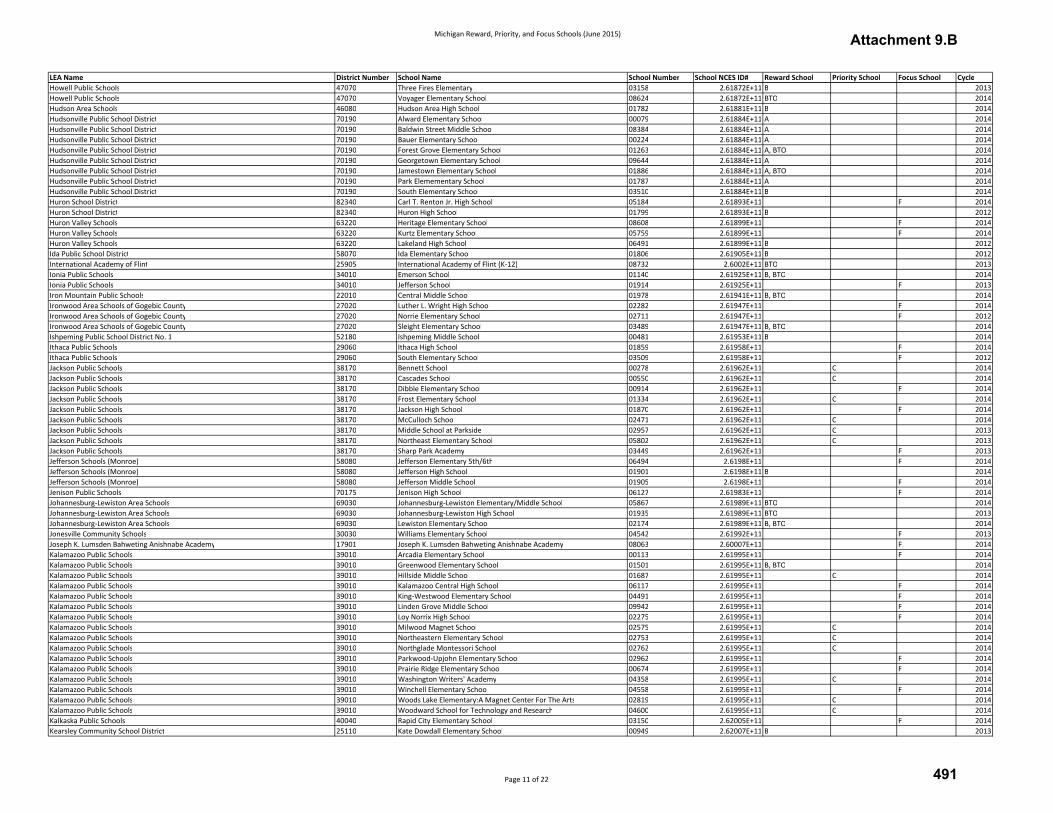
Michigan Reward, Priority, and Focus Schools (June 2015)
LEA Name District Number School Name School Number School NCES ID# Reward School Priority School Focus School Cycle
Howell Public Schools 47070 Three Fires Elementary 03158 2.61872E+11 B 2013
Howell Public Schools 47070 Voyager Elementary School 08624 2.61872E+11 BTO 2014
Hudson Area Schools 46080 Hudson Area High School 01782 2.61881E+11 B 2014
Hudsonville Public School District 70190 Alward Elementary School 00079 2.61884E+11 A 2014
Hudsonville Public School District 70190 Baldwin Street Middle School 08384 2.61884E+11 A 2014
Hudsonville Public School District 70190 Bauer Elementary School 00224 2.61884E+11 A 2014
Hudsonville Public School District 70190 Forest Grove Elementary School 01263 2.61884E+11 A, BTO 2014
Hudsonville Public School District 70190 Georgetown Elementary School 09644 2.61884E+11 A 2014
Hudsonville Public School District 70190 Jamestown Elementary School 01886 2.61884E+11 A, BTO 2014
Hudsonville Public School District 70190 Park Elemementary School 01787 2.61884E+11 A 2014
Hudsonville Public School District 70190 South Elementary School 03510 2.61884E+11 B 2014
Huron School District 82340 Carl T. Renton Jr. High School 05184 2.61893E+11 F 2014
Huron School District 82340 Huron High School 01799 2.61893E+11 B 2012
Huron Valley Schools 63220 Heritage Elementary School 08608 2.61899E+11 F 2014
Huron Valley Schools 63220 Kurtz Elementary School 05759 2.61899E+11 F 2014
Huron Valley Schools 63220 Lakeland High School 06491 2.61899E+11 B 2012
Ida Public School District 58070 Ida Elementary School 01806 2.61905E+11 B 2012
International Academy of Flint 25905 International Academy of Flint (K-12) 08732 2.6002E+11 BTO 2013
Ionia Public Schools 34010 Emerson School 01140 2.61925E+11 B, BTO 2014
Ionia Public Schools 34010 Jefferson School 01914 2.61925E+11 F 2013
Iron Mountain Public Schools 22010 Central Middle School 01978 2.61941E+11 B, BTO 2014
Ironwood Area Schools of Gogebic County 27020 Luther L. Wright High School 02282 2.61947E+11 F 2014
Ironwood Area Schools of Gogebic County 27020 Norrie Elementary School 02711 2.61947E+11 F 2012
Ironwood Area Schools of Gogebic County 27020 Sleight Elementary School 03489 2.61947E+11 B, BTO 2014
Ishpeming Public School District No. 1 52180 Ishpeming Middle School 00481 2.61953E+11 B 2014
Ithaca Public Schools 29060 Ithaca High School 01859 2.61958E+11 F 2014
Ithaca Public Schools 29060 South Elementary School 03509 2.61958E+11 F 2012
Jackson Public Schools 38170 Bennett School 00278 2.61962E+11 C 2014
Jackson Public Schools 38170 Cascades School 00550 2.61962E+11 C 2014
Jackson Public Schools 38170 Dibble Elementary School 00914 2.61962E+11 F 2014
Jackson Public Schools 38170 Frost Elementary School 01334 2.61962E+11 C 2014
Jackson Public Schools 38170 Jackson High School 01870 2.61962E+11 F 2014
Jackson Public Schools 38170 McCulloch School 02471 2.61962E+11 C 2014
Jackson Public Schools 38170 Middle School at Parkside 02957 2.61962E+11 C 2013
Jackson Public Schools 38170 Northeast Elementary School 05802 2.61962E+11 C 2013
Jackson Public Schools 38170 Sharp Park Academy 03449 2.61962E+11 F 2013
Jefferson Schools (Monroe) 58080 Jefferson Elementary 5th/6th 06494 2.6198E+11 F 2014
Jefferson Schools (Monroe) 58080 Jefferson High School 01901 2.6198E+11 B 2014
Jefferson Schools (Monroe) 58080 Jefferson Middle School 01905 2.6198E+11 F 2014
Jenison Public Schools 70175 Jenison High School 06127 2.61983E+11 F 2014
Johannesburg-Lewiston Area Schools 69030 Johannesburg-Lewiston Elementary/Middle School 05867 2.61989E+11 BTO 2014
Johannesburg-Lewiston Area Schools 69030 Johannesburg-Lewiston High School 01935 2.61989E+11 BTO 2013
Johannesburg-Lewiston Area Schools 69030 Lewiston Elementary School 02174 2.61989E+11 B, BTO 2014
Jonesville Community Schools 30030 Williams Elementary School 04542 2.61992E+11 F 2013
Joseph K. Lumsden Bahweting Anishnabe Academy 17901 Joseph K. Lumsden Bahweting Anishnabe Academy 08063 2.60007E+11 F 2014
Kalamazoo Public Schools 39010 Arcadia Elementary School 00113 2.61995E+11 F 2014
Kalamazoo Public Schools 39010 Greenwood Elementary School 01501 2.61995E+11 B, BTO 2014
Kalamazoo Public Schools 39010 Hillside Middle School 01687 2.61995E+11 C 2014
Kalamazoo Public Schools 39010 Kalamazoo Central High School 06117 2.61995E+11 F 2014
Kalamazoo Public Schools 39010 King-Westwood Elementary School 04491 2.61995E+11 F 2014
Kalamazoo Public Schools 39010 Linden Grove Middle School 09942 2.61995E+11 F 2014
Kalamazoo Public Schools 39010 Loy Norrix High School 02275 2.61995E+11 F 2014
Kalamazoo Public Schools 39010 Milwood Magnet School 02575 2.61995E+11 C 2014
Kalamazoo Public Schools 39010 Northeastern Elementary School 02753 2.61995E+11 C 2014
Kalamazoo Public Schools 39010 Northglade Montessori School 02762 2.61995E+11 C 2014
Kalamazoo Public Schools 39010 Parkwood-Upjohn Elementary School 02962 2.61995E+11 F 2014
Kalamazoo Public Schools 39010 Prairie Ridge Elementary School 00674 2.61995E+11 F 2014
Kalamazoo Public Schools 39010 Washington Writers' Academy 04358 2.61995E+11 C 2014
Kalamazoo Public Schools 39010 Winchell Elementary School 04558 2.61995E+11 F 2014
Kalamazoo Public Schools 39010 Woods Lake Elementary:A Magnet Center For The Arts 02819 2.61995E+11 C 2014
Kalamazoo Public Schools 39010 Woodward School for Technology and Research 04600 2.61995E+11 C 2014
Kalkaska Public Schools 40040 Rapid City Elementary School 03150 2.62005E+11 F 2014
Kearsley Community School District 25110 Kate Dowdall Elementary School 00949 2.62007E+11 B 2013
Page 11 of 22
Attachment 9.B
491
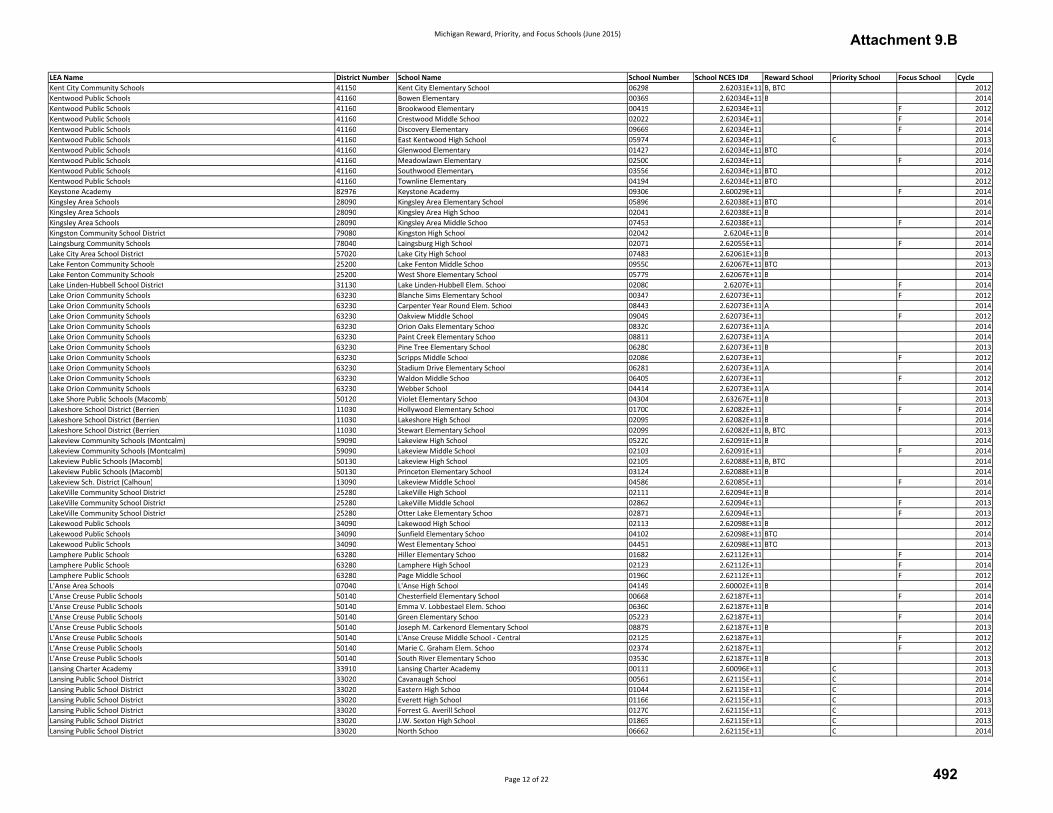
Michigan Reward, Priority, and Focus Schools (June 2015)
LEA Name District Number School Name School Number School NCES ID# Reward School Priority School Focus School Cycle
Kent City Community Schools 41150 Kent City Elementary School 06298 2.62031E+11 B, BTO 2012
Kentwood Public Schools 41160 Bowen Elementary 00369 2.62034E+11 B 2014
Kentwood Public Schools 41160 Brookwood Elementary 00419 2.62034E+11 F 2012
Kentwood Public Schools 41160 Crestwood Middle School 02022 2.62034E+11 F 2014
Kentwood Public Schools 41160 Discovery Elementary 09669 2.62034E+11 F 2014
Kentwood Public Schools 41160 East Kentwood High School 05974 2.62034E+11 C 2013
Kentwood Public Schools 41160 Glenwood Elementary 01427 2.62034E+11 BTO 2014
Kentwood Public Schools 41160 Meadowlawn Elementary 02500 2.62034E+11 F 2014
Kentwood Public Schools 41160 Southwood Elementary 03556 2.62034E+11 BTO 2012
Kentwood Public Schools 41160 Townline Elementary 04194 2.62034E+11 BTO 2012
Keystone Academy 82976 Keystone Academy 09306 2.60029E+11 F 2014
Kingsley Area Schools 28090 Kingsley Area Elementary School 05896 2.62038E+11 BTO 2014
Kingsley Area Schools 28090 Kingsley Area High School 02041 2.62038E+11 B 2014
Kingsley Area Schools 28090 Kingsley Area Middle School 07453 2.62038E+11 F 2014
Kingston Community School District 79080 Kingston High School 02042 2.6204E+11 B 2014
Laingsburg Community Schools 78040 Laingsburg High School 02071 2.62055E+11 F 2014
Lake City Area School District 57020 Lake City High School 07483 2.62061E+11 B 2013
Lake Fenton Community Schools 25200 Lake Fenton Middle School 09550 2.62067E+11 BTO 2013
Lake Fenton Community Schools 25200 West Shore Elementary School 05779 2.62067E+11 B 2014
Lake Linden-Hubbell School District 31130 Lake Linden-Hubbell Elem. School 02080 2.6207E+11 F 2014
Lake Orion Community Schools 63230 Blanche Sims Elementary School 00347 2.62073E+11 F 2012
Lake Orion Community Schools 63230 Carpenter Year Round Elem. School 08443 2.62073E+11 A 2014
Lake Orion Community Schools 63230 Oakview Middle School 09049 2.62073E+11 F 2012
Lake Orion Community Schools 63230 Orion Oaks Elementary School 08320 2.62073E+11 A 2014
Lake Orion Community Schools 63230 Paint Creek Elementary School 08811 2.62073E+11 A 2014
Lake Orion Community Schools 63230 Pine Tree Elementary School 06280 2.62073E+11 B 2013
Lake Orion Community Schools 63230 Scripps Middle School 02086 2.62073E+11 F 2012
Lake Orion Community Schools 63230 Stadium Drive Elementary School 06281 2.62073E+11 A 2014
Lake Orion Community Schools 63230 Waldon Middle School 06405 2.62073E+11 F 2012
Lake Orion Community Schools 63230 Webber School 04414 2.62073E+11 A 2014
Lake Shore Public Schools (Macomb) 50120 Violet Elementary School 04304 2.63267E+11 B 2013
Lakeshore School District (Berrien) 11030 Hollywood Elementary School 01700 2.62082E+11 F 2014
Lakeshore School District (Berrien) 11030 Lakeshore High School 02095 2.62082E+11 B 2014
Lakeshore School District (Berrien) 11030 Stewart Elementary School 02099 2.62082E+11 B, BTO 2013
Lakeview Community Schools (Montcalm) 59090 Lakeview High School 05220 2.62091E+11 B 2014
Lakeview Community Schools (Montcalm) 59090 Lakeview Middle School 02103 2.62091E+11 F 2014
Lakeview Public Schools (Macomb) 50130 Lakeview High School 02105 2.62088E+11 B, BTO 2014
Lakeview Public Schools (Macomb) 50130 Princeton Elementary School 03124 2.62088E+11 B 2014
Lakeview Sch. District (Calhoun) 13090 Lakeview Middle School 04586 2.62085E+11 F 2014
LakeVille Community School District 25280 LakeVille High School 02111 2.62094E+11 B 2014
LakeVille Community School District 25280 LakeVille Middle School 02862 2.62094E+11 F 2013
LakeVille Community School District 25280 Otter Lake Elementary School 02871 2.62094E+11 F 2013
Lakewood Public Schools 34090 Lakewood High School 02113 2.62098E+11 B 2012
Lakewood Public Schools 34090 Sunfield Elementary School 04102 2.62098E+11 BTO 2014
Lakewood Public Schools 34090 West Elementary School 04451 2.62098E+11 BTO 2013
Lamphere Public Schools 63280 Hiller Elementary School 01682 2.62112E+11 F 2014
Lamphere Public Schools 63280 Lamphere High School 02123 2.62112E+11 F 2014
Lamphere Public Schools 63280 Page Middle School 01960 2.62112E+11 F 2012
L'Anse Area Schools 07040 L'Anse High School 04149 2.60002E+11 B 2014
L'Anse Creuse Public Schools 50140 Chesterfield Elementary School 00668 2.62187E+11 F 2014
L'Anse Creuse Public Schools 50140 Emma V. Lobbestael Elem. School 06360 2.62187E+11 B 2014
L'Anse Creuse Public Schools 50140 Green Elementary School 05223 2.62187E+11 F 2014
L'Anse Creuse Public Schools 50140 Joseph M. Carkenord Elementary School 08879 2.62187E+11 B 2013
L'Anse Creuse Public Schools 50140 L'Anse Creuse Middle School - Central 02125 2.62187E+11 F 2012
L'Anse Creuse Public Schools 50140 Marie C. Graham Elem. School 02374 2.62187E+11 F 2012
L'Anse Creuse Public Schools 50140 South River Elementary School 03530 2.62187E+11 B 2013
Lansing Charter Academy 33910 Lansing Charter Academy 00111 2.60096E+11 C 2013
Lansing Public School District 33020 Cavanaugh School 00561 2.62115E+11 C 2014
Lansing Public School District 33020 Eastern High School 01044 2.62115E+11 C 2014
Lansing Public School District 33020 Everett High School 01166 2.62115E+11 C 2013
Lansing Public School District 33020 Forrest G. Averill School 01270 2.62115E+11 C 2013
Lansing Public School District 33020 J.W. Sexton High School 01865 2.62115E+11 C 2013
Lansing Public School District 33020 North School 06662 2.62115E+11 C 2014
Page 12 of 22
Attachment 9.B
492
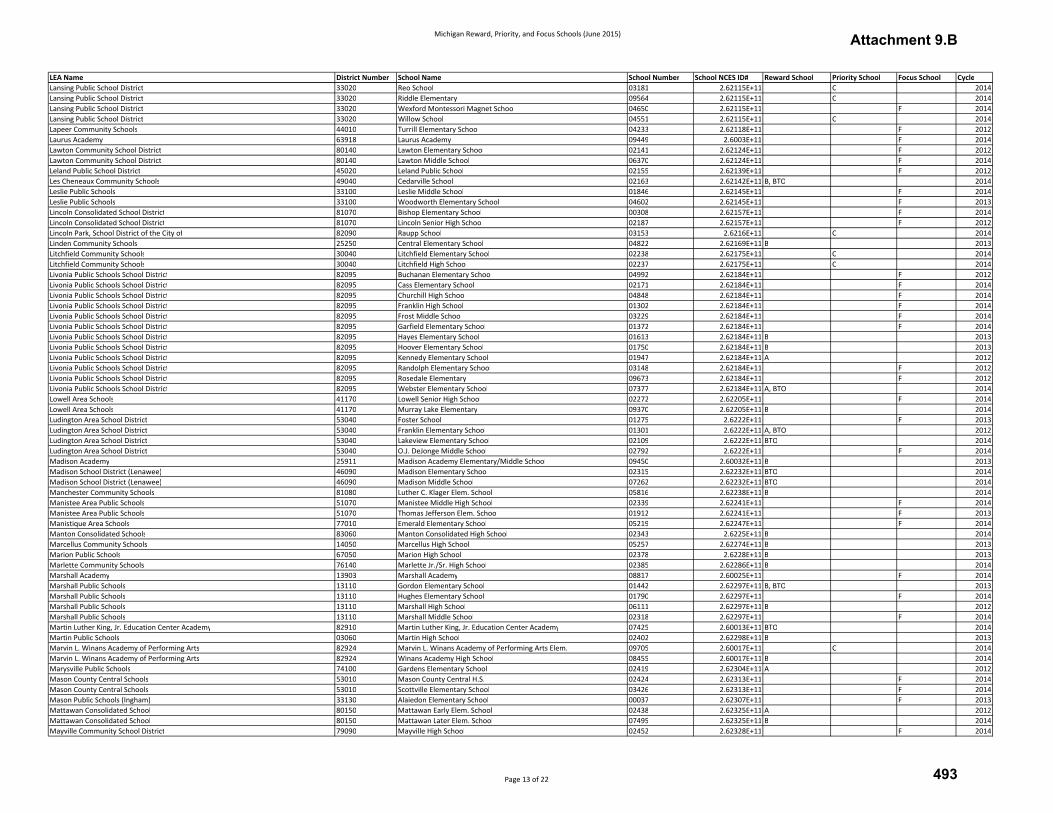
Michigan Reward, Priority, and Focus Schools (June 2015)
LEA Name District Number School Name School Number School NCES ID# Reward School Priority School Focus School Cycle
Lansing Public School District 33020 Reo School 03181 2.62115E+11 C 2014
Lansing Public School District 33020 Riddle Elementary 09564 2.62115E+11 C 2014
Lansing Public School District 33020 Wexford Montessori Magnet School 04650 2.62115E+11 F 2014
Lansing Public School District 33020 Willow School 04551 2.62115E+11 C 2014
Lapeer Community Schools 44010 Turrill Elementary School 04233 2.62118E+11 F 2012
Laurus Academy 63918 Laurus Academy 09449 2.6003E+11 F 2014
Lawton Community School District 80140 Lawton Elementary School 02141 2.62124E+11 F 2012
Lawton Community School District 80140 Lawton Middle School 06370 2.62124E+11 F 2014
Leland Public School District 45020 Leland Public School 02155 2.62139E+11 F 2012
Les Cheneaux Community Schools 49040 Cedarville School 02163 2.62142E+11 B, BTO 2014
Leslie Public Schools 33100 Leslie Middle School 01846 2.62145E+11 F 2014
Leslie Public Schools 33100 Woodworth Elementary School 04602 2.62145E+11 F 2013
Lincoln Consolidated School District 81070 Bishop Elementary School 00308 2.62157E+11 F 2014
Lincoln Consolidated School District 81070 Lincoln Senior High School 02187 2.62157E+11 F 2012
Lincoln Park, School District of the City of 82090 Raupp School 03153 2.6216E+11 C 2014
Linden Community Schools 25250 Central Elementary School 04822 2.62169E+11 B 2013
Litchfield Community Schools 30040 Litchfield Elementary School 02238 2.62175E+11 C 2014
Litchfield Community Schools 30040 Litchfield High School 02237 2.62175E+11 C 2014
Livonia Public Schools School District 82095 Buchanan Elementary School 04992 2.62184E+11 F 2012
Livonia Public Schools School District 82095 Cass Elementary School 02171 2.62184E+11 F 2014
Livonia Public Schools School District 82095 Churchill High School 04848 2.62184E+11 F 2014
Livonia Public Schools School District 82095 Franklin High School 01302 2.62184E+11 F 2014
Livonia Public Schools School District 82095 Frost Middle School 03229 2.62184E+11 F 2014
Livonia Public Schools School District 82095 Garfield Elementary School 01372 2.62184E+11 F 2014
Livonia Public Schools School District 82095 Hayes Elementary School 01613 2.62184E+11 B 2013
Livonia Public Schools School District 82095 Hoover Elementary School 01750 2.62184E+11 B 2013
Livonia Public Schools School District 82095 Kennedy Elementary School 01947 2.62184E+11 A 2012
Livonia Public Schools School District 82095 Randolph Elementary School 03148 2.62184E+11 F 2012
Livonia Public Schools School District 82095 Rosedale Elementary 09673 2.62184E+11 F 2012
Livonia Public Schools School District 82095 Webster Elementary School 07377 2.62184E+11 A, BTO 2014
Lowell Area Schools 41170 Lowell Senior High School 02272 2.62205E+11 F 2014
Lowell Area Schools 41170 Murray Lake Elementary 09370 2.62205E+11 B 2014
Ludington Area School District 53040 Foster School 01275 2.6222E+11 F 2013
Ludington Area School District 53040 Franklin Elementary School 01301 2.6222E+11 A, BTO 2012
Ludington Area School District 53040 Lakeview Elementary School 02109 2.6222E+11 BTO 2014
Ludington Area School District 53040 O.J. DeJonge Middle School 02792 2.6222E+11 F 2014
Madison Academy 25911 Madison Academy Elementary/Middle School 09450 2.60032E+11 B 2013
Madison School District (Lenawee) 46090 Madison Elementary School 02315 2.62232E+11 BTO 2014
Madison School District (Lenawee) 46090 Madison Middle School 07262 2.62232E+11 BTO 2014
Manchester Community Schools 81080 Luther C. Klager Elem. School 05816 2.62238E+11 B 2014
Manistee Area Public Schools 51070 Manistee Middle High School 02339 2.62241E+11 F 2014
Manistee Area Public Schools 51070 Thomas Jefferson Elem. School 01912 2.62241E+11 F 2013
Manistique Area Schools 77010 Emerald Elementary School 05219 2.62247E+11 F 2014
Manton Consolidated Schools 83060 Manton Consolidated High School 02343 2.6225E+11 B 2014
Marcellus Community Schools 14050 Marcellus High School 05257 2.62274E+11 B 2013
Marion Public Schools 67050 Marion High School 02378 2.6228E+11 B 2013
Marlette Community Schools 76140 Marlette Jr./Sr. High School 02385 2.62286E+11 B 2014
Marshall Academy 13903 Marshall Academy 08817 2.60025E+11 F 2014
Marshall Public Schools 13110 Gordon Elementary School 01442 2.62297E+11 B, BTO 2013
Marshall Public Schools 13110 Hughes Elementary School 01790 2.62297E+11 F 2014
Marshall Public Schools 13110 Marshall High School 06111 2.62297E+11 B 2012
Marshall Public Schools 13110 Marshall Middle School 02318 2.62297E+11 F 2014
Martin Luther King, Jr. Education Center Academy 82910 Martin Luther King, Jr. Education Center Academy 07425 2.60013E+11 BTO 2014
Martin Public Schools 03060 Martin High School 02402 2.62298E+11 B 2013
Marvin L. Winans Academy of Performing Arts 82924 Marvin L. Winans Academy of Performing Arts Elem. 09705 2.60017E+11 C 2014
Marvin L. Winans Academy of Performing Arts 82924 Winans Academy High School 08455 2.60017E+11 B 2014
Marysville Public Schools 74100 Gardens Elementary School 02419 2.62304E+11 A 2012
Mason County Central Schools 53010 Mason County Central H.S. 02424 2.62313E+11 F 2014
Mason County Central Schools 53010 Scottville Elementary School 03426 2.62313E+11 F 2014
Mason Public Schools (Ingham) 33130 Alaiedon Elementary School 00037 2.62307E+11 F 2013
Mattawan Consolidated School 80150 Mattawan Early Elem. School 02438 2.62325E+11 A 2012
Mattawan Consolidated School 80150 Mattawan Later Elem. School 07495 2.62325E+11 B 2014
Mayville Community School District 79090 Mayville High School 02452 2.62328E+11 F 2014
Page 13 of 22
Attachment 9.B
493
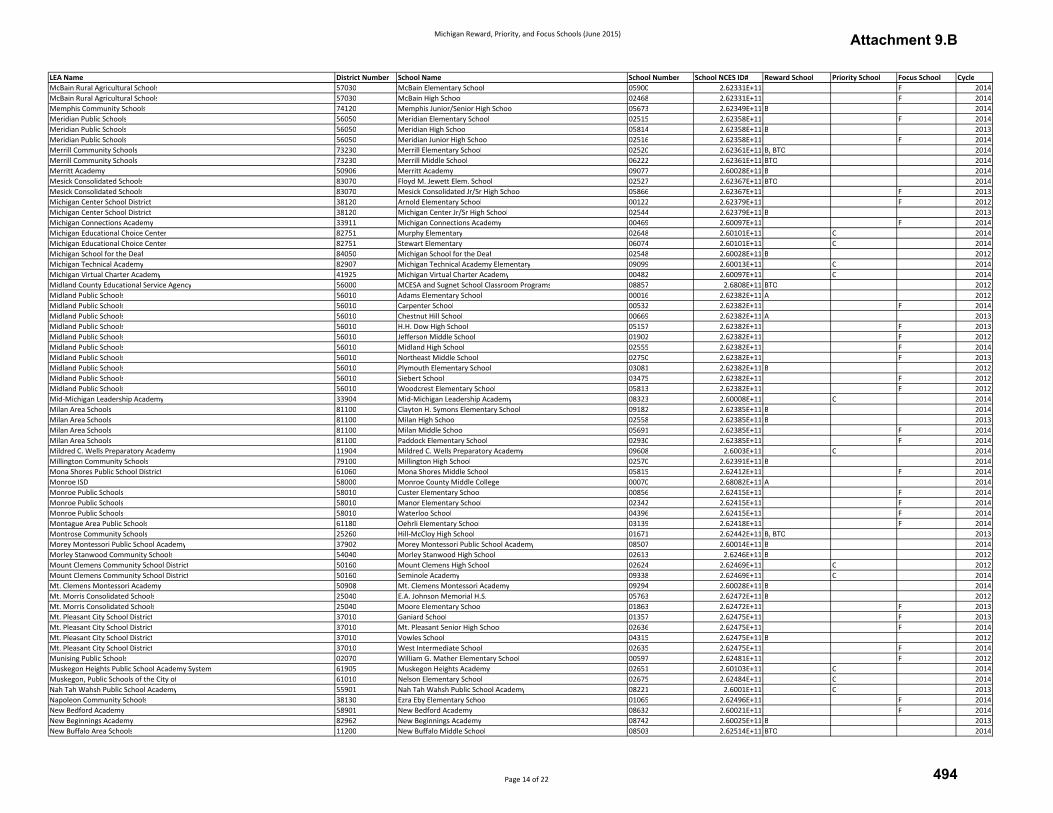
Michigan Reward, Priority, and Focus Schools (June 2015)
LEA Name District Number School Name School Number School NCES ID# Reward School Priority School Focus School Cycle
McBain Rural Agricultural Schools 57030 McBain Elementary School 05900 2.62331E+11 F 2014
McBain Rural Agricultural Schools 57030 McBain High School 02468 2.62331E+11 F 2014
Memphis Community Schools 74120 Memphis Junior/Senior High School 05673 2.62349E+11 B 2014
Meridian Public Schools 56050 Meridian Elementary School 02515 2.62358E+11 F 2014
Meridian Public Schools 56050 Meridian High School 05814 2.62358E+11 B 2013
Meridian Public Schools 56050 Meridian Junior High School 02516 2.62358E+11 F 2014
Merrill Community Schools 73230 Merrill Elementary School 02520 2.62361E+11 B, BTO 2014
Merrill Community Schools 73230 Merrill Middle School 06222 2.62361E+11 BTO 2014
Merritt Academy 50906 Merritt Academy 09077 2.60028E+11 B 2014
Mesick Consolidated Schools 83070 Floyd M. Jewett Elem. School 02527 2.62367E+11 BTO 2014
Mesick Consolidated Schools 83070 Mesick Consolidated Jr/Sr High School 05866 2.62367E+11 F 2013
Michigan Center School District 38120 Arnold Elementary School 00122 2.62379E+11 F 2012
Michigan Center School District 38120 Michigan Center Jr/Sr High School 02544 2.62379E+11 B 2013
Michigan Connections Academy 33911 Michigan Connections Academy 00469 2.60097E+11 F 2014
Michigan Educational Choice Center 82751 Murphy Elementary 02648 2.60101E+11 C 2014
Michigan Educational Choice Center 82751 Stewart Elementary 06074 2.60101E+11 C 2014
Michigan School for the Deaf 84050 Michigan School for the Deaf 02548 2.60028E+11 B 2012
Michigan Technical Academy 82907 Michigan Technical Academy Elementary 09099 2.60013E+11 C 2014
Michigan Virtual Charter Academy 41925 Michigan Virtual Charter Academy 00482 2.60097E+11 C 2014
Midland County Educational Service Agency 56000 MCESA and Sugnet School Classroom Programs 08857 2.6808E+11 BTO 2012
Midland Public Schools 56010 Adams Elementary School 00016 2.62382E+11 A 2012
Midland Public Schools 56010 Carpenter School 00532 2.62382E+11 F 2014
Midland Public Schools 56010 Chestnut Hill School 00669 2.62382E+11 A 2013
Midland Public Schools 56010 H.H. Dow High School 05157 2.62382E+11 F 2013
Midland Public Schools 56010 Jefferson Middle School 01902 2.62382E+11 F 2012
Midland Public Schools 56010 Midland High School 02555 2.62382E+11 F 2014
Midland Public Schools 56010 Northeast Middle School 02750 2.62382E+11 F 2013
Midland Public Schools 56010 Plymouth Elementary School 03081 2.62382E+11 B 2012
Midland Public Schools 56010 Siebert School 03475 2.62382E+11 F 2012
Midland Public Schools 56010 Woodcrest Elementary School 05813 2.62382E+11 F 2012
Mid-Michigan Leadership Academy 33904 Mid-Michigan Leadership Academy 08323 2.60008E+11 C 2014
Milan Area Schools 81100 Clayton H. Symons Elementary School 09182 2.62385E+11 B 2014
Milan Area Schools 81100 Milan High School 02558 2.62385E+11 B 2013
Milan Area Schools 81100 Milan Middle School 05691 2.62385E+11 F 2014
Milan Area Schools 81100 Paddock Elementary School 02930 2.62385E+11 F 2014
Mildred C. Wells Preparatory Academy 11904 Mildred C. Wells Preparatory Academy 09608 2.6003E+11 C 2014
Millington Community Schools 79100 Millington High School 02570 2.62391E+11 B 2014
Mona Shores Public School District 61060 Mona Shores Middle School 05815 2.62412E+11 F 2014
Monroe ISD 58000 Monroe County Middle College 00070 2.68082E+11 A 2014
Monroe Public Schools 58010 Custer Elementary School 00856 2.62415E+11 F 2014
Monroe Public Schools 58010 Manor Elementary School 02342 2.62415E+11 F 2014
Monroe Public Schools 58010 Waterloo School 04396 2.62415E+11 F 2014
Montague Area Public Schools 61180 Oehrli Elementary School 03139 2.62418E+11 F 2014
Montrose Community Schools 25260 Hill-McCloy High School 01671 2.62442E+11 B, BTO 2013
Morey Montessori Public School Academy 37902 Morey Montessori Public School Academy 08507 2.60014E+11 B 2014
Morley Stanwood Community Schools 54040 Morley Stanwood High School 02613 2.6246E+11 B 2012
Mount Clemens Community School District 50160 Mount Clemens High School 02624 2.62469E+11 C 2012
Mount Clemens Community School District 50160 Seminole Academy 09338 2.62469E+11 C 2014
Mt. Clemens Montessori Academy 50908 Mt. Clemens Montessori Academy 09294 2.60028E+11 B 2014
Mt. Morris Consolidated Schools 25040 E.A. Johnson Memorial H.S. 05763 2.62472E+11 B 2012
Mt. Morris Consolidated Schools 25040 Moore Elementary School 01863 2.62472E+11 F 2013
Mt. Pleasant City School District 37010 Ganiard School 01357 2.62475E+11 F 2013
Mt. Pleasant City School District 37010 Mt. Pleasant Senior High School 02636 2.62475E+11 F 2014
Mt. Pleasant City School District 37010 Vowles School 04315 2.62475E+11 B 2012
Mt. Pleasant City School District 37010 West Intermediate School 02635 2.62475E+11 F 2014
Munising Public Schools 02070 William G. Mather Elementary School 00597 2.62481E+11 F 2012
Muskegon Heights Public School Academy System 61905 Muskegon Heights Academy 02651 2.60103E+11 C 2014
Muskegon, Public Schools of the City of 61010 Nelson Elementary School 02675 2.62484E+11 C 2014
Nah Tah Wahsh Public School Academy 55901 Nah Tah Wahsh Public School Academy 08221 2.6001E+11 C 2013
Napoleon Community Schools 38130 Ezra Eby Elementary School 01065 2.62496E+11 F 2014
New Bedford Academy 58901 New Bedford Academy 08632 2.60021E+11 F 2014
New Beginnings Academy 82962 New Beginnings Academy 08742 2.60025E+11 B 2013
New Buffalo Area Schools 11200 New Buffalo Middle School 08503 2.62514E+11 BTO 2014
Page 14 of 22
Attachment 9.B
494
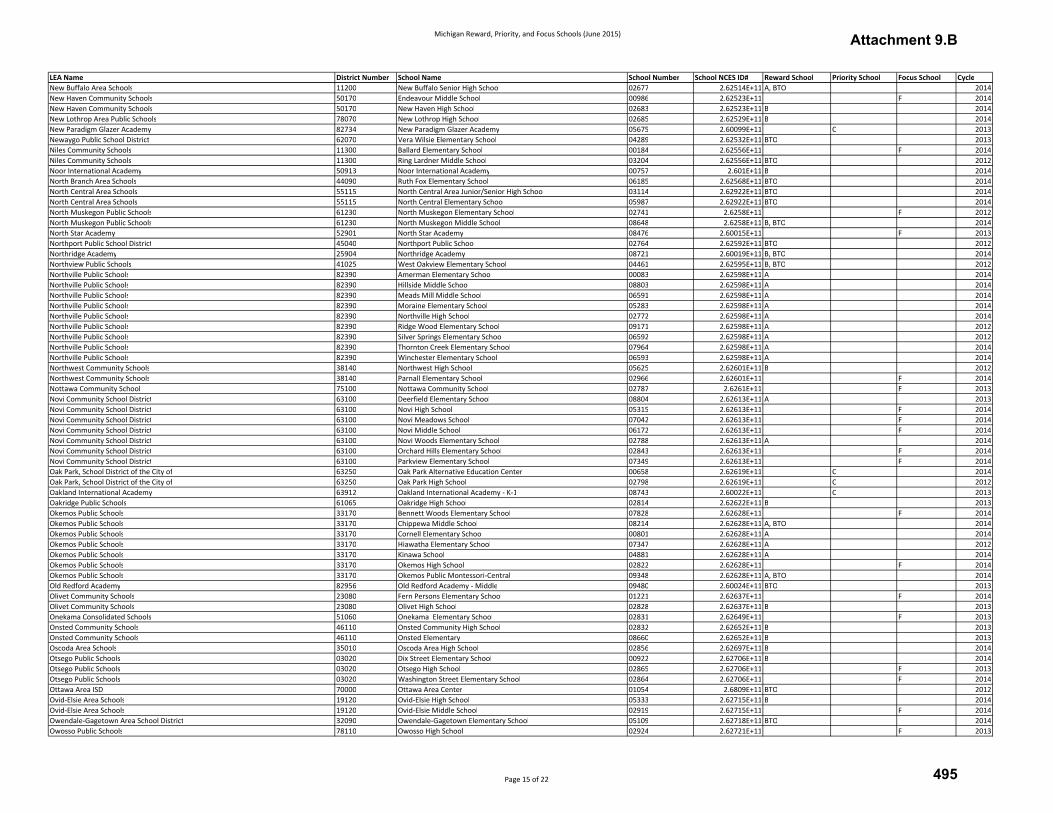
Michigan Reward, Priority, and Focus Schools (June 2015)
LEA Name District Number School Name School Number School NCES ID# Reward School Priority School Focus School Cycle
New Buffalo Area Schools 11200 New Buffalo Senior High School 02677 2.62514E+11 A, BTO 2014
New Haven Community Schools 50170 Endeavour Middle School 00986 2.62523E+11 F 2014
New Haven Community Schools 50170 New Haven High School 02683 2.62523E+11 B 2014
New Lothrop Area Public Schools 78070 New Lothrop High School 02685 2.62529E+11 B 2014
New Paradigm Glazer Academy 82734 New Paradigm Glazer Academy 05675 2.60099E+11 C 2013
Newaygo Public School District 62070 Vera Wilsie Elementary School 04289 2.62532E+11 BTO 2013
Niles Community Schools 11300 Ballard Elementary School 00184 2.62556E+11 F 2014
Niles Community Schools 11300 Ring Lardner Middle School 03204 2.62556E+11 BTO 2012
Noor International Academy 50913 Noor International Academy 00757 2.601E+11 B 2014
North Branch Area Schools 44090 Ruth Fox Elementary School 06185 2.62568E+11 BTO 2014
North Central Area Schools 55115 North Central Area Junior/Senior High School 03114 2.62922E+11 BTO 2014
North Central Area Schools 55115 North Central Elementary School 05987 2.62922E+11 BTO 2014
North Muskegon Public Schools 61230 North Muskegon Elementary School 02741 2.6258E+11 F 2012
North Muskegon Public Schools 61230 North Muskegon Middle School 08648 2.6258E+11 B, BTO 2014
North Star Academy 52901 North Star Academy 08476 2.60015E+11 F 2013
Northport Public School District 45040 Northport Public School 02764 2.62592E+11 BTO 2012
Northridge Academy 25904 Northridge Academy 08721 2.60019E+11 B, BTO 2014
Northview Public Schools 41025 West Oakview Elementary School 04461 2.62595E+11 B, BTO 2012
Northville Public Schools 82390 Amerman Elementary School 00083 2.62598E+11 A 2014
Northville Public Schools 82390 Hillside Middle School 08803 2.62598E+11 A 2014
Northville Public Schools 82390 Meads Mill Middle School 06591 2.62598E+11 A 2014
Northville Public Schools 82390 Moraine Elementary School 05283 2.62598E+11 A 2014
Northville Public Schools 82390 Northville High School 02772 2.62598E+11 A 2014
Northville Public Schools 82390 Ridge Wood Elementary School 09171 2.62598E+11 A 2012
Northville Public Schools 82390 Silver Springs Elementary School 06592 2.62598E+11 A 2012
Northville Public Schools 82390 Thornton Creek Elementary School 07964 2.62598E+11 A 2014
Northville Public Schools 82390 Winchester Elementary School 06593 2.62598E+11 A 2014
Northwest Community Schools 38140 Northwest High School 05625 2.62601E+11 B 2012
Northwest Community Schools 38140 Parnall Elementary School 02966 2.62601E+11 F 2014
Nottawa Community School 75100 Nottawa Community School 02787 2.6261E+11 F 2013
Novi Community School District 63100 Deerfield Elementary School 08804 2.62613E+11 A 2013
Novi Community School District 63100 Novi High School 05315 2.62613E+11 F 2014
Novi Community School District 63100 Novi Meadows School 07042 2.62613E+11 F 2014
Novi Community School District 63100 Novi Middle School 06172 2.62613E+11 F 2014
Novi Community School District 63100 Novi Woods Elementary School 02788 2.62613E+11 A 2014
Novi Community School District 63100 Orchard Hills Elementary School 02843 2.62613E+11 F 2014
Novi Community School District 63100 Parkview Elementary School 07349 2.62613E+11 F 2014
Oak Park, School District of the City of 63250 Oak Park Alternative Education Center 00658 2.62619E+11 C 2014
Oak Park, School District of the City of 63250 Oak Park High School 02798 2.62619E+11 C 2012
Oakland International Academy 63912 Oakland International Academy - K-1 08743 2.60022E+11 C 2013
Oakridge Public Schools 61065 Oakridge High School 02814 2.62622E+11 B 2013
Okemos Public Schools 33170 Bennett Woods Elementary School 07828 2.62628E+11 F 2014
Okemos Public Schools 33170 Chippewa Middle School 08214 2.62628E+11 A, BTO 2014
Okemos Public Schools 33170 Cornell Elementary School 00801 2.62628E+11 A 2014
Okemos Public Schools 33170 Hiawatha Elementary School 07347 2.62628E+11 A 2012
Okemos Public Schools 33170 Kinawa School 04881 2.62628E+11 A 2014
Okemos Public Schools 33170 Okemos High School 02822 2.62628E+11 F 2014
Okemos Public Schools 33170 Okemos Public Montessori-Central 09348 2.62628E+11 A, BTO 2014
Old Redford Academy 82956 Old Redford Academy - Middle 09480 2.60024E+11 BTO 2013
Olivet Community Schools 23080 Fern Persons Elementary School 01221 2.62637E+11 F 2014
Olivet Community Schools 23080 Olivet High School 02828 2.62637E+11 B 2013
Onekama Consolidated Schools 51060 Onekama Elementary School 02831 2.62649E+11 F 2013
Onsted Community Schools 46110 Onsted Community High School 02832 2.62652E+11 B 2013
Onsted Community Schools 46110 Onsted Elementary 08660 2.62652E+11 B 2013
Oscoda Area Schools 35010 Oscoda Area High School 02856 2.62697E+11 B 2014
Otsego Public Schools 03020 Dix Street Elementary School 00922 2.62706E+11 B 2014
Otsego Public Schools 03020 Otsego High School 02865 2.62706E+11 F 2013
Otsego Public Schools 03020 Washington Street Elementary School 02864 2.62706E+11 F 2014
Ottawa Area ISD 70000 Ottawa Area Center 01054 2.6809E+11 BTO 2012
Ovid-Elsie Area Schools 19120 Ovid-Elsie High School 05333 2.62715E+11 B 2014
Ovid-Elsie Area Schools 19120 Ovid-Elsie Middle School 02919 2.62715E+11 F 2014
Owendale-Gagetown Area School District 32090 Owendale-Gagetown Elementary School 05109 2.62718E+11 BTO 2014
Owosso Public Schools 78110 Owosso High School 02924 2.62721E+11 F 2013
Page 15 of 22
Attachment 9.B
495
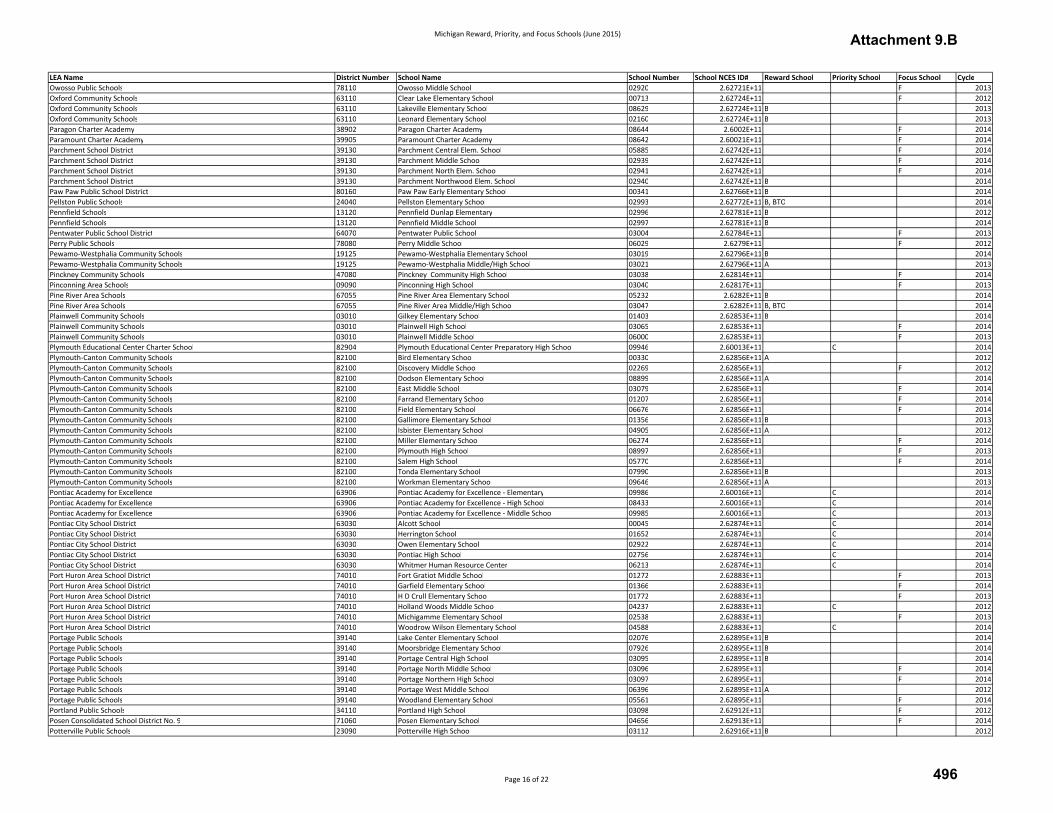
Michigan Reward, Priority, and Focus Schools (June 2015)
LEA Name District Number School Name School Number School NCES ID# Reward School Priority School Focus School Cycle
Owosso Public Schools 78110 Owosso Middle School 02920 2.62721E+11 F 2013
Oxford Community Schools 63110 Clear Lake Elementary School 00713 2.62724E+11 F 2012
Oxford Community Schools 63110 Lakeville Elementary School 08629 2.62724E+11 B 2013
Oxford Community Schools 63110 Leonard Elementary School 02160 2.62724E+11 B 2013
Paragon Charter Academy 38902 Paragon Charter Academy 08644 2.6002E+11 F 2014
Paramount Charter Academy 39905 Paramount Charter Academy 08642 2.60021E+11 F 2014
Parchment School District 39130 Parchment Central Elem. School 05885 2.62742E+11 F 2014
Parchment School District 39130 Parchment Middle School 02939 2.62742E+11 F 2014
Parchment School District 39130 Parchment North Elem. School 02941 2.62742E+11 F 2014
Parchment School District 39130 Parchment Northwood Elem. School 02940 2.62742E+11 B 2014
Paw Paw Public School District 80160 Paw Paw Early Elementary School 00341 2.62766E+11 B 2014
Pellston Public Schools 24040 Pellston Elementary School 02993 2.62772E+11 B, BTO 2014
Pennfield Schools 13120 Pennfield Dunlap Elementary 02996 2.62781E+11 B 2012
Pennfield Schools 13120 Pennfield Middle School 02997 2.62781E+11 B 2014
Pentwater Public School District 64070 Pentwater Public School 03004 2.62784E+11 F 2013
Perry Public Schools 78080 Perry Middle School 06029 2.6279E+11 F 2012
Pewamo-Westphalia Community Schools 19125 Pewamo-Westphalia Elementary School 03019 2.62796E+11 B 2014
Pewamo-Westphalia Community Schools 19125 Pewamo-Westphalia Middle/High School 03021 2.62796E+11 A 2013
Pinckney Community Schools 47080 Pinckney Community High School 03038 2.62814E+11 F 2014
Pinconning Area Schools 09090 Pinconning High School 03040 2.62817E+11 F 2013
Pine River Area Schools 67055 Pine River Area Elementary School 05232 2.6282E+11 B 2014
Pine River Area Schools 67055 Pine River Area Middle/High School 03047 2.6282E+11 B, BTO 2014
Plainwell Community Schools 03010 Gilkey Elementary School 01403 2.62853E+11 B 2014
Plainwell Community Schools 03010 Plainwell High School 03065 2.62853E+11 F 2014
Plainwell Community Schools 03010 Plainwell Middle School 06000 2.62853E+11 F 2013
Plymouth Educational Center Charter School 82904 Plymouth Educational Center Preparatory High School 09946 2.60013E+11 C 2014
Plymouth-Canton Community Schools 82100 Bird Elementary School 00330 2.62856E+11 A 2012
Plymouth-Canton Community Schools 82100 Discovery Middle School 02269 2.62856E+11 F 2012
Plymouth-Canton Community Schools 82100 Dodson Elementary School 08899 2.62856E+11 A 2014
Plymouth-Canton Community Schools 82100 East Middle School 03079 2.62856E+11 F 2014
Plymouth-Canton Community Schools 82100 Farrand Elementary School 01207 2.62856E+11 F 2014
Plymouth-Canton Community Schools 82100 Field Elementary School 06676 2.62856E+11 F 2014
Plymouth-Canton Community Schools 82100 Gallimore Elementary School 01356 2.62856E+11 B 2013
Plymouth-Canton Community Schools 82100 Isbister Elementary School 04905 2.62856E+11 A 2012
Plymouth-Canton Community Schools 82100 Miller Elementary School 06274 2.62856E+11 F 2014
Plymouth-Canton Community Schools 82100 Plymouth High School 08997 2.62856E+11 F 2013
Plymouth-Canton Community Schools 82100 Salem High School 05770 2.62856E+11 F 2014
Plymouth-Canton Community Schools 82100 Tonda Elementary School 07990 2.62856E+11 B 2013
Plymouth-Canton Community Schools 82100 Workman Elementary School 09646 2.62856E+11 A 2013
Pontiac Academy for Excellence 63906 Pontiac Academy for Excellence - Elementary 09986 2.60016E+11 C 2014
Pontiac Academy for Excellence 63906 Pontiac Academy for Excellence - High School 08433 2.60016E+11 C 2014
Pontiac Academy for Excellence 63906 Pontiac Academy for Excellence - Middle School 09985 2.60016E+11 C 2013
Pontiac City School District 63030 Alcott School 00045 2.62874E+11 C 2014
Pontiac City School District 63030 Herrington School 01652 2.62874E+11 C 2014
Pontiac City School District 63030 Owen Elementary School 02922 2.62874E+11 C 2014
Pontiac City School District 63030 Pontiac High School 02756 2.62874E+11 C 2014
Pontiac City School District 63030 Whitmer Human Resource Center 06213 2.62874E+11 C 2014
Port Huron Area School District 74010 Fort Gratiot Middle School 01272 2.62883E+11 F 2013
Port Huron Area School District 74010 Garfield Elementary School 01366 2.62883E+11 F 2014
Port Huron Area School District 74010 H D Crull Elementary School 01772 2.62883E+11 F 2013
Port Huron Area School District 74010 Holland Woods Middle School 04237 2.62883E+11 C 2012
Port Huron Area School District 74010 Michigamme Elementary School 02538 2.62883E+11 F 2013
Port Huron Area School District 74010 Woodrow Wilson Elementary School 04588 2.62883E+11 C 2014
Portage Public Schools 39140 Lake Center Elementary School 02076 2.62895E+11 B 2014
Portage Public Schools 39140 Moorsbridge Elementary School 07926 2.62895E+11 B 2014
Portage Public Schools 39140 Portage Central High School 03095 2.62895E+11 B 2014
Portage Public Schools 39140 Portage North Middle School 03096 2.62895E+11 F 2014
Portage Public Schools 39140 Portage Northern High School 03097 2.62895E+11 F 2014
Portage Public Schools 39140 Portage West Middle School 06396 2.62895E+11 A 2012
Portage Public Schools 39140 Woodland Elementary School 05561 2.62895E+11 F 2014
Portland Public Schools 34110 Portland High School 03098 2.62912E+11 F 2012
Posen Consolidated School District No. 9 71060 Posen Elementary School 04656 2.62913E+11 F 2014
Potterville Public Schools 23090 Potterville High School 03112 2.62916E+11 B 2012
Page 16 of 22
Attachment 9.B
496
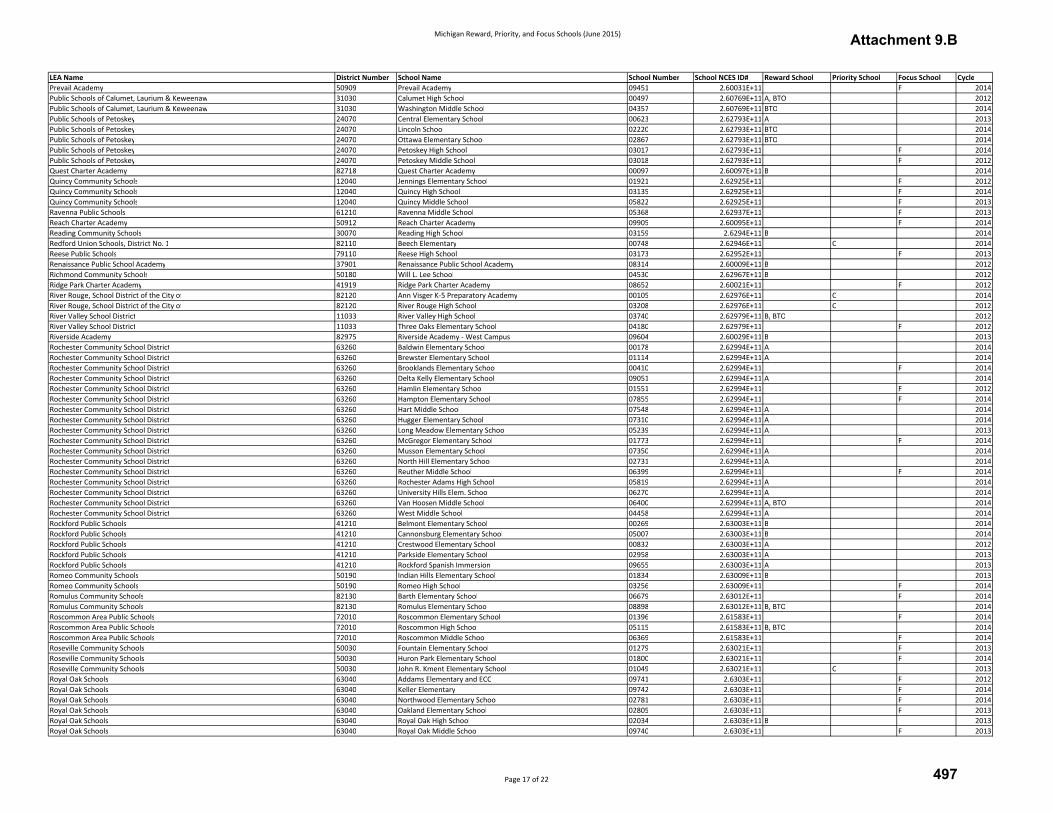
Michigan Reward, Priority, and Focus Schools (June 2015)
LEA Name District Number School Name School Number School NCES ID# Reward School Priority School Focus School Cycle
Prevail Academy 50909 Prevail Academy 09451 2.60031E+11 F 2014
Public Schools of Calumet, Laurium & Keweenaw 31030 Calumet High School 00497 2.60769E+11 A, BTO 2012
Public Schools of Calumet, Laurium & Keweenaw 31030 Washington Middle School 04357 2.60769E+11 BTO 2014
Public Schools of Petoskey 24070 Central Elementary School 00623 2.62793E+11 A 2013
Public Schools of Petoskey 24070 Lincoln School 02220 2.62793E+11 BTO 2014
Public Schools of Petoskey 24070 Ottawa Elementary School 02867 2.62793E+11 BTO 2014
Public Schools of Petoskey 24070 Petoskey High School 03017 2.62793E+11 F 2014
Public Schools of Petoskey 24070 Petoskey Middle School 03018 2.62793E+11 F 2012
Quest Charter Academy 82718 Quest Charter Academy 00097 2.60097E+11 B 2014
Quincy Community Schools 12040 Jennings Elementary School 01921 2.62925E+11 F 2012
Quincy Community Schools 12040 Quincy High School 03135 2.62925E+11 F 2014
Quincy Community Schools 12040 Quincy Middle School 05822 2.62925E+11 F 2013
Ravenna Public Schools 61210 Ravenna Middle School 05368 2.62937E+11 F 2013
Reach Charter Academy 50912 Reach Charter Academy 09905 2.60095E+11 F 2014
Reading Community Schools 30070 Reading High School 03159 2.6294E+11 B 2014
Redford Union Schools, District No. 1 82110 Beech Elementary 00748 2.62946E+11 C 2014
Reese Public Schools 79110 Reese High School 03173 2.62952E+11 F 2013
Renaissance Public School Academy 37901 Renaissance Public School Academy 08314 2.60009E+11 B 2012
Richmond Community Schools 50180 Will L. Lee School 04530 2.62967E+11 B 2012
Ridge Park Charter Academy 41919 Ridge Park Charter Academy 08652 2.60021E+11 F 2012
River Rouge, School District of the City of 82120 Ann Visger K-5 Preparatory Academy 00105 2.62976E+11 C 2014
River Rouge, School District of the City of 82120 River Rouge High School 03208 2.62976E+11 C 2012
River Valley School District 11033 River Valley High School 03740 2.62979E+11 B, BTO 2012
River Valley School District 11033 Three Oaks Elementary School 04180 2.62979E+11 F 2012
Riverside Academy 82975 Riverside Academy - West Campus 09604 2.60029E+11 B 2013
Rochester Community School District 63260 Baldwin Elementary School 00178 2.62994E+11 A 2014
Rochester Community School District 63260 Brewster Elementary School 01114 2.62994E+11 A 2014
Rochester Community School District 63260 Brooklands Elementary School 00410 2.62994E+11 F 2014
Rochester Community School District 63260 Delta Kelly Elementary School 09051 2.62994E+11 A 2014
Rochester Community School District 63260 Hamlin Elementary School 01551 2.62994E+11 F 2012
Rochester Community School District 63260 Hampton Elementary School 07855 2.62994E+11 F 2014
Rochester Community School District 63260 Hart Middle School 07548 2.62994E+11 A 2014
Rochester Community School District 63260 Hugger Elementary School 07310 2.62994E+11 A 2014
Rochester Community School District 63260 Long Meadow Elementary School 05239 2.62994E+11 A 2013
Rochester Community School District 63260 McGregor Elementary School 01773 2.62994E+11 F 2014
Rochester Community School District 63260 Musson Elementary School 07350 2.62994E+11 A 2014
Rochester Community School District 63260 North Hill Elementary School 02731 2.62994E+11 A 2014
Rochester Community School District 63260 Reuther Middle School 06399 2.62994E+11 F 2014
Rochester Community School District 63260 Rochester Adams High School 05819 2.62994E+11 A 2014
Rochester Community School District 63260 University Hills Elem. School 06270 2.62994E+11 A 2014
Rochester Community School District 63260 Van Hoosen Middle School 06400 2.62994E+11 A, BTO 2014
Rochester Community School District 63260 West Middle School 04458 2.62994E+11 A 2014
Rockford Public Schools 41210 Belmont Elementary School 00269 2.63003E+11 B 2014
Rockford Public Schools 41210 Cannonsburg Elementary School 05007 2.63003E+11 B 2014
Rockford Public Schools 41210 Crestwood Elementary School 00832 2.63003E+11 A 2012
Rockford Public Schools 41210 Parkside Elementary School 02958 2.63003E+11 A 2013
Rockford Public Schools 41210 Rockford Spanish Immersion 09655 2.63003E+11 A 2013
Romeo Community Schools 50190 Indian Hills Elementary School 01834 2.63009E+11 B 2013
Romeo Community Schools 50190 Romeo High School 03256 2.63009E+11 F 2014
Romulus Community Schools 82130 Barth Elementary School 06679 2.63012E+11 F 2014
Romulus Community Schools 82130 Romulus Elementary School 08898 2.63012E+11 B, BTO 2014
Roscommon Area Public Schools 72010 Roscommon Elementary School 01396 2.61583E+11 F 2014
Roscommon Area Public Schools 72010 Roscommon High School 05115 2.61583E+11 B, BTO 2014
Roscommon Area Public Schools 72010 Roscommon Middle School 06369 2.61583E+11 F 2014
Roseville Community Schools 50030 Fountain Elementary School 01279 2.63021E+11 F 2013
Roseville Community Schools 50030 Huron Park Elementary School 01800 2.63021E+11 F 2014
Roseville Community Schools 50030 John R. Kment Elementary School 01049 2.63021E+11 C 2013
Royal Oak Schools 63040 Addams Elementary and ECC 09741 2.6303E+11 F 2012
Royal Oak Schools 63040 Keller Elementary 09742 2.6303E+11 F 2014
Royal Oak Schools 63040 Northwood Elementary School 02781 2.6303E+11 F 2014
Royal Oak Schools 63040 Oakland Elementary School 02805 2.6303E+11 F 2013
Royal Oak Schools 63040 Royal Oak High School 02034 2.6303E+11 B 2013
Royal Oak Schools 63040 Royal Oak Middle School 09740 2.6303E+11 F 2013
Page 17 of 22
Attachment 9.B
497
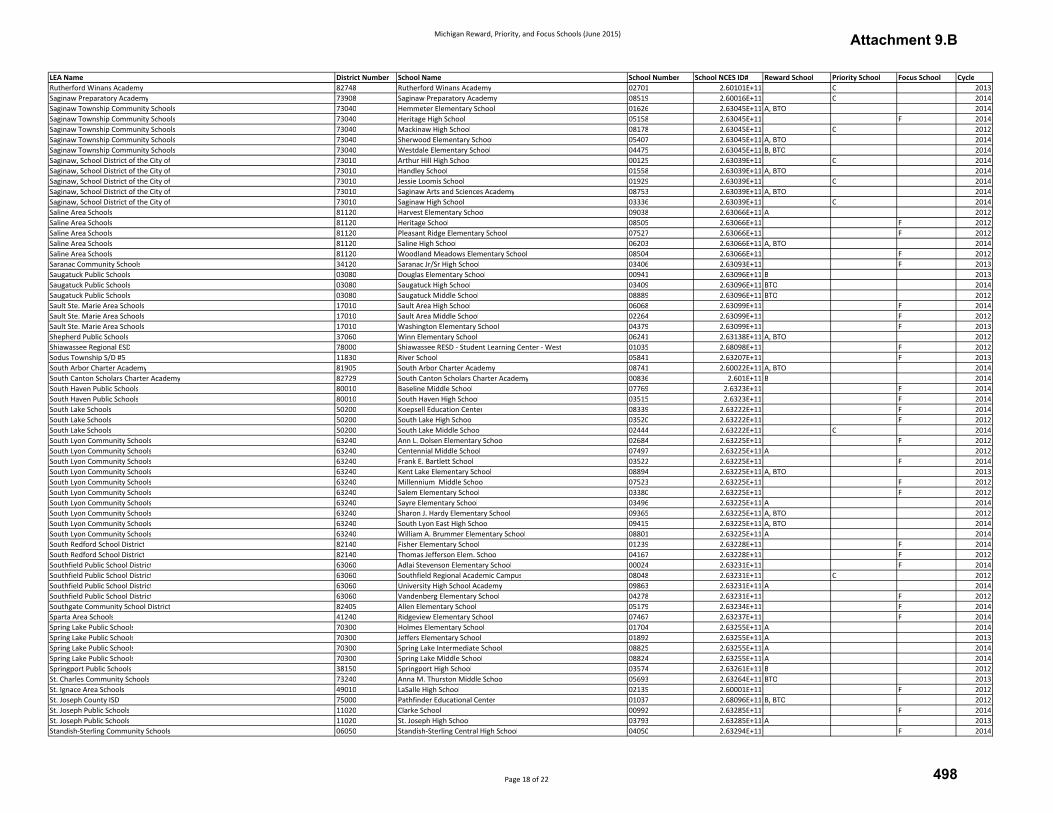
Michigan Reward, Priority, and Focus Schools (June 2015)
LEA Name District Number School Name School Number School NCES ID# Reward School Priority School Focus School Cycle
Rutherford Winans Academy 82748 Rutherford Winans Academy 02701 2.60101E+11 C 2013
Saginaw Preparatory Academy 73908 Saginaw Preparatory Academy 08519 2.60016E+11 C 2014
Saginaw Township Community Schools 73040 Hemmeter Elementary School 01626 2.63045E+11 A, BTO 2014
Saginaw Township Community Schools 73040 Heritage High School 05158 2.63045E+11 F 2014
Saginaw Township Community Schools 73040 Mackinaw High School 08178 2.63045E+11 C 2012
Saginaw Township Community Schools 73040 Sherwood Elementary School 05407 2.63045E+11 A, BTO 2014
Saginaw Township Community Schools 73040 Westdale Elementary School 04475 2.63045E+11 B, BTO 2014
Saginaw, School District of the City of 73010 Arthur Hill High School 00125 2.63039E+11 C 2014
Saginaw, School District of the City of 73010 Handley School 01558 2.63039E+11 A, BTO 2014
Saginaw, School District of the City of 73010 Jessie Loomis School 01929 2.63039E+11 C 2014
Saginaw, School District of the City of 73010 Saginaw Arts and Sciences Academy 08753 2.63039E+11 A, BTO 2014
Saginaw, School District of the City of 73010 Saginaw High School 03336 2.63039E+11 C 2014
Saline Area Schools 81120 Harvest Elementary School 09038 2.63066E+11 A 2012
Saline Area Schools 81120 Heritage School 08505 2.63066E+11 F 2012
Saline Area Schools 81120 Pleasant Ridge Elementary School 07527 2.63066E+11 F 2012
Saline Area Schools 81120 Saline High School 06203 2.63066E+11 A, BTO 2014
Saline Area Schools 81120 Woodland Meadows Elementary School 08504 2.63066E+11 F 2012
Saranac Community Schools 34120 Saranac Jr/Sr High School 03406 2.63093E+11 F 2013
Saugatuck Public Schools 03080 Douglas Elementary School 00941 2.63096E+11 B 2013
Saugatuck Public Schools 03080 Saugatuck High School 03409 2.63096E+11 BTO 2014
Saugatuck Public Schools 03080 Saugatuck Middle School 08889 2.63096E+11 BTO 2012
Sault Ste. Marie Area Schools 17010 Sault Area High School 06068 2.63099E+11 F 2014
Sault Ste. Marie Area Schools 17010 Sault Area Middle School 02264 2.63099E+11 F 2012
Sault Ste. Marie Area Schools 17010 Washington Elementary School 04379 2.63099E+11 F 2013
Shepherd Public Schools 37060 Winn Elementary School 06241 2.63138E+11 A, BTO 2012
Shiawassee Regional ESD 78000 Shiawassee RESD - Student Learning Center - West 01035 2.68098E+11 F 2012
Sodus Township S/D #5 11830 River School 05841 2.63207E+11 F 2013
South Arbor Charter Academy 81905 South Arbor Charter Academy 08741 2.60022E+11 A, BTO 2014
South Canton Scholars Charter Academy 82729 South Canton Scholars Charter Academy 00836 2.601E+11 B 2014
South Haven Public Schools 80010 Baseline Middle School 07769 2.6323E+11 F 2014
South Haven Public Schools 80010 South Haven High School 03515 2.6323E+11 F 2014
South Lake Schools 50200 Koepsell Education Center 08339 2.63222E+11 F 2014
South Lake Schools 50200 South Lake High School 03520 2.63222E+11 F 2012
South Lake Schools 50200 South Lake Middle School 02444 2.63222E+11 C 2014
South Lyon Community Schools 63240 Ann L. Dolsen Elementary School 02684 2.63225E+11 F 2012
South Lyon Community Schools 63240 Centennial Middle School 07497 2.63225E+11 A 2012
South Lyon Community Schools 63240 Frank E. Bartlett School 03522 2.63225E+11 F 2014
South Lyon Community Schools 63240 Kent Lake Elementary School 08894 2.63225E+11 A, BTO 2013
South Lyon Community Schools 63240 Millennium Middle School 07523 2.63225E+11 F 2012
South Lyon Community Schools 63240 Salem Elementary School 03380 2.63225E+11 F 2012
South Lyon Community Schools 63240 Sayre Elementary School 03496 2.63225E+11 A 2014
South Lyon Community Schools 63240 Sharon J. Hardy Elementary School 09365 2.63225E+11 A, BTO 2012
South Lyon Community Schools 63240 South Lyon East High School 09415 2.63225E+11 A, BTO 2014
South Lyon Community Schools 63240 William A. Brummer Elementary School 08801 2.63225E+11 A 2014
South Redford School District 82140 Fisher Elementary School 01239 2.63228E+11 F 2014
South Redford School District 82140 Thomas Jefferson Elem. School 04167 2.63228E+11 F 2012
Southfield Public School District 63060 Adlai Stevenson Elementary School 00024 2.63231E+11 F 2014
Southfield Public School District 63060 Southfield Regional Academic Campus 08048 2.63231E+11 C 2012
Southfield Public School District 63060 University High School Academy 09863 2.63231E+11 A 2014
Southfield Public School District 63060 Vandenberg Elementary School 04278 2.63231E+11 F 2012
Southgate Community School District 82405 Allen Elementary School 05179 2.63234E+11 F 2014
Sparta Area Schools 41240 Ridgeview Elementary School 07467 2.63237E+11 F 2014
Spring Lake Public Schools 70300 Holmes Elementary School 01704 2.63255E+11 A 2014
Spring Lake Public Schools 70300 Jeffers Elementary School 01892 2.63255E+11 A 2013
Spring Lake Public Schools 70300 Spring Lake Intermediate School 08825 2.63255E+11 A 2014
Spring Lake Public Schools 70300 Spring Lake Middle School 08824 2.63255E+11 A 2014
Springport Public Schools 38150 Springport High School 03574 2.63261E+11 B 2012
St. Charles Community Schools 73240 Anna M. Thurston Middle School 05693 2.63264E+11 BTO 2013
St. Ignace Area Schools 49010 LaSalle High School 02135 2.60001E+11 F 2012
St. Joseph County ISD 75000 Pathfinder Educational Center 01037 2.68096E+11 B, BTO 2012
St. Joseph Public Schools 11020 Clarke School 00992 2.63285E+11 F 2014
St. Joseph Public Schools 11020 St. Joseph High School 03793 2.63285E+11 A 2013
Standish-Sterling Community Schools 06050 Standish-Sterling Central High School 04050 2.63294E+11 F 2014
Page 18 of 22
Attachment 9.B
498
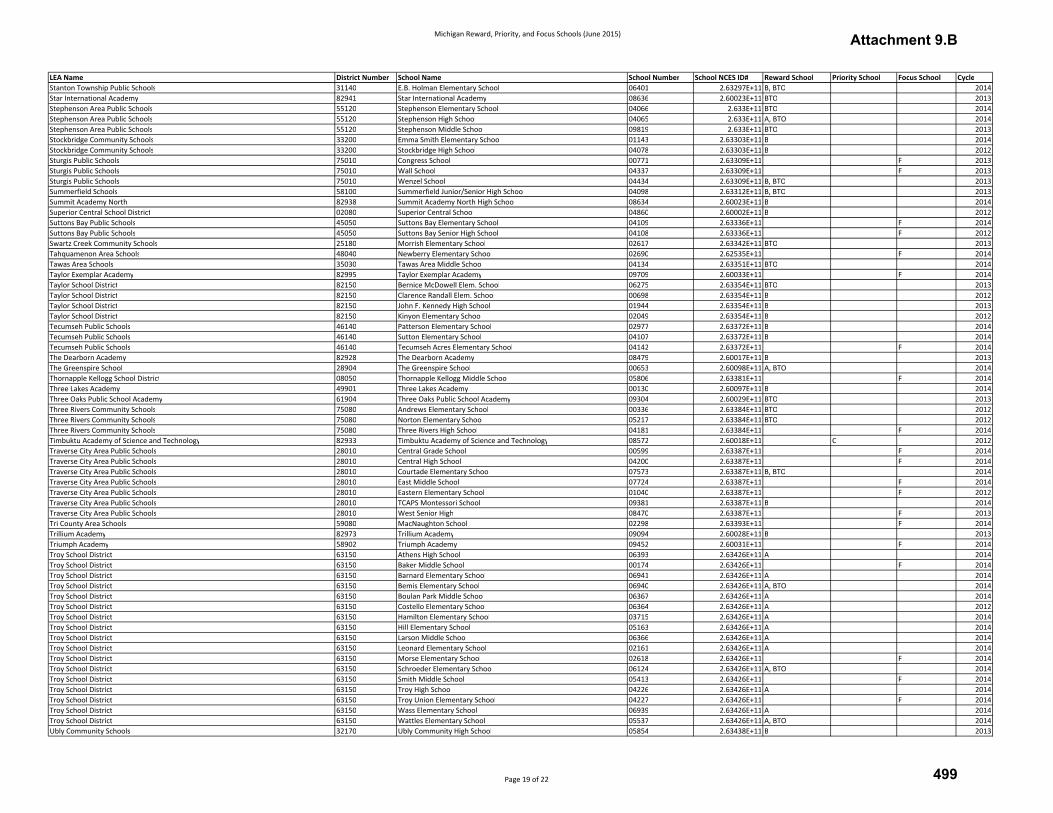
Michigan Reward, Priority, and Focus Schools (June 2015)
LEA Name District Number School Name School Number School NCES ID# Reward School Priority School Focus School Cycle
Stanton Township Public Schools 31140 E.B. Holman Elementary School 06401 2.63297E+11 B, BTO 2014
Star International Academy 82941 Star International Academy 08636 2.60023E+11 BTO 2013
Stephenson Area Public Schools 55120 Stephenson Elementary School 04066 2.633E+11 BTO 2014
Stephenson Area Public Schools 55120 Stephenson High School 04065 2.633E+11 A, BTO 2014
Stephenson Area Public Schools 55120 Stephenson Middle School 09819 2.633E+11 BTO 2013
Stockbridge Community Schools 33200 Emma Smith Elementary School 01143 2.63303E+11 B 2014
Stockbridge Community Schools 33200 Stockbridge High School 04078 2.63303E+11 B 2012
Sturgis Public Schools 75010 Congress School 00771 2.63309E+11 F 2013
Sturgis Public Schools 75010 Wall School 04337 2.63309E+11 F 2013
Sturgis Public Schools 75010 Wenzel School 04434 2.63309E+11 B, BTO 2013
Summerfield Schools 58100 Summerfield Junior/Senior High School 04098 2.63312E+11 B, BTO 2013
Summit Academy North 82938 Summit Academy North High School 08634 2.60023E+11 B 2014
Superior Central School District 02080 Superior Central School 04860 2.60002E+11 B 2012
Suttons Bay Public Schools 45050 Suttons Bay Elementary School 04109 2.63336E+11 F 2014
Suttons Bay Public Schools 45050 Suttons Bay Senior High School 04108 2.63336E+11 F 2012
Swartz Creek Community Schools 25180 Morrish Elementary School 02617 2.63342E+11 BTO 2013
Tahquamenon Area Schools 48040 Newberry Elementary School 02690 2.62535E+11 F 2014
Tawas Area Schools 35030 Tawas Area Middle School 04134 2.63351E+11 BTO 2014
Taylor Exemplar Academy 82995 Taylor Exemplar Academy 09709 2.60033E+11 F 2014
Taylor School District 82150 Bernice McDowell Elem. School 06275 2.63354E+11 BTO 2013
Taylor School District 82150 Clarence Randall Elem. School 00698 2.63354E+11 B 2012
Taylor School District 82150 John F. Kennedy High School 01944 2.63354E+11 B 2013
Taylor School District 82150 Kinyon Elementary School 02049 2.63354E+11 B 2012
Tecumseh Public Schools 46140 Patterson Elementary School 02977 2.63372E+11 B 2014
Tecumseh Public Schools 46140 Sutton Elementary School 04107 2.63372E+11 B 2014
Tecumseh Public Schools 46140 Tecumseh Acres Elementary School 04142 2.63372E+11 F 2014
The Dearborn Academy 82928 The Dearborn Academy 08479 2.60017E+11 B 2013
The Greenspire School 28904 The Greenspire School 00653 2.60098E+11 A, BTO 2014
Thornapple Kellogg School District 08050 Thornapple Kellogg Middle School 05806 2.63381E+11 F 2014
Three Lakes Academy 49901 Three Lakes Academy 00130 2.60097E+11 B 2014
Three Oaks Public School Academy 61904 Three Oaks Public School Academy 09304 2.60029E+11 BTO 2013
Three Rivers Community Schools 75080 Andrews Elementary School 00336 2.63384E+11 BTO 2012
Three Rivers Community Schools 75080 Norton Elementary School 05217 2.63384E+11 BTO 2012
Three Rivers Community Schools 75080 Three Rivers High School 04181 2.63384E+11 F 2014
Timbuktu Academy of Science and Technology 82933 Timbuktu Academy of Science and Technology 08572 2.60018E+11 C 2012
Traverse City Area Public Schools 28010 Central Grade School 00599 2.63387E+11 F 2014
Traverse City Area Public Schools 28010 Central High School 04200 2.63387E+11 F 2014
Traverse City Area Public Schools 28010 Courtade Elementary School 07573 2.63387E+11 B, BTO 2014
Traverse City Area Public Schools 28010 East Middle School 07724 2.63387E+11 F 2014
Traverse City Area Public Schools 28010 Eastern Elementary School 01040 2.63387E+11 F 2012
Traverse City Area Public Schools 28010 TCAPS Montessori School 09381 2.63387E+11 B 2014
Traverse City Area Public Schools 28010 West Senior High 08470 2.63387E+11 F 2013
Tri County Area Schools 59080 MacNaughton School 02298 2.63393E+11 F 2014
Trillium Academy 82973 Trillium Academy 09094 2.60028E+11 B 2013
Triumph Academy 58902 Triumph Academy 09452 2.60031E+11 F 2014
Troy School District 63150 Athens High School 06393 2.63426E+11 A 2014
Troy School District 63150 Baker Middle School 00174 2.63426E+11 F 2014
Troy School District 63150 Barnard Elementary School 06941 2.63426E+11 A 2014
Troy School District 63150 Bemis Elementary School 06940 2.63426E+11 A, BTO 2014
Troy School District 63150 Boulan Park Middle School 06367 2.63426E+11 A 2014
Troy School District 63150 Costello Elementary School 06364 2.63426E+11 A 2012
Troy School District 63150 Hamilton Elementary School 03715 2.63426E+11 A 2014
Troy School District 63150 Hill Elementary School 05163 2.63426E+11 A 2014
Troy School District 63150 Larson Middle School 06366 2.63426E+11 A 2014
Troy School District 63150 Leonard Elementary School 02161 2.63426E+11 A 2014
Troy School District 63150 Morse Elementary School 02618 2.63426E+11 F 2014
Troy School District 63150 Schroeder Elementary School 06124 2.63426E+11 A, BTO 2014
Troy School District 63150 Smith Middle School 05413 2.63426E+11 F 2014
Troy School District 63150 Troy High School 04226 2.63426E+11 A 2014
Troy School District 63150 Troy Union Elementary School 04227 2.63426E+11 F 2014
Troy School District 63150 Wass Elementary School 06939 2.63426E+11 A 2014
Troy School District 63150 Wattles Elementary School 05537 2.63426E+11 A, BTO 2014
Ubly Community Schools 32170 Ubly Community High School 05854 2.63438E+11 B 2013
Page 19 of 22
Attachment 9.B
499

Michigan Reward, Priority, and Focus Schools (June 2015)
LEA Name District Number School Name School Number School NCES ID# Reward School Priority School Focus School Cycle
Union City Community Schools 13135 Union City Elementary School 04248 2.63441E+11 F 2014
Union City Community Schools 13135 Union City High School 04247 2.63441E+11 B 2014
Union City Community Schools 13135 Union City Middle School 04246 2.63441E+11 F 2014
Unionville-Sebewaing Area S.D. 79145 Unionville-Sebewaing Elem. School 04909 2.63444E+11 B 2013
Unionville-Sebewaing Area S.D. 79145 Unionville-Sebewaing High School 04255 2.63444E+11 A 2013
University Preparatory Academy (PSAD) 82702 University Preparatory Academy (PSAD) - Middle 09888 2.60096E+11 BTO 2012
University Preparatory Science and Math (PSAD) 82701 University Preparatory Science and Math (PSAD) High School 00506 2.60095E+11 B 2014
University Preparatory Science and Math (PSAD) 82701 University Preparatory Science and Math (PSAD) Middle School 09907 2.60095E+11 B, BTO 2013
University Yes Academy 82724 University Yes Academy 00378 2.60097E+11 C 2013
Utica Community Schools 50210 Adlai Stevenson High School 04931 2.63447E+11 F 2014
Utica Community Schools 50210 Beck Centennial Elem. School 08459 2.63447E+11 B 2013
Utica Community Schools 50210 Bruce Collins Elementary School 05753 2.63447E+11 F 2012
Utica Community Schools 50210 Burr Elementary School 00457 2.63447E+11 B, BTO 2014
Utica Community Schools 50210 Crissman Elementary School 05756 2.63447E+11 B 2012
Utica Community Schools 50210 Davis Junior High School 05754 2.63447E+11 F 2014
Utica Community Schools 50210 Dekeyser Elementary School 06182 2.63447E+11 F 2012
Utica Community Schools 50210 Dresden Elementary School 00958 2.63447E+11 F 2012
Utica Community Schools 50210 Eppler Junior High School 01152 2.63447E+11 B 2014
Utica Community Schools 50210 Frank Jeannette Jr. High School 02656 2.63447E+11 F 2014
Utica Community Schools 50210 Graebner Elementary School 06263 2.63447E+11 B 2013
Utica Community Schools 50210 Heritage Junior High School 06769 2.63447E+11 F 2012
Utica Community Schools 50210 Jack Harvey Elementary School 01866 2.63447E+11 F 2014
Utica Community Schools 50210 Malow Junior High School 06255 2.63447E+11 B 2013
Utica Community Schools 50210 Messmore Elementary School 07129 2.63447E+11 A 2014
Utica Community Schools 50210 Morgan Elementary School 02608 2.63447E+11 B 2013
Utica Community Schools 50210 Plumbrook Elementary School 03077 2.63447E+11 F 2014
Utica Community Schools 50210 Richard J. Duncan Elementary 09019 2.63447E+11 A 2014
Utica Community Schools 50210 Switzer Elementary School 04117 2.63447E+11 A 2012
Utica Community Schools 50210 Utica High School 04267 2.63447E+11 F 2014
Utica Community Schools 50210 West Utica Elementary School 04468 2.63447E+11 F 2014
Van Buren ISD 80000 Bert Goens Learning Center 06908 2.68099E+11 F 2012
Van Buren Public Schools 82430 McBride Middle School 05988 2.63456E+11 F 2014
Van Buren Public Schools 82430 Tyler Road Elementary School 06826 2.63456E+11 F 2013
Van Dyke Public Schools 50220 LINCOLN ELEMENTARY SCHOOL 00350 2.63468E+11 C 2014
Van Dyke Public Schools 50220 Lincoln High School 02201 2.63468E+11 F 2012
Van Dyke Public Schools 50220 Lincoln Middle School 02205 2.63468E+11 C 2014
Van Dyke Public Schools 50220 McKinley Elementary School 02463 2.63468E+11 C 2014
Vanderbilt Area Schools 69040 Vanderbilt Area School 05868 2.63462E+11 C 2014
Vassar Public Schools 79150 Central School 00612 2.63471E+11 F 2014
Vassar Public Schools 79150 Vassar Senior High School 04287 2.63471E+11 C 2014
Vestaburg Community Schools 59150 Vestaburg Community High School 04296 2.63492E+11 C 2013
Vicksburg Community Schools 39170 Sunset Lake Elementary School 04104 2.63495E+11 F 2013
Vicksburg Community Schools 39170 Tobey Elementary School 04185 2.63495E+11 B 2012
Vicksburg Community Schools 39170 Vicksburg High School 04299 2.63495E+11 B 2013
Vista Charter Academy 41909 Vista Charter Academy 08370 2.6001E+11 BTO 2014
Waldron Area Schools 30080 Waldron Elementary School 04330 2.63504E+11 F 2014
Waldron Area Schools 30080 Waldron Middle School 08826 2.63504E+11 B 2012
Walker Charter Academy 41915 Walker Charter Academy 08485 2.60015E+11 F 2014
Walled Lake Consolidated Schools 63290 Commerce Elementary School 00763 2.63516E+11 A 2014
Walled Lake Consolidated Schools 63290 Dublin Elementary 00961 2.63516E+11 B 2014
Walled Lake Consolidated Schools 63290 Hickory Woods Elementary School 07544 2.63516E+11 F 2014
Walled Lake Consolidated Schools 63290 James R Geisler Middle School 04339 2.63516E+11 F 2014
Walled Lake Consolidated Schools 63290 Keith Elementary School 02001 2.63516E+11 A 2013
Walled Lake Consolidated Schools 63290 Mary Helen Guest Elementary School 00889 2.63516E+11 BTO 2013
Walled Lake Consolidated Schools 63290 Meadowbrook Elementary School 08577 2.63516E+11 F 2012
Walled Lake Consolidated Schools 63290 Oakley Park Elementary School 02809 2.63516E+11 A 2013
Walled Lake Consolidated Schools 63290 Walled Lake Central High School 04340 2.63516E+11 F 2014
Walled Lake Consolidated Schools 63290 Walled Lake Elementary School 04341 2.63516E+11 F 2014
Walled Lake Consolidated Schools 63290 Walled Lake Western High School 05705 2.63516E+11 F 2014
Walled Lake Consolidated Schools 63290 Walnut Creek Middle School 08610 2.63516E+11 F 2012
Warren Consolidated Schools 50230 Beer Middle School 05700 2.63519E+11 F 2014
Warren Consolidated Schools 50230 Black Elementary School 02372 2.63519E+11 F 2014
Warren Consolidated Schools 50230 Carleton Middle School 06121 2.63519E+11 F 2014
Page 20 of 22
Attachment 9.B
500

Michigan Reward, Priority, and Focus Schools (June 2015)
LEA Name District Number School Name School Number School NCES ID# Reward School Priority School Focus School Cycle
Warren Consolidated Schools 50230 Cousino Senior High School 00814 2.63519E+11 F 2014
Warren Consolidated Schools 50230 Cromie Elementary School 00835 2.63519E+11 C 2014
Warren Consolidated Schools 50230 Fillmore Elementary School 05589 2.63519E+11 C 2014
Warren Consolidated Schools 50230 Green Acres Elementary School 01486 2.63519E+11 F 2014
Warren Consolidated Schools 50230 Grissom Middle School 05701 2.63519E+11 F 2014
Warren Consolidated Schools 50230 Harwood Elementary School 05961 2.63519E+11 C 2014
Warren Consolidated Schools 50230 Jefferson Elementary School 06684 2.63519E+11 B 2012
Warren Consolidated Schools 50230 Lean Elementary School 02986 2.63519E+11 F 2014
Warren Consolidated Schools 50230 Sterling Heights Senior H.S. 06019 2.63519E+11 F 2014
Warren Consolidated Schools 50230 Susick Elementary School 04106 2.63519E+11 F 2014
Warren Consolidated Schools 50230 Warren Mott High School 00645 2.63519E+11 F 2014
Warren Consolidated Schools 50230 Willow Woods Elementary School 05960 2.63519E+11 C 2014
Warren Woods Public Schools 50240 Warren Woods Tower High School 06267 2.63522E+11 BTO 2013
Washington-Parks Academy 82719 Lincoln-King Academy 00133 2.60096E+11 C 2014
Washtenaw Technical Middle College 81903 Washtenaw Technical Middle College 08483 2.60016E+11 A, BTO 2014
Waterford School District 63300 Knudsen Elementary School 05048 2.63531E+11 F 2013
Waterford School District 63300 Waterford Durant High School 00072 2.63531E+11 C 2014
Waterford School District 63300 Waterford Mott High School 05535 2.63531E+11 F 2014
Watervliet School District 11320 North Elementary School 02722 2.63546E+11 F 2014
Watervliet School District 11320 South Elementary School 04924 2.63546E+11 F 2014
Waverly Community Schools 33215 East Intermediate School 04402 2.63552E+11 F 2014
Waverly Community Schools 33215 Waverly Senior High School 04403 2.63552E+11 F 2014
Waverly Community Schools 33215 Winans Elementary School 04557 2.63552E+11 B 2014
Wayland Union Schools 03040 Bessie B. Baker School 00307 2.63555E+11 F 2013
Wayland Union Schools 03040 Dorr School 00936 2.63555E+11 B 2012
Wayland Union Schools 03040 Pine Street Elementary 06778 2.63555E+11 F 2014
Wayland Union Schools 03040 R.J. Steeby School 03224 2.63555E+11 F 2014
Wayland Union Schools 03040 Wayland Union Middle School 08421 2.63555E+11 F 2014
Wayne-Westland Community School District 82160 Adams Upper Elementary School 00017 2.60002E+11 F 2013
Wayne-Westland Community School District 82160 Adlai Stevenson Middle School 04926 2.60002E+11 F 2014
Wayne-Westland Community School District 82160 Albert Schweitzer Elementary School 00043 2.60002E+11 C 2013
Wayne-Westland Community School District 82160 Alexander Hamilton Elementary School 00048 2.60002E+11 C 2012
Wayne-Westland Community School District 82160 David Hicks School 00874 2.60002E+11 C 2014
Wayne-Westland Community School District 82160 Eugene B. Elliott Elem. School 01111 2.60002E+11 F 2014
Wayne-Westland Community School District 82160 Hoover Elementary School 05295 2.60002E+11 C 2013
Wayne-Westland Community School District 82160 John Marshall Upper Elementary School 01956 2.60002E+11 F 2013
Wayne-Westland Community School District 82160 P.D. Graham Elementary School 05881 2.60002E+11 F 2014
Wayne-Westland Community School District 82160 Taft-Galloway Elementary School 04130 2.60002E+11 F 2013
Wayne-Westland Community School District 82160 Walker-Winter Elementary School 04334 2.60002E+11 F 2013
Webberville Community Schools 33220 Webberville High School 04417 2.63573E+11 B 2014
Webberville Community Schools 33220 Webberville Middle School 09726 2.63573E+11 F 2014
Wellspring Preparatory High School 41923 Wellspring Preparatory High School 00293 2.60098E+11 BTO 2014
West Bloomfield School District 63160 Abbott Middle School 06292 2.63582E+11 F 2014
West Bloomfield School District 63160 Oakland Early College 09852 2.63582E+11 B 2014
West Bloomfield School District 63160 Orchard Lake Middle School 04437 2.63582E+11 F 2014
West Bloomfield School District 63160 Roosevelt Elementary School 03271 2.63582E+11 F 2014
West Bloomfield School District 63160 Scotch Elementary School 07372 2.63582E+11 F 2012
West Bloomfield School District 63160 Sheiko Elementary School 01491 2.63582E+11 F 2012
West Bloomfield School District 63160 West Bloomfield High School 06171 2.63582E+11 F 2014
West Branch-Rose City Area Schools 65045 Surline Elementary School 05838 2.63585E+11 B 2014
West Iron County Public Schools 36025 West Iron County High School 01852 2.63291E+11 B 2012
West Iron County Public Schools 36025 West Iron County Middle School 05490 2.63291E+11 F 2012
West MI Academy of Environmental Science 41904 West MI Academy of Environmental Science 08052 2.60009E+11 BTO 2014
West Michigan Aviation Academy 41924 West Michigan Aviation Academy 00325 2.60098E+11 F 2014
West Ottawa Public School District 70070 Harbor Lights Middle School 08613 2.63591E+11 F 2014
West Ottawa Public School District 70070 Lakeshore Elementary School 07840 2.63591E+11 A, BTO 2014
West Ottawa Public School District 70070 Lakewood Elementary School 02114 2.63591E+11 A 2014
West Ottawa Public School District 70070 Macatawa Bay Middle School 06296 2.63591E+11 F 2014
West Ottawa Public School District 70070 North Holland Elementary School 02732 2.63591E+11 F 2014
West Ottawa Public School District 70070 Pine Creek Elementary School 07519 2.63591E+11 BTO 2013
West Ottawa Public School District 70070 Sheldon Woods Elementary School 03458 2.63591E+11 F 2014
West Ottawa Public School District 70070 Waukazoo Elementary School 04401 2.63591E+11 A 2013
West Ottawa Public School District 70070 Woodside Elementary School 04595 2.63591E+11 F 2014
Page 21 of 22
Attachment 9.B
501
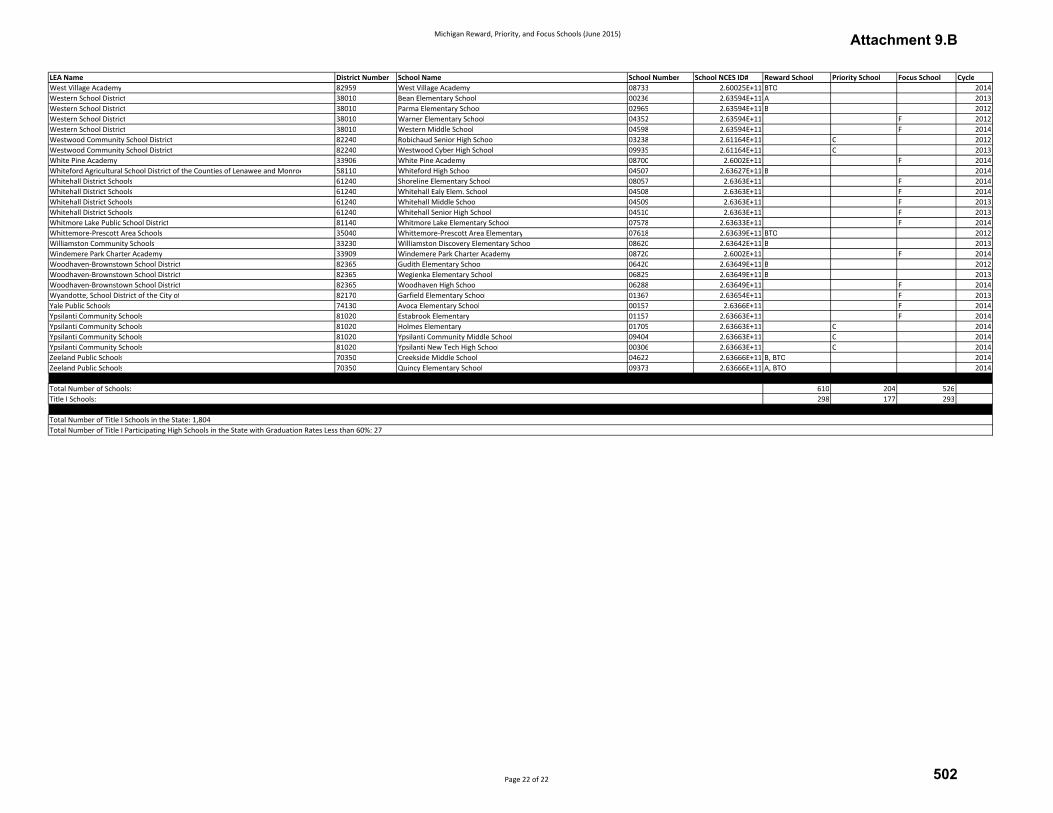
Michigan Reward, Priority, and Focus Schools (June 2015)
LEA Name District Number School Name School Number School NCES ID# Reward School Priority School Focus School Cycle
West Village Academy 82959 West Village Academy 08733 2.60025E+11 BTO 2014
Western School District 38010 Bean Elementary School 00236 2.63594E+11 A 2013
Western School District 38010 Parma Elementary School 02965 2.63594E+11 B 2012
Western School District 38010 Warner Elementary School 04352 2.63594E+11 F 2012
Western School District 38010 Western Middle School 04598 2.63594E+11 F 2014
Westwood Community School District 82240 Robichaud Senior High School 03238 2.61164E+11 C 2012
Westwood Community School District 82240 Westwood Cyber High School 09935 2.61164E+11 C 2013
White Pine Academy 33906 White Pine Academy 08700 2.6002E+11 F 2014
Whiteford Agricultural School District of the Counties of Lenawee and Monroe 58110 Whiteford High School 04507 2.63627E+11 B 2014
Whitehall District Schools 61240 Shoreline Elementary School 08057 2.6363E+11 F 2014
Whitehall District Schools 61240 Whitehall Ealy Elem. School 04508 2.6363E+11 F 2014
Whitehall District Schools 61240 Whitehall Middle School 04509 2.6363E+11 F 2013
Whitehall District Schools 61240 Whitehall Senior High School 04510 2.6363E+11 F 2013
Whitmore Lake Public School District 81140 Whitmore Lake Elementary School 07578 2.63633E+11 F 2014
Whittemore-Prescott Area Schools 35040 Whittemore-Prescott Area Elementary 07618 2.63639E+11 BTO 2012
Williamston Community Schools 33230 Williamston Discovery Elementary School 08620 2.63642E+11 B 2013
Windemere Park Charter Academy 33909 Windemere Park Charter Academy 08720 2.6002E+11 F 2014
Woodhaven-Brownstown School District 82365 Gudith Elementary School 06420 2.63649E+11 B 2012
Woodhaven-Brownstown School District 82365 Wegienka Elementary School 06825 2.63649E+11 B 2013
Woodhaven-Brownstown School District 82365 Woodhaven High School 06288 2.63649E+11 F 2014
Wyandotte, School District of the City of 82170 Garfield Elementary School 01367 2.63654E+11 F 2013
Yale Public Schools 74130 Avoca Elementary School 00157 2.6366E+11 F 2014
Ypsilanti Community Schools 81020 Estabrook Elementary 01157 2.63663E+11 F 2014
Ypsilanti Community Schools 81020 Holmes Elementary 01705 2.63663E+11 C 2014
Ypsilanti Community Schools 81020 Ypsilanti Community Middle School 09404 2.63663E+11 C 2014
Ypsilanti Community Schools 81020 Ypsilanti New Tech High School 00306 2.63663E+11 C 2014
Zeeland Public Schools 70350 Creekside Middle School 04622 2.63666E+11 B, BTO 2014
Zeeland Public Schools 70350 Quincy Elementary School 09373 2.63666E+11 A, BTO 2014
610 204 526
298 177 293
Total Number of Schools:
Title I Schools:
Total Number of Title I Schools in the State: 1,804
Total Number of Title I Participating High Schools in the State with Graduation Rates Less than 60%: 27
Page 22 of 22
Attachment 9.B
502
STATE OF MICHIGAN96TH LEGISLATURE
REGULAR SESSION OF 2011
Introduced by Rep. Rogers
ENROLLED HOUSE BILL No. 4625AN ACT to amend 1937 (Ex Sess) PA 4, entitled “An act relative to continuing tenure of office of certificated
teachers in public educational institutions; to provide for probationary periods; to regulate discharges or demotions; to provide for resignations and leaves of absence; to create a state tenure commission and to prescribe the powers and duties thereof; and to prescribe penalties for violation of the provisions of this act,” by amending sections 1, 2, 3, and 3a of article II, sections 1 and 3 of article III, and section 4 of article IV (MCL 38.81, 38.82, 38.83, 38.83a, 38.91, 38.93, and 38.104), sections 1 and 2 of article II as amended and section 3a of article II and section 3 of article III as added by 1993 PA 59, section 1 of article III as amended by 1996 PA 282, and section 4 of article IV as amended by 1993 PA 60, and by adding sections 2a and 3b to article II; and to repeal acts and parts of acts.
The People of the State of Michigan enact:
ARTICLE II
Sec. 1. (1) Subject to subsections (2) and (3) and section 3b of this article, a teacher is in a probationary period during his or her first 5 full school years of employment.
(2) Subject to section 3b of this article, a teacher under contract but not on continuing tenure as of the effective date of the 2011 amendatory act that amended this subsection is in a probationary period during his or her first 4 full school years of employment.
(3) A teacher on continuing tenure as of the effective date of the 2011 amendatory act that amended this subsection continues to be on continuing tenure even if the teacher has not served for at least 5 full school years of employment.
Sec. 2. A teacher shall not be required to serve more than 1 probationary period in any 1 school district or institution.
Sec. 2a. A probationary teacher who is rated as effective or highly effective on his or her most recent annual year-end performance evaluation under section 1249 of the revised school code, 1976 PA 451, MCL 380.1249, is not subject to being displaced by a teacher on continuing tenure solely because the other teacher has continuing tenure.
Sec. 3. (1) Before the end of each school year, the controlling board shall provide the probationary teacher with a definite written statement as to whether or not his or her work has been effective. Subject to subsection (2), a probationary teacher or teacher not on continuing contract shall be employed for the ensuing year unless notified in writing at least 15 days before the end of the school year that his or her services will be discontinued.
(2) A teacher who is in a probationary period may be dismissed from his or her employment by the controlling board at any time.
(77)
EHB 4625
Act No. 101Public Acts of 2011
Approved by the GovernorJuly 19, 2011
Filed with the Secretary of StateJuly 19, 2011
EFFECTIVE DATE: July 19, 2011
Attachment 10.A
503
2EHB 4625
Sec. 3a. The controlling board of a probationary teacher’s employing school district shall ensure that the teacher is provided with an individualized development plan developed by appropriate administrative personnel in consultation with the individual teacher and that the teacher is provided with at least an annual year-end performance evaluation each year during the teacher’s probationary period. The annual year-end performance evaluation shall be based on classroom observations and shall include at least an assessment of the teacher’s progress in meeting the goals of his or her individualized development plan. The controlling board shall determine the format and number of the classroom observations in consultation with teachers and school administrators. A performance evaluation shall be conducted in accordance with section 1249 of the revised school code, 1976 PA 451, MCL 380.1249.
Sec. 3b. (1) Except as otherwise provided in subsection (2), a teacher shall not be considered to have successfully completed the probationary period unless the teacher has been rated as effective or highly effective on his or her 3 most recent annual year-end performance evaluations under section 1249 of the revised school code, 1976 PA 451, MCL 380.1249, and has completed at least 5 full school years of employment in a probationary period.
(2) If a teacher has been rated as highly effective on 3 consecutive annual year-end performance evaluations under section 1249 of the revised school code, 1976 PA 451, MCL 380.1249, and has completed at least 4 full school years of employment in a probationary period, the teacher shall be considered to have successfully completed the probationary period.
ARTICLE III
Sec. 1. (1) After the satisfactory completion of the probationary period, a teacher is considered to be on continuing tenure under this act. A teacher on continuing tenure shall be employed continuously by the controlling board under which the probationary period has been completed and shall not be dismissed or demoted except as specified in this act. Continuing tenure is held only in accordance with this act.
(2) If a teacher employed in a program operated by a consortium of school districts was previously on continuing tenure in a school district that participates in the consortium, the teacher shall be considered to be on continuing tenure only in that school district.
(3) If a teacher employed in a program operated by a consortium of school districts was not previously on continuing tenure in a school district that participates in the consortium and satisfactorily completes the probationary period, the teacher shall be considered to be on continuing tenure only in the school district that is the fiscal agent for the consortium. However, if there is a written agreement between the teacher and another participating school district that provides that the teacher will have continuing tenure in that school district, the teacher shall be considered to be on continuing tenure only in that school district and shall not be considered to be on continuing tenure in the school district that is the fiscal agent for the consortium.
(4) If a teacher employed in a public school academy established under the revised school code, 1976 PA 451, MCL 380.1 to 380.1852, is on leave of absence from a school district and was on continuing tenure in the school district at the time he or she began the leave of absence, the teacher retains continuing tenure in that school district during the period he or she is employed in the public school academy.
(5) If a teacher satisfactorily completes the probationary period as an adult education teacher, the teacher shall be considered to be on continuing tenure in the school district only for adult education and shall not by virtue of completing the probationary period as an adult education teacher be considered to be on continuing tenure in the school district for elementary and secondary education.
(6) If a teacher satisfactorily completes the probationary period as an elementary or secondary education teacher, the teacher shall be considered to be on continuing tenure in the school district only for elementary and secondary education and shall not by virtue of completing the probationary period as an elementary or secondary education teacher be considered to be on continuing tenure in the school district for adult education.
(7) For a teacher employed in a capacity other than as a classroom teacher, including but not limited to, a superintendent, assistant superintendent, principal, department head or director of curriculum, under a contract of employment made with the teacher after the completion of the probationary period, a controlling board shall not provide in the contract of employment that the teacher will be considered to be granted continuing tenure in that other capacity by virtue of the contract of employment. Such a teacher shall be considered to have been granted continuing tenure only as an active classroom teacher in the school district. Upon the termination of such a contract of employment, if the controlling board does not reemploy the teacher under contract in the capacity covered by the contract, the teacher shall be continuously employed by the controlling board as an active classroom teacher. Failure of a controlling board to reemploy a teacher in any such capacity upon the termination of any such contract of employment described in this subsection shall not be considered to be a demotion under this act. The salary in the position to which the teacher is assigned shall be the same as if the teacher had been continuously employed as an active classroom teacher.
(8) Continuing tenure does not apply to an annual assignment of extra duty for extra pay.
Attachment 10.A
504
3EHB 4625
Sec. 3. The controlling board of the school district employing a teacher on continuing tenure shall ensure that the teacher is provided with an annual year-end performance evaluation in accordance with section 1249 of the revised school code, 1976 PA 451, MCL 380.1249. If the teacher has received a rating of ineffective or minimally effective on an annual year-end performance evaluation, the school district shall provide the teacher with an individualized development plan developed by appropriate administrative personnel in consultation with the individual teacher. The individualized development plan shall require the teacher to make progress toward individual development goals within a specified time period, not to exceed 180 days. The annual year-end performance evaluation shall be based on multiple classroom observations conducted during the period covered by the evaluation and shall include, in addition to the factors required under section 1249 of the revised school code, 1976 PA 451, MCL 380.1249, at least an assessment of the teacher’s progress in meeting the goals of his or her individualized development plan. The controlling board shall determine the format and number of the classroom observations in consultation with teachers and school administrators.
ARTICLE IV
Sec. 4. (1) A teacher on continuing tenure may contest the controlling board’s decision to proceed upon the charges against the teacher by filing a claim of appeal with the tenure commission and serving a copy of the claim of appeal on the controlling board not later than 20 days after receipt of the controlling board’s decision. The controlling board shall file its answer with the tenure commission and serve a copy of the answer on the teacher not later than 10 days after service of the claim of appeal. If the teacher does not contest the controlling board’s decision in the time and manner specified in this subsection, the discharge or demotion specified in the charges takes effect and the teacher shall be considered to have waived any right to contest the discharge or demotion under this act.
(2) An administrative law judge described in subsection (3) shall furnish to each party without undue delay a notice of hearing fixing the date and place of the hearing. The hearing date shall not be less than 10 days after the date the notice of hearing is furnished and shall not be more than 45 days after service of the controlling board’s answer unless the tenure commission grants a delay for good cause shown by the teacher or controlling board.
(3) The hearing shall be conducted by an administrative law judge who is an attorney licensed to practice law in this state and is employed by the department of education. An administrative law judge who conducts hearings under this section shall not advise the tenure commission or otherwise participate in a tenure commission review of an administrative law judge’s preliminary decision and order under this section.
(4) Except as otherwise provided in this section, the hearing shall be conducted in accordance with chapter 4 of the administrative procedures act of 1969, 1969 PA 306, MCL 24.271 to 24.287, and in accordance with rules promulgated by the tenure commission.
(5) The hearing and tenure commission review shall be conducted in accordance with the following:
(a) The hearing shall be public or private at the option of the teacher.
(b) The hearing shall be held at a convenient place in the county in which all or a portion of the school district is located or, if mutually agreed by the parties, at the tenure commission offices in Lansing. The administrative law judge’s necessary travel expenses associated with conducting the hearing outside Lansing shall be borne equally by the tenure commission and the controlling board.
(c) Both the teacher and the controlling board may be represented by legal counsel.
(d) Testimony at the hearing shall be on oath or affirmation.
(e) A stenographer shall make a full record of the proceedings of the hearing. The cost of employing the stenographer and of providing the record shall be borne equally by the tenure commission and the controlling board.
(f) The administrative law judge may subpoena witnesses and documentary evidence on his or her own motion, and shall do so at the request of the controlling board or the teacher. If a person refuses to appear and testify in answer to a subpoena issued by the administrative law judge, the party on whose behalf the subpoena was issued may file a petition in the circuit court for the county in which the hearing is held for an order requiring compliance. Failure to obey such an order of the court may be punished by the court as contempt.
(g) The hearing shall be concluded not later than 75 days after the teacher’s claim of appeal was filed with the tenure commission.
(h) The administrative law judge shall make the necessary orders to ensure that the case is submitted for decision not later than 50 days after the hearing is concluded.
(i) Not later than 60 days after submission of the case for decision, the administrative law judge shall serve a preliminary decision and order in writing upon each party or the party’s attorney and the tenure commission. The preliminary decision and order shall grant, deny, or modify the discharge or demotion specified in the charges.
(j) Not later than 20 days after service of the preliminary decision and order, a party may file with the tenure commission a statement of exceptions to the preliminary decision and order or to any part of the record or proceedings, including, but not limited to, rulings on motions or objections, along with a written brief in support of the exceptions. The party shall serve a copy of the statement of exceptions and brief upon each of the other parties within the time
Attachment 10.A
505

4EHB 4625
limit for filing the exceptions and brief. If there are no exceptions timely filed, the preliminary decision and order becomes the tenure commission’s final decision and order.
(k) Not later than 10 days after being served with the other party’s exceptions and brief, a party may file a statement of cross-exceptions responding to the other party’s exceptions or a statement in support of the preliminary decision and order with the tenure commission, along with a written brief in support of the cross-exceptions or of the preliminary decision and order. The party shall serve a copy of the statement of cross-exceptions or of the statement in support of the preliminary decision and order and a copy of the brief on each of the other parties.
(l) A matter that is not included in a statement of exceptions filed under subdivision (j) or in a statement of cross-exceptions filed under subdivision (k) is considered waived and cannot be heard before the tenure commission or on appeal to the court of appeals.
(m) If exceptions are filed, the tenure commission, after review of the record and the exceptions, may adopt, modify, or reverse the preliminary decision and order. The tenure commission shall not hear any additional evidence and its review shall be limited to consideration of the issues raised in the exceptions based solely on the evidence contained in the record from the hearing. The tenure commission shall issue its final decision and order not later than 60 days after the exceptions are filed.
(6) After giving the party notice and an opportunity to comply, the administrative law judge or the tenure commission may dismiss an appeal or deny a discharge or demotion for a party’s lack of progress or for a party’s repeated failure to comply with the procedures specified in this section or the tenure commission’s rules.
(7) A party aggrieved by a final decision and order of the tenure commission may appeal the decision and order to the court of appeals in accordance with the Michigan court rules within 20 days after the date of the decision and order.
Enacting section 1. Section 5 of article IV of 1937 (Ex Sess) PA 4, MCL 38.105, is repealed.
Enacting section 2. This amendatory act does not take effect unless all of the following bills of the 96th Legislature are enacted into law:
(a) House Bill No. 4626.
(b) House Bill No. 4627.
(c) House Bill No. 4628.
This act is ordered to take immediate effect.
Clerk of the House of Representatives
Secretary of the Senate
Approved
Governor
Attachment 10.A
506

STATE OF MICHIGAN96TH LEGISLATURE
REGULAR SESSION OF 2011
Introduced by Rep. Scott
ENROLLED HOUSE BILL No. 4626AN ACT to amend 1937 (Ex Sess) PA 4, entitled “An act relative to continuing tenure of office of certificated
teachers in public educational institutions; to provide for probationary periods; to regulate discharges or demotions; to provide for resignations and leaves of absence; to create a state tenure commission and to prescribe the powers and duties thereof; and to prescribe penalties for violation of the provisions of this act,” by amending section 4 of article I, sections 1 and 3 of article IV, and section 2 of article V (MCL 38.74, 38.101, 38.103, and 38.112), section 4 of article I and section 3 of article IV as amended by 2005 PA 124 and section 1 of article IV as amended by 2005 PA 136.
The People of the State of Michigan enact:
ARTICLE I
Sec. 4. The word “demote” means to suspend without pay for 15 or more consecutive days or reduce compensation for a particular school year by more than an amount equivalent to 30 days’ compensation or to transfer to a position carrying a lower salary. However, demote does not include discontinuance of salary pursuant to section 3 of article IV, the discontinuance or reduction of performance-based compensation paid pursuant to section 1250 of the revised school code, 1976 PA 451, MCL 380.1250, or a reduction in personnel, including, but not limited to, a reduction in workweeks or workdays.
(78)
EHB 4626
Act No. 100Public Acts of 2011
Approved by the GovernorJuly 19, 2011
Filed with the Secretary of StateJuly 19, 2011
EFFECTIVE DATE: July 19, 2011
Attachment 10.A
507
2EHB 4626
ARTICLE IV
Sec. 1. (1) Except as otherwise provided in section 1a of this article, discharge or demotion of a teacher on continuing tenure may be made only for a reason that is not arbitrary or capricious and only as provided in this act.
(2) This act does not prevent any controlling board from establishing a reasonable policy for retirement to apply equally to all teachers who are eligible for retirement under the public school employees retirement act of 1979, 1980 PA 300, MCL 38.1301 to 38.1437, or, having established a reasonable retirement age policy, from temporarily continuing on a year-to-year basis on criteria equally applied to all teachers the contract of any teacher whom the controlling board might wish to retain beyond the established retirement age for the benefit of the school system.
Sec. 3. (1) On the filing of charges in accordance with this article, the controlling board may suspend the accused teacher from active performance of duty until 1 of the following occurs:
(a) The teacher fails to contest the decision to proceed upon the charges within the time period specified in section 4(1) of this article.
(b) A preliminary decision and order discharging or demoting the teacher is issued by the administrative law judge under section 4(5)(i) of this article.
(c) If the preliminary decision and order is to reinstate the teacher, a final decision and order is rendered by the tenure commission under section 4(5)(m) of this article.
(2) Except as otherwise provided in subsections (3) and (4), if a teacher is suspended under subsection (1), the teacher’s salary shall continue during the suspension.
(3) If criminal charges have been filed against a teacher, a controlling board may place the teacher’s salary in an escrow account during a suspension under subsection (1). Before placing the teacher’s salary in an escrow account as described in this subsection, the controlling board shall provide to the teacher notice of the charges, an explanation of the employer’s evidence, and an opportunity for the teacher to respond, either in writing or in person. Health or life insurance benefits, or both, may be continued during the suspension at the option of the controlling board. If the administrative law judge issues a preliminary decision and order under section 4(5)(i) of this article to reinstate the teacher or for payment for salary lost by the teacher during the suspension, the controlling board shall release the money in the escrow account to the teacher to the extent necessary to effectuate the order. If the teacher fails to timely contest the decision to proceed upon the charges or if the administrative law judge issues a preliminary decision and order under section 4(5)(i) of this article discharging or demoting the teacher, the controlling board is entitled to the money in the escrow account.
(4) If a teacher who is suspended under subsection (1) is convicted of a felony that is not a listed offense or of a misdemeanor that is a listed offense, the controlling board may discontinue the teacher’s salary effective upon the date of the conviction. If the teacher is convicted of a felony that is a listed offense, the controlling board shall discontinue the teacher’s salary effective upon the date of conviction. As used in this subsection, “listed offense” means that term as defined in section 2 of the sex offenders registration act, 1994 PA 295, MCL 28.722.
(5) If a preliminary decision and order discharging a teacher is issued by the administrative law judge and the tenure commission subsequently reverses the preliminary decision and order of the administrative law judge, the tenure commission may order back pay.
ARTICLE V
Sec. 2. (1) Any controlling board upon written request of a teacher may grant leave of absence for a period not to exceed 1 year, subject to renewal at the will of the board. Additionally, a controlling board may grant a leave of absence because of physical or mental disability without receiving a written request from a teacher for a period not to exceed 1 year, subject to renewal at the will of the controlling board. A teacher who is placed on an unrequested leave of absence has the right to a hearing on the unrequested leave of absence in accordance with the provisions for a hearing in section 4 of article IV. A leave of absence does not serve to terminate continuing tenure previously acquired under this act.
(2) As a condition to reinstating the teacher at the expiration of the leave of absence, a controlling board may require a teacher who is on an unrequested leave of absence due to physical or mental disability to furnish verification acceptable to the controlling board of the teacher’s ability to perform his or her essential job functions.
Enacting section 1. This amendatory act does not take effect unless all of the following bills of the 96th Legislature are enacted into law:
(a) House Bill No. 4625.
(b) House Bill No. 4627.
(c) House Bill No. 4628.
Attachment 10.A
508
3EHB 4626
This act is ordered to take immediate effect.
Clerk of the House of Representatives
Secretary of the Senate
Approved
Governor
Attachment 10.A
509
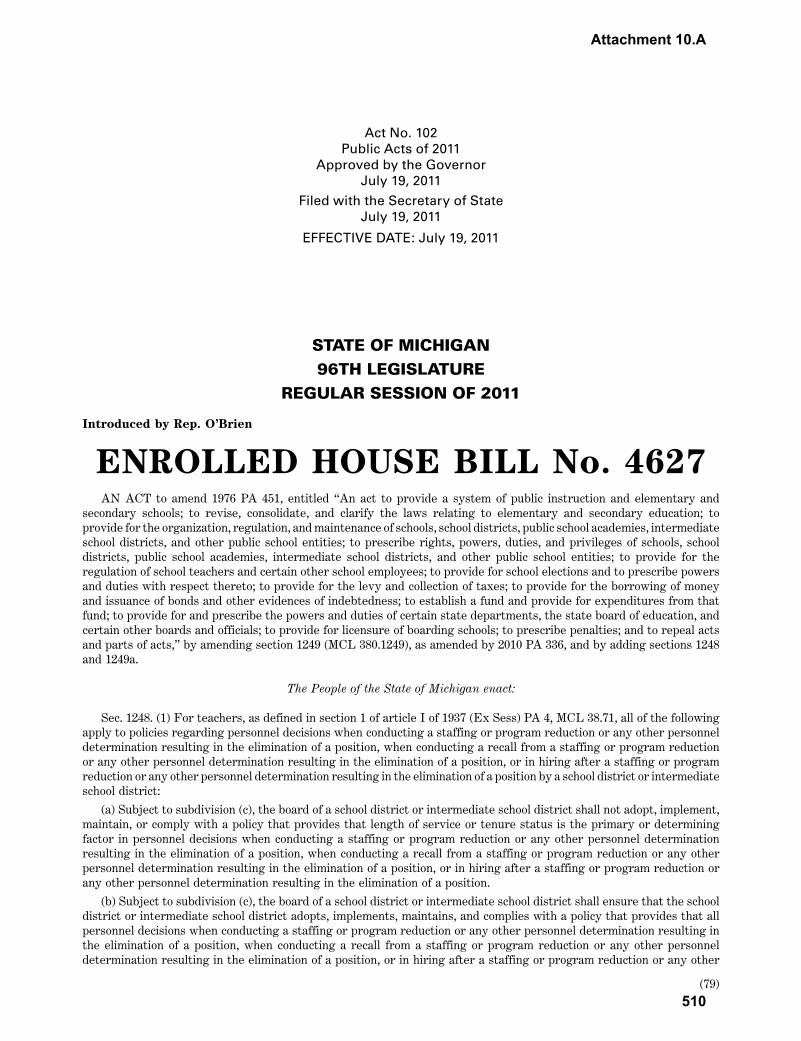
STATE OF MICHIGAN96TH LEGISLATURE
REGULAR SESSION OF 2011
Introduced by Rep. O’Brien
ENROLLED HOUSE BILL No. 4627AN ACT to amend 1976 PA 451, entitled “An act to provide a system of public instruction and elementary and
secondary schools; to revise, consolidate, and clarify the laws relating to elementary and secondary education; to provide for the organization, regulation, and maintenance of schools, school districts, public school academies, intermediate school districts, and other public school entities; to prescribe rights, powers, duties, and privileges of schools, school districts, public school academies, intermediate school districts, and other public school entities; to provide for the regulation of school teachers and certain other school employees; to provide for school elections and to prescribe powers and duties with respect thereto; to provide for the levy and collection of taxes; to provide for the borrowing of money and issuance of bonds and other evidences of indebtedness; to establish a fund and provide for expenditures from that fund; to provide for and prescribe the powers and duties of certain state departments, the state board of education, and certain other boards and officials; to provide for licensure of boarding schools; to prescribe penalties; and to repeal acts and parts of acts,” by amending section 1249 (MCL 380.1249), as amended by 2010 PA 336, and by adding sections 1248 and 1249a.
The People of the State of Michigan enact:
Sec. 1248. (1) For teachers, as defined in section 1 of article I of 1937 (Ex Sess) PA 4, MCL 38.71, all of the following apply to policies regarding personnel decisions when conducting a staffing or program reduction or any other personnel determination resulting in the elimination of a position, when conducting a recall from a staffing or program reduction or any other personnel determination resulting in the elimination of a position, or in hiring after a staffing or program reduction or any other personnel determination resulting in the elimination of a position by a school district or intermediate school district:
(a) Subject to subdivision (c), the board of a school district or intermediate school district shall not adopt, implement, maintain, or comply with a policy that provides that length of service or tenure status is the primary or determining factor in personnel decisions when conducting a staffing or program reduction or any other personnel determination resulting in the elimination of a position, when conducting a recall from a staffing or program reduction or any other personnel determination resulting in the elimination of a position, or in hiring after a staffing or program reduction or any other personnel determination resulting in the elimination of a position.
(b) Subject to subdivision (c), the board of a school district or intermediate school district shall ensure that the school district or intermediate school district adopts, implements, maintains, and complies with a policy that provides that all personnel decisions when conducting a staffing or program reduction or any other personnel determination resulting in the elimination of a position, when conducting a recall from a staffing or program reduction or any other personnel determination resulting in the elimination of a position, or in hiring after a staffing or program reduction or any other
(79)
EHB 4627
Act No. 102Public Acts of 2011
Approved by the GovernorJuly 19, 2011
Filed with the Secretary of StateJuly 19, 2011
EFFECTIVE DATE: July 19, 2011
Attachment 10.A
510

2EHB 4627
personnel determination resulting in the elimination of a position, are based on retaining effective teachers. The policy shall ensure that a teacher who has been rated as ineffective under the performance evaluation system under section 1249 is not given any preference that would result in that teacher being retained over a teacher who is evaluated as minimally effective, effective, or highly effective under the performance evaluation system under section 1249. Effectiveness shall be measured by the performance evaluation system under section 1249, and the personnel decisions shall be made based on the following factors:
(i) Individual performance shall be the majority factor in making the decision, and shall consist of but is not limited to all of the following:
(A) Evidence of student growth, which shall be the predominant factor in assessing an employee’s individual performance.
(B) The teacher’s demonstrated pedagogical skills, including at least a special determination concerning the teacher’s knowledge of his or her subject area and the ability to impart that knowledge through planning, delivering rigorous content, checking for and building higher-level understanding, differentiating, and managing a classroom; and consistent preparation to maximize instructional time.
(C) The teacher’s management of the classroom, manner and efficacy of disciplining pupils, rapport with parents and other teachers, and ability to withstand the strain of teaching.
(D) The teacher’s attendance and disciplinary record, if any.
(ii) Significant, relevant accomplishments and contributions. This factor shall be based on whether the individual contributes to the overall performance of the school by making clear, significant, relevant contributions above the normal expectations for an individual in his or her peer group and having demonstrated a record of exceptional performance.
(iii) Relevant special training. This factor shall be based on completion of relevant training other than the professional development or continuing education that is required by the employer or by state law, and integration of that training into instruction in a meaningful way.
(c) Except as otherwise provided in this subdivision, length of service or tenure status shall not be a factor in a personnel decision described in subdivision (a) or (b). However, if that personnel decision involves 2 or more employees and all other factors distinguishing those employees from each other are equal, then length of service or tenure status may be considered as a tiebreaker.
(2) If a collective bargaining agreement is in effect for employees of a school district or intermediate school district as of the effective date of this section and if that collective bargaining agreement prevents compliance with subsection (1), then subsection (1) does not apply to that school district or intermediate school district until after the expiration of that collective bargaining agreement.
(3) If a teacher brings an action against a school district or intermediate school district based on this section, the teacher’s sole and exclusive remedy shall be an order of reinstatement commencing 30 days after a decision by a court of competent jurisdiction. The remedy in an action brought by a teacher based on this section shall not include lost wages, lost benefits, or any other economic damages.
Sec. 1249. (1) Not later than September 1, 2011, and subject to subsection (9), with the involvement of teachers and school administrators, the board of a school district or intermediate school district or board of directors of a public school academy shall adopt and implement for all teachers and school administrators a rigorous, transparent, and fair performance evaluation system that does all of the following:
(a) Evaluates the teacher’s or school administrator’s job performance at least annually while providing timely and constructive feedback.
(b) Establishes clear approaches to measuring student growth and provides teachers and school administrators with relevant data on student growth.
(c) Evaluates a teacher’s or school administrator’s job performance, using multiple rating categories that take into account data on student growth as a significant factor. For these purposes, student growth shall be measured by national, state, or local assessments and other objective criteria. If the performance evaluation system implemented by a school district, intermediate school district, or public school academy under this section does not already include the rating of teachers as highly effective, effective, minimally effective, and ineffective, then the school district, intermediate school district, or public school academy shall revise the performance evaluation system within 60 days after the effective date of the amendatory act that added this sentence to ensure that it rates teachers as highly effective, effective, minimally effective, or ineffective.
(d) Uses the evaluations, at a minimum, to inform decisions regarding all of the following:
(i) The effectiveness of teachers and school administrators, ensuring that they are given ample opportunities for improvement.
Attachment 10.A
511
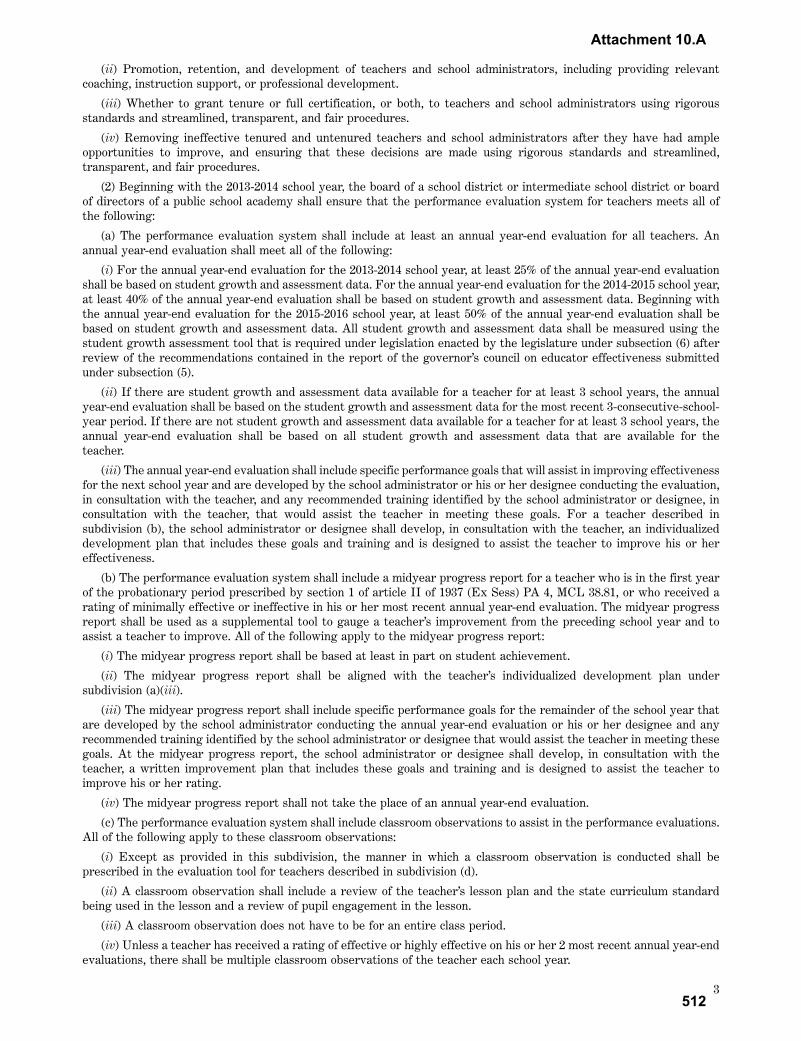
3EHB 4627
(ii) Promotion, retention, and development of teachers and school administrators, including providing relevant coaching, instruction support, or professional development.
(iii) Whether to grant tenure or full certification, or both, to teachers and school administrators using rigorous standards and streamlined, transparent, and fair procedures.
(iv) Removing ineffective tenured and untenured teachers and school administrators after they have had ample opportunities to improve, and ensuring that these decisions are made using rigorous standards and streamlined, transparent, and fair procedures.
(2) Beginning with the 2013-2014 school year, the board of a school district or intermediate school district or board of directors of a public school academy shall ensure that the performance evaluation system for teachers meets all of the following:
(a) The performance evaluation system shall include at least an annual year-end evaluation for all teachers. An annual year-end evaluation shall meet all of the following:
(i) For the annual year-end evaluation for the 2013-2014 school year, at least 25% of the annual year-end evaluation shall be based on student growth and assessment data. For the annual year-end evaluation for the 2014-2015 school year, at least 40% of the annual year-end evaluation shall be based on student growth and assessment data. Beginning with the annual year-end evaluation for the 2015-2016 school year, at least 50% of the annual year-end evaluation shall be based on student growth and assessment data. All student growth and assessment data shall be measured using the student growth assessment tool that is required under legislation enacted by the legislature under subsection (6) after review of the recommendations contained in the report of the governor’s council on educator effectiveness submitted under subsection (5).
(ii) If there are student growth and assessment data available for a teacher for at least 3 school years, the annual year-end evaluation shall be based on the student growth and assessment data for the most recent 3-consecutive-school-year period. If there are not student growth and assessment data available for a teacher for at least 3 school years, the annual year-end evaluation shall be based on all student growth and assessment data that are available for the teacher.
(iii) The annual year-end evaluation shall include specific performance goals that will assist in improving effectiveness for the next school year and are developed by the school administrator or his or her designee conducting the evaluation, in consultation with the teacher, and any recommended training identified by the school administrator or designee, in consultation with the teacher, that would assist the teacher in meeting these goals. For a teacher described in subdivision (b), the school administrator or designee shall develop, in consultation with the teacher, an individualized development plan that includes these goals and training and is designed to assist the teacher to improve his or her effectiveness.
(b) The performance evaluation system shall include a midyear progress report for a teacher who is in the first year of the probationary period prescribed by section 1 of article II of 1937 (Ex Sess) PA 4, MCL 38.81, or who received a rating of minimally effective or ineffective in his or her most recent annual year-end evaluation. The midyear progress report shall be used as a supplemental tool to gauge a teacher’s improvement from the preceding school year and to assist a teacher to improve. All of the following apply to the midyear progress report:
(i) The midyear progress report shall be based at least in part on student achievement.
(ii) The midyear progress report shall be aligned with the teacher’s individualized development plan under subdivision (a)(iii).
(iii) The midyear progress report shall include specific performance goals for the remainder of the school year that are developed by the school administrator conducting the annual year-end evaluation or his or her designee and any recommended training identified by the school administrator or designee that would assist the teacher in meeting these goals. At the midyear progress report, the school administrator or designee shall develop, in consultation with the teacher, a written improvement plan that includes these goals and training and is designed to assist the teacher to improve his or her rating.
(iv) The midyear progress report shall not take the place of an annual year-end evaluation.
(c) The performance evaluation system shall include classroom observations to assist in the performance evaluations. All of the following apply to these classroom observations:
(i) Except as provided in this subdivision, the manner in which a classroom observation is conducted shall be prescribed in the evaluation tool for teachers described in subdivision (d).
(ii) A classroom observation shall include a review of the teacher’s lesson plan and the state curriculum standard being used in the lesson and a review of pupil engagement in the lesson.
(iii) A classroom observation does not have to be for an entire class period.
(iv) Unless a teacher has received a rating of effective or highly effective on his or her 2 most recent annual year-end evaluations, there shall be multiple classroom observations of the teacher each school year.
Attachment 10.A
512
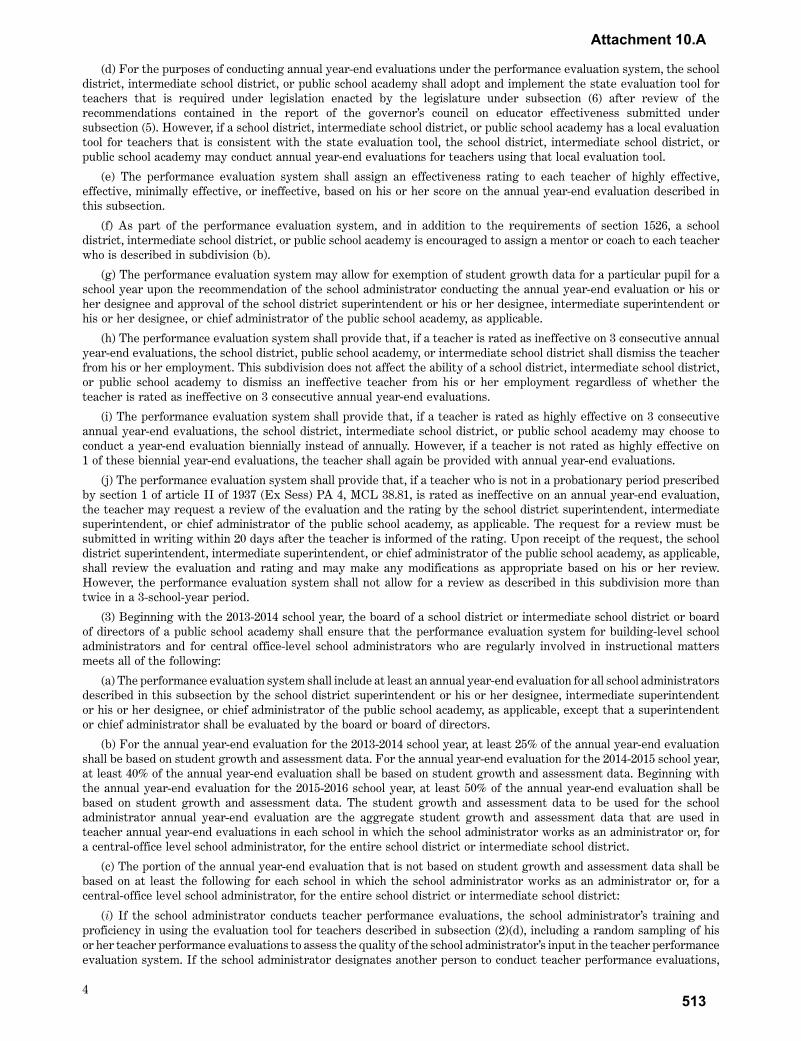
4EHB 4627
(d) For the purposes of conducting annual year-end evaluations under the performance evaluation system, the school district, intermediate school district, or public school academy shall adopt and implement the state evaluation tool for teachers that is required under legislation enacted by the legislature under subsection (6) after review of the recommendations contained in the report of the governor’s council on educator effectiveness submitted under subsection (5). However, if a school district, intermediate school district, or public school academy has a local evaluation tool for teachers that is consistent with the state evaluation tool, the school district, intermediate school district, or public school academy may conduct annual year-end evaluations for teachers using that local evaluation tool.
(e) The performance evaluation system shall assign an effectiveness rating to each teacher of highly effective, effective, minimally effective, or ineffective, based on his or her score on the annual year-end evaluation described in this subsection.
(f) As part of the performance evaluation system, and in addition to the requirements of section 1526, a school district, intermediate school district, or public school academy is encouraged to assign a mentor or coach to each teacher who is described in subdivision (b).
(g) The performance evaluation system may allow for exemption of student growth data for a particular pupil for a school year upon the recommendation of the school administrator conducting the annual year-end evaluation or his or her designee and approval of the school district superintendent or his or her designee, intermediate superintendent or his or her designee, or chief administrator of the public school academy, as applicable.
(h) The performance evaluation system shall provide that, if a teacher is rated as ineffective on 3 consecutive annual year-end evaluations, the school district, public school academy, or intermediate school district shall dismiss the teacher from his or her employment. This subdivision does not affect the ability of a school district, intermediate school district, or public school academy to dismiss an ineffective teacher from his or her employment regardless of whether the teacher is rated as ineffective on 3 consecutive annual year-end evaluations.
(i) The performance evaluation system shall provide that, if a teacher is rated as highly effective on 3 consecutive annual year-end evaluations, the school district, intermediate school district, or public school academy may choose to conduct a year-end evaluation biennially instead of annually. However, if a teacher is not rated as highly effective on 1 of these biennial year-end evaluations, the teacher shall again be provided with annual year-end evaluations.
(j) The performance evaluation system shall provide that, if a teacher who is not in a probationary period prescribed by section 1 of article II of 1937 (Ex Sess) PA 4, MCL 38.81, is rated as ineffective on an annual year-end evaluation, the teacher may request a review of the evaluation and the rating by the school district superintendent, intermediate superintendent, or chief administrator of the public school academy, as applicable. The request for a review must be submitted in writing within 20 days after the teacher is informed of the rating. Upon receipt of the request, the school district superintendent, intermediate superintendent, or chief administrator of the public school academy, as applicable, shall review the evaluation and rating and may make any modifications as appropriate based on his or her review. However, the performance evaluation system shall not allow for a review as described in this subdivision more than twice in a 3-school-year period.
(3) Beginning with the 2013-2014 school year, the board of a school district or intermediate school district or board of directors of a public school academy shall ensure that the performance evaluation system for building-level school administrators and for central office-level school administrators who are regularly involved in instructional matters meets all of the following:
(a) The performance evaluation system shall include at least an annual year-end evaluation for all school administrators described in this subsection by the school district superintendent or his or her designee, intermediate superintendent or his or her designee, or chief administrator of the public school academy, as applicable, except that a superintendent or chief administrator shall be evaluated by the board or board of directors.
(b) For the annual year-end evaluation for the 2013-2014 school year, at least 25% of the annual year-end evaluation shall be based on student growth and assessment data. For the annual year-end evaluation for the 2014-2015 school year, at least 40% of the annual year-end evaluation shall be based on student growth and assessment data. Beginning with the annual year-end evaluation for the 2015-2016 school year, at least 50% of the annual year-end evaluation shall be based on student growth and assessment data. The student growth and assessment data to be used for the school administrator annual year-end evaluation are the aggregate student growth and assessment data that are used in teacher annual year-end evaluations in each school in which the school administrator works as an administrator or, for a central-office level school administrator, for the entire school district or intermediate school district.
(c) The portion of the annual year-end evaluation that is not based on student growth and assessment data shall be based on at least the following for each school in which the school administrator works as an administrator or, for a central-office level school administrator, for the entire school district or intermediate school district:
(i) If the school administrator conducts teacher performance evaluations, the school administrator’s training and proficiency in using the evaluation tool for teachers described in subsection (2)(d), including a random sampling of his or her teacher performance evaluations to assess the quality of the school administrator’s input in the teacher performance evaluation system. If the school administrator designates another person to conduct teacher performance evaluations,
Attachment 10.A
513
5EHB 4627
the evaluation of the school administrator on this factor shall be based on the designee’s training and proficiency in using the evaluation tool for teachers described in subsection (2)(d), including a random sampling of the designee’s teacher performance evaluations to assess the quality of the designee’s input in the teacher performance evaluation system, with the designee’s performance to be counted as if it were the school administrator personally conducting the teacher performance evaluations.
(ii) The progress made by the school or school district in meeting the goals set forth in the school’s school improvement plan or the school district’s school improvement plans.
(iii) Pupil attendance in the school or school district.
(iv) Student, parent, and teacher feedback, and other information considered pertinent by the superintendent or other school administrator conducting the performance evaluation or the board or board of directors.
(d) For the purposes of conducting performance evaluations under the performance evaluation system, the school district, intermediate school district, or public school academy shall adopt and implement the state evaluation tool for school administrators described in this subsection that is required under legislation enacted by the legislature under subsection (6) after review of the recommendations contained in the report of the governor’s council on educator effectiveness submitted under subsection (5). However, if a school district, intermediate school district, or public school academy has a local evaluation tool for school administrators described in this subsection that is consistent with the state evaluation tool, the school district, intermediate school district, or public school academy may conduct performance evaluations for school administrators using that local evaluation tool.
(e) The performance evaluation system shall assign an effectiveness rating to each school administrator described in this subsection of highly effective, effective, minimally effective, or ineffective, based on his or her score on the evaluation tool described in subdivision (d).
(f) The performance evaluation system shall ensure that if a school administrator described in this subsection is rated as minimally effective or ineffective, the person or persons conducting the evaluation shall develop and require the school administrator to implement an improvement plan to correct the deficiencies. The improvement plan shall recommend professional development opportunities and other measures designed to improve the rating of the school administrator on his or her next annual year-end evaluation.
(g) The performance evaluation system shall provide that, if a school administrator described in this subsection is rated as ineffective on 3 consecutive annual year-end evaluations, the school district, public school academy, or intermediate school district shall dismiss the school administrator from his or her employment. However, this subdivision applies only if the 3 consecutive annual year-end evaluations are conducted using the same evaluation tool and under the same performance evaluation system. This subdivision does not affect the ability of a school district, intermediate school district, or public school academy to dismiss an ineffective school administrator from his or her employment regardless of whether the school administrator is rated as ineffective on 3 consecutive annual year-end evaluations.
(h) The performance evaluation system shall provide that, if a school administrator is rated as highly effective on 3 consecutive annual year-end evaluations, the school district, intermediate school district, or public school academy may choose to conduct a year-end evaluation biennially instead of annually. However, if a school administrator is not rated as highly effective on 1 of these biennial year-end evaluations, the school administrator shall again be provided with annual year-end evaluations.
(4) The governor’s council on educator effectiveness is created as a temporary commission described in section 4 of article V of the state constitution of 1963. All of the following apply to the governor’s council on educator effectiveness:
(a) The governor’s council on educator effectiveness shall consist of the following 5 voting members:
(i) The governor shall appoint 3 members.
(ii) The senate majority leader shall appoint 1 member.
(iii) The speaker of the house of representatives shall appoint 1 member.
(b) In addition to the members appointed under subdivision (a), the superintendent of public instruction or his or her designee shall serve as a nonvoting member.
(c) The members appointed under subdivision (a), and the designee of the superintendent of public instruction if he or she appoints a designee, shall have expertise in 1 or more of the following areas: psychometrics, measurement, performance-based educator evaluation models, educator effectiveness, or development of educator evaluation frameworks in other states.
(d) Not later than October 31, 2011, the governor’s council on educator effectiveness shall contract with 1 or more additional experts in the areas described in subdivision (c) as the council considers necessary.
(e) The governor shall appoint an advisory committee for the governor’s council on educator effectiveness to provide input on the council’s recommendations. The advisory committee shall consist of public school teachers, public school administrators, and parents of public school pupils.
Attachment 10.A
514
6EHB 4627
(f) The governor’s office shall provide staffing and support for the governor’s council on educator effectiveness.
(5) Not later than April 30, 2012, the governor’s council on educator effectiveness shall submit to the state board, the governor, and the legislature a report that identifies and recommends all of the following for the purposes of this section and that includes recommendations on evaluation processes and other matters related to the purposes of this section:
(a) A student growth and assessment tool. The student growth and assessment tool shall meet all of the following:
(i) Is a value-added model that takes into account student achievement and assessment data, and is based on an assessment tool that has been determined to be reliable and valid for the purposes of measuring value-added data.
(ii) In addition to measuring student growth in the core subject areas of mathematics, science, English language arts, and social science, will measure student growth in other subject areas.
(iii) Complies with all current state and federal law for students with a disability.
(iv) Has at least a pre- and post-test.
(v) Is able to be used for pupils of all achievement levels.
(b) A state evaluation tool for teachers. All of the following apply to this recommendation:
(i) In addition to the student growth and assessment tool, the recommended state evaluation tool for teachers may include, but is not limited to, instructional leadership abilities, teacher and pupil attendance, professional contributions, training, progress report achievement, school improvement plan progress, peer input, and pupil and parent feedback.
(ii) The council shall ensure that the recommended state evaluation tool for teachers will allow all special education teachers to be rated.
(iii) The council shall seek input from school districts, intermediate school districts, and public school academies that have already developed and implemented successful, effective performance evaluation systems.
(c) A state evaluation tool for school administrators described in subsection (3). In addition to the student growth and assessment tool, the recommended state evaluation tool for these school administrators may include, but is not limited to, teacher and pupil attendance, graduation rates, professional contributions, training, progress report achievement, school improvement plan progress, peer input, and pupil and parent feedback.
(d) For the purposes of the recommended state evaluation tools for teachers and school administrators under subdivisions (b) and (c), recommended parameters for the effectiveness rating categories for teachers under subsection (2)(e) and for school administrators under subsection (3)(e).
(e) Recommended changes to be made in the requirements for a professional education teaching certificate that will ensure that a teacher is not required to complete additional postsecondary credit hours beyond the credit hours required for a provisional teaching certificate.
(f) A process for evaluating and approving local evaluation tools for teachers under subsection (2)(d) and school administrators under subsection (3)(d).
(6) It is the intent of the legislature to review the report submitted by the governor’s council on educator effectiveness under subsection (5) and to enact appropriate legislation to put into place a statewide performance evaluation system taking into consideration the recommendations contained in the report.
(7) If all of the following apply for a public school operated by a school district, intermediate school district, or public school academy, then the school district, intermediate school district, or public school academy is not required to comply with subsection (2) or (3) for that public school:
(a) As of the effective date of this subsection, the school district, intermediate school district, or public school academy has already implemented and is currently using a performance evaluation system for that public school that meets all of the following requirements:
(i) Under the system, the most significant portion of a teacher’s or school administrator’s evaluation is based on student growth and assessment data, which may include value-added measures.
(ii) The system uses research-based measures to determine student growth, which may be measured by standards-based, nationally normed assessments.
(iii) The system determines professional competence through multiple direct observations of classroom practices and professional practices throughout the school year.
(iv) Under the system, teacher effectiveness and ratings, as measured by student achievement and growth data, are factored into teacher retention, promotion, and termination decisions.
(v) Under the system, teacher and school administrator performance evaluation results are used to inform teacher professional development for the succeeding year.
(vi) The system ensures that teachers and school administrators are evaluated at least annually.
(b) The school district, intermediate school district, or public school academy notifies the governor’s council on educator effectiveness by November 1, 2011 that it is exempt under this subsection from the requirements of subsections (2) and (3).
Attachment 10.A
515

7EHB 4627
(c) The school district, intermediate school district, or public school academy posts a description of its evaluation system on its website.
(8) If, after the effective date of this subsection, a school district, intermediate school district, or public school academy begins operating a new public school, or implements a new performance evaluation system for a public school it operates, and all of the following apply, then the school district, intermediate school district, or public school academy is not required to comply with subsection (2) or (3) for that public school:
(a) The performance evaluation system adopted and implemented for that public school replicates and is identical to the performance evaluation system of a public school that is exempt under subsection (7).
(b) The school district, intermediate school district, or public school academy posts a description of the performance evaluation system on its website.
(9) If a collective bargaining agreement is in effect for teachers or school administrators of a school district, public school academy, or intermediate school district as of the effective date of the 2011 amendatory act that amended this subsection, and if that collective bargaining agreement prevents compliance with subsection (1), then subsection (1) does not apply to that school district, public school academy, or intermediate school district until after the expiration of that collective bargaining agreement.
(10) A school district, intermediate school district, or public school academy shall continue to conduct the evaluations for school principals that are currently required by the department through the 2010-2011 school year. At the end of the 2010-2011 school year, a school district, intermediate school district, or public school academy shall report the most recently completed or determined “effectiveness label” from that evaluation for each principal who is in place for 2010-2011, in a form and manner prescribed by the department.
Sec. 1249a. Beginning in 2015-2016, if a pupil is assigned to be taught by a teacher who has been rated as ineffective on his or her 2 most recent annual year-end evaluations under section 1249, the board of the school district or intermediate school district or board of directors of the public school academy in which the pupil is enrolled shall notify the pupil’s parent or legal guardian that the pupil has been assigned to a teacher who has been rated as ineffective on his or her 2 most recent annual year-end evaluations. The notification shall be in writing, shall be delivered to the parent or legal guardian not later than July 15 immediately preceding the beginning of the school year for which the pupil is assigned to the teacher, and shall identify the teacher who is the subject of the notification.
Enacting section 1. This amendatory act does not take effect unless all of the following bills of the 96th Legislature are enacted into law:
(a) House Bill No. 4625.
(b) House Bill No. 4626.
(c) House Bill No. 4628.
This act is ordered to take immediate effect.
Clerk of the House of Representatives
Secretary of the Senate
Approved
Governor
Attachment 10.A
516
STATE OF MICHIGAN96TH LEGISLATURE
REGULAR SESSION OF 2011
Introduced by Reps. Yonker and Haveman
ENROLLED HOUSE BILL No. 4628AN ACT to amend 1947 PA 336, entitled “An act to prohibit strikes by certain public employees; to provide review
from disciplinary action with respect thereto; to provide for the mediation of grievances and the holding of elections; to declare and protect the rights and privileges of public employees; to require certain provisions in collective bargaining agreements; and to prescribe means of enforcement and penalties for the violation of the provisions of this act,” by amending section 15 (MCL 423.215), as amended by 2011 PA 25.
The People of the State of Michigan enact:
Sec. 15. (1) A public employer shall bargain collectively with the representatives of its employees as described in section 11 and may make and enter into collective bargaining agreements with those representatives. Except as otherwise provided in this section, for the purposes of this section, to bargain collectively is to perform the mutual obligation of the employer and the representative of the employees to meet at reasonable times and confer in good faith with respect to wages, hours, and other terms and conditions of employment, or to negotiate an agreement, or any question arising under the agreement, and to execute a written contract, ordinance, or resolution incorporating any agreement reached if requested by either party, but this obligation does not compel either party to agree to a proposal or make a concession.
(2) A public school employer has the responsibility, authority, and right to manage and direct on behalf of the public the operations and activities of the public schools under its control.
(3) Collective bargaining between a public school employer and a bargaining representative of its employees shall not include any of the following subjects:
(a) Who is or will be the policyholder of an employee group insurance benefit. This subdivision does not affect the duty to bargain with respect to types and levels of benefits and coverages for employee group insurance. A change or proposed change in a type or to a level of benefit, policy specification, or coverage for employee group insurance shall be bargained by the public school employer and the bargaining representative before the change may take effect.
(b) Establishment of the starting day for the school year and of the amount of pupil contact time required to receive full state school aid under section 1284 of the revised school code, 1976 PA 451, MCL 380.1284, and under section 101 of the state school aid act of 1979, 1979 PA 94, MCL 388.1701.
(c) The composition of school improvement committees established under section 1277 of the revised school code, 1976 PA 451, MCL 380.1277.
(d) The decision of whether or not to provide or allow interdistrict or intradistrict open enrollment opportunity in a school district or of which grade levels or schools in which to allow such an open enrollment opportunity.
(e) The decision of whether or not to act as an authorizing body to grant a contract to organize and operate 1 or more public school academies under the revised school code, 1976 PA 451, MCL 380.1 to 380.1852.
(80)
EHB 4628
Act No. 103Public Acts of 2011
Approved by the GovernorJuly 19, 2011
Filed with the Secretary of StateJuly 19, 2011
EFFECTIVE DATE: July 19, 2011
Attachment 10.A
517

2EHB 4628
(f) The decision of whether or not to contract with a third party for 1 or more noninstructional support services; or the procedures for obtaining the contract for noninstructional support services other than bidding described in this subdivision; or the identity of the third party; or the impact of the contract for noninstructional support services on individual employees or the bargaining unit. However, this subdivision applies only if the bargaining unit that is providing the noninstructional support services is given an opportunity to bid on the contract for the noninstructional support services on an equal basis as other bidders.
(g) The use of volunteers in providing services at its schools.
(h) Decisions concerning use of experimental or pilot programs and staffing of experimental or pilot programs and decisions concerning use of technology to deliver educational programs and services and staffing to provide the technology, or the impact of these decisions on individual employees or the bargaining unit.
(i) Any compensation or additional work assignment intended to reimburse an employee for or allow an employee to recover any monetary penalty imposed under this act.
(j) Any decision made by the public school employer regarding the placement of teachers, or the impact of that decision on an individual employee or the bargaining unit.
(k) Decisions about the development, content, standards, procedures, adoption, and implementation of the public school employer’s policies regarding personnel decisions when conducting a reduction in force or any other personnel determination resulting in the elimination of a position or a recall from a reduction in force or any other personnel determination resulting in the elimination of a position or in hiring after a reduction in force or any other personnel determination resulting in the elimination of a position, as provided under section 1248 of the revised school code, 1976 PA 451, MCL 380.1248, any decision made by the public school employer pursuant to those policies, or the impact of those decisions on an individual employee or the bargaining unit.
(l) Decisions about the development, content, standards, procedures, adoption, and implementation of a public school employer’s performance evaluation system adopted under section 1249 of the revised school code, 1976 PA 451, MCL 380.1249, or under 1937 (Ex Sess) PA 4, MCL 38.71 to 38.191, decisions concerning the content of a performance evaluation of an employee under those provisions of law, or the impact of those decisions on an individual employee or the bargaining unit.
(m) For public employees whose employment is regulated by 1937 (Ex Sess) PA 4, MCL 38.71 to 38.191, decisions about the development, content, standards, procedures, adoption, and implementation of a policy regarding discharge or discipline of an employee, decisions concerning the discharge or discipline of an individual employee, or the impact of those decisions on an individual employee or the bargaining unit. For public employees whose employment is regulated by 1937 (Ex Sess) PA 4, MCL 38.71 to 38.191, a public school employer shall not adopt, implement, or maintain a policy for discharge or discipline of an employee that includes a standard for discharge or discipline that is different than the arbitrary and capricious standard provided under section 1 of article IV of 1937 (Ex Sess) PA 4, MCL 38.101.
(n) Decisions about the format, timing, or number of classroom observations conducted for the purposes of section 3a of article II of 1937 (Ex Sess) PA 4, MCL 38.83a, decisions concerning the classroom observation of an individual employee, or the impact of those decisions on an individual employee or the bargaining unit.
(o) Decisions about the development, content, standards, procedures, adoption, and implementation of the method of compensation required under section 1250 of the revised school code, 1976 PA 451, MCL 380.1250, decisions about how an employee performance evaluation is used to determine performance-based compensation under section 1250 of the revised school code, 1976 PA 451, MCL 380.1250, decisions concerning the performance-based compensation of an individual employee, or the impact of those decisions on an individual employee or the bargaining unit.
(p) Decisions about the development, format, content, and procedures of the notification to parents and legal guardians required under section 1249a of the revised school code, 1976 PA 451, MCL 380.1249a.
(4) Except as otherwise provided in subsection (3)(f), the matters described in subsection (3) are prohibited subjects of bargaining between a public school employer and a bargaining representative of its employees, and, for the purposes of this act, are within the sole authority of the public school employer to decide.
(5) If a public school is placed in the state school reform/redesign school district or is placed under a chief executive officer under section 1280c of the revised school code, 1976 PA 451, MCL 380.1280c, then, for the purposes of collective bargaining under this act, the state school reform/redesign officer or the chief executive officer, as applicable, is the public school employer of the public school employees of that public school for as long as the public school is part of the state school reform/redesign school district or operated by the chief executive officer.
(6) A public school employer’s collective bargaining duty under this act and a collective bargaining agreement entered into by a public school employer under this act are subject to all of the following:
(a) Any effect on collective bargaining and any modification of a collective bargaining agreement occurring under section 1280c of the revised school code, 1976 PA 451, MCL 380.1280c.
(b) For a public school in which the superintendent of public instruction implements 1 of the 4 school intervention models described in section 1280c of the revised school code, 1976 PA 451, MCL 380.1280c, if the school intervention
Attachment 10.A
518

3EHB 4628
model that is implemented affects collective bargaining or requires modification of a collective bargaining agreement, any effect on collective bargaining and any modification of a collective bargaining agreement under that school intervention model.
(7) Each collective bargaining agreement entered into between a public employer and public employees under this act after March 16, 2011 shall include a provision that allows an emergency manager appointed under the local government and school district fiscal accountability act, 2011 PA 4, MCL 141.1501 to 141.1531, to reject, modify, or terminate the collective bargaining agreement as provided in the local government and school district fiscal accountability act, 2011 PA 4, MCL 141.1501 to 141.1531. Provisions required by this subsection are prohibited subjects of bargaining under this act.
(8) Collective bargaining agreements under this act may be rejected, modified, or terminated pursuant to the local government and school district fiscal accountability act, 2011 PA 4, MCL 141.1501 to 141.1531. This act does not confer a right to bargain that would infringe on the exercise of powers under the local government and school district fiscal accountability act, 2011 PA 4, MCL 141.1501 to 141.1531.
(9) A unit of local government that enters into a consent agreement under the local government and school district fiscal accountability act, 2011 PA 4, MCL 141.1501 to 141.1531, is not subject to subsection (1) for the term of the consent agreement, as provided in the local government and school district fiscal accountability act, 2011 PA 4, MCL 141.1501 to 141.1531.
(10) If the charter of a city, village, or township with a population of 500,000 or more specifies the selection of a retirant member of the municipality’s fire department, police department, or fire and police department pension or retirement board, the method of selection of that member is a prohibited subject of bargaining.
Enacting section 1. This amendatory act does not take effect unless all of the following bills of the 96th Legislature are enacted into law:
(a) House Bill No. 4625.
(b) House Bill No. 4626.
(c) House Bill No. 4627.
This act is ordered to take immediate effect.
Clerk of the House of Representatives
Secretary of the Senate
Approved
Governor
Attachment 10.A
519
ESB 817
STATE OF MICHIGAN97TH LEGISLATURE
REGULAR SESSION OF 2014
Introduced by Senators Pappageorge, Pavlov, Colbeck, Nofs, Hansen and Hildenbrand
ENROLLED SENATE BILL No. 817AN ACT to amend 1976 PA 451, entitled “An act to provide a system of public instruction and elementary and
secondary schools; to revise, consolidate, and clarify the laws relating to elementary and secondary education; to provide for the organization, regulation, and maintenance of schools, school districts, public school academies, intermediate school districts, and other public school entities; to prescribe rights, powers, duties, and privileges of schools, school districts, public school academies, intermediate school districts, and other public school entities; to provide for the regulation of school teachers and certain other school employees; to provide for school elections and to prescribe powers and duties with respect thereto; to provide for the levy and collection of taxes; to provide for the borrowing of money and issuance of bonds and other evidences of indebtedness; to establish a fund and provide for expenditures from that fund; to provide for and prescribe the powers and duties of certain state departments, the state board of education, and certain other boards and officials; to provide for licensure of boarding schools; to prescribe penalties; and to repeal acts and parts of acts,” by amending section 1249 (MCL 380.1249), as amended by 2011 PA 102.
The People of the State of Michigan enact:
Sec. 1249. (1) Subject to subsection (7), with the involvement of teachers and school administrators, the board of a school district or intermediate school district or board of directors of a public school academy shall adopt and implement for all teachers and school administrators a rigorous, transparent, and fair performance evaluation system that does all of the following:
(a) Evaluates the teacher’s or school administrator’s job performance at least annually while providing timely and constructive feedback.
(b) Establishes clear approaches to measuring student growth and provides teachers and school administrators with relevant data on student growth.
(c) Evaluates a teacher’s or school administrator’s job performance, using multiple rating categories that take into account data on student growth as a significant factor. For 2014-2015, for grades and subjects in which state assessments are administered in compliance with 20 USC 6311, student growth must be measured, at least in part, using the state assessments, and for grades and subjects in which state assessments are not required and administered for purposes of 20 USC 6311, student growth must be measured, at least in part, using alternative assessments that are rigorous and comparable across schools within the school district, intermediate school district, or public school academy. If the performance evaluation system implemented by a school district, intermediate school district, or public school academy under this section does not already include the rating of teachers as highly effective, effective, minimally effective, and ineffective, then the school district, intermediate school district, or public school academy shall revise the performance evaluation system not later than September 19, 2011 to ensure that it rates teachers as highly effective, effective, minimally effective, or ineffective.
(126)
Act No. 257Public Acts of 2014
Approved by the GovernorJune 28, 2014
Filed with the Secretary of StateJune 30, 2014
EFFECTIVE DATE: June 30, 2014
Attachment 10.A
520
2ESB 817
(d) Uses the evaluations, at a minimum, to inform decisions regarding all of the following:
(i) The effectiveness of teachers and school administrators, ensuring that they are given ample opportunities for improvement.
(ii) Promotion, retention, and development of teachers and school administrators, including providing relevant coaching, instruction support, or professional development.
(iii) Whether to grant tenure or full certification, or both, to teachers and school administrators using rigorous standards and streamlined, transparent, and fair procedures.
(iv) Removing ineffective tenured and untenured teachers and school administrators after they have had ample opportunities to improve, and ensuring that these decisions are made using rigorous standards and streamlined, transparent, and fair procedures.
(2) Beginning with the 2015-2016 school year, the board of a school district or intermediate school district or board of directors of a public school academy shall ensure that the performance evaluation system for teachers meets all of the following:
(a) The performance evaluation system shall include at least an annual year-end evaluation for all teachers. An annual year-end evaluation shall meet all of the following:
(i) At least 50% of the annual year-end evaluation shall be based on student growth and assessment data. All student growth and assessment data shall be measured using the student growth assessment tool that is required under legislation enacted by the legislature after review of the recommendations contained in the report of the former Michigan council for educator effectiveness.
(ii) If there are student growth and assessment data available for a teacher for at least 3 school years, the annual year-end evaluation shall be based on the student growth and assessment data for the most recent 3-consecutive-school-year period. If there are not student growth and assessment data available for a teacher for at least 3 school years, the annual year-end evaluation shall be based on all student growth and assessment data that are available for the teacher.
(iii) The annual year-end evaluation shall include specific performance goals that will assist in improving effectiveness for the next school year and are developed by the school administrator or his or her designee conducting the evaluation, in consultation with the teacher, and any recommended training identified by the school administrator or designee, in consultation with the teacher, that would assist the teacher in meeting these goals. For a teacher described in subdivision (b), the school administrator or designee shall develop, in consultation with the teacher, an individualized development plan that includes these goals and training and is designed to assist the teacher to improve his or her effectiveness.
(b) The performance evaluation system shall include a midyear progress report for a teacher who is in the first year of the probationary period prescribed by section 1 of article II of 1937 (Ex Sess) PA 4, MCL 38.81, or who received a rating of minimally effective or ineffective in his or her most recent annual year-end evaluation. The midyear progress report shall be used as a supplemental tool to gauge a teacher’s improvement from the preceding school year and to assist a teacher to improve. All of the following apply to the midyear progress report:
(i) The midyear progress report shall be based at least in part on student achievement.
(ii) The midyear progress report shall be aligned with the teacher’s individualized development plan under subdivision (a)(iii).
(iii) The midyear progress report shall include specific performance goals for the remainder of the school year that are developed by the school administrator conducting the annual year-end evaluation or his or her designee and any recommended training identified by the school administrator or designee that would assist the teacher in meeting these goals. At the midyear progress report, the school administrator or designee shall develop, in consultation with the teacher, a written improvement plan that includes these goals and training and is designed to assist the teacher to improve his or her rating.
(iv) The midyear progress report shall not take the place of an annual year-end evaluation.
(c) The performance evaluation system shall include classroom observations to assist in the performance evaluations. All of the following apply to these classroom observations:
(i) Except as provided in this subdivision, the manner in which a classroom observation is conducted shall be prescribed in the evaluation tool for teachers described in subdivision (d).
(ii) A classroom observation shall include a review of the teacher’s lesson plan and the state curriculum standard being used in the lesson and a review of pupil engagement in the lesson.
(iii) A classroom observation does not have to be for an entire class period.
(iv) Unless a teacher has received a rating of effective or highly effective on his or her 2 most recent annual year-end evaluations, there shall be multiple classroom observations of the teacher each school year.
(d) For the purposes of conducting annual year-end evaluations under the performance evaluation system, the school district, intermediate school district, or public school academy shall adopt and implement the state evaluation tool for teachers that is required under legislation enacted by the legislature after review of the recommendations contained in
Attachment 10.A
521
3ESB 817
the report of the former Michigan council for educator effectiveness. However, if a school district, intermediate school district, or public school academy has a local evaluation tool for teachers that is consistent with the state evaluation tool, the school district, intermediate school district, or public school academy may conduct annual year-end evaluations for teachers using that local evaluation tool.
(e) The performance evaluation system shall assign an effectiveness rating to each teacher of highly effective, effective, minimally effective, or ineffective, based on his or her score on the annual year-end evaluation described in this subsection.
(f) As part of the performance evaluation system, and in addition to the requirements of section 1526, a school district, intermediate school district, or public school academy is encouraged to assign a mentor or coach to each teacher who is described in subdivision (b).
(g) The performance evaluation system may allow for exemption of student growth data for a particular pupil for a school year upon the recommendation of the school administrator conducting the annual year-end evaluation or his or her designee and approval of the school district superintendent or his or her designee, intermediate superintendent or his or her designee, or chief administrator of the public school academy, as applicable.
(h) The performance evaluation system shall provide that, if a teacher is rated as ineffective on 3 consecutive annual year-end evaluations, the school district, public school academy, or intermediate school district shall dismiss the teacher from his or her employment. This subdivision does not affect the ability of a school district, intermediate school district, or public school academy to dismiss an ineffective teacher from his or her employment regardless of whether the teacher is rated as ineffective on 3 consecutive annual year-end evaluations.
(i) The performance evaluation system shall provide that, if a teacher is rated as highly effective on 3 consecutive annual year-end evaluations, the school district, intermediate school district, or public school academy may choose to conduct a year-end evaluation biennially instead of annually. However, if a teacher is not rated as highly effective on 1 of these biennial year-end evaluations, the teacher shall again be provided with annual year-end evaluations.
(j) The performance evaluation system shall provide that, if a teacher who is not in a probationary period prescribed by section 1 of article II of 1937 (Ex Sess) PA 4, MCL 38.81, is rated as ineffective on an annual year-end evaluation, the teacher may request a review of the evaluation and the rating by the school district superintendent, intermediate superintendent, or chief administrator of the public school academy, as applicable. The request for a review must be submitted in writing within 20 days after the teacher is informed of the rating. Upon receipt of the request, the school district superintendent, intermediate superintendent, or chief administrator of the public school academy, as applicable, shall review the evaluation and rating and may make any modifications as appropriate based on his or her review. However, the performance evaluation system shall not allow for a review as described in this subdivision more than twice in a 3-school-year period.
(3) Beginning with the 2015-2016 school year, the board of a school district or intermediate school district or board of directors of a public school academy shall ensure that the performance evaluation system for building-level school administrators and for central office-level school administrators who are regularly involved in instructional matters meets all of the following:
(a) The performance evaluation system shall include at least an annual year-end evaluation for all school administrators described in this subsection by the school district superintendent or his or her designee, intermediate superintendent or his or her designee, or chief administrator of the public school academy, as applicable, except that a superintendent or chief administrator shall be evaluated by the board or board of directors.
(b) At least 50% of the annual year-end evaluation shall be based on student growth and assessment data. The student growth and assessment data to be used for the school administrator annual year-end evaluation are the aggregate student growth and assessment data that are used in teacher annual year-end evaluations in each school in which the school administrator works as an administrator or, for a central-office level school administrator, for the entire school district or intermediate school district.
(c) The portion of the annual year-end evaluation that is not based on student growth and assessment data shall be based on at least the following for each school in which the school administrator works as an administrator or, for a central-office level school administrator, for the entire school district or intermediate school district:
(i) If the school administrator conducts teacher performance evaluations, the school administrator’s training and proficiency in using the evaluation tool for teachers described in subsection (2)(d), including a random sampling of his or her teacher performance evaluations to assess the quality of the school administrator’s input in the teacher performance evaluation system. If the school administrator designates another person to conduct teacher performance evaluations, the evaluation of the school administrator on this factor shall be based on the designee’s training and proficiency in using the evaluation tool for teachers described in subsection (2)(d), including a random sampling of the designee’s teacher performance evaluations to assess the quality of the designee’s input in the teacher performance evaluation system, with the designee’s performance to be counted as if it were the school administrator personally conducting the teacher performance evaluations.
Attachment 10.A
522
4ESB 817
(ii) The progress made by the school or school district in meeting the goals set forth in the school’s school improvement plan or the school district’s school improvement plans.
(iii) Pupil attendance in the school or school district.
(iv) Student, parent, and teacher feedback, and other information considered pertinent by the superintendent or other school administrator conducting the performance evaluation or the board or board of directors.
(d) For the purposes of conducting performance evaluations under the performance evaluation system, the school district, intermediate school district, or public school academy shall adopt and implement the state evaluation tool for school administrators described in this subsection that is required under legislation enacted by the legislature after review of the recommendations contained in the report of the former Michigan council for educator effectiveness. However, if a school district, intermediate school district, or public school academy has a local evaluation tool for school administrators described in this subsection that is consistent with the state evaluation tool, the school district, intermediate school district, or public school academy may conduct performance evaluations for school administrators using that local evaluation tool.
(e) The performance evaluation system shall assign an effectiveness rating to each school administrator described in this subsection of highly effective, effective, minimally effective, or ineffective, based on his or her score on the evaluation tool described in subdivision (d).
(f) The performance evaluation system shall ensure that if a school administrator described in this subsection is rated as minimally effective or ineffective, the person or persons conducting the evaluation shall develop and require the school administrator to implement an improvement plan to correct the deficiencies. The improvement plan shall recommend professional development opportunities and other measures designed to improve the rating of the school administrator on his or her next annual year-end evaluation.
(g) The performance evaluation system shall provide that, if a school administrator described in this subsection is rated as ineffective on 3 consecutive annual year-end evaluations, the school district, public school academy, or intermediate school district shall dismiss the school administrator from his or her employment. However, this subdivision applies only if the 3 consecutive annual year-end evaluations are conducted using the same evaluation tool and under the same performance evaluation system. This subdivision does not affect the ability of a school district, intermediate school district, or public school academy to dismiss an ineffective school administrator from his or her employment regardless of whether the school administrator is rated as ineffective on 3 consecutive annual year-end evaluations.
(h) The performance evaluation system shall provide that, if a school administrator is rated as highly effective on 3 consecutive annual year-end evaluations, the school district, intermediate school district, or public school academy may choose to conduct a year-end evaluation biennially instead of annually. However, if a school administrator is not rated as highly effective on 1 of these biennial year-end evaluations, the school administrator shall again be provided with annual year-end evaluations.
(4) It is the intent of the legislature to review the report submitted by the former Michigan council for educator effectiveness and to enact appropriate legislation to put into place a statewide performance evaluation system taking into consideration the recommendations contained in the report.
(5) If all of the following apply for a public school operated by a school district, intermediate school district, or public school academy, then the school district, intermediate school district, or public school academy is not required to comply with subsection (2) or (3) for that public school:
(a) As of July 19, 2011, the school district, intermediate school district, or public school academy had already implemented and is currently using a performance evaluation system for that public school that meets all of the following requirements:
(i) Under the system, the most significant portion of a teacher’s or school administrator’s evaluation is based on student growth and assessment data, which may include value-added measures.
(ii) The system uses research-based measures to determine student growth. For 2014-2015, for grades and subjects in which state assessments are administered in compliance with 20 USC 6311, student growth must be measured, at least in part, using the state assessments, and for grades and subjects in which state assessments are not required and administered for purposes of 20 USC 6311, student growth must be measured, at least in part, using alternative assessments that are rigorous and comparable across schools within the school district, intermediate school district, or public school academy. Student growth also may be measured by standards-based, nationally normed assessments and other objective criteria which may include other national or local assessments.
(iii) The system determines professional competence through multiple direct observations of classroom practices and professional practices throughout the school year.
(iv) Under the system, teacher effectiveness and ratings, as measured by student achievement and growth data, are factored into teacher retention, promotion, and termination decisions.
(v) Under the system, teacher and school administrator performance evaluation results are used to inform teacher professional development for the succeeding year.
Attachment 10.A
523
5ESB 817
(vi) The system ensures that teachers and school administrators are evaluated at least annually.
(b) The school district, intermediate school district, or public school academy notified the former governor’s council on educator effectiveness by November 1, 2011 that it is exempt under this subsection from the requirements of subsections (2) and (3).
(c) The school district, intermediate school district, or public school academy posts a description of its evaluation system on its website.
(6) If, after July 19, 2011, a school district, intermediate school district, or public school academy begins operating a new public school, or implements a new performance evaluation system for a public school it operates, and all of the following apply, then the school district, intermediate school district, or public school academy is not required to comply with subsection (2) or (3) for that public school:
(a) The performance evaluation system adopted and implemented for that public school replicates and is identical to the performance evaluation system of a public school that is exempt under subsection (5).
(b) The school district, intermediate school district, or public school academy posts a description of the performance evaluation system on its website.
(7) If a collective bargaining agreement is in effect for teachers or school administrators of a school district, public school academy, or intermediate school district as of July 19, 2011, and if that collective bargaining agreement prevents compliance with subsection (1), then subsection (1) does not apply to that school district, public school academy, or intermediate school district until after the expiration of that collective bargaining agreement.
This act is ordered to take immediate effect.
Secretary of the Senate
Clerk of the House of Representatives
Approved
Governor
Attachment 10.A
524

InterimProgressReport
April 2012
Attachment 10.B
525
MICHIGAN COUNCIL FOR EDUCATOR EFFECTIVENESS INTERIM PROGRESS REPORT
APRIL 27, 2012
Table of Contents Interim Progress Report…………………………………………………………..…………………………………1 Appendix A: Council Members’ Biographies…………………………………………………………………….16 Appendix B: Annotated Meeting Agendas……………………………………………………………………..17 Appendix C: In-Meeting Consultations…………………………………………………………………………36 Appendix D: Out-of Meeting Consultations……………………………………………………………………..39 Appendix E: Research and Resources…………………………………………………………………………..41 Appendix F: Advisory Committee Members…………………………………………………………………….46 Appendix G: Advisory Committee Report………………………………………………………………………..47 Appendix H: Advisory Committee Responses to MCEE Questions………………………………………….49 Appendix I: Michigan Department of Education Framework for Learning…………………………………..51 Appendix J: Michigan Department of Education School Improvement Framework…………………………53 Appendix K: Professional Standards for Michigan Teachers…………………………………………………54 Appendix L: Michigan Assessment Timeline……………………………………………………………………55 Appendix M: Evaluation System Pilot Proposed Budget……………………………………………………..56
Attachment 10.B
526
Michigan Council for Educator Effectiveness Interim Progress Report April 2012 Page 1 of 56
MICHIGAN COUNCIL FOR EDUCATOR EFFECTIVENESS INTERIM PROGRESS REPORT
APRIL 27, 2012
Background The Michigan Council for Educator Effectiveness (MCEE)1 was established in June of 2011 as part of Michigan’s teacher tenure reform efforts (PA 102 of 2011). Council members were appointed in September, and the legislature appropriated funding in mid-December of 2011. The MCEE is a temporary commission with a life of no more than two years. The council has five voting members, three of whom were appointed by Governor Rick Snyder, and one each by Senate Majority Leader Randy Richardville and Speaker of the House Jase Bolger. Governor Snyder appointed Deborah Loewenberg Ball, dean of the University of Michigan School of Education, as chair of the MCEE. In addition to Ball, the governor appointed Mark Reckase from Michigan State University’s College of Education and Nick Sheltrown from National Heritage Academics in Grand Rapids. Majority Leader Richardville appointed David Vensel, a principal from Jefferson High School in Monroe, and Speaker Bolger appointed Jennifer Hammond, a principal from Grand Blanc High School. Joseph Martineau serves on the MCEE without vote and is the designee of the Michigan Department of Education’s superintendent of public instruction. (See Appendix A for a full biography of each council member.) Charge and Vision The MCEE is charged by law with an ambitious agenda, one that has tremendous significance for the educational opportunities and outcomes of our state’s children. The MCEE will submit to the State Board of Education, the Governor, and the state legislature a report that identifies and recommends all of the following:
A student growth and assessment tool. A state evaluation tool for teachers. A state evaluation tool for school administrators. Changes to the requirements for a professional teaching certificate. A process for evaluating and approving local evaluation tools for teachers and administrators that
are consistent with the state evaluation tool for teachers and administrators and the act.
The following common vision grounds the efforts of the MCEE:
The Michigan Council for Educator Effectiveness will develop a fair, transparent, and feasible evaluation system for teachers and school administrators. The system will be based on rigorous standards of professional practice and of measurement. The goal of this system is to contribute to enhanced instruction, improve student achievement, and support ongoing professional learning.
1 MCEE was formerly called the Governor’s Council on Educator Effectiveness. On March 27, 2012, Executive Order No. 2012–3 was signed by Governor Snyder. It moved the GCEE out of the Governor’s Office and into the Michigan Department of Technology, Management, and Budget (DTMB). It also changed the name of the council to the Michigan Council for Educator Effectiveness.
Attachment 10.B
527
Michigan Council for Educator Effectiveness Interim Progress Report April 2012 Page 2 of 56
The Process The Michigan Council for Educator Effectiveness convened for the first time in December 2011. Since then, the MCEE has met 16 times, averaging one three-hour meeting per week. Most meetings have taken place at the University of Michigan’s School of Education in Ann Arbor, though the council has also held meetings in Detroit, Lansing, and Grand Rapids. Four meetings were open to the public, offering a variety of stakeholders the opportunity to observe the council’s work and voice comments and suggestions. (Appendix B summarizes each meeting’s presentations and discussions.) Collaboration has been central to the MCEE’s progress. Council members, as well as two ongoing expert consultants, divided into two groups focused on two immediate priorities: observation protocols for teachers and student growth and assessment tools. These technical groups work to make progress outside of the formal MCEE meetings, but all council members and consultants collaborate during formal meetings to discuss findings, ideas, and questions, and all deliberations and decisions are collective. In addition to the work of its six members, the MCEE has benefitted from the input of expert consultants, all of whom are national leaders in areas crucial to the council’s work. These experienced scholars and practitioners have provided valuable insight into education policies, reforms, and initiatives that are taking place in Michigan and in other states. Since their first meeting, council members have consulted with more than 30 experts from 10 states (see Appendices C and D). They have also referred to research and reports from a wide range of organizations and commissions around the country that have already worked extensively to understand educator evaluation and to implement evaluation systems (see Appendix E). Research and consultants have provided the MCEE with a wealth of knowledge regarding observation tools, student growth models, pilots, and both the successes and concerns of other states throughout similar processes. Because observation of teaching is so central to the evaluation system that the council is charged to recommend, the MCEE has focused its work over the last three months on learning about the efficacy, feasibility, cost, and other aspects of implementing a variety of observation tools. Council members have consulted with other states, spoken with representatives from observation tool organizations, and discussed each framework’s strengths and weaknesses. The council has made significant progress on this portion of the charge. Similarly, because student growth is also to be a key component, the MCEE has been actively investigating alternative approaches to measuring growth, and learning about various challenges and ways to address them. This interim progress report provides a summary of what has been learned in both of these crucial areas. The Advisory Committee PA 102 of 2011 also established the Advisory Committee to the Michigan Council for Educator Effectiveness, which consists of Governor-appointed teachers, district leaders, and members of interest groups (see Appendix F for a full list of members). This committee has responded to questions submitted by the council, and has provided input on the observation and student growth components of the council’s charge. To read the Advisory Committee’s ideas and feedback, please refer to Appendices G and H. Teacher Evaluation: Observation Tool Overview Regular observations of educators are an essential component of building learning organizations. The MCEE is committed to institutionalizing teacher observations as part of Michigan’s educator evaluation system in a rigorous, professionally responsible, and legally defensible way. Because so many states have recently created such systems, the council gathered information from across the country about the components of such systems, the tools available, the measurement challenges associated with educator observations, the processes and resources needed to guarantee rigorous use of these measures, and the lessons that other states have learned along the way.
Attachment 10.B
528
Michigan Council for Educator Effectiveness Interim Progress Report April 2012 Page 3 of 56
Design Principles for an Educator Evaluation System It is essential that Michigan have a clear set of design principles for the development of its educator evaluation system:
Expectations should be clear and rigorous. The system should involve multiple measures. The system should enhance performance. The system should be committed to and structured to support ongoing educator learning and
development.
Criteria for Selecting Observation Processes and Tools With these design principles in mind, the MCEE recommends five criteria for the selection and review of observation instruments and related materials to be used by Michigan school districts:
The instruments should be aligned with relevant state and national standards for educators. In Michigan, there are three relevant frameworks that need to be aligned with the educator evaluation system: the Teaching for Learning Framework (Appendix I), the School Improvement Program framework (Appendix J), and the Professional Standards for Michigan Teachers (see Appendix K). In addition, as new policies and reforms are embraced by the state, (e.g., the Common Core State Standards), educator evaluation systems must be aligned to support teachers who are adjusting curriculum and instruction to these new mandates. There are also myriad standards for teaching issued by professional organizations (e.g., the National Council for Teachers of Mathematics, the National Council for Social Studies, etc.) that are relevant.
The instruments should be used both for describing practice and supporting ongoing educator learning/development. Although one goal of the educator evaluation system is to identify weak or underperforming teachers, the power of the system will lie in its potential to improve continually the capacity of Michigan’s educator workforce. Thus the system should be designed to support teacher and principal learning over time.
The instruments should be accompanied by a rigorous and ongoing training program for evaluators.
The documentation of teaching is only as good as the observer. Observers need to be trained to observe carefully, attend rigorously to the key elements of instruction, to be thorough and accurate in their note taking and assessments, and responsible in the conclusions they draw from their observations. This takes training, and every commercially available observation protocol includes substantial training. Several require annual retraining as well.
Independent research on the reliability and the validity of the instruments should be available.
Although locally developed measures or adaptations of widely used measures might be appealing to many educators, an educator evaluation system involves high-stakes decisions about employment and credentialing. Over time, therefore, it is essential that any locally developed observation instrument be rigorously examined for its reliability and validity. It is also essential to monitor fidelity of districts’ use of any common state-wide protocol. Although any tool recommended as the common tool for the state will already be supported by evidence of validity, it will nevertheless depend on proper local implementation to be reliable and fair.
Attachment 10.B
529

Michigan Council for Educator Effectiveness Interim Progress Report April 2012 Page 4 of 56
The demands of the process should be feasible (in terms of personnel, time, and financial cost).
Institutionalizing educator evaluation for every teacher in every school multiple times across the year will require major changes in the work of the school principal. Rigorous observation systems require pre- and post-conferences with teachers, extended and brief observations, time to review and analyze the observational data (along with additional material), and time to conference with every teacher. Efforts to short circuit and truncate these components will compromise the quality and defensibility of the evaluation system. Thus concerns for adopting a system that is feasible in terms of time, personnel, money, and other human and material resources are critical.
Observation/Evaluation Systems Many observation and evaluation systems are currently available. Some have been developed by researchers, others by professional developers, others by educators committed to providing sound support for early career teachers. Several states—Rhode Island, North Carolina, and Colorado, for example—have developed their own protocols (often adapting aspects of other widely used observation tools). Most of these materials are not accompanied by credible research on their reliability and validity. In addition to hearing from several Michigan school principals about their observation systems, the MCEE carefully examined the following tools:
The Marzano Observation Protocol (Marzano Research Laboratory) The Thoughtful Classroom (Silver Strong & Associates) The Five Dimensions of Teaching and Learning (The University of Washington, Center for
Educational Leadership) Charlotte Danielson’s Framework for Teaching Proficiency Test Instrument (Outcomes
Associates, Inc.) The Classroom Assessment Scoring System (CLASS, Teachstone, Inc.) The TAP Rubric (National Institute for Excellence in Teaching)
All of the existing protocols are potentially aligned with Michigan standards for teachers, although they differ substantially in level of detail and relevance to all grade levels and subject areas:
Observation Instrument
Major dimensions Aligned Training Independent research on reliability/ validity
Observation or observation plus other materials
Marzano Establish and communicate learning goals Help students effectively interact with new knowledge Help students practice and deepen their understanding Help students generate and test hypotheses Engage students Establish and maintain classroom rules Recognize and acknowledge adherence to rules Establish and maintain effective relationships Communicate high expectations for all students Develop effective lessons 41 subdimensions (short form)
✔ ✔ Obs+
Attachment 10.B
530

Michigan Council for Educator Effectiveness Interim Progress Report April 2012 Page 5 of 56
Observation Instrument
Major dimensions Aligned Training Independent research on reliability/ validity
Observation or observation plus other materials
Thoughtful Classroom
Organization, rules, and procedures Preparing students for learning Presenting new learning Deepening learning Applying learning Positive relationships A culture of thinking and learning Helping students reflect on learning Engagement and enjoyment 75 subdimensions
✔ ✔ Obs+
Five Dimensions
Purpose Student engagement Curriculum and pedagogy Assessment of student learning Classroom culture 13 subdimensions
✔ ✔ Obs
Framework for Teaching
Planning and preparation Creating a respectful environment Instruction Professional responsibilities 22 subdimensions
✔ ✔ ✔ Obs+
Classroom Assessment Scoring System (Declined to release entire rubric)
Emotional support Classroom organization Instructional support Number of subdimensions unknown
✔ ✔ ✔ Obs
TAP
Designing and planning instruction Instruction Professional responsibilities Learning environment
✔ ✔ Obs+
Some of the observation protocols focus exclusively on what observers might see in a classroom; others include professional responsibilities such as collaborating with other teachers, working well with parents, planning and reflecting on lessons. Very few of them have been the subject of independent research; only the Danielson Framework for Teaching and the Classroom Assessment Scoring System have substantial research in terms of instrument validity and reliability. Lessons Learned Several important issues were emphasized by all of the state commissioners whom we interviewed and all of the observation system vendors. We summarize the main items here:
Pilot phase: A system of educator evaluation will only work to improve student learning if there is extensive buy in, understanding, and local learning. Every state commission recommended a pilot testing year, during which proposed tools and approaches can be tried out and their feasibility and fairness analyzed. Such pilot testing enables appropriate adaptations to be developed, as
Attachment 10.B
531
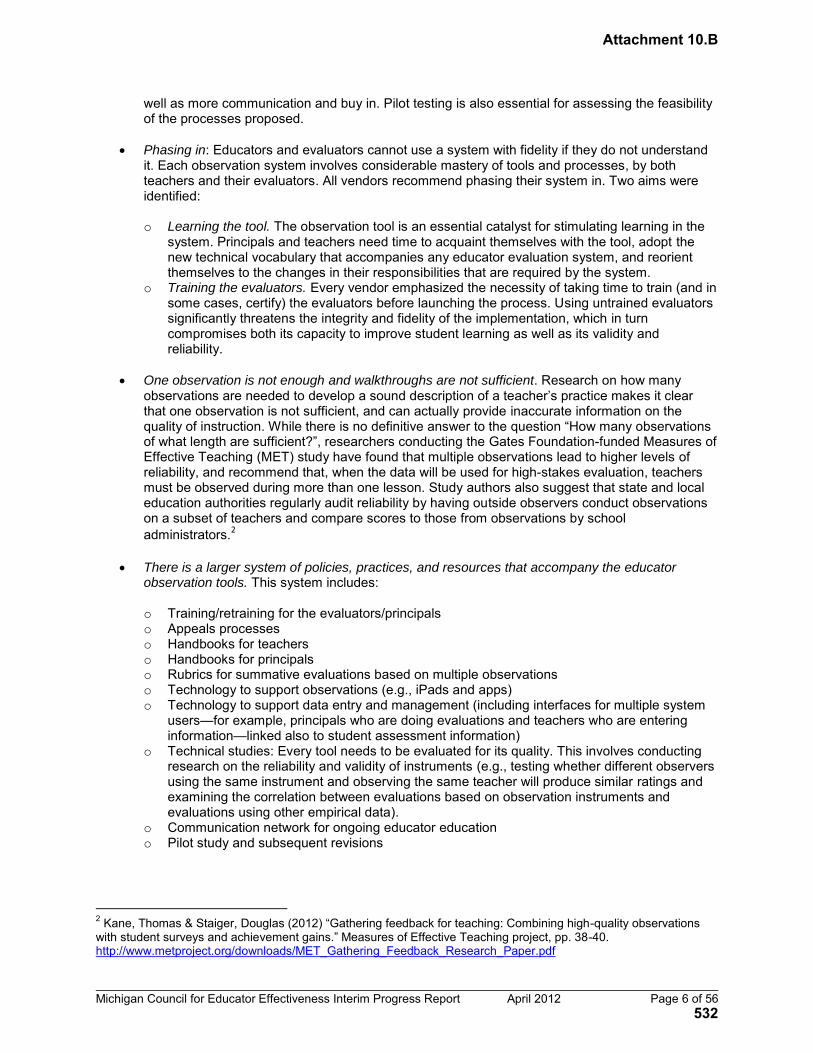
Michigan Council for Educator Effectiveness Interim Progress Report April 2012 Page 6 of 56
well as more communication and buy in. Pilot testing is also essential for assessing the feasibility of the processes proposed.
Phasing in: Educators and evaluators cannot use a system with fidelity if they do not understand it. Each observation system involves considerable mastery of tools and processes, by both teachers and their evaluators. All vendors recommend phasing their system in. Two aims were identified:
o Learning the tool. The observation tool is an essential catalyst for stimulating learning in the
system. Principals and teachers need time to acquaint themselves with the tool, adopt the new technical vocabulary that accompanies any educator evaluation system, and reorient themselves to the changes in their responsibilities that are required by the system.
o Training the evaluators. Every vendor emphasized the necessity of taking time to train (and in some cases, certify) the evaluators before launching the process. Using untrained evaluators significantly threatens the integrity and fidelity of the implementation, which in turn compromises both its capacity to improve student learning as well as its validity and reliability.
One observation is not enough and walkthroughs are not sufficient. Research on how many
observations are needed to develop a sound description of a teacher’s practice makes it clear that one observation is not sufficient, and can actually provide inaccurate information on the quality of instruction. While there is no definitive answer to the question “How many observations of what length are sufficient?”, researchers conducting the Gates Foundation-funded Measures of Effective Teaching (MET) study have found that multiple observations lead to higher levels of reliability, and recommend that, when the data will be used for high-stakes evaluation, teachers must be observed during more than one lesson. Study authors also suggest that state and local education authorities regularly audit reliability by having outside observers conduct observations on a subset of teachers and compare scores to those from observations by school administrators.2
There is a larger system of policies, practices, and resources that accompany the educator
observation tools. This system includes:
o Training/retraining for the evaluators/principals o Appeals processes o Handbooks for teachers o Handbooks for principals o Rubrics for summative evaluations based on multiple observations o Technology to support observations (e.g., iPads and apps) o Technology to support data entry and management (including interfaces for multiple system
users—for example, principals who are doing evaluations and teachers who are entering information—linked also to student assessment information)
o Technical studies: Every tool needs to be evaluated for its quality. This involves conducting research on the reliability and validity of instruments (e.g., testing whether different observers using the same instrument and observing the same teacher will produce similar ratings and examining the correlation between evaluations based on observation instruments and evaluations using other empirical data).
o Communication network for ongoing educator education o Pilot study and subsequent revisions
2 Kane, Thomas & Staiger, Douglas (2012) “Gathering feedback for teaching: Combining high-quality observations with student surveys and achievement gains.” Measures of Effective Teaching project, pp. 38-40. http://www.metproject.org/downloads/MET_Gathering_Feedback_Research_Paper.pdf
Attachment 10.B
532

Michigan Council for Educator Effectiveness Interim Progress Report April 2012 Page 7 of 56
Challenges In reviewing research and interviewing relevant actors in other states, the MCEE has identified four challenges that must be met in making recommendations about the observation tool (or tools) to be used.
Challenge 1: Being fiscally and practically feasible. Only two instruments have independent, persuasive data associated with them about their reliable use (Framework for Teaching and CLASS). Both are labor intensive, and require multiple observations, as well as considerable material and personnel resources. A fair system requires the use of tested instruments that result in defensible observations and subsequent evaluations, but this costs both money and time.
Challenge 2: Ensuring fairness and reliability. No matter what tool is selected, considerations of
feasibility are important, but must be balanced by an overriding concern for fairness. Determining how many observations are required, how many observers there should be, the number of dimensions and subdimensions on which teachers should be evaluated, and what the necessary training and expertise of evaluations should be are crucial considerations. All of the available evidence suggests that multiple observations are needed and multiple observers need to be trained. Some of the available instruments (that do not have independent evidence associated with them) are shorter or have been streamlined for the purposes of briefer, more efficient observations, but these instruments may not produce observations that are of high enough quality to make high-stakes decisions. Principals are not likely to have the time needed to conduct multiple observations for every teacher (in addition to end of the year conferences), nor do they have the content expertise to be qualified to make sound judgments across all content domains.
Challenge 3: Assessing the fidelity of protocol implementation. Given the high-stakes nature of the decisions that will be made based on these observations, it is imperative that there be a system in place to check that instruments and procedures are implemented with integrity and rigor. Every vendor with whom we spoke emphasized the importance of observer training and retraining. As the use of these observations goes to scale in thousands of teachers’ classrooms, data must be collected and analyses conducted to appraise whether tools are being used accurately and whether protocols for implementation are being followed.
Challenge 4: Determining the equivalence of different instruments. If the state grants waivers to
school districts to use a range of observation and evaluation tools, it is imperative that evidence is collected concerning the equivalence of instruments. That is, it would be unacceptable for teachers in one district to be held to a standard that is higher or lower than another district. Thus, the state will also need to collect information to demonstrate the equivalence of judgments made using different tools.
Observations of teaching might seem simple to carry out. However, the council’s research makes clear the need to be vigilant in demanding the rigorous and accurate use of instruments that have also been field-tested, their reliability and implementation analyzed, and critically reviewed. Doing anything less would jeopardize the integrity of the entire process, limit the policy’s capacity to improve schooling for Michigan’s children, and compromise the entire reason for this initiative. Teacher Evaluation: Student Growth Model The central purpose of teaching is to help students learn, and student growth measures can provide valuable insights into teachers’ effectiveness in doing so, particularly when coupled with other measures of teaching efficacy. Given the central place that student learning holds in the initiative to develop an excellent educator evaluation system in Michigan, the MCEE is examining ways in which accounting for student growth can be effectively incorporated into the state’s approach to evaluating educators. As this brief update will illustrate, much work has been done on this important component and much work remains to be completed before any recommendations can be made.
Attachment 10.B
533

Michigan Council for Educator Effectiveness Interim Progress Report April 2012 Page 8 of 56
One of the first challenges for the MCEE has been to clarify exactly what is meant by “student growth.” Despite its apparent simplicity, it is actually a term that has taken on a range of meanings around the country. An early task of the council was to survey the field to understand different ways this term is being used in education policy. This review has included consulting with various experts in learning measurement and modeling, reviewing work done by other states, meeting with service providers, and consulting with local school districts. The council has found wide variance in the ways in which organizations describe student growth measurement. They differ in (1) the tests used to assess student growth, (2) the actual analytic techniques for quantifying student growth, and (3) the measures of value added by educators to student growth. These are based on different assumptions and vary in their accuracy and reliability. Each of these three is explained briefly below. Tests Used to Measure Student Growth The MCEE has reviewed a range of assessments that can be used to produce estimates of student growth. These include teacher-made assessments, state tests (such as the Michigan Educational Assessment Program, or MEAP), and national norm-referenced tests (such as Northwest Evaluation Association’s [NWEA] Measures of Academic Progress [MAP] or Scantron Performance Series). Specific characteristics of each assessment affect what it means to track students’ growth. Quantitative Measures of Student Growth The council’s investigations so far have allowed for a broad definition of student growth, including proxies for student growth (e.g., students’ percentile ranks conditioned on pretest scores), which are often used as measures of student progress. Measures of student growth and progress that are currently in use for accountability purposes around the U.S. vary from the simple to the statistically complex. Simple examples include:
Difference scores based on pre-test vs. post-test administrations of the same test in the same grade (not in use on a large scale).
Transition tables tracking student performance levels from one grade to the next (such as those used in Delaware, Iowa, Minnesota, and Michigan).
More complex examples include:
Difference scores based on pre- vs. post-test administrations, where the difficulty level of the test is calibrated on a vertical scale3 to individual students’ achievement levels at the time of the pre- or post-assessment (this approach is not in widespread use, but available through such instruments as the NWEA MAP).
Difference scores based on vertically scaled tests from one grade to the next (such as those used in some states with vertically scaled assessments).
Student growth percentile models such as those used in Arizona, Colorado, Indiana, and Massachusetts. In these models, percentile ranks of students’ post-test scores are given for students who started out with similar scores on the pre-test.
3 Vertical scales attempt to place test scores of students across grades on a common scale. For example, all students taking a particular test (regardless of grade) may fall on a vertical scale of 0 to 1000. Leveraging a common scale across grades is supposed to allow educators to compare student test score movement between adjacent grades as a way to estimate student growth. Thus, a helpful feature of vertical scales is that they allow the comparisons of test scores easily between grades. Vertical scales are not without their limitations, however. It is important to note that there is legitimate scholarly disagreement regarding the validity of vertical scales, and the council will need to consider these disagreements when making its recommendations.
Attachment 10.B
534
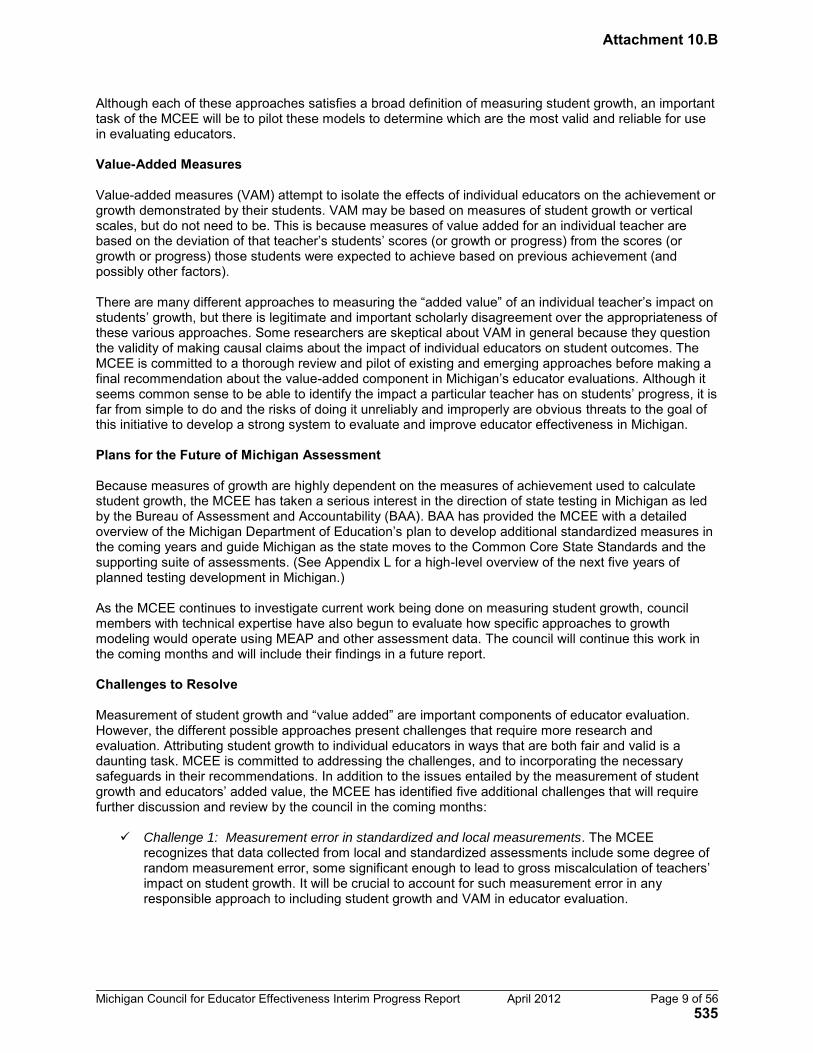
Michigan Council for Educator Effectiveness Interim Progress Report April 2012 Page 9 of 56
Although each of these approaches satisfies a broad definition of measuring student growth, an important task of the MCEE will be to pilot these models to determine which are the most valid and reliable for use in evaluating educators. Value-Added Measures Value-added measures (VAM) attempt to isolate the effects of individual educators on the achievement or growth demonstrated by their students. VAM may be based on measures of student growth or vertical scales, but do not need to be. This is because measures of value added for an individual teacher are based on the deviation of that teacher’s students’ scores (or growth or progress) from the scores (or growth or progress) those students were expected to achieve based on previous achievement (and possibly other factors). There are many different approaches to measuring the “added value” of an individual teacher’s impact on students’ growth, but there is legitimate and important scholarly disagreement over the appropriateness of these various approaches. Some researchers are skeptical about VAM in general because they question the validity of making causal claims about the impact of individual educators on student outcomes. The MCEE is committed to a thorough review and pilot of existing and emerging approaches before making a final recommendation about the value-added component in Michigan’s educator evaluations. Although it seems common sense to be able to identify the impact a particular teacher has on students’ progress, it is far from simple to do and the risks of doing it unreliably and improperly are obvious threats to the goal of this initiative to develop a strong system to evaluate and improve educator effectiveness in Michigan. Plans for the Future of Michigan Assessment Because measures of growth are highly dependent on the measures of achievement used to calculate student growth, the MCEE has taken a serious interest in the direction of state testing in Michigan as led by the Bureau of Assessment and Accountability (BAA). BAA has provided the MCEE with a detailed overview of the Michigan Department of Education’s plan to develop additional standardized measures in the coming years and guide Michigan as the state moves to the Common Core State Standards and the supporting suite of assessments. (See Appendix L for a high-level overview of the next five years of planned testing development in Michigan.) As the MCEE continues to investigate current work being done on measuring student growth, council members with technical expertise have also begun to evaluate how specific approaches to growth modeling would operate using MEAP and other assessment data. The council will continue this work in the coming months and will include their findings in a future report. Challenges to Resolve Measurement of student growth and “value added” are important components of educator evaluation. However, the different possible approaches present challenges that require more research and evaluation. Attributing student growth to individual educators in ways that are both fair and valid is a daunting task. MCEE is committed to addressing the challenges, and to incorporating the necessary safeguards in their recommendations. In addition to the issues entailed by the measurement of student growth and educators’ added value, the MCEE has identified five additional challenges that will require further discussion and review by the council in the coming months:
Challenge 1: Measurement error in standardized and local measurements. The MCEE recognizes that data collected from local and standardized assessments include some degree of random measurement error, some significant enough to lead to gross miscalculation of teachers’ impact on student growth. It will be crucial to account for such measurement error in any responsible approach to including student growth and VAM in educator evaluation.
Attachment 10.B
535

Michigan Council for Educator Effectiveness Interim Progress Report April 2012 Page 10 of 56
Challenge 2: Balancing fairness toward educators with fairness toward students. The MCEE recognizes that there are significant issues to consider regarding whether demographic information should be incorporated into the statistical models used for VAM. Including such information will result in different expectations for certain groups of students based on their backgrounds, which in turn may result in maintaining or even increasing achievement gaps. Although this is less fair to students, it is fairer to educators to take into account the background characteristics of their students in setting expectations for growth. Not including demographics in setting expectations for student growth is fairer toward students, but is less fair toward educators. It is important to design a system that balances fairness toward educators and students.
Challenge 3: Non-tested grades and subjects. Performing student growth calculations depends
on having good measures in place. Measuring growth in non-tested subjects, such as art, physical education, music, etc. is a significant issue for the MCEE to address in its recommendation. An additional issue is the fact that many teachers do not teach in grades that are tested.
Challenge 4: Tenuous roster connections between students and teachers. Fundamental to
describing a teacher’s influence on the learning outcomes of students is knowing which students he or she teaches, and to what degree each teacher is responsible for the instruction of each student. Based on discussions with local districts and state agencies, and national policy work, the MCEE recognizes that the student-teacher rostering relationship has a number of important challenges that need to be addressed. Repeatedly states have reported difficulties in simply determining which students were associated with which teachers.
Challenge 5: Number of years of data. Teachers’ assignments change regularly, some more than
others. Teachers’ work shifts as changes arise in their assignments to grade levels, subject areas, schools, and students. Instructional effectiveness must be geared to specifics of the context. Teachers also retire, while others enter the workforce. Like observations, assessments of value added are only as good as the data available, and for many teachers in tested grades and subject areas there is considerable variability in how many years of data are available.
In the coming months, the MCEE will continue to investigate these and other important issues as they relate to using student growth data to inform educator evaluation. Combining Observation and Student Growth Scores As this document has revealed, challenges exist in the selection of observational and student growth tools. The council has found that it is also important to consider carefully how values produced from observational and student growth tools are combined into a final evaluation score. The MCEE has reviewed the approach for combining evaluation scores in states such as New York, Ohio, Tennessee, Ohio, North Carolina, and Colorado. From these states’ teacher evaluation systems, two approaches have emerged: formulaic and rubric. In the formulaic approach (Tennessee and New York), inputs such as student growth and teacher observation are given weights and combined into a single teaching performance score by means of a formula. Combined scores are then mapped to a labeling scheme, which provides descriptions of teaching performance. For example, in New York 60 points of the evaluation are based on nationally recognized measures of teacher performance. The other 40 points are based on growth, giving a total possible of 100 points. The number of points a teacher earns is then mapped onto the following performance standards: Ineffective: 0 – 64 Developing: 65 – 74 Effective: 75 – 90 Highly Effective: 91 – 100
Attachment 10.B
536

Michigan Council for Educator Effectiveness Interim Progress Report April 2012 Page 11 of 56
Other states chose to use a rubric approach, where teacher observation data and student growth data are both independently mapped to standards of performance. For example, teachers may score a 5 in student growth, but only a 1 from observations of their teaching. The two scores are mapped to a rubric to determine the overall evaluation rating (“Partially Effective”). The rubric below is an illustrative example provided by Colorado:
Each of these approaches to combining scores presents challenges and opportunities. Naturally, a constraint of the rubric approach is that it is best applied to evaluation systems that equally weight two components (such as observation and growth). However, the rubric approach has intuitive appeal to educators, and is likely easier to understand than a formulaic approach. Approaches that use a formula are fairly flexible in their weighting and the number of factors employed, but may communicate a false degree of precision. The MCEE considers the combining of component scores to be an important challenge that requires more discussion. Other Potential Components of the Educator Evaluation System Observations and student test scores are only two of the components of educator evaluation systems that are being developed. Other components include documents that support the observations, as well as other materials contributed by teachers, principals, students, or parents. Among the other components used in other states are the following:
Pre-observation conferences Post-observation conferences Summative evaluation conferences Teacher self-assessments Professional accountabilities (e.g., National Heritage Academies’ mid- and year-end evaluations) Educator growth plans (developed by teachers or administrators) Locally developed assessments of student learning Structured review of student work Teacher artifacts using portfolio or evidence binder processes Feedback from students, parents, and/or other teachers using structured survey tools Teacher self-reflection and progress on professional growth goals
The MCEE will continue to consider the other components that should be included in Michigan’s educator evaluation system.
Attachment 10.B
537
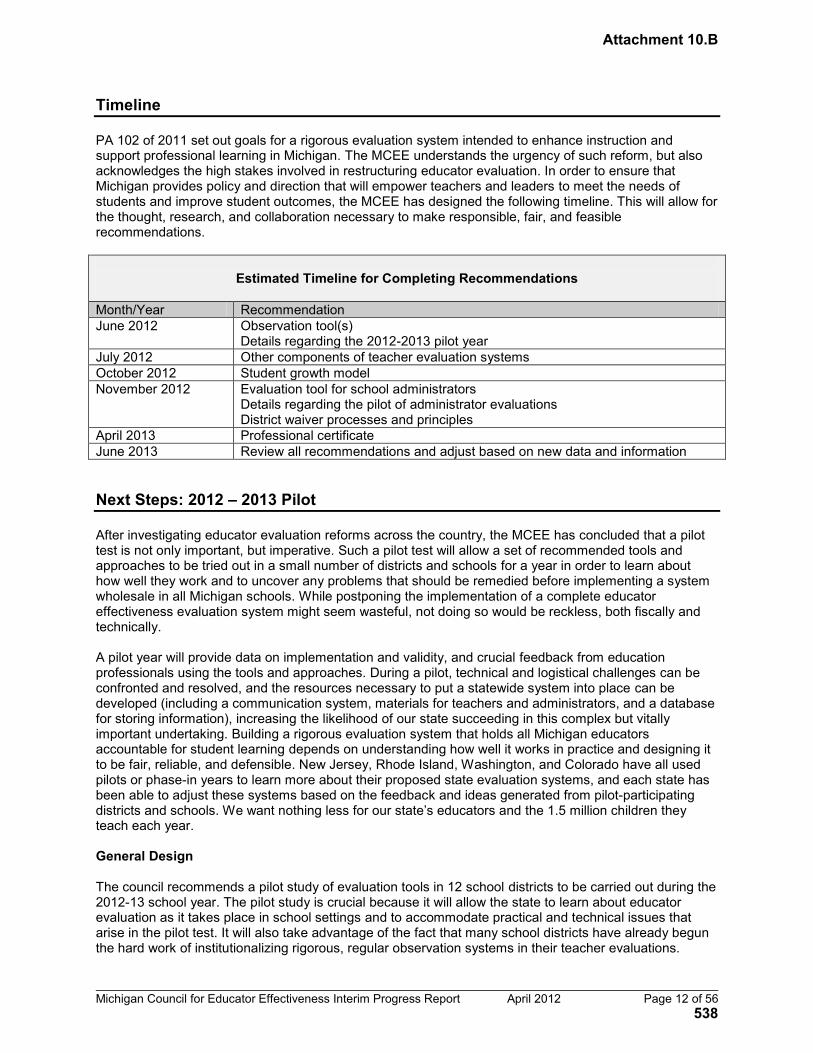
Michigan Council for Educator Effectiveness Interim Progress Report April 2012 Page 12 of 56
Timeline PA 102 of 2011 set out goals for a rigorous evaluation system intended to enhance instruction and support professional learning in Michigan. The MCEE understands the urgency of such reform, but also acknowledges the high stakes involved in restructuring educator evaluation. In order to ensure that Michigan provides policy and direction that will empower teachers and leaders to meet the needs of students and improve student outcomes, the MCEE has designed the following timeline. This will allow for the thought, research, and collaboration necessary to make responsible, fair, and feasible recommendations.
Estimated Timeline for Completing Recommendations Month/Year Recommendation June 2012 Observation tool(s)
Details regarding the 2012-2013 pilot year July 2012 Other components of teacher evaluation systems October 2012 Student growth model November 2012 Evaluation tool for school administrators
Details regarding the pilot of administrator evaluations District waiver processes and principles
April 2013 Professional certificate June 2013 Review all recommendations and adjust based on new data and information Next Steps: 2012 – 2013 Pilot After investigating educator evaluation reforms across the country, the MCEE has concluded that a pilot test is not only important, but imperative. Such a pilot test will allow a set of recommended tools and approaches to be tried out in a small number of districts and schools for a year in order to learn about how well they work and to uncover any problems that should be remedied before implementing a system wholesale in all Michigan schools. While postponing the implementation of a complete educator effectiveness evaluation system might seem wasteful, not doing so would be reckless, both fiscally and technically. A pilot year will provide data on implementation and validity, and crucial feedback from education professionals using the tools and approaches. During a pilot, technical and logistical challenges can be confronted and resolved, and the resources necessary to put a statewide system into place can be developed (including a communication system, materials for teachers and administrators, and a database for storing information), increasing the likelihood of our state succeeding in this complex but vitally important undertaking. Building a rigorous evaluation system that holds all Michigan educators accountable for student learning depends on understanding how well it works in practice and designing it to be fair, reliable, and defensible. New Jersey, Rhode Island, Washington, and Colorado have all used pilots or phase-in years to learn more about their proposed state evaluation systems, and each state has been able to adjust these systems based on the feedback and ideas generated from pilot-participating districts and schools. We want nothing less for our state’s educators and the 1.5 million children they teach each year. General Design The council recommends a pilot study of evaluation tools in 12 school districts to be carried out during the 2012-13 school year. The pilot study is crucial because it will allow the state to learn about educator evaluation as it takes place in school settings and to accommodate practical and technical issues that arise in the pilot test. It will also take advantage of the fact that many school districts have already begun the hard work of institutionalizing rigorous, regular observation systems in their teacher evaluations.
Attachment 10.B
538
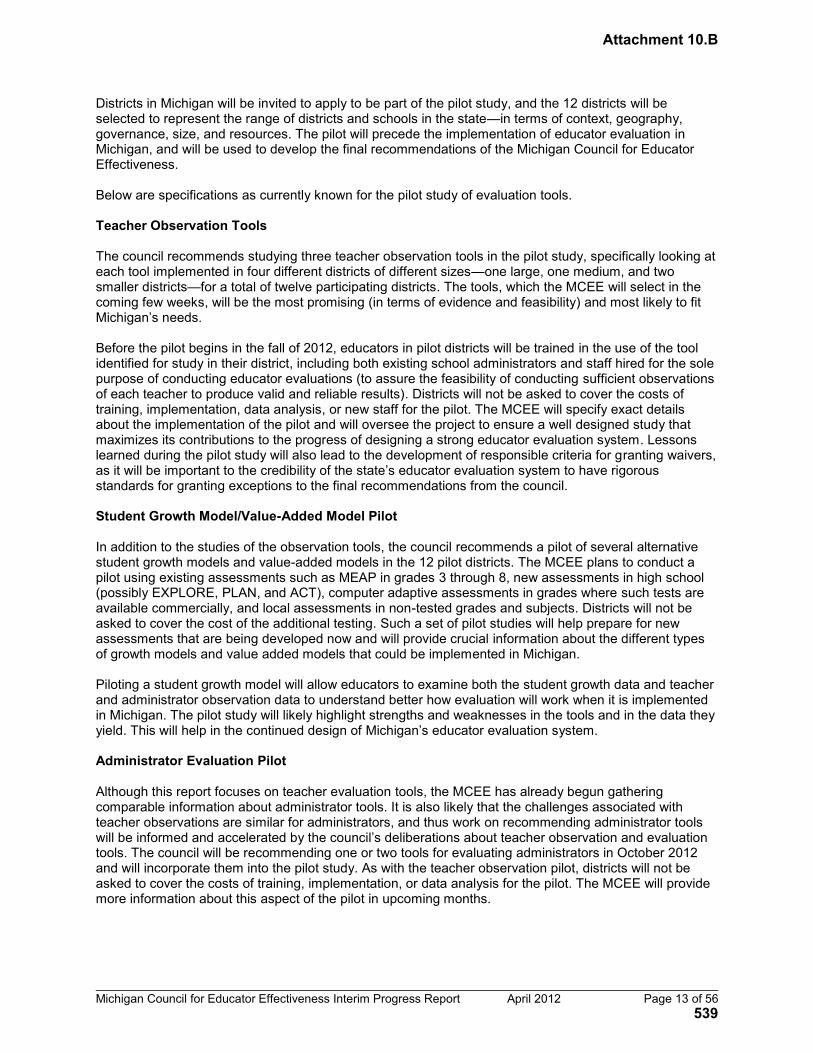
Michigan Council for Educator Effectiveness Interim Progress Report April 2012 Page 13 of 56
Districts in Michigan will be invited to apply to be part of the pilot study, and the 12 districts will be selected to represent the range of districts and schools in the state—in terms of context, geography, governance, size, and resources. The pilot will precede the implementation of educator evaluation in Michigan, and will be used to develop the final recommendations of the Michigan Council for Educator Effectiveness. Below are specifications as currently known for the pilot study of evaluation tools. Teacher Observation Tools The council recommends studying three teacher observation tools in the pilot study, specifically looking at each tool implemented in four different districts of different sizes—one large, one medium, and two smaller districts—for a total of twelve participating districts. The tools, which the MCEE will select in the coming few weeks, will be the most promising (in terms of evidence and feasibility) and most likely to fit Michigan’s needs. Before the pilot begins in the fall of 2012, educators in pilot districts will be trained in the use of the tool identified for study in their district, including both existing school administrators and staff hired for the sole purpose of conducting educator evaluations (to assure the feasibility of conducting sufficient observations of each teacher to produce valid and reliable results). Districts will not be asked to cover the costs of training, implementation, data analysis, or new staff for the pilot. The MCEE will specify exact details about the implementation of the pilot and will oversee the project to ensure a well designed study that maximizes its contributions to the progress of designing a strong educator evaluation system. Lessons learned during the pilot study will also lead to the development of responsible criteria for granting waivers, as it will be important to the credibility of the state’s educator evaluation system to have rigorous standards for granting exceptions to the final recommendations from the council. Student Growth Model/Value-Added Model Pilot In addition to the studies of the observation tools, the council recommends a pilot of several alternative student growth models and value-added models in the 12 pilot districts. The MCEE plans to conduct a pilot using existing assessments such as MEAP in grades 3 through 8, new assessments in high school (possibly EXPLORE, PLAN, and ACT), computer adaptive assessments in grades where such tests are available commercially, and local assessments in non-tested grades and subjects. Districts will not be asked to cover the cost of the additional testing. Such a set of pilot studies will help prepare for new assessments that are being developed now and will provide crucial information about the different types of growth models and value added models that could be implemented in Michigan. Piloting a student growth model will allow educators to examine both the student growth data and teacher and administrator observation data to understand better how evaluation will work when it is implemented in Michigan. The pilot study will likely highlight strengths and weaknesses in the tools and in the data they yield. This will help in the continued design of Michigan’s educator evaluation system. Administrator Evaluation Pilot Although this report focuses on teacher evaluation tools, the MCEE has already begun gathering comparable information about administrator tools. It is also likely that the challenges associated with teacher observations are similar for administrators, and thus work on recommending administrator tools will be informed and accelerated by the council’s deliberations about teacher observation and evaluation tools. The council will be recommending one or two tools for evaluating administrators in October 2012 and will incorporate them into the pilot study. As with the teacher observation pilot, districts will not be asked to cover the costs of training, implementation, or data analysis for the pilot. The MCEE will provide more information about this aspect of the pilot in upcoming months.
Attachment 10.B
539
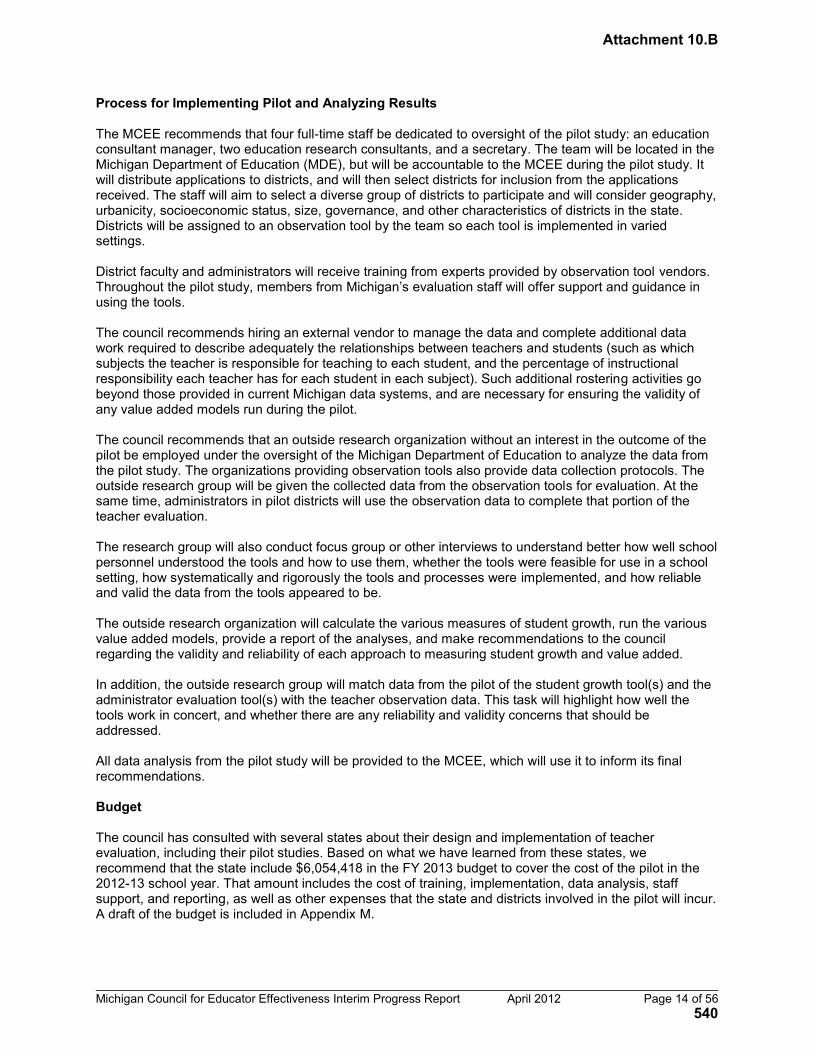
Michigan Council for Educator Effectiveness Interim Progress Report April 2012 Page 14 of 56
Process for Implementing Pilot and Analyzing Results The MCEE recommends that four full-time staff be dedicated to oversight of the pilot study: an education consultant manager, two education research consultants, and a secretary. The team will be located in the Michigan Department of Education (MDE), but will be accountable to the MCEE during the pilot study. It will distribute applications to districts, and will then select districts for inclusion from the applications received. The staff will aim to select a diverse group of districts to participate and will consider geography, urbanicity, socioeconomic status, size, governance, and other characteristics of districts in the state. Districts will be assigned to an observation tool by the team so each tool is implemented in varied settings. District faculty and administrators will receive training from experts provided by observation tool vendors. Throughout the pilot study, members from Michigan’s evaluation staff will offer support and guidance in using the tools. The council recommends hiring an external vendor to manage the data and complete additional data work required to describe adequately the relationships between teachers and students (such as which subjects the teacher is responsible for teaching to each student, and the percentage of instructional responsibility each teacher has for each student in each subject). Such additional rostering activities go beyond those provided in current Michigan data systems, and are necessary for ensuring the validity of any value added models run during the pilot. The council recommends that an outside research organization without an interest in the outcome of the pilot be employed under the oversight of the Michigan Department of Education to analyze the data from the pilot study. The organizations providing observation tools also provide data collection protocols. The outside research group will be given the collected data from the observation tools for evaluation. At the same time, administrators in pilot districts will use the observation data to complete that portion of the teacher evaluation. The research group will also conduct focus group or other interviews to understand better how well school personnel understood the tools and how to use them, whether the tools were feasible for use in a school setting, how systematically and rigorously the tools and processes were implemented, and how reliable and valid the data from the tools appeared to be. The outside research organization will calculate the various measures of student growth, run the various value added models, provide a report of the analyses, and make recommendations to the council regarding the validity and reliability of each approach to measuring student growth and value added. In addition, the outside research group will match data from the pilot of the student growth tool(s) and the administrator evaluation tool(s) with the teacher observation data. This task will highlight how well the tools work in concert, and whether there are any reliability and validity concerns that should be addressed. All data analysis from the pilot study will be provided to the MCEE, which will use it to inform its final recommendations. Budget The council has consulted with several states about their design and implementation of teacher evaluation, including their pilot studies. Based on what we have learned from these states, we recommend that the state include $6,054,418 in the FY 2013 budget to cover the cost of the pilot in the 2012-13 school year. That amount includes the cost of training, implementation, data analysis, staff support, and reporting, as well as other expenses that the state and districts involved in the pilot will incur. A draft of the budget is included in Appendix M.
Attachment 10.B
540
Michigan Council for Educator Effectiveness Interim Progress Report April 2012 Page 15 of 56
Looking Forward Evidence shows that skillful instruction can dramatically increase the probability that students will learn. Such teaching is sensitive to students’ environments, good at buffering interferences, and adept at promoting students’ academic engagement as well as their social and emotional development. Being able to achieve our ambitious educational agenda in this state depends on building and supporting a system that can ensure that the teachers who serve in our classrooms have the requisite professional skills and know how to use them with the diversity of Michigan’s 1.5 million schoolchildren. As such, the charge presented to the MCEE is ambitious and historically significant, as it could lead to revolutionary changes in how educators are evaluated in Michigan. The council is committed to moving firmly but responsibly on this charge and to learning from other states and from knowledgeable experts about how to create the infrastructure, procedures, and tools necessary to create a fair, transparent, and feasible new system. At work now for just four full months, the MCEE has made major strides in understanding the issues and learning about resources, tools, and systems that can inform the development of Michigan’s system. The council’s ambitious timeline will advance this work with due speed and carefulness across the coming months. The pilot study will help to provide crucial information, and the ongoing investigations and contacts will supply other vital resources for meeting the charge of the MCEE. The council appreciates the broad support that it has received from stakeholders across the state and looks forward to the next stage of the work.
Attachment 10.B
541

Michigan Council for Educator Effectiveness Interim Progress Report April 2012 Page 16 of 56
Appendix A: Council Members’ Biographies Deborah Loewenberg Ball, Chair Deborah Loewenberg Ball is the William H. Payne Collegiate Professor in education at the University of Michigan, and an Arthur F. Thurnau Professor. She currently serves as dean of the School of Education and as director of a new organization called TeachingWorks. She taught elementary school for more than 15 years, and continues to teach mathematics to elementary students every summer. Ball’s research focuses on the practice of mathematics instruction, and on the improvement of teacher training and development. She is an expert on teacher education, with a particular interest in how professional training and experience combine to equip beginning teachers with the skills and knowledge needed for responsible practice. Ball has served on several national and international commissions and panels focused on policy initiatives and the improvement of education, including the National Mathematics Advisory Panel (appointed by President George W. Bush) and the National Board for Education Sciences (appointed by President Barack Obama). Jennifer Hammond Jennifer Hammond is the principal of Grand Blanc High School. She previously served as a teacher and administrator at schools in Troy, Hamtramck, and also in Houston, Texas. Hammond earned a bachelor's degree and certificate in secondary teaching from Michigan State University, a master's degree in mathematics education from Wayne State University, an educational specialist degree in school administration from Oakland University, and a doctorate in philosophy of educational leadership from Oakland University. Joseph Martineau Joseph Martineau is the executive director of the Bureau of Assessment & Accountability in the Michigan Department of Education. He has served in the Michigan Department of Education as a psychometrican, manager of large-scale assessment programs, and director of state testing and accountability. He also serves as a member of the board of the National Council on Measurement in Education, and on the executive committee of the Smarter Balanced Assessment Consortium. Martineau earned a bachelor's degree in linguistics and a master's degree in instructional design from Brigham Young University and a doctorate from Michigan State University. Martineau serves on the council as a non-voting member. Mark Reckase Mark Reckase is a professor in the measurement and quantitative methods program within the Counseling, Educational Psychology, and Special Education Department of the College of Education at Michigan State University. He worked for 17 years at ACT Inc., a college admission testing company and was a faculty member at the University of Missouri-Columbia. Reckase also served as the vice president of the American Educational Research Association and the president of the National Council of Measurement in Education. He earned a bachelor's degree in psychology from the University of Illinois, and a master's degree and doctorate in psychology from Syracuse University. Nicholas Sheltrown Nicholas Sheltrown is director of measurement, research, and accountability at National Heritage Academics in Grand Rapids. He manages the measurement and research initiatives for a network of 71 charter schools with over 40,000 students. Sheltrown previously served as director of research and measurement at Grand Valley State University, the technology director at Byron Center Public Schools and vice president of professional development at ST Concepts Inc. in Byron Center. He earned a bachelor's degree in mathematics from Cornerstone University, and a master's degree in curriculum and teaching and a doctorate from Michigan State University. David Vensel David Vensel is the principal of Jefferson High School in Monroe. He previously served as a teacher and assistant high school principal at Airport High School in Carleton. He earned a bachelor's degree in sociology from Eastern Michigan University and master's degree in American history and secondary education from the University of Toledo. Bios taken from: http://www.michigan.gov/snyder/0,4668,7-277-57577-262871--,00.html
Attachment 10.B
542

Michigan Council for Educator Effectiveness Interim Progress Report April 2012 Page 17 of 56
Appendix B: Annotated Meeting Agendas
Governor’s Council on Educator Effectiveness Wednesday, December 7, 2011 • 2:00 – 5:00 p.m.
Lansing, Michigan CLOSED SESSION: George W. Romney Building • 111 S. Capitol Ave.
AGENDA
Council members present: Deborah Ball, Jenny Hammond, Joseph Martineau, Nick Sheltrown, Dave Vensel 2:00 – 2:30 Welcome, introductions, and preview of charge
Council members introduce themselves and share brief details about the expertise they bring to the work of the Governor’s Council. Deborah Loewenberg Ball previews the work of the coming months. Notes: The word “tool” does not necessarily mean that we will suggest one tool, but that we will develop principles that guide the legislature. The GCEE is contributing to the infrastructure for training, development, and evaluation of teachers. A checklist is not sufficient to measure effectiveness. The GCEE agrees that it is very important to build consensus around this work.
2:30 – 3:00 Framing: The challenges of teacher evaluation What are the greatest challenges in developing principles for a teacher evaluation system? Notes: The legislation makes this a political charge. Perhaps the council can encourage less partisan features of the legislation.
3:00 – 3:20 Review council curriculum and procedures and finalize meeting schedule
3:20 – 3:30 Move to Capitol Building PUBLIC SESSION: Capitol Building • 100 N. Capitol Ave. • Rooms 402 and 403 3:30 – 3:40 Review of charge and introduction of council members
Deborah Loewenberg Ball reads the official charge of the Governor’s Council. Council members introduce themselves to invited speakers and guests.
3:40 – 4:40 Prepared remarks from invited speakers Representatives from key groups who have a stake in the work of the council make brief prepared statements. They include: Phil Pavlov, Senator, 25th District; Chair, Senate Education Committee Paul Scott, former Representative, 51st District Debbie Squires, Associate Director, Michigan Elementary and Middle School Principals
Association James N. Goenner, President & CEO, National Charter Schools Institute Dan Quisenberry, President, Michigan Association of Public School Academies Brad Biladeau, Associate Executive for Government Relations, Michigan Association of
School Administrators Jim Ballard, Executive Director, Michigan Association of Secondary School Principals (or
alternate) Amber Arellano, Executive Director, The Education Trust-Midwest Chad Aldis, State Director, StudentsFirst Dan Varner, CEO, Excellent Schools Detroit Louise Somalski, Legislative Coordinator, AFT Michigan Art Przybylowicz, Associate Executive Director and General Counsel, Michigan Education
Association
Attachment 10.B
543

Michigan Council for Educator Effectiveness Interim Progress Report April 2012 Page 18 of 56
Notes: Speakers suggested creating a fair, transparent, valid, and reliable system. Empower principals to become instructional leaders, and use evaluation as a development tool. Study what other states have implemented and learn from them.
4:40 – 5:00 Public remarks Open the floor for brief remarks from others in attendance.
Next meeting Wednesday, December 14, 2011 2:00 – 5:00 p.m. University of Michigan School of Education (610 E. University Avenue, Ann Arbor)
Attachment 10.B
544
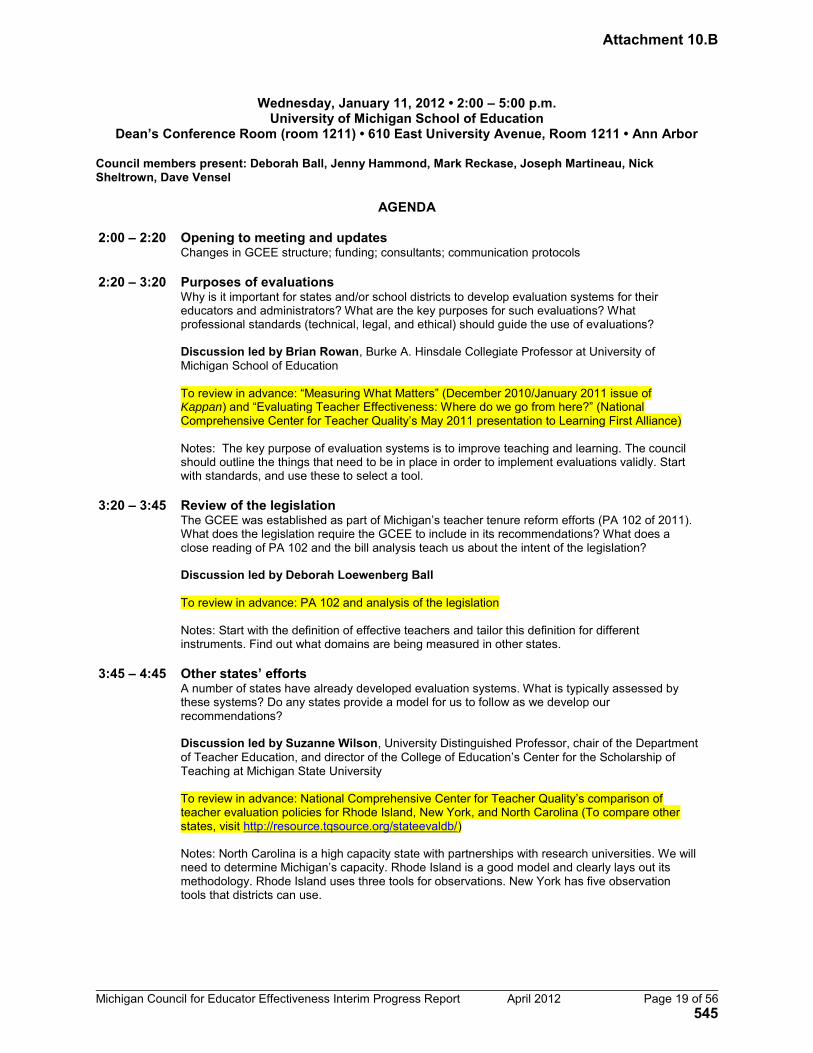
Michigan Council for Educator Effectiveness Interim Progress Report April 2012 Page 19 of 56
Wednesday, January 11, 2012 • 2:00 – 5:00 p.m. University of Michigan School of Education
Dean’s Conference Room (room 1211) • 610 East University Avenue, Room 1211 • Ann Arbor
Council members present: Deborah Ball, Jenny Hammond, Mark Reckase, Joseph Martineau, Nick Sheltrown, Dave Vensel
AGENDA
2:00 – 2:20 Opening to meeting and updates
Changes in GCEE structure; funding; consultants; communication protocols
2:20 – 3:20 Purposes of evaluations Why is it important for states and/or school districts to develop evaluation systems for their educators and administrators? What are the key purposes for such evaluations? What professional standards (technical, legal, and ethical) should guide the use of evaluations? Discussion led by Brian Rowan, Burke A. Hinsdale Collegiate Professor at University of Michigan School of Education To review in advance: “Measuring What Matters” (December 2010/January 2011 issue of Kappan) and “Evaluating Teacher Effectiveness: Where do we go from here?” (National Comprehensive Center for Teacher Quality’s May 2011 presentation to Learning First Alliance) Notes: The key purpose of evaluation systems is to improve teaching and learning. The council should outline the things that need to be in place in order to implement evaluations validly. Start with standards, and use these to select a tool.
3:20 – 3:45 Review of the legislation The GCEE was established as part of Michigan’s teacher tenure reform efforts (PA 102 of 2011). What does the legislation require the GCEE to include in its recommendations? What does a close reading of PA 102 and the bill analysis teach us about the intent of the legislation? Discussion led by Deborah Loewenberg Ball To review in advance: PA 102 and analysis of the legislation Notes: Start with the definition of effective teachers and tailor this definition for different instruments. Find out what domains are being measured in other states.
3:45 – 4:45 Other states’ efforts A number of states have already developed evaluation systems. What is typically assessed by these systems? Do any states provide a model for us to follow as we develop our recommendations? Discussion led by Suzanne Wilson, University Distinguished Professor, chair of the Department of Teacher Education, and director of the College of Education’s Center for the Scholarship of Teaching at Michigan State University To review in advance: National Comprehensive Center for Teacher Quality’s comparison of teacher evaluation policies for Rhode Island, New York, and North Carolina (To compare other states, visit http://resource.tqsource.org/stateevaldb/) Notes: North Carolina is a high capacity state with partnerships with research universities. We will need to determine Michigan’s capacity. Rhode Island is a good model and clearly lays out its methodology. Rhode Island uses three tools for observations. New York has five observation tools that districts can use.
Attachment 10.B
545
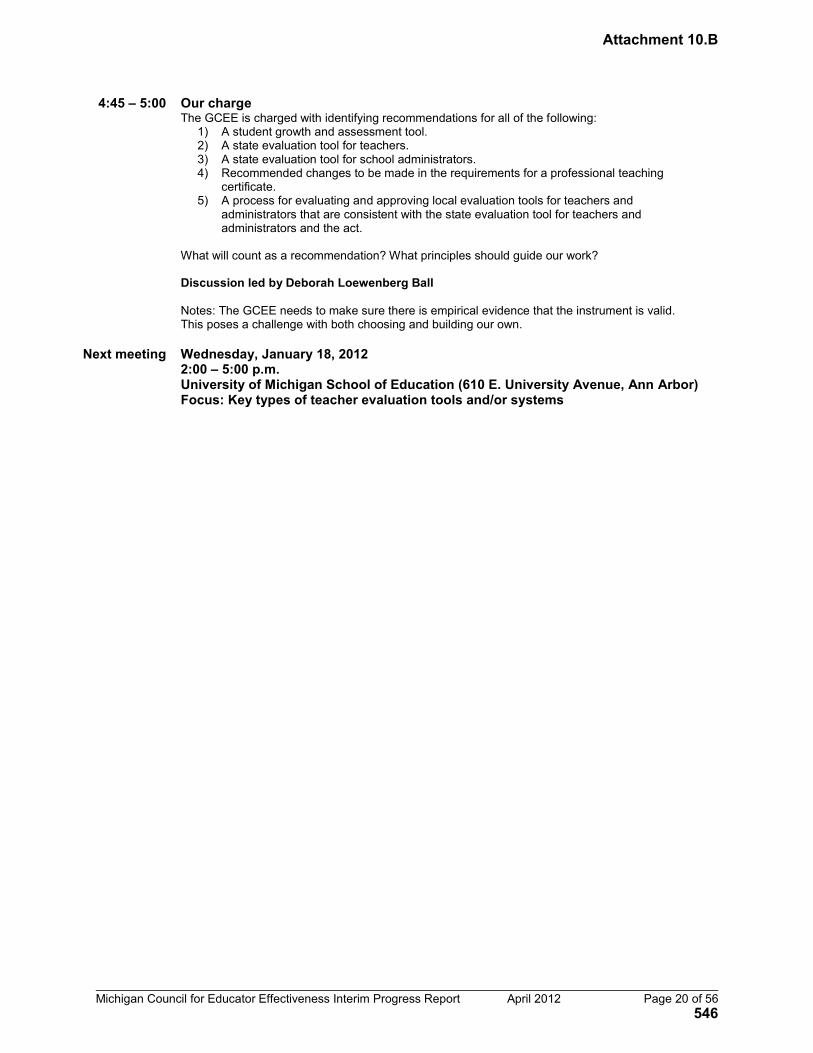
Michigan Council for Educator Effectiveness Interim Progress Report April 2012 Page 20 of 56
4:45 – 5:00 Our charge The GCEE is charged with identifying recommendations for all of the following:
1) A student growth and assessment tool. 2) A state evaluation tool for teachers. 3) A state evaluation tool for school administrators. 4) Recommended changes to be made in the requirements for a professional teaching
certificate. 5) A process for evaluating and approving local evaluation tools for teachers and
administrators that are consistent with the state evaluation tool for teachers and administrators and the act.
What will count as a recommendation? What principles should guide our work? Discussion led by Deborah Loewenberg Ball Notes: The GCEE needs to make sure there is empirical evidence that the instrument is valid. This poses a challenge with both choosing and building our own.
Next meeting Wednesday, January 18, 2012
2:00 – 5:00 p.m. University of Michigan School of Education (610 E. University Avenue, Ann Arbor) Focus: Key types of teacher evaluation tools and/or systems
Attachment 10.B
546

Michigan Council for Educator Effectiveness Interim Progress Report April 2012 Page 21 of 56
Governor’s Council on Educator Effectiveness Wednesday, January 18, 2012 • 2:00 – 4:00 p.m.
University of Michigan School of Education Dean’s Conference Room • 610 East University Avenue, Room 1211 • Ann Arbor
Council members present: Deborah Ball, Jenny Hammond, Mark Reckase, Joseph Martineau, Nick Sheltrown, Dave Vensel
AGENDA
2:00 – 2:10 Opening to meeting and updates
2:10 – 2:40 Walkthrough tool used at Monroe Public Schools
Presentation by Julie Everly, assistant superintendent for elementary education, and Ryan McLeod, assistant superintendent for secondary education, Monroe Public Schools Notes: Monroe Public Schools has an iPad walkthrough tool for observations. Tools prompt district level “look fors” and allow others to be added at the school level. MPS will be drafting a rubric based walk-through tool next in order to get away from the yes/no model. The district asks principals to do ten walk-throughs each week. This model allows immediate feedback for teachers.
2:40 – 3:15 Two rubrics: Danielson and Marshall Compare and contrast the two rubrics. Where are the overlaps? What’s missing? How do they align with the chart Brian presented at the January 11 meeting? Discussion led by Brian Rowan, Burke A. Hinsdale Collegiate Professor at University of Michigan School of Education To review in advance (IN DROPBOX):
Charlotte Danielson’s Framework for Teaching (2011 Revised Edition) Kim Marshall’s Teacher Evaluation Rubrics (revised September 4, 2010)
Notes: Marshall doesn’t use evidence, only judgment. Danielson has a statement of standards and is well developed and elaborated. According to the MET study, observation tools should define expectations for teachers, ensure observer accuracy, ensure reliability of results, and determine alignment of outcomes. Ensuring accuracy of observers is a huge challenge, but MET recommends that teachers be trained and certified.
3:15 – 4:00 Three models: North Carolina, Rhode Island, and Washington, D.C.: Compare and contrast the three models. Where are the overlaps? What’s missing? How well do they address some of the concerns placed in the “parking lot” at the January 11 meeting (e.g., reliability of data, transparency of process, validity of instrument, application to untested grades and subjects)? Discussion led by Suzanne Wilson, University Distinguished Professor, chair of the Department of Teacher Education, and director of the College of Education’s Center for the Scholarship of Teaching at Michigan State University To review in advance (IN DROPBOX):
North Carolina Teacher Evaluation Process The Rhode Island Model: Guide to Evaluating Building Administrators and Teachers
(2011-2012) IMPACT: The District of Columbia Public Schools Effectiveness Assessment System for
School-Based Personnel (Group 1: General Education Teachers with Individual Value-Added Student Achievement Data)
IMPACT: The District of Columbia Public Schools Effectiveness Assessment System for School-Based Personnel (Group 2: General Education Teachers without Individual Value-Added Student Achievement Data)
Attachment 10.B
547

Michigan Council for Educator Effectiveness Interim Progress Report April 2012 Page 22 of 56
Notes: Washington, D.C. model is concrete and describes behaviors and examples in depth. North Carolina looks like National Board and focuses on teachers as leaders. Rhode Island seems oriented toward developing over time and learning.
Next meeting Wednesday, February 8, 2012
2:00 – 5:00 p.m. University of Michigan School of Education (610 E. University Avenue, Ann Arbor)
Attachment 10.B
548
Michigan Council for Educator Effectiveness Interim Progress Report April 2012 Page 23 of 56
Governor’s Council on Educator Effectiveness Wednesday, February 8, 2012 • 2:00 – 5:00 p.m.
University of Michigan School of Education Dean’s Conference Room • 610 East University Avenue, Room 1211 • Ann Arbor
Council members present: Deborah Ball, Jenny Hammond, Joseph Martineau, Nick Sheltrown, Dave Vensel
AGENDA 2:00 – 2:10 Opening to meeting and updates
2:10 – 3:10 Big issues
What big issues or questions need to be addressed before we can make any recommendations about principles or tools for evaluation? We have already begun building a “parking lot” for these that includes things like access to data, transparency, and validating evaluation instruments. What other big categories do we need to consider? What fundamental questions concern you most about this work? Notes: Council members’ questions include: How do we deal with the differences in context, level, and subject matter? Are we developing our own tool, or are we looking for a tool or approach that is already developed? To whom do our recommendations apply? How do we communicate with the legislature, teacher organizations, and others? Regarding the student growth tool, what is the metric? Some next steps are to create a vision statement, continue to look into what other states have done, and continue to research existing tools.
3:10 – 3:40 Guiding principles At our first meeting, I said that any recommendation that we make needs to be valid, fair, useful, and feasible. Are there other principles that should guide our work?
3:40 – 4:10 Learning from experts What two or three things are you most needing to learn about from consultants or each other to do this work responsibly? Do you have suggestions for experts we could bring in to guide some of that learning?
4:10 – 5:00 Advisory Committee What role do you envision for the soon-to-be-appointed advisory committee of teachers, administrators, and parents? Notes: The Advisory Committee can identify the concerns and expectations that they have; this could give the GCEE insight into what others are worrying about and hoping for. The Advisory Committee could develop a plan to learn about what a subset of districts is doing now, and use that to inform a list of components that they believe should be included in an evaluation system. The GCEE needs to learn how best to work with the Advisory Committee.
Next meeting Monday, February 13, 2012
2:00 – 5:00 p.m. University of Michigan School of Education (610 E. University Avenue, Ann Arbor)
Attachment 10.B
549
Michigan Council for Educator Effectiveness Interim Progress Report April 2012 Page 24 of 56
Governor’s Council on Educator Effectiveness Thursday, February 13, 2012 • 2:00 p.m. – 5:00 p.m.
University of Michigan School of Education Dean’s Conference Room • 610 East University Avenue, Room 1211 • Ann Arbor
Council members present: Deborah Ball, Jenny Hammond, Mark Reckase, Joseph Martineau, Nick Sheltrown, Dave Vensel
AGENDA
2:00 – 2:10 Opening to meeting and updates
2:10 – 5:00 VAM team and observation tool team conduct small group work
Attachment 10.B
550

Michigan Council for Educator Effectiveness Interim Progress Report April 2012 Page 25 of 56
Governor’s Council on Educator Effectiveness Thursday, February 16, 2012 • 9:00 a.m. – 12:00 p.m.
University of Michigan School of Education Dean’s Conference Room • 610 East University Avenue, Room 1211 • Ann Arbor
Council members Present: Deborah Ball, Jenny Hammond, Joseph Martineau, Nick Sheltrown, Dave Vensel
AGENDA
9:00 – 9:10 Opening to meeting and updates
9:10 – 9:20 Timeline for deliverables and resulting political tensions
Discuss concerns we have heard from some legislators regarding a revised timeline that allows us to complete our work by the end of the calendar year. Consider strategies for addressing concerns. Notes: The council decided that the timeline for deliverables needs to be extended in order to make responsible recommendations. Deborah could make this proposal at her March 1 meeting.
9:20 – 9:45 Communication strategies and guidelines Review and comment on vision statement drafted by Jenny and Dave. Discuss key talking points, protocols for media requests and other official communications on behalf of the council, meetings with key stakeholder groups, etc. To review in advance (in Dropbox): Draft vision statement
9:45 – 10:00 Timing of statewide student tests Discuss the benefits and drawbacks of administering statewide tests (e.g., MEAP, ACT, MME) in the spring Notes: MEAP will move online and to the spring in 2014-15. The state could provide some funding to do benchmark/periodic assessments in non-tested grades and subjects. MCEE will continue to consider assessment timelines and their alignment with evaluation recommendations.
10:00 – 11:15 Work in small groups
11:15 – 12:00 Presentation by David Hecker, president, Education Alliance of Michigan Notes: Districts will need a lot of support to use valid and reliable assessments in all content areas. The council must have a mobility standard; many classrooms, especially in urban districts, change composition over the course of the year. The GCEE should consider using peer reviews, portfolios, and self-assessments.
Next meeting Tuesday, February 21, 2012
2:00 – 5:00 p.m. University of Michigan School of Education (610 E. University Avenue, Ann Arbor) Note: Dan McCaffrey, PNC Chair in Policy Analysis and senior statistician at RAND Corporation, will be presenting the Frank B. Womer Lecture at the School of Education from 12:00 to 1:30 p.m. Governor’s Council members are invited to attend.
Attachment 10.B
551
Michigan Council for Educator Effectiveness Interim Progress Report April 2012 Page 26 of 56
Governor’s Council on Educator Effectiveness Tuesday, February 21, 2012 • 2:00 – 5:00 p.m. University of Michigan School of Education
Dean’s Conference Room • 610 East University Avenue, Room 1211 • Ann Arbor
Council members present: Deborah Ball, Jenny Hammond, Mark Reckase, Joseph Martineau, Nick Sheltrown, Dave Vensel
AGENDA
12:00 – 1:30 Daniel F. McCaffrey presents the 2012 Frank B. Womer Lecture in Measurement and Assessment Dan McCaffrey, PNC Chair in Policy Analysis and senior statistician at RAND Corporation will present his talk, “Can Paying Teachers for Performance Improve Student Achievement? Results from Three Random Assignment Evaluations.” All GCEE members are invited. His talk will take place in the Prechter Laboratory (room 2202) in the School of Education. A light lunch will be served. For more information, see: http://soe.umich.edu/news_events/events/detail/womer_lecture_daniel_mccaffrey/) NOTE: Dan McCaffrey will join us for the GCEE meeting after his talk and answer questions we have about value-added modeling and other student growth models. Nick and Joseph prepared some questions in advance, which are included on this agenda. Please feel free to bring your own questions to the meeting.
2:00 – 2:10 Opening to meeting and updates Proposal to hire GCEE project manager
2:10 – 3:10 Introduction to value-added modeling (VAM) What technically qualifies a model to be value-added? What minimum characteristics must a
model have to be considered a value-added model? What is the simplest value-added model that could be used responsibly in educator
evaluation? What factors should we consider when selecting a value-added model? What potential benefits does VAM present to a teacher evaluation system? What are the potential pitfalls? To review in advance (in Dropbox): Daniel Koretz’s 2008 American Educator article, “A Measured Approach” Notes: There is no universal definition of VAM, but there are components that everyone agrees is a part of VAM (e.g. this year’s scores regressed against last year’s and the year’s before with a consideration for demographics). Dan suggests: regress the current year score on some set of prior year scores, account for error in prior scores, add aggregated scores at classroom level to control for peers.
3:10 – 4:10 Using VAM to evaluate and improve instruction How would you suggest value-added data be incorporated in a teacher evaluation system? What advice would you give practicing educators who must incorporate VAM in an overall
evaluation? How would you recommend using VAM to provide feedback to teachers to help them improve
instruction? Most VAMs compare teachers against the average teacher effect, but how do you know if the
average teacher is effective? How much does choice in what VAM model you select influence things like teacher ranking
and evaluation? What do you think about the role of “growth toward a standard” models?
Attachment 10.B
552

Michigan Council for Educator Effectiveness Interim Progress Report April 2012 Page 27 of 56
4:10 – 5:00 VAM data integrity and reliability What is a simple design that doesn't require additional data collection to test the effect of a
VAM-based system in the state (e.g., interrupted time series design)? What are the biggest data quality issues that you have encountered that compromise VAM? In the 2003 report, Evaluating Value-Added Models for Teacher Accountability, you wrote,
“The research base is currently insufficient to support the use of VAM for high-stakes decisions.” Is this still true in your opinion?
Notes: The GCEE should focus on error where stakes are the highest. Some other factors to consider include putting in peer effects, accounting for students with multiple teachers, precision, and statistical bias.
Next meeting Monday, February 27, 2012, 2:00 – 5:00 p.m. Grand Valley State University, Eberhard Building, room 215 301 Fulton St. W, Grand Rapids, MI
Attachment 10.B
553

Michigan Council for Educator Effectiveness Interim Progress Report April 2012 Page 28 of 56
Governor’s Council on Educator Effectiveness Monday, February 27, 2012 • 9:00 a.m. – 12:00 p.m.
Grand Valley State University • Eberhard Building, room 215 • 301 Fulton St. W • Grand Rapids
Council members present: Deborah Ball, Jenny Hammond, Mark Reckase, Joseph Martineau, Nick Sheltrown, Dave Vensel
AGENDA 9:00 – 9:10 Opening to meeting and welcome remarks
9:10 – 9:40 Use of teaching evaluations and student achievement scores to improve
instruction Presentation by Tom Livezey, superintendent, and Jason Kennedy, principal, Oakridge Public Schools, Muskegon, MI
9:40 – 10:30 Observation tools and other modes for measuring the effectiveness of instruction Discussion led by Suzanne Wilson, University Distinguished Professor, chair of the Department of Teacher Education, and director of the College of Education’s Center for the Scholarship of Teaching at Michigan State University Notes: Suzanne Wilson guided the group in a discussion of observation tools. Council members developed a list of questions for observation tool developers. Answers to these will assist the GCEE in determining which tools might best fit Michigan districts and schools.
10:30 – 11:30 Student growth and assessment tools Discussion led by Deborah Loewenberg Ball, chair, Governor’s Council on Educator Effectiveness; William H. Payne Collegiate Professor of Education, Arthur F. Thurnau Professor, and dean, University of Michigan School of Education Notes: Review Dan McCaffrey’s talk.
11:30 – 12:00 Public comment session Notes: Suggestions from public attendees included looking at student growth percentile model as an interim student growth option, examining the state’s professional development opportunities, using multiple observers and student/parent surveys.
Next meeting Thursday, March 1, 2012
9:00 a.m. – 12:00 p.m. Lansing, MI (exact location to be determined soon)
Attachment 10.B
554

Michigan Council for Educator Effectiveness Interim Progress Report April 2012 Page 29 of 56
Governor’s Council on Educator Effectiveness Thursday, March 1, 2012 • 9:00 a.m. – 12:00 p.m.
Capitol Building, room 424 • 100 North Capitol Avenue • Lansing, Michigan Council members present: Deborah Ball, Jenny Hammond, Joseph Martineau, Nick Sheltrown, Dave Vensel
AGENDA
9:00 – 9:10 Opening to meeting and updates Debriefing Monday’s meeting in Grand Rapids Updates
9:10 – 9:40 Systematized evaluation: National Heritage Academies Presentation by Max Hunsicker, senior director of coaching and learning at National Heritage Academies Notes: According to Mr. Hunsicker, National Heritage Academies’ evaluation is intentional, supportive, and measured. The goal of this system is to have high-quality teachers in every classroom. The system focuses on components of teaching that have the greatest impact on student achievement. This system is built around meaningful dialogue and professional development.
9:40 – 10:10 Update on meeting with legislators Notes from conversation with Senator Phil Pavlov, chair of the Senate Education Committee Highlights from meeting with key legislators
10:10 – 11:00 Outstanding questions and next steps Review questions surfaced at Monday’s meeting Determine assignments and next steps To review in advance: Grids of questions about observation tools and student growth models (in Dropbox in folders “Observation tool questions” and “Student growth questions” Notes: Council members reviewed this question grid and determined assignments for future work. The primary focus for upcoming weeks will be on observation tools.
11:00 – 12:00 Student growth and value-added models Review notes from conversation with Dan McCaffrey Begin building framework for building recommendations for feasible and useful student growth assessments
Next meeting
Wednesday, March 7, 2012 2:00 – 5:00 p.m. University of Michigan School of Education (610 E. University Avenue, Ann Arbor)
Attachment 10.B
555
Michigan Council for Educator Effectiveness Interim Progress Report April 2012 Page 30 of 56
Governor’s Council on Educator Effectiveness Wednesday, March 7, 2012 • 2:00 – 5:00 p.m. University of Michigan School of Education
Dean’s Conference Room (room 1211) • 610 East University Avenue • Ann Arbor
Council members present: Deborah Ball, Jenny Hammond, Mark Reckase, Joseph Martineau, Nick Sheltrown, Dave Vensel
AGENDA 2:00 – 2:10 Opening to meeting and updates
Debriefing last week’s meetings in Grand Rapids and Lansing Updates
2:10 – 2:40 Update on meeting with legislators Notes from conversation with Senator Phil Pavlov, chair of the Senate Education Committee Highlights from meeting with key legislators Next steps
2:40 – 3:00 Michigan assessment timeline through 2015-16 Discuss the state’s assessment timeline and its impact on student growth models To review in advance: Assessment timeline (in Dropbox folder “Relevant MDE policies)
3:00 – 4:00 Washington perspective In 2007, the Center for Educational Leadership (CEL) at University of Washington College of Education released its instructional framework, the 5 Dimensions of Teaching and Learning (5D). According to CEL’s website (www.k-12leadership.org): The 5D Framework is the only comprehensive instructional framework in the country accompanied by an on-line assessment tool that measures leaders’ ability to observe and analyze instruction, provide useful and timely feedback to teachers, and guide teachers’ learning. More than 2,000 district leaders, school leaders, and coaches nationwide have participated in the 5D assessment process since its development. We will have a Skype conversation with Steve Fink, executive director at CEL, Sandy Austin, project director at CEL, and Edie Holcomb, program facilitator at Washington’s Teacher & Principal Evaluation Pilot (TPEP), which is using 5D as one of their observation protocols (along with Danielson and Marzano). To review in advance: Materials from University of Washington (in Dropbox folder “University of Washington”) Notes: Washington is using three instructional frameworks, but 5D reflects the overall scope of Danielson and Marzano. In Washington, these frameworks will be used with all instructional personnel. Each of the providers (Danielson, Marzano, and 5D) will provide training. The instrument is not as important as the training to use the framework well. These presenters believe that observers do not judge a classroom, but watch and catalogue.
4:00 – 5:00 Work in small groups
Next meeting Friday, March 16, 2012 2:00 – 5:00 p.m. University of Michigan School of Education (610 E. University Avenue, Ann Arbor)
Attachment 10.B
556

Michigan Council for Educator Effectiveness Interim Progress Report April 2012 Page 31 of 56
Governor’s Council on Educator Effectiveness Friday, March 16, 2012 • 2:00 – 5:00 p.m.
University of Michigan School of Education Dean’s Conference Room (room 1211) • 610 East University Avenue • Ann Arbor
Council members present: Deborah Ball, Jenny Hammond, Mark Reckase, Joseph Martineau, Nick Sheltrown
AGENDA 2:00 – 2:10 Opening to meeting and updates
Introduce Cori Mehan Updates
2:10 – 2:30 Michigan assessment timeline through 2015-16 Discuss the state’s assessment timeline and its impact on student growth models To review in advance: Assessment timeline (in Dropbox folder “Relevant MDE policies”) Notes: Council members studied the testing timeline and asked Joseph questions about implementation and feasibility. It was noted that this timeline will help council members as they make future recommendations regarding student growth.
2:30 – 3:00 Review of Michigan’s current data availability and challenges Nick Sheltrown and Joseph Martineau will present and lead a discussion Notes: Nick and Joseph explained roster checking, which would allow for districts to match students more accurately with teachers and glean a more accurate measurement for each teacher’s percentage of instructional responsibility. The council discussed the difficulty of applying such a tool to PE and art teachers, but decided to consider roster verification tools as they continue to make recommendations.
3:00 – 4:00 “Teaching capacity” growth model Mark Reckase and Joseph Martineau will present an alternative growth model that they are developing to measure “teaching capacity” Notes: Mark and Joseph presented their growth model and answered questions. They explained that this model would allow districts to consider and account for students’ backgrounds and other external factors when evaluating student growth. Each student would receive a challenge index. One outstanding concern was that this model might favor teachers working with disadvantaged student populations.
4:00 – 5:00 Colorado perspective Colorado’s State Council for Educator Effectiveness submitted its report and recommendations to the State Board of Education on April 13, 2011. We will have a Skype conversation with Lorrie Shepard, member of the council and dean at the University of Colorado at Boulder’s School of Education. She will offer information about their council’s efforts, the process they used to arrive at their recommendations, and key lessons learned. To review in advance: Attached summary of Colorado’s State Council for Educator Effectiveness Report and Recommendations (Full report is in Dropbox folder “Sample reports of Ed Evaluation Committees”) Notes: Lorrie Shepard explained the educator evaluation process in Colorado, including their timeline, matrix approach, pilot, and choosing an observation tool.
Next meeting Wednesday, March 28, 2012
10:00 a.m. – 1:00 p.m. University of Michigan School of Education (610 E. University Avenue, Ann Arbor)
Attachment 10.B
557

Michigan Council for Educator Effectiveness Interim Progress Report April 2012 Page 32 of 56
Michigan Council for Educator Effectiveness Wednesday, March 28, 2012 • 10:00 a.m. – 1:00 p.m.
University of Michigan School of Education Dean’s Conference Room • 610 East University Avenue, Room 1211 • Ann Arbor
Council members present: Deborah Ball, Jenny Hammond, Mark Reckase, Joseph Martineau, Nick Sheltrown (via telephone), Dave Vensel (via telephone)
AGENDA
10:00 – 10:45
Opening to meeting and updates Executive Order changing our name; Plans for open meeting in Detroit on April 2; Discussion of ways to engage the Advisory Council before the April 30 deadline; Summer meeting dates Notes: The governor signed an executive order that changed the council’s name to the Michigan Council for Educator Effectiveness. Our logo must be changed, as well as other documents. The Detroit meeting will take place at the Skillman Foundation. Cori will send out directions and parking information. The MCEE will ask the Advisory Council for their input on key challenges.
10:45 – 11:00 Vision statement approval To review in advance (In Dropbox folder “Vision statements”): Vision statement revisions document Notes: Council members edited and approved the vision statement, which will guide the council’s future work and recommendations.
11:00 – 11:30 Combined performance measures Nick Sheltrown will review how five states combine their performance measures. Notes: Nick provided information on combining performance data. In the discussion afterward, the council generally preferred the rubric approach, not the formula approach. The council also agreed on the need to be able to indicate the probability that a teacher will fall into any given box in the rubric. For future thinking, could this approach set Michigan apart from other states?
11:30 – 1:00 Review of observation tool conversations and findings Jenny Hammond, Dave Vensel, and Suzanne Wilson will review the observation protocols and frameworks that they have examined and discuss findings, thoughts, and questions. To review in advance:
Memo concerning observation protocols and related materials/processes (to be emailed later on March 27)
Charlotte Danielson’s Framework for Teaching (In Dropbox folder “Meeting agendas and materials”)
Robert J. Marzano’s An Observational Protocol Based on “The Art and Science of Teaching” (In Dropbox folder “Meeting agendas and materials”)
University of Washington’s 5D+ Teacher Evaluation Rubric (In Dropbox folder “Meeting agendas and materials”)
Note: If you received a binder that contains these observation tools, please bring it with you to the meeting. Notes: Jenny, Dave, and Suzanne met with representatives from observation tool organizations to learn more about the specifics of each tool. Council members discussed observation tool ideas, concerns, and questions regarding feasibility, reliability, validity, cost, and other aspects of each system.
Next meeting Monday, April 2, 2012
12:00 – 3:00 p.m. The Skillman Foundation (100 Talon Centre Dr., Suite 100, Detroit)
Attachment 10.B
558

Michigan Council for Educator Effectiveness Interim Progress Report April 2012 Page 33 of 56
Michigan Council for Educator Effectiveness Monday, April 2, 2012 • 12:00 p.m. – 3:00 p.m.
The Skillman Foundation • Grantees’ Room • 100 Talon Centre Dr., Suite 100 • Detroit
Council members present: Deborah Ball, Dave Vensel
AGENDA
12:00 – 12:15 Opening to meeting and welcome remarks
12:15 – 1:00 Updates on the MCEE’s work Discussion led by Deborah Loewenberg Ball, chair, Michigan Council for Educator Effectiveness; William H. Payne Collegiate Professor of Education, Arthur F. Thurnau Professor, and dean, University of Michigan School of Education Notes: The MCEE has looked at particular observation frames and protocols like Danielson. Council members have looked at other states in order to learn what systems exist. The council is working to develop a system that is fair, transparent, and feasible, and will contribute to educational improvement.
1:00 – 1:30 Learning about the Washington’s evaluation pilot We will have a phone conversation with Michaela Miller, Washington’s teacher–principal evaluation project manager, to discuss Washington’s pilot program. Michaela will discuss timeline, training, cost, feedback from educators, and other lessons learned regarding Washington’s educator evaluation pilot. Notes: Washington has plans to phase in their system; there are nine school districts in the pilot this year and there will be 65 school districts in 2012-2013. Washington was able to train all teachers in pilot schools on the observation tools, but it was expensive. Michaela suggests that the MCEE focus on connecting teachers and principals in pilot districts, use frameworks that already exist, work with teachers to set goals, and listen to feedback from teachers.
1:30 – 2:00 Piloting evaluation systems - What are the benefits of a pilot year? - What systems or policies need to be in place for a pilot to be effective? - How might districts apply to be a part of a pilot year?
Discussion led by Cori Mehan, project manager for the Michigan Council for Educator Effectiveness. Notes: After examining other states, Cori shared some findings. Selecting varying sizes of pilot districts can help to understand more potential challenges. The cohort of pilot districts should be relatively small so that the state can analyze the evaluation systems’ effectiveness in each school. In many cases, student growth measures are not piloted in the first year.
2:00 – 3:00 Public comment session Notes: Create more transparency with the public. Avoid “gotcha” checklist evaluation. Evaluation system needs to be about professional growth. Pilots are important for buy-in; pilots also help to ensure that a system works before asking more districts to take part.
Next meeting Monday, April 12, 2012 8:00 – 11:00 p.m. University of Michigan School of Education (610 E. University Avenue, Ann Arbor)
Attachment 10.B
559
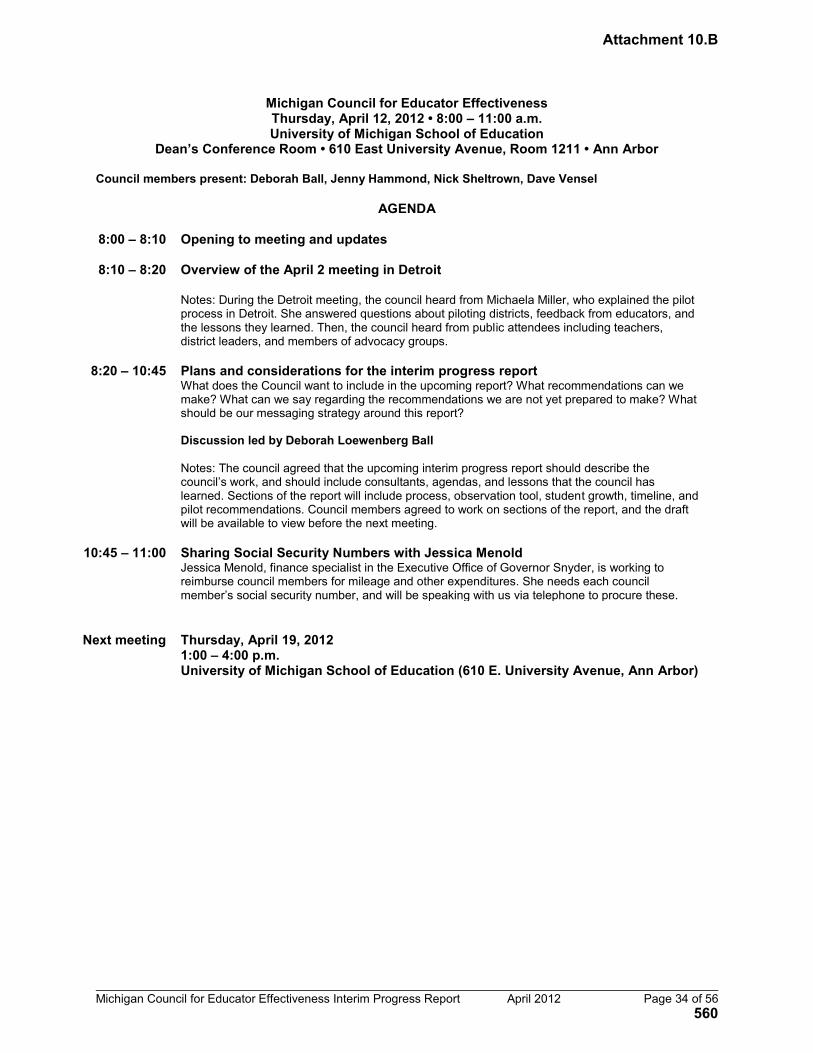
Michigan Council for Educator Effectiveness Interim Progress Report April 2012 Page 34 of 56
Michigan Council for Educator Effectiveness Thursday, April 12, 2012 • 8:00 – 11:00 a.m. University of Michigan School of Education
Dean’s Conference Room • 610 East University Avenue, Room 1211 • Ann Arbor
Council members present: Deborah Ball, Jenny Hammond, Nick Sheltrown, Dave Vensel
AGENDA 8:00 – 8:10 Opening to meeting and updates
8:10 – 8:20 Overview of the April 2 meeting in Detroit
Notes: During the Detroit meeting, the council heard from Michaela Miller, who explained the pilot process in Detroit. She answered questions about piloting districts, feedback from educators, and the lessons they learned. Then, the council heard from public attendees including teachers, district leaders, and members of advocacy groups.
8:20 – 10:45 Plans and considerations for the interim progress report What does the Council want to include in the upcoming report? What recommendations can we make? What can we say regarding the recommendations we are not yet prepared to make? What should be our messaging strategy around this report? Discussion led by Deborah Loewenberg Ball Notes: The council agreed that the upcoming interim progress report should describe the council’s work, and should include consultants, agendas, and lessons that the council has learned. Sections of the report will include process, observation tool, student growth, timeline, and pilot recommendations. Council members agreed to work on sections of the report, and the draft will be available to view before the next meeting.
10:45 – 11:00 Sharing Social Security Numbers with Jessica Menold Jessica Menold, finance specialist in the Executive Office of Governor Snyder, is working to reimburse council members for mileage and other expenditures. She needs each council member’s social security number, and will be speaking with us via telephone to procure these.
Next meeting Thursday, April 19, 2012 1:00 – 4:00 p.m. University of Michigan School of Education (610 E. University Avenue, Ann Arbor)
Attachment 10.B
560
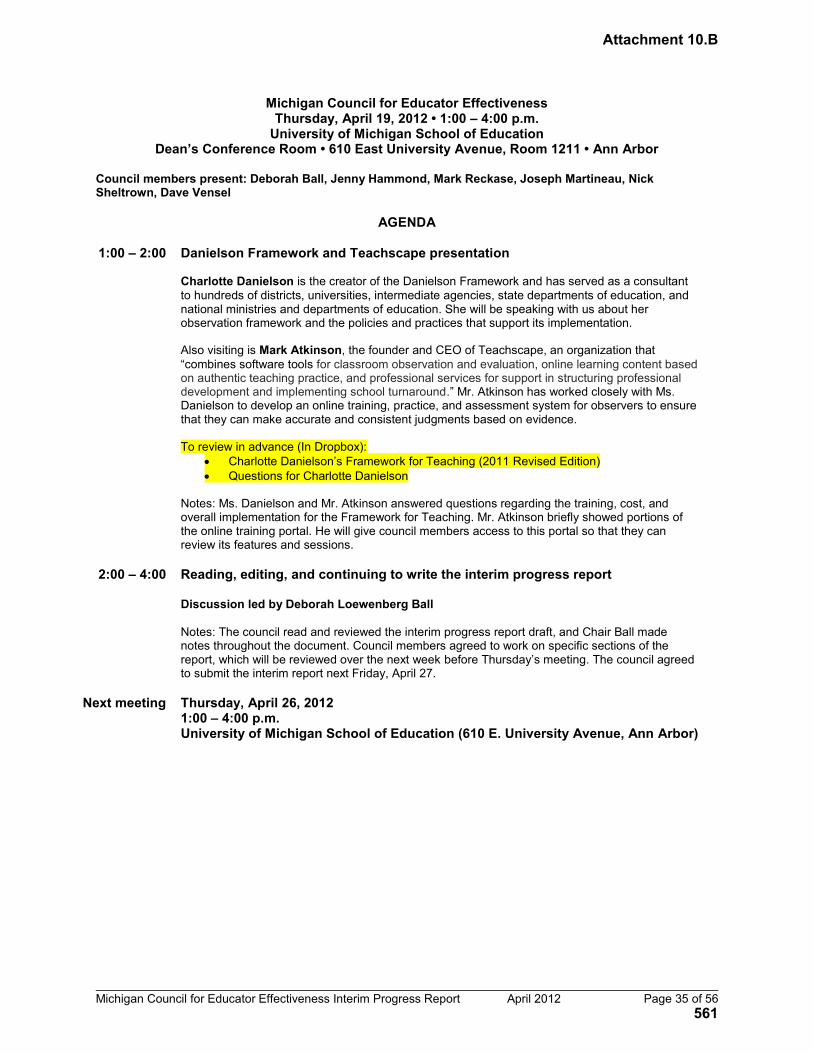
Michigan Council for Educator Effectiveness Interim Progress Report April 2012 Page 35 of 56
Michigan Council for Educator Effectiveness Thursday, April 19, 2012 • 1:00 – 4:00 p.m.
University of Michigan School of Education Dean’s Conference Room • 610 East University Avenue, Room 1211 • Ann Arbor
Council members present: Deborah Ball, Jenny Hammond, Mark Reckase, Joseph Martineau, Nick Sheltrown, Dave Vensel
AGENDA 1:00 – 2:00 Danielson Framework and Teachscape presentation
Charlotte Danielson is the creator of the Danielson Framework and has served as a consultant to hundreds of districts, universities, intermediate agencies, state departments of education, and national ministries and departments of education. She will be speaking with us about her observation framework and the policies and practices that support its implementation. Also visiting is Mark Atkinson, the founder and CEO of Teachscape, an organization that “combines software tools for classroom observation and evaluation, online learning content based on authentic teaching practice, and professional services for support in structuring professional development and implementing school turnaround.” Mr. Atkinson has worked closely with Ms. Danielson to develop an online training, practice, and assessment system for observers to ensure that they can make accurate and consistent judgments based on evidence. To review in advance (In Dropbox):
Charlotte Danielson’s Framework for Teaching (2011 Revised Edition) Questions for Charlotte Danielson
Notes: Ms. Danielson and Mr. Atkinson answered questions regarding the training, cost, and overall implementation for the Framework for Teaching. Mr. Atkinson briefly showed portions of the online training portal. He will give council members access to this portal so that they can review its features and sessions.
2:00 – 4:00 Reading, editing, and continuing to write the interim progress report
Discussion led by Deborah Loewenberg Ball
Notes: The council read and reviewed the interim progress report draft, and Chair Ball made notes throughout the document. Council members agreed to work on specific sections of the report, which will be reviewed over the next week before Thursday’s meeting. The council agreed to submit the interim report next Friday, April 27.
Next meeting Thursday, April 26, 2012
1:00 – 4:00 p.m. University of Michigan School of Education (610 E. University Avenue, Ann Arbor)
Attachment 10.B
561
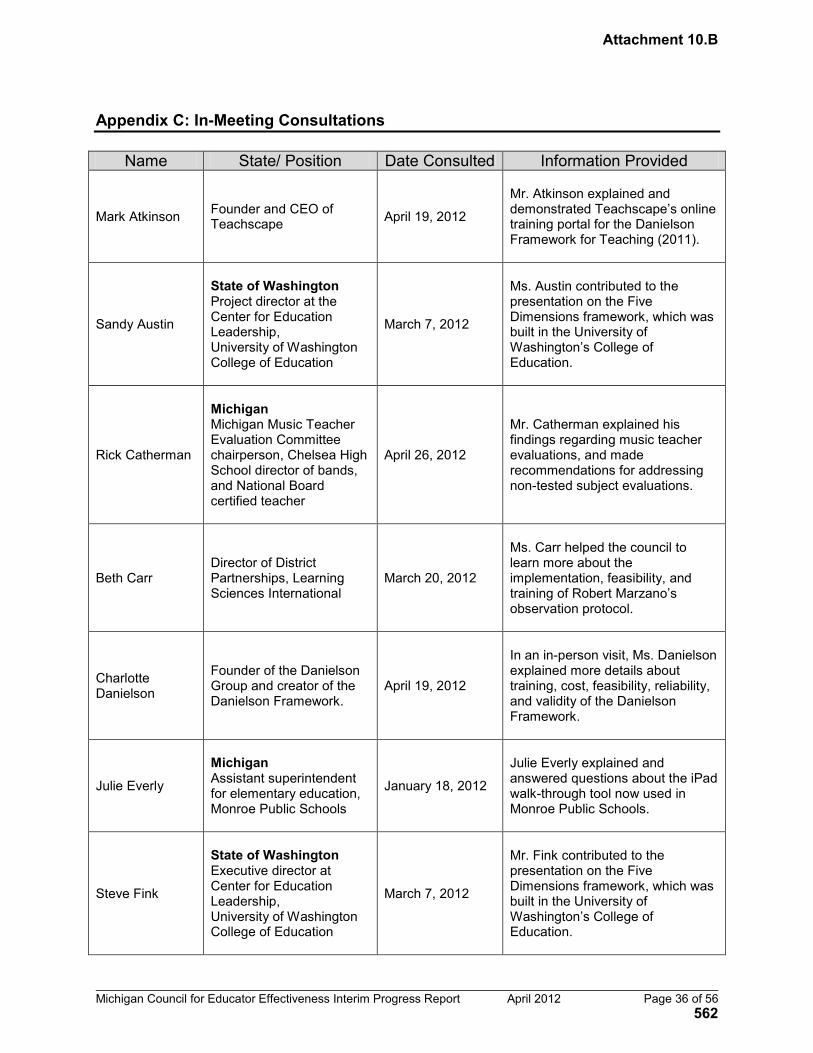
Michigan Council for Educator Effectiveness Interim Progress Report April 2012 Page 36 of 56
Appendix C: In-Meeting Consultations
Name State/ Position Date Consulted Information Provided
Mark Atkinson
Founder and CEO of Teachscape
April 19, 2012
Mr. Atkinson explained and demonstrated Teachscape’s online training portal for the Danielson Framework for Teaching (2011).
Sandy Austin
State of Washington Project director at the Center for Education Leadership, University of Washington College of Education
March 7, 2012
Ms. Austin contributed to the presentation on the Five Dimensions framework, which was built in the University of Washington’s College of Education.
Rick Catherman
Michigan Michigan Music Teacher Evaluation Committee chairperson, Chelsea High School director of bands, and National Board certified teacher
April 26, 2012
Mr. Catherman explained his findings regarding music teacher evaluations, and made recommendations for addressing non-tested subject evaluations.
Beth Carr
Director of District Partnerships, Learning Sciences International
March 20, 2012
Ms. Carr helped the council to learn more about the implementation, feasibility, and training of Robert Marzano’s observation protocol.
Charlotte Danielson
Founder of the Danielson Group and creator of the Danielson Framework.
April 19, 2012
In an in-person visit, Ms. Danielson explained more details about training, cost, feasibility, reliability, and validity of the Danielson Framework.
Julie Everly
Michigan Assistant superintendent for elementary education, Monroe Public Schools
January 18, 2012
Julie Everly explained and answered questions about the iPad walk-through tool now used in Monroe Public Schools.
Steve Fink
State of Washington Executive director at Center for Education Leadership, University of Washington College of Education
March 7, 2012
Mr. Fink contributed to the presentation on the Five Dimensions framework, which was built in the University of Washington’s College of Education.
Attachment 10.B
562

Michigan Council for Educator Effectiveness Interim Progress Report April 2012 Page 37 of 56
Name State/ Position Date Consulted Information Provided
Edie Holcomb
State of Washington Program facilitator at Washington’s Teacher and & Principal Evaluation Pilot
March 7, 2012
Mr. Holcomb contributed to the presentation on the Five Dimensions framework, which was built in the University of Washington’s College of Education.
Max Hunsicker
Michigan Senior director of coaching and learning, National Heritage Academies
March 1, 2012
Mr. Hunsicker shared information regarding National Heritage Academies’ teacher evaluation system.
Jason Kennedy
Michigan Principal, Oakridge Public Schools
February 27, 2012
Mr. Kennedy discussed the evaluation system currently used by Oakridge Public Schools.
Tom Livezey
Michigan Superintendent, Oakridge Public Schools
February 27, 2012
Mr. Livezey discussed the evaluation system currently used by Oakridge Public Schools.
Dan McCaffrey
PNC Chair in Policy Analysis and senior statistician at RAND Corporation
February 21, 2012
Mr. McCaffrey guided the council through an introduction of Value Added Modeling and answered council members’ questions.
Laurie McCullough
Chief Strategy Officer, Teachstone
March 20, 2012
Ms. McCullough helped the council to learn more about the implementation, feasibility, and training of CLASS observation tool.
Ryan McLeod
Michigan Assistant superintendent for secondary education, Monroe Public Schools
January 18, 2012
Mr. McLeod explained and answered questions about the iPad walk-through tool now used in Monroe Public Schools
Michaela Miller
State of Washington Program manager, Washington’s Teacher and & Principal Evaluation Pilot
April 2, 2012
Ms. Miller shared information regarding the training, cost, and feasibility of an evaluation tool pilot, like the one she is working with in Washington.
Attachment 10.B
563
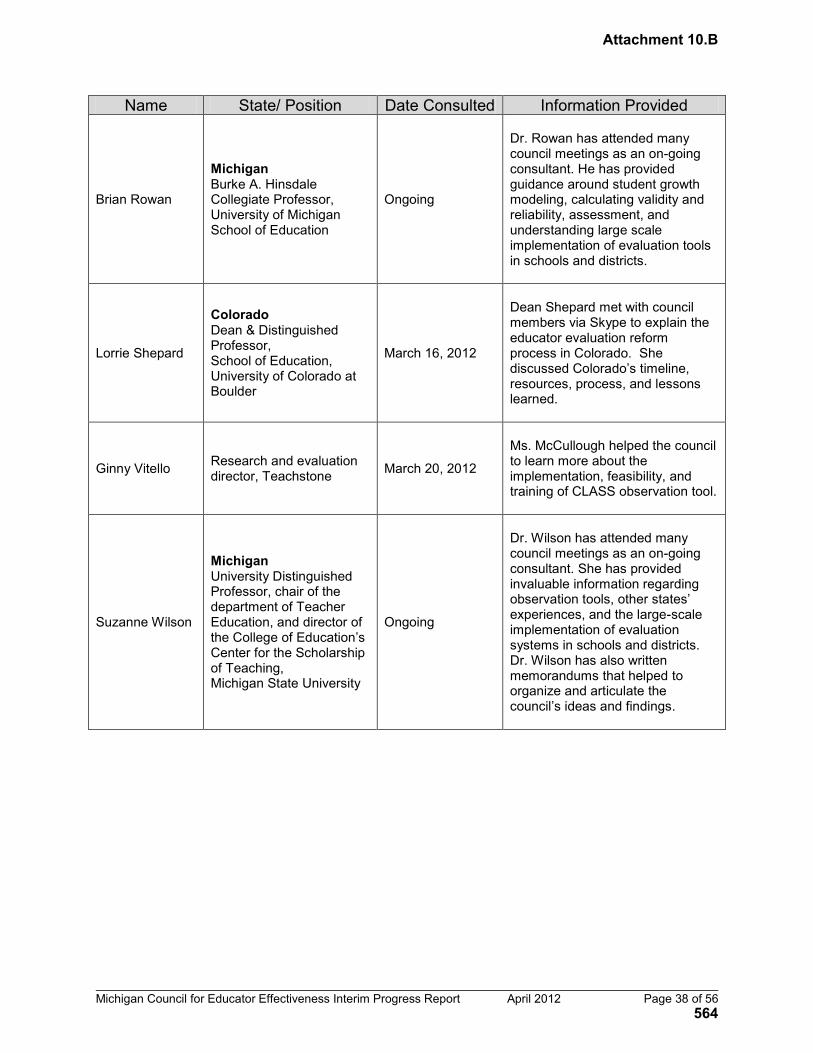
Michigan Council for Educator Effectiveness Interim Progress Report April 2012 Page 38 of 56
Name State/ Position Date Consulted Information Provided
Brian Rowan
Michigan Burke A. Hinsdale Collegiate Professor, University of Michigan School of Education
Ongoing
Dr. Rowan has attended many council meetings as an on-going consultant. He has provided guidance around student growth modeling, calculating validity and reliability, assessment, and understanding large scale implementation of evaluation tools in schools and districts.
Lorrie Shepard
Colorado Dean & Distinguished Professor, School of Education, University of Colorado at Boulder
March 16, 2012
Dean Shepard met with council members via Skype to explain the educator evaluation reform process in Colorado. She discussed Colorado’s timeline, resources, process, and lessons learned.
Ginny Vitello
Research and evaluation director, Teachstone
March 20, 2012
Ms. McCullough helped the council to learn more about the implementation, feasibility, and training of CLASS observation tool.
Suzanne Wilson
Michigan University Distinguished Professor, chair of the department of Teacher Education, and director of the College of Education’s Center for the Scholarship of Teaching, Michigan State University
Ongoing
Dr. Wilson has attended many council meetings as an on-going consultant. She has provided invaluable information regarding observation tools, other states’ experiences, and the large-scale implementation of evaluation systems in schools and districts. Dr. Wilson has also written memorandums that helped to organize and articulate the council’s ideas and findings.
Attachment 10.B
564

Michigan Council for Educator Effectiveness Interim Progress Report April 2012 Page 39 of 56
Appendix D: Out-of Meeting Consultations
Name Position Date Consulted Information Provided
Katy Anthes
Colorado Executive director of educator effectiveness, Colorado Department of Education
March 26, 2012
Ms. Anthes provided information regarding Colorado’s evaluation reform process. She answered questions regarding Colorado’s pilot, cost, and lessons learned.
Amber Arellano
Michigan Executive director, The Education Trust Midwest
Ongoing
Ms. Arellano has provided ongoing support and guidance by conducting research, building understanding of other states’ evaluation systems, and aiding in the navigation of political environments.
Drew Jacobs
Michigan Data and policy analyst The Education Trust Midwest
Ongoing
Mr. Jacobs has provided insight into the waiver process, evaluation tools, and other states’ reform processes.
Sarah Lenhoff
Michigan Assistant director of policy and research, The Education Trust-Midwest
Ongoing
Ms. Lenhoff has helped the council understand more about pilots, evaluation tools (particularly student growth tools), and building capacity around evaluation systems.
Robert Murphy
New Jersey Principal, East Brunswick High School
March 2012
Mr. Murphy discussed the observation tool that New Jersey currently uses to assess teachers. He addressed the cost, feasibility, and feedback from teachers for the tool.
Julia Simmerer
Ohio Director, Office of Educator Effectiveness, Ohio Department of Education
April 4, 2012
Ms. Simmerer provided information regarding Ohio’s observation tools, their training on these tools, and their pilot. She provided insight on the resources that Ohio needs in order for this process to be implemented effectively.
Attachment 10.B
565
Michigan Council for Educator Effectiveness Interim Progress Report April 2012 Page 40 of 56
Name State/ Position Date Consulted Information Provided
Matt Smith
Colorado Chair, Colorado State Council for Educator Effectiveness and Vice President, Engineering & IT Systems, United Launch Alliance
April 2012
Mr. Smith discussed how Colorado used information that the pilot program could aid the state, administrators, and teachers in understanding and adapting evaluation systems.
Attachment 10.B
566

Michigan Council for Educator Effectiveness Interim Progress Report April 2012 Page 41 of 56
Appendix E: Research and Resources
Other States’ Reports Document Title Publishing Organization Description of Document and Web Link
The State Council for Educator Effectiveness Report and Recommendations (2011)
Colorado’s State Council for Educator Effectiveness
This report details the evaluation recommendations made by Colorado’s State Council for Educator Effectiveness. Colorado Report
Teacher and Principal Evaluation Pilot Report to the Legislature (2011)
State of Washington’s Office of the Superintendent of Public Instruction
This report to the Washington legislature details the teacher and educator evaluation reform process and pilot. Washington Report
The Rhode Island Model: Guide to Evaluating Building Administrators and Teachers (2011)
Rhode Island Board of Regents
This guide explains Rhode Island’s teacher and administrator evaluation process. Rhode Island Report
RISE Evaluator and Teacher Handbook 1.0 (2011)
Indiana Department of Education, RISE Evaluation and Development System
This handbook details Indiana’s teacher evaluation system. Indiana Report
Building a Breakthrough Framework for Educator Evaluation in the Commonwealth (2011)
Massachusetts Task Force on the Evaluation of Teachers and Administrators
This framework details the educator evaluation system in Massachusetts. Massachusetts Report
North Carolina Teacher Evaluation Process
Public Schools of North Carolina, State Board of Educations, Department of Public Instruction
This report explains North Carolina’s teacher evaluation process. North Carolina Report
State Database of Teacher Evaluation Policies – Comprehensive Comparison
National Comprehensive Center for Teacher Quality
This document compares the evaluation systems of three states: Rhode Island, New York, and North Carolina. State Database Comparison
Attachment 10.B
567
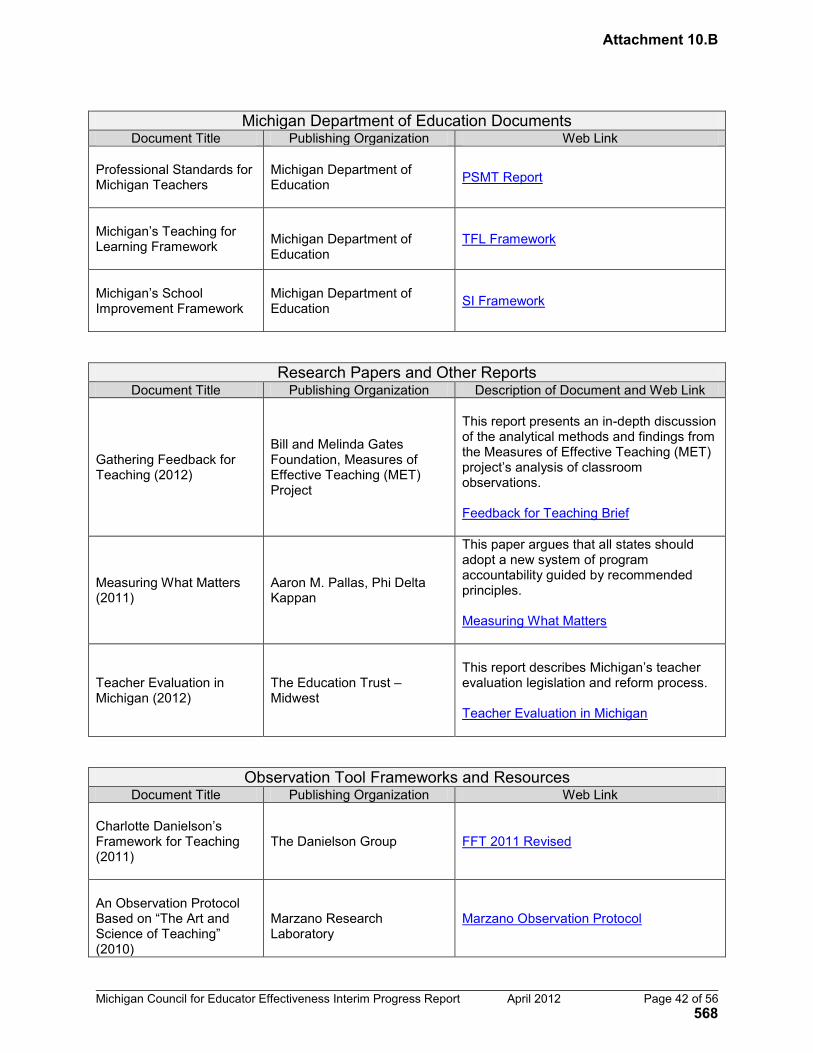
Michigan Council for Educator Effectiveness Interim Progress Report April 2012 Page 42 of 56
Michigan Department of Education Documents
Document Title Publishing Organization Web Link Professional Standards for Michigan Teachers
Michigan Department of Education PSMT Report
Michigan’s Teaching for Learning Framework
Michigan Department of Education
TFL Framework
Michigan’s School Improvement Framework
Michigan Department of Education SI Framework
Research Papers and Other Reports Document Title Publishing Organization Description of Document and Web Link
Gathering Feedback for Teaching (2012)
Bill and Melinda Gates Foundation, Measures of Effective Teaching (MET) Project
This report presents an in-depth discussion of the analytical methods and findings from the Measures of Effective Teaching (MET) project’s analysis of classroom observations. Feedback for Teaching Brief
Measuring What Matters (2011)
Aaron M. Pallas, Phi Delta Kappan
This paper argues that all states should adopt a new system of program accountability guided by recommended principles. Measuring What Matters
Teacher Evaluation in Michigan (2012)
The Education Trust – Midwest
This report describes Michigan’s teacher evaluation legislation and reform process. Teacher Evaluation in Michigan
Observation Tool Frameworks and Resources Document Title Publishing Organization Web Link
Charlotte Danielson’s Framework for Teaching (2011)
The Danielson Group FFT 2011 Revised
An Observation Protocol Based on “The Art and Science of Teaching” (2010)
Marzano Research Laboratory
Marzano Observation Protocol
Attachment 10.B
568
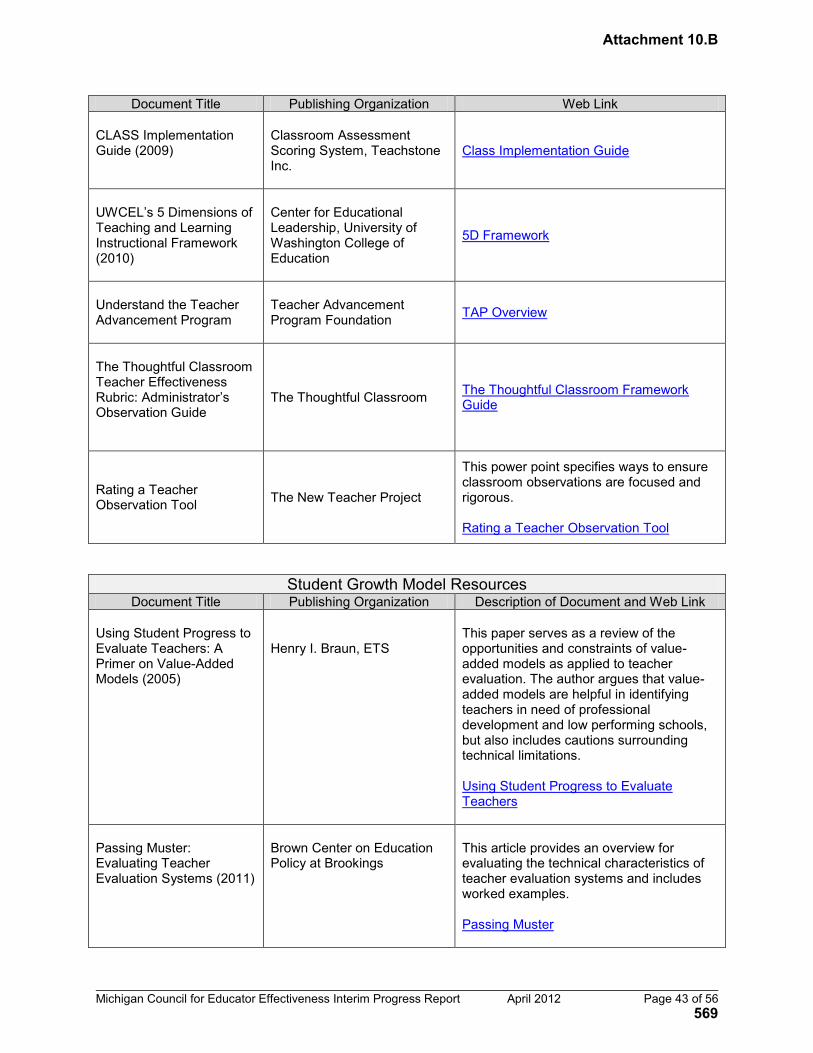
Michigan Council for Educator Effectiveness Interim Progress Report April 2012 Page 43 of 56
Document Title Publishing Organization Web Link CLASS Implementation Guide (2009)
Classroom Assessment Scoring System, Teachstone Inc.
Class Implementation Guide
UWCEL’s 5 Dimensions of Teaching and Learning Instructional Framework (2010)
Center for Educational Leadership, University of Washington College of Education
5D Framework
Understand the Teacher Advancement Program
Teacher Advancement Program Foundation TAP Overview
The Thoughtful Classroom Teacher Effectiveness Rubric: Administrator’s Observation Guide
The Thoughtful Classroom The Thoughtful Classroom Framework Guide
Rating a Teacher Observation Tool
The New Teacher Project
This power point specifies ways to ensure classroom observations are focused and rigorous. Rating a Teacher Observation Tool
Student Growth Model Resources Document Title Publishing Organization Description of Document and Web Link
Using Student Progress to Evaluate Teachers: A Primer on Value-Added Models (2005)
Henry I. Braun, ETS
This paper serves as a review of the opportunities and constraints of value-added models as applied to teacher evaluation. The author argues that value-added models are helpful in identifying teachers in need of professional development and low performing schools, but also includes cautions surrounding technical limitations. Using Student Progress to Evaluate Teachers
Passing Muster: Evaluating Teacher Evaluation Systems (2011)
Brown Center on Education Policy at Brookings
This article provides an overview for evaluating the technical characteristics of teacher evaluation systems and includes worked examples. Passing Muster
Attachment 10.B
569
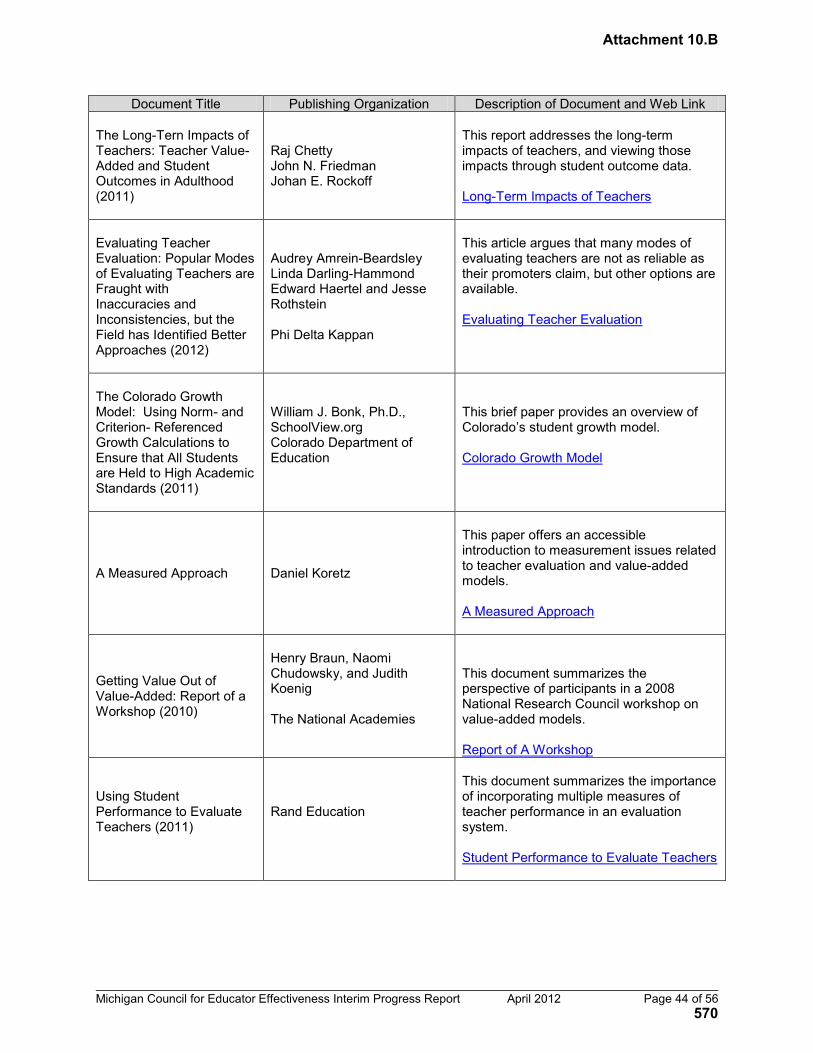
Michigan Council for Educator Effectiveness Interim Progress Report April 2012 Page 44 of 56
Document Title Publishing Organization Description of Document and Web Link The Long-Tern Impacts of Teachers: Teacher Value-Added and Student Outcomes in Adulthood (2011)
Raj Chetty John N. Friedman Johan E. Rockoff
This report addresses the long-term impacts of teachers, and viewing those impacts through student outcome data. Long-Term Impacts of Teachers
Evaluating Teacher Evaluation: Popular Modes of Evaluating Teachers are Fraught with Inaccuracies and Inconsistencies, but the Field has Identified Better Approaches (2012)
Audrey Amrein-Beardsley Linda Darling-Hammond Edward Haertel and Jesse Rothstein Phi Delta Kappan
This article argues that many modes of evaluating teachers are not as reliable as their promoters claim, but other options are available. Evaluating Teacher Evaluation
The Colorado Growth Model: Using Norm- and Criterion- Referenced Growth Calculations to Ensure that All Students are Held to High Academic Standards (2011)
William J. Bonk, Ph.D., SchoolView.org Colorado Department of Education
This brief paper provides an overview of Colorado’s student growth model. Colorado Growth Model
A Measured Approach
Daniel Koretz
This paper offers an accessible introduction to measurement issues related to teacher evaluation and value-added models. A Measured Approach
Getting Value Out of Value-Added: Report of a Workshop (2010)
Henry Braun, Naomi Chudowsky, and Judith Koenig The National Academies
This document summarizes the perspective of participants in a 2008 National Research Council workshop on value-added models. Report of A Workshop
Using Student Performance to Evaluate Teachers (2011)
Rand Education
This document summarizes the importance of incorporating multiple measures of teacher performance in an evaluation system. Student Performance to Evaluate Teachers
Attachment 10.B
570
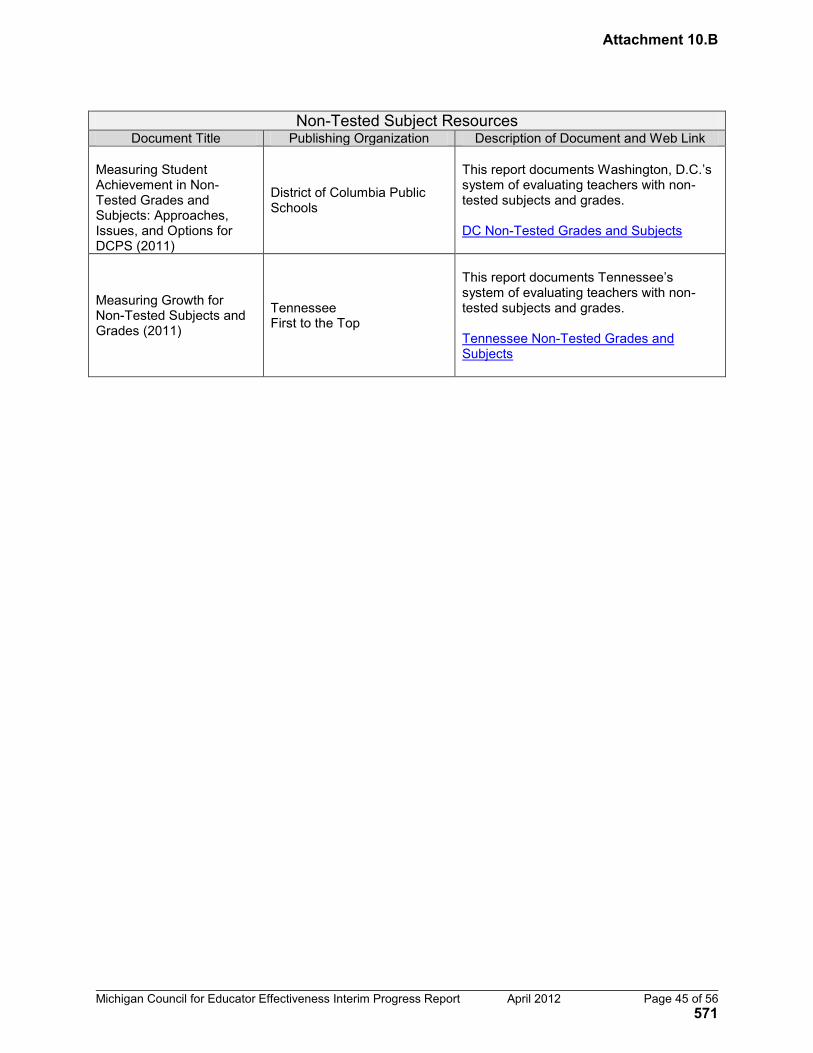
Michigan Council for Educator Effectiveness Interim Progress Report April 2012 Page 45 of 56
Non-Tested Subject Resources
Document Title Publishing Organization Description of Document and Web Link Measuring Student Achievement in Non-Tested Grades and Subjects: Approaches, Issues, and Options for DCPS (2011)
District of Columbia Public Schools
This report documents Washington, D.C.’s system of evaluating teachers with non-tested subjects and grades. DC Non-Tested Grades and Subjects
Measuring Growth for Non-Tested Subjects and Grades (2011)
Tennessee First to the Top
This report documents Tennessee’s system of evaluating teachers with non-tested subjects and grades. Tennessee Non-Tested Grades and Subjects
Attachment 10.B
571

Michigan Council for Educator Effectiveness Interim Progress Report April 2012 Page 46 of 56
Appendix F: Advisory Committee Members
Name Position Organization Representing Dan L. DeGrow, Chair Superintendent St. Clair County RESA public school
administrators
Amber M. Arellano Executive Director The Education Trust-Midwest public school administrators
Ernst A. Bauer Research, Evaluation and Assessment Consultant
Oakland Schools public school administrators
William C. Chilman, IV Superintendent Beal City Public Schools parents of public school
pupils
Barbara F. Mays Vice-Chair Barton Elementary School Parent Organization
parents of public school pupils
Mary A. Kovari Principal Detroit Institute of Technology High School
public school administrators
Kirstin G. Queen HR Manager Ford Motor Credit Company parents of public school pupils
John F. Haan Elementary Teacher Charlevoix Public Schools public school teachers
Tonya Allen Chief Operating Officer and Vice President
Program for The Skillman Foundation
parents of public school pupils
Ingrid J. Guerra-Lopez Director
Wayne State University Institute for Learning and Performance Improvement
public school teachers
Krista L. Hunsanger Teacher Grand Ledge Public Schools public school teachers
Colin Ripmaster Principal Mattawan High School public school administrators
Richard S. Carsten Superintendent Ida Public Schools public school administrators
Matthew T. Wandrie Superintendent Lapeer Community Schools public schools
administrators
Nathan R. Walker Organizer American Federation of Teachers Michigan public school teachers
Tammy M. Wagner Dickinson parents of public school pupils
Attachment 10.B
572
Michigan Council for Educator Effectiveness Interim Progress Report April 2012 Page 47 of 56
Appendix G: Advisory Committee Report The Advisory Committee to the Governor’s Council on Educator Effectiveness (GCEE) was established to provide input on the recommendations of the GCEE. In order to fulfill this role, the Advisory Committee convened to begin developing a foundational understanding of the five key components of the educator evaluation system upon which the GCEE will make recommendations to the legislature. Based on their work over the course of four meetings, the Advisory Committee submits the following summary to the GCEE: General Comments The Advisory Committee supports the GCEE in seeking additional time beyond April to assess potential tools given the high stakes for successful and sustainable implementation. This is in keeping with the work taking place in other states. In a similar project in the State of Colorado, for example, a two-year period was spent selecting a tool that is currently being piloted this year. Thought should be given to implementing a pilot project for each of the tools design for Michigan. The Advisory Committee also supports development of a communications plan and feedback process as a critical first step to ensure stakeholder input is considered. This will increase the likelihood of support. We recommend that the communications plan includes the following information:
1. Clearly identifies the legal foundation and rationale for change as well as communicates the data upon which the necessity for the tool was determined;
2. Addresses a broad group of stakeholders to include teachers, administrators, students, parents and the community;
3. Communicates the importance of teacher quality in student learning. Research from the past few decades has demonstrated that teachers are the single most significant in-school predictor of student achievement. As such, it is critical that the evaluation process incorporates high expectations and contributes to teacher development.
4. Establishes a common language for key components of the tool; 5. Is constructed in such a way as to convey fidelity of the tool and the plan; 6. Identifies the Student Growth and Assessment tool as a pilot that will employ use of a formal
feedback mechanism for effective year-to-year improvements; and 7. Includes a thoughtful roll-out plan that contains a thorough Question and Answer document.
I. Student Growth and Assessment Tool Critical Factors and Suggested Elements of the Student Growth and Assessment Tool We support a Student Growth Tool that:
1. Reflects elements of successful national models. 2. Creates a model that positively impacts school culture and educator behavior, encourages
collaborative professional dialogue and serves as a catalyst for teacher professional growth and continuous improvement.
3. Defines state expectations for student growth that are applicable for all districts and charter schools in the state and may be used for some portion of the total student growth component.
4. Provides a clear measure of student growth to engender stakeholder understanding and trust. 5. Is comprehensive enough to address a variety of circumstances, yet simple enough to be clear
and build understanding of what data means and how it impacts teacher behavior (performance) and results.
6. Is valid in multiple contexts within different types of classrooms, schools and districts, yet not diluted to the point at which it becomes minimally effective for all.
7. Incorporates elements of student growth applicable to individual teachers as well as collective accountability applicable across all teacher groups.
Attachment 10.B
573

Michigan Council for Educator Effectiveness Interim Progress Report April 2012 Page 48 of 56
8. Accounts for classroom differences and addresses growth defined in a variety of contexts – core versus non-core, individual classroom versus building, etc.
9. Defines a clear target of expected growth as well as what constitutes above and below expectations.
10. Incorporates artifacts as valuable components of performance evaluation. 11. Includes multiple assessments that are age-appropriate and specific. 12. Is constructed to make intuitive sense to practitioners with clarity as to how the measures impact
educator practice. 13. Includes ongoing evaluation with annual opportunities for stakeholder review and feedback.
Identified Challenges
1. The model must be tested. There is a concern for psychometric issues – reliability, validity, standard error, etc.
2. The model must be connected with the Teacher Evaluation and Administrator Evaluation tools. 3. The model should address concerns over data integrity. 4. The tool should support a culture of collaboration versus competition. 5. There is concern over lack of expertise in using data: developing assessments, understanding
formative and summative assessment, and examining student work are significant challenges. 6. There are many outside factors that impact students (i.e. divorce, death in family, etc.) and
classrooms (i.e absenteeism, mobility, etc.) that may not be accounted for in formulas.
II. Teacher Evaluation Tool Critical Factors and Suggested Elements (TECF) We support a Teacher Evaluation Tool that:
1. Serves as a pathway to highly effective teaching. 2. Emphasizes a culture of collaboration versus competition. 3. Represents nationally agreed upon dimensions of professional practice and utilizes a clear,
common language. 4. Identifies target behaviors in a graduated approach that applies appropriately to first year
teachers and to veterans. 5. Utilizes multiple indicators (observations, portfolios, artifacts, etc.) to identify progress. 6. Relies upon data collected throughout the school year rather than a moment in time. 7. Includes multiple student assessments – both formative and summative – at local, state and
national levels. 8. Incorporates technology solutions to assist with data collection and management. 9. Considers Master Teachers as partners in the evaluation team. 10. Incorporates feedback from students and parents.
Identified Challenges (TEIC)
1. Development of a system that reflects fidelity for teachers of all disciplines. 2. Weighting of domains to reflect priority of components leading to teacher growth. 3. Common quality training for administrators and teachers to assure consistency among raters. 4. Determining a student growth model that aligns local and state value-added measures that are
reliable and valid. 5. Designing inputs to reduce potential for subjectivity. 6. Time involved for administrators to complete evaluations. 7. Teacher support and understanding of components.
Attachment 10.B
574
Michigan Council for Educator Effectiveness Interim Progress Report April 2012 Page 49 of 56
Appendix H: Advisory Committee Responses to MCEE Questions Michigan Council for Educator Effectiveness Response from the Advisory Council The Advisory Committee to the Governor’s Council on Educator Effectiveness (GCEE) offers the following in response to questions from the GCEE. Numbers listed after each statement refer to comments and suggestions shared in the Advisory Committee Summary of Components I and II. 1. What should be the design principles for an educator evaluation system?
Candidate design principles might include:
a) The system should be committed to and structured to support ongoing educator learning and development. [TECF 1, TECF 4]
b) Expectations should be clear and rigorous. [TECF 3] c) The system should involve multiple measures. [TECF 5]
Response: There is a consensus that each of the above design principles should be included. The evaluation system will influence behaviors of evaluators as well as those being evaluated. While the common goal is a positive change in school culture and improvement in student learning, there is a risk of compromised student learning in the pursuit of high scores. 2. What should be the criteria for selecting observation processes and tools?
Candidate criteria might include: a) The instruments should be aligned with relevant state and national standards for educators.
[TECF 3] b) The instruments should be used both for describing practice and supporting on-going
educator learning/development. [TECF 1, TECF 4, TEIC 2] c) The instruments should be accompanied with a rigorous and on-going training program for
evaluators. [TEIC 3] d) Independent research on the reliability and the validity of the instruments should be available.
[TEIC 4] e) The demands of the process should be feasible (in terms of personnel, time, and financial
cost). [TECF 8, TEIC 6]
Response: There is a consensus that each of the criteria is acceptable.
3. What other potential components of the educator evaluation system would you suggest? Among the components used in other states are the following:
a) Pre- and/or post-observation conferences [TECF 5] b) Summative evaluation conferences c) Teacher self-assessments and reflections d) Educator growth plans e) Locally developed assessments of student learning [TEIC 4] f) Structured review of student work g) Teacher artifacts using portfolio or evidence binder processes [TECF 5] h) Feedback from students, parents, and/or other teachers using structured survey tools [TECF
10] Response: All of these are potentially valuable components. Caution should be exercised when determining how many elements are involved in the default model. Some may be better left to local
Attachment 10.B
575
Michigan Council for Educator Effectiveness Interim Progress Report April 2012 Page 50 of 56
decisions as districts adapt the state model to their own system. In addition, a glossary of terms should be included as critical to development of a common understanding of the targets. 4. What lessons have districts and schools learned about instituting fair and feasible educator evaluator
systems that we should be cognizant of? Response: Based on the collective input of the Advisory Committee, we submit the following insights from local schools:
a) Too rigid a document or a top-down approach will not change culture. Local buy in is required. The value-added model should not be divisive and counter-productive to improving collaborative practices.
b) The tools must allow some local flexibility to fit local needs. o The system must be fair and flexible - tight on core components and loose on optional
components. o Local teachers must have some control over the growth goals they select.
c) Multiple measures of effectiveness are important, including: o reliable and valid student achievement data; o portfolios that provide examples of student learning; and o teacher self-evaluation components.
d) It would be helpful to make distinctions in teaching effectiveness. Some teachers are better at teaching high-needs or at risk students. Achievement in this population may not increase at the same level as other students and teachers who are making a difference with high-needs populations should not be penalized for slower growth rates.
e) Quality protocols for training evaluators are critical. We would like to see MDE provide training. f) The time involved in conducting evaluations is a concern. We would like to see a system where
other non-principal evaluators, including Master Teachers, can contribute. g) The student growth model component is emerging as the most problematic. A concrete example
must be provided that addresses the following considerations: o Nationally-normed tests, by definition are insensitive to instruction. o Local teachers should have input into student growth and assessment criteria.
Attachment 10.B
576

Michigan Council for Educator Effectiveness Interim Progress Report April 2012 Page 51 of 56
Appendix I: Michigan Department of Education Framework for Learning Foundations 1. Classroom Management: Create an environment for learning; set expectations, establish routines, embed technology in instruction, motivate students, and form supportive personal relationships with students in order to maximize instruction. 2. Educator Responsibilities: Sustain a deep understanding of both content and pedagogy; continually seek professional growth and development; use technology to enhance teaching and learning; collaborate through professional learning communities to enhance planning, instruction, and pedagogical knowledge; reflect on professional practice. 3. Essential Teacher Beliefs: Maintain firm attitudes concerning equity and anti-racism; set high expectations for all students; uphold the principle that all students can grow their intelligence; foster student motivation and improve student attitudes; display urgency and relentlessness with regards to student growth; take ownership of outcomes. 4. Initial and On-Going Instructional Planning: Conduct backward planning to create rigorous lesson, unit, and long-term plans; use standards and objectives to ground plans; embed technology in instruction. 5. Investing Families and the Community: Collaborate with the community to support students; build an open line of two-way communication between parents and teachers; communicate with students’ families when making decisions; work with parents to create a healthy learning environment at home; establish a volunteer program through which parents can become involved in classrooms and schools. Strategies for Instruction 1. Activation and Extension of Knowledge: Use technology to activate and extend knowledge; enhance students’ ability to make connections and deepen knowledge; provide mnemonic devices to help students remember and think about content; enable students to understand the relevance of content. 2. Differentiation: Assess students’ academic strengths and areas for growth; recognize students’ multiple intelligences; tailor lessons to meet the needs of diverse learners; use technology to comply with students’ learning preferences. 3. Engagement and Motivation of All Learners: Plan lessons that are culturally relevant for students; reinforce effort and positive behavior with recognition and praise; tap in to student interest and expertise. 4. Flexible Grouping: Create cooperative groups that are flexible and fluid; provide students the opportunity to work in both heterogeneous and homogenous groups; vary teaching methods between individual and whole group instruction. 5. Multiple Opportunities for Practice, Mastery, and Assessment: Provide students with academic choice; use both alternative and authentic assessments; incorporate technology into the testing process; evaluate students using both formative and summative assessments; give students the opportunity to practice skills and deepen knowledge through meaningful homework assignments. 6. Scaffolding: Confer with students; Use graduated questioning to support and challenge students in their learning; space learning over time; use direct instruction. 7. Stimulation of Critical Thinking and Problem Solving: Engage students in critical discussion surrounding content; allow students to generate and test hypotheses; lead students to practice and enhance higher order thinking skills; encourage students to consider their own learning; enable students to summarize content and compare and contrast ideas.
Attachment 10.B
577
Michigan Council for Educator Effectiveness Interim Progress Report April 2012 Page 52 of 56
Using Data 1. Instructional Decision-Making: Use data to identify instructional needs, match instructional strategies to identified needs, monitor student progress, and set goals; provide feedback to students upon identification of strengths and weaknesses; track student data with technology. 2. Using Multiple Data Sources: Use formal assessment data, informal assessment data, and non-assessment data to drive instructional decision-making.
Attachment 10.B
578
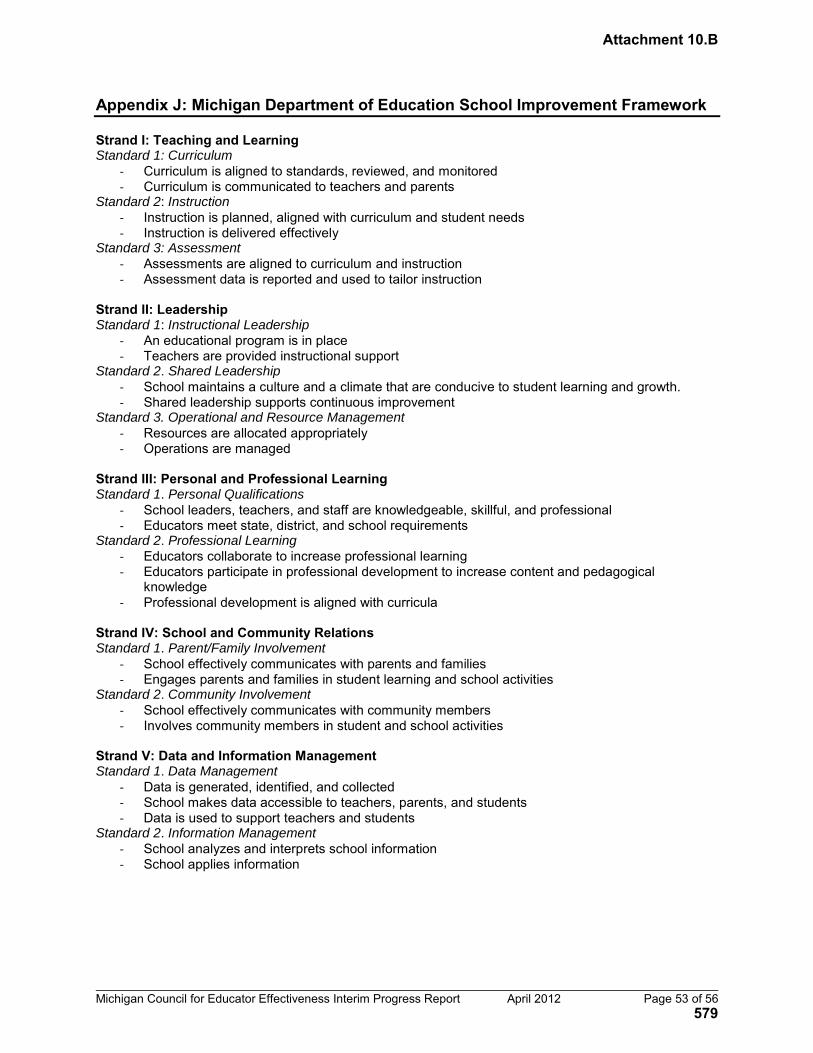
Michigan Council for Educator Effectiveness Interim Progress Report April 2012 Page 53 of 56
Appendix J: Michigan Department of Education School Improvement Framework Strand I: Teaching and Learning Standard 1: Curriculum
- Curriculum is aligned to standards, reviewed, and monitored - Curriculum is communicated to teachers and parents
Standard 2: Instruction - Instruction is planned, aligned with curriculum and student needs - Instruction is delivered effectively
Standard 3: Assessment
- Assessments are aligned to curriculum and instruction - Assessment data is reported and used to tailor instruction
Strand II: Leadership Standard 1: Instructional Leadership
- An educational program is in place - Teachers are provided instructional support
Standard 2. Shared Leadership
- School maintains a culture and a climate that are conducive to student learning and growth. - Shared leadership supports continuous improvement
Standard 3. Operational and Resource Management
- Resources are allocated appropriately - Operations are managed
Strand III: Personal and Professional Learning Standard 1. Personal Qualifications
- School leaders, teachers, and staff are knowledgeable, skillful, and professional - Educators meet state, district, and school requirements
Standard 2. Professional Learning
- Educators collaborate to increase professional learning - Educators participate in professional development to increase content and pedagogical
knowledge - Professional development is aligned with curricula
Strand IV: School and Community Relations Standard 1. Parent/Family Involvement
- School effectively communicates with parents and families - Engages parents and families in student learning and school activities
Standard 2. Community Involvement
- School effectively communicates with community members - Involves community members in student and school activities
Strand V: Data and Information Management Standard 1. Data Management
- Data is generated, identified, and collected - School makes data accessible to teachers, parents, and students - Data is used to support teachers and students
Standard 2. Information Management
- School analyzes and interprets school information - School applies information
Attachment 10.B
579

Michigan Council for Educator Effectiveness Interim Progress Report April 2012 Page 54 of 56
Appendix K: Professional Standards for Michigan Teachers Standard #1: Subject Matter Knowledge-Base In General and Liberal Education: An understanding and appreciation of general and liberal arts including English, literature, humanities, social sciences, mathematics, natural or physical sciences, and the arts. Standard #2: Instructional Design and Assessment: Facilitation of learning and achievement of all students (in accordance with the SBE Universal Education Vision and Principles). Standard #3: Curricular and Pedagogical Content Knowledge Aligned with State Resources: Knowledge of subject matter and pedagogy with reference to the MCF and other state sponsored resources, for consistent and equitable learning in Michigan schools. Standard #4: Effective Learning Environments: Management and monitoring of time, relationships, students, and classrooms to enhance learning. Standard #5: Responsibilities and Relationships to the School, Classroom, and Student: Systematic reflection to organize and improve teaching and develop effective relationships. Standard #6: Responsibilities and Relationships to the Greater Community Participation in professional, local, state, national, and global learning communities. Standard #7: Technology Operation and Concepts: Use of technological tools, operations and concepts to enhance learning, personal/professional productivity, and communication.
Attachment 10.B
580
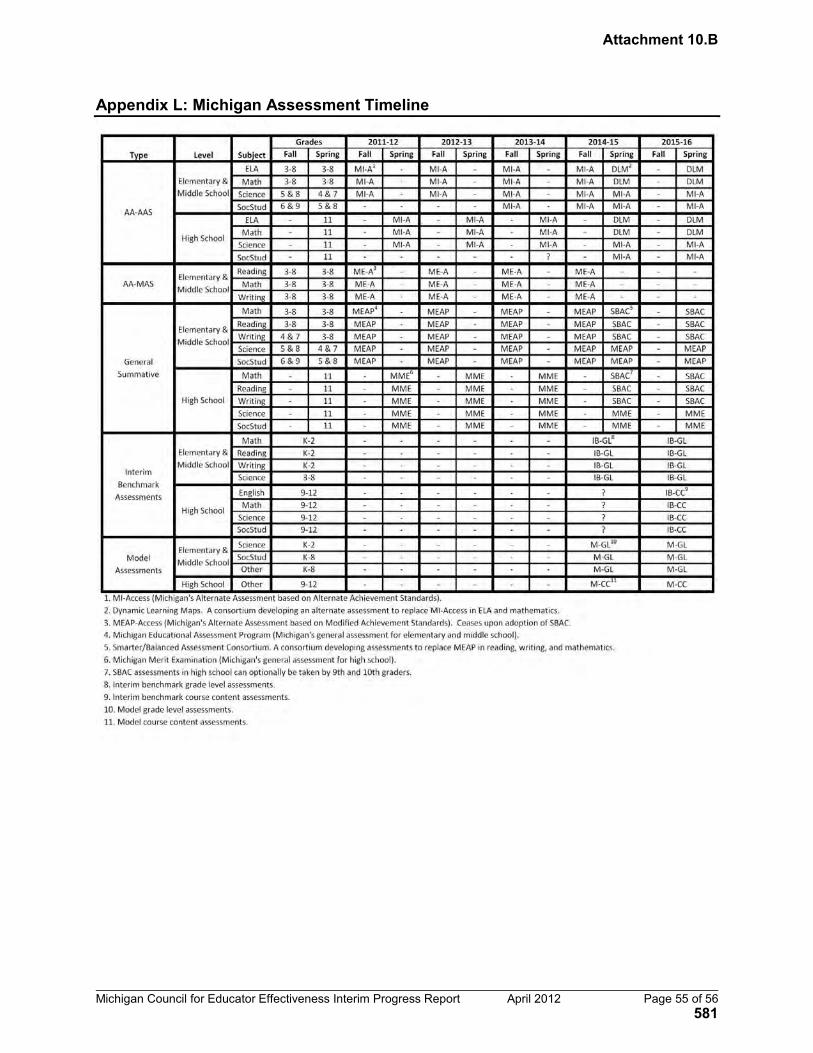
Michigan Council for Educator Effectiveness Interim Progress Report April 2012 Page 55 of 56
Appendix L: Michigan Assessment Timeline
Attachment 10.B
581

Michigan Council for Educator Effectiveness Interim Progress Report April 2012 Page 56 of 56
Appendix M: Evaluation System Pilot Proposed Budget
Staff costs
$ 460,693
ACT Explore/Plan costs 1,307,700
CAT costs
582,650
Observation costs
2,805,900
VAM Analysis, $50,000/test for MEAP, MME, MIA, EPA, and CAT 250,000
Rostering/Data Hosting ($3/student) 225,000
External vendor to assist districts in incorporating existing common assessment non-tested grades & subjects:
250,000
Evaluation Write up
200,000
Analysis of Combined Metrics 100,000
Analysis of Observation Metrics 100,000
Observation tool Cost 100,975
Total Pilot Costs
$ 6,382,918
ACT/Explore/Plan costs already incurred $ (328,500)
Net Pilot Costs
$ 6,054,418
Attachment 10.B
582
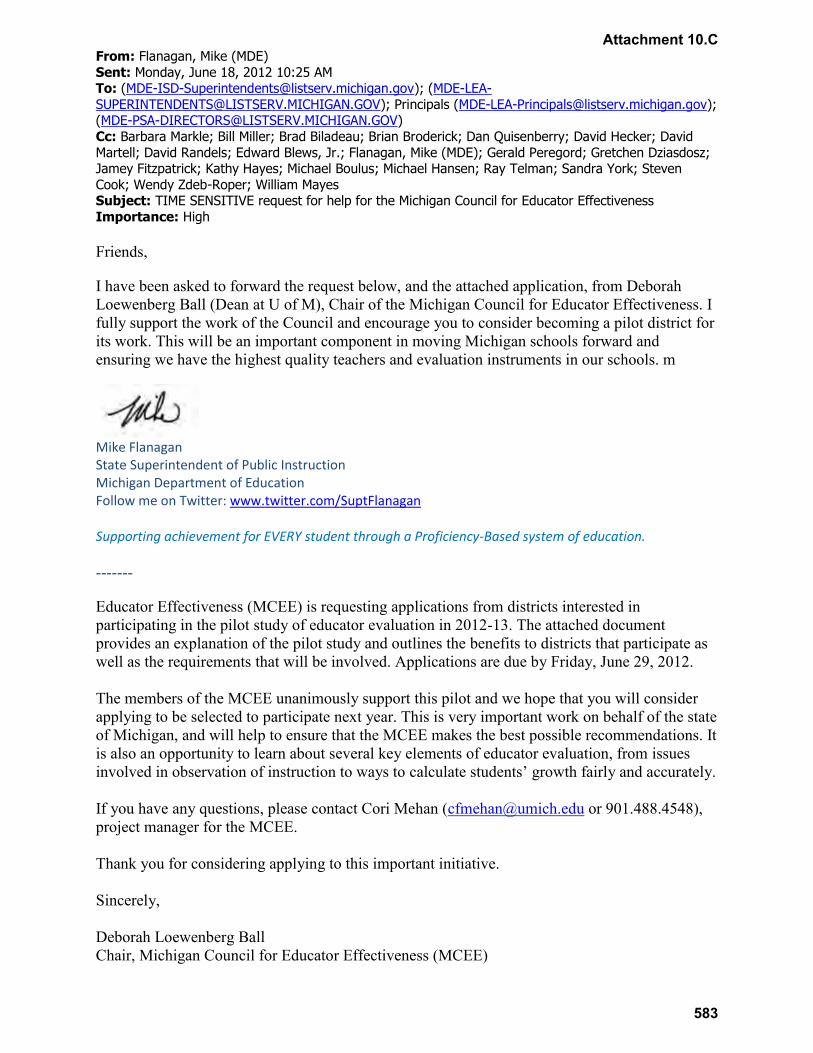
From: Flanagan, Mike (MDE)
Sent: Monday, June 18, 2012 10:25 AM To: ([email protected]); (MDE-LEA-
[email protected]); Principals ([email protected]); ([email protected])
Cc: Barbara Markle; Bill Miller; Brad Biladeau; Brian Broderick; Dan Quisenberry; David Hecker; David
Martell; David Randels; Edward Blews, Jr.; Flanagan, Mike (MDE); Gerald Peregord; Gretchen Dziasdosz; Jamey Fitzpatrick; Kathy Hayes; Michael Boulus; Michael Hansen; Ray Telman; Sandra York; Steven
Cook; Wendy Zdeb-Roper; William Mayes Subject: TIME SENSITIVE request for help for the Michigan Council for Educator Effectiveness
Importance: High
Friends,
I have been asked to forward the request below, and the attached application, from Deborah Loewenberg Ball (Dean at U of M), Chair of the Michigan Council for Educator Effectiveness. I fully support the work of the Council and encourage you to consider becoming a pilot district for its work. This will be an important component in moving Michigan schools forward and ensuring we have the highest quality teachers and evaluation instruments in our schools. m
Mike Flanagan State Superintendent of Public Instruction Michigan Department of Education Follow me on Twitter: www.twitter.com/SuptFlanagan Supporting achievement for EVERY student through a Proficiency-Based system of education.
-------
Educator Effectiveness (MCEE) is requesting applications from districts interested in participating in the pilot study of educator evaluation in 2012-13. The attached document provides an explanation of the pilot study and outlines the benefits to districts that participate as well as the requirements that will be involved. Applications are due by Friday, June 29, 2012. The members of the MCEE unanimously support this pilot and we hope that you will consider applying to be selected to participate next year. This is very important work on behalf of the state of Michigan, and will help to ensure that the MCEE makes the best possible recommendations. It is also an opportunity to learn about several key elements of educator evaluation, from issues involved in observation of instruction to ways to calculate students’ growth fairly and accurately. If you have any questions, please contact Cori Mehan ([email protected] or 901.488.4548), project manager for the MCEE. Thank you for considering applying to this important initiative. Sincerely, Deborah Loewenberg Ball Chair, Michigan Council for Educator Effectiveness (MCEE)
Attachment 10.C
583

Michigan Council for Educator Effectiveness • ph: 901.488.4548 • fax: 734.764.3473 • [email protected] East University Avenue, Suite 1110 • Ann Arbor, MI 48109-1259
Benefits of and Requirements for Participation in the Pilot
Classroom Observations• TrainingwillbeprovidedforschooladministratorsandotherschoolprofessionalsononeoftheclassroomobservationframeworksselectedbyMCEEforthepilot(e.g.,FrameworkforTeaching;MarzanoObservationalProtocol;5DimensionsofTeachingandLearning;ThoughtfulClassroom;TAP).
• Trainedexternalobserverswillcarryoutobservationssimultaneouslywithschooladministratorsandotherschoolprofessionals.
• Participantswillconductclassroomobservationsasrequiredbytheframeworkbeingpiloted,includingnumber,type,andlengthofobservationsandpre-andpost-observationconferencing.
Assessments• PretestingofallstudentswilltakeplaceinSeptember2012.• TrainingofproctorsasneededforACTtestadministrationwillbeprovided.
• Pre-andpost-administrationoftheACTsuiteofcollege-readinessindicatortestswillbeprovided,including:
- EXPLORE(forgrades7–9)- PLAN(forgrade10)- ACT(forgrades11and12)
• Pre-midyear-andpost-administrationofacomputeradaptivetest(CAT)inatleastreadingandmathematicsingradesK–6willbeprovided.
• Sufficientaccesstocomputersisarequirementforparticipation.
Growth/Value Added Measures Thefollowinggrowth/valueaddedmeasureswillbecalculatedbytheindependentorganizationandprovidedtodistricts:• IndividualstudentgrowthmeasuresbasedontheEXPLORE/PLAN/ACTresults.
• IndividualstudentgrowthmeasuresbasedontheCATresults.• ValueAddedModeling(VAM),tyingstudentgrowthdatatoindividualteachersrunontheMEAP,MME,MI-Access,EXPLORE/PLAN/ACT,andtheCATs.
Scoring of Educator EffectivenessParticipatingdistrictswillberequiredtodetermineratingsforteachers,basedondatacollectedinthepilot.
Assessing Student Growth in a Non-Core SubjectParticipatingdistrictswillbeaskedtodevelopastudentgrowthtoolinatleastonenon-coresubject,suchasmusic,physicaleducation,orthearts,inatleastonegradelevelaspartofthepilotstudy.
Administrator EvaluationParticipatingdistrictswillalsotakepartinthepilotoftheadministratorevaluationtoolduringthewinterandspringof2013.
TheMichigan Council for Educator Effectiveness (MCEE)seeksapplicationsfromMichiganschooldistrictstoparticipateinapilotstudyofapproachestoeducatorevaluationduringthe2012–13schoolyear.
PendingappropriationsfromtheMichiganlegislaturetofundthepilot,theMCEEwillselectapproximately12districtstoparticipateinthepilot.Districtsmayapplytoparticipateinthepilotregardlessofthedegreeofdevelopmentandimplementationoftheirowneducatorevaluationsystems.Participatingdistrictsmaychoosetoapplytoparticipateattheelementary,middle,orsecondaryschoollevels,oratalllevels;however,preferencewillbegiventodistrictsthatapplytoparticipateatalllevels.MCEEwillmakeitsselectionofdistrictsbased
ongeographiclocation,demographics,andsizeinordertomakethestudyasrepresentativeaspossibleofMichiganschoolsystems.
Thepilotstudywillbestructuredasasetofactivitiesandresearchprojectsmanagedandexecutedbyanexternaluniversity-basedresearchpartnerunderthedirectionoftheMCEE.Districtsinthepilotwillbeexpectedtocooperatewiththeexternalorganizationtoassurethequalityofthepilotstudy.Thiswillincludethesubmissionofadministrator,teacher,andstudentdata,aswellasteacherandschooladministratorsurveys,videos,andinterviews.Allsubmitteddatawillbetreatedwithcompleteconfidentialityinaccordancewithstandardsofallapplicableinstitutionalreviewboards.TheresultsofthispilotstudywillinformthefinalrecommendationsoftheMCEEregardingastatewideeducatorevaluationsystem.Anapplicationformisattached.
Request for Applications for Participation in the Michigan Council for Educator Effectiveness (MCEE) Pilot Study of Educator Effectiveness Tools
Michigan Council forEducator Effectiveness
MCEE
Attachment 10.C
584

Michigan Council for Educator Effectiveness • ph: 901.488.4548 • fax: 734.764.3473 • [email protected] East University Avenue, Suite 1110 • Ann Arbor, MI 48109-1259
Application for Participation in the Michigan Council for Educator Effectiveness (MCEE) Pilot Study of Educator Effectiveness Tools
Michigan Council forEducator Effectiveness
MCEE
District name: District code:
Your name: Phone: Email:
Number of school buildings by grade configuration:
Number of teachers by grade level:
Number of students in each grade level:
Describe what is currently in place for educator evaluations in your district:Please include copies of your current observation tool and administrator evaluation system as attachments when you submit this form.
Describe the people who are currently responsible for educator evaluations in your district. Include the number per building and their roles (e.g., superintendent, principal, assistant principal, lead teacher, etc.):
List the current student achievement assessments currently in use in your district:
Explain how growth is currently incorporated into educator evaluations and the measures that are used:
Middle/Junior High High SchoolElementary
K 1 2 3 4 5 6–8 9–12
K 1 2 3 4 5 6 7 8 9 10 11 12
Savethisdocument,thensendcompletedformandrequiredattachmentstoCori Mehan,MCEEprojectmanager,[email protected]. Deadline: June 29, 2012
Attachment 10.C
585
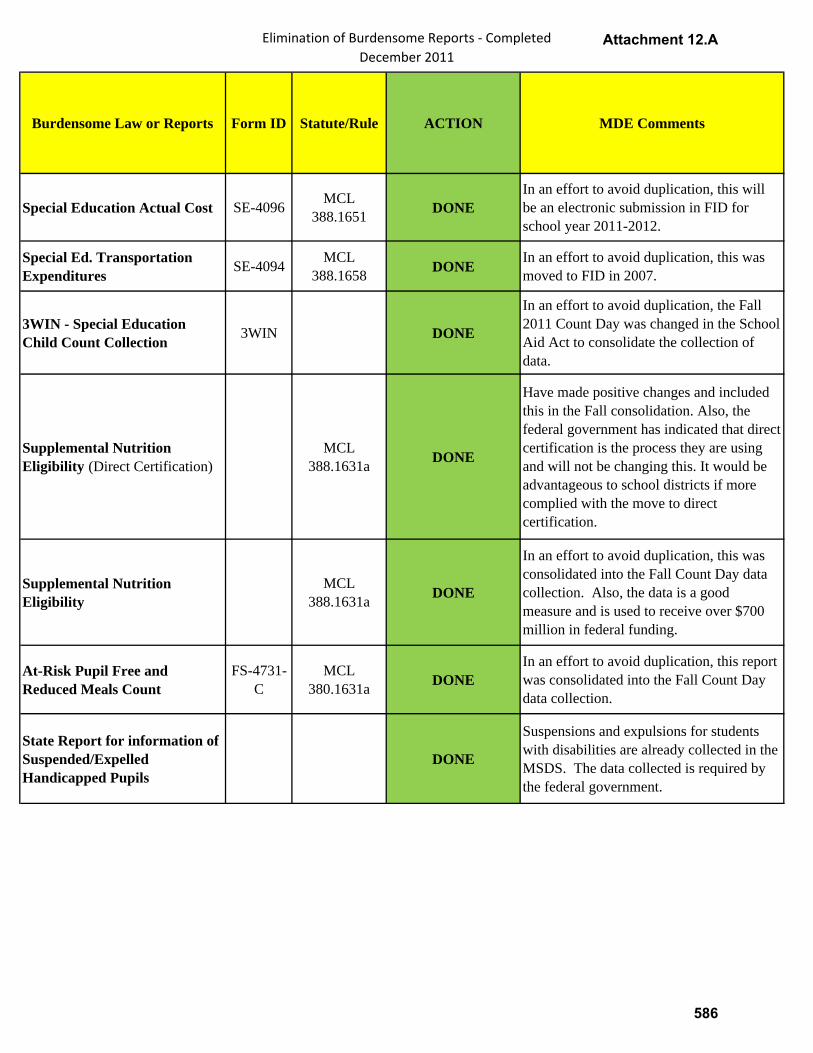
Elimination of Burdensome Reports ‐ CompletedDecember 2011
Burdensome Law or Reports Form ID Statute/Rule ACTION MDE Comments
Special Education Actual Cost SE-4096 MCL 388.1651 DONE
In an effort to avoid duplication, this will be an electronic submission in FID for school year 2011-2012.
Special Ed. Transportation Expenditures SE-4094 MCL
388.1658 DONE In an effort to avoid duplication, this was moved to FID in 2007.
3WIN - Special Education Child Count Collection 3WIN DONE
In an effort to avoid duplication, the Fall 2011 Count Day was changed in the School Aid Act to consolidate the collection of data.
Supplemental Nutrition Eligibility (Direct Certification)
MCL 388.1631a DONE
Have made positive changes and included this in the Fall consolidation. Also, the federal government has indicated that direct certification is the process they are using and will not be changing this. It would be advantageous to school districts if more complied with the move to direct certification.
Supplemental Nutrition Eligibility
MCL 388.1631a DONE
In an effort to avoid duplication, this was consolidated into the Fall Count Day data collection. Also, the data is a good measure and is used to receive over $700 million in federal funding.
At-Risk Pupil Free and Reduced Meals Count
FS-4731-C
MCL 380.1631a DONE
In an effort to avoid duplication, this report was consolidated into the Fall Count Day data collection.
State Report for information of Suspended/Expelled Handicapped Pupils
DONE
Suspensions and expulsions for students with disabilities are already collected in the MSDS. The data collected is required by the federal government.
Attachment 12.A
586
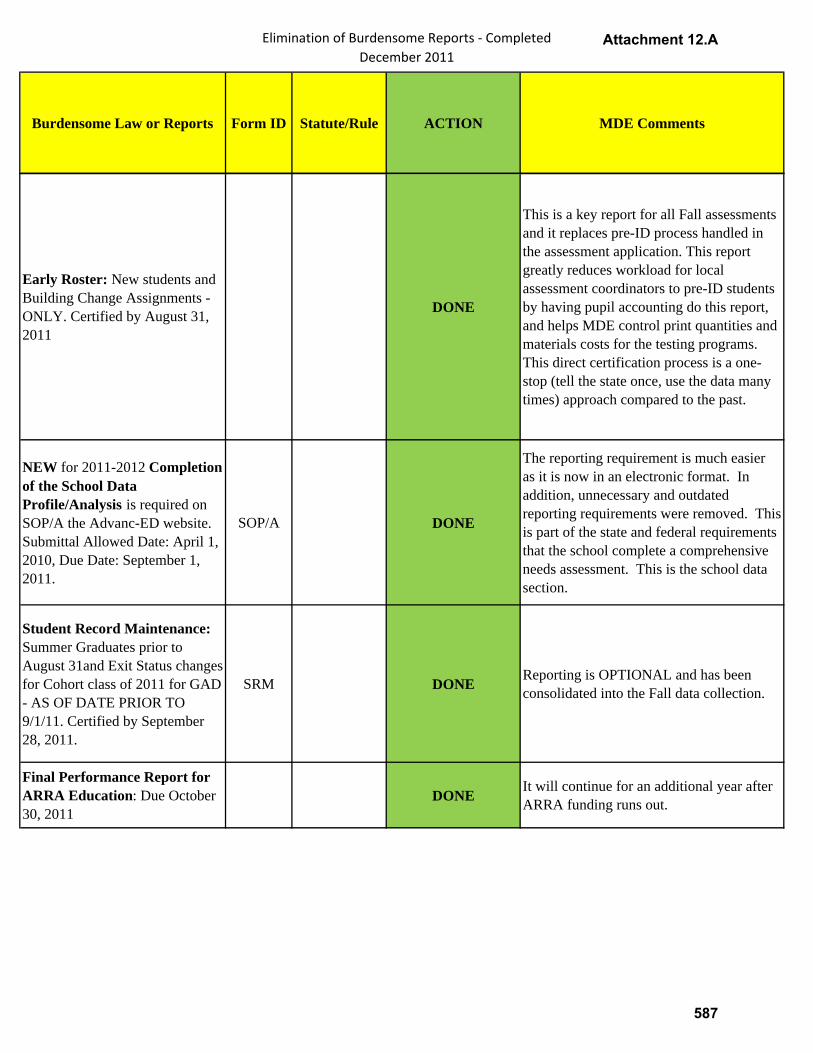
Elimination of Burdensome Reports ‐ CompletedDecember 2011
Burdensome Law or Reports Form ID Statute/Rule ACTION MDE Comments
Early Roster: New students and Building Change Assignments - ONLY. Certified by August 31, 2011
DONE
This is a key report for all Fall assessments and it replaces pre-ID process handled in the assessment application. This report greatly reduces workload for local assessment coordinators to pre-ID students by having pupil accounting do this report, and helps MDE control print quantities and materials costs for the testing programs. This direct certification process is a one-stop (tell the state once, use the data many times) approach compared to the past.
NEW for 2011-2012 Completion of the School Data Profile/Analysis is required on SOP/A the Advanc-ED website. Submittal Allowed Date: April 1, 2010, Due Date: September 1, 2011.
SOP/A DONE
The reporting requirement is much easier as it is now in an electronic format. In addition, unnecessary and outdated reporting requirements were removed. This is part of the state and federal requirements that the school complete a comprehensive needs assessment. This is the school data section.
Student Record Maintenance: Summer Graduates prior to August 31and Exit Status changes for Cohort class of 2011 for GAD - AS OF DATE PRIOR TO 9/1/11. Certified by September 28, 2011.
SRM DONE Reporting is OPTIONAL and has been consolidated into the Fall data collection.
Final Performance Report for ARRA Education: Due October 30, 2011
DONE It will continue for an additional year after ARRA funding runs out.
Attachment 12.A
587
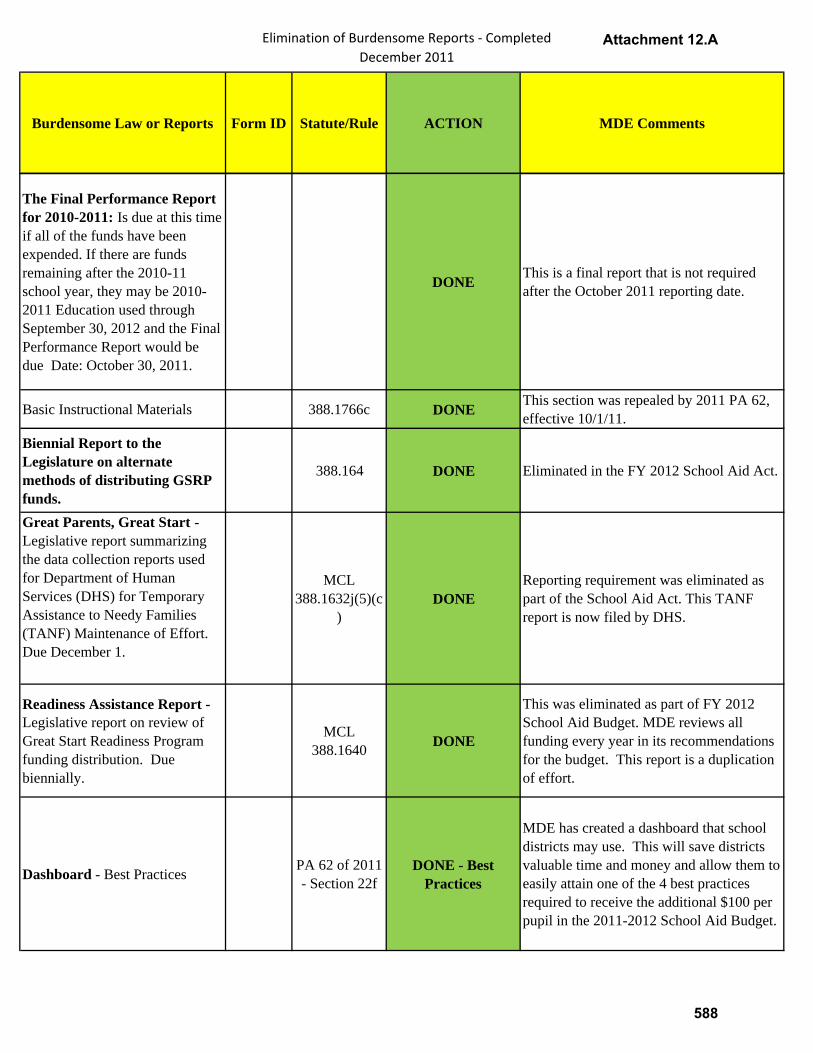
Elimination of Burdensome Reports ‐ CompletedDecember 2011
Burdensome Law or Reports Form ID Statute/Rule ACTION MDE Comments
The Final Performance Report for 2010-2011: Is due at this time if all of the funds have been expended. If there are funds remaining after the 2010-11 school year, they may be 2010-2011 Education used through September 30, 2012 and the Final Performance Report would be due Date: October 30, 2011.
DONE This is a final report that is not required after the October 2011 reporting date.
Basic Instructional Materials 388.1766c DONE This section was repealed by 2011 PA 62, effective 10/1/11.
Biennial Report to the Legislature on alternate methods of distributing GSRP funds.
388.164 DONE Eliminated in the FY 2012 School Aid Act.
Great Parents, Great Start - Legislative report summarizing the data collection reports used for Department of Human Services (DHS) for Temporary Assistance to Needy Families (TANF) Maintenance of Effort. Due December 1.
MCL 388.1632j(5)(c
) DONE
Reporting requirement was eliminated as part of the School Aid Act. This TANF report is now filed by DHS.
Readiness Assistance Report - Legislative report on review of Great Start Readiness Program funding distribution. Due biennially.
MCL 388.1640 DONE
This was eliminated as part of FY 2012 School Aid Budget. MDE reviews all funding every year in its recommendations for the budget. This report is a duplication of effort.
Dashboard - Best Practices PA 62 of 2011 - Section 22f
DONE - Best Practices
MDE has created a dashboard that school districts may use. This will save districts valuable time and money and allow them to easily attain one of the 4 best practices required to receive the additional $100 per pupil in the 2011-2012 School Aid Budget.
Attachment 12.A
588
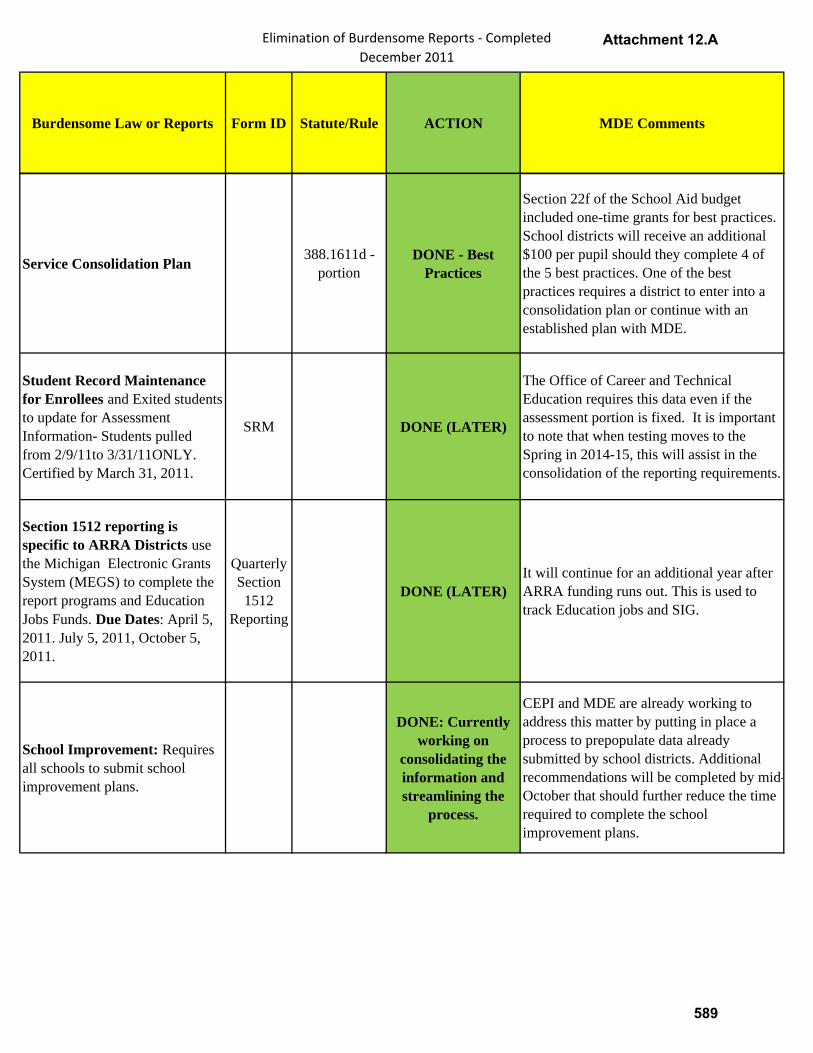
Elimination of Burdensome Reports ‐ CompletedDecember 2011
Burdensome Law or Reports Form ID Statute/Rule ACTION MDE Comments
Service Consolidation Plan 388.1611d - portion
DONE - Best Practices
Section 22f of the School Aid budget included one-time grants for best practices. School districts will receive an additional $100 per pupil should they complete 4 of the 5 best practices. One of the best practices requires a district to enter into a consolidation plan or continue with an established plan with MDE.
Student Record Maintenance for Enrollees and Exited students to update for Assessment Information- Students pulled from 2/9/11to 3/31/11ONLY. Certified by March 31, 2011.
SRM DONE (LATER)
The Office of Career and Technical Education requires this data even if the assessment portion is fixed. It is important to note that when testing moves to the Spring in 2014-15, this will assist in the consolidation of the reporting requirements.
Section 1512 reporting is specific to ARRA Districts use the Michigan Electronic Grants System (MEGS) to complete the report programs and Education Jobs Funds. Due Dates: April 5, 2011. July 5, 2011, October 5, 2011.
Quarterly Section
1512 Reporting
DONE (LATER)It will continue for an additional year after ARRA funding runs out. This is used to track Education jobs and SIG.
School Improvement: Requires all schools to submit school improvement plans.
DONE: Currently working on
consolidating the information and streamlining the
process.
CEPI and MDE are already working to address this matter by putting in place a process to prepopulate data already submitted by school districts. Additional recommendations will be completed by mid-October that should further reduce the time required to complete the school improvement plans.
Attachment 12.A
589
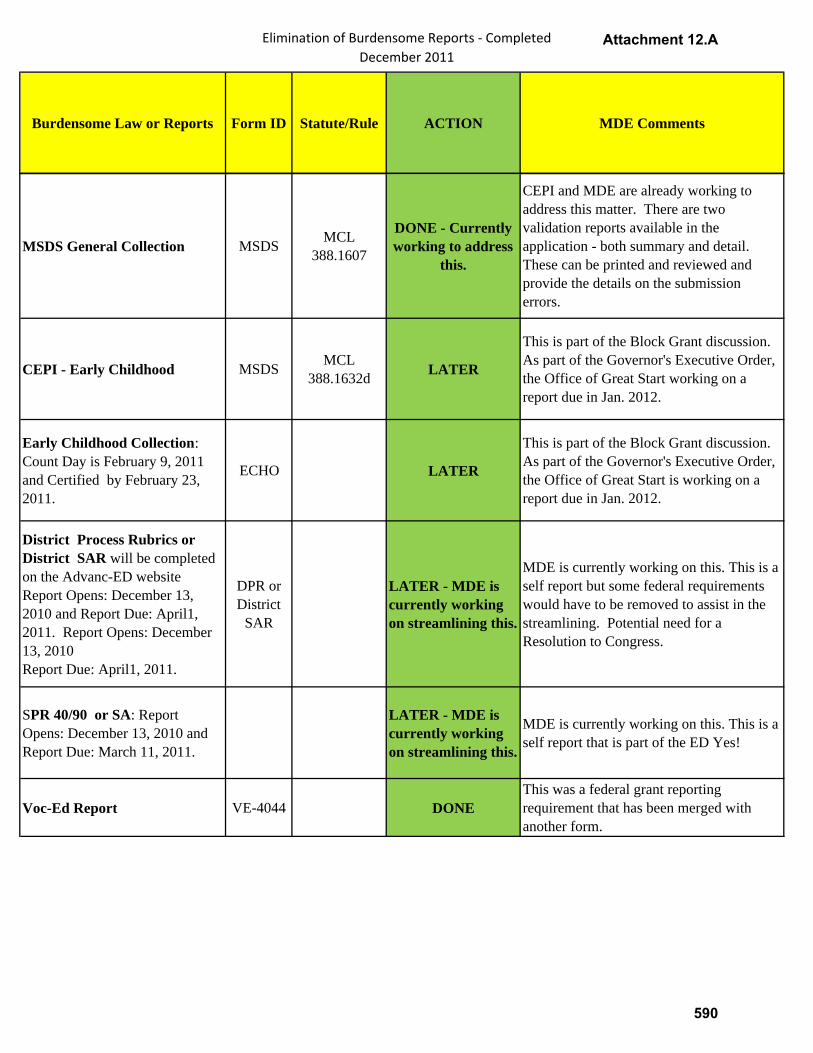
Elimination of Burdensome Reports ‐ CompletedDecember 2011
Burdensome Law or Reports Form ID Statute/Rule ACTION MDE Comments
MSDS General Collection MSDS MCL 388.1607
DONE - Currently working to address
this.
CEPI and MDE are already working to address this matter. There are two validation reports available in the application - both summary and detail. These can be printed and reviewed and provide the details on the submission errors.
CEPI - Early Childhood MSDS MCL 388.1632d LATER
This is part of the Block Grant discussion. As part of the Governor's Executive Order, the Office of Great Start working on a report due in Jan. 2012.
Early Childhood Collection: Count Day is February 9, 2011 and Certified by February 23, 2011.
ECHO LATER
This is part of the Block Grant discussion. As part of the Governor's Executive Order, the Office of Great Start is working on a report due in Jan. 2012.
District Process Rubrics or District SAR will be completed on the Advanc-ED website Report Opens: December 13, 2010 and Report Due: April1, 2011. Report Opens: December 13, 2010Report Due: April1, 2011.
DPR or District
SAR
LATER - MDE is currently working on streamlining this.
MDE is currently working on this. This is a self report but some federal requirements would have to be removed to assist in the streamlining. Potential need for a Resolution to Congress.
SPR 40/90 or SA: Report Opens: December 13, 2010 and Report Due: March 11, 2011.
LATER - MDE is currently working on streamlining this.
MDE is currently working on this. This is a self report that is part of the ED Yes!
Voc-Ed Report VE-4044 DONEThis was a federal grant reporting requirement that has been merged with another form.
Attachment 12.A
590
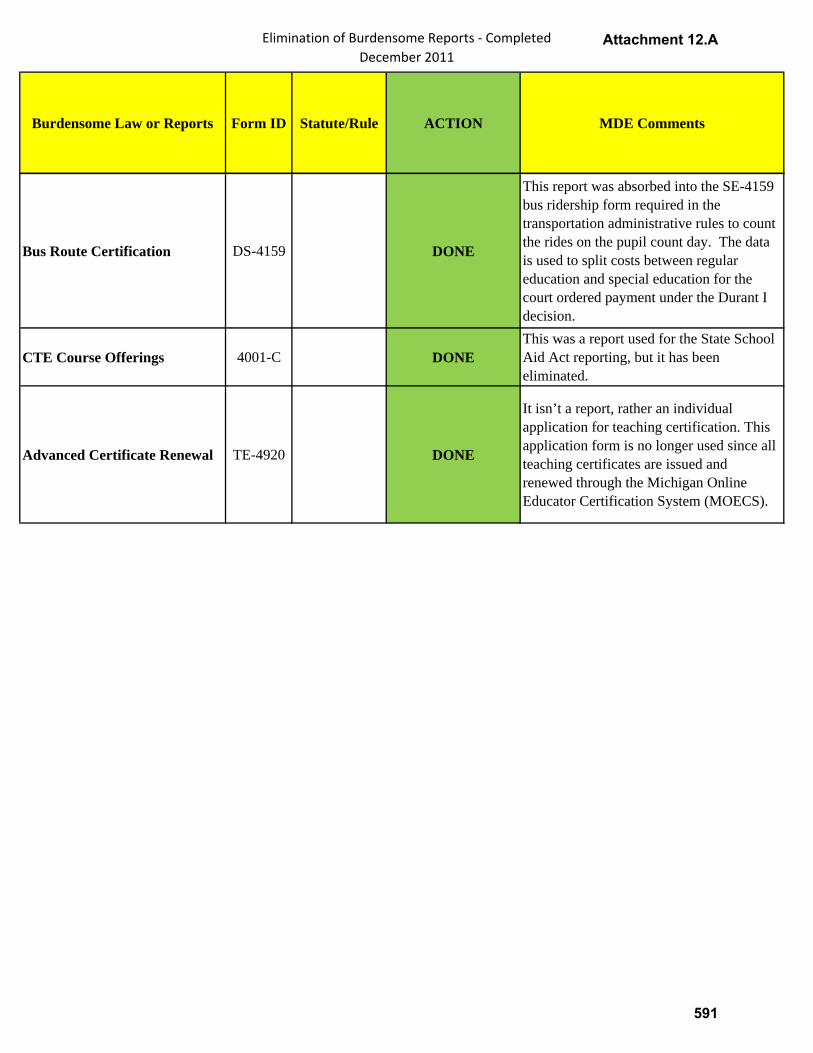
Elimination of Burdensome Reports ‐ CompletedDecember 2011
Burdensome Law or Reports Form ID Statute/Rule ACTION MDE Comments
Bus Route Certification DS-4159 DONE
This report was absorbed into the SE-4159 bus ridership form required in the transportation administrative rules to count the rides on the pupil count day. The data is used to split costs between regular education and special education for the court ordered payment under the Durant I decision.
CTE Course Offerings 4001-C DONEThis was a report used for the State School Aid Act reporting, but it has been eliminated.
Advanced Certificate Renewal TE-4920 DONE
It isn’t a report, rather an individual application for teaching certification. This application form is no longer used since all teaching certificates are issued and renewed through the Michigan Online Educator Certification System (MOECS).
Attachment 12.A
591

Elimination of Burdensome Reports ‐ Requiring LegislationDecember 2011
Burdensome Law or Report Form ID Statute/Rule ACTION Rationale for Action
Interim Federal Expenditure: Early On
RESOLUTION TO CONGRESS
MDE only asks for the minimum federal requirement. This is for 3 grants and the grants are for two years each. Yes, the information is quite detailed, but the application is required should they want to receive the funding for the second year.
Certification of Constitutionally Protected Prayer
NCLB, Section 9525
RESOLUTION TO CONGRESS
This information isn't collected anywhere else.
Local Education Agency Planning Cycle Application: Planning Component of the Consolidated Application completed on the Advanc-ED website. Due Date for July 1, 2011 Obligation Date: TBD
LEAPCA RESOLUTION TO CONGRESS
This is federally required in ESEA and contains information necessary to approve the use of funds for programs and services.
The Annual Education Report: Needs to be published on the district's and school's websites respectively with links to the Data for Student Success. Published on Website 15 Days Before the Start of the School Year.
AER RESOLUTION TO CONGRESS
This is highly technical and specified in NCLB. It's been revamped recently but still a waste. Parents are sent a 26 page document to fill out and submit tot he district. The Annual Education Report is required under ESEA for all districts in states that receive Title I funds. The report must be published and all the fields are required.
State Schools for the Deaf and Blind as Public Schools Act
MCL 393.21, 393.51, 393.61
STATE LEGISLATION - AMEND
Update archaic language.
Michigan School for the Blind Act
1893 PA 123 - MCL 393.101 –
393.111
STATE LEGISLATION - AMEND
Update archaic language. If amended, repeal MSD Act.
Michigan School for the Deaf Act
1893 PA 116 - MCL 393.15 –
393.69
STATE LEGISLATION - AMEND
Update archaic language. If amended, repeal MSB Act.
Attachment 12.B
592

Elimination of Burdensome Reports ‐ Requiring LegislationDecember 2011
Burdensome Law or Report Form ID Statute/Rule ACTION Rationale for Action
School for the Blind - State Board of Education Act MCL 388.1008b
STATE LEGISLATION - AMEND
Authority was transferred from State Board of Education to the Superintendent of Public Instruction by Executive Order. Language should be updated. Reference to “state board” should be amended to “superintendent of public instruction. "Reference to "as authorized by the superintendent of the school for the blind" should be amended to "as authorized by the superintendent of public instruction. Reference to “school for the blind” should be amended to “students who are blind.”
Schools for the Deaf and Schools for the Blind - State Board of Education Act
MCL 388.1010(a)
STATE LEGISLATION - AMEND
Update language: Authority was transferred to the Department of Human Services by Executive Order. Reference to "Michigan school for the deaf” and “Michigan school for the blind” should be amended to “schools for the deaf and blind.” Delete reference to “Michigan rehabilitation institute for veterans and disabled adults at Pine Lake.
Attachment 12.B
593

Elimination of Burdensome Reports ‐ Requiring LegislationDecember 2011
Burdensome Law or Report Form ID Statute/Rule ACTION Rationale for Action
Right to enroll in Kindergarten in the second semester if a district has semiannual promotions.
MCL 380.1147(2)
STATE LEGISLATION - AMEND
Delete this sentence: In a school district which has semiannual promotions, a child, resident of the district, is entitled to enroll in kindergarten for the second semester if the child is at least 5 years of age on March 1 of the year of enrollment. Rationale: The provision is obsolete as no district currently offers semiannual promotions, which means that each grade, K-12, is divided into a beginning and advanced section, and all children are promoted every semester. There is literature back to the 1950s about eliminating the semiannual option.
Attachment 12.B
594

Elimination of Burdensome Reports ‐ Requiring LegislationDecember 2011
Burdensome Law or Report Form ID Statute/Rule ACTION Rationale for Action
ECIC report on Great Start Collaborative Grants.
MCL 388.1632b(4)
STATE LEGISLATION - AMEND
MDE is responsible for submitting ECIC’s report. Amend to allow ECIC to submit the report directly. When MDE submits the report, it must be approved on many levels and then be reported to the State Board of Education. ECIC has its own oversight Board. Change as indicated: Not later than December 1 of each fiscal year, for the grants awarded under this section for the immediately preceding fiscal year, the ECIC shall provide to the house and senate appropriations subcommittees on state school aid, the state budget director, and the house and senate fiscal agencies a report detailing the amount of each grant awarded under this section, the grant recipients, the activities funded by each grant under this section, and an analysis of each grant recipient's success in addressing the development of a comprehensive system of early childhood services and supports.
Conviction Report of Teachers - Legislative report on actions affecting a person’s teaching certificate during the preceding quarter. Due quarterly.
MCL 380.1535a(12)
STATE LEGISLATION - AMEND
Amend language to require this report annually instead of quarterly.
Conviction Report of Administrators - Legislative report on actions taken affecting a person’s state board approval during the preceding quarter. Due quarterly.
MCL 380.1539b(12) -
STATE LEGISLATION - AMEND
Amend language to combine this report with the teacher conviction report and require annually instead of quarterly.
Attachment 12.B
595

Elimination of Burdensome Reports ‐ Requiring LegislationDecember 2011
Burdensome Law or Report Form ID Statute/Rule ACTION Rationale for Action
ISD Maps MCL 380.626STATE LEGISLATION - AMEND
MDE does not collect ISD maps. If the maps are necessary, then this should be amended to require the ISDs to maintain the maps.
Auxiliary ServicesMCL 380.1296
R 340.291 - R 340.295
STATE LEGISLATION - ELIMINATE AND RESCIND RULE
This section and the rules are duplicative of federal requirements in IDEA. The rules and law impose lower standards for special education services than the federal requirement and are rendered moot. In fact, Sec. 380.1296 creates many funding problems and confusion that leads to consistent noncompliance with the federal law. It is recommended that Section 1296 be repealed and the rules be rescinded.
Special Education Programs and Services
MCL 380.1711(1)(a)
STATE LEGISLATION-AMEND
MCL 380.1711(1)(a) should be amended to stike the language that says "develop the maximum potential" from the subsection and replace it with "meet the individual needs". This would align the language with IDEA and Michigan rules.
Certification of Eye Protective Devices
MCL 380.1288 - R 340.1301 - R 340.1305
STATE LEGISLATION-AMEND OR RESCIND RULES
Amend 380.1288 reference to National Standards Institute Guidelines are obsolete. Rules governing Eye Protective Devices requires reporting to ISD under R 340.1305. This reporting was added to MEGS several years ago. This rule should be amended or rescinded. Also, Executive Order 1996-12 transferred rule making authority from the State Board of Education to the Superintendent of Public Instruction.
Attachment 12.B
596
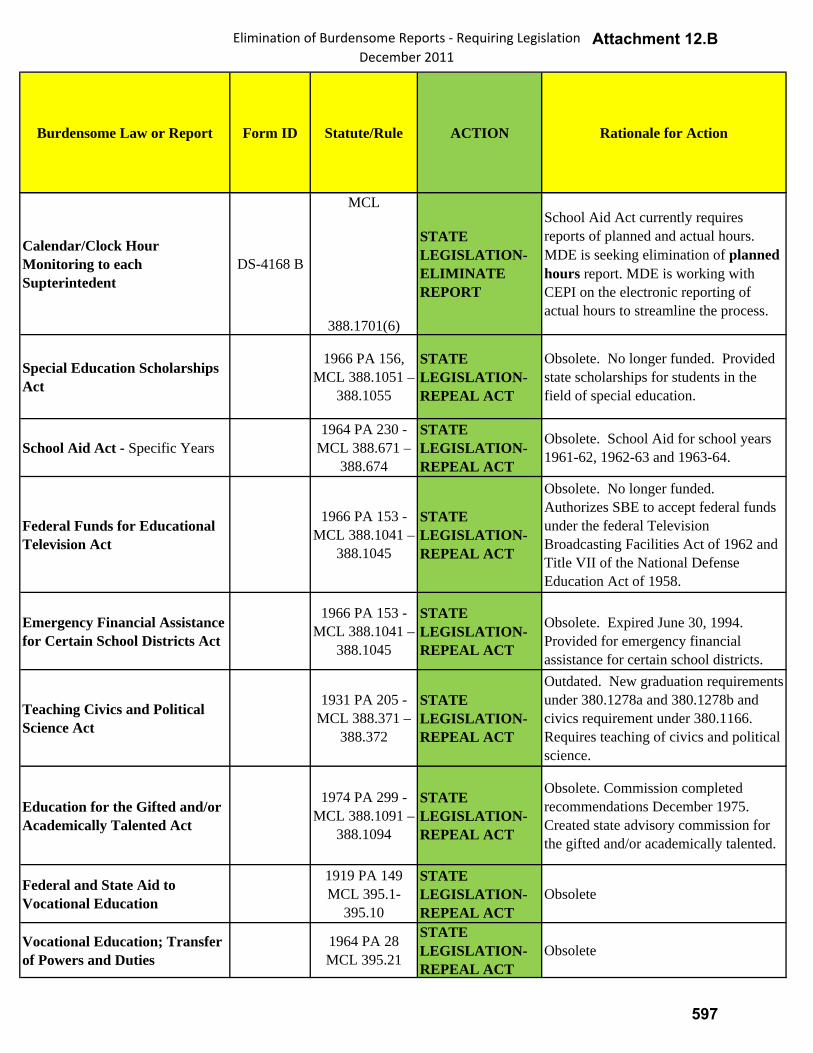
Elimination of Burdensome Reports ‐ Requiring LegislationDecember 2011
Burdensome Law or Report Form ID Statute/Rule ACTION Rationale for Action
Calendar/Clock Hour Monitoring to each Supterintedent
DS-4168 B
MCL
388.1701(6)
STATE LEGISLATION-ELIMINATE REPORT
School Aid Act currently requires reports of planned and actual hours. MDE is seeking elimination of planned hours report. MDE is working with CEPI on the electronic reporting of actual hours to streamline the process.
Special Education Scholarships Act
1966 PA 156, MCL 388.1051 –
388.1055
STATE LEGISLATION-REPEAL ACT
Obsolete. No longer funded. Provided state scholarships for students in the field of special education.
School Aid Act - Specific Years1964 PA 230 -
MCL 388.671 – 388.674
STATE LEGISLATION-REPEAL ACT
Obsolete. School Aid for school years 1961-62, 1962-63 and 1963-64.
Federal Funds for Educational Television Act
1966 PA 153 - MCL 388.1041 –
388.1045
STATE LEGISLATION-REPEAL ACT
Obsolete. No longer funded. Authorizes SBE to accept federal funds under the federal Television Broadcasting Facilities Act of 1962 and Title VII of the National Defense Education Act of 1958.
Emergency Financial Assistance for Certain School Districts Act
1966 PA 153 - MCL 388.1041 –
388.1045
STATE LEGISLATION-REPEAL ACT
Obsolete. Expired June 30, 1994. Provided for emergency financial assistance for certain school districts.
Teaching Civics and Political Science Act
1931 PA 205 - MCL 388.371 –
388.372
STATE LEGISLATION-REPEAL ACT
Outdated. New graduation requirements under 380.1278a and 380.1278b and civics requirement under 380.1166. Requires teaching of civics and political science.
Education for the Gifted and/or Academically Talented Act
1974 PA 299 - MCL 388.1091 –
388.1094
STATE LEGISLATION-REPEAL ACT
Obsolete. Commission completed recommendations December 1975. Created state advisory commission for the gifted and/or academically talented.
Federal and State Aid to Vocational Education
1919 PA 149 MCL 395.1-
395.10
STATE LEGISLATION-REPEAL ACT
Obsolete
Vocational Education; Transfer of Powers and Duties
1964 PA 28 MCL 395.21
STATE LEGISLATION-REPEAL ACT
Obsolete
Attachment 12.B
597
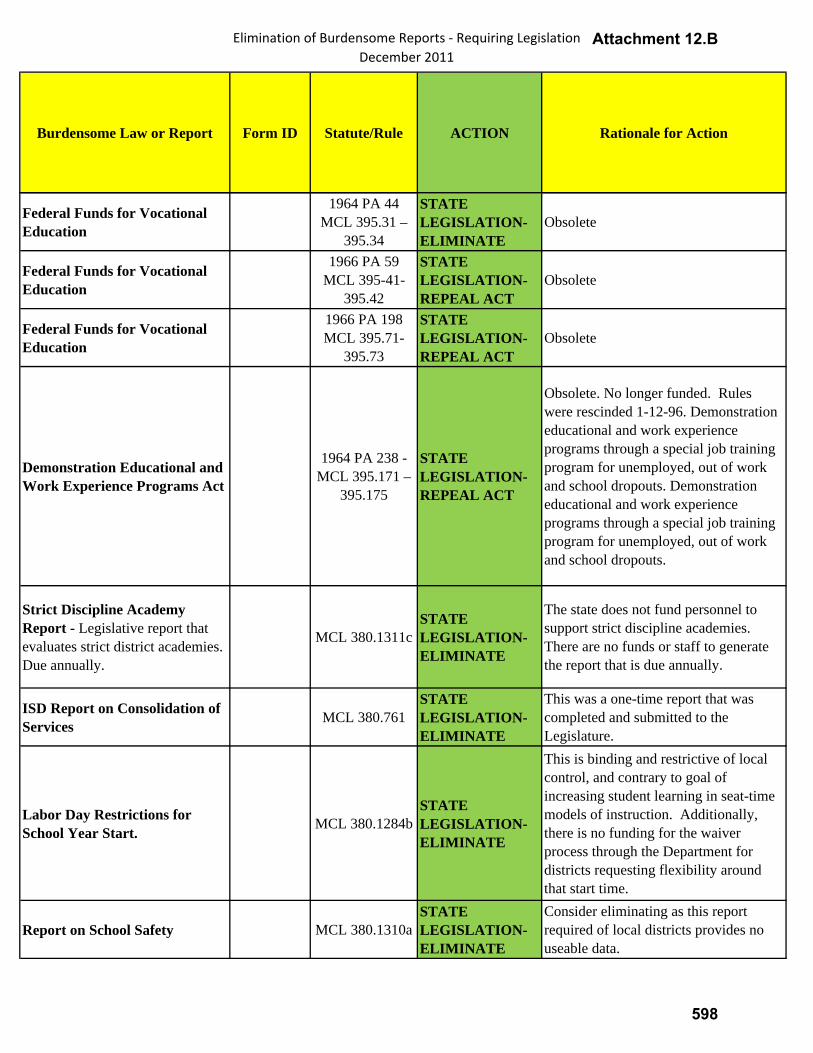
Elimination of Burdensome Reports ‐ Requiring LegislationDecember 2011
Burdensome Law or Report Form ID Statute/Rule ACTION Rationale for Action
Federal Funds for Vocational Education
1964 PA 44 MCL 395.31 –
395.34
STATE LEGISLATION-ELIMINATE
Obsolete
Federal Funds for Vocational Education
1966 PA 59 MCL 395-41-
395.42
STATE LEGISLATION-REPEAL ACT
Obsolete
Federal Funds for Vocational Education
1966 PA 198 MCL 395.71-
395.73
STATE LEGISLATION-REPEAL ACT
Obsolete
Demonstration Educational and Work Experience Programs Act
1964 PA 238 - MCL 395.171 –
395.175
STATE LEGISLATION-REPEAL ACT
Obsolete. No longer funded. Rules were rescinded 1-12-96. Demonstration educational and work experience programs through a special job training program for unemployed, out of work and school dropouts. Demonstration educational and work experience programs through a special job training program for unemployed, out of work and school dropouts.
Strict Discipline Academy Report - Legislative report that evaluates strict district academies. Due annually.
MCL 380.1311cSTATE LEGISLATION-ELIMINATE
The state does not fund personnel to support strict discipline academies. There are no funds or staff to generate the report that is due annually.
ISD Report on Consolidation of Services MCL 380.761
STATE LEGISLATION-ELIMINATE
This was a one-time report that was completed and submitted to the Legislature.
Labor Day Restrictions for School Year Start. MCL 380.1284b
STATE LEGISLATION-ELIMINATE
This is binding and restrictive of local control, and contrary to goal of increasing student learning in seat-time models of instruction. Additionally, there is no funding for the waiver process through the Department for districts requesting flexibility around that start time.
Report on School Safety MCL 380.1310aSTATE LEGISLATION-ELIMINATE
Consider eliminating as this report required of local districts provides no useable data.
Attachment 12.B
598
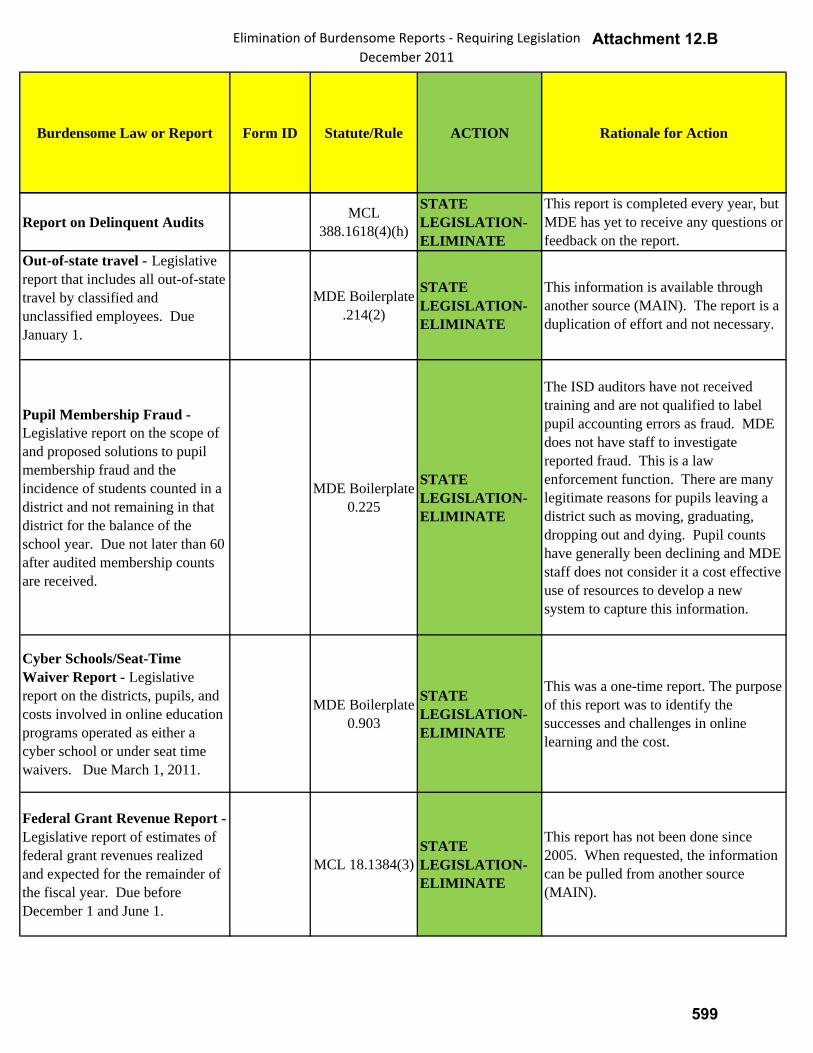
Elimination of Burdensome Reports ‐ Requiring LegislationDecember 2011
Burdensome Law or Report Form ID Statute/Rule ACTION Rationale for Action
Report on Delinquent Audits MCL 388.1618(4)(h)
STATE LEGISLATION-ELIMINATE
This report is completed every year, but MDE has yet to receive any questions or feedback on the report.
Out-of-state travel - Legislative report that includes all out-of-state travel by classified and unclassified employees. Due January 1.
MDE Boilerplate .214(2)
STATE LEGISLATION-ELIMINATE
This information is available through another source (MAIN). The report is a duplication of effort and not necessary.
Pupil Membership Fraud - Legislative report on the scope of and proposed solutions to pupil membership fraud and the incidence of students counted in a district and not remaining in that district for the balance of the school year. Due not later than 60 after audited membership counts are received.
MDE Boilerplate 0.225
STATE LEGISLATION-ELIMINATE
The ISD auditors have not received training and are not qualified to label pupil accounting errors as fraud. MDE does not have staff to investigate reported fraud. This is a law enforcement function. There are many legitimate reasons for pupils leaving a district such as moving, graduating, dropping out and dying. Pupil counts have generally been declining and MDE staff does not consider it a cost effective use of resources to develop a new system to capture this information.
Cyber Schools/Seat-Time Waiver Report - Legislative report on the districts, pupils, and costs involved in online education programs operated as either a cyber school or under seat time waivers. Due March 1, 2011.
MDE Boilerplate 0.903
STATE LEGISLATION-ELIMINATE
This was a one-time report. The purpose of this report was to identify the successes and challenges in online learning and the cost.
Federal Grant Revenue Report - Legislative report of estimates of federal grant revenues realized and expected for the remainder of the fiscal year. Due before December 1 and June 1.
MCL 18.1384(3)STATE LEGISLATION-ELIMINATE
This report has not been done since 2005. When requested, the information can be pulled from another source (MAIN).
Attachment 12.B
599
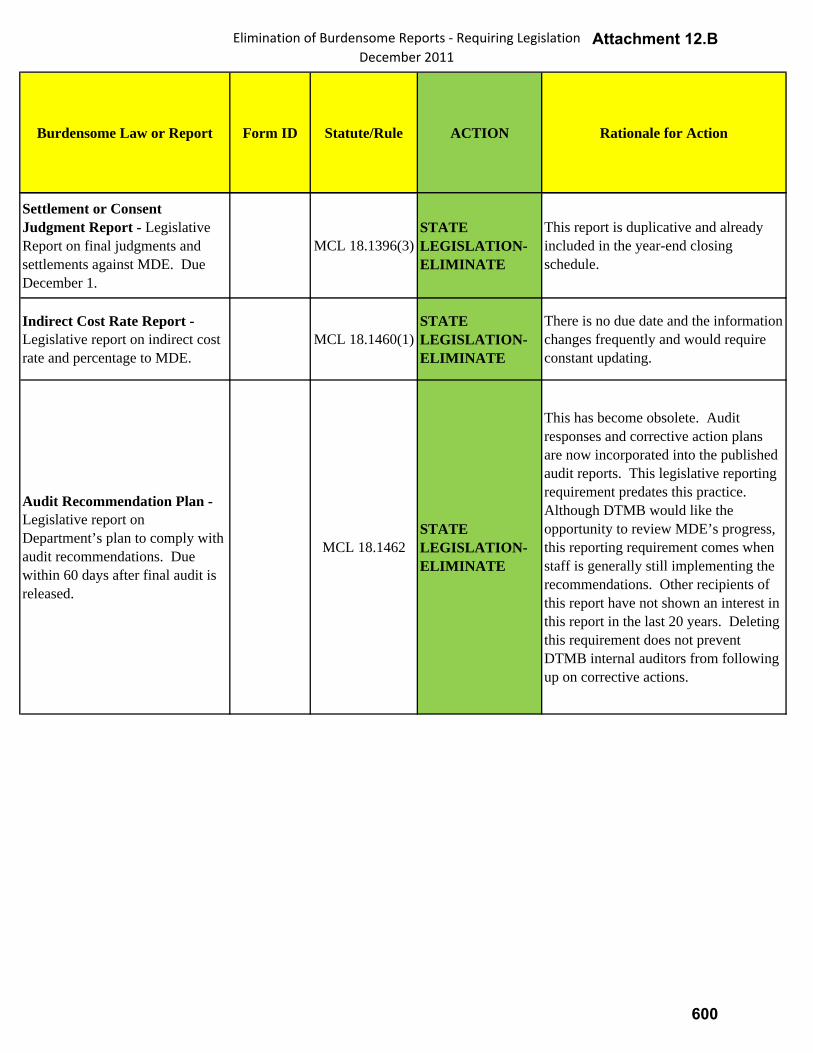
Elimination of Burdensome Reports ‐ Requiring LegislationDecember 2011
Burdensome Law or Report Form ID Statute/Rule ACTION Rationale for Action
Settlement or Consent Judgment Report - Legislative Report on final judgments and settlements against MDE. Due December 1.
MCL 18.1396(3)STATE LEGISLATION-ELIMINATE
This report is duplicative and already included in the year-end closing schedule.
Indirect Cost Rate Report - Legislative report on indirect cost rate and percentage to MDE.
MCL 18.1460(1)STATE LEGISLATION-ELIMINATE
There is no due date and the information changes frequently and would require constant updating.
Audit Recommendation Plan - Legislative report on Department’s plan to comply with audit recommendations. Due within 60 days after final audit is released.
MCL 18.1462STATE LEGISLATION-ELIMINATE
This has become obsolete. Audit responses and corrective action plans are now incorporated into the published audit reports. This legislative reporting requirement predates this practice. Although DTMB would like the opportunity to review MDE’s progress, this reporting requirement comes when staff is generally still implementing the recommendations. Other recipients of this report have not shown an interest in this report in the last 20 years. Deleting this requirement does not prevent DTMB internal auditors from following up on corrective actions.
Attachment 12.B
600
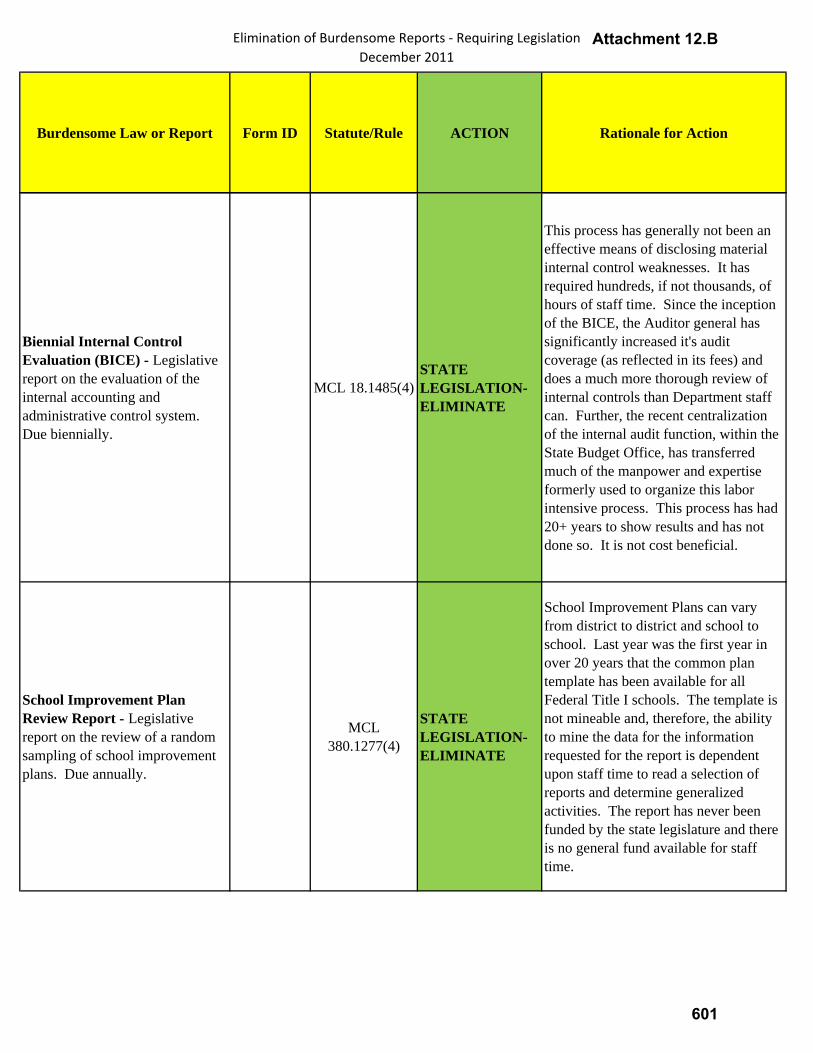
Elimination of Burdensome Reports ‐ Requiring LegislationDecember 2011
Burdensome Law or Report Form ID Statute/Rule ACTION Rationale for Action
Biennial Internal Control Evaluation (BICE) - Legislative report on the evaluation of the internal accounting and administrative control system. Due biennially.
MCL 18.1485(4)STATE LEGISLATION-ELIMINATE
This process has generally not been an effective means of disclosing material internal control weaknesses. It has required hundreds, if not thousands, of hours of staff time. Since the inception of the BICE, the Auditor general has significantly increased it's audit coverage (as reflected in its fees) and does a much more thorough review of internal controls than Department staff can. Further, the recent centralization of the internal audit function, within the State Budget Office, has transferred much of the manpower and expertise formerly used to organize this labor intensive process. This process has had 20+ years to show results and has not done so. It is not cost beneficial.
School Improvement Plan Review Report - Legislative report on the review of a random sampling of school improvement plans. Due annually.
MCL 380.1277(4)
STATE LEGISLATION-ELIMINATE
School Improvement Plans can vary from district to district and school to school. Last year was the first year in over 20 years that the common plan template has been available for all Federal Title I schools. The template is not mineable and, therefore, the ability to mine the data for the information requested for the report is dependent upon staff time to read a selection of reports and determine generalized activities. The report has never been funded by the state legislature and there is no general fund available for staff time.
Attachment 12.B
601

Elimination of Burdensome Reports ‐ Requiring LegislationDecember 2011
Burdensome Law or Report Form ID Statute/Rule ACTION Rationale for Action
Accreditation Report - Legislative report on the evaluation of the school accreditation system and the status of schools. Due annually.
MCL 380.1280(14)
STATE LEGISLATION-ELIMINATE
School report cards are currently posted on the Department’s website and include everything required for the Annual Accreditation Report except the recommendations to the legislature to help all schools reach accreditation. This report is a duplication of effort and not necessary.
State Board Report - Legislative report on the State Board’s operations and recommendations including an itemized statement of receipts and expenditures for the preceding fiscal year, and advise as to the financial requirements of all public education, including higher education. Due biennially.
MCL 388.1011STATE LEGISLATION-ELIMINATE
Duplicative of boilerplate.
Federal Funds for Education - Legislative report on projects that include federal funds accepted to conduct research, surveys and demonstrations in education and to strengthen and improve education policy and educational opportunities in elementary and secondary education. Due April 1.
MCL 388.1033STATE LEGISLATION-ELIMINATE
Duplicative of boilerplate.
Attachment 12.B
602
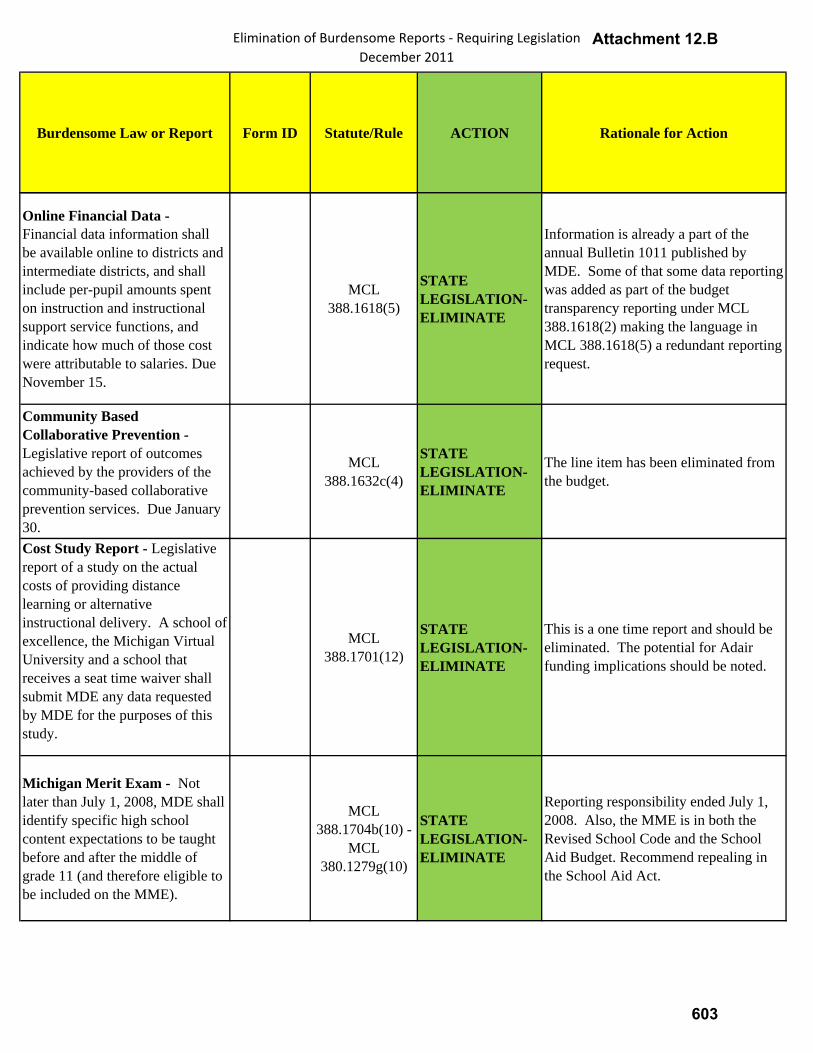
Elimination of Burdensome Reports ‐ Requiring LegislationDecember 2011
Burdensome Law or Report Form ID Statute/Rule ACTION Rationale for Action
Online Financial Data - Financial data information shall be available online to districts and intermediate districts, and shall include per-pupil amounts spent on instruction and instructional support service functions, and indicate how much of those cost were attributable to salaries. Due November 15.
MCL 388.1618(5)
STATE LEGISLATION-ELIMINATE
Information is already a part of the annual Bulletin 1011 published by MDE. Some of that some data reporting was added as part of the budget transparency reporting under MCL 388.1618(2) making the language in MCL 388.1618(5) a redundant reporting request.
Community Based Collaborative Prevention - Legislative report of outcomes achieved by the providers of the community-based collaborative prevention services. Due January 30.
MCL 388.1632c(4)
STATE LEGISLATION-ELIMINATE
The line item has been eliminated from the budget.
Cost Study Report - Legislative report of a study on the actual costs of providing distance learning or alternative instructional delivery. A school of excellence, the Michigan Virtual University and a school that receives a seat time waiver shall submit MDE any data requested by MDE for the purposes of this study.
MCL 388.1701(12)
STATE LEGISLATION-ELIMINATE
This is a one time report and should be eliminated. The potential for Adair funding implications should be noted.
Michigan Merit Exam - Not later than July 1, 2008, MDE shall identify specific high school content expectations to be taught before and after the middle of grade 11 (and therefore eligible to be included on the MME).
MCL 388.1704b(10) -
MCL 380.1279g(10)
STATE LEGISLATION-ELIMINATE
Reporting responsibility ended July 1, 2008. Also, the MME is in both the Revised School Code and the School Aid Budget. Recommend repealing in the School Aid Act.
Attachment 12.B
603
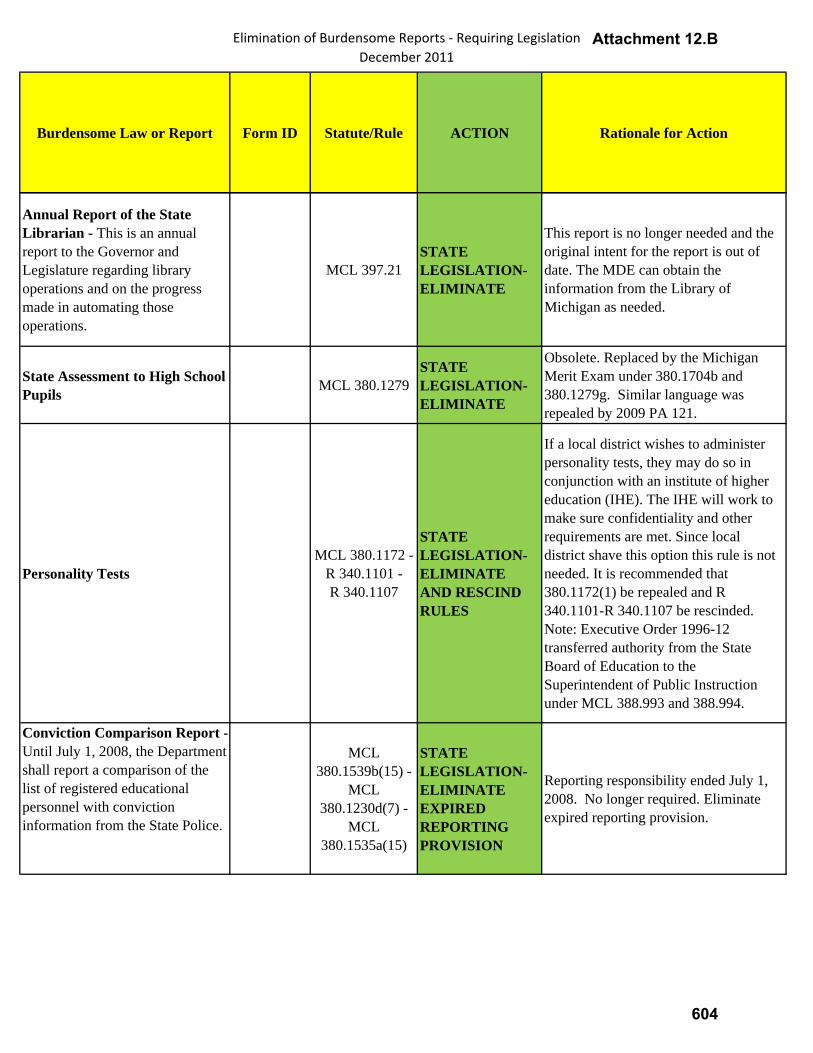
Elimination of Burdensome Reports ‐ Requiring LegislationDecember 2011
Burdensome Law or Report Form ID Statute/Rule ACTION Rationale for Action
Annual Report of the State Librarian - This is an annual report to the Governor and Legislature regarding library operations and on the progress made in automating those operations.
MCL 397.21STATE LEGISLATION-ELIMINATE
This report is no longer needed and the original intent for the report is out of date. The MDE can obtain the information from the Library of Michigan as needed.
State Assessment to High School Pupils MCL 380.1279
STATE LEGISLATION-ELIMINATE
Obsolete. Replaced by the Michigan Merit Exam under 380.1704b and 380.1279g. Similar language was repealed by 2009 PA 121.
Personality TestsMCL 380.1172 -
R 340.1101 - R 340.1107
STATE LEGISLATION-ELIMINATE AND RESCIND RULES
If a local district wishes to administer personality tests, they may do so in conjunction with an institute of higher education (IHE). The IHE will work to make sure confidentiality and other requirements are met. Since local district shave this option this rule is not needed. It is recommended that 380.1172(1) be repealed and R 340.1101-R 340.1107 be rescinded. Note: Executive Order 1996-12 transferred authority from the State Board of Education to the Superintendent of Public Instruction under MCL 388.993 and 388.994.
Conviction Comparison Report - Until July 1, 2008, the Department shall report a comparison of the list of registered educational personnel with conviction information from the State Police.
MCL 380.1539b(15) -
MCL 380.1230d(7) -
MCL 380.1535a(15)
STATE LEGISLATION-ELIMINATE EXPIRED REPORTING PROVISION
Reporting responsibility ended July 1, 2008. No longer required. Eliminate expired reporting provision.
Attachment 12.B
604
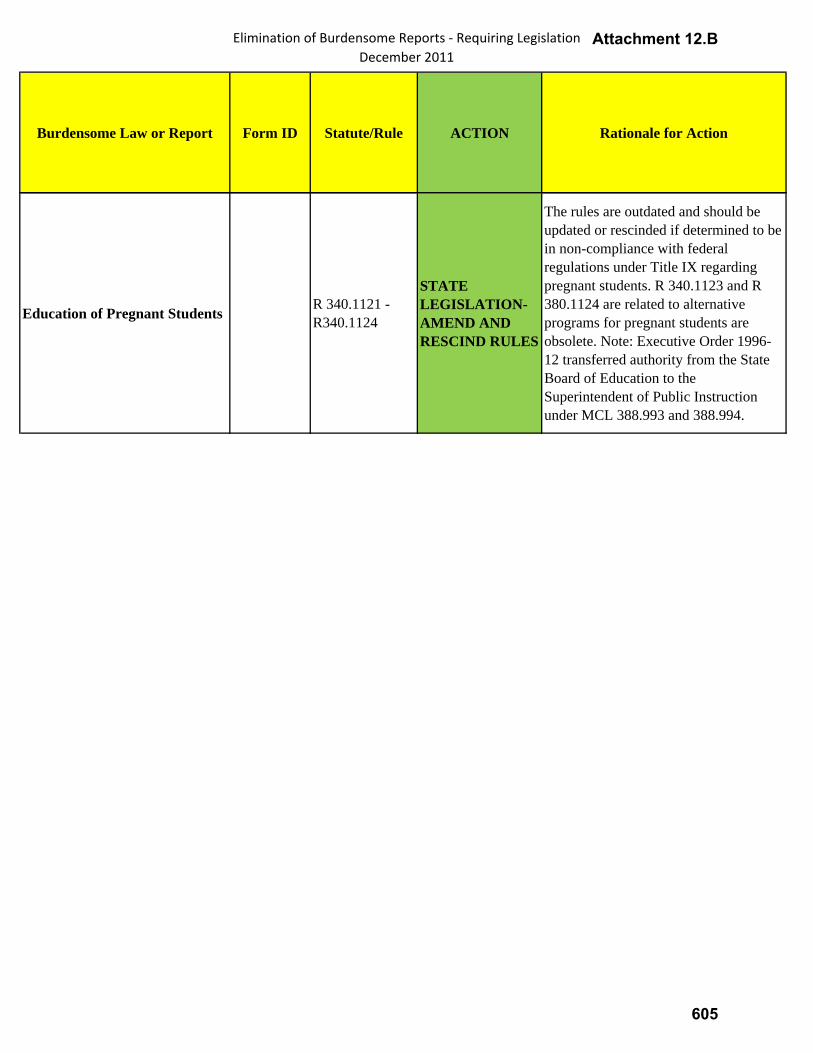
Elimination of Burdensome Reports ‐ Requiring LegislationDecember 2011
Burdensome Law or Report Form ID Statute/Rule ACTION Rationale for Action
Education of Pregnant Students R 340.1121 - R340.1124
STATE LEGISLATION-AMEND AND RESCIND RULES
The rules are outdated and should be updated or rescinded if determined to be in non-compliance with federal regulations under Title IX regarding pregnant students. R 340.1123 and R 380.1124 are related to alternative programs for pregnant students are obsolete. Note: Executive Order 1996-12 transferred authority from the State Board of Education to the Superintendent of Public Instruction under MCL 388.993 and 388.994.
Attachment 12.B
605
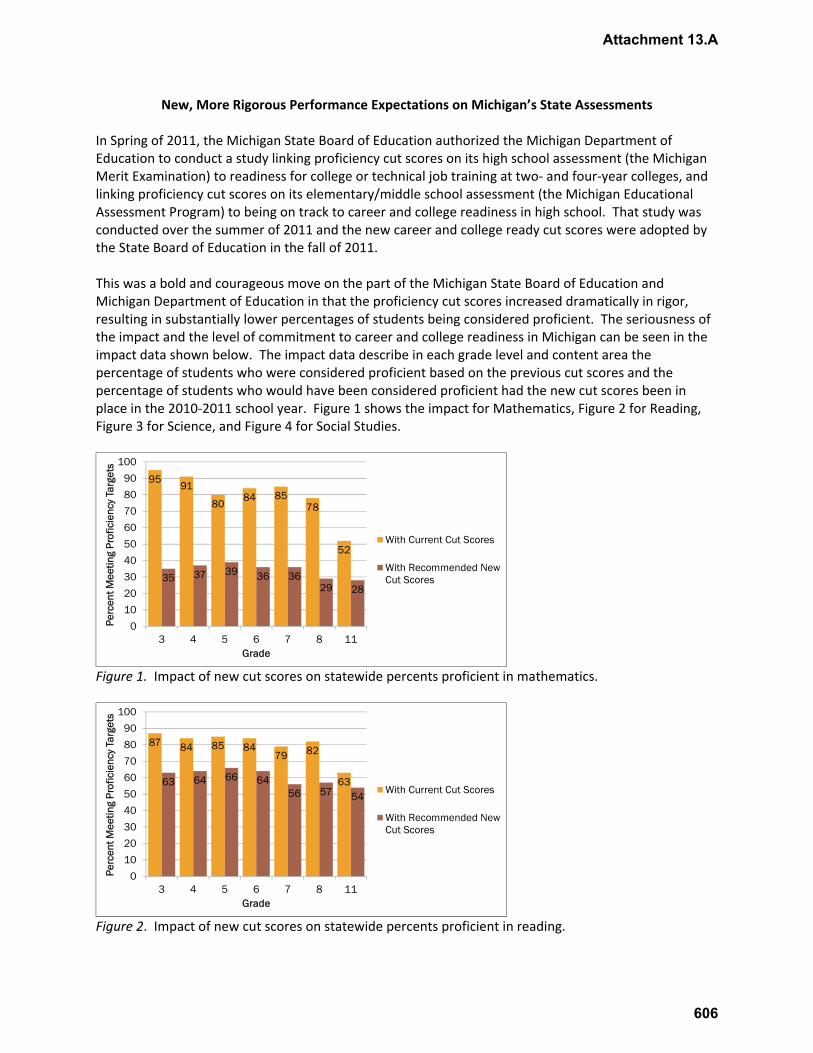
New, More Rigorous Performance Expectations on Michigan’s State Assessments In Spring of 2011, the Michigan State Board of Education authorized the Michigan Department of Education to conduct a study linking proficiency cut scores on its high school assessment (the Michigan Merit Examination) to readiness for college or technical job training at two‐ and four‐year colleges, and linking proficiency cut scores on its elementary/middle school assessment (the Michigan Educational Assessment Program) to being on track to career and college readiness in high school. That study was conducted over the summer of 2011 and the new career and college ready cut scores were adopted by the State Board of Education in the fall of 2011. This was a bold and courageous move on the part of the Michigan State Board of Education and Michigan Department of Education in that the proficiency cut scores increased dramatically in rigor, resulting in substantially lower percentages of students being considered proficient. The seriousness of the impact and the level of commitment to career and college readiness in Michigan can be seen in the impact data shown below. The impact data describe in each grade level and content area the percentage of students who were considered proficient based on the previous cut scores and the percentage of students who would have been considered proficient had the new cut scores been in place in the 2010‐2011 school year. Figure 1 shows the impact for Mathematics, Figure 2 for Reading, Figure 3 for Science, and Figure 4 for Social Studies.
9591
8084 85
78
52
35 37 39 36 3629 28
0
10
20
30
40
50
60
70
80
90
100
3 4 5 6 7 8 11
Perc
ent M
eetin
g Pr
ofic
ienc
y Ta
rget
s
Grade
With Current Cut Scores
With Recommended NewCut Scores
Figure 1. Impact of new cut scores on statewide percents proficient in mathematics.
87 84 85 8479 82
6363 64 66 6456 57 54
0
10
20
30
40
50
60
70
80
90
100
3 4 5 6 7 8 11
Perc
ent M
eetin
g Pr
ofic
ienc
y Ta
rget
s
Grade
With Current Cut Scores
With Recommended NewCut Scores
Figure 2. Impact of new cut scores on statewide percents proficient in reading.
Attachment 13.A
606
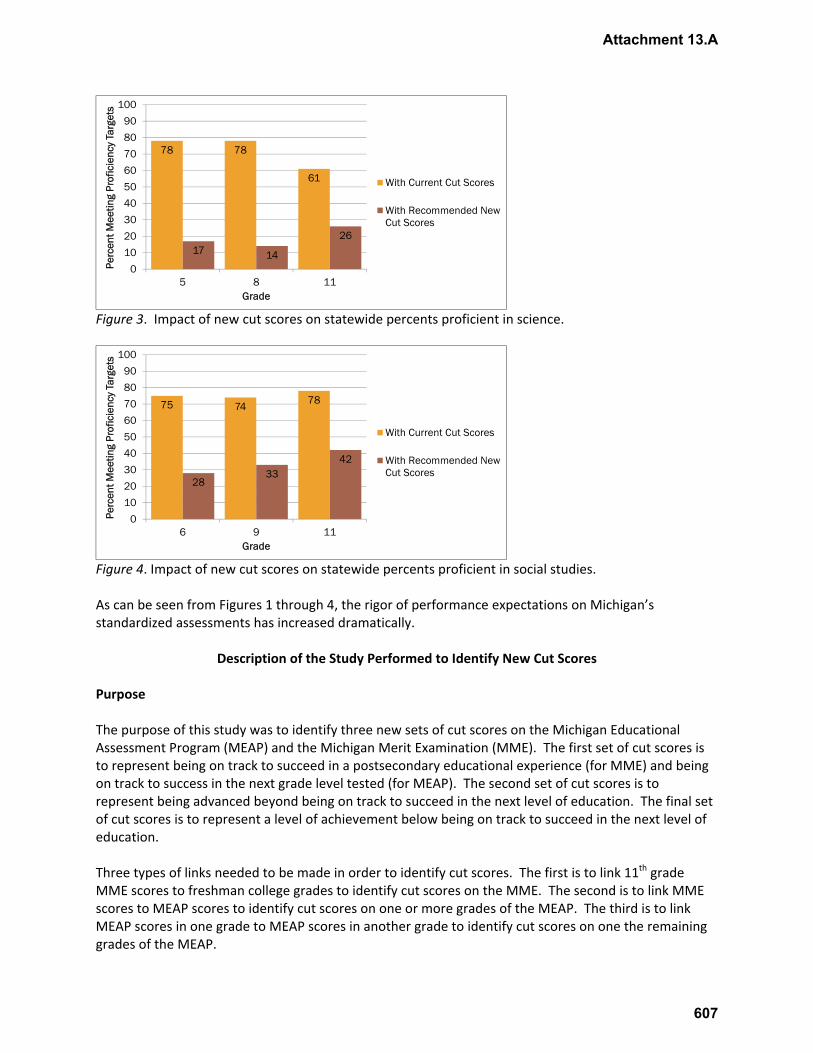
78 78
61
17 14
26
0
10
20
30
40
50
60
70
80
90
100
5 8 11
Perc
ent M
eetin
g Pr
ofic
ienc
y Ta
rget
s
Grade
With Current Cut Scores
With Recommended NewCut Scores
Figure 3. Impact of new cut scores on statewide percents proficient in science.
75 7478
2833
42
0
10
20
30
40
50
60
70
80
90
100
6 9 11
Perc
ent M
eetin
g Pr
ofic
ienc
y Ta
rget
s
Grade
With Current Cut Scores
With Recommended NewCut Scores
Figure 4. Impact of new cut scores on statewide percents proficient in social studies. As can be seen from Figures 1 through 4, the rigor of performance expectations on Michigan’s standardized assessments has increased dramatically.
Description of the Study Performed to Identify New Cut Scores
Purpose The purpose of this study was to identify three new sets of cut scores on the Michigan Educational Assessment Program (MEAP) and the Michigan Merit Examination (MME). The first set of cut scores is to represent being on track to succeed in a postsecondary educational experience (for MME) and being on track to success in the next grade level tested (for MEAP). The second set of cut scores is to represent being advanced beyond being on track to succeed in the next level of education. The final set of cut scores is to represent a level of achievement below being on track to succeed in the next level of education. Three types of links needed to be made in order to identify cut scores. The first is to link 11th grade MME scores to freshman college grades to identify cut scores on the MME. The second is to link MME scores to MEAP scores to identify cut scores on one or more grades of the MEAP. The third is to link MEAP scores in one grade to MEAP scores in another grade to identify cut scores on one the remaining grades of the MEAP.
Attachment 13.A
607
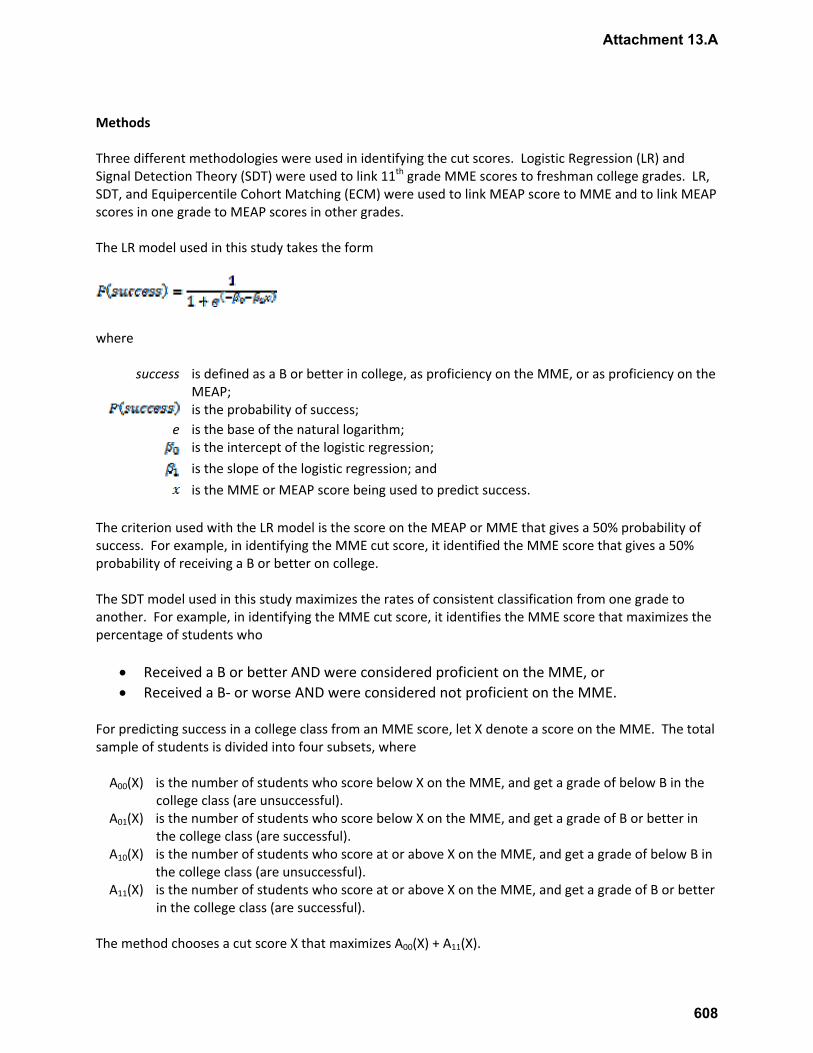
Methods Three different methodologies were used in identifying the cut scores. Logistic Regression (LR) and Signal Detection Theory (SDT) were used to link 11th grade MME scores to freshman college grades. LR, SDT, and Equipercentile Cohort Matching (ECM) were used to link MEAP score to MME and to link MEAP scores in one grade to MEAP scores in other grades. The LR model used in this study takes the form
where success is defined as a B or better in college, as proficiency on the MME, or as proficiency on the
MEAP; is the probability of success; e is the base of the natural logarithm; is the intercept of the logistic regression; is the slope of the logistic regression; and is the MME or MEAP score being used to predict success. The criterion used with the LR model is the score on the MEAP or MME that gives a 50% probability of success. For example, in identifying the MME cut score, it identified the MME score that gives a 50% probability of receiving a B or better on college. The SDT model used in this study maximizes the rates of consistent classification from one grade to another. For example, in identifying the MME cut score, it identifies the MME score that maximizes the percentage of students who
• Received a B or better AND were considered proficient on the MME, or • Received a B‐ or worse AND were considered not proficient on the MME.
For predicting success in a college class from an MME score, let X denote a score on the MME. The total sample of students is divided into four subsets, where A00(X) is the number of students who score below X on the MME, and get a grade of below B in the
college class (are unsuccessful). A01(X) is the number of students who score below X on the MME, and get a grade of B or better in
the college class (are successful). A10(X) is the number of students who score at or above X on the MME, and get a grade of below B in
the college class (are unsuccessful). A11(X) is the number of students who score at or above X on the MME, and get a grade of B or better
in the college class (are successful). The method chooses a cut score X that maximizes A00(X) + A11(X).
Attachment 13.A
608

For the MEAP to MME targets, the formulation above works as well, with successful and unsuccessful being defined as scoring at or above the MME cuts core and scoring below the MME cut score, respectively. Specifically, the same parameterization can be applied when back mapping from a known cut score on the next highest grade assessed. For example, to predict success on the MME Mathematics from grade 8 MEAP Mathematics scores, the total sample of students is again divided into the four aforementioned subsets, but the model is parameterized as follows: A00(X) is the number of students who score below X on the grade 8 MEAP, and score below the MME
Mathematics cut score. A01(X) is the number of students who score below X on the grade 8 MEAP, and score at or above the
MME Mathematics cut score. A10(X) is the number of students who score at or above X on the grade 8 MEAP, and score below the
MME Mathematics cut score. A11(X) is the number of students who score at or above X on the grade 8 MEAP, and score at or
above the MME Mathematics cut score. Note that under mild monotonicity assumptions, this method is equivalent to choosing the score point such that the conditional probability of exceeding the cut score equals .5. To the extent that the assumption holds, LR and SDT should derive similar solutions. Finally, the SDT analyses were run using smoothed distributions of student scores for both MEAP and MME to avoid any effects of jaggedness of either distribution on the results. After identifying the cut score for proficiency on the MME, the cut scores were then mapped backward onto the MEAP to achieve the same type of results (meaning that the known outcome was then proficiency on the MME and the unknown outcome was proficiency on the MEAP). Because both LR and SDT are subject to regression effects, it was important to address these effects by having the minimum number of links in defining each grade level’s cut score. By linking each grade to the grade just previous to it, there would be seven links for the third grade cut score as shown here:
1. Linking grade 11 MME to college grades. 2. Linking grade 8 MEAP to grade 11 MME. 3. Linking grade 7 MEAP to grade 8 MEAP. 4. Linking grade 6 MEAP to grade 7 MEAP. 5. Linking grade 5 MEAP to grade 6 MEAP. 6. Linking grade 4 MEAP to grade 5 MEAP. 7. Linking grade 3 MEAP to grade 4 MEAP.
Instead, a different linking scheme was implemented which limited the maximum number of links created to identify any grade level’s cut score to three. Table A1 shows the links for each grade and content area to demonstrate that the maximum number of links was three. Because both LR and SDT are subject to regression away from the mean (meaning that they can inflate cut scores if they are above the mean, or deflate them if they are below the mean), the results of the LR and SDT models were carefully inspected to assure that any place in which there was evidence of regression effects, a different methodology was used.
Attachment 13.A
609
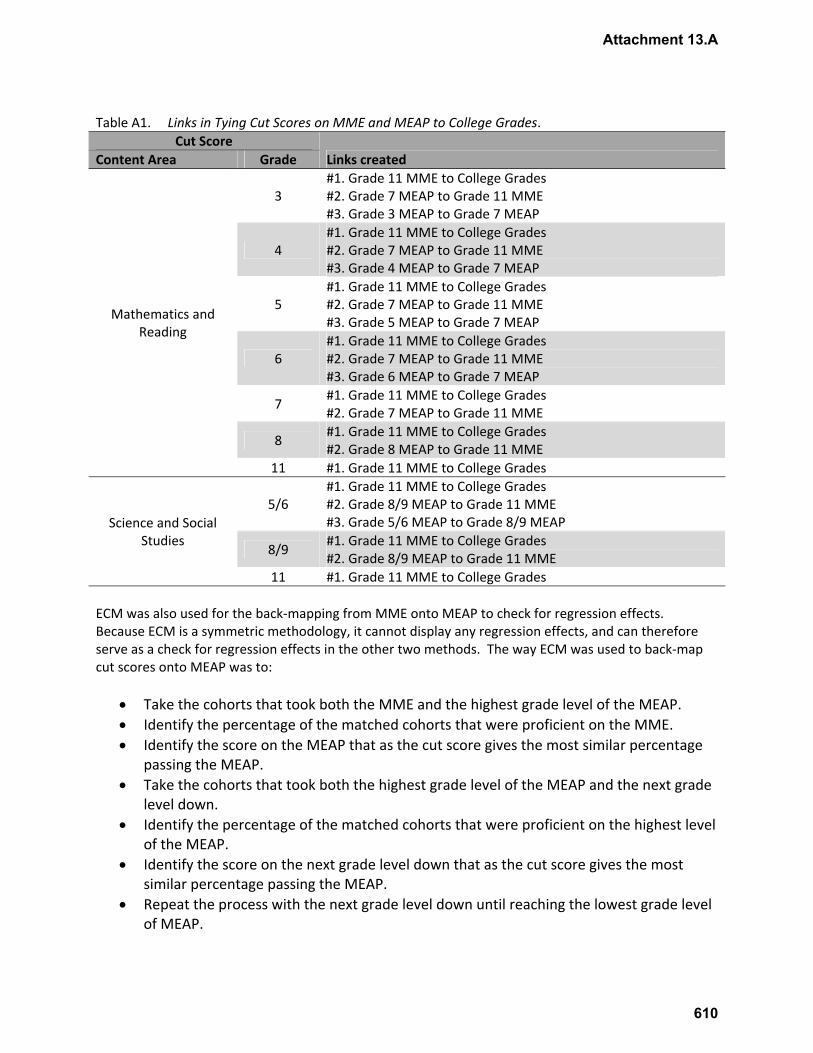
Table A1. Links in Tying Cut Scores on MME and MEAP to College Grades.
Cut Score Links created Content Area Grade
Mathematics and Reading
3 #1. Grade 11 MME to College Grades #2. Grade 7 MEAP to Grade 11 MME #3. Grade 3 MEAP to Grade 7 MEAP
4 #1. Grade 11 MME to College Grades #2. Grade 7 MEAP to Grade 11 MME #3. Grade 4 MEAP to Grade 7 MEAP
5 #1. Grade 11 MME to College Grades #2. Grade 7 MEAP to Grade 11 MME #3. Grade 5 MEAP to Grade 7 MEAP
6 #1. Grade 11 MME to College Grades #2. Grade 7 MEAP to Grade 11 MME #3. Grade 6 MEAP to Grade 7 MEAP
7 #1. Grade 11 MME to College Grades #2. Grade 7 MEAP to Grade 11 MME
8 #1. Grade 11 MME to College Grades #2. Grade 8 MEAP to Grade 11 MME
11 #1. Grade 11 MME to College Grades
Science and Social Studies
5/6 #1. Grade 11 MME to College Grades #2. Grade 8/9 MEAP to Grade 11 MME #3. Grade 5/6 MEAP to Grade 8/9 MEAP
8/9 #1. Grade 11 MME to College Grades #2. Grade 8/9 MEAP to Grade 11 MME
11 #1. Grade 11 MME to College Grades ECM was also used for the back‐mapping from MME onto MEAP to check for regression effects. Because ECM is a symmetric methodology, it cannot display any regression effects, and can therefore serve as a check for regression effects in the other two methods. The way ECM was used to back‐map cut scores onto MEAP was to:
• Take the cohorts that took both the MME and the highest grade level of the MEAP. • Identify the percentage of the matched cohorts that were proficient on the MME. • Identify the score on the MEAP that as the cut score gives the most similar percentage
passing the MEAP. • Take the cohorts that took both the highest grade level of the MEAP and the next grade
level down. • Identify the percentage of the matched cohorts that were proficient on the highest level
of the MEAP. • Identify the score on the next grade level down that as the cut score gives the most
similar percentage passing the MEAP. • Repeat the process with the next grade level down until reaching the lowest grade level
of MEAP.
Attachment 13.A
610

The reasons that three methods were used were the following:
• LR and SDT served as a validation of each other. • ECM served as a check on regression effects.
The three methodologies have different aims. LR aims to identify the score that gives a fixed probability of success. SDT aims to maximize consistent classifications from one level to the next. ECM aims to identify cut scores across grade levels that are approximately equally rigorous in terms of impact. Although they have different aims, they should give similar results. Therefore, it is important to determine which results to use in what circumstances. SDT was considered the preferred methodology because its aim was to maximize consistent classification from one level to the next (an inherently desirable outcome in that if a student is classified as proficient in one grade, they can be reasonably expected to be proficient in the next grade given typical education). Where SDT and LR were affected by regression effects, ECM was preferable in that it would produce non‐inflated/deflated cut scores. Therefore, the results were inspected to determine whether SDT and/or LR were affected by regression effects. Where there was no evidence of regression effects, SDT results were used. Where there was evidence of regression effects, ECM results were used. Several different analyses were carried out to identify the three sets of cut scores for MME, which were then back‐mapped to MEAP. First, the partially proficient, proficient, and advanced cut scores were analyzed in terms of students receiving a C or better, B or better, and A or better, respectively. Second, the proficient and advanced cut scores were analyzed in terms of receiving a B or better in a 2‐year or 4‐year college, respectively. Finally, the partially proficient, proficient, and advanced cut scores were analyzed in terms of students having a 1/3, 1/2, and 2/3 probability of receiving a B or better, respectively. Data The data used for this study included grades in first credit‐bearing freshman courses in Michigan public two‐year and four‐year colleges and universities. The college courses used for the analysis of each MME content area were as given in Table A2. Note that Writing is not included in this analysis. This is because (1) the MEAP writing test was new in Fall 2011 and does not have the data necessary to map cut scores on the MEAP back from cut scores on the MME, (2) the MME writing cut score is already similar to the ACT writing college ready benchmark, and (3) the MEAP writing cut scores were already set to be consistent with the MME writing cut scores. Table A1. College Courses Used for the Analysis of each MME Content Area. MME Content Area College Courses Used Mathematics College Algebra.
Reading Courses identified by 4‐year universities. Reading‐heavy courses such as entry‐level literature, history, philosophy, or psychology for 2‐year universities.
Science Courses identified by 4‐year universities. Entry level biology, chemistry, physics, or geology for 2‐year universities.
Social Studies Courses identified by 4‐year universities. Entry level history, geography, or economics for 2‐year universities.
Attachment 13.A
611
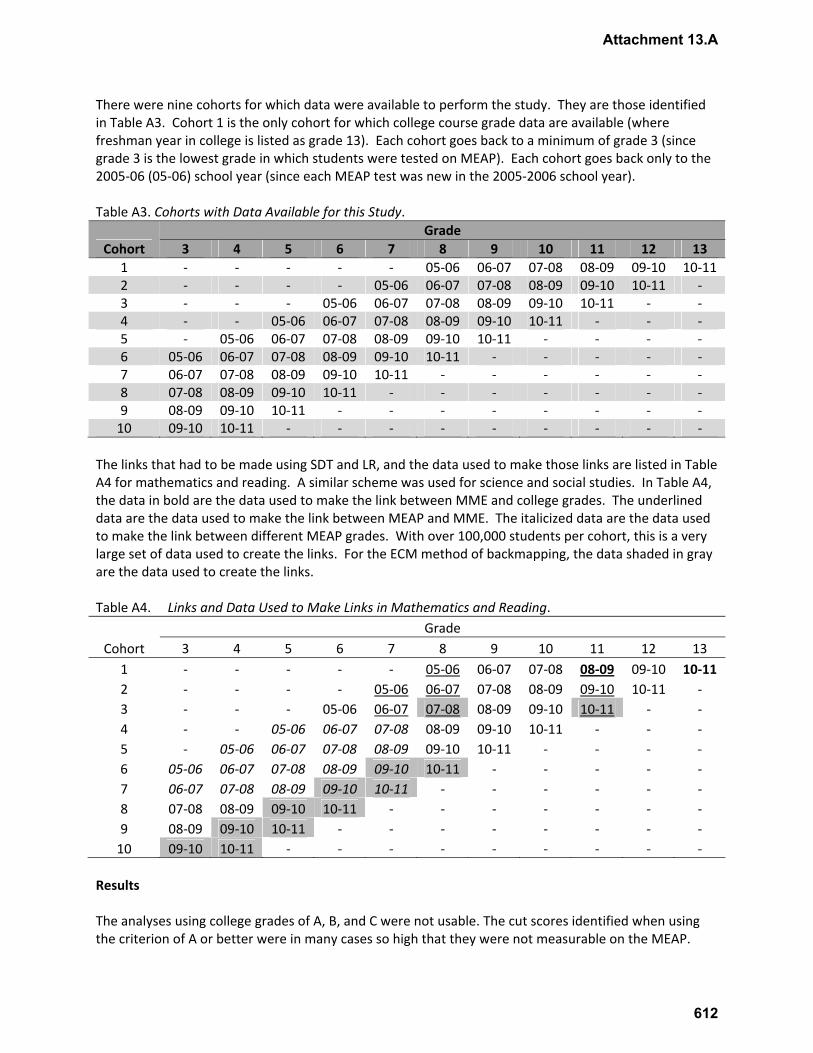
There were nine cohorts for which data were available to perform the study. They are those identified in Table A3. Cohort 1 is the only cohort for which college course grade data are available (where freshman year in college is listed as grade 13). Each cohort goes back to a minimum of grade 3 (since grade 3 is the lowest grade in which students were tested on MEAP). Each cohort goes back only to the 2005‐06 (05‐06) school year (since each MEAP test was new in the 2005‐2006 school year). Table A3. Cohorts with Data Available for this Study.
Cohort Grade
3 4 5 6 7 8 9 10 11 12 13 1 ‐ ‐ ‐ ‐ ‐ 05‐06 06‐07 07‐08 08‐09 09‐10 10‐11 2 ‐ ‐ ‐ ‐ 05‐06 06‐07 07‐08 08‐09 09‐10 10‐11 ‐ 3 ‐ ‐ ‐ 05‐06 06‐07 07‐08 08‐09 09‐10 10‐11 ‐ ‐ 4 ‐ ‐ 05‐06 06‐07 07‐08 08‐09 09‐10 10‐11 ‐ ‐ ‐ 5 ‐ 05‐06 06‐07 07‐08 08‐09 09‐10 10‐11 ‐ ‐ ‐ ‐ 6 05‐06 06‐07 07‐08 08‐09 09‐10 10‐11 ‐ ‐ ‐ ‐ ‐ 7 06‐07 07‐08 08‐09 09‐10 10‐11 ‐ ‐ ‐ ‐ ‐ ‐ 8 07‐08 08‐09 09‐10 10‐11 ‐ ‐ ‐ ‐ ‐ ‐ ‐ 9 08‐09 09‐10 10‐11 ‐ ‐ ‐ ‐ ‐ ‐ ‐ ‐ 10 09‐10 10‐11 ‐ ‐ ‐ ‐ ‐ ‐ ‐ ‐ ‐
The links that had to be made using SDT and LR, and the data used to make those links are listed in Table A4 for mathematics and reading. A similar scheme was used for science and social studies. In Table A4, the data in bold are the data used to make the link between MME and college grades. The underlined data are the data used to make the link between MEAP and MME. The italicized data are the data used to make the link between different MEAP grades. With over 100,000 students per cohort, this is a very large set of data used to create the links. For the ECM method of backmapping, the data shaded in gray are the data used to create the links. Table A4. Links and Data Used to Make Links in Mathematics and Reading.
Cohort Grade
3 4 5 6 7 8 9 10 11 12 13 1 ‐ ‐ ‐ ‐ ‐ 05‐06 06‐07 07‐08 08‐09 09‐10 10‐11 2 ‐ ‐ ‐ ‐ 05‐06 06‐07 07‐08 08‐09 09‐10 10‐11 ‐ 3 ‐ ‐ ‐ 05‐06 06‐07 07‐08 08‐09 09‐10 10‐11 ‐ ‐ 4 ‐ ‐ 05‐06 06‐07 07‐08 08‐09 09‐10 10‐11 ‐ ‐ ‐ 5 ‐ 05‐06 06‐07 07‐08 08‐09 09‐10 10‐11 ‐ ‐ ‐ ‐ 6 05‐06 06‐07 07‐08 08‐09 09‐10 10‐11 ‐ ‐ ‐ ‐ ‐ 7 06‐07 07‐08 08‐09 09‐10 10‐11 ‐ ‐ ‐ ‐ ‐ ‐ 8 07‐08 08‐09 09‐10 10‐11 ‐ ‐ ‐ ‐ ‐ ‐ ‐ 9 08‐09 09‐10 10‐11 ‐ ‐ ‐ ‐ ‐ ‐ ‐ ‐ 10 09‐10 10‐11 ‐ ‐ ‐ ‐ ‐ ‐ ‐ ‐ ‐
Results The analyses using college grades of A, B, and C were not usable. The cut scores identified when using the criterion of A or better were in many cases so high that they were not measurable on the MEAP.
Attachment 13.A
612

The cut scores identified when using the criterion of C or better were so low that they were in the range of scores attainable by chance. The analyses using college grades of B or better from 2‐year versus 4‐year colleges were also unusable. While the 2‐year college data resulted in slightly lower cut scores than 4‐year college data, they were within measurement error of each other. Therefore, the final analyses used both 2‐year and 4‐year college data together. Therefore, the results using the criteria of probabilities of 1/3, 1/2, and 2/3 were carried out and are the ones used to establish the recommended partially proficient, proficient, and advanced cut scores. The results of the LR and SDT analyses were nearly identical in identifying cut scores on the MME. Therefore, as SDT is the preferable methodology, SDT results were used for the cut scores on the MME. The results of SDT and LR in back‐mapping the proficient cuts for MEAP were not detectably affected by regression effects1. Because SDT was the preferable methodology, the SDT cuts were used for the proficient bar on MEAP. However, the results of LR and SDT were clearly affected by regression effects in back‐mapping the partially proficient and advanced cut scores to MEAP2. Therefore, ECM was used to back‐map the partially proficient and advanced cut scores. The cut scores resulting from the analyses are given in Tables A5 through A8, respectively, for mathematics, reading, science, and social studies. Finally, classification consistency rates are given in Tables A9 for the links from MME to college grades, from MEAP to MME, and from one grade to another for MEAP. Table A5. Recommended New MEAP and MME Mathematics Cut Scores.
Assessment Grade Partially Proficient Proficient Advanced MME 11 1093 1116 1138 MEAP 8 809 830 865 MEAP 7 714 731 776 MEAP 6 614 629 675 MEAP 5 516 531 584 MEAP 4 423 434 470 MEAP 3 322 336 371
Table A6. Recommended New MEAP and MME Reading Cut Scores.
Assessment Grade Partially Proficient Proficient Advanced MME 11 1081 1108 1141 MEAP 8 796 818 853 MEAP 7 698 721 760 MEAP 6 602 619 653 MEAP 5 501 521 565 MEAP 4 395 419 478 MEAP 3 301 324 364
1 The SDT results for the proficient cuts were above the mean, but were slightly lower than the ECM cuts. Had the SDT results been affected by regression, they would have been inflated and would have surpassed the ECM cuts. 2 The SDT and LR results were far above the mean for the advanced cut and were below the mean for the partially proficient cut. The resulting SDT and LR cuts were more extreme than the ECM results, and became even more extreme in grades where there were more links there were in the chain.
Attachment 13.A
613
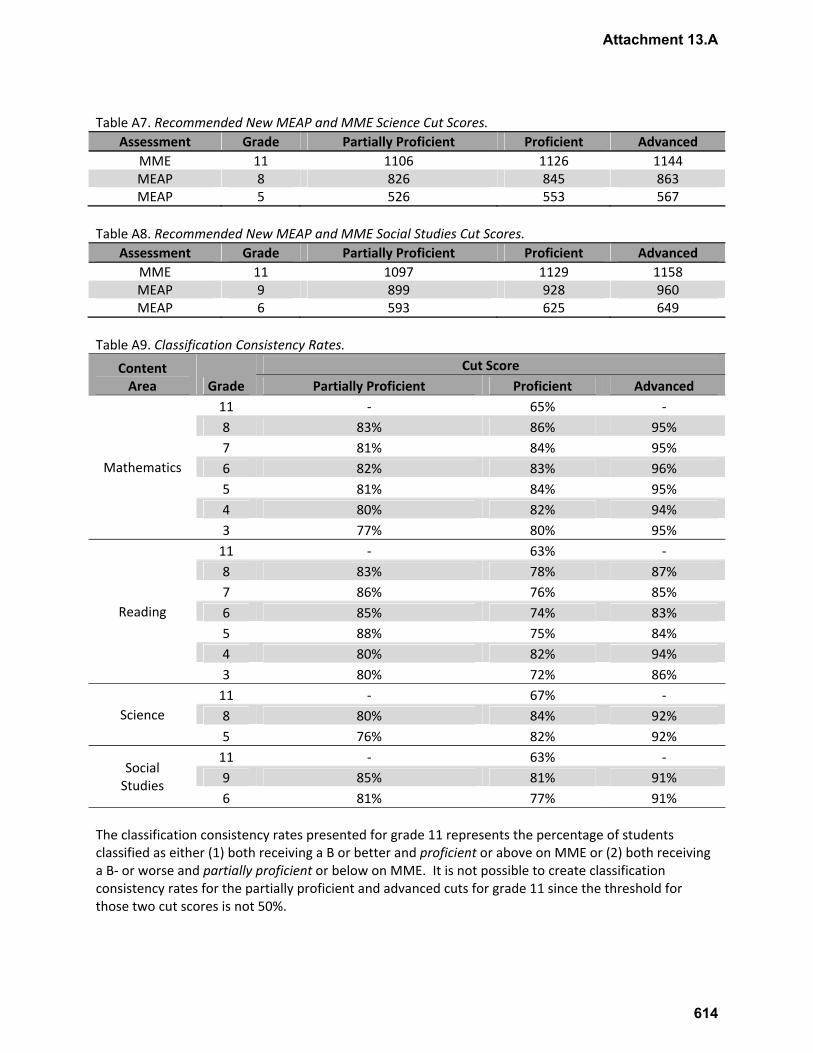
Table A7. Recommended New MEAP and MME Science Cut Scores.
Assessment Grade Partially Proficient Proficient Advanced MME 11 1106 1126 1144 MEAP 8 826 845 863 MEAP 5 526 553 567
Table A8. Recommended New MEAP and MME Social Studies Cut Scores.
Assessment Grade Partially Proficient Proficient Advanced MME 11 1097 1129 1158 MEAP 9 899 928 960 MEAP 6 593 625 649
Table A9. Classification Consistency Rates.
Content Area Grade
Cut Score Partially Proficient Proficient Advanced
Mathematics
11 ‐ 65% ‐ 8 83% 86% 95% 7 81% 84% 95% 6 82% 83% 96% 5 81% 84% 95% 4 80% 82% 94% 3 77% 80% 95%
Reading
11 ‐ 63% ‐ 8 83% 78% 87% 7 86% 76% 85% 6 85% 74% 83% 5 88% 75% 84% 4 80% 82% 94% 3 80% 72% 86%
Science 11 ‐ 67% ‐ 8 80% 84% 92% 5 76% 82% 92%
Social Studies
11 ‐ 63% ‐ 9 85% 81% 91% 6 81% 77% 91%
The classification consistency rates presented for grade 11 represents the percentage of students classified as either (1) both receiving a B or better and proficient or above on MME or (2) both receiving a B‐ or worse and partially proficient or below on MME. It is not possible to create classification consistency rates for the partially proficient and advanced cuts for grade 11 since the threshold for those two cut scores is not 50%.
Attachment 13.A
614
The classification consistency rates presented for the proficient cut in grades 3 through 9 represent the percentage of students who were consistently classified as either proficient or above or consistently classified as partially proficient or below from one grade level to the next grade level up. The classification consistency rates presented for the partially proficient cut in grades 3 through 9 represent the percentage of students who were consistently classified as either partially proficient or above or consistently classified as not proficient from one grade level to the next grade level up. The classification consistency rates presented for the advanced cut in grades 3 through 9 represent the percentage of students who were consistently classified as either advanced or consistently classified as proficient or below from one grade level to the next grade level up. Table A9 shows that the lowest classification consistency is from MME to college grades. ACT Inc. indicated that this level of classification consistency is consistent with that obtained in other states for which they have conducted similar analyses. The remaining classification consistency rates indicate a high degree of stability from grade to grade. The difference between MME to college grades and the remainder of the consistency rates is to be expected for two reasons. First, the rates that are based solely on student achievement scores are high because the classifications are being made on the most similar constructs: achievement on two standardized tests of the same subjects. These rates should be higher. Second, the rates for grade 11 are based on less similar but still related constructs: achievement on standardized tests versus college grades in related subjects. These rates should be lower.
Attachment 13.A
615

Attachment 13.B
616

Attachment 13.B
617

Attachment 13.B
618
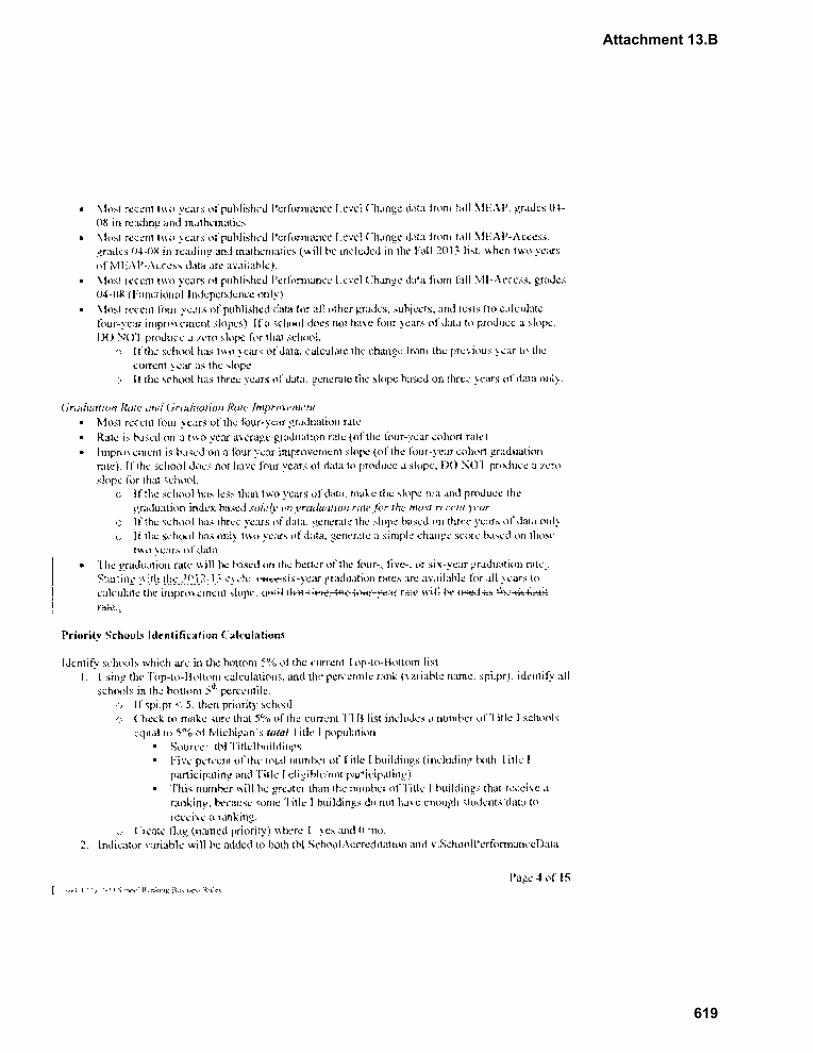
Attachment 13.B
619
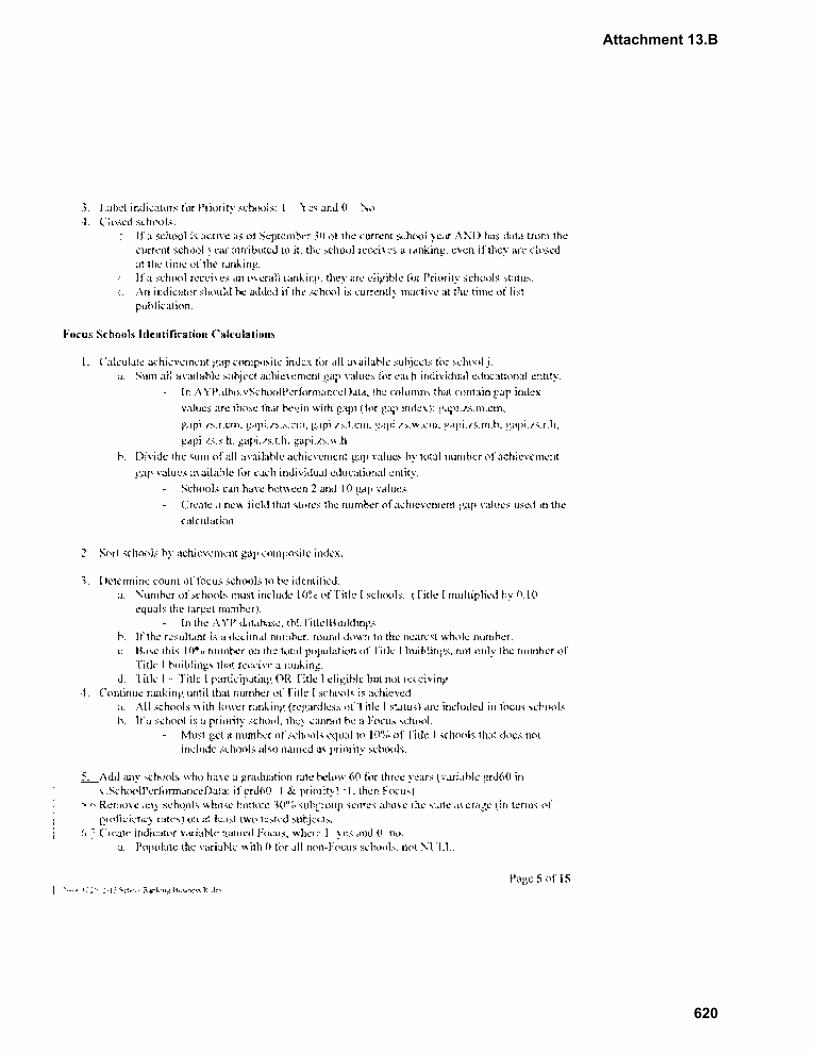
Attachment 13.B
620

Attachment 13.B
621
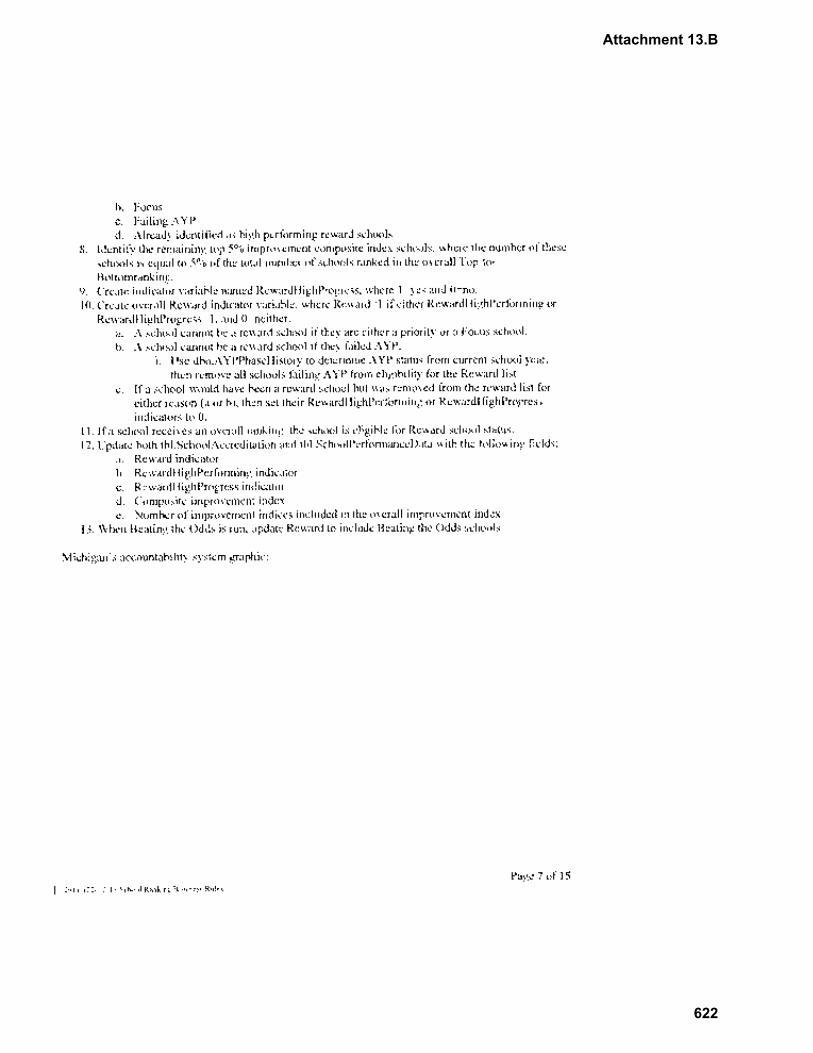
Attachment 13.B
622
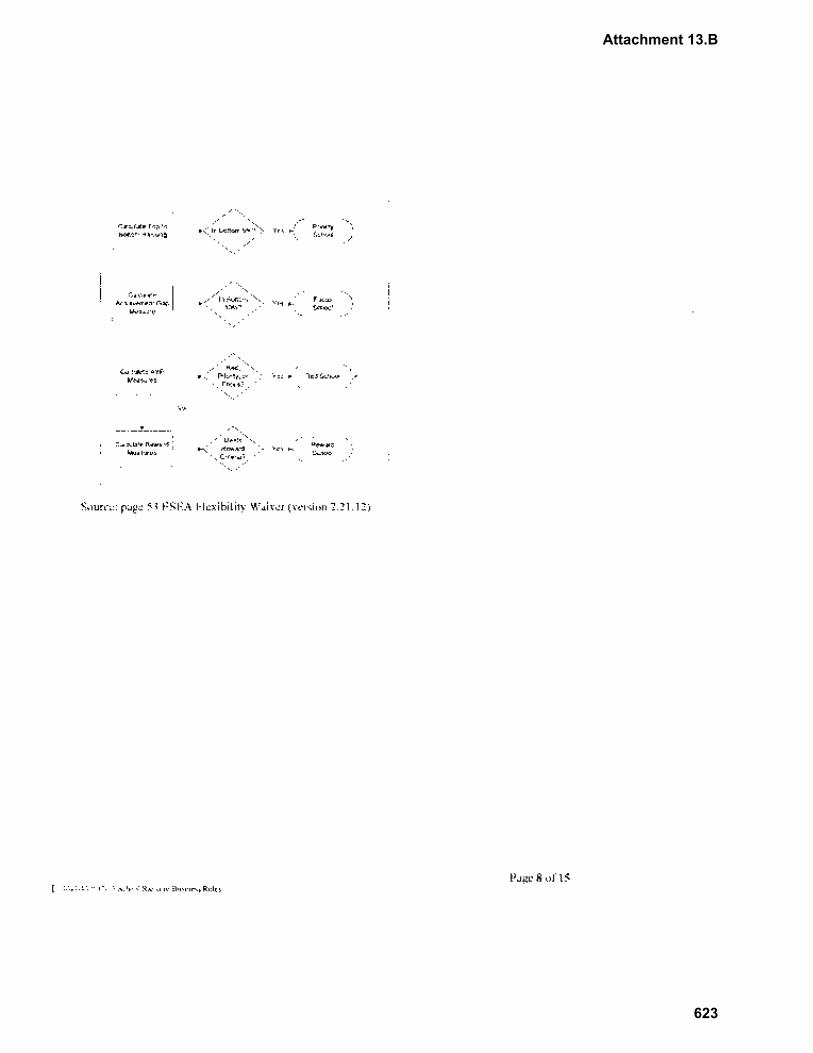
Attachment 13.B
623

Attachment 13.B
624
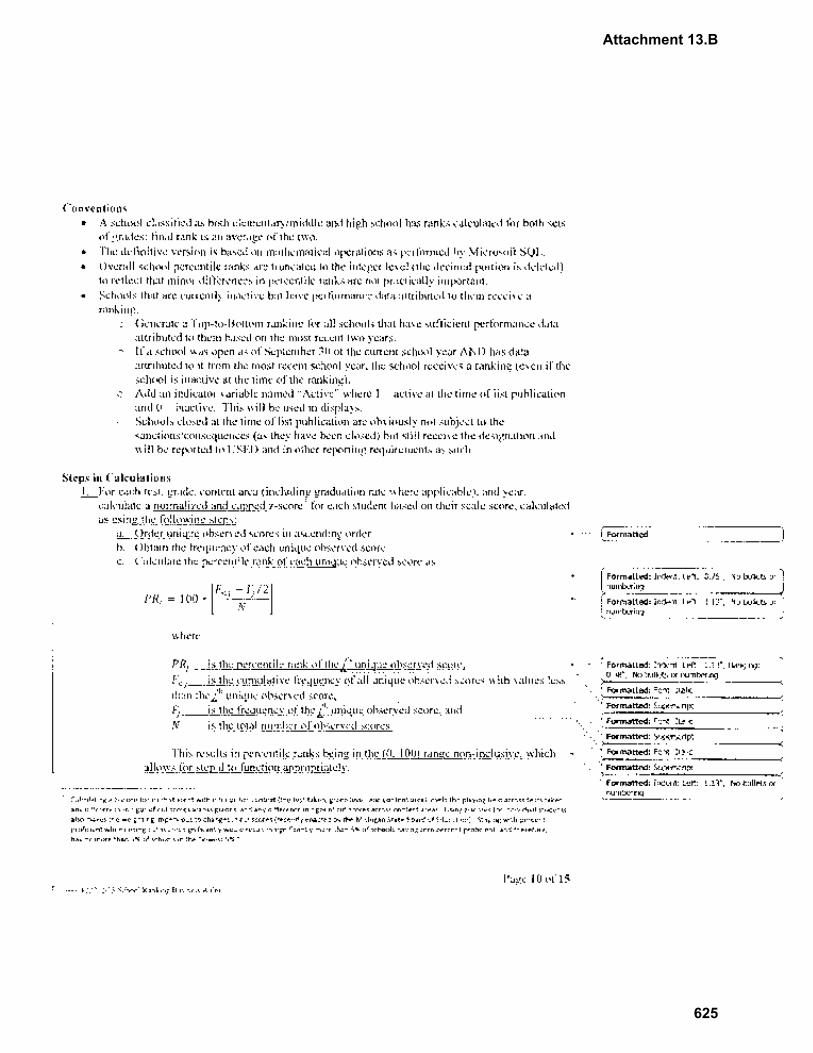
Attachment 13.B
625
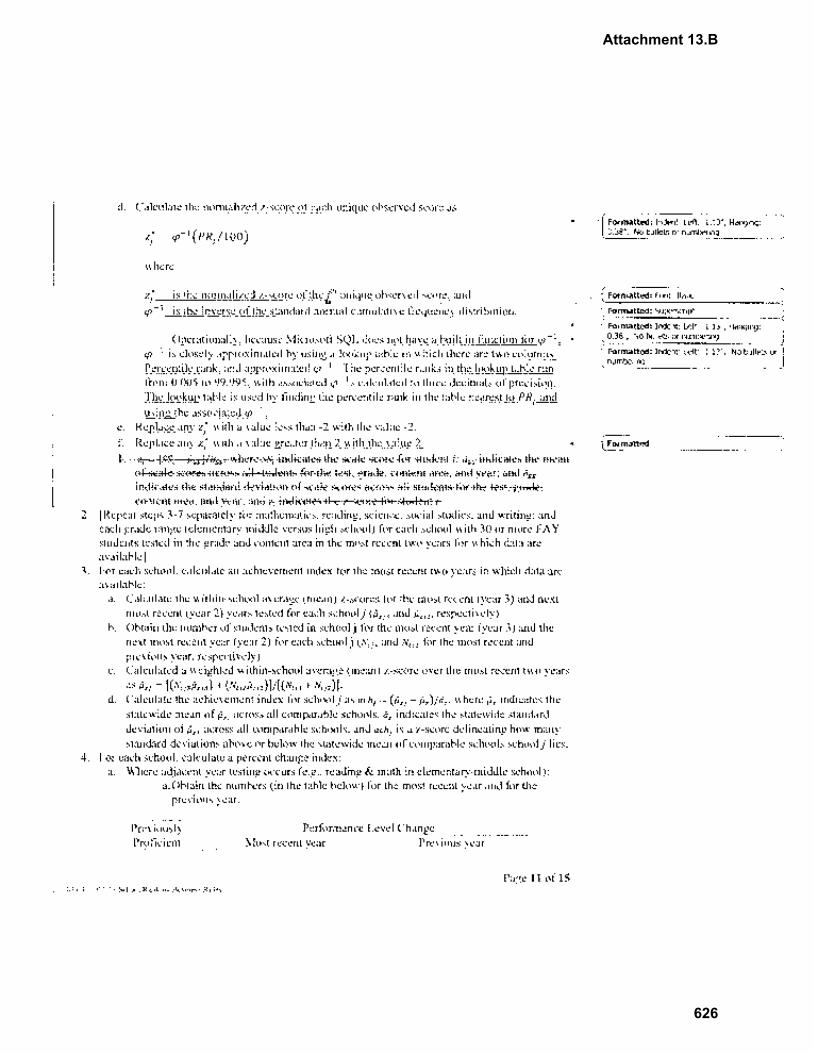
Attachment 13.B
626
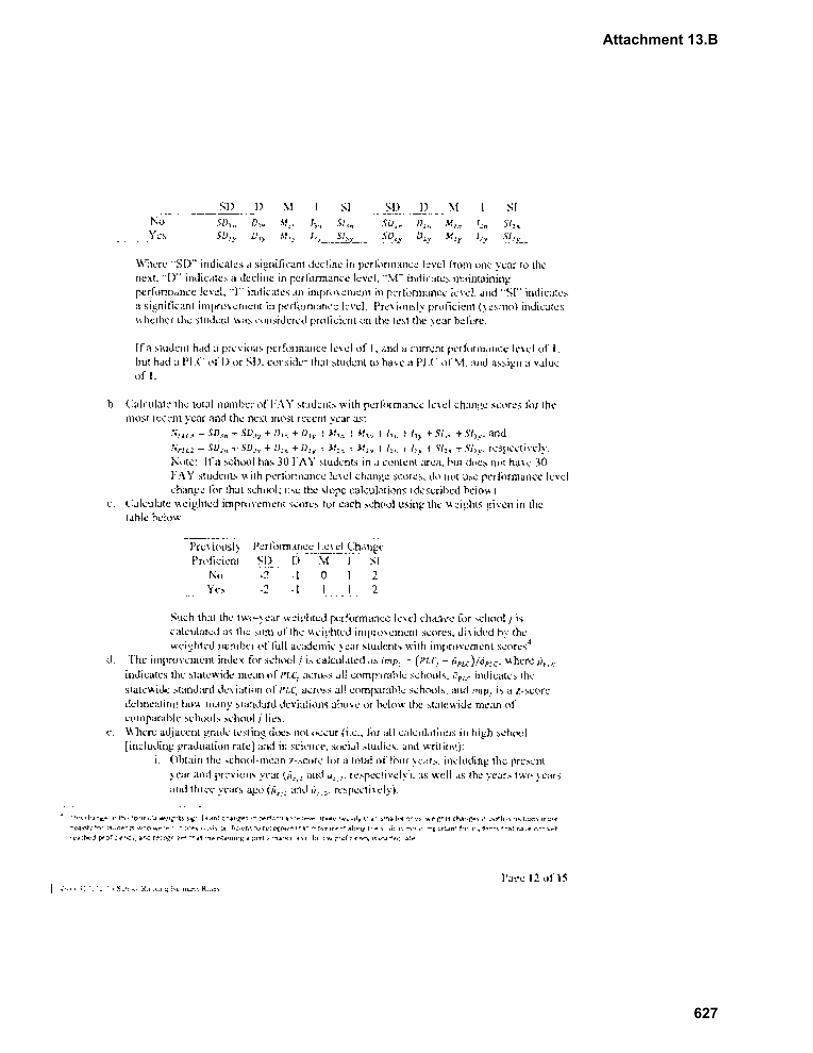
Attachment 13.B
627
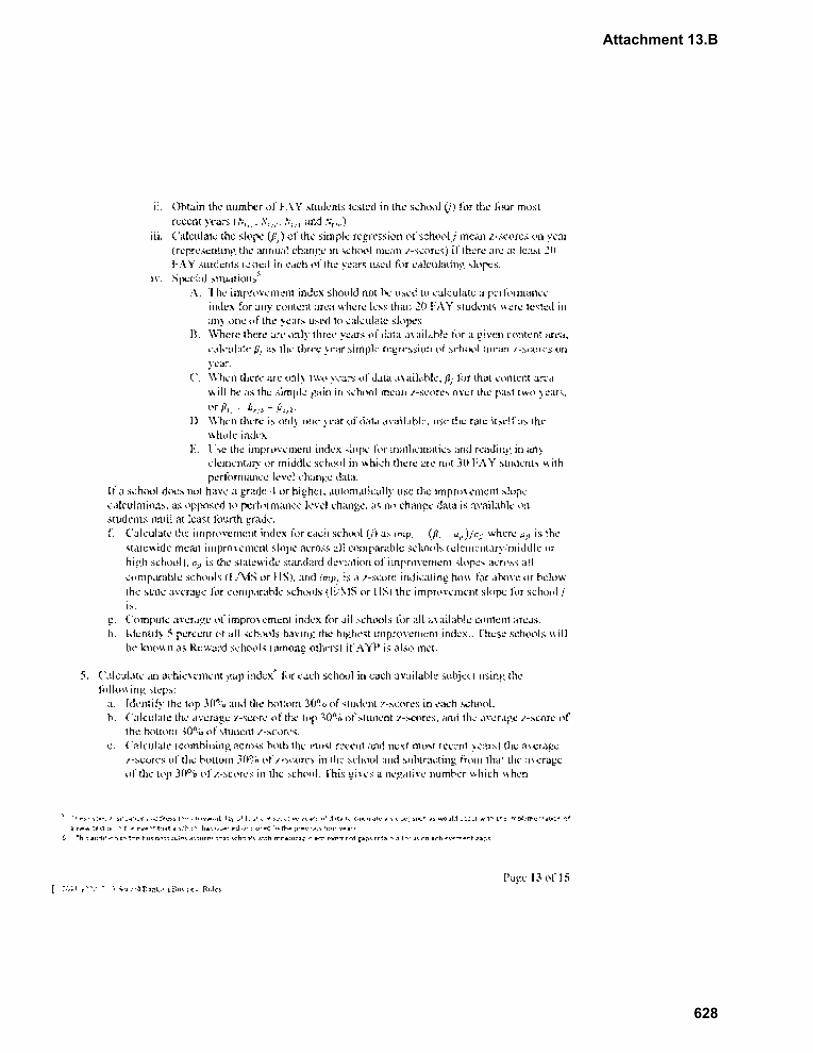
Attachment 13.B
628

Attachment 13.B
629

Attachment 13.B
630
Attachment 13.C
631

Attachment 13.C
632
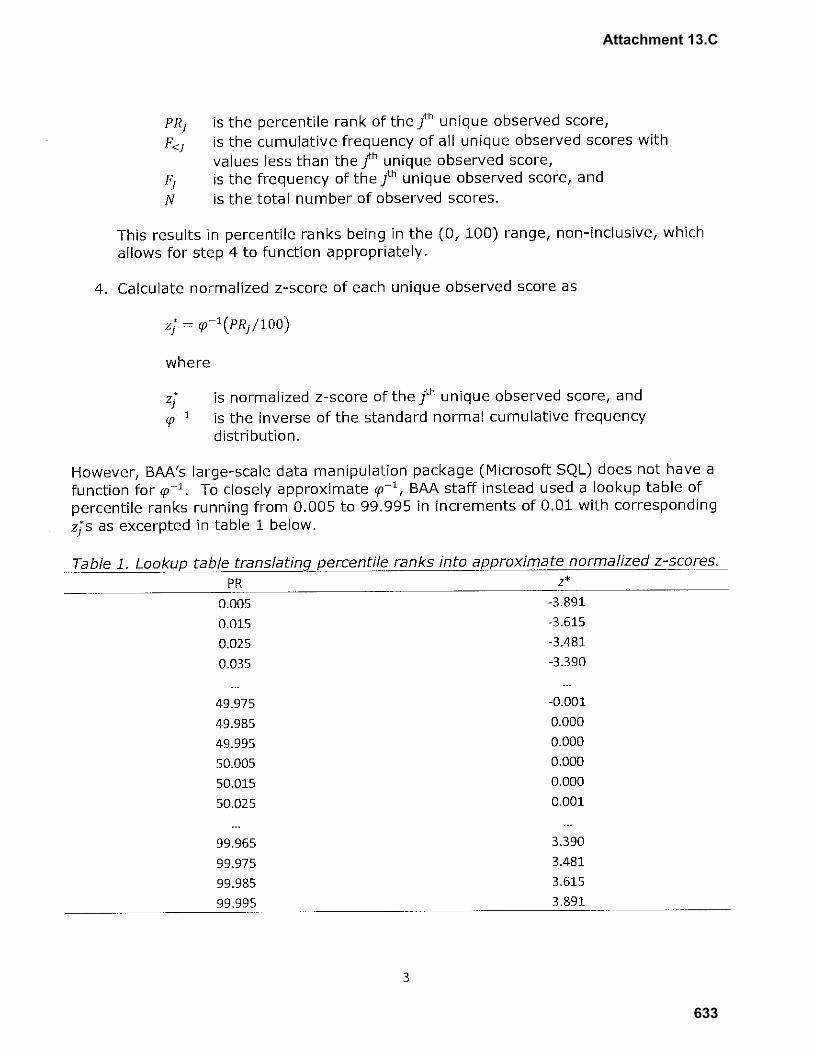
Attachment 13.C
633
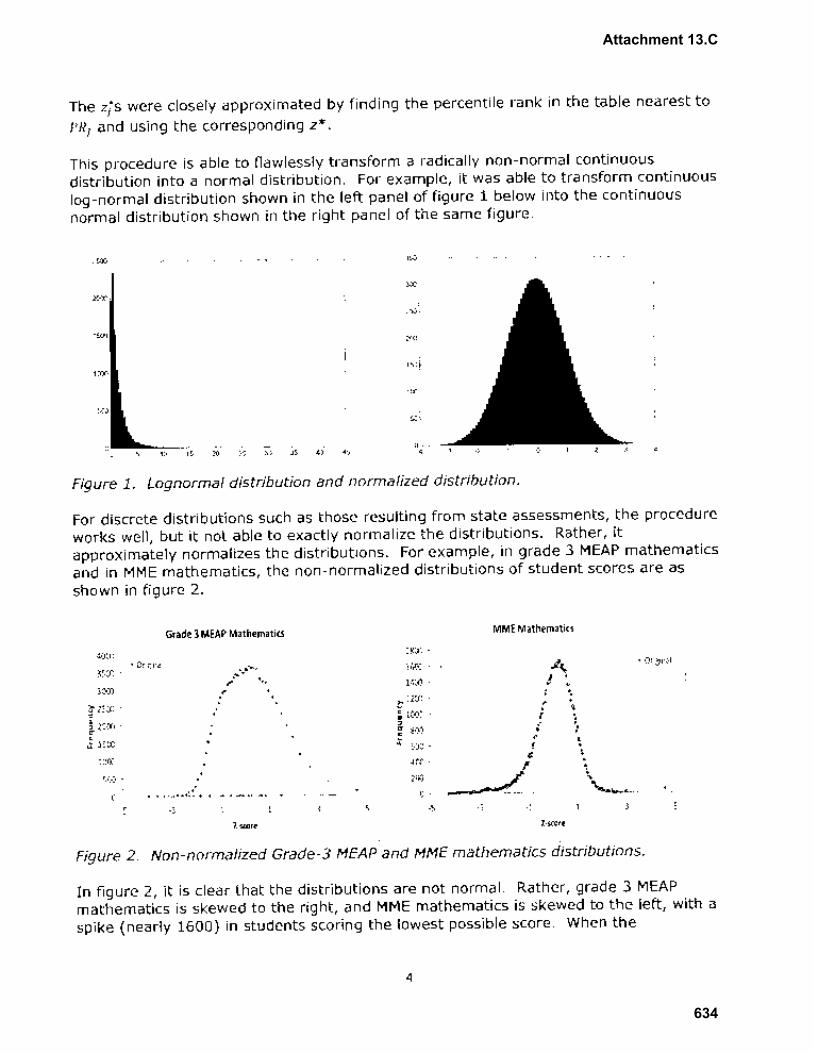
Attachment 13.C
634

Attachment 13.C
635

Attachment 13.C
636
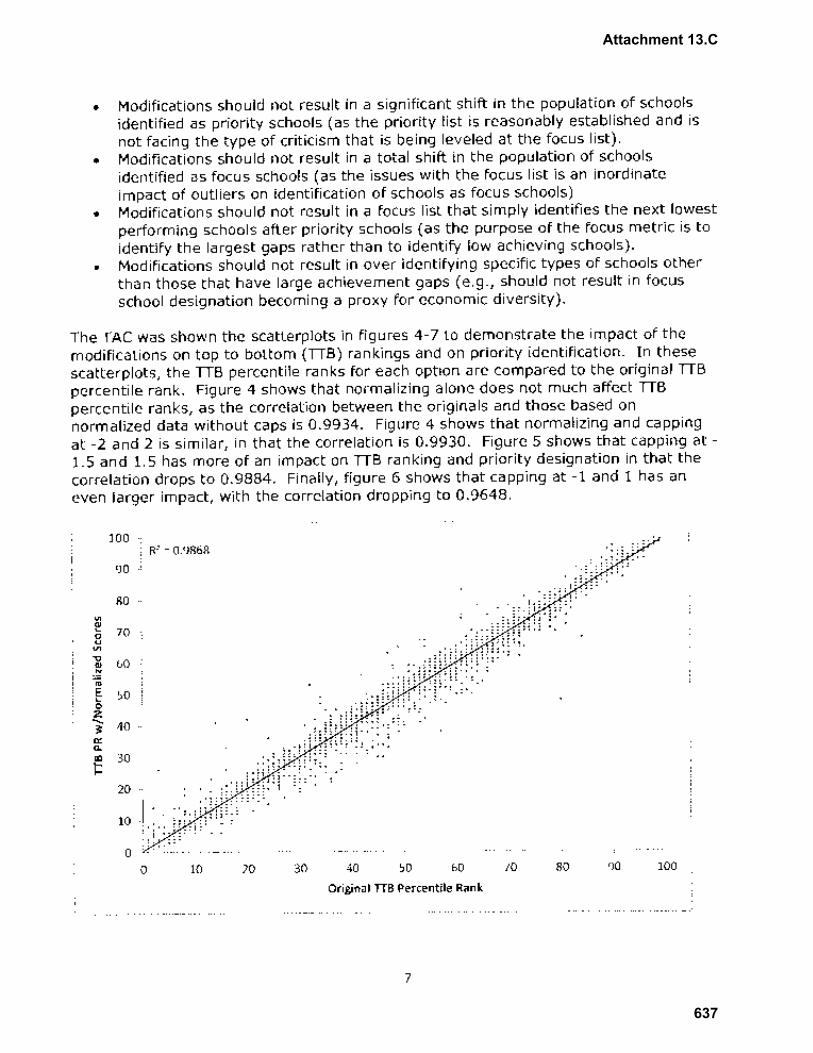
Attachment 13.C
637
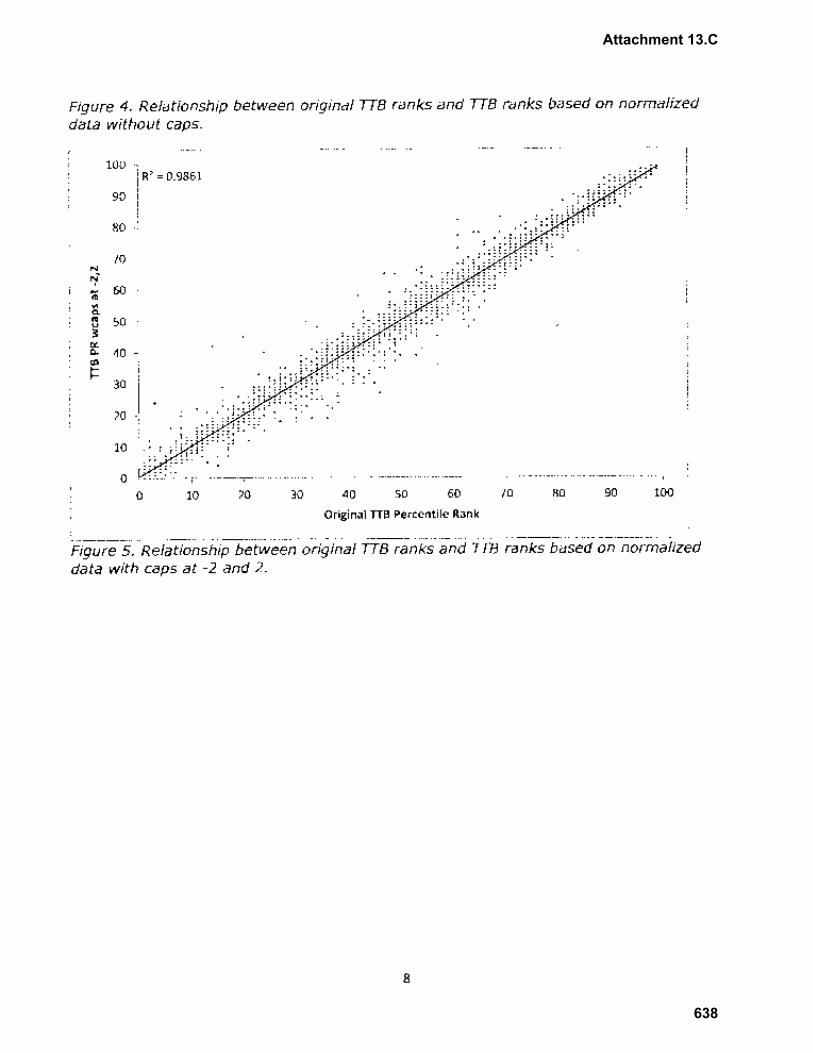
Attachment 13.C
638

Attachment 13.C
639
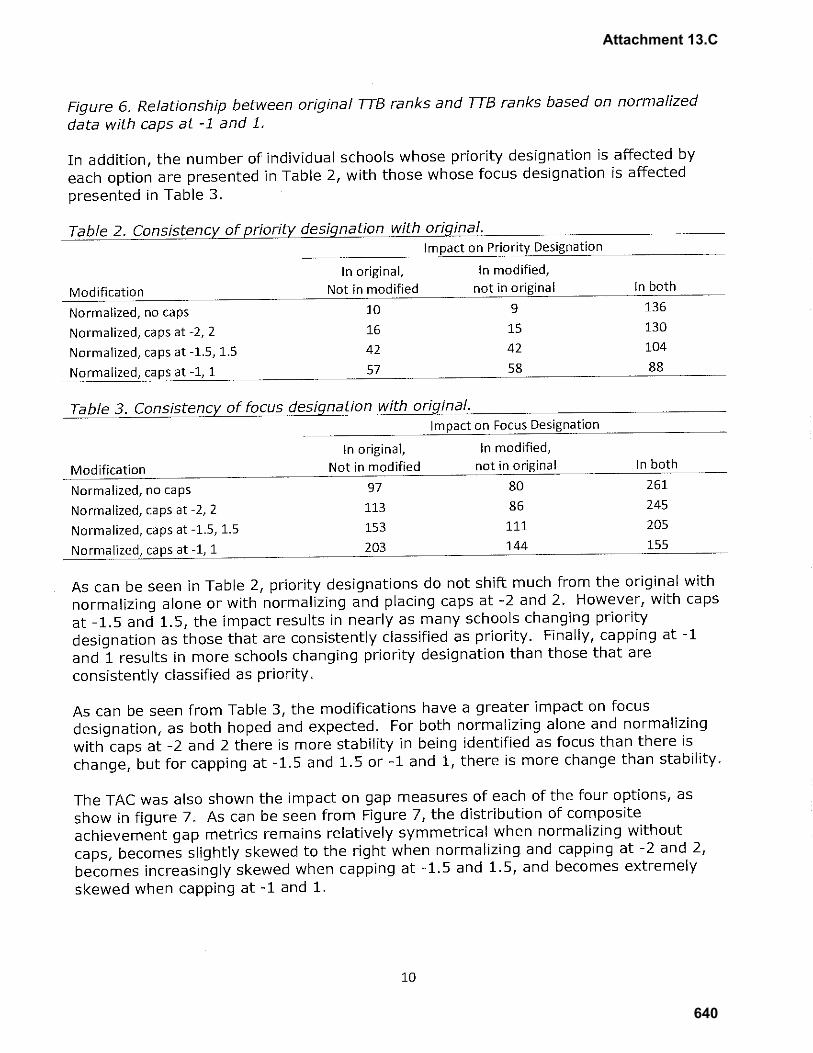
Attachment 13.C
640
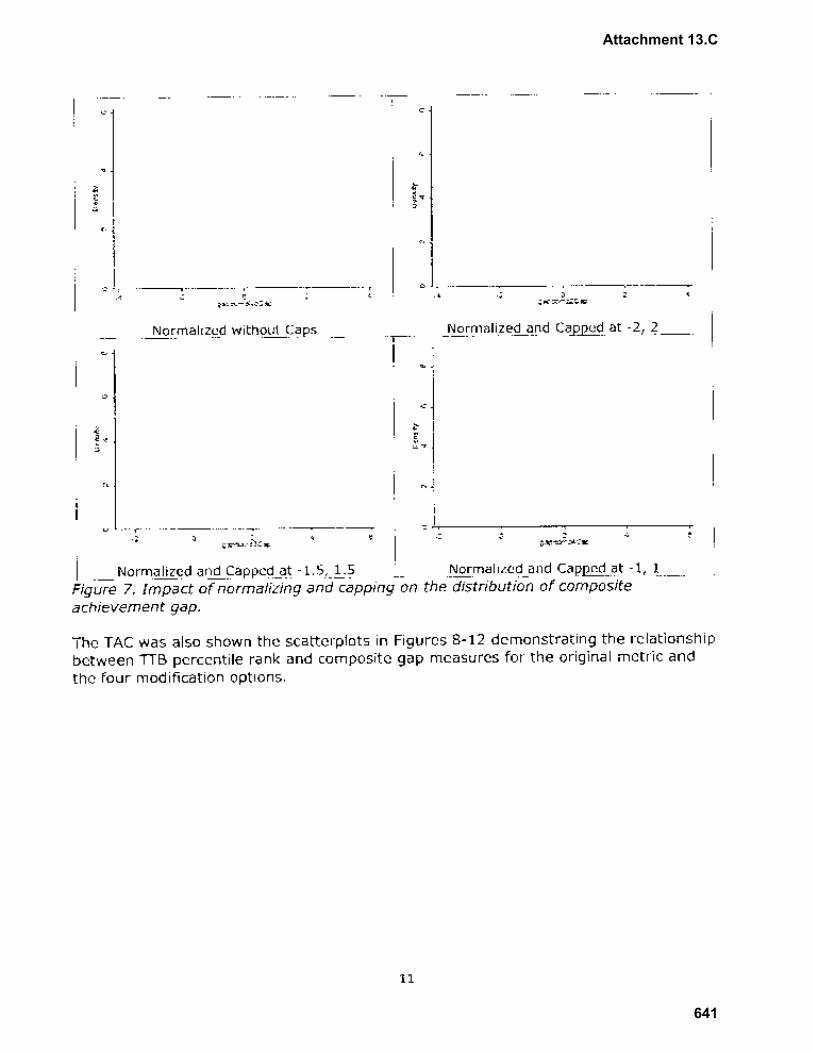
Attachment 13.C
641

Attachment 13.C
642
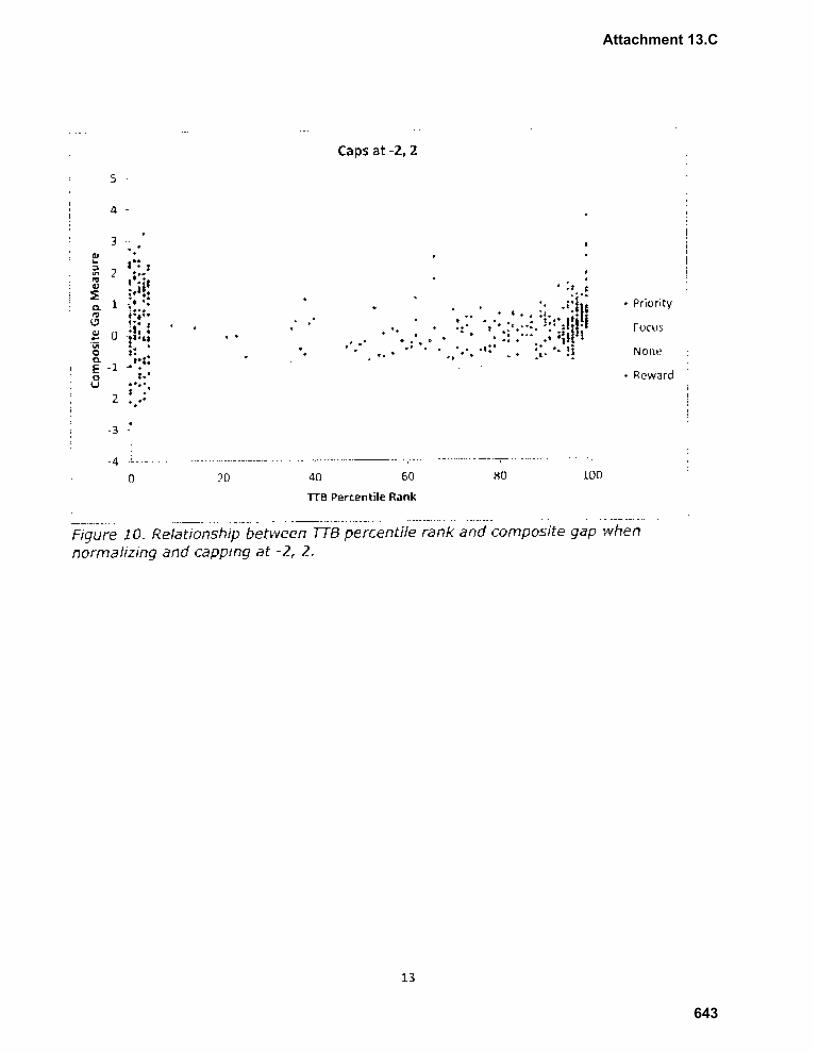
Attachment 13.C
643
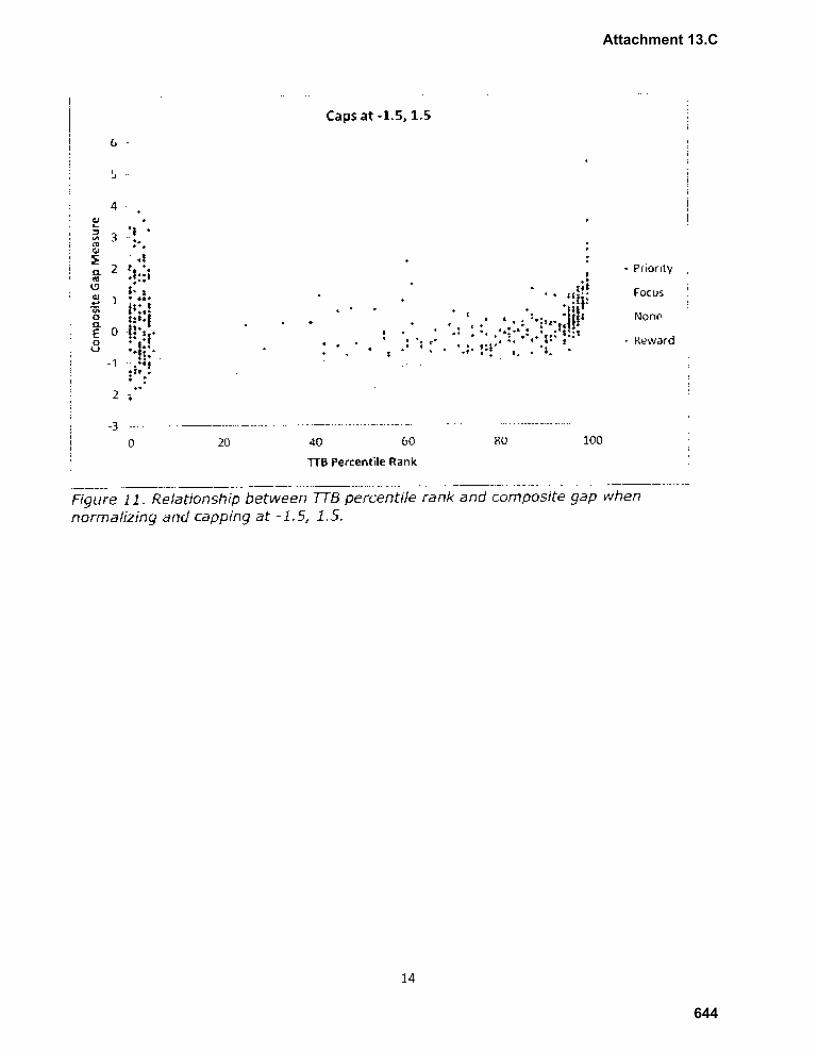
Attachment 13.C
644
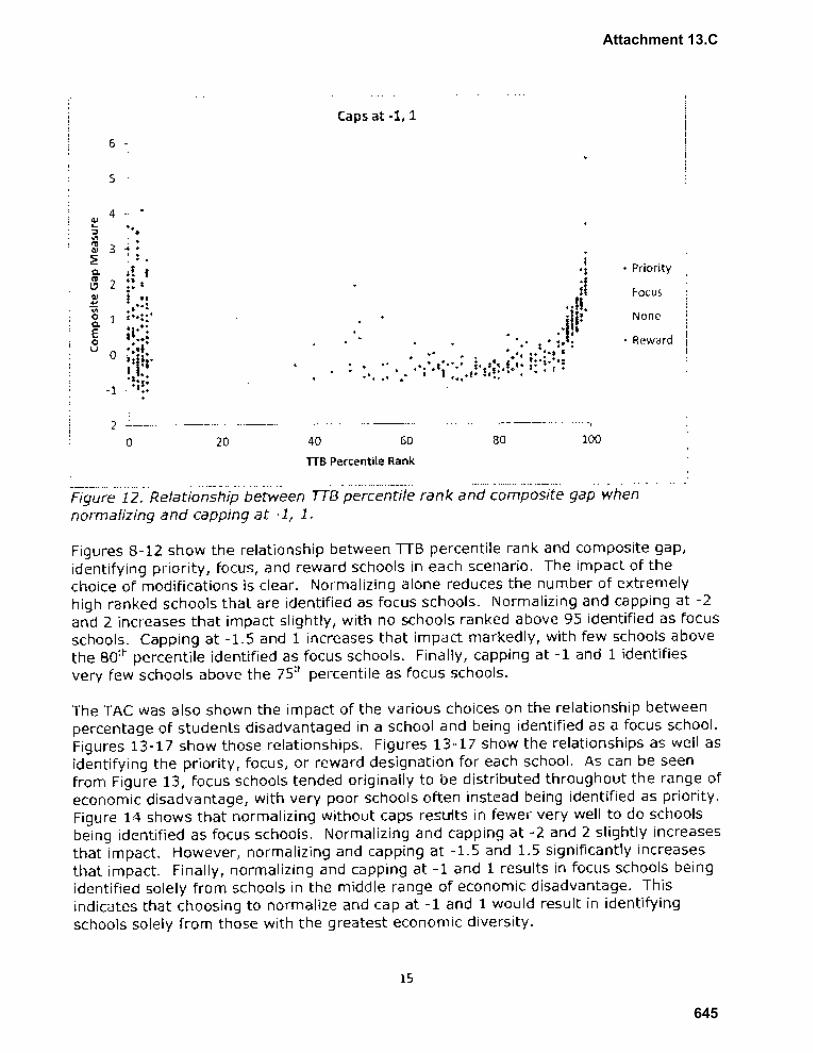
Attachment 13.C
645
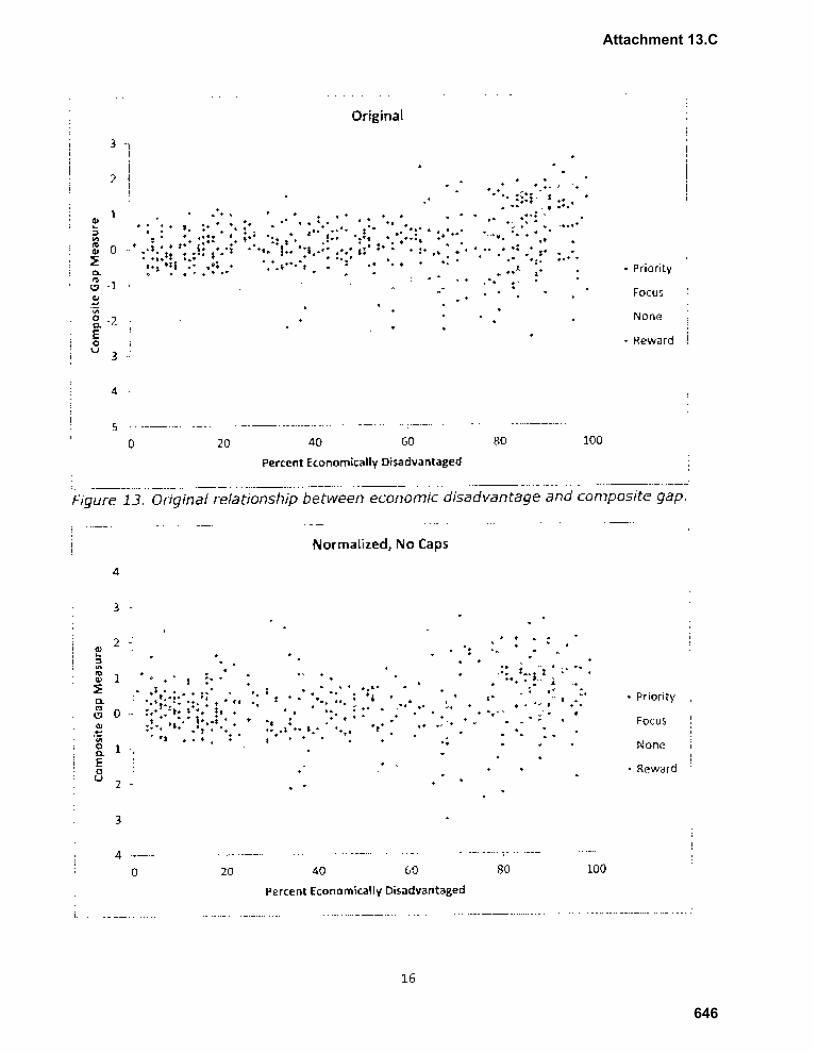
Attachment 13.C
646
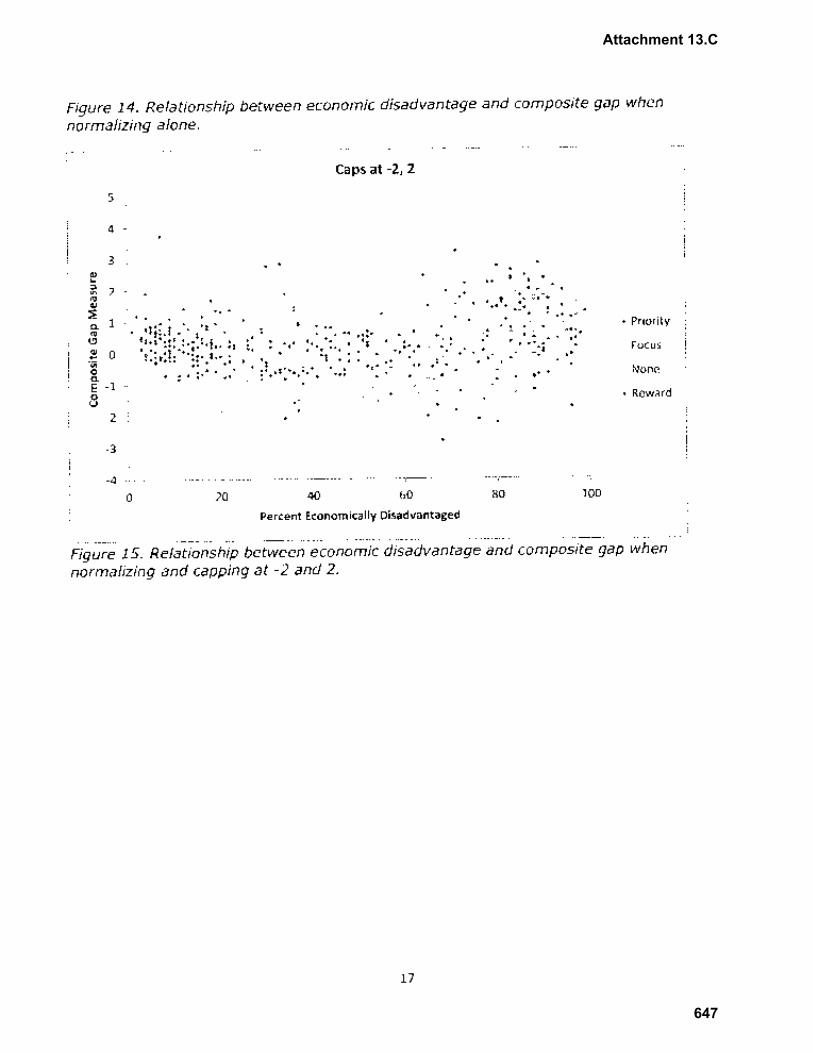
Attachment 13.C
647

Attachment 13.C
648

Attachment 13.C
649

Attachment 13.C
650
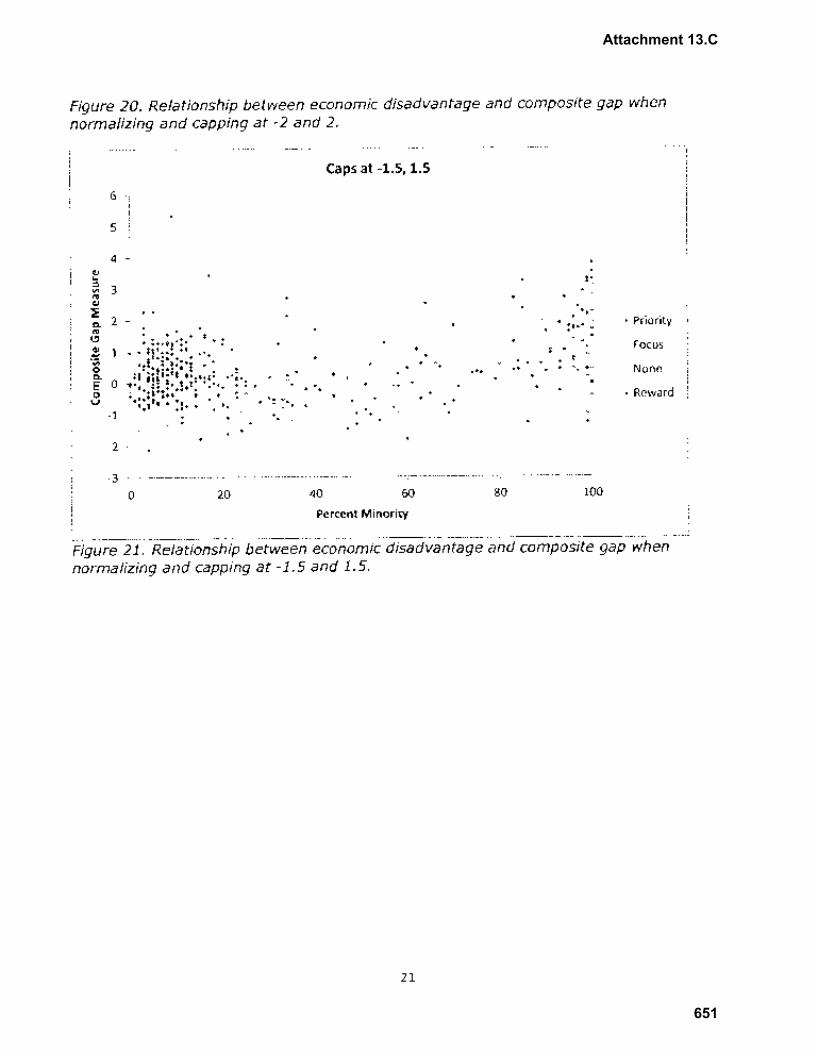
Attachment 13.C
651
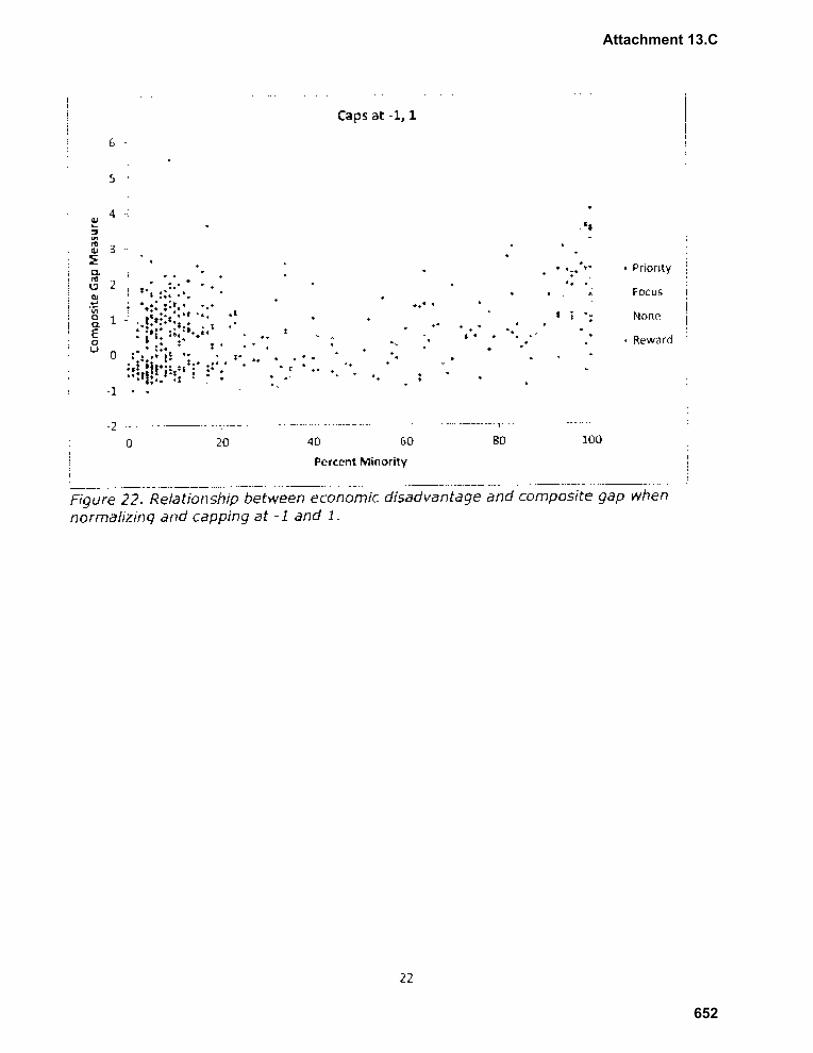
Attachment 13.C
652
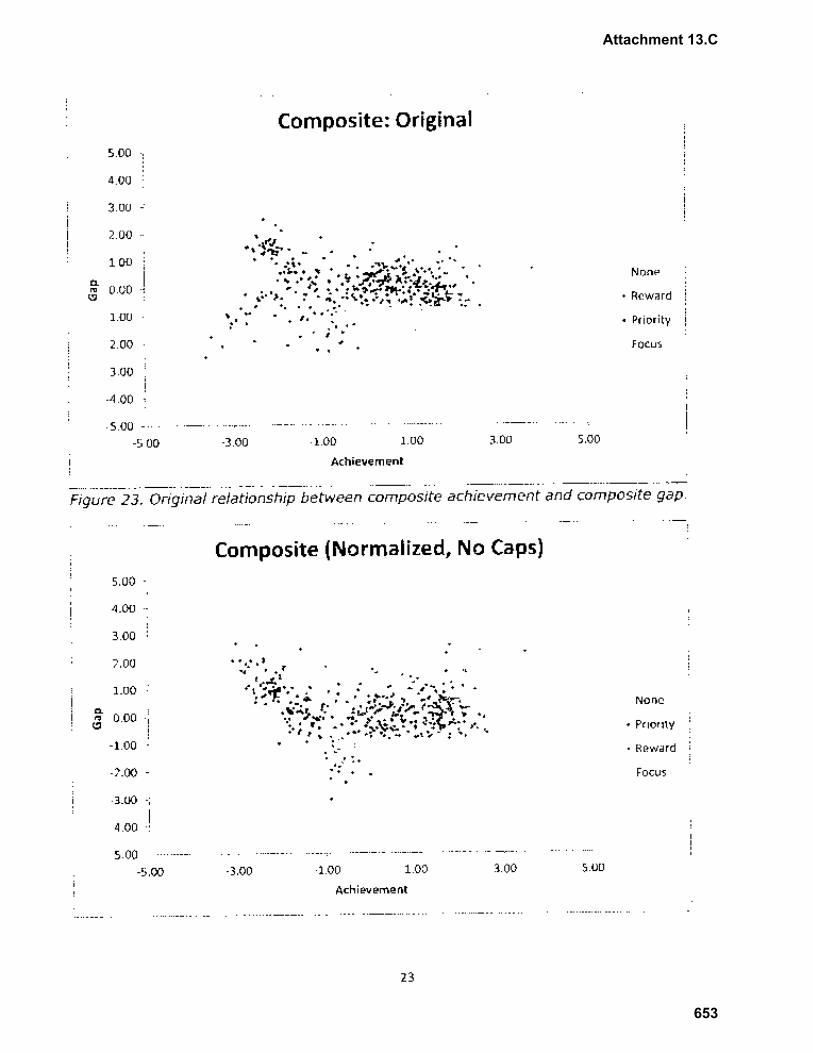
Attachment 13.C
653
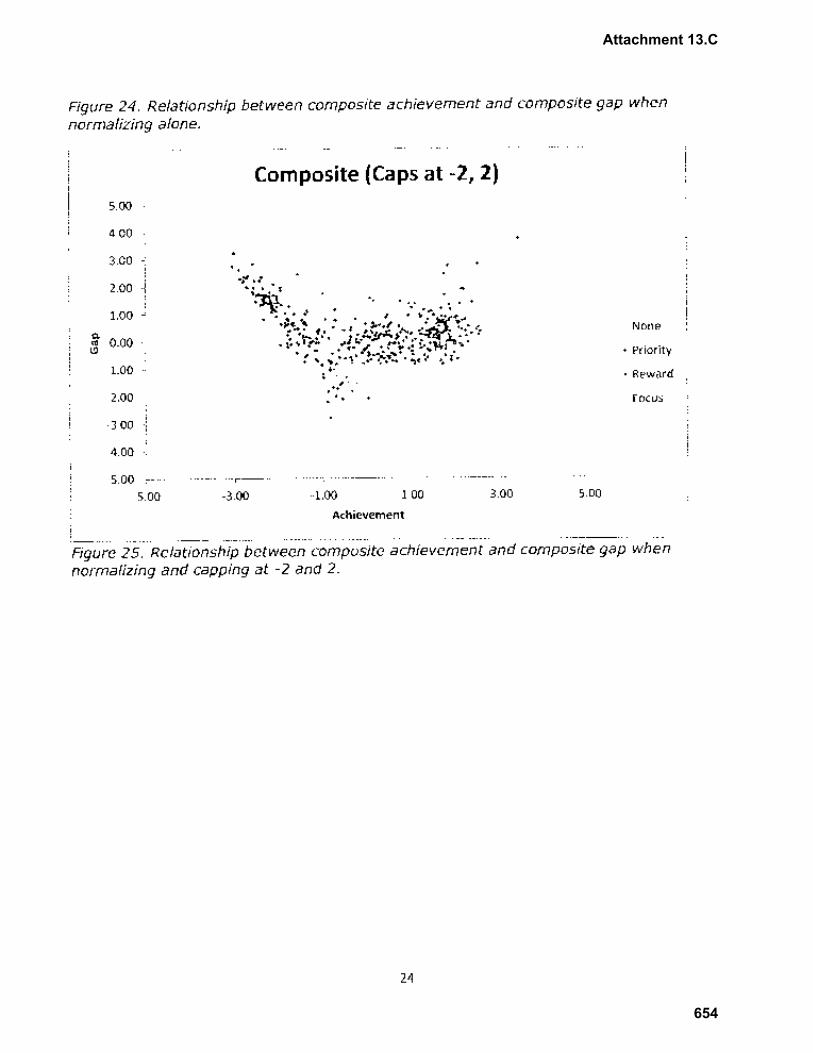
Attachment 13.C
654

Attachment 13.C
655

Attachment 13.C
656
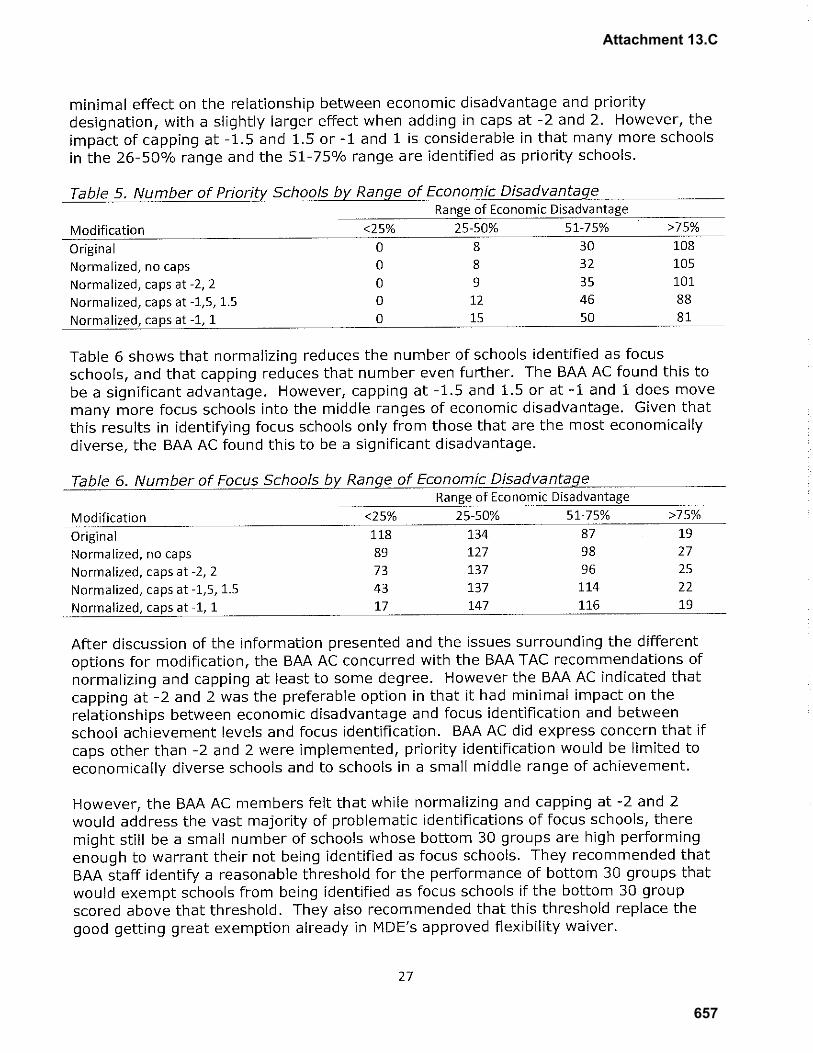
Attachment 13.C
657
Attachment 13.C
658
1
1
BOTTOM 30% SUBGROUP IN FOCUS SCHOOLS DATA APPENDIX
Michigan’s addition of the bottom 30% subgroup has added a new layer and dimension to accountability and helps schools focus on their within‐school achievement gaps. It is the size of this within‐school gap between the top 30% subgroup and the bottom 30% subgroup that identifies schools as Focus schools within Michigan, meaning that the schools with the largest within school gaps are identified as focus schools. This addendum provides an analysis of the demographic characteristics of the bottom 30% subgroup in Focus schools. To produce Figure 1, we calculated for each school the proportion of the bottom 30% subgroup that was marked as being in each traditional demographic subgroup (for example, the proportion of the bottom 30% subgroup that was also economically disadvantaged). We then sorted schools by whether they were or were not flagged as focus schools. Then, for each group of schools (non‐focus, focus), we calculated the median proportion of the bottom 30% subgroup that was also marked as being in one of the traditional subgroups. In Figure 1, the left panel represents non‐focus schools and the right panel represents focus schools. The bars then represent the typical proportion of the bottom 30% subgroup in each type of school that are also flagged as being in one of the traditional demographic subgroups. For example, the dark blue bars indicate that in non‐focus schools, the bottom 30% subgroup is typically also approximately 38% economically disadvantaged; but that in focus schools the bottom 30% subgroup is also typically approximately 43% economically disadvantaged. Figure 1 demonstrates two main points:
1. The bottom 30% subgroup in Focus schools contains all of the standard ESEA subgroups. 2. Focus schools have a higher representation of students with disabilities (labeled “se” in the
above graphic), limited English proficient (LEP) students, and black and Hispanic students in their bottom 30% subgroup than non‐focus schools.
Attachment 13.D
659
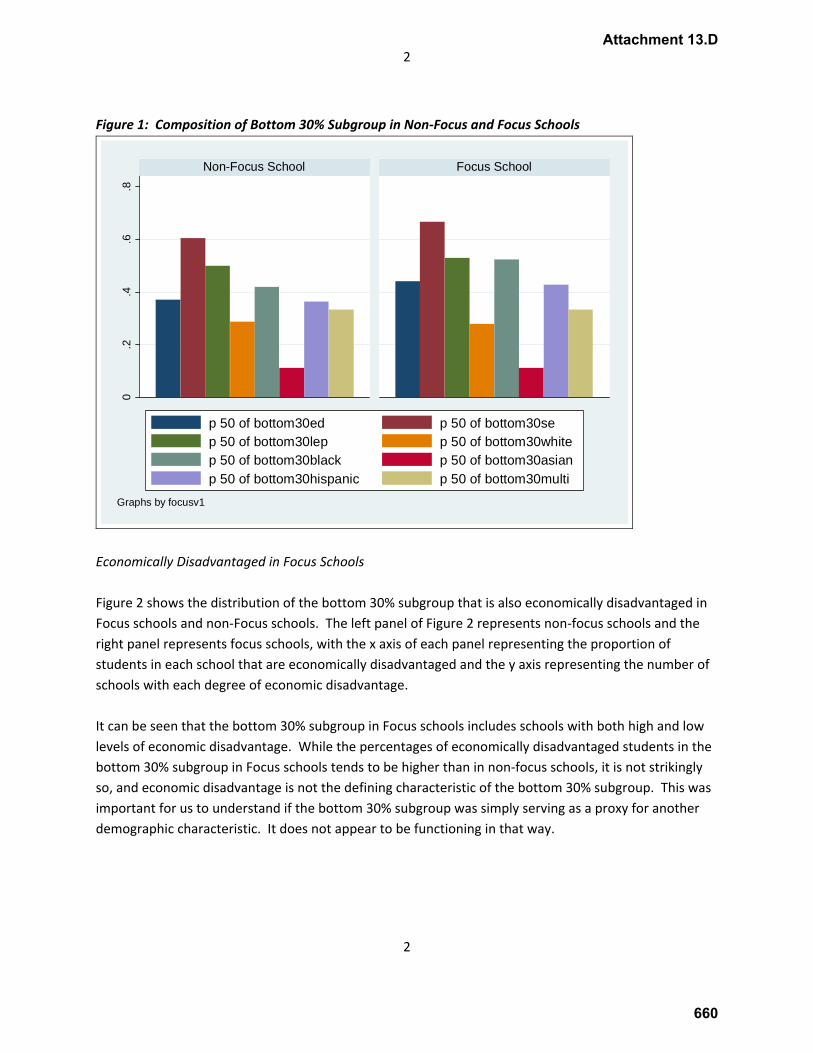
2
2
Figure 1: Composition of Bottom 30% Subgroup in Non‐Focus and Focus Schools 0
.2.4
.6.8
Non-Focus School Focus School
p 50 of bottom30ed p 50 of bottom30sep 50 of bottom30lep p 50 of bottom30whitep 50 of bottom30black p 50 of bottom30asianp 50 of bottom30hispanic p 50 of bottom30multi
Graphs by focusv1
Economically Disadvantaged in Focus Schools Figure 2 shows the distribution of the bottom 30% subgroup that is also economically disadvantaged in Focus schools and non‐Focus schools. The left panel of Figure 2 represents non‐focus schools and the right panel represents focus schools, with the x axis of each panel representing the proportion of students in each school that are economically disadvantaged and the y axis representing the number of schools with each degree of economic disadvantage. It can be seen that the bottom 30% subgroup in Focus schools includes schools with both high and low levels of economic disadvantage. While the percentages of economically disadvantaged students in the bottom 30% subgroup in Focus schools tends to be higher than in non‐focus schools, it is not strikingly so, and economic disadvantage is not the defining characteristic of the bottom 30% subgroup. This was important for us to understand if the bottom 30% subgroup was simply serving as a proxy for another demographic characteristic. It does not appear to be functioning in that way.
Attachment 13.D
660
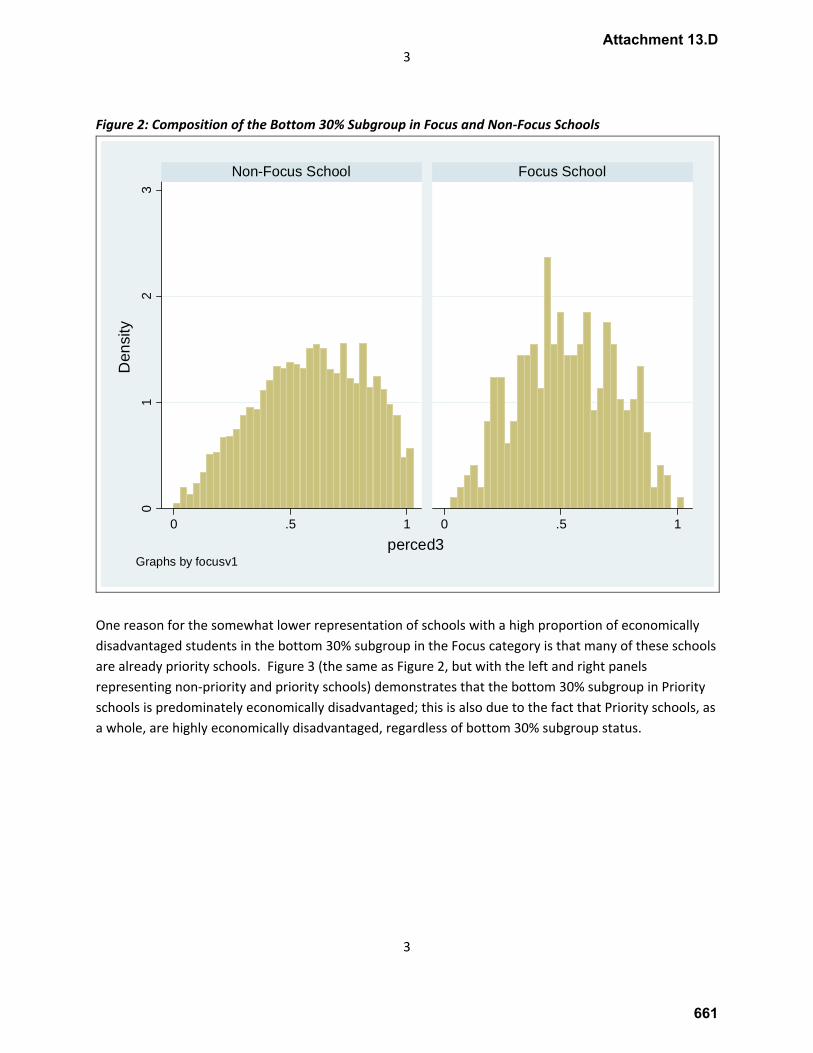
3
3
Figure 2: Composition of the Bottom 30% Subgroup in Focus and Non‐Focus Schools
01
23
0 .5 1 0 .5 1
Non-Focus School Focus School
Den
sity
perced3Graphs by focusv1
One reason for the somewhat lower representation of schools with a high proportion of economically disadvantaged students in the bottom 30% subgroup in the Focus category is that many of these schools are already priority schools. Figure 3 (the same as Figure 2, but with the left and right panels representing non‐priority and priority schools) demonstrates that the bottom 30% subgroup in Priority schools is predominately economically disadvantaged; this is also due to the fact that Priority schools, as a whole, are highly economically disadvantaged, regardless of bottom 30% subgroup status.
Attachment 13.D
661
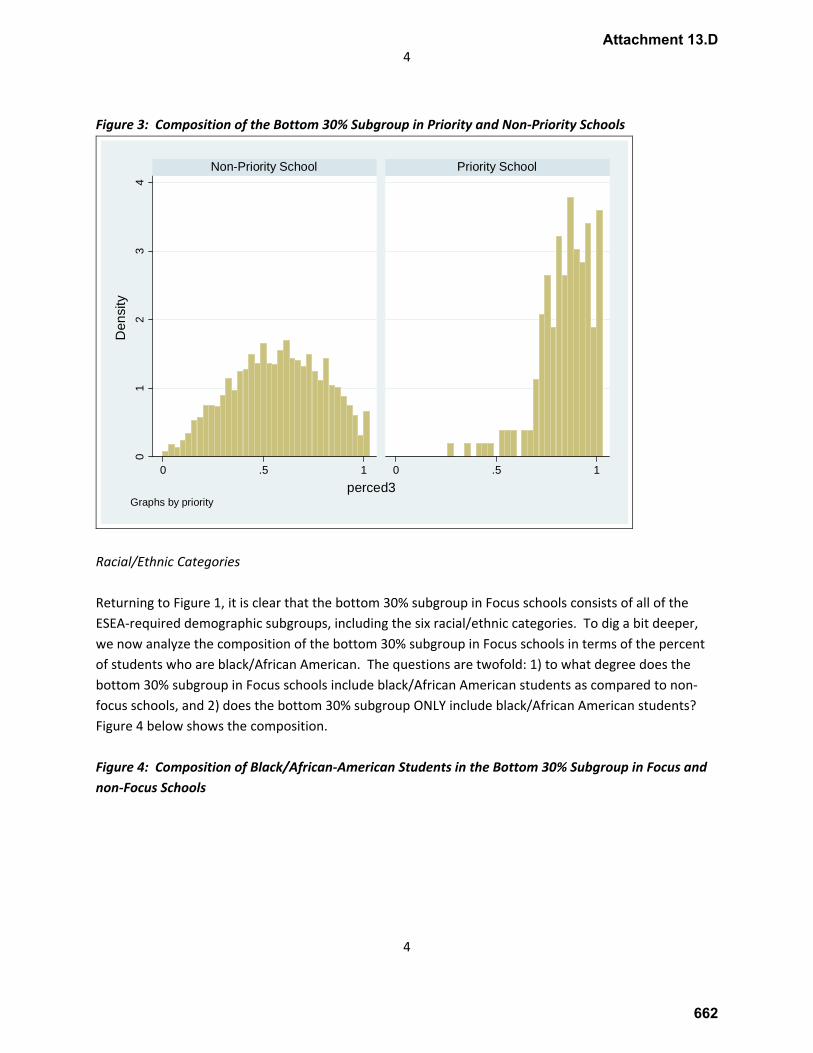
4
4
Figure 3: Composition of the Bottom 30% Subgroup in Priority and Non‐Priority Schools 0
12
34
0 .5 1 0 .5 1
Non-Priority School Priority School
Den
sity
perced3Graphs by priority
Racial/Ethnic Categories Returning to Figure 1, it is clear that the bottom 30% subgroup in Focus schools consists of all of the ESEA‐required demographic subgroups, including the six racial/ethnic categories. To dig a bit deeper, we now analyze the composition of the bottom 30% subgroup in Focus schools in terms of the percent of students who are black/African American. The questions are twofold: 1) to what degree does the bottom 30% subgroup in Focus schools include black/African American students as compared to non‐focus schools, and 2) does the bottom 30% subgroup ONLY include black/African American students? Figure 4 below shows the composition. Figure 4: Composition of Black/African‐American Students in the Bottom 30% Subgroup in Focus and
non‐Focus Schools
Attachment 13.D
662
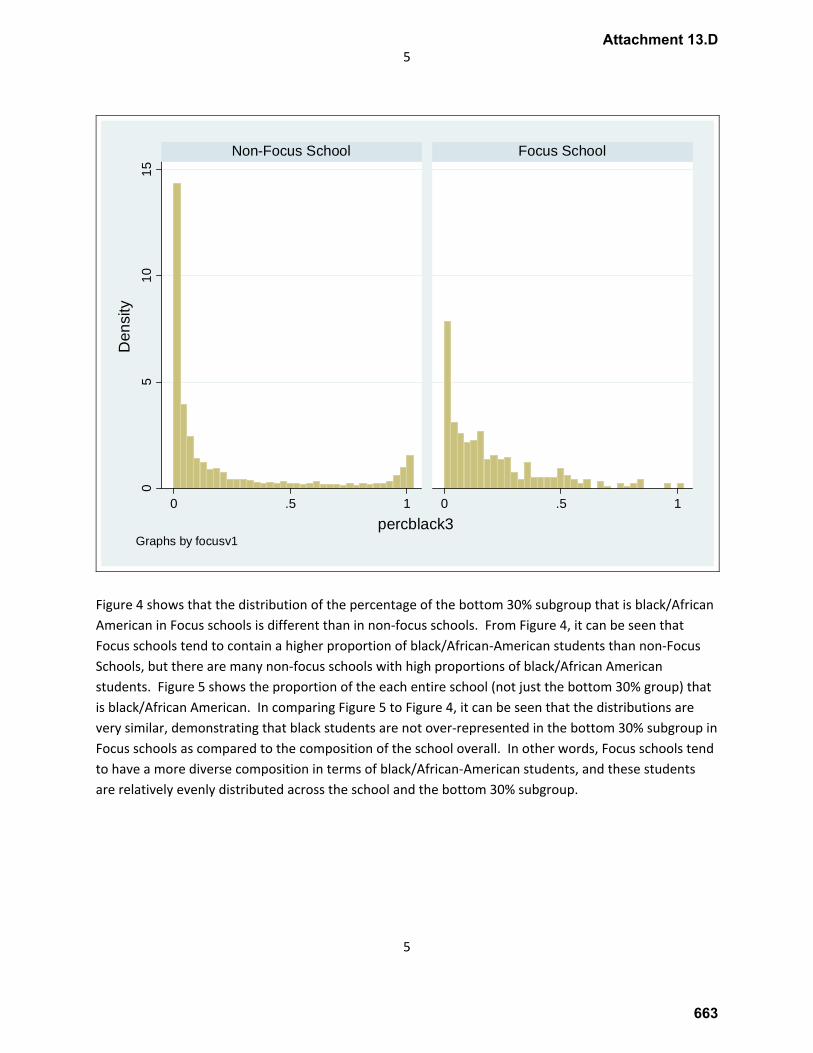
5
5
05
1015
0 .5 1 0 .5 1
Non-Focus School Focus School
Den
sity
percblack3Graphs by focusv1
Figure 4 shows that the distribution of the percentage of the bottom 30% subgroup that is black/African American in Focus schools is different than in non‐focus schools. From Figure 4, it can be seen that Focus schools tend to contain a higher proportion of black/African‐American students than non‐Focus Schools, but there are many non‐focus schools with high proportions of black/African American students. Figure 5 shows the proportion of the each entire school (not just the bottom 30% group) that is black/African American. In comparing Figure 5 to Figure 4, it can be seen that the distributions are very similar, demonstrating that black students are not over‐represented in the bottom 30% subgroup in Focus schools as compared to the composition of the school overall. In other words, Focus schools tend to have a more diverse composition in terms of black/African‐American students, and these students are relatively evenly distributed across the school and the bottom 30% subgroup.
Attachment 13.D
663
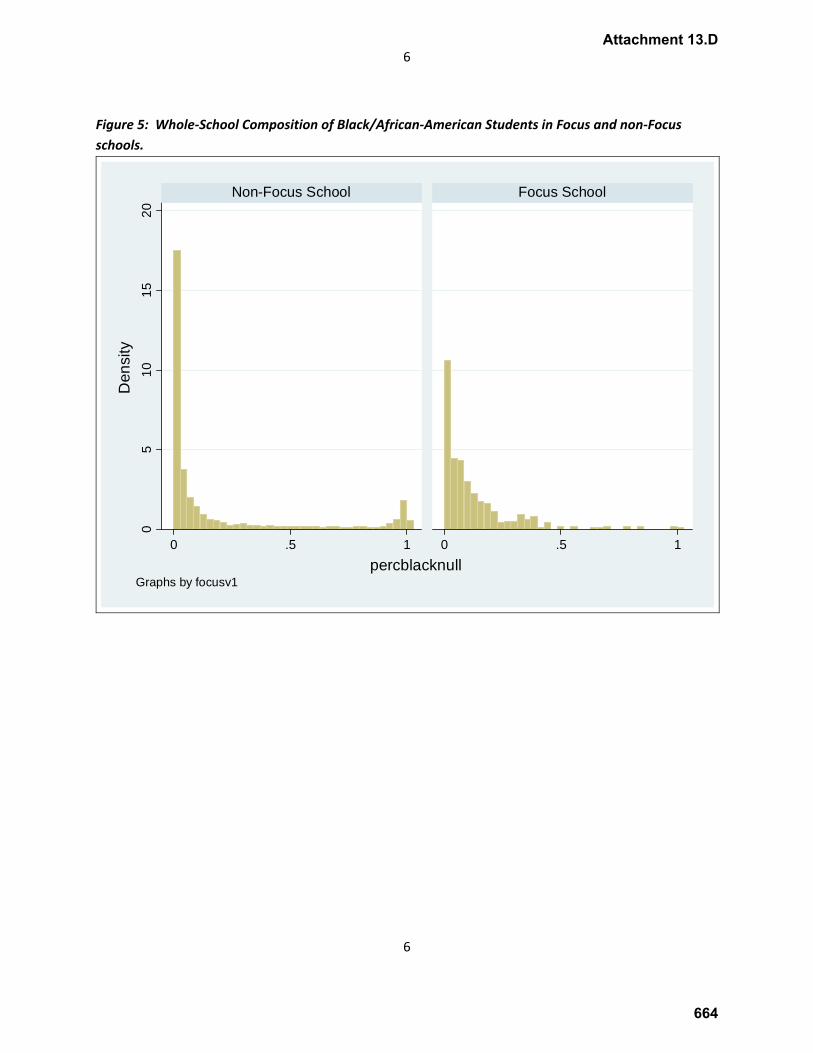
6
6
Figure 5: Whole‐School Composition of Black/African‐American Students in Focus and non‐Focus
schools. 0
510
1520
0 .5 1 0 .5 1
Non-Focus School Focus School
Den
sity
percblacknullGraphs by focusv1
Attachment 13.D
664

7
7
Students with Disabilities in the Bottom 30% Subgroup in Focus Schools Figure 6 shows the distribution of students with disabilities in each of the subgroups (top 30% in dark blue, middle 40% in red, bottom 30% in green, and whole school in orange) in Focus and non‐Focus schools. The bottom 30% subgroup includes students with disabilities at a higher rate than the other two subgroups across both types of schools as might be expected. However, the composition of the bottom 30% in Focus schools is similar to that in non‐Focus schools in terms of students with disabilities. Figure 6: Distribution of Students with Disabilities in Focus and non‐Focus Schools.
0.0
5.1
.15
.2.2
5
Non-Focus School Focus School
p 50 of percse1 p 50 of percse2p 50 of percse3 p 50 of percsenull
Graphs by focusv1
Attachment 13.D
665
Accountability Designation Considerations and Supports for Center
Programs
Throughout Michigan, there are center programs that are designed to meet
the specific academic, social and transition goals of students with disabilities
with more intensive programming than those offered in traditional school
settings. Center programs by design, are organized to meet unique needs of
a very specific population of learners. Center programs serve students
through age 25, require an accountability system that aligns with the types
of programming offered for students with disabilities. Center programs are
designated as individual schools for the purpose of data tracking, and have a
separate building code.
Michigan assures that all students, including those in center programs, are
assessed, using appropriate state approved assessments. These center
programs are included in the Top-to-Bottom ranking, using the specialized
assessments identified for each student within their individual education
program (IEP). The specific set of interventions and requirements identified
for the “Priority” or “Focus” accountability designation are not appropriate
for center programs in Michigan, due to the unique nature of these schools.
Although reward schools do not require interventions that are problematic,
the designation of “reward” does not align with the measures that should be
used to identify progress and achievement in center programs.
A litigation settlement between the MDE and a number of these center
programs in 2013 removes these designations and the placement of such
schools under authority of the School Reform Office for the purposes of
developing and implementing a reform/redesign plan or similar efforts.
Attachment 13.E
666
Since center programs are not considered identified as Priority or Focus
Schools, nor placed under the supervision of the School Reform Office,
alternate mechanisms are needed to include them in Michigan’s
accountability system.
Center programs whose Top-to-Bottom ranking is in the state’s bottom 5%
will therefore be required to conduct a facilitated, comprehensive data
analysis of their appropriate state assessments, prepare a plan to improve
instruction and student achievement, identify these Teaching and Learning
Priorities in the state’s School Improvement website, ASSIST and
incorporate them into their school improvement plans.
MDE will review the School Improvement Plans and Annual Education
Reports of these center programs annually to monitor the center program’s
implementation of the Teaching and Learning Priorities and improvement
activities as well as their required reporting activities. MDE will provide
support over multiple years to enable center programs to make progress in
student achievement. In this way, MDE will ensure that there is
accountability for student learning in the center programs.
Attachment 13.E
667