WIC PNSS & PedNSS - State of Michigan
35
Comparison of Racial and Ethnic Distribution (2) Local Agency Number Included in Analysis White, Not Hispanic % Black, Not Hispanic % Hispanic % American Indian/Alaska Native % Asian/Pacific Islander % Multiple Races % All Other/Unknown % 01DHD#2 336 92.0 0.6 3.0 0.3 0.0 4.2 0.0 02LMAS 133 71.4 0.0 2.3 9.8 0.0 16.5 0.0 04DHD#4 343 91.5 0.3 2.0 0.3 0.0 5.8 0.0 05NWMCHA 423 90.3 0.5 2.1 0.7 0.5 5.9 0.0 06CMDHD 1,018 88.3 1.4 4.5 0.6 0.4 4.7 0.1 07West UP 271 86.7 1.8 2.2 1.1 1.8 5.9 0.4 08Barry 397 90.2 2.0 6.3 0.3 0.3 0.8 0.3 09Bay 506 79.6 2.2 11.7 0.0 0.2 6.3 0.0 10Gr Trav 387 85.0 1.0 5.4 3.9 0.8 3.6 0.3 11Berrien 765 49.4 37.3 7.7 0.1 1.3 3.3 0.9 12BHS 890 79.8 0.7 14.2 0.0 0.2 4.3 0.9 13Calhoun 932 60.7 20.7 7.7 0.2 4.8 5.2 0.6 14Leelanau 110 78.2 0.0 11.8 2.7 0.0 7.3 0.0 15Intercar 2,148 60.8 4.6 26.4 0.1 2.1 4.8 1.2 17Chippewa 174 56.9 0.6 4.0 17.2 1.1 20.1 0.0 19Mid-Mich 636 87.4 0.6 8.8 0.0 0.0 2.5 0.6 21Delta 277 77.3 1.8 4.7 2.5 1.1 12.6 0.0 22Iron 183 93.4 0.0 2.2 0.0 0.0 3.3 1.1 25Genesee 2,429 48.3 38.8 5.8 0.0 0.4 6.5 0.2 30HDI 573 39.1 42.1 14.8 0.2 0.0 3.8 0.0 32Huron 122 93.4 0.0 5.7 0.0 0.0 0.0 0.8 33Ingham 1,738 42.2 29.1 15.4 0.2 4.8 8.2 0.2 35Keweenaw 28 * * * * * * * (1) Reporting period is January 1 through December 31 (2) Excludes data with errors * National includes previous year’s data for all participating States and ITOs. * Percentages are not calculated if <100 records are available for analysis after exclusions. 2021 Pregnancy Nutrition Surveillance Comparison of Racial and Ethnic Distribution by Local Agency Table 3F (1) Michigan Run Date: 5/27/2022 WIC PNSS & PedNSS Page : 1
-
Upload
khangminh22 -
Category
Documents
-
view
0 -
download
0
Transcript of WIC PNSS & PedNSS - State of Michigan

Comparison of Racial and Ethnic Distribution (2)
Local AgencyNumber
Included in Analysis
White, Not Hispanic
%
Black, Not Hispanic
%
Hispanic
%
American Indian/Alaska
Native%
Asian/Pacific Islander
%
Multiple Races
%
All Other/Unknown
%
01DHD#2 336 92.0 0.6 3.0 0.3 0.0 4.2 0.0
02LMAS 133 71.4 0.0 2.3 9.8 0.0 16.5 0.0
04DHD#4 343 91.5 0.3 2.0 0.3 0.0 5.8 0.0
05NWMCHA 423 90.3 0.5 2.1 0.7 0.5 5.9 0.0
06CMDHD 1,018 88.3 1.4 4.5 0.6 0.4 4.7 0.1
07West UP 271 86.7 1.8 2.2 1.1 1.8 5.9 0.4
08Barry 397 90.2 2.0 6.3 0.3 0.3 0.8 0.3
09Bay 506 79.6 2.2 11.7 0.0 0.2 6.3 0.0
10Gr Trav 387 85.0 1.0 5.4 3.9 0.8 3.6 0.3
11Berrien 765 49.4 37.3 7.7 0.1 1.3 3.3 0.9
12BHS 890 79.8 0.7 14.2 0.0 0.2 4.3 0.9
13Calhoun 932 60.7 20.7 7.7 0.2 4.8 5.2 0.6
14Leelanau 110 78.2 0.0 11.8 2.7 0.0 7.3 0.0
15Intercar 2,148 60.8 4.6 26.4 0.1 2.1 4.8 1.2
17Chippewa 174 56.9 0.6 4.0 17.2 1.1 20.1 0.0
19Mid-Mich 636 87.4 0.6 8.8 0.0 0.0 2.5 0.6
21Delta 277 77.3 1.8 4.7 2.5 1.1 12.6 0.0
22Iron 183 93.4 0.0 2.2 0.0 0.0 3.3 1.1
25Genesee 2,429 48.3 38.8 5.8 0.0 0.4 6.5 0.2
30HDI 573 39.1 42.1 14.8 0.2 0.0 3.8 0.0
32Huron 122 93.4 0.0 5.7 0.0 0.0 0.0 0.8
33Ingham 1,738 42.2 29.1 15.4 0.2 4.8 8.2 0.2
35Keweenaw 28 * * * * * * *
(1) Reporting period is January 1 through December 31(2) Excludes data with errors* National includes previous year’s data for all participating States and ITOs.* Percentages are not calculated if <100 records are available for analysis after exclusions.
2021 Pregnancy Nutrition Surveillance
Comparison of Racial and Ethnic Distribution by Local Agency
Table 3F (1)
Michigan
Run Date: 5/27/2022WIC PNSS & PedNSS
Page : 1

Comparison of Racial and Ethnic Distribution (2)
Local AgencyNumber
Included in Analysis
White, Not Hispanic
%
Black, Not Hispanic
%
Hispanic
%
American Indian/Alaska
Native%
Asian/Pacific Islander
%
Multiple Races
%
All Other/Unknown
%
37Ionia 275 86.9 0.0 9.1 0.0 0.0 4.0 0.0
38Jackson 946 71.5 14.9 6.7 0.1 1.0 5.9 0.0
39Kalamazo 1,207 45.4 36.5 9.4 0.2 0.7 7.2 0.5
41Kent 3,098 29.8 29.2 31.1 0.2 4.9 4.6 0.2
43DHD#10 1,509 80.5 1.1 12.5 0.3 0.3 4.9 0.3
44Lapeer 248 88.7 1.2 5.2 0.0 0.8 4.0 0.0
45Tuscola 247 93.1 0.0 4.5 0.0 0.0 2.4 0.0
46CAA 383 69.7 3.7 19.1 0.3 0.3 6.0 1.0
47Livingst 328 89.6 1.5 4.3 0.0 0.6 2.7 1.2
50Macomb 2,593 47.2 37.2 3.0 0.2 8.6 3.7 0.2
51DCS 517 66.2 15.3 12.4 0.2 1.9 4.1 0.0
52Marquett 224 87.5 2.2 3.1 1.8 0.0 4.9 0.4
56MMCAA 322 86.6 1.9 6.2 0.0 2.2 3.1 0.0
58Monroe 611 80.7 6.9 7.0 0.0 0.2 5.1 0.2
61Muskegon 1,140 58.7 23.5 9.9 0.3 0.4 7.0 0.3
63Oakland 2,957 45.8 35.2 12.6 0.1 2.4 3.8 0.2
73Saginaw 734 45.5 33.0 15.1 0.0 0.1 5.4 0.8
74St Clair 590 80.3 5.6 7.5 0.0 0.5 5.8 0.3
76Sanilac 172 94.2 0.6 2.3 0.0 0.6 1.2 1.2
78Shiawass 327 87.2 0.6 6.1 0.0 0.3 5.5 0.3
81Washtena 1,069 37.0 41.1 10.0 0.1 3.0 8.4 0.4
82Wayne 4,497 58.9 26.5 5.8 0.2 5.6 2.8 0.2
89Urban L 3,810 18.2 72.4 5.9 0.1 1.0 2.3 0.1
(1) Reporting period is January 1 through December 31(2) Excludes data with errors* National includes previous year’s data for all participating States and ITOs.* Percentages are not calculated if <100 records are available for analysis after exclusions.
2021 Pregnancy Nutrition Surveillance
Comparison of Racial and Ethnic Distribution by Local Agency
Table 3F (1)
Michigan
Run Date: 5/27/2022WIC PNSS & PedNSS
Page : 2

National (Prior Year) 93,573 48.3 24.7 18.9 1.6 2.6 3.7 0.2
Comparison of Racial and Ethnic Distribution (2)
Local AgencyNumber
Included in Analysis
White, Not Hispanic
%
Black, Not Hispanic
%
Hispanic
%
American Indian/Alaska
Native%
Asian/Pacific Islander
%
Multiple Races
%
All Other/Unknown
%
90Detroit 4,853 9.4 71.4 16.2 0.1 1.2 1.6 0.2
Michigan 47,523 51.1 30.3 11.2 0.3 2.4 4.4 0.3
(1) Reporting period is January 1 through December 31(2) Excludes data with errors* National includes previous year’s data for all participating States and ITOs.* Percentages are not calculated if <100 records are available for analysis after exclusions.
2021 Pregnancy Nutrition Surveillance
Comparison of Racial and Ethnic Distribution by Local Agency
Table 3F (1)
Michigan
Run Date: 5/27/2022WIC PNSS & PedNSS
Page : 3

Comparison of Age Distribution (2)
Local Agency Number Included in
Analysis
< 15 Years
%
15 - 17 Years
%
18 - 19 Years
%
20 - 29 Years
%
30 - 39 Years
%
>= 40 Years
%
Unknown
%
01DHD#2 336 0.0 2.4 8.9 62.8 24.7 0.9 0.3
02LMAS 133 0.0 1.5 9.8 59.4 27.1 2.3 0.0
04DHD#4 343 0.3 2.0 7.3 58.6 30.0 1.7 0.0
05NWMCHA 423 0.0 2.1 8.3 60.5 27.0 2.1 0.0
06CMDHD 1,018 0.1 2.6 8.8 61.9 24.6 1.7 0.4
07West UP 271 0.0 1.5 7.0 54.2 35.8 1.5 0.0
08Barry 397 0.0 2.5 6.3 61.2 28.0 1.0 1.0
09Bay 506 0.0 2.4 6.1 61.9 28.5 1.2 0.0
10Gr Trav 387 0.0 1.3 6.2 61.5 29.5 1.6 0.0
11Berrien 765 0.4 3.1 8.9 61.4 23.9 1.4 0.8
12BHS 890 0.3 2.7 6.7 64.0 22.8 2.9 0.4
13Calhoun 932 0.0 2.4 8.0 63.6 23.9 1.4 0.6
14Leelanau 110 0.0 2.7 4.5 52.7 38.2 0.9 0.9
15Intercar 2,148 0.1 1.9 6.6 61.6 27.3 2.1 0.5
17Chippewa 174 0.0 2.3 7.5 62.1 27.0 1.1 0.0
19Mid-Mich 636 0.0 2.2 8.2 59.9 28.1 1.4 0.2
21Delta 277 0.4 0.7 7.2 64.3 26.4 1.1 0.0
22Iron 183 0.0 2.2 6.0 62.3 28.4 1.1 0.0
25Genesee 2,429 0.2 1.9 7.3 63.2 25.3 1.7 0.3
30HDI 573 0.0 1.4 9.6 63.7 23.7 1.0 0.5
32Huron 122 0.0 0.8 1.6 61.5 35.2 0.8 0.0
33Ingham 1,738 0.1 2.4 6.4 61.3 27.3 2.2 0.3
35Keweenaw 28 * * * * * * *
37Ionia 275 0.4 1.8 6.2 66.2 23.3 1.8 0.4
(1) Reporting period is January 1 through December 31(2) Excludes data with errors* National includes previous year’s data for all participating States and ITOs.* Percentages are not calculated if <100 records are available for analysis after exclusions.
2021 Pregnancy Nutrition Surveillance
Comparison of Age Distribution by Local Agency
Table 4F (1)
Michigan
Run Date: 5/27/2022WIC PNSS & PedNSS
Page : 4

Comparison of Age Distribution (2)
Local Agency Number Included in
Analysis
< 15 Years
%
15 - 17 Years
%
18 - 19 Years
%
20 - 29 Years
%
30 - 39 Years
%
>= 40 Years
%
Unknown
%
38Jackson 946 0.1 2.6 7.1 63.0 24.5 1.6 1.1
39Kalamazo 1,207 0.1 2.9 7.3 59.9 27.4 1.7 0.7
41Kent 3,098 0.1 2.5 6.5 58.6 28.9 2.7 0.7
43DHD#10 1,509 0.1 2.1 7.3 63.4 24.7 1.9 0.6
44Lapeer 248 0.0 2.4 4.8 62.1 27.8 2.4 0.4
45Tuscola 247 0.0 2.4 7.3 62.8 25.5 1.6 0.4
46CAA 383 0.0 0.5 7.8 65.8 24.5 0.8 0.5
47Livingst 328 0.0 1.5 5.8 55.8 33.8 2.4 0.6
50Macomb 2,593 0.0 0.9 4.7 57.0 34.8 2.5 0.0
51DCS 517 0.2 0.6 2.7 60.3 34.6 1.5 0.0
52Marquett 224 0.0 3.1 3.1 65.6 26.3 1.8 0.0
56MMCAA 322 0.0 1.6 7.8 64.9 24.2 1.6 0.0
58Monroe 611 0.0 1.6 6.2 65.8 24.9 1.3 0.2
61Muskegon 1,140 0.1 3.0 10.5 60.2 24.5 1.0 0.8
63Oakland 2,957 0.0 1.5 5.1 56.7 34.1 2.4 0.1
73Saginaw 734 0.0 2.9 7.6 63.8 24.0 1.2 0.5
74St Clair 590 0.0 1.7 8.0 63.4 23.7 2.2 1.0
76Sanilac 172 0.0 3.5 6.4 62.2 27.9 0.0 0.0
78Shiawass 327 0.0 3.4 6.4 65.4 24.2 0.6 0.0
81Washtena 1,069 0.1 1.1 6.2 57.1 32.7 2.3 0.5
82Wayne 4,497 0.0 1.2 4.4 56.7 34.2 3.2 0.2
89Urban L 3,810 0.0 1.8 5.9 57.3 31.9 2.7 0.4
90Detroit 4,853 0.1 2.7 6.7 56.9 30.8 2.4 0.4
(1) Reporting period is January 1 through December 31(2) Excludes data with errors* National includes previous year’s data for all participating States and ITOs.* Percentages are not calculated if <100 records are available for analysis after exclusions.
2021 Pregnancy Nutrition Surveillance
Comparison of Age Distribution by Local Agency
Table 4F (1)
Michigan
Run Date: 5/27/2022WIC PNSS & PedNSS
Page : 5

Michigan 47,523 0.1 2.0 6.5 59.8 29.1 2.2 0.4
National (Prior Year) 93,581 0.1 2.4 7.2 59.6 28.3 2.3 0.2
(1) Reporting period is January 1 through December 31(2) Excludes data with errors* National includes previous year’s data for all participating States and ITOs.* Percentages are not calculated if <100 records are available for analysis after exclusions.
2021 Pregnancy Nutrition Surveillance
Comparison of Age Distribution by Local Agency
Table 4F (1)
Michigan
Run Date: 5/27/2022WIC PNSS & PedNSS
Page : 6
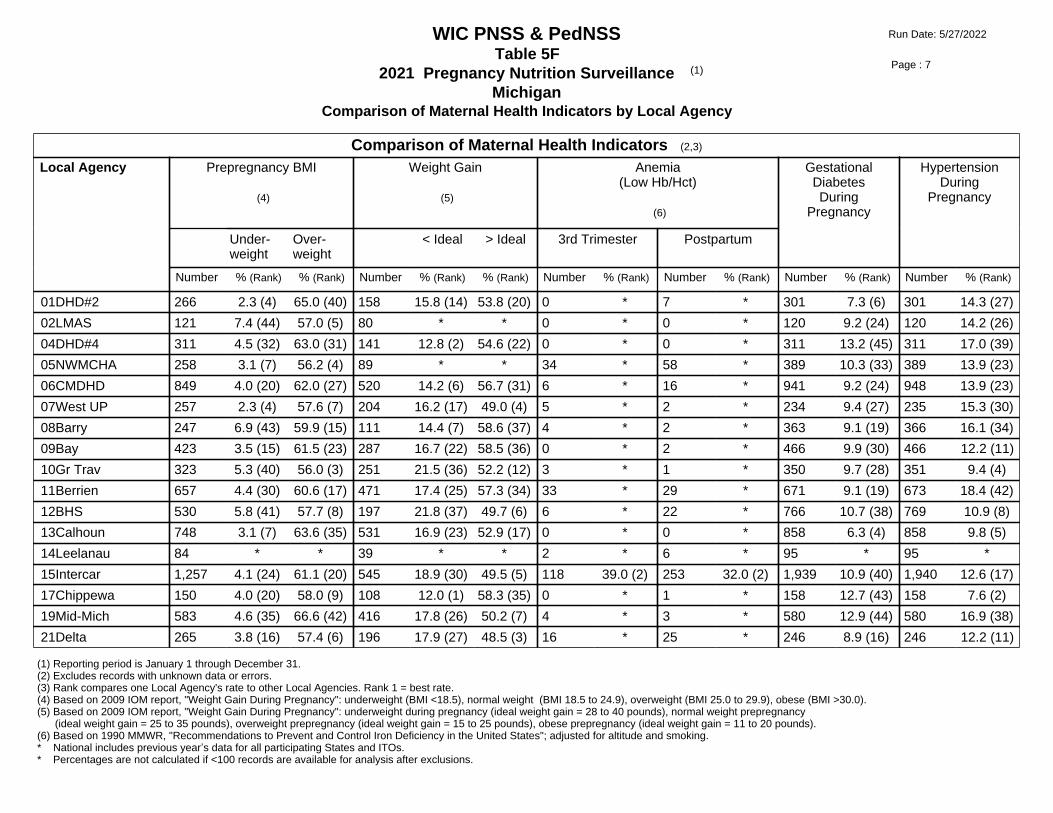
Comparison of Maternal Health Indicators (2,3)
Local Agency Prepregnancy BMI
(4)
Weight Gain
(5)
Anemia(Low Hb/Hct)
(6)
GestationalDiabetesDuring
Pregnancy
HypertensionDuring
Pregnancy
Under-weight
Over-weight
< Ideal > Ideal 3rd Trimester Postpartum
Number % (Rank) % (Rank) Number % (Rank) % (Rank) Number % (Rank) Number % (Rank) Number % (Rank) Number % (Rank)
01DHD#2 266 2.3 (4) 65.0 (40) 158 15.8 (14) 53.8 (20) 0 * 7 * 301 7.3 (6) 301 14.3 (27)
02LMAS 121 7.4 (44) 57.0 (5) 80 * * 0 * 0 * 120 9.2 (24) 120 14.2 (26)
04DHD#4 311 4.5 (32) 63.0 (31) 141 12.8 (2) 54.6 (22) 0 * 0 * 311 13.2 (45) 311 17.0 (39)
05NWMCHA 258 3.1 (7) 56.2 (4) 89 * * 34 * 58 * 389 10.3 (33) 389 13.9 (23)
06CMDHD 849 4.0 (20) 62.0 (27) 520 14.2 (6) 56.7 (31) 6 * 16 * 941 9.2 (24) 948 13.9 (23)
07West UP 257 2.3 (4) 57.6 (7) 204 16.2 (17) 49.0 (4) 5 * 2 * 234 9.4 (27) 235 15.3 (30)
08Barry 247 6.9 (43) 59.9 (15) 111 14.4 (7) 58.6 (37) 4 * 2 * 363 9.1 (19) 366 16.1 (34)
09Bay 423 3.5 (15) 61.5 (23) 287 16.7 (22) 58.5 (36) 0 * 2 * 466 9.9 (30) 466 12.2 (11)
10Gr Trav 323 5.3 (40) 56.0 (3) 251 21.5 (36) 52.2 (12) 3 * 1 * 350 9.7 (28) 351 9.4 (4)
11Berrien 657 4.4 (30) 60.6 (17) 471 17.4 (25) 57.3 (34) 33 * 29 * 671 9.1 (19) 673 18.4 (42)
12BHS 530 5.8 (41) 57.7 (8) 197 21.8 (37) 49.7 (6) 6 * 22 * 766 10.7 (38) 769 10.9 (8)
13Calhoun 748 3.1 (7) 63.6 (35) 531 16.9 (23) 52.9 (17) 0 * 0 * 858 6.3 (4) 858 9.8 (5)
14Leelanau 84 * * 39 * * 2 * 6 * 95 * 95 *
15Intercar 1,257 4.1 (24) 61.1 (20) 545 18.9 (30) 49.5 (5) 118 39.0 (2) 253 32.0 (2) 1,939 10.9 (40) 1,940 12.6 (17)
17Chippewa 150 4.0 (20) 58.0 (9) 108 12.0 (1) 58.3 (35) 0 * 1 * 158 12.7 (43) 158 7.6 (2)
19Mid-Mich 583 4.6 (35) 66.6 (42) 416 17.8 (26) 50.2 (7) 4 * 3 * 580 12.9 (44) 580 16.9 (38)
21Delta 265 3.8 (16) 57.4 (6) 196 17.9 (27) 48.5 (3) 16 * 25 * 246 8.9 (16) 246 12.2 (11)
(1) Reporting period is January 1 through December 31.(2) Excludes records with unknown data or errors.(3) Rank compares one Local Agency's rate to other Local Agencies. Rank 1 = best rate.(4) Based on 2009 IOM report, "Weight Gain During Pregnancy": underweight (BMI <18.5), normal weight (BMI 18.5 to 24.9), overweight (BMI 25.0 to 29.9), obese (BMI >30.0).(5) Based on 2009 IOM report, "Weight Gain During Pregnancy": underweight during pregnancy (ideal weight gain = 28 to 40 pounds), normal weight prepregnancy (ideal weight gain = 25 to 35 pounds), overweight prepregnancy (ideal weight gain = 15 to 25 pounds), obese prepregnancy (ideal weight gain = 11 to 20 pounds).(6) Based on 1990 MMWR, "Recommendations to Prevent and Control Iron Deficiency in the United States"; adjusted for altitude and smoking.* National includes previous year’s data for all participating States and ITOs.* Percentages are not calculated if <100 records are available for analysis after exclusions.
2021 Pregnancy Nutrition Surveillance
Comparison of Maternal Health Indicators by Local Agency
Table 5F (1)
Michigan
Run Date: 5/27/2022WIC PNSS & PedNSS
Page : 7

Comparison of Maternal Health Indicators (2,3)
Local Agency Prepregnancy BMI
(4)
Weight Gain
(5)
Anemia(Low Hb/Hct)
(6)
GestationalDiabetesDuring
Pregnancy
HypertensionDuring
Pregnancy
Under-weight
Over-weight
< Ideal > Ideal 3rd Trimester Postpartum
Number % (Rank) % (Rank) Number % (Rank) % (Rank) Number % (Rank) Number % (Rank) Number % (Rank) Number % (Rank)
22Iron 104 6.7 (42) 58.7 (12) 37 * * 0 * 1 * 167 6.0 (3) 167 16.2 (35)
25Genesee 1,667 5.0 (37) 59.0 (14) 805 19.6 (34) 51.2 (9) 37 * 47 * 2,178 9.1 (19) 2,182 17.4 (41)
30HDI 367 3.8 (16) 67.6 (43) 67 * * 0 * 0 * 540 8.7 (14) 540 14.8 (28)
32Huron 112 4.5 (32) 64.3 (38) 91 * * 4 * 11 * 116 10.3 (33) 116 17.2 (40)
33Ingham 1,471 3.3 (11) 62.3 (29) 1,141 18.3 (28) 55.7 (26) 10 * 2 * 1,634 9.1 (19) 1,634 12.4 (14)
35Keweenaw 21 * * 9 * * 0 * 0 * 27 * 27 *
37Ionia 167 4.2 (26) 68.9 (44) 124 18.5 (29) 56.5 (30) 17 * 16 * 248 10.5 (35) 251 21.5 (45)
38Jackson 611 3.4 (13) 58.6 (11) 406 13.3 (3) 55.4 (24) 15 * 32 * 863 8.5 (10) 864 12.5 (15)
39Kalamazo 904 2.9 (6) 64.5 (39) 439 15.7 (12) 55.6 (25) 0 * 4 * 1,076 8.8 (15) 1,078 13.3 (21)
41Kent 1,798 3.2 (9) 60.9 (19) 721 24.1 (38) 46.9 (2) 214 37.4 (1) 540 23.5 (1) 2,812 8.5 (10) 2,818 16.7 (37)
43DHD#10 1,198 4.3 (27) 61.5 (23) 719 20.6 (35) 50.9 (8) 12 * 6 * 1,369 11.0 (41) 1,370 15.8 (33)
44Lapeer 244 4.5 (32) 54.1 (1) 208 14.4 (7) 46.6 (1) 0 * 0 * 223 5.4 (1) 224 10.3 (6)
45Tuscola 188 4.8 (36) 62.8 (30) 140 15.7 (12) 52.1 (11) 6 * 4 * 236 11.4 (42) 236 13.6 (22)
46CAA 330 2.1 (3) 61.2 (22) 237 14.8 (10) 52.3 (13) 0 * 0 * 327 10.1 (31) 328 14.0 (25)
47Livingst 311 5.1 (38) 55.9 (2) 201 19.4 (33) 55.2 (23) 1 * 0 * 292 8.6 (13) 293 20.5 (44)
50Macomb 2,282 3.2 (9) 63.1 (32) 1,704 17.0 (24) 53.3 (18) 0 * 0 * 2,380 10.5 (35) 2,381 10.8 (7)
51DCS 369 4.1 (24) 58.5 (10) 290 13.4 (4) 57.2 (33) 13 * 2 * 473 10.8 (39) 473 13.1 (20)
(1) Reporting period is January 1 through December 31.(2) Excludes records with unknown data or errors.(3) Rank compares one Local Agency's rate to other Local Agencies. Rank 1 = best rate.(4) Based on 2009 IOM report, "Weight Gain During Pregnancy": underweight (BMI <18.5), normal weight (BMI 18.5 to 24.9), overweight (BMI 25.0 to 29.9), obese (BMI >30.0).(5) Based on 2009 IOM report, "Weight Gain During Pregnancy": underweight during pregnancy (ideal weight gain = 28 to 40 pounds), normal weight prepregnancy (ideal weight gain = 25 to 35 pounds), overweight prepregnancy (ideal weight gain = 15 to 25 pounds), obese prepregnancy (ideal weight gain = 11 to 20 pounds).(6) Based on 1990 MMWR, "Recommendations to Prevent and Control Iron Deficiency in the United States"; adjusted for altitude and smoking.* National includes previous year’s data for all participating States and ITOs.* Percentages are not calculated if <100 records are available for analysis after exclusions.
2021 Pregnancy Nutrition Surveillance
Comparison of Maternal Health Indicators by Local Agency
Table 5F (1)
Michigan
Run Date: 5/27/2022WIC PNSS & PedNSS
Page : 8

Comparison of Maternal Health Indicators (2,3)
Local Agency Prepregnancy BMI
(4)
Weight Gain
(5)
Anemia(Low Hb/Hct)
(6)
GestationalDiabetesDuring
Pregnancy
HypertensionDuring
Pregnancy
Under-weight
Over-weight
< Ideal > Ideal 3rd Trimester Postpartum
Number % (Rank) % (Rank) Number % (Rank) % (Rank) Number % (Rank) Number % (Rank) Number % (Rank) Number % (Rank)
52Marquett 196 1.5 (1) 62.2 (28) 138 15.2 (11) 62.3 (38) 2 * 1 * 203 8.4 (9) 205 11.7 (10)
56MMCAA 214 1.9 (2) 64.0 (36) 89 * * 5 * 3 * 305 9.2 (24) 304 12.5 (15)
58Monroe 571 4.0 (20) 65.1 (41) 454 15.9 (15) 55.9 (28) 0 * 0 * 551 9.1 (19) 551 18.5 (43)
61Muskegon 1,057 3.3 (11) 61.5 (23) 861 19.3 (32) 52.5 (14) 0 * 1 * 1,041 10.2 (32) 1,048 16.2 (35)
63Oakland 2,293 4.4 (30) 61.1 (20) 1,261 16.2 (17) 52.7 (15) 3 * 0 * 2,649 7.6 (7) 2,649 12.2 (11)
73Saginaw 532 3.4 (13) 61.5 (23) 317 14.5 (9) 52.7 (15) 0 * 0 * 686 9.8 (29) 685 11.4 (9)
74St Clair 564 4.3 (27) 64.2 (37) 434 13.4 (4) 56.9 (32) 4 * 12 * 520 8.5 (10) 521 15.5 (31)
76Sanilac 32 * * 11 * * 1 * 2 * 154 7.1 (5) 154 13.0 (19)
78Shiawass 295 5.1 (38) 60.3 (16) 246 19.1 (31) 53.7 (19) 1 * 1 * 298 5.4 (1) 298 6.7 (1)
81Washtena 868 4.3 (27) 60.8 (18) 559 16.1 (16) 51.3 (10) 34 * 51 * 954 10.6 (37) 954 15.5 (31)
82Wayne 2,901 4.0 (20) 58.8 (13) 1,798 16.6 (21) 54.3 (21) 0 * 4 * 4,039 8.9 (16) 4,040 8.5 (3)
89Urban L 2,846 3.9 (18) 63.1 (32) 1,641 16.3 (19) 55.8 (27) 0 * 0 * 3,489 9.0 (18) 3,494 15.1 (29)
90Detroit 3,506 3.9 (18) 63.1 (32) 2,062 16.5 (20) 56.3 (29) 1 * 1 * 4,513 8.3 (8) 4,515 12.8 (18)
Michigan 35,370 3.9 61.5 21,570 17.1 53.8 613 31.8 1,172 24.7 43,174 9.2 43,229 13.4
National (Prior Year) 72,360 4.1 60.8 50,124 20.8 48.4 13,438 19.6 4,714 20.0 51,634 10.7 51,095 13.3
(1) Reporting period is January 1 through December 31.(2) Excludes records with unknown data or errors.(3) Rank compares one Local Agency's rate to other Local Agencies. Rank 1 = best rate.(4) Based on 2009 IOM report, "Weight Gain During Pregnancy": underweight (BMI <18.5), normal weight (BMI 18.5 to 24.9), overweight (BMI 25.0 to 29.9), obese (BMI >30.0).(5) Based on 2009 IOM report, "Weight Gain During Pregnancy": underweight during pregnancy (ideal weight gain = 28 to 40 pounds), normal weight prepregnancy (ideal weight gain = 25 to 35 pounds), overweight prepregnancy (ideal weight gain = 15 to 25 pounds), obese prepregnancy (ideal weight gain = 11 to 20 pounds).(6) Based on 1990 MMWR, "Recommendations to Prevent and Control Iron Deficiency in the United States"; adjusted for altitude and smoking.* National includes previous year’s data for all participating States and ITOs.* Percentages are not calculated if <100 records are available for analysis after exclusions.
2021 Pregnancy Nutrition Surveillance
Comparison of Maternal Health Indicators by Local Agency
Table 5F (1)
Michigan
Run Date: 5/27/2022WIC PNSS & PedNSS
Page : 9
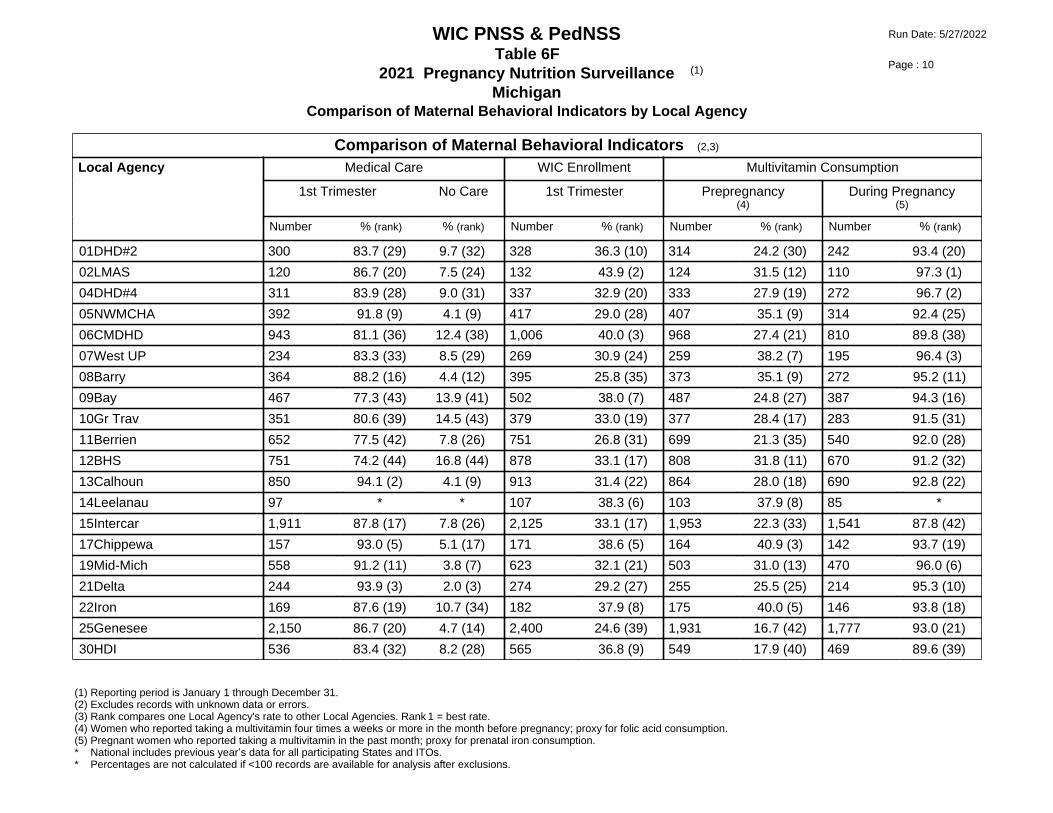
Comparison of Maternal Behavioral Indicators (2,3)
Local Agency Medical Care WIC Enrollment Multivitamin Consumption
1st Trimester No Care 1st Trimester Prepregnancy(4)
During Pregnancy(5)
Number % (rank) % (rank) Number % (rank) Number % (rank) Number % (rank)
01DHD#2 300 83.7 (29) 9.7 (32) 328 36.3 (10) 314 24.2 (30) 242 93.4 (20)
02LMAS 120 86.7 (20) 7.5 (24) 132 43.9 (2) 124 31.5 (12) 110 97.3 (1)
04DHD#4 311 83.9 (28) 9.0 (31) 337 32.9 (20) 333 27.9 (19) 272 96.7 (2)
05NWMCHA 392 91.8 (9) 4.1 (9) 417 29.0 (28) 407 35.1 (9) 314 92.4 (25)
06CMDHD 943 81.1 (36) 12.4 (38) 1,006 40.0 (3) 968 27.4 (21) 810 89.8 (38)
07West UP 234 83.3 (33) 8.5 (29) 269 30.9 (24) 259 38.2 (7) 195 96.4 (3)
08Barry 364 88.2 (16) 4.4 (12) 395 25.8 (35) 373 35.1 (9) 272 95.2 (11)
09Bay 467 77.3 (43) 13.9 (41) 502 38.0 (7) 487 24.8 (27) 387 94.3 (16)
10Gr Trav 351 80.6 (39) 14.5 (43) 379 33.0 (19) 377 28.4 (17) 283 91.5 (31)
11Berrien 652 77.5 (42) 7.8 (26) 751 26.8 (31) 699 21.3 (35) 540 92.0 (28)
12BHS 751 74.2 (44) 16.8 (44) 878 33.1 (17) 808 31.8 (11) 670 91.2 (32)
13Calhoun 850 94.1 (2) 4.1 (9) 913 31.4 (22) 864 28.0 (18) 690 92.8 (22)
14Leelanau 97 * * 107 38.3 (6) 103 37.9 (8) 85 *
15Intercar 1,911 87.8 (17) 7.8 (26) 2,125 33.1 (17) 1,953 22.3 (33) 1,541 87.8 (42)
17Chippewa 157 93.0 (5) 5.1 (17) 171 38.6 (5) 164 40.9 (3) 142 93.7 (19)
19Mid-Mich 558 91.2 (11) 3.8 (7) 623 32.1 (21) 503 31.0 (13) 470 96.0 (6)
21Delta 244 93.9 (3) 2.0 (3) 274 29.2 (27) 255 25.5 (25) 214 95.3 (10)
22Iron 169 87.6 (19) 10.7 (34) 182 37.9 (8) 175 40.0 (5) 146 93.8 (18)
25Genesee 2,150 86.7 (20) 4.7 (14) 2,400 24.6 (39) 1,931 16.7 (42) 1,777 93.0 (21)
30HDI 536 83.4 (32) 8.2 (28) 565 36.8 (9) 549 17.9 (40) 469 89.6 (39)
(1) Reporting period is January 1 through December 31.(2) Excludes records with unknown data or errors.(3) Rank compares one Local Agency's rate to other Local Agencies. Rank 1 = best rate.(4) Women who reported taking a multivitamin four times a weeks or more in the month before pregnancy; proxy for folic acid consumption.(5) Pregnant women who reported taking a multivitamin in the past month; proxy for prenatal iron consumption.* National includes previous year’s data for all participating States and ITOs.* Percentages are not calculated if <100 records are available for analysis after exclusions.
2021 Pregnancy Nutrition Surveillance
Comparison of Maternal Behavioral Indicators by Local Agency
Table 6F (1)
Michigan
Run Date: 5/27/2022WIC PNSS & PedNSS
Page : 10

Comparison of Maternal Behavioral Indicators (2,3)
Local Agency Medical Care WIC Enrollment Multivitamin Consumption
1st Trimester No Care 1st Trimester Prepregnancy(4)
During Pregnancy(5)
Number % (rank) % (rank) Number % (rank) Number % (rank) Number % (rank)
32Huron 116 81.0 (37) 10.3 (33) 121 23.1 (42) 115 43.5 (2) 81 *
33Ingham 1,525 88.7 (15) 5.4 (18) 1,723 28.0 (29) 1,559 10.2 (45) 1,256 90.2 (36)
35Keweenaw 27 * * 27 * 26 * 23 *
37Ionia 250 92.0 (7) 2.8 (5) 271 26.2 (33) 261 18.8 (39) 193 96.4 (3)
38Jackson 857 82.3 (34) 12.5 (39) 937 39.6 (4) 908 24.0 (31) 734 90.6 (35)
39Kalamazo 1,064 86.7 (20) 7.2 (23) 1,187 33.2 (16) 1,128 19.5 (38) 891 90.2 (36)
41Kent 2,735 84.6 (25) 5.7 (20) 3,066 21.6 (44) 2,530 20.6 (37) 2,215 92.8 (22)
43DHD#10 1,349 79.0 (41) 14.2 (42) 1,484 36.3 (10) 1,405 26.0 (23) 1,154 88.8 (41)
44Lapeer 224 83.5 (31) 13.4 (40) 248 33.5 (15) 235 29.8 (14) 179 95.0 (13)
45Tuscola 235 80.0 (40) 11.9 (36) 246 29.7 (26) 234 27.8 (20) 174 92.5 (24)
46CAA 323 92.0 (7) 0.9 (1) 377 27.3 (30) 367 24.3 (29) 283 92.2 (26)
47Livingst 292 80.8 (38) 12.0 (37) 323 30.7 (25) 307 39.4 (6) 238 95.4 (9)
50Macomb 2,374 91.7 (10) 4.1 (9) 2,552 25.9 (34) 2,043 10.4 (44) 1,860 95.1 (12)
51DCS 465 87.7 (18) 6.5 (22) 516 26.7 (32) 247 40.1 (4) 376 95.7 (8)
52Marquett 202 82.2 (35) 11.4 (35) 218 36.2 (12) 173 22.0 (34) 185 94.6 (15)
56MMCAA 303 86.5 (23) 8.6 (30) 318 24.2 (40) 305 23.9 (32) 218 96.3 (5)
58Monroe 550 90.4 (13) 3.1 (6) 605 25.6 (36) 586 29.0 (15) 427 94.1 (17)
61Muskegon 1,024 84.5 (26) 7.6 (25) 1,115 34.5 (13) 924 25.9 (24) 848 91.7 (30)
63Oakland 2,621 90.8 (12) 4.4 (12) 2,925 25.6 (36) 2,404 21.0 (36) 2,125 92.2 (26)
73Saginaw 675 85.8 (24) 5.6 (19) 729 31.3 (23) 692 28.9 (16) 553 91.9 (29)
74St Clair 519 71.7 (45) 20.6 (45) 583 44.8 (1) 562 26.2 (22) 481 87.3 (43)
(1) Reporting period is January 1 through December 31.(2) Excludes records with unknown data or errors.(3) Rank compares one Local Agency's rate to other Local Agencies. Rank 1 = best rate.(4) Women who reported taking a multivitamin four times a weeks or more in the month before pregnancy; proxy for folic acid consumption.(5) Pregnant women who reported taking a multivitamin in the past month; proxy for prenatal iron consumption.* National includes previous year’s data for all participating States and ITOs.* Percentages are not calculated if <100 records are available for analysis after exclusions.
2021 Pregnancy Nutrition Surveillance
Comparison of Maternal Behavioral Indicators by Local Agency
Table 6F (1)
Michigan
Run Date: 5/27/2022WIC PNSS & PedNSS
Page : 11

National (Prior Year) 73,395 71.3 6.9 78,665 20.5 57,185 22.8 57,616 89.2
Comparison of Maternal Behavioral Indicators (2,3)
Local Agency Medical Care WIC Enrollment Multivitamin Consumption
1st Trimester No Care 1st Trimester Prepregnancy(4)
During Pregnancy(5)
Number % (rank) % (rank) Number % (rank) Number % (rank) Number % (rank)
76Sanilac 154 95.5 (1) 1.3 (2) 168 25.0 (38) 160 47.5 (1) 125 96.0 (6)
78Shiawass 300 93.0 (5) 4.7 (14) 322 22.4 (43) 73 * 212 87.3 (43)
81Washtena 941 89.5 (14) 6.4 (21) 1,051 34.3 (14) 1,020 15.1 (43) 807 95.0 (13)
82Wayne 3,999 93.4 (4) 2.1 (4) 4,435 24.1 (41) 3,163 25.3 (26) 3,259 90.8 (34)
89Urban L 3,428 84.5 (26) 3.8 (7) 3,731 21.0 (45) 3,032 24.7 (28) 2,535 89.6 (39)
90Detroit 4,486 83.7 (29) 4.9 (16) 4,793 21.0 (45) 3,753 16.8 (41) 3,220 91.2 (32)
Michigan 42,619 86.5 6.3 46,872 27.8 39,891 22.7 34,303 91.8
(1) Reporting period is January 1 through December 31.(2) Excludes records with unknown data or errors.(3) Rank compares one Local Agency's rate to other Local Agencies. Rank 1 = best rate.(4) Women who reported taking a multivitamin four times a weeks or more in the month before pregnancy; proxy for folic acid consumption.(5) Pregnant women who reported taking a multivitamin in the past month; proxy for prenatal iron consumption.* National includes previous year’s data for all participating States and ITOs.* Percentages are not calculated if <100 records are available for analysis after exclusions.
2021 Pregnancy Nutrition Surveillance
Comparison of Maternal Behavioral Indicators by Local Agency
Table 6F (1)
Michigan
Run Date: 5/27/2022WIC PNSS & PedNSS
Page : 12

Comparison of Smoking Indicators (2,3)
Local Agency
Smoking
Quit SmokingBy First Prenatal
Visit and Stayed OffCigarettes (4)
Smoking in Household
3 MonthsPrior to Pregnancy
Last 3 Monthsof Pregnancy
Prenatal Postpartum
Number % (rank) Number % (rank) Number % (rank) Number % (rank) Number % (rank)
01DHD#2 313 35.8 (40) 302 23.8 (43) 72 * 242 12.8 (42) 302 4.3 (41)
02LMAS 127 41.7 (45) 120 25.8 (44) 38 * 109 10.1 (35) 118 4.2 (40)
04DHD#4 334 36.8 (42) 310 21.3 (38) 90 * 272 9.6 (33) 311 1.9 (23)
05NWMCHA 409 31.1 (30) 389 19.0 (33) 82 * 314 10.5 (36) 388 3.1 (36)
06CMDHD 985 30.3 (29) 948 20.7 (36) 221 24.9 (24) 809 11.5 (40) 945 3.1 (36)
07West UP 260 33.8 (33) 234 21.4 (39) 53 * 195 11.3 (39) 236 3.4 (38)
08Barry 376 36.4 (41) 367 16.1 (26) 94 * 272 5.1 (14) 368 3.0 (34)
09Bay 487 34.7 (35) 467 19.3 (35) 123 35.8 (19) 387 9.0 (31) 470 2.8 (33)
10Gr Trav 377 34.0 (34) 351 13.1 (21) 95 * 283 4.2 (12) 351 1.7 (20)
11Berrien 701 25.7 (18) 671 11.8 (15) 115 47.0 (9) 540 9.6 (33) 672 3.4 (38)
12BHS 835 26.2 (20) 769 16.1 (26) 146 30.8 (21) 668 9.1 (32) 768 2.2 (26)
13Calhoun 873 23.6 (16) 850 11.3 (13) 156 36.5 (18) 687 2.8 (3) 854 0.8 (2)
14Leelanau 106 34.9 (36) 95 * 27 * 85 * 95 *
15Intercar 2,016 19.7 (11) 1,940 9.4 (10) 294 37.1 (17) 1,538 3.3 (8) 1,938 1.4 (16)
17Chippewa 165 25.5 (17) 158 20.9 (37) 36 * 141 7.8 (23) 158 2.5 (29)
19Mid-Mich 606 35.1 (38) 581 19.1 (34) 155 35.5 (20) 470 8.7 (28) 581 1.4 (16)
21Delta 262 35.1 (38) 245 23.7 (42) 68 * 214 11.2 (38) 246 1.6 (19)
22Iron 175 34.9 (36) 167 21.6 (40) 51 * 146 6.2 (17) 166 1.2 (12)
(1) Reporting period is January 1 through December 31.(2) Excludes records with unknown data or errors.(3) Rank compares one Local Agency's rate to other Local Agencies. Rank 1 = best rate.(4) Among women who smoked 3 months prior to pregnancy.* National includes previous year’s data for all participating States and ITOs.* Percentages are not calculated if <100 records are available for analysis after exclusions.
2021 Pregnancy Nutrition Surveillance
Comparison of Smoking Indicators by Local Agency
Table 7F (1)
Michigan
Run Date: 5/27/2022WIC PNSS & PedNSS
Page : 13
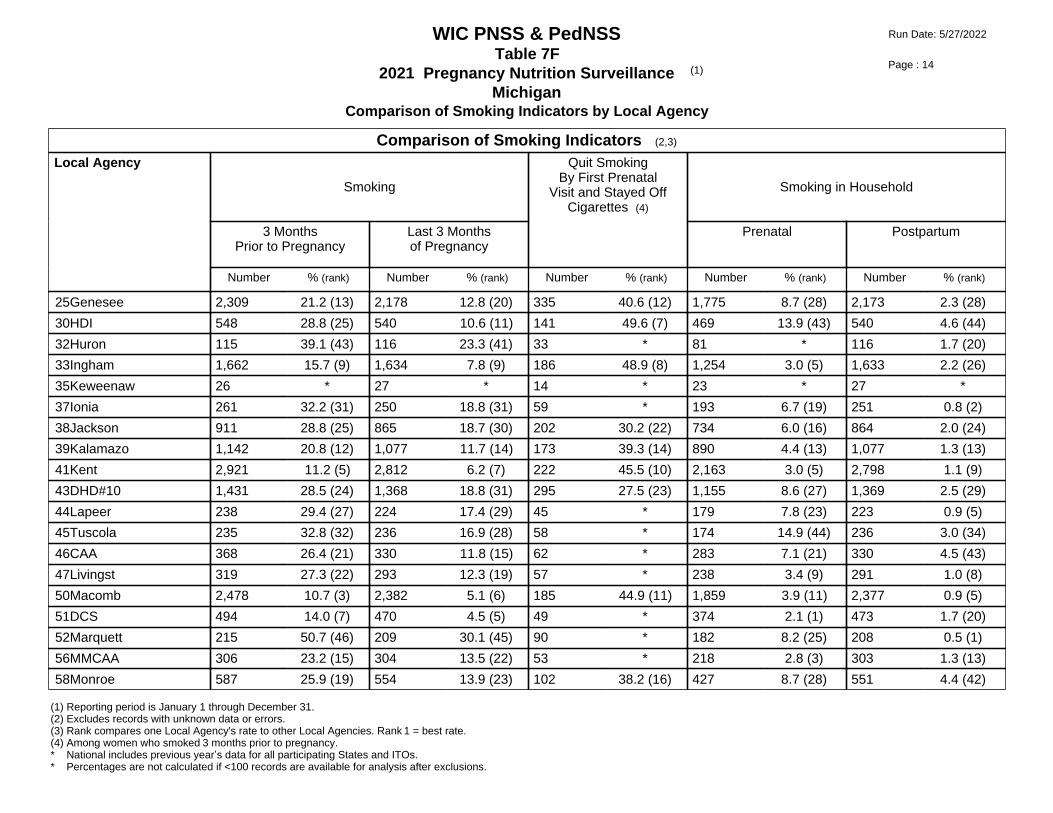
Comparison of Smoking Indicators (2,3)
Local Agency
Smoking
Quit SmokingBy First Prenatal
Visit and Stayed OffCigarettes (4)
Smoking in Household
3 MonthsPrior to Pregnancy
Last 3 Monthsof Pregnancy
Prenatal Postpartum
Number % (rank) Number % (rank) Number % (rank) Number % (rank) Number % (rank)
25Genesee 2,309 21.2 (13) 2,178 12.8 (20) 335 40.6 (12) 1,775 8.7 (28) 2,173 2.3 (28)
30HDI 548 28.8 (25) 540 10.6 (11) 141 49.6 (7) 469 13.9 (43) 540 4.6 (44)
32Huron 115 39.1 (43) 116 23.3 (41) 33 * 81 * 116 1.7 (20)
33Ingham 1,662 15.7 (9) 1,634 7.8 (9) 186 48.9 (8) 1,254 3.0 (5) 1,633 2.2 (26)
35Keweenaw 26 * 27 * 14 * 23 * 27 *
37Ionia 261 32.2 (31) 250 18.8 (31) 59 * 193 6.7 (19) 251 0.8 (2)
38Jackson 911 28.8 (25) 865 18.7 (30) 202 30.2 (22) 734 6.0 (16) 864 2.0 (24)
39Kalamazo 1,142 20.8 (12) 1,077 11.7 (14) 173 39.3 (14) 890 4.4 (13) 1,077 1.3 (13)
41Kent 2,921 11.2 (5) 2,812 6.2 (7) 222 45.5 (10) 2,163 3.0 (5) 2,798 1.1 (9)
43DHD#10 1,431 28.5 (24) 1,368 18.8 (31) 295 27.5 (23) 1,155 8.6 (27) 1,369 2.5 (29)
44Lapeer 238 29.4 (27) 224 17.4 (29) 45 * 179 7.8 (23) 223 0.9 (5)
45Tuscola 235 32.8 (32) 236 16.9 (28) 58 * 174 14.9 (44) 236 3.0 (34)
46CAA 368 26.4 (21) 330 11.8 (15) 62 * 283 7.1 (21) 330 4.5 (43)
47Livingst 319 27.3 (22) 293 12.3 (19) 57 * 238 3.4 (9) 291 1.0 (8)
50Macomb 2,478 10.7 (3) 2,382 5.1 (6) 185 44.9 (11) 1,859 3.9 (11) 2,377 0.9 (5)
51DCS 494 14.0 (7) 470 4.5 (5) 49 * 374 2.1 (1) 473 1.7 (20)
52Marquett 215 50.7 (46) 209 30.1 (45) 90 * 182 8.2 (25) 208 0.5 (1)
56MMCAA 306 23.2 (15) 304 13.5 (22) 53 * 218 2.8 (3) 303 1.3 (13)
58Monroe 587 25.9 (19) 554 13.9 (23) 102 38.2 (16) 427 8.7 (28) 551 4.4 (42)
(1) Reporting period is January 1 through December 31.(2) Excludes records with unknown data or errors.(3) Rank compares one Local Agency's rate to other Local Agencies. Rank 1 = best rate.(4) Among women who smoked 3 months prior to pregnancy.* National includes previous year’s data for all participating States and ITOs.* Percentages are not calculated if <100 records are available for analysis after exclusions.
2021 Pregnancy Nutrition Surveillance
Comparison of Smoking Indicators by Local Agency
Table 7F (1)
Michigan
Run Date: 5/27/2022WIC PNSS & PedNSS
Page : 14

National (Prior Year) 79,201 24.6 81,871 11.3 14,082 35.8 66,264 8.1 79,517 3.3
Comparison of Smoking Indicators (2,3)
Local Agency
Smoking
Quit SmokingBy First Prenatal
Visit and Stayed OffCigarettes (4)
Smoking in Household
3 MonthsPrior to Pregnancy
Last 3 Monthsof Pregnancy
Prenatal Postpartum
Number % (rank) Number % (rank) Number % (rank) Number % (rank) Number % (rank)
61Muskegon 1,064 28.1 (23) 1,052 15.6 (25) 224 38.4 (15) 850 6.5 (18) 1,045 1.1 (9)
63Oakland 2,841 8.9 (1) 2,645 4.0 (2) 186 40.3 (13) 2,124 2.4 (2) 2,643 0.8 (2)
73Saginaw 695 29.8 (28) 686 12.2 (18) 157 53.5 (5) 552 10.9 (37) 687 2.5 (29)
74St Clair 567 40.6 (44) 521 15.5 (24) 167 50.3 (6) 481 12.3 (41) 521 4.6 (44)
76Sanilac 162 14.8 (8) 153 11.8 (15) 15 * 125 5.6 (15) 153 1.3 (13)
78Shiawass 316 22.2 (14) 300 11.0 (12) 51 * 207 7.7 (22) 295 1.4 (16)
81Washtena 1,028 17.1 (10) 953 7.0 (8) 119 58.8 (3) 807 3.0 (5) 950 0.9 (5)
82Wayne 4,289 10.8 (4) 4,039 4.4 (4) 302 55.0 (4) 3,261 3.7 (10) 4,043 1.1 (9)
89Urban L 3,591 12.6 (6) 3,503 4.1 (3) 298 62.1 (1) 2,526 8.2 (25) 3,499 2.7 (32)
90Detroit 4,512 10.3 (2) 4,535 3.4 (1) 312 61.9 (2) 3,215 7.0 (20) 4,523 2.1 (25)
Michigan 45,084 19.1 43,243 9.7 6,108 42.3 34,212 6.2 43,188 1.9
(1) Reporting period is January 1 through December 31.(2) Excludes records with unknown data or errors.(3) Rank compares one Local Agency's rate to other Local Agencies. Rank 1 = best rate.(4) Among women who smoked 3 months prior to pregnancy.* National includes previous year’s data for all participating States and ITOs.* Percentages are not calculated if <100 records are available for analysis after exclusions.
2021 Pregnancy Nutrition Surveillance
Comparison of Smoking Indicators by Local Agency
Table 7F (1)
Michigan
Run Date: 5/27/2022WIC PNSS & PedNSS
Page : 15
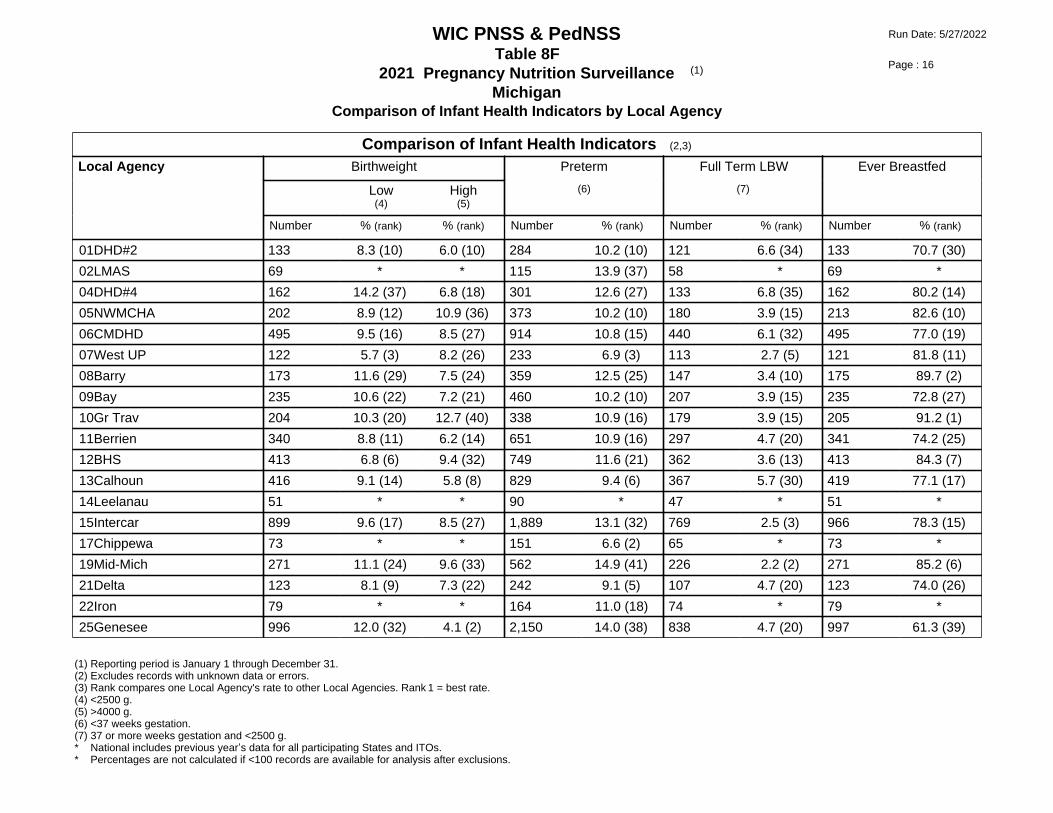
Comparison of Infant Health Indicators (2,3)
Local Agency Birthweight Preterm Full Term LBW Ever Breastfed
Low(4)
High(5)
(6) (7)
Number % (rank) % (rank) Number % (rank) Number % (rank) Number % (rank)
01DHD#2 133 8.3 (10) 6.0 (10) 284 10.2 (10) 121 6.6 (34) 133 70.7 (30)
02LMAS 69 * * 115 13.9 (37) 58 * 69 *
04DHD#4 162 14.2 (37) 6.8 (18) 301 12.6 (27) 133 6.8 (35) 162 80.2 (14)
05NWMCHA 202 8.9 (12) 10.9 (36) 373 10.2 (10) 180 3.9 (15) 213 82.6 (10)
06CMDHD 495 9.5 (16) 8.5 (27) 914 10.8 (15) 440 6.1 (32) 495 77.0 (19)
07West UP 122 5.7 (3) 8.2 (26) 233 6.9 (3) 113 2.7 (5) 121 81.8 (11)
08Barry 173 11.6 (29) 7.5 (24) 359 12.5 (25) 147 3.4 (10) 175 89.7 (2)
09Bay 235 10.6 (22) 7.2 (21) 460 10.2 (10) 207 3.9 (15) 235 72.8 (27)
10Gr Trav 204 10.3 (20) 12.7 (40) 338 10.9 (16) 179 3.9 (15) 205 91.2 (1)
11Berrien 340 8.8 (11) 6.2 (14) 651 10.9 (16) 297 4.7 (20) 341 74.2 (25)
12BHS 413 6.8 (6) 9.4 (32) 749 11.6 (21) 362 3.6 (13) 413 84.3 (7)
13Calhoun 416 9.1 (14) 5.8 (8) 829 9.4 (6) 367 5.7 (30) 419 77.1 (17)
14Leelanau 51 * * 90 * 47 * 51 *
15Intercar 899 9.6 (17) 8.5 (27) 1,889 13.1 (32) 769 2.5 (3) 966 78.3 (15)
17Chippewa 73 * * 151 6.6 (2) 65 * 73 *
19Mid-Mich 271 11.1 (24) 9.6 (33) 562 14.9 (41) 226 2.2 (2) 271 85.2 (6)
21Delta 123 8.1 (9) 7.3 (22) 242 9.1 (5) 107 4.7 (20) 123 74.0 (26)
22Iron 79 * * 164 11.0 (18) 74 * 79 *
25Genesee 996 12.0 (32) 4.1 (2) 2,150 14.0 (38) 838 4.7 (20) 997 61.3 (39)
(1) Reporting period is January 1 through December 31.(2) Excludes records with unknown data or errors.(3) Rank compares one Local Agency's rate to other Local Agencies. Rank 1 = best rate.(4) <2500 g.(5) >4000 g.(6) <37 weeks gestation.(7) 37 or more weeks gestation and <2500 g.* National includes previous year’s data for all participating States and ITOs.* Percentages are not calculated if <100 records are available for analysis after exclusions.
2021 Pregnancy Nutrition Surveillance
Comparison of Infant Health Indicators by Local Agency
Table 8F (1)
Michigan
Run Date: 5/27/2022WIC PNSS & PedNSS
Page : 16

Comparison of Infant Health Indicators (2,3)
Local Agency Birthweight Preterm Full Term LBW Ever Breastfed
Low(4)
High(5)
(6) (7)
Number % (rank) % (rank) Number % (rank) Number % (rank) Number % (rank)
30HDI 263 18.3 (40) 6.1 (12) 513 17.7 (45) 214 7.0 (36) 263 65.0 (36)
32Huron 68 * * 114 5.3 (1) 64 * 68 *
33Ingham 873 11.2 (25) 6.8 (18) 1,588 13.4 (34) 758 4.6 (19) 878 81.4 (12)
35Keweenaw 18 * * 24 * 14 * 19 *
37Ionia 131 6.9 (7) 12.2 (39) 248 11.7 (22) 114 3.5 (11) 131 86.3 (3)
38Jackson 456 11.6 (29) 6.1 (12) 836 11.8 (23) 399 5.8 (31) 458 77.1 (17)
39Kalamazo 510 11.6 (29) 7.1 (20) 1,039 12.5 (25) 441 5.0 (25) 512 74.8 (24)
41Kent 1,252 12.9 (36) 6.5 (16) 2,762 14.9 (41) 1,054 5.6 (28) 1,261 75.4 (23)
43DHD#10 694 11.5 (28) 9.2 (31) 1,312 13.0 (31) 598 4.7 (20) 696 83.5 (8)
44Lapeer 116 5.2 (2) 4.3 (4) 220 9.5 (7) 104 3.8 (14) 116 85.3 (5)
45Tuscola 123 6.5 (4) 10.6 (35) 230 14.3 (40) 105 2.9 (6) 123 81.3 (13)
46CAA 164 9.1 (14) 9.8 (34) 328 11.0 (18) 143 3.5 (11) 164 70.7 (30)
47Livingst 134 9.0 (13) 9.0 (30) 286 12.2 (24) 117 2.6 (4) 134 82.8 (9)
50Macomb 1,089 12.8 (35) 4.4 (5) 2,306 14.1 (39) 914 5.6 (28) 1,093 66.9 (33)
51DCS 220 10.9 (23) 4.5 (6) 466 13.7 (36) 186 3.2 (7) 222 71.6 (28)
52Marquett 107 7.5 (8) 12.1 (38) 200 8.5 (4) 96 * 108 76.9 (20)
56MMCAA 155 6.5 (4) 11.0 (37) 297 10.4 (13) 136 1.5 (1) 155 77.4 (16)
58Monroe 237 11.4 (26) 5.9 (9) 537 10.4 (13) 213 5.2 (27) 238 71.0 (29)
61Muskegon 569 10.0 (18) 7.7 (25) 1,006 12.6 (27) 498 4.8 (24) 573 68.9 (32)
(1) Reporting period is January 1 through December 31.(2) Excludes records with unknown data or errors.(3) Rank compares one Local Agency's rate to other Local Agencies. Rank 1 = best rate.(4) <2500 g.(5) >4000 g.(6) <37 weeks gestation.(7) 37 or more weeks gestation and <2500 g.* National includes previous year’s data for all participating States and ITOs.* Percentages are not calculated if <100 records are available for analysis after exclusions.
2021 Pregnancy Nutrition Surveillance
Comparison of Infant Health Indicators by Local Agency
Table 8F (1)
Michigan
Run Date: 5/27/2022WIC PNSS & PedNSS
Page : 17

National (Prior Year) 74,575 10.2 6.0 72,650 12.0 61,872 4.5 75,364 57.4
Comparison of Infant Health Indicators (2,3)
Local Agency Birthweight Preterm Full Term LBW Ever Breastfed
Low(4)
High(5)
(6) (7)
Number % (rank) % (rank) Number % (rank) Number % (rank) Number % (rank)
63Oakland 1,238 11.4 (26) 6.5 (16) 2,578 13.1 (32) 1,064 4.3 (18) 1,249 76.1 (21)
73Saginaw 374 12.6 (34) 5.6 (7) 672 12.6 (27) 328 6.4 (33) 375 75.5 (22)
74St Clair 260 10.4 (21) 7.3 (22) 499 12.8 (30) 217 3.2 (7) 260 66.5 (35)
76Sanilac 70 * * 150 10.0 (9) 65 * 72 *
78Shiawass 136 5.1 (1) 8.8 (29) 294 9.9 (8) 125 3.2 (7) 136 66.9 (33)
81Washtena 464 12.3 (33) 6.3 (15) 920 13.6 (35) 398 7.0 (36) 466 85.8 (4)
82Wayne 1,795 10.0 (18) 6.0 (10) 3,937 11.1 (20) 1,592 5.0 (25) 1,836 63.6 (37)
89Urban L 1,481 16.9 (39) 3.7 (1) 3,361 17.5 (44) 1,191 8.6 (39) 1,502 62.3 (38)
90Detroit 2,180 15.2 (38) 4.2 (3) 4,434 15.0 (43) 1,820 7.6 (38) 2,203 56.5 (40)
Michigan 20,634 11.6 6.4 42,035 13.2 17,699 5.3 20,853 71.6
(1) Reporting period is January 1 through December 31.(2) Excludes records with unknown data or errors.(3) Rank compares one Local Agency's rate to other Local Agencies. Rank 1 = best rate.(4) <2500 g.(5) >4000 g.(6) <37 weeks gestation.(7) 37 or more weeks gestation and <2500 g.* National includes previous year’s data for all participating States and ITOs.* Percentages are not calculated if <100 records are available for analysis after exclusions.
2021 Pregnancy Nutrition Surveillance
Comparison of Infant Health Indicators by Local Agency
Table 8F (1)
Michigan
Run Date: 5/27/2022WIC PNSS & PedNSS
Page : 18

Comparison of Racial and Ethnic Distribution (2)
Local AgencyNumber
Included in Analysis
White, Not Hispanic
%
Black, Not Hispanic
%
Hispanic
%
American Indian/Alaska
Native%
Asian/Pacific Islander
%
Multiple Races
%
All Other/Unknown
%
01DHD#2 1,069 91.0 0.7 3.2 0.3 0.1 4.7 0.1
02LMAS 439 74.5 0.2 1.4 4.8 0.0 19.1 0.0
04DHD#4 1,084 92.0 0.7 1.9 0.5 0.1 4.6 0.2
05NWMCHA 1,459 91.1 0.5 2.3 0.7 0.3 5.1 0.0
06CMDHD 3,107 88.7 1.4 3.7 1.3 0.5 4.3 0.2
07West UP 841 88.1 1.9 2.4 0.5 1.7 4.8 0.7
08Barry 1,344 88.4 2.4 6.8 0.1 1.0 0.9 0.4
09Bay 1,559 79.8 1.9 11.5 0.0 0.2 6.2 0.4
10Gr Trav 1,164 85.0 0.8 6.0 2.3 0.9 4.6 0.5
11Berrien 2,584 49.1 36.8 8.1 0.3 1.0 4.1 0.5
12BHS 2,937 81.3 0.6 12.7 0.0 0.2 4.3 0.9
13Calhoun 2,796 60.8 19.9 7.3 0.4 5.0 6.2 0.5
14Leelanau 353 79.0 0.6 10.2 4.2 0.0 5.4 0.6
15Intercar 6,885 61.1 4.2 27.4 0.2 1.7 4.5 1.0
17Chippewa 588 53.7 0.7 3.1 21.1 0.9 20.1 0.3
19Mid-Mich 2,048 87.8 0.5 8.7 0.0 0.0 2.4 0.4
21Delta 858 80.8 0.7 4.8 1.5 0.3 11.2 0.7
22Iron 569 91.7 0.2 2.1 0.2 0.0 4.0 1.8
25Genesee 7,771 47.4 39.5 5.6 0.1 0.2 6.9 0.3
30HDI 1,776 31.3 47.6 17.1 0.1 0.6 3.3 0.1
32Huron 418 92.6 0.2 5.3 0.0 0.2 1.2 0.5
33Ingham 5,297 41.6 28.6 15.7 0.2 5.2 8.4 0.3
35Keweenaw 108 14.8 0.0 5.6 64.8 0.0 13.9 0.9
(1) Reporting period is January 1 through December 31.(2) Excludes data with errors.* Percentages are not calculated if <100 records are available for analysis after exclusions.
Comparison of Racial and Ethnic Distribution by Local Agency
Table 3F
Michigan
Run Date: 5/27/2022WIC PNSS & PedNSS
2019 - 2021 Pregnancy Nutrition Surveillance (1)
Combined 3 Years
Page : 19

Comparison of Racial and Ethnic Distribution (2)
Local AgencyNumber
Included in Analysis
White, Not Hispanic
%
Black, Not Hispanic
%
Hispanic
%
American Indian/Alaska
Native%
Asian/Pacific Islander
%
Multiple Races
%
All Other/Unknown
%
37Ionia 938 87.2 0.1 8.8 0.0 0.1 3.6 0.1
38Jackson 2,931 71.4 14.3 5.8 0.2 0.5 7.5 0.2
39Kalamazo 3,980 46.0 34.9 9.9 0.2 1.0 7.6 0.4
41Kent 10,004 31.7 29.0 29.2 0.3 4.7 4.8 0.3
43DHD#10 4,682 81.2 1.6 11.6 0.4 0.4 4.6 0.3
44Lapeer 863 90.4 0.7 4.6 0.0 0.6 3.4 0.3
45Tuscola 826 93.1 0.1 4.7 0.0 0.1 1.9 0.0
46CAA 1,257 72.1 2.5 18.9 0.1 0.2 5.6 0.6
47Livingst 1,015 91.4 1.2 3.8 0.0 0.5 2.2 0.9
50Macomb 8,196 50.2 34.1 2.9 0.1 8.2 4.2 0.3
51DCS 1,626 68.5 12.7 11.9 0.2 2.0 4.7 0.0
52Marquett 726 87.9 1.2 2.9 1.4 0.4 6.1 0.1
56MMCAA 957 89.8 1.5 3.9 0.0 1.7 3.2 0.0
58Monroe 1,964 81.2 6.7 6.2 0.1 0.4 4.9 0.6
61Muskegon 3,707 54.2 27.8 9.3 0.3 0.5 7.5 0.3
63Oakland 9,164 46.6 34.1 12.4 0.1 2.3 4.3 0.2
73Saginaw 2,298 46.3 30.9 15.7 0.0 0.7 6.0 0.5
74St Clair 2,039 80.8 6.3 6.4 0.1 0.5 5.6 0.2
76Sanilac 589 93.4 0.2 4.4 0.2 0.3 1.0 0.5
78Shiawass 1,080 88.1 0.5 6.8 0.0 0.1 4.4 0.2
81Washtena 3,202 37.2 40.7 10.2 0.1 2.5 8.9 0.3
82Wayne 15,442 56.5 29.0 5.4 0.2 5.5 3.1 0.3
89Urban L 11,043 14.3 77.2 5.3 0.1 0.6 2.5 0.1
90Detroit 15,972 8.7 73.0 15.5 0.1 1.0 1.7 0.1
(1) Reporting period is January 1 through December 31.(2) Excludes data with errors.* Percentages are not calculated if <100 records are available for analysis after exclusions.
Comparison of Racial and Ethnic Distribution by Local Agency
Table 3F
Michigan
Run Date: 5/27/2022WIC PNSS & PedNSS
2019 - 2021 Pregnancy Nutrition Surveillance (1)
Combined 3 Years
Page : 20

Michigan 151,661 51.0 30.6 10.9 0.4 2.3 4.6 0.3
(1) Reporting period is January 1 through December 31.(2) Excludes data with errors.* Percentages are not calculated if <100 records are available for analysis after exclusions.
Comparison of Racial and Ethnic Distribution by Local Agency
Table 3F
Michigan
Run Date: 5/27/2022WIC PNSS & PedNSS
2019 - 2021 Pregnancy Nutrition Surveillance (1)
Combined 3 Years
Page : 21
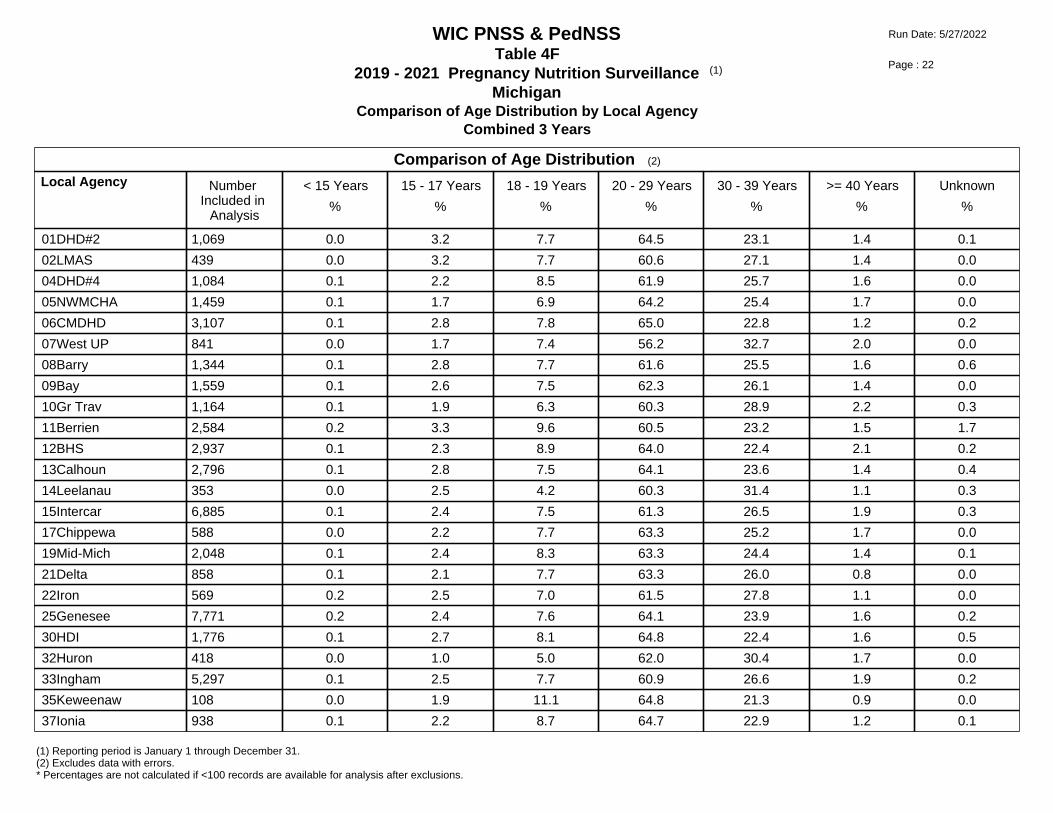
Comparison of Age Distribution (2)
Local Agency Number Included in
Analysis
< 15 Years
%
15 - 17 Years
%
18 - 19 Years
%
20 - 29 Years
%
30 - 39 Years
%
>= 40 Years
%
Unknown
%
01DHD#2 1,069 0.0 3.2 7.7 64.5 23.1 1.4 0.1
02LMAS 439 0.0 3.2 7.7 60.6 27.1 1.4 0.0
04DHD#4 1,084 0.1 2.2 8.5 61.9 25.7 1.6 0.0
05NWMCHA 1,459 0.1 1.7 6.9 64.2 25.4 1.7 0.0
06CMDHD 3,107 0.1 2.8 7.8 65.0 22.8 1.2 0.2
07West UP 841 0.0 1.7 7.4 56.2 32.7 2.0 0.0
08Barry 1,344 0.1 2.8 7.7 61.6 25.5 1.6 0.6
09Bay 1,559 0.1 2.6 7.5 62.3 26.1 1.4 0.0
10Gr Trav 1,164 0.1 1.9 6.3 60.3 28.9 2.2 0.3
11Berrien 2,584 0.2 3.3 9.6 60.5 23.2 1.5 1.7
12BHS 2,937 0.1 2.3 8.9 64.0 22.4 2.1 0.2
13Calhoun 2,796 0.1 2.8 7.5 64.1 23.6 1.4 0.4
14Leelanau 353 0.0 2.5 4.2 60.3 31.4 1.1 0.3
15Intercar 6,885 0.1 2.4 7.5 61.3 26.5 1.9 0.3
17Chippewa 588 0.0 2.2 7.7 63.3 25.2 1.7 0.0
19Mid-Mich 2,048 0.1 2.4 8.3 63.3 24.4 1.4 0.1
21Delta 858 0.1 2.1 7.7 63.3 26.0 0.8 0.0
22Iron 569 0.2 2.5 7.0 61.5 27.8 1.1 0.0
25Genesee 7,771 0.2 2.4 7.6 64.1 23.9 1.6 0.2
30HDI 1,776 0.1 2.7 8.1 64.8 22.4 1.6 0.5
32Huron 418 0.0 1.0 5.0 62.0 30.4 1.7 0.0
33Ingham 5,297 0.1 2.5 7.7 60.9 26.6 1.9 0.2
35Keweenaw 108 0.0 1.9 11.1 64.8 21.3 0.9 0.0
37Ionia 938 0.1 2.2 8.7 64.7 22.9 1.2 0.1
(1) Reporting period is January 1 through December 31.(2) Excludes data with errors.* Percentages are not calculated if <100 records are available for analysis after exclusions.
Comparison of Age Distribution by Local Agency
Table 4F
Michigan
Run Date: 5/27/2022WIC PNSS & PedNSS
2019 - 2021 Pregnancy Nutrition Surveillance (1)
Combined 3 Years
Page : 22

Comparison of Age Distribution (2)
Local Agency Number Included in
Analysis
< 15 Years
%
15 - 17 Years
%
18 - 19 Years
%
20 - 29 Years
%
30 - 39 Years
%
>= 40 Years
%
Unknown
%
38Jackson 2,931 0.0 2.8 8.1 63.5 24.0 1.1 0.5
39Kalamazo 3,980 0.1 3.3 8.1 60.3 25.9 2.0 0.4
41Kent 10,004 0.1 2.5 7.2 58.4 29.1 2.1 0.4
43DHD#10 4,682 0.1 2.2 8.1 64.0 23.5 1.8 0.3
44Lapeer 863 0.0 2.9 5.3 64.1 26.2 1.3 0.2
45Tuscola 826 0.1 2.8 6.4 64.8 23.5 2.2 0.2
46CAA 1,257 0.1 1.4 8.3 63.6 25.3 1.0 0.2
47Livingst 1,015 0.0 1.7 5.0 59.8 31.1 2.2 0.2
50Macomb 8,196 0.0 1.1 4.5 58.1 33.6 2.6 0.0
51DCS 1,626 0.1 0.9 4.1 61.3 31.0 2.6 0.0
52Marquett 726 0.1 1.4 5.6 61.6 28.8 2.5 0.0
56MMCAA 957 0.0 1.7 5.9 64.8 26.1 1.6 0.0
58Monroe 1,964 0.0 2.4 7.9 63.4 24.6 1.5 0.1
61Muskegon 3,707 0.2 3.4 10.0 61.5 23.2 1.2 0.5
63Oakland 9,164 0.0 1.4 5.2 57.6 33.0 2.5 0.2
73Saginaw 2,298 0.1 3.0 8.2 63.2 24.2 1.1 0.2
74St Clair 2,039 0.1 2.5 7.8 64.3 23.0 1.9 0.3
76Sanilac 589 0.0 2.7 8.7 66.7 21.6 0.3 0.0
78Shiawass 1,080 0.0 3.3 7.8 66.4 21.5 1.0 0.0
81Washtena 3,202 0.1 1.4 6.3 58.1 31.7 2.2 0.2
82Wayne 15,442 0.0 1.2 4.8 59.0 31.5 3.1 0.2
89Urban L 11,043 0.1 2.3 6.4 59.9 28.6 2.4 0.2
90Detroit 15,972 0.1 2.6 7.0 58.4 29.0 2.7 0.2
Michigan 151,661 0.1 2.2 6.9 60.8 27.7 2.1 0.3
(1) Reporting period is January 1 through December 31.(2) Excludes data with errors.* Percentages are not calculated if <100 records are available for analysis after exclusions.
Comparison of Age Distribution by Local Agency
Table 4F
Michigan
Run Date: 5/27/2022WIC PNSS & PedNSS
2019 - 2021 Pregnancy Nutrition Surveillance (1)
Combined 3 Years
Page : 23

Comparison of Maternal Health Indicators (2,3)
Local Agency Prepregnancy BMI
(4)
Weight Gain
(5)
Anemia(Low Hb/Hct)
(6)
GestationalDiabetesDuring
Pregnancy
HypertensionDuring
Pregnancy
Under-weight
Over-weight
< Ideal > Ideal 3rd Trimester Postpartum
Number % (Rank) % (Rank) Number % (Rank) % (Rank) Number % (Rank) Number % (Rank) Number % (Rank) Number % (Rank)
01DHD#2 786 4.7 (37) 62.1 (32) 372 16.7 (15) 52.4 (20) 75 * 88 * 964 6.0 (3) 965 11.6 (16)
02LMAS 387 4.4 (31) 59.9 (15) 267 16.1 (6) 54.3 (34) 24 * 35 * 391 9.2 (30) 391 14.8 (36)
04DHD#4 997 5.3 (43) 60.3 (19) 466 16.7 (15) 54.1 (32) 68 * 80 * 980 9.2 (30) 981 14.5 (32)
05NWMCHA 1,065 3.8 (15) 59.9 (15) 361 17.7 (25) 51.8 (12) 137 24.1 (4) 136 27.2 (12) 1,371 7.7 (10) 1,370 13.4 (26)
06CMDHD 2,674 3.8 (15) 61.2 (26) 1,766 16.4 (10) 53.3 (29) 207 23.7 (3) 242 21.5 (8) 2,857 8.9 (27) 2,869 13.5 (27)
07West UP 740 2.6 (1) 57.4 (6) 511 17.4 (23) 49.9 (6) 55 * 85 * 748 9.1 (29) 749 12.6 (22)
08Barry 777 6.4 (44) 58.3 (8) 340 18.5 (31) 51.8 (12) 110 36.4 (8) 121 9.9 (3) 1,223 10.4 (43) 1,227 14.9 (38)
09Bay 1,299 3.2 (4) 62.4 (34) 796 17.0 (18) 54.9 (37) 115 23.5 (2) 83 * 1,427 6.9 (4) 1,427 10.8 (11)
10Gr Trav 990 4.6 (36) 53.7 (2) 777 16.5 (11) 51.9 (15) 79 * 70 * 1,067 8.7 (25) 1,070 8.7 (2)
11Berrien 2,225 4.1 (24) 61.0 (25) 1,581 19.1 (38) 53.8 (31) 241 37.3 (9) 227 21.6 (9) 2,285 8.5 (23) 2,287 17.8 (43)
12BHS 2,146 5.1 (41) 61.2 (26) 999 19.6 (42) 52.2 (18) 207 24.2 (5) 245 27.8 (15) 2,636 8.8 (26) 2,638 9.2 (3)
13Calhoun 2,138 4.0 (21) 61.4 (28) 1,309 19.1 (38) 52.7 (26) 159 39.6 (13) 220 27.7 (14) 2,526 7.9 (13) 2,526 9.9 (7)
14Leelanau 300 3.7 (13) 58.0 (7) 185 15.1 (4) 54.6 (36) 27 * 29 * 323 9.3 (32) 323 10.5 (9)
15Intercar 4,689 4.8 (38) 60.5 (20) 2,327 19.8 (43) 49.2 (4) 627 38.4 (10) 1,028 31.0 (20) 6,229 9.4 (35) 6,236 10.7 (10)
17Chippewa 516 4.1 (24) 58.7 (9) 364 13.5 (2) 54.9 (37) 31 * 53 * 525 8.4 (20) 527 10.2 (8)
19Mid-Mich 1,897 4.2 (28) 63.9 (42) 1,344 18.6 (32) 50.7 (8) 153 12.4 (1) 227 11.5 (4) 1,892 11.9 (46) 1,894 15.6 (40)
21Delta 804 3.6 (10) 58.7 (9) 609 16.6 (13) 52.1 (16) 72 * 104 9.6 (2) 760 9.3 (32) 762 14.3 (31)
(1) Reporting period is January 1 through December 31.(2) Excludes records with unknown data or errors.(3) Rank compares one Local Agency's rate to other Local Agencies. Rank 1 = best rate.(4) Based on 2009 IOM report, "Weight Gain During Pregnancy": underweight (BMI <18.5), normal weight (BMI 18.5 to 24.9), overweight (BMI 25.0 to 29.9), obese (BMI >30.0).(5) Based on 2009 IOM report, "Weight Gain During Pregnancy": underweight during pregnancy (ideal weight gain = 28 to 40 pounds), normal weight prepregnancy(ideal weight gain = 25 to 35 pounds), overweight prepregnancy (ideal weight gain = 15 to 25 pounds), obese prepregnancy (ideal weight gain = 11 to 20 pounds).(6) Based on 1990 MMWR, "Recommendations to Prevent and Control Iron Deficiency in the United States"; adjusted for altitude and smoking.* Percentages are not calculated if <100 records are available for analysis after exclusions.
Comparison of Maternal Health Indicators by Local Agency
Table 5F
Michigan
Run Date: 5/27/2022WIC PNSS & PedNSS
2019 - 2021 Pregnancy Nutrition Surveillance (1)
Combined 3 Years
Page : 24

Comparison of Maternal Health Indicators (2,3)
Local Agency Prepregnancy BMI
(4)
Weight Gain
(5)
Anemia(Low Hb/Hct)
(6)
GestationalDiabetesDuring
Pregnancy
HypertensionDuring
Pregnancy
Under-weight
Over-weight
< Ideal > Ideal 3rd Trimester Postpartum
Number % (Rank) % (Rank) Number % (Rank) % (Rank) Number % (Rank) Number % (Rank) Number % (Rank) Number % (Rank)
22Iron 390 7.4 (45) 53.1 (1) 145 17.2 (22) 48.3 (3) 44 * 53 * 502 5.0 (2) 503 15.1 (39)
25Genesee 5,595 4.9 (40) 59.2 (13) 2,705 18.7 (34) 51.7 (11) 708 46.9 (23) 603 32.0 (23) 7,051 8.0 (16) 7,060 15.8 (41)
30HDI 1,457 3.4 (5) 67.2 (45) 734 20.2 (44) 48.1 (2) 127 42.5 (16) 376 31.9 (21) 1,660 7.9 (13) 1,660 13.1 (24)
32Huron 369 5.1 (41) 65.6 (44) 277 16.6 (13) 57.4 (45) 34 * 49 * 395 8.4 (20) 397 12.1 (20)
33Ingham 4,375 3.8 (15) 62.1 (32) 3,434 18.9 (36) 53.7 (30) 444 44.4 (17) 389 31.9 (21) 4,960 7.8 (12) 4,961 12.0 (19)
35Keweenaw 87 * * 24 * * 12 * 16 * 97 * 97 *
37Ionia 675 4.4 (31) 64.0 (43) 477 17.0 (18) 55.3 (42) 72 * 112 8.9 (1) 856 10.3 (42) 858 18.1 (45)
38Jackson 2,012 4.1 (24) 60.8 (23) 1,294 16.1 (6) 55.0 (40) 195 39.0 (11) 195 30.8 (18) 2,690 8.0 (16) 2,695 10.9 (12)
39Kalamazo 3,129 3.4 (5) 61.7 (31) 1,566 16.5 (11) 54.2 (33) 249 45.0 (18) 371 33.2 (24) 3,524 9.4 (35) 3,526 11.5 (15)
41Kent 6,280 3.8 (15) 60.2 (17) 2,549 25.7 (45) 44.2 (1) 1,094 40.7 (14) 1,872 29.4 (16) 9,142 8.2 (18) 9,155 14.7 (34)
43DHD#10 3,861 3.9 (20) 61.5 (29) 2,469 19.3 (41) 51.1 (9) 326 34.7 (7) 407 24.8 (11) 4,291 9.8 (40) 4,292 14.6 (33)
44Lapeer 845 3.8 (15) 56.0 (4) 737 17.0 (18) 51.8 (12) 73 * 96 * 790 4.8 (1) 791 9.6 (4)
45Tuscola 631 4.0 (21) 62.4 (34) 478 19.2 (40) 54.4 (35) 61 * 72 * 778 10.7 (44) 779 14.0 (30)
46CAA 944 3.1 (3) 60.8 (23) 462 14.9 (3) 51.1 (9) 118 52.5 (26) 127 40.9 (30) 1,119 9.6 (39) 1,121 13.3 (25)
47Livingst 973 4.5 (34) 54.1 (3) 662 18.6 (32) 52.1 (16) 71 * 137 12.4 (5) 917 10.9 (45) 918 18.1 (45)
50Macomb 7,058 3.6 (10) 61.5 (29) 5,549 18.4 (29) 52.6 (25) 692 40.9 (15) 826 27.4 (13) 7,596 9.3 (32) 7,599 9.7 (5)
51DCS 1,278 4.5 (34) 57.2 (5) 830 15.1 (4) 56.9 (44) 144 34.0 (6) 192 20.3 (7) 1,497 10.0 (41) 1,497 12.8 (23)
(1) Reporting period is January 1 through December 31.(2) Excludes records with unknown data or errors.(3) Rank compares one Local Agency's rate to other Local Agencies. Rank 1 = best rate.(4) Based on 2009 IOM report, "Weight Gain During Pregnancy": underweight (BMI <18.5), normal weight (BMI 18.5 to 24.9), overweight (BMI 25.0 to 29.9), obese (BMI >30.0).(5) Based on 2009 IOM report, "Weight Gain During Pregnancy": underweight during pregnancy (ideal weight gain = 28 to 40 pounds), normal weight prepregnancy(ideal weight gain = 25 to 35 pounds), overweight prepregnancy (ideal weight gain = 15 to 25 pounds), obese prepregnancy (ideal weight gain = 11 to 20 pounds).(6) Based on 1990 MMWR, "Recommendations to Prevent and Control Iron Deficiency in the United States"; adjusted for altitude and smoking.* Percentages are not calculated if <100 records are available for analysis after exclusions.
Comparison of Maternal Health Indicators by Local Agency
Table 5F
Michigan
Run Date: 5/27/2022WIC PNSS & PedNSS
2019 - 2021 Pregnancy Nutrition Surveillance (1)
Combined 3 Years
Page : 25

Comparison of Maternal Health Indicators (2,3)
Local Agency Prepregnancy BMI
(4)
Weight Gain
(5)
Anemia(Low Hb/Hct)
(6)
GestationalDiabetesDuring
Pregnancy
HypertensionDuring
Pregnancy
Under-weight
Over-weight
< Ideal > Ideal 3rd Trimester Postpartum
Number % (Rank) % (Rank) Number % (Rank) % (Rank) Number % (Rank) Number % (Rank) Number % (Rank) Number % (Rank)
52Marquett 655 3.4 (5) 60.6 (22) 469 16.2 (9) 55.2 (41) 55 * 69 * 643 7.2 (7) 649 13.6 (28)
56MMCAA 760 2.9 (2) 63.3 (37) 126 11.1 (1) 52.4 (20) 69 * 134 15.7 (6) 889 9.4 (35) 888 11.7 (18)
58Monroe 1,721 4.3 (29) 63.8 (41) 1,243 18.3 (28) 52.5 (23) 157 47.8 (24) 159 30.8 (18) 1,779 8.3 (19) 1,781 17.7 (42)
61Muskegon 3,354 3.7 (13) 63.3 (37) 2,483 18.4 (29) 52.2 (18) 220 45.5 (20) 191 22.5 (10) 3,392 9.5 (38) 3,396 17.8 (43)
63Oakland 7,326 4.1 (24) 59.0 (12) 4,248 17.0 (18) 53.1 (28) 753 45.0 (18) 803 33.3 (25) 8,277 7.0 (5) 8,277 11.4 (14)
73Saginaw 1,763 3.5 (8) 60.2 (17) 1,166 16.1 (6) 52.4 (20) 193 46.1 (22) 166 29.5 (17) 2,122 8.5 (23) 2,123 10.9 (12)
74St Clair 1,934 4.8 (38) 59.2 (13) 1,612 16.7 (15) 55.5 (43) 155 39.4 (12) 150 38.7 (28) 1,844 7.9 (13) 1,847 14.7 (34)
76Sanilac 97 * * 39 * * 49 * 43 * 518 7.3 (9) 518 9.8 (6)
78Shiawass 999 4.3 (29) 63.0 (36) 825 18.8 (35) 50.2 (7) 77 * 95 * 973 8.4 (20) 975 11.6 (16)
81Washtena 2,629 4.0 (21) 60.5 (20) 1,706 19.0 (37) 49.5 (5) 286 45.5 (20) 400 33.8 (26) 2,876 8.9 (27) 2,878 13.7 (29)
82Wayne 10,142 4.4 (31) 58.7 (9) 6,141 17.6 (24) 52.5 (23) 1,434 48.4 (25) 1,666 33.9 (27) 14,046 7.0 (5) 14,040 8.2 (1)
89Urban L 8,323 3.5 (8) 63.4 (40) 4,710 17.7 (25) 54.9 (37) 863 59.6 (28) 627 50.4 (31) 10,178 7.7 (10) 10,190 14.8 (36)
90Detroit 11,877 3.6 (10) 63.3 (37) 6,951 18.2 (27) 52.9 (27) 1,381 54.2 (27) 853 39.0 (29) 14,946 7.2 (7) 14,952 12.4 (21)
Michigan 116,028 4.0 61.0 70,517 18.2 52.4 12,545 43.2 14,331 30.2 138,600 8.2 138,713 12.6
(1) Reporting period is January 1 through December 31.(2) Excludes records with unknown data or errors.(3) Rank compares one Local Agency's rate to other Local Agencies. Rank 1 = best rate.(4) Based on 2009 IOM report, "Weight Gain During Pregnancy": underweight (BMI <18.5), normal weight (BMI 18.5 to 24.9), overweight (BMI 25.0 to 29.9), obese (BMI >30.0).(5) Based on 2009 IOM report, "Weight Gain During Pregnancy": underweight during pregnancy (ideal weight gain = 28 to 40 pounds), normal weight prepregnancy(ideal weight gain = 25 to 35 pounds), overweight prepregnancy (ideal weight gain = 15 to 25 pounds), obese prepregnancy (ideal weight gain = 11 to 20 pounds).(6) Based on 1990 MMWR, "Recommendations to Prevent and Control Iron Deficiency in the United States"; adjusted for altitude and smoking.* Percentages are not calculated if <100 records are available for analysis after exclusions.
Comparison of Maternal Health Indicators by Local Agency
Table 5F
Michigan
Run Date: 5/27/2022WIC PNSS & PedNSS
2019 - 2021 Pregnancy Nutrition Surveillance (1)
Combined 3 Years
Page : 26

Comparison of Maternal Behavioral Indicators (2,3)
Local Agency Medical Care WIC Enrollment Multivitamin Consumption
1st Trimester No Care 1st Trimester Prepregnancy(4)
During Pregnancy(5)
Number % (rank) % (rank) Number % (rank) Number % (rank) Number % (rank)
01DHD#2 962 82.5 (32) 10.1 (31) 1,045 34.0 (21) 967 21.8 (28) 833 91.2 (17)
02LMAS 390 81.5 (36) 10.8 (34) 432 42.4 (1) 382 26.7 (17) 355 92.4 (15)
04DHD#4 983 82.0 (35) 10.8 (34) 1,062 36.0 (13) 987 25.8 (20) 851 92.9 (13)
05NWMCHA 1,378 89.3 (12) 4.9 (12) 1,439 31.7 (26) 1,329 29.7 (10) 1,114 89.4 (27)
06CMDHD 2,868 81.2 (37) 12.2 (38) 3,073 39.4 (5) 2,795 27.1 (16) 2,465 88.8 (31)
07West UP 744 84.4 (25) 9.3 (30) 830 33.1 (24) 762 36.5 (5) 638 95.3 (1)
08Barry 1,216 88.2 (14) 4.7 (10) 1,335 28.7 (34) 1,227 28.5 (12) 966 94.5 (4)
09Bay 1,432 75.6 (43) 17.5 (45) 1,548 39.6 (4) 1,451 18.1 (40) 1,255 89.3 (28)
10Gr Trav 1,070 80.0 (40) 13.6 (42) 1,149 29.2 (32) 1,052 25.7 (21) 818 89.2 (29)
11Berrien 2,223 74.0 (45) 11.2 (36) 2,538 29.9 (31) 2,283 18.4 (39) 1,872 89.9 (26)
12BHS 2,492 75.1 (44) 15.0 (44) 2,897 34.3 (18) 2,595 23.4 (25) 2,241 88.1 (34)
13Calhoun 2,483 91.9 (4) 4.9 (12) 2,746 33.6 (22) 2,199 23.8 (23) 2,056 86.3 (41)
14Leelanau 324 82.1 (34) 12.7 (40) 348 35.3 (16) 307 34.5 (6) 269 87.4 (37)
15Intercar 6,169 87.7 (16) 7.3 (25) 6,796 34.3 (18) 5,786 23.1 (26) 5,063 87.2 (38)
17Chippewa 525 91.2 (5) 5.9 (18) 574 41.5 (2) 516 39.5 (3) 467 86.5 (39)
19Mid-Mich 1,868 83.6 (29) 10.2 (32) 2,015 34.2 (20) 1,696 27.7 (14) 1,556 94.4 (5)
21Delta 752 91.0 (6) 3.9 (4) 849 35.1 (17) 752 26.3 (18) 649 94.1 (7)
22Iron 510 88.2 (14) 8.6 (29) 565 36.5 (12) 515 39.0 (4) 452 92.0 (16)
25Genesee 6,993 86.6 (20) 4.2 (6) 7,659 25.6 (41) 5,884 8.9 (46) 5,570 88.9 (30)
30HDI 1,647 84.0 (26) 6.6 (23) 1,759 37.9 (8) 1,612 14.6 (44) 1,445 85.4 (46)
32Huron 396 82.3 (33) 7.8 (28) 415 28.0 (36) 361 33.2 (9) 294 90.1 (23)
(1) Reporting period is January 1 through December 31.(2) Excludes records with unknown data or errors.(3) Rank compares one Local Agency's rate to other Local Agencies. Rank 1 = best rate.(4) Women who reported taking a multivitamin four times a weeks or more in the month before pregnancy; proxy for folic acid consumption.(5) Pregnant women who reported taking a multivitamin in the past month; proxy for prenatal iron consumption.* Percentages are not calculated if <100 records are available for analysis after exclusions.
Comparison of Maternal Behavioral Indicators by Local Agency
Table 6F
Michigan
Run Date: 5/27/2022WIC PNSS & PedNSS
2019 - 2021 Pregnancy Nutrition Surveillance (1)
Combined 3 Years
Page : 27
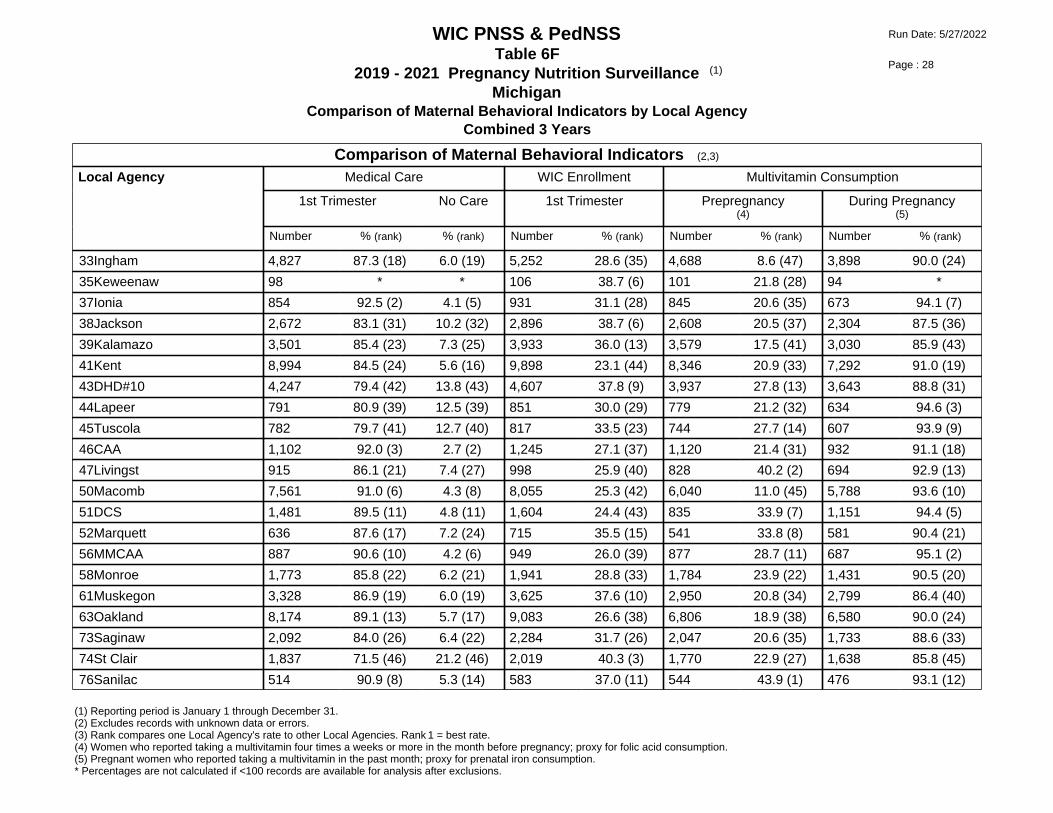
Comparison of Maternal Behavioral Indicators (2,3)
Local Agency Medical Care WIC Enrollment Multivitamin Consumption
1st Trimester No Care 1st Trimester Prepregnancy(4)
During Pregnancy(5)
Number % (rank) % (rank) Number % (rank) Number % (rank) Number % (rank)
33Ingham 4,827 87.3 (18) 6.0 (19) 5,252 28.6 (35) 4,688 8.6 (47) 3,898 90.0 (24)
35Keweenaw 98 * * 106 38.7 (6) 101 21.8 (28) 94 *
37Ionia 854 92.5 (2) 4.1 (5) 931 31.1 (28) 845 20.6 (35) 673 94.1 (7)
38Jackson 2,672 83.1 (31) 10.2 (32) 2,896 38.7 (6) 2,608 20.5 (37) 2,304 87.5 (36)
39Kalamazo 3,501 85.4 (23) 7.3 (25) 3,933 36.0 (13) 3,579 17.5 (41) 3,030 85.9 (43)
41Kent 8,994 84.5 (24) 5.6 (16) 9,898 23.1 (44) 8,346 20.9 (33) 7,292 91.0 (19)
43DHD#10 4,247 79.4 (42) 13.8 (43) 4,607 37.8 (9) 3,937 27.8 (13) 3,643 88.8 (31)
44Lapeer 791 80.9 (39) 12.5 (39) 851 30.0 (29) 779 21.2 (32) 634 94.6 (3)
45Tuscola 782 79.7 (41) 12.7 (40) 817 33.5 (23) 744 27.7 (14) 607 93.9 (9)
46CAA 1,102 92.0 (3) 2.7 (2) 1,245 27.1 (37) 1,120 21.4 (31) 932 91.1 (18)
47Livingst 915 86.1 (21) 7.4 (27) 998 25.9 (40) 828 40.2 (2) 694 92.9 (13)
50Macomb 7,561 91.0 (6) 4.3 (8) 8,055 25.3 (42) 6,040 11.0 (45) 5,788 93.6 (10)
51DCS 1,481 89.5 (11) 4.8 (11) 1,604 24.4 (43) 835 33.9 (7) 1,151 94.4 (5)
52Marquett 636 87.6 (17) 7.2 (24) 715 35.5 (15) 541 33.8 (8) 581 90.4 (21)
56MMCAA 887 90.6 (10) 4.2 (6) 949 26.0 (39) 877 28.7 (11) 687 95.1 (2)
58Monroe 1,773 85.8 (22) 6.2 (21) 1,941 28.8 (33) 1,784 23.9 (22) 1,431 90.5 (20)
61Muskegon 3,328 86.9 (19) 6.0 (19) 3,625 37.6 (10) 2,950 20.8 (34) 2,799 86.4 (40)
63Oakland 8,174 89.1 (13) 5.7 (17) 9,083 26.6 (38) 6,806 18.9 (38) 6,580 90.0 (24)
73Saginaw 2,092 84.0 (26) 6.4 (22) 2,284 31.7 (26) 2,047 20.6 (35) 1,733 88.6 (33)
74St Clair 1,837 71.5 (46) 21.2 (46) 2,019 40.3 (3) 1,770 22.9 (27) 1,638 85.8 (45)
76Sanilac 514 90.9 (8) 5.3 (14) 583 37.0 (11) 544 43.9 (1) 476 93.1 (12)
(1) Reporting period is January 1 through December 31.(2) Excludes records with unknown data or errors.(3) Rank compares one Local Agency's rate to other Local Agencies. Rank 1 = best rate.(4) Women who reported taking a multivitamin four times a weeks or more in the month before pregnancy; proxy for folic acid consumption.(5) Pregnant women who reported taking a multivitamin in the past month; proxy for prenatal iron consumption.* Percentages are not calculated if <100 records are available for analysis after exclusions.
Comparison of Maternal Behavioral Indicators by Local Agency
Table 6F
Michigan
Run Date: 5/27/2022WIC PNSS & PedNSS
2019 - 2021 Pregnancy Nutrition Surveillance (1)
Combined 3 Years
Page : 28

Michigan 137,201 85.7 6.4 149,581 28.5 120,125 20.7 110,438 89.4
Comparison of Maternal Behavioral Indicators (2,3)
Local Agency Medical Care WIC Enrollment Multivitamin Consumption
1st Trimester No Care 1st Trimester Prepregnancy(4)
During Pregnancy(5)
Number % (rank) % (rank) Number % (rank) Number % (rank) Number % (rank)
78Shiawass 969 84.0 (26) 11.8 (37) 1,069 32.0 (25) 671 23.5 (24) 797 85.9 (43)
81Washtena 2,861 90.7 (9) 4.5 (9) 3,139 30.0 (29) 2,854 14.8 (43) 2,366 93.3 (11)
82Wayne 13,906 93.2 (1) 2.0 (1) 15,227 23.0 (45) 10,609 26.0 (19) 10,979 90.3 (22)
89Urban L 10,069 83.4 (30) 3.3 (3) 10,809 21.5 (47) 7,384 21.6 (30) 7,491 86.1 (42)
90Detroit 14,854 81.0 (38) 5.3 (14) 15,767 22.4 (46) 11,313 15.4 (42) 10,864 87.8 (35)
(1) Reporting period is January 1 through December 31.(2) Excludes records with unknown data or errors.(3) Rank compares one Local Agency's rate to other Local Agencies. Rank 1 = best rate.(4) Women who reported taking a multivitamin four times a weeks or more in the month before pregnancy; proxy for folic acid consumption.(5) Pregnant women who reported taking a multivitamin in the past month; proxy for prenatal iron consumption.* Percentages are not calculated if <100 records are available for analysis after exclusions.
Comparison of Maternal Behavioral Indicators by Local Agency
Table 6F
Michigan
Run Date: 5/27/2022WIC PNSS & PedNSS
2019 - 2021 Pregnancy Nutrition Surveillance (1)
Combined 3 Years
Page : 29

Comparison of Smoking Indicators (2,3)
Local Agency
Smoking
Quit SmokingBy First Prenatal
Visit and Stayed OffCigarettes (4)
Smoking in Household
3 MonthsPrior to Pregnancy
Last 3 Monthsof Pregnancy
Prenatal Postpartum
Number % (rank) Number % (rank) Number % (rank) Number % (rank) Number % (rank)
01DHD#2 969 38.8 (41) 966 27.5 (46) 281 23.5 (42) 832 16.1 (46) 965 4.0 (40)
02LMAS 401 40.9 (43) 391 25.8 (42) 130 28.5 (40) 354 14.1 (41) 389 3.3 (32)
04DHD#4 992 41.4 (44) 978 25.4 (41) 320 31.9 (30) 851 12.3 (36) 980 3.2 (30)
05NWMCHA 1,337 36.3 (34) 1,372 22.4 (37) 383 31.9 (30) 1,113 14.1 (41) 1,369 4.0 (40)
06CMDHD 2,876 37.1 (37) 2,876 23.9 (38) 846 30.4 (35) 2,464 14.4 (43) 2,873 3.4 (33)
07West UP 771 36.4 (35) 748 24.7 (40) 209 30.6 (33) 638 9.7 (24) 750 2.4 (23)
08Barry 1,231 37.3 (38) 1,228 18.8 (25) 340 45.0 (9) 965 7.4 (14) 1,229 2.8 (26)
09Bay 1,456 35.6 (32) 1,435 21.3 (34) 422 28.9 (39) 1,254 12.2 (35) 1,437 3.8 (37)
10Gr Trav 1,052 35.1 (29) 1,073 16.8 (21) 285 44.2 (11) 818 7.6 (15) 1,073 2.3 (21)
11Berrien 2,286 29.8 (19) 2,285 14.5 (16) 481 42.8 (14) 1,872 12.3 (36) 2,287 3.7 (36)
12BHS 2,645 32.7 (24) 2,640 19.3 (28) 659 34.6 (25) 2,235 11.0 (28) 2,634 2.3 (21)
13Calhoun 2,490 26.4 (14) 2,509 14.7 (17) 509 31.2 (32) 2,068 6.1 (11) 2,520 1.4 (11)
14Leelanau 326 38.0 (40) 323 19.2 (27) 98 * 270 9.6 (23) 323 3.4 (33)
15Intercar 6,196 21.5 (10) 6,236 11.0 (10) 1,044 38.2 (18) 5,043 4.6 (3) 6,231 1.3 (5)
17Chippewa 535 35.1 (29) 525 25.9 (43) 158 17.1 (44) 463 11.9 (34) 527 4.4 (45)
19Mid-Mich 1,853 35.4 (31) 1,892 20.9 (33) 520 33.1 (27) 1,557 11.3 (30) 1,897 2.5 (25)
21Delta 775 41.4 (44) 761 24.6 (39) 242 36.8 (22) 649 12.6 (39) 761 2.9 (28)
22Iron 521 36.9 (36) 503 26.2 (44) 157 21.7 (43) 451 8.6 (17) 500 2.2 (19)
25Genesee 6,870 23.5 (13) 7,073 13.8 (14) 1,208 37.3 (20) 5,561 8.7 (18) 7,058 2.1 (18)
(1) Reporting period is January 1 through December 31.(2) Excludes records with unknown data or errors.(3) Rank compares one Local Agency's rate to other Local Agencies. Rank 1 = best rate.(4) Among women who smoked 3 months prior to pregnancy.* Percentages are not calculated if <100 records are available for analysis after exclusions.
Comparison of Smoking Indicators by Local Agency
Table 7F
Michigan
Run Date: 5/27/2022WIC PNSS & PedNSS
2019 - 2021 Pregnancy Nutrition Surveillance (1)
Combined 3 Years
Page : 30

Comparison of Smoking Indicators (2,3)
Local Agency
Smoking
Quit SmokingBy First Prenatal
Visit and Stayed OffCigarettes (4)
Smoking in Household
3 MonthsPrior to Pregnancy
Last 3 Monthsof Pregnancy
Prenatal Postpartum
Number % (rank) Number % (rank) Number % (rank) Number % (rank) Number % (rank)
30HDI 1,613 29.6 (18) 1,658 12.1 (11) 417 47.2 (7) 1,444 11.8 (33) 1,658 3.5 (35)
32Huron 380 37.9 (39) 397 22.2 (35) 115 30.4 (35) 294 14.6 (44) 397 4.0 (40)
33Ingham 4,811 17.1 (7) 4,963 9.4 (9) 643 39.7 (15) 3,882 5.0 (4) 4,950 2.4 (23)
35Keweenaw 101 61.4 (47) 98 * 52 * 94 * 98 *
37Ionia 844 32.3 (23) 857 20.5 (30) 215 27.4 (41) 673 7.9 (16) 861 2.0 (16)
38Jackson 2,669 34.2 (28) 2,696 22.3 (36) 755 30.2 (37) 2,302 9.2 (21) 2,696 2.0 (16)
39Kalamazo 3,609 22.8 (12) 3,520 12.7 (12) 631 33.6 (26) 3,023 6.3 (12) 3,514 1.3 (5)
41Kent 9,000 15.2 (6) 9,156 7.4 (6) 1,010 44.1 (12) 7,145 4.1 (1) 9,106 1.1 (2)
43DHD#10 4,247 32.0 (22) 4,291 20.6 (31) 1,101 30.5 (34) 3,641 11.6 (32) 4,290 2.8 (26)
44Lapeer 783 30.3 (20) 791 16.7 (20) 161 44.1 (12) 634 6.8 (13) 790 1.3 (5)
45Tuscola 746 35.9 (33) 783 20.7 (32) 215 38.1 (19) 607 13.0 (40) 783 1.8 (14)
46CAA 1,127 30.6 (21) 1,123 13.9 (15) 245 45.3 (8) 928 9.4 (22) 1,124 3.9 (39)
47Livingst 926 29.0 (16) 914 17.4 (22) 191 36.6 (23) 696 5.0 (4) 914 1.3 (5)
50Macomb 7,427 14.9 (4) 7,599 7.0 (5) 801 44.6 (10) 5,783 5.9 (10) 7,592 1.3 (5)
51DCS 1,472 17.4 (8) 1,491 7.8 (7) 199 50.3 (5) 1,148 5.1 (6) 1,498 1.3 (5)
52Marquett 674 41.4 (44) 659 27.0 (45) 238 32.8 (29) 579 8.8 (19) 657 1.7 (13)
56MMCAA 879 27.2 (15) 888 16.4 (19) 186 36.6 (23) 687 5.7 (9) 883 1.9 (15)
58Monroe 1,790 33.1 (25) 1,783 18.0 (23) 448 39.1 (16) 1,431 10.9 (26) 1,778 4.0 (40)
61Muskegon 3,278 29.5 (17) 3,396 18.6 (24) 780 29.7 (38) 2,804 9.9 (25) 3,397 3.1 (29)
(1) Reporting period is January 1 through December 31.(2) Excludes records with unknown data or errors.(3) Rank compares one Local Agency's rate to other Local Agencies. Rank 1 = best rate.(4) Among women who smoked 3 months prior to pregnancy.* Percentages are not calculated if <100 records are available for analysis after exclusions.
Comparison of Smoking Indicators by Local Agency
Table 7F
Michigan
Run Date: 5/27/2022WIC PNSS & PedNSS
2019 - 2021 Pregnancy Nutrition Surveillance (1)
Combined 3 Years
Page : 31

Comparison of Smoking Indicators (2,3)
Local Agency
Smoking
Quit SmokingBy First Prenatal
Visit and Stayed OffCigarettes (4)
Smoking in Household
3 MonthsPrior to Pregnancy
Last 3 Monthsof Pregnancy
Prenatal Postpartum
Number % (rank) Number % (rank) Number % (rank) Number % (rank) Number % (rank)
63Oakland 8,419 10.8 (1) 8,274 5.5 (2) 679 37.3 (20) 6,566 4.2 (2) 8,269 0.9 (1)
73Saginaw 2,055 34.0 (27) 2,130 12.9 (13) 557 55.5 (3) 1,731 10.9 (26) 2,130 2.2 (19)
74St Clair 1,872 39.5 (42) 1,851 20.3 (29) 580 39.0 (17) 1,636 15.3 (45) 1,846 5.2 (46)
76Sanilac 550 22.2 (11) 517 15.1 (18) 90 * 474 8.9 (20) 517 1.5 (12)
78Shiawass 998 33.7 (26) 978 19.1 (26) 267 33.0 (28) 790 12.3 (36) 971 4.1 (44)
81Washtena 2,886 19.4 (9) 2,874 8.5 (8) 427 51.1 (4) 2,361 5.6 (8) 2,875 1.1 (2)
82Wayne 13,903 12.7 (2) 14,038 5.8 (4) 1,227 48.6 (6) 10,945 5.3 (7) 14,051 1.2 (4)
89Urban L 9,573 15.0 (5) 10,203 5.5 (2) 1,072 57.1 (2) 7,475 11.2 (29) 10,189 3.8 (37)
90Detroit 13,787 14.5 (3) 14,988 5.0 (1) 1,570 58.2 (1) 10,834 11.4 (31) 14,961 3.2 (30)
Michigan 136,101 22.1 138,780 11.7 23,164 39.8 110,111 8.4 138,645 2.3
(1) Reporting period is January 1 through December 31.(2) Excludes records with unknown data or errors.(3) Rank compares one Local Agency's rate to other Local Agencies. Rank 1 = best rate.(4) Among women who smoked 3 months prior to pregnancy.* Percentages are not calculated if <100 records are available for analysis after exclusions.
Comparison of Smoking Indicators by Local Agency
Table 7F
Michigan
Run Date: 5/27/2022WIC PNSS & PedNSS
2019 - 2021 Pregnancy Nutrition Surveillance (1)
Combined 3 Years
Page : 32

Comparison of Infant Health Indicators (2,3)
Local Agency Birthweight Preterm Full Term LBW Ever Breastfed
Low(4)
High(5)
(6) (7)
Number % (rank) % (rank) Number % (rank) Number % (rank) Number % (rank)
01DHD#2 746 7.6 (10) 7.6 (20) 917 8.3 (2) 683 5.4 (43) 747 66.8 (34)
02LMAS 335 7.5 (8) 10.4 (42) 378 10.8 (13) 293 3.1 (11) 335 77.6 (16)
04DHD#4 792 9.0 (25) 8.6 (35) 934 10.7 (12) 691 3.9 (24) 791 77.0 (18)
05NWMCHA 1,093 8.7 (22) 8.7 (36) 1,321 11.1 (19) 959 3.4 (16) 1,146 81.6 (9)
06CMDHD 2,315 8.3 (17) 7.6 (20) 2,781 10.9 (16) 2,053 4.2 (27) 2,320 76.5 (21)
07West UP 606 8.3 (17) 10.1 (41) 728 8.0 (1) 550 4.5 (31) 606 82.7 (8)
08Barry 981 9.6 (29) 8.1 (26) 1,207 11.5 (27) 863 4.2 (27) 999 83.4 (7)
09Bay 1,151 9.6 (29) 7.9 (23) 1,403 11.0 (18) 1,020 4.2 (27) 1,157 65.9 (38)
10Gr Trav 879 7.8 (11) 11.0 (45) 1,033 9.6 (5) 788 2.9 (6) 882 84.1 (4)
11Berrien 1,867 7.9 (13) 5.1 (4) 2,214 9.9 (8) 1,656 4.5 (31) 1,871 71.4 (28)
12BHS 2,180 7.3 (6) 8.5 (34) 2,564 10.2 (10) 1,940 2.9 (6) 2,195 80.6 (11)
13Calhoun 2,015 9.6 (29) 7.1 (19) 2,448 9.9 (8) 1,788 4.9 (38) 2,028 73.3 (25)
14Leelanau 266 6.8 (2) 8.3 (29) 312 10.9 (16) 237 3.0 (8) 266 86.1 (1)
15Intercar 4,782 7.9 (13) 8.3 (29) 6,034 12.0 (31) 4,176 2.8 (4) 5,052 77.3 (17)
17Chippewa 412 9.0 (25) 11.9 (46) 493 10.8 (13) 353 3.4 (16) 412 65.8 (39)
19Mid-Mich 1,514 8.7 (22) 8.8 (37) 1,827 12.2 (33) 1,320 2.8 (4) 1,517 84.8 (3)
21Delta 606 7.3 (6) 8.1 (26) 740 9.7 (7) 539 3.3 (13) 607 75.8 (23)
22Iron 400 8.0 (16) 9.0 (39) 491 11.6 (28) 355 3.7 (22) 401 76.6 (20)
25Genesee 5,698 11.6 (40) 5.1 (4) 6,933 13.5 (41) 4,883 5.5 (44) 5,707 56.3 (43)
(1) Reporting period is January 1 through December 31.(2) Excludes records with unknown data or errors.(3) Rank compares one Local Agency's rate to other Local Agencies. Rank 1 = best rate.(4) <2500 g.(5) >4000 g.(6) <37 weeks gestation.(7) 37 or more weeks gestation and <2500 g.* Percentages are not calculated if <100 records are available for analysis after exclusions.
Comparison of Infant Health Indicators by Local Agency
Table 8F
Michigan
Run Date: 5/27/2022WIC PNSS & PedNSS
2019 - 2021 Pregnancy Nutrition Surveillance (1)
Combined 3 Years
Page : 33

Comparison of Infant Health Indicators (2,3)
Local Agency Birthweight Preterm Full Term LBW Ever Breastfed
Low(4)
High(5)
(6) (7)
Number % (rank) % (rank) Number % (rank) Number % (rank) Number % (rank)
30HDI 1,326 13.0 (44) 4.3 (2) 1,594 14.8 (44) 1,134 5.3 (42) 1,328 62.0 (40)
32Huron 330 9.1 (27) 8.8 (37) 387 10.6 (11) 295 3.4 (16) 330 76.4 (22)
33Ingham 3,999 10.4 (34) 6.3 (12) 4,825 12.8 (36) 3,491 4.4 (30) 4,027 76.9 (19)
35Keweenaw 86 * * 94 * 73 * 87 *
37Ionia 720 7.8 (11) 9.9 (40) 845 10.8 (13) 640 3.3 (13) 719 83.6 (5)
38Jackson 2,199 10.0 (33) 7.9 (23) 2,611 11.4 (25) 1,948 4.6 (34) 2,203 71.9 (27)
39Kalamazo 2,804 10.8 (37) 6.9 (17) 3,425 12.1 (32) 2,450 4.0 (26) 2,839 69.2 (32)
41Kent 7,239 12.6 (43) 5.8 (11) 8,940 15.1 (45) 6,109 5.0 (39) 7,294 74.7 (24)
43DHD#10 3,406 8.5 (21) 8.3 (29) 4,093 11.8 (30) 2,972 3.4 (16) 3,419 79.0 (14)
44Lapeer 661 7.9 (13) 8.3 (29) 767 11.1 (19) 577 3.8 (23) 661 81.2 (10)
45Tuscola 642 8.4 (20) 8.3 (29) 753 12.7 (35) 556 3.2 (12) 641 78.9 (15)
46CAA 919 6.5 (1) 8.1 (26) 1,111 9.5 (4) 827 2.4 (2) 918 69.8 (30)
47Livingst 739 9.7 (32) 6.9 (17) 895 12.5 (34) 643 3.0 (8) 738 83.6 (5)
50Macomb 6,077 11.2 (38) 5.1 (4) 7,362 13.1 (38) 5,212 4.7 (35) 6,121 61.1 (41)
51DCS 1,212 8.8 (24) 6.7 (15) 1,464 11.7 (29) 1,058 3.3 (13) 1,217 69.5 (31)
52Marquett 540 7.2 (5) 10.4 (42) 637 9.3 (3) 485 3.9 (24) 542 85.6 (2)
56MMCAA 719 6.8 (2) 10.6 (44) 874 9.6 (5) 645 2.2 (1) 719 79.6 (12)
58Monroe 1,409 9.1 (27) 6.7 (15) 1,732 11.2 (21) 1,242 3.5 (20) 1,411 66.6 (36)
61Muskegon 2,819 10.4 (34) 5.6 (8) 3,277 13.1 (38) 2,411 4.7 (35) 2,828 67.1 (33)
(1) Reporting period is January 1 through December 31.(2) Excludes records with unknown data or errors.(3) Rank compares one Local Agency's rate to other Local Agencies. Rank 1 = best rate.(4) <2500 g.(5) >4000 g.(6) <37 weeks gestation.(7) 37 or more weeks gestation and <2500 g.* Percentages are not calculated if <100 records are available for analysis after exclusions.
Comparison of Infant Health Indicators by Local Agency
Table 8F
Michigan
Run Date: 5/27/2022WIC PNSS & PedNSS
2019 - 2021 Pregnancy Nutrition Surveillance (1)
Combined 3 Years
Page : 34

Comparison of Infant Health Indicators (2,3)
Local Agency Birthweight Preterm Full Term LBW Ever Breastfed
Low(4)
High(5)
(6) (7)
Number % (rank) % (rank) Number % (rank) Number % (rank) Number % (rank)
63Oakland 6,587 11.5 (39) 6.5 (14) 8,098 12.9 (37) 5,702 4.5 (31) 6,656 73.0 (26)
73Saginaw 1,755 11.7 (41) 5.6 (8) 2,091 13.1 (38) 1,526 4.7 (35) 1,764 66.2 (37)
74St Clair 1,536 8.3 (17) 7.9 (23) 1,800 11.4 (25) 1,351 3.6 (21) 1,539 66.7 (35)
76Sanilac 422 6.9 (4) 6.4 (13) 511 11.2 (21) 375 2.4 (2) 426 52.8 (45)
78Shiawass 783 7.5 (8) 7.7 (22) 953 11.3 (24) 693 3.0 (8) 784 71.4 (28)
81Washtena 2,297 11.8 (42) 5.2 (7) 2,782 14.0 (42) 1,957 5.0 (39) 2,307 79.5 (13)
82Wayne 11,129 10.7 (36) 5.6 (8) 13,682 11.2 (21) 9,797 5.1 (41) 11,419 57.5 (42)
89Urban L 7,570 15.1 (46) 3.9 (1) 9,830 17.1 (46) 6,159 7.2 (46) 7,837 54.3 (44)
90Detroit 12,023 13.7 (45) 4.3 (2) 14,622 14.3 (43) 10,210 6.7 (45) 12,170 52.8 (45)
Michigan 110,594 10.8 6.3 134,856 12.7 95,690 4.7 111,991 55.1
(1) Reporting period is January 1 through December 31.(2) Excludes records with unknown data or errors.(3) Rank compares one Local Agency's rate to other Local Agencies. Rank 1 = best rate.(4) <2500 g.(5) >4000 g.(6) <37 weeks gestation.(7) 37 or more weeks gestation and <2500 g.* Percentages are not calculated if <100 records are available for analysis after exclusions.
Comparison of Infant Health Indicators by Local Agency
Table 8F
Michigan
Run Date: 5/27/2022WIC PNSS & PedNSS
2019 - 2021 Pregnancy Nutrition Surveillance (1)
Combined 3 Years
Page : 35