
STATE OF MICHIGAN - E-Dockets
672
January 21, 2022 Lisa Felice Executive Secretary Michigan Public Service Commission 7109 West Saginaw Highway Lansing, MI 48917 RE: In the matter of the application of DTE ELECTRIC COMPANY for authority to increase its rates, amend its rate schedules and rules governing the distribution and supply of electric energy, and for miscellaneous accounting authority MPSC Case No. U-20836 Dear Ms. Felice: Attached for electronic filing in the above captioned matter are DTE Electric Company’s Application, Proposed Notice of Hearing, Proposed Protective Order, Proposed Nondisclosure Certificates, Testimony and Exhibits. Also attached is the Proof of Service. Also provided to the MPSC by hand delivery for filing via two external storage drive are DTE Electric Company’s Part II – Financial Information materials, Part III –Supplemental Data and electronic files in Excel and Word format. Concurrently with this filing, the parties to Case Nos. U-20162 and U-20561 are being provided all of these materials via the following secure portal link: U-20836 DTE Electric 2022 Rate Case - Public Discovery - All Documents (sharepoint.com). Very truly yours, Jon P. Christinidis JPC/erb Attachments cc: Service List Jon P. Christinidis (313) 235-7706 [email protected] DTE Electric Company One Energy Plaza, 1635 WCB Detroit, MI 48226-1279
-
Upload
khangminh22 -
Category
Documents
-
view
1 -
download
0
Transcript of STATE OF MICHIGAN - E-Dockets

January 21, 2022 Lisa Felice Executive Secretary Michigan Public Service Commission 7109 West Saginaw Highway Lansing, MI 48917 RE: In the matter of the application of DTE ELECTRIC COMPANY for authority to
increase its rates, amend its rate schedules and rules governing the distribution and supply of electric energy, and for miscellaneous accounting authority
MPSC Case No. U-20836 Dear Ms. Felice: Attached for electronic filing in the above captioned matter are DTE Electric Company’s Application, Proposed Notice of Hearing, Proposed Protective Order, Proposed Nondisclosure Certificates, Testimony and Exhibits. Also attached is the Proof of Service. Also provided to the MPSC by hand delivery for filing via two external storage drive are DTE Electric Company’s Part II – Financial Information materials, Part III –Supplemental Data and electronic files in Excel and Word format. Concurrently with this filing, the parties to Case Nos. U-20162 and U-20561 are being provided all of these materials via the following secure portal link: U-20836 DTE Electric 2022 Rate Case - Public Discovery - All Documents (sharepoint.com).
Very truly yours,
Jon P. Christinidis JPC/erb Attachments cc: Service List
Jon P. Christinidis (313) 235-7706 [email protected]
DTE Electric Company One Energy Plaza, 1635 WCB Detroit, MI 48226-1279

STATE OF MICHIGAN
BEFORE THE MICHIGAN PUBLIC SERVICE COMMISSION In the matter of the Application of ) DTE ELECTRIC COMPANY ) for authority to increase its rates, amend ) Case No. U-20836 its rate schedules and rules governing the ) distribution and supply of electric energy, and ) for miscellaneous accounting authority. )
APPLICATION
DTE Electric Company (“Applicant,” the “Company” or “DTE Electric”), a corporation
organized and existing under and by virtue of the laws of the State of Michigan, with its principal
office at One Energy Plaza, Detroit, Michigan 48226, files this Application pursuant to MCL 460.6
et seq., and various Michigan Public Service Commission (“Commission”) orders, requesting
authority to increase rates, and amend its rate schedules and rules governing the distribution and
supply of electric energy. In support of the relief requested in this Application, the Company
respectfully represents to the Commission as follows:
1. DTE Electric is owned by DTE Electric Holdings, LLC, which is a wholly-owned
subsidiary of DTE Energy providing retail electric service to customers located in Michigan,
and is a public utility subject to the jurisdiction of the Commission.
2. The Company is presently serving its electric customers under schedules of rates
and charges approved by this Commission in, inter alia, its Order dated May 8, 2020, in Case No.
U-20561(the “U-20561 Order”).
3. This Application is being filed in accordance with filing requirements contained in
the Commission’s Orders in Case No. U-18238, dated July 31, 2017 and October 11, 2017.

2
4. The Company has determined the need for additional annual revenues in the
amount of approximately $388 million effective as early as November 10, 2022, in order to
recover, among other things, Applicant’s increased investments in plant involving generation and
the electric distribution system and the associated depreciation and property tax increases. The
increased investments and related expenses are offset by lower operation and maintenance
(“O&M”) expenses.
5. This filing reflects the rationale, spending, timing, and expected customer benefits
associated with significant investments in distribution, generation, and customer service. Several
of these programs include strategic infrastructure investments in substations, poles, wires,
transformers and other electric distribution assets to modernize equipment, support growth in
customer demand in specific areas, improve worker and public safety, and reduce the frequency
and duration of power outages. In addition, the Company supports the continuation of the multi-
year tree trimming “surge” program and the construction of the Blue Water Energy Center.
6. The proposed revenue increase described in this Application is necessary in order
to allow the Company to continue to provide safe and reliable electric service, to meet customers’
service quality expectations, and to allow the Company a reasonable opportunity to recover its
costs of operation, including a reasonable rate of return.
7. The historical test year being used by DTE Electric is the calendar year ended
December 31, 2020. This 12-month period was then normalized and adjusted for known and
measurable changes, as supported by the Company’s witnesses in this case, to arrive at the
Company’s November 1, 2022 through October 31, 2023 projected test year.
8. DTE Electric’s projected rate base of approximately $21.3 billion includes actual net
plant and working capital as of December 31, 2020 with projected changes through October 31, 2023
and includes the impact of base capital expenditures and further adjustments for specific major

3
projects. Major capital projects from 2020 through the projected period ending October 31, 2023 are
described in the testimony and exhibits of the Company’s witnesses.
9. DTE Electric’s testimony and exhibits filed contemporaneously with this
Application evidence a need for additional annual revenue beginning November 21, 2022 of
approximately $388 million.
10. Attachment 1 to this Application summarizes the Company’s request. DTE Electric
proposes to allocate the required electric revenue increase among rate classes as set forth on
Attachment 2 to this Application. A comparison of typical bills and proposed rates for Residential
Service Rate D1 is shown on Attachment 3 to this Application. In addition, the Proposed Draft
Notice is included as Attachment 4 to this Application.
Furthermore, DTE Electric is proposing, among other things, certain changes to the
Company’s tariffs, and rules and regulations, including but not limited to, proposed time of use
Rate Schedule D1.11, proposed Rate Schedule D1.12, proposed Rate Schedule D3.5, proposed
Rider 21, and proposed amendments to Rider 10, Rider 18, and the Retail Access Service Rider.
11. The Company is also proposing several pilot programs in this filing, which include
the following:
• Distribution Operations - Strategic Undergrounding • Distribution Operations - Deconductoring • Distribution Operations - Electric Vehicle Charging Demo • Distribution Operations - Small Solar and Storage Testbed • Distribution Operations - Non-wire Alternatives • Generation - Green Hydrogen at Blue Water Energy Center • Generation - Battery Energy Storage System • Marketing - Charging Forward eFleets • Marketing - Charging Forward Expansion • Marketing - Residential Battery • Demand Response - Residential Generator • Demand Response – Battery Storage • Demand Response – Residential Window Air-conditioning • Demand Response – Peak Time Savings

4
12. In Case No. U-20561, the Commission approved the deferral of tree trim surge
amounts above the approved O&M expenses as a regulatory asset through 2022. The Company,
in this filing, is requesting that the Commission approve surge funding deferral for the calendar
years of 2023 and 2024. The Company plans to seek securitization of the deferred asset once it
reaches approximately $150 million. The Company is also requesting the Commission approve a
change in the “return on” rate it applies to the tree trim surge regulatory asset balance going
forward.
13. DTE Electric is also requesting approval of various accounting proposals, including
but not limited to, accounting treatment of costs to expand the Company’s Charging Forward
program; regulatory accounting treatment for certain costs associated with the Time of Use rate
offering; proposed accounting for unused Low-Income Assistance/Residential Income Assistance
credits; accounting for a pension expense deferral mechanism; a COVID-19 compliance expense
regulatory asset; and a customer outage credit regulatory asset.
14. DTE Electric is seeking cost recovery of its variable compensation programs that
are used to attract and retain employees with the requisite skills and experience to ensure
quality customer service; ensure that DTE Electric’s employees’ total compensation is externally
competitive; and that differentiate total rewards based on organizational and individual
contributions. The Company is not seeking to recover the variable compensation for the top five
DTE Energy executives.
15. DTE Electric is requesting a return on equity of 10.25% with an overall rate of return
of 5.56% after tax, 6.98% pre-tax. The Company is requesting a permanent capital structure of
approximately 50% equity and 50% long-term debt. The projected average rate base for the test
year is approximately $21.3 billion, which includes an equity base of approximately $8.4 billion.

5
16. DTE Electric is requesting that the Commission adopt the PSCR base established
in the Commission’s Order in Case No. U-15244 on January 13, 2009, adjusted for an updated
loss factor.
17. In 2016, the Michigan legislature passed and the Governor signed into law 2016
PA 341 which, in the part pertinent to this proceeding, amended MCL 460.1 et seq. by adding
Section 6w (MCL 460.6w). Act 341 became effective on April 20, 2017 and directed the
creation of a state reliability mechanism (“SRM”) and capacity charge. DTE Electric has
calculated the capacity charge consistent with the methodology used in the Commission’s Case
No. U-20162 Order dated May 2, 2019.
18. The Company’s filing also includes revenue requirements by unit/grouping study
(Plant Study) in compliance with the Commission’s May 8, 2020 Order in DTE Electric’s last
main rate case (Case No. U-20561).
19. The Company is filing the direct testimony and exhibits of 31 witnesses concurrently
with this Application. The contents, recommendations, revenue and expense items and proposed
ratemaking items set forth in those documents are incorporated into this Application by reference.
20. The fact that Applicant may not address an item or position addressed by Applicant
in previous cases, or which is presently on appeal before the courts, does not constitute a waiver
of such item or position by the Company, or of any rights or positions that the Company may wish
to take on these matters in this or any other proceedings before the Commission (now or in the
future), or in any other appropriate court or venue.
WHEREFORE, DTE Electric requests that the Commission:
A. Accept this Application for filing;
B. Give such Notice to interested parties as may be required by statute or the
Commission's rules;
6
C. Establish a date, place and time for a prehearing conference;
D. Conduct a hearing on this Application in order to determine the just and reasonable
rates, effective as early as November 21, 2022, which will provide the Company a reasonable
opportunity to recover its costs of operation, including a reasonable rate of return, in the projected
test year and beyond;
E. Approve an additional annual revenue increase effective as soon as possible in the
projected test year as described herein;
F. Approve the Company’s proposed capital structure and return on equity;
G. Grant the Company’s request for tree trimming expenditures and the associated
request for regulatory asset treatment through 2024;
H. Approve new rates effective as early as November 10, 2022 in the manner described
in this Application, the accompanying Attachments and the Company’s Direct Testimony and
Exhibits;
I. Grant the Company’s request to approve the PSCR base;
J. Approve the Company’s proposals to implement certain customer rate schedules
and tariffs;
K. Approve recovery of the Company’s generation investments;
L. Approve recovery of the Company’s investments related to the strengthening of
the Company’s distribution system and reliability improvements;
M. Approve all proposed pilot programs as requested by the Company;
N. Approve all proposed regulatory accounting treatments as requested by the
Company.
O. Approve a capacity charge based on the methodology established in Case No. U-

7
20162 and the capacity-related costs approved in this proceeding;
P. Grant any other relief described in this Application as requested by the Company;
Q. Grant Applicant such further additional relief, as the Commission may deem
suitable and appropriate.
Respectfully Submitted, DTE ELECTRIC COMPANY By: ___________________________
Marco A. Bruzzano Senior Vice President – Corporate Strategy & Regulatory Affairs
DTE ELECTRIC COMPANY Legal Department
By: ___________________________ Attorneys for DTE Electric Company Andrea Hayden (P71976) Jon P. Christinidis (P47352) David S. Maquera (P66228) Paula Johnson-Bacon (P55862) Lauren D. Donofrio (P66026) Carlton D. Watson (P77857) Breanne K. Reitzel (P81107) One Energy Plaza, 1635 WCB Detroit, MI 48226 (313) 235-7706
Dated: January 21, 2022

Attachment 1
(a) (b)
Projected
Revenue
Line Description Deficiency (1)
1 Rate Base (Plant Investment - Return On & Of, plus Property Taxes) 409$
2 Capital Structure 38
3 O&M (26)
4 Sales Margin (42)
5 Other 9
6 Total Requested Rate Relief 388$
(1) Revenue Deficiency calculated from last approved rate case U-20561
DTE Electric Company
Electric Revenue Deficiency by Major Component
($ Millions)
MPSC Case No. U-20836

Attachment 2
(a) (b) (c) (d) (e)
Total Total Total Net Total Net
Present Proposed Increase/ Increase/
Line Revenue Revenue (Decrease) (Decrease)
No. Rate Schedule ($000's) ($000's) ($000's) (%)
1 D1/D1.6 Residential $2,445,134 $2,657,170 $212,036 8.7%
2 D1-A TOU Pilot $8,787 $9,522 $735 8.4%
3 D1-B TOU Pilot $8,823 $9,562 $738 8.4%
4 D1.1 Int. Air $53,972 $59,442 $5,469 10.1%
5 D1.2 TOD $27,857 $30,660 $2,803 10.1%
6 D1.7 TOD $15,244 $17,089 $1,844 12.1%
7 D1.8 Dynamic $37,922 $41,493 $3,571 9.4%
8 D1.9 Elec. Vehicle $925 $1,018 $93 10.0%
9 D2 Elec. Space Heat $46,003 $49,800 $3,797 8.3%
10 D5 Res. Water Ht. $14,983 $16,762 $1,779 11.9%
11 Total Residential $2,659,651 $2,892,516 $232,866 8.8%
1213 Secondary
14 D1.1 Int. Air $659 $714 $55 8.3%
15 D1.7 TOD $1,071 $1,187 $115 10.8%
16 D1.8 Dynamic $133 $145 $12 8.7%
17 D 1.9 Elec Vehicle $7 $8 $1 8.2%
18 D3/D3.5 Gen. Serv. $932,920 $1,008,757 $75,836 8.1%
19 D3.1 Unmetered $10,055 $10,762 $707 7.0%
20 D3.2 Sec. Educ. $43,517 $49,764 $6,247 14.4%
21 D3.3 Interruptible $8,143 $8,914 $771 9.5%
22 D4 Lg. Gen. Serv. $259,936 $272,810 $12,874 5.0%
23 D5 Com. Wat. Ht. $713 $789 $76 10.7%
24 E1.1 Eng. St. Ltg. $957 $1,051 $94 9.8%
25 R7 Greenhs. Ltg. $408 $452 $44 10.9%
26 R8 Space Cond. $8,602 $9,351 $749 8.7%
27 Total Secondary $1,267,121 $1,364,702 $97,581 7.7%
2829 Primary
30 D11 Prim. Supply $976,184 $1,023,389 $47,205 4.8%
31 D12 Exp. Lrg Cust $0 $0 $0 -
32 D6.2 Pri. Educ. $42,647 $44,811 $2,164 5.1%
33 D8 Int. Primary $42,973 $45,406 $2,433 5.7%
34 D10 El.Schools $2,258 $2,372 $114 5.1%
35 R1.1 Alt. Mtl. Melt. $4,253 $4,415 $162 3.8%
36 R1.2 El. Pr. Htg. $34,633 $36,624 $1,990 5.7%
37 R3 Standby $11,882 $12,753 $871 7.3%
38 R10 Int. Supply $69,135 $62,911 ($6,224) (9.0%)
39 Total Primary $1,183,965 $1,232,681 $48,716 4.1%
4041 Other
42 D9 Protective Ltg. $10,790 $10,101 ($689) (6.4%)
43 E1 Muni Street Ltg $52,923 $62,439 $9,517 18.0%
44 E2 Traffic Lights $4,947 $5,180 $233 4.7%
45 Total Other $68,659 $77,720 $9,061 13.2%
4647 Total All Classes $5,179,395 $5,567,620 $388,224 7.5%
DTE Electric CompanySummary of Present and Proposed Revenue by Rate Schedule
MPSC Case No. U-20836

Attachment 3
(a) (b) (c) (d) (e)
Line Monthly Present Net Proposed NetNo. kWh Use Monthly Bill Monthly Bill Amount Percent
1 100 $24.25 $25.90 $1.65 6.79%2 200 $40.13 $43.42 $3.29 8.21%3 300 $56.01 $60.95 $4.94 8.82%4 400 $71.89 $78.47 $6.59 9.16%5 500 $87.76 $96.00 $8.24 9.38%6 600 $105.43 $115.06 $9.63 9.13%7 700 $123.29 $134.28 $10.99 8.92%8 800 $141.15 $153.51 $12.36 8.76%9 900 $159.02 $172.74 $13.72 8.63%10 1,000 $176.88 $191.97 $15.09 8.53%11 1,500 $266.19 $288.11 $21.91 8.23%12 2,000 $355.51 $384.25 $28.74 8.08%13 4,000 $712.76 $768.80 $56.04 7.86%
Increase
DTE Electric Company
Comparison of Typical Bills Under Present and Proposed Rates
Residential Service Rate D1
MPSC Case No. U-20836

Page 1
ATTACHMENT 4
PROPOSED
STATE OF MICHIGAN
BEFORE THE MICHIGAN PUBLIC SERVICE COMMISSION
NOTICE OF HEARING
FOR THE ELECTRIC CUSTOMERS OF
DTE ELECTRIC COMPANY
CASE NO. U-20836
• DTE Electric Company may increase its annual base electric revenues by approximately
$388 million above existing base electric rate levels along with other requested relief if
the Michigan Public Service Commission (Commission) approves its request.
• A TYPICAL RESIDENTIAL CUSTOMER'S AVERAGE ELECTRIC BILL MAY BE
INCREASED BY UP TO $10.31 PER MONTH, IF THE MICHIGAN PUBLIC
SERVICE COMMISSION APPROVES THE REQUEST.
• The information below describes how a person may participate in this case.
• You may call or write DTE Electric Company, One Energy Plaza, Detroit, Michigan
48226, 1-800-477-4747, for a free copy of its application, testimony and exhibits. Any
person may review the application, testimony and exhibits at the offices of DTE Electric
Company or on the Commission’s website at: michigan.gov/mpscedockets
• A pre-hearing will be held:
DATE/TIME: , 2022, at 10:00 a.m.
BEFORE: Administrative Law Judge _________________
LOCATION: Video/Teleconferencing
PARTICIPATION: Any interested person may participate. Persons needing any
assistance to participate should contact the Commission's
Executive Secretary at (517) 284-8090, or by email
[email protected] in advance of the hearing.

Page 2
The Michigan Public Service Commission (Commission) will hold a pre-hearing to consider
DTE Electric Company’s January 10, 2022 application to increase its annual base electric revenues
by approximately $388 million along with other requested relief.
DTE Electric Company’s Application states that the requested increase is required to
recover the costs associated with significant investments in distribution, generation, and customer
service. Several of these programs include strategic infrastructure investments in electric
distribution assets to modernize equipment, support growth in customer demand in specific areas,
improve worker and public safety, and reduce the frequency and duration of power outages. In
addition, DTE Electric Company seeks to recover the costs of continuing its multi-year tree
trimming “surge” program and the construction of the Blue Water Energy Center.
DTE Electric Company’s requested relief also includes certain changes to its tariffs, and rules
and regulations, including but not limited to proposed time of use Rate Schedule D1.11, proposed
Rate Schedule D1.12, proposed Rate Schedule D3.5, proposed Rider 21, and proposed
amendments to Rider 10, Rider 18, and the Retail Access Service Rider. The Application also
requests approval of capital structure cost changes, various accounting proposals and identifies
several proposed pilot programs associated with its distribution system, generation, electric
vehicles, and electric demand response. In total, DTE Electric Company’s Application seeks
Commission approval for additional annual revenues of approximately $388 million based upon a
November 1, 2022 through October 31, 2023 projected test year with rates effective as early as
November 10, 2022.
The chart below summarizes DTE Electric Company's proposed base revenue increases.
SUMMARY OF PROPOSED BASE REVENUE INCREASES
DTE Electric Company
Summary of Proposed
Base Electric Revenue Increase /(Decrease)
Total Total Total Net Total Net
Present Proposed Increase/ Increase/
Revenue Revenue (Decrease) (Decrease)
Rate Schedule ($000's) ($000's) ($000's) (%)
D1/D1.6 Residential $2,445,134 $2,657,170 $212,036 8.7%
D1-A TOU Pilot $8,787 $9,522 $735 8.4%
D1-B TOU Pilot $8,823 $9,562 $738 8.4%
D1.1 Int. Air $53,972 $59,442 $5,469 10.1%
D1.2 TOD $27,857 $30,660 $2,803 10.1%
D1.7 TOD $15,244 $17,089 $1,844 12.1%
D1.8 Dynamic $37,922 $41,493 $3,571 9.4%
D1.9 Elec. Vehicle $925 $1,018 $93 10.0%
D2 Elec. Space Heat $46,003 $49,800 $3,797 8.3%
D5 Res. Water Ht. $14,983 $16,762 $1,779 11.9%
Total Residential $2,659,651 $2,892,516 $232,866 8.8%

Page 3
Secondary
D1.1 Int. Air $659 $714 $55 8.3%
D1.7 TOD $1,071 $1,187 $115 10.8%
D1.8 Dynamic $133 $145 $12 8.7%
D 1.9 Elec Vehicle $7 $8 $1 8.2%
D3/D3.5 Gen. Serv. $932,920 $1,008,757 $75,836 8.1%
D3.1 Unmetered $10,055 $10,762 $707 7.0%
D3.2 Sec. Educ. $43,517 $49,764 $6,247 14.4%
D3.3 Interruptible $8,143 $8,914 $771 9.5%
D4 Lg. Gen. Serv. $259,936 $272,810 $12,874 5.0%
D5 Com. Wat. Ht. $713 $789 $76 10.7%
E1.1 Eng. St. Ltg. $957 $1,051 $94 9.8%
R7 Greenhs. Ltg. $408 $452 $44 10.9%
R8 Space Cond. $8,602 $9,351 $749 8.7%
Total Secondary $1,267,121 $1,364,702 $97,581 7.7%
Total Total Total Net Total Net
Present Proposed Increase/ Increase/
Revenue Revenue (Decrease) (Decrease)
Rate Schedule ($000's) ($000's) ($000's) (%)
Primary
D11 Prim. Supply $976,184 $1,023,389 $47,205 4.8%
D12 Exp. Lrg Cust $0 $0 $0 -
D6.2 Pri. Educ. $42,647 $44,811 $2,164 5.1%
D8 Int. Primary $42,973 $45,406 $2,433 5.7%
D10 El.Schools $2,258 $2,372 $114 5.1%
R1.1 Alt. Mtl. Melt. $4,253 $4,415 $162 3.8%
R1.2 El. Pr. Htg. $34,633 $36,624 $1,990 5.7%
R3 Standby $11,882 $12,753 $871 7.3%
R10 Int. Supply $69,135 $62,911 ($6,224) (9.0%)
Total Primary $1,183,965 $1,232,681 $48,716 4.1%
Other
D9 Protective Ltg. $10,790 $10,101 ($689) (6.4%)
E1 Muni Street Ltg $52,923 $62,439 $9,517 18.0%
E2 Traffic Lights $4,947 $5,180 $233 4.7%
Total Other $68,659 $77,720 $9,061 13.2%
Total All Classes $5,179,395 $5,567,620 $388,224 7.5%
All documents filed in this case shall be submitted electronically through the Commission’s
E-Dockets website at: michigan.gov/mpscedockets. Requirements and instructions for filing can
be found in the User Manual on the E-Dockets help page. Documents may also be submitted, in
Word or PDF format, as an attachment to an email sent to: [email protected]. If you
require assistance prior to e-filing, contact Commission staff at (517) 284-8090 or by email at:

Page 4
Any person wishing to intervene and become a party to the case shall electronically file a
petition to intervene with this Commission by _____________, 2022. (Interested persons may
elect to file using the traditional paper format.) The proof of service shall indicate service upon
DTE Electric Company’s attorney, Jon P. Christinidis, One Energy Plaza, 1635 WCB, Detroit, MI
48226.
The prehearing is scheduled to be held remotely by video conference or teleconference.
Persons filing a petition to intervene will be advised of the process to participate in the hearing.
Any person wishing to participate without intervention under Mich Admin Code, R
792.10413 (Rule 413), or file a public comment, may do so by filing a written statement in this
docket. The written statement may be mailed or emailed and should reference Case No. U-20836.
Statements may be emailed to: [email protected]. Statements may be mailed to:
Executive Secretary, Michigan Public Service Commission, 7109 West Saginaw Hwy., Lansing,
MI 48917. All information submitted to the Commission in this matter becomes public
information, thus available on the Michigan Public Service Commission’s website, and subject to
disclosure. Please do not include information you wish to remain private. For more information on
how to participate in a case, you may contact the Commission at the above address or by telephone
at (517) 284-8090.
Requests for adjournment must be made pursuant to the Michigan Office of Administrative
Hearings and Rules R 792.10422 and R 792.10432. Requests for further information on
adjournment should be directed to (517) 284-8130.
A copy of DTE Electric Company’s application may be reviewed on the Commission’s
website at: michigan.gov/mpscedockets, and at the office of DTE Electric Company, One Energy
Plaza, Detroit, MI 48226. For more information on how to participate in a case, you may contact
the Commission at the above address or by telephone at (517) 284-8090.
The Utility Consumer Representation Fund has been created for the purpose of aiding in
the representation of residential utility customers in various Commission proceedings. Contact the
Chairperson, Utility Consumer Participation Board, Department of Licensing and Regulatory
Affairs, P.O. Box 30004, Lansing, Michigan 48909, for more information.
Jurisdiction is pursuant to 1909 PA 106, as amended, MCL 460.551 et seq.; 1919 PA 419,
as amended, MCL 460.54 et seq.; 1939 PA 3, as amended, MCL 460.1 et seq.; 1969 PA 306, as
amended, MCL 24.201 et seq.; and Parts 1 & 4 of the Michigan Office of Administrative Hearings
and Rules, Mich. Admin Code, R 792.10106 and R 792.10401 through R 792.10448.

1
STATE OF MICHIGAN
BEFORE THE MICHIGAN PUBLIC SERVICE COMMISSION
In the matter of the application of )
DTE ELECTRIC COMPANY for )
authority to increase its rates, amend its )
rate schedules and rules governing the ) Case No. U-20836
distribution and supply of electric energy, )
and for miscellaneous accounting authority )
PROPOSED PROTECTIVE ORDER
This Protective Order governs the use and disposition of Protected Material that DTE
Electric Company (“Applicant”) or any other Party discloses to another Party during the course of
this proceeding. The Applicant or other Party disclosing Protected Material is referred to as the
“Disclosing Party”; the recipient is the “Receiving Party” (defined further below). The intent of
this Protective Order is to protect non-public, confidential information and materials so designated
by the Applicant or by any other party, which information and materials contain confidential,
proprietary, or commercially sensitive information. This Protective Order defines “Protected
Material” and describes the manner in which Protected Material is to be identified and treated.
Accordingly, it is ordered:
I. “Protected Material” and Other Definitions
A. For the purposes of this Protective Order, “Protected Material” consists of trade
secrets or confidential, proprietary, or commercially sensitive information provided in Disclosing
Party’s Exhibits, discovery or audit responses, any witness’ related exhibit and testimony, and any
arguments of counsel describing or relying upon the Protected Material. Subject to challenge under
Paragraph IV.A, Protected Material shall consist of non-public confidential information and

2
materials including, but not limited to, the following information disclosed during the course of
this case if it is marked as required by this Protective Order:
1. Trade secrets or confidential, proprietary, or commercially sensitive information
provided in response to discovery, in response to an order issued by the
presiding hearing officer or the Michigan Public Service Commission (“MPSC”
or the “Commission”), in testimony or exhibits filed later in this case, or in
arguments of counsel;
a. Examples of such trade secrets, confidential, proprietary, or commercially
sensitive information include, but are not limited to, information regarding
compensation, generation, transmission and distribution facilities and
related equipment, infrastructure, energy market projections or
assumptions, forecasts, gas conversion analyses, sensitivity analyses,
revenue requirement analyses, or financial arrangements including but not
limited to those set forth in contracts.
b. Exclusions include Critical Energy Infrastructure Information (“CEII”),
technical data subject to U.S. export control laws and regulations, including
but not limited to 10 C.F.R. Part 810 et. seq., North American Electric
Reliability Corporation (NERC) Critical Infrastructure Protection (CIP)
material and information, DTE Electric distribution system information and
operational data including Supervisory Control and Data Acquisition
(SCADA) information, confidential Midcontinent Independent System
Operator (MISO) and ITC Holdings Corp and/or its affiliate companies’
information in the possession of DTE Electric Company, and information
regarding Cyber Security which shall not be disclosed pursuant to this
Protective Order or under any other circumstance. No individual DTE
Energy employee’s compensation benefits or other personal information is
relevant in this proceeding. No individual DTE Energy employee’s
compensation, benefits or other personal information shall be required to be
disclosed in this proceeding in the course of a hearing, through discovery,
under this Protective Order, or otherwise.
2. To the extent permitted, information obtained under license from a third-party
licensor, to which the Disclosing Party or witnesses engaged by the Disclosing
Party is a licensee, that is subject to any confidentiality or non-transferability
clause. This information includes reports; analyses; models (including related
inputs and outputs); trade secrets; and confidential, proprietary, or
commercially sensitive information that the Disclosing Party or one of its
witnesses receives as a licensee and is authorized by the third- party licensor to
disclose consistent with the terms and conditions of this Protective Order.
3. Where protection from all means of disclosure is demanded in writing by a
vendor of commercially-available market analyses and/or studies concerning

3
employee compensation levels and such written demand is submitted to the
Commission by DTE Electric, no Party shall obtain access to such
commercially-available market analyses and/or studies concerning employee
compensation levels until the Commission promises confidentiality for such
market analyses and/or studies concerning employee compensation levels in
writing, the Chairman of the Commission authorizes that promise of
confidentiality in writing and the Commission thereafter through issuance of an
order grants Protected Materials involving such market analyses and/or studies
concerning employee compensation levels exemption from disclosure under the
Michigan Freedom of Information Act (“FOIA”) as “Trade secrets or
commercial or financial information” pursuant to MCL 15.243(1)(f) and the
material marked “CONFIDENTIAL-SUBJECT TO PROTECTIVE ORDER
IN CASE NO. U-20836 – EXEMPT FROM PUBLIC DISCLOSURE UNDER
THE MICHIGAN FREEDOM OF INFORMATION ACT MCL 15.243(1)(f)”.
If the AG or any other Party to this proceeding is itself subject to disclosure
requirements under FOIA and wishes to obtain Protected Materials involving
market analyses and/or studies concerning employee compensation levels that
have been exempted by the Commission from disclosure under FOIA, the AG
or other Party, in addition to executing a Non-Disclosure Certificate, must also
exempt such Protected Materials from disclosure under FOIA prior to obtaining
such Protected Materials.
4. Information that could identify the bidders and bids, including the winning bid,
in a competitive solicitation for a power purchase agreement or in a
competitively bid engineering, procurement, or construction contract at any
stage of the selection process (i.e., before the Disclosing Party has entered into
a power purchase agreement or selected a contractor).
B. The information subject to this Protective Order does not include:
1. Information that is or has become available to the public through no fault of the
Receiving Party or Reviewing Representative and no breach of this Protective
Order, or information that is otherwise lawfully known by the Receiving Party
without any obligation to hold it in confidence;
2. Information received from a third party free to disclose the information without
restriction;
3. Information that is approved for release by written authorization of the
Disclosing Party, but only to the extent of the authorization;
4. Information that is required by law or regulation to be disclosed, but only to the
extent of the required disclosure; or

4
5. Information that is disclosed in response to a valid, non-appealable order of a
court of competent jurisdiction or governmental body, but only to the extent the
order requires.
C. The parties agree that this protective order is insufficient to protect particularly
sensitive commercial information regarding current contract negotiations and contract-re-
negotiations and such information shall not be disclosed without agreement of the parties or further
proceedings regarding this information including, but not limited to, a determination by the
presiding officer whether, and if so to what extent, the material is to be disclosed, and any
additional protections that may be necessary on a case by case basis. The parties reserve the right
to exhaust any appeals to the Commission and any court or appellate court of competent
jurisdiction prior to making any ordered disclosure.
D. “Party” refers to the Applicant, MPSC Staff (“Staff”), Michigan Attorney General,
or any other person, company, organization, or association that is granted intervention in Case No.
U-20836 under the Commission’s Rules of Practice and Procedure, Mich Admin Code, R
792.10401 et al.
E. “Receiving Party” means any Party to this proceeding who requests or receives
access to Protected Material, subject to the requirement that each Reviewing Representative sign
a Nondisclosure Certificate attached to this Protective Order as Attachment 1.
F. “Reviewing Representative” means a person who has signed a Nondisclosure
Certificate and who is:
1. An attorney who has entered an appearance in this proceeding for a Receiving
Party;
2. An attorney, paralegal, or other employee associated, for the purpose of this
case, with an attorney described in Paragraph I.F.1;
3. An expert or employee of an expert retained by a Receiving Party to advise,
prepare for, or testify in this proceeding; or

5
4. An employee or other representative of a Receiving Party with significant
responsibility in this case.
A Reviewing Representative is responsible for assuring that persons under his or her
supervision and control comply with this Protective Order.
G. “Nondisclosure Certificate” means the certificate attached to this Protective Order as
Attachment 1, which is signed by a Reviewing Representative who has been granted access to
Protected Material and agreed to be bound by the terms of this Protective Order.
II. Access to and Use of Protected Material
A. This Protective Order governs the use of all Protected Material that is marked as
required by Paragraph III.A and made available for review by the Disclosing Party to any
Receiving Party or Reviewing Representative. This Protective Order protects: (i) the Protected
Material; (ii) any copy or reproduction of the Protected Material made by any person; and (iii) any
memorandum, handwritten notes, or any other form of information that copies, contains, or
discloses Protected Material. All Protected Material in the possession of a Receiving Party shall
be maintained in a secure place. Access to Protected Material shall be limited to persons authorized
to have access subject to the provisions of this Protective Order.
B. Protected Material shall be used and disclosed by the Receiving Party solely in
accordance with the terms and conditions of this Protective Order. A Receiving Party may
authorize access to, and use of, Protected Material by a Reviewing Representative identified by
the Receiving Party, subject to Paragraphs III and V below, only as necessary to analyze the
Protected Material; make or respond to discovery; present evidence; prepare testimony, argument,
briefs, or other filings; prepare for cross-examination; consider strategy; and evaluate settlement.
These individuals shall not release or disclose the content of Protected Material to any other person
or use the information for any other purpose.

6
C. The Disclosing Party retains the right to object to any designated Reviewing
Representative if the Disclosing Party has reason to believe that there is an unacceptable risk of
misuse of confidential information. If a Disclosing Party objects to a Reviewing Representative,
the Disclosing Party and the Receiving Party will attempt to reach an agreement to accommodate
that Receiving Party’s request to review Protected Material. If no agreement is reached, then either
the Disclosing Party or the Receiving Party may submit the dispute to the presiding hearing officer.
If the Disclosing Party notifies a Receiving Party of an objection to a Reviewing Representative,
then the Protected Material shall not be provided to that Reviewing Representative until the
objection is resolved by agreement or by the presiding hearing officer.
D. Before reviewing any Protected Material, including copies, reproductions, and
copies of notes of Protected Material, a Receiving Party and Reviewing Representative shall sign
a copy of the Nondisclosure Certificate (Attachment 1 to this Protective Order) agreeing to be
bound by the terms of this Protective Order. The Reviewing Representative shall also provide a
copy of the executed Nondisclosure Certificate to the Disclosing Party.
E. No person who is afforded access to any Protected Material by reason of this Order
shall disclose the Protected Material to anyone not specifically authorized to receive such
information pursuant to the terms of this Order. Nor shall such persons use the Protected Material
in any manner inconsistent with this Order. All persons afforded access to Protected Material
pursuant to this Order shall keep the Protected Material secure in accordance with the purposes
and intent of this Order and shall adopt all reasonable precautions to assure continued
confidentiality, including precautions against unauthorized copying, use, or disclosure thereof.

7
F. A party seeking or intending to disclose in or on the public record information taken
directly from materials identified as Protected Material must – before actually disclosing the
information – do one of the following: (a) contact DTE Electric’s counsel of record and obtain
written permission to place the information in the public record, (b) take affirmative steps to
confirm and actually confirm that the information is otherwise public information and within an
exclusion in section 7 of this Order and comply with the notice provisions in section 7, or (c)
challenge the confidential nature of the Protected Material and obtain a ruling under section 10
that the information is not confidential and may be disclosed in or on the public record
G. Even if no longer engaged in this proceeding, every person who has signed a
Nondisclosure Certificate continues to be bound by the provisions of this Protective Order. The
obligations under this Protective Order are not extinguished or nullified by entry of a final order
in this case and are enforceable by the MPSC or a court of competent jurisdiction. To the extent
Protected Material is not returned to a Disclosing Party, it remains subject to this Protective Order.
H. Members of the Commission, Commission staff assigned to assist the Commission
with its deliberations, and the presiding hearing officer shall have access to all Protected Material
that is submitted to the Commission under seal without the need to sign the Nondisclosure
Certificate.
I. A Party retains the right to seek further restrictions on the dissemination of
Protected Material to persons who have or may subsequently seek to intervene in this MPSC
proceeding.
J. Nothing in this Protective Order precludes a Party from asserting a timely
evidentiary objection to the proposed admission of Protected Material into the evidentiary record
for this case.

8
III. Procedures
A. The Disclosing Party shall mark any information that it considers confidential as
“CONFIDENTIAL: SUBJECT TO THE PROTECTIVE ORDER ISSUED IN CASE NO.
U-20836.” Software executable files containing protected material may not be capable of being
marked with the foregoing required protective language. The inability to mark software executable
files containing protected material with such protective language shall not diminish the
requirements of this Protective Order. It shall be sufficient if the medium used to deliver software
executable files containing protected information is marked with the required protective language.
However, any output from the software executable files containing protected material that is
generated only as a reproducible document, whether electronic or non-electronic, that is capable
of being marked with the required protective language, shall be marked by the party who generated
the output with such protective language and subject to the requirements of this Protective Order.
If the Receiving Party or a Reviewing Representative makes copies of any Protected Material, they
shall conspicuously mark the copies as Protected Material. Notes of Protected Material shall also
be conspicuously marked as Protected Material by the person making the notes.
B. If a Receiving Party wants to quote, refer to, or otherwise use Protected Material in
pleadings, pre-filed testimony, exhibits, cross-examination, briefs, oral argument, comments, or in
some other form in this proceeding (including administrative or judicial appeals), the Receiving
Party shall do so consistent with procedures that will maintain the confidentiality of the Protected
Material. For purposes of this Protective Order, the following procedures apply:
1. Written submissions using Protected Material shall be filed in a sealed record
to be maintained by the MPSC’s Docket Section, or by a court of competent
jurisdiction, in envelopes clearly marked on the outside, “CONFIDENTIAL –
SUBJECT TO THE PROTECTIVE ORDER ISSUED IN CASE NO.
U-20836.” Simultaneously, identical documents and materials, with the
9
Protected Material redacted, shall be filed and disclosed the same way that
evidence or briefs are usually filed;
2. Oral testimony, examination of witnesses, or argument about Protected
Material shall be conducted on a separate record to be maintained by the
MPSC’s Docket Section or by a court of competent jurisdiction. These separate
record proceedings shall be closed to all persons except those furnishing the
Protected Material and persons otherwise subject to this Protective Order. The
Receiving Party presenting the Protected Material during the course of the
proceeding shall give the presiding officer or court sufficient notice to allow the
presiding officer or court an opportunity to take measures to protect the
confidentiality of the Protected Material; and
3. Copies of the documents filed with the MPSC which contain Protected
Material, including the portions of the exhibits, transcripts, or briefs that refer
to Protected Material, shall be marked or identified as, “CONFIDENTIAL -
SUBJECT TO PROTECTIVE ORDER IN CASE NO. U-20836” and shall be
maintained in a separate portion of the record under seal, segregated in the files
of the Commission, and withheld from inspection by any person not bound by
the terms of this Order.
C. The Protected Material subject to this Order shall be shielded from disclosure to
the extent permitted by law. If any person files a Freedom of Information Act (“FOIA”) request
with the Commission seeking access to documents subject to this Order, then the Commission’s
Executive Secretary shall notify DTE Electric as soon as reasonably practicable and DTE Electric
may take whatever legal actions it deems appropriate to protect the Protected Material from
disclosure. If the Commission denies a claim of confidentiality, in whole or in part, then the
Commission shall give notice to DTE Electric at least five (5) business days prior to the
Commission’s contemplated disclosure in response to the request. The notice shall briefly explain
why DTE Electric’s objections to disclosure were not sustained by the Commission. In the event
that the FOIA requester commences suit against the Commission to compel disclosure of a
document for which privilege is claimed, the Commission shall immediately notify DTE Electric
of the suit.

10
IV. Termination of Protected Status
A. A Receiving Party reserves the right to challenge whether a document or
information is Protected Material and whether this information can be withheld under this
Protective Order. In response to a motion, the Commission or the presiding hearing officer in this
case may revoke a document’s protected status after notice and hearing. If the presiding hearing
officer revokes a document’s protected status, then the document loses its protected status after 14
days unless a Party files an application for leave to appeal the ruling to the Commission within
that time period. Any Party opposing the application for leave to appeal shall file an answer with
the Commission no more than 14 days after the filing and service of the appeal. If an application
is filed, then the information will continue to be protected from disclosure until either the time for
appeal of the Commission’s final order resolving the issue has expired under MCL 462.26 or, if
the order is appealed, until judicial review is completed and the time to take further appeals has
expired.
B. If a document’s protected status is challenged under Paragraph IV.A, the Receiving
Party challenging the protected status of the document shall explicitly state its reason for
challenging the confidential designation. The Disclosing Party bears the burden of proving that the
document should continue to be protected from disclosure.
V. Retention of Documents
Protected Material remains the property of the Disclosing Party and only remains available
to the Receiving Party until the time expires for petitions for rehearing of a final MPSC order in
Case No. U-20836 or until the MPSC has ruled on all petitions for rehearing in this case (if any).
However, an attorney for a Receiving Party who has signed a Nondisclosure Certificate and who
is representing the Receiving Party in an appeal from an MPSC final order in this case may retain
copies of Protected Material until either the time for appeal of the Commission’s final order

11
resolving the issue has expired under MCL 462.26 or, if the order is appealed, until judicial review
is completed and the time to take further appeals has expired. On or before the time specified by
the preceding sentences, the Receiving Party shall return to the Disclosing Party all Protected
Material in its possession or in the possession of its Reviewing Representatives-including all
copies and notes of Protected Material-or certify in writing to the Disclosing Party that the
Protected Material has been destroyed.
VI. Limitations and Disclosures
The provisions of this Protective Order do not apply to a particular document, or portion
of a document, described in Paragraph II.A if a Receiving Party can demonstrate that it has been
previously disclosed by the Disclosing Party on a non-confidential basis or meets the criteria set
forth in Paragraphs I.B.1 through I.B.5. A Receiving Party intending to disclose information taken
directly from materials identified as Protected Material must-before actually disclosing the
information-do one of the following: (i) contact the Disclosing Party’s counsel of record and obtain
written permission to disclose the information, or (ii) challenge the confidential nature of the
Protected Material and obtain a ruling under Paragraph IV that the information is not confidential
and may be disclosed in or on the public record.
VII. Remedies
If a Receiving Party violates this Protective Order by improperly disclosing or using
Protected Material, the Receiving Party shall take all necessary steps to remedy the improper
disclosure or use. This includes immediately notifying the MPSC, the presiding hearing officer,
and the Disclosing Party, in writing, of the identity of the person known or reasonably suspected
to have obtained the Protected Material. A Party or person that violates this Protective Order
remains subject to this paragraph regardless of whether the Disclosing Party could have discovered
the violation earlier than it was discovered. This paragraph applies to both inadvertent and

12
intentional violations. Nothing in this Protective Order limits the Disclosing Party’s rights and
remedies, at law or in equity, against a Party or person using Protected Material in a manner not
authorized by this Protective Order, including the right to obtain injunctive relief in a court of
competent jurisdiction to prevent violations of this Protective Order.
MICHIGAN ADMINISTRATIVE HEARING SYSTEM
For the Michigan Public Service Commission
________________________________________________
Administrative Law Judge

13
STATE OF MICHIGAN
BEFORE THE MICHIGAN PUBLIC SERVICE COMMISSION
In the matter of the application of )
DTE ELECTRIC COMPANY for )
authority to increase its rates, amend its )
rate schedules and rules governing the ) Case No. U-20836
distribution and supply of electric energy, )
and for miscellaneous accounting authority )
NONDISCLOSURE CERTIFICATE
By signing this Nondisclosure Certificate, I acknowledge that access to Protected Material
is provided to me under the terms and restrictions of the Protective Order issued in Case No. U-
20836, that I have been given a copy of and have read the Protective Order, and that I agree to be
bound by the terms of the Protective Order. I understand that the substance of the Protected
Material (as defined in the Protective Order), any notes from Protected Material, or any other form
of information that copies or discloses Protected Material, shall be maintained as confidential and
shall not be disclosed to anyone other than in accordance with the Protective Order.
Reviewing Representative
Date: ____________ __________________________________________
Title: ____________________________________
Representing: ______________________________
__________________________________________
Printed Name

STATE OF MICHIGAN
BEFORE THE MICHIGAN PUBLIC SERVICE COMMISSION
In the matter of the Application of ) DTE ELECTRIC COMPANY for ) authority to increase its rates, amend its ) rate schedules and rules governing the ) Case No. U-20836 distribution and supply of electric energy, ) and for miscellaneous accounting authority )
PROOF OF SERVICE
STATE OF MICHIGAN ) ) ss. COUNTY OF WAYNE )
ESTELLA R. BRANSON states that on January 21, 2022, she served a copy of DTE
Electric Company’s Application, Proposed Prehearing Notice, Proposed Protective Order, Proposed
Nondisclosure Certificates, Testimony and Exhibits, DTE Electric Company’s Part II – Financial
Information materials and Part III –Supplemental Data materials (are being provided via a secure
portal link) in the above captioned matter, via electronic mail and secure portal link, upon the
persons listed on the attached service list.
ESTELLA R. BRANSON

MPSC Case No. U-20836 Service List (U-20162 and U-20561 combined)
Page 1
ABATE Michael J. Pattwell Clark Hill PLC 212 E. Cesar E. Chavez Avenue Lansing, MI 48906 [email protected] Stephen A. Campbell Clark Hill PLC 500 Woodward Avenue Suite 3500 Detroit, MI 48226 [email protected] CHARGEPOINT, INC. Timothy J. Lundgren Potomac Law Group 120 N. Washington Square, Suite 300 Lansing, MI 48933 [email protected] CENTRAL TRANSPORT, LLC; CENTRAL TRANSPORT, INC.; CROWN ENTERPRISES, INC.; DETROIT INERNATIONAL BRIDGE COMPANY; UNIVERSAL TRUCKLOAD SERVICES INC. Sean P. Gallagher Gallagher Law 321 West Lake Lansing Road East Lansing, MI 48823 [email protected] CITIZENS UTILITY BOARD OF MICHIGAN John R Liskey Constance De Young Groh John R Liskey Attorney at Law 921 N. Washington Ave Lansing, MI 48906 [email protected] [email protected]
CITIZENS UTILITY BOARD OF MICHIGAN; SIERRA CLUB Christopher M. Bzdok Olson, Bzdok & Howard, P.C. 420 East Front Street Traverse City, MI 49686 [email protected] Michael Soules 1625 Massachusetts Ave. NW Suite 702 Washington, DC 20036 [email protected] ENVIRONMENTAL LAW AND POLICY CENTER/ECOLOGY CENTER/SOLAR ENERGY INDUSTRIES ASSOCIATION/VOTE SOLAR Margrethe Kearney 1514 Wealthy Street SE, Suite 256 Grand Rapids, MI 49506 [email protected] [email protected] Bradley Klein Nikhil Vijaykar Environmental Law & Policy Center 35 E. Wacker Drive, Suite 1600 Chicago, IL 60601 [email protected] [email protected] ENERGY MICHIGAN; FOUNDRY ASSOCIATION OF MICHIGAN Timothy J. Lundgren Laura Chappelle Potomac Law Group 120 N. Washington Square, Suite 300 Lansing, MI 48933 [email protected] [email protected]

MPSC Case No. U-20836 Service List (U-20162 and U-20561 combined)
Page 2
GREAT LAKES RENEWABLE ENERGY ASSOCIATION INC.; RESIDENTIAL CUSTOMER GROUP Don L. Keskey Brian W. Coyer University Office Place 333 Albert Avenue, Suite 425 East Lansing, MI 48823 [email protected] [email protected] THE KROGER CO. Kurt J. Boehm, Esq Jody Kyler Cohn, Esq Boehm, Kurtz & Lowry 36 East Seventh Street, Suite 1510 Cincinnati, OH 45202 [email protected] [email protected] MICHIGAN ATTORNEY GENERAL Joel King Assistant Attorney General ENRA Division 525 W. Ottawa Street, 6th Floor P.O. Box 30755 Lansing, Michigan 48909 [email protected] [email protected] MICHIGAN CABLE TELECOMMUNICATIONS ASSOC. Michael S. Ashton Shaina R. Reed Fraser Trebilcock Davis & Dunlap 124 West Allegan Street, Suite 1000 Lansing, MI 48933 [email protected] [email protected]
MICHIGAN ENVIRONMENTAL COUNCIL; NATURAL RESOURCES DEFENSE COUNCIL Christopher M. Bzdok Tracy J. Andrews Olson, Bzdok & Howard, P.C. 420 East Front Street Traverse City, MI 49686 [email protected] [email protected] [email protected] [email protected] [email protected] MICHIGAN ENERGY INNOVATION BUSINESS COUNCIL; INSTITUTE FOR ENERGY INNOVATION Laura Chappelle Potomac Law Group 120 N. Washington Square, Suite 300 Lansing, MI 48933 [email protected] MPSC STAFF Heather M.S. Durian Michael J. Orris Spencer A. Sattler Amit T. Singh Monica M. Stephens Daniel E. Sonneveldt 7109 West Saginaw Hwy, 3rd Floor Lansing, MI 48917 [email protected] [email protected] [email protected] [email protected] [email protected]

MPSC Case No. U-20836 Service List (U-20162 and U-20561 combined)
Page 3
SOULARDARITY Nicholas Leonard Executive Director Great Lakes Environmental Law Center 4444 Second Avenue Detroit, MI 48201 [email protected] Lydia Barbash-Riley Olson, Bzdok & Howard, P.C. 420 East Front Street Traverse City, MI 49686 [email protected] Mark Templeton Robert Weinstock Rebecca Boyd University of Chicago Law School Abrams Environmental Law Clinic 6020 South University Avenue Chicago, IL 60637 [email protected] [email protected] [email protected] UTILITY WORKERS LOCAL 223 John A. Canzano Ben King 423 N. Main Street, Suite 200 Royal Oak, MI 48067 [email protected] [email protected] WAL-MART Melissa M. Horne Higgins, Cavanagh & Cooney, LLP 10 Dorrance Street, Suite 400 Providence, RI 02903 [email protected]

STATE OF MICHIGAN
BEFORE THE MICHIGAN PUBLIC SERVICE COMMISSION
In the matter of the Application of )
DTE ELECTRIC COMPANY )
for authority to increase its rates, amend ) Case No. U-20836
its rate schedules and rules governing the )
distribution and supply of electric energy, and )
for miscellaneous accounting authority. )
QUALIFICATIONS
AND
DIRECT TESTIMONY
OF
ADELLA F. CROZIER

DTE ELECTRIC COMPANY
QUALIFICATIONS AND DIRECT TESTIMONY OF ADELLA F. CROZIER
Line
No.
AFC-1
Q1. What is your name, business address and by whom are you employed?1
My name is Adella F. Crozier (she/her/hers). My business address is One Energy 2
Plaza, Detroit, MI 48226. I am employed by DTE Energy Corporate Services LLC, 3
a subsidiary of DTE Energy Company (DTE Energy), within Regulatory Affairs as 4
a Director. 5
6
Q2. On whose behalf are you testifying? 7
I am testifying on behalf of DTE Electric Company (DTE Electric or Company). 8
9
Q3. What is your educational background? 10
I received a Bachelor of Science degree in Metallurgical Engineering from Iowa 11
State University and a Master of Business Administration degree from the 12
University of Chicago. I have also completed several Company sponsored courses 13
and attended various seminars to further my professional development. 14
15
Q4. What work experience do you have? 16
Prior to my employment at DTE Energy, I was employed by LTV Steel Company 17
(LTV) in various roles including Metallurgical and Quality Control Engineer in 18
positions of increasing responsibility for different product lines. My last role with 19
LTV was as Product Manager in the Sales and Marketing Department. In this role, 20
I had responsibility for managing the relationship between the Sales and Marketing 21
Department and one of LTV’s major plants. As part of my responsibilities, I ran 22
financial and engineering analyses related to product line offerings. 23
24
Q5. What has been your work experience at DTE Energy? 25

A. F. CROZIER
Line U-20836
No.
AFC-2
I joined DTE Energy in 2003 as a Technological Specialist in the Fossil Generation 1
Department’s Engineering Support Organization. In 2004, I was promoted to 2
Supervisor – Mechanics and Metallurgy. In 2005, I joined the Regulatory Affairs 3
Department as Manager of Special Projects. In this role, I assisted the 4
Environmental Affairs Department with their portions of Detroit Edison’s general 5
rate case filings and served as a member of several workgroups related to Governor 6
Granholm’s 21st Century Energy Plan and Capacity Need Forum. I helped with 7
the Company’s implementation of Michigan’s 2008 energy legislation, particularly 8
those areas related to energy optimization. I managed several Detroit Edison 9
energy optimization filings as well as provided witness testimony regarding the 10
revenue requirement of several energy optimization plans and reconciliations. 11
During this time, I also assisted the case managers of general rate cases. 12
13
I was promoted to Manager of Electric Regulatory Strategy in 2013 where my 14
responsibilities included research of regulatory matters. My team provided 15
management of DTE Electric’s general rate cases. 16
17
I was promoted to Director within Regulatory Affairs in 2016. In this role, my team 18
is currently responsible for managing the Company’s state filings and activities at 19
the Michigan Public Service Commission (MPSC or Commission). Members of my 20
team also provide various research activities pertinent to our electric utility and 21
provide cost of service and revenue requirement modeling. 22
23
Q6. Have you been involved in any prior regulatory proceedings? 24
Yes. I sponsored testimony in the following DTE Electric cases: 25

A. F. CROZIER
Line U-20836
No.
AFC-3
U-15806 Detroit Edison’s Energy Optimization (EO) Plan 1
U-15806 A Detroit Edison’s EO Amended Plan 2
U-16358 Detroit Edison’s 2009 EO Reconciliation 3
U-16359 Detroit Edison’s 2010 EO Reconciliation 4
U-16737 Detroit Edison’s 2011 EO Reconciliation 5
U-20561 DTE Electric 2019 Rate Case 6
U-18232 DTE Electric 2020 Renewable Energy Plan (REP) Amendment 7
U-18091 DTE Electric 2021 PURPA Avoided Costs 8

A. F. CROZIER
Line U-20836
No.
AFC-4
Purpose of Testimony 1
Q7. What is the purpose of your testimony?2
The purpose of my testimony is to: 3
• Provide an overview of the Company’s entire general electric rate case including 4
a summary of the drivers for filing this case at this time, the amount of the 5
Company’s projected revenue deficiency starting November 1, 2022, and a 6
summary of the impacts on the Company’s business from the novel coronavirus 7
(COVID-19) pandemic; 8
• Review the overall methodology used to develop the Company’s projected test 9
year amounts in this case; 10
• Address the following Company ratemaking and policy considerations which 11
are included in my testimony to propose unique or different ratemaking 12
treatments, respond to prior Commission orders, highlight noteworthy 13
regulatory issues, or address topics of interest expressed by stakeholders: 14
o Request for changes to the Commission approved ratemaking treatment 15
for tree trimming surge costs as well as the Company’s future 16
securitization of costs associated with the Company’s tree trimming 17
surge; 18
o Changes to the R10 production cost allocation methodology; 19
o Description and support for the corporate memberships included for 20
ratemaking as ordered in the Company’s last general rate case, U-20561; 21
o The Company’s proposed treatment of customer outage credits given the 22
Commission’s recently proposed revisions to the ruleset governing these 23
credits. 24
• Introduce the Company’s other witnesses. 25

A. F. CROZIER
Line U-20836
No.
AFC-5
1
Q8. Are you sponsoring any exhibits in this proceeding? 2
Yes. I am sponsoring the following exhibit: 3
Exhibit Schedule Description 4
A-27 Q1 Corporate Memberships 5
6
Q9. Was this exhibit prepared by you or under your direction? 7
Yes, it was. 8
9
Case Overview 10
Q10. Can you briefly describe DTE Electric? 11
Yes. DTE Electric generates, purchases, distributes, and sells electricity to 12
approximately 2.2 million customers in southeastern Michigan. The Company has 13
over 11,000 megawatts of generation capacity including, coal, wind, solar, nuclear, 14
hydroelectric pumped storage, and natural gas. DTE Electric delivers electricity to 15
its customers over approximately 31,000 miles of overhead distribution lines and 16
16,600 miles of underground distribution lines across a service territory that 17
encompasses 7,600 square miles. Founded in 1903, DTE Electric is the largest 18
electric utility in Michigan and one of the largest in the nation. 19
20
Q11. What is DTE Electric’s overall business objective? 21
DTE Electric’s overall business objective is to provide safe, reliable, clean, and 22
cost-effective electric service to its customers and deliver reasonable and 23
appropriate compensatory returns to DTE Energy shareholders while maintaining 24
its financial health. Providing safe, reliable, and cost-effective service to its 25
A. F. CROZIER
Line U-20836
No.
AFC-6
customers means that DTE Electric: 1) provides quality customer service, 2) 1
operates its system safely, and 3) delivers electric service reliably at a reasonable 2
cost. 3
4
Q12. How do the requests in this general rate case filing support DTE Electric’s 5
overall business objectives? 6
This rate case represents a major commitment to reliability and innovation. The 7
Company is seeking approval of significant infrastructure investments to improve 8
the reliability and resilience of its electric distribution system as detailed in its 9
recent Distribution Grid Plan filed in Case No. U-20147. This involves redesigning 10
and rebuilding antiquated infrastructure, modernizing how the electric grid is 11
monitored and operated, and performing preventive and proactive maintenance and 12
tree trimming at standards that reflect today’s operating conditions, including 13
increased system hardening to withstand more extreme weather. These investments 14
will not only reduce how often and how long customers experience power outages 15
but will also enable the Company to support greater optionality for customers in 16
adopting new technologies such as batteries, solar, and electric vehicles (EVs). 17
18
To support innovation during this period of transformational change in the energy 19
industry, the Company is also proposing new technology deployments, including 20
enhanced information technology capabilities to improve the customer experience; 21
energy storage in the form of batteries and green hydrogen; non-wires alternatives; 22
and expanded programs to support deployment of EV and volt-var 23
optimization/conservation voltage reduction. The generation fleet is expanding to 24
cleaner resources with the expected start-up of the Company’s new natural gas plant, 25

A. F. CROZIER
Line U-20836
No.
AFC-7
Blue Water Energy Center (BWEC), in the second quarter of 2022 and continuing 1
the retirement of our Tier 2 coal fleet. DTE Electric has retired four of its coal-fired 2
facilities (Marysville, Harbor Beach, Conners Creek and River Rouge) and plans to 3
retire two of its four remaining coal plants – St. Clair and Trenton Channel – in 4
2022. 5
6
Q13. Why has DTE Electric filed this general rate case at this time? 7
The Company carefully considered several factors before determining the need to 8
file this general electric rate case. Our customers expect and deserve safe and 9
reliable service. As discussed above, DTE Electric is implementing a major capital 10
investment program to improve reliability and resilience, most notably for the 11
distribution system. However, the Company’s existing rates and projected 12
electricity sales cannot sustain this level of infrastructure investment without a rate 13
increase. The only way that DTE Electric can adequately provide the required 14
service levels that our customers desire and deserve is by being financially healthy. 15
The Company’s current authorized rates are not expected to provide DTE Electric 16
with adequate revenues to make necessary infrastructure investments while 17
providing a reasonable opportunity to earn a fair return on equity beginning in 18
November 2022. 19
20
Q14. What are the measures used to determine the Company’s financial health? 21
Maintaining DTE Electric’s financial health requires that the Company has a 22
reasonable opportunity to earn its cost of capital, that the Company has a well-23
balanced capitalization (no less than 50% equity to total permanent capitalization), 24
and that the Company is able to maintain its A/Aa3/A+ credit ratings for senior 25

A. F. CROZIER
Line U-20836
No.
AFC-8
secured debt from the three major rating agencies. These preconditions are 1
necessary to ensure DTE Electric has full access to capital markets at reasonable 2
rates, terms and conditions regardless of business cycle timing or industry 3
conditions. As discussed by Company Witness Mr. Lepczyk, without full access 4
to capital markets at reasonable terms and conditions, the cost of providing utility 5
services can increase significantly. 6
7
Q15. Why is the Company’s financial health important for customers? 8
To attract the capital necessary for the prudent operation and maintenance of our 9
facilities, the Company must be able to demonstrate its ongoing financial health. 10
Inadequate rates will ultimately result in higher financing costs and have a 11
significant negative impact on our ability to adequately serve our customers and 12
maintain the integrity of our electric distribution and generation assets. This 13
negative impact will occur because more dollars are required to support our 14
financing costs, and therefore, are not available for system maintenance or customer 15
service. Similarly, inadequate funding for capital and maintenance programs, over 16
time, will result in the deterioration of DTE Electric’s generation and distribution 17
infrastructure, ultimately resulting in reduced system reliability and service quality. 18
19
Thus, it is essential to DTE Electric’s financial health that the ultimate cost that 20
customers are asked to pay for Company services generates sufficient cash flow 21
from operations to fund the necessary capital expenditures to improve service and 22
pay a reasonable dividend. 23
24

A. F. CROZIER
Line U-20836
No.
AFC-9
Q16. Do the financial stability of DTE Electric and its continued implementation of 1
infrastructure maintenance and investment programs provide additional 2
benefits to customers and the region? 3
Yes. DTE Electric has an important positive economic impact on the communities 4
it serves. DTE Electric is one of the largest employers in Southeast Michigan with 5
over 4,800 employees. Through the Pure Michigan Business Connect campaign, 6
the Company utilizes the services of numerous local contractors and vendors. DTE 7
Energy spent over $2 billion with Michigan based companies in 2020. Through 8
property taxes, DTE Electric contributes to the financial health of local 9
communities. In the historical test year, DTE Electric paid approximately $250 10
million in property taxes to Michigan communities. To maintain facilities, comply 11
with various regulations, implement our Distribution Grid Plan, and continue the 12
transformation of our generation fleet, DTE Electric continues to make major 13
capital investments in the communities in which it serves and operates. Thus, DTE 14
Electric supports additional job growth opportunities and provides incremental tax 15
revenue for our local communities. 16
17
COVID-19 18
Q17. In what ways did the Company support and protect both customers and 19
employees in response to COVID-19? 20
DTE Electric undertook many actions to safeguard its customers and employees 21
during the COVID-19 crisis. In the initial months of the pandemic, DTE Electric 22
suspended disconnections for Michigan’s most vulnerable populations, low-23
income and senior customers, and waived late fees for eligible low-income 24
customers receiving energy assistance. In addition, the Company waived deposits 25

A. F. CROZIER
Line U-20836
No.
AFC-10
and reconnection fees for low-income customers, seniors, and those experiencing 1
COVID-19 related financial hardship and seeking restoration of electric service. 2
DTE Electric extended access to and provided greater flexibility of payment plans 3
to customers financially impacted by COVID-19 as well as provided customer 4
assistance personnel with the resources necessary to connect customers to available 5
financial assistance and social service agencies. The customer service programs 6
that were devised and implemented in response to the pandemic are discussed in 7
Company Witness Ms. Johnson’s testimony. The Company also delayed the filing 8
of this general rate case to prevent base rate increases, which I discuss later in my 9
testimony. 10
11
The Company also took action to keep its employees safe for their own sake, their 12
family’s sake, and for the 2.2 million customers that relay upon our product. The 13
continued safe and reliable operation of our generation facilities and distribution 14
grid depends on the health and safety of our employees. The Company initiated new 15
personal protective equipment (PPE) requirements; sequestered select employees to 16
ensure their availability for the safe and reliable operation of our systems; and 17
increased health screening and safety operations to screen employees and 18
contractors. Throughout the pandemic, DTE Electric has remained committed to 19
keeping employees safe and employed. 20
21
Q18. Generally, what impact has the COVID-19 pandemic had on the Company in 22
terms of electricity sales? 23
Electricity sales changed considerably due to the COVID-19 pandemic and since 24
the Company filed its last rate case in 2019. In this instant case, the Company 25

A. F. CROZIER
Line U-20836
No.
AFC-11
shows an overall improving sales trend from its historical year of 2020 to the 1
projected test period which ends in October 2023. Of course, 2020 was very 2
turbulent due to the start of the COVID-19 pandemic. Though the overall 3
electricity sales trajectory has been an improving one, it remains difficult to project 4
how the COVID pandemic will impact the projected test year in this case. The 5
lingering economic uncertainties impact our sales forecasts. As discussed in 6
Company Witness Mr. Leuker’s testimony, since March 2020, mitigation strategies 7
to reduce the spread of COVID-19, including many individuals working at home, 8
have caused a shift in electricity consumption throughout DTE Electric’s service 9
territory. In general, these mitigation strategies had an inverse effect on Residential 10
and C&I sales (that is, residential sales higher with declines in commercial and 11
industrial sales). The potential ongoing impacts of COVID-19 are factored into 12
Witness Leuker’s forecast as are the needed adjustments to the Company’s 13
forecasting methods. 14
15
Requested Relief 16
Q19. What rate relief was approved in the Commission’s Order in the Company’s 17
last rate case, Case No. U-20561? 18
The Company’s last general rate case, Case No. U-20561, was filed in July 2019 19
requesting $351 million in rate relief. In the Commission’s May 8, 2020 Order, 20
DTE Electric received approval for $188 million in rate relief. 21
22
Q20. What actions has DTE Electric taken to delay this request for additional rate 23
relief? 24

A. F. CROZIER
Line U-20836
No.
AFC-12
The Company is aware of the impact that utility rate changes have on our 1
customers, especially considering the COVID-19 pandemic. In consideration for 2
the impacts to customer affordability during these unprecedented times, the 3
Company made three separate accounting requests1 from June 2020 through 4
February 2021 that would assist the Company and its customers in managing costs. 5
These requests were approved by the Commission and have allowed the Company 6
to continue its investment in infrastructure and maintenance programs while 7
delaying the filing of an application for new base rates. Specifically, the application 8
was delayed from July 2020 until the filing of this instant case which is nearly two 9
and a half years since the Company’s last general rate case filing in July 2019. 10
11
Q21. What rate relief is DTE Electric requesting in this case? 12
As Company Witness Mr. Vangilder summarizes, DTE Electric expects a revenue 13
shortfall of $388.2 million for the November 1, 2022 through October 31, 2023 14
projected test year. The key factors contributing to this shortfall are the revenue 15
requirement associated with increased investments made in plant and the associated 16
depreciation and property tax increases. O&M expenses have increased only 17
moderately from the historical test period, primarily as a result of the inflation 18
projected at the time of this filing. 19
20
Q22. Can you highlight some of the major investments and expenses included in the 21
Company’s request for rate relief? 22
1 Case No. U-20835 filed on June 9, 2020 and approved on July 9, 2020; Case No. U-20921 filed on
October 26, 2020 and approved on December 9, 2020; and Case No U-20835 filed on February 26, 2021
and approved on April 8, 2021
A. F. CROZIER
Line U-20836
No.
AFC-13
This rate case sets forth the rationale, spending, timing, and expected customer 1
benefits associated with significant investments in distribution, generation, and 2
customer service. Several programs to highlight are summarized below. 3
• Strategic infrastructure investments in substations, poles, wires, 4
transformers and other electric distribution assets to modernize equipment, 5
support growth in customer demand in specific areas, improve worker and 6
public safety, and reduce the frequency and duration of power outages. This 7
includes the 4.8 kV hardening, pole top maintenance program, and increased 8
investment in distribution automation and telecommunications technologies. 9
• Continuation of the multi-year tree trimming “surge” program that reduces 10
outages on circuits trimmed to the new, more protective standard during the 11
first year after being trimmed. The continuation of the Commission-12
approved tree trimming program through the test year, combined with the 13
recent $70 million contribution2 by DTE Electric (an amount that is not 14
included in this rate case), may provide the Company with an opportunity to 15
accelerate the program’s completion. This program remains critical to 16
improving reliability and resilience across the system and will be 17
foundational to the Company’s overall efforts to improve reliability. 18
• Construction of the Blue Water Energy Center, a highly efficient combined 19
cycle natural gas plant that will ensure grid reliability and resource adequacy 20
with the closure of three coal plants – Trenton Channel, River Rouge, and 21
St. Clair. This is an important component of the Company’s journey to net 22
zero carbon emissions. The Company was granted a certificate of necessity 23
2 U-21128 filed August 31, 2021 with Commission order November 4, 2021.

A. F. CROZIER
Line U-20836
No.
AFC-14
for this plant on April 27, 2019 in Case No. U-18419 and expects to place 1
the plant into commercial operation by June 2022. 2
3
Q23. What investments is the Company making to promote greater levels of 4
advanced technology across its businesses? 5
The Company believes a diverse set of energy storage applications will be needed 6
to support the reliability and resilience of a decarbonized electric grid. The 7
Company proposes several energy storage pilot programs to test different use cases 8
and applications in this rate case. As the Company transforms its generation and 9
distribution systems, it is essential for the Company to gain first-hand experience 10
with different energy storage applications to shape its long-term operations. 11
12
In this case, DTE Electric presents several pilots that will allow the Company to 13
learn more about energy storage use within our generation fleet, distribution system 14
and in conjunction with customer sited batteries. Among these pilots are 15
investments in different technology applications, including 1) green hydrogen 16
storage at the new Blue Water Energy Center; 2) grid-scale battery applications to 17
replace retiring peaking generation; 3) storage for addressing certain substation 18
overloads; 4) residential sited batteries that can be used for back-up power; and 5) 19
customer sited batteries to reduce peak demand. Company Witnesses Mr. Morren, 20
Ms. Pfeuffer, Mr. Burns, and Mr. Farrell support these pilots in their testimonies. 21
Piloting these technologies and use cases under the energy technologies and 22
programs pilot framework, set forth by the Commission Order in Case No. U-20645 23
on February 4, 2021 order, will provide important learnings and position the 24

A. F. CROZIER
Line U-20836
No.
AFC-15
Company to better manage future deployment of battery and other storage 1
applications on DTE Electric’s distribution system. 2
3
Q24. Are there other projects included in the case that provide examples of the 4
Company’s commitment to improving its use of technology? 5
Other examples of the Company’s commitment to improving its use of technology 6
are briefly described below: 7
• Completion of the new system operations center and installation of 8
additional distribution system monitoring and controls to modernize system 9
operations, will continue to improve the speed and effectiveness of storm 10
responses as well as enable the integration of new technologies such as 11
electric vehicles and distributed solar generation. 12
• With the success and momentum of the current Charging Forward and eFleet 13
pilots, the Company is proposing the extension of pilot elements and the 14
introduction of new elements. Establishing various pilots, incentives, and 15
ownership models now will allow DTE to develop full-scale programs later 16
that enable widespread EV adoption at a reasonable cost to customers. 17
• As outlined in the Company’s information technology (IT) plans, the 18
customer IT portfolio of investments prioritizes the enhancement of 19
customer experiences across the move-in/move-out, billing, payment, 20
collection and outage journeys. The plans also outline how significantly 21
higher level of IT investments are being made to not only support the 22
sustainment of the IT organization and update the current core systems that 23
are critical to operations, but also to advance and enhance new business 24
capabilities. 25

A. F. CROZIER
Line U-20836
No.
AFC-16
1
Rate Case Methodology 2
Q25. What approach is the Company using to support its projected test year 3
positions and its recommendations in this case? 4
DTE Electric has used actual historical data as the point of departure for most 5
estimated cost levels for the projected test year. These historical costs were then 6
adjusted for the impact of inflation. As has been DTE Electric’s practice in prior 7
cases, certain other costs reflect specific estimates or projections where general 8
impacts of inflation alone would not be appropriate. For example, some of these 9
include, but are not limited to, capital expenditures for new plant, uncollectible 10
expense, and storm expense. All these cost components and the circumstances 11
involved are explained and supported by other Company witnesses. 12
13
Q26. What historical and projected test year periods are being used by DTE Electric 14
for purposes of calculating its projected revenue deficiency? 15
The historical test year used by DTE Electric is the calendar year ended December 16
31, 2020. This 12-month period was then normalized and adjusted for known and 17
measurable changes, as supported by the Company’s witnesses in this case, to 18
arrive at the Company’s November 1, 2022 through October 31, 2023 projected test 19
year. 20
21
Tree Trimming Surge 22
Q27. What has the Commission previously approved for tree trim funding in the 23
Company’s recent rate cases? 24

A. F. CROZIER
Line U-20836
No.
AFC-17
In the Company’s two most recent general electric rate cases (Case No. U-20162 1
and Case No. U-20561), the Commission approved the deferral of “surge” amounts 2
for the Company’s tree trimming program. These “surge” amounts represent an 3
increase in annual funding above the baseline tree trimming O&M and will help 4
the Company achieve a five-year trim cycle for its distribution system. On May 2, 5
2019 in U-20162, the Commission approved the deferral of “surge” amounts of 6
$43.3 million for 2019, $74.1 million for 2020, and $70.5 million for 2021. In the 7
Company’s most recent general rate case, U-20561, the Commission approved 8
$58.2 million of “surge” funding for 2022. As discussed in detail by Company 9
Witness Ms. Hartwick, this “surge” in tree trimming spending will occur over an 10
approximately seven-year period. At the program’s termination, the Company 11
expects to maintain a steady-state five-year cycle of tree trimming on its 12
distribution circuits. 13
14
Q28. Has the Company made any additional requests of the Commission related to 15
tree trimming since the last rate case (Case No. U-20561)? 16
Yes. The Company filed an application with the Commission on August 31, 2021 17
in Case No. U-21128 requesting ex-parte approval to defer a minimum of $70 18
million collected in 2021 associated with unexpected electricity usage patterns 19
caused by the pandemic. The Company’s request sought approval to invest the 20
funds in additional tree trim efforts without seeking future cost recovery. The 21
increased spending would occur through 2023 and any amounts not spent by that 22
time will be refunded to customers. After seeking comments from interested 23
stakeholders, the Commission approved the application on November 4, 2021. 24
25

A. F. CROZIER
Line U-20836
No.
AFC-18
Q29. Does the approval of the Company’s application in U-21128 to defer a 1
minimum of $70 million allow the Company to complete the surge sooner than 2
initially projected? 3
In the initial program design, the surge was designed to end in 2025 and to place 4
the Company on a five-year trim cycle starting in 2026. The Company is now 5
targeting completion of the surge in 2024 if the resources necessary to perform the 6
program work are available. Details are included in Witness Hartwick’s testimony. 7
8
Q30. Does approval of the Company’s $70 million regulatory liability in Case No. 9
U-21128 impact the revenue requirement being requested in this case? 10
No, it does not. However, if the Company is successful in its increased tree 11
trimming efforts, it may reduce the deferred surge amounts required in the period 12
beyond the projected test year, though this will be influenced by the ability to attract 13
tree trimming resources at a cost level consistent with the company’s past estimates; 14
based on high demand for tree trimmers, especially in California, the costs of these 15
resources may be higher than prior forecasts. 16
17
Q31. Are you requesting that the Commission approve additional years of Tree 18
Trim Surge deferrals in this case? 19
Yes. As stated above, the Commission approved tree trim surge funding through 20
2022. To continue the Tree Trim Surge program, the Company is requesting that 21
the Commission approve a surge funding deferral of $67 million for calendar year 22
2023 and $52.7 million for calendar year 2024. This would allow the Company to 23
continue planning work, secure tree trimming contractors and grow the local 24
workforce. The approval helps provide contractors a greater level of work certainty 25

A. F. CROZIER
Line U-20836
No.
AFC-19
and continuity which in turn assists the Company in acquiring and retaining the 1
necessary resources to prevent interruption of the Tree Trim program. Witness 2
Hartwick supports the request in her testimony. 3
4
Q32. What other parameters did the Commission specify related to the deferral of 5
the tree trimming surge amounts in previous orders? 6
In the Case U-20162 May 2, 2019 Order, the Commission specified that the return 7
earned on the Tree Trim Surge regulatory asset for the 2019, 2020, and 2021 8
deferrals would accrue at the short-term debt rate of 3.56% authorized by the 9
Commission in its order. Lastly, the Commission stated that the Company may 10
seek recovery of the regulatory asset in a future rate case or through securitization. 11
12
Q33. In Case Nos. U-20162 and U-20561, the Company discussed its plans to seek 13
securitization of the regulatory asset once it reached approximately $100 14
million. Has the Company sought the securitization of any of the deferred tree 15
trimming assets yet? 16
Yes. In Case No. U-21015, the Company requested securitization of $116.2 million 17
of its tree trim deferred asset balance through June 30, 2021. The requested amount 18
represented the total qualified assets of $156.9 million ($43.3 million in 2019, $74.1 19
million in 2020, and $38.3 million through June 30, 2021, plus interest of $1.2 20
million) net of deferred federal income tax charges (DFIT) of $43.3 million. The 21
Commission approved the securitization of and recovery up to the total qualified 22
costs of $156.9 million inclusive of DFIT. Additionally, the Commission required 23
the proceeds from the securitization be used to retire both permanent debt and 24
equity for the tree trim surge regulatory asset. Company Witness Ms. Uzenski 25

A. F. CROZIER
Line U-20836
No.
AFC-20
explains the elimination of the securitized Tree Trim Surge regulatory asset and the 1
related capitalization. 2
3
Q34. How has the Company treated the tree trim surge regulatory asset in this 4
general rate case filing? 5
Though the Company previously, as ordered by the Commission, has included a 6
return on the Tree Trim Surge regulatory asset at the short-term cost of debt 7
approved by the Commission in the Company’s 2019 rate case (Case No. 20162), 8
the Company is requesting a change in the “return on” rate it applies to the tree trim 9
surge regulatory asset balance going forward. As I mentioned above, the 10
Commission’s Order in the U-21015 securitization filing required the proceeds 11
from the securitization be used to retire both permanent debt and equity for the Tree 12
Trim Surge regulatory asset. Consistent with that determination, the Company 13
should be allowed to recover its actual financing cost in a commensurate manner. 14
Witness Lepczyk supports the use of permanent debt and equity to calculate the 15
return on the Tree Trim Surge regulatory asset. The Company has never amortized 16
any of the tree trim deferred asset balance and is not proposing to do so in this case. 17
The revenue requirement for the deferred amount is calculated by Company 18
Witness Vangilder on Exhibit A-11, Schedule A1.1 using permanent capital 19
supported in this case by Witness Lepczyk. 20
21
Q35. When does the Company anticipate making its next securitization filing? 22
The Company previously anticipated securitizing surge expenses in tranches of 23
approximately $100 million. However, similar to the recent securitization filing in 24
U-21128, the Company will likely file for securitization authorization once the 25

A. F. CROZIER
Line U-20836
No.
AFC-21
balance reaches approximately $150 million. The upfront cost associated with 1
securitization bonds is largely fixed. As such, the larger tree trimming deferred 2
asset balance allows the Company to lower the overall cost of securitization by 3
potentially reducing the number of bond offerings. The Company has determined 4
that waiting until a larger deferred balance accumulates before securitizing more 5
efficiently spreads the fixed costs and reduces overall securitization costs to 6
customers. 7
8
Q36. When does the Company anticipate reaching $150 million of surge expenses? 9
The Company anticipates that surge expenses will again reach $150 million in late 10
2023 and anticipates seeking securitization at that time. 11
12
R10 production cost allocation methodology 13
Q37. Is the Company proposing any changes to Rider 10 in this proceeding? 14
Yes. The Rider 10 pricing structure is unique in that these customers have an 15
interruptible service for which the Company’s R10 class is designated as a capacity 16
resource within the MISO Resource Adequacy Construct (unlike non-interruptible 17
customers) and have a significant portion of their power supply rate based on the 18
real time MISO locational hourly marginal energy price. Therefore, it is reasonable 19
that the Rider 10 class cost responsibility for power supply should be different than 20
other customer classes. I have instructed Company Witness Ms. Asghar to provide 21
a 50% credit to the Rider 10 class contribution to Allocation Schedule 100 (Power 22
Plant Energy Production). This credit will reduce the R10 class power supply cost 23
responsibility and thereby reduce the R10 Administrative Charge calculated by 24
Company Witness Mr. Willis. 25

A. F. CROZIER
Line U-20836
No.
AFC-22
1
Corporate Memberships 2
Q38. How does the Company determine which corporate memberships to acquire? 3
The Company acquires and maintains corporate memberships that help in our 4
mission to provide safe, affordable, and reliable energy. Decisions regarding which 5
memberships to obtain are typically made by individual business units. A list of 6
the corporate memberships included in DTE Electric’s O&M expense are shown 7
on Exhibit A-27, Schedule Q1. As shown in this Exhibit, each membership 8
generally falls under the auspices of one business unit. 9
10
Q39. Do any of the membership costs associated with organizations listed on Exhibit 11
A-27, Schedule Q1 involve lobbying activities? 12
No. Any memberships, or portions of memberships, related to lobbying activities 13
are excluded from DTE Electric’s revenue requirement. Witness Uzenski supports 14
how certain memberships and certain membership costs have been excluded. 15
16
Q40. What benefits does the Company receive from DTE Electric’s memberships in 17
the organizations listed on Exhibit A-27, Schedule Q1? 18
The benefits the Company receives from the memberships listed in Exhibit A-27, 19
Schedule Q1 pages 3 through 5 generally fit into one or more of the following broad 20
categories: 21
• Benchmarking - helps the Company understand how its performance and 22
practices compare to its peers, 23
• Best practices - provides insights into industry best practices and potential 24
opportunities for implementation based on those insights., 25

A. F. CROZIER
Line U-20836
No.
AFC-23
• Research - performs research that the Company would otherwise have to 1
perform on its own, and leads to access to information at a lower cost than 2
if each member organization performed the research on their own 3
• Networking – helps build relationships with peers that improves the flow of 4
communication between people and companies leading to a greater 5
awareness of industry trends, emerging technologies, emerging issues, and 6
resources 7
8
As mentioned above, some of the memberships are a nondiscretionary cost of doing 9
business. These are also noted in Exhibit A-27, Schedule Q1 on pages 1 and 2. 10
11
Customer Outage Credits 12
Q41. Has the Company changed how it treats customer outage credits for 13
ratemaking purposes in this case? 14
Yes. In prior rate cases, the Company included the payment of outage credits as an 15
O&M expense. The amounts included for recovery represented the customer 16
outage credits paid in the historical test year adjusted for inflation. In this general 17
rate case, I have instructed Witness Uzenski to remove any payments for customer 18
outage credits. 19
20
Q42. What rules are the Company’s current practices for customer outage bill 21
credits based on? 22
The Company’s practices are consistent with the rules 460.744–747 established by 23
the Commission in the Service Quality and Reliability Standards. 24
25

A. F. CROZIER
Line U-20836
No.
AFC-24
Q43. Have any changes to these rules been contemplated by the Commission? 1
Starting in late 2019, the Commission Staff began holding collaborative meetings 2
with electric utilities, industry experts, and other stakeholders to solicit input on 3
updating the utility standards for safe and reliable electric service in Michigan. The 4
Company participated in these collaborative meetings and offered its insights 5
throughout the process while also learning from the expertise of other participants. 6
Currently, the Commission’s proposed changes to the Service Quality and 7
Reliability Standards informed by this collaborative effort are in the final stages of 8
approval. 9
10
Q44. Why has the Company excluded customer outage credit expenses from this 11
rate request? 12
The expense amounts the Company has collected in the past for customer outage 13
credits reflected practices that have been in place for many years. Part of those 14
practices involved paying customer outage credits only when an impacted customer 15
requested payment. During collaborative discussions, it became obvious that past 16
practices would change based on the feedback from MPSC Staff. One of those 17
changes, as reflected in the current draft of the service quality and reliability 18
standards, is that electric utilities will be required to provide the credit automatically 19
to the customer. 20
21
In anticipation of that change, the Company is preparing for the automatic payment 22
of the customer outage credits and is also using this change in the Commission rules 23
to propose a different treatment for recovery of those credits. Once the rules are 24

A. F. CROZIER
Line U-20836
No.
AFC-25
final, the Company will be prepared to provide the credits automatically under the 1
new criteria established. 2
3
Q45. What is the Company proposing for recovery of customer outage credits going 4
forward? 5
The Company is proposing to defer for subsequent recovery, the costs of the 6
customer outage credits that it pays starting with the final order in this case. With 7
the Commission’s approval, the Company will defer the costs only for those 8
customer outage credits due to outages shown not to be the company’s 9
responsibility. Examples of outages outside the companies control are trees falling 10
from outside of the right of way; public interference, such as a vehicle damaging a 11
pole and causing a service interruption; damage caused by animals, or outages 12
caused by the transmission system operator. Those deferred amounts would be 13
reviewed for reasonableness and prudency in the subsequent general electric rate 14
case. Only after the deferred amounts are approved would the Company begin 15
amortizing and recovering them. Witness Uzenski describes the deferral 16
mechanism including the amortization period in her testimony. 17
18
Q46. Is the Company making any supporting proposals related to customer outage 19
credits? 20
Yes. Those outages caused by a customer’s failure to keep the service line and the 21
customer’s service entrance cable to the meter box free of hazards, including 22
vegetation, will be considered as beyond the Company’s control. As a result, any 23
outage credits paid for these types of underlying reasons will be deferred for 24
potential recovery by the Company. I have instructed Witness Willis to make 25

A. F. CROZIER
Line U-20836
No.
AFC-26
changes to the Company’s tariff related to customer responsibility, C5.3A. The 1
change is intended to provide increased clarity regarding the customer’s 2
responsibility for ensuring their service line and service entrance cable are clear of 3
interference. 4
5
Introduction of Other Witnesses 6
Q47. How will the Company present evidence in support of its requested relief in 7
this case? 8
The Company will present its case through 31 witnesses, including myself, as 9
described below (in alphabetical order). 10
1) Ms. Maheen Asghar, Principal Financial Analyst – Load Research and Pricing, 11
supports and justifies the November 2022/October 2023 forecast allocation 12
schedules and the methodology DTE Electric used to include the demand 13
associated with the electric choice loads in forecast distribution allocation 14
schedules. 15
16
2) Mr. Robert A. Bellini, Manager – Community Lighting, supports the energy 17
forecast for outdoor lighting; the development of the proposed rate design for 18
the outdoor lighting rate schedules (municipal lighting and other) as well as 19
supports the reasonableness of the historic and projected Community Lighting 20
O&M and the Community Lighting capital expenditures. 21
22
3) Mr. Shawn D. Burgdorf, Manager of the Power Supply Strategy & Modeling – 23
Generation Optimization, establishes the projected wholesale market energy 24
sales revenue net of fuel including the reconciliation of 2020. He also provides 25
A. F. CROZIER
Line U-20836
No.
AFC-27
an overview of 1) the MISO resource adequacy requirements and capacity 1
market, 2) the capacity import limitation (CIL) enforced by MISO in the 2
Planning Resource Auction (PRA) and its impact on Zone 7, which includes 3
DTE Electric’s service territory, 3) the MISO Zone 7 capacity position for 4
Planning Year 2020/2021 and 2021/2022 as well as forecasted capacity 5
positions for Planning Years 2025/26 and 4) the Commission ordered Net 6
Present Value Revenue Requirement (NPVRR) or economic evaluation analysis 7
completed on the Belle River Power Plant. 8
9
4) Mr. Benjamin J. H. Burns, Director - Electric Regulated Marketing, provides an 10
update on DTE Electric’s approved electric vehicle (EV) program cost 11
projections, introduces a Residential Batteries pilot and the associated costs, 12
explains certain expenditures related to the Advanced Customer Pricing Pilot 13
(“ACPP”) regulatory asset, explains the 2023 full Time-of-Use (“TOU”) roll out 14
outreach and associated costs, as well as provides support for the Electric 15
Regulated Marketing O&M expense and merchant fee expense. 16
17
5) Mr. Michael S. Cooper, Director - Compensation, Benefits & Wellness, presents 18
an overview of benefit expense for DTE Electric for the 2020 historical test 19
period and the November 1, 2022 through October 31, 2023 projected test 20
period. He supports the Company’s pension costs, other post-employment 21
benefits (OPEB) costs, active employee health care and other employee benefits 22
costs; discusses potential future COVID-19 related expense; provides an 23
overview of the Company’s compensation philosophy for non-represented 24
employees and the role that the Company’s incentive plans play in the overall 25

A. F. CROZIER
Line U-20836
No.
AFC-28
reasonableness of its total compensation; provides an analysis of the 1
reasonableness of the current total compensation levels; describes the 2
components of the Company’s short and long-term incentive plans and supports 3
the inclusion of such costs in the Company’s revenue requirement, exclusive of 4
the costs related to DTE Energy’s top five executives. In addition, Witness 5
Cooper demonstrates that the quantifiable customer benefits of the Company’s 6
incentive plans exceed the expense, as required by the Commission’s 7
traditionally mandated cost/benefit analysis of incentive compensation expense. 8
9
6) Mr. Jeffery C. Davis, Manager – Nuclear Strategy and Business Support, 10
supports the Company’s actual nuclear O&M and capital expenditures for the 11
12-month historical test period ended December 31, 2020. He also discusses and 12
supports the reasonableness of the projected nuclear O&M and capital 13
expenditures for the interim forecast period and the 12-month projected test 14
period ending October 31, 2023. In addition, he supports the reasonableness of 15
the projected Nuclear Surcharge for the projected test period ending October 31, 16
2023. 17
18
7) Ms. Morgan Elliot-Andahazy, Director - Advanced Distribution Management 19
Systems, describes the Company’s approach to implement an Advanced 20
Distribution Management System (ADMS) to improve DTE Electric’s ability to 21
monitor and control its electric distribution grid. In addition, she addresses the 22
capital expenditures and justification for the new Electric System Operations 23
Center (ESOC) and the Alternate System Operations Center (ASOC). 24
25

A. F. CROZIER
Line U-20836
No.
AFC-29
8) Mr. Keegan Farrell, Manager - Demand Response (DR), discusses the 1
development of DR efforts that DTE Electric is conducting and provides support 2
for the expenditures and activities associated with the continuation of existing 3
programs and pilots, as well as the Company’s proposals for new pilots. In 4
addition, he discusses proposed changes to DR tariff language and customer 5
penalty revenues from underperformance during DR events. 6
7
9) Mr. Neal T. Foley, Director - Regulatory Affairs, discusses the Company’s 8
overall approach to rate design and the key components of new tariffs and tariff 9
changes that the Company is proposing. 10
11
10) Ms. Shannen M. Hartwick, Director - Tree Trim, discusses the Company’s tree 12
trimming program including the 2020 historic period expense as well as the 13
expense for the projected test year. She also supports funding for a tree trim 14
surge program that will enable the Company to deliver the reliability goals 15
established in its Five-Year Plan. 16
17
11) Ms. Tamara D. Johnson, Director – Revenue Management & Protection, 18
supports the details of the Company’s Low-Income programs and provides 19
explanation and support for the uncollectible expense including a discussion of 20
the impacts on that expense as a result of the COVID-19 pandemic. She proposes 21
changes to the DTE Electric Company Rate Book. She also discusses details of 22
our Low-Income Assistance credits and their impact with the Low-Income Self 23
Sufficiency Program. 24
25

A. F. CROZIER
Line U-20836
No.
AFC-30
12) Mr. Thomas W. Lacey, Principal Financial Analyst – Revenue Requirements 1
Department, supports the revenue requirements by plant/unit study (Plant Study) 2
filed in compliance with the Commission’s May 8, 2020 Order in DTE Electric’s 3
last general rate case (Case No. U-20561). 4
5
13) Mr. Robert J. Lee, Manager - Environmental Strategy, describes the status of 6
two significant Environmental Protection Agency (EPA) regulations, the Steam 7
Electric Effluent Limitation Guidelines (ELG) Rule and the Coal Combustion 8
Residuals (CCR) Rule. 9
10
14) Mr. Timothy J. Lepczyk, Assistant Treasurer and Director – Corporate Finance, 11
supports DTE Electric’s projected capital structure and the cost of its long and 12
short-term debt to be used in the determination of DTE Electric’s overall rate of 13
return in this proceeding. 14
15
15) Mr. Markus B. Leuker, Manager – Corporate Energy Forecasting, provides the 16
Company’s current electric sales, maximum demand, and system output forecast 17
for the period 2021-2026, including the projected 12-month test period 18
November 2022 through October 2023. He discusses the outlook for the 19
national and local economy which is the basis of the forecast. Witness Leuker 20
also describes how the forecast of electric sales, maximum demand and system 21
output is developed and supports the reasonableness of the electric sales forecast 22
used by DTE Electric in this proceeding. 23
24
16) Mr. Habeeb J. Maroun, Principal Financial Analyst – Revenue Requirements 25
Department, presents Unbundled Cost of Service (UCOS) Studies for DTE 26

A. F. CROZIER
Line U-20836
No.
AFC-31
Electric’s projected test year ending October 31, 2023. He also supports revenue 1
requirement calculations for: (1) customer related costs, and (2) capacity charges 2
by rate class. 3
4
17) Mr. David C. Milo, Fuel Resource Specialist – Fuel Supply, supports DTE 5
Electric Fuel Supply’s and Midwest Energy Resources Company’s operations 6
and maintenance expense and capital expenditures for the twelve months ended 7
December 2020 historical actual, and as projected for 2021 through October 31, 8
2023. 9
10
18) Mr. Justin L. Morren, Plant Director - Fossil Generation, explains the status of 11
DTE Electric’s Fossil Generation power plants and ratings; provides a review 12
of the Fossil Generation base coal unit availability performance for five years 13
prior and five years following the test year in this case; supports the historical 14
2020 level of capital expenditures on a plant level basis and the forecast of 15
capital expenditures planned for 2021 through October 31, 2023; Witness 16
Morren also supports the known and measurable changes in Fossil Generation 17
O&M expenses that will span the timeframe from the 2020 historic test year in 18
this case to the projected test year, ending October 31, 2023. In support of the 19
Company’s advancement in the decarbonization arena, Witness Morren 20
provides details on projects that will introduce two emerging technologies — 21
hydrogen-fueled generation and grid scale Battery Energy Storage Systems 22
(BESS) — into the Company’s generation portfolio. 23
24

A. F. CROZIER
Line U-20836
No.
AFC-32
19) Mr. Thac K. Nguyen, Manager – Energy Waste Reduction, discusses the 1
development, future plans, and related expenditures associated with the DTE 2
Insight Program. 3
4
20) Ms. Sharon G. Pfeuffer, Vice President – Distribution Operation Engineering 5
and Construction, supports the historical capital expenditures and O&M 6
expenses related to electric distribution activities for 2020 and the projected 7
capital expenditures and O&M expenses for 2021 to October 31, 2023, and the 8
capital and O&M forecasts for the projected test period of November 1, 2022 to 9
October 31, 2023. 10
11
21) Ms. Angie M. Pizzuti, Vice President and Chief Customer Officer, discusses the 12
Company’s efforts to create “Distinctive Service Excellence” and transform the 13
customer experience through targeted investments in the Customer IT Portfolio, 14
which includes all Information Technology projects that support, enable, or 15
directly impact customer operations, customer interactions, and the customer 16
experience. 17
18
22) Mr. Joseph E. Robinson, Director of Engineering and Planning - Electric 19
Distribution Operations, supports (1) the Company’s approach, analysis and 20
results regarding the line loss study that was directed to be accomplished in the 21
Order for Case No. U-20561, (2) clarification of the rules and regulations 22
language in Section C of the Company’s Rate Book for Electric Service 23
regarding service connections, (3) the Company’s existing Contribution in Aid 24
of Construction policy, and (4) the Company’s grid data analytics plan and 25
future grid integration studies requested in Senate Resolution 143. 26

A. F. CROZIER
Line U-20836
No.
AFC-33
1
23) Mr. Pankaj Sharma, Director – Information Protection & Security within the 2
Information Technology Services (ITS) organization, discusses IT capital 3
investment categorization within the Company; describes the capital investment 4
planning process that drives prioritization of both single and multi-year projects 5
and programs; supports the Company’s IT capital expenditures beginning with 6
the historic test year and extending through the projected test year; and describes 7
the variances in the actual 2019 and 2020 expenditures from the projected 2019 8
and 2020 expenditures in the Company’s previous general rate case. 9
10
24) Mr. Phillip L. Smith, Director – Operational Technology for Distribution 11
Operations, supports capital related to the Advanced Metering Infrastructure 12
project for the 2020 historical test period, as well as the projected capital 13
expenditures for 2021 to 2023, leading to the capital forecasts for the projected 14
test period of November 1, 2022 to October 31, 2023. 15
16
25) Mr. Jason E. Sparks, Director – Customer Service Operations, explains the 17
Company’s actual Customer Service O&M expenses for the 12 month period 18
ended December 31, 2020 and provides support for projected O&M expenses 19
for the projected test period ending October 31, 2023. 20
21
26) Ms. Theresa Uzenski, Manager – Regulatory Accounting, supports DTE 22
Electric’s financial statements for the historical test year ended December 31, 23
2020, the interim forecast period and a twelve-month projected test period 24
ending October 31, 2023, with certain adjustments necessary for presenting the 25

A. F. CROZIER
Line U-20836
No.
AFC-34
financial information in the appropriate format for ratemaking purposes. She 1
supports the development of the projected test year adjusted electric operating 2
income based on forecasted changes from the normalized historical electric 3
operating income. Ms. Uzenski also supports the Corporate Staff Group 4
expenses for the historical and forecasted periods and explains the function of 5
this group and the method for allocating costs to DTE Electric and the other DTE 6
Energy subsidiaries. She supports that costs recovered from other mechanisms 7
are excluded from the financial statements in this case (including the 8
Transitional Recovery Mechanism for the transition of Detroit Public Lighting 9
Department customers, the Renewable Energy Program, and Energy Waste 10
Reduction). She explains the requested treatment of costs to expand upon the 11
Company’s Charging Forward program to include a broader application of 12
electrification to transportation infrastructure; describes the Company’s 13
proposed accounting for unused Low- Income Assistance (LIA)/Residential 14
Income Assistance (RIA) credits and explains the accounting for the Company’s 15
requests to defer implementation costs related to the Company’s Time of Use 16
rate offering, defer pension expense, and defer COVID-19 expenses. She also 17
provides support for revenues collected for coal combustion residual clean-up 18
costs. 19
20
27) Mr. Kirk M. Vangilder, Principal Financial Analyst - Revenue Requirements, 21
supports DTE Electric's twelve months ended December 31, 2020 historical 22
revenue deficiency. In addition, he is sponsoring Net Operating Income (NOI) 23
adjustments for interest synchronization and income tax savings, as well as the 24
revenue conversion factor. Mr. Vangilder is sponsoring DTE Electric’s twelve 25
A. F. CROZIER
Line U-20836
No.
AFC-35
months ending October 31, 2023 projected revenue deficiency. He also 1
calculates the incremental revenue requirement for DTE Electric’s Tree Trim 2
Surge regulatory asset and the net present value of the Tree Trim Surge Program. 3
4
28) Dr. Bente Villadsen, Principal at The Brattle Group, supports the cost of capital 5
for the Company. Specifically, Dr. Villadsen provides return on equity (ROE) 6
estimates derived from a sample of comparable risks. Dr. Villadsen also 7
considers the business and financial risk of the Company relative to the proxy 8
companies’ ratio to arrive at her recommendation for the allowed ROE of 9
10.25%. 10
11
29) Mr. Aaron Willis, Manager – Regulatory Economics, discusses and supports the 12
Power Supply Costs for the projected test year, the proposed Rate Design, 13
Contribution in Aid of Construction (CIAC), and the Retail Access Service 14
Rider. 15
16
30) Ms. Sherri Wisniewski, Director – Tax Operations, supports the DTE Electric 17
Federal Income Tax, Michigan Corporate Income Tax, Municipal Income Tax, 18
property tax and other general taxes for the 2020 calendar year historical period 19
as well as the twelve months projected test period ending October 31, 2023. 20
21
Q48. Does this complete your direct testimony? 22
Yes, it does. 23

STATE OF MICHIGAN
BEFORE THE MICHIGAN PUBLIC SERVICE COMMISSION
In the matter of the Application of )
DTE ELECTRIC COMPANY )
for authority to increase its rates, amend ) Case No. U-20836
its rate schedules and rules governing the )
distribution and supply of electric energy, and )
for miscellaneous accounting authority. )
QUALIFICATIONS
AND
DIRECT TESTIMONY
OF
MAHEEN ASGHAR

DTE ELECTRIC COMPANY
QUALIFICATIONS AND DIRECT TESTIMONY OF MAHEEN ASGHAR Line No.
MA - 1
Q1. What is your name, business address, and by whom are you employed?1
A1. My name Maheen Asghar (she/her/hers). My business address is One Energy Plaza, 2
Detroit, Michigan 48226. I am employed by DTE Energy Services, LLC (DTE 3
Energy) as a Principal Financial Analyst – Regulatory Economics. 4
5
Q2. On whose behalf are you testifying? 6
A2. I am testifying on behalf of DTE Electric Company (DTE Electric or Company). 7
8
Q3. What is your educational background? 9
A3. I received a Bachelor of Science in Computer Science from Wayne State University 10
and a Master of Science in Information (data science and analytics) from the 11
University of Michigan. 12
13
Q4. What is your professional experience? 14
A4. I began my career at DTE Energy, in 2014, as a co-op programming student in 15
Distribution Operations (DO). I transitioned to a full-time position as an Operations 16
Analyst within DO in 2016, where I worked primarily with outage data. In 2019, I 17
accepted a position in Corporate Strategy, a role in which I supported key 18
operational and strategic work across the Company. I joined Regulatory Affairs in 19
2021, as a Principal Financial Analyst. 20
21
Q5. What is your current position? 22
A5. Currently, I am a Principal Financial Analyst in Regulatory Affairs. In this 23
position, I am responsible for evaluating customer class usage characteristics, 24
developing allocation schedules for use in cost-of-service studies and rate design, 25

M. ASGHAR Line U-20836
No.
MA - 2
and for measuring and evaluating demand response programs offered by the 1
Company. 2
3
Q6. Have you received any additional training? 4
A6. I attended the AEIC Load Research & Analytics Fundamentals of Customer Load 5
Data Analysis Seminar in 2021. 6
7
Q7. Have you previously sponsored testimony before the Michigan Public Service 8
Commission (MPSC or Commission)? 9
A7. I have not previously testified in a case before the MPSC. 10

M. ASGHAR
U-20836 Line No.
MA - 3
Purpose of Testimony 1
Q8. What is the purpose of your testimony? 2
A8. The purpose of my testimony is to support and justify the November 2022 to 3
October 2023 forecast allocation schedules. 4
5
Q9. Are you supporting any exhibits in this case? 6
A9. Yes. I am supporting the following exhibits: 7
Exhibit Schedule Description 8
A-5 E2 Cost of Service Allocation Methodology Diagram 9
A-5 E3 Allocation Schedule Description 10
A-17 G1.1 2022/2023 Forecast Energy Allocation Schedules 11
A-17 G1.2 Demand and Energy Allocation Percentages by Rate 12
Class 13
14
Q10. Were these exhibits prepared by you or under your direction? 15
A10. Yes, they were. 16
17
Q11. What are the sources of data used for the allocation schedules?18
A11. The November 2022 to October 2023 forecast allocation schedules are based on 19
2020 customer class sales data obtained from the 2020 Total System Analysis 20
(TSA). The forecast allocation schedules are based on the energy sales forecast for 21
the residential, commercial and industrial classes supported by Company Witness 22
Leuker, the street lighting and traffic signals sales forecast supported by Company 23
Witness Bellini, and the forecast billing determinants supported by Company 24

M. ASGHAR Line U-20836
No.
MA - 4
Witness Willis. These sales levels are shown with losses on Exhibit A-17, Schedule 1
G1.1. 2
3
Background and Basis for Allocation Schedules 4
Q12. Are there any technical terms used in your testimony that may require 5
explanation? 6
A12. Yes. To aid in understanding and to avoid confusion, I am defining the following 7
terms that I use throughout my testimony: 8
▪ Customer Class or Class of Service: A set of customers with similar characteristics 9
who have been grouped for the purpose of setting an applicable rate for electric 10
service. 11
▪ Total System Analysis (TSA): The study of all customer classes that identifies the 12
hourly demand values for all hours of the year. This is the foundation of allocation 13
schedules. 14
▪ Energy: The total kilowatt-hours (kWh) or megawatt-hours (MWh) supplied to or 15
used by an individual customer or customer class. 16
▪ Demand: The rate at which electric energy is used at a given instant or averaged 17
over a designated time interval. Typically, demand is expressed in kilowatts (kW) 18
or megawatts (MW). 19
▪ Service Area System Peak Demand: The highest hourly demand for all customers 20
(full service and choice) served on the DTE Electric distribution system within a 21
specific period (day, month, year, etc.). Service Area System Peak Demand is 22
commonly referred to as the ‘system peak.’ 23

M. ASGHAR Line U-20836
No.
MA - 5
▪ Bundled Peak Demand: The highest hourly demand for all customers served by 1
DTE Electric’s production system within a specific period (day, month, year, etc.). 2
Bundled Peak Demand is commonly referred to as ‘bundled peak.’ 3
▪ Coincident Peak Demand (CP): The demand of any customer class within a 4
specific period (day, month, year, etc.) that occurs at the same time as the system 5
peak or the bundled peak demand for the same period. 6
▪ 12CP: The demand value derived by averaging the actual demand values registered 7
on the monthly system or bundled peak hours for January through December for 8
each customer class. 9
▪ 4CP: The demand value derived by averaging the actual demand values registered 10
on the monthly bundled peak hours for June through September for each customer 11
class. 12
▪ Non-Coincident Peak Demand: The maximum demand of any customer class 13
within a specific period but not necessarily occurring at the time of the system peak 14
demand for that period. 15
▪ Losses: A term used to define the difference between the electrical energy delivered 16
to a customer (or a given point on the electrical distribution system) and the amount 17
of electrical energy that must be generated at the power plant to serve that customer. 18
In other words, losses refer to the difference in the amount of power generated from 19
the power plant and the point of delivery. 20
▪ Load Factor: The ratio, in percent, of the total energy over a designated period of 21
time to the maximum hourly demand (bundled or system) occurring in that period. 22
Load factor is calculated by the formula: 23
LF (%) = (Total Energy / (Peak Demand * No. of Hours)) * 100 24
▪ Customer-Owned: Industrial customers that use customer owned substations. 25

M. ASGHAR Line U-20836
No.
MA - 6
▪ DTE-Owned: Industrial customers that use DTE Electric single customer or joint-1
use general distribution substations. 2
▪ Transmission Voltage Level: Served directly from the transmission system at 3
120 kV or above, or from the transmission system through a DTE-owned 4
substation dedicated or primarily providing service to the customer and located 5
on or immediately adjacent to the customer's premises. 6
▪ Sub-transmission Voltage Level: Served directly from the sub-transmission 7
system at voltages from 24 kV to 41.6 kV or from the sub-transmission system 8
through a DTE-owned substation dedicated or primarily providing service to the 9
customer and located on or immediately adjacent to the customer's premises. 10
▪ Primary Voltage Level: Served directly from the primary distribution system at 11
a nominal voltage between 4.8 kV and 13.2 kV who does not qualify as either a 12
transmission voltage customer or a sub-transmission voltage customer. 13
▪ Secondary Service: Served directly from the secondary distribution system at a 14
nominal voltage less than or equal to 4.8 kV and who does not qualify as either 15
a transmission voltage customer, sub-transmission voltage customer or a primary 16
voltage customer. 17

M. ASGHAR Line U-20836
No.
MA - 7
Q13. What is the purpose of the allocation schedules you have developed? 1
A13. Allocation schedules are developed using customer class sales, data from Advanced 2
Metering Infrastructure (AMI), and quantitative methods to determine the extent 3
(expressed as a percentage) that each customer class uses the various portions of 4
the electrical system. In this case, the customer class usage percentages determined 5
in the allocation schedules are one of the inputs used by Company Witness Maroun 6
to determine customer class cost responsibility. Because all customer classes do 7
not utilize the full distribution system to take delivery of electrical service, the 8
allocation schedules are developed to assign only the portions of the system used 9
by each customer class. Exhibit A-5, Schedule E2, is a diagram which reflects the 10
applicability of allocation schedules to customer class. 11
12
Q14. How did you develop the allocation schedules? 13
A14. There are 11 forecast allocation schedules that I develop for use in cost-of-service 14
studies (see Exhibit A-5, Schedule E3 for a description of each schedule). Each 15
schedule was developed to allocate to each customer class’ utilization of a 16
particular part of the electrical system, which is the industry standard practice for 17
developing allocation schedules. Schedule 100, shown in Exhibit A-17, Schedule 18
G1.2, is based on the class’s forecasted energy consumption. and the remaining 10 19
allocation schedules described in Exhibit A-5, Schedule E3, are based on the 20
forecasted demand that a customer class places on the various portions of the 21
electrical system. The allocation schedule numbers and the associated portion of 22
the electrical system they represent are shown schematically on Exhibit A-5, 23
Schedule E2. 24
25

M. ASGHAR Line U-20836
No.
MA - 8
Q15. Why does the measurement basis differ for each allocation schedule? 1
A15. The measurement basis for each allocation schedule is based on the design and 2
service requirements for each portion of the electrical system. Specifically, 3
forecasted energy is used for Power Plant Energy Production (Schedule 100) 4
required to serve customers. As customers use energy, they create a demand (rate 5
at which energy is used and/or delivered) on the system. 6
7
The output capacity of power plant production is designed considering the peak 8
demand requirements of the production system, measured as the bundled peak 9
demand. Production Schedules 200A and 200B are measured based on the 10
forecasted bundled 4CP. Schedule 201 – Distribution is based on the forecasted 11
12CP of the of the Service Area. 12
13
Schedules 202, 203A, 203B, 203C, 204 and 205 refer to substations, high voltage 14
lines and transformers, which are designed to carry the maximum load required by 15
the customer classes they serve regardless of whether the class maximum demand 16
occurs at the same time or a different time as the system peak. The forecasted non-17
coincident peak demand is the measurement basis for these allocation schedules. 18
19
Low voltage secondary lines are designed to serve the absolute maximum demand 20
level of the customers they feed. Therefore, Schedule 300 is based upon the 21
forecasted sum of the individual customer maximum demands. 22
23
Forecast Allocation Schedules 24

M. ASGHAR Line U-20836
No.
MA - 9
Q16. How was the 2020 TSA used to develop the demand values determined for the 1
forecast allocation schedules? 2
A16. The basis for the forecast allocation schedules developed for this case are the 3
forecasted net sales values presented in Witness Leuker’s Exhibit A-15, Schedule 4
E1. However, because Witness Leuker’s system peak demand forecast does not 5
contain the associated customer class level demand values necessary for allocation 6
schedule development, it was necessary to develop these corresponding demand 7
values by customer class. This was done by applying historical load factors to the 8
forecast energy values using industry standard load research principles to derive 9
demand values using energy and load factor. Therefore, forecast demands were 10
calculated by dividing the net forecast energy values without losses, by the product 11
of the historic load factor and annual hours (8,784 hours per year as 2020 was a 12
leap year). 13
14
Q17. How were the appropriate historic load factors determined? 15
A17. A 5-year average load factor was derived from years 2016-2020 and used for each 16
cost of service class. 17
18
Q18. Why is using the 5-year average historical load factor a better representation of 19
the class’ performance than the actual 2020 historic load factor? 20
A18. Using the 5-year average load factor accounts for any abnormalities in any single 21
year and smooths out any variability due to weather, or other anomalies such as 22
economic conditions. 23
24

M. ASGHAR Line U-20836
No.
MA - 10
Q19. Why is using average historical load factors a reasonable method of determining 1
forecast demand values? 2
A19. This approach is reasonable because it utilizes industry standard load research 3
principles that are defined in the “The Art of Rate Design”, published by the Edison 4
Electric Institute (EEI), taught in the EEI Rate Fundamentals Course, and published 5
in Chapter 7 of the Association of Edison Illuminating Companies (AEIC) Load 6
Research Manual, 3rd Edition. These sources define the relationship of load factor 7
to demand and the principle of using energy and load factor to calculate demand. 8
9
Q20. How did you develop the November 2022 to October 2023 forecast allocation 10
schedules? 11
A20. I applied the 5-year average load factors to the forecasted energy sales received 12
from Witness Leuker to produce the November 2022 to October 2023 forecast 13
schedules shown in Exhibit A-17, Schedule G1.1. 14
15
Q21. Where any other changes made to the forecast allocation schedules? 16
A21. Yes. The electric line loss factors were changed in the present case. The Company 17
completed a new electric line loss study based on 2019 data, which examined 18
average line losses by month and by voltage. The line loss study and a detailed 19
description of how it was performed are explained in further detail by Company 20
Witness Robinson. 21
22
Q22. How are line losses used in forecast allocation schedules? 23
A22. Line loss factors are used as a multiplier in allocation schedules to increase the 24
energy or demand value for a given schedule to reflect the amount of production 25

M. ASGHAR Line U-20836
No.
MA - 11
needed to serve the customer class. Line losses were measured by voltage level, 1
allowing allocation schedules to accurately reflect demands on the system caused 2
by different classes of customers. 3
4
Q23. Are the allocation schedules defined in your testimony developed using 5
established principles and methods? 6
A23. Yes. I used the industry recognized and accepted load research principles supported 7
by EEI and AEIC. The methods I used are consistent with the methods used by the 8
Company in all its electric general rate cases filed since 2014. 9
10
Q24. Does this complete your direct testimony? 11
A24. Yes, it does. 12

STATE OF MICHIGAN
BEFORE THE MICHIGAN PUBLIC SERVICE COMMISSION
In the matter of the Application of ) DTE ELECTRIC COMPANY ) for authority to increase its rates, amend ) Case No. U-20836 its rate schedules and rules governing the ) distribution and supply of electric energy, and ) for miscellaneous accounting authority. )
QUALIFICATIONS
AND
DIRECT TESTIMONY
OF
ROBERT A. BELLINI

DTE ELECTRIC COMPANY QUALIFICATIONS AND DIRECT TESTIMONY OF ROBERT A. BELLINI
Line No.
RAB-1
Q1. What is your name, business address and by whom are you employed? 1
A1. My name is Robert A. Bellini (he/him/his). My business address is 8001 Haggerty, 2
Belleville, Michigan 48111. I am employed by DTE Electric Company (DTE 3
Electric or Company) as Manager of Community Lighting. 4
5
Q2. On whose behalf are you testifying? 6
A2. I am testifying on behalf of DTE Electric. 7
8
Q3. What is your educational background and business experience? 9
A3. I graduated from Central Michigan University with a Bachelor of Science degree 10
in Business Administration in 1999. In 2005, I graduated from Oakland University, 11
with the degree of Master of Accountancy. From 2005 until 2008, I was employed 12
by Deloitte & Touche LLP as a financial auditor. While employed at Deloitte & 13
Touche, I passed the Certified Public Accountant (C.P.A.) examination and became 14
a licensed C.P.A. in 2007. In 2007, I was promoted to Senior Auditor on client 15
engagements. In this role, I was responsible for tailoring each audit based on a 16
client’s industry and the risks inherent in their operations, supervising the audit 17
fieldwork, and communicating the audit issues and results with client management. 18
19
In 2008, I joined DTE Energy as a Financial Auditor. My responsibilities included 20
executing both financial and Sarbanes-Oxley (SoX) audits in support of the DTE 21
Energy 10K annual filing under the guidance of our external auditor, 22
PriceWaterhouseCoopers (PWC). In 2010, I was promoted to Senior Auditor. My 23
responsibilities included planning, scoping, and executing both financial and 24
operational audits. In 2013, I was promoted to Principal Supervisor of the Joint 25

R. A. BELLINI Line U-20836 No.
RAB-2
Use department. My responsibilities included developing budgets, forecasting, and 1
negotiating joint use agreements with various attaching entities. In 2016, I was 2
promoted to Manager, Joint Use. In 2018, I was promoted to Manager, Community 3
Lighting. 4
5
Q4. What are your duties and responsibilities as Manager of Community 6
Lighting? 7
A4. In this capacity, I am responsible for managing the marketing and sales, budgeting 8
and forecasting, planning and construction and asset management for nearly 9
197,000 DTE Electric-owned street lights and outdoor protective lights. I also 10
manage the maintenance and provision of energy to municipally owned streetlights 11
and the provision of energy-only service to municipalities, in accordance with DTE 12
Electric’s MPSC-approved tariffs. DTE Electric’s assets related to these services 13
include mercury vapor, metal halide, high pressure sodium, and light-emitting 14
diode (LED) luminaires. 15
16
Q5. Have you previously provided testimony before the Michigan Public Service 17
Commission? 18
A5. Yes, I have. I sponsored testimony in Case No. U-20561, the DTE Electric 2019 19
General Rate case. 20
21
22

R. A. BELLINI Line U-20836 No.
RAB-3
Purpose of Testimony 1
Q6. What is the purpose of your testimony?2
A6. The purpose of my testimony is to support cost recovery relative to O&M and 3
Capital expenses related to DTE Electric’s lighting assets. I will: 4
• Support the energy forecast for the various outdoor lighting rates including 5
automated traffic signal (ATS) rates and metered street lighting rates; 6
• Support and discuss the reasonableness of the Company’s actual Community 7
Lighting O&M expenses ended December 31, 2020, and the projected 8
Community Lighting O&M expenses for the 12-month projected test period 9
ending October 31, 2023; 10
• Support and discuss Community Lighting’s capital expenditures for the 11
historical test year ended December 31, 2020, and the projected Community 12
Lighting capital expenditures for the 12-month projected test period ending 13
October 31, 2023; 14
• Support the proposed rate design for the outdoor lighting (municipal and 15
other) and ATS tariff offerings using the lighting model; 16
• Support and discuss proposed wording changes for certain E1 and D9 17
Outdoor Lighting tariff sheets; 18
• Provide a plan to reduce costs to maintain overhead fed lights as well as 19
promote efficiency through the use of technology. 20
21
Q7. Are you sponsoring any exhibits? 22
A7. Yes. I am sponsoring in whole, or in part, the following exhibits: 23
Exhibit Schedule Description 24
A-12 B5.5 Projected Capital Expenditures – Community Lighting 25

R. A. BELLINI Line U-20836 No.
RAB-4
A-13 C5.6 Projected Operation and Maintenance Expenses – 1
Distribution Expenses 2
A-16 F3 Present and Proposed Revenues by Rate Schedule – 12 3
months ending October 31, 2023 4
A-16 F8 Proposed Tariff Sheets 5
A-25 O1 Community Lighting Outdoor Lighting Outage 6
Duration 7
A-25 O2 Community Lighting Outdoor Lighting Outage Cost 8
9
I am sponsoring lines 8 and 22 within Exhibit A-13, Schedule C5.6, page 1 of 2, 10
and the pages specific to the residential and commercial outdoor protective lighting 11
(OPL) and municipal classes within Exhibit A-16, Schedule F3. This includes 12
pages 46 through 57. On Exhibit A-16, Schedule F8, I am sponsoring the OPL and 13
municipal tariffs while Company Witness Mr. Willis sponsors the tariffs for the 14
remaining customer classes. 15
16
Q8. Were these exhibits prepared by you or under your direction? 17
A8. Yes, they were. 18
19
Q9. Could you describe the portfolio of Community Lighting assets that DTE 20
Electric owns, operates, and maintains on behalf of its customers? 21
A9. Yes. DTE Electric owns, operates and maintains approximately 197,000 22
Community Lighting assets which include municipal, commercial, and residential 23
customers. There are approximately 83,000 street lights that are owned by the 24

R. A. BELLINI Line U-20836 No.
RAB-5
customer (municipality). Ownership of Community Lighting assets is detailed in 1
Table 1 below: 2
Community Lighting Assets 3
4 Asset Type Asset Ownership Rate Type # of Assets Description
Municipal OH &UG Street Lights DTE Electric E1 Option I 164,890 DTE Electric owned and maintained system
Municipal OH &UG Street Lights Customer E1 Option II 195 Municipally owned and DTE Electric maintained system
Municipal OH &UG Street Lights Customer E1 Option III 82,625 Municipally owned and maintained system
Commercial Outdoor Protective Lights DTE Electric D9 23,023 DTE Electric owned and maintained lighting equipment
Residential Outdoor Protective Lights DTE Electric D9 9,452 DTE Electric owned and maintained lighting equipment
5
Q10. Can you provide an overview of DTE Electric’s Community Lighting 6
Municipal Street Lighting Business? 7
A10. Yes. DTE Electric Community Lighting provides MPSC-approved tariff service to 8
approximately 165,000 street lights on its E1 Option I Rate Schedule, 9
approximately 200 municipally-owned street lights on its E1 Option II Rate 10
Schedule, approximately 83,000 municipally-owned street lights on its E1 Option 11
III Rate Schedule, and approximately 32,000 OPLs on its D9 Rate Schedule. In 12
addition to the lighting services above, Community Lighting provides MPSC-13
approved tariff service to municipalities for the operation of ATS lights on its E2 14
Rate Schedule. 15
16
DTE Electric’s E1 Option I Rate Schedule and the proposed pricing reflects 17
recovery of costs associated with its ownership, maintenance and provision of 18
energy to its portfolio of mercury vapor, high pressure sodium, metal halide 19
(collectively referred to as high intensity discharge (HID)) and LED street lighting. 20
DTE Electric’s E1 Option II Rate Schedule (closed to new customers since January 21
2009) is applicable to street lighting systems owned by municipalities, but 22

R. A. BELLINI Line U-20836 No.
RAB-6
maintained by the Company. DTE Electric’s E1 Option III Rate Schedule is 1
applicable to street lighting systems which are both owned and maintained by the 2
municipality for which the Company provides only the energy. 3
4
Q11. Can you provide an overview of the various lighting technologies that DTE 5
Electric’s Community Lighting employs in its Municipal Street Lighting 6
Business (Option I)? 7
A11. Yes. The current lighting portfolio for street lighting customers served on DTE 8
Electric’s E1 Option I Rate Schedule includes approximately 51,000 high pressure 9
sodium luminaires and approximately 94,000 LED luminaires, or 31% and 57% of 10
its total Company-owned street lighting portfolio, respectively. While the quantity 11
of high pressure sodium luminaires has been steadily dropping over the past several 12
years, the total number of LED luminaires continues to increase in-kind due to the 13
conversion of HID luminaires. 14
15
11%, or approximately 19,000 of DTE Electric’s street light assets are currently 16
mercury vapor luminaires. The mercury vapor technology became obsolete 17
pursuant to the Energy Policy Act of 2005, and, as a result of their obsolescence 18
and inefficient use of energy, the quantity of mercury vapor street lights has been 19
reduced by approximately 74,000 over the past ten years, primarily through their 20
conversion to LED luminaires. DTE Electric no longer performs periodic group 21
re-lamping of the mercury vapor lighting; rather, the lamps are replaced upon lamp 22
failure. When the entire mercury vapor lighting unit (consisting of the luminaire, 23
lamp, and photocell) fails, DTE Electric converts the failed unit to LED lighting 24
due to its continuing obligation to provide service for Municipal Street Lighting 25

R. A. BELLINI Line U-20836 No.
RAB-7
(MSL) customers taking service under its E1 Option I Rate Schedule. DTE Electric 1
began to convert failed mercury lighting to LED lighting on February 1, 2017 in 2
accordance with the MPSC’s January 31, 2017 Order in MPSC Case No. U-18014. 3
Prior to February 1, 2017, all failed mercury vapor lights were converted to high 4
pressure sodium. Metal halide lighting luminaires represent approximately 1% or 5
approximately 1,500 of DTE Electric’s company owned lighting luminaires 6
7
Q12. Can you provide an overview of the various lighting technologies for the street 8
lights that are municipality owned (Option II & III)? 9
A12. Yes. The mix of lighting for DTE Electric’s E1 Option II Rate Schedule reflects a 10
mix of 83% high pressure sodium and 17% mercury vapor. As I previously 11
indicated, this service has been closed to new customers since 2009, and existing 12
E1 Option II Rate Schedule customers electing to convert to LED are required to 13
convert to DTE Electric’s E1 Option I or Option III Rate Schedules. The mix of 14
lighting for DTE Electric’s E1 Option III Rate Schedule includes approximately 15
69,000 LED luminaires or 84% of the total; approximately 13,000 are high pressure 16
sodium luminaires, or 15% of the total, with the balance being a mix of mercury 17
vapor and metal halide. The high concentration of energy efficient LED lighting 18
reflects the City of Detroit’s conversion of most of its street lights to LED. 19
20
Q13. Can you provide an overview of DTE Electric’s Community Lighting OPL (D9 21
Rate Schedule) and ATS Business (E2 Rate Schedule)? 22
A13. Yes. DTE Electric’s D9 Rate Schedule and the proposed pricing reflects recovery 23
of costs associated with its ownership, maintenance and provision of energy to its 24
portfolio of approximately 23,000 commercial and more than 9,000 residential 25

R. A. BELLINI Line U-20836 No.
RAB-8
outdoor protective lights. DTE Electric’s OPLs employ the same lighting 1
technologies as its street lights and, consistent with its conversion of failed mercury 2
vapor street lights to LED lighting, DTE Electric began to convert failed mercury 3
vapor OPLs to LED lighting on February 1, 2017. 4
5
DTE Electric’s E2 Rate Schedule and proposed pricing reflects the recovery of 6
costs for the production and distribution of energy for ATS lights owned and 7
maintained by municipalities and other public authorities. This service is an 8
energy-only service and represents annual load of more than 59 GWh including 9
service to the City of Detroit. 10
11
DTE Electric also provides metered municipality-owned streetlight service under 12
the E1.1 Rate Schedule. Total annual load on this service, including service to the 13
City of Detroit, is approximately 10 GWh. I support the energy forecast for this 14
Rate Schedule and Witness Willis supports the proposed rate for this service. 15
16
Community Lighting Sales Forecast 17
Q14. How did you develop the sales forecast for Lighting? 18
A14. Consistent with the method used in prior rate cases, the sales forecast for the E1 19
Option I Rate Schedule was developed by first preparing a forecast of light counts 20
for each lighting type (technology and wattage size) for the projected test period 21
based upon: (1) known projects, (2) continued conversions of mercury vapor 22
lighting to LED lighting, and (3) an estimate of increased light counts net of 23
removals, resulting from sales growth. The system wattage (nominal lamp wattage 24
plus ballast wattage) applicable to each lighting type was applied to the forecasted 25

R. A. BELLINI Line U-20836 No.
RAB-9
volume of lights for each lighting type. Annual usage was assumed to be 4,200 1
hours, to reflect the hours that the lights on either the dusk to dawn or standard 2
provision are illuminated. The energy forecast for lights on the dusk to midnight 3
provision was based upon 2,100 hours use and the energy forecast for lights on the 4
de-energized provision is zero. 5
6
The sales forecast for the E1 Option II Rate Schedule was developed based upon 7
the existing light counts for each of the lighting types. The system wattage value 8
applicable to each lighting type was applied to the forecasted volume of lights for 9
each lighting type for the 4,200 hours for which all the lights are illuminated on an 10
annual basis. 11
12
The sales forecast for the E1 Option III Rate Schedule was developed by first 13
preparing a forecast of light counts for each of the lighting types for the projected 14
test period based upon known projects and an estimate of light count changes. The 15
system wattage value applicable to each lighting type was applied to the forecasted 16
volume of lights for each lighting type for the 4,200 hours for which all the lights 17
are illuminated on an annual basis. 18
19
The total sales forecast for the OPL D9 Rate Schedule, like that prepared for the E1 20
Rate Schedule, was developed by preparing a forecast of light counts for each of 21
the lighting types for the projected test period based upon existing light counts, an 22
estimate of increased light counts resulting from sales growth net of removals, and 23
continued conversion of mercury vapor lighting to LED lighting. The system 24
wattage value applicable to each lighting type was applied to the forecasted volume 25

R. A. BELLINI Line U-20836 No.
RAB-10
of lights for each lighting type for the 4,200 hours for which the lights are 1
illuminated on an annual basis. 2
3
The total sales forecast for the ATS E2 Rate Schedule was determined by using the 4
total connected wattage, as of March 1, 2021, for that rate schedule and determining 5
the annual usage based upon that determinant. In other words, it is simply the 6
product of the total reported wattage and the total number of hours in the projected 7
test period. 8
9
The total sales forecast for the E1.1 Rate Schedule was based upon annualized 10
usage data for the 12-month period that ended December 2020. 11
12
Community Lighting Operations 13
Q15. What is included in the Maintenance of Street Lighting and Signal Systems 14
account on lines 8 and 22 of Exhibit A-13, Schedule C5.6? 15
A15. Lines 8 and 22 on this exhibit show the Projected Operation and Maintenance 16
Expenses that are directly assigned to Operation and Maintenance of Street 17
Lighting and Signal Systems. The total historical period expense of $3.8 million in 18
Account 596 (Maintenance of street lighting and signal systems) represents 19
preventive maintenance expense, labor expense and non-capitalized outage 20
restoration expense. The preventive maintenance work included post inspection, 21
post painting, re-lamping of metal halide luminaires, and night patrols for DTE 22
owned municipal streetlights. The labor expense primarily reflects the labor of the 23
Community Lighting team including sales, planning, asset maintenance, 24
construction and asset engineering. As reflected on Exhibit A-13, Schedule C5.6, 25

R. A. BELLINI Line U-20836 No.
RAB-11
the historical period operation and maintenance (O&M) expense of $3.8 million is 1
adjusted for inflation of 3.1% for 2021, 2.9% for 2022, and 2.42% for the first 10 2
months of 2023. 3
4
Q16. How often does DTE Electric inspect posts? 5
A16. DTE Electric has more than 60,000 posts, and has established detailed post 6
inspection criteria to inspect its posts every three years to both identify posts whose 7
structural integrity dictates their replacement (condemnation), and posts that 8
require painting. At the time posts are inspected, minor post maintenance work 9
such as adding or replacing post asset tags, post hand-hole covers, and T-box door 10
covers may also be completed. Over the past nine years, DTE Electric’s post 11
inspection process has resulted in the annual replacement of condemned posts at a 12
rate of approximately 3.5% and post painting at a rate of approximately 8.9% 13
relative to the total population of posts. These inspection service results are 14
mutually exclusive meaning that posts which get replaced are not included in the 15
tally of those posts which get identified for painting. 16
17
Q17. Does your historical O&M expense include any preventive maintenance 18
expense for LED luminaires? 19
A17. Yes. Prior to 2018, DTE Electric had not performed any preventive maintenance 20
on LED luminaires. However, beginning in 2018, DTE implemented LED washing 21
as part of its preventive maintenance program. 22
23
Q18. Why has DTE Electric initiated a LED washing and group relamping 24
preventive maintenance program? 25

R. A. BELLINI Line U-20836 No.
RAB-12
A18. DTE Electric currently re-lamps its HID luminaires on a periodic basis to ensure 1
that their performance (light output) is maintained at an appropriate level to provide 2
for the safety and security of its customers. Given the increasing saturation of LED 3
luminaires in its lighting portfolio, DTE Electric was similarly concerned about the 4
lighting performance of LED luminaires over time. Because of this concern, DTE 5
Electric conducted two formal and separate LED light loss factor (LLF) studies, 6
initially in 2015 and again in 2017, to determine how LED lumen output 7
depreciated over time. The results of those studies identified the need to wash 8
LEDs on a periodic basis to ensure that their lumen output remained at or above 9
L70 (70% of the original design lumen output), the level at which the Lighting 10
Industry has defined LED luminaire end of life and no longer provides acceptable 11
light output to meet the lighting safety and security design requirements of its 12
customers. 13
14
Q19. How has DTE Electric determined the projected expense for the performance 15
of the LED luminaire washing and group relamping? 16
A19. Based upon the results of the LLF studies, DTE Electric developed an LED 17
luminaire 5-year washing schedule for its LED luminaire portfolio from the time 18
when the LED luminaires were originally installed. For instance, LED luminaires 19
originally installed in 2016 will generally be washed in 2021, LED luminaires 20
installed in 2017 will generally be washed in 2022, and so on. HID luminaires are 21
also targeted to be relamped on a 9 year cycle similar to that described for LED 22
luminaires. 23
24
R. A. BELLINI Line U-20836 No.
RAB-13
DTE washed approximately 7,300 LED luminaires and relamped approximately 1
11,000 HID luminaires in 2020, and is currently on pace to wash approximately 2
7,300 LED luminaires and relamp approximately 5,300 HID luminaires. For both 3
programs, DTE was able to obtain firm unit pricing from our contractors who are 4
tasked with performing this work. 5
6
Q20. Do you consider the actual and projected expenses for Community Lighting 7
shown in Exhibit A-13, Schedule C5.6 reasonable? 8
A20. Yes, I do. I base this on my analysis of past expenses, projected requirements for 9
labor and material for the safe and reliable distribution of electric power, and plans 10
for maintaining and/or improving customer service. 11
12
Q21. What are the Community Lighting capital expenditures on Exhibit A-12, 13
Schedule B5.5, “Projected Capital Expenditures – Community Lighting”? 14
A21. Capital expenditures for Community Lighting for 2020 were $15.2 million. The 15
2020 expenditures included approximately $4.7 million for outage restoration, 16
approximately $.8 million for post replacement, and the balance for new business, 17
planned HID to LED conversions, and capital support staff. 18
19
The projected capital expenditures for Community Lighting are $15.7 million for 20
2021, $13.9 million for 10 months ending October 31, 2022, and $16.7million for 21
12 months ending October 31, 2023. Similar to the 2020 actual expenditures, these 22
projections include outage restoration, including conversion of failed mercury 23
vapor luminaires to LED for both street light and OPLs, post replacement, planned 24

R. A. BELLINI Line U-20836 No.
RAB-14
HID to LED conversions, new business, and capital support staff. Other work will 1
include targeted infrastructure upgrades such as underground cable replacement. 2
3
Q22. What is the Community Lighting team’s performance with respect to outage 4
restoration activity? 5
A22. In 2020, DTE Electric’s Community Lighting team spent approximately $6.3 6
million on outage restoration expense with approximately 75% of this cost being 7
capitalized, and the balance being recorded as O&M. The outage restoration 8
expense was approximately $8 million in 2019, with the reduction in year-over-9
year outage expenditures caused by the reduced availability of contract crews 10
resulting from the impact of Covid-19. DTE Electric places a significant amount 11
of focus on its outage restoration process and employs balanced metrics to ensure 12
that its outage restoration costs and outage duration are optimized. Exhibit A-25, 13
Schedule O2 reflects DTE Electric’s historical performance for outage restoration 14
cost per event. 15
16
Q23. What was DTE Electric’s performance with respect to outage duration for its 17
lighting customers? 18
A23. DTE Electric has several targets for outage performance: outage duration and 19
outage defects. DTE Electric’s 2020 outage duration target was 3.1 business days 20
and DTE Electric’s 2020 actual performance was 3.3 business days. These 21
historical metrics are displayed on Exhibit A-25, Schedule O1. The historical 22
metrics for outage defects over the past ten years are also displayed on Exhibit A-23
25, Schedule O1. 24
25
R. A. BELLINI Line U-20836 No.
RAB-15
In addition to weather-related events, “long duration” and “follow-up” outage 1
events include extended repair time for underground faults (i.e. Miss Dig permits), 2
repairs resulting from third party damage, and lack of special order material (SOM) 3
maintained by a city or municipality. The performance metrics only include 4
reactive street light outage repairs; they do not include any outage repair resulting 5
from patrol and fix activities nor any preventative maintenance activities such as 6
group re-lamping. DTE Electric’s outage work management system for street 7
lighting uses 24-hour military time protocol and measures duration to the minute 8
degree. Street light outage events reported on weekends and after normal week day 9
business hours are analyzed and dispatched to crews on the following business day. 10
DTE Electric measures both total and crew duration cycle repair periods. Crews 11
authorized by DTE Electric work both day and evening shifts to complete reactive 12
outage repairs of reported street light outage events; and when seasonal work load 13
increases (late August to November and following storms), additional resources are 14
secured and mobilized. 15
16
Q24. What other measures does DTE Electric have in place to improve its 17
restoration time and to maintain a high level of customer service? 18
A24. DTE Electric has established strategic maintenance contracts with the contractors 19
performing the outage restoration work to include financial penalties for not 20
achieving targeted restoration times. Restoration performance, among other 21
metrics, is reviewed with the contractors at monthly performance meetings and, to 22
the extent that restoration performance is not meeting expectations, DTE Electric 23
has shifted responsibility for restoration in certain service territories to alternative 24
contractors to achieve the desired restoration performance. Internally, the 25

R. A. BELLINI Line U-20836 No.
RAB-16
Company evaluates contractor performance metrics in weekly huddles to identify 1
potential performance issues or problem-solving opportunities. Once notified of an 2
outage, DTE Electric contacts the reporting customer to update them on the status 3
of their repair. In addition to these efforts, the Company continues to improve the 4
arrangements for the provision of special order materials on behalf of municipalities 5
that choose streetlight materials that are not included in DTE Electric’s standard 6
streetlight offerings. 7
8
In an effort to further bolster customer service, in 2019, the Company increased its 9
night patrol activities with the intent to proactively identify and repair outages. At 10
DTE Electric’s direction, contractors are now responsible for patrolling all E1 11
Option I streetlights, with the expectation that each community with streetlights 12
owned and operated by the Company will be visited at least once annually. 13
14
Q25. What other activities does DTE Electric employ to minimize outage 15
restoration expense? 16
A25. On a planned basis, DTE Electric performs periodic group re-lamping of its high 17
pressure sodium on a 9-year cycle. The group re-lamping activity not only 18
improves lighting output, but it also reduces the volume of outage events caused by 19
a failed lamp. DTE Electric does not perform group re-lamping of mercury vapor 20
luminaires as this luminaire technology is obsolete and is being converted to LED 21
upon failure. 22
In 2015, DTE Electric completed its strategic movement from 24,000 hour lamps 23
(approximately 5-year life) to 40,000 hour lamps (approximately 9-year life) for its 24

R. A. BELLINI Line U-20836 No.
RAB-17
high pressure sodium luminaires and is continuing to evaluate the conversion rate 1
from high pressure sodium luminaires to equivalent LED luminaires. 2
3
Q26. How does DTE Electric determine how much capital it contributes to 4
prospective projects? 5
A26. DTE Electric’s calculation method for Contributions in Aid of Construction 6
(CIAC) varies depending on whether the DTE Electric project cost is for new 7
business or conversion of existing business (i.e. convert mercury vapor luminaires 8
to LED). The determination of CIAC for new business is calculated as the total 9
estimated project cost less three years of expected incremental revenues from the 10
project based upon the Company’s MPSC-approved tariffs. The determination of 11
CIAC for conversion of existing business is the total estimated project cost less 12
three years of expected incremental revenues from the project plus a DTE Electric-13
provided labor credit. Typically when converting existing fixtures to LED, a credit 14
is not applicable, as the new LED rate and the assoictaed 3 years of revenue are less 15
than the revenue of the existing lighting system being replaced. 16
17
Q27. Why does DTE Electric provide a labor credit for planned conversions? 18
A27. DTE Electric provides a labor credit, equal to the contract labor charge for 19
installation, to both incentivize conversions from the obsolete mercury vapor 20
lighting technology to the LED lighting technology, and to realize the economic 21
efficiencies gained from performing planned conversions of mercury vapor lighting 22
versus reactive conversions upon failure. DTE Electric’s contract labor costs for 23
planned conversions are approximately 40% below that for reactive conversions. 24
In addition to the incremental revenue and labor credits, the project cost for 25

R. A. BELLINI Line U-20836 No.
RAB-18
conversion of existing business may also be eligible for an energy waste reduction 1
(EWR) grant as part of the Company’s MPSC-approved EWR program, further 2
offsetting the customer’s contribution to the conversion project. 3
4
Q28. What is the rationale for providing a three-year revenue credit for qualifying 5
customer projects? 6
A28. The underlying purpose of reducing the project cost for new business by three years 7
of incremental revenues is to recognize the impact of increased revenues from the 8
project which are ultimately used to offset the revenue requirement associated with 9
the new assets that DTE Electric records to the applicable regulatory account. In 10
the determination of CIAC for planned conversion of existing business, DTE 11
Electric similarly determines total project cost and similarly reduces this amount 12
by 3 years of expected incremental revenues. As I previously stated, because the 13
rates and associated costs for LED lighting are lower than those for equivalent HID 14
lighting, no incremental revenue is available to offset the recovery of the additional 15
assets and therefore, no reduction in CIAC is provided. However, the CIAC impact 16
is reduced because DTE Electric provides a labor credit to customers requesting 17
planned conversion of obsolete mercury vapor lighting, and facilitates the process 18
for receipt of energy waste reduction grants for conversion of existing HID lighting 19
to LED lighting. 20
21
Q29. Do DTE Electric’s proposed LED rates reflect any capital expense which was 22
offset by CIAC? 23
A29. No. DTE Electric records customer CIAC as a direct offset to actual capital 24
expense for each of its new business and conversion projects. Therefore, DTE 25

R. A. BELLINI Line U-20836 No.
RAB-19
Electric’s proposed LED rates do not reflect any capital expense which was offset 1
by CIAC. For instance, if a customer provides a CIAC payment of $50,000 and 2
actual capital expense was $80,000, then DTE Electric would record net capital of 3
$30,000 on its books for purposes of ratemaking. 4
5
Q30. What is DTE Electric’s progress to date with respect to conversion of mercury 6
vapor to LED street lighting? 7
A30. As I mentioned previously, DTE Electric currently has a total remaining population 8
of just under 20,000 mercury vapor street light luminaires. DTE Electric continues 9
to work with its municipal customers in converting these assets to LED lighting. 10
Over the past seven years, DTE Electric has converted approximately 62,000 street 11
lights to LED and is in the process of developing its conversion work for 2022. The 12
implementation of projects to convert mercury vapor to LED for each individual 13
municipality requires evaluation, establishment and execution of contracts, work 14
planning (including the ordering of materials, updating of drawings, receipt of 15
permits, etc.), construction (including field coordination and oversight), and field 16
verification and billing system updates, all of which is labor intensive. 17
18
Community Lighting Rate Design 19
Q31. What does Exhibit A-16, Schedule F3 show? 20
A31. This exhibit shows the present and proposed rate design and corresponding 21
revenues by rate schedule, based on the billing determinants for the 12 months 22
ending October 31, 2023. The exhibit details the forecasted billing determinants as 23
well as the resulting present and proposed rates and revenues. The various billing 24
components are listed in column (a), and the respective billing determinants, 25

R. A. BELLINI Line U-20836 No.
RAB-20
including units of measure, are listed in column (b). The forecasted billing 1
determinants were developed based on historical data and relationships, as well as 2
known and measurable changes, and are consistent with the sales forecast as 3
presented on Company Witness Mr. Leuker’s Exhibit A-15, Schedule E2, Other 4
class sales. The existing luminaire and energy rates, both non-capacity energy and 5
capacity energy, as approved in the Order dated May 8, 2020, in Case No. U-20561 6
are in columns (c), (d) and (e), and are used to calculate the present revenues in 7
column (f). The luminaire rates proposed in this proceeding based upon the lighting 8
cost of service (as discussed in detail below) are in column (g), the proposed non-9
capacity energy rates are in column (h), the proposed capacity energy rates are in 10
column (i) and the resulting revenues from the new lighting cost of service are in 11
column (j). 12
13
Q32. How were DTE Electric’s present Municipal Street Lighting and Outdoor 14
Protective Lighting charges determined? 15
A32. The lighting rates approved in MPSC Case No. U-20561 reflect a monthly energy 16
charge, both non-capacity energy and capacity energy, and a luminaire charge. The 17
monthly energy charge was determined by applying the energy rates, both in 18
cent/kWh, to the calculated consumption values of the various lighting technology 19
lamp sizes for both the E1 and D9 Rate Schedules. The luminaire charge (which 20
includes costs related to customer service charges) is a fixed monthly amount 21
applied to each luminaire dependent on the technology utilized, the lamp size or 22
wattage, the lighting provision and whether it is served from underground or 23
overhead. The total (energy and luminaire) monthly lighting charges that were 24
calculated in MPSC Case No. U-20561 do not fully represent true cost of service 25

R. A. BELLINI Line U-20836 No.
RAB-21
rates by technology type (within the lighting rate class). In MPSC Case No. U-1
20561, the lighting rates were gradually moved towards cost of service with the 2
total movement capped to minimize the impact on any individual customer. 3
4
Q33. Did DTE Electric change the methodology by which it allocated the production 5
and distribution revenue requirements to the various lighting rate schedules 6
that you are supporting in this case? 7
A33. No. Consistent with the methodology employed in Case Nos. U-18014, U-18255, 8
U-20105, U-20162, and U-20561, the functionalized production (Exhibit A-16, 9
Schedule F1.1) and distribution (Exhibit A-16, Schedule F1.2) revenue requirement 10
amounts supported by Company Witness Maroun for each of the lighting rates 11
schedules (D9, E1, & E2) were fully allocated to each of those rate schedules within 12
the lighting rate model. The proposed luminaire, distribution, and energy charges 13
(both capacity and non-capacity) within each of the rate schedules were designed 14
to meet the production and distribution revenue requirement for each rate schedule 15
shown in these exhibits. Witness Maroun’s Exhibit A-16, Schedule F1.5, detailing 16
how much of the production revenue requirement for each rate class is capacity and 17
non-capacity related, was used to allocate the production revenue requirement 18
between the capacity and non-capacity energy charges. Consistent with the 19
methodology employed in Case Nos. U-18014, U-18255, U-20105, U-20162, and 20
U-20561, the E1 and D9 Rate Schedule energy charges, both capacity and non-21
capacity, were developed based upon the total production revenue requirement 22
prepared by Witness Maroun for the E1 and D9 Rate Schedules. 23
24

R. A. BELLINI Line U-20836 No.
RAB-22
Rate Schedule E1 1
Q34. How were the proposed E1 Rate Schedule luminaire charges determined? 2
A34. The Company determined the new luminaire service cost structures listed in the E1 3
Rate Schedule tariff schedules as shown on Exhibit A-16, Schedule F3 by 4
reviewing and allocating the specific cost of service components to the type of 5
service, underground or overhead, and then further allocating them to the individual 6
lighting technologies. There were no changes in the methodology for the allocation 7
of non-production O&M costs or capital-related costs to luminaire charges 8
proposed in this proceeding. 9
10
Q35. How was O&M allocated to the proposed E1 Rate Schedule luminaire charges 11
in the lighting model? 12
A35. Total Distribution O&M expense reflected in the E1 Rate Schedule luminaire 13
charge is $8.4 million, based upon the Company’s cost of service model sponsored 14
by Witness Maroun. This distribution O&M expense is comprised $3.4 million 15
directly assigned to lighting and recorded in account 596 (Street Lights & OPL), 16
$3.0 million allocated to lighting from various distribution operation and 17
distribution maintenance accounts, $0.5 million from various customer 18
service/sales accounts allocated to E1 Rate Schedule lighting and $1.5 million of 19
total A&G expense. Based upon the underlying labor costs within account 596 and 20
the various distribution operation, distribution maintenance and customer service 21
accounts allocated to E1 Rate Schedule lighting, approximately 40%, or $0.6 22
million, of A&G expense was directly allocated to E1 Option I Rate Schedule 23
lighting and the balance was allocated to the various distribution O&M accounts 24
within E1 Rate Schedule. 25

R. A. BELLINI Line U-20836 No.
RAB-23
1
The total customer service and distribution O&M expense allocated to lighting, 2
including A&G allocated to these accounts, was further allocated to the various E1 3
Rate Schedule luminaire/distribution charges based upon the system wattage of the 4
luminaires and lamps. With the exception of group re-lamping, LED washing, post 5
inspection, night patrols and post painting, all O&M ($3.4 million) and A&G ($0.6 6
million) directly assigned to lighting was spread equally across all luminaires. The 7
O&M associated with LED washing was allocated to LED luminaires (both 8
overhead-fed and underground-fed) based upon the underlying LED saturation and 9
contract cost, O&M associated with post inspection and post painting was spread 10
equally to all underground fed luminaires and O&M for group re-lamping was 11
allocated to metal halide luminaires only. 12
13
Q36. How was depreciation expense allocated to the proposed E1 Option I Rate 14
Schedule luminaire charges in the lighting model? 15
A36. The total depreciation expense reflected in the E1 Option I Rate Schedule luminaire 16
charges, as established in the Company’s cost of service model supported by 17
Witness Maroun, is $25.3 million. This reflects $18.5 million depreciation for the 18
directly assigned lighting asset accounts, $2.4 million for the distribution asset 19
accounts allocated to lighting, and the balance associated with general and 20
intangible plant accounts allocated to lighting. 21
22
The depreciation expense for overhead subaccount 373.01 (street lighting and 23
signal systems - overhead) was allocated directly to overhead fed luminaires, and 24
depreciation expense for underground subaccount 373.02 (street lighting and signal 25

R. A. BELLINI Line U-20836 No.
RAB-24
systems – underground) was allocated directly to underground fed luminaires. The 1
depreciation expense for overhead subaccount 373.03 (Street Lighting wire - OH) 2
was allocated to all overhead luminaires equally. The depreciation expense for 3
underground subaccount 373.04 (Street Lighting Wire/Cable - Underground) was 4
allocated to all underground-fed luminaires equally. 5
6
The depreciation expense for both the overhead and underground luminaire 7
subaccounts (LED Overhead, LED Underground, and HID Overhead, HID 8
Underground) was allocated to the respective overhead and underground 9
luminaires based upon lighting technology, wattage and underlying original 10
investment. For instance, all underground-fed mercury vapor luminaires received 11
an allocation of depreciation expense from subaccount 373.05 (Street Lighting 12
Luminaires – HID Underground) based upon the luminaire type’s investment and 13
underlying mercury vapor luminaire useful life utilized to establish rates in MPSC 14
Case Nos. U-18014, U-18255, U-20105, U-20162, and U-20561. 15
16
The depreciation expense that was allocated to lighting from distribution was 17
allocated to all underground and overhead lighting based upon each luminaire 18
type’s system wattage -- the best representation of each lighting type’s usage of the 19
distribution system. 20
21
Q37. How was the revenue requirement for other taxes, return on investment and 22
income tax allocated to the proposed E1 Option I Rate Schedule luminaire 23
charges? 24

R. A. BELLINI Line U-20836 No.
RAB-25
A37. Consistent with the allocation performed in DTE Electric’s prior five rate cases, all 1
other capital-related components were allocated to the various luminaire types in a 2
manner similar to that employed for the related underlying depreciation expense. 3
For the directly assigned street lighting asset subaccounts, other taxes, return on 4
investment and income tax followed the allocation of net plant to each of the 5
lighting types. 6
7
Q38. Do you believe the proposed allocation of costs reflected in the various E1 8
Option I Rate Schedule luminaire charges is reasonable? 9
A38. Yes. The methodology utilized in the lighting model to allocate each of the 10
individual cost of service components discretely, rather than in total, more 11
accurately reflects the cost to provide lighting service to underground and overhead 12
assets as well as the various lighting technologies. The usage of the eight separate 13
asset subaccounts for allocation of the capital-related costs results in more accurate 14
rate setting based upon both how the lights are fed as well as the lighting 15
technology, wattage and luminaire investment. 16
17
Q39. How were the E1 Option II Rate Schedule charges developed? 18
A39. The E1 Option II Rate Schedule charges were developed based upon a share of the 19
production revenue requirement allocated by Witness Maroun in the Company’s 20
cost of service model to the E1 Rate Schedule, a share of the distribution and 21
customer service revenue requirements allocated by Witness Maroun in the 22
Company’s cost of service model to the E1 Rate Schedule and a small allocation of 23
the O&M expense directly assigned to the E1 Rate Schedule from Account 596. 24
The allocations of revenue requirement from production, distribution and customer 25

R. A. BELLINI Line U-20836 No.
RAB-26
service to the E1 Option II Rate Schedule were accomplished on a per kWh basis 1
across all E1 Option II rates. The proposed rates for the E1 Option II Rate Schedule 2
are displayed in a luminaire charge, similar to that for Rate Schedule E1 Option I, 3
and energy charges, both capacity and non-capacity, in a cent/kWh format. 4
5
Q40. How were the E1 Option III Rate Schedule charges developed? 6
A40. The E1 Option III Rate Schedule charges were developed based upon a share of the 7
total production revenue requirement allocated by Witness Maroun in the 8
Company’s cost of service model to the E1 Rate Schedule, a share of the total 9
distribution revenue requirement allocated by Witness Maroun in the Company’s 10
cost of service model to the E1 Rate Schedule and a share of the customer service 11
revenue requirement allocated by Witness Maroun in the Company’s cost of service 12
model to the E1 Rate Schedule. The allocations of revenue requirement from 13
production, distribution and customer service to the E1 Option III Rate Schedule 14
were performed on an equal energy basis across all E1 Option III rates. The 15
proposed E1 Option III Rate Schedule distribution and energy charges, both 16
capacity and non-capacity, are displayed in a cent per kWh format, allowing for a 17
transparent comparison of lighting costs for the various luminaire system wattages 18
and the various lighting technologies. 19
20
Q41. How does your proposed cost allocation methodology impact the present rates 21
for the E1 Rate Schedule? 22
A41. The cost allocation methodology described above and employed in the lighting 23
model reflects a collective revenue deficiency for the E1 Rate Schedule options. 24
Based upon using the same cost allocations in the lighting rate model that were 25

R. A. BELLINI Line U-20836 No.
RAB-27
utilized in the Company’s last five rate cases, Rate Schedule E1 lighting rates 1
proposed in this proceeding are collectively below their cost of service. 2
3
Q42. What is your proposal regarding rate design in this proceeding for Rate 4
Schedule E1 Option I rates? 5
A42. Consistent with the final rate design in MPSC Case Nos. U-18014, U-18255, U-6
20105, U-20162, and U-20561, I have proposed a continuation of the gradual move 7
towards rates which are entirely based upon cost of service for the lighting class. 8
Consensus on this methodology was reached in the lighting collaborative ordered 9
in Case No. U-17767 and beginning with rate Case No. U-18014, the Rate Schedule 10
E1 Option I lighting rates are being gradually moved to rates which are entirely 11
based upon cost of service. 12
13
Q43. How were the Rate Schedule E1 Option I proposed rates developed in this 14
proceeding? 15
A43. The proposed Rate Schedule E1 Option I lighting rates were designed with two 16
goals in mind; (1) continue the gradual move to rates which are entirely cost based 17
and (2) minimize the impact of the proposed lighting rates on the monthly lighting 18
bill for any municipality. Using the lighting rate model, the first step towards 19
achievement of these goals was to limit the overall increase on any municipality 20
and/or total lighting rate to twice the proposed increase in revenue requirement. 21
The second step of the process was to allocate the remaining revenue deficiency for 22
the Rate Schedule E1 Option I class, on a percentage basis, to all the remaining 23
lights. 24
25
R. A. BELLINI Line U-20836 No.
RAB-28
Rate Schedule D9 1
Q44. How were the proposed rates for the D9 Rate Schedule determined? 2
A44. The proposed luminaire rates for the D9 Rate Schedule for both commercial and 3
residential OPL service were developed based upon the allocated and directly 4
assigned distribution costs supported by Witness Maroun in the Company’s cost of 5
service model. The luminaire rate design methodology employed in the lighting 6
model for the D9 Rate Schedule mirrors the methodology employed for the E1 Rate 7
Schedule with all allocated distribution costs assigned to luminaire charges based 8
upon energy consumption and the directly assigned costs allocated based upon the 9
underlying individual cost of service components. As I discussed earlier, the 10
proposed energy charges, both capacity and non-capacity, for the D9 Rate Schedule 11
for both commercial and residential OPL service were developed collectively with 12
the E1 Rate Schedule energy charges. 13
14
Q45. Are all of the proposed luminaire rates for the D9 Rate Schedule entirely cost-15
based? 16
A45. No. The proposed rates for Rate Schedule D9 required the use of the same two-17
step methodology to gradually achieve cost-based intra-class rates that was 18
employed for the E1 Option I Rate Schedule. 19
20
Rate Schedule E2 21
Q46. How were the proposed Rate Schedule E2 charges determined? 22
A46. The Rate Schedule E2 charges were developed based upon the production, both 23
capacity and non-capacity, and distribution revenue requirements allocated to Rate 24
Schedule E2 customers by Witness Maroun in the Company’s cost of service 25

R. A. BELLINI Line U-20836 No.
RAB-29
model. Each of the revenue requirement amounts were divided by the total 1
forecasted energy for the projected test period to arrive at a distribution rate, a non-2
capacity energy rate and a capacity energy rate in cents/kWh. The total rate 3
approved in MPSC Case No. U-20561 was 8.21 cents/kWh. The total rate proposed 4
in this proceeding is 8.64 cents per kWh which includes a distribution charge of 5
2.10 cents/ kWh, a capacity energy charge of 1.88 cents/kWh and a non-capacity 6
energy charge of 4.66 cents/kWh. 7
8
Q47. How has Witness Maroun’s presentation of the revenue deficiency/sufficiency 9
for production presented in this case impacted your rate design? 10
A47. To allocate the targets to the lighting tariff energy charges, both capacity and non-11
capacity, in the cost of service-based rate presentation, I have allocated the revenue 12
deficiency for Rate Schedule E2 to the E2 rate directly and I have allocated the total 13
D9 sufficiency, and total E1 deficiency Rate Schedules to those energy rates in 14
total. 15
16
Q48. Will you please describe Exhibit A-16, Schedule F8? 17
A48. This exhibit contains the proposed tariff sheet changes which result from the pricing 18
changes described above. 19
20
Proposed Tariff Changes 21
Q49. Are you proposing any changes to E1 or D9 Outdoor Lighting tariff sheets? 22
A49. Yes. We are proposing to clarify the tariff language for E1 and D9 customers taking 23
Dusk to Midnight service or Experimental Programmable Photocell service. 24
25
R. A. BELLINI Line U-20836 No.
RAB-30
Q50. What changes are you proposing to make to the Dusk to Midnight service and 1
Experimental Programmable Photocell service tariff billing provisions? 2
A50. We are proposing to add clarifying language to properly reflect how discounts for 3
these two billing provisions are calculated. As currently written, the tariff only 4
includes the discount for the Distribution Charge per lamp, per month for both Dusk 5
to Midnight and Experimental Programmable Photocell services and both do not 6
reflect the Energy Charge savings. To adjust for this, we are proposing to add the 7
underscored verbiage to the tariff language: 8
Dusk to Midnight Service: For service to parking lots from dusk to approximately 9
twelve o’clock midnight E.S.T., a distribution discount of 1.060¢ per nominal lamp 10
size wattage per month and a 50% reduction in the average monthly hours of use 11
will be applied. One control per circuit or luminaire will be provided. 12
Experimental Programmable Photocell Service: Customers may elect to place 13
luminaires on photocells that are programmable to turn off lights at pre-determined 14
times during the night. A distribution discount of 1.060¢ per nominal lamp size 15
wattage per month and a 50% reduction in the average monthly hours of use will 16
be applied. 17
18
Plan to Reduce Overhead Fed Lighting Costs & Discussion of Technological 19
Effiencies 20
Q51. What efforts have been undertaken by DTE Electric to control costs for 21
maintaining E1 Option I overhead fed streetlighting? 22
A51. DTE Electric has focused on three key areas to ensure that costs for maintaining its 23
overhead fed streetlights are minimized: 1) Coordinating the use of night patrols 24
for the purpose of canvassing E1 option I streetlights to proactively identify 25
R. A. BELLINI Line U-20836 No.
RAB-31
outages, 2) Working with municipalities who, as part of their agreement chose non-1
standard luminaires or posts referred to as special order materials (SOM), in an 2
effort to safeguard from depletion of their inventory, and 3) Generating a new 3
revenue stream for safe deployment of 3rd party attachments, for which after-tax 4
revenues would be used to offset E1 Option I revenue requirement. 5
6
As previously mentioned, DTE Electric began piloting a formal night patrol process, 7
the intent of which is to proactively identify outages and reduce the number of 8
reactive outages responded to by crews authorized by DTE Electric. Though in the 9
short term, total outage restoration costs may increase because of outages that are 10
identified proactively, number of events and costs over the long term are expected 11
to decrease as a result of outage events being repaired on a planned basis, as opposed 12
to a reactive basis (which may be higher in cost). As night patrols are completed, 13
DTE Electric is cataloging data to identify outages as a percentage of total E1 Option 14
I streetlights by city or municipality, the nature of the outage (i.e. lamp failure, cable 15
failure), and where the outages are occurring. This information will then be used to 16
exercise warranty provisions for premature luminaire failures, as well as targeting 17
specific circuits subject to recurring failures for capital replacement projects, 18
thereby reducing long term maintenance costs. 19
20
DTE Electric completed in 2020, a joint review of all city and municipal agreements 21
for which “Special Order Material” (SOM) is included, and where a minimum stock 22
level to be maintained by the city or municipality is specified. This joint review was 23
intended to reaffirm city or municipal minimum reorder points for SOM materials 24
and have this material available to DTE Electric when an SOM related outage 25
R. A. BELLINI Line U-20836 No.
RAB-32
occurs. Several of DTE Electric’s follow-up outage defects are attributable to the 1
lack of SOM inventory, and average significantly higher restoration times when 2
inventory is unavailable. In addition to extended outages, DTE Electric will 3
typically incur the cost for multiple trip charges when the city or municipality does 4
not have SOM material in stock. We are also working with cities and municipalities 5
to provide standard stock options to those who no longer want to maintain SOM 6
materials. As cities and municipalities begin to restock their inventories or transition 7
to standard stock options, we expect to see a reduction in cost and outage duration 8
associated with SOM streetlights. 9
10
Lastly, DTE Electric has negotiated agreements that allow 3rd party attachments to 11
municipal streetlights. Each attachment will require a permit to be issued by both 12
DTE Electric as well as the city or municipality in which the proposed attachment 13
will be made. DTE Electric requires that the 3rd party submit a passing structural 14
analysis, certified by a professional engineer prior to the issuance of a permit. Rental 15
revenues generated from each attachment will be recorded in account 454, Rent 16
from Electric Property, and allocated to E1 Option I Rate Schedule. Rental revenues 17
will reduce the revenue requirement for E1 Option I customers. 18
19
Q52. What efficiencies have been gained through the use of technology? 20
A52. As part of DTE Electric’s plan to address and increase reliability of our grid, the 21
Advanced Distribution Management System (ADMS) project is currently being 22
implemented. One of the components of ADMS, referred to as the Outage 23
Management System (OMS), will target efficiencies through improved reporting 24
and data tracking specific managing outage restoration events. The current system 25

R. A. BELLINI Line U-20836 No.
RAB-33
used to manage outage events will be retired in 2022 and be replaced with several 1
new tools as part of OMS. The goal is to provide an integrated platform whereby 2
our mapping and job tracking will be linked. This will reduce the likelihood for 3
errors by no longer having to transfer data between multiple systems. We expect 4
that this will also reduce restoration costs by eliminating multiple events being 5
created for the same location and allow for us to know in real time where our crews 6
have been dispatched. Refer to the testimony of Company Witness Elliott-7
Andahazy for additional information pertaining to ADMS and OMS. 8
9
Finally, we continue to evaluate vendor proposals for a smart streetlight network 10
that would allow for real-time feedback significant load changes, service 11
interruptions, and outages specific to streetlights. A key factor in this evaluation 12
process is the initial capital investment cost as well as ongoing O&M costs to 13
maintain a smart network, and the impact on rate design to our municipal customers. 14
As previously mentioned, we are piloting a night patrol process that will canvass 15
cities and municipalities to proactively identify outage events as a cost-effective 16
alternative until a decision is made on implementing a smart streetlight network. 17
18
Q53. Does this complete your direct testimony? 19
A53. Yes, it does.20

STATE OF MICHIGAN
BEFORE THE MICHIGAN PUBLIC SERVICE COMMISSION
In the matter of the Application of )
DTE ELECTRIC COMPANY )
for authority to increase its rates, amend ) Case No. U-20836
its rate Schedules and rules governing the )
distribution and supply of electric energy, and )
for miscellaneous accounting authority. )
QUALIFICATIONS
AND
DIRECT TESTIMONY
OF
SHAWN D. BURGDORF

DTE ELECTRIC COMPANY
QUALIFICATIONS AND DIRECT TESTIMONY OF SHAWN D. BURGDORF Line No.
SDB - 1
Q1. What is your name, business address and by whom are you employed? 1
A1. My name is Shawn D. Burgdorf. My business address is 414 S. Main Street, Suite 2
300, Ann Arbor, Michigan 48104. I am employed by DTE Electric Company (DTE 3
Electric or Company). 4
5
Q2. What is your current position with the Company? 6
A2. I am currently the Manager of the Power Supply Strategy & Modeling team within 7
the Generation Optimization department. 8
9
Q3. What is your educational background? 10
A3. I received a Bachelor of Science Degree in Mechanical Engineering from 11
University of Michigan in 2005. I also received a Master of Business 12
Administration Degree from Eastern Michigan University in 2016. 13
14
Q4. Do you hold any certifications? 15
A4. Yes. I am certified as a North American Electric Reliability Council (NERC) 16
Certified System Operator for balancing and interchange. I have also attended 17
Utility Rate School and the Advanced Regulatory Studies Program, both hosted by 18
the National Association of Regulatory Utility Commissioners (NARUC) and The 19
Institute of Public Utilities Michigan State University. 20
21
Q5. What is your work experience? 22
A5. After receiving my Bachelor’s degree from the University of Michigan in 2005, I 23
was employed by Consumers Energy Company (Consumers Energy). During my 24
initial employment at Consumers Energy, I worked in their production cost 25

S. D. BURGDORF Line U-20836 No.
SDB - 2
modeling group where I supported the development of power supply forecasts using 1
the PROMOD® model as the basis. In 2009, I transferred positions into the 2
Transmission and Regulatory Strategies Department. In this role, I was responsible 3
for monitoring and analyzing filings by the Midcontinent Independent System 4
Operator, Inc. (MISO) at the Federal Energy Regulatory Commission (FERC). I 5
was also responsible for forecasting future transmission and certain energy market-6
related costs in Power Supply Cost Recovery (PSCR) proceedings before the 7
Michigan Public Service Commission (Commission or MPSC). 8
9
In 2012, I began my employment at DTE Electric within the Generation 10
Optimization Department. In 2015, I was promoted to a Supervisor position and 11
subsequently in October 2018, I was promoted to my current Manager position 12
within Generation Optimization. 13
14
Q6. What are your duties and responsibilities in your current position? 15
A6. My current responsibilities include acquisition of wholesale electric power supply 16
to reliably and economically serve the energy and capacity requirements of the 17
Company’s customers including: optimization of the Company’s generation assets, 18
including renewable energy facilities, within the wholesale power market; 19
management of emission allowance procurement; management of resource 20
adequacy processes; modeling the DTE Electric generation fleet; optimizing 21
financial transmission rights; and review and advocacy of the Company’s 22
recommendations regarding proposed MISO rules, regulations, and business 23
practices. 24
25
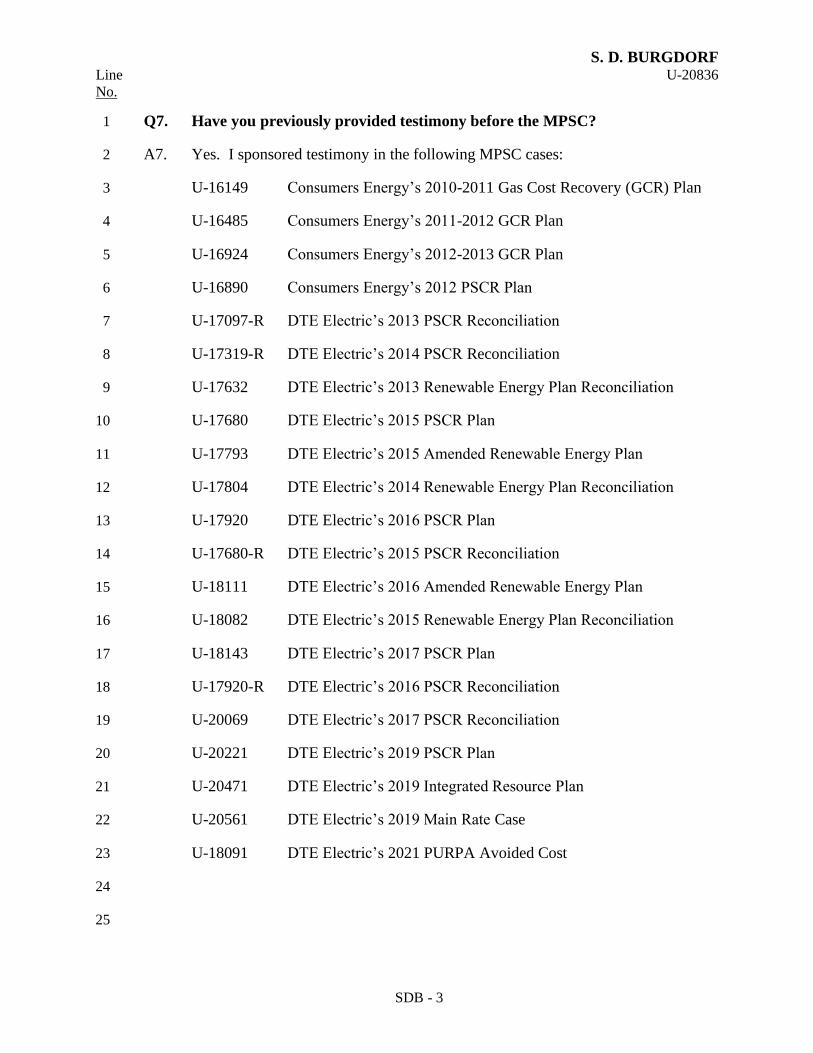
S. D. BURGDORF Line U-20836 No.
SDB - 3
Q7. Have you previously provided testimony before the MPSC? 1
A7. Yes. I sponsored testimony in the following MPSC cases: 2
U-16149 Consumers Energy’s 2010-2011 Gas Cost Recovery (GCR) Plan 3
U-16485 Consumers Energy’s 2011-2012 GCR Plan 4
U-16924 Consumers Energy’s 2012-2013 GCR Plan 5
U-16890 Consumers Energy’s 2012 PSCR Plan 6
U-17097-R DTE Electric’s 2013 PSCR Reconciliation 7
U-17319-R DTE Electric’s 2014 PSCR Reconciliation 8
U-17632 DTE Electric’s 2013 Renewable Energy Plan Reconciliation 9
U-17680 DTE Electric’s 2015 PSCR Plan 10
U-17793 DTE Electric’s 2015 Amended Renewable Energy Plan 11
U-17804 DTE Electric’s 2014 Renewable Energy Plan Reconciliation 12
U-17920 DTE Electric’s 2016 PSCR Plan 13
U-17680-R DTE Electric’s 2015 PSCR Reconciliation 14
U-18111 DTE Electric’s 2016 Amended Renewable Energy Plan 15
U-18082 DTE Electric’s 2015 Renewable Energy Plan Reconciliation 16
U-18143 DTE Electric’s 2017 PSCR Plan 17
U-17920-R DTE Electric’s 2016 PSCR Reconciliation 18
U-20069 DTE Electric’s 2017 PSCR Reconciliation 19
U-20221 DTE Electric’s 2019 PSCR Plan 20
U-20471 DTE Electric’s 2019 Integrated Resource Plan 21
U-20561 DTE Electric’s 2019 Main Rate Case 22
U-18091 DTE Electric’s 2021 PURPA Avoided Cost 23
24
25

S. D. BURGDORF Line U-20836 No.
SDB - 4
1
Q8. What is the purpose of your testimony in this proceeding? 2
A8. The purpose of my testimony is to establish the projected wholesale market energy 3
sales revenue net of fuel including the reconciliation of costs in 2020. To do this, 4
I projected capacity-related generation costs in the 2022 PSCR Plan, projected 2022 5
wholesale market revenues from energy and ancillary services sales from the 6
Company’s capacity resources, and the fuel related cost associated with the 7
Company’s capacity resources. This information is used by Company Witness Mr. 8
Maroun in his calculation of cost of service. 9
10
I will also provide an overview of: 1) the MISO resource adequacy requirements 11
and capacity market, 2) the capacity import limit (CIL) enforced by MISO in the 12
Planning Resource Auction (PRA) and its impact on Zone 7, and 3) the MISO Zone 13
7 capacity position for Planning Years 2020/21 and 2021/2022, as well as a 14
forecasted capacity position for Planning Year 2025/26. 15
16
Finally, I will discuss the Commission ordered Net Present Value Revenue 17
Requirement (NPVRR) or economic evaluation analysis completed on the Belle River 18
Power Plant. 19
20
Q9. Are you sponsoring any exhibits in this proceeding? 21
A9. Yes. I am sponsoring the following exhibits: 22
Exhibit Schedule Description 23
A-12 B6.1 Belle River Power Plant 2026 NPVRR Analysis 24
A-12 B6.2 Belle River Power Plant 2028 NPVRR Analysis 25

S. D. BURGDORF Line U-20836 No.
SDB - 5
A-12 B6.3 Belle River Power Plant 2030 NPVRR Analysis 1
A-26 P1 Projected 2022 PURPA Capacity-Related Generation 2
Cost 3
A-26 P2 Projected 2022 PA295/PA342 Capacity-Related 4
Generation Cost 5
A-26 P3 Projected 2022 Capacity-Related Generation Cost & 6
Energy Sales Revenue Net of Fuel Cost Including 2020 7
Reconciliation 8
A-26 P4 2020 Energy Sales Revenue Net of Fuel Cost 9
10
Q10. Were these exhibits prepared by you or under your direction? 11
A10. Yes, they were. 12
13
Q11. Section 6w(3)(A) of Act 341 requires that for rate design purposes the capacity 14
charge include capacity-related generation costs in the Company’s PSCR 15
mechanism. What are the capacity-related generation costs included in the 16
Company’s PSCR mechanism? 17
A11. The Company’s PSCR mechanism includes capacity-related generation costs 18
associated with Public Utility Regulatory Policies Act of 1978 (PURPA) power 19
purchase agreements, PA295/PA342 Company-owned renewable energy systems, 20
PA295/PA342 renewable energy contracts, and capacity purchases. 21
22
Q12. How did the Company project the 2022 capacity-related generation costs for 23
PURPA power purchase agreements as included in its PSCR plan filing in 24
Case No. U-21050? 25

S. D. BURGDORF Line U-20836 No.
SDB - 6
A12. The Company’s PURPA contracts have three rate components: fixed, operation and 1
maintenance (O&M), and variable. The projections for both the fixed and O&M 2
components were included in the capacity-related generation costs. The total 3
projected 2022 PURPA capacity-related generation cost is $11.1 million as shown 4
on Exhibit A-26, Schedule P1. 5
6
Q13. What costs associated with PA295/PA342 Company-owned renewable energy 7
systems and power purchase agreements are included in the PSCR? 8
A13. The portion of the cost of PA295/PA342 Company-owned renewable energy 9
systems that is passed through the PSCR Transfer Price mechanism is the approved 10
Transfer Price Schedule or the levelized cost of energy for the renewable energy 11
systems. The portion of the cost of PA295/PA342 power purchase agreements (i.e., 12
non-Company owned) that is passed through the PSCR mechanism is the lower of 13
the Transfer Price approved for the power purchase agreement and the contract 14
price of the agreement. 15
16
The Transfer Price is a proxy for the incremental non-renewable capacity and energy 17
expense that would be passed on to the customer if the renewable energy resource 18
was not developed. The relevant statute explains that when setting the Transfer 19
Price, the Commission shall consider factors including, but not limited to, projected 20
capacity, energy, maintenance, and operating costs, information filed under Section 21
6j of 1939 PA 3 (MCL 460.6j), and wholesale market data including, but not limited 22
to, locational marginal pricing. 23
24

S. D. BURGDORF Line U-20836 No.
SDB - 7
Q14. How did the Company project the 2022 capacity-related generation costs for 1
PA295/PA342 company-owned renewable energy systems and power purchase 2
agreements? 3
A14. The capacity-related generation cost for PA295/PA342 Company-owned and non-4
Company-owned renewable energy systems and power purchase agreements is the 5
approved Transfer Price fixed component for each specific renewable energy 6
system. The total projected 2020 PA295/PA342 capacity-related generation cost is 7
$113.1 million as shown on Exhibit A-26, Schedule P2. 8
9
Q15. How did the Company project the 2022 cost of capacity purchases? 10
A15. The Company included the net capacity purchase costs based on the 2022 PSCR 11
Plan forecasted expense for the calendar year 2022. The expense includes the 12
Company’s net transactions within the MISO annual Planning Resource Auctions 13
(PRA) covering the 2022 calendar year1. Consistent with the amount filed in Case 14
No. U-21050, the total projected cost of capacity purchases is $0.8 million as shown 15
on Exhibit A-26, Schedule P3, line 6. 16
17
Q16. How did the Company calculate the projected 2022 energy sales revenue net 18
of projected fuel costs per Section 6w(3)(B) of Act 341? 19
A16. Section 6w(3)(B) of Act 341 requires that the revenue, net of projected fuel costs, 20
from energy market sales, off-system energy sales, ancillary services sales, and 21
energy sales under unit-specific bilateral contracts be subtracted from the 22
Company’s capacity costs before calculating its capacity charge. I performed the 23
calculation consistent with the method as directed by the Commission in Case No. 24
1 MISO annual resource adequacy auctions cover the Planning Year from June 1st – May 31st. The 2021/22 Planning Year auction covers January 1st – May 31st, 2022 and the 2022/23 Planning Year auction covers June 1st – December 31st, 2022.
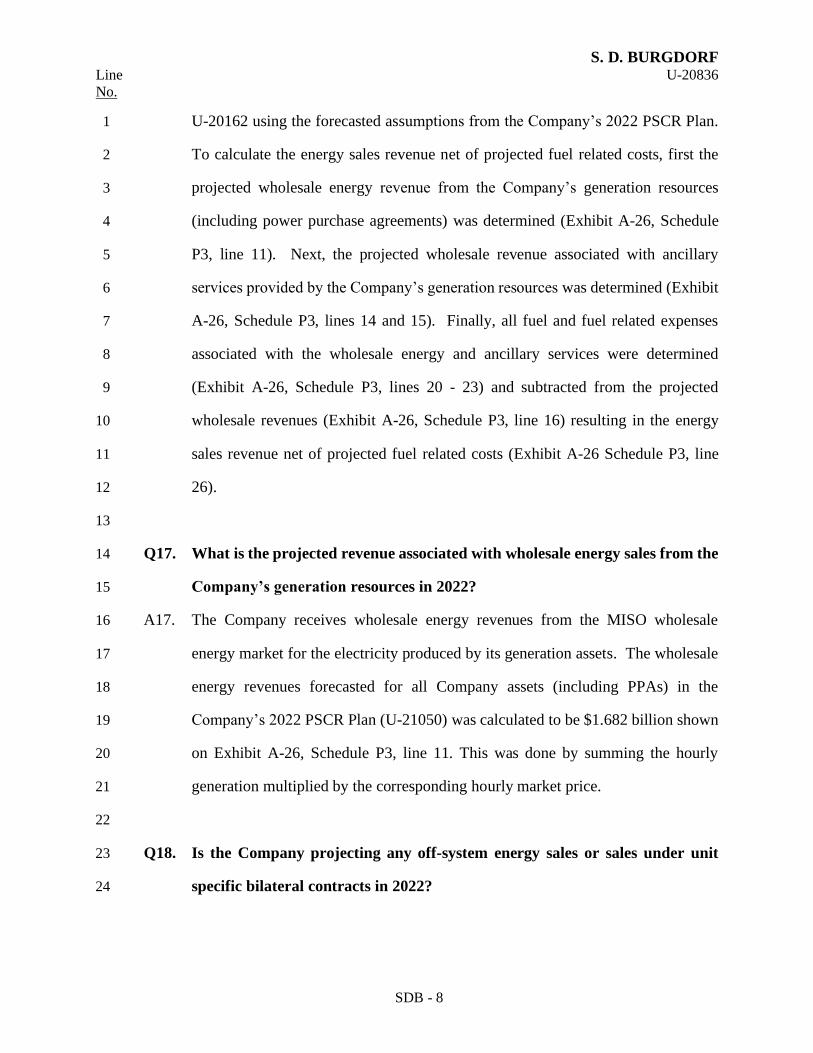
S. D. BURGDORF Line U-20836 No.
SDB - 8
U-20162 using the forecasted assumptions from the Company’s 2022 PSCR Plan. 1
To calculate the energy sales revenue net of projected fuel related costs, first the 2
projected wholesale energy revenue from the Company’s generation resources 3
(including power purchase agreements) was determined (Exhibit A-26, Schedule 4
P3, line 11). Next, the projected wholesale revenue associated with ancillary 5
services provided by the Company’s generation resources was determined (Exhibit 6
A-26, Schedule P3, lines 14 and 15). Finally, all fuel and fuel related expenses 7
associated with the wholesale energy and ancillary services were determined 8
(Exhibit A-26, Schedule P3, lines 20 - 23) and subtracted from the projected 9
wholesale revenues (Exhibit A-26, Schedule P3, line 16) resulting in the energy 10
sales revenue net of projected fuel related costs (Exhibit A-26 Schedule P3, line 11
26). 12
13
Q17. What is the projected revenue associated with wholesale energy sales from the 14
Company’s generation resources in 2022? 15
A17. The Company receives wholesale energy revenues from the MISO wholesale 16
energy market for the electricity produced by its generation assets. The wholesale 17
energy revenues forecasted for all Company assets (including PPAs) in the 18
Company’s 2022 PSCR Plan (U-21050) was calculated to be $1.682 billion shown 19
on Exhibit A-26, Schedule P3, line 11. This was done by summing the hourly 20
generation multiplied by the corresponding hourly market price. 21
22
Q18. Is the Company projecting any off-system energy sales or sales under unit 23
specific bilateral contracts in 2022? 24

S. D. BURGDORF Line U-20836 No.
SDB - 9
A18. No. These values are shown as zero on Exhibit A-26, Schedule P3, lines 12 and 1
13. 2
3
Q19. What is the projected ancillary services revenue from the Company’s 4
generation resources in 2022? 5
A19. The Company receives wholesale revenue for providing the following ancillary 6
services: regulation reserves, spinning reserves, and supplemental reserves (all 7
settled via MISO’s energy and ancillary services market) and reactive reserves 8
(settled per Schedule 2 of the MISO tariff). The Company’s 2022 PSCR Plan 9
projected that Company’s generation resources would generate $1.5 million of 10
wholesale revenue associate with regulation, spinning, and supplemental reserves 11
and $10.8 million of revenue associated with Schedule 2 reactive reserves. The 12
projected wholesale ancillary services revenues from the Company’s generation 13
resources in 2022 are shown on Exhibit A-26, Schedule P3, lines 14 and 15. 14
15
Q20. What is the total projected wholesale energy sales revenue including ancillary 16
services in 2022? 17
A20. The total projected wholesale energy sales revenue including ancillary services in 18
2022 is $1.694 billion as shown on Exhibit A-26, Schedule P3, line 16. 19
20
Q21. What is the projected fuel and fuel related cost required to generate the 21
projected wholesale energy and ancillary services sales from the Company’s 22
generation resources in 2022? 23
A21. The projected fuel and fuel related cost required to make the energy and ancillary 24
services market sales is projected from the generation in the 2022 PSCR Plan and 25

S. D. BURGDORF Line U-20836 No.
SDB - 10
includes: fuel, emission allowance expenses, fuel chemical expenses, Schedule 17 1
market administration expense, variable component of power purchase agreements, 2
and the variable component of renewables (based on removing the fixed component 3
of the MPSC-approved transfer prices from the overall transfer price). Total 4
projected fuel and fuel related costs for the Company’s generation fleet are $798.9 5
million as shown on Exhibit A-26, Schedule P3, line 24. 6
7
Q22. What are the Schedule 17 market administration costs associated with the 8
projected wholesale energy sales described above that should be netted against 9
the wholesale revenue? 10
A22. MISO incurs costs when providing the following services including, but not limited 11
to: 1) market modeling and scheduling functions; 2) market bidding support; 3) 12
locational marginal pricing support; 4) market settlements and billing; 5) market 13
monitoring functions; and, 6) simultaneous co-optimization for the scheduling and 14
enabling of the least-cost, security-constrained commitment and dispatch of 15
Generation Resources to serve Load and provide Operating Reserves in the MISO 16
Balancing Authority Areas while also establishing a spot energy market. MISO 17
recovers these Energy and Operating Reserve Markets Support Administrative 18
Service Cost through a recovery adder filed as Schedule 17 in the MISO tariff. The 19
projected Schedule 17 rate for 2022 is $0.0843/MWh, so the Schedule 17 20
administration fees associated with the projected generation in 2022 is $3.7 million 21
as shown on Exhibit A-26, Schedule P3, line 23. These expenses need to be 22
included as they would not be incurred if the generation sales did not occur. 23
24

S. D. BURGDORF Line U-20836 No.
SDB - 11
Q23. What was the Company’s actual wholesale energy sales revenue net of fuel 1
related costs in 2020? 2
A23. I calculated the Company’s actual wholesale energy sales revenue net of fuel 3
related costs in 2020, which is shown on Exhibit A-26, Schedule P4, line 12, 4
column (c). That actual amount was $245.3 million less than the projected 5
wholesale energy sales revenue net of fuel related costs embedded in the 6
Company’s rate design in effect in 2020. 7
8
Q24. What is the Company’s projected wholesale energy sales revenue net of 9
projected fuel costs per Section 6w(3)(B) of Act 341 for 2022 including the 10
reconciliation of 2020? 11
A24. The total projected 2022 wholesale energy sales revenue of $1.694 billion, net of 12
$0.799 billion in fuel related costs equates to $895 million wholesale energy sales 13
revenue net of fuel related costs as shown on Exhibit A-26, Schedule P3, line 26. 14
The reconciliation of the net sales benefit difference for 2020 of $245.3 million 15
(Exhibit A-26, Schedule P4, Line 12, column (d)) was subtracted from the 2022 16
projection resulting in an amount of $649.9 million (Exhibit A-26, Schedule P3, 17
Line 28). This amount was provided to Company Witness Maroun to develop his 18
capacity related cost of service. 19
20
Overview of the Resource Adequacy Requirements and Capacity Market 21
Q25. Who establishes the resource adequacy planning requirements with which the 22
Company must comply? 23
A25. Resource adequacy requirements are governed by a combination of the North 24
American Electric Reliability Corporation (NERC), MISO, and the MPSC. The 25
MISO tariff requires the Company to develop a resource adequacy plan that 26

S. D. BURGDORF Line U-20836 No.
SDB - 12
complies with the reliability standards set forth by the NERC. NERC Standard 1
BAL-502-RFC-02 “Planning Resource Adequacy Analysis, Assessment and 2
Documentation” requires the Planning Coordinator to calculate a planning reserve 3
margin for each planning year. MISO is the Planning Coordinator for the 4
Midcontinent ISO region. MCL 460.6w (PA 341) requires the Company to 5
demonstrate, annually, that it will have sufficient resources to meet its projected 6
planning reserve margin on a four-year forward basis. This Michigan requirement 7
is intended to ensure proper longer-term planning for resource adequacy, which is 8
not the case with MISO’s one-year annual planning cycle as further discussed in 9
my testimony. 10
11
Q26. How are capacity planning reserve margin requirements established by 12
MISO? 13
A26. Each year, MISO establishes a Planning Reserve Margin (PRM) which is the 14
amount of capacity above the expected weather-normalized peak demand required 15
to reliably serve load in the entire MISO region. A PRM is intended to maintain 16
reliable operation while meeting unforeseen events such as extreme weather and 17
unexpected capacity outages. The PRM is established by performing a Loss of 18
Load Expectation (LOLE) study which considers factors including, but not limited 19
to: generator forced outage rates, generator planned outages, expected performance 20
of load modifying resources, load forecasting uncertainty, and transmission system 21
import and export capabilities. The PRM is established using a LOLE of 1 day per 22
10 years which is the industry standard. 23
24
Q27. How does MISO implement its resource adequacy requirements? 25

S. D. BURGDORF Line U-20836 No.
SDB - 13
A27. MISO’s resource adequacy requirements are annual and implemented for the 1
immediately upcoming planning year only. Every year, Load Serving Entities 2
(LSE) in MISO are required to demonstrate compliance with their Planning Reserve 3
Margin Requirement (PRMR), which is their forecasted peak demand (coincident 4
with the MISO’s peak demand) plus the required PRM. The PRMR compliance 5
process is executed by MISO in the spring immediately prior to the planning year 6
that begins on June 1. MISO LSEs must meet their PRMR through a combination 7
of: submitting a Fixed Resource Adequacy Plan (an LSE’s plan showing rights to 8
sufficient resources to meet its PRMR), purchasing capacity through MISO’s PRA 9
at the same time as separately selling or self-scheduling (offering into the auction 10
at a price of zero as a “price taker”) any capacity they may own, or paying a capacity 11
deficiency charge. 12
13
MISO’s PRA does not guarantee the availability of capacity and if there are 14
insufficient resources to meet demand in the PRA, resource adequacy will not be 15
achieved. In fact, a capacity shortage situation could easily arise because MISO’s 16
PRA is for a term of only one Planning Year and it is performed only two months 17
prior to that Planning Year, whereas the planning and construction of new 18
generating capacity can take several years. When LSEs properly plan for the long-19
term capacity needs of their customers, the PRA works as a residual auction for the 20
upcoming Planning Year by providing a means to buy and sell small amounts of 21
capacity needed due to normal variances in load and generation. 22
23
Q28. How does MISO implement local reliability requirements? 24

S. D. BURGDORF Line U-20836 No.
SDB - 14
A28. MISO developed Local Resource Zones (LRZs) based on criteria including 1
electrical boundaries, state boundaries, transmission interconnections and 2
geographic boundaries. There are ten LRZs within MISO and the Company’s 3
service territory is in LRZ 7 which is comprised of most of the lower peninsula of 4
Michigan. As part of MISO’s annual LOLE study, the CIL and Capacity Export 5
Limit (CEL) of each LRZ are determined along with the Local Clearing 6
Requirement (LCR), which is the minimum amount of unforced capacity (UCAP, 7
the amount of capacity assigned to a resource utilizing historic availability) that 8
must be physically located within a LRZ in order to maintain reliability. Simply 9
stated, to reliably serve load a minimum amount of capacity must be located near 10
the load due to the limitations of the transmission system to import additional 11
capacity. 12
13
When conducting the PRA, MISO enforces the LCRs, CILs and CELs using a multi-14
zone optimization methodology and commits capacity up to the PRM requirements 15
of all LSEs. Because both the LCR and PRMR must be enforced in the PRA to 16
ensure a reliability of 1 day per 10 years LOLE, the actual amount of capacity 17
imports that clear in the PRA can be constrained further than the CIL resulting in an 18
effective CIL, which I refer to as ECIL, which is calculated by the following 19
formula: ECIL = PRMR - LCR. This ensures that sufficient existing resources are 20
committed, if available, in each LRZ to reliably serve load. 21
22
The PRA Auction Clearing Price (ACP) is procedurally set to the maximum clearing 23
price of the Cost of New Entry (CONE) when there is insufficient capacity to meet 24
the LCR of a zone or the total PRMR for the MISO footprint. CONE is an industry-25

S. D. BURGDORF Line U-20836 No.
SDB - 15
wide term used to indicate the current, annualized, capital cost of constructing a 1
hypothetical advanced combustion turbine (CT). 2
3
Overview of the Effective Capacity Import Limit (ECIL) for MISO Zone 7 4
Q29. What was the Zone 7 ECIL for Planning Years 2020/21 and 2021/22 as well as 5
what is projected for 2022/23? 6
A29. The Zone 7 ECIL was 95 MW (ECIL = PRMR – LCR = 21,945 – 21,851 = 95 7
MW) using MISO PRA results for Planning Year (PY) 2020/21 and 1,749 MW for 8
Planning Year 2021/22. This means that for PRA purposes, only 95 MW of 9
capacity resources from outside LRZ 7 could be used to meet the Zone 7 PRMR 10
requirement without violating the LCR constraint in PY 2020/21 while that amount 11
changed significantly in a single year to 1,749 MW in PY 2021/22. The projected 12
ECIL for PY 2022/23 is ~773 MW which further demonstrates the volatility of 13
ECIL by a projected drop of ~1,000 MW for PY 2022/23 from PY 2021/22. 14
15
Q30. Do you have concerns about relying on imports and the ability to import 16
capacity external to Zone 7? 17
A30. Yes. The ECIL can be utilized by all LSEs in LRZ 7. However, there is currently 18
no allocation process; thus, uncertainty exists on the ECIL availability that can be 19
relied upon by an individual LSE. This can result in reduced reliability if LSEs 20
count on too much imported capacity and collectively exceed the ECIL. The 21
historical variability in MISO resource planning requirements (e.g. the large change 22
in ECIL over the past two PYs) poses both a reliability (not meeting federal 23
reliability standards) and cost risk by relying on resources external to Zone 7. 24
Customers are exposed to the potential of additional costs when using resources 25

S. D. BURGDORF Line U-20836 No.
SDB - 16
outside of Zone 7 to meet resource adequacy requirements. For example, when 1
non-Zone 7 capacity is used, the Company would receive the ZRCs from this out-2
of-zone resource and use the ZRCs to meet its Zone 7 capacity requirement to serve 3
customer demand. However, if the Zone 7 auction clearing price is CONE due to 4
insufficient resources to meet the LCR, customers may be subject to a Zonal 5
Deliverability Charge. This charge occurs when there is a difference in the auction 6
clearing price between the MISO zone in which the resource is located and the zone 7
in which the LSE is located. 8
9
Overview of the MISO Zone 7 Capacity Position for Planning Years 2020/21, 10
2021/22 and Forecasted Capacity Position for Planning Year 2025/26 11
Q31. What were the PRA results for MISO Zone 7 in Planning Years 2020/21 and 12
2021/22? 13
A31. MISO Zone 7 did not meet its LCR for Planning Year 2020/21. This resulted in 14
the Zone 7 price clearing at the auction maximum CONE ($94,000/MW-year) and 15
was the first time that any Zone in MISO has not met its resource adequacy 16
requirements since the beginning of the MISO annual capacity construct in 2013. 17
The Zone 7 resource adequacy shortfall indicated the local reliability in Zone 7 was 18
worse than the federal reliability standard of a 1 day in 10 years loss of load event. 19
MISO Zone 7 did meet its LCR for Planning Year 2021/22 which shows the 20
variability in changing planning requirements from year to year. 21
22
Q32. How have the total Zone 7 resources changed over the past few Planning 23
Years? 24

S. D. BURGDORF Line U-20836 No.
SDB - 17
A32. The UCAP value of all resource types in Zone 7 has seen a slight decrease over the 1
past few Planning Years. Table 1 shows the total resource UCAP values in Zone 7 2
by Planning Year. 3
4
Table 1: Zone 7 Resources (MW) by Planning Year (PY) 5
Description1 PY 2018/19 PY 2019/20 PY 2020/21 PY 2021/22
Zone 7 Resources 22,036 22,063 21,728 21,666
1) Data from actual MISO summaries of PRA results
6
Q33. Are there any significant capacity resource additions/retirements expected for 7
MISO Zone 7 between Planning Year 2021/22 and Planning Year 2025/26? 8
A33. Yes. DTE Electric is commissioning the Blue Water Energy Center in Planning 9
Year 2022/23 along with retiring the remaining St. Clair units and Trenton Channel 10
9 unit. DTE Electric plans to add renewable generation of approximately 801 MW 11
of UCAP over the Planning Years 2022/23 through 2025/26. Additionally, 12
Consumers Energy has filed an Integrated Resource Plan on June 30, 2021 (MPSC 13
Case U-20190) with significant changes to their resource mix. 14
15
The most recent capacity demonstration report published on March 26, 2021 by the 16
MPSC in Case No. U-20886 shows total Zone 7 resources at 21,943 MW for 17
Planning Year 2024/25. This capacity demonstration report does not extend beyond 18
Planning Year 2024/25, so I held the Zone 7 resources flat for the Planning Year 19
2025/26. I believe this value, adjusted to 21,623 MW (Table 5, Line 6) for known 20
DTE Electric capacity value changes, risk of delays in DTE renewable build plan, 21
and adjustments for Consumers IRP filed on June 30, 2021 to be a reasonable 22
forecast for Planning Year 2025/26. Considering the extensive addition of 23

S. D. BURGDORF Line U-20836 No.
SDB - 18
renewable generation in the near-term Zone 7 forecast, there is the potential for 1
renewable project delays (both on project construction and transmission upgrades) 2
which risk not being completed prior to PY 2025/26. I accounted for this risk with 3
an assumption of a single renewable facility being delayed (~247 MW UCAP) to 4
develop the Zone 7 resource projection for PY 2025/26 as shown in Table 5. 5
6
Q34. What is the MISO Zone 7 Local Reliability Requirement (LRR)? 7
A34. The LRR represents the minimum amount of UCAP for an LRZ to meet its LOLE 8
without considering transmission ties to systems outside of the LRZ. The LRR is 9
a part of the equation to calculate the LCR. Holding all else equal, a higher LRR 10
results in a higher amount of capacity resources required to be located in a MISO 11
Zone. The equations for LRR and LCR are as follows: 12
LRR = (Per-Unit LRR) * Zonal Peak Demand 13
LCR = LRR – CIL - controllable exports by MISO 14
In recent years, there have been no controllable Zone 7 exports and the equation 15
simplifies to LCR = LRR – CIL. 16
17
Q35. How has the Per-Unit LRR changed over the past few Planning Years and 18
what is a reasonable forecast for Planning Year 2021/22? 19
A35. The historical Per-Unit LRR values for the past few Planning Years are shown in 20
Table 2. The Per-Unit LRR has shown an upward trend from 115.3% in Planning 21
Year 2018/19 to 121.2% in the most recent 2021/22 Planning Year. 22
Table 2: Zone 7 Historical Per-Unit LRR by Planning Year (PY) 23
Description 2018/19 2019/20 2020/21 2021/22
Zone 7 Per-Unit LRR1 115.3% 117.2% 119.5% 121.2%
1) Source: MISO LOLE reports published for corresponding Planning
Years

S. D. BURGDORF Line U-20836 No.
SDB - 19
1
There are many factors that MISO considers in its LOLE analysis when 2
determining reserve margins which include weather and economic uncertainty, 3
load, and generation. MISO completed their LOLE analysis for PY 2022/23 and 4
have published a Per-Unit LRR value of 119.4%. Even though the Per-Unit LRR 5
dropped slightly, it has been trending upward in the recent past as shown in Table 6
2. I believe holding flat the current 119.4% in projecting PY 2025/26 as a 7
reasonable and possibly conservatively low value. 8
9
Q36. How has the Zone 7 Peak forecasted demand changed over the past few 10
Planning Years and what is a reasonable near-term peak demand forecast? 11
A36. The Zone 7 peak forecasted demand values over the past few Planning Years 12
indicate a near-term downward trend as shown in Table 3. 13
14
Table 3: Zone 7 Historical Forecasted Peak Demand (MW) by Planning Year 15
Description PY 2018/19 PY 2019/20 PY 2020/21 PY 2021/22
Zone 7 Peak Demand1 21,174 21,350 20,963 20,296 1) PY 2018/19, PY 2019/20, PY 2020/21, PY 2021/22 data from preliminary PRA data published by MISO in corresponding years
16
The recent COVID-19 driven recession lowered DTE Electric’s load forecast for 17
Planning Year 2021/22 from recent years. However, DTE Electric is forecasting a 18
higher peak load demand for Planning Year 2022/23. To forecast Zone 7 peak 19
demand for Planning Year 2025/26, I removed DTE Electric’s peak demand forecast 20
used for Zone 7 in the 2020 MISO LOLE report for PY 2025/26 and added back 21
DTE Electric’s current (as of this case filing) peak demand forecast developed by 22

S. D. BURGDORF Line U-20836 No.
SDB - 20
Company Witness Leuker to determine a Zone 7 peak of 20,399 MW (Table 5, Line 1
1). 2
3
Q37. Does DTE Electric believe the MISO Zone 7 CIL will change significantly from 4
the Planning Year 2022/23 value in Planning Year 2025/26? 5
A37. It is uncertain how the CIL value will change in the future as historical values for 6
CIL have changed significantly year over year. The Table 4 shows the variability 7
in CIL values in recent years. 8
9
Table 4: Zone 7 Historical CIL value by Planning Year (in MWs) 10
Description 2018/19 2019/20 2020/21 2021/22 2022/23
Zone 7 CIL1 3,785 3,211 3,200 4,888 3,749
1) Source: MISO LOLE reports published for corresponding Planning Years
11
Q38. What were the MISO Zone 7 resources compared to the LCR for Planning 12
Years 2020/21, 2021/22 and what is your projection for potential MISO Zone 13
7 resources compared to the LCR for Planning Years 2022/23 and 2025/26? 14
A38. Table 5 shows the actual MISO Zone 7 resource position compared to the LCR for 15
Planning Years 2020/21 and 2021/2022. Table 5 also shows the forecasted MISO 16
Zone 7 resource positions compared to the forecasted LCR for Planning Years 17
2022/23 and 2025/26. The information in the table below is based on MISO data 18
from the 2021 LOLE report updated for DTE Electric peak demand changes, MISO 19
data from the Planning Year 2022/23 LOLE Results, MISO’s PRA results for 20
Planning Years 2020/21 and 2021/22 and the MPSC Staff Report for Zone 7 21
capacity demonstrations in Case U-20886 updated for DTE Electric resource 22
changes for Planning Years 2022/23 and 2025/26 and adjustments to Zone 7 23

S. D. BURGDORF Line U-20836 No.
SDB - 21
resources for PY 2025/26 to reflect Consumers Energy’s IRP filed on June 30, 1
2021. 2
3
Table 5: Planning Years 2020/21, 2021/22, forecasts for 2022/23 and 2025/26 4
Line
# Description
PY
2020/21
PY
2021/22
PY
2022/23 PY 2025/26
1 Zone 7 Peak Demand 20,963 20,296 20,7521 20,3991
2 LRR Unforced Capacity per-unit of Peak Demand2 119.5% 121.2% 119.4% 119.4%
3 Local Reliability Requirement (LRR = Line 1 x Line 2) 25,051 24,598 24,778 24,356
4 Capacity Import Limit (CIL) 3,200 4,888 3,7493 3,200 -4,8884
5 Local Clearing Requirement (LCR = Line 3 - Line 4) 21,851 19,710 21,029 19,468 - 21,156
6 Zone 7 Resources 21,728 21,666 21,5375 21,6236
7 Anticipated LCR Position (Line 6 - Line 5) (123) 1,956 508 467 - 2,155
8 Anticipated LCR Position without Belle River (Line 7
- 1,215 MW UCAP) (748) - 940
(1) Value based on 2020 LOLE Study Report updated for DTE peak load changes (2) LRR is based on PY 2022/23 value in MISO’s Planning Year 2022/23 LOLE Study Report
(3) CIL is based on PY 2022/23 value in MISO’s Planning Year 2022/23 LOLE Study Report
(4) CIL is based on historic range of CIL values
(5) Value based on U-20886 MPSC Staff Report and Recommendations updated for DTE resource changes (6) Value based on U-20886 MPSC Staff Report and Recommendations updated for DTE resource changes, risk of delays in DTE renewable build
plan, and adjustments for Consumers IRP filed on June 30th, 2021
5
Q39. Do you have any concerns about the forecasted MISO Zone 7 capacity 6
resources compared to the projected LCR for Planning Years 2022/23 and 7
2025/26? 8
A39. Yes. Table 5 shows that Zone 7 was short of its LCR in Planning Year 2020/21 and 9
long of its LCR in PY 2021/22. The fact that Zone 7 fell short of its LCR in 10
Planning Year 2020/21, the recent variability in MISO’s CIL year-over-year, the 11
changing resource mix in Zone 7, as well as siting and supply chain risks affecting 12
deployment of new renewable resources, presents a potential reliability concern 13
that Zone 7 may not have enough resources to meet its LCR in Planning Years 14
2022/23 and 2025/26. Unexpected outages that lead to capacity dis-accreditation, 15
timing to bring new generation online and changes in resource accreditation 16

S. D. BURGDORF Line U-20836 No.
SDB - 22
(particularly for renewable resources as their penetration within MISO increases) 1
are additional risks that may contribute to Zone 7 falling short of capacity in the 2
near future. Should Zone 7 fall short of capacity and thus the LCR not met, the 3
MISO auction clearing price for Zone 7 would be set at CONE (as was the case in 4
Planning Year 2020/21) and the probability of a loss of load event (an event in 5
which available capacity is insufficient to serve demand) would exceed the federal 6
reliability standards that govern the resource adequacy planning process. 7
8
Q40. What contribution does the Company’s Belle River Units have on the amount 9
of local generation capacity in PY 2025/26? 10
A40. The Company’s Belle River Power Plant provides approximately 1,200 MWs of 11
UCAP towards meeting the MISO Zone 7 LCR in Planning Year 2025/26. The 12
ability to reliably serve load in Zone 7 may be compromised if the Belle River units 13
were not available. As previously discussed, if Zone 7 does not meet the LCR, the 14
MISO auction clearing price for Zone 7 would be set at CONE and the probability 15
of a loss of load event would exceed the federal reliability standards that govern the 16
resource adequacy planning process. 17
18
19
Belle River Power Plant (BRPP) Economic Evaluation 20
Q41. Has the Company completed an economic analysis regarding continued 21
operations of the Belle River Power Plant (BRPP)? 22
A41. Yes. In the Order in Case No. U-20561 issued May 8, 2020, the Commission 23
ordered that a NPVRR analyzing BRPP using alternative retirement dates be 24
included in the Company’s next rate case. BRPP consists of two units, Units 1 and 25

S. D. BURGDORF Line U-20836 No.
SDB - 23
2. The Company has completed a NPVRR analysis, the results of which are 1
summarized on Exhibit A-12, Schedules B6.1 - B6.3. 2
3
Q42. What alternative retirement dates did the Company analyze? 4
A42. The NPVRR analysis of BRPP consisted of the following options: 5
• Retire BRPP in May 31, 2030 6
• Retire BRPP May 31, 2028 7
• Retire BRPP May 31, 2026 8
• Retire BRPP May 31, 2023 9
10
Q43. How did the Company structure its NPVRR analysis? 11
A43. For the NPVRR analysis, the Company assessed the incremental benefits and costs 12
for four retirement options and calculated the net difference between the NPVRR 13
of each option. 14
15
A NPVRR was calculated for each sensitivity in each retirement analysis. A 16
summary of the sensitivities for each analysis is shown in Exhibit A-12, Schedule 17
B6.1 - B6.3, page 2 of 6. A total of four NPVRR sensitivities were examined with 18
capacity price inputs ranging from $0 to CONE at $94.80/kW-year. In each 19
sensitivity, each retirement option incorporates the benefits and costs of specific 20
value components. The total benefit and cost of each component for each option is 21
summarized on pages 3 through 6 in lines 4 and 5, columns (b) through (g) with the 22
total and overall NPVRR listed in column (h), line 6. Line 7, columns (b) through 23
(p) list each year and lines 10 through 16, column (a) provides the value 24
components that are included: operations and maintenance (O&M) expense, fuel 25

S. D. BURGDORF Line U-20836 No.
SDB - 24
costs, energy and capacity purchases, capital investment, and property tax expense. 1
The resulting net difference between the NPVRR of each component is listed in 2
column (q) and summed up in line 16. 3
4
Each NPVRR sensitivity considered assumptions listed on Exhibit A-12, Schedule 5
B6.1 - B6.3, page 1 of 6. The assumptions for this analysis have been provided by 6
the respective subject matter experts in the Company. My team provided the inputs 7
on the generation and market price assumptions. Refer to Company Witness 8
Morren for additional detail on the Capital and O&M assumptions included in the 9
analyses and Company Witness Wisnewski provided the property taxes. 10
11
Q44. What sensitivities did the Company perform regarding the capacity price 12
inputs for the NPVRR analysis? 13
A44. Four sensitivity calculations were used for the capacity price input in the NPVRR 14
analysis. For capacity purchases, in the case of necessary capacity replacement for 15
the option of retiring the plants prior to 2030, the Company considered the pricing 16
alternatives of zero ($0), 10% of CONE ($9.48/kW-year), 50% of CONE 17
($47.40/kW-year), and CONE ($94.80/kW-year). 18
19
A NPVRR was calculated for each sensitivity in each retirement analysis. A 20
summary of the sensitivities for the analysis is shown in Exhibit A-12, Schedule 21
B6.1 - B6.3, page 2 of 6. 22
23
Q45. Why did the Company use four sensitivities for the capacity price inputs in the 24
NPVRR analysis? 25

S. D. BURGDORF Line U-20836 No.
SDB - 25
A45. It is important to consider a wide range of capacity pricing sensitivities when 1
performing an economic analysis, given the nature of capacity pricing. It is prudent 2
to include these sensitivities in an economic analysis, particularly in light of the 3
recent variability that has been experienced relative to the MISO Zone 7 PRA 4
capacity auction results. For example, the most recent auction clearing price for 5
MISO Zone 7 capacity was $5.00/MW-day ($1.83/kW-year). In contrast, the 6
MISO Zone 7 PRA for plan year 2020/2021 cleared at $257.53/MW-day 7
($94.00/kW-year), otherwise known as CONE. The auction price of CONE 8
occurred as a result of the Zone 7 MISO planning resources offered in the MISO 9
PRA not meeting Zone 7’s LCR. As noted above, this marked the first time that 10
any Zone in MISO has not met its resource adequacy requirements since the 11
beginning of the MISO annual capacity construct in 2013. 12
13
Refer to the section of my testimony that discusses the MISO Zone 7 Capacity 14
Position and PRA results for Planning Years 2020/21, 2021/22 as well as the 15
forecasted capacity position for Planning Year 2025/26. 16
17
Q46. What are the results of the NPVRR analysis performed for BRPP? 18
A46. The results of the NPVRR analysis for BRPP show a range of net present value 19
outcomes consistent with the range of capacity prices. A net positive difference 20
indicates that the NPVRR associated with operating the BRPP through the later 21
retirement date is more costly to customers; conversely, a net negative difference 22
indicates that the NPVRR of operating the plant through the later retirement date is 23
less costly to customers. The results of the analysis are summarized in Table 6 24
below and shown in Exhibit A-12, Schedule B6.1-B6.3, page 2 of 6. Column (b) 25

S. D. BURGDORF Line U-20836 No.
SDB - 26
presents the range of capacity price sensitivities and column (c) presents the range 1
of results. 2
3
Table 6: Results of BRPP NPVRR 4
Belle River Sensitivity
Retirement 2026
VS Retirement
2023 Case
Retirement 2028
VS Retirement
2023 Case
Retirement 2030
VS Retirement
2023 Case
# $ millions of NPVRR *
1 Capacity Price at $0 Forecast 89 205 357
2 Capacity Price at 10% of CONE 60 159 296
3 Capacity Price at 50% of CONE (58) (26) 53
4 Capacity Price at 100% of CONE (205) (256) (250)
Note: Net negative values imply less costly option for customers; Net positive values imply more costly for customers 5
6
A more detailed NPVRR summary for each capacity price sensitivity can be found 7
in Exhibit A-12, Schedules B6.1-B6.3, pages 3-6 of 6. 8
9
Q47. What factors has the Company taken into consideration in its decision-making 10
process regarding the timing of the retirement of BRPP? 11
A47. An NPVRR, or economic cost and benefit analysis, can provide a general guideline 12
for the reasonableness and prudency of continued operations of a generating unit, 13
but there are other factors that need to be considered. As Company Witness Morren 14
indicates in his direct testimony, other factors, such as resource adequacy and grid 15
reliability, need to be understood when determining retirement dates, in addition to 16
economics. He also discusses the Company’s decision to cease burning coal at 17
BRPP in 2028. 18
19
Q48. Does this complete your direct testimony? 20
A48. Yes, it does. 21

STATE OF MICHIGAN
BEFORE THE MICHIGAN PUBLIC SERVICE COMMISSION
In the matter of the Application of ) DTE ELECTRIC COMPANY ) for authority to increase its rates, amend ) Case No. U-20836 its rate schedules and rules governing the ) distribution and supply of electric energy, and ) for miscellaneous accounting authority. )
QUALIFICATIONS
AND
DIRECT TESTIMONY
OF
BENJAMIN J.H. BURNS

DTE ELECTRIC COMPANY
QUALIFICATIONS AND DIRECT TESTIMONY OF BENJAMIN J.H. BURNS
Line
No.
BJHB-1
What is your name, business address and by whom are you employed?1
A1. Benjamin J.H. Burns (he/him/his), Director Marketing, One Energy Plaza, Detroit, 2
Michigan, 48226. I am employed by DTE Electric Company (“DTE” or “the 3
Company”). 4
5
On whose behalf are you testifying? 6
A2. I am testifying on behalf of DTE Electric Company. 7
8
What is your education background? 9
A3. I hold an MBA from Columbia Business School. I also hold a Bachelor of Arts in 10
English and Political Science from the University of Michigan. 11
12
What work experience do you have? 13
A4. I served as a Combat Engineer Officer in the United States Marine Corps on active 14
duty from 2002 to 2006, deploying in support of Operation Iraqi Freedom in 2004. 15
I held three roles of increasing responsibility as Platoon Commander, Company 16
Executive Officer and Battalion Assistant Operations Officer. I left active duty as 17
a Captain. 18
19
I worked for Turner Construction Company in project management overseeing 20
high-rise construction in New York, NY from 2006 to 2008. Immediately prior to 21
joining the Company, I was a management consultant with Booz & Company’s 22
Engineered Products and Services practice. During my years with Booz (2010 – 23
2013) I led and worked on projects for Fortune 500 and Private Equity clients that 24
focused on growth strategy and operations improvement. 25

B. J.H. Burns
Line U-20836
No.
BJHB-2
I joined DTE in 2013 as a Manager in the Corporate Strategy group. In this role I 1
led development of DTE’s fossil plant re-use strategy. I also led development of 2
Distribution Operations’ strategy to improve work management in support of 3
connecting customers and executing the strategic capital budget. In 2016, I 4
transitioned from that role to serve as Manager of Scheduling and Coordination in 5
Distribution Operations where I led the organization responsible for developing the 6
execution plan for the annual capital work. In 2018, I became the General Manager 7
of the Home Protection Plus business within DTE Gas, which is an appliance repair 8
business offered to customers under Value Added Programs and Services 9
(“VAPS”) with approximately 220,000 customers. In 2019, I was promoted to my 10
current role as Director of Electric Marketing and Electrification. 11
12
Please describe your current position and duties. 13
A5. As the Director of Electric Marketing and Electrification, I lead the organization 14
which serves three primary roles: 15
1. Transportation Electrification: Accelerate the adoption of electric vehicles 16
across all segments of transportation within our service territory. 17
2. Customer Marketing: Communicate with external customers regarding rates 18
for both electric service prices and various rate tariffs the Company offers 19
customers for service and address all inbound customer inquiries or complaints. 20
3. New Product Development: Assess and bring to market programs and services 21
under the VAPS regulations, which support both customer satisfaction and 22
customer affordability.23

B. J.H. Burns
Line U-20836
No.
BJHB-3
Purpose of Testimony 1
What is the purpose of your testimony?2
A6. The purpose of my testimony is to explain and provide support (including 3
where appropriate, the relevant costs) for the seven following areas: 4
1. Expenditure status for the already-existing pilots Charging Forward and 5
Charging Forward eFleets; 6
2. Expansion of DTE’s electric vehicle (“EV”) pilot, Charging Forward and the 7
associated costs; 8
3. The introduction of a Residential Batteries pilot and the associated costs; 9
4. A request to increase merchant fees expense; 10
5. Certain expenditures related to the Advanced Customer Pricing Pilot (“ACPP”) 11
regulatory asset; 12
6. The 2023 full Time-of-Use (“TOU”) roll out outreach and associated costs; and 13
7. The Electric Regulated Marketing operations and maintenance (“O&M”) 14
expense. 15
16
Are you sponsoring any exhibits in this proceeding? 17
A7. Yes; I am sponsoring the following exhibits: 18
Exhibit Schedule Description 19
A-12 B5.9 Charging Forward Cost Projections 20
A-12 B5.9.1 Charging Forward eFleets Pilot Requirements 21
A-12 B5.9.2 Charging Forward Expansion Pilot Requirements 22
A-12 B5.9.3 Charging Forward Expansion Letters of Support 23
A-12 B5.10 Residential Batteries Cost Projections 24
A-12 B5.10.1 Residential Batteries Pilot Requirements 25

B. J.H. Burns
Line U-20836
No.
BJHB-4
A-13 C5.7.1 Customer Service - Credit and Debit Merchant Fees 1
A-13 C5.9 Regulated Marketing Projected O&M Expense 2
A-13 C5.9.2 Advanced Customer Pricing Pilot & Time of Use 3
Deferrals 4
A-29 T1 Charging Forward 2nd Annual Status Report 5
6
Were these exhibits prepared by you or under your direction? 7
A8. Exhibit A-29, Schedule T1 (Charging Forward 2nd Annual Status Report) was 8
prepared under my direction pursuant to the Orders dated May 2, 2019 and May 8, 9
2020 in Case Nos. U-20162 and U-20561. Exhibit A-12, Schedule B5.9.3 is 10
expressions of support from external stakeholders. Exhibit A-13, Schedule C5.9.2 11
is co-sponsored with Witnesses Pizzuti and Sparks. The remaining exhibits were 12
prepared under my direction in support of the instant case. 13
14
1. EXISTING CHARGING FORWARD PILOT EXPENDITURES 15
What is the current status of the original Charging Forward pilot? 16
A9. The Company proposed Charging Forward in Case No. U-20162. In May 2019, the 17
Commission issued an Order in the U-20162 proceeding, approving the Charging 18
Forward program approach with some modifications and recommendations. The 19
Company provided an update on Charging Forward in the subsequent case, Case 20
No. U-20561, and the Commission concluded, “Consistent with the May 2 [2019] 21
order, the Commission agrees with the ALJ that the regulatory asset and the capital 22
expense should be approved for only the actual and reviewed expenses. Going 23
forward, DTE Electric is authorized to begin the five-year amortization concurrent 24
with review and approval in a rate case in lieu of amortization over five years 25

B. J.H. Burns
Line U-20836
No.
BJHB-5
beginning the year after the costs are incurred” (MPSC Case No. U-20561, Order 1
dated May 8, 2020, pp. 165-166). For a complete status update of Charging Forward 2
and justification for its components’ costs discussed below, please reference 3
Exhibit A-29, Schedule T1, Charging Forward 2nd Annual Status Report filed by 4
the Company in June 2021 under Case No. U-20162. The remainder of this portion 5
of my testimony will be focused on outlining the past costs and future cost 6
projections for the pilot. 7
8
What are the Company’s total expected costs for Charging Forward? 9
A10. As stated in the MPSC Case No. U-20162 Order dated May 2, 2019, “The company 10
proposed the pilot program costs be recovered through capital expenditures, O&M 11
expense, and regulatory asset treatment for proposed rebates. 8 Tr 3579-3581. The 12
Staff, however, recommended deferral of both rebates and O&M costs through the 13
creation of a regulatory asset with amortization over a five-year period. 8 Tr 4056-14
4057” (p. 113). The Order continues, “Overall, the Commission finds that 15
regulatory asset treatment, as proposed by the Staff, is the most reasonable and 16
prudent recovery mechanism” (p. 115). The total actual and estimated expenditures 17
for the program through the end of 2022 are summarized in Table 1 below. 18
Table 1. Actual & Estimated Pilot Spend (in thousands) by Component1 19
20
Program Component 2019 2020 2021 2022 Total
Direct Current Fast Charger Trials $62 $51 $250 - $363
Customer Education & Outreach $382 $202 $810 $406 $1,800
Residential Smart Charger Support $48 $121 $309 $770 $1,248
Charging Infrastructure Enablement $100 $460 $1,911 $6,229 $8,700
Additional Elements $227 $119 $186 $33 $565
Program Management $273 $449 $453 $238 $1,413
Total $1,092 $1,400 $3,919 $7,676 $14,088
1 Differences in totals due to rounding

B. J.H. Burns
Line U-20836
No.
BJHB-6
1
Exhibit A-12, Schedule B5.9, page 2 breaks the costs down into capital and 2
regulatory asset expenditures as shown in Table 2 below. 3
4
Table 2. Actual & Estimated Pilot Spend (in thousands) by Type 5
6
Type of Spend 2019 2020 2021 2022 Total
Capital $64 $0 $339 $1,900 $2,303
Regulatory Asset $1,028 $1,401 $3,580 $5,776 $11,785
Total $1,092 $1,401 $3,919 $7,676 $14,088
7
The capital costs for Charging Forward include: 8
• Utility infrastructure to deliver electricity from the DTE distribution system 9
to the meter, which may include cable, conductors, conduit, transformer(s), 10
and the meter (“EV Service Connection”); and 11
• The DTE Distribution Operations (“DO”) engineering support required for 12
pilot implementation. 13
14
Exhibit A-12, Schedule B5.9, page 2 shows the above total estimated calendar year 15
expenditures broken down into projected capital expenditures (lines 1 through 6) 16
and regulatory asset costs (lines 7 through 17) for the following periods: 17
• January 1, 2020 to December 31, 2020 (“historical period”) in column (b); 18
• January 1, 2021 to October 31, 2022 (“bridge period”) in column (e); and 19
• November 1, 2022 to October 31, 2023 (“test period”) in column (f). 20
21
Total estimated pilot costs for those three periods are $1.4 million, $11.6 million, 22
and $0, respectively, as shown in line 18. 23

B. J.H. Burns
Line U-20836
No.
BJHB-7
1
What are the costs associated with the Direct Current Fast Charger (“DCFC”) 2
Trials? 3
A11. Three of the Company’s DCFC trials initiated in 2018 required or will require 4
additional funding: ChargeD Phase 1, ChargeD Phase 2, and the battery-powered 5
DCFC as detailed in the 2nd Annual Status Report.2 These DCFC trial costs are 6
outlined in Exhibit A-12, Schedule B5.9, page 2, line 2 (DCFC Trials Service 7
Connection) and line 8 (DCFC Trials Supply Infrastructure). The total actual and 8
estimated expenditures for the historical and bridge periods are $0.1 million and 9
$0.3 million in columns (b) and (e), respectively. 10
11
The two cost categories associated with the three DCFC trials include: 12
• The EV Service Connection described above; and 13
• The infrastructure necessary to deliver electricity from the meter to the 14
Electric Vehicle Supply Equipment (“EVSE”), which may include an 15
electric panel, cable, and conduit (“EV Supply Infrastructure”). 16
17
What are the costs for the Charging Forward Customer Education & 18
Outreach? 19
A12. The Company has shifted funds within Charging Forward to increase the Customer 20
Education & Outreach total expenditures by approximately $200,000 while 21
remaining within the overall budget as outlined in the 2nd Annual Status Report.3 22
Line 13 of Exhibit A-12, Schedule B5.9, page 2 shows the actual and projected 23
2 Exhibit A-29, Schedule T1 3 Exhibit A-29, Schedule T1

B. J.H. Burns
Line U-20836
No.
BJHB-8
costs of $0.2 million for the historical period in column (b) and $1.2 million for the 1
bridge period in column (e). 2
3
What are the costs for Residential Smart Charger Support? 4
A13. The Company has shifted funds within Charging Forward to decrease the 5
Residential Smart Charger Support total expenditures by approximately $0.5 6
million as outlined in the 1st Annual Status Report.4 Line 12 of Exhibit A-12, 7
Schedule B5.9, page 2 shows the actual and projected costs of $0.1 million for the 8
historical period in column (b) and $1.1 million for the bridge period in column (e). 9
10
What types of costs are associated with Charging Infrastructure Enablement? 11
A14. The projected EV Service Connection costs and EV Supply Infrastructure rebate 12
costs are included in the Charging Infrastructure Enablement component for three 13
different categories of EVSE: DCFC infrastructure, Level 2 infrastructure, and fleet 14
charging infrastructure. 15
16
The projected expenditures for the Charging Infrastructure Enablement component 17
are shown in Exhibit A-12, Schedule B5.9, page 2 as outlined in Table 3 below. 18
19
Table 3. Actual and Projected Costs for Charging Infrastructure Enablement (in 20
thousands) 21
EVSE Category
Historical
Period
Column (b)
Bridge
Period
Column (e)
DCFC (lines 3 and 9) $130 $3,870
Level 2 (lines 4 and 10) $283 $2,100
Fleet (lines 5 and 11) $48 $2,170
4 https://mi-psc.force.com/sfc/servlet.shepherd/version/download/068t000000CFtGtAAL

B. J.H. Burns
Line U-20836
No.
BJHB-9
Total $461 $8,140
1
2
What costs are included with Additional Elements? 3
A15. The Company expanded the scope of Charging Forward to include three additional 4
elements based upon feedback from its stakeholder discussions:5 5
• An updated EV-Grid Impact Study;6 6
• An EV-Ready Builder Rebate Pilot (as proposed in Case No. U-20561); and 7
• An EV-Only Off-Peak Incentive Pilot (“Bring Your Own Charger”). 8
9
Line 14 of Exhibit A-12, Schedule B5.9, page 2 shows the actual and projected 10
costs of $0.1 million and $0.2 million for the historical and bridge periods in 11
columns (b) and (e), respectively. 12
13
What costs are included with Program Management? 14
A16. The Program Management component includes EV Team Labor and Program 15
Costs. The EV Team includes a manager, principal marketing specialist, and 16
strategist to oversee the overall implementation and execution of the Charging 17
Forward pilot. Program Costs include the web-based application subscription from 18
PowerClerk, EV charger data collection tools, and industry conference expenses to 19
ensure the EV team is implementing best practices from across the nation. These 20
expenditures are shown in Exhibit A-12, Schedule B5.9, page 2, lines 15 and 16 21
with actual and projected costs of $0.4 million and $0.7 million for the historical 22
and bridge periods in columns (b) and (e), respectively. 23
5 Detailed further in the 2nd Annual Status Report (Exhibit A-29, Schedule T1) 6 https://mi-psc.force.com/sfc/servlet.shepherd/version/download/068t000000CFdYoAAL

B. J.H. Burns
Line U-20836
No.
BJHB-10
1
2
3
What is the current status of Charging Forward eFleets (“eFleets”)? 4
A17. To build on momentum of the fleet element of Charging Forward and avoid any 5
gaps in available funding to support fleet electrification, DTE proposed eFleets in 6
an ex-parte filing in December 2020 and received approval in March 2021. Per the 7
Order, “the Commission concludes that DTE Electric’s Phase Two proposal is 8
reasonable and in the public interest as it will develop a better understanding 9
regarding how C&I customers are incentivized to make the transition to clean EV 10
technology, how the increased electrical load associated with EVs impact electrical 11
system usage and grid requirements, as well as the expected operational impacts 12
of a wider commercial EV rollout” (MPSC Case No. U-20935, Order dated March 13
19, 2021, pp. 4-5). 14
15
eFleets was approved with three primary components: Education & Outreach, 16
Advisory Services, and Charging Infrastructure Enablement for commercial fleets. 17
The transportation segments of focus for the eFleets pilot include mass transit 18
buses, school buses, commercial fleets (including light-, medium-, and heavy-duty 19
vehicles), and off-road vehicles. The Company initiated the Education & Outreach 20
component of eFleets in May 2021 and launched the full pilot in October 2021. 21
22
Does this eFleets proposal meet the pilot definition and corresponding six 23
objective criteria as defined in Order U-20645? 24

B. J.H. Burns
Line U-20836
No.
BJHB-11
A18. Yes; Order U-20645 defines a pilot as a limited duration experiment to determine 1
the impact of a measure on one or more outcomes of interest. It also lists the six 2
objective criteria of a pilot as 1) need and goals, 2) design and evaluation, 3) costs, 3
4) timeline, 5) stakeholder engagement, and 6) public interest. Please see Exhibit 4
A-12, Schedule B5.9.1 for a high-level summary of how eFleets is meeting these 5
requirements and the corresponding questions in this testimony that relate to each 6
of the six objective criteria. 7
8
What are the Company’s total expected costs for eFleets? 9
A19. Per Order U-20935, “the Commission authorizes DTE Electric to create a 10
regulatory asset, not to exceed $10.3 million, to recognize deferred Phase Two 11
program costs with the amortization of those costs over five years beginning the 12
year after the costs are incurred… In addition, the Commission reiterates that… 13
approval in this case does not signal future authorization of the projected $3.1 14
million in capital costs… Rather, the company will also be required to present those 15
costs for a future reasonableness-and-prudence review in a future general rate 16
case” (p.5). For more details on the pilot components and justification for its costs, 17
please refer to the 2nd Annual Status Report.7 Consistent with the costs identified in 18
the Case No. U-20935 Order, the Company continues to expect that complete 19
implementation of eFleets will cost approximately $13.4 million through the end of 20
2025 as shown in Table 4 below. 21
22
23
24
7 Exhibit A-29, Schedule T1
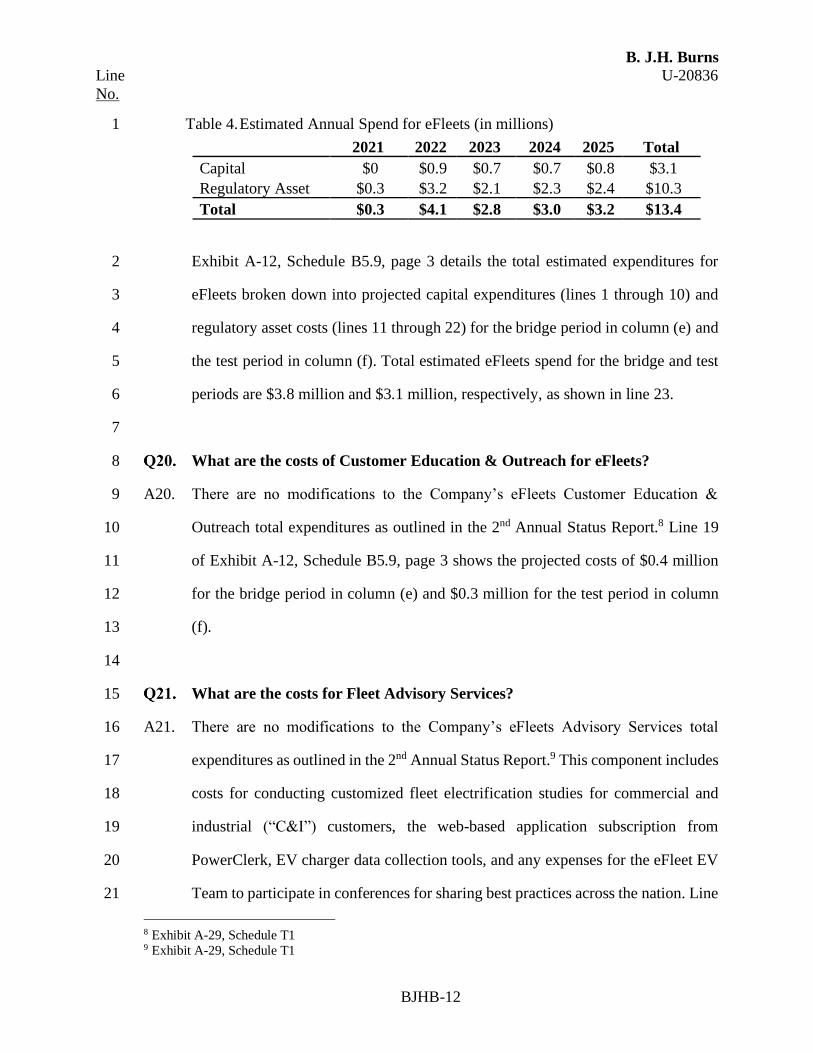
B. J.H. Burns
Line U-20836
No.
BJHB-12
Table 4. Estimated Annual Spend for eFleets (in millions) 1
2021 2022 2023 2024 2025 Total
Capital $0 $0.9 $0.7 $0.7 $0.8 $3.1
Regulatory Asset $0.3 $3.2 $2.1 $2.3 $2.4 $10.3
Total $0.3 $4.1 $2.8 $3.0 $3.2 $13.4
Exhibit A-12, Schedule B5.9, page 3 details the total estimated expenditures for 2
eFleets broken down into projected capital expenditures (lines 1 through 10) and 3
regulatory asset costs (lines 11 through 22) for the bridge period in column (e) and 4
the test period in column (f). Total estimated eFleets spend for the bridge and test 5
periods are $3.8 million and $3.1 million, respectively, as shown in line 23. 6
7
What are the costs of Customer Education & Outreach for eFleets? 8
A20. There are no modifications to the Company’s eFleets Customer Education & 9
Outreach total expenditures as outlined in the 2nd Annual Status Report.8 Line 19 10
of Exhibit A-12, Schedule B5.9, page 3 shows the projected costs of $0.4 million 11
for the bridge period in column (e) and $0.3 million for the test period in column 12
(f). 13
14
What are the costs for Fleet Advisory Services? 15
A21. There are no modifications to the Company’s eFleets Advisory Services total 16
expenditures as outlined in the 2nd Annual Status Report.9 This component includes 17
costs for conducting customized fleet electrification studies for commercial and 18
industrial (“C&I”) customers, the web-based application subscription from 19
PowerClerk, EV charger data collection tools, and any expenses for the eFleet EV 20
Team to participate in conferences for sharing best practices across the nation. Line 21
8 Exhibit A-29, Schedule T1 9 Exhibit A-29, Schedule T1

B. J.H. Burns
Line U-20836
No.
BJHB-13
21 of Exhibit A-12, Schedule B5.9, page 3 shows the projected costs of $0.4 million 1
for the bridge period in column (e) and $0.3 million for the test period in column 2
(f). 3
4
What types of costs are included in Charging Infrastructure Enablement for 5
eFleets? 6
A22. The projected EV Service Connection costs and EV Supply Infrastructure rebate 7
costs are included in the Charging Infrastructure Enablement component for two 8
different categories of infrastructure, Level 2 and DCFC, for the five different 9
transportation segments described above. The projected expenditures for the 10
Charging Infrastructure Enablement component are shown in Exhibit A-12, 11
Schedule B5.9, page 3 as outlined in Table 5 below. 12
13
Table 5. Projected Costs for eFleets Charging Infrastructure Enablement (in 14
thousands) 15
Program Component
Bridge Period
Column (e)
Test Period
Column (f)
DCFC Infrastructure (lines 2-5 and 12-15) $1,476 $1,365
Level 2 Infrastructure (lines 6-8 and 16-18) $886 $693
Total $2,362 $2,058
16
What costs are included in Program Management for eFleets? 17
A23. The Program Management component includes the costs for the eFleets EV Team 18
and DO Engineering Labor. The eFleets EV Team includes shared resources with 19
the original Charging Forward pilot, including a manager, principal marketing 20
specialist, strategist, and a corporate communications specialist to oversee the 21
overall pilot implementation. In addition, a sales team comprised of a manager, a 22

B. J.H. Burns
Line U-20836
No.
BJHB-14
senior sales specialist, and a sales associate will support execution of eFleets across 1
the five transportation segments described above. DO Engineering Labor costs 2
include labor hours from various colleagues in the DO team supporting the eFleets 3
EV Team and is tracked separately from other DO Engineering work (to not be 4
double counted). These expenditures are shown in lines 9 and 20 of Exhibit A-12, 5
Schedule B5.9, page 3 in columns (e) and (f) with projected costs of $0.7 million 6
and $0.4 million for the for the bridge and test periods, respectively. 7
8
How does the Company propose to continue reporting for Charging Forward 9
and eFleets going forward? 10
A24. The Company will continue to file quarterly reports as well as Annual Status 11
Reports in case docket U-20162. Additionally, DTE will continue to host 12
stakeholder discussions approximately twice per year. 13
14
2. CHARGING FORWARD EXPANSION 15
What are the elements of the Charging Forward Expansion (“Expansion”) 16
proposal? 17
A25. DTE is proposing the extension of the following existing elements with 18
modifications based on lessons learned and described in more detail below: 19
Customer Education & Outreach, Residential Smart Charger Support (“Residential 20
Rebates”), Bring Your Own Charger, EV-Ready Builder Rebates, and Charging 21
Infrastructure Enablement (“Make-Ready Rebates”). Additionally, DTE is 22
proposing the introduction of the following new elements to address identified gaps 23
described in more detail below: Residential Charging as a Service (“CaaS”), 24
Charging Hubs, Transit Batteries, Transportation Network Company (“TNC”) 25

B. J.H. Burns
Line U-20836
No.
BJHB-15
Driver Rebates, Income-Eligible Rebates, Commercial CaaS, and an Emerging 1
Technology Fund. 2
3
Does this Expansion proposal meet the pilot definition and corresponding six 4
objective criteria as defined in Order U-20645? 5
A26. Yes; similar to Charging Forward eFleets, please see Exhibit A-12 Schedule B5.9.2 6
for a high-level summary of how the Charging Forward Expansion is meeting these 7
requirements and the corresponding questions in this testimony that relate to each 8
of the six objective criteria. 9
10
How is the Charging Forward Expansion portion of your testimony 11
structured? 12
A27. The Charging Forward Expansion testimony is organized in four sections: 13
I. Transportation Electrification (“TE”) Market Overview; 14
II. DTE’s Role in TE; 15
III. Charging Forward Expansion Pilot Design; and 16
IV. Cost-Benefit Analysis. 17
18
I. TE Market Overview 19
How do you define an EV? 20
A28. For the purposes of this testimony, EVs include on-road battery EVs (“BEVs”)10 21
and plug-in hybrid EVs (“PHEVs”).11 22
23
What are the different types of EVSE available? 24
10 Battery Electric Vehicles (BEVs) use only electricity stored in a battery pack to power an electric motor. 11 PHEVs are like BEVs but also have an internal combustion engine fueled by gasoline that can be used.

B. J.H. Burns
Line U-20836
No.
BJHB-16
A29. EVSEs fall into three different levels of charging power: 1
• Level 1 is the lowest level of charging at 120 volts (“V”) and is typically a 2
standard outlet, delivering around 3-5 miles of charging in an hour; 3
• Level 2 is 240V (similar to an electric oven or dryer) and charges a vehicle 4
between 12-60 miles in an hour depending on the power of the charger; and 5
• Level 3 (commonly known as DCFC) requires a minimum of 480V and can 6
charge 80% of a vehicle’s battery in as little as 30 minutes (160+ miles in 7
an hour depending on the power of the charger). 8
9
EVSE is also either networked or non-networked. Networked EVSE requires either 10
a cellular or wireless connection to communicate over the air (which allows for 11
payment collection, data storage, and remote software updates among other things). 12
Network Providers typically require a software licensing fee from the owner of the 13
EVSE for those capabilities to be utilized. Non-networked EVSE does not have the 14
ability to communicate, and there are no ongoing software costs for the owner. 15
16
What are the current market dynamics for EVs? 17
A30. Recent announcements by major automakers show that the future of mobility is 18
electric. In the first two months of this year, four major automakers announced new 19
goals to phase out sales of internal combustion engine vehicles, driven primarily by 20
tightening restrictions in Europe.12 Automakers have been announcing increased 21
investment in EVs for years, and these models are finally entering the market. For 22
example, the number of EV models produced in North American plants is expected 23
to increase from 49 today to over 100 by 2024.13 EVs are not only increasing in 24
12 Bloomberg New Energy Finance (“BNEF”) Electric Vehicle Outlook 2021 13 Automotive Communities Partnership June 2021 Webinar

B. J.H. Burns
Line U-20836
No.
BJHB-17
model availability but also becoming more affordable. Battery prices have declined 1
64% over the last five years, and they are expected to decrease another 25% by 2
2025.14 3
4
What are the current and future adoption rates for EVs in Michigan? 5
A31. As of August 2021, there were almost 28,000 EVs in Michigan, or about 0.4% of 6
total vehicles on the road. Of those, approximately 68% (19,000) are in the 7
Company’s electric service territory.15 While the market is relatively small today, 8
industry experts expect that to change rapidly over the coming years. Despite global 9
passenger vehicle sales falling 13% overall in 2020 due to the pandemic, EV sales 10
increased 48%.16 Michigan has also experienced record-level EV sales recently, 11
from an average of 260 EVs sold per month in 2019 and 2020 to over 1,000 EVs 12
sold per month over the last six months of available data (March-August 2021). 13
Based on this and other upwards-adjusted industry expert forecasts,17 DTE recently 14
updated its forecast and now projects that 11% (375,000) of vehicles on the road in 15
its electric service territory will be EVs by 2030, as shown in Figure 1 below. 16
17
Figure 1. Cumulative EV Sales Forecast in DTE’s Territory by 2030 18
19
20
21
22
23
14 BNEF, McKinsey 15 IHS Markit 16 BNEF Electric Vehicle Outlook 2021 17 BNEF (national), Automotive Communities Partnership (national), and IHS Markit (Michigan) forecasts

B. J.H. Burns
Line U-20836
No.
BJHB-18
1
Do you anticipate benefits from TE? 2
A32. Yes; TE benefits many stakeholders. First, electric customers benefit through 3
downward rate pressure, because EV load is relatively flexible and can be shifted 4
to times when there is more available capacity on the grid, effectively spreading 5
system fixed costs over increased sales. Second, EV owners experience total cost 6
of ownership savings through approximately 50-60% lower fuel and maintenance 7
costs than a gasoline vehicle.18 Third, the public at large benefits from 8
environmental benefits, since EVs emit 55% less greenhouse gases (“GHGs”) than 9
a traditional gasoline vehicle in Michigan annually.19 The transportation sector in 10
Michigan currently accounts for 33% of emissions in the state, and as the 11
Company’s generation portfolio moves towards net zero, electrifying vehicles will 12
be critical for the State of Michigan to meet its own net zero target by 2050.20,21 13
Finally, TE can be an important piece of economic development for Michigan as 14
the automakers in the state shift toward EVs, creating new opportunities for battery 15
and vehicle engineering and manufacturing. 16
17
Do barriers remain to EV adoption that could dampen adoption rates and 18
realization of the associated benefits? 19
A33. Yes; the speed of EV adoption lags behind that of other new technologies after their 20
introduction for several key reasons, including: lack of awareness and familiarity 21
with EVs, a perceived lack of available EVSE (“range anxiety”), upfront EV price 22
18 Consumer Reports – Electric Vehicle Ownership Costs (October 2020) 19 https://afdc.energy.gov/vehicles/electric_emissions.html 20 https://www.eia.gov/environment/emissions/state/ (Table 4) 21 https://www.michigan.gov/whitmer/0,9309,7-387-90499_90704-540278--,00.html

B. J.H. Burns
Line U-20836
No.
BJHB-19
premiums, and the burdensome home charger installation process. These key 1
barriers to EV adoption will each be addressed in more detail below. 2
3
DTE’s Role in TE 4
What are the key roles for utility involvement in TE? 5
A34. The Commission established objectives for utilities in the TE space as follows: “(1) 6
maximize program participation at minimum cost; (2) aggressively test new and 7
novel practices and technologies to ensure that new load associated with EV 8
charging maximizes net benefits to all ratepayers; and (3) ensure that investments 9
in make-ready infrastructure serve double duty by directly addressing core barriers 10
(such as range anxiety), and by enabling the company to learn reasonable and 11
practicable ways to actively manage charging times and locations, to minimize 12
required investment in new distribution infrastructure, and to obviate adverse grid 13
impacts related to uncontrolled charging” (MPSC Case No. U-20162, Order dated 14
May 2, 2019, p. 113). Playing a proactive role and learning now – while EV 15
adoption remains relatively low – is important for a utility to ensure that widespread 16
EV adoption in the future is integrated efficiently with the grid to maximize net 17
benefits to its customers. 18
19
Additionally, utilities still have a critical role to play in reducing barriers to EV 20
adoption, especially as it relates to a lack of awareness of EVs and range anxiety. 21
The Critical Consumer Issues Forum (“CCIF”) aims to facilitate exchanges among 22
state commissions, consumer advocates, and electric companies and highlight areas 23
of agreement in a way that enhances each group’s individual efforts to address 24
important consumer-focused issues. Per the CCIF in July 2019, “Customer 25

B. J.H. Burns
Line U-20836
No.
BJHB-20
education should be considered as an important component of electric company 1
electric transportation-related programs” and “Multiple entities, including 2
electric companies, need to be involved in meeting electric transportation 3
infrastructure and deployment needs.”22 4
Finally, enabling equitable access to EVs is important, and a utility is well-suited 5
to address this gap. Another consensus statement from the CCIF states, “electric 6
companies may invest in areas where third-party service providers are not 7
investing. With a history of serving all communities in their service areas, as well 8
as having access to lower-cost capital, electric companies are well-suited for 9
helping ensure access to low- to moderate-income and underserved populations.”23 10
11
What are DTE’s guiding principles for the Expansion pilot’s design? 12
A35. DTE’s overarching guiding principle is to play a proactive role in testing various 13
incentive structures and ownership models now to better understand how EV load 14
can best be added to the system in the future to maximize net benefits to its 15
customers. To that end, DTE uses the key roles of utility involvement for TE 16
described above and summarized here as its guiding principles: 17
1) Reduce barriers to EV adoption; 18
2) Efficiently integrate EV load with the grid; 19
3) Help enable equitable access to EVs; and 20
4) Test new technologies to prepare for widespread TE adoption in the future. 21
22
22 http://www.criticalconsumerissuesforum.com/wp-content/uploads/2019/07/CCIF-Electric-
Transportation-Report-July-2019.pdf 23 http://www.criticalconsumerissuesforum.com/wp-content/uploads/2019/07/CCIF-Electric-
Transportation-Report-July-2019.pdf

B. J.H. Burns
Line U-20836
No.
BJHB-21
Additionally, a fifth guiding principle DTE uses to inform pilot design is to ensure 1
actions benefit the public interest and State of Michigan. From joint comments filed 2
by DTE and 18 other organizations24 on November 17, 2017 in Case No. U-18368, 3
“Transportation Electrification is in the public interest. There is a clear policy case 4
for transportation electrification, as it can offer operational savings to PEV 5
drivers, support local industries in the state, … and provide significant 6
environmental benefits to all Michigan residents through reduced emissions” (p. 7
2). 8
9
Is the Expansion consistent with the expectations of the State of Michigan? 10
A36. Yes; momentum for TE is building in Michigan. Governor Whitmer created the 11
Michigan Office of Future Mobility and Electrification with Executive Directive 12
2020-01 on February 25, 2020, stating “(to) secure Michigan’s position as a global 13
leader in the future of mobility, the State must think creatively and act 14
comprehensively…And it must expand Michigan’s global leadership in developing 15
the systems and networks necessary for the deployment of connected infrastructure, 16
autonomous technologies, shared transportation, and electric vehicles.”25 17
18
Additionally, Michigan committed “to achieve economy-wide carbon neutrality no 19
later than 2050” with an interim goal “to achieve a 28% reduction below 2005 20
levels in greenhouse gas emissions by 2025” with Executive Directive 2020-10 on 21
24 Actia, Advanced Energy Economy, The Alliance for Transportation Electrification, Clean Fuels
Michigan, Consumers Energy Company, The Ecology Center, Edison Electric Institute, Ford Motor
Company, General Motors, Greenlots, Michigan Electric and Gas Association, Michigan Energy
Innovation Business Council, Michigan Environmental Council, Michigan League of Conservation Voters,
Natural Resources Defense Council, Phoenix Contact, Siemens, and Sierra Club 25 https://www.michigan.gov/whitmer/0,9309,7-387-90499_90704-521687--,00.html

B. J.H. Burns
Line U-20836
No.
BJHB-22
September 23, 2020.26 The transportation sector is the largest contributor to GHG 1
emissions in the United States (“U.S.”), so TE will be an important piece of the 2
solution. With approval of DTE’s eFleets pilot, the Commission stated, “the 3
continued growth of EV adoption and carbon reduction is consistent with Governor 4
Gretchen Whitmer’s ‘MI Healthy Climate Plan’ as announced in Executive 5
Directive 2020-10 and Executive Order 2020-182” (MPSC Case No. U-20935, 6
Order dated March 19, 2021, p. 4), signaling that DTE’s TE efforts are well aligned 7
with State policy. 8
9
What has DTE learned so far with its existing Charging Forward initiative? 10
A37. The 2nd Annual Status Report for Charging Forward provides a detailed update of 11
the existing pilot.27 A few of the key lessons learned include: 12
• Incentives are an effective method to increase TOU enrollment and shift 13
EV load off-peak: 87% of Residential Rebate applicants said the rebate 14
influenced their decision to enroll in a TOU rate, and 88% of charging takes 15
place outside of 3-7 pm (the “critical peak window”); 16
• Creative solutions to incentivize off-peak charging both maximizes 17
participation and benefits all customers: it took about half the time for the 18
Company’s Bring Your Own Charger (“BYOC”) pilot to reach 400 19
participants as it did for the Residential Rebate element, and DTE saw a 20
reduction of 21% in critical peak window load from BYOC participants’ 21
whole-home usage before and after enrollment; and 22
• Public charging infrastructure can be efficiently integrated with the grid to 23
minimize distribution upgrade investments: the average waived 24
26 https://www.michigan.gov/whitmer/0,9309,7-387-90499_90704-540278--,00.html 27 Exhibit A-29, Schedule T-1

B. J.H. Burns
Line U-20836
No.
BJHB-23
contribution in aid of construction (“CIAC”) costs were $0 per site for 1
Level 2 (average of four ports per site) and only $5,000 per site for DCFCs 2
(average of two chargers per site) for Charging Forward to-date. 3
4
Are there gaps that still need to be addressed? 5
A38. Yes; after two years of implementing Charging Forward, the Company has 6
identified several gaps that still need to be addressed to better facilitate EV 7
adoption. These gaps (and the corresponding Charging Forward Expansion 8
elements designed to help address these gaps) are as follows: 9
• There is still a significant gap in awareness of EVs: 53% of DTE customers 10
surveyed in November 2020 still could not correctly name an EV model 11
(Customer Education & Outreach);28 12
• Range anxiety continues to deter adoption: 63% of customers surveyed 13
state location and availability of charging stations as a primary barrier to 14
purchase (Customer Education & Outreach, Make-Ready Rebates, and 15
Commercial CaaS);29 16
• The upfront purchase premium is difficult to overcome: 57% of customers 17
surveyed state the price of an EV is too high (Transit Batteries, TNC Driver 18
Rebates, Income-Eligible Rebates);30 19
• The process and cost to install a home charger is burdensome: 48% of 20
customers surveyed did not know how to install a home charger or thought 21
it was difficult, and about half of approved Residential Rebate participants 22
required some sort of electrical upgrade (Residential CaaS);31 23
28 DTE Tracking Survey from November 2020 (n = 503) 29 DTE Tracking Survey from November 2020 (n = 503) 30 DTE Tracking Survey from November 2020 (n = 503) 31 DTE Tracking Survey from November 2020 (n = 503)

B. J.H. Burns
Line U-20836
No.
BJHB-24
• Expensive, high-powered charging infrastructure required to electrify 1
fleets is a difficult barrier to overcome for already-hesitant fleet operators 2
(Charging Hubs); 3
• The business case to install charging equipment is still very challenging, 4
especially in underserved areas (Commercial CaaS); and 5
• DTE’s ability to fund quickly evolving technology pilots is constrained in 6
a regulatory environment (Emerging Technology Fund). 7
8
Are there design characteristics that still need to be tested? 9
A39. Yes; the Company would like to continue testing different design characteristics to 10
analyze corresponding impacts and determine the most appropriate long-term 11
application. Specific design characteristics that DTE still needs to test include, but 12
are not limited to, incentive structures, qualification criteria, and ownership models. 13
14
Why should DTE expand Charging Forward at this time? 15
A40. It is anticipated that the three-year Charging Forward pilot approved in Case No. 16
U-20162 will have fully utilized its approved funding in the next year, 17
approximately three years after approval in May 2019. The spend is within budget 18
in the expected timeline and achieved its objectives as detailed in the 2nd Annual 19
Status Report.32 To avoid disruption in utility programming at this critical market 20
stage that furthers State of Michigan policies, a Charging Forward Expansion is 21
required. Management consulting firm Guidehouse states, “The next few years 22
represent the precipice of a multi-decade transition toward a decarbonized mobility 23
future. U.S. market insights suggest a growing consensus that the better 24
32 See Exhibit A-29, Schedule T1

B. J.H. Burns
Line U-20836
No.
BJHB-25
stakeholders prepare their EV markets and electric distribution infrastructure to 1
support the transition—through data-driven planning and market interventions—2
the more cost effective the transition can be for ratepayers.”33 3
4
II. Charging Forward Expansion Pilot Design 5
What are the key goals of the Charging Forward Expansion? 6
A41. Consistent with DTE’s role in TE and guiding principles above, the key goals of 7
the Charging Forward Expansion are to reduce barriers to EV adoption, efficiently 8
integrate EV load with the grid, enable equitable access to EVs, pilot new 9
technologies, maximize participation at a minimum cost, and support State of 10
Michigan policy initiatives. 11
12
What are the primary components of the Charging Forward Expansion? 13
A42. The elements of the Charging Forward Expansion outlined above can be grouped 14
into the following five primary components: 15
A. Customer Education & Outreach; 16
B. Residential Level 2 Charging; 17
C. Commercial Customer Support; 18
D. Equitable Access to EVs; and 19
E. Program Development. 20
21
The elements within each of the primary components are detailed in the following 22
sections. All of them were designed with DTE’s guiding principles in mind as 23
shown in Table 6 below. 24
33 "The Emerging Mobility Universe," Guidehouse, October 2021

B. J.H. Burns
Line U-20836
No.
BJHB-26
1
Table 6. Overview of Expansion Elements by Guiding Principles 2
A. Customer Education & Outreach (“E&O”) 3
What is a primary barrier to EV adoption? 4
A43. Lack of awareness of EVs and their associated benefits is still a primary barrier to 5
EV adoption. As stated above, 53% of DTE customers surveyed could not correctly 6
name an EV model.34 If customers are unaware of EV models or unfamiliar with 7
the technology, they will not even consider an EV for their next vehicle purchase. 8
Another large awareness barrier is that 49% of non-EV owners surveyed know 9
about zero or only one public charging station, despite hundreds available in DTE’s 10
service territory.35 However, once a person owns an EV, 77% of those originally 11
concerned about insufficient range and/or charging infrastructure became less or no 12
34 DTE Tracking Survey from November 2020 (n = 503) 35 DTE Tracking Survey from November 2020 (n = 503)

B. J.H. Burns
Line U-20836
No.
BJHB-27
longer concerned,36 indicating that in addition to deploying more charging 1
infrastructure, education is another way to address range anxiety. 2
3
Why should DTE provide education on EVs? 4
A44. Per the Midcontinent Transportation Electrification Collaborative consensus 5
principles, “Utilities are a trusted source of information about charging solution 6
choices, have established relationships with their customers, and have the ability 7
to communicate the benefits of EVs to their customers."37 Fuel economy is the 8
number one reason why DTE customers are buying EVs,38 and as the “fuel” 9
provider, DTE is best suited to provide education on the electric pricing options 10
that benefit both EV drivers and DTE’s customers. Credible sources suggest that 11
car buyers spend as many as 13 hours researching cars online before even going to 12
the dealer, so typically their minds are already made up.39 The DTE EV webpages 13
are an important online resource for consumers in the purchase funnel, and they 14
have been viewed over 414,000 times since launch of Charging Forward in May 15
2019. The Company’s EV webpages are also starting to gain traction: more than 16
half of those webpage views have been in the last four months. Additionally, in 17
2020, 19% of customers reported they would or had visited DTE’s website for EV 18
resources compared to 14% the year prior, an increase of 36%.40 To continue to be 19
a trusted source of information for its customers, its critical to expand Charging 20
Forward’s Customer E&O component to continue engaging customers and driving 21
36 AAA Electric Vehicle Ownership Survey 2019 (n=1,090) 37 https://www.betterenergy.org/wp-content/uploads/2018/04/MTEC_White_Paper_April_2018-1-1.pdf 38 DTE Tracking Survey from November 2020 (n = 503) 39 California New Car Dealers Association 40 DTE Tracking Survey from November 2020 (n = 503)

B. J.H. Burns
Line U-20836
No.
BJHB-28
them to the website, which the Company will keep improving based on lessons 1
learned. 2
3
Does E&O affect efficient integration of EV load with the grid? 4
A45. Yes; E&O is important to improve EV driver understanding of available TOU rates 5
and other managed charging incentives. Managed charging not only saves EV 6
drivers more money on fuel but also benefits DTE customers at large by shifting 7
charging to times that are better for the system overall. 8
9
What practices will DTE continue from its current E&O pilot? 10
A46. For potential EV drivers, the Company will continue to deploy best practices such 11
as consistent messaging to amplify the benefits of EVs and break down the 12
perceived barriers to adoption via a robust multi-channel campaign. For potential 13
EVSE owners (“site hosts”), DTE will continue the best practice of communicating 14
the benefits of owning and operating EVSE. Overall, E&O will continue to support 15
customers’ electrification journeys by making them aware of available incentives, 16
electric pricing options, electrician resources, charger locations, DTE’s EV 17
community (“EV Connections”), and DTE EV webpages (including its Virtual EV 18
Showroom). 19
20
How will E&O for the Expansion be different than the current offering? 21
A47. Once safe to do so, DTE will ramp up in-person EV experiences, which it has not 22
been able to do for the majority of Charging Forward thus far due to the pandemic. 23
Based on post-rebate survey feedback, DTE also plans to add EV capability to an 24
enterprise-wide rate tool to guide potential and current EV drivers to the best TOU 25

B. J.H. Burns
Line U-20836
No.
BJHB-29
rate for them. Additionally, the Company would like to explore how to further 1
strengthen the customer experience for its already-popular Virtual EV Showroom 2
tool, potentially directly connecting to dealership inventory. The Company is 3
requesting $1.5 million for Customer E&O, including the development of an EV-4
specific rate selection tool for customers. 5
6
What metrics will the Company use to gauge success of the E&O component? 7
A48. The Company will continue to evaluate the success of its E&O efforts using both 8
quantitative and qualitative measures. Metrics such as impressions, tactics, website 9
views, and survey data provide a quantitative update on the progress, while 10
customer verbatims from surveys deliver qualitative insight. 11
12
B. Residential Level 2 Charging 13
What incentives does DTE currently offer through Charging Forward to 14
support Residential Level 2 Charging? 15
A49. DTE currently offers three incentives to support Residential Level 2 Charging: 16
• Residential Rebates: a $500 rebate to customers that have an EV, install a 17
qualified Level 2 charger, and enroll in a TOU rate; 18
• BYOC: payments up to $24/quarter for EV drivers that have a Level 2 19
charger and are on the regular residential rate (D1) but comply with 20
BYOC’s off-peak charging requirements;41 21
• EV-Ready Builder Rebate: up to a $250 rebate for builders to future-proof 22
new construction single-family and multi-family homes with the wiring for 23
Level 2 chargers. 24
41 BYOC is administered by Sagewell, using its software analytics on participant meter data

B. J.H. Burns
Line U-20836
No.
BJHB-30
1
Additionally, DTE’s Demand Response (“DR”) team manages DTE Smart Charge, 2
which utilizes vehicle telematics in partnership with Ford and General Motors 3
(“GM”) to incentivize drivers to temporarily pause or start their vehicle’s charging 4
when it is most beneficial to the system.42 5
6
What are the key learnings from those existing incentives so far? 7
A50. For Residential Rebates and BYOC, there have been a few key learnings so far. 8
First, 87% of applicants cited the Residential Rebate as influencing their enrollment 9
in a TOU rate, giving the Company a clear indication that a large group of 10
customers opt to remain on the regular residential rate without an incentive to 11
switch.43 Second, TOU rates and compliance incentives are an effective way to shift 12
load off-peak: BYOC and Residential Rebate participants reduced critical peak 13
window charging by 67% and 48%, respectively, compared to customers on the 14
regular residential rate. Both of these learnings give credence to the theory that the 15
Company’s incentives are necessary to promote off-peak charging and produce 16
benefits for its customers.44 17
18
For EV-Ready Builder Rebates, DTE has learned that these are not as attractive as 19
anticipated for builders for two reasons: 20
1. Single-family builders want to keep offerings to customers consistent across 21
homes and communities and, given the short-term nature of Charging 22
42 For additional information on DTE Smart Charge, please see testimony of Witness Farrell 43 DTE Tracking Survey from November 2020 (n = 503) 44 BYOC and regular residential rate data from Sagewell; Residential Rebate data from chargers
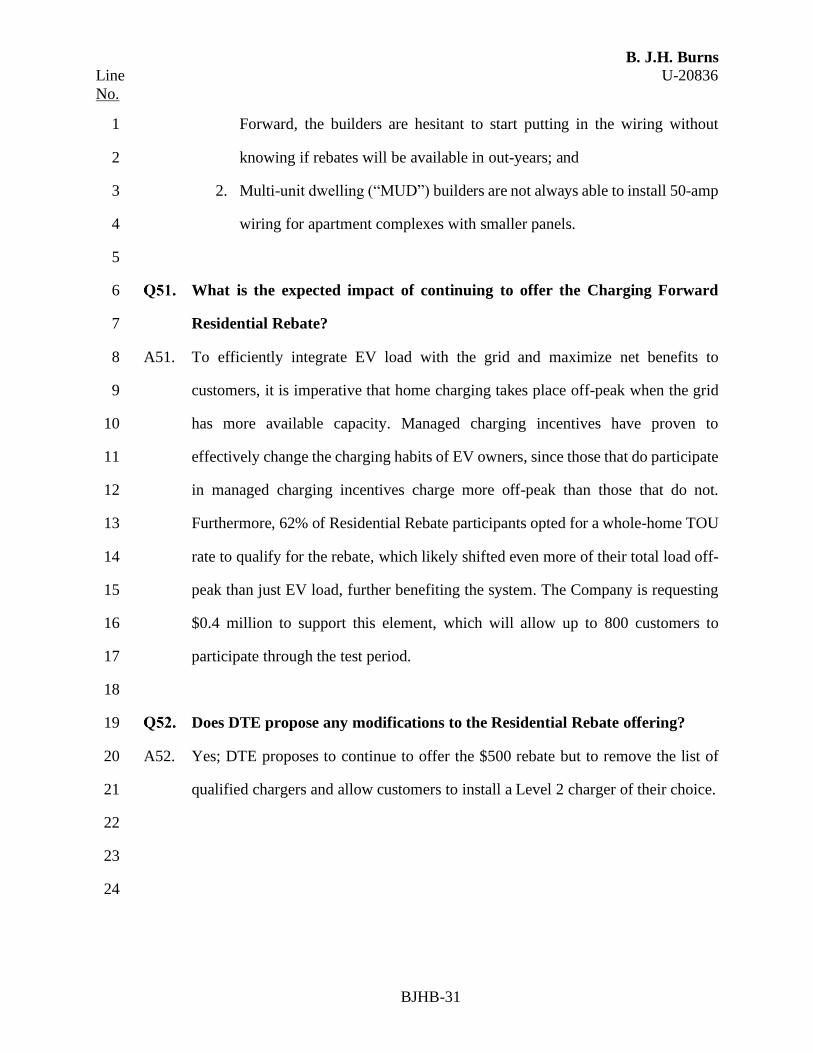
B. J.H. Burns
Line U-20836
No.
BJHB-31
Forward, the builders are hesitant to start putting in the wiring without 1
knowing if rebates will be available in out-years; and 2
2. Multi-unit dwelling (“MUD”) builders are not always able to install 50-amp 3
wiring for apartment complexes with smaller panels. 4
5
What is the expected impact of continuing to offer the Charging Forward 6
Residential Rebate? 7
A51. To efficiently integrate EV load with the grid and maximize net benefits to 8
customers, it is imperative that home charging takes place off-peak when the grid 9
has more available capacity. Managed charging incentives have proven to 10
effectively change the charging habits of EV owners, since those that do participate 11
in managed charging incentives charge more off-peak than those that do not. 12
Furthermore, 62% of Residential Rebate participants opted for a whole-home TOU 13
rate to qualify for the rebate, which likely shifted even more of their total load off-14
peak than just EV load, further benefiting the system. The Company is requesting 15
$0.4 million to support this element, which will allow up to 800 customers to 16
participate through the test period. 17
18
Does DTE propose any modifications to the Residential Rebate offering? 19
A52. Yes; DTE proposes to continue to offer the $500 rebate but to remove the list of 20
qualified chargers and allow customers to install a Level 2 charger of their choice. 21
22
23
24

B. J.H. Burns
Line U-20836
No.
BJHB-32
Why does DTE believe this modification will be beneficial to the Expansion’s 1
goals? 2
A53. Despite Charging Forward proving effective with the participants it does have, 3
uptake in the incentives has been somewhat limited: there have been approximately 4
6,250 EVs sold in DTE’s service territory since Charging Forward launched, but 5
there are only 1,050 total Residential Rebate and BYOC participants so far. DTE is 6
seeking to improve uptake with the Expansion by adjusting eligibility requirements 7
for the Residential Rebates. Allowing the Company to test the new qualifications 8
and compare against the original incentive and early success of BYOC will help 9
determine the best long-term approach. While it is beneficial for DTE to receive 10
data from the currently qualified chargers, the Company does not see that as a 11
requirement going forward for two reasons. First, DTE estimates that over 2,000 12
networked chargers will be enrolled in the existing Charging Forward pilot, and it 13
can leverage the advanced metering infrastructure (“AMI”) analytics from 14
Sagewell and the EV-only TOU rate (D1.9) if a larger sample of customers is 15
needed. Second, removing the qualified charger requirement will help to keep costs 16
lower for customers as they will be able to choose less expensive chargers and/or 17
potentially not have ongoing software fees. 18
19
The Company recognizes the long-term benefits of networked chargers as more 20
distributed energy resources (“DERs”) are added to the grid, but given the relatively 21
small size of the pilot and the somewhat random locations they would be placed as 22
customers participate, the value of the network capability will likely not be realized 23
by the Company or its customers in the next five years. Additionally, future DR 24
pilots and programs do not only have to rely on networked chargers – they can also 25

B. J.H. Burns
Line U-20836
No.
BJHB-33
be achieved by controlling charging through vehicle telematics, as demonstrated by 1
DTE Smart Charge. 2
3
Why is it important to continue offering BYOC in parallel? 4
A54. One of the primary goals of Charging Forward is to maximize program 5
participation at a minimum cost. By offering BYOC, DTE increased Charging 6
Forward participants from 615 to 1,050 at a relatively low cost within one year. The 7
Company is still testing the best way to incentivize customers to charge their 8
vehicles off-peak, and 22% of BYOC participants indicated they did not want to 9
enroll in a TOU rate.45 If customers do not feel comfortable moving their entire 10
home onto a TOU rate, nor do they want to pay for the installation of a second 11
meter, BYOC is an efficient, effective way to incentivize off-peak charging in the 12
near-term and ensure EV load benefits accrue to all customers. The Company is 13
requesting $0.1 million for this element, which can support adding up to an 14
additional 500 participants through the test period. 15
16
Why should the EV-Ready Builder Rebate be continued? 17
A55. It can cost up to five times as much to install the wiring for an EV charger after a 18
home is built. However, absent a rebate, builders are largely not offering EV future-19
proofing to their customers. Incentivizing both single-family and MUD builders to 20
install this wiring upfront will make it easier and less expensive for future residents 21
to purchase an EV. If Michigan building codes are updated to require EV-readiness 22
for new building construction, the Company would discontinue the EV-Ready 23
Builder Rebate and only distribute funds to previously-approved communities. The 24
45 BYOC participant survey April 2021 (n=105)

B. J.H. Burns
Line U-20836
No.
BJHB-34
Company is requesting $0.1 million for this element, which can support the wiring 1
for up to 280 homes through the test period. 2
3
Does DTE want to introduce another element in the Charing Forward 4
Expansion to encourage Residential Level 2 Charging? 5
A56. Yes; the Company is proposing to offer Residential CaaS to alleviate the 6
burdensome process and upfront costs of installing home chargers. 7
8
What are the primary design features of Residential CaaS? 9
A57. DTE will offer a turnkey installation and financing solution to customers interested 10
in a Level 2 charger for their single-family homes. The Company will contract with 11
licensed electricians to install a 240V outlet in customer homes, and it will also 12
contract with charging vendors to provide a plug-in EV charger if the customer opts 13
for a full charging solution (versus just the 240V outlet). Once the installation is 14
complete, the customer would pay a monthly fee on their electric bill for a period 15
of ten years. The Company is requesting $2.4 million to support this element, which 16
will allow up to approximately 1,100 customers to participate through the test 17
period. 18
19
What value does this service add for the participating customer? 20
A58. The typical home charger installation process requires as many as seven steps (with 21
EV customers having to undertake research at most steps along the way). DTE’s 22
home charger installation service would reduce the number of steps for 23
participating customers to only two: contact DTE and schedule the installation. 24
Customers will no longer need to worry about finding available incentives, 25

B. J.H. Burns
Line U-20836
No.
BJHB-35
researching chargers, vetting electricians, or soliciting quotes, which will reduce 1
the amount of time, complexity, and frustration for them. 2
3
Additionally, this service will partially or fully remove the upfront cost for 4
customers to install an EV charger, which is about $2,000 on average today.46 5
Spreading the upfront cost over ten years in the form of an affordable monthly 6
payment on the customer’s electric bill – which should be less than what they are 7
saving in monthly fuel costs – assists in removing both complexity and upfront 8
price pressure when purchasing an EV. 9
10
Is Residential CaaS designed to be participant-funded? 11
A59. Yes; the monthly fee over a period of ten years would be designed to cover the 12
increased revenue requirement from the capital outlay and estimated maintenance 13
costs, ensuring that impact on rate base is neutral over time. If customers move 14
before the ten years is complete, the unpaid amount left on their agreement will be 15
added to their final electric bill (along with any unpaid usage fees from their meter). 16
For instance, if a customer has paid a total of $800 of principal towards their $2,000 17
installation, they will have the remaining principal of $1,200 added to their final 18
electric bill. The customers that opt for the full charging solution will be able to 19
take the plug-in chargers with them, and the home will be EV-ready with the 240V 20
outlet for the next resident. 21
22
23
46 PlugShare EV Home Charging Station Installation in the US Survey (n=3,500); Residential CaaS is
meant to finance the cost of a standard installation - there may be cases where customers need to pay some
amount upfront if their installation requires significant additional services (e.g., upgraded service, new
panel, wiring through finished drywall, etc.)

B. J.H. Burns
Line U-20836
No.
BJHB-36
What are the key learnings DTE is seeking from this new service? 1
A60. DTE is seeking to understand three key things from Residential CaaS. First, it is 2
seeking to understand how the burdensome process to install a Level 2 charger at 3
home is impacting EV adoption. While on the surface it may not seem like a critical 4
factor, it could be enough to dissuade a large portion of customers on the fence 5
when considered in conjunction with other barriers (e.g., the upfront premium of 6
EVs and the lack of familiarity with the technology and/or installation process). 7
Understanding customer demand for an offering like this to simplify the EV charger 8
installation process and finance it on a customer’s monthly bill will be important 9
information for future pilots and programs. 10
11
Second, DTE is seeking to strengthen partnership opportunities with dealerships. 12
As reported in its 1st Annual Status Report, the Charging Forward team visited over 13
30 dealerships of 10 different automakers, presented an overview of the EV market 14
and available program incentives to ~120 participating dealership personnel at the 15
Michigan Automobile Dealers Association annual conference, and hosted a Lunch 16
and Learn at the Detroit Auto Dealers Association in 2019. The team educated 17
salespeople on Charging Forward incentives, electric pricing options, and DTE EV 18
website resources and provided leave-behind materials for both the sales staff and 19
potential EV buyers.47 Offering an easy solution for home charging to potential EV 20
buyers could help dealership personnel with sales, and increased sales will help 21
them become more familiar with the technology to field questions as needed. 22
23
47 https://mi-psc.force.com/sfc/servlet.shepherd/version/download/068t000000CFtGtAAL

B. J.H. Burns
Line U-20836
No.
BJHB-37
Third, the Company would like to understand the best way to encourage 1
participants to charge off-peak. Since this element of the Expansion is designed to 2
be participant-funded and is seeking to understand how large of a barrier home 3
charger installation is for potential EV buyers, DTE does not want to introduce a 4
TOU requirement as a potential limiting factor to start. However, the Company 5
does intend to promote its available managed charging incentives to these 6
customers and better understand what new drivers will decide to do (and why). 7
8
How is this complementary to other Charging Forward elements? 9
A61. Residential CaaS is complementary to the existing Residential Rebate and BYOC 10
elements, which can be coupled with this offering to incentivize off-peak charging. 11
12
What metrics will the Company use to evaluate the Residential Level 2 13
Charging component? 14
A62. The Company will track several metrics to gauge success of the Residential Level 15
2 Charging component, including: 16
• Number of participants by element; 17
• Participant enrollment in managed charging incentives (if applicable); 18
• Charging behavior (percent off-peak vs. on-peak); and 19
• Installation and maintenance costs. 20
21
C. Commercial Customer Support 22
What incentives does DTE currently offer through Charging Forward to 23
support commercial customers? 24

B. J.H. Burns
Line U-20836
No.
BJHB-38
A63. DTE currently offers Make-Ready Rebates to commercial customers that install 1
and operate qualified Level 2 chargers and/or DCFCs. In both cases, if an EV 2
Service Connection is required, DTE fully funds the DTE-owned equipment up to 3
$100,000 per site. For the Level 2 chargers, there is an additional $2,500 rebate per 4
port installed. For DCFCs, there is a tiered rebate structure based on the power 5
output of the charger; rebates start at $18,000 for 50 kilowatts (“kW”) and go up to 6
$55,000 for 150kW or higher. As of November 2021, Charging Forward is fully 7
subscribed for both Level 2 and DCFC rebates. 8
9
What are the key learnings from the Make-Ready Rebates so far? 10
A64. There have been several learnings that DTE has gained from the Make-Ready 11
Rebates since pilot launch. From a cost standpoint, the Company has learned it can 12
efficiently integrate DCFCs with the grid through an engineering assessment 13
process. The Company first evaluates if a system upgrade is required prior to 14
application approval and institutes an “On-Hold” process for sites that require 15
significant investment. In doing so, the Company identified installations for 16 16
chargers that would have required significant EV Service Connections (in excess 17
of $100,000 per site) and successfully influenced the relocation of 25% of them to 18
better sites (while the others were withdrawn). Also, by following that process, the 19
waived CIAC fees have only cost approximately $5,000 to install two DCFCs at a 20
site on average (versus an original estimate of $40,000 per site). Because of its 21
proactive engineering assessment process, the Company was able to nearly triple 22
the number of DCFC rebates offered to customers from 32 to 90 with the same 23
amount of funding, achieving its objective to maximize participation at a minimum 24

B. J.H. Burns
Line U-20836
No.
BJHB-39
cost to customers. For Level 2 chargers, no sites to-date have required any CIAC 1
fees as existing electrical infrastructure has been sufficient to power the chargers. 2
3
DTE has also learned the importance of designing rebates to incentivize the types 4
of chargers deployed. For example, the Company was unintentionally only 5
incentivizing 50kW chargers with its original $20,000 per charger rebate but has 6
since adjusted to the tiered rebate structure described above after feedback from 7
stakeholders, which more fairly incentivizes higher-powered charging deployment. 8
The Company has also learned the importance of its incentives for charging 9
infrastructure deployment at this nascent market stage. DTE has rejected several 10
DCFC applications due to location or grid impact, and none of the site hosts have 11
proceeded to install DCFCs absent the Charging Forward rebate. Additionally, 12
DTE surveyed 20 customers that are currently on a DCFC waitlist (since the 13
existing rebates are nearly fully subscribed), and 100% of respondents indicated 14
they do not plan to move forward without a rebate. 15
16
The Company has also learned from Charging Forward data that approximately 17
75% of commercial charging takes place outside the critical peak window, so it 18
does believe this added load can be beneficial to all customers so long as it is 19
correctly managed at the local distribution level and during critical peak events. 20
Lastly, the Company confirmed its hypothesis that DCFC site hosts would most 21
likely enroll in its General Service Rate (D3), which does not require a demand 22
charge but has a volumetric charge that is three to four times greater than those that 23
do (e.g., D4 and D11). To-date, five site hosts are served by D3 whereas three site 24
hosts opted to include the DCFCs on their existing rates with demand charges. Of 25

B. J.H. Burns
Line U-20836
No.
BJHB-40
the remaining approved sites that have not been installed yet, the vast majority are 1
expected to enroll in D3. 2
3
Why is it important to continue offering the make-ready rebates to site hosts? 4
A65. The business case for installing and operating chargers is still extremely 5
challenging and, as suggested above, incentives are still needed today to deploy the 6
charging infrastructure required to support EV adoption. The network of publicly 7
available EVSEs is not sufficient for near-term demand (let alone future growth) as 8
shown in Table 7 below. The Company is requesting $3.9 million for this element, 9
which can support the make-ready Service Connection and rebates for up to 250 10
Level 2 ports and 50 DCFCs through the test period. 11
12
Table 7. State of Charging Infrastructure in DTE Electric’s Territory48 13
Existing
Ports
Needed
by 2023
(52,000
EVs)
Estimated
DTE
Rebates49
Estimated
Remaining
Gap in
2023
Total
Level 250
620 6,000 750 4,630
DCFC 110 730 124 496
14
Given the amount of charging infrastructure needed in DTE’s electric service 15
territory by 2023, nearly ten times the existing ports, it is critical for the Company 16
to continue offering incentives and ensure charging deployment does not stall at 17
48 Based on Department of Energy Alternative Fuels Data Center’s EVI-Pro Lite tool, assuming 76% of
drivers having access to home charging and a split of 30% 20-mile PHEVs, 10% 50-mile PHEVs, 20%
100-mile BEVs, and 40% 250-mile BEVs 49 Includes the pipeline from the original Charging Forward pilot and the Expansion through the test period 50 Includes workplace and public, not residential

B. J.H. Burns
Line U-20836
No.
BJHB-41
such an important development stage in the EV market. As shown in Table 7 above, 1
the amount of incentives DTE is proposing through the test period is still leaving a 2
significant gap, demonstrating that the Company is not seeking to incentivize the 3
entire comprehensive network recommended by the Department of Energy. Rather, 4
DTE is aiming to create a limited network that is required to reduce range anxiety 5
and ensure the EV adoption rates are realized, which is necessary to achieve the 6
Michigan Healthy Climate Plan and the Regional Electric Vehicle (“REV”) 7
Midwest Coalition Memorandum of Understanding (“MOU”) signed by Governor 8
Whitmer in September 2021. The press release from the REV Midwest MOU states, 9
“Improving access to charging infrastructure and reducing range anxiety will 10
support EV adoption and the next generation of American-made electric 11
automobiles.”51 12
13
Are the Make-Ready Rebates needed if there are other sources of funding 14
available such as Federal or State incentives? 15
A66. Yes; the goal of the Make-Ready Rebate is not to be a replacement for but rather 16
be complementary to other available incentives and help deploy EV infrastructure 17
across Michigan in this early market stage. For example, DTE has worked closely 18
with the Michigan Department of Environment, Great Lakes, and Energy 19
(“EGLE”) and their Charge Up Michigan grant program, which actually requires 20
applicants to first be approved through a utility incentive. State agencies have 21
appropriately relied on utilities to perform a large portion of due diligence on their 22
behalf (e.g., qualifying vendors, assessing grid impacts, and collecting data), and 23
utilities are best suited to do this with their own incentives. The Company will 24
51 https://www.michigan.gov/whitmer/0,9309,7-387-90499_90640-569470--m_2020_1,00.html

B. J.H. Burns
Line U-20836
No.
BJHB-42
continue to work closely with governmental agencies as any potential Federal or 1
State incentives become available for customers to ensure alignment and 2
achievement of incentive goals. 3
4
Will the Company offer the same rebate amounts to site hosts with the 5
expansion? 6
A67. Yes, for DCFCs. The tiered rebate structure for DCFCs described above is designed 7
to offset the EV Supply Infrastructure cost, which has been sized appropriately for 8
the chargers installed thus far. The Company believes this is the appropriate amount 9
to balance offsetting costs and encouraging necessary deployment while still 10
requiring investment from the site host, but it may adjust rebate amounts in the 11
future if reasonable and prudent (e.g., if additional funding sources become readily 12
available). 13
14
For Level 2 chargers, if the Expansion is approved and additional funding for Level 15
2 chargers becomes available, DTE proposes to decrease the rebate from $2,500 16
per port to $2,000 per port which is more in-line with the EV Supply Infrastructure 17
cost of installing Level 2 ports from what the Company has seen thus far. 18
19
Does DTE want to introduce other elements under the Commercial Customer 20
Support umbrella? 21
A68. Yes; DTE is proposing two additional elements under Commercial Customer 22
Support: Charging Hubs and Transit Batteries. 23
24
What are the primary design features of Charging Hubs? 25

B. J.H. Burns
Line U-20836
No.
BJHB-43
A69. DTE would build, own, operate, and maintain sites with several high-powered 1
DCFCs at appropriate sites when certain buildout criteria are met to justify the 2
investment. The Charging Hubs would be primarily designed to serve multiple 3
customers with Class 3-6 medium-duty (“MD”) and/or Class 7-8 heavy-duty 4
(“HD”) fleet EVs, while also being available to light-duty passenger vehicles. The 5
design and size of the Charging Hubs could vary based on the expected demand, 6
but in general, the Charging Hubs will have approximately 12 DCFCs between 7
150kW and 350kW to start. Similar to truck stops, the charging spaces will be 8
covered by a canopy to protect drivers from the elements with a restroom and 9
vending facility available for convenience. 10
11
Why does the Company believe that DTE Charging Hubs are needed in the 12
market today? 13
A70. While the upfront cost to electrify fleets is primarily driven by vehicle premiums, 14
the cost of charging infrastructure can be significant, especially for MD and HD 15
fleet owners that are looking to pilot just one or two EVs. The current publicly-16
available DCFC infrastructure is designed for passenger vehicles, which have 17
smaller parking dimensions than what is required for larger MD and HD vehicles. 18
Charging Hubs designed for MD and HD fleets allow commercial customers to 19
pilot electrification at a relatively low cost and enables them to confidently 20
accelerate their electrification journey. 21
22
Why is fleet electrification beneficial? 23
A71. Fleet electrification will be an important piece of the solution for Michigan to 24
achieve its net-zero emissions target. Larger vehicles disproportionately emit 25

B. J.H. Burns
Line U-20836
No.
BJHB-44
GHGs compared to their on-road presence: approximately 27% of on-road 1
emissions come from larger vehicles even though they make up only about 4% of 2
the overall vehicle fleet.52 3
4
Fleet operators will also benefit from lower operational expenses of electric MD 5
and HD vehicles. Diesel MD and HD vehicles get only about 6-10 miles per gallon 6
in efficiency, which translates to about $0.30 to $0.50 per mile for fuel, assuming 7
an average of $3 per gallon.53 Based on the pricing supported by Witness Willis, 8
“refueling” at Charging Hubs will be up to 40% less expensive than it is for diesel 9
today. In addition to fuel savings, electric fleet operators could also realize 10
maintenance savings up to 50% compared to their existing diesel vehicles.54 11
12
Why is it appropriate for DTE to own and operate Charging Hubs? 13
A72. DTE is uniquely suited to site Charging Hubs where there is both sufficient power 14
supply and customer demand. Because DTE can identify ideal locations on its 15
system, it can deploy Charging Hubs at a minimum total cost. Creating centralized 16
Charging Hubs with shared usage has the potential to significantly reduce the total 17
number of chargers required. For example, if DTE installed a Charging Hub with 18
12 DCFCs, it could serve as many as 100 vehicles every day of the week (a ratio of 19
three chargers to 25 vehicles). If fleet owners each wanted to pilot one or two EVs 20
and did not have a Charging Hub, they would each need to install at least one 21
charger at their individual facilities (a ratio of one charger to two vehicles at best). 22
Proactively siting Charging Hubs where there is more available capacity on the 23
52 https://calstart.org/wp-content/uploads/2021/05/How-Zero-Emission-Heavy-Duty-Trucks-Can-Be-Part-
of-the-Climate-Solution.pdf 53 https://www.eia.gov/todayinenergy/detail.php?id=26832 54 https://ww2.arb.ca.gov/sites/default/files/2020-12/201207costdisc.pdf

B. J.H. Burns
Line U-20836
No.
BJHB-45
system and creating better utilization of the chargers through shared usage will help 1
minimize overall system improvement costs to DTE’s customers. A shared 2
Charging Hub also provides a way for DTE’s C&I customers to have equitable 3
access to charging by avoiding electrical system bottlenecks for fleet electrification 4
in areas with many C&I customers, because ideally-located Charging Hubs could 5
potentially serve all customers. 6
7
What buildout criteria would need to be met? 8
A73. DTE believes the following six buildout criteria should be considered for Charging 9
Hub sites: 10
• Locations with sufficient DTE system capacity; 11
• At least 1,500 MD or HD fleet vehicles registered in surrounding zip codes 12
within three miles of the site; 13
• Within two miles of a major roadway with at least 2,000 average daily 14
traffic of commercial vehicles; 15
• Sufficient land available to install several DCFCs; 16
• An MOU with at least three customers showing intent to utilize the hub; and 17
• In or near a non-attainment zone for criteria pollutants. 18
19
If all of the criteria are met for a site, the Company would deploy a Charging Hub 20
there. In the event there is a site in high demand for customers, but other criteria 21
are not satisfied, the Company will explore other options to serve those customers. 22
The Company is requesting $2.8 million to begin the design and construction on up 23
to two Charging Hubs as long as the above criteria are met. 24
25

B. J.H. Burns
Line U-20836
No.
BJHB-46
1
How will the rate to use the Charging Hub be designed? 2
A74. The rate would be structured with a volumetric charge and session fee to reflect the 3
cost that the Company incurs to serve the Charging Hub and a per session charge 4
to offset a portion of the initial capital outlay to build it. See Witness Willis’s 5
testimony for pricing information. Charger capacities may vary from those 6
described here, and to ensure flexibility, I have directed Company Witness Willis 7
to design the rate for <200 kW chargers and >200 kW chargers. 8
9
What assumptions are being made around utilization and charging levels? 10
A75. DTE is assuming that MD vehicles will use the 150kW chargers and HD vehicles 11
will use the 350kW chargers. In the first year of operation, the Company is 12
assuming a total of 15 vehicles – 13 MD and two HD – would use the chargers 13
daily, which would lead to about 3,750 sessions (656,000 kW-hour or “kWh”) for 14
the 150kW chargers and 575 sessions (293,000 kWh) for the 350kW chargers. 15
16
What key learnings is DTE seeking to gain from Charging Hubs? 17
A76. DTE is looking to increase electrification among MD and HD vehicles and will use 18
Charging Hubs to better understand: 19
• Impact on DTE’s customer base; 20
• EV adoption impacts (compared to customers without access to a Hub); 21
• Optimal design of Charging Hubs (including charger quantities and power 22
outputs, usage fee, and locations); and 23
• Best practices for managed charging and/or peak-shaving solutions at a 24
high-powered commercial site. 25

B. J.H. Burns
Line U-20836
No.
BJHB-47
1
What are the primary design features of the Transit Batteries element? 2
A77. DTE is proposing to purchase transit bus batteries and recover its costs from 3
participating transit agencies to facilitate and accelerate their journeys to 4
electrification. The Company would work directly with bus manufacturers and 5
transit agencies to make it as seamless as possible for the agencies to procure buses 6
such that: 7
• From their perspective, they order the bus the same as they typically would 8
from the manufacturer, but the upfront price is discounted by the amount of 9
the battery; and 10
• Purchased buses could still qualify for other available funding sources such 11
as Federal Transit Administration (“FTA”) Low-No Emissions Grants. 12
13
While the batteries are on the bus, DTE would collect data on the battery and its 14
charging pattern and transit agencies would be responsible for a monthly cost 15
recovery fee through a new electric bus (“eBus”) tariff, which can be found as Rider 16
21 in Exhibit A-16, Schedule F-8 sponsored by Witness Willis. After the utility’s 17
costs are recovered, a participating transit agency would take ownership of the 18
battery. At the end of the battery’s useful life on the bus, the transit agency would 19
either need to repurpose or dispose of it themselves or they could return it to DTE 20
at a fair market salvage value to repurpose the battery to benefit the grid. Although 21
the Company anticipates taking ownership of the batteries after their useful life on 22
the bus, the option of ownership for transit agencies is an important factor for transit 23
agencies to be able to qualify for FTA funding in parallel. 24
25

B. J.H. Burns
Line U-20836
No.
BJHB-48
1
What is the background on the eBus tariff? 2
A78. The eBus tariff is based on the Pay as You Save (“PAYS”) model, which was 3
originally invented by the Energy Efficiency Institute, Inc. as a financial tool for 4
climate solutions, primarily for building energy upgrades such as weatherization 5
and heating, ventilation, and air conditioning (“HVAC”) upgrades. Clean Energy 6
Works (“CEW”), with oversight from the Global Innovation Lab for Climate 7
Finance, adapted it to apply to clean transport, specifically transit eBuses to start. 8
MPSC Staff requested a briefing by CEW on the tariff in its eighth stakeholder 9
meeting for the MI Power Grid New Technologies and Business Models workgroup 10
on May 19, 2021, and it was received positively by the group.55 11
12
Are the batteries useful beyond their life in the bus? 13
A79. Yes; per McKinsey & Company, “these batteries can live a second life, even when 14
they no longer meet EV performance standards…After remanufacturing, such 15
batteries are still able to perform sufficiently to serve less-demanding applications, 16
such as stationary energy-storage services.”56 If this element is approved next year, 17
the Company would expect the first bus with this ownership model to be put in-18
service in 2024 (due to the lead-time of bus procurement), which means the 19
Company will have until approximately 2030 to plan for where and how batteries 20
can best be repurposed and utilized on its system. Potential applications include 21
storage for renewables, fast charging on critical circuits, customer back-up power, 22
and/or peak shaving. 23
55 https://www.youtube.com/watch?v=jDoUGr9OUZE 56 https://www.mckinsey.com/industries/automotive-and-assembly/our-insights/second-life-ev-batteries-
the-newest-value-pool-in-energy-storage

B. J.H. Burns
Line U-20836
No.
BJHB-49
1
What is the value of Transit Batteries as an enabler in today’s market? 2
A80. Despite paying back over the life of the bus through significant fuel and 3
maintenance savings, transit eBuses can have an upfront purchase premium of over 4
80%, which is extremely difficult for transit agencies to overcome.57 Eliminating 5
the largest source of the upfront premium, the cost of the battery, makes 6
electrification much more manageable for transit agencies, especially when 7
combined with additional sources of funding. 8
9
What are the impacts of transit bus electrification? 10
A81. Transit bus electrification benefits many stakeholders. In addition to lowering 11
transit agencies’ fuel and maintenance costs as described above, it also helps put 12
downward pressure on rates, because most routes can be accommodated with 13
overnight, off-peak depot charging. The Transit Batteries element will prioritize 14
those cases to maximize net benefits to DTE’s customers. 15
16
Second, combining DTE’s proposed Transit Batteries with potential increased FTA 17
funding for eBuses could greatly accelerate deployment in the state, enabling 18
achievement of the Michigan Healthy Climate Plan referenced above. An eBus 19
produces 62% fewer emissions than the average diesel bus, and this will only 20
continue to improve as DTE achieves its own commitment to carbon neutrality.58 21
22
23
24
57 https://afdc.energy.gov/files/u/publication/financial_analysis_be_transit_buses.pdf 58 https://onlinepubs.trb.org/onlinepubs/tcrp/tcrp_rpt_226FactSheet3.pdf
B. J.H. Burns
Line U-20836
No.
BJHB-50
Is the Transit Batteries element designed to be rate neutral? 1
A82. Yes; although the initial cost of the battery will be funded upfront through rates, 2
this element will be designed to recoup the associated increase in revenue 3
requirement in full over time through the following two revenue streams: 4
1) Anticipated increase in revenue from overnight depot charging 5
less the cost to serve this increased load over the life of the 6
bus;59 and 7
2) A monthly fee calculated upfront to cover the remaining gap 8
in battery cost (Rider 21 referenced above). 9
A key principle of the eBus tariff is that the calculated monthly fee will be less than 10
the estimated operational savings the transit agency would achieve from 11
electrification. This also correctly incentivizes transit agencies to maximize bus 12
usage, since the fee is fixed and recognizes that the more they drive the transit eBus, 13
the more operational savings they can realize. Because of the long lead time to 14
procure transit eBuses, the Company is currently requesting $0.4 million to deploy 15
one bus through the test period. 16
17
What key learnings is DTE seeking from this element? 18
A83. DTE is seeking to increase the sample size of electric transit buses in its electric 19
service territory to better understand: 20
• Optimized charging solutions to minimize grid investments while meeting 21
the transit agencies’ needs (e.g., depot charging solutions and charger to bus ratios) 22
and 23
59 Based on route mileage, eBus efficiency, charger deployed, and transit agency’s electric rate.
B. J.H. Burns
Line U-20836
No.
BJHB-51
• Right sizing of bus battery packs to meet route requirements after adjusting 1
for known cold-weather impacts. 2
3
Additionally, the Company is seeking to learn more about how batteries might be 4
repurposed after their useful life on EVs and efficiently integrated into DTE’s 5
system at a lower cost than buying new, which could also help address any potential 6
environmental impacts of recycling used batteries from EVs as adoption grows. 7
8
How are DTE Charging Hubs and Transit Batteries complementary to other 9
Charging Forward elements? 10
A84. Charging Hubs are complementary to the eFleets Advisory Services component 11
that was recently approved. As DTE approaches its commercial customers to help 12
provide a roadmap to electrification, it will be able to provide a solution to 13
customers near potential sites that are hesitant to install their own EVSE. Similarly, 14
it will be able to provide insight back to the team on demand for potential future 15
sites. 16
17
The Transit Batteries element is also complementary to eFleets and its available 18
EVSE rebates for transit agencies up to $70,000 per charger. Paired with Advisory 19
Services, DTE could be solving the issues of technology expertise, upfront bus 20
premium, and charging infrastructure all at once for the transit agencies. 21
22
Lastly, both elements are complementary to each other, since used transit bus 23
batteries could potentially be repurposed to serve as on-site storage at Charging 24

B. J.H. Burns
Line U-20836
No.
BJHB-52
Hubs to alleviate any potential critical peak demand issues in the future as 1
utilization of the sites grows. 2
3
What metrics will the Company use to evaluate the Commercial Customer 4
Support component? 5
A85. For Make-Ready Rebates, DTE will continue to track participants, geographic 6
diversity, site host verticals, site costs, deployed charger data, and additional 7
sources of funding (e.g., from EGLE). It will also test and analyze how adjusting 8
incentive levels and qualification criteria affects uptake. 9
For Charging Hubs, DTE will track utilization by charger power level, number of 10
C&I customers supported, number of fleet vehicles supported, number of passenger 11
vehicles supported, site costs (both deployment and ongoing maintenance), peak 12
demand, load profile, and revenue collected. 13
14
For Transit Batteries, DTE will report number of buses deployed, average battery 15
costs, transit agencies supported, number of supporting Charging Forward eFleets 16
rebates issued, other additional sources of funding, average monthly fee, and 17
estimated battery kWh available to be repurposed by year of coming offline. 18
19
D. Equitable Access to EVs 20
To date, have EVs and EVSE been evenly distributed throughout the U.S. and 21
in Michigan? 22
A86. No; EV ownership is unequally distributed by demographics such as income, 23
population, and race. Counting both new and used vehicle purchases, households 24
earning less than $100,000 per year represent only 44% of EV purchases (but 66% 25

B. J.H. Burns
Line U-20836
No.
BJHB-53
of U.S. households), and Black and Hispanic car buyers make up only 12% of EV 1
purchases (but 33% of the U.S. population).60, 61, 62 EV ownership is also unequally 2
dispersed along the urban-rural divide. From the International Council on Clean 3
Transportation (“ICCT”), “The 50 most populous metropolitan areas accounted for 4
80% of new 2019 U.S. electric vehicle registrations… and 55% of the U.S. 5
population.”63 6
7
Public EV charging infrastructure is also unevenly distributed, depending on the 8
area’s income, demographics, proportion of MUDs, and whether it is a rural area 9
or not. A recent study in California showed public charger access is lower in areas 10
with below-median household incomes and with majority Black and Hispanic 11
populations. The charger access gap is even larger considering just publicly-funded 12
public charging stations, where Black and Hispanic majority areas are 13
approximately half as likely to have access. These public charger access disparities 14
are more pronounced in areas with a higher proportion of MUDs. For areas with a 15
similar proportion of MUDs, higher-income areas are twice as likely to have access 16
to a public charger as lower-income areas. Adding to this disparity is that residents 17
of higher-income luxury MUDs are not only more likely to have access to public 18
chargers, but because of the amenities available, they are also more likely to have 19
dedicated parking structures that enable them to install private residential chargers 20
(compared to residents of lower-income MUDs).64 Charging infrastructure is also 21
60 https://escholarship.org/uc/item/0tn4m2tx 61 https://www.census.gov/data/tables/time-series/demo/income-poverty/cps-hinc/hinc-01.html 62https://mtgis-
portal.geo.census.gov/arcgis/apps/MapSeries/index.html?appid=2566121a73de463995ed2b2fd7ff6eb7 63 https://theicct.org/sites/default/files/publications/EV-cities-update-aug2020.pdf 64 https://www.sciencedirect.com/science/article/pii/S0967070X20309021

B. J.H. Burns
Line U-20836
No.
BJHB-54
more scarce in rural areas. For example, not including Tesla chargers, the entirety 1
of the Upper Peninsula has only 16 Level 2 chargers and 2 DCFCs.65 2
3
What are the equity implications of unequal EV ownership and EVSE access? 4
A87. The people most likely to benefit from reduced operational expenses and improved 5
air quality are least likely to own EVs or have access to charging. A recent report 6
by the ICCT found that the average vehicle-owning U.S. household earning less 7
than $25,000 spends 50% of their income on vehicle ownership and operation 8
annually compared to approximately 16% for median-income vehicle-owning 9
households. This same report notes that EV-related savings tend to be higher for 10
rural drivers than for urban or suburban residents because of the longer distances 11
that rural drivers travel.66 12
13
What gaps in charging access have been noted from Charging Forward so far? 14
A88. The data DTE utilizes indicates only four Charging Forward residential rebate 15
participants have been identified as low-income customers. Additionally, Charging 16
Forward had low participation from commercial customers in rural areas: as of 17
August 2021, only 14% of 36 total DCFC sites and 3% of 136 total Level 2 sites 18
approved or deployed with Charging Forward funds are placed in rural areas as 19
shown in Figure 2 below. 20
65 https://www.atlasevhub.com/materials/ev-charging-deployment/ 66 https://theicct.org/sites/default/files/publications/EV-equity-feb2021.pdf

B. J.H. Burns
Line U-20836
No.
BJHB-55
Figure 2. Map of Approved & Installed Charging Forward Rebates Compared to 1
Rural Areas67, 68 2
Interest in Charging Forward has recently picked up at MUDs, with 12% of all 3
installed or approved commercial charger sites located in that site host category.69 4
While this initially seems positive, DTE has noticed that the installed chargers and 5
approved applications tend to be for high-end MUDs, in line with the results of the 6
California study described above.70 In one instance, though, DTE was able to 7
negotiate with an MUD owner to designate 25% of their approved Level 2 chargers 8
in a lot located by a building of affordable housing units. 9
10
67 https://www.hrsa.gov/rural-health/about-us/definition/datafiles.html 68 Data as of August 20, 2021 69 Data as of October 21, 2021 70 This was determined by evaluating the marketing for the MUDs where DTE has installed or approved
chargers - most advertise luxury or upscale living.

B. J.H. Burns
Line U-20836
No.
BJHB-56
Finally, only 7 municipalities are represented in the 204 approved applications for 1
Level 2 chargers or DCFCs, and within that, most of the municipality-owned 2
chargers are located in Ann Arbor.71 DTE would like to increase participation by 3
municipalities because they manage a significant amount of public parking. 4
Installing chargers in municipality-owned parking spaces or areas could provide 5
more dependable EV charging for people without residential charging access and 6
reduce range anxiety for all potential EV drivers. Municipalities would also be ideal 7
partners if DTE decides to pilot EVSE on existing streetlights, as Kansas City did 8
with its utility Evergy.72 9
10
Why is Equitable Access to EVs an important focus for DTE? 11
A89. There is an outsized need for TE support in communities that are underrepresented 12
by current EV owners and lacking access to EV charging, and utilities are well-13
suited to address the gap as noted in the DTE’s Role in TE section above. 14
DTE can realize long-term cost reductions by intentionally building out the EV 15
charging network equitably in these early stages of EV adoption. Establishing 16
various pilots, incentives, and ownership models now with a focus on equity will 17
allow DTE to develop full-scale programs later that enable widespread EV adoption 18
at a reasonable cost to customers. DTE is committed to addressing the needs of all 19
its customers and intends to play an important part in furthering Michigan’s goal to 20
be carbon neutral by 2050. To achieve statewide carbon neutrality, all parts of the 21
transportation sector must undergo TE, including those areas left behind by third-22
party service providers. 23
71 Data as of October 21, 2021 72 https://www.smartcitiesdive.com/news/kansas-city-streetlight-mounted-ev-charger-pilot-aims-for-equity-
accessibi/603805/

B. J.H. Burns
Line U-20836
No.
BJHB-57
1
Furthermore, “Advance Equity and Clean Environment” is one of the three 2
objectives of the REV Midwest MOU. By advancing equity in its own 3
programming, DTE is complementing the State’s efforts to foster equitable TE.73 4
5
What elements is DTE proposing under this new component? 6
A90. There are three elements of the Charging Forward Expansion that DTE is proposing 7
to introduce under the new Equitable Access to EVs component: TNC Driver 8
Rebates, Income-Eligible Rebates, and Commercial CaaS. 9
10
How do TNC Driver Rebates help enable equitable access to EVs? 11
A91. TNC Driver Rebates enable equitable access to EVs in three ways. First, TNC 12
drivers themselves are more likely to come from populations that are 13
underrepresented in the general EV owning population. About 65% of TNC drivers 14
and riders identify as members of racial and/or ethnic minority groups.74 Lyft, 15
together with a University of Michigan research project, has already identified 16
about 2,000 TNC drivers in Metro Detroit that could save up to $4,000 per year by 17
switching to an EV. 18
19
Second, electrifying TNC vehicles brings the benefits of reduced air pollution to 20
areas that currently have low EV ownership rates. The 2021 Economic Impact 21
Report for Detroit from Lyft shows 59% of rides start or end in low-income areas.75 22
Paired with the greater ethnic and racial minority makeup of riders and drivers 23
73 https://www.michigan.gov/documents/leo/REV_Midwest_MOU_master_737026_7.pdf 74 https://drive.google.com/file/d/1Yol8oGRL38gKWRCOw9y65SxvY9dLMyyp/view 75 https://drive.google.com/file/d/1Yol8oGRL38gKWRCOw9y65SxvY9dLMyyp/view

B. J.H. Burns
Line U-20836
No.
BJHB-58
alike, this means electrifying TNC vehicles would reduce the air pollution in areas 1
where low-income, ethnic and racial minorities live and travel. 2
3
Third, electrifying TNC vehicles doubles as large-scale customer EV education 4
because each ride in an EV has the potential to expose someone to an EV for the 5
first time or convert an EV skeptic to an EV enthusiast over a series of rides.76 Lyft's 6
Denver EV program, which consists of 200 Kia Niro EVs, has given rides to over 7
500,000 unique passengers in the Denver metro area in less than two years. 8
Furthermore, Lyft found through a survey that Lyft EV riders were 38% more likely 9
to consider purchasing an EV for their next vehicle than riders who had not ridden 10
in a Lyft EV.77 Given the diverse make-up of the TNC driver population, 11
electrifying TNC vehicles becomes not just a convenient educational opportunity, 12
but also a primary driver of EV educational equity. In a report produced for DTE, 13
EV diversity consultancy EVNoire emphasized that “Diverse, underrepresented 14
and under-resourced communities need to have outlets and opportunities to engage 15
with diverse EV drivers who are reflective of their communities and can share EV 16
experiences in an authentic, culturally appropriate, and meaningful way.”78 17
18
How would the TNC Driver Rebates be structured? 19
A92. DTE proposes a TNC Driver Rebate of $5,000 for EVs that meet the partnering 20
TNCs’ requirements (e.g., interior space, battery range, fast charging capabilities, 21
etc.). DTE has already set aside $500,000 to test TNC Driver Rebates with its 22
existing Charging Forward funds as reviewed in three different stakeholder 23
76 https://sepapower.org/knowledge/utilities-and-ride-hailing-electrification-an-opportunity-for-all/ 77 Lyft data provided to DTE 78 EVNoire, “DTE Drive the Future Executive Summary,” 2021

B. J.H. Burns
Line U-20836
No.
BJHB-59
meetings and submitted in both Annual Status Reports.79 For the initial rollout, 1
DTE is exploring a potential partnership with Lyft that would test different 2
incentive payout structures to maximize electrification while ensuring the vehicles 3
are still being used for ride-hailing (e.g., different upfront lump sums to reduce EV 4
purchase price paired with mileage and/or ride bonuses to incentivize continued use 5
for ride-hailing). If a larger fund becomes available through the Charging Forward 6
Expansion, DTE will pursue partnership opportunities with other TNCs in its 7
electric territory. The Company is requesting $0.5 million to fund rebates for up to 8
100 TNC drivers through the test period. 9
10
What justifies this level of rebate? 11
A93. The TNC Driver Rebate would enable DTE to create EV experiences for the public 12
at a lower cost than formally organized Ride & Drives. Each EV deployed with the 13
rebate is estimated to create 3,500 EV experiences annually, equaling a cost of 14
$1.40 per experience, considering just the first year.80 This compares to $200 per 15
experience for a DTE-organized Ride & Drive. Given that the EV would likely be 16
operating in its ride-hailing capacity for longer than a year, the effective cost to 17
DTE for each EV experience courtesy of these TNC rides falls considerably. 18
19
What key learnings is DTE seeking from this element? 20
A94. Data shared from TNCs can provide insight into where (home vs. public), how 21
(Level 2 vs. DCFC), and when TNC drivers charge their EVs. It can also help DTE 22
determine where there is the greatest need for additional charging infrastructure and 23
79 https://mi-psc.force.com/sfc/servlet.shepherd/version/download/068t000000CFtGtAAL; Exhibit A-29,
Schedule T1 80 Assumes 40 rides per week and 1.7 passengers per ride (per Lyft data)

B. J.H. Burns
Line U-20836
No.
BJHB-60
how that can best be integrated with the grid to maximize net benefits to its 1
customers.81 Additionally, DTE will continue to test inclusive messaging and 2
diverse messengers to communicate this rebate to its intended audience. Finally, 3
DTE is seeking to learn how to best engage riders with EV education while in the 4
vehicles and enhance their EV experience. 5
6
Why are Income-Eligible Rebates needed? 7
A95. EVs currently cost over $10,000 more on average to purchase than the equivalent 8
gasoline vehicle, which makes it harder for lower-income households to purchase, 9
despite operational savings. However, as the technology improves, prices fall, and 10
the used car market develops, this difference is forecasted to fall to only $2,500 by 11
2025 and reach parity around 2028.82 Making incentives available to underserved 12
communities now and stacking them with other available incentives (such as federal 13
tax incentives, Charging Forward Residential Rebates, etc.) will help ensure that 14
communities that can benefit most from EVs have the opportunity to participate 15
earlier. 16
17
How would Income-Eligible Rebates be structured? 18
A96. DTE would offer $1,500 rebates to eligible customers for purchasing or leasing a 19
new or used EV under a total all-in purchase price of $50,000. DTE customers 20
could be eligible for this rebate in one of two ways: 21
1) Verifying the customer’s participation in an income-eligible public 22
assistance program like Michigan Food Assistance (“SNAP”), or the 23
81 Phillips, Erin, “Utilities and Ride Hailing Electrification: An Opportunity for All,” Smart Electric Power
Alliance, 2021. https://sepapower.org/knowledge/utilities-and-ride-hailing-electrification-an-opportunity-
for-all/ Accessed 8/11/21. 82 https://theicct.org/sites/default/files/publications/EV-equity-feb2021.pdf

B. J.H. Burns
Line U-20836
No.
BJHB-61
customer participates in income-eligible DTE assistance programs like the 1
Energy Efficiency Assistance Program; or 2
2) Verifying the customer’s income is under 400% of the Department of 3
Health and Human Services poverty guidelines, which translates to 4
approximately $51,000 for a one-person household (or about $123,000 for 5
a five-person household).83 6
7
DTE will work with stakeholders and others to determine how the rebates can be 8
issued at point-of-sale (or as close as possible), since needing to cover the costs 9
upfront may be a limiting factor for many qualified customers. The Company would 10
also require recipients of the income-eligible rebates to be participants of its 11
Residential Rebates or BYOC pilots if they have a residential Level 2 charger to 12
help ensure charging takes place off-peak when it is beneficial to the system. The 13
Company is requesting approximately $1.9 million for this element to support up 14
to 1,300 rebates for customers through the test period. 15
16
What justifies this level of rebate? 17
A97. DTE benchmarked other utilities and found that four have received approval to 18
offer EV rebates ranging from $250 to $5,500 to customers. Additionally, 19
California utilities have joined with the California Air Resources Board to offer 20
$1,500 point-of-sale price reductions. All five of these are shown in Table 8 below. 21
22
23
24
83 https://www.federalregister.gov/documents/2021/02/01/2021-01969/annual-update-of-the-hhs-poverty-
guidelines

B. J.H. Burns
Line U-20836
No.
BJHB-62
Table 8. Utility Approved EV Rebate Summary 1
2
Most of the rebates apply to all utility customers. In the case of Xcel Energy and 3
Pasadena Water & Power, this rebate is income-eligible and gives qualified 4
customers up to $5,500 and $1,500, respectively. Additionally, DTE’s proposed 5
rebate amount of $1,500 is still less than the estimated NPV gross margin that each 6
EV would add to the grid over its lifetime (see Table 11 below). 7
8
Why did the Company set income eligibility at 400% of the federal poverty 9
guidelines? 10
A98. DTE has analyzed three other approved utility income-qualified programs by 11
PG&E, Pasadena Water & Power, and Xcel Energy, and found that all use some 12
kind of categorical eligibility, with PG&E and Xcel Energy also using income 13
verification for those applicants whose income was not already verified by another 14
program. These three programs are summarized below in Table 9. 15
84 https://ww5.cityofpasadena.net/water-and-power/incomequalifiedelectricvehicles/ 85 https://www.nhec.com/drive-electric/ 86 https://evrebates.sce.com/ 87 https://www.xcelenergy.com/staticfiles/xe-responsive/Marketing/21-07-533_CO-EV-
CarRebate_app_P03.pdf 88 https://cleanfuelreward.com/
Utility Rebate
Range
Terms
Pasadena Water & Power84
(income-eligible program)
$250 -
$1500
$250 for new or used EV + $250 for local
dealership + $1000 for low-income
New Hampshire Electric Co-
op85
$600 -
$1,000
$600 for new or used PHEV, $1,000 for
new or used BEV
Southern California Edison
(“SCE”) 86
$1,000 Used BEV or PHEV
Xcel Energy
(income-eligible program)87
$3,000 -
$5,500
$5,500 for new BEV or PHEV, $3,000 for
used BEV or PHEV
California Clean Fuel Reward88
(funded by multiple CA utilities)
$1,500 $1,500 for new EV
(at point-of-sale)

B. J.H. Burns
Line U-20836
No.
BJHB-63
1
Table 9. Utility Income-Eligible Programs 2
Utility Program
Purpose
Rebate
Amount Income Qualifications
PG&E
(approved) 89
Cover the cost of
purchasing or
installing EV
charging
equipment
$2,500
Categorical qualification, or
household income no more than
400% of federal poverty
guidelines
Xcel Energy
(approved) 90
EV
purchase/lease
rebate
$3,000 -
$5,500
Categorical qualification, or
household income below one of
the following three metrics:
60% of the state of Colorado’s
median income, 200% of the
relevant federal poverty level,
or 80% of area median income.
Pasadena
Water &
Power91
EV
purchase/lease
rebate
$1,500 Categorical qualification
3
Due to the current lack of Michigan state incentives available to stack with the DTE 4
EV rebate, and based on guidance from automakers, DTE chose to align its income 5
qualification threshold with PG&E to test adoption impacts at that level for 6
Michigan. 7
8
How will DTE try to offset the costs of Income-Eligible Rebates? 9
A99. DTE will create a pathway for voluntary donations to offset this element’s cost. 10
The Commission approved a similar donation pathway for DTE’s MIGreenPower 11
(“MIGP”) program, called the MIGP Low-Income Donation Pilot (MPSC Case No. 12
U-20713, Order dated June 9, 2021). In this pilot, DTE will collect funds from 13
89 https://www.pge.com/en_US/residential/solar-and-vehicles/options/clean-vehicles/electric/empower-ev-
program.page 90 https://www.xcelenergy.com/staticfiles/xe-responsive/Marketing/21-07-533_CO-EV-
CarRebate_app_P03.pdf 91 https://ww5.cityofpasadena.net/water-and-power/residentialevrebate/

B. J.H. Burns
Line U-20836
No.
BJHB-64
customers to 1) subsidize MIGP subscriptions for other eligible customers and 2) 1
partially fund community-based solar array projects. If Income-Eligible Rebates 2
are approved as part of the Expansion, the Company will seek to apply lessons 3
learned and best practices from the MIGP Low-Income Donation Pilot to Income-4
Eligible Rebates. Additionally, should any funding become available for income-5
qualified customers to purchase an EV, the Company will work with the State of 6
Michigan to ensure the offerings are complementary (as it does for the Make-Ready 7
Rebates today). 8
9
What key learnings is DTE seeking from this element? 10
A100. DTE is looking to understand: 11
• How rebating the cost of an EV impacts EV ownership and participation in 12
Charging Forward from qualified customers; 13
• Charging behavior of underrepresented customers; and 14
• Impact of inclusive messaging and diverse messengers to promote this 15
rebate to its intended audience. 16
17
What is DTE proposing for the Commercial CaaS element? 18
A101. DTE is proposing a true utility make-ready model for Commercial CaaS. In this 19
model, DTE would install the chargers on behalf of the site host and would own 20
and fund all the electrical infrastructure costs up to the chargers (both the EV 21
Service Connection and EV Supply Infrastructure). The site hosts would own and 22
operate the chargers and fund them through a fee on their monthly electric bill (after 23
the Make-Ready Rebate is applied). 24
25

B. J.H. Burns
Line U-20836
No.
BJHB-65
Commercial CaaS differentiates from the Make-Ready Rebates DTE offers to site 1
hosts today. With Make-Ready Rebates, DTE only provides a fixed rebate, DTE 2
does not own any assets beyond the meter, and the site hosts are responsible for 3
funding and installing the chargers upfront. 4
5
What customer segments would qualify for this element? 6
A102. The following four customer segments would qualify for Commercial CaaS: 7
Environmental Justice Communities (“EJCs”), MUDs, rural areas, and 8
municipalities. All four would qualify for both Level 2 and DCFC installations. The 9
Company is requesting approximately $1.2 million for this element, which would 10
support 150 Level 2 ports and 4 DCFCs through the test period. 11
12
What is Environmental Justice and what is an EJC? 13
A103. Michigan’s EGLE defines Environmental Justice (“EJ”) as “the equitable 14
treatment and meaningful involvement of all people, regardless of race, color, 15
national origin, ability, or income … critical to the development and application of 16
laws, regulations, and policies that affect the environment, as well as the places 17
people live, work, play, worship, and learn.”92 18
19
The Environmental Protection Agency (EPA) has an EJ screening tool, EJScreen, 20
that combines environmental and demographic data to provide 11 EJ indices for 21
each community, expressed in percentiles relative to other communities.93 EGLE is 22
developing a Michigan-specific EJ screening tool, MIEJScreen, that will score 23
communities based on environmental conditions and population characteristics 24
92 https://www.michigan.gov/environmentaljustice/0,9615,7-400-98505---,00.html 93 https://www.epa.gov/ejscreen/what-ejscreen

B. J.H. Burns
Line U-20836
No.
BJHB-66
such as traffic density, wastewater discharge, poverty, and race.94 DTE may use 1
EJScreen, MIEJScreen, or another tool or method, to identify communities eligible 2
for that segment of the Commercial CaaS element. For the purposes of this 3
testimony, DTE refers to these communities as EJCs. 4
5
Which MUDs would qualify for Commercial CaaS? 6
A104. MUDs will qualify for Commercial CaaS if they provide affordable housing. 7
Affordable housing would include: 8
• Public housing; 9
• Privately-owned and government-subsidized MUDs (participating in 10
programs such as Housing Choice Vouchers, Low Income Housing Tax 11
Credit, etc.); and 12
• Privately-owned MUDs that can show they house low-income residents. 13
14
DTE would also provide Commercial CaaS to MUDs that can show they house 15
vulnerable populations or have another reasonable characteristic at the Company’s 16
discretion (e.g., TNC driver residents). 17
18
How does Commercial CaaS help enable equitable access to EVs? 19
A105. Commercial CaaS incentivizes charger installation in areas that have low 20
participation in Charging Forward thus far as described above. It significantly 21
reduces both the complexity of installation and the upfront funding required by the 22
site host. Public charging reduces range anxiety – even for those with access to 23
94 https://www.youtube.com/watch?v=E-Lo6SvN_Kg

B. J.H. Burns
Line U-20836
No.
BJHB-67
overnight charging at home – and enables EV ownership for people without access 1
to home charging. 2
3
What are your thoughts with regard to electric utility ownership and 4
operation of the EV Supply Infrastructure? 5
A106. Other utilities such as Eversource, National Grid Upstate New York (“UNY”), and 6
SCE already offer a true make-ready model, with National Grid UNY and SCE also 7
making special offers for site hosts in underserved areas.95 National Grid UNY and 8
SCE provide more support for MUDs in disadvantaged communities, and SCE is 9
also approved to rebate maintenance and networking costs for 10 years for MUDs 10
located in these areas.96,97 Both of these utilities identify disadvantaged 11
communities using a state-wide screening tool, such as the one EGLE is creating. 12
Aside from precedents at other utilities, it is reasonable and appropriate for DTE to 13
experiment with different ownership models to see what approaches are most 14
reasonable and prudent, as well as evaluate which ownership structures 15
successfully expand charging access for underserved customers before committing 16
fully to one ownership model for a larger scale and longer-term program. 17
18
What key learnings is DTE seeking to gain from this element? 19
A107. DTE seeks to learn: 20
95 https://www.eversource.com/content/ema-c/residential/save-money-energy/explore-alternatives/electric-
vehicles/charging-stations/artner-with-eversource 96 https://www.nationalgridus.com/Upstate-NY-Business/Energy-Saving-Programs/Electric-Vehicle-
Charging-Station-Program 97 https://www.sce.com/evbusiness/chargeready/multifamily
B. J.H. Burns
Line U-20836
No.
BJHB-68
• Whether additional support through Commercial CaaS will increase 1
participation of site hosts from the four qualified customer segments 2
compared to the Make-Ready Rebates element; 3
• If the increased participation and associated benefits outweigh the 4
additional costs and operational burden compared to the Make-Ready 5
Rebates element; and 6
• EV adoption rates in the zip codes surrounding the partnering Commercial 7
CaaS site hosts. 8
9
How is the Equitable Access to EVs component complementary to the rest of 10
Charging Forward? 11
A108. TNC Driver Rebates are complementary to Customer E&O since it can create 12
thousands of additional EV experiences each year. TNC Driver Rebates is also 13
complementary to Commercial CaaS, since DTE can use data from the rebates to 14
best determine where Commercial CaaS should be applied (especially as it relates 15
to MUDs for TNC drivers). 16
17
Additionally, Commercial CaaS is complementary to the Make-Ready Rebates 18
because a customer approved for Commercial CaaS is also eligible to stack the 19
incentive with the Make-Ready Rebate (so long as its terms & conditions are met). 20
21
Finally, the TNC Driver Rebates and Income-Eligible Rebates are complementary 22
to Charging Forward’s managed charging incentives, since they can be combined 23
to further maximize benefits for the participants and DTE’s customers. 24
25

B. J.H. Burns
Line U-20836
No.
BJHB-69
What metrics will the Company use to evaluate the Equitable Access to EVs 1
component? 2
A109. For TNC Driver Rebates, DTE will track vehicles deployed, rides completed, 3
incentives issued, route information, charging behavior, driver demographics, and 4
participant surveys in coordination with its TNC partner(s). For Income-Eligible 5
Rebates, DTE will track rebates issued, vehicle information, participant 6
demographics, and participation in DTE managed charging incentives. Lastly, for 7
Commercial CaaS, DTE will track charger deployment in the four targeted 8
customer segments, associated deployment costs, charger utilization data, and 9
community characteristics. 10
11
E. Program Development 12
What elements make up the Program Development component? 13
A110. An Emerging Technology Fund and Program Administration make up the fifth and 14
final component of the Charging Forward Expansion. 15
16
Is an Emerging Technology Fund necessary? 17
A111. The EV Market is fast-paced and has rapidly evolving market dynamics. Staff 18
recognized these characteristics and recommended that DTE “aggressively test new 19
and novel practices and technologies to ensure that new load associated with EV 20
charging maximizes net benefits to all ratepayers” (MPSC Case No. U-20162, 21
Order dated May 2, 2019, p. 113). DTE agrees it needs to be proactively involved 22
in new technology demonstrations to prepare for widespread EV adoption in the 23
future, but the fast-paced market is not well-suited to regulatory lag. DTE currently 24
lacks a timely source of available funding, so the Company is typically not in a 25

B. J.H. Burns
Line U-20836
No.
BJHB-70
position to partner with companies on new technology demonstrations. DTE has 1
had to turn down several opportunities to partner with companies working on new 2
technologies that have the potential to benefit customers in the long-term. 3
4
Michigan’s Office of Future Mobility and Electrification (“OFME”) is frequently 5
facilitating the conversations with these companies in an effort to establish 6
Michigan as a leader in the future of EV technologies to bring economic 7
development opportunities to the state. Oftentimes, these companies are even 8
looking for a demonstration location that would evolve into their North American 9
headquarters, creating new jobs for the State of Michigan. “Elevate Economic 10
Growth and Industry Leadership” is also one of the core activities of the REV 11
Midwest MOU, in which Michigan committed to deploying electrification and 12
other technology in collaboration with utilities, among others. Establishing an 13
Emerging Technology Fund allows the Company to test new technologies, support 14
economic development, and prepare for widespread EV adoption in the future at 15
the same time. The Company is requesting $0.9 million to be used on qualifying 16
demonstrations through the test period. 17
18
What types of demonstrations would qualify for funding from the Emerging 19
Technology Fund? 20
A112. While it’s difficult to predict what types of new technology or practices will 21
manifest over the next few years, the Company envisions to use the Emerging 22
Technology Fund to: 23
• Test cutting edge EV-grid integration solutions on its system (e.g., vehicle-24
to-building/grid, wireless charging, active load management, etc.); 25

B. J.H. Burns
Line U-20836
No.
BJHB-71
• Trial new and novel practices and/or approaches to engaging underserved 1
communities (e.g., car-sharing); 2
• Test second life applications for used EV batteries; and 3
• Reduce emissions from the transportation sector and/or further economic 4
development opportunities. 5
6
How would DTE ensure this element’s expenditures are reasonable and 7
prudent? 8
A113. To ensure collaboration and alignment across key stakeholders, DTE proposes to 9
create a small Advisory Committee of external experts and DTE to evaluate 10
opportunities and recommend whether the Company should proceed or not. 11
12
How does DTE propose to execute the Charging Forward Expansion broadly? 13
A114. DTE proposes to have a team of fourteen full time equivalent (“FTE”) employees 14
administering and executing the Charging Forward Expansion, three of which 15
would be carryover from the original Charging Forward pilot. 16
17
What are the proposed roles for the fourteen Charging Forward FTEs? 18
A115. Although it depends on the final Order and adjustments from this proposal, DTE 19
anticipates the following roles would be needed to successfully implement the 20
Expansion as currently proposed: manager(s), program manager(s), sales 21
associate(s), marketing analyst(s), strategist(s), and DTE business unit liaison(s). 22
The Company is requesting $1.8 million to fund the roles required to support 23
Charging Forward. 24
25

B. J.H. Burns
Line U-20836
No.
BJHB-72
What is the proposed timeline for the Charging Forward Expansion? 1
A116. DTE has estimated expenditures through the bridge and test periods for the 2
Expansion and intends to continue learning and refining its elements until either: 3
• The element is no longer justified with the state of the EV market; 4
• The element spend is not approved by the MPSC; or 5
• An appropriate approach for a full-scale program has been determined. 6
7
Does DTE think that a full-scale Charging Forward program will be 8
necessary? 9
A117. Yes; DTE has shown that Charging Forward incentives are necessary to promote 10
off-peak charging and to produce benefits to DTE’s customers. As the EV market 11
grows, the EV-owning population will shift from majority early adopters to 12
majority mainstream customers. As this growth continues, DTE should continue to 13
guide customer usage and infrastructure deployment patterns toward those that will 14
maximize net benefits for all customers. 15
16
Furthermore, DTE was directed by the Commission to file a long-term plan, stating 17
“In addition to providing greater transparency in the company’s Phase Two 18
proposal, including a long-term plan in DTE Electric’s next rate case will also 19
inform the Commission’s review of the company’s plans to implement its EV 20
Charging Forward program at full-scale” (MPSC Case No. U-20935, Order dated 21
March 19, 2021, pp. 5–6). 22
23
24
B. J.H. Burns
Line U-20836
No.
BJHB-73
When does DTE expect to have a long-term plan for operating a Charging 1
Forward program at full-scale? 2
A118. The Company may be able to propose long-term solutions more quickly for some 3
elements where it has already begun implementation (e.g., E&O, Residential 4
Rebates, etc.), but others may take longer to test and validate (e.g., Charging Hubs, 5
Transit Batteries, Commercial CaaS, etc.). Charging Forward has been in operation 6
for approximately 28 months, of which 13 months were greatly impacted by the 7
COVID-19 pandemic.98 Additionally, the Company is still testing different 8
incentive structures and offerings to gauge impact on EV adoption for all 9
customers, charging infrastructure deployment, and charging behavior to determine 10
how it can best maximize net benefits to its customers. 11
12
What does the Company view as appropriate next steps to work toward a full-13
scale program? 14
A119. The Company believes continuing to refine existing elements and testing new 15
elements through the Charging Forward Expansion are the appropriate next steps 16
to work toward a full-scale program. Through the existing Charging Forward pilot 17
and the proposed Expansion, the Company is seeking to identify elements which 18
are supporting the EV market, providing value to its participants, not overly 19
burdensome on the Company, and justified from a utility customer perspective 20
(e.g., the proven benefits it provides outweigh the costs, it is confirmed to be 21
participant-funded or rate neutral, etc.). Once these elements are validated, DTE 22
will share its findings with its stakeholders and propose to operate those elements 23
at full scale. 24
98 As noted in the 2nd Annual Status Report, usage from EVs did not recover to pre-pandemic levels until
April 2021

B. J.H. Burns
Line U-20836
No.
BJHB-74
1
What do stakeholders say about DTE’s plans for the Charging Forward 2
Expansion? 3
A120. DTE invited stakeholders from 34 organizations and hosted at least 14 separate 4
meetings to solicit their feedback in advance of this proceeding and received verbal 5
support to proceed with the Charging Forward Expansion proposal from all of them. 6
Additionally, some of the stakeholders chose to submit Letters of Support (see 7
Exhibit A-12, Schedule B5.9.3). At a high level, the Letters of Support largely 8
demonstrate overall advocacy for DTE’s guiding principles and corresponding 9
Charging Forward Expansion design as well as the need to support the State of 10
Michigan in its Healthy Climate Plan. Elements which are strongly supported and 11
specifically addressed in the letters are summarized in Table 10 below. 12
13
Table 10. Strong Support for Charging Forward Expansion Components 14
Expansion Component Strongly-Supporting Organizations
Customer E&O Alliance for TE, Clean Fuels
Michigan, GM, NextEnergy
Residential Level 2
Charging
Clean Fuels Michigan, Ford, GM,
NextEnergy
Commercial Customer
Support
Alliance for TE, Blue Water Transit
CALSTART, Clean Fuels Michigan,
DDOT, Ecology Center, EVNoire,
Ford, GM, Greenlots, Lyft,
NextEnergy, Proterra, SMART

B. J.H. Burns
Line U-20836
No.
BJHB-75
Equitable Access to EVs Alliance for TE, CALSTART, Clean
Fuels Michigan, Ecology Center,
EVNoire, Ford, GM, Lyft
Program Development Alliance for TE, Clean Fuels
Michigan, Greenlots, NextEnergy
1
2
How will DTE continue to engage stakeholders? 3
A121. DTE currently provides high-level status reports quarterly and a detailed status 4
report annually to stakeholders via email in addition to filing them in the Case No. 5
U-20162 docket. The Company also invites stakeholders to participate in 6
discussion sessions about twice per year and has hosted four to-date. DTE 7
recommends continuing all of these stakeholder engagement methods and activities 8
for the Expansion to ensure the appropriate collaboration and alignment in 9
Michigan. 10
11
III. Cost-Benefit Analysis 12
What are the Company’s total expected costs for the Expansion? 13
A122. Exhibit A-12, Schedule B5.9, page 4 shows capital expenditures (lines 1 through 14
7), O&M expense (lines 8 through 14), and regulatory asset costs (lines 15 through 15
24) for the bridge period in column (e) and test period in column (f). Total estimated 16
Charging Forward Expansion costs for the bridge and test periods are $0.4 million 17
and $17.4 million, respectively, as shown in line 25. 18
19
What costs are included in capital? 20
B. J.H. Burns
Line U-20836
No.
BJHB-76
A123. As it does in its approved Charging Forward pilot, DTE plans to capitalize any EV 1
Service Connection costs. These costs encompass all spending necessary to provide 2
distribution service to meet the load needs of the charger up to the point of 3
interconnection at the Company’s service meter and are relevant for the Make-4
Ready Rebates and Commercial CaaS elements of the Charging Forward 5
Expansion. DTE will own the transformer, the service drop, and the meter, which 6
are all retirement units. 7
8
DTE will also capitalize the EV Supply Infrastructure costs for the elements where 9
it is planning to own and maintain these assets as it does the EV Service 10
Connection. Elements with DTE-owned EV Supply Infrastructure include 11
Residential CaaS, Commercial CaaS, and Charging Hubs. Additionally, the 12
Company will capitalize the chargers themselves when owned and maintained by 13
DTE Electric, as is the case for Residential CaaS and Charging Hubs. 14
15
Lastly, DTE plans to capitalize batteries for the Transit Batteries element, because 16
it intends to purchase the battery on behalf of transit agencies. 17
18
What costs are included in O&M? 19
A124. On-going annual expenditures to run and maintain the programs are being requested 20
through O&M expense, which is in-line with advancing toward a long-term 21
program. That applies to the following elements of the Charging Forward 22
Expansion: Customer E&O, TNC Driver Rebates, Charging Hub (O&M portion), 23
Residential CaaS (O&M portion), and Program Administration. 24
25

B. J.H. Burns
Line U-20836
No.
BJHB-77
What costs are included in the regulatory asset? 1
A125. As discussed by Company Witness Uzenski, DTE is seeking to continue regulatory 2
asset treatment for its existing Make-Ready Rebates, Residential Rebates, BYOC, 3
and EV-Ready Builder Rebates elements. Per the Commission, “DTE Electric is 4
authorized to create a regulatory asset to recognize deferred EV program costs 5
with the amortization of those costs over five years beginning the year after the 6
costs are incurred. Further, the Commission authorizes the company to include 7
recovery of the resulting amortization expense in rates and include the deferred net 8
unamortized balance of EV program costs in rate base. However, the program costs 9
will not actually be recovered until they have undergone a future reasonableness-10
and-prudence review in a rate case” (MPSC Case No. U-20162, Order dated May 11
2, 2019, p. 115). 12
13
DTE is also seeking accounting authority to defer and amortize the EV Rate Tool, 14
Income-Eligible Rebates, Commercial CaaS (for the EVSE portion), and the 15
Emerging Technology Fund as regulatory assets pursuant to Case No. U-20162 16
Order dated May 2, 2019, above. The Company believes these elements are 17
appropriate for regulatory asset treatment because they have the same 18
characteristics as the existing regulatory asset elements: timing of spend is 19
uncertain and spend can vary significantly year after year. The Commission 20
concluded regulatory asset treatment is justified for elements with those 21
characteristics because it “balances the risk between the company and the 22
customer” (MPSC Case No. U-20162, Order dated May 2, 2019, p. 114). 23
24

B. J.H. Burns
Line U-20836
No.
BJHB-78
What net present value (“NPV”) benefits does DTE estimate each EV provides 1
to the grid? 2
A126. In its original proposal for Charging Forward in 2018, the Company estimated the 3
NPV of gross margin that each EV sale provides toward DTE’s electric system 4
fixed costs over its lifetime (“benefits”) is in the range of $2,100 to $2,800. Since 5
2018, the Company has updated its input assumptions based on the following 6
market updates and lessons learned from Charging Forward: 7
• The Company was previously only considering the efficiency difference 8
between BEVs and PHEVs, but in the updated analysis, the Company is 9
also now considering the efficiency of light-duty trucks (“pickups”) as they 10
use more energy than smaller cars and represent 20% of new sales of the 11
overall vehicle market.99 Multiple pickup models are expected to be 12
released in 2022, and the Ford F-150 Lightning amassed more than 120,000 13
preorders in only two months.100 14
• The Company updated the average revenue rate for an EV from $0.14/kWh 15
in 2018 to between $0.11-$0.12/kWh today based on what rates Charging 16
Forward participants selected for both residential and commercial chargers; 17
and 18
• DTE was previously assuming that all commercial charging for an EV took 19
place during critical peak for its low-end estimation. Based on actual 20
Charging Forward data, the Company now uses a weighted average for on-21
peak charging of 15%.101 22
99 https://www.forbes.com/wheels/news/shoppers-snap-up-pickup-trucks/ 100 https://www.cnbc.com/2021/07/28/ford-says-reservations-for-f-150-lightning-electric-pickup-top-
120000.html 101 Residential charging is 80% of charging on average and is outside of the critical peak window 12% of
time; commercial charging is the remaining 20% and is outside of the critical peak window 75% of time

B. J.H. Burns
Line U-20836
No.
BJHB-79
1
DTE Electric’s Distribution Grid Plan (“DGP”) considered grid impacts from 2
increased EV adoption as part of the scenario planning process (described in further 3
detail in Section 3).102 While the distribution system currently has limited existing 4
capacity to accommodate load growth, up to 5% EV penetration can be 5
accommodated in most areas without creating significant additional loading 6
constraints. Using the same forecast above, EV penetration is expected to rise to 7
about 1.5% through 2023, so minimal system impacts are expected during the test 8
period. Using these updated parameters, the NPV benefits each EV adds to the 9
system is estimated to be between $1,800 and $2,250 as shown in Table 11 below. 10
11
Table 11. EV NPV Benefits Assumptions, 2018 and Current 12
Assumption
Description
2018
Value
Current
Value
Key Assumptions for
Updated Analysis
Annual EV electricity usage
(kWh)
3,900 4,085 •0.31 kWh/mile for cars
•0.53 kWh/mile for pickups
•11,520 miles/year
Life of each incremental EV
(years)
10 10
Weighted average revenue
rate ($/kWh)
$0.14 $0.11-
$0.12 •80% from residential
•20% from commercial
PSCR + Fuel Supply Cost $0.033 $0.034
Critical Peak charging (%) 30% 15% •12% from residential
•25% from commercial
NPV Gross Margin
Incremental EV Sales ($)
$2,100-
$2,800
$1,800-
$2,250 •Discount rate of 6.79%
What total system benefit does DTE expect from EV adoption over the bridge 13
and test periods? 14
102 https://mi-psc.force.com/sfc/servlet.shepherd/version/download/068t000000Uc0pkAAB

B. J.H. Burns
Line U-20836
No.
BJHB-80
A127. As shown in its forecast curve above (Figure 1), DTE projects about 32,000 EVs to 1
be sold in its electric service territory in 2022 and 2023. Based on the NPV range 2
in Table 11, the Company estimates NPV system benefit of approximately $57.6 3
million to $72.0 million from EVs added during the bridge and test periods. 4
5
Should the Company be using the total system benefits in its cost-benefit 6
analysis for the Charging Forward Expansion? 7
A128. No; based on data collected from Charging Forward so far, the Company believes 8
61% should be subtracted from the 32,000 expected EV sales over the bridge and 9
test periods for the purposes of the cost-benefit analysis of the Expansion, broken 10
down in the following three ways: 11
• 13% for TOU enrollment absent an incentive: the Company estimates 13% 12
of new EV drivers would enroll in TOU rates absent an incentive, since 13
only 87% of Residential Rebate applicants said it influenced their decision 14
to enroll in a TOU rate as mentioned above; 15
• 37% for no range anxiety: the company estimates 37% of potential EV 16
buyers do not have range anxiety today, since only 63% of survey 17
respondents perceived range anxiety as a barrier to purchasing an EV; and 18
• 11% for likely purchase: based on the same survey, 11% of non-EV 19
owners stated they were “very likely” to purchase an EV as their next 20
vehicle, so an Expansion is not likely to facilitate those sales. 21
22
After subtracting these three portions totaling 61% from expected EV sales in 2022 23
and 2023, approximately 12,500 remaining new EVs – and their associated benefits 24

B. J.H. Burns
Line U-20836
No.
BJHB-81
– should be considered in the cost-benefit analysis for the Charging Forward 1
Expansion. 2
3
Should any Expansion elements be excluded from the cost-benefit analysis? 4
A129. Yes; the elements that should be excluded from the cost-benefit analysis are those 5
that are designed to be participant-funded over time: Residential CaaS ($2.3 million 6
through the test period) and Transit Batteries ($0.4 million through the test period), 7
totaling $2.7 million. 8
9
Should any additional revenue collected from the Expansion be included in the 10
cost-benefit analysis? 11
A130. Yes; there are two incremental revenue streams that should be included in the cost-12
benefit analysis. First, the rate design for the Charging Hubs includes a capital 13
contribution fee that is meant to offset some of the costs of the upfront capital that 14
DTE will use to build the sites while still encouraging electrification by enabling 15
fuel savings. This capital contribution fee should be included as additional revenue 16
for cost-benefit analysis purposes and is estimated to be approximately $2.0 million 17
over the first ten years of operation. 18
19
Second, incremental revenue received from participating Commercial CaaS site 20
hosts on their monthly bill to partially fund the charger costs should be included in 21
the cost-benefit analysis. For the chargers DTE estimates to deploy through the 22
future test period, this is estimated to be approximately $0.1 million. 23
24

B. J.H. Burns
Line U-20836
No.
BJHB-82
Voluntary donations for Income-Eligible Rebates will also help offset costs to 1
DTE’s customers, but the Company has not yet confirmed its approach for this, so 2
it does not yet have a way to forecast the amount. Summing the other two estimated 3
incremental revenue streams amounts to approximately $2.1 million to be included 4
in the cost-benefit analysis. 5
6
Using that approach, what is the overall cost-benefit analysis for the Charging 7
Forward Expansion? 8
A131. The overall NPV net benefits to DTE customers for the Charging Forward 9
Expansion are estimated to be in the range of $9.5 million to $15.1 million as shown 10
in Table 12 below. 11
12
Table 12. NPV Cost-Benefit Analysis of the Charging Forward Expansion 13
(in millions) 14
Assumption
Description
Low-End
Estimate
High-End
Estimate
System Benefits from EV Sales in 2022-2023 $57.6 $72.0
Less Benefits Not Attributed to Expansion ($35.1) ($43.9)
Less Expansion Costs ($17.7) ($17.7)
Plus Participant-Funded Elements $2.7 $2.7
Plus Incremental Revenue $2.0 $2.0
Total NPV Net Benefit of Expansion $9.5 $15.1
15
Why is the Company not showing a cost-benefit analysis for each element? 16

B. J.H. Burns
Line U-20836
No.
BJHB-83
A132. It is difficult to prove benefits specific to each element because incremental impacts 1
from each element are not always clear. For example, Customer Education & 2
Outreach is a critical enabler for EV adoption and promoting managed charging. 3
However, from a standalone perspective, it appears to just be a “cost” since no 4
specific benefits can directly be tied to it. Charging Forward elements are designed 5
to be complementary to each other and addressing gaps in the market. As such, and 6
while still in the pilot phase, the Company believes it is appropriate to consider the 7
cost-benefit analysis holistically instead of separately. However, based on the 8
lower-end NPV benefits each EV provides to the grid of $1,800 from Table 11 9
above, Table 13 below highlights the number of EVs that would need to be sold to 10
cover the projected spend for each element through the test period. 11
12
Table 13. Estimated EV Sales Required to Breakeven by Element 13
Expansion Element Projected
Spend
($,
thousands)
EV Sales
Required
to Breakeven
Customer E&O103 1,450 806
Residential Rebates 400 222
BYOC 100 56
EV-Ready Builder
Rebates
80 44
103 Including EV Rate Tool

B. J.H. Burns
Line U-20836
No.
BJHB-84
Residential CaaS 2,351 n/a; participant-
funded
Make-Ready
Rebates
3,858 2,143
Charging Hubs104 2,840 467
Transit Batteries 400 n/a; participant-
funded
TNC Driver Rebates 500 278
Income-Eligible
Rebates
1,917 1,065
Commercial CaaS105 1,171 597
Emerging
Technology Fund
900 500
Program
Management
1,752 973
Total 17,718106 7,151
1
Only about 7,150 EVs would need to be sold to cover the cost of the Charging 2
Forward Expansion through the test period, significantly less than the number of 3
EVs that DTE is attributing to the Charging Forward Expansion (12,500). The 4
104 Based on additional NPV revenue of approximately $2.0 million offsetting the projected spend 105 Based on additional NPV revenue of approximately $0.1 million offsetting the projected spend 106 Difference due to rounding
B. J.H. Burns
Line U-20836
No.
BJHB-85
Company believes this demonstrates the prudency of its investment to help 1
accelerate TE, bring about the benefits of TE to all of its customers, and further the 2
State of Michigan’s climate goals. 3
4
3. RESIDENTIAL BATTERIES PILOT 5
What is DTE proposing for the Residential Batteries pilot? 6
A133. DTE is proposing a customer-sited behind-the-meter residential battery pilot for up 7
to 500 residential customers. At full enrollment the batteries would provide 5 8
megawatts (“MW”) of stored energy, or 10kW per customer. Participants would 9
have access to use the stored battery energy in the event of an outage and would 10
pay a monthly subscription fee for this backup power access. Outside of outage 11
events, DTE would have access to use the battery to derive key learning to 12
determine the best path forward pertaining to residential battery storage. 13
14
Does this meet the pilot definition and corresponding six objective criteria as 15
defined in Case No. U-20645? 16
A134. Yes; similar to Charging Forward eFleets and the Charging Forward Expansion 17
above, please see Exhibit A-12 Schedule B5.10.1 for a high-level summary of how 18
Residential Batteries is meeting these requirements and the corresponding 19
questions in this testimony that relate to each of the six objective criteria. 20
21
How will the Residential Batteries portion of your testimony be structured? 22
A135. The Residential Batteries testimony will be structured in the following sections: 23
I. Market Overview & Role of Utility; 24
II. Pilot Design; and 25

B. J.H. Burns
Line U-20836
No.
BJHB-86
III. Estimated Costs and Proposed Treatment. 1
2
I. Market Overview & Role of Utility 3
What are the current market dynamics for residential batteries? 4
A136. The residential battery market has been growing in recent years both nationally and 5
in Michigan. Wood Mackenzie is forecasting a 16% per annum increase in 6
residential battery adoption in the U.S. through 2025.107 This increased demand is 7
primarily driven by declining battery prices and distributed solar (“PV”) 8
advancements. Lithium-ion battery pack prices fell from $1,100 per kWh in 2010 9
to $137 per kWh in 2020, a decrease of almost 90%. Bloomberg New Energy 10
Finance is predicting battery pack prices could be as low as $58 per kWh by 11
2030.108 12
13
What benefits does residential battery storage provide? 14
A137. Residential batteries are beneficial for both the installing customers and utilities. 15
From an installing customer perspective, home battery storage offers a no-noise 16
backup power solution for resiliency during outages. From a utility perspective, 17
with the recent passage of the Federal Energy Regulatory Commission (FERC) 18
orders related to energy storage coupled with guidance from the MPSC around the 19
desire for more energy storage pilot programs, residential battery storage offers the 20
utility an opportunity to explore and gain key learnings to best prepare for 21
compliance to these initiatives. 22
23
107 Wood Mackenzie Power and Renewables – Presentation at Energy Storage Monitor 3rd Quarter Review
– September 2020 108 https://about.bnef.com/blog/battery-pack-prices-cited-below-100-kwh-for-the-first-time-in-2020-while-
market-average-sits-at-137-kwh/

B. J.H. Burns
Line U-20836
No.
BJHB-87
Are there other reasons to conduct a Residential Batteries pilot now? 1
A138. In the coming years, distributed storage is expected to have various ways in which 2
it can interact with the grid. The FERC has required its jurisdictional ISOs to 3
provide standalone distributed storage resources with wholesale market access via 4
Order 841, and FERC has also required that aggregated distributed storage 5
resources have access to wholesale markets via Order 2222. MISO is currently in 6
the process of preparing for its compliance with both of these directives. 7
Implementing a pilot at this point allows the utility to also explore these directives 8
which will assist the design of the future system that best supports widespread 9
customer adoption. . Learning customer preferences and system interactions now, 10
while the market is still nascent, will improve program design, customer 11
satisfaction, and potential grid benefits in the future. 12
13
II. Pilot Design 14
What are the key design features of the Residential Batteries pilot? 15
A139. The proposed pilot would seek to enroll up to 500 customers and as many as 500-16
1,000 customer-sited batteries (depending on battery partner offerings) that will be 17
controlled and owned by DTE. Should the customer lose power, the customer will 18
have full access to the energy in the battery for resiliency during their outage event, 19
which could be enough to power an average house for a day or more, depending on 20
its usage.109 The customer would pay the Company a monthly subscription fee for 21
backup power access, and the Company will provide education and outreach around 22
109 The typical residential customer uses 21 kWh per day, and the battery capacity proposed in the pilot is
able to provide 27 kWh of usable energy, leading to just over a day of resiliency benefit for the average
residential customer (or more if they conserve their energy usage)

B. J.H. Burns
Line U-20836
No.
BJHB-88
the capacity limits of the battery for enrolled customers. Outside of outage events, 1
the Company would have full access to the battery to derive key learnings. 2
3
How will participants be charged? 4
A140. The pilot would be offered for free to 250 income-eligible customers residing in 5
single-family homes on targeted circuits. For the remaining 250 customers, a tiered 6
monthly subscription fee structure will be offered at pricing to be determined closer 7
to the anticipated launch of the pilot. 8
9
Why are the pricing tiers an important design feature of the pilot? 10
A141. Tiered pricing allows for testing of customer interest at different price points to 11
better understand customers’ willingness to pay for backup power. Comparing 12
speed of uptake for different monthly fees – in combination with customer surveys 13
– will help determine appropriate pricing strategies for resiliency as a service, 14
which will inform a potential broader program offering to DTE customers in the 15
future. 16
17
How will the pricing tiers be determined? 18
A142. Price points in similarly designed residential battery pilots have ranged from $29.99 19
to $49.99 per month. This is reflected in Table 14 below. 20
21
22
23
24

B. J.H. Burns
Line U-20836
No.
BJHB-89
Table 14. Monthly Pricing Benchmarking Results for Utility-Owned 1
Residential Battery Storage 2
Utility Monthly Subscription Fee
Green Mountain
Power
$30: Pilot, $55: Full Program
Liberty Utilities $50 ($25 per battery)
Consumers Energy $29.99, $39.99, $49.99
3
Although the Company would seek to offer similar price points, the estimated 4
deployment schedule has initial battery system placements occur in 2023. The 5
Company recommends setting specific pricing closer to the anticipated pilot launch 6
date when it can better understand and incorporate economic factors influencing 7
battery costs (such as battery availability, unit costs, and supply chain disruption). 8
9
Why is it important to include the offering for free to a portion of pilot 10
participants? 11
A143. It is important to offer the pilot for free to a portion of customers for two key 12
reasons. First, to analyze the potential value that clustered residential battery 13
storage can provide to the grid, it is critical to have at least 1MW of storage for a 14
13.2 kV circuit and 0.5MW for a 4.8kV circuit. With over 3,000 circuits on DTE’s 15
distribution system, the Company must restrict a portion of the pilot to a few high-16
priority circuits to ensure enough participants and batteries can be clustered 17
together to achieve the level of storage required to obtain targeted NWA learnings. 18
Without having more information about customers’ willingness to pay, DTE 19
anticipates that recruiting 50-100 DTE customers to join the pilot from one circuit 20

B. J.H. Burns
Line U-20836
No.
BJHB-90
could be challenging and may necessitate giving some of them a free subscription. 1
Second, serving customers from a range of socioeconomic backgrounds will 2
provide the opportunity for learnings across DTE’s customer base to help ensure 3
equitable access to the technology with any potential future offerings. 4
5
How will the Company identify targeted circuits for the pilot? 6
A144. The Company will identify targeted circuits using the following methodology: 7
1. Select substations with only one circuit overload so realized benefits can be 8
traced to a single circuit;110 9
2. Prioritize circuits serving higher customer populations to ensure a large 10
enough market to achieve desired circuit concentration; and 11
3. Match prioritized circuits to areas defined as EJCs (described above). 12
13
Concentrating participation on targeted circuits will help ensure equitable 14
distribution of pilot value, both for the individual customers participating in the 15
pilot and customers on the same circuit who are not involved in the pilot. 16
17
How will the Company identify customers who are eligible to receive the free 18
subscription? 19
A145. DTE will prioritize income-eligible customers in EJCs for the free subscription. 20
The Company will use the same criteria for income-eligibility as proposed for the 21
Income-Eligible Rebates offered in the Charging Forward Expansion described 22
above. However, DTE may broaden the eligibility criteria for the free subscription 23
110 Circuit overload is defined as a circuit being above its 100% firm rating; by placing batteries on the
circuit, the firm rating would drop below 100%

B. J.H. Burns
Line U-20836
No.
BJHB-91
if necessary, to achieve the participation required on a circuit for measurable 1
impact. 2
3
How does the Company plan to engage a battery provider to facilitate the 4
pilot? 5
A146. DTE plans to conduct a request for proposal (“RFP”) to identify battery providers 6
that provide the most value to both the Company and pilot participants. 7
8
Does the pilot include a Bring Your Own Device (“BYOD”) offering? 9
A147. The pilot does not offer a BYOD segment to start because the Company does not 10
yet understand the appropriate incentive structure that should be offered to these 11
customers. Additionally, DTE needs to first understand how to interact with and 12
control the batteries. Learnings from this pilot will enable DTE to determine the 13
best design for a potential larger program, which has been a successful approach 14
for other utilities. For example, Arizona Public Service operated a utility-owned 15
approach for its first residential battery pilot but included a BYOD offering in a 16
subsequent offering. 17
18
What key learnings is DTE seeking to obtain through this pilot? 19
A148. Targeted key learnings from the Residential Batteries pilot include: 20
• Customers’ willingness to pay for resiliency as a service; 21
• Average battery capacity dispatched in an outage event and customer 22
satisfaction with resiliency duration; 23
• Quantifying initiatives, including NWA benefits, annual capacity auction, 24
MISO TOU price difference, and any potential transmission savings; 25

B. J.H. Burns
Line U-20836
No.
BJHB-92
• How to best control batteries; 1
• Exploring residential battery technology to assist with prepare for 2
implementation of FERC Order 2222; 3
• Testing various outreach efforts and messaging to drive successful, diverse 4
recruitment; and 5
• Understanding how a broader offering to the customer should be structured, 6
if warranted. 7
8
What is the proposed timing of the pilot? 9
A149. The Company will operate the pilot and collect monthly fees for a period of 10 10
years, which corresponds to the useful life of the battery systems. DTE will seek to 11
obtain key learnings by year three or four, depending on the time required for the 12
pilot to achieve peak enrollment. Upon receiving approval from the Commission, 13
the Company will seek to achieve its first battery placement within six months. 14
15
How will success of the pilot be measured? 16
A150. Success of the pilot will be measured from both a customer and utility perspective. 17
From a customer perspective, customer satisfaction, as measured by participant 18
surveys, will be the focused measure of success. From the Company’s perspective, 19
the primary measure of success would be understanding the key operational and 20
financial impacts necessary to determine the scope, structure, and feasibility of a 21
broader battery offering to the customer base and achievement of other key 22
learnings identified above. 23
24
How will DTE engage key stakeholders? 25

B. J.H. Burns
Line U-20836
No.
BJHB-93
A151. DTE will share pilot updates and solicit feedback from key stakeholders (ranging 1
from battery providers, environmental groups, regional organizations, and MPSC 2
Staff) prior to pilot implementation. The Company would seek to structure pilot 3
status reporting in a similar manner to the Charging Forward initiative with semi-4
annual status update meeting with interested parties and the preparation of an 5
annual report to the Commission that provides insight into the pilot’s progress and 6
key learnings. 7
8
III. Estimated Costs and Proposed Treatment 9
What are the Company’s total expected costs for the Residential Batteries 10
pilot? 11
A152. Exhibit A-12, Schedule B5.10 shows the above costs broken down into projected 12
capital expenditures (lines 1-5) and O&M expense (lines 6-10) for the bridge and 13
test periods in columns (e) and (f), respectively. Line 11 shows total estimated 14
Residential Batteries pilot costs for the bridge and test periods as $1.1 million and 15
$3.3 million, respectively. 16
17
What costs are included in capital? 18
A153. DTE is requesting capital costs associated with the procurement and installation of 19
up to 182 battery systems to the point of interconnection at the Company’s service 20
meter. The Company is also requesting capital costs for the IT solution needed to 21
perform aggregation, monitoring, and billing functions. Finally, the Company will 22
incur capital costs associated with DO studies that will measure the impact of the 23
batteries on the Company’s distribution system. Requested capital costs are $1.1 24
million for bridge period and $3.1 million for the projected test period. 25

B. J.H. Burns
Line U-20836
No.
BJHB-94
1
What costs are included in the O&M? 2
A154. The Company is including personnel to execute the pilot, estimated call center 3
expenses, and applicable education & outreach costs to promote the Residential 4
Batteries pilot with its customers. The Company is requesting recovery of $0.2 5
million of O&M for the projected test year. 6
7
What are the expected revenues from the Residential Batteries pilot? 8
A155. Test year subscription fee revenue is estimated to be approximately $12,000 if we 9
assume a similar pricing structure to other utility pilots mentioned above. Given the 10
prices of battery systems today, breakeven economics are not possible without 11
charging customers a significantly higher monthly subscription fee. As the pilot 12
progresses, battery costs are expected to continue to decline as mentioned above, 13
potentially leading to more favorable economics in future years. 14
15
Why should the Residential Batteries pilot be approved if the costs outweigh 16
the expected revenues? 17
A156. There are important key learnings the pilot seeks to gain associated with the ability 18
of storage to participate in wholesale markets under FERC Order 2222 in the 19
coming years, and the pilot allows for exploration of this feature, which will also 20
inform for any potential future program design. More specifically, in response to 21
FERC Order 2222, the Company may see the introduction and growth of 22
aggregated energy storage resources on its distribution system. In this environment, 23
the Company’s ability to track and potentially control associated electricity flows, 24
especially during times of system distress, will be critical to the continued safe 25

B. J.H. Burns
Line U-20836
No.
BJHB-95
operation of the distribution system. The pilot proposed here will allow the 1
Company to test and better understand the technical and operational needs and 2
considerations of aggregated energy storage on its distribution system, including 3
aggregated storage which may respond to wholesale market signals. The learnings 4
driven through this pilot should better prepare the Company for the implementation 5
of FERC 2222 and ensure it is able to safely operate its distribution system in this 6
future environment. 7
8
4. MERCHANT FEES 9
What is the purpose of your testimony in this proceeding regarding merchant 10
fees? 11
A157. The purpose of my merchant fees testimony is to support the recovery of debit and 12
credit card payment transaction fees expense in the Company’s rates. 13
14
What are merchant fees? 15
A158. Merchant fees are the transactional costs associated with the processing of debit 16
and credit card payments. These costs, or fees, are expenses borne by the Company 17
and levied by the customer’s debit and credit card issuer and payment processor. 18
19
What type of debit and credit cards does the Company allow customers to 20
utilize? 21
A159. DTE allows the use of all debit cards for bill payments. In addition, it allows 22
customers to utilize either Visa or MasterCard credit cards. DTE has restricted the 23
type of credit cards that are allowed for bill payment to these two card issuers as 24
they offer a lower negotiated utility transaction rate for residential customers. 25

B. J.H. Burns
Line U-20836
No.
BJHB-96
1
What measures has the Company taken to minimize merchant fees? 2
A160. DTE continues to restrict the use of credit and debit cards for business customers 3
with two mitigation policies that were proposed and approved by the Commission 4
in prior rate cases: 5
1) In Case No. U-20162, the Company proposed excluding industrial customers 6
in rate schedules D6.2, D8, D10, and D11 from using credit or debit cards 7
(implemented August 2019); and 8
2) In Case No. U-20561, the Company proposed limiting the ability of debit or 9
credit card payments to C&I customers whose preceding calendar year 10
aggregate annual energy bill was less than $75,000 (implemented January 11
2021). 12
13
Did the Company, as directed by the Commission in Case U-20561, work with 14
Staff on methodologies to better evaluate the impacts and attributions of 15
merchant fees on customers? 16
A161. Yes; DTE worked with Staff and determined that no cross subsidization would 17
occur across rate schedules related to merchant fees, addressing Staff’s primary 18
concern. This is addressed by Company Witness Maroun. 19
20
What is the Company projecting the merchant fee expense to be in the 21
projected test period? 22
A162. The Company is forecasting $20.5 million of merchant fees in the test year as 23
shown in Exhibit A-13, Schedule C.5.7.1, page 1, line 5 in column (g). 24
25

B. J.H. Burns
Line U-20836
No.
BJHB-97
How did the Company develop its test year merchant fee forecast? 1
A163. As shown in Exhibit A-13, Schedule C5.7.1, page 2, column (e), the Company 2
calculated the 3-year average merchant fee growth rate that was experienced from 3
2018 through 2020. This growth rate was then applied to the actual merchant fee 4
expense incurred in 2020 to develop the 2021-2023 merchant fee forecasts. The 5
2021 -2023 calculated amounts for non-residential merchant fee expense were 6
reduced by the mitigation policy impacts. 7
8
What impact do the mitigation policies have on the merchant fee O&M 9
expense? 10
A164. Exhibit A-13, Schedule C5.7.1, page 2, line 7 in column (i) shows that the O&M 11
expense will be approximately $2.3 million less due to non-residential mitigation 12
efforts. This reduces a projected expense amount for non-residential merchant 13
fees of $3.7 million to $1.4 million. 14
15
5. ADVANCED CUSTOMER PRICING PILOT 16
Can you please explain the Company’s Advanced Customer Pricing Pilot 17
(“ACPP”)? 18
A165. ACPP is a pilot program which began enrolling residential customers in the first 19
quarter of 2021 to better understand residential customer preferences and responses 20
to a variety of TOU rate plans, recruitment and messaging approaches, and ongoing 21
engagement. A successful pilot will inform both how DTE designs different rate 22
programs to customers and various techniques for customer outreach and 23
engagement which might be more effective. The MPSC approved the pilot in 24

B. J.H. Burns
Line U-20836
No.
BJHB-98
November 2019 in Case No. U-20602. I am supporting the portion of these costs 1
that relate to: 2
• Customer Outreach and 3
• Evaluation, monitoring, and verification (“EM&V”). 4
5
Please see Company Witness Pizzuti’s testimony for Information Technology costs 6
and Company Witness Sparks’s testimony for Customer Service and Insight 7
application costs. 8
9
What are the costs related to Customer Outreach and EM&V for the pilot? 10
A166. Exhibit A-13, Schedule C5.9.2, column (f) lines 3 and 5 show the cost for Customer 11
Outreach and EM&V as $3.6 million and $0.9 million, respectively. 12
13
Can you provide an explanation of the Company’s expenditures related to 14
these line items? 15
A167. As described in Case No. U-20602, Customer Outreach costs are to ensure that 16
customers are correctly assigned and contacted. It also covers costs associated with 17
problem-solving should any execution issues arise. DTE is working with a 18
supporting vendor to ensure best practices in advanced rate communication are 19
used, which helped inform the communication strategy. 20
21
EM&V costs support statistically valid assignment of recruitment and control 22
groups and the EM&V of pilot data. Support for pilot evaluation will ensure that 23
analyses conducted with pilot-generated data are compelling, comprehensive, and 24
provide the right insights as the Company progresses toward full implementation. 25

B. J.H. Burns
Line U-20836
No.
BJHB-99
1
6. 2023 TOU ROLLOUT CUSTOMER OUTREACH 2
What is the role of Customer Outreach in the full TOU rollout? 3
A168. Company Witness Foley’s testimony discusses the Company’s TOU full 4
implementation proposal, and Customer Outreach will ensure that all residential 5
electric customers are aware and informed that their base rate will be changed to a 6
new TOU rate in May 2023 (with the ability to unenroll if they do not desire to 7
remain on that rate). 8
9
What is the total O&M expense for Customer Outreach in the projected test 10
period that DTE Electric is seeking to recover? 11
A169. As shown on Exhibit A-13, Schedule C5.9.2, column (e), line10, DTE is seeking 12
to recover $8.1 million of O&M expenses in the projected test year. 13
Why is $8.1 million of O&M expense needed for Customer Outreach? 14
A170. In order to prepare customers for the upcoming change in their rate, they will 15
receive a series of communications via multiple channels prior to the rate 16
implementation meant to inform, educate, and provide tips for how to save on a 17
TOU rate. Research will be conducted with message testing and focus groups in 18
order to ensure that all communications developed are easy to understand and 19
engaging for the customer. Advertising will be deployed to reach a broader 20
population of customers and have a strong educational focus. The outreach will also 21
include producing the following three videos: 22
• What a customer needs to understand about the new rate; 23
• The benefits of the new rate; and 24
• How to save money on the new rate by shifting usage to non-peak times. 25

B. J.H. Burns
Line U-20836
No.
BJHB-100
1
7. REGULATED MARKETING O&M EXPENSE 2
What is the total Regulated Marketing O&M expense for the projected test 3
period that DTE is seeking to recover? 4
A171. As shown on Exhibit A-13, Schedule C5.9, column (k), line 18, DTE is seeking to 5
recover $24 million of Regulated Marketing O&M expenses in the projected test 6
year. 7
8
What was the Regulated Marketing O&M expense for the adjusted 2020 9
historical test year? 10
A172. As shown on Exhibit A-13, Schedule C5.9, column (e), line 18, Regulated 11
Marketing total O&M expense for the adjusted 2020 historical test year was $15.6 12
million. 13
What does Regulated Marketing O&M expense include? 14
A173. Regulated Marketing O&M expense includes: Major Account Services, which 15
manages new and existing customer relationships for C&I customer classes; 16
Electric Marketing, which manages marketing campaigns to educate customers, 17
develops new product and service offerings, and measures business performance; 18
and Economic Development, which seeks to stimulate local economic growth and 19
activity, including job growth through business attraction, retention, and expansion. 20
Lastly, Regulated Marketing includes Demand Response Portfolio costs which are 21
supported by Company Witness Farrell and amortization of the Charging Forward 22
and ACPP regulatory assets supported by Company Witness Uzenski. 23
24

B. J.H. Burns
Line U-20836
No.
BJHB-101
What known and measurable changes is DTE Electric proposing to the 1
historical test year amount? 2
A174. DTE Electric is proposing the following known and measurable changes to the 3
historical 2020 test year Regulated Marketing O&M expense: 4
1) Inflation for 2021, 2022 and 10 months of 2023 in the amount of $1.2 million, 5
2) PEV Amortization ending in 2020 resulting in a reduction of $1.2 million, 6
3) Charging Forward regulatory asset amortization of $1.2 million as supported 7
by Company Witness Uzenski, 8
4) Charging Forward Expansion O&M of $3.3 million. 9
5) ACPP regulatory asset amortization of $1.1 million as supported by Company 10
Witness Uzenski, 11
6) Residential Batteries costs of $0.2 million; and 12
7) $2.5 million related to Demand Response programs supported by Company 13
Witness Farrell. 14
What were the assumed labor and material inflation adjustment factors for 15
2020, 2021 and 2022? 16
A175. The assumed labor and material annual inflation adjustment factors were 3.1% for 17
2021, 2.9% for 2022 and 2.4 % (10 months of 2.9%) for 2023 as supported by 18
Company Witness Uzenski. 19
20
What are your conclusions regarding the level of Regulated Marketing O&M 21
expense for the projected test period? 22
A176. The Regulated Marketing O&M expense is a reasonable and prudent level 23
necessary to support the new programs proposed by the Company in this 24
proceeding, maintain the existing level of customer support to commercial and 25

B. J.H. Burns
Line U-20836
No.
BJHB-102
industrial major account customers, support the Company’s economic development 1
activities and educate all customers regarding regulated Company offerings. 2
3
What are your thoughts concerning the level of DTE Electric’s historical and 4
projected capital and O&M expenses contained in your testimony? 5
A177. DTE Electric has been reasonable and prudent in past capital and O&M 6
expenditures and I anticipate this to continue through the projected test period and 7
beyond. I believe that DTE Electric has fully justified as reasonable and prudent 8
its request for capital expenditures and O&M expenses that are set forth in my 9
testimony and associated exhibits. 10
11
Does this conclude your direct testimony? 12
A178. Yes. 13

STATE OF MICHIGAN
BEFORE THE MICHIGAN PUBLIC SERVICE COMMISSION
In the matter of the Application of )
DTE ELECTRIC COMPANY )
for authority to increase its rates, amend ) Case No. U-20836
its rate schedules and rules governing the )
distribution and supply of electric energy, and )
for miscellaneous accounting authority. )
QUALIFICATIONS
AND
DIRECT TESTIMONY
OF
MICHAEL S. COOPER

DTE ELECTRIC COMPANY
QUALIFICATIONS AND DIRECT TESTIMONY OF MICHAEL S. COOPER Line No.
MSC - 1
What is your name, business address, and by whom are you employed? 1
A1. My name is Michael S. Cooper (he/him/his). My business address is DTE Energy 2
Company, One Energy Plaza, Detroit, Michigan 48226. I am employed by DTE 3
Energy Corporate Services, LLC (DTE LLC). 4
5
On whose behalf are you testifying? 6
A2. I am testifying on behalf of DTE Electric Company (DTE Electric or Company). 7
8
What is your educational background? 9
A3. I received a Bachelor of Business Administration Degree with a major in 10
accounting and finance from the University of Toledo in 1994. I received a Master 11
of Arts Degree in educational administration from Michigan State University in 12
1997. 13
14
What is your current position and work experience? 15
A4. My current position is Director of Compensation, Benefits & Wellness. I joined 16
DTE Energy Corporate Services LLC full time in 2008 and held positions with 17
increasing responsibility in Human Resources. In 2012, I became the Manager of 18
Compensation and assumed my current position in 2017. Prior to joining DTE 19
Energy, I was employed by Manpower as an on-site Staffing Program Manager and 20
in other related positions for Visteon Corporation. I was previously employed at 21
Robert William James & Associates as a recruiter with an emphasis in accounting 22
and finance related positions. 23
24

M. S. COOPER U-20836
Line
No.
MSC - 2
What are your responsibilities as Director of Compensation, Benefits & 1
Wellness? 2
A5. As Director of Compensation, Benefits & Wellness, I have overall responsibility 3
for the design, implementation, and administration of DTE Energy’s compensation 4
and employee benefits policies and practices. 5
6
Have you participated in DTE Electric or DTE Gas proceedings before the 7
Michigan Public Service Commission (Commission)? 8
A6. Yes. I sponsored testimony in DTE Electric’s most recent general rate cases (Case 9
Nos. U-18255, U-20162 and U-20561) and in DTE Gas’s most recent general rate 10
cases (Case Nos. U-18999, U-20642 and U-20940). 11
12
Purpose of Testimony 13
What is the purpose of your testimony? 14
A7. My testimony will present an overview of employee compensation practices and 15
benefit expense for DTE Electric for the 2020 historical test period and the 12 16
months ended October 31, 2023, projected test period. Specifically, I will: 17
1. Provide support for the Company’s projected pension costs, other post-18
employment benefits costs (OPEB), active employee health care costs and 19
the costs of other employee benefits, including adjustments to the historical 20
test period for abnormally low self-insured medical costs in 2020 as a result 21
of COVID-19 and a constant-dollar adjustment to normalize historical 22
Active Healthcare expense; 23
2. Demonstrate the potential volatility in the Company’s future pension costs, 24
including the potential for negative pension costs, which demonstrates the 25

M. S. COOPER U-20836
Line
No.
MSC - 3
need for the deferral of the Company’s actual pension expense to a 1
Regulatory Liability or Asset, as more fully described by Company Witness 2
Ms. Uzenski; 3
3. Discuss the potential impact of President Biden’s COVID-19 Action Plan 4
issued September 9, 2021; 5
4. Support the Company’s labor cost escalation assumptions used in Witness 6
Uzenski’s development of the composite inflation factors for the projected 7
test period; 8
5. Provide an overview of the Company’s compensation philosophy for non-9
represented employees, including an analysis of salaries for non-represented 10
positions as of December 31, 2020, relative to the market medians for 11
comparable positions; 12
6. Describe the components of the Company’s short-term and long-term 13
incentive compensation plans and support the inclusion of the related 14
expense in the Company’s revenue requirement, exclusive of the costs 15
related to DTE Energy’s Top Five Executive Officers; and 16
7. Demonstrate that the quantifiable customer benefits of the Company’s 17
incentive compensation plans exceed the corresponding expense, as required 18
by the Commission’s traditionally mandated cost/benefit analysis of 19
incentive compensation expense. 20
21
In summary, my testimony will support the reasonableness of the projected 22
employee benefits and compensation expense to be incurred by DTE Electric for the 23
projected test period. 24
25

M. S. COOPER U-20836
Line
No.
MSC - 4
Are you sponsoring any exhibits? 1
A8. Yes, I am supporting information on the following exhibits: 2
Exhibit Schedule Description 3
A-13 C5.11 Projected Operation and Maintenance Expenses - 4
Employee Pensions and Benefits 5
A-13 C5.11.1 Willis Towers Watson Healthcare Trend Projection 6
A-13 C5.11.2 PwC 2022 Medical Cost Trend 7
A-13 C5.11.3 COVID-19 Active Healthcare Normalization Adjustment 8
A-13 C5.11.4 Constant Dollar Active Healthcare Adjustment 9
A-13 C5.12.1 Projected Operation and Maintenance Expenses – 10
Qualified Pension Costs 11
A-13 C5.12.2 Pension Cost Scenarios 12
A-13 C5.12.3 Projected Operation and Maintenance Expenses - Other 13
Post-Employment Benefits (OPEB) 14
A-21 K1 Employee Compensation Market Analysis: Dec 31, 2020 15
A-21 K2 2021 Annual Incentive Plan and Rewarding Employees 16
Plan Metrics: DTE Electric Company 17
A-21 K3 2021 Annual Incentive Plan and Rewarding Employees 18
Plan Metrics: Nuclear Generation 19
A-21 K4 2021 Annual Incentive Plan and Rewarding Employees 20
Plan Metrics: DTE Energy Corporate Services LLC 21
A-21 K5 2021 Long-Term Incentive Plan Metrics 22
A-21 K6 2021 Incentive Plans Cost/Benefit Analysis 23
A-21 K7 AIP and REP Operating Measure Results: 2016 - 2020 24
25

M. S. COOPER U-20836
Line
No.
MSC - 5
Were these exhibits prepared by you or under your direction? 1
A9. Yes, they were. 2
3
EMPLOYEE PENSION COSTS 4
What are pension costs? 5
A10. Pension costs are those costs related to pension benefits DTE Electric provides to 6
the majority of its employees under its defined benefits plan. The Company’s 7
defined benefit pension costs are recognized under U.S. Generally Accepted 8
Accounting Principles (GAAP) Accounting Standard Codification (ASC) section 9
715-30 (ASC 715-30), formerly known as Statement of Financial Accounting 10
Standard 87. 11
12
What are the components of pension costs? 13
A11. Pension costs are measured at the beginning of each fiscal year, under ASC 715-14
30, and include the following five pension cost components: 15
16
Service Costs: Service Costs represent the pension benefits earned by active 17
employees, on a present value basis, during the current period. Service Costs are 18
measured based on the expected benefits to be paid based on actuarial assumptions 19
including current and projected salaries, expected employee turnover, and life 20
expectancy. 21
22
Interest Costs: Interest Costs are the increase in the Projected Benefit Obligation 23
(PBO) due to the passage of time during the current period. The PBO is the 24
actuarial present value of benefits attributable to the pension benefit formula and 25

M. S. COOPER U-20836
Line
No.
MSC - 6
service accrued to date discounted back to current dollars at a discount rate selected 1
at the prior year-end. A discount rate of 2.57% was used in determining the PBO 2
at the end of the historical test year and interest costs during the projected test year 3
are similarly based on 2.57%. Measuring the PBO as a present value at the 4
beginning of each fiscal year requires the accrual of an interest cost for the current 5
period at a rate equal to the prior year’s discount rate. The discount rate used in 6
measuring Interest Costs, as well as Service Costs for the 2020 historical test period, 7
was 3.28%, based on the interest rate environment at the end of 2019 and projected 8
benefit payments from the pension plan matched against a yield curve of corporate 9
bond rates, rated Aa or higher, provided by Aon, the Company’s independent 10
actuarial firm. The 2.57% discount rate used for determining Interest Costs and 11
Service Costs during the projected test year reflects the assumption that high-12
quality corporate bond interest rates at the end of 2022 will remain essentially 13
unchanged from the rates prevailing in late December 2020. While the likelihood 14
that interest rates at the end of 2022 will be as low as in late December 2020, the 15
assumption of no changes in discount rates is consistent with traditional practice. 16
The impact of potentially higher discount rates is discussed later in my testimony. 17
18
Expected Return on Assets: The Expected Return on Assets is an estimate of the 19
expected investment return, during the current period, on the Market Related Value 20
of the assets invested in the pension trust at the beginning of the year adjusted for 21
both planned funding and benefit payments for the year. While actual year-to-year 22
investment returns can vary significantly, the expected annual rate of return is 23
determined based on long-term financial market expectations to avoid large swings 24
in pension costs based on short-term investment performance. DTE Electric’s 25

M. S. COOPER U-20836
Line
No.
MSC - 7
expected annual return was 7.10% for the 2020 historical test year, as developed by 1
NEPC LLC, the Company’s independent investment consulting firm. The expected 2
rate of return is assumed to be reduced to 7.00% in 2021, 6.80% in 2022 and 6.70% 3
in 2023. The projections for 2021-2023 reflect a planned increase in fixed income 4
asset allocation due to a projected increase in funded status. 5
6
Unrecognized Gains and Losses: The cost of Unrecognized Gains and Losses 7
reflect the amortization of the accumulated changes in the PBO or the plan’s assets 8
resulting from experiences different from those assumed in actuarial measurements. 9
Most notably, since the discount rate and return on assets assumptions are based on 10
either point in time measurements, as in the case of discount rates, or long-term 11
estimates, as is the case for expected rate of return on assets, differences can arise 12
due to changes in the interest rate environment between year-end measurements 13
and when the actual annual asset returns differ from long-term expectations. These 14
gains and losses are deferred and the amount of the unrecognized balance in excess 15
of a corridor equal to 10% of the greater of the PBO or the Market Related Value 16
of assets is amortized based on a period equal to the average remaining service life 17
of employees covered by the plans. 18
19
Prior Service Costs: The amortization of Prior Service Costs relates to pension plan 20
design changes that will affect future benefit payments. When a plan provision is 21
changed that will affect future benefit payments for existing employees or retirees, 22
the incremental change in the PBO liability is amortized over the average remaining 23
years of service life of the active employees. 24
25

M. S. COOPER U-20836
Line
No.
MSC - 8
How are these pension costs expected to change between the historical test year 1
and the projected year? 2
A12. As summarized on Exhibit A-13, Schedule C5.12.1, the Company’s pension costs 3
are projected to decrease from $92.9 million during the historical test year to $13.5 4
million for the projected test year. The decrease in pension costs between the two 5
periods is due primarily to a decrease in Interest Costs arising from the relatively 6
low discount rates as of December 2020 and an increase in the Expected Return on 7
Assets due to higher asset balances (which is partially offset by the reduction in the 8
expected annual rate of return on assets) and a decrease in the Amortization of 9
Losses. 10
11
The Service Cost component is expected to increase by $1.0 million between the 12
historical and projected test years, which reflects a decrease in the interest rates 13
used to discount the future value of benefits earned by employees. 14
15
Interest Costs are anticipated to decrease by $22.8 million between the historical 16
and projected test years, primarily due to the decrease in the discount rate from the 17
3.28% rate used in measuring interest expense in 2020 to the 2.57% rate used in the 18
projected test period. 19
20
The Expected Return on Assets are projected to increase by $19.9 million between 21
the historical test year and the projected test year due to increases in pension assets, 22
which is partially offset by the reduction in the long-term expected asset return 23
assumption. DTE Electric made pension contributions of $60 million in 2020 and 24

M. S. COOPER U-20836
Line
No.
MSC - 9
transfers of $50 million in both November 2022 and November 2023 from the DTE 1
Gas Non-Union pension trusts are planned. 2
3
The Amortization of Losses is projected to decrease by $36.7 million between the 4
two periods. This decrease reflects the decrease in the balance of unrecognized 5
losses due to loss amortization in the intervening years. 6
7
The Prior Service Cost amortization is projected to decrease by $1.1 million 8
between the historical test period and the projected test year. 9
10
The total projected pension cost of $13.5 million is subsequently adjusted for the 11
impact of costs transferred and capitalized, as described by Company witness 12
Uzenski, which results in pension expense of $9.2 million for the projected test 13
year. 14
15
Will the Company’s actual pension cost be impacted by changes in discount 16
rates and differences in the actual return on assets relative to the expected 17
return? 18
A13. Yes. The Company’s projected Pension costs are based on discount rates as of 19
December 31, 2020, and the Company’s expected rate of return on assets is based 20
on long-term investment performance expectations based on the funded status at 21
December 31, 2020. However, changes in the interest rate environment at any 22
given year end and short-term variations between the actual annual rate of return 23
and the expected annual rate of return can have a significant impact on the 24
Company’s actual annual pension costs. 25

M. S. COOPER U-20836
Line
No.
MSC - 10
1
Have you quantified the impact on the Company’s projected pension costs of 2
alternative discount rate assumptions and an increase in the actual return on 3
assets in 2021? 4
A14. Yes. Exhibit A-13 Schedule C5.12.2 reflects the impact on the Company’s 5
projected pension costs under two scenarios. The first scenario assumes that the 6
actual return on pension assets in 2021 is 12.0% rather than the 7.0% annual rate of 7
return assets in the base forecast and the second scenario, which is additive to the 8
first, assumes that the discount rate in December 2021 is 100 basis points higher 9
than the 2.57% assumed in the base forecast. While both the actual return on assets 10
in 2021 and the actual discount rate as of December 31, 2021 were both lower than 11
assumed in these scenarios, the directional impact is still true. 12
13
What is the impact on the Company’s pension costs for the projected test year 14
under these two scenarios? 15
A15. As reflected on Exhibit A-13, Schedule C5.12.2, the scenario of a 12% actual return 16
on assets in 2021 results in the Company’s pension costs for the projected test year 17
decreasing to negative $7.9 million. The additional assumption of a 100 basis point 18
increase in the December 2021 discount rate would decrease the Company’s 19
pension costs for the projected test year to negative $33.7 million. These estimates 20
assume the Company’s expected annual rate of return on assets will not change in 21
future years, which is unlikely as the Company’s existing investment policy 22
provides for more conservative investment strategies, and accordingly, lower 23
expected annual rate of return on assets, as the proportion of the pension liabilities 24
funded increases. If the Company’s expected annual rate of return on assets is 25
reduced to 6.0% in 2022 and 2023 in recognition of the pension liabilities being 26

M. S. COOPER U-20836
Line
No.
MSC - 11
fully funded as of December 31, 2021, the projected pension costs would increase 1
by over $30 million in the projected test year to negative $3.6 million. These 2
estimates further presume that the actual annual rate on assets will equal the 3
expected annual rate of return in 2022 and 2023 and that there are no further 4
changes in discount rates beyond December 31, 2021. 5
These analyses demonstrate the potential for extreme volatility in the Company’s 6
pension costs due to changes in actual results, as in the case of the return on assets, 7
or changes in point in time measurements, as in the case of the discount rate. 8
Moreover, this analysis also shows that the Company may, under certain 9
circumstances, incur negative pension costs during the projected test year. 10
11
How does the Company propose to address this potential volatility and that 12
future negative pension costs could be negative? 13
A16. Witness Uzenski proposes that due to the potential volatility and that the Company 14
could incur negative pension costs in the future be addressed through the adoption 15
of a deferral mechanism for pension expense similar to that in place for the 16
Company’s OPEB expense. While I have included pension expense of $9.2 million 17
of pension expense for the projected test year, if the Commission adopts the 18
Company’s proposal to defer any actual pension expense to a Regulatory Asset or 19
Liability, the pension expense for the projected test year would be eliminated. 20
21
OTHER POST-EMPLOYMENT BENEFITS 22
What are OPEB Costs? 23
A17. OPEB costs relate to the provision of retiree medical, dental, prescription drug and 24
life insurance benefits. OPEB is a cost recognized under U.S. GAAP Accounting 25

M. S. COOPER U-20836
Line
No.
MSC - 12
Standard Codification (ASC) section 715-60. Similar to ASC 715-30, OPEB costs 1
are determined under ASC 715-60 at the beginning of each fiscal year. 2
3
4
What are the cost components of OPEB? 5
A18. OPEB has the same basic cost components as pension costs. They are: 6
7
Service Costs: Service Costs are the portion of the expected postretirement benefit 8
obligation, on a present value basis, attributable to employee participation service 9
during the current period. Service Costs reflect actuarial assumptions of employee 10
turnover, age at retirement and expected longevity. Service Costs also depends on 11
the estimated costs of providing these benefits subsequent to retirement and thus is 12
impacted by both current medical cost levels and expected medical cost inflation. 13
14
Interest Costs: Interest Costs are the costs arising from the current period interest 15
on the discounted Accumulated Postretirement Benefit Obligation (APBO). The 16
APBO was discounted to today’s dollars based on the discount rate of 2.58% in 17
December 2019 and the interest cost on the APBO during the projected test year is 18
also based on 2.58%. The discount rate used in measuring Interest Costs, as well 19
as Service Costs for the 2020 historical test period, was 3.29%, based on the interest 20
rate environment at the end of 2019, as determined similar to the measurement of 21
the Company’s pension costs. The 2.58% discount rate used for determining 22
Interest Costs and Service Costs during the projected test year reflects the 23
assumption that high-quality corporate bond interest rates at the end of 2022 will 24
remain essentially unchanged from the rates prevailing in December 2020. 25
26

M. S. COOPER U-20836
Line
No.
MSC - 13
Expected Return on Assets: The Expected Return on Assets is an offset to the costs 1
of OPEB, based on the expected long-term return on assets invested. The expected 2
annual rate of return was 7.20% during the historical test year and is projected to 3
be 6.70% in 2021 and 6.30% in 2022 and 2023 due to an expected increase in asset 4
allocation to fixed income. 5
6
Amortizations: This cost component includes the amortizations related to deferred 7
Gains and Losses as well as Prior Service Costs. Accumulated gains and losses, 8
outside the 10% corridor, as described for pension costs, are amortized over the 9
current estimated remaining service lives of active participants. Prior Service Costs 10
are amortized over the estimated remaining service lives of active participants, at 11
the time of the last plan change, to the age at which these employees are fully 12
eligible for the benefits. 13
14
How are these OPEB costs expected to change between the historical test year 15
and the projected test year? 16
A19. As reflected on Exhibit A-13, Schedule C5.12.3, the Company’s OPEB costs are 17
projected to decrease from negative $27.0 million in the historical test year to 18
negative $35.0 million during the projected test year, which represents a decrease 19
in OPEB costs of $8.0 million. This reduction in OPEB costs is primarily due to 20
the reduction in Interest Costs due to the reduction in the discount rate from 3.29% 21
to 2.58%. 22
23
What are the underlying causes of the changes in OPEB costs between the 24
historical test year and the projected test year? 25

M. S. COOPER U-20836
Line
No.
MSC - 14
A20. The cost components for OPEB are reflected on Exhibit A-13, Schedule C5.12.3 1
for the historical test year and projected test year. These include the following 2
changes: 3
4
Service Costs are estimated to increase by $1.9 million between the two periods. 5
This increase reflects the impact of the reduced discount rate used to measure future 6
benefits and updated retiree health care inflation assumptions. 7
8
Interest Cost is expected to decrease by $8.5 million between the two periods due 9
to the decrease in the interest rate from the 3.29% rate used in 2020 in measuring 10
interest costs to the 2.58% rate used in the projected test year. 11
12
The Expected Return on Assets is projected to increase by $4.6 million between the 13
two periods, which results in a decrease in OPEB costs, due primarily to the 14
increase in assets arising from investment gains recognized in 2020 partially offset 15
by the reduction in the expected annual rate of return on assets in 2021 and beyond. 16
17
The amortization of (Gains)/Losses is projected to decrease by $4.6 million 18
between the two periods due to a decrease in the balances subject to amortization. 19
20
Finally, the amortization of Prior Service Costs is projected to remain essentially 21
flat between the two periods. 22
23

M. S. COOPER U-20836
Line
No.
MSC - 15
The total projected OPEB cost of negative $35.0 million is adjusted for the impact 1
of the costs transferred and the portion of OPEB costs capitalized, as described by 2
Witness Uzenski. 3
4
Has DTE Electric externally funded its OPEB costs? 5
A21. Yes. DTE Electric has funded the OPEB costs included in the Company’s revenue 6
requirement adopted by the Commission in previous orders through a Voluntary 7
Employees' Beneficiary Association (VEBA) trust and an Internal Revenue Code 8
Section 401(h) trust. 9
10
Will the Company externally fund its OPEB liability in the future? 11
A22. No. Since the Commission approved the Company’s proposal in Case No. U-20561 12
to continue the deferral of the projected negative OPEB expense initially approved 13
by the Commission in Case No. U-17767, the Company’s current and projected 14
revenue requirements do not include any OPEB expense and thus there is no 15
obligation for the Company to externally fund its OPEB liability. 16
17
Is the negative OPEB expense included in the Company’s proposed revenue 18
requirement? 19
A23. No. Witness Uzenski sponsors the Company’s proposal to continue to defer the 20
projected negative OPEB expense to the accumulated regulatory liability. Thus, 21
the projected negative OPEB expense is not reflected in the Company’s proposed 22
revenue requirement. 23
24
M. S. COOPER U-20836
Line
No.
MSC - 16
What is the basis for the projected cost increase in the New Hire Retiree 1
VEBA? 2
A24. The New Hire Retiree VEBA costs on Exhibit A-13, Schedule C5.11 reflect the 3
costs of the DTE Supplemental Retiree Benefits Plan that is offered in lieu of the 4
traditional retiree healthcare plan for eligible employees. The increase in New Hire 5
Retiree VEBA expense from $6.0 million in the historic test year to $11.4 million 6
in the projected test year is based on annual escalations of 25%, based on recent 7
experience. This increase reflects the growth in the number of plan participants 8
due to new hires. Since the New Hire Retiree VEBA is offered in lieu of the 9
Company’s traditional retiree healthcare plan, which is closed to new participants, 10
these costs are offset by avoided OPEB costs. 11
12
What other post-employment benefits are offered by the Company? 13
A25. The Company also offers an Employee Savings Plan, commonly referred to as a 14
401(k) plan. The Employee Savings Plan allows eligible employees the 15
opportunity to put aside a certain percentage of their annual earnings that the 16
Company matches up to 6% of annual salaries and wages for non-represented 17
employees and for most represented groups. In addition, employees, hired after the 18
defined benefit pension plan was closed to most new hires, receive an additional 19
employer contribution of 4% of annual salaries and wages. The Employee Savings 20
Plan costs, on Exhibit A-13, Schedule C5.11, are projected to increase from $28.5 21
million in the historic test year to $35.4 million in the projected test year based on 22
projected 3.0% annual pay increases, as well as the impact of the higher employer 23
contributions for newly hired employees that participate exclusively in the defined 24
contribution retirement plan. The combined effect of higher employee salaries and 25
M. S. COOPER U-20836
Line
No.
MSC - 17
wages as well as new hires in the historical test year is expected to increase the 1
Company’s Employee Savings Plan costs by 8.0% per year. 2
3
ACTIVE EMPLOYEE BENEFIT PROGRAMS 4
What other benefit programs are offered to active employees? 5
A26. The Company offers a competitive active employee benefits package for the 6
attraction and retention of a skilled workforce. The major components of the 7
benefit package include choices among several medical plans, dental plans, vision 8
care and life insurance options. The components of these benefits are summarized 9
on Exhibit A-13, Schedule C5.11, on lines 8 through 14. The medical, dental and 10
vision expenses are projected to increase from $41.4 million in the historic test year 11
to $58.0 million in the projected test year. This increase reflects the normalization 12
of the 2020 Active Healthcare costs for the non-recurring impact of a reduction in 13
the Company’s self-insured medical and dental costs resulting from the COVID-19 14
pandemic and an adjustment to reflect an historical average of constant dollar costs, 15
which results in a total increase of $9.2 million, as described below. The 2020 16
normalized Active Healthcare costs of $50.5 million is then escalated for the 17
adjusted medical plan trend of 5.5% in 2021, 5.0% in 2022 and 4.5% in 2023, as 18
more fully described below. The $0.2 million of Life Insurance costs in 2020 are 19
projected to remain essentially flat in the projected test year. Benefit Plan 20
Administration Fees are projected to increase from $5.4 million in 2020 to $5.8 21
million for the projected test year due to the overall rate of inflation as measured 22
by the Consumer Price Index. 23
24

M. S. COOPER U-20836
Line
No.
MSC - 18
What is included in the normalization adjustments for Active Healthcare costs 1
in column (c) of Exhibit A-13, Schedule C5-11? 2
A27. The total Active Healthcare normalization adjustment of $9.1 million consists of 3
two separate adjustments. The first adjustment relates to the normalization of the 4
Company’s Active Healthcare costs in 2020 for the impact of the COVID-19 5
pandemic on the Company’s self-insured medical and dental costs and is an 6
increase of $3.4 million. The second adjustment represents a normalization of the 7
Company’s adjusted total Active Healthcare costs for a five-year average of the 8
Company’s constant dollar Active Healthcare costs, which represents an increase 9
of $5.7 million. 10
11
How did the COVID-19 pandemic impact the Company’s Active Healthcare 12
costs in 2020? 13
A28. The Company experienced a substantial reduction in its self-insured medical and 14
dental claims in 2020, as a result of the combined effects of Government ordered 15
shut-downs, capacity constraints experienced by medical service providers during 16
the peak periods of the pandemic and the generally reduced utilization by 17
employees and dependents of healthcare services. While the Company also 18
incurred claims directly related to COVID-19 cases by employees and dependents, 19
those costs were more than offset by overall reduction in claims. 20
21
Should the Company’s 2020 incurred Active Healthcare costs be adjusted to 22
exclude the impact of the reduction realized as a result of the COVID-19 23
pandemic? 24
A29. Yes. The Company’s actual Active Healthcare costs in 2020 were impacted by the 25
unusual and non-recurring impact of the COVID-19 pandemic that must be 26

M. S. COOPER U-20836
Line
No.
MSC - 19
eliminated from the historical test year. The elimination of the measurable impact 1
on the Company’s Active Healthcare costs is necessary not only because the 2
number of claims made in 2020 were driven to non-representatively low levels, but 3
also because of the high likelihood that a meaningful portion of the medical services 4
not rendered in 2020 will only be postponed into future years, not eliminated. This 5
will likely increase the Company’s Active Healthcare costs beyond the levels 6
reflected in the medical trend factors used to escalate for future Active Healthcare 7
costs. 8
9
Have you quantified the impact on the Company’s 2020 actual Active 10
Healthcare costs of the COVID-19 pandemic? 11
A30. Yes. Exhibit A-13, Schedule C5.11.3 reflects a comparison of the Company’s 12
actual self-insured medical and dental costs in 2020 compared to 2019 related to 13
active employees. The total self-insured medical and dental costs in 2020 were 14
$43.2 million compared to 2019 claims of $48.8 million, which represents a 15
reduction in absolute terms of $5.6 million. However, according to the PwC 16
projection of medical cost trends in 2020 independent of any impacts of COVID-17
19, as explained in Exhibit A-13, Schedule C5.11.2, the Company’s Active 18
Healthcare costs should have increased by 6.0% in 2020, which is reduced in this 19
analysis to 5.5% as a result of the Wellness program, as described more fully below. 20
The comparison of the actual 2020 claims of $43.2 million to the expected 2020 21
claims of $51.4 million shows that the Company’s self-insured claims were $8.3 22
million less than the level expected in the absence of the COVID-19 pandemic, as 23
reflected in column (d), line 6 of Exhibit A-13, Schedule C5.11.3. 24
25

M. S. COOPER U-20836
Line
No.
MSC - 20
However, this $8.3 million reduction is inclusive of the cost of actual self-insured 1
claims in 2020 related to COVID-19 medical treatment of $1.1 million. When the 2
actual COVID-19 claims are excluded, the total unexpected change in the 3
Company’s self-insured medical and dental costs increases to $9.3 million, which 4
represents the estimated impact in 2020 of the COVID-19 pandemic on the 5
Company’s Active Healthcare costs that must be reflected as a normalization 6
adjustment to the Company’s 2020 costs. 7
8
In addition to COVID-19 claims, the Company also incurred costs associated with 9
COVID-19 for medical services related to testing and other measures of $3.1 10
million that should also be excluded from the Company’s normalized 2020 Active 11
Healthcare costs. The subtraction of the costs of COVID-19 claims in 2020 of $1.1 12
million and the COVID-19 medical services costs of $3.1 million results in a net 13
adjustment to the Company’s Active Healthcare costs of $5.2 million, as reflected 14
in column (e), line 12 of Exhibit A-13, Schedule C5.11.3, prior to any recognition 15
for the portion of the Company’s costs that are capitalized and transferred. The net 16
adjustment to the Company’s 2020 Active Healthcare expense is an increase of $3.4 17
million. The potential for additional COVID-19 related costs related to increased 18
vaccination and testing requirements is discussed later in my testimony. 19
20
What is the Constant Dollar Normalization Adjustment to 2020 Active 21
Healthcare costs? 22
A31. The year-to-year volatility of actual Active Healthcare costs makes the use of any 23
one historical period’s expense a potentially unreliable starting point in the 24
determination of projected Active Healthcare costs. Accordingly, the adjustment 25

M. S. COOPER U-20836
Line
No.
MSC - 21
of $5.2 million, as derived in Exhibit A-13, Schedule C5.11.4, represents a 1
normalization of the Company’s actual 2020 Active Healthcare costs that is 2
designed to eliminate the volatility of the Company’s Active Healthcare costs 3
through the quantification of the Company’s historical Active Healthcare costs per 4
employee as adjusted for national historical healthcare cost trends. This results in 5
an average of the Company’s actual Active Healthcare costs per employee stated 6
in a basis that eliminates the impact of historical healthcare cost inflation. 7
8
What is the basis for your conclusion that year-to-year Active Healthcare costs 9
are volatile? 10
A32. The Company is self-insured for about 70% of its total Active Healthcare costs. 11
Self-insurance results in the level of Active Healthcare costs incurred by the 12
Company being highly impacted by the mix and severity of medical treatments 13
administered to employees and their eligible dependents. The Company’s Active 14
Healthcare costs are also impacted by the number of employees and dependents 15
eligible for coverage, which can vary from year to year due to both changes in the 16
number of employees and the number of employees that opt out of the Company’s 17
medical plans. 18
19
Have you quantified the degree of volatility in the Company’s Active 20
Healthcare Costs? 21
A33. Yes. The actual annual percentage change in the Company’s Active Healthcare 22
costs for the years 2010 through 2020, as adjusted for a one-time credit in 2018, is 23
reflected in Table 1 below. 24
25

M. S. COOPER U-20836
Line
No.
MSC - 22
1
2
This chart shows that the Company’s actual Active Healthcare costs have changed 3
relative to the prior year by as much a 18% in 2013 to a decrease of almost 5% in 4
2020 and demonstrates that Active Healthcare costs can vary significantly from 5
year-to-year. 6
7
Are the annual percent changes reflected in this chart the same as the 8
Company’s Active Healthcare expense? 9
A34. No. The annual percent changes reflected in Table 1 above are based on the 10
Company’s total Active Healthcare costs before reduction for the portion of those 11
costs that are capitalized. Due to changes between years in the portion of Active 12
Healthcare costs capitalized, annual changes in Active Healthcare expense can be 13
distorted. For example, the portion of Active Healthcare costs capitalized in 2011 14
(10.0%)
(5.0%)
0.0%
5.0%
10.0%
15.0%
20.0%
2011 2012 2013 2014 2015 2016 2017 2018 2019 2020
Active Healthcare Costs
Annual Percentage Change
2011 - 2020

M. S. COOPER U-20836
Line
No.
MSC - 23
was about 22% while in 2020 the portion of Active Healthcare costs capitalized has 1
increased to over 33%. The increase in the proportion of Active Healthcare cost 2
capitalized reflects the increase in the Company’s annual capital expenditures. 3
Accordingly, the quantification of the annual changes in the Company’s Active 4
Healthcare costs before adjustment for the portion of costs capitalized is a more 5
meaningful method of identifying the true annual variability of Active Healthcare 6
costs because it eliminates the distortion of year-to-year changes in the proportion 7
of costs capitalized. 8
9
Is there a method of normalizing the Company’s historical Active Healthcare 10
costs to determine a more reliable starting point in determining Active 11
Healthcare costs for the projected test year? 12
A35. Yes. The variability in the Company’s actual Active Healthcare costs can be 13
normalized through the use of constant dollar Active Healthcare costs on a per 14
employee basis. This allows the normalization of the inherent volatility in historical 15
Active Healthcare costs through the elimination of the impact of healthcare price 16
level changes and changes in the level of employees. 17
18
How did you determine a constant dollar average of the Company’s Active 19
Healthcare costs on a per employee basis? 20
A36. Exhibit A-13, Schedule C5.11.4 reflects the Company’s actual Medical, Dental and 21
Vision components of the actual Active Healthcare costs for the years 2016 through 22
2020, before the impact of the costs capitalized and transferred. These costs are 23
divided by the simple average of employees at the beginning and end of each year 24
to develop the Active Healthcare costs per employee. The Active Healthcare costs 25

M. S. COOPER U-20836
Line
No.
MSC - 24
per employee for each year is then adjusted for the actual percent increase in 1
medical trends, as reported by PwC on page 3 of Exhibit A-13, Schedule C5.11.2. 2
While the actual medical trend rates reported by PwC for the years 2016 through 3
2019 are used, the PwC trend rate of 6.0% for 2020 is adjusted downward by 0.5% 4
for the impact of the Company’s Wellness program. (The Life Insurance and 5
Benefit Plan Administration Fees have been excluded from this analysis because 6
these items are subject to separate escalation factors.) Adjusting the Company’s 7
actual Active Healthcare costs for the overall increases in medical costs 8
experienced by a broad universe of employers and insurance providers, as reflected 9
in the PwC study, enables the separation of the Company’s year-to-year variability 10
that is driven by changes in utilization by the Company’s employees and their 11
dependents from changes to overall healthcare cost trends. 12
13
The adjustment of each year’s Active Healthcare costs per employee produces a 14
five-year average cost per employee on a constant dollar basis of $11,363. By 15
multiplying this amount by the 2020 average number of employees the total 16
constant dollar Active Healthcare cost of $77.8 million is generated. This 17
represents a $8.6 million increase relative to the Company’s incurred Active 18
Healthcare costs in 2020, as adjusted for the COVID-19 normalization. This 19
amount is adjusted for the 66.7% of Active Healthcare costs charged to expense 20
and results in a constant dollar normalization adjustment of $5.7 million. 21
22
Has the Commission previously addressed the propriety of a constant dollar 23
Active Healthcare adjustment? 24

M. S. COOPER U-20836
Line
No.
MSC - 25
A37. Yes. In its Order in DTE Gas Company’s most recent rate case the Commission 1
declined to adopt the constant dollar Active Healthcare cost adjustment based on 2
its conclusion that “a multi-year average adequately captures the volatility of the 3
expense” (Case No. U-20940, Order issued December 9, 2021, p. 157). 4
5
Do you agree with the Commission’s conclusion in Case No. U-20940? 6
A38. No. Although the Commission acknowledged that Active Healthcare costs are 7
volatile, it used one year’s actual Active Healthcare costs as the starting basis for 8
projecting future Active Healthcare costs. (i.e., actual 2019 costs x multi-year 9
average percentage of 3% x 3 years). The Commission’s adoption of a multi-year 10
average of the historical annual percentage increases in the Company’s Active 11
Healthcare costs in determining the escalation of historical test period Active 12
Healthcare costs for the projected test period did not address whether the historical 13
test period costs were a representative starting point to which the escalations should 14
be applied. 15
16
Does a multi-year average of historical increases in Active Healthcare costs 17
fully recognize the impact of volatility? 18
A39. No. Averages of historical increases in the Company’s actual Active Healthcare 19
costs only measures the annual changes in those costs, which is distinguishable 20
from the determination of the proper starting point to which those projected 21
increases should be applied. The decline in the Company’s actual Active Healthcare 22
costs in 2020 because of the COVID-19 pandemic, as previously discussed, 23
provides compelling reinforcement that unadjusted historical costs can be a poor 24
basis for projecting future Active Healthcare costs. 25
26
27
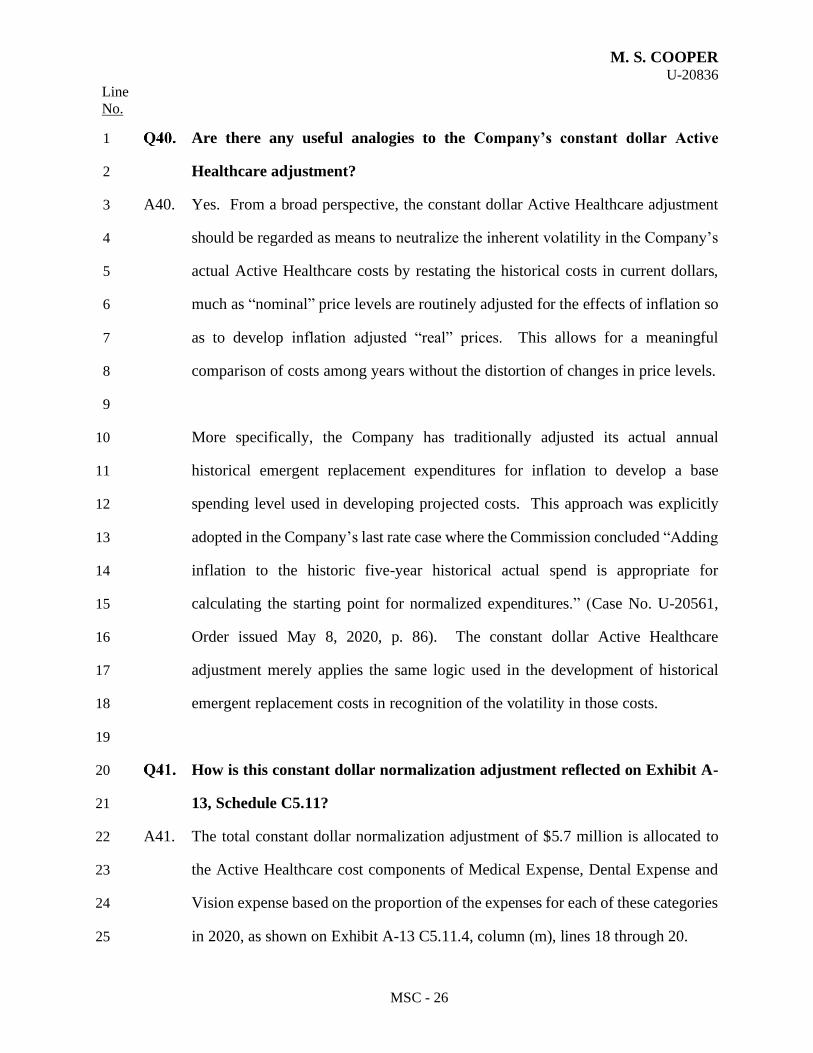
M. S. COOPER U-20836
Line
No.
MSC - 26
Are there any useful analogies to the Company’s constant dollar Active 1
Healthcare adjustment? 2
A40. Yes. From a broad perspective, the constant dollar Active Healthcare adjustment 3
should be regarded as means to neutralize the inherent volatility in the Company’s 4
actual Active Healthcare costs by restating the historical costs in current dollars, 5
much as “nominal” price levels are routinely adjusted for the effects of inflation so 6
as to develop inflation adjusted “real” prices. This allows for a meaningful 7
comparison of costs among years without the distortion of changes in price levels. 8
9
More specifically, the Company has traditionally adjusted its actual annual 10
historical emergent replacement expenditures for inflation to develop a base 11
spending level used in developing projected costs. This approach was explicitly 12
adopted in the Company’s last rate case where the Commission concluded “Adding 13
inflation to the historic five-year historical actual spend is appropriate for 14
calculating the starting point for normalized expenditures.” (Case No. U-20561, 15
Order issued May 8, 2020, p. 86). The constant dollar Active Healthcare 16
adjustment merely applies the same logic used in the development of historical 17
emergent replacement costs in recognition of the volatility in those costs. 18
19
How is this constant dollar normalization adjustment reflected on Exhibit A-20
13, Schedule C5.11? 21
A41. The total constant dollar normalization adjustment of $5.7 million is allocated to 22
the Active Healthcare cost components of Medical Expense, Dental Expense and 23
Vision expense based on the proportion of the expenses for each of these categories 24
in 2020, as shown on Exhibit A-13 C5.11.4, column (m), lines 18 through 20. 25

M. S. COOPER U-20836
Line
No.
MSC - 27
1
Is the normalization of 2020 Active Healthcare costs necessary after the impact 2
of COVID-19 has been eliminated? 3
A42. Yes. The adjustment for COVID-19 only eliminates the identifiable impact of the 4
COVID-19 pandemic on the Company’s self-insured medical and dental plans in 5
2020. Accordingly, even after 2020 is adjusted for the impact of COVID-19 on the 6
self-insured plans, there remains significant volatility in total Active Healthcare 7
costs among the years that is not addressed through the 2020 COVID-19 8
adjustment. 9
10
What is the basis for the future medical plan trend for Active Healthcare 11
expense? 12
A43. The annual unadjusted medical plan trend factors of 6.50% for 2021, 2022 and 2023 13
is based on projections for healthcare trends provided by the health care experts at 14
Willis Towers Watson (WTW), as reflected on Exhibit A-13, Schedule C5.11.1 and 15
explained below. These unadjusted trend factors are reduced by 0.50% each year 16
to reflect the expected savings to be realized by the Company’s Wellness program. 17
Accordingly, the Active Healthcare expense projections are based on the 18
normalized 2020 actual expense escalated by the adjusted medical trend factors of 19
5.50% in 2021, 5.00% in 2022 and 4.50% in 2023. 20
21
How were the trend factors determined? 22
A44. The first step in the development of the trend factors is to develop the Allowed 23
Trend. The Allowed Trend is subsequently adjusted for the Company’s actual plan 24
design to develop the future Medical Plan Trend applicable to the Company. The 25

M. S. COOPER U-20836
Line
No.
MSC - 28
use of national trends by WTW is premised on the view that data for any individual 1
company is not a credible basis for future expectations. 2
3
Do you have any collaborating sources that support the reasonableness of 4
Aon’s projections? 5
A45. Yes. A study released in 2021 by PwC’s Health Research Institute as reflected in 6
Exhibit A-13, Schedule C5.11.2, projects that medical costs will increase by 7.0% 7
in 2021 and 6.5% in 2022. As described in the PwC study, these year over year 8
changes are derived with the impact of the COVID-19 pandemic excluded from the 9
prior year’s numbers. 10
11
What are Other Employee Benefits Costs? 12
A46. The costs of the Company’s Other Employee Benefits are reflected on Exhibit A-13
13, Schedule C5.11. These costs include a variety of other benefits including 14
Accrued Vacation, Supplemental Severance Plan, Wellness Plan, Long-Term 15
Disability expense, costs associated with the Affordable Care Act (ACA), General 16
Benefits expenses as well as the Supplemental Savings Plan and Deferred 17
Compensation Plan. Also included in Other Employee Benefits Costs is the 18
amortization of the medical refund liability, as approved by the Commission in its 19
Order in Case No. U-20162 that is sponsored by Witness Uzenski. 20
21
What is the basis for your projection of the Company’s Accrued Vacation 22
expense? 23
A47. Accrued Vacation expense can vary from year-to-year based on the timing of the 24
usage of earned vacation time by employees as well as forfeitures and the value of 25

M. S. COOPER U-20836
Line
No.
MSC - 29
unused vacation at year-end. Consistent with past practice, the projected Vacation 1
Accrual expense reflected on Exhibit A-13, Schedule C5.11 is based on the average 2
of the recorded expense for the most recent five years, which is then escalated by 3
projected 3% labor annual cost increases through the end of the projected test year. 4
Accordingly, Accrued Vacation expense recognized in 2020 of $5.6 million is 5
adjusted to $0.2 million for the projected test year. 6
7
What is the basis for the Supplemental Severance Plan cost projections? 8
A48. Aon developed the projected cost of this plan. The Supplemental Severance Plan 9
was adopted in 2016 that provides certain eligible employees that are covered by 10
the MCN Energy Group, Inc. (MCN) Traditional pension plan a lump sum payment 11
that is designed to provide retirement benefits comparable to the pension benefit 12
provided under DTE Energy’s traditional pension plan. Since certain employees of 13
both DTE Electric and DTE LLC are covered by the traditional MCN pension plan 14
because they were employees of MCN or its subsidiaries at the time of DTE 15
Energy’s merger with MCN, the cost of the Supplemental Severance Plan is borne 16
by DTE Electric to the extent the labor costs for the affected employees are 17
allocated to DTE Electric. The Supplemental Severance Plan expense is projected 18
to decrease from $0.9 million in the historical test year to $0.3 million in the 19
projected test year, based on actuarial projections provided by Aon. 20
21
How did you project the increase in the Company’s Wellness Program 22
expense? 23
A49. As referenced in the discussion of Active Healthcare expense, the Company has a 24
Wellness Program designed to produce significant reductions in future active 25

M. S. COOPER U-20836
Line
No.
MSC - 30
healthcare expense. This Wellness Program will result in an increase of Wellness 1
Program expense from $3.8 million in the historical test year to $4.4 million in the 2
projected test year (Exhibit A-13, Schedule C5.11, line 18). 3
4
Has the Commission addressed the reasonableness of the Wellness Program 5
in its prior orders? 6
A50. Yes. The same Wellness Program was included in the Company’s proposed 7
revenue requirement in DTE Electric’s most recent rate case. In response to the 8
Attorney General’s opposition to the inclusion of the increase in Wellness Program 9
costs, the Commission concluded that it “supports wellness programs and the cost-10
efficiencies derived from supporting healthy employees and work environments” 11
and adopted the Company’s projections (Case No. U-20561, Order issued May 8, 12
2020, p. 202). 13
14
How have you projected the Company’s Long-Term Disability Expense? 15
A51. Actual 2020 Long-Term Disability Expense is projected to increase from $1.1 16
million to $1.2 million during the projected test year based on the assumption that 17
these costs will increase based on the labor escalation rate, escalated at the 3.0% 18
annual labor cost rate recognizing that disability claims relate to employee labor. 19
20
21
What is the basis for the adjustments to the Supplemental Savings Plan costs 22
for the projected test year? 23
A52. The decrease in the Supplemental Savings Plan (SSP) costs reflect an increase in 24
the Company’s matching contributions based on 3.0% projected salary escalations 25
offset by a reduction in the expected earnings on the designated investments. Since 26

M. S. COOPER U-20836
Line
No.
MSC - 31
the Company does not separately fund the Company’s matches to the employees’ 1
contributions, the earnings and losses from the employees’ directed investments is 2
a cost incurred by the Company. The projection reflects an annual return on the 3
investments consistent with the expected long-term return on investments used in 4
the determination of the Company’s pension costs in the projected test year. This 5
results in SSP expense for the historical test year of $3.1 million being reduced to 6
$2.7 million during the projected test year, which is primarily the result of actual 7
investment returns in 2020 being higher than the 7.00% projected return. 8
9
What is the basis for the adjustments to the Deferred Compensation costs? 10
A53. Similar to the Supplemental Savings Plan, the Company’s recorded costs are based 11
on the return on the investment directives of the participating employees since the 12
deferrals are not funded by the Company. The projected Deferred Compensation 13
costs are based on the expectation that the designated investments will earn an 14
annual return consistent with the expected return on assets for the pension plan. 15
Thus, actual Deferred Compensation expense is projected to increase from $97,000 16
in the historical test year to $98,000 for the projected test year. 17
18
How have you developed the projections for the other items included in Other 19
Benefits Costs on Exhibit A-13, Schedule C5.11? 20
A54. The ACA expense of $21,000 reflects the actual costs recognized for the 21
Comparative Effectiveness Research Fee and, because the fee as approved in the 22
ACA escalates at the overall national medical expenditures, is escalated at the 23
medical trend used above, resulting in $24,000 of ACA expense for the projected 24
test year. General Benefits Expense and Retirement Administration Fees are 25
projected based on the actual amounts recorded in 2020 of $2.4 million and $0.4 26
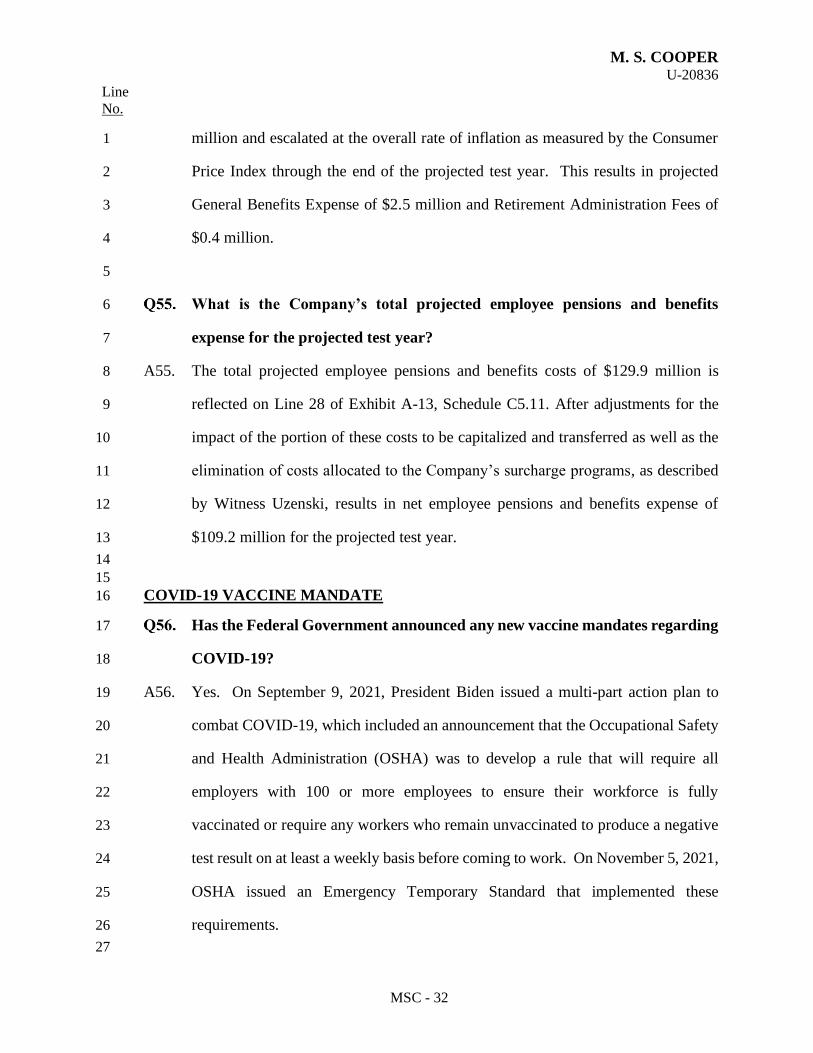
M. S. COOPER U-20836
Line
No.
MSC - 32
million and escalated at the overall rate of inflation as measured by the Consumer 1
Price Index through the end of the projected test year. This results in projected 2
General Benefits Expense of $2.5 million and Retirement Administration Fees of 3
$0.4 million. 4
5
What is the Company’s total projected employee pensions and benefits 6
expense for the projected test year? 7
A55. The total projected employee pensions and benefits costs of $129.9 million is 8
reflected on Line 28 of Exhibit A-13, Schedule C5.11. After adjustments for the 9
impact of the portion of these costs to be capitalized and transferred as well as the 10
elimination of costs allocated to the Company’s surcharge programs, as described 11
by Witness Uzenski, results in net employee pensions and benefits expense of 12
$109.2 million for the projected test year. 13
14
15
COVID-19 VACCINE MANDATE 16
Has the Federal Government announced any new vaccine mandates regarding 17
COVID-19? 18
A56. Yes. On September 9, 2021, President Biden issued a multi-part action plan to 19
combat COVID-19, which included an announcement that the Occupational Safety 20
and Health Administration (OSHA) was to develop a rule that will require all 21
employers with 100 or more employees to ensure their workforce is fully 22
vaccinated or require any workers who remain unvaccinated to produce a negative 23
test result on at least a weekly basis before coming to work. On November 5, 2021, 24
OSHA issued an Emergency Temporary Standard that implemented these 25
requirements. 26
27

M. S. COOPER U-20836
Line
No.
MSC - 33
How will the emergency OSHA rules impact the Company? 1
A57. It is unclear. Compliance with the emergency OSHA rules adopted on November 2
5, 2021, could be significant if implemented. For example, assuming 30% of the 3
Company’s approximately 7,000 employees remain unvaccinated and the cost of 4
each COVID-19 test is $60, the Company would incur an annual cost of almost $7 5
million for the weekly testing of all unvaccinated employees. However, if 6
laboratory diagnostics are required for these tests, the annual cost could easily triple 7
to nearly $20 million. However, the emergency OSHA rules are also the subject 8
of numerous actions in the Federal Court system regarding the legality and scope 9
of the rules, which could result in the affirmation, modification or elimination of 10
the emergency rules. 11
Simply stated, there is too much uncertainty regarding the actual costs that may be 12
incurred by the Company of complying with OSHA emergency rules tests to 13
develop a reliable estimate of the costs. Moreover, since the Company has excluded 14
from the historical test year the non-recurring costs in 2020 related to COVID-19, 15
including the related healthcare costs discussed above, there remains a risk that the 16
Company will nevertheless incur costs related to COVID-19 in the future. This 17
could include the costs of compliance with both existing and additional mandates 18
issued by the Federal or Local governmental agencies, further actions taken by the 19
Company to protect the health and safety of its employees and customers or 20
increased healthcare costs that may arise from either additional COVID-19 variants 21
or increases in the cost of vaccinations if current Federal subsidies are eliminated. 22
23
How do you propose this uncertainty be addressed? 24

M. S. COOPER U-20836
Line
No.
MSC - 34
A58. Witness Uzenski proposes that the Company be authorized to establish a 1
Regulatory Asset for the accumulation of the costs incurred by the Company in 2
connection with the costs of both complying with President Biden’s COVID-19 3
Action Plan and other COVID-19 costs the Company may incur in the projected 4
test year. 5
6
LABOR COST ESCALATION 7
What annual labor cost escalation assumptions are appropriate for the 8
projected test period? 9
A59. Annual labor cost escalation assumptions are required for both the Company’s 10
represented and non-represented employees. Based on existing Collective 11
Bargaining Agreements, the Company is obligated to increase pay rates by 12
approximately 3.0% annually through the term of the contracts. In addition to 13
scheduled pay rate increases, the agreements also provide for progression increases 14
for those employees that have not yet achieved the maximum pay rate for their 15
positions. 16
17
Non-represented employee compensation is generally adjusted annually based on a 18
review of pay practices of other employers, overall price level changes and internal 19
pay equity. Pursuant to these reviews, the Company implemented base pay 20
adjustments in March 2021 that resulted in an overall pay increase of about 3%, 21
just as it was in 2020 and every year since 2010. In addition to the annual pay 22
adjustment program, employees also receive pay increases based on promotions. 23
24
Based on the above, I have determined that annual escalations of 3.0% for 2021, 25

M. S. COOPER U-20836
Line
No.
MSC - 35
2022 and 2023 are a conservative estimate of the Company’s expected increase in 1
its labor rates. 2
3
EMPLOYEE COMPENSATION 4
What is the Company’s compensation philosophy and framework for non-5
represented employees other than Executives? 6
A60. Non-represented employees are those employees not covered by Collective 7
Bargaining Agreements with union organizations, whereas Executives are 8
generally defined as those at the Vice President level and above. DTE Electric’s 9
compensation philosophy is to provide pay programs that: 1) attract, retain, and 10
motivate employees; 2) ensure that pay is externally competitive; and 3) 11
differentiate total rewards based on both organizational unit and individual 12
contributions and results. 13
14
At DTE Electric, total annual compensation for non-represented employees has two 15
primary components: base pay and variable pay, as delivered through the 16
Company’s incentive compensation programs. Employee base pay is reviewed 17
annually and adjusted (if appropriate) based on the position relative to what the 18
external market pays for similar positions and individual performance. Variable 19
pay is based on the achievement of Company, departmental and individual results 20
reflecting a balance of customer, operational and, in limited instances, financial 21
objectives. Variable pay consists of short-term incentive plans and a long-term 22
incentive plan. Participation in the long-term incentive plan is open to all 23
Managers, Directors and Executives as well as an additional 10% of non-24
represented employees that are eligible for discretionary awards. 25

M. S. COOPER U-20836
Line
No.
MSC - 36
1
How does the Company’s philosophy regarding incentive compensation 2
compare with that of its peer group? 3
A61. Incentive compensation programs are a component of total compensation practices 4
for the vast majority of energy companies for their non-represented employee 5
population. Base pay is set lower than it otherwise would be because of the variable 6
pay component. When considered holistically, the Company’s base and variable 7
pay plans provide a framework of market-based total annual compensation pay 8
opportunities for non-represented employees. It is the total annual cash 9
compensation, as represented by these two components, that prospective and 10
current employees use to gauge whether DTE Electric’s compensation is 11
competitive with other potential employers. 12
13
How does the Company’s non-represented compensation philosophy and 14
framework provide benefits to customers? 15
A62. DTE Electric’s compensation philosophy and framework provide a benefit to 16
customers by attracting and retaining employees with the requisite skills and 17
experience to ensure safe, reliable, and high-quality customer service delivery, and 18
by recognizing and rewarding effective and efficient performance. A competitive 19
compensation policy also serves to effectively retain employees, minimizing the 20
risks and costs of high employee attrition. This philosophy directly benefits all 21
customers by providing a high level of service at a competitive cost and provides 22
incentives to focus future job performance on those activities that provide the most 23
benefit to customers. 24
25

M. S. COOPER U-20836
Line
No.
MSC - 37
What is the comparative market used by the Company to determine the 1
external market for compensation? 2
A63. The comparative market for positions varies based on the specific job. Some jobs 3
are compared to those in utilities of similar size (e.g., revenue, number of 4
employees, etc.), other jobs to general industry located in Southeastern Michigan, 5
and yet other jobs to general industry located within the United States. The relevant 6
market will depend upon the requisite skills and abilities required of the job and the 7
nature of the recruitment source. For example, the comparative market for an 8
administrative assistant is the general industry within Southeastern Michigan while 9
the comparative market for a manager of nuclear operations is utilities within the 10
Midwestern United States (primarily), or within the entire United States 11
(secondarily). 12
13
How is benchmark data obtained from the comparative market? 14
A64. The Company participates in and/or purchases published salary surveys from 15
several different organizations. The surveys typically report median base salary, 16
target incentives and median total cash compensation by job classification. 17
18
How are base salaries determined? 19
A65. Base salaries are targeted around the median base salary levels of the comparative 20
market as adjusted for differences in company size and scope where appropriate. 21
All non-executive positions are placed in a salary zone based on external 22
benchmarking. The mid-point of the salary zone is based on the market median for 23
comparable work in comparable companies. A range is provided above and below 24
the midpoint to allow for differentiation based on applicable skills and experience, 25
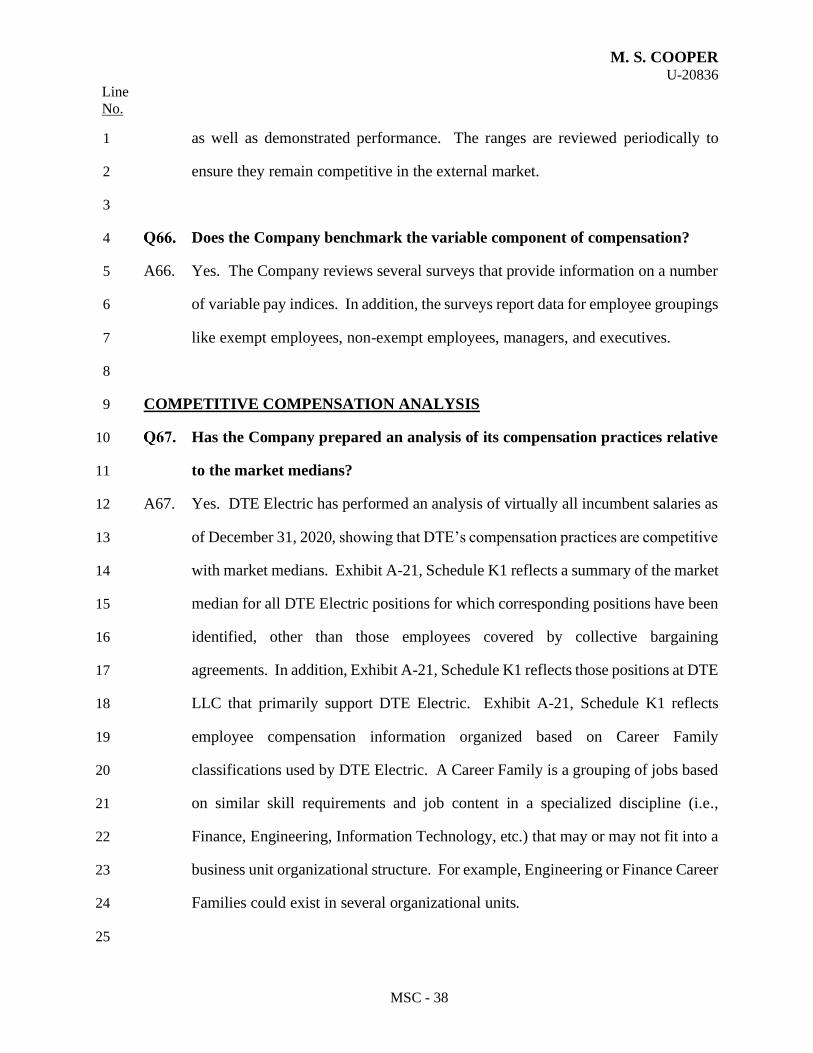
M. S. COOPER U-20836
Line
No.
MSC - 38
as well as demonstrated performance. The ranges are reviewed periodically to 1
ensure they remain competitive in the external market. 2
3
Does the Company benchmark the variable component of compensation? 4
A66. Yes. The Company reviews several surveys that provide information on a number 5
of variable pay indices. In addition, the surveys report data for employee groupings 6
like exempt employees, non-exempt employees, managers, and executives. 7
8
COMPETITIVE COMPENSATION ANALYSIS 9
Has the Company prepared an analysis of its compensation practices relative 10
to the market medians? 11
A67. Yes. DTE Electric has performed an analysis of virtually all incumbent salaries as 12
of December 31, 2020, showing that DTE’s compensation practices are competitive 13
with market medians. Exhibit A-21, Schedule K1 reflects a summary of the market 14
median for all DTE Electric positions for which corresponding positions have been 15
identified, other than those employees covered by collective bargaining 16
agreements. In addition, Exhibit A-21, Schedule K1 reflects those positions at DTE 17
LLC that primarily support DTE Electric. Exhibit A-21, Schedule K1 reflects 18
employee compensation information organized based on Career Family 19
classifications used by DTE Electric. A Career Family is a grouping of jobs based 20
on similar skill requirements and job content in a specialized discipline (i.e., 21
Finance, Engineering, Information Technology, etc.) that may or may not fit into a 22
business unit organizational structure. For example, Engineering or Finance Career 23
Families could exist in several organizational units. 24
25

M. S. COOPER U-20836
Line
No.
MSC - 39
Why have you excluded from this analysis employees covered by collective 1
bargaining agreements? 2
A68. Compensation levels for unionized employees are determined through a negotiated 3
process, which involves a variety of work rules and benefit related issues, rather 4
than determined strictly through market analysis. Moreover, the specialized skills 5
and experience required by many of the positions are not readily comparable to 6
other positions in the local market. Thus, a comparison of pay levels for those 7
employees covered by collective bargaining agreements is not useful in this 8
context. 9
10
What conclusions do you draw from Exhibit A-21, Schedule K1? 11
A69. In summary, Exhibit A-21, Schedule K1 demonstrates that the weighted average of 12
the annual base compensation for all positions with incumbents as of December 31, 13
2020, with available position matches was a mere 0.1% more than the average of 14
median market base compensation. Plus, such analysis further demonstrates that 15
total cash compensation for all positions with incumbents as of December 31, 2020, 16
with available position matches was 0.8% less than the average of median market 17
for total cash compensation. This analysis concludes that the Company’s total 18
compensation is insignificantly different from the market medians and confirms 19
that the Company’s compensation practices are consistent with the Company’s 20
compensation policy to pay employees near the market median for comparable 21
positions on a total cash compensation basis. Moreover, a comparison of the 22
Company’s base salaries, which excludes short-term incentive compensation, to the 23
market medians for total cash compensation, which is inclusive of short-term 24
incentive compensation, shows that in the absence of the Company’s short-term 25

M. S. COOPER U-20836
Line
No.
MSC - 40
incentive compensation programs, the Company’s pay would be 11.5% less than 1
the market medians. 2
3
How was the market median for the positions determined? 4
A70. As described above, the Company subscribes to several compensation survey 5
providers that create comprehensive databases of job descriptions that enables the 6
Company to match the job requirements, including education, expertise and 7
experience of existing positions with market surveys. After matching job positions 8
are identified, actual base and total compensation ranges are developed from the 9
salary survey database. The information on Exhibit A-21, Schedule K1 was derived 10
from the Company’s compilation of the compensation for positions with an 11
incumbent as of December 31, 2020. 12
13
What proportion of DTE Electric’s total employee population as of December 14
31, 2020, is reflected in this analysis? 15
A71. This analysis includes 99.1% of the employee population as of December 31, 2020, 16
at DTE Electric, as well as DTE LLC employees that provide supporting services 17
to DTE Electric, but exclusive of those employees represented by collective 18
bargaining agreements. 19
20
What is included in the total cash compensation amounts? 21
A72. Total cash compensation reflects base pay as of December 31, 2020, and the Target 22
payout levels for those employees eligible to participate in the Company’s short-23
term incentive compensation programs. Although the analysis on Exhibit A-21, 24
Schedule K1 does not reflect the value of the Company’s Long-Term Incentive 25

M. S. COOPER U-20836
Line
No.
MSC - 41
Plan, as it is primarily for executive level positions, a separate analysis of executive 1
compensation prepared by Aon, which is inclusive of long-term plans, shows that 2
total compensation is equal to the median of the Company’s peer group, as 3
discussed in more detail below. 4
5
Has the Company had any independent experts on compensation review the 6
Company’s analytical techniques? 7
A73. Yes. Independent assessments by Aon have concluded that the Company uses best 8
practices in sourcing the market pay data and developing estimated market values. 9
10
EXECUTIVE COMPENSATION 11
How does the compensation program for Executives differ from that for non-12
executives? 13
A74. The compensation program for Executives differs in three respects. First, the 14
comparative market for compensation benchmarking is defined as a specific group 15
of peer companies from which comparative data are analyzed through a custom 16
study performed every two years. Second, a higher proportion of Executives’ 17
compensation is delivered in the form of variable pay. The third way in which the 18
Executive compensation program differs is with respect to governance. The 19
compensation programs for Company Executives must be approved by the 20
Organization and Compensation Committee of the DTE Energy Board of Directors. 21
22
What is the comparative market for Executive compensation? 23
A75. The comparative market for Executive compensation consists primarily of utilities 24
(including utility holding companies), broad-based energy resource companies and 25

M. S. COOPER U-20836
Line
No.
MSC - 42
certain non-energy related companies selected on the basis of revenues, financial 1
performance, geographic location and availability of compensation information. 2
3
What are the key components of the Executive Compensation Program? 4
A76. The key elements of the Executive Compensation Program are base salary and 5
variable pay (annual incentive plan and long-term incentive awards). 6
7
How are Executive base salaries determined? 8
A77. Executive base salaries are targeted around the median of the comparative market. 9
Appropriate methods of measurement are used to take into account differences in 10
company size and scope. In addition, midpoints are established for those 11
Executives whose jobs cannot be easily matched in the comparative market. These 12
midpoints are designed to allow adequate differentiation for (i) individual potential, 13
(ii) contributions made, and (iii) the length of time the Executive has been in his or 14
her position and are assessed periodically to keep pace with market movement. 15
16
INCENTIVE COMPENSATION 17
What are you proposing regarding the level of incentive compensation expense 18
to be included in the Company’s revenue requirement? 19
A78. I am proposing that projected incentive compensation expense of $63.8 million 20
related to the Company’s short-term and long-term incentive compensation plans 21
be included in the revenue requirement adopted by the Commission in this 22
proceeding, as described in more detail below. 23
24

M. S. COOPER U-20836
Line
No.
MSC - 43
Is the Company requesting recovery in rates for all incentive compensation 1
expenses? 2
A79. No. The Company has excluded $10.1 million for DTE Energy’s Top Five 3
Executive Officers. This exclusion is reflected on Exhibit A-3, Schedule C19 as 4
supported by Witness Uzenski and has been excluded from the table reflected in 5
the response to Q101. 6
7
What is the basis for your proposed inclusion of $63.8 million of incentive 8
compensation expense in the Company’s revenue requirement? 9
A80. In summary, my proposal to include the Company’s projected incentive 10
compensation expense, exclusive of the portion related to the Named Executive 11
Officers, is based on the prevalence of incentive compensation programs and the 12
resultant need for the Company to have total compensation programs that enable it 13
to be competitive with other employers. 14
15
Are incentive compensation programs a typical element in compensation at 16
other companies? 17
A81. Yes. According to a 2021 study published by WorldatWork and Compensation 18
Advisory Partners, the vast majority of companies have both short-term and long-19
term incentive programs. (Incentive Pay Practices: Publicly Traded Companies, 20
July 2021, WorldatWork and Compensation Advisory Partners). Moreover, a 2018 21
study by Aon of U.S. Salary Increases shows that 90% of Power and Gas Service 22
providers utilized broad-based incentive compensation programs. 23
24

M. S. COOPER U-20836
Line
No.
MSC - 44
Does the Company’s incentive compensation program result in unreasonable 1
compensation? 2
A82. No. As explained above, the Company benchmarks its total compensation for both 3
Executive and non-executive employees against relevant peers, inclusive of 4
incentive compensation, establishing a mid-point salary range based on the median 5
market level. Moreover, based on a recent survey by Aon, the total compensation 6
of DTE Energy’s Executives is equal to the median of its peers based on Target 7
level performance, inclusive of the long-term incentive compensation. The 8
Company’s incentive compensation programs are merely a component of the total 9
compensation policies required for the Company to be competitive with its peers, 10
rather than a supplement. Indeed, in the absence of the incentive compensation 11
programs, total compensation for DTE Energy’s Executives would be substantially 12
less than its peers, since about 70% of total compensation is delivered through 13
variable pay programs, by both DTE and its peers. 14
15
How do the components of the Company’s total compensation practices 16
compare to the Company’s peers? 17
A83. Based on the Aon survey referenced above, a comparison of the relative magnitude 18
of the Company’s salary, short-term and long-term pay components for Executives 19
to the 50th percentile of its peers is reflected in Table 2. 20
21
22
23
24
25

M. S. COOPER U-20836
Line
No.
MSC - 45
1
2
3
4
5
6
7
8
9
10
11
12
What are the specific components of the Company’s incentive compensation 13
programs? 14
A84. The Company has incentive compensation plans for both its Executive and all other 15
non-represented employees. Short-term incentive plans are provided through the 16
Annual Incentive Plan (AIP) and Rewarding Employees Plan (REP). Additionally, 17
a multiple year incentive plan, which is available to all managers and above and up 18
to 10% of other eligible non-represented employees, is provided through the Long-19
Term Incentive Plan (LTIP). 20
21
What is the AIP? 22
A85. The AIP is a short-term variable pay program available to senior management level 23
employees to motivate performance. The 2021 AIP measures and weightings for 24
DTE Electric, other than Nuclear Generation, DTE Nuclear Generation, and DTE 25
Salary Salary
Short-Term Short-Term
Long-Term Long-Term
0%
20%
40%
60%
80%
100%
120%
DTE Peers
Target Executive Compensation Comparison

M. S. COOPER U-20836
Line
No.
MSC - 46
LLC are reflected on Exhibit A-21, Schedules K2 through K4. For each measure, a 1
Target is established for which a 100% payout will be earned. Performance less 2
than Target but above a minimum Threshold result in a payout between 25% of 3
Target and Target, and performance up to the Maximum level results in a payout 4
of up to 175% of Target for the AIP. 5
6
Which employee classification is eligible to participate in the AIP? 7
A86. All Executive level employees, generally Vice President and above, and Directors 8
participate in the AIP. All other non-represented employees are eligible to 9
participate in the REP. 10
11
What are the components of the REP? 12
A87. The REP is identical to the AIP except that Threshold performance is at 50% of 13
Target and the Maximum performance payout is 150% of Target. The 2021 REP 14
measures and weightings are reflected on Exhibit A-21, Schedules K2 through K4. 15
The Gallup survey of employee engagement measure is excluded from the REP in 16
recognition that the Company’s leadership is responsible for providing an 17
environment of high employee engagement. 18
19
What are the categories of measures included in the AIP and REP? 20
A88. There are four categories of measures in both the AIP and REP. Specifically, 21
Financial Performance, Customer Satisfaction, Safety & Engagement, and 22
Operating Excellence. 23
24
What are the financial measures included in the AIP? 25

M. S. COOPER U-20836
Line
No.
MSC - 47
A89. There are three financial measures for DTE Electric employees that are designed to 1
create a clear line of sight for all employees to focus on operating excellence by 2
rewarding employees when the Company is successful. 3
1) DTE Electric Operating Earnings objective is based on the Company 4
realizing the authorized return on equity by the Commission in its Order in 5
Case No. U-20561. 6
2) DTE Electric’s Cash from Operations is similarly based on the authorized 7
return on equity but reflects the higher capital expenditures arising from the 8
significant investments required to upgrade DTE Electric’s system. The 9
inclusion of a cash flow measure recognizes the importance of DTE Electric 10
maintaining a high credit rating to allow continued access to the capital 11
markets at reasonable costs and terms to ensure proper capital investment 12
to continue to serve our customers. 13
3) DTE Energy’s Earnings per Share measure is based on the high-end of 2021 14
earnings guidance. 15
Nuclear Generation Financial Performance measures consist of DTE Electric 16
Operating Earnings and Nuclear Generation Operation and Maintenance Expense. 17
The Financial Performance measures for DTE LLC reflect DTE Energy’s 18
Operating Earnings per Share and Cash from Operations. 19
20
What are the Customer Satisfaction measures? 21
A90. There are two customer satisfaction measures that are intended to focus employees 22
on improving the experience that our customers have in their interactions with the 23
Company. 24
25

M. S. COOPER U-20836
Line
No.
MSC - 48
1) The Net Promoter Score is a measure of the extent to which customers are 1
likely to recommend the Company to their friends and colleagues . 2
2) The MPSC Customer Complaints measure represents the number of formal 3
complaints made to the MPSC regarding DTE, as reported to the Company 4
by the MPSC. 5
6
What are the Safety & Engagement measures? 7
A91. The three Safety & Engagement measures encompass employee engagement as 8
measured by the Gallup survey and two employee safety related measures. 9
10
The Gallup measure of Employee Engagement is reflective of the direct correlation 11
between the level of active employee engagement and the performance of an 12
organization. The 2021 Target of 4.32 is based on continued top decile 13
performance compared to Gallup’s total database and actual results will be 14
determined based on a survey of employees by Gallup. Employee Engagement is 15
a statistically significant measure of the level of commitment employees have to an 16
organization’s success and is not merely a measure of employee satisfaction. 17
18
DTE Electric has two safety related measures. 19
1) Recordable injuries per 100 employees divided by the actual number of 20
hours worked, as defined by the Occupational Safety and Health 21
Administration (OSHA). This is a standard measure of safety performance 22
used nationwide. The measure is intended to create a heightened focus on 23
the importance of safety in the workplace. 24
25

M. S. COOPER U-20836
Line
No.
MSC - 49
2) OSHA Days Away, Restricted or Transferred (DART) rate. This measure 1
is calculated by taking the number of qualifying injuries per 100 employees 2
divided by the actual number of hours worked. 3
4
What are the Operating Excellence measures for 2021? 5
A92. DTE Electric has four Operating Excellence measures that reflect specific operating 6
priorities for 2021 to motivate the achievement of certain operating objectives 7
important to the Company, its customers, and the Commission. 8
9
1) The Fossil Power Plant Reliability measure reflects the percentage of time 10
the plants are not available for power production due to a random outage, 11
referred to as the Random Outage Factor (ROF). The 2021 Target is 6.8%, 12
which represents better than first quartile performance of the industry 13
benchmark, as compiled by the North American Electric Reliability 14
Corporation. 15
2) One measure of Electric Distribution Reliability is average number of 16
minutes per interruption for customers experiencing an interruption when 17
there is not a declared storm (Blue Sky Customer Average Interruption 18
Duration Index (CAIDI)). 19
3) The second measure of Electric Distribution Reliability is the System 20
Average Interruption Duration Index (SAIDI) exclusive of Major Event 21
Days (MEDs). 22
4) DTE Electric’s Operating Excellence measures also include the Nuclear 23
On-Line Unit Capability Factor (UCF), which is described below. 24
25

M. S. COOPER U-20836
Line
No.
MSC - 50
What are the operating measures applicable to the Nuclear Generation 1
business unit? 2
A93. Nuclear Generation has three Safety and Engagement related measures and four 3
Operating Excellence measures. 4
5
What are Nuclear Generation’s Safety and Engagement related measures? 6
A94. In addition to Employee Engagement, as measured by Gallup surveys, and the 7
OSHA Recordable Incident Rate, which have been described in the context of DTE 8
Electric, Nuclear Generation also uses the annual Total Industrial Safety Accident 9
Events (TISA Events), which is a nuclear industry measure that is aligned with the 10
Institute of Nuclear Power Operations, in lieu of the DART rate. The Threshold is 11
one incident and the Maximum is zero. 12
13
What are the Operating Excellence measures related to Nuclear Generation? 14
A95. Nuclear Generation has four Operating Excellence measures. 15
16
The first relates to On-Line UCF, which measures the percentage of time that Fermi 17
2 is available to generate power, exclusive of planned outages. The 2021 Target of 18
98.5% represents a performance level that is within the second quartile of the 19
Company’s peers. 20
21
The three additional Operating Excellence measures for nuclear generation include 22
a measure Operational Focus and indices that encompass Work Management and 23
Radiation Protection. 24
25

M. S. COOPER U-20836
Line
No.
MSC - 51
Are there other AIPs and REPs that impact DTE Electric’s expenses? 1
A96. Yes. In addition to the DTE Electric and Nuclear Generation measures described 2
above, there are also separate AIP and REP measures for corporate staff employees 3
at DTE LLC that provide services to all DTE Energy business units. The measures 4
of the DTE LLC reflect certain DTE Electric and Nuclear Generation measures, as 5
well as measures related to DTE Gas. The specific measures related to DTE 6
Electric and Nuclear Generation are reflected on Exhibit A-21, Schedule K-4. 7
8
What is the Company’s Long-Term Incentive Plan? 9
A97. The LTIP provides the opportunity for certain individuals to receive retention-10
oriented or performance-based rewards delivered via shares of DTE Energy 11
common stock, either through Restricted Stock or Performance Shares. While the 12
Restricted Stock generally vests based on the employees’ tenure, the final payout 13
of Performance Shares is based on the achievement of multiyear performance 14
objectives. Currently 30% of the value of awards is through Restricted Stock and 15
70% through grants of Performance Shares for executives and directors, while 16
100% of the awards to individuals below Director-level are through Performance 17
Shares. The objective in granting shares through this program is to both motivate 18
superior results as well as provide a means to retain key employees and is consistent 19
with the practices of a vast majority of surveyed companies, as reflected in the 20
WorldatWork and Compensation Advisory Partners study referenced in Q81. 21
22
What are the performance share measures used in the LTIP? 23
A98. The measures are shown on Exhibit A-21, Schedule K5. 24
25

M. S. COOPER U-20836
Line
No.
MSC - 52
What is the rationale for the use of these measures? 1
A99. These measures reflect the long-term financial performance of DTE Energy and are 2
intended to motivate employees of the individual operating companies, such as 3
DTE Electric, to keep in mind the role of their own contributions to the overall 4
long-term success of DTE. Accordingly, the predominate measure for DTE 5
Electric and DTE LLC (80% for both) is the total return to DTE Energy 6
shareholders (i.e., capital appreciation and dividends) relative to a group of peer 7
companies over the next three years. This three-year focus is designed to motivate 8
decisions and actions that produce sustainable benefits rather than short-term 9
actions that may entail long-term risks. The second financial measure included in 10
the LTIP that contributes 20% to the weighting for DTE Electric and DTE LLC is 11
the actual DTE Electric Average Return on Equity over a three-year period. The 12
focus on DTE Electric’s three-year return on equity provides a longer-term 13
emphasis that encourages sustained performance. 14
The LTIP also includes two operating measures for Nuclear Generation that relate 15
to a standard industry index measuring nuclear power plant performance and the 16
Nuclear On-Line UCF, which have weightings of 60% and 20% respectively. The 17
third Nuclear Generation measure relates to DTE Energy’s total return to 18
shareholders and is weighted 20%. 19
20
What is the basis for the costs of the LTIP? 21
A100. The LTIP costs incurred in 2020 pertain to the grants of Performance Shares and 22
Restricted Stock. The expense related to the Restricted Stock is not conditioned on 23
any Company performance measures but rather is exclusively based on the number 24
of shares granted at the date of grant. In contrast, Performance Shares expense is 25

M. S. COOPER U-20836
Line
No.
MSC - 53
based on the achievement of the predetermined performance objectives. The 1
recognized cost of Performance Shares is based on the number of shares granted at 2
the market price of DTE Energy’s common stock at the date of grant but with 3
adjustment in the number of shares based on actual performance. Witness Uzenski 4
describes the adjustment to the actual 2020 LTIP expense to normalize for the 5
impact of changes in DTE Energy’s stock price recognized in 2020. 6
7
What is the incentive compensation expense if all the Operating Targets are 8
achieved? 9
A101. The net expense to DTE Electric in the projected test period of the Company 10
achieving all of its Targets for the incentive compensation plans, exclusive of the 11
expense related to the Named Executive Officers, is $63.8 million. The table below 12
summarizes the expense for the projected test period by the nature of the plans, the 13
classification of the employees eligible and the basis of the metrics used. 14
15
16
17
18
LTIP AIP REP Total
(000's Omitted)
Financial
DTE Electric $6,492 $744 $7,177 $14,413
Nuclear Gen 266 89 836 1,191
DTE LLC 15,229 4,764 5,876 25,869
21,987 5,598 13,888 41,473
Operating
DTE Electric 0 657 6,335 6,992
Nuclear Gen 1,064 234 3,027 4,326
DTE LLC 0 5,137 5,834 10,972
1,064 6,029 15,196 22,290

M. S. COOPER U-20836
Line
No.
MSC - 54
Total
DTE Electric 6,492 1,402 13,511 21,405
Nuclear Gen 1,331 324 3,863 5,517
DTE LLC 15,229 9,901 11,710 36,841
$23,052 $11,627 $29,084 $63,763
1
Why do the expenses for DTE LLC represent a majority of the variable 2
compensation expenses? 3
A102. DTE LLC provides a variety of administrative and other services that are common 4
to both DTE Electric and DTE Gas for which the costs are billed to the operating 5
companies, as explained by Witness Uzenski. In addition, DTE LLC employs all 6
of the Executives of DTE Energy, including the Executives of DTE Electric. 7
8
How have you reflected the Operating Excellence measures related to DTE 9
Gas in the AIP and REP for DTE LLC? 10
A103. While the AIP and REP expenses allocated to DTE Electric in the historic period 11
from DTE LLC include some measures related to DTE Gas, the AIP and REP 12
weightings for DTE LLC have been adjusted to exclude the measures specifically 13
related to DTE Gas. 14
15
Do the amounts in Table 3 reflect that a portion of the Company’s incentive 16
compensation costs are capitalized? 17
A104. Yes. The amounts in Table 3 are net of the portion of AIP and REP costs related 18
to operating measures that will be capitalized. The LTIP amounts in Table 3 are 19
the total costs, with no reduction for the portion capitalized. These capitalization 20
assumptions are in recognition of the Commission’s exclusion from Net Plant of 21

M. S. COOPER U-20836
Line
No.
MSC - 55
the incentive costs capitalized related to financial measures in its Order in Case No. 1
U-20561, as more fully described by Witness Uzenski. 2
3
Are all incentive compensation costs dependent on the Company’s financial or 4
operating performance? 5
A105. No. As described earlier, a portion of the DTE Energy shares granted under the 6
LTIP are in the form of Restricted Stock. Unlike the Performance Shares, the cost 7
of Restricted Stock is not variable based on either the Company’s financial or 8
operating performance. The only contingency is that the employee forfeits the 9
Restricted Stock if they leave the Company, other than through retirement or the 10
event of death or disability of the employee. While Restricted Stock grants are 11
made under the LTIP, they are not regarded as incentive compensation. 12
Accordingly, the expense of $5.9 million related to Restricted Stock is excluded 13
from Table 3. 14
15
Has the Commission provided any criteria for the inclusion of incentive 16
compensation expense in the Company’s revenue requirements? 17
A106. Yes. The Commission has indicated in all its recent Orders that address the topic 18
of incentive compensation programs that recovery of such expenses is dependent 19
on a demonstration that the programs provide benefits to customers in excess of the 20
expense. 21
22
Have you performed an analysis of the customer benefits of the Company’s 23
incentive compensation programs? 24

M. S. COOPER U-20836
Line
No.
MSC - 56
A107. Yes. The Company performed a comprehensive analysis of the customer benefits 1
that would be derived from the achievement of the metrics included in the 2
Company’s incentive plans relative to their expense. This analysis, as reflected on 3
Exhibit A-21, Schedule K6, demonstrates that the total calculated customer benefit 4
of $105.6 million exceeds the total incentive compensation expense of $63.8 5
million by $41.8 million. 6
7
How did you calculate the interest cost savings from the retention of the 8
Company’s existing debt ratings? 9
A108. The primary benefit of achieving the Cash from Operations measure is the 10
Company maintaining its BBB+ debt rating from Standard & Poor’s and 11
comparable ratings by the other major debt rating firms. The current yield spread 12
between utility A rated bonds compared to BBB rated bonds is 22 basis points. 13
Based on the long-term debt included in the capital structure sponsored by 14
Company Witness Vangilder, a downgrade in the Company’s credit rating would 15
increase the Company’s annual interest costs by $18.5 million. 16
17
How have you quantified the benefits of the Nuclear Generation related 18
operating measures included in the LTIP? 19
A109. The benefits of two operating measures related to Nuclear Generation are based on 20
the achievement of Target performance for the Nuclear On-Line UCF, the means 21
of quantification of which is described below in the discussion of the Operating 22
Excellence measures. The customer benefits from achieving Target UCF 23
performance, which represents the most quantifiable component of the Nuclear 24

M. S. COOPER U-20836
Line
No.
MSC - 57
Generation measures, is allocated to the individual measures in proportion to the 1
costs of each measure. 2
3
What is the net customer benefit of the LTIP measures? 4
A110. As reflected on Exhibit A-21, Schedule K6, the quantifiable benefits of the 5
operating LTIP measures are $2.5 million compared to the cost of the LTIP 6
operating measures of $1.1 million, for a net customer benefit of $1.4 million. 7
While customer benefits of the LTIP financial measures are not readily 8
quantifiable, customers do realize a benefit from DTE Electric and DTE Energy 9
being financially healthy with access to the capital markets. 10
11
How are the benefits of the AIP and REP reflected on Exhibit A-21, Schedule 12
K6 computed? 13
A111. The benefits of the measures are computed based either on the avoided costs to the 14
Company, which results in lower future revenue requirements, or based on the 15
value to customers of improved performance. The reference points to determine 16
improvement are, in most instances, based on the Company’s actual performance 17
in the 2020 historical test year, but when 2020 results are not representative, a five-18
year average is used. In those instances in which the Company’s Targets are based 19
on superior performance relative to peers, then measures of peer performance are 20
used. The benefits of achieving Target performance are allocated between the AIP 21
and REP components based on the relative AIP and REP expense for each measure. 22
23
How did you quantify the benefit of achieving Target performance levels in 24
the Customer Satisfaction measures? 25

M. S. COOPER U-20836
Line
No.
MSC - 58
A112. The benefits of achieving the 2021 Target of 45% Net Promoter Score (NPS) are 1
based on the expectation that improvements in the NPS score will result in fewer 2
customer calls. The 2021 Target of 45% represents a 5% improvement relative the 3
2020 actual NPS and is expected to produce $5.5 million of customer benefits based 4
on avoided Company costs and customer costs. 5
The customer benefits of attaining Target performance for MPSC Customer 6
Complaints measure is based on the avoided costs to both the Company and its 7
customers based on the reduced time spent by employees and customers resolving 8
complaints for a total savings of $0.2 million. 9
While the total quantified benefits of $5.7 million related to the Customer 10
Satisfaction measures are slightly less than the related expense, there can be little 11
doubt that an emphasis among the Company’s employees on improving the 12
experiences customers have with the Company results in additional significant non-13
quantifiable benefits to both customers and the Commission. 14
15
How did you determine the benefits of the Employee Engagement measure? 16
A113. The quantifiable benefits of a highly engaged workforce are based on three critical 17
dimensions identified by Gallup: absenteeism, productivity, and safety incidents. 18
According to Gallup, a 0.1 improvement in the grand mean will result in a 3.1% 19
reduction in absenteeism, a 1.8% increase in productivity and a 3.8% reduction in 20
safety incidents. Compared to median level of Gallup survey results for other 21
companies, achievement of the 2020 Target Gallup survey results will generate 22
O&M savings at DTE Electric of $4.1 million, inclusive of savings allocated from 23
LLC and net of the savings capitalized. 24
25

M. S. COOPER U-20836
Line
No.
MSC - 59
What are the expected benefits of the Company achieving Target level 1
performance regarding the OSHA Recordable Incident Rate (RIR)? 2
A114. The benefits of achieving the OSHA Recordable Incident Rate (RIR) and the 3
Nuclear Total Industrial Safety Accident Rate goal are based on the estimated direct 4
costs of non-fatal incidents of $41,000, as developed by OSHA, and a study by 5
Liberty Mutual that estimates the indirect cost of an OSHA recordable is about 3.0 6
times the direct costs, results in a total cost of $169,000 per incident, in current 7
dollars. Based on Target level performance relative to the 75th percentile 8
performance of the Company’s peer group results in an estimated benefit of $4.7 9
million, net of the savings capitalized. Because the benefits of achieving the OSHA 10
RIR Target are similar to the OSHA DART and TISA Events, the benefit is 11
allocated in proportion to the costs of each related measures. 12
13
While the quantified savings of the safety related metrics are less than the related 14
costs, much like the customer service-related measures, the benefits of maintaining 15
an organizational focus on the safe operation of the Company’s system for the 16
benefit of its employees, customers, and the communities where the Company 17
operates are undoubtedly substantial. 18
19
How did you quantify the savings related to improvements in distribution 20
system reliability? 21
A115. The benefit of achieving the Blue Sky CAIDI of 103 minutes is based on comparing 22
the 2021 Target to the five-year average of Blue Sky CAIDI of 124 minutes, which 23
represents a reduction of 21 minutes, or almost 17%. The derivation of the benefits 24
to customers was determined based on the Interruptions Cost Estimation Calculator 25

M. S. COOPER U-20836
Line
No.
MSC - 60
as developed by Nexant, Inc. and the Lawrence Berkeley National Lab. A 1
reduction of 21 minutes in the Blue Sky CAIDI produces an annual customer 2
benefit of $41.0 million. The benefits of achieving Target performance in the Blue 3
Sky CAIDI measure have been allocated equally between the Blue Sky CAIDI and 4
SAIDI exclusive of MEDs measures due to the close relationship of each of these 5
measures to distribution system reliability. 6
7
How did you quantify the benefits of the Fossil Power Plant Reliability 8
measure? 9
A116. The benefit of the Fossil Power Plant Reliability measure reflects the impact of 10
decreasing the ROF from a five-year average of about 7.8% to the 2021 Target of 11
6.8%. The savings computed reflect the impact of the increases in power generation 12
relative to the avoided market energy purchases and increased capacity value. This 13
produces annual savings of $1.6 million. 14
15
What are the benefits of an increase in the Nuclear Power Plant Reliability? 16
A117. The benefits of an increase in the Nuclear Power Plant Reliability reflect an increase 17
from the On-Line UCF at Fermi 2 from the five-year average of 92.8% to the 2021 18
Target of 98.5%. Because Fermi 2 has the lowest marginal costs of production 19
within the DTE Electric fleet, increased utilization has a significant impact on the 20
overall cost of power generation. The savings computed are based on the 21
differential between Fermi 2’s marginal fuel costs and the average market price of 22
avoided energy purchases combined with increased capacity value for a total annual 23
savings of $16.7 million. These savings are allocated to the Nuclear related 24

M. S. COOPER U-20836
Line
No.
MSC - 61
operating measures included in the LTIP as well as to the AIP and REP measures 1
in proportion to the costs of each measure. 2
3
Have you quantified any additional savings related to the other Nuclear 4
Generation measures included in the AIP and REP and the Nuclear Industry 5
Index included in the Nuclear LTIP? 6
A118. No. The On-Line UCF measure represents the only quantifiable benefits of the 7
Company meeting its Target performance levels for Fermi 2. While there is 8
indisputable value in the various specific measures within the other Nuclear 9
measures, the benefits of Fermi 2 achieving its Target On-Line UCF level has been 10
attributed to these matrices and the Nuclear Industry Index. 11
12
What is your conclusion regarding the cost effectiveness of the Company’s 13
incentive compensation plans? 14
A119. While not every individual measure has quantified benefits in excess of the 15
incentive compensation expense of the related measure, it is clear that in aggregate, 16
the quantified customer benefits of the Company achieving Target performance 17
levels are substantially greater than the related expense. 18
19
Because the Company’s overall employee compensation approximates the market, 20
inclusive of incentive compensation and the quantified benefits exceed the 21
projected incentive compensation expense, the Company’s total incentive 22
compensation expense should be included in the revenue requirement adopted by 23
the Commission in this proceeding as a reasonable and prudently incurred expense. 24
25

M. S. COOPER U-20836
Line
No.
MSC - 62
Has the Commission recently addressed the issue of the inclusion of incentive 1
compensation expense in a utility’s revenue requirement? 2
A120. Yes. In its Order in DTE Gas Company’s most recent rate case the Commission 3
included only 20% of the expense related to the operating measures and concluded 4
that incentive compensation expense related to financial measures should not be 5
included in DTE Gas’s revenue requirement (Case No. U-20940, Order issued 6
December 9, 2021, pp 162-164). 7
8
Do you agree with the Commission’s exclusion of 80% of the incentive 9
compensation expense related to the operating measures? 10
A121. No. The Commission adopted the Attorney General’s proposal to include only 20% 11
of the incentive compensation expense related to the operating measures based on 12
an analysis described as being a five-year average of Target and above 13
performance. However, the Attorney General’s proposal was incorrect because the 14
20% failed to include the operating measures that were at the Maximum 15
performance level. The actual five-year average of operating measures in which 16
performance was Target and above was about 50%. More importantly, the 17
Commission’s adoption of the Attorney General’s proposal failed to recognize that 18
although certain measures may produce results less than Target, other measures can 19
produce results that are greater than Target. This is important because the AIP 20
provides for scaled payouts between 50% and 175% of Target and the REP provides 21
for scaled payouts between 25% and 150% of Target for performance between 22
Threshold and Maximum. Exclusive reliance on the number of measures at Target 23
represents a binary model that is based on a pass/fail test that fails to recognize the 24

M. S. COOPER U-20836
Line
No.
MSC - 63
gradients of performance between the Threshold and Maximum performance levels 1
and the resulting impact on the Company’s incentive compensation expense. 2
3
Have you computed the actual operating performance levels for the most 4
recent five-year period that recognizes the gradients of performance between 5
Threshold and Maximum levels? 6
A122. Yes. Exhibit A-21, Schedule K7, reflects the actual operating measures 7
performance for the years 2016 through 2020 for both the AIP and REP for all 8
employee groups. Exhibit A-21, Schedule K7 provides the actual performance 9
relative to not only Target levels, but also in relation to Threshold and Maximum 10
levels. 11
12
What conclusions do you draw from Exhibit A-21, Schedule K7? 13
A123. This exhibit shows that from 2016 through 2020, the AIP had achieved performance 14
in the operating measures of between 87.4% to 125.4% for an average over that 15
period of 100.9% whereas the REP had achieved performance of between 77.8% 16
and 107.6% for an average of 87.5%. The combined five-year average for both the 17
AIP and REP is 94.2%. These variations in actual performance in the operating 18
measures reflect the ambitious goals that are set each year to motivate ever 19
improving operating performance because, in most instances, the performance 20
Targets are increased each year from the prior year. 21
22
Do these percentages vary from the five-year average of operating 23
performance when the average of the measures at Target and above 24
performance is compared to the total measures? 25

M. S. COOPER U-20836
Line
No.
MSC - 64
A124. Yes. They vary significantly. The five-year average of measures with results at 1
Target and above relative to total measures for the AIP is 63.1% and for the REP is 2
59.6%, for a combined average of 61.3%, as reflected on lines 50 though 58 of 3
Exhibit A-21, Schedule K7. 4
5
Is the use of the average based on weighted performance of 94.2% a more 6
accurate measure of the level of incentive compensation expense that the 7
Company will incur in the projected test year than the simple average of 8
61.3%? 9
A125. Yes. Due to the scaled payouts for performance between Threshold and Maximum, 10
as described above, the use of the weighted performance average is more indicative 11
of the incentive compensation expense related to the operating measures the 12
Company will incur in the projected test year. Based on five-year average of the 13
weighted performance of 94.2%, it is reasonable to include 100% of the incentive 14
compensation expense related to the operating measures. Reliance on the weighted 15
measures is also consistent with all Commission Orders in DTE Electric and DTE 16
Gas rate cases that addressed this identical issue prior to the Order in Case No. U-17
20940. 18
19
Do you agree with the Commission’s conclusion regarding the financial 20
measures? 21
A126. No. The Commission apparently rejected the inclusion of the incentive 22
compensation expense related to the financial measures based, in part, by opining 23
that “DTE Gas’s mere contention that customers receive benefits from well-24
compensated employees is insufficient to demonstrate that incentive compensation 25

M. S. COOPER U-20836
Line
No.
MSC - 65
specifically tied to financial performance does not primarily benefit shareholders or 1
that such benefits to ratepayers are commensurate with the proposed expense”. 2
3
I disagree with the Commission’s conclusions for two reasons. First, because the 4
total quantified benefits of all measures exceed the aggregate expense, it is proper 5
to include all incentive compensation expense, including the portion related to the 6
financial measures. Second, as demonstrated earlier in my testimony, the 7
Company’s total compensation, inclusive of incentive compensation, is well 8
aligned with market medians. That alignment in compensation is required to enable 9
the Company to attract and retain qualified employees. The need to have 10
competitive compensation practices has never been more important than in today’s 11
environment in light of the increased challenges of both keeping existing and hiring 12
new employees. By focusing on the individual components of the Company’s 13
compensation programs, including incentive compensation, the importance of the 14
overall reasonableness of the Company’s compensation costs is lost. 15
16
Does this complete your direct testimony? 17
A127. Yes, it does. 18

STATE OF MICHIGAN
BEFORE THE MICHIGAN PUBLIC SERVICE COMMISSION
In the matter of the Application of )
DTE ELECTRIC COMPANY )
for authority to increase its rates, amend ) Case No. U-20836
its rate schedules and rules governing the )
distribution and supply of electric energy, and )
for miscellaneous accounting authority. )
QUALIFICATIONS
AND
DIRECT TESTIMONY
OF
JEFFREY C. DAVIS

DTE ELECTRIC COMPANY
QUALIFICATIONS AND DIRECT TESTIMONY OF JEFFERY C. DAVIS
Line
No.
JCD-1
Q1. What is your name, business address and by whom are you employed?1
A1. My name is Jeffrey C. Davis (he/him/his). My business address is: 6400 North 2
Dixie Highway, Newport, Michigan, 48166. I am employed by DTE Electric 3
Company at the Fermi 2 Nuclear Power Plant as Manager of Nuclear Strategy and 4
Business Support. 5
6
Q2. On whose behalf are you testifying? 7
A2. I am testifying on behalf of DTE Electric Company (DTE Electric or Company). 8
9
Q3. What is your educational background? 10
A3. I graduated from the University of Michigan with bachelor’s degrees in nuclear 11
engineering and radiological sciences (NERS) and engineering physics. I have also 12
earned a master’s degree and doctorate in NERS from the University of Michigan. 13
I am a member of the American Nuclear Society. 14
15
Q4. What is your DTE Electric work experience? 16
A4. I have been employed by DTE Energy since 2008. Prior to my current position, I 17
was a principal financial analyst with responsibility for budgeting, forecasting, and 18
reporting operations and maintenance (O&M) and capital expenditures for the 19
Nuclear Generation organization. 20
21
Q5. What is your current position? 22
A5. In 2015, I was promoted to the role of Manager – Nuclear Strategy and Business 23
Support with responsibility for developing the strategic financial plan and goals for 24
the Nuclear Generation organization. 25

J. C. Davis
Line U-20836
No.
JCD-2
Q6. Have you previously been involved in DTE Electric general rate case filings? 1
A6. I was the DTE Electric witness in support of nuclear fuel expenses, nuclear O&M 2
expenses, nuclear capital expenditures and the nuclear surcharge in the Company’s 3
most recent general rate cases: Case Nos. U-20162 and U-20561. I was also the 4
DTE Electric witness in support of nuclear generation for DTE Electric’s Power 5
Supply and Cost Recovery (PSCR) Reconciliation Case Nos. U-20203 and U-6
20528. In addition, I have provided support to other DTE Electric witnesses in 7
support of nuclear fuel expenses, nuclear O&M expenses and nuclear capital 8
expenditures in the following DTE Electric rate cases: Case Nos. U-16472, U-9
17767, U-18014 and U-18255.10

J. C. Davis
Line U-20836
No.
JCD-3
Purpose of Testimony 1
Q7. What is the purpose of your testimony?2
A7. The purpose of my testimony is to discuss and support the reasonableness of the 3
Company’s actual nuclear O&M and capital expenditures for the 12-month 4
historical test period ended December 31, 2020. I will also discuss and support the 5
reasonableness of the projected nuclear O&M and capital expenditures for the 6
bridge forecast period and the 12-month projected test period ending October 31, 7
2023. In addition, I will discuss and support the reasonableness of the projected 8
Nuclear Surcharge for the projected test period ending October 31, 2023. 9
10
Q8. Are you sponsoring any exhibits in this proceeding? 11
A8. Yes. I am sponsoring the following exhibits: 12
Exhibit Schedule Description 13
A-12 B5.3 Projected Capital Expenditures - Nuclear Production 14
Plant & Nuclear Fuel 15
A-13 C5.3 Projected Operation and Maintenance Expenses - 16
Nuclear Power Generation 17
A-13 C5.16 Nuclear Power Generation - Projected PERC O&M 18
Expenditures 19
A-20 J1 Proposed Nuclear Surcharge Projected Test Period – 12 20
Months Ending October 31, 2023 21
A-20 J2 DTE Electric Nuclear Decommissioning Study for the 22
Fermi 2 Power Plant 23
Q9. Were these exhibits prepared by you or under your direction? 24
A9. Yes, they were. 25

J. C. DAVIS
Line U-20836
No.
JCD-4
1
Q10. How do you plan to proceed with your testimony? 2
A10. I will begin my testimony with the Nuclear Generation capital expenditures; 3
discussing and supporting the actual capital expenditures for the historical test year 4
ended December 31, 2020, the projected capital expenditures for the bridge forecast 5
period and the 12-month projected test period ending October 31, 2023. I have 6
divided my Nuclear Generation capital expenditure discussion into four sections of 7
expenditures: Routine and Small Projects, Non-Routine and Large Projects, 8
Nuclear Fuel, and Allowance for Funds Used During Construction (AFUDC). 9
10
I will then discuss and support the actual O&M expenses for the historical test year 11
ended December 31, 2020 and the forecasted O&M expenses for the 12-month 12
projected test period ending October 31, 2023 for Nuclear Generation. I have 13
divided the Nuclear Generation O&M expenses discussion into three sections: rate 14
case adjustments, adjusted historical test period and projected adjustments. 15
16
I will then discuss and support the Nuclear Surcharge for the 12-month projected 17
test period ending October 31, 2023 for Nuclear Generation. 18
19
The Fermi 2 Power Plant is licensed by the Nuclear Regulatory Commission (NRC) 20
to operate through 2045. The capital and O&M expenditures discussed for the 21
historical and projected test periods throughout my testimony reflect appropriate 22
measures to ensure safe and reliable operation of the Fermi 2 Power Plant through 23
2045. 24
25

J. C. DAVIS
Line U-20836
No.
JCD-5
Nuclear Generation Capital Expenditures 1
Q11. Can you provide an outline of your Nuclear Generation capital expenditures 2
discussion? 3
A11. My testimony will begin with the 2020 – 2023 Capital Projects Overview and then 4
discuss and support the additional details regarding: 5
• Routine and Small Projects 6
• Non-Routine and Large Projects 7
• Total Nuclear Fuel 8
• AFUDC Forecast 9
10
2020 - 2023 Capital Projects Overview 11
Q12. Can you provide an overview of the Nuclear Generation capital expenditures 12
supported by your testimony? 13
A12. I refer you to Exhibit A-12, Schedule B5.3, page 1 which depicts the actual capital 14
expenditures for the historical test year ended December 31, 2020, projected capital 15
expenditures for the bridge forecast period and projected capital expenditures for 16
the 12-month projected test period ending October 31, 2023. 17
18
Total capital expenditures are composed of Routine and Small Projects, Non-19
Routine and Large Projects, and Total Nuclear Fuel. Nuclear Generation actual 20
capital expenditures for historical test year ended December 31, 2020 totaled 21
$271.6 million as shown on line 11, column (b) of the exhibit. Nuclear Generation 22
forecasts total capital expenditures for the projected bridge forecast period at 23
$450.4 million as shown on line 11, column (e) and for the 12-month projected test 24
period ending October 31, 2023 at $120.3 million as shown on line 11, column (f). 25

J. C. DAVIS
Line U-20836
No.
JCD-6
1
A portfolio of discrete projects and capital fuel expenditures provides the basis to 2
support the forecasted Total Capital Expenditures for January 1, 2021 through 3
October 31, 2023. 4
5
Q13. Before you discuss the discrete projects, can you summarize the principles and 6
conduct of asset maintenance at a nuclear generation unit such as Fermi 2? 7
A13. Nuclear safety is our overriding priority at Fermi 2 and, indeed, throughout the 8
nuclear industry. Our operational and strategic decisions preserve this priority. 9
10
Q14. What do you mean by nuclear safety? 11
A14. Nuclear safety is focused on ensuring that we maintain and operate the Fermi 2 12
nuclear asset with a high degree of rigor. Conservatism is necessary to minimize 13
risk and ensure the safe and reliable use of nuclear material. 14
15
Q15. How does DTE Electric manage nuclear safety risk? 16
A15. DTE Electric manages nuclear safety risk through proper training, procedures and 17
governance, operating the plant with a healthy focus on nuclear safety and 18
maintenance of the asset. 19
20
Q16. What are the key principles the DTE Electric organization uses for 21
maintaining the nuclear asset? 22
A16. I would summarize our key maintenance principles as: 23
1. Implementation of inspection, surveillance, maintenance and project activities 24
are proactive and condition- or time-based to preclude a failure. Unanticipated 25

J. C. DAVIS
Line U-20836
No.
JCD-7
equipment failures challenge plant operators; our strategies are designed to 1
minimize the probabilities of unanticipated equipment failures. 2
2. Work such as capital replacements and modifications are implemented when the 3
plant is in the safest condition to do so. For most of our work at Nuclear 4
Generation, that safest condition is when the Fermi 2 plant is shut down for a 5
refueling outage. 6
7
Q17. Why is it safest to perform maintenance on the Fermi 2 plant during a 8
refueling outage? 9
A17. Refueling outages are the safest time to perform maintenance for the following 10
reasons: 11
1. Nuclear safety - our operating license issued by the NRC requires the plant to be 12
shut down prior to taking many systems out of service for maintenance. These 13
licensing requirements align with minimizing risks to health and safety. 14
2. Personnel safety – many areas of the plant are behind locked doors during 15
operations due to the radiological or atmospheric conditions of the area. 16
Refueling outages offer opportunities to access these otherwise inhospitable 17
areas of the plant for maintenance. 18
19
Q18. What is the cadence for the Fermi 2 plant refueling outages? 20
A18. The Fermi 2 plant currently operates on an 18-month cycle, meaning every 18 21
months the Fermi 2 plant shuts down for a refueling outage. The Fermi 2 refueling 22
outages are numbered sequentially and named as such, so – our spring 2020 23
refueling outage, which was Fermi 2’s twentieth refueling outage, was named 24
Refueling Outage 20 or RF20 and Fermi 2’s twenty-first refueling outage scheduled 25

J. C. DAVIS
Line U-20836
No.
JCD-8
in the winter/spring of 2022 (approximately 18 months after RF20 concluded) is 1
named Refueling Outage 21 or RF21. 2
3
I note here RF21 will be the last refueling outage before Fermi 2 is scheduled to 4
begin 24-month operating cycles. Refueling Outage 22 (RF22) is scheduled for the 5
spring of 2024; subsequent refueling outages are scheduled for the spring of the 6
even numbered years. I will discuss the 24-month operating cycle in more detail 7
later in my testimony. 8
9
Q19. What is the typical planning cadence for a Fermi 2 plant refueling outage? 10
A19. Refueling outages are highly complex and require an integrated work plan to 11
execute thousands of activities in a relatively short duration. 12
13
Planning for a refueling outage is generally a two-year effort with many 14
intermediate milestones guiding the planning effort. The two most relevant of these 15
milestones for capital expenditures are (1) two years prior to the refueling outage 16
(T+24 months), Nuclear Generation confirms the Non-Routine and Large Projects 17
for implementation in the outage and (2) at one year prior to the refueling outage 18
(T+12 months), Nuclear Generation establishes for the Routine and Small Projects 19
the number of units to be completed in the outage. 20
21
Routine and Small Projects Capital Expenditures 22
Q20. Can you further explain the Routine and Small Projects summarized on line 2 23
of Exhibit A-12, Schedule B5.3, page 1? 24

J. C. DAVIS
Line U-20836
No.
JCD-9
A20. Routine and Small Projects are those capital expenditures associated with 1
maintaining the various assets that support the safe operation of the Fermi 2 asset 2
and includes work such as pump, motor, valve and reactor control component 3
replacements and can typically be expressed in number of units replaced. Routine 4
and Small Projects are reasonable and prudent because these types of projects are 5
the core of our proactive maintenance regime to maintain nuclear safety. 6
7
Pages 2-3 of Exhibit A-12, Schedule B5.3 provide a listing of the Routine and Small 8
Projects that support page 1, line 2. 9
10
Q21. Can you explain the Routine and Small Projects detailed in Exhibit A-12, 11
Schedule B5.3, pages 2-3? 12
A21. Exhibit A-12, Schedule B5.3, pages 2-3 shows the by-project capital expenditures 13
for Routine and Small Projects for the historical test year and the projected 14
expenditures for the 22-month bridge forecast period ending October 31, 2022 and 15
the 12-month projected test period ending October 31, 2023 which total $94.8 16
million, $115.8 million and $37.3 million respectively. 17
18
The expenditures and project make-up are consistent for the historical test year, 19
projected bridge forecast period and projected test period because of the regulatory 20
and safety requirements governing Routine and Small Projects. 21
22
23

J. C. DAVIS
Line U-20836
No.
JCD-10
Q22. Can you discuss the expenditures and rationale for the Visual Annunciator 1
System (VAS) Replacement project shown on Exhibit A-12, Schedule B5.3, 2
page 2, line 11? 3
A22. The Visual Annunciator System (VAS) capital expenditures for the historical test 4
year, projected bridge forecast period and projected test period are $3.4 million, 5
$9.7 million, and $0.0 million respectively. The purpose of this major plant 6
computer system that includes computer processors, circuit cards, labeled tiles 7
(visual displays), pushbuttons and auditory devices is to alert plant operators when 8
a process parameter or system condition is not normal; loss of the VAS would 9
jeopardize plant operator’s ability to safely operate the Fermi 2 plant. Just like any 10
computer, periodic replacement is necessary to address aging and obsolescence of 11
this key digital asset. DTE Electric expects the replacement of the nearly twenty-12
year-old VAS to complete during RF21. 13
14
Q23. Can you discuss the expenditures and rationale for the Security video server 15
system computer replacement project shown on Exhibit A-12, Schedule B5.3, 16
page 3, line 50? 17
A23. The security video server system computer replacement capital expenditures for the 18
historical test year, projected bridge forecast period and projected test period are 19
$0.0 million, $12.7 million and $12.1 million respectively. The purpose of this 20
major plant security system that includes computer servers, video cameras and 21
other detection devices is to alert plant security of security risks and to maintain 22
positive surveillance of the Fermi 2 Power Plant; loss of the plant’s security video 23
system would necessitate compensatory measures to ensure the physical security of 24
the Fermi 2 site. Just like any computer, periodic replacement is necessary to 25

J. C. DAVIS
Line U-20836
No.
JCD-11
address aging and obsolescence of this key digital asset. DTE Electric expects the 1
replacement of the nearly twenty-year-old security system to complete in 2023. 2
3
Non-Routine and Large Projects Capital Expenditures 4
Q24. Can you expand your discussion for the Non-Routine and Large Projects 5
summarized on line 3 of Exhibit A-12, Schedule B5.3, page 1? 6
A24. Non-Routine and Large Projects are large projects that are necessary to properly 7
maintain the Fermi 2 asset and are incremental to normal routine capital 8
expenditures. 9
10
Refer to Page 4 of Exhibit A-12, Schedule B5.3 for a listing of the projects that 11
support page 1, line 3. 12
13
Q25. Can you explain the Non-Routine and Large Projects detailed in Exhibit A-12, 14
Schedule B5.3, page 4? 15
A25. Yes. This exhibit shows the by-project capital expenditures for Non-Routine and 16
Large Projects, as noted by line 3 of Exhibit A-12, Schedule B5.3, page 1. These 17
projects for the historical test year, the projected expenditures for the 22-month 18
bridge forecast period ending October 31, 2022 and the 12-month projected test 19
period ending October 31, 2023 total $176.5 million, $211.7 million and $56.9 20
million respectively. 21
22
Q26. Referring to line 2 of Exhibit A-12, Schedule B5.3, page 4, what is a torus 23
structure? 24

J. C. DAVIS
Line U-20836
No.
JCD-12
A26. The torus is a donut-shaped containment structure designed to absorb excess 1
thermal energy and provide emergency water to the reactor core during a postulated 2
accident scenario. Located beneath the reactor vessel, the torus is a very large steel 3
pressure vessel with a major diameter of approximately 120 feet and the interior 4
cross-section of the torus has a diameter of approximately 30 feet. During normal 5
operations, the torus serves as a reservoir for approximately one million gallons of 6
radioactive water. The interior of the torus structure is characterized by confined 7
spaces, high temperatures, high humidity and high radiation. 8
9
Q27. Is the torus structure coated? 10
A27. A specialized torus coating protects the interior steel of the torus from corrosion. 11
The integrity of the torus coating serves a nuclear-safety function as the coating 12
must remain adhered to the torus shell during all design-basis operating parameters 13
so as to not delaminate and obstruct suction points for emergency water supplies 14
necessary to transfer water from the torus to the reactor core. 15
16
Q28. What has been DTE Electric’s maintenance and inspection history for the 17
torus containment structure coating? 18
A28. In 1989, during Fermi 2’s first refueling outage, inspections of the torus structure 19
coating revealed degradation regarding some submerged portions of the coating. 20
DTE Electric reviewed the degradation and concluded at the time that the coating 21
had adequate integrity, and that periodic inspections and repairs of the coating 22
would be a reasonable and prudent path-forward strategy. The NRC was informed 23
of DTE Electric’s approach and did not disagree. In 1991 the NRC documented its 24
inspection conclusions and stated that the coatings were performing satisfactorily, 25

J. C. DAVIS
Line U-20836
No.
JCD-13
and minor defects are being repaired as necessary. DTE Electric routinely 1
performed inspections and localized repairs of the coating during refueling outages 2
to ensure the continued integrity of the coating; however, during a 2019 NRC 3
review of the torus structure inspection reports, it determined that continuing the 4
inspection and repair regime on the original coating would no longer be an 5
acceptable strategy to ensure suction points for emergency water pumps would not 6
become obstructed from delaminated coatings and that replacement of the entire 7
submerged portions of the coating was more appropriate. 8
9
Q29. Can you explain the expenditures and rationale for the Torus Containment 10
Structure Coating Replacement project shown on line 2 of Exhibit A-12, 11
Schedule B5.3, page 4? 12
A29. Torus Containment Structure Coating Replacement project capital expenditures for 13
the historical test year, projected bridge forecast period and projected test period 14
are $100.6 million, $1.3 million and $0.0 respectively. The project’s capital 15
expenditures align to the forecasted project activities designed to complete the 16
replacement of the submerged portions of the torus containment structure coating 17
in RF20. To support safe operation of the Fermi 2 Power Plant and maintain 18
committed license basis assumptions, replacement of the torus containment 19
structure coating was reasonable and prudent. 20
21
Q30. What was the basis to replace the submerged portions of the torus containment 22
structure coatings in RF20? 23
A30. DTE Electric had a nuclear safety obligation to replace the torus coating in RF20 24
because DTE could not demonstrate with a high level of assurance that beyond 25

J. C. DAVIS
Line U-20836
No.
JCD-14
RF20, the submerged portions of the original torus coating – during an accident 1
scenario – could fulfill its nuclear-safety function. The NRC agreed with DTE 2
Electric’s plan to replace the submerged portions of the torus structure coating in 3
RF20, which created a regulatory obligation to perform the work. 4
5
Q31. What is involved in replacing the coating of the torus containment structure? 6
A31. As I discussed earlier, the interior of the torus structure itself is relatively 7
inhospitable to work in and is characterized by confined spaces, high temperature, 8
high humidity and high radiation. And recall, the torus is partially filled with about 9
one million gallons of water, and that water is radioactively contaminated. 10
11
Although DTE Electric, during refueling outages, routinely performs inspection 12
and remediation work in the torus structure using specialty divers, a full surface 13
torus structure coating replacement project is a once-in-a-plant-lifetime 14
undertaking. DTE Electric’s project plan had to coordinate the safe removal of the 15
approximately one million gallons of radioactively contaminated water from the 16
torus structure to other onsite storage capacity which included the construction of 17
temporary storage capacity of approximately 400,000 gallons – which is a major 18
undertaking in and of itself. DTE Electric’s project plan also had to address how to 19
mobilize, house and coordinate access of the hundreds of incremental workers 20
required to execute the project. DTE Electric’s project plan also had to address 21
mobilizing, staging and operating a wide array of equipment necessary to support 22
safety, habitability, confined-space rescue, power requirements as well as the 23
coating removal and coating application equipment. The execution of the torus 24

J. C. DAVIS
Line U-20836
No.
JCD-15
containment structure coating replacement project was further complicated by the 1
COVID-19 global pandemic. 2
3
Q32. Is the torus containment structure coating replacement project complete? 4
A32. Yes. The torus containment structure coating replacement project is complete as 5
the coating was replaced in RF20. The torus containment structure coating was 6
resolved to the satisfaction of DTE Electric and the NRC and will support safe and 7
reliable operations of the Fermi 2 Power Plant through the period of extended 8
operations ending in 2045. 9
10
Q33. Can you explain the expenditures and rationale for the Main Unit Generator 11
projects shown on line 3 and line 20 of Exhibit A-12, Schedule B5.3, page 4? 12
A33. The main unit generator projects are a series of replacements necessary to address 13
both an Original Equipment Manufacturer (OEM) design vulnerability and improve 14
overall reliability. These projects also support electrical grid reliability. 15
Replacement of this model of generator is the identical approach other nuclear 16
generation owners have taken to mitigate operational risk. To support reliable 17
operation of Fermi 2 through 2045, major refurbishments and replacement of the 18
existing generator asset is reasonable and prudent. 19
20
The Main Unit Generator Rotor Replacement project as depicted on line 20 is to 21
replace the existing rotor with a refurbished spare rotor. The generator rotor is 22
forecasted to be replaced in RF21 and has capital expenditures for the historical test 23
year, projected bridge forecast period and projected test period of $0.0 million, 24
$18.5 million and $0.0 million respectively. 25

J. C. DAVIS
Line U-20836
No.
JCD-16
1
The Main Unit Generator Replacement project as depicted on line 3 is to replace 2
the generator stator and rotor with a matched stator and rotor. This replacement is 3
projected to occur during RF22 and has capital expenditures for the historical test 4
year, projected bridge forecast period and projected test period of $26.6 million, 5
$39.8 million and $31.8 million respectively. 6
7
Q34. What is the basis to replace the Fermi 2 main unit generator rotor in RF21? 8
A34. The Midcontinent Independent System Operator (MISO) identified that Trenton 9
Channel Unit 9 would be designated as a System Support Resource unless an 10
alternative solution was identified to resolve violations of applicable reliability 11
criteria upon the unit’s retirement. Replacement of the existing Fermi 2 main unit 12
generator rotor (and the automatic voltage regulator (AVR) as shown on line 10 of 13
Exhibit A-12, Schedule B5.3, page 4) is required in conjunction with replacement 14
of Service System Transformer #65 and #69 (discussed later in my testimony) prior 15
to retirement of the Trenton Channel Power Plant in May of 2022 to resolve the 16
reliability issues that would otherwise occur. The existing Fermi 2 generator rotor 17
and AVR are not capable of generating sufficient reactive power to solve the 18
reliability issues identified by MISO. RF21 is the Company’s last window of 19
opportunity to replace the Fermi 2 generator rotor to maintain the Trenton Channel 20
Unit 9 planned retirement date of May 31, 2022. 21
22
Q35. What is the basis to replace the Fermi 2 main unit generator in RF22? 23
A35. The existing Fermi 2 generator (stator and rotor) is the original plant equipment, 24
manufactured in the early 1970s using the technology of that time. The equipment 25

J. C. DAVIS
Line U-20836
No.
JCD-17
is approaching end of life (EOL). To date, multiple known vulnerabilities and 1
degradation have been mitigated through increased maintenance bridging 2
strategies; however, design vulnerabilities associated with the stator continue to 3
represent increased risk for sudden failure. Sudden failures not only present a 4
generation risk but also present operational risk to the plant operators responsible 5
for maneuvering the plant to a shutdown condition following a generator failure. 6
7
DTE Electric had targeted to replace the Fermi 2 main unit generator in RF20; 8
however, the Company determined the replacement stator was not ready for 9
installation such that replacement of the stator could have increased operational 10
risks to the Fermi 2 plant. The Company was reasonable and prudent in 11
rescheduling the implementation of the generator replacement given the importance 12
of the generator to Fermi 2’s safe and reliable operation through 2045. 13
14
DTE Electric continues to work to complete the replacement stator and have the 15
replacement stator in a ready state. RF22 is the next planned opportunity following 16
RF21. Implementing the Main Unit Generator Replacement project in RF22 is a 17
reasonable and prudent projection provided the current state described above. The 18
Company has implemented and will continue to implement reasonable and prudent 19
bridging strategies to mitigate the short-term reliability risks associated with the 20
existing Fermi 2 main unit generator; however, understanding the importance of 21
this generator replacement ultimately to Fermi 2’s safe and reliable operation 22
through 2045, the Company is seeking to implement the Main Unit Generator 23
Replacement project in RF22. 24
25

J. C. DAVIS
Line U-20836
No.
JCD-18
Q36. Can you discuss the expenditures and rationale for the Service System 1
Transformer #65 and #69 Replacement project shown on line 4 of Exhibit A-2
12, Schedule B5.3, page 4? 3
A36. The Service System Transformer #65 and #69 (SST65 and SST69) capital 4
expenditures for the historical test year, projected bridge forecast period and 5
projected test period are $11.9 million, $16.5 million and $2.8 million respectively. 6
The purpose of SST65 and SST69 is to supply electrical loads to plant equipment 7
essential for safe plant operation. The SST65 is forecasted to be replaced in RF21 8
and SST69 is forecasted to be replaced in RF22. The transformers are being 9
replaced to ensure power supplied remains properly conditioned once Trenton 10
Channel Power Plant retires. The Midcontinent Independent System Operator 11
(MISO) identified that Trenton Channel Unit 9 would be designated as a System 12
Support Resource unless an alternative solution was identified to resolve violations 13
of applicable reliability criteria upon the unit’s retirement. Replacement of 14
transformers was the solution identified to resolve the reliability issues and is 15
required prior to the retirement of the Trenton Channel Power Plant in May of 2022. 16
17
Q37. Can you discuss the expenditures and rationale for the Underground Safety-18
Related Service Water Piping project shown on line 6 of Exhibit A-12, 19
Schedule B5.3, page 4? 20
A37. The Underground Safety-Related Service Water Piping capital expenditures for the 21
historical test year, projected bridge forecast period and projected test period are 22
$8.0 million, $21.6 million and $2.5 million respectively. The Underground Safety-23
Related Service Water Piping project will replace nuclear safety-related piping that 24
delivers cooling water to various components that support the operation of the 25

J. C. DAVIS
Line U-20836
No.
JCD-19
nuclear reactor. The replacement of the underground service water piping is 1
necessary to address normal age-related degrading pipe-wall thickness and to 2
ensure this pipe will continue to support plant operations through the end of the 3
operating license in 2045. 4
5
Q38. Can you discuss the expenditures and rationale for the Boraflex Fuel Storage 6
Racks project shown on line 8 of Exhibit A-12, Schedule B5.3, page 4? 7
A38. The Boraflex fuel storage racks capital expenditures for the historical test year, 8
projected bridge forecast period and projected test period are $4.0 million, $6.1 9
million and $2.4 million respectively. The Boraflex fuel storage racks project will 10
replace the end-of-life Boraflex spent fuel storage racks with new neutron-11
absorbing material. The replacement of the Boraflex storage fuel racks is necessary 12
to restore safety margins for the storage of the spent fuel through the end of the 13
operating license in 2045 and to ensure compliance with Fermi 2’s renewed 14
operating license. 15
16
Q39. Can you discuss the expenditures and rationale for the torus vent header 17
coating replacement project depicted on line 21 of Exhibit A-12, Schedule 18
B5.3, page 4? 19
A39. For clarity, the torus vent header coating replacement project is a distinct project 20
from the previously discussed torus containment structure coating replacement 21
project. The torus vent header coating replacement capital expenditures for the 22
historical test year, projected bridge forecast period and projected test period are 23
$0.0 million, $40.0 million and $0 million respectively. The torus vent header is a 24
ring header located within the torus structure and is designed to distribute 25

J. C. DAVIS
Line U-20836
No.
JCD-20
water/steam into the torus as steam is released from safety relief valves during a 1
postulated accident scenario; like the torus structure, the torus vent header has a 2
specialized internal coating to protect the torus vent header pipe from corrosion. 3
The torus vent header coating has reached the end of its useful life and requires 4
replacement. The torus vent header coating replacement project is a reasonable and 5
prudent project to replace the existing torus vent header coating with a qualified 6
replacement coating to support continued safe and reliable operations of the Fermi 7
2 Power Plant. 8
9
Q40. Can you discuss the expenditures and rationale for the drywell cooler projects 10
shown on lines 9, 12 and 17 of Exhibit A-12, Schedule B5.3, page 4? 11
A40. These drywell cooler projects are a series of drywell cooler replacements that we 12
have grouped by refueling outage implementation. The replacement of these 13
coolers is necessary to address the normal end of life status of these coolers which 14
are original plant equipment. Fermi 2 has 14 drywell coolers which provide the 15
containment structure that surrounds the reactor with atmospheric cooling during 16
normal operations. 17
18
Drywell Coolers #10 and #14, as depicted on line 9, were replaced in RF20 in the 19
spring of 2020 and have capital expenditures for the historical test year, projected 20
bridge forecast period and projected test period of $2.4 million, $0.4 million and 21
$0.0 million respectively. 22
23
Drywell Coolers #12 and #13, as depicted on line 12, are forecasted to be replaced 24
in RF21 and have capital expenditures for the historical test year, projected bridge 25

J. C. DAVIS
Line U-20836
No.
JCD-21
forecast period and projected test period of $1.8 million, $5.7 million and $0.0 1
million respectively. 2
3
Drywell Cooler #8 is depicted on line 17, is also forecasted to be replaced in RF21 4
and has capital expenditures for the historical test year, projected bridge forecast 5
period and projected test period of $0.1 million, $3.8 million and $0.0 million 6
respectively. 7
8
Q41. Do any of the projects listed in Exhibit A-12, Schedule B5.3, pages 2-4 contain 9
contingency amounts? 10
A41. No. The capital expenditures as shown in Exhibit A-12, Schedule B5.3, pages 2-4 11
do not include contingencies. 12
13
Q42. How does Nuclear Generation organization manage its capital expenditures 14
without contingencies? 15
A42. Nuclear Generation manages to total capital expenditures for the period and expects 16
that capital expenditures in total will be incurred as projected. In general, Nuclear 17
Generation maintains a prioritized list of projects such that as project forecasts are 18
over or under expected amounts, Nuclear Generation uses this this prioritized list 19
consistent with the key principles I described earlier to manage the Nuclear 20
Generation portfolio of projects. 21
22
Nuclear Fuel Capital Expenditures 23
Q43. Can you explain Total Nuclear Fuel summarized on line 10 of Exhibit A-12, 24
Schedule B5.3, page 1? 25

J. C. DAVIS
Line U-20836
No.
JCD-22
A43. Yes. Total Nuclear Fuel includes those capital expenditures for the various 1
components of the nuclear fuel cycle: (1) Uranium, (2) Conversion, (3) Enrichment 2
and (4) Fabrication. 3
4
Uranium refers to the costs associated with mining and milling uranium. Natural 5
uranium is obtained from the exploration and mining of uranium ore. Milling is the 6
mechanical and chemical process of extracting uranium from the mined ore in the 7
form of U3O8, commonly referred to as yellowcake. The U3O8 is the feed material 8
for the conversion process. 9
10
Conversion refers to the costs associated with chemically converting U3O8 into 11
UF6, uranium hexafluoride. The UF6 is the gaseous compound used as a feed in 12
the enrichment process. 13
14
Enrichment refers to the costs to enrich the uranium from a natural 0.7% U235 15
content to a 4% to 5% U235 content required for light water reactor fuel. The 16
enriched UF6 is used as a feed in the fabrication process. 17
18
Fabrication refers to the chemical conversion of the enriched UF6 to UO2 (uranium 19
dioxide) powder which is then pressed and sintered into hard ceramic fuel pellets 20
that are loaded into long, narrow zirconium alloy tubes called fuel rods; fuel rods 21
are then assembled into fuel bundles using spacers and end fittings to hold the fuel 22
rods together. The Fermi 2 reactor core requires 764 of these fuel bundles to 23
operate. 24
25

J. C. DAVIS
Line U-20836
No.
JCD-23
The amount of fuel purchased is determined by the design of the fuel and by the 1
expected generation during the life of the fuel. Nuclear fuel capital expenditures 2
were developed on the basis that Fermi 2 will transition from its current 18-month 3
operating cycle to a 24-month operating cycle following RF21 in winter/spring of 4
2022. 5
6
Q44. Can you explain the Total Nuclear Fuel expenditures as shown on Exhibit A-7
12, Schedule B5.3, page 1, line 10? 8
A44. Yes. The Total Nuclear Fuel capital expenditures for the historical test year, 9
projected bridge forecast period and projected test period are $0.3 million, $122.9 10
million and $26.1 million respectively and are consistent with Fermi 2’s projections 11
in the Company’s 2022 PSCR Plan in Case No. U-21050. 12
13
Q45. Can you explain why Total Nuclear Fuel expenditures vary from year-to-year? 14
A45. Yes. Total Nuclear Fuel expenditures vary from year-to-year because Fermi 2 15
currently operates on an 18-month fuel cycle and fuel costs are fixed in time relative 16
to that 18-month fuel cycle (most nuclear fuel capital expenditures occur 17
approximately six months prior to a refueling outage); therefore, Total Nuclear Fuel 18
capital expenditures have oscillated on a three-year pattern but as Fermi 2 19
transitions to a 24-month cycle at the conclusion of RF21 the Total Nuclear Fuel 20
capital expenditures can be expected to oscillate on a two-year pattern. 21
22
Q46. How would you characterize the level of expenditures for Fermi 2’s Total 23
Nuclear Fuel? 24

J. C. DAVIS
Line U-20836
No.
JCD-24
A46. I believe Fermi 2’s fuel expenditures are reasonable and prudent. I expect fuel 1
expenditures to continue to be reasonable as the Company has secured contracts for 2
uranium, conversion, enrichment and fabrication through the projected test period 3
ending October 31, 2023. 4
5
AFUDC Forecast 6
Q47. Can you explain the Allowance for Funds Used During Construction (AFUDC) 7
as shown in Exhibit A-12, Schedule B5.3, page 5? 8
A47. Nuclear Generation capital expenditures include an Allowance for Funds Used 9
During Construction (AFUDC) for eligible projects that are in Construction Work 10
in Progress (CWIP); eligible projects are those projects greater than $50,000 and 11
lasting more than six months. The actual historical period Total AFUDC – Nuclear 12
Production Plant was $11.0 million as shown in Exhibit A-12, Schedule B5.3, page 13
5, line 25, column (b). The forecasted Total AFUDC – Nuclear Production Plant 14
for the projected test period is $13.3 million as shown in Exhibit A-12, Schedule 15
B5.3, page 5, line 25, column (c). 16
17
Q48. How did you forecast the AFUDC as shown in Exhibit A-12, Schedule B5.3, 18
page 5? 19
A48. The Nuclear Production Plant – Routine Expenditures AFUDC forecast uses a 20
historical trend to estimate AFUDC as the mix of eligible projects is fairly 21
consistent year-to-year. The Nuclear Production Plant – Project Specific AFUDC 22
forecast explicitly calculates AFUDC for eligible projects using project-specific 23
CWIP balances multiplied by the AFUDC rate where the AFUDC rate is the 24

J. C. DAVIS
Line U-20836
No.
JCD-25
authorized cost of capital rate of 5.463% consistent with the May 8, 2020 Case No. 1
U-20561 rate order. 2
3
2020 – 2022 Capital Projects Summary 4
Q49. What is your opinion regarding the reasonableness of the forecasted capital 5
expenditures for Nuclear Generation? 6
A49. I believe the forecasted capital expenditures for Nuclear Generation are reasonable 7
and prudent. I believe the forecast as depicted by line 11 of Exhibit A-12, Schedule 8
B5.3, page 1, accurately represents the capital expenditures that can reasonably be 9
expected to continue operation of nuclear assets of similar age and vintage. My 10
summation of projects reflects DTE Electric’s commitment to ensure the safe and 11
reliable operation of Fermi 2 through its current operating license expiration in 12
2045. As I have expressed previously, these capital expenditures are prudent and 13
reasonable given the regulations, goals and conditions under which Fermi 2 14
operates. 15
16
Nuclear Generation O&M Expense 17
Q50. Can you provide an outline of your Nuclear Generation O&M discussion? 18
A50. Yes. My testimony will begin with the O&M Expenses Overview and then discuss 19
and support the additional details regarding: 20
• Rate Case Adjustments 21
• Adjusted Historical Test Period 22
• Projected Adjustments 23
24

J. C. DAVIS
Line U-20836
No.
JCD-26
O&M Expenses Overview 1
Q51. Can you provide an overview of the Nuclear Generation O&M expenses 2
supported by your testimony? 3
A51. Exhibit A-13, Schedule C5.3, page 1, line 24 from left to right depicts the O&M 4
expenses for the 12-month historical test period ended December 31, 2020, 5
adjustments to the historical test period and then the forecasted O&M expenses for 6
the 12-month projected test period ending October 31, 2023. 7
8
The actual O&M expenses by FERC account for the 12-month historical test period 9
ended December 31, 2020 were $245.7 million as shown in column (c). Rate case 10
adjustments are made in column (d) to reduce O&M by $27.8 million to account 11
for the Nuclear Surcharge, in column (e) to reclassify Project Evaluation Review 12
Committee (PERC) nuclear O&M project expenditures and in column (f) to reduce 13
O&M by $25.0 million to account for 2020 COVID-19 expenditures not projected 14
to occur within the projected test period. Note: DTE Electric expects to incur 15
COVID-19 expenses in support of safely executing RF21; however, these expenses 16
will occur prior to the projected test period and, as such, are not included in the test 17
period projections. These rate case adjustments result in $192.9 million of adjusted 18
O&M for the 2020 historical test period as shown in column (g). 19
20
Projected adjustments of $5.2 million, $5.1 million and $4.3 million in columns (h), 21
(i) and (j) respectively account for inflation. The $14.4 million decrease in column 22
(k) is subtracted to account for outage accrual adjustments and O&M is adjusted by 23
$5.3 million in column (l) to account for the total PERC expense in the forecasted 24
test period as supported by calculations performed by Company Witness Uzenski. 25

J. C. DAVIS
Line U-20836
No.
JCD-27
These projected adjustments yield a total change of $5.5 million as shown in 1
column (m). 2
3
With the above adjustments, the forecasted O&M expenses for the 12-month 4
projected test period are $198.4 million as shown in column (n). 5
6
Q52. What projected Total Nuclear Power Generation O&M expenses are you 7
supporting? 8
A52. I am supporting projected Total Nuclear Power Generation O&M expenses of 9
$198.4 million as shown in Exhibit A-13, Schedule C5.3, line 24, column (n) as 10
reasonable and prudent. 11
12
Rate Case Adjustments 13
Q53. Can you explain the basis for the Rate Case Adjustments in column (d) of 14
Exhibit A-13, Schedule C5.3, page 1? 15
A53. Site security and radiation protection costs were removed from base rates and 16
recognized in the Nuclear Surcharge as established in DTE Electric Case No. U-17
14399. The Nuclear Surcharge reduction of $27.8 million as summed on line 24, 18
column (d) accomplishes this requirement. The complete elimination of all 19
financial statement impacts of the Nuclear Surcharge are supported by Witness 20
Uzenski. 21
22
Q54. Can you explain the basis for the Rate Case Adjustments in column (e) of 23
Exhibit A-13, Schedule C5.3, page 1? 24

J. C. DAVIS
Line U-20836
No.
JCD-28
A54. The Reclassify PERC adjustment nets to zero as shown on line 24, column (e). This 1
reclassification is performed to make explicit the $11.6 million PERC Base 2
Expense shown on line 21, column (e) and the $12.3 million of PERC Regulatory 3
Asset amortization shown on line 22, column (e) are not inflated in the projected 4
adjustments. I will explain the PERC Regulatory Asset mechanism later in my 5
testimony. 6
7
Adjusted Historical Test Period 8
Q55. Can you explain the components that constitute the actual Total Nuclear 9
Power Generation O&M expenses for adjusted historical test period in line 24, 10
column (f) of Exhibit A-13, Schedule C5.3, page 1? 11
A55. Total Nuclear Power Generation O&M of $192.9 million consists of the Nuclear 12
Organization, PERC Base Expense, amortization of the PERC Regulatory Asset, 13
regulatory assessments and dues, and refueling outage expenses. I detail these 14
expenses for the 2020 historical period on page 2 of Exhibit A-13, Schedule C5.3. 15
16
Q56. What is the need for and basis of the “Nuclear Organization” expenses that 17
are included in the 2020 historic period for Operation and Maintenance 18
Expenses on Exhibit A-13, Schedule C5.3, page 2, line 1? 19
A56. Nuclear Organization expenses are the baseline employee, services and material 20
expenses required to safely and reliably operate Fermi 2. The Nuclear Organization 21
expenses for the historical test period ended December 31, 2020 were $127.3 22
million. 23
24

J. C. DAVIS
Line U-20836
No.
JCD-29
Q57. What is the need for and basis for the “PERC Base Expense” expenses that 1
are included in the 2020 historic period for Operation and Maintenance 2
Expenses on Exhibit A-13, Schedule C5.3, page 2, line 2? 3
A57. As explained and supported by Witness Uzenski, the Commission Order in Case 4
No. U-18014 approved an annual base level of PERC expenses of $4.9 million for 5
nuclear O&M projects and the Commission Order in Case No. U-20561 increased 6
the approved annual base level of PERC expenses to $15.0 million; the PERC Base 7
Expense of $11.6 million depicted on line 2 recognizes those approvals. 8
9
Q58. What is the need for and basis for the “Reg Asset Amortization - PERC” 10
expenses that are included in the 2020 historic period for Operation and 11
Maintenance Expenses on Exhibit A-13, Schedule C5.3, page 2, line 3? 12
A58. As explained and supported by Witness Uzenski, the Commission Order in Case 13
No. U-18014 approved a regulatory asset for annual PERC projects O&M 14
expenditures that exceed the annual base level of PERC expenses of $4.9 million 15
for nuclear O&M projects. In Case No. U-20561, the Commission Order updated 16
the approved regulatory asset for annual PERC projects O&M expenditures that 17
exceed the annual base level of PERC expenses of $15.0 million for nuclear O&M 18
projects. Order U-18014 established the amortization period of this regulatory asset 19
as five years. Consistent with that order, the $12.3 million depicted on line 3 is the 20
amount of the PERC Regulatory Asset amortized in 2020. 21
22
Q59. What is the need for and basis for the “Regulatory Assessments and Dues” 23
expenses that are included in the 2020 historic period for Operation and 24
Maintenance Expenses on Exhibit A-13, Schedule C5.3, page 2, line 4? 25

J. C. DAVIS
Line U-20836
No.
JCD-30
A59. A majority of these assessments and dues are regulatory driven, such as those 1
assessments and dues required by the NRC to cover oversight of the plant. In 2
addition, assessments and dues are associated with licensing requirements 3
including the Emergency Response Organization (ERO) and various industry 4
groups. 5
6
Industry groups include the Institute of Nuclear Power Operations (INPO), which 7
assists utilities in operating nuclear plants to the highest safety standards, the 8
Nuclear Energy Institute (NEI), which assists in common issues impacting the 9
nuclear industry, the Electric Power Research Institute (EPRI) and the General 10
Electric Boiling Water Reactor Owners’ Group, both of which sponsor research 11
that is used by nuclear plants to operate more safely and economically. 12
13
The ERO supports the Fermi 2 Emergency Plan which is a license requirement 14
necessary to ensure the health and safety of the public during emergency response 15
events. The ERO funds federal, state and local county emergency facilities in 16
support of the Fermi 2 Emergency Plan. 17
18
Q60. Which assessments and dues are non-discretionary (i.e. mandated)? 19
A60. NRC, INPO and ERO assessments and dues are non-discretionary. 20
21
Q61. Why does the Company pay the discretionary assessments and dues? 22
A61. Although not specifically mandated, voluntary participation with organizations 23
such as EPRI and NEI are critical within a nuclear business model. In particular, 24
organizations like EPRI that support research and development include sharing of 25

J. C. DAVIS
Line U-20836
No.
JCD-31
products and services to ensure nuclear asset owners benefit as a whole from shared 1
information. These products and services would be unaffordable without group 2
participation and funding. The role provided by NEI is valuable to plant owners 3
and operators in helping to shape important industry issues and regulation through 4
a coordinated and solidified approach. The nuclear industry clearly recognizes that 5
any one plant can abruptly upset the entire industry due to performance issues. As 6
a result, this industry believes in significant group participation and knowledge 7
sharing to help preclude such an event. 8
9
Q62. What is the need for and basis for “Total Refueling Outage” expenses for the 10
2020 historical period on Exhibit A-13, Schedule C5.3, page 2, line 10? 11
A62. As discussed earlier in my testimony, the Fermi 2 plant operates on an 18-month 12
refueling cycle such that every 18 months Fermi 2 shuts down to refuel the reactor. 13
The “Total Refueling Outage” expenses are those costs necessary to (1) refuel the 14
Fermi 2 reactor and (2) perform offline maintenance to ensure Fermi 2 can operate 15
safely and reliably for the next operating cycle. 16
17
The “Total Refueling Outage” expense consists of the actual refueling outage costs 18
(line 7), the refueling outage accrual (line 8) and the refueling outage accrual 19
reversals (line 9) for the 2020 historical period. Line 10 nets these three components 20
and represents an accounting practice of levelizing incremental refueling expenses 21
by accruing the anticipated refueling expenses over the term of an operating cycle. 22
23
Q63. Why does DTE Electric levelize its incremental refueling outage expenses? 24

J. C. DAVIS
Line U-20836
No.
JCD-32
A63. DTE Electric levelizes its incremental refueling outage expenses so that the 1
difference in expense between outage and non-outage years does not burden DTE 2
Electric customers with large rate fluctuations or create financial swings for the 3
Company. For example, if the Company bases the rate request on the projections 4
for a refueling outage year and all the expenses of that outage appear in that year’s 5
projections, then the Company would be presenting an unnecessarily high cost of 6
providing Fermi 2 generation over the period the rates are in effect. The inverse is 7
also true if the Company used a non-refueling outage year projection for the same 8
purpose. This is consistent with the treatment in prior cases where the Commission 9
has allowed levelized refueling outage expenses in setting rates. 10
11
Q64. What is the basis for the “Refuel Outage” expense at $51.8 million for the 2020 12
historical period shown on Exhibit A-13, Schedule C5.3, page 2, line 7? 13
A64. This is the actual refuel outage expenditures incurred in the 2020 historical period 14
for RF20. 15
16
Q65. How does DTE Electric manage incremental refueling outage expenses? 17
A65. The Company manages incremental expenses through structured planning and 18
preparation that is consistent with industry standards and processes. We 19
implemented rigorous financial controls that supported daily management of 20
resources during the execution phase of the refueling outage. This management of 21
resources includes daily reviews of scope completion, schedule and budget. As 22
work completes, contracted resources exit promptly from the site to ensure that 23
costs are controlled. 24
25

J. C. DAVIS
Line U-20836
No.
JCD-33
Q66. What is the basis for the “Refuel Outage Accrual” expenses at $39.3 million 1
for the 2020 historical period shown on Exhibit A-13, Schedule C5.3, page 2, 2
line 8? 3
A66. This is the actual amount accrued in the historical period for RF20 and RF21 and 4
were consistent with projected RF20 and RF21 expenditures. 5
6
Q67. What is the basis for the “Refuel Outage Reversal” of $62.2 million for the 7
2020 historical period shown on Exhibit A-13, Schedule C5.3, page 2, line 9? 8
A67. This is the actual amount of outage accrual that had been accrued in advance for 9
RF20 and credited to O&M in the historical test period to offset the $51.8 million 10
of actual RF20 refuel outage expenditures shown on line 7 and discussed above. 11
12
Projected Adjustments 13
Q68. Can you explain the basis for the inflation adjustments in columns (g), (h) and 14
(i) on line 24 of Exhibit A-13, Schedule C5.3, page 1? 15
A68. The labor and material prorated inflation adjustment rates of 3.1% for 2021, 2.9% 16
for 2022 and 2.9% for 2023 are supported by the testimony of Witness Uzenski. 17
Nuclear Generation applied these forecasted inflation rates to the adjusted historical 18
test period costs in column (g). 19
20
Q69. Can you explain the basis for the Outage Accrual adjustment in column (k) on 21
line 24 of Exhibit A-13, Schedule C5.3, page 1? 22
A69. The Outage Accrual adjustment is to normalize the outage accrual for the projected 23
test period to approximately $17 million. This Outage Accrual adjustment reflects 24
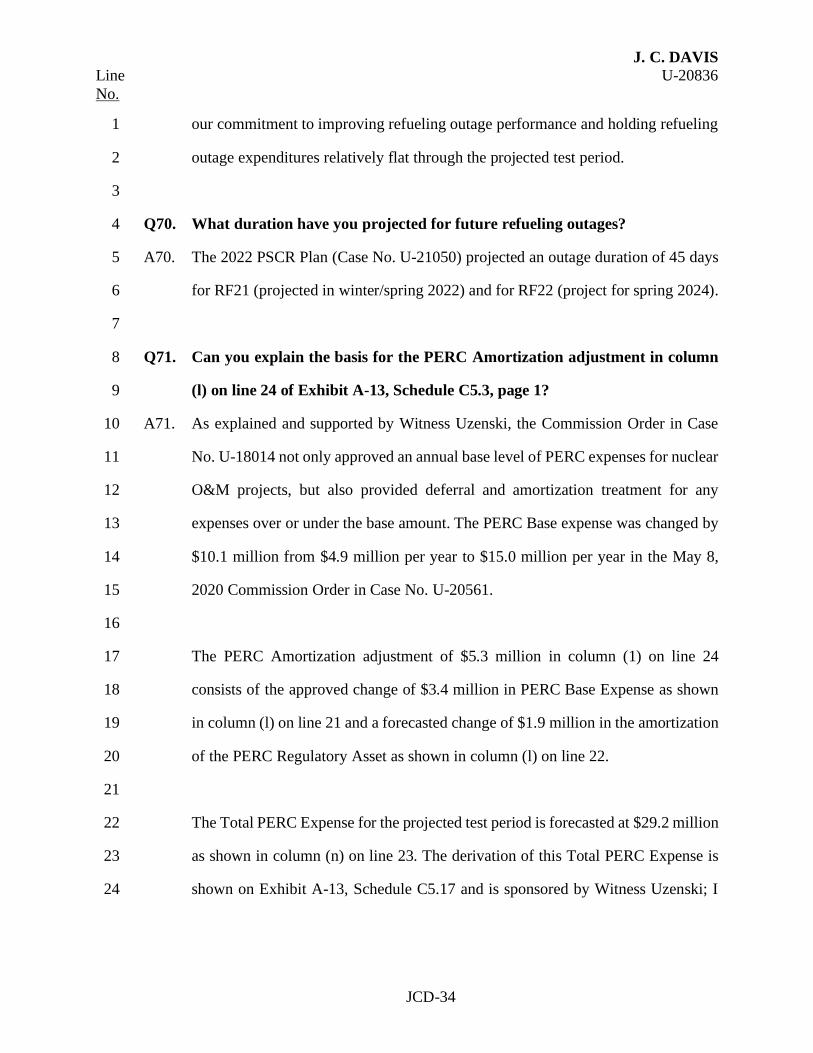
J. C. DAVIS
Line U-20836
No.
JCD-34
our commitment to improving refueling outage performance and holding refueling 1
outage expenditures relatively flat through the projected test period. 2
3
Q70. What duration have you projected for future refueling outages? 4
A70. The 2022 PSCR Plan (Case No. U-21050) projected an outage duration of 45 days 5
for RF21 (projected in winter/spring 2022) and for RF22 (project for spring 2024). 6
7
Q71. Can you explain the basis for the PERC Amortization adjustment in column 8
(l) on line 24 of Exhibit A-13, Schedule C5.3, page 1? 9
A71. As explained and supported by Witness Uzenski, the Commission Order in Case 10
No. U-18014 not only approved an annual base level of PERC expenses for nuclear 11
O&M projects, but also provided deferral and amortization treatment for any 12
expenses over or under the base amount. The PERC Base expense was changed by 13
$10.1 million from $4.9 million per year to $15.0 million per year in the May 8, 14
2020 Commission Order in Case No. U-20561. 15
16
The PERC Amortization adjustment of $5.3 million in column (1) on line 24 17
consists of the approved change of $3.4 million in PERC Base Expense as shown 18
in column (l) on line 21 and a forecasted change of $1.9 million in the amortization 19
of the PERC Regulatory Asset as shown in column (l) on line 22. 20
21
The Total PERC Expense for the projected test period is forecasted at $29.2 million 22
as shown in column (n) on line 23. The derivation of this Total PERC Expense is 23
shown on Exhibit A-13, Schedule C5.17 and is sponsored by Witness Uzenski; I 24

J. C. DAVIS
Line U-20836
No.
JCD-35
detail the projects comprising line 2 of Exhibit A-13, Schedule C5.17 in Exhibit A-1
13, Schedule C5.16, page 1. 2
3
Q72. Can you explain the Total PERC O&M Expenditures detailed in Exhibit A-4
13, Schedule C5.16, page 1? 5
A72. This exhibit shows the by-project PERC O&M expenditures for the 2020 historical 6
period and projected Calendar Years 2021, 2022 and 2023 planned expenditures 7
totaling $31.3 million, $15.0 million, $24.7 million and $17.0 million respectively. 8
9
Q73. How do the Total PERC O&M Expenditures on line 26 of Exhibit A-13, 10
Schedule C5.16, page 1 relate to Exhibit A-13, Schedule C5.17? 11
A73. As an example, the actual total PERC O&M expenditures of approximately $31.3 12
million for Calendar Year 2020 shown in Exhibit A-13, Schedule C5.16, page 1, 13
line 23, column (b) flows to Exhibit A-13, Schedule C5.17, page 1, line 2, column 14
(c). 15
16
Q74. How does the PERC amortization expense on line 13 of Exhibit A-13, Schedule 17
C5.17, page 1 relate to Exhibit A-13, Schedule C5.3, page 1? 18
A74. Exhibit A-13, Schedule C5.17 shows the calculation for PERC amortization that 19
was derived from Exhibit A-13, Schedule C5.16, Page 1. Exhibit A-13, Schedule 20
C5.17, page 1, line 13, column (g) shows $14.2 million as the calculated amortized 21
portion of PERC O&M for the 12-month test period ending October 31, 2023. This 22
$14.2 million is used in Exhibit A-13, Schedule C5.3, page 1, line 22, column (n). 23
24

J. C. DAVIS
Line U-20836
No.
JCD-36
Q75. What is the rationale for the 24-Month Operating Cycle project shown on line 1
5 of A-13, Schedule C5.16, page 1? 2
A75. The 24-month operating cycle project is intended to reduce the frequency of Fermi 3
2 refueling outages and improve operating time. Operating on a 24-month cycle 4
results in three refueling outages every six years; operating on an 18-month 5
operating cycle results in four refueling outages every six years. As discussed 6
earlier, Fermi 2 currently operates with 18-month operating cycles; therefore, 7
transitioning to a 24-month operating cycle will result in additional generation over 8
a six-year cycle due to fewer refueling outages. 9
10
Fermi 2’s cycle length is limited by our NRC license. The 24-Month Operating 11
Cycle project performs analysis to ensure the plant is capable of operating 24 12
months between refueling outages and submits that analysis as a license amendment 13
request to the NRC to update the Fermi 2 license to allow a 24-month cycle. DTE 14
Electric received NRC approval in early 2021 which means Refueling Outage 21 15
(RF21) in the winter/spring of 2022 will be the last refueling outage following an 16
18-month cycle. 17
18
The Company first introduced the 24-Month Operating Cycle project in Case No. 19
U-20162. The Commission responded favorably and approved cost recovery 20
associated with the 24-Month Operating Cycle project in the Order U-20162, dated 21
May 2, 2019. 22
23
Q76. What are the expenditures and the rationale for the Main Unit Generator 24
Inspection project shown on line 1 of A-13, Schedule C5.16, page 1? 25

J. C. DAVIS
Line U-20836
No.
JCD-37
A76. The Main Unit Generator inspection project as depicted on line 1 is part of the 1
Company’s bridging strategy to ensure the Main Unit Generator is capable of safe 2
and reliable operations. DTE Electric completed a generator inspection in RF20 3
with actual expenditures in Calendar Year 2020 of $8.4 million and will conduct 4
another generator inspection during RF21 with projected expenditures in Calendar 5
Year 2022 of $7.7 million as shown on line 1 of Exhibit A-13, Schedule C5.16, 6
page 1. 7
8
Q77. What are the expenditures and the rationale for the Fermi 2 Nuclear 9
Decommissioning Study project shown on line 9 of A-13, Schedule C5.16, page 10
1? 11
A77. The Fermi 2 Nuclear Decommissioning Study project represented the effort 12
required by the Company to accomplish the Commission’s directive in Case No. 13
U-20162, requiring DTE Electric to complete an updated decommissioning study. 14
15
The Company initiated the project to update the Fermi 2 nuclear decommissioning 16
study soon after issuance of the May 2, 2019 Order in Case No. U-20162. As 17
discussed in previous rate filings, this nuclear decommissioning study was 18
complex, required allocation of Company resources and took approximately a year 19
to complete. On January 29, 2021, DTE Electric submitted this study’s updated 20
conclusions within the DTE Electric Company’s Report on the Adequacy of the 21
Existing Annual Provision of Nuclear Plant Decommissioning (also referred to as 22
the Fermi 2 triennial decommissioning report). The Fermi 2 Nuclear 23
Decommissioning Study project had actual expenditures in Calendar Year 2020 of 24
$0.7 million as shown on line 9 of Exhibit A-13, Schedule C5.16, page 1. 25

J. C. DAVIS
Line U-20836
No.
JCD-38
1
I consider the Fermi 2 Nuclear Decommissioning Study scope reasonable and 2
prudent to accomplish the task the Commission concluded should be conducted. 3
4
Q78. What were the conclusions of the Fermi 2 Decommissioning Study project? 5
A78. The Fermi 2 decommissioning study provides two primary conclusions: (1) the site-6
specific decommissioning cost estimate reinforced that DTE Electric’s existing 7
practice of annual review and update of the Fermi 2 nuclear decommissioning cost 8
estimates is reasonable and prudent and (2) the existing annual Nuclear Surcharge 9
funding provision for nuclear decommissioning is presently appropriate, reasonable 10
and prudent. 11
12
Q79. Is the Company requesting a change to the annual amount of the Nuclear 13
Decommissioning Funding portion of the Nuclear Surcharge as an outcome of 14
the Fermi 2 Decommissioning Study project? 15
A79. No. The annual amount of the Nuclear Decommissioning Funding portion of the 16
Nuclear Surcharge was extensively reviewed in the MPSC Case No. U-20162 17
proceeding and subsequent reviews demonstrate it is reasonable and prudent to 18
maintain the Nuclear Decommissioning Funding portion of the surcharge 19
unchanged. The Fermi 2 Decommissioning Study further supports the 20
Commission’s findings from U-20162 that the annual Nuclear Decommissioning 21
Funding portion of the Nuclear Surcharge of approximately $2.9 million is 22
presently reasonable and prudent. 23
24

J. C. DAVIS
Line U-20836
No.
JCD-39
Q80. What are the expenditures and the rationale for the Fermi 2 Nuclear Extended 1
Power Uprate (EPU) Study project shown on line 21 of A-13, Schedule C5.16, 2
page 1? 3
A80. The Fermi 2 Extended Power Uprate (EPU) Study project is to provide a detailed 4
feasibility, scoping and estimating analysis, regarding the potential for Fermi 2 to 5
support an EPU. The Fermi 2 EPU Study project actual expenditures in Calendar 6
Year 2020 and forecasted Calendar Years 2021, 2022 and 2023 are $0.0 million, 7
$0.0 million, $0.0 million and $4.9 million respectively as shown on line 21 of 8
Exhibit A-13, Schedule C5.16, page 1. 9
10
Q81. What is an EPU? 11
A81. U.S. Commercial reactors, such as Fermi 2, were designed with excess capacity 12
that would allow for a potential uprate; however, the NRC licenses for commercial 13
nuclear power plants establishes limits on the maximum heat output, or power level, 14
for the reactor core; this power level plays an important role in many of the analyses 15
that demonstrate plant safety, so the NRC's permission is required before a plant 16
can change its maximum power level. The NRC has approved EPU increases as 17
high as 20 percent; however, EPUs usually require significant modifications to 18
major pieces of non-nuclear equipment such as turbines, main generators, pumps 19
and motors, transformers and steam dryers. 20
21
Q82. What would be the potential benefit of performing an EPU at the Fermi 2 22
Power Plant? 23
A82. Performing an EPU at the Fermi 2 Power Plant could yield an additional 172 MWe 24
of carbon-free, baseload generation capacity for Michigan. 25

J. C. DAVIS
Line U-20836
No.
JCD-40
1
Q83. What would be the potential benefit of performing the Fermi 2 EPU study? 2
A83. An EPU project would be complex with considerable scope and cost unknowns; for 3
example, DTE Electric’s level of efforts analysis provides a total EPU cost ranging 4
between $600 million and $1,000 million with the largest drivers of cost uncertainty 5
being unknowns regarding the margins available within Fermi 2’s existing 6
equipment such as the steam dryer, emergency equipment cooling system strainers, 7
turbine valves, main steam lines and main unit generator to operate safely at EPU 8
conditions or if the existing equipment must be replaced to support EPU conditions. 9
Performing the EPU study would allow DTE Electric to narrow the uncertainty in 10
scope and cost to support a reasonable and prudent decision for a Fermi 2 EPU. 11
12
Q84. What would be the deliverable of the Fermi 2 EPU Study? 13
A84. The Fermi 2 EPU study would perform a detailed analysis of Fermi 2’s existing 14
equipment and determine the required actions to support Fermi 2 EPU operations; 15
analysis would recommend if existing equipment can support EPU through 16
additional engineering analysis or if existing equipment must be replaced. The 17
analysis will support cost estimates for the individual EPU sub-projects as we 18
evaluate the total EPU costs. DTE Electric expects the study to take several years 19
to complete, as equipment such as the steam dryer requires a refueling outage to 20
access and instrument for margin analysis. Once the study concludes in 2025, we 21
will have a more certain understanding of the scope and costs required to perform 22
an EPU at Fermi 2 Power Plant. 23
24

J. C. DAVIS
Line U-20836
No.
JCD-41
Q85. What are the Total Nuclear Power Generation O&M expenses that you 1
support for the projected test period ending October 31, 2023? 2
A85. I support Total Nuclear Power Generation O&M expenses of $198.4 million for the 3
projected test period as shown in Exhibit A-13, Schedule C5.3, page 1, line 24, 4
column (n). As I have discussed previously, these projected Total Operation and 5
Maintenance expenses are required for the safe and reliable operation of Fermi 2 6
for the projected test period. I consider these expenses to be prudent and 7
reasonable. 8
9
Nuclear Surcharge 10
Q86. Is the Company requesting a change to the Nuclear Surcharge? 11
A86. Only with respect to inflation for the Site Security and Radiation Protection portion 12
of the Nuclear Surcharge. The Company is proposing an updated Nuclear 13
Surcharge based on the same approach approved by the Commission in Case Nos. 14
U-17767, U-18014, U-18255, U-20162 and U-20561 and depicted in Exhibit A-20, 15
Schedule J1. 16
17
The Site Security and Radiation Protection portion of the surcharge has been 18
updated to reflect 2020 historical expense plus inflation on line 2. The inflation 19
rate is supported by Witness Uzenski on Exhibit A-13, Schedule C5.15. 20
21
The Nuclear Decommissioning Funding portion of the surcharge shown on line 3 22
is unchanged. 23
24

J. C. DAVIS
Line U-20836
No.
JCD-42
The Low Level Radioactive Waste (LLRW) Disposal Funding portion of the annual 1
surcharge shown on line 4 is unchanged. 2
3
The resulting nuclear surcharge set forth in Company rates is supported by 4
Company Witness Willis on Exhibit A-16, Schedule F6. 5
6
Q87. What is the Nuclear Surcharge that you support for the 12-month projected 7
test period ending October 31, 2023? 8
A87. I support the Proposed Nuclear Surcharge of $39.1 million for the projected test 9
period as shown in Exhibit A-20, Schedule J1, page 1, line 5, column (b); this 10
represents an increase of approximately $0.3 million from the current authorized 11
Nuclear Surcharge shown on line 6, column (b). The Proposed Nuclear Surcharge 12
funds Fermi 2 site security, radiation protection, nuclear decommissioning and the 13
disposal of LLRW; these activities are required for safe and secure operation of the 14
Fermi 2 Power Plant for the projected test period. I consider the Proposed Nuclear 15
Surcharge to be prudent and reasonable. 16
17
Q88. Does this complete your direct testimony? 18
A88. Yes, it does. 19

STATE OF MICHIGAN
BEFORE THE MICHIGAN PUBLIC SERVICE COMMISSION
In the matter of the Application of ) DTE ELECTRIC COMPANY ) for authority to increase its rates, amend ) Case No. U-20836 its rate schedules and rules governing the ) distribution and supply of electric energy, and ) for miscellaneous accounting authority. )
QUALIFICATIONS
AND
DIRECT TESTIMONY
OF
MORGAN ELLIOTT ANDAHAZY

DTE ELECTRIC COMPANY
QUALIFICATIONS AND DIRECT TESTIMONY OF MORGAN ELLIOTT
ANDAHAZY
Line
No.
MEA-1
Q1. What is your name, business address and by whom are you employed? 1
My name is Morgan Elliott Andahazy (she/her/hers). My business address is One 2
Energy Plaza, Detroit, Michigan 48226. I am employed by DTE Electric Company 3
(DTE Electric or Company). 4
5
Q2. On whose behalf are you testifying? 6
I am testifying on behalf of DTE Electric. 7
8
Q3. What is your education background? 9
I hold a Bachelor of Science in Engineering (Industrial and Operations 10
Engineering), and a Master of Business Administration, both from The University 11
of Michigan, Ann Arbor. 12
13
Q4. What work experience do you have? 14
In 2007, I joined DTE Electric as a Contract employee supporting the Distribution 15
Operations Continuous Improvement (DOCI) team. In March 2008, I joined DTE 16
Electric as a full-time employee and a Project Lead within the DOCI team. As a 17
Project Lead, I was responsible for measuring and improving productivity within 18
the Electric Field Operations (EFO) organization. During this time, I obtained my 19
Six Sigma Black Belt based on work I did with EFO Productivity projects. In 2009, 20
I transitioned to the Continuous Improvement (CI) Manager for Distribution 21
Operations (DO) where I was responsible for the team of Project Leads supporting 22
improvement projects throughout DO. In March 2010, I was moved to a new 23
developmental assignment as a Field Supervisor for the Underground (UG) Cable 24

M. ELLIOT ANDAHAZY
Line U-20836
No.
MEA-2
Pulling team at the Trombly Service Center. At Trombly I was responsible for 1
overseeing the daily construction work performed by the UG Cable Pullers, and 2
supervising a Union represented workforce. In January 2011, I was promoted to the 3
CI Manager for Corporate Services. I was responsible for coordination and 4
implementation of CI training to the organization, and I led the team of CI experts 5
responsible for improvement projects. In October 2011, I transitioned to Manager, 6
Trombly Service Center, where I was responsible for all UG operations (cable 7
pulling and cable splicing) for the Southeast (SE) Region of DO. In April 2013, my 8
role expanded to Manager, SE Region, which consisted of three service centers 9
(Trombly, Redford, and Caniff) and included all Overhead (OH) and UG operations 10
in the SE Region. In March 2016, I was promoted to Director, Service Operations 11
responsible for all OH and UG operations in Southwest (SW), Northwest (NW), 12
and Northeast (NE) regions in DO. In this role, I also assisted in Local 17 contract 13
negotiations. In October 2017, I assumed my present position as Director, of the 14
Advanced Distribution Management System project. 15
16
Q5. What are your current duties and responsibilities with DTE Electric? 17
I lead the team responsible for the successful implementation of the new Advanced 18
Distribution Management System (ADMS). This team is responsible for the 19
strategic direction, vendor selection, and implementation of all ADMS components 20
including the Generation Management System (GMS), Energy Management 21
System (EMS), Outage Management System (OMS), Distribution Management 22
System (DMS), and the Network Management System (NMS). 23
24

M. ELLIOT ANDAHAZY
Line U-20836
No.
MEA-3
Q6. Have you sponsored testimony in a case before the MPSC before? 1
No. 2
3
Purpose of Testimony 4
Q7. What is the purpose of your testimony?5
The purpose of my testimony is to describe the Company’s progress in 6
implementing the Advanced Distribution Management System (ADMS) to improve 7
DTE Electric’s ability to monitor and control its distribution grid as referenced in 8
Company Witness Pfeuffer’s Exhibit A-23, Schedule M1, 2021 Distribution Grid 9
Plan, MPSC Case No. U-20147 (DGP). I also describe the Company’s progress on 10
design and construction of the new Electric System Operations Center (ESOC) and 11
the Alternate System Operations Center (ASOC) as referenced in Witness 12
Pfeuffer’s Exhibit A-23, Schedule M1, 2021 Distribution Grid Plan, MPSC Case 13
No. U-20147 (DGP). In addition, my testimony also addresses the required capital 14
expenditures and continued justification to complete these implementations. 15
16
Advanced Distribution Management System (ADMS) 17
Q8. Are you sponsoring any exhibits in this proceeding? 18
Yes. I am supporting the following exhibits: 19
Exhibit Schedule Description 20
A-12 B5.4 Projected Capital Expenditures – 21
Distribution Plant 22
(page 11, lines 2 through 5) 23
24
A-23 M6 Distribution Plant Capital Project Detail – 25
Technology and Automation 26
(ADMS and ESOC/ASOC projects) 27
28

M. ELLIOTT ANDAHAZY
Line U-20836
No.
MEA-4
Q9. Were these exhibits prepared by you or under your direction? 1
Yes, they were. 2
3
Q10. Can you describe the scope of the ADMS program? 4
As described in Company Witness Bruzzano’s testimony in MPSC Case No. U-5
20561 (4T 186-196), the ADMS program is the umbrella name for three tightly 6
connected projects that consist of five components with distinct yet complimentary 7
objectives. The three projects included are: 8
• Generation Management System (GMS) and Energy Management System 9
(EMS) 10
• Outage Management System (OMS) and Distribution Management System 11
(DMS) 12
• Network Management System (NMS) 13
14
The ADMS program is comprised of the hardware and its associated software that 15
will substantially improve DTE Electric’s ability to manage the flow of electricity 16
from the point of generation to the point of delivery, to monitor the condition of the 17
grid, to safely operate it, and to respond to emergency conditions and outages more 18
quickly. The “advanced” portion of the ADMS refers not just to improved 19
functionality, but also to the significant level of integration that is now available 20
across components that in the past were separate, in terms of communication, from 21
one another. These components, and the business processes that enable them, 22
perform different functions but benefit significantly from being able to share data 23
seamlessly. 24
25

M. ELLIOTT ANDAHAZY
Line U-20836
No.
MEA-5
Q11. Can you describe the five components included in the ADMS program? 1
The ADMS is comprised of five functional components: 2
• Generation Management System (GMS): allows the Company to manage the 3
Generation fleet and includes Automatic Generation Control (AGC) to 4
balance the system load and support frequency control; utilized to interface 5
with the Midcontinent Independent System Operator (MISO). 6
• Energy Management System (EMS): allows the Company to model the 7
subtransmission system and the connections to the transmission system; 8
provides tools to analyze real-time system conditions including State 9
Estimation and Contingency Analysis which are the tools that analyze the 10
system and provide data demonstrating current performance, and 11
performance in defined contingency situations, so operators can make 12
informed decisions to maintain system reliability; and allows the Company 13
to operate devices on the subtransmission system via Supervisory Control 14
and Data Acquisition (SCADA). 15
• Outage Management System (OMS): aggregates emergent trouble 16
information reported by customers and Advanced Metering Infrastructure 17
(AMI) meters and allows system operators and dispatchers to prioritize 18
response and properly assign crews for repairs. Emergent trouble is defined 19
as storm and non-storm, outage and non-outage events reported in the 20
system. 21
• Distribution Management System (DMS): provides a complete network 22
model of the electrical system for operators to view system conditions in real 23
time. DMS consists of multiple applications such as Network Model 24
(eMap), Distribution Power Flow (DPF), Distribution State Estimation 25

M. ELLIOTT ANDAHAZY
Line U-20836
No.
MEA-6
(DSE), and applications with more advanced functionality such as Fault 1
Location, Isolation, and Service Restoration (FLISR), Volt/Var Control 2
(VVC), Conservation Voltage Reduction (CVR), Feeder Reconfiguration 3
(FR) and electronic Switch Order Management (SOM). DMS allows the 4
Company to gain and access advanced situational awareness of the 5
distribution system from the Transmission Interconnection to the customer’s 6
connection on the distribution system. 7
• Network Management System (NMS): allows the Company to maintain high 8
quality system data, which is essential to the safe and effective monitoring 9
and operations of the grid. 10
11
Q12. Were the ADMS project costs included and approved for recovery in DTE 12
Electric’s previous rate case? 13
Yes. The ADMS project was discussed in depth in Witness Bruzzano’s testimony 14
in both MPSC Case No. U-20162 and MPSC Case No. U-20561. In its May 2, 15
2019 order in MPSC Case No. U-20162, the Commission stated the following on 16
page 29 when referring to ADMS: “The Commission finds this capital expense 17
amount to be reasonable in light of the significant improvements in reliability, 18
integration with distributed resources, and substation outage risk that are offered by 19
ADMS, and the fact that it is becoming commonplace in the industry.” The 20
projected expenditures presented in MPSC Case No. U-20561, Exhibit A-12, 21
Schedule B5.4, for the ADMS DMS/OMS project totaled $64.7 million. Based on 22
the defined test year, the amount included in the rate base was $58.1 million. 23
24
Q13. How will customers benefit from the ADMS implementation? 25

M. ELLIOTT ANDAHAZY
Line U-20836
No.
MEA-7
Customers will benefit from reduced outage durations and from better 1
communication on the status of their electric service and expected restoration times. 2
Table 1 identifies the operational improvements that are expected to occur, 3
including related improvements in All-Weather SAIDI, due to ADMS 4
implementation. The third column in Table 1 denotes the expected improvement in 5
the All-Weather SAIDI. 6
7

M. ELLIOTT ANDAHAZY
Line U-20836
No.
MEA-8
1
Estimated All-Weather SAIDI Improvements from ADMS 2
3
Q14. Are additional benefits expected to be realized due to the implementation of 4
ADMS? 5

M. ELLIOTT ANDAHAZY
Line U-20836
No.
MEA-9
Yes. There are a number of the additional benefits that were originally detailed in 1
Witness Bruzzano’s testimony in MPSC Case No. U-20561, and were also 2
discussed in detail in the Distribution Grid Plan (DGP) section 12.1. First, the 3
existing technology the Company had/has in operation was reaching end-of-life and 4
needed to be replaced regardless of implementing a full ADMS (includes GMS, 5
EMS, and OMS). Second, implementing a common platform for the GMS, EMS, 6
OMS, and DMS allows the components to seamlessly share data from across the 7
electrical system grid to provide real-time visibility of current conditions and 8
provide operational control of the distribution circuits. Third, the DMS applications 9
will allow the Company to improve many of the current manual processes in place 10
to monitor and operate the electrical grid, such as the paper SOM process. Fourth, 11
improved data quality allows employees to have a better understanding of the 12
current system configuration in the field, allowing for improved communications 13
between the control room and field employees; this improved communication will 14
also materially improve safety by allowing the field employees visibility into the 15
current configuration of the equipment while in the field so they can see a visual 16
representation of the information being discussed with the control room and 17
collaborate to create the safest restoration plan. Fifth, the ADMS allows the 18
Company to fully leverage investments made in the field while modernizing the 19
electrical grid, improving the ability to integrate Distributed Energy Resources 20
(DER) and providing a centralized tool for managing VVC and CVR. Please refer 21
to section 12.1 of the Distribution Grid Plan for more details of benefits of ADMS 22
platform in different scenarios. 23
24
Q15. What was the original implementation strategy for ADMS at DTE Electric? 25

M. ELLIOTT ANDAHAZY
Line U-20836
No.
MEA-10
The Company began the journey to invest in an ADMS in 2015 and 2016 by 1
meeting with utilities with good reliability performance and found that these 2
utilities had invested in deploying superior technology for monitoring grid 3
condition and operating devices remotely, which can be broadly defined as 4
Advanced Distribution Management Systems. The Company spent most of 2017 5
developing the ADMS implementation strategy and defining the scope of the 6
project, including the functionality and associated specifications needed to upgrade 7
and integrate the Company’s legacy systems. This strategy also included 8
establishing the proper project management process and oversight, utilizing the 9
Company’s internal project management experts, the Major Enterprise Project 10
(MEP) organization, and their extensive experience with multi-year technology 11
investment programs. The oversight of the ADMS projects included frequent 12
Executive Steering Committee meetings with MEP, IT and Operations Senior 13
Executives, monthly touchpoints with the Vendor’s executives, and weekly team 14
reviews with the vendor to ensure progress was on track, and risks were identified 15
and escalated quickly. 16
17
Q16. What was the original planned sequence for the ADMS implementation? 18
The Company developed the optimal sequence for implementing the three ADMS 19
projects based on the status of the current systems. The GMS/EMS project was 20
scheduled first as the legacy systems had already reached end-of-life, and the EMS 21
is the foundation for all other ADMS components. The second project planned was 22
the NMS so the Company could improve the overall data quality in its source 23
records so the new systems would run more effectively. The third project to be 24
implemented would be the OMS/DMS and would be rolled out in multiple phases. 25

M. ELLIOTT ANDAHAZY
Line U-20836
No.
MEA-11
The Company’s strategy was to implement the DMS Network Model application, 1
along with the OMS in the first phase. The new OMS would also require a new 2
mobile component to be installed to allow field resources to receive assigned 3
trouble work, and associated details of the jobs. The remaining DMS applications 4
would be rolled out in the final two phases of the OMS/DMS project. Not only did 5
this sequence allow the Company to replace the components in the order best suited 6
to relieve aging systems first, it also allowed the ADMS vendor additional time to 7
continue to mature their newer ADMS components, in particular the mobile 8
component of the OMS. 9
10
Q17. What vendors were selected by DTE Electric for the ADMS suite of products? 11
In 2017, DTE Electric hired Accenture to assist the Company in scoping the ADMS 12
project and in recommending the best ADMS vendor. Through a rigorous selection 13
process, the Company determined that OSI Inc. (OSI) was the best partner for the 14
GMS, EMS, OMS, and DMS. In 2018, DTE Electric conducted another selection 15
process for the NMS project. The Company selected Cyient as the NMS vendor 16
due to their expertise in data quality management. 17
18
Q18. Why did DTE Electric select OSI as their main ADMS vendor? 19
OSI offered a fully integrated platform across the four ADMS components (GMS, 20
EMS, OMS, and DMS). OSI was clearly an industry leader in the GMS and EMS 21
space, at the time serving 84 large utility customers in North America and receiving 22
outstanding customer feedback. Most importantly for the Company, OSI had 23
robust North American Electric Reliability Corporation (NERC) Critical 24
Infrastructure Protection (CIP) and security capabilities, which are critical in light 25
M. ELLIOTT ANDAHAZY
Line U-20836
No.
MEA-12
of rising cybersecurity threats. The Company recognized that OSI’s OMS product 1
was still relatively new and that their mobile solution supporting the OMS 2
(Compass) was still in the development phase. However, none of the competitors 3
had a full suite of mature products to meet the Company’s needs either, and OSI’s 4
strong reputation coupled with their user-friendly interfaces, development 5
roadmap, and security benefits ultimately led to their selection. 6
7
Q19. Can you describe the original schedule for implementing ADMS? 8
The GMS was scheduled to be in operation by the end of 2018, followed by the 9
EMS in 2019 and the NMS in 2020. In addition, the first version of the OMS 10
software was scheduled to be delivered in June 2019. This delivery would have 11
supported an implementation in late 2020. The DMS phase of the project was 12
scheduled to kick off in July 2019, which supported a staggered implementation 13
throughout 2021, transitioning into full day to day operational support in 2022. 14
15
Q20. Have any ADMS components been successfully implemented? 16
Yes. The Company successfully completed the implementation of the GMS in 17
2018, followed by the EMS in 2019, and NMS in 2020. 18
19
Q21. You indicated that the NMS was successfully implemented in 2020. There is 20
additional funding requested included in this instant case, Exhibit A-12, 21
Schedule B5.4, related to NMS. Please explain. 22
The initial NMS project set the foundation for the Company to maintain high 23
quality system data, which is essential to the safe and effective monitoring and 24
operation of the electrical grid. This source data is imported into the DMS Network 25

M. ELLIOTT ANDAHAZY
Line U-20836
No.
MEA-13
Model application and is the basis for the outputs of all other ADMS applications. 1
It is imperative to have high quality data in the Network Model to ensure safe, 2
reliable, and accurate interpretation of the current status of the system when 3
utilizing the ADMS in daily operations. This additional investment, totaling $6.3 4
million in years 2021-2023, will support further development of high-quality data 5
in the Network Model that was not included in the original scope of the NMS 6
project. 7
8
Q22. What additional data quality functionality is included in this funding and why 9
is it necessary? 10
The foundation for the evolving Distribution Planning processes is a high-quality 11
Network Model including grid topology and electrical characteristics. As part of 12
the recent grid modernization strategy efforts, the Company determined additional 13
investments were needed in the Network Model data quality to support the 14
advanced planning tools and process for scenario planning. This is a new request 15
for additional work on the Network Model that was identified as being beneficial 16
when the initial work was completed and can be considered phase two of the NMS 17
project. These additional Network Model investments include technology to better 18
align field conditions and maps to the digital representation of the grid, integration 19
between asset systems, new data models to support planning and operations 20
topology and characteristics, and advanced analytics to leverage sensor data to 21
continuously improve the Network Model. If we do not make these additional 22
investments, the Company will require additional O&M personnel to manually 23
maintain data between systems, which will introduce more opportunity for 24

M. ELLIOTT ANDAHAZY
Line U-20836
No.
MEA-14
incorrect data entry and discrepancies between asset systems. The value of the 1
components of the ADMS depends directly on the accuracy of this data. 2
3
Q23. What additional funding is required through 2023 to add the enhancement 4
you just described? 5
6
Given its foundational role, the Network Model requires enhancements to support 7
the full ADMS deployment as the complexity of the grid increases. In 2021-2023, 8
DTE Electric will invest $6.3 million to configure and develop common platform 9
maps for subtransmission operating maps, substation one-line diagrams, and 10
primary service customer diagrams to enable dynamic generation of these maps and 11
diagrams from the Geographic Information System (GIS) mapping system. 12
Additionally, this funding amount covers the cost for the Company to implement 13
four asset integration configurations between the asset management and GIS 14
systems during 2022 and an additional three such configurations during 2023. 15
These asset integration configurations are necessary to automatically maintain 16
consistency between our enterprise asset systems for technical data required for 17
planning studies, such as automatically creating an asset record with kVA size in 18
our asset management system for a regulator when it is created in our GIS 19
connected model. These additional investments are required to support and realize 20
the full customer benefits of the ADMS as detailed in Table 1 and to support timely 21
studies of customer requests to connect to the grid through the distribution planning 22
processes. 23
24
Q24. In light of the planned enhancements, what additional data will be available? 25

M. ELLIOTT ANDAHAZY
Line U-20836
No.
MEA-15
Additional data needed range from schematics to support switching and tagging in 1
the short term, to engineering and control setting information to support advanced 2
functionality, such as smart inverters functionality in ADMS in the long term. This 3
increased detail in network model fidelity will require Network Model 4
enhancements to support consolidation (defined as the creation of additional details 5
into the Network Model through ESRI software that do not exist in the systems 6
today) of one set of asset attributes across operating maps each in 2022 and 2023. 7
8
To increase efficiency and accuracy of maintaining the growing volume of data in 9
grid models for planning and operations, DTE Electric needs technology solutions 10
to continuously improve data integrity to efficiently maintain data input. We will 11
implement four analytical models each in 2022 and 2023 to continuously improve 12
targeted areas of our network model. These analytical models provide this critical 13
data integrity function by performing anomaly detection and correction to fill in 14
missing data or correct data elements in source systems through an automated 15
technology solution. The cost for building and implementing these network models 16
in 2022 and 2023 is included in the funding amount. Additional details can be 17
found in section “12.9.4.3 Network Model” of the DTE Electric 2021 Distribution 18
Grid Plan, Exhibit A-23, Schedule M1 sponsored by Witness Pfeuffer. As 19
described in the Distribution Grid Plan (DGP), in Exhibit 12.9.4.3.1 Network 20
Model Capital Investment, page 427, the Company expects continued investment 21
in the data quality supporting the Network Model outside of this rate case timeframe 22
to continue to support the increased need for additional aspects of high-quality data 23
to leverage technological investments in the future. 24
25

M. ELLIOTT ANDAHAZY
Line U-20836
No.
MEA-16
Q25. Can you describe the customer benefits to these additional investments in the 1
Network Model? 2
Customers will benefit from these additional investments in the Network Model 3
through downstream planning and operational processes that leverage the as-built 4
network model. The network model will enable DTE Electric to respond in a 5
timelier fashion to requests for connecting customers’ distributed generation and 6
distributed storage through the Company’s planning processes. The network model 7
also supports DTE Electric’s ability to plan and adapt to the changing needs of the 8
grid, such as planning for system upgrades driven by greater electrification as 9
described in the Grid Modernization plan, which in turn supports our customers’ 10
interests in modernizing their factories, businesses, and homes with cleaner and 11
more efficient technology like EVs, solar panels, and batteries. 12
13
Q26. Can you describe the progress to date for the OMS and DMS components of 14
the project? 15
Under the original schedule with phased implementation of the different ADMS 16
components, the Company planned to implement the OMS in late 2020, and to 17
stagger the multiple DMS applications between late 2020 and the end of 2021. For 18
several reasons that I will explain in more detail below, OMS and DMS 19
implementation has been delayed. Due to the staggered deployment strategy, the 20
Company is in different stages of implementation for the remaining OMS and DMS 21
components. Most of the OMS and DMS are now scheduled for completion by the 22
end of 2022, as discussed later in my testimony. In early 2020, DTE Electric hired 23
an experienced System Integrator (Ernst & Young) to support the OMS/DMS 24
project, which is industry standard practice when implementing an ADMS. The 25

M. ELLIOTT ANDAHAZY
Line U-20836
No.
MEA-17
System Integrator helps the company with the overall delivery strategy, coordinates 1
all testing efforts, coordinates integration between software packages (new and 2
legacy software), and creates appropriate training materials for the organization. 3
For the OMS and the DMS Network Model application, the team has completed 4
system configuration, Factory Acceptance Testing (FAT), and Site Acceptance 5
Testing (SAT). In addition, the Company has developed drafts of the associated 6
training materials and conducted “Train the Trainer” sessions for the OMS. The 7
project team is currently working through System Integration Testing (SIT), defect 8
remediation and testing, and partnering with OSI on enhanced functionality 9
(enhancements) to improve the base product and meet additional operational needs. 10
This due diligence and system refinement before full deployment are absolutely 11
necessary to ensure a successful roll out given the critical role of these systems to 12
overall system reliability and safety. The training materials and training sessions 13
will also be completed as defects and enhancements are remediated by OSI to 14
support the rollout and implementation with accurate, easy-to-understand tools for 15
all users. For the remaining DMS applications, the Company is in the process of 16
system configuration and preparing for the upcoming testing cycles (FAT, SAT, 17
and SIT). 18
19
Q27. What caused the delays for the OMS and DMS components? 20
The major cause of the delay in the OMS and DMS components was the 21
development and delivery of the mobile Compass tool from OSI (I will discuss the 22
criticality of the mobile tool to the OMS implementation later in my testimony). 23
While there was some delay early in the project to ensure Compass was compatible 24
with multiple field devices (iOS, Android, etc.), most of the delay occurred in 2020 25

M. ELLIOTT ANDAHAZY
Line U-20836
No.
MEA-18
and 2021. Specifically, OSI delivered the first working Compass test environment 1
in the second quarter of 2020, opposed to December 2019 as planned. Once the 2
base product was delivered, the Company partnered with OSI to continue 3
developing the additional functionality required to replace the Company’s existing 4
(legacy) mobile tool and to improve the functionality between the new Compass 5
mobile tool and the base OMS product. Restrictions imposed during the COVID 6
pandemic made the partnership and continued development of the Compass tool 7
extremely challenging. For example, the OSI and DTE Electric project teams were 8
not able to travel and meet in person until August 2021. Due to the complexity of 9
the technology required to support the needed mobile functionality, and the 10
increased complexity of partnering on a project of this magnitude given the 11
restrictions in place due to the pandemic, the Company had to make the decision to 12
move the implementation date of the DMS Network Model, OMS, and Compass 13
mobile tool. The critical nature of these systems to the Company’s daily operations 14
informed this decision. Although some systems can be deployed and continued to 15
be refined over time after they are live, it was determined that this system needed 16
additional design improvements and testing in order to be ready for use in 17
operations by the Company and avoid potentially costly workarounds and 18
problems. As discussed in more detail later in my testimony, the new 19
implementation date is the fourth quarter of 2022 to accommodate the time needed 20
for OSI to remediate the issues and develop required enhancements. This timing 21
has the additional benefit of ensuring the cutover of systems does not occur during 22
the summer when our customers experience higher outage related issues and these 23
tools are critical to our ability to restore customers. In this context, cutover is 24
defined as the point when the new component is turned on/implemented and the old 25

M. ELLIOTT ANDAHAZY
Line U-20836
No.
MEA-19
component (in the case of a replacement system) is turned off. Due to original 1
sequencing of the OMS/DMS project, where DMS implementation follows OMS 2
implementation, the delay in implementing OMS caused the remaining phased 3
DMS implementation schedule to shift into 2022 as well. 4
5
Q28. Why is the mobile component of the ADMS critical to cutover to the new 6
OMS? 7
The current OMS has a fully integrated mobile tool, which the Overhead (OH) and 8
Underground (UG) field employees use as an event management system to receive 9
their trouble work assignments. This tool provides OH/UG field employees with 10
job information, including the number of customers affected, the type of trouble 11
predicted on the system, and corresponding AMI meter information. This mobile 12
functionality, which exists in the current OMS, will continue to be required with 13
the new OMS, and the current mobile solution is not compatible with the new OMS 14
for continued use. OSI has developed the mobile Compass tool to fit this basic 15
event management need. In addition, the Compass tool will also allow field 16
employees access to the map view of the Network Model. In other words, the field 17
employees will gain improved situational awareness by having access to the same 18
Network Model as the control room employees and will have an improved 19
understanding of the current configuration of the grid. This situational awareness 20
will improve field safety and is included in the overall benefits described in Table 21
1. 22
23
Q29. Did the delays in implementing the new OMS impact DTE Electric’s ability to 24
manage customer outages with the current technology? 25

M. ELLIOTT ANDAHAZY
Line U-20836
No.
MEA-20
No. The Company has continued to use the current OMS and supporting systems 1
to manage customer outages and associated trouble per our normal trouble 2
restoration processes. However, while the current OMS (implemented in 2003) is 3
rapidly reaching end-of life, meaning that the vendor is no longer providing updates 4
and is only providing limited software support, and the Company has been able to 5
manage the grid operations in the current OMS to date, we have not been able to 6
do so in the most efficient manner, and the investment in the new ADMS (including 7
the new OMS, the benefits of which are described in detail below) allows the 8
Company to mitigate the current limitations described above and improve 9
reliability as shown in Table 1 and as previously justified and approved by the 10
Commission for inclusion in rate base. 11
12
Q30. Can you describe the current strategy for deploying OMS and DMS? 13
Due to the delays in the delivery of the mobile tool, the Company has modified its 14
implementation sequence for the OMS and DMS components. Specifically, the 15
OMS team will continue to partner with OSI on the development and delivery of 16
variance remediation, including appropriate testing after monthly patching cycles. 17
Variance remediation refers to the process of the ADMS vendor fixing or 18
developing functionality in the base product and providing the Company with a 19
patch to the current system, so the proper functionality can be achieved while 20
utilizing the system. The Company will complete all configuration and testing on 21
the DMS applications in parallel while the OMS work continues. Training and 22
cutover of the OMS and DMS components will happen simultaneously for the 23
frontline employees instead of being staggered as originally planned to allow 24
quicker implementation of all components. In addition, the Company will be 25

M. ELLIOTT ANDAHAZY
Line U-20836
No.
MEA-21
implementing a full system upgrade of the current OSI EMS shortly before the 1
OMS cutover. The initial strategy assumed the first EMS upgrade would occur 2
after the ADMS: DMS/OMS project was complete. However, in partnership with 3
OSI, the Company determined the EMS upgrade was required before the OMS 4
cutover to fully leverage all the functions in the OMS and DMS Network Model. 5
6
Q31. Why is the company upgrading the new OSI EMS that was installed in 2019? 7
With the new delivery schedule, and in order to leverage all of the functionality 8
OSI has implemented in the new OMS and DMS systems, the Company must 9
upgrade the current EMS version 2016 to EMS version 2019. This is a normal 10
process that would have occurred regardless of the OMS/DMS implementations 11
and will continue to occur when the OSI products are fully deployed and in use in 12
daily operations. These routine period updates allow the Company to add any new 13
functionality, security updates, and product improvements developed by OSI (and 14
is a standard process for all OSI customers). The technologies continue to evolve, 15
and it is important for the Company to keep its systems current to avoid potential 16
risk for problems and implement all security-driven upgrades. 17
18
Q32. Since a mobile solution for the field personnel is critical for OMS cutover, how 19
will DTE Electric mitigate the risk of continued delivery delays of the mobile 20
Compass tool? 21
DTE Electric will leverage another field work force (field force) management 22
software solution called ClickSoft, that is already a project included in the 23
Company’s strategic plan for OH/UG field resources. To mitigate the risk of 24
continued delivery delays with Compass, the Company will pull up the emergent 25

M. ELLIOTT ANDAHAZY
Line U-20836
No.
MEA-22
trouble field force management portion of the ClickSoft project into 2022, and then 1
use the ClickSoft mobile application as the cutover-required mobile software to 2
allow OH/UG field resources to receive trouble job assignments and details 3
associated with those jobs. This new sequence reduces the risk of further Compass 4
delays affecting the OMS cutover schedule, as it will allow OMS cutover to occur 5
even if Compass is not yet fully available and will not interfere with the 6
implementation of Compass when it is fully available, as the Company will 7
integrate the two technologies. This allows DTE Energy to obtain the majority of 8
the ADMS benefits in 2022 and 2023 with the implementation of the main OMS 9
and DMS components, rather than waiting for the mobile Compass tool 10
development. The Company will continue to plan to invest in the remaining 11
ClickSoft functionality for planned work and additional field force functionality 12
once Compass is implemented. 13
14
Q33. Can you elaborate on the ClickSoft work management software? 15
ClickSoft, owned by Salesforce, is a full Field Force Management solution that is 16
used to manage work in the field that is currently deployed and in use at the 17
Company in the Substations organization, and will be implemented for the Electric 18
Field Operations (EFO) organization when the new OMS goes live (replacing the 19
current end-of-life Service Suite work management application used by EFO, as 20
discussed in Company Witness Sharma’s testimony). ClickSoft has a mobile 21
component, ClickMobile, that can be used by field resources to receive job 22
assignments and associated job details, plus additional field force management 23
functions such as electronic pre-job briefs and time entry. The Company originally 24
planned to implement the full ClickSoft package for the remaining field 25

M. ELLIOTT ANDAHAZY
Line U-20836
No.
MEA-23
organizations within DO after the ADMS implementation was complete. This 1
strategy included fully integrating ClickSoft and ClickMobile with OMS and the 2
mobile Compass tool, integrating ClickSoft with the Company’s current work 3
management tool Maximo, and leveraging ClickSoft’s field force management 4
capabilities to improve the planning and scheduling processes to support both 5
trouble and planned work. This long-term integration vision has three major 6
benefits: first, allowing the Company to more effectively plan work for all field 7
resources regardless of type of work (planned and emergent trouble); second, 8
allowing dispatching personnel full visibility to all field resources regardless of type 9
of work assigned; third, all field personnel will obtain the situational awareness 10
benefits from Compass and the full field force management benefits of ClickSoft 11
regardless of type of work assigned. 12
13
Q34. If the Company implements ClickSoft when the OMS is cutover, will the 14
Company continue to invest in the Compass mobile tool with OSI? 15
Yes. While ClickSoft will be the new mobile solution required for the OMS 16
cutover, the Company will continue to partner with OSI on the development and 17
delivery of the Compass mobile tool. As OSI progresses, the Company will 18
continue work on integrating the two mobile solutions and rolling out the Compass 19
tool to the field as planned to increase the field’s situational awareness capabilities. 20
As described above, these two mobile tools complement each other by offering the 21
field employees a full field force management tool in ClickSoft, and the full 22
situational awareness benefits in Compass. For example, field employees will 23
utilize the ClickSoft tool to receive their job assignments, obtain GPS routes, 24
conduct electronic pre-job briefs, and fill out their daily time sheets. This program 25

M. ELLIOTT ANDAHAZY
Line U-20836
No.
MEA-24
will be integrated with the Compass mobile tool where the employees will obtain 1
more details regarding the job assigned, and be able to see the current system 2
configuration to determine the safest and most efficient method to restore the 3
system. 4
5
Q35. What are the customer benefits associated with the Company’s strategy to 6
implement both Compass and the ClickSoft tools? 7
As described above, while these two mobile products have some overlapping 8
functionality, they are actually complimentary programs and both are needed to 9
provide field personnel with a full field force management tool and a situational 10
awareness tool to realize the full benefits of the ADMS. The Compass mobile tool 11
primarily drives increased benefits in safety and situational awareness for frontline 12
employees, and the ability to improve communication between the field and control 13
center while responding to trouble. Specifically, Compass provides field device 14
and electrical system status to field personnel consistent with what is seen by the 15
System Operators and Dispatchers. This means that employees can actually see 16
which lines are live, if circuits are jumpered together, etc, rather than having those 17
system conditions verbally described over the phone by employees in the control 18
room. It also provides the field employees with the ability to update device status 19
in the Network Model to ensure proper information surrounding the status of the 20
customers power is understood. The resulting benefit to the customer is shorter 21
restoration times and improved response to trouble in the field as discussed earlier 22
in my testimony and displayed in Table 1. In the future, the Compass tool will 23
continue to mature allowing the field to have better access to the advanced DMS 24
applications such as FLISR and SOM. 25

M. ELLIOTT ANDAHAZY
Line U-20836
No.
MEA-25
1
The ClickSoft tool brings a different set of benefits to the Company and customers. 2
In this initial implementation of ClickSoft, the largest benefit is ensuring that the 3
cutover date for the new OMS will not be affected by any potential development 4
delays in Compass. So, there is less risk the ADMS benefits described earlier are 5
delayed any further. Additionally, ClickSoft brings more benefits to fruition due 6
to its enhanced field force management capabilities. When the full ClickSoft 7
implementation is complete, the Company will be able to have one central location 8
to manage all work (planned and trouble), one common tool to manage all field 9
resources, and the field will have more streamlined processes to manage their work. 10
This will create a better understanding of total work volumes, and better 11
opportunities to coordinate field resources for different specialties. This 12
functionality translates into improved ability to manage both emergent trouble and 13
the growing planned work required to complete planned investments in the grid. 14
As stated earlier, while there is some basic overlap in functionality, these two 15
solutions are complementary and will allow the Company to serve customers more 16
effectively in all aspects of work. 17
18
Q36. What are the new implementation dates for the OMS and DMS components? 19
With the exception of Compass and the SOM DMS application, DTE Electric plans 20
to complete cutovers of the EMS upgrade, OMS, ClickSoft (for emergent work), 21
and DMS components by the end of 2022, using these components in daily 22
operation. As stated earlier, the Company will roll out the Compass mobile tool as 23
soon as OSI delivers agreed upon functionality, and it is fully integrated with the 24
ClickSoft tool. Due to the complexity of change management needed to help 25

M. ELLIOTT ANDAHAZY
Line U-20836
No.
MEA-26
frontline employees understand and embrace the new technology and associated 1
processes, the SOM DMS application will be technically cut over in late 2022 with 2
the other DMS components, but will be rolled out to the frontline employees for 3
daily operational use in mid-2023. This delay in implementing SOM will allow 4
employees the time needed to be fully trained and understand the change impact of 5
the new SOM processes, and will allow future maturity in the Network Model for 6
improved data quality and increased safety. 7
8
Q37. Has DTE Electric modified the project management processes to ensure the 9
delivery dates of the OMS and DMS components are not further delayed? 10
Yes. As delivery issues were identified and escalated from project team to 11
leadership and on to the steering committee, the Company took appropriate steps 12
to mitigate these risks effectively. Examples include hiring an experienced ADMS 13
System Integrator (Ernst & Young) in early 2020 to help manage the overall 14
strategy, the testing process, and training development. In addition, the Company 15
increased the cadence of touchpoints with the ADMS vendor’s Executives from 16
monthly to bi-weekly. These improvements, along with leveraging the ability to 17
travel due to lessened COVID restrictions and continued project management 18
cadences (weekly) to track performance, will support a successful implementation 19
of OMS and DMS, in accord with the new timeline. 20
21
Q38. Given the delays, is it still important for DTE Electric to pursue the OMS and 22
DMS components of ADMS? 23
Yes. In addition to the benefits described earlier in this testimony (SAIDI 24
improvements, end-of-life technology, seamless integration of components, 25

M. ELLIOTT ANDAHAZY
Line U-20836
No.
MEA-27
automating manual processes, improved situational awareness), as mentioned in 1
Witness Pfeuffer’s testimony on prioritization of DO Strategic projects, the Global 2
Prioritization Model (GPM) continues to rank ADMS as the top project due to its 3
importance to the Company’s plans to improve reliability for customers and 4
modernize the grid to respond to increasing weather volatility, new technologies, 5
and electrification. Without completing this final ADMS project, the Company will 6
not be able to fully leverage technology investments to improve the customer 7
experience, and the Company would still need to invest in a new OMS as the current 8
system is reaching end-of-life. 9
10
Q39. Can you describe the funding required to complete the ADMS project? 11
Table 2 displays the amounts presented and included in rate base from MPSC Case 12
No. U-20561, Exhibit A-12, Schedule B5.4 for the ADMS: DMS/OMS project. In 13
summary, the total presented for 2018-2021 was $64.7 million and the total 14
included in rate base through the end of the test year was $58.1 million. In this 15
instant case, Exhibit A-12, Schedule B5.4 displays the updated costs for the ADMS: 16
DMS/OMS project and totals $83.5 million; it is important to note this exhibit only 17
includes costs for years 2020-2023. If you include the actual historical investment 18
for 2018 and 2019, as displayed in Table 3, the new expected investment for the 19
ADMS: DMS/OMS project now totals $93.9 million, an increase of $29.2 million. 20
Due to the test year ending prior to the end of the calendar year the total cost to be 21
considered for inclusion in the rate base is $92.6 million. This still reflects the 22
overall cost increase of about $29.2 million. 23
24
Q40. Why did the total project cost increase by $29.2 million? 25

M. ELLIOTT ANDAHAZY
Line U-20836
No.
MEA-28
The overall cost increase of $29.2 million can be broken down into four 1
components: 1) $3.7 million of planned investment was not included in the Exhibit 2
A-12 from MPSC case No. U-20561 due to the years in scope for that case; 2) there 3
is an additional $5 million included for an expanded ADMS Reporting project, 4
which was not included in the original scope; 3) there is an additional $6.9 million 5
included for the emergent trouble portion of the ClickSoft project already planned 6
in the Company’s strategic investment that is being pulled up to correspond to the 7
OMS cutover date; and 4) the remaining $13.6 million of additional costs are 8
associated with the ADMS: DMS/OMS project delays due to COVID and the 9
delayed delivery of the Compass mobile tool. Based on the test years included in 10
this instant case, the Company is seeking a total of $92.6 million to be included in 11
rate base. Due to the test year timing (not equal to calendar year), this creates an 12
incremental $34.5 million increase above what was previously approved for 13
inclusion in rate base. The difference between the $34.5 million and the $29.2 14
million is the amount that was presented in the last rate case as the planned total 15
spend for the project, but which was not included in rate base, because it fell outside 16
the test year, and the exclusion of the remaining spend that falls outside the test 17
year in this case. This is shown in Tables 2 and 3, below. 18
19
Previously Presented ADMS: DMS/OMS Investments 20
ADMS: DMS/OMS investments presented in previous rate case (U-20561)
Historic Projected Calendar Year Total
($000) 12 mos. ended 12 mos. ended 12 mos. ended 12 mos. ended Investment
Description 12/31/2018 12/31/2019 12/31/2020 12/31/2021 Presented
ADMS: DMS/OMS 835 25,980 28,000 9,900 64,715
Historic Bridge Period Test Year Total
($000) 12 mos. ended 16 mos. ending 12 mos. ending Included in
Description 12/31/2018 4/30/2020 4/30/2021 Rate Base
ADMS: DMS/OMS 835 35,313 21,967 58,115

M. ELLIOTT ANDAHAZY
Line U-20836
No.
MEA-29
1
ADMS: DMS/OMS Investments Presented in Instant Case 2
As seen in Table 2. the difference between what DTE planned to spend on this 3
project and what fell in the last projected test year was $6.6 million ($64.7 million 4
planned - $58.1 million included in rate base). As seen in Table 3, the difference 5
between what DTE plans to spend on this project and what falls within this 6
projected test year is $1.3 million ($93.9 million planned - $92.6 million to be 7
included in rate base). When the previously planned and presented $6.6 million is 8
added to the $29.2 million in incremental spend, and the $1.3 million that falls 9
beyond the 2022-2023 projected test year is subtracted, the total proposed increase 10
to rate base in this case for this project is $34.5 million ($29.2 million - $1.3 million 11
+ $6.6 million). 12
13
Q41. Can you elaborate on the ADMS Reporting project included in the total costs 14
for ADMS? 15
The Company relies upon the Data that resides in the OMS system to make critical 16
decisions daily and especially during storm events. With the implementation of a 17
new OMS system, the data and capabilities that other interfaced solutions can 18
subscribe is changing. As a result, there are multiple Reports, Dashboards and 19
support systems that have been created over time that use the data created by the 20
ADMS: DMS/OMS investments presented in the instant case (U-20836) plus historic investments
Historic Historic Projected Calendar Year Total
($000) 24 mos. ended 12 mos. ended 12 mos. ended 12 mos. ended 12 mos. ended Investment
Description 12/31/2019 12/31/2020 12/31/2021 12/31/2022 12/31/2023 Presented
ADMS: DMS/OMS 10,392 19,393 21,928 34,138 8,089 93,940
Historic Historic Bridge Period Test Year Total to be
($000) 24 mos. ended 12 mos. ended 22 mos. ending 12 mos. ending Included in
Description 12/31/2019 12/31/2020 10/31/2022 10/31/2023 Rate Base
ADMS: DMS/OMS: EADMS: DMS/OMS10,392 19,393 50,377 12,430 92,592

M. ELLIOTT ANDAHAZY
Line U-20836
No.
MEA-30
OMS and must be updated to connect to the new OMS solution. The existing tools 1
were examined, and the Company made the strategic decision to leverage Cloud 2
computing technology to store and build all of the reports and applications that 3
support daily operations and use data sourced from the OMS. The first step in this 4
project includes transferring appropriate data from the on-premise Outage Data 5
Warehouse (ODW), which is a direct extract from the ADMS, to the Data Lake in 6
the Cloud where the OMS data can be accessed by approved reports and combined 7
with data from other sources. The second step of this project includes identifying 8
all current reports that utilize data created by the current OMS, and evaluating how 9
to streamline the reports to improve accuracy and appropriate availability within 10
the Company. The third component includes building all new operational reports 11
in the Cloud which can seamlessly access the data from the new ADMS and other 12
source systems to allow operations to better serve our customers. Examples of 13
these reports include customer location history that displays a summary of historical 14
work at a location so the field employees and engineers can assess key trouble areas 15
and generate plans for improved reliability. Other examples include Storm 16
reporting tools and applications (such as ChatBot which is described in Company 17
Witness Sharma’s testimony), and real-time operational reports used by the field 18
employees and the ESOC to better manage trouble volume. 19
20
Q42. Why wasn’t the Reporting workstream included in the original scope of the 21
ADMS project? 22
When the original ADMS project was scoped, the Company assumed a nominal 23
investment in reports associated with ADMS data. The original plan included using 24
the current operational reports in the future, and simply changing the source for the 25

M. ELLIOTT ANDAHAZY
Line U-20836
No.
MEA-31
data obtained from the OMS. As the OMS project developed, the Company was 1
able to more completely assess the current state of its operational reporting and 2
support systems. This understanding highlighted an opportunity to bring all of 3
those systems and reports into a consolidated method including updating those 4
systems to new tools and methods that better serve the needs of the employees that 5
use those systems to manage Customer restoration. At that same time, between the 6
initial 2017 ADMS project inception and the end of 2019 when this decision was 7
taken, the Company learned more about the rapidly evolving benefits of Cloud 8
computing and made the strategic decision to move its IT investments in that 9
direction for all future development for which the Cloud approach is consistent with 10
safety or regulatory standards. This full understanding of the current systems and 11
strategic change in Cloud computing were not understood nor included in the 12
original scope of the project. 13
14
Q43. What benefits will the customer gain with this additional investment in ADMS 15
Reports? 16
Many of the current reporting tools that generate the operational reports utilized 17
daily are reaching end-of-life or are housed on servers which are reaching end-of-18
life. The reports need to be upgraded before failure to ensure accurate input into 19
current processes. In addition, these updated ADMS reports will allow the 20
Company to improve accuracy and response to emergent issues reported by 21
customers. 22
23
System Operations Center (SOC) Modernization 24

M. ELLIOTT ANDAHAZY
Line U-20836
No.
MEA-32
Q44. Was the SOC Modernization project cost included and approved for recovery 1
in DTE Electric’s previous rate case? 2
Yes. The SOC Modernization project was addressed in depth by Company Witness 3
Bruzzano in both MPSC Case No. U-20162 and MPSC Case No. U-20561, and the 4
expenditures for the project were approved for recovery by the Commission in both 5
cases. Regarding SOC Modernization, the Commission noted in its May 2, 2019 6
order in U-20162 on page 30 that: “The Commission stresses the need for and 7
importance of this modernization project for system operations from a reliability 8
and resiliency standpoint.” In addition, in MPSC Case No. U-20561, Exhibit A-12, 9
Schedule B5.4 the Company presented total projected expenditures of $109.4 10
million for years 2018-2021. Following these previous cases, the Commission has 11
approved a total of $106.9 million be included in the rate base. 12
13
Q45. What is the SOC Modernization project? 14
The SOC Modernization project is aimed at replacing the Company’s outdated 15
primary SOC and the smaller, outdated backup SOC by constructing two facilities 16
designed using current industry security, resiliency, and operability standards. The 17
existing SOC and backup SOC have significant limitations, which I will describe 18
later in my testimony. 19
20
Q46. What functions does the SOC perform? 21
The SOC is the most critical facility in Distribution Operations. Personnel in the 22
SOC operate the subtransmission and distribution system in southeast Michigan 23
and support generation operations. They monitor alarms and system conditions, 24
and direct field personnel to operate electrical equipment for routine switching 25

M. ELLIOTT ANDAHAZY
Line U-20836
No.
MEA-33
needed for maintenance, other planned activities, and for outage restoration. SOC 1
System Supervisors are the ultimate authority for the DTE Electrical system 2
operation with the goal of maintaining safety of the field personnel and public, 3
reliability of the electrical grid and the continuity of service to the customers. The 4
SOC also interfaces with Central Dispatch personnel to ensure appropriate crews 5
are assigned to address system issues. 6
7
Q47. Why is the SOC Modernization project needed to replace the existing SOC 8
facility? 9
The existing SOC poses several limitations, which DTE Electric identified through 10
extensive benchmarking at the inception of this project: 11
• Outdated facility: The facility lacks the redundancy in mechanical and 12
electrical systems that is necessary to ensure continued operations in the 13
event of a crisis. 14
• Outdated technology: The SOC utilizes a magnetic tile board representation 15
of the electric network, as opposed to an electronic display board of the 16
transmission, subtransmission, and distribution network that is now common 17
in the industry. This severely limits situational awareness, which is critical 18
to understand the current status of the system. The tile map board, located 19
on a vertical wall inside the facility, is also running out of space to 20
accommodate growth and limits training opportunities. Whenever a change 21
occurs on the system, which happens many times per day, an employee must 22
manually mark open and shut circuits by placing a magnetic marker on the 23
wall with a 20+ foot pole. 24

M. ELLIOTT ANDAHAZY
Line U-20836
No.
MEA-34
• Space limitations: DTE Electric’s SOC and dispatch personnel are physically 1
separated, causing the use of repeated phone calls to communicate. The 2
colocation of SOC and dispatch personnel is a well-established industry best 3
practice and provides customer benefits in terms of improved speed to 4
resolve trouble. 5
• Limited visibility of telecommunication infrastructure performance: The 6
reliability of the telecommunication paths from field devices to the SOC is 7
critical for the effective monitoring of the grid and remote operations. 8
Developing the ability to separately monitor the condition of the 9
telecommunication network through the construction of a Network 10
Operations Center (NOC) is part of the SOC Modernization project. 11
12
Q48. What was the original timeframe for the new Electric System Operations 13
Center (ESOC) and the new Alternate System Operations Center (ASOC)? 14
The SOC Modernization project was initiated in 2017, with a planned completion 15
and occupancy of ESOC by December 2019 and ASOC by December 2020. 16
17
Q49. What progress has been made on the construction of the new ESOC? 18
The design for the new ESOC was completed in April 2019, contractors were 19
mobilized in May, and the groundbreaking for the new ESOC was held on May 28, 20
2019. To date, construction of the new ESOC is complete, Central Dispatch 21
(Dispatchers and support personnel) and about half of the Operational Engineering 22
employees are now working in the space, and IT is installing the remaining 23
equipment as described in further detail later in my testimony. 24
25

M. ELLIOTT ANDAHAZY
Line U-20836
No.
MEA-35
Q50. Were there any delays in the construction of the new ESOC? 1
Yes. The SOC Modernization project was initially delayed in 2018 due to ESOC 2
building design adjustments and permit timing, which pushed the groundbreaking 3
to May 2019 as described above. The new ESOC experienced some delays in the 4
beginning of construction which resulted from discovery of below-grade 5
obstructions and environmental remediation. However, COVID caused the largest 6
delay for ESOC construction. The project was completely shut down for 7
approximately two months due to availability of construction workforce, as both 8
the company and contractors developed and implemented new COVID-related 9
health protocols in consultation with state and local officials. Once construction 10
resumed, COVID work restrictions, associated with worker social distancing, 11
reduced efficiency for approximately fourteen additional months. COVID also 12
caused material delays in mechanical and electrical systems due to the availability 13
of microchips. 14
15
Q51. What are the costs associated with building the new ESOC? 16
In MPSC Case No. U-20561, Exhibit A-12, Schedule B5.4, the total costs the 17
Company presented for the SOC Modernization project was $109.4 million for 18
2018-2021. Table 4 displays the amounts presented in MPSC Case No U-20561 19
plus the historical investment from 2017 previously displayed in MPSC Case U-20
20162, Exhibit A-12, Schedule B5.4. This indicates a total projected investment of 21
$110.7 million for the SOC Modernization project, with $106.9 million previously 22
approved to be included in rate base due to test year calculation. The SOC 23
Modernization project originally consisted of two new facilities, the ESOC and 24
ASOC, with an expected distribution of $78 million and $33 million respectively. 25

M. ELLIOTT ANDAHAZY
Line U-20836
No.
MEA-36
In this instant case, Exhibit A-12, Schedule B5.4, the Company displays the ESOC 1
and ASOC facilities on two separate lines for years 2020-2023. The ESOC costs 2
presented total $65.9 million and the ASOC totals $34.5 million. Table 5 displays 3
the amounts presented in this instant case plus the historical investment for previous 4
years to show the new total costs associated with these two projects. The new total 5
cost for the ESOC is $98.5 million (historic 2017-2020 plus projected 2021 and 6
2022 investments), indicating an increase of $20.5 million over the original 7
projected investment. The new total costs for the ASOC is $34.5 million, indicating 8
only a slight increase of $1.5 million over the original plan submitted for approval. 9
As displayed in Table 6, the total increase in costs for the two facilities is $22.1 10
million for the years 2017-2023, to be included in rate base. The increased cost of 11
the ESOC was driven by the construction delays due to COVID and several other 12
items described below. The Company is proposing to include an incremental $22.1 13
million in the rate base. 14
15
Previously Presented SOC Modernization Investments 16
17
18
SOC investments presented in previous rate case (U-20162 & U-20561)
Historic Historic Projected Calendar Year Total
($000) 12 mos. ended 12 mos. ended 12 mos. ended 12 mos. ended 12 mos. ended Investment
Description 12/31/2017 12/31/2018 12/31/2019 12/31/2020 12/31/2021 Presented
SOC Moderization 1,223 4,460 36,100 63,300 5,600 110,683
Historic Historic Bridge Period Test Year Total
($000) 12 mos. ended 12 mos. ended 16 mos. ending 12 mos. ending Included in
Description 12/31/2017 12/31/2018 4/30/2020 4/30/2021 Rate Base
SOC Moderization 1,223 4,460 57,200 44,067 106,949

M. ELLIOTT ANDAHAZY
Line U-20836
No.
MEA-37
SOC Investments Presented in Instant Case 1
2
Change in SOC Investments 3
4
Q52. Can you further explain the issues causing the increase in budget to complete 5
the ESOC? 6
Yes. In addition to the costs incurred for construction delays caused by COVID, 7
there were other cost increases to the ESOC project since the Company filed MPSC 8
Case No. U-20561. These cost increases were driven by the following items: an 9
increase in square footage, additional testing and permitting, and a new IT 10
datacenter with additional integration efforts. Descriptions of these impacts can be 11
found in the following questions. 12
Change in SOC investments
Total Total to be
($000) Investment Included in
Description Case(s) Presented Rate Base
SOC Moderization U-20162 & U20561 110,683 106,949
SOC: ESOC U-20836 98,518 98,518
SOC: ASOC U-20836 34,526 30,531
Increase 22,361 22,100
SOC investments presented in the instant case (U-20836) plus historic investments
Historic Historic Projected Calendar Year Total
($000) 36 mos. ended 12 mos. ended 12 mos. ended 12 mos. ended 12 mos. ended Investment
Description 12/31/2019 12/31/2020 12/31/2021 12/31/2022 12/31/2023 Presented
SOC: ESOC 32,624 51,463 14,062 369 0 98,518
SOC: ASOC - - 577 9,982 23,967 34,526
Historic Historic Bridge Period Test Year Total to be
($000) 36 mos. ended 12 mos. ended 22 mos. ending 12 mos. ending Included in
Description 12/31/2019 12/31/2020 12/31/2020 10/31/2023 Rate Base
SOC: ESOC 26,941 51,463 14,369 62 98,518
SOC: ASOC - - 8,895 21,636 30,531

M. ELLIOTT ANDAHAZY
Line U-20836
No.
MEA-38
1
Q53. Why was the square footage of the ESOC increased from the original design? 2
When the SOC was proposed in MPSC Case No. U-20561, the original design was 3
approximately 42,000 square feet, and was intended to allow co-location of the 4
system operators from the existing SOC Control Room with the dispatchers from 5
the existing Central Dispatch. As the Company continued to evaluate the learnings 6
from benchmarking other utilities, DTE Electric determined that additional benefits 7
could be realized if critical support personnel were also co-located within the 8
ESOC. To accommodate these additional resources, the square footage of the 9
ESOC needed to increase. The square footage of the final design was 21,000 square 10
feet larger than the original design, totaling 63,900 square feet, to allow for the 11
revised plan to co-locate all required personnel. 12
13
Q54. Why is co-location of additional critical support staff important? 14
The additional co-location of critical support personnel is to increase efficiency and 15
collaboration among these employees and other Control Room staff. The Company 16
is defining critical support personnel as the Operational Engineering (OE) 17
workgroup, and the SCADA Realtime Support (SRS) workgroup. We know that it 18
is far more efficient to have all critical personnel who work on Control Room 19
processes in the same facility. These technical workgroups are an integral part of 20
operations in the Control Room and including them in the co-location effort further 21
enables the use of the ADMS tools by the Control Room personnel to better serve 22
customers. In addition to the co-location of the support personnel, several 23
collaboration rooms and an emergency operations room were added to enable the 24
efficient restoration of customers whenever a significant event occurs on the 25

M. ELLIOTT ANDAHAZY
Line U-20836
No.
MEA-39
system. Also, the ESOC was equipped with a training area that will enable the 1
incorporation of lessons learned into operations personnel day-to-day training. We 2
know this is consistent within the utility industry due to the benchmarking results 3
conducted and described in detail in Company Witness Bruzzano’s testimony in 4
MPSC Case No. U-20162 and MPSC Case No. U-20561. The current primary SOC 5
is located across two connected buildings and spans four floor levels. It is 6
approximately 40,000 square feet, including the separately located Central 7
Dispatch and Operations Engineering workgroups. This means that when system 8
changes occur and adjustments need to be made to respond accordingly, the 9
employees needed to coordinate activities may be located in multiple places and 10
must rely upon calling or emailing one another to give direction rather than 11
collaborating in the same location. Similarly, the current backup SOC has 12
approximately 5,000 square feet and the same constraints of not allowing the 13
Company to co-locate personnel effectively. The new ASOC was also scaled up 14
and is planned to be approximately 19,300 square feet. Both facilities are designed 15
to reduce the current inefficiencies associated with not having critical functions co-16
located. With the decision to co-locate these additional critical support resources, 17
the number of employees that would be accommodated at the ESOC rose by 18
approximately 60, which in turn drove an increase in IT costs for that same number 19
of computers, monitors, peripherals and their associated infrastructure, including 20
the labor to provision and install that equipment. 21
22
Q55. Why was there additional testing and permitting versus the assumptions made 23
in the original ESOC scope? 24

M. ELLIOTT ANDAHAZY
Line U-20836
No.
MEA-40
Independent quality testing for concrete, including caissons and foundations, steel, 1
roofing, and soil is required by the International Building Code, which has been 2
adopted by the State of Michigan to obtain the necessary permitting. As the project 3
scope development progressed, the Company identified the scope of this work was 4
underestimated and the final costs were higher than what was expressed in 5
Company Witness Bruzzano’s testimony in the previous MPSC Case No. U-20561. 6
7
Q56. How did the IT Datacenter with additional integration efforts increase for the 8
ESOC project? 9
When the SOC Modernization project was originally scoped, there was an option 10
to either serve the ESOC from a fully contained Datacenter incorporated within the 11
new facility, or from an external datacenter within the Corporate headquarters. The 12
original estimates reflected the option to serve the facility from an external source 13
within the Corporate Headquarters. While this option included a datacenter 14
footprint, it was not fully built out, so foundational infrastructure was included such 15
as cabling, workstations, internal network and power, yet the estimate did not 16
include the complete material requirements for a fully isolated network-ready 17
facility including an integrated, dedicated, datacenter. After the ESOC project 18
began, it became clear that to achieve the desired level of disaster tolerance needed 19
to ensure that the new facility would remain operational during significant events, 20
the other option with an integrated datacenter and network isolation design would 21
be required. Based upon this assessment and decision, the fully integrated 22
datacenter option was pulled into scope for the construction of the ESOC. The fully 23
integrated datacenter brought with it additional material investments for that 24
location including HVAC, Equipment racking, cabling, servers, storage, and all of 25

M. ELLIOTT ANDAHAZY
Line U-20836
No.
MEA-41
the other support equipment needed to activate a modern datacenter for this facility 1
while meeting all of the NERC certification requirements. This increased the level 2
of investment needed to achieve the updated design required. 3
4
Q57. What steps remain before the new ESOC is fully operational? 5
ESOC construction and the implementation of its IT systems are largely complete. 6
The Central Dispatch employees, and most of the other ESOC support personnel, 7
have moved into the new facility for daily operations. The only remaining items to 8
be completed are related to the NERC aspects of the facility and include turning on 9
the NERC Physical Perimeter Barrier, activation of Electronic Security Barriers, 10
separation of EMS/GMS applications, and the formal NERC certification of the 11
control room. Formal NERC certification is required before the Control Room 12
Operators may move into the ESOC and operate the EMS system in day-to-day 13
operations. The Company is on track to complete these last items and be fully 14
operational by the end of the first quarter 2022. 15
16
Q58. Is a new backup facility still needed for the ESOC? 17
Yes. The reasons for building a new modernized backup facility have not changed 18
since the Commission approved building a new ASOC in MPSC Case No. U-19
20561. As stated in Witness Bruzzano’s testimony in MPSC Case No. U-20561 20
(4T 199), given the critical nature of the ESOC in operating the electric 21
infrastructure, a backup facility is required in the event the primary facility is 22
inoperable. The existing backup facility is inadequate for sustained operations and 23
for disaster recovery efforts. Though it does meet minimum regulatory 24
requirements for NERC regulated Balancing Authority and Generator Operator 25

M. ELLIOTT ANDAHAZY
Line U-20836
No.
MEA-42
tasks, nevertheless managing the distribution system and recovering from a storm 1
or other disaster from the existing backup SOC would be extraordinarily 2
challenging and delay restoration of the distribution system. The new backup SOC, 3
also known as the ASOC, will have the appropriate square footage required to co-4
locate personnel and will have the appropriate mechanical and electrical system 5
redundancies, as discussed previously in my testimony. In addition, the new ASOC 6
will also be outfitted with the same ADMS technology (including a video wall) as 7
the new ESOC for seamless operations during the transition between facilities. This 8
will allow the Company to continue the use of the electronic records of the Network 9
Model rather than reverting to a paper version as is used in the current backup 10
facility. The planned location of the new ASOC has shifted from a site near the 11
existing backup SOC, to be connected to the new Waterford Service center (as 12
discussed in Company Witness Uzenski’s testimony). The ASOC will be located 13
approximately 25 miles away from the new ESOC and will allow the Company to 14
safely operate the grid in the case of a major adverse event at ESOC. Having both 15
a primary and alternate location to operate the grid is a NERC requirement to be 16
able to operate the electrical system and to recover from a catastrophic event safely 17
and quickly. 18
19
Q59. Why did the Company decide to move the location of the ASOC? 20
As previously indicated, the ASOC was still in its conceptual design phase when 21
MPSC Case No. U-20561 was submitted. Once the Company obtained a full design 22
with appropriate requirements, the forecasted costs were significantly higher than 23
what was initially presented. By constructing the ASOC at the same location as the 24
new proposed Waterford service center, the Company will be able to leverage 25

M. ELLIOTT ANDAHAZY
Line U-20836
No.
MEA-43
synergies in construction and reduce overall costs closer in alignment to the initial 1
estimates provided in MPSC Case No. U-20561. This new location still allows the 2
control room to relocate in case of an emergency in a reasonable amount of time to 3
not affect operations, and the shared space in the new service center will allow for 4
the co-location of the critical support staff as well. 5
6
Q60. What progress has been made on the new ASOC facility? 7
In 2020, the ESOC and ASOC were split into separate projects. This was due to 8
the delay in the overall SOC Modernization project, the decision to move the 9
location of the ASOC to leverage the planned construction of the Waterford service 10
center, and to the new timing of the ASOC construction. At present, the ASOC 11
project is in the planning and conceptual design phase. 12
13
Q61. What costs for the new ASOC were already approved in rates? 14
As discussed earlier in my testimony, in MPSC Case No. U-20162 and MPSC Case 15
No. U-20561, both the ESOC and ASOC were included as one line item titled SOC 16
Modernization in Exhibit A-12, Schedule B5.4. The Company presented a total 17
cost of $109.5 million, resulting in $106.9 million approved for inclusion in the rate 18
base for both facilities based on the test case years. This total included $33 million 19
for the conceptualized ASOC facility costs. 20
21
Q62. What are the current cost requirements of building the new ASOC? 22
In this instant case, the Company has separated out the cost of ESOC and ASOC in 23
the Exhibit A-12, Schedule B5.4, where the Company is presenting the revised 24
conceptualized cost for ASOC totaling $34.5 million in 2021-2023, which is a 25

M. ELLIOTT ANDAHAZY
Line U-20836
No.
MEA-44
slight increase over the original conceptualized cost of $33 million. These totals 1
can also be referenced in Table 5 for comparison. The cost associated with ASOC 2
is in addition to the costs associated with the Waterford service center as described 3
in Company Witness Uzenski’s testimony. As previously discussed in my 4
testimony, Table 6 displays the comparison in total costs between rate cases. The 5
Company is proposing to include an incremental $22.1 million in the rate base. 6
7
Q63. How will customers benefit from the total SOC Modernization project? 8
As described earlier in my testimony, the SOC Modernization project consists of 9
building two facilities, ESOC and ASOC, to address the current limitations in the 10
current facilities. Customers will benefit from the improved communication paths 11
between the resources that will be co-located in the new facilities, which will 12
facilitate quicker and improved coordination to create and implement restoration 13
strategies more effectively. Plus, customers will benefit from reduced risk in 14
disruption in operations during outage events, and faster restoration times 15
regardless of the facility from which the System Operations organization is forced 16
to operate. The ability to understand system conditions and dispatch resources to 17
address issues will be greatly enhanced by the technology available in the new 18
facilities and the co-location of the system operators, dispatchers, and support 19
personnel. In addition, ESOC will be more resilient and hardened to withstand 20
adverse natural and man-made disasters, allowing electric grid operations to 21
recover much more quickly in the event of a major catastrophe. 22
23
M. ELLIOTT ANDAHAZY
Line U-20836
No.
MEA-45
Q64. Did the delays in construction of the new ESOC and ASOC disrupt DTE 1
Electric’s ability to manage power outages and other system issues such as 2
equipment failures in the field? 3
No. The Company has continued to effectively manage the grid operations in the 4
current facilities following established procedures to coordinate resources and 5
monitor the grid. However, while the Company has been able to manage the grid 6
operations in the current facilities to date, we have not been able to do so in the 7
most efficient manner, and the investment in the two new facilities allows the 8
Company to mitigate the current limitations described above and improve 9
reliability as previously justified and approved by the Commission. 10
11
Q65. Does this complete your direct testimony? 12
Yes, it does. 13

STATE OF MICHIGAN
BEFORE THE MICHIGAN PUBLIC SERVICE COMMISSION
In the matter of the Application of ) DTE ELECTRIC COMPANY ) for authority to increase its rates, amend ) Case No. U-20836 its rate schedules and rules governing the ) distribution and supply of electric energy, and ) for miscellaneous accounting authority. )
QUALIFICATIONS
AND
DIRECT TESTIMONY
OF
KEEGAN O. FARRELL

DTE ELECTRIC COMPANY QUALIFICATIONS AND DIRECT TESTIMONY OF KEEGAN O. FARRELL
Line No.
KOF - 1
What is your full name, business address and by whom you are employed? 1
A1. My name is Keegan O. Farrell (he/him/his). My business address is: One Energy 2
Plaza, Detroit, Michigan 48226. I am employed by DTE Electric Company (DTE 3
Electric or Company) as the Manager of Demand Response. 4
5
On whose behalf are you testifying? 6
A2. I am testifying on behalf of DTE Electric. 7
8
What is your educational background? 9
A3. I graduated from Michigan State University with a Bachelor of Arts Degree in 10
Communication. In addition, I received a Master of Science Degree in Decision 11
Technologies from the University of North Texas. 12
13
What is your professional experience? 14
A4. From 2008 until 2012, I was employed by DTE Gas Resources, LLC in Fort Worth, 15
Texas where I held positions of increasing responsibility, ultimately serving as a 16
Decision Support Analyst. In this role, I was responsible for assisting with 17
calculating reservoir economics, monitoring daily oil and natural gas production, 18
and overseeing the compliance and emission calculations for the Environmental 19
Protection Agency’s Greenhouse Gas Reporting Program (Subpart W). In 2012, I 20
joined DTE Energy as a Senior Business Financial Analyst – Load Research. In 21
2014, I was promoted to Principal Financial Analyst – Load Research. In this 22
position, I was responsible for developing and implementing statistical sampling 23
programs used to evaluate customer class usage characteristics, developing 24

K. O. FARRELL Line U-20836 No.
KOF - 2
allocation schedules for use in cost-of-service studies and rate design, and for 1
measuring and evaluating demand response programs offered by the Company. 2
3
What is your current position? 4
A5. In 2018, I accepted the position of Supervisor Program Management – Demand 5
Response and in 2021 I was promoted to Manager of Demand Response. In this 6
position, I oversee the DTE Demand Response (DR) portfolio, which includes 7
electric and gas DR. I am responsible for the short- and long-term strategic 8
development and implementation of DR pilots and programs. 9
10
Do you currently participate in any industry associations? 11
A6. Yes. I am the course coordinator for the Association of Edison Illuminating 12
Companies (AEIC) Fundamentals for Load Data Analysis course. In addition, I 13
represent DTE Energy on the board of the Peak Load Management Alliance 14
(PLMA). 15
16
Have you received industry related training? 17
A7. Yes. I have completed the AEIC Fundamentals of Load Data Analysis course. I 18
have also attended various courses at Michigan State University Institute of Public 19
Utilities Annual Regulatory Studies Program as well as the Demand Response 20
Fundamentals and Evolution Course presented by the PLMA. 21
22
Have you testified previously before the Michigan Public Service 23
Commission? 24

K. O. FARRELL Line U-20836 No.
KOF - 3
A8. Yes. I have sponsored testimony and exhibits before the Michigan Public Service 1
Commission (MPSC or Commission) in the following DTE Electric cases: 2
Case No. Description 3
U-18014 DTE Electric 2016 General Rate Case 4
U-18255 DTE Electric 2017 General Rate Case 5
U-20162 DTE Electric 2018 General Rate Case 6
U-20471 DTE Electric 2019 IRP 7
U-20521 DTE Electric 2017-2018 Demand Response Reconciliation Case 8
U-20793 DTE Electric 2019 Demand Response Reconciliation Case 9
U-21044 DTE Electric 2020 Demand Response Reconciliation Case 10
11
Purpose of Testimony 12
What is the purpose of your testimony? 13
A9. The purpose of my direct testimony is to discuss the development of DR efforts that 14
DTE Electric is conducting and provide support for the expenditures and activities 15
associated with the continuation of existing programs and pilots, and the 16
Company’s proposals for new pilots. In addition, I discuss proposed changes to 17
demand response tariff language and customer penalty revenues from 18
underperformance during DR events. 19
20
Are you sponsoring any exhibits in the proceeding? 21
A10. Yes, I am sponsoring the following exhibits: 22
Exhibit Schedule Description 23
A-12 B5.6 Capital Expenditures – Demand Response 24
Portfolio and DTE Insight (page 1, lines 1-25

K. O. FARRELL Line U-20836 No.
KOF - 4
4 and page 2, lines 1-15) 1
A-12 B5.6.1 Peak Time Savings Pilot Document 2
A-12 B5.6.2 Battery Storage Pilot Document 3
A-12 B5.6.3 Residential Generator Pilot Document 4
A-12 B5.6.4 Residential Window A/C Pilot Document 5
6
Were these exhibits prepared by you or under your direction? 7
A11. Yes, they were. 8
9
How is your testimony organized? 10
A12. My testimony consists of the following five parts: 11
Part I Demand Response Portfolio 12
Part II Interruptible Air Conditioning Program 13
Part III Programmable Controllable Thermostat Program 14
Part IV Bring-Your-Own-Device Program 15
Part V Other Demand Response Programs and Pilots 16
Part VI Demand Response Customer Penalty Revenues 17
18
Part I: Demand Response Portfolio 19
What is the overall purpose of the DR programs and pilots that the Company 20
is managing and investing in? 21
A13. The Company has been managing and investing in a diverse range of programs and 22
pilots that serve as resources in the Company’s integrated resource planning. 23
Significant changes have been occurring in the energy landscape in the State of 24
Michigan including, energy legislation, regulatory framework, and environmental 25

K. O. FARRELL Line U-20836 No.
KOF - 5
regulations. These changes, coupled with a shift from fossil fuel-based generation 1
to renewable generation, are driving investment in a DR portfolio to support 2
resource adequacy. DR programs are, and will continue to be, an important part of 3
DTE Electric’s integrated resource portfolio. The Company’s DR programs are 4
being designed and managed to help reduce enrolled customers’ energy use during 5
peak hours. The reduction in customer usage from DR programs provide value to 6
both the utility and the customer through reduced capacity costs, and in turn, can 7
provide lower bills or incentives for customers utilizing the programs. 8
9
The DR programs are part of a utility system framework within the comprehensive 10
context of an Integrated Resource Plan (IRP) process. DTE Electric develops, 11
validates, and manages these programs, which offer customers a range of options 12
consisting of products, customer incentives, tariff structures, and education based 13
on their profiles and customers’ willingness to curtail energy usage during peak 14
hours. As part of the development process, the internal DR organization evaluates 15
programs and pilots, customer behavior, program acceptance and validates 16
technologies that can deliver benefits to utility customers. A portfolio of functioning 17
programs enabled the Company to continue providing secure, reliable, and 18
sustainable energy supply to its customers under a changing generation capacity and 19
energy landscape and will continue to do so in the coming years. 20
21
Is the evaluation and cost recovery of Demand Response investments governed 22
by a specific regulatory framework? 23
A14. Yes. The investments in DR are evaluated under the three-phase framework 24
approved by the Commission in Case U-18369 on September 15, 2017. 25

K. O. FARRELL Line U-20836 No.
KOF - 6
1
Could you describe the regulatory framework adopted by the Commission to 2
approve, recover, and reconcile expenditures in the Company’s DR portfolio? 3
A15. Yes. The Commission adopted the Staff’s recommendation of a “three-phase” 4
approach with some modifications. The three-phase approach is a multi-step 5
process which evaluates DR proposals in the context of the IRP in the first phase. 6
After DR plans are approved as part of the IRP, the DR program costs are 7
considered approved, and are included in rates in the utility’s next general rate case 8
during the second phase. The utility can propose changes to its DR programs or 9
pilots that can be evaluated and approved in general rate cases or demand response 10
reconciliation filings and later included in the following IRP. The third phase 11
involves a reconciliation of the DR costs, participation rates and demand savings 12
achieved on an annual basis. The Commission also stated that during the 13
reconciliation proceedings, actual capital spending in the examination period will 14
be reconciled against the amount approved in the IRP and recovered in the rate 15
case, while Operation and Maintenance (“O&M”) spending will be reconciled 16
against the amount approved and recovered in the general rate case. 17
18
Is the evaluation and cost recovery of the investments in the DTE Electric’s 19
DR portfolio subject to the framework approved in the Commission’s Order 20
in Case No. U-18369? 21
A16. Yes. The Commission approved a multi-year proposal presented by the Company 22
with modifications in its Order on April 15, 2020 in the Company’s IRP Case No. 23
U-20471. This approval constitutes the first phase in the three-phase framework 24
described above as related to the DR capital investments specifically included in 25

K. O. FARRELL Line U-20836 No.
KOF - 7
the bridge period of January 1, 2021 through October 31, 2022, and the projected 1
test year November 1, 2022 through October 31, 2023. The instant proceeding 2
represents the second phase in the DR three-phase framework. Accordingly, DTE 3
Electric requests that the approved DR capital costs from its recent IRP and the 4
associated O&M for those programs and pilots be included in rates. In addition, as 5
provided in the Commission’s Order in Case U-18369, the Company is proposing 6
changes to its DR programs and pilots. This is intended to support the timely 7
evaluation and approval in this rate case proceeding for future inclusion in a 8
subsequent IRP, which is due to be filed no later than September 1, 2023. 9
10
What DR programs and/or pilots were approved in the Company’s last IRP? 11
A17. In the 2019 order in case U-20471, the MPSC approved capital expenditures 12
associated with the interruptible air conditioning (IAC) switches and the 13
programmable communicating thermostats (PCTs), and the Bring-Your-Own-14
Device (BYOD) pilot1 and the Electric Power Research Institute (EPRI) pilot. Each 15
of these programs are discussed later in my testimony. 16
17
Could you provide an overview of the Company’s current DR portfolio? 18
A18. Yes. The Company currently has an established DR portfolio, which combines a 19
diverse set of programs for residential, commercial, and industrial customers. In 20
addition, the Company continues to invest in various pilots to enhance the current 21
portfolio offerings as well as leverage new technologies. The goal of the 22
Company’s DR programs is to deliver accountable peak demand reduction and 23
customer engagement. Pilots are potential programs focused on understanding 24
1 In 2019, BYOD was considered a pilot, but is now a program in the Company’s DR portfolio.

K. O. FARRELL Line U-20836 No.
KOF - 8
technology or design and to determine whether they are capable of becoming full-1
scale programs that will deliver accountable peak demand reduction. Pilots can 2
eventually become programs in the Company’s DR portfolio if they prove to be 3
successful. 4
5
Another classification used to define the type of program is whether the program is 6
dispatchable or non-dispatchable, which are distinguished by the reason for the 7
action. A dispatchable program is one in which an action is taken in response to 8
requests or “calls” from a utility. The dispatch may be communicated directly to 9
connected devices or to designated energy managers, who modify operations. Often, 10
there are non-performance penalties or other conditions designed to increase 11
customer compliance. Examples of dispatchable programs in the Company’s 12
portfolio include direct load control of air conditioning units or interruptible tariffs 13
for Commercial and Industrial customers. On the other hand, a non-dispatchable 14
program is one in which voluntary actions are taken by the customer to reduce or 15
shift demand from peak to non-peak periods. Time-of-use rates are an example of 16
non-dispatchable DR. With time-of-use rates, the prices customers pay vary based 17
on the time of day to reflect the varying cost to supply, typically higher during peak 18
hours and lower during non-peak hours. In order to reduce load during peak hours 19
and thereby reduce their overall cost, customers may voluntarily shift their usage to 20
the lower rate non-peak hours. 21
22
How much capacity does the Company’s existing DR portfolio account for in 23
meeting MISO’s resource adequacy requirements? 24

K. O. FARRELL Line U-20836 No.
KOF - 9
A19. For the 2021/2022 MISO Plan Year, DTE registered a total of 749 MWs of demand 1
response resources as Midcontinent Independent System Operator (MISO) Load 2
Modifying Resource (LMR) to meet resource adequacy requirements and is broken 3
out by program in Table 1. 4
5
DTE Electric Load Modifying Resource Program Registered Capacity 6
Program MW (ICAP2)
R10 Interruptible Supply Rider 304
D1.1 Interruptible Space Conditioning 174
D8 Interruptible Primary Supply Rate 103
R1.2 Process Heat Rider 63
D3.3 Interruptible General Service 13
R12 Capacity Release 33
R1.1 Metal Melting Rider 3
Bring-Your-Own-Device (BYOD) 55
Total 749
7
How much has the Company invested in the DR portfolio? 8
A20. The Company spent $5.9 million in capital expenditures associated with the DR 9
portfolio in 2020. Shown in Table 2 is the Company’s historical capital 10
expenditures from January 1, 2020 through December 31, 2020 by program. At the 11
time of the filing of DTE Electric’s instant rate case, the capital expenditures as well 12
as the O&M expenses associated with the DR portfolio for the calendar year 2020 are 13
subject to the ongoing reconciliation proceeding under Case No. U-21044. The 14
2 ICAP (Installed Capacity) values are used by MISO for their resource adequacy requirements.

K. O. FARRELL Line U-20836 No.
KOF - 10
referenced DR reconciliation case corresponds to the third phase described above of 1
the three-phase framework approved by the Commission in Case No. U-18369. 2
3
– Historical DR Capital Expenditures 2020 4
Programs ($ Thousand)
Historical 12 Mo. Ended
12/31/2020
Interruptible Air Conditioning (IAC) Program
$1,624
Programmable Controllable Thermostat (PCT) Program $2,599
Other DR Pilots3 $1,704
Total – DR Portfolio $5,927
5
How much is the Company forecasting to invest in the DR portfolio during the 6
bridge period of January 1, 2021 through October 31, 2022, and the projected 7
test year November 1, 2022 through October 31, 2023? 8
A21. The Company is forecasting to invest capital expenditures in the DR portfolio in 9
the amount of $19.9 million for the bridge period of January 1, 2021 through 10
October 31, 2022, and $9.7 million for the projected test year beginning on 11
November 1, 2022 and ending on October 31, 2023. A breakdown of these capital 12
expenditures is shown in Exhibit A-12, Schedule B5.6, Page 1 of 2. In addition, the 13
Company is forecasting to spend $2.7 million in operation and maintenance (O&M) 14
expenses in support of the DR programs and pilots. The associated O&M expenses 15
are shown in Company Witness Burns’ Exhibit A-13 Schedule C-5.9, line 9. The 16
3 Other DR Pilots include BYOD pilot, Peak Time Savings (PTS) pilot, as well as storage pilots

K. O. FARRELL Line U-20836 No.
KOF - 11
Company is planning to continue investments in the IAC, PCT, and BYOD 1
programs, as well as continuing to invest in other DR programs and pilots. 2
3
How do the O&M expenses support DR programs? 4
A22. The estimated expenses of $2.7 million represent the funding needed to support the 5
marketing, operation, and development of the portfolio of programs and pilots, 6
including staffing requirements to manage and monitor the existing portfolio, 7
software and technology to effectively run the programs and targeted customer 8
incentives. 9
10
Is the Company planning to increase the annual projected O&M expenses 11
versus the expenditure levels from prior annual periods? 12
A23. Yes. As some of the prior pilots transitioned to programs in the recent years, the 13
Company is focusing its material and human resources on the operation and 14
maintenance of those programs. Given the nature of these operation and 15
maintenance activities, the associated expenditures are considered O&M expenses 16
from an accounting perspective. In addition, external platform solutions that utilize 17
cloud technology are considered s software-as-a-service procurement and are 18
considered an O&M expense. The Company expects that this kind of technology 19
solution and type of service supply will become more prevalent for programs and 20
pilots in the future. 21
22
Is the DTE Insight Program and associated spend a component of the 23
Company’s DR portfolio? 24

K. O. FARRELL Line U-20836 No.
KOF - 12
A24. No. DTE Insight is a stand-alone program developed around a mobile application 1
that aims to drive customer behavior with the goal of reducing both overall energy 2
(gas and electricity) consumption and electricity demand during peak hours. The 3
DTE Insight program is discussed in the testimony of Company Witness Thac 4
Nguyen. 5
6 Part II: Interruptible Space Conditioning Program 7
What is the Interruptible Space Conditioning program? 8
A25. The interruptible space conditioning program, commonly referred to as the IAC 9
program or CoolCurrents™ is a dispatchable DR program, in which a direct load 10
control device (LCD) is installed on a customer’s air conditioning unit or central 11
heat pump in exchange for a discounted energy charge on the associated usage. The 12
Company is offering the IAC program under the Tariff D1.1 Interruptible Space 13
Conditioning Service Rate. 14
15
What is the status of the Company’s IAC LCD replacement program? 16
A26. Since the Company started replacing legacy LCDs in 2017, the Company has 17
successfully replaced a cumulative total of 166,568 units as of October 31, 2021, 18
with a goal of replacing approximately 214,000 by the end of the projected test 19
year. 20
21
Why is the Company continuing to make these improvements? 22
A27. The Company has identified that replacing the outdated infrastructure results in a 23
higher capacity value through increased capabilities and effectiveness. The 24
Company has increased the MISO acknowledged capacity on the IAC program as 25
the replacement of the older technology is occurring. The Company is currently 26

K. O. FARRELL Line U-20836 No.
KOF - 13
claiming 174 MWs of available capacity for the program in 2021 as shown 1
previously in Table 1. With continuous investment in the IAC program, DTE is 2
able to extend the equipment life as well as increase the available capacity in MISO, 3
all while continuing to provide an additional demand response program option for 4
residential and commercial customers. 5
6
Overall, continuous investment in the IAC program remains appropriate because 7
DTE Electric intends to upgrade the infrastructure and extend the equipment life 8
while increasing the available capacity in MISO. 9
10
Has the Company found any technical issues during the recent installation 11
activities? 12
A28. Yes. The Company found that some of the legacy LCD switches or Radio Control 13
Units (RCUs) are no longer connected by the necessary 24v wiring that powers the 14
switch. Without this wiring, a new LCD switch will not operate. In order for the 15
equipment to become operational, an electrician will have to repair the wiring to 16
accommodate the control unit. 17
18
Additionally, a software upgrade applied in late 2020 caused approximately 25,000 19
new LCDs to be manually reset. The Company chose to focus on resetting these 20
units in early 2021 rather than continue to install new LCDs. This contributed to 21
the Company missing its goal of installing 24,000 units in 2021 or having 22
approximately 180,000 switches replaced by year-end 2021. 23
24

K. O. FARRELL Line U-20836 No.
KOF - 14
Is the Company addressing the technical installation issue in some of the 1
customers’ legacy switches? 2
A29. Yes. DTE is evaluating options to address sites where the 24v line is inoperative. 3
The two main options under consideration include a proactive campaign requesting 4
the customer repair the wiring and notify the Company when the work is completed, 5
and an identification of alternative wired LCDs that are not dependent on 6
customers’ upgrade to a 24v line. These two options are part of the planned efforts 7
that the Company is embarking to finalize the complete program replacement by 8
the end of 2024. 9
10
Has the Company encountered any other issues with IAC program? 11
A30. Yes. The Company is seeing attrition in the IAC program due to the evolvement of 12
technology and other DR programs, such as the smart thermostat programs. Moving 13
forward, the Company is exploring new opportunities to educate current IAC 14
customers on the benefits of continued participation on the IAC program as well as 15
exploring opportunities to enroll new customers on the program. In addition, a 16
portion of legacy LCDs previously were not replaced as installers could not access 17
the LCDs for various reasons These issues are now being addressed and customers 18
are being given the opportunity to schedule their LCD replacement. 19
20
What are the Company’s planned efforts in managing the IAC program? 21
A31. Under its long-term IAC capital improvement plan, DTE Electric has installed new 22
devices and is planning to purchase and install additional devices. The cumulative 23
total of installed LCDs was 166,568 as of October 31, 2021. Table 3 below details 24
historical and projected installations. 25

K. O. FARRELL Line U-20836 No.
KOF - 15
1
2
– Historical and Projected IAC LCD Installations 3
Historical
12 Mo. Ended
12/31/2020
Projected 12 Mo. Ending
12/31/2021
Projected 8 Mo.
Ending 10/31/2022
Projected 12 Mo. Ending
10/31/2023
Ending Balance 158,212 170,212 190,212 214,212
4
The Company is managing the upgrade with a commensurate rate of unit purchases 5
while the installation work progresses throughout the bridge and projected test 6
periods. It is expected that those acquired units will be installed throughout the 7
respective periods while maintaining an adequate volume of units in inventory. 8
Concurrently, the Company is planning to execute on the 24v line installation 9
options mentioned above. 10
11
How much is the Company forecasting to invest in the IAC program during 12
the bridge period of January 2021 through October 2022, and in the projected 13
test year ending October 31, 2023? 14
A32. The Company is forecasting to invest $6.7 million in capital expenditures in the 15
projected bridge period January 1, 2021 through October 31, 2022, and $3.3 million 16
in the projected test year extending from November 1, 2022 to October 31, 2023. 17
The planned investment corresponds with a steady installation rate, and 18
commensurate unit purchases to replenish inventories, all in anticipation of 19
continued device installation that will occur during both the bridge and projected 20
test year. Overall, the investment plan supports the continuation of the existing IAC 21
replacement program as approved by the Commission in its Orders for general rate 22

K. O. FARRELL Line U-20836 No.
KOF - 16
cases Nos. U-17767, U-18014, U-18255, U-20162, and U-20561, and for the 1
Company’s IRP case No. U-20471. The associated projected capital expenditures 2
are shown in Exhibit A-12, Schedule B5.6, page 1 of 2, line 1, columns (c) through 3
(f). 4
5 Part III: Programmable Controllable Thermostat (PCT) Program 6
Could you please describe the PCT Program? 7
A33. The PCT program, marketed under the name SmartCurrents™, is a form of demand 8
response known as Variable Peak Pricing (VPP), in which the price of electricity 9
varies by time-of-day and also includes a critical peak price on days of high 10
demand. The Company is running the PCT program, which is available to 11
residential and commercial customers and requires customers to enroll or be 12
enrolled in the Dynamic Peak Pricing (DPP) tariff D1.8. Under the program, the 13
Company seeks to expand the number of participants on the existing DPP rate. 14
Customers who sign up to participate in the PCT program receive a free Wi-Fi 15
enabled thermostat and agree to take service under the DPP rate. The customer’s 16
enrollment allows the Company to send a signal to the Company-provided PCT 17
unit, that has been installed in the customer’s home, during a DPP critical peak 18
event. By participating in the program, customers allow the Company to send a 19
remote signal adjust the thermostat set-point by four degrees on critical peak days 20
when the cost per kWh increases to $0.95 between the hours of 3:00 P.M. and 7:00 21
P.M. The customer still retains the option to override the temperature set point; 22
however, manual overrides of the utility signal could drive the customer’s bill 23
higher with increased energy usage during the peak period. 24
25

K. O. FARRELL Line U-20836 No.
KOF - 17
Has the Commission been supportive of the implementation of the PCT 1
program? 2
A34. Yes. In its Order dated January 31, 2017 in the Company’s rate case No. U-18014, 3
the MPSC authorized capital expenditures to begin a pilot that would utilize a PCT 4
combined with the DPP rate. The initial goal of the pilot was to enroll 10,000 5
customers over the course of multiple years. In the Company’s subsequent rate 6
cases, the Commission denied additional funding, stating that a showing of initial 7
success would be required (Commission’s Order in Case No. U-18255), and that it 8
would not consider further expenditure until DTE Electric completes enrollment of 9
the first 10,000 customers and demonstrates some measure of success with the 10
program (Commission’s Order in Case No. U-20162). As the Company continued 11
the development of the PCT pilot demonstrating progressive measures of success, 12
it also requested further support for investing in the pilot in the subsequent 13
regulatory proceedings. The Commission in its final Order on April 15, 2020 in the 14
Company’s IRP case No. U-20471 supported the continued implementation of the 15
PCT pilot and approved the capital expenditure investment for the tri-annual period 16
extending from 2020 through 2022. Later on, the Commission in its Order on May 17
8, 2020 in the Company’s general rate case No. U-20561 indicated no objection to 18
the Company’s request for funding to support the implementation of the PCT pilot 19
to the level of enrollment that was requested in this latest approved general rate 20
case. More recently, in its Order on February 18, 2021 in Case No. U-20793, the 21
Commission approved the settlement agreement among the parties that affirms that 22
the Company’s reconciliation of 2019 DR program costs are reasonable, prudent, 23
and in the public interest. Those costs subject to the DR 2019 reconciliation case 24

K. O. FARRELL Line U-20836 No.
KOF - 18
included expenditures incurred in the continuous development and advancement of 1
the PCT pilot. 2
3
Has the Company transitioned the PCT pilot into a DR program? 4
A35. Yes. The Company decided to transition the PCT pilot into an established DR 5
program in 2021. First, the PCT pilot achieved increased customer interest and 6
engagement, and the Company identified increasing levels of customer enrollment 7
after the refined pilot marketing strategy and customer education efforts were fully 8
operational. Second, from a customer experience perspective, the pilot, now 9
program, also provides customers with an alternative time-of-use option, as well as 10
tools to manage their energy costs. Customer feedback has also been positive as 11
well as program attrition being low – the attrition rate of the PCT pilot is 9.8% as 12
of October 31, 2021. Third, the Company assessed the pilot’s potential contribution 13
to peak demand reduction and qualification as an LMR. 14
15
Can the DPP rate and the associated load reduction through DPP events be 16
used as an LMR to meet MISO resource adequacy requirements? 17
A36. Yes, in response to recent rate language modifications. To qualify as an LMR in 18
MISO, the notification window for an event must be no more than 12 hours. The 19
original event notification window for a DPP event was 6 P.M. on the day before 20
an event was to occur. Since the DPP events start at 3 P.M. and last until 7 P.M., 21
this made the minimum notification window 21 hours, which was initially too long 22
to qualify as an LMR. In the Company’s most recent IRP (Case No. U-20471), 23
MPSC Staff’s Witness David Isakson recommended reducing the notification 24
window to allow the qualification of DPP (including PCT) as an LMR. The 25

K. O. FARRELL Line U-20836 No.
KOF - 19
Company followed this recommendation and made an ex-parte filing (Case No. U-1
20923) on November 4th, 2020 to update the tariff language to read “up to 24 hours 2
before, but no less than 6 hours.” This language and reduced notification window 3
allows the Company to take capacity credit for MWs reduced during DPP event 4
hours to meet MISO resource adequacy requirements. The Commission approved 5
the updated language in its Order on February 4, 2021. This change affects any 6
customer taking service under rate schedule D1.8, regardless of their SmartCurrents 7
enrollment status. 8
9
Does the Company plan to use the load reduction from the DPP rate (including 10
that of PCT customers) to meet future MISO resource adequacy 11
requirements? 12
A37. Yes. First, the Company educated customers throughout 2021 and notified them of 13
the change regarding the notification window. The Company plans to take capacity 14
credit for the reduced MW to meet 2022/2023 MISO resource adequacy 15
requirements. The capacity credit will be taken for peak demand reduction resulting 16
from both the DPP rate only load reduction and the load reduction from customers 17
participating in the SmartCurrents™ program. 18
19
How many customers are enrolled on the PCT Program? 20
A38. As of October 31, 2021, the Company has enrolled 17,691 customers on the PCT 21
program. It is projected, that this will equate to approximately 10 MWs of future 22
capacity avoidance in the near term. 3,269 customers were removed from the PCT 23
Program on August 28, 2021 due to inactivity status or ineligibility which included 24
premise move-outs and rate changes. 25
K. O. FARRELL Line U-20836 No.
KOF - 20
1
What steps has the Company been undertaking to gain insights and further 2
develop the PCT program since the Company’s prior general rate case No. U-3
20561? 4
A39. At the end of 2020, there was a total of 16,137 customers enrolled in the pilot, 5
exceeding the 2020 year-end goal of 15,000 enrolled customers. Much of the 6
continued pilot success can be attributed to the implementation of enhanced 7
marketing and targeting strategies that resulted in increased interest and customer 8
engagement. In 2019, after analyzing multiple data points, such as enrollment data, 9
website performance and customer personas (generic customer segmentation 10
groups), the Company developed and executed new customer targeting and 11
messaging strategies that were carefully developed and tested through a series of 12
A/B experiments with messages tailored to each customer persona. A/B testing 13
consists of sending one variation of a campaign to a subset of your target audience 14
and a different variation to another subset, with the goal of identifying the top 15
performing variant based on email metrics and enrollment results. For example, the 16
persona identified as “Tech Free Let Me Be”, is perceived to be less technologically 17
informed based on their DTE interaction history and program participation; this 18
persona was targeted with a message focused on professional installation assistance 19
in an A/B experiment against the standard SmartCurrents email. The installation-20
focused variant outperformed the standard SmartCurrents email across each 21
measurement of the experiment. Based on this performance, the variant has now 22
been implemented as an ongoing tactic for this persona, and the exercise of 23
performing of A/B email experiments has become a standard ongoing practice for 24
PCT. Additionally in 2019, the Company expanded marketing plans to new 25

K. O. FARRELL Line U-20836 No.
KOF - 21
outreach channels (i.e., welcoming emails) targeting and accessing customers 1
sooner in the customer journey. In 2020, when the stay-at-home order went into 2
effect, DTE paused recruitment activities following the expressed concern of 3
customers’ ability to save on the DPP rate. In addition, the Company made a 4
commitment to its customers taking service under rate D1.8 (including PCT 5
customers) to pause calling any DPP events while the stay-at-home order was in 6
effect. During this pause, the Company focused on educating current customers on 7
the time-of-use component of the DPP rate and providing them with saving tips to 8
combat high bills. This increased focus resulted from learnings from focus groups, 9
in which the Company identified that ongoing education of programs that have a 10
rate element can increase satisfaction and participant referrals. The focus groups 11
revealed a strong desire among participating and potential customers to understand 12
how much they have saved on the rate or their potential savings on the rate. This 13
led to the development of the SmartCurrents Bill Comparison Communication that 14
launched in June 2021 to both potential and existing participants. The feedback 15
from the focus groups also lead to the Company designing “Everyday Rate 16
Education Experiments.” These experiments will prompt the customer to “set a 17
schedule” on their provided thermostat as well as offer in-the-moment reminders 18
of ways customers can shift their energy use to save during off-peak periods. These 19
prompts will be delivered through text messaging and in-home educational material 20
and executed throughout 2021. 21
22
What are the planned efforts to manage the PCT program going forward? 23
A40. The Company has been and remains committed to increasing the customer 24
enrollment levels throughout the bridge period from January 2021 through October 25

K. O. FARRELL Line U-20836 No.
KOF - 22
2022, and the projected test year from November 2022 through October 2023. The 1
continuous implementation of the PCT program includes the continued recruiting 2
of new customers for continued expansion of the program. The Company is 3
currently researching whether or not to offer a different thermostat brand through 4
SmartCurrents™ and if doing so would further the appeal of the program. The 5
Company is forecasting to reach an enrollment level of 19,000 customers by the 6
end of 2021, 23,000 customers by the end of the bridge period on October 31, 2022, 7
and 25,000 customers by the end of the projected test year on October 31, 2023. 8
The enrollment progress and projection are shown in Table 4. 9
10
Historic and Projected PCT Enrollments 11
Historical
12 Mo. Ended
12/31/2020
Projected 12 Mo. Ending 12/31/2021
Projected 8 Mo.
Ending 10/31/2022
Projected 12 Mo. Ending
10/31/2023
Ending Balance 16,137 19,000 23,000 25,000
12
How much is the Company forecasting to spend in the PCT program going 13
forward during the bridge period of January 1, 2021 through October 31, 14
2022, and in the projected test year ending on October 31, 2023? 15
A41. The Company is forecasting to invest $8.2 million in capital expenditures during 16
the bridge period of January 1, 2021 through October 31, 2022, and $3.5 million in 17
capital expenditures during the projected test-year period of November 1, 2022 18
through October 31, 2023. This level of spend is necessary to reach the customer 19
enrollment level of 23,000 by the end of the bridge period and of 25,000 by the end 20
of the projected test-year period and includes thermostats, installation and technical 21
support, program implementer support and other outside services. The associated 22
K. O. FARRELL Line U-20836 No.
KOF - 23
projected capital expenditures are shown in Exhibit A-12, Schedule B5.6, page 1 1
of 2, line 2, columns (c) through (f). In addition, the Company is planning to spend 2
$0.5 million in O&M to manage and operate the platform that serves as interface 3
with customers and is used to call events and monitor performance. The associated 4
O&M expenses are included in Company Witness Burns’ Exhibit A-13 Schedule 5
C-5.9, line 9. 6
7 Part IV: Bring-Your-Own Device (BYOD) Program 8
What is the BYOD program? 9
A42. The BYOD program, marketed under the name Smart Savers, is a program 10
available to residential and commercial customers who already have an installed 11
Wi-Fi enabled smart thermostat. The Company incentivizes customers to enroll in 12
the program. Once enrolled, customers’ thermostats are configured to allow the 13
Company to send a control signal during Smart Savers events, which raises the 14
thermostat’s set-point by up to four degrees during the event. Events only occur 15
Monday through Friday between the hours of 12:00 PM and 8:00 PM and are 16
limited to 14 events per year. As a result of this change in thermostat configuration 17
at the customer sites, the Company is able to account for demand reduction at peak 18
times during the called event. Smart Savers customers are always notified prior to 19
an event. In some instances, the Company will precool a participant’s home to 20
increase the energy savings recognized during the event. The customers can 21
override the event or opt-out completely if they choose to do so. No financial 22
penalties or incentive reductions are associated with the customers’ override 23
actions. 24
25
How many customers are enrolled in BYOD or Smart Savers Program? 26

K. O. FARRELL Line U-20836 No.
KOF - 24
A43. There were 34,764 devices enrolled in the Smart Savers Program as of October 31, 1
2021. The Company is currently claiming 55 MWs of available capacity for the 2
program in 2021 as shown previously in Table 1. 3
4
What are the Company’s planned efforts for the BYOD program going 5
forward? 6
A44. Based on the previously mentioned results regarding customer engagement through 7
enrollment and event participation as well as peak demand reduction levels, the 8
Company plans to continue marketing and operating the program. The Company 9
continues to monitor customer behavior during the events and evaluate if additional 10
measures or incentives are necessary to continue customer engagement. The 11
Company may initiate appropriate modifications based on program results. The 12
Company began registering the BYOD program as an LMR to meet MISO resource 13
adequacy requirements in 2020/2021 and continued to do so in the 2021/2022 Plan 14
Year. The Company plans to invest in the ongoing enrollment and integration of 15
the new enrollees with an interim goal of 35,000 by the end of 2021 and 50,000 by 16
the end of the test year period, and in the execution and evaluation of BYOD events 17
throughout the bridge period and the projected test year, which ends on October 31, 18
2023. Table 4 below shows historic and projected enrollment levels for the 19
program: 20
21
Historic and Projected BYOD Enrollments 22
Period
Historical 12 Mo. Ended
12/31/2020
Projected 12 Mo. Ending
12/31/2021
Projected 8 Mo. Ending
10/31/2022
Projected 12 Mo. As of
10/31/2023
Ending Balance 28,042 35,000 41,000 50,000

K. O. FARRELL Line U-20836 No.
KOF - 25
1
Has the Commission been supportive of the Company’s BYOD program? 2
A45. Yes. In its interim order in the Company’s IRP case U-20471, issued on February 3
20, 2020, the Commission was supportive of the BYOD then-pilot. Since the 4
Company was then directed to refile the DR forecasted capital expenditures 5
including costs for the BYOD pilot, the Company chose to remove all the capital 6
associated with “Other DR Pilots”, including that of the BYOD pilot, in its 7
compliance filing on March 20, 2020. Later, in the 2019 DR Reconciliation case 8
U-20793, the Company effectively included and updated the capital expenditures 9
for the approved BYOD program. In its Order on February 18, 2021, the 10
Commission approved the settlement agreement among the parties resulting from 11
the Company’s 2019 DR Reconciliation case No. U-20793 that included the 12
requested investment for the BYOD program. As further reaffirmative support, 13
following the Administrative Law Judge (ALJ)’s recommendation, the 14
Commission approved the capital expenditure request for the BYOD pilot, now 15
program, in its Order on May 8, 2020 in the Company’s 2019 general rate case No. 16
U-20561. 17
18
How much is the Company forecasting to spend in the BYOD program going 19
forward? 20
A46. The Company is forecasting to spend $1.8 million in O&M expenses on an annual 21
basis in the BYOD program. This level of O&M spend is necessary to reach the 22
estimated enrollment level of 41,000 by the end of the bridge period and a future 23
goal of 50,000 by the end of the projected test-year period. The associated projected 24

K. O. FARRELL Line U-20836 No.
KOF - 26
O&M expenses are shown in Company’s Witness Burns’ Exhibit A-13, Schedule 1
C5.9, line 9, column (i) and corresponding note 4. 2
3
Does the Company estimate an increase in O&M spend in the BYOD 4
program? 5
A47. Yes. The majority of the spend is necessary to conduct the operations and 6
management efforts for the marketing, enrollment, integration, and evaluation of 7
the annual target of BYOD customers and corresponding devices. For the use of a 8
demand response management system, the Company engaged in a specific contract 9
with EnergyHub, which is a nationally recognized industry leader in management 10
solutions with a focus on utility-driven programs. As indicated previously, the 11
O&M expenses are allocated to support the use of this external platform to integrate 12
customers and manage performance for the applicable DR programs on a looking 13
forward basis. As this external platform solution is now provided and operated 14
using Cloud technology, it is considered a software-as-a-service procurement, and 15
thus O&M expense. 16
17 Part V: Other Demand Response Programs and Pilots 18
What DR pilots is the Company investing in? 19
A48. The Company is developing or planning DR pilots as part of the ongoing evaluation 20
of its DR portfolio. First, the Company is currently implementing the Plug-in 21
Electric Vehicle (PEV or EV) pilot in partnership with the EPRI’s Transportation 22
Program. This pilot is known as the DTE Smart Charge pilot. Second, the Company 23
is launching, marketing, and implementing the Peak Time Savings (PTS) pilot 24
(formerly known as Peak Time Rebates (PTR) in prior filings) for residential 25
customers. Third, the Company is working on the implementation plans of a battery 26

K. O. FARRELL Line U-20836 No.
KOF - 27
energy storage pilot for or in conjunction with Commercial and Industrial 1
customers within the DR space. Fourth, the Company is evaluating the 2
development of two additional pilots through a Request for Information (RFI) with 3
potential impact on peak demand reduction: a residential generator pilot and an 4
interruptible window air conditioner pilot. Last, the Company’s DR organization is 5
supporting the development of Non-Wire Alternatives (NWA) pilots that are being 6
developed under the leadership of the Distribution Operations (DO) organization 7
and sponsored in this proceeding by Company’s Witness Pfeuffer. 8
In addition to the aforementioned pilots, the Company is evaluating the 9
improvement of two additional programs. The first is the replacement of LCDs in 10
the interruptible water heating program. The second is an enhancement for current 11
C&I interruptible customers and consists of a dashboard or platform that would be 12
provided to C&I customers already on an interruptible rate to help improve event 13
performance. 14
15
What is the Company’s overall approach to develop and manage the ongoing 16
and future DR pilots? 17
A49. As described at the beginning of my testimony, the Company designs and executes 18
DR programs to help customers reduce their peak energy use, which provides value 19
to the participating customers, in the form of savings or other compensation, to the 20
utility through reduced capacity needs and lower capacity costs, and all customers 21
through reduced overall system costs. The Company has several successful, long-22
term programs which support its peak-reduction objectives, and many other pilot 23
efforts through which the Company explores diverse opportunities to engage 24
customers and reduce peak load. However, our DR offerings and customer 25
K. O. FARRELL Line U-20836 No.
KOF - 28
engagement should not remain static over time, and the continued development of 1
pilots is critical to ensure a pipeline of learnings to support future programs and to 2
present customers with the best program offerings. To support ongoing pilot efforts, 3
the Company needs to remain agile enough to efficiently redeploy DR pilot 4
spending and resources as capacity needs change, customer behaviors evolve, 5
program acceptance is assessed, or other more cost-effective technologies and 6
opportunities arise in the near future. This flexibility will ensure DTE Electric is 7
well positioned to expand existing or future programs to respond to changing 8
market conditions and customer behavior. The Company continues to evaluate 9
alternative programs that may emerge as a result of insights from pilots or utility 10
benchmarking efforts. In the coming years, the Company expects to continue 11
developing new pilots and programs that may become economic alternatives to 12
capacity and have an appropriate level of customer adoption potential. 13
14
What is the EV or DTE Smart Charge pilot? 15
A50. The Company is conducting a pilot that involves a partnership with the EPRI 16
Transportation Program. The pilot leverages EPRI’s PEV platform to streamline 17
the management of PEV charging. The Company is partnering with specific PEV 18
automotive manufacturers in its service territory to assess the effectiveness of the 19
Open Vehicle Grid Integrated Platform (OVGIP) concept to integrate PEV 20
charging with grid objectives through demand response. The Company and the 21
automotive manufacturers (OEMs) seek a better understanding of the 22
responsiveness of the PEV owners and their willingness to participate in DR events 23
specifically targeted at vehicle charging and the amount of demand that is curtailed 24

K. O. FARRELL Line U-20836 No.
KOF - 29
through events. As previously mentioned, this pilot was pre-approved for capital 1
cost recovery in the Company’s last IRP. 2
3
What are the EV pilot’s main objectives? 4
A51. The Company is focusing on the main pilot objectives as the pilot expands to a 5
larger population: 6
• Evaluate energy reduction (kWh) and demand reduction (kW), 7
• Evaluate results from different times, lengths, and participation levels of events, 8
• Assess EV user behavior in response to different incentive mechanisms such as 9
up front and program-end incentives, 10
• Assess override (Opt-in / Opt-out) approach by EV users, and 11
• Test deliverability of events, for instance, ensuring communication signals 12
functioned properly. 13
14
What are the customer benefits of participating in the EV pilot? 15
A52. In addition to receiving an incentive from the Company for their participation, 16
customers will be given a unique way to manage their EV charging. Pilot customers 17
will also be able to share feedback to the Company and OEMs on charging habits 18
and shape the future of EV charging as a DR resource. In addition, participating 19
customers will learn about the concepts of demand response as well as reverse 20
demand response. 21
22
What is the estimated impact of the EV pilot for the pilot duration? 23
A53. The Company is working with the OEMs to evaluate the performance of 2021 24
events. In 2019, the Company called twelve (12) events in a 6-month timeframe. 25

K. O. FARRELL Line U-20836 No.
KOF - 30
The Company and OEMs identified a total demand response reduction of 702.1 1
kWh across all 12 events. The average participation from PEVs across all of the 2
events was 24% full participation and 76% partial or non-participation, which 3
overall provided an initial assessment of the customer override behavior (Opt-4
in/Opt-out). These events consisted of 165 customers who were employees of the 5
OEMs and were designed to ensure any issues (i.e. communication or signal issues) 6
could be solved prior to an expansion of a larger pool of customers. 7
8
Could you expand on the implementation plan for the EV Pilot? 9
A54. Yes. The continuation of the pilot initially scheduled for 2020 didn’t resume until 10
2021 due to delays experienced by the OEMs. In April 2021, the Company began 11
recruitment of all eligible electric vehicle owners who drive a partnered OEM 12
vehicle within DTE Electric’s service territory with a goal to enroll up to an 13
estimate of 1,000 participants. As of October 31, 2021, the pilot has 347 14
participants. The first DR event occurred on May 19, 2021, and the Company 15
estimates that there will be at least 30 DR events called throughout calendar year 16
2021. This stage of the pilot development and testing extended through December 17
2021. Based on the verified results (i.e., peak load reduction), the Company and 18
partnered OEMs will assess the opportunity to expand the pilot into a more fully 19
developed, larger-scale public program in the future. 20
21
How will the EV pilot be evaluated? 22
A55. In addition to working with the OEMs to measure the load reduction during events, 23
the Company and OEMs will monitor customer engagement in the acquisition 24
phase based on available marketing metrics. The Company and OEMs plan to 25

K. O. FARRELL Line U-20836 No.
KOF - 31
conduct consumer research to assess customers’ overall experience and likelihood 1
to recommend, satisfaction ratings and motivational factors. Additionally, the 2
Company and OEMs have agreed to call reserve DR events to measure the how 3
customers respond to being asked to start charging their vehicle and specified times. 4
5
How much is the Company forecasting to invest in the EV pilot? 6
A56. The Company is forecasting to invest $0.78 million in capital expenditures during 7
the bridge period and $0.35 million during the forecasted test year. These amounts 8
are included in the Other Demand Response Programs and Pilots funding shown 9
in Exhibit A-12, Schedule B5.6, page 1 of 2, line 3, column (c) through (f). 10
11
What is the Peak Time Savings (PTS) pilot that the Company is investing in? 12
A57. The PTS pilot, formerly known as Peak Time Rebates, is structured to reward 13
customers for reducing energy consumption during the Company’s called Peak 14
Time Events. The participating customers will receive bill credits for each event 15
based on measured reductions in customers’ energy demand relative to a pre-16
established baseline, which has been initially developed based on features of 17
comparable utility programs. Unlike the Company’s current DPP rate, the PTS pilot 18
does not increase a customer’s electric rate during peak events, but instead provides 19
customers with a no-risk introduction to demand response. 20
21
What are the main objectives of the proposed PTS pilot? 22
A58. The main objectives of the PTS pilot are as follows: 23
• Analyze outcomes to determine potential peak-savings impacts and the impact 24
on rates and revenues. 25
K. O. FARRELL Line U-20836 No.
KOF - 32
• Assess customer receptiveness and the value customers receive from PTS; and 1
• Identify and process new learnings that could be applied to current and future 2
demand response offerings. 3
4
What are the customer benefits of participating in the PTS pilot? 5
A59. The PTS pilot provides customers with a tool to become familiarized with the 6
concepts of peak demand and demand response in a “no regrets” environment. 7
Through the PTS pilot, customers will be able to gain a greater understanding of 8
energy usage and its impact on their electric bills and how to save. Because of the 9
no-risk design, customers who are uncomfortable with the design of other demand 10
response programs may be drawn to this pilot. Based on benchmark findings, the 11
no-penalty design of the PTS pilot should broaden the program reach amongst the 12
DTE Electric customer base, influence high participation and retention rates, and 13
increase customer satisfaction. Participating customers who reduce their energy 14
consumption during the called events will also benefit from reduced energy bills 15
through bill credits. 16
17
What is the estimated impact of Peak Time Events for the pilot duration? 18
A60. The Company currently estimates that the impact of the pilot would be 19
approximately three (3) megawatts (MW) of peak demand reduction, and savings 20
in energy consumption ranging anywhere from 155 to 260 megawatt hours (MWh) 21
over the course of the pilot. 22
23
Could you expand on the implementation plan of the PTS pilot? 24

K. O. FARRELL Line U-20836 No.
KOF - 33
A61. Yes. The Company launched the PTS pilot as recruitment started in Summer 2021 1
with the first invitations sent in June 2021, coinciding with the first summer event 2
season. Throughout the complete customer acquisition phase, the PTS pilot is 3
expected to be offered to approximately 450,000 residential electric customers who 4
will “opt-in” to the pilot, with the goal of obtaining 10,800 eligible participants, 5
based on performance of other DTE pilots. As of October 31, 2021, the PTS has 6
8,919 customers enrolled in the pilot, 36% of which are considered low-income. 7
The PTS pilot is designed to test different variable sets during its two phases to 8
inform the design of a potential full-scale program. First, during the customer 9
acquisition phase, which is expected to conclude on December 31, 2021, the pilot 10
is testing three sets of marketing and outreach variables (i.e., three rebate levels, 11
two benefit messages, and various outreach channels) to determine which 12
combinations result in the highest opt-in rates. Then, during the event phase, the 13
pilot will test the responsiveness of different customer groups (i.e., high technical 14
potential, low-income, and mixed potential / mixed income) to different rebate 15
levels. Peak Time Events will be called on weekdays from 3 p.m. to 7 p.m., 16
excluding holidays, during all four seasons of the year with a maximum of 14 17
occurrences (or 56 hours) in a calendar year. Customers will be notified of events 18
via email and/or text by 6 p.m. the day prior, as well as receive reminders prior to 19
the start and end of each event. Following each event, the Company will assess the 20
impact on peak savings by comparing the customers’ actual electricity usage during 21
an event to a pre-determined baseline calculated based on a set of the highest non-22
holiday weekday usage in prior periods. Participating customers are expected to 23
receive a bill credit to the extent that a reduced home energy usage is verified during 24
the peak demand event announced by the Company. The pilot has developed 25

K. O. FARRELL Line U-20836 No.
KOF - 34
comprehensive webpages in order for the Company to provide customers with an 1
overview of the program and answer common questions, automatically process 2
enrollments completed via self-service, collect customer event notification 3
preferences, and provide an educational connection point for pilot participants, for 4
instance when they need savings tips to reduce usage during events or when they’d 5
like to review their individual event performance. Additionally, the pilot offers a 6
dedicated team of customer service advisors specifically trained to answers all PTS 7
questions and complete enrollment or unenrollment on behalf of the customer. As 8
indicated above, the recruiting phase started in Summer 2021, and the Company 9
has and will continue to invest in the execution of the pilot throughout the 10
development, launch, recruitment, and event phases in 2021 and 2022. The first 11
event season began in Summer 2021 with the first Peak Time Event called on 12
August 25, 2021, with 2,235 customers enrolled at the time of the event. Overall, 13
the pilot is tentatively scheduled to conclude at the end of Summer 2022. At that 14
time, the pilot will be fully evaluated to determine the next steps, which could 15
include, but are not limited to, continuing the pilot, continuing the pilot with 16
modifications, or discontinuing the pilot. Participants will be notified of any 17
outcomes. 18
19
How will the PTS pilot be evaluated? 20
A62. To evaluate the viability of PTS as a full-scale program, the Company will assess 21
peak demand reduction and overall energy use impacts and will monitor customer 22
engagement in the acquisition phase based on available marketing metrics. 23
Additionally, the Company plans to conduct consumer research to assess 24

K. O. FARRELL Line U-20836 No.
KOF - 35
customers’ overall experience and likelihood to recommend, satisfaction ratings 1
and motivational factors. 2
3
How much is the Company forecasting to invest in the PTS pilot? 4
A63. The Company is forecasting to invest a total of $1.7 million in capital expenditures 5
over the bridge period and the forecasted test year and is included in Other Demand 6
Response Programs and Pilots shown in Exhibit A-12, Schedule B5.6, page 1 of 2, 7
line 3, columns (c) through (f). In addition, the Company is planning to spend $0.25 8
million in O&M expenses to support the pilot and complement the implementation 9
activities. The associated projected O&M expenses are included in Demonstrating 10
and Selling Expenses – DR in Company’s Witness Burns’ Exhibit A-13, Schedule 11
C5.9, line 9. 12
13
Could you describe the battery energy storage pilot with C&I customers that 14
the Company is planning to invest? 15
A64. Yes. The battery energy storage pilot will be a behind-the-meter (BTM) lithium-16
ion battery energy storage system (BESS) at customers’ sites. It is designed to test 17
the ability to achieve peak demand shaving or shifting during demand response 18
events. As part of the implementation plan, the Company is looking to partner with 19
one or two C&I customers. 20
21
What are the main objectives of the BTM battery energy storage pilot? 22
A65. The main objectives of the designed pilot are as follows: 23
• Evaluate the effectiveness of the BESS to achieve system peak demand 24
reduction when a demand response event is called by the Company. 25

K. O. FARRELL Line U-20836 No.
KOF - 36
• Assess customer’s actions to achieve demand charge and overall bill reduction. 1
• Gain operational experience on battery installation, management, and control 2
interfaces when the system is located in a customer’s site as opposed to a 3
Company’s site. 4
• Engage with customers to better understand their interest in hosting and 5
potentially escalate BESS. 6
• Assess feasibility for sharing asset control between customer and the Company; 7
and 8
• Facilitate the understanding of multiple energy storage values, compensation 9
models, and the integration of battery storage in wholesale markets to support 10
tariff development as contemplated by the Commission’s order in MPSC Case 11
No. U-21032. 12
13
What are the customer benefits of participating in the BTM battery energy 14
storage pilot? 15
A66. The pilot will target customers who are already enrolled on the Company’s Rate 16
D4, Rate D6.2 or Rate D11 electric tariffs (excluding sites or load under Rider 10) 17
since those customers are more suited for a pilot participation due to their peak load 18
profiles, outdoor space availability and operational capabilities. The Company will 19
retain the ability to control the BESS when calling a dispatch event while the 20
customer will retain the option to use the BESS when the Company does not call 21
an event. The dispatch strategy will consider the ability for the Company to call a 22
certain number of scheduled DR events with a prior-day notification, and a very 23
limited number of emergency DR events with immediate notification. When no 24
Company DR event is planned, the customer will be able to dispatch the BESS to 25

K. O. FARRELL Line U-20836 No.
KOF - 37
address its facility energy needs on a day by day basis. It is expected that more 1
detailed commercial arrangements will balance the different control and use 2
possibilities split between the Company and the customer. This arrangement will 3
allow for the customer to get experience operating a battery while potentially 4
reducing peak operating costs. 5
6
What are the estimated impacts of the BTM battery energy storage pilot? 7
A67. While the design parameters are subject to change as the Company moves forward 8
with the pilot engaging the customer host, the battery will likely be up to 500 kW/2 9
MWh at each of potentially two sites to reduce peak customer and system demand 10
over an event of up to 4 hours. In the recently finalized Request for Information 11
(RFI), the technical parameters of the proposals ranged between 250kW/4 hours 12
and 500kW/8 hours, providing the Company with a better assessment of the 13
potential equipment availability, and with flexibility to design alternative 14
implementation plans that can better match the variable customers’ sites. 15
16
Could you expand on the implementation plan for the BTM battery energy 17
storage pilot? 18
A68. Yes. The Company completed the RFI in March 2021. The results of the RFI 19
highlighted aspects that need to be considered during the equipment acquisition and 20
installation stages and were reflected in the subsequent Request for Proposal (RFP). 21
The Company has conducted the RFP with additions of detailed requests for 22
adherence to strict fire safety standards, equipment delivery time, and updated costs 23
for more specific pilot siting or siting’s within the Company’s service territory. The 24
Company is in the process of finalizing its selection of a specific equipment 25

K. O. FARRELL Line U-20836 No.
KOF - 38
provider based on information gathered from the RFP. Once a vendor is officially 1
selected and contracted, the Company will initiate the marketing and outreach 2
activities to engage and contract with the pilot host customer and/or customers that 3
can better fit the characteristics of the intended configuration and proposal resulting 4
from the RFP. The pilot development and installation are forecasted to extend 5
throughout 2021 and 2022, with a current estimated installation in 2023, depending 6
on the selected proposal resulting from the RFP, the potential need of equipment 7
testing for safety and configuration with DTE Electric’s systems, and on the 8
commercial arrangement with the host customer. 9
10
How will the BTM battery energy storage pilot be evaluated? 11
A69. The BTM battery energy storage pilot will be evaluated by measuring the load 12
reduction during events called by the Company against the battery expected 13
parameters as well as the evaluation of other system impacts. The customer peak 14
load reduction will also be evaluated to observe the peak bill reduction on the 15
customer’s bill for both Company called events and customer’s use. The Company 16
will also look to evaluate communication and sharing of the battery controls with a 17
customer. 18
19
How much is the Company forecasting to invest in the BTM battery energy 20
storage pilot? 21
A70. The Company is forecasting to invest $2.8 million in capital expenditures for a 22
planned two site-project of 1,000 kW / 4 MWh total. A limited capital investment 23
amount of the total projection has been allocated for the respective bridge period 24
and projected test-year period of this general rate case, and is included in the Other 25

K. O. FARRELL Line U-20836 No.
KOF - 39
DR Programs and Pilots funding shown in Exhibit A-12, Schedule B5.6, page 1 of 1
2, line 3, column (c) through (f). 2
3
Will this battery storage pilot facilitate the understanding of multiple energy 4
storage values, compensation models, and the integration of battery storage in 5
wholesale markets to support tariff development as contemplated by the 6
Commission’s order in U-21032? 7
A71. Yes. The Commission’s August 11, 2021, Order in Case No. U-21032 encourages 8
utilities to propose, in upcoming rate cases, “well-designed retail tariffs that account 9
for the full value stack ESRs offer, while also allowing for participation through 10
the utility in regional wholesale markets” (Order at p. 27). The order contemplates 11
utilities participating in wholesale electricity markets on behalf of customer-owned 12
energy storage resources. In order to develop such tariffs and related pilot programs 13
for customer-owned battery storage, the Company needs to gain experience with 14
the application of storage technology by end use customers and interactions with 15
the wholesale market. The proposed energy storage pilot will provide data and other 16
learnings on the services and values battery storage can provide to end use 17
customers and the utility and how storage can be paired with complementary 18
programs such as demand response to maximize value and optimize operation of 19
energy storage. The energy storage applications in this pilot will serve an energy 20
management function for the participating customers to help reduce electricity bills 21
while also providing services when needed by the utility to support reliability in the 22
bulk power system. Quantifying how the storage is used, the associated values it 23
brings to the customer and the Company, direct and indirect costs, and coordination 24
between the customer and the Company will help the Company develop appropriate 25

K. O. FARRELL Line U-20836 No.
KOF - 40
tariffs and compensation models as contemplated by the Commission.The 1
Company expects to engage further with the Commission and stakeholders to 2
develop such tariffs using data from the pilot. 3
4
Could you describe the residential generator pilot that the Company plans to 5
invest in? 6
A72. Yes. The Company plans to conduct a residential customer-owned natural gas 7
generator pilot. The pilot will leverage a third-party service provider’s platform 8
utilizing telemetry to shift customers' electric load to the customers' generator in 9
real-time during peak events. Initial plans indicate that the customers will receive 10
an incentive for their participation in the program. 11
12
What are the general objectives in pursuing a residential generator pilot? 13
A73. The main objectives of the residential generator pilot are as follows: 14
• Assess the viability of a program that can act as a year-round DR asset 15
responding on short-term notices for peak events 16
• Determine whether customers would be willing to participate actively and allow 17
for real-time telemetry to control their generators during an event 18
• Measure how effective the customer-owned generators respond as a year-round 19
LMR 20
• Assess customer receptiveness and the value customers receive from a 21
residential generator pilot; and 22
• Identify and process new learnings that could be applied to current and future 23
demand response offerings. 24
25

K. O. FARRELL Line U-20836 No.
KOF - 41
What are the customer benefits of participating in the residential generator 1
pilot? 2
A74. Pilot participants will benefit by receiving an incentive from the Company as well 3
reduced electric bills during peak events. 4
5
What is the estimated impact of the residential generator pilot for the pilot 6
duration? 7
A75. Through early analysis, it is estimated that there are at least 60,000 residential 8
generators with an estimated impact of 5kW of load reduction per unit. The 9
Company is plans to issue a Request for Information (RFI) to better understand the 10
opportunities for a demand response pilot that exist within the Company’s service 11
territory. 12
13
Could you expand on the implementation plan of the residential generator 14
pilot? 15
A76. Yes. The Company is working on a progress plan that includes the engagement 16
with the third-party supplier of the platform and customer interface at the 17
conclusion of the RFI, and subsequently, engagement of specific customers in 18
2022. 19
20
How will the residential generator pilot be evaluated? 21
A77. The Company considers that the following metrics will be in place and tracked to 22
evaluate pilot effectiveness: customer acquisition and enrollment rates (including 23
attrition), marketing metrics (outreach activities and their impact), and load shed 24
during different type of events. 25
K. O. FARRELL Line U-20836 No.
KOF - 42
1
How much is the Company forecasting to invest in the residential generator 2
pilot during the bridge period of January 2021 through October 2022, in the 3
projected test year ending October 31, 2023? 4
A78. The Company plans to invest $0.46 million in capital through the bridge period and 5
projected test year and is included in the Other DR Programs and Pilot funding 6
shown in Exhibit A-12, Schedule B5.6, page 1 of 2, line 3, columns (c) through (f). 7
8
Could you elaborate on the plans to develop a residential window air 9
conditioning pilot? 10
A79. Yes. The Company plans to conduct a residential customer-owned window air 11
conditioning pilot. The pilot will leverage a third-party service provider’s demand 12
response platform to interface with devices to cycle and/or offset the temperature 13
during peak events and evaluate performance. Initial plans indicate that the 14
customers will receive an incentive for their enrollment and participation in the 15
pilot. Additionally, the Company is exploring options to provide customers with a 16
company-owned hardware solution to transform any window air conditioning unit 17
to a Wi-Fi-enabled demand response resource to broaden the eligible audience. 18
19
What are the general objectives in pursuing a residential window air 20
conditioning pilot? 21
A80. The overall objective of a residential window air conditioning pilot is to assess the 22
viability of a program that can act as a summer DR asset responding on short-term 23
or long-term notices of peak events. In addition, other objectives include: 24

K. O. FARRELL Line U-20836 No.
KOF - 43
• understanding customer receptiveness to the pilot concept, different 1
incentive offers, and varying event methodologies, 2
• evaluating overall energy reduction (kWh) and demand reduction (kW), 3
• evaluating peak event results from different methodologies, times, lengths, 4
and participation levels, 5
• identifying and processing new learnings that could be applied to current 6
and future demand response offerings. 7
8
What are the customer benefits of participating in the residential window air 9
conditioning pilot? 10
A81. Pilot participants will benefit by receiving an incentive from the Company as well 11
reduced electric bills during peak events. 12
13
What is the estimated impact of a residential window air conditioning pilot 14
duration? 15
A82. Through early analysis, it is estimated that are approximately 25% of households 16
have a window A/C unit within the Company’s service territory. The Company is 17
plans to issue a RFI to better understand the opportunities for a demand response 18
pilot and the load reduction capabilities that exist within the Company’s service 19
territory. 20
21
Could you expand on the implementation plan of the residential window air 22
conditioning pilot? 23

K. O. FARRELL Line U-20836 No.
KOF - 44
A83. The Company is working on a project plan that includes the engagement with a 1
third-party supplier of the platform and customer interface, and subsequently, 2
engagement of eligible customers in 2022. 3
4
How will the residential window air conditioning pilot be evaluated? 5
A84. The Company considers that the following metrics will be in place and tracked to 6
evaluate pilot effectiveness: customer acquisition and enrollment rates (including 7
attrition), marketing metrics (outreach activities and their impact), and load shed 8
during different type of events. 9
10
How much is the Company forecasting to invest in the residential window air 11
conditioning pilot during the bridge period of January 2021 through October 12
2022, in the projected test year ending October 31, 2023? 13
A85. The Company plans to invest $0.7 million in capital through the projected test year 14
and is included in the Other DR Programs and Pilot funding shown in Exhibit A-15
12, Schedule B5.6, page 1 of 2, line 3, columns (c) through (f). 16
17
Could you elaborate on the plans to replace water heating control units? 18
A86. Yes. The Company plans to begin the replacement of approximately 48,000 19
residential and commercial water heating load control units for customers who 20
currently take service under the water heating service rate or D5 in 2023. By taking 21
service under this separately metered rate, customers’ water heating units can be 22
interrupted remotely by the Company in exchange for a discounted energy charge 23
for the associated usage. Similar to the reasons behind the IAC replacement project, 24
the Company has identified that the original LCD units that currently reside in 25

K. O. FARRELL Line U-20836 No.
KOF - 45
customers’ homes have reached the end of life and no longer function as intended. 1
The pilot will also study the feasibility of recruiting new customers onto the 2
interruptible water heating rate. 3
4
What are the general objectives in replacing the water heating control units? 5
A87. By investing in a water heating control unit replacement program, the Company is 6
able to extend the equipment life as well as increase the available capacity in MISO. 7
This program also provides an additional demand response program option for 8
residential and commercial customers. 9
10
How much is the Company forecasting to invest in the Interruptible Water 11
Heating program during the bridge period of January 2021 through October 12
2022, in the projected test year ending October 31, 2023? 13
A88. The Company plans to begin the project in early 2023 and is forecasting to spend 14
$0.15 million in capital through the projected test year and is included in the Other 15
DR Programs and Pilot funding shown in Exhibit A-12, Schedule B5.6, page 1 of 16
2, line 3, columns (c) through (f). 17
18
What is the Commercial and Industrial (C&I) Dashboard Technology that the 19
Company would like to provide interruptible customers? 20
A89. The Company is planning to partner with a program implementer to provide C&I 21
customers who take service under a demand response tariff (i.e. D8, R10 and R12) 22
with technology and software so customers can better understand and sequentially, 23
improve upon their event performance. In addition, the technology can provide 24

K. O. FARRELL Line U-20836 No.
KOF - 46
more advanced analytics for better DR forecasting for the Company to provide to 1
MISO. 2
3
How can the C&I Dashboard Technology assist customers during 4
interruptible events? 5
A90. The technology provides real time telemetry to the customer and the Company, so 6
the event performance is monitored in real time and displayed on a dashboard for 7
the participating customer and the Company. This instantaneous feedback lets both 8
the customer and the Company know if additional actions need to be taken to reduce 9
load to committed levels. In addition, the technology provides more advanced 10
analytics for better DR forecasting and post-event analysis. 11
12
How much is the Company forecasting to invest in the C&I Dashboard 13
Technology during the bridge period of January 2021 through October 2022, 14
in the projected test year ending October 31, 2023? 15
A91. The Company is forecasting to spend $0.35 million in capital through the projected 16
test year to secure a contract with a third party to secure and provide the appropriate 17
technology. This spend is included in the Other Dr Programs and Pilot funding 18
shown in Exhibit A-12, Schedule B5.6, page 1 of 2, line 3, columns (c) through (f). 19
20
In summary, what is the Company’s forecasted capital expenditure and the 21
respective funding request for the other DR Programs and pilots? 22
A92. The Company is forecasting to invest $5.0 million in capital expenditures during 23
the bridge period of January 1, 2021 through October 31, 2022, and $2.8 million in 24
capital expenditures during the projected test year from November 1, 2022 to 25

K. O. FARRELL Line U-20836 No.
KOF - 47
October 31, 2023. This level of spend is necessary to continue developing the EV 1
pilot, PTS pilot, storage pilot, the newly initiated evaluation of the residential 2
generator and window air conditioner pilots as well as the water heating 3
replacement project and C&I Dashboard Technology. The associated projected 4
capital expenditures for Other DR Programs and Pilots are shown in Exhibit A-12, 5
Schedule B5.6, page 1 of 2, line 3, column (c) through (f). 6
7
Part VII: Demand Response Customer Penalty Revenues 8
What is the current penalty for non-interruption penalty of interruptible 9
customers? 10
A93. The current non-interruption penalty is $50 per kW applied to the highest 60-minute 11
integrated interruptible demand created during the interruption period. 12
13
What is the Company proposing for the future non-interruption penalty of 14
interruptible customers? 15
A94. The Company is proposing for the non-interruption penalty to be the higher of $50 16
per kW applied to the highest 60-minute integrated interruptible demand created 17
during the interruption period or the actual damages incurred by the Company, 18
including MISO penalties. 19
20
Why is the Company proposing this change? 21
A95. The Company is proposing this change to ensure non-performing interruptible 22
customers are not subsidized by other PSCR customers. Under the current $50 kW 23
penalty, the possibility exists that MISO penalties may exceed the penalties paid by 24

K. O. FARRELL Line U-20836 No.
KOF - 48
the Company’s non-interruption customers, resulting in a subsidization of non-1
interruption customers by other PSCR customers. 2 3
What is the current method to allocate and distribute demand response related 4
penalties from non-performance by customers during DR events? 5
A96. There is currently not an approved method to distribute penalty revenues. However, 6
under performance penalties in recent events have been allocated to Power Supply 7
Cost Recovery (PSCR) customers as a credit. 8
9
How does the Company propose future allocation of non-performance 10
penalties? 11
A97. The Company proposes to first offset any MISO allocated penalties that flow 12
through PSCR to ensure PSCR customers are held harmless. Any excess customer 13
penalty revenues above the MISO issued penalties will then be allocated towards 14
improving demand response programs. This may include, but not limited to, items 15
such as IT infrastructure improvements, customer communication improvements, 16
marketing, and enhanced education for DR participating customers. Under the 17
circumstance that demand response program improvement opportunities are not 18
readily available, or if the improvements do not fully utilize the penalty revenues, 19
the Company will distribute penalty revenues to PSCR customers. 20
21
Will the Company seek a financial incentive on the revenues above MISO 22
penalties that are used in DR program improvements? 23
A98. No. The Company does not plan to seek a financial incentive on the customer 24
penalties revenues. The Company will include an explanation of how the penalty 25
revenues were utilized in its annual demand response reconciliation. 26

K. O. FARRELL Line U-20836 No.
KOF - 49
1
Does this complete your direct testimony? 2
A99. Yes, it does. 3

STATE OF MICHIGAN
BEFORE THE MICHIGAN PUBLIC SERVICE COMMISSION
In the matter of the Application of )
DTE ELECTRIC COMPANY )
for authority to increase its rates, amend ) Case No. U-20836
its rate schedules and rules governing the )
distribution and supply of electric energy, and )
for miscellaneous accounting authority. )
QUALIFICATIONS
AND
DIRECT TESTIMONY
OF
NEAL T. FOLEY

DTE ELECTRIC COMPANY
QUALIFICATIONS AND DIRECT TESTIMONY OF NEAL T. FOLEY
Line
No.
NTF-1
Q1. What is your name, business address and by whom are you employed?1
A1. My name is Neal T. Foley (he/him/his). My business address is One Energy Plaza, 2
Detroit, Michigan 48226. I am employed by DTE Energy Corporate Services, LLC, 3
a subsidiary of DTE Energy Company as Director, Regulatory Affairs. 4
5
Q2. On whose behalf are you testifying? 6
A2. I am testifying on behalf of DTE Electric Company (DTE Electric or Company). 7
8
Q3. What is your education background? 9
A3. I received a Bachelor of Science in Aerospace Engineering and a Bachelor of 10
Science in Mechanical Engineering from the University of Michigan. I also received 11
a Master of Science in Systems Engineering from Johns Hopkins University and a 12
Master of Business Administration from Georgetown University. 13
14
Q4. What work experience do you have? 15
A4. In 2007 I was employed by Lockheed Martin Corporation as a Satellite Operations 16
Engineer. In 2008, I was hired by Booz Allen Hamilton as an Associate Consultant 17
in its Federal consulting practice. In 2012, I was hired by Deloitte as a Manager of 18
Financial Analysis in its Federal consulting practice. In 2014, I was hired by 19
McKinsey & Company as an Associate Consultant, ultimately being promoted to 20
Engagement Manager before my departure in 2017. In 2017 I was hired by DTE 21
Energy Company as Manager of Corporate Strategy. In this role I was broadly 22
responsible for tracking and assessing utility industry trends, executing analyses to 23
better understand the economic impacts of emerging technologies and business 24

N. T. FOLEY
Line U-20836
No.
NTF-2
models, and leading strategic initiatives for the Company. I was promoted to my 1
current role as Director of Regulatory Affairs in 2020. 2
3
Q5. What are your current duties and responsibilities with DTE Electric? 4
A5. My responsibilities broadly include the management of regulatory activities relative 5
to DTE Electric’s Load Research, Tariffs, Pricing, and Rate Design. 6
7
Q6. Have you previously sponsored testimony before the Michigan Public Service 8
Commission (MPSC or Commission)? 9
A6. No. I have not previously sponsored testimony before the MPSC10

N. T. FOLEY
Line U-20836
No.
NTF-3
Purpose of Testimony 1
Q7. What is the purpose of your testimony?2
A7. The purpose of my testimony is to describe the Company’s overall approach to rate 3
design and the key components of new tariffs and tariff changes that the Company 4
is proposing. As such, my testimony has four major components: 5
• Rate Design Principles. In this section I describe the Company’s overall 6
approach to rate design in order to set proper context for the subsequent 7
sections. 8
• Time of Use (TOU) Full Implementation. In this section I address the recent 9
history of TOU rates, the preliminary results of the Company’s Advanced 10
Customer Pricing Pilot (ACPP), and describe the key components of the 11
Company’s proposed Rate Schedule D1.11 (Residential Service Rate – 12
Standard TOU), including providing details of the customer rollout. 13
• Voluntary residential “Stable Bill Service Level” demand-based tariff. In this 14
section I address the recent history of residential demand rates, discuss the 15
overall motivation and basis for introducing a voluntary demand-based tariff, 16
and describe the structure of the Company’s proposed Rate Schedule D1.12 17
(Residential Service Rate - Stable Bill Service Level) 18
• Rider 18 (Distributed Generation Program). In this section I address the 19
recent history of Distributed Generation (DG) rate design, introduce new 20
data and analysis the Company has prepared in support of its proposed 21
changes, and describe the structure and key changes of the Company’s 22
proposed Rider 18. 23
24
Q8. Are you sponsoring any exhibits in this proceeding? 25

N. T. FOLEY
Line U-20836
No.
NTF-4
A8. No. I am not sponsoring any exhibits in this proceeding. 1
2
Rate Design Principles 3
Q9. What are the key principles that guide the Company’s rate design activities and 4
proposals? 5
A9. The Company uses three basic principles to guide its rate design activities and 6
proposals. These principles are: 7
• Cost-alignment. Rate schedules (“rates” or “tariffs”) should be cost-aligned, 8
meaning they reflect both how and when costs are incurred. 9
• Optionality. Customers should be provided with multiple base rate and 10
voluntary rate options and be free to select the offerings that best fit their 11
needs and preferences. 12
• Broad adoption. Rates should be made available as widely as possible. 13
Eligibility requirements, including separate metering requirements, should 14
be used sparingly. 15
I will discuss these principles in greater detail below. 16
17
Q10. Besides these three rate design principles, are there any other considerations 18
that guide the Company’s thinking when proposing new rates or rate design 19
changes? 20
A10. While the Company uses the three principles summarized above to guide its thinking 21
as it contemplates new rates or rate design changes, there are other considerations 22
that the Company takes into account as well. More specifically the Company 23
considers the following when contemplating new rates or rate design changes: 24

N. T. FOLEY
Line U-20836
No.
NTF-5
• Incrementalism. The Company acknowledges that customers broadly value 1
stability and certainty in the structure of their electric rates. As such, when 2
introducing new rates or changes to existing rates, potential customer 3
impacts should be considered so that sufficient communication and 4
education can be focused on those customers likely to see the largest impact. 5
Incrementalism must be balanced with other considerations, so there is no 6
“one size fits all” answer to how new structures should be introduced. 7
Instead, incrementalism should be considered on a case-by-case basis as new 8
structures are being contemplated. 9
• Cost of implementation. The Company considers whether the cost of 10
implementing a new rate or rate design change is prudent by weighing those 11
implementation costs against how the new rate or rate design change will 12
better achieve the principles outlined above. 13
14
Q11. As it applies to the Company’s first principle, what does it mean for a rate to 15
be “cost-aligned”? 16
A11. To best understand this principle, it is helpful to distinguish between a rate being 17
cost-based and being cost-aligned. Being cost-based means that the rate is designed 18
to recover those costs that have been allocated to the relevant class through an 19
approved Cost of Service (COS) study. 20
21
For a rate to be cost-aligned, it must also accurately reflect the underlying cost 22
drivers for each category of cost incurred by the Company. These cost drivers 23
include both how costs are incurred, and when they are incurred. Said differently, 24

N. T. FOLEY
Line U-20836
No.
NTF-6
the structure of the rate would need to match the structure of the cost causation for 1
it to be cost-aligned. 2
3
Q12. How are costs typically incurred by the Company? 4
A12. Broadly, the Company incurs three types of costs: 5
• Energy-related costs. These costs vary with the volume of energy being 6
delivered by the utility. These costs can also be dependent upon the time of 7
day or season the energy is delivered. The main components of energy-8
related costs are fuel and purchased power. 9
• Demand-related costs. These costs vary with the peak demand being placed 10
on an asset or assets. In other words, assets that are sized to meet a peak 11
demand would fall into this category. The main components of demand-12
related costs are the fixed portions of generation assets and certain types of 13
distribution equipment. 14
• Customer-related costs. These costs generally vary with the number of 15
customers that the Company serves and are unrelated to the usage 16
characteristics of those customers. Examples of customer-related costs are 17
near-site distribution infrastructure and other delivery costs such as billing 18
resources and infrastructure. 19
20
Q13. When are costs typically incurred by the Company? 21
A13. Costs are incurred at different times by the Company depending on the underlying 22
category of costs. As such, it is helpful to look at each category of cost separately: 23

N. T. FOLEY
Line U-20836
No.
NTF-7
• Energy-related costs. These costs are incurred at all times by the Company 1
given that it is delivering energy at all times. Energy costs on a per kWh basis 2
tend to vary over hours, days, and seasons, driven by system usage. 3
• Demand-related costs. These costs are incurred coincident with the peak that 4
could be placed on the underlying asset. For example, a portion of the 5
Company’s generation portfolio is built to meet peak system demand, and 6
these costs are therefore incurred coincident with system peaks. Similarly, 7
certain distribution assets, such as substations and transformers, are built to 8
meet the aggregate peak demand of the customers that the asset serves. These 9
costs are therefore incurred coincident with the aggregate peak demand that 10
could be placed on the underlying asset by those customers. 11
• Customer-related costs. As outlined above, these costs do not vary with the 12
usage characteristics of customers within a customer class, and therefore 13
cannot be assigned to a specific time period or periods. 14
15
Q14. Are the Company’s current base rates cost-based consistent with the 16
requirements of MCL 460.11(1) 17
A14. Yes. MCL 460.11(1) states: 18
“…the commission shall ensure the establishment of electric rates equal to the 19
cost of providing service to each customer class. In establishing cost of service 20
rates, the commission shall ensure that each class, or sub-class, is assessed for 21
its fair and equitable use of the electric grid.” 22
23
In compliance with MCL 460.11(1), the Company’s base rates are designed such 24
that they collect the portion of the Company’s overall revenue requirement that has 25

N. T. FOLEY
Line U-20836
No.
NTF-8
been allocated to the relevant class through an approved COS study. In this way, the 1
Company’s rates are cost-based. 2
3
Q15. Are the Company’s current rates cost-aligned? 4
A15. As stated above, the Company’s current base rates are cost-based in that they are 5
designed to collect the class revenue requirement established through an approved 6
COS study. However, the Company’s current rates are not cost-aligned in all cases, 7
meaning the rate design does not necessarily reflect how and when costs are 8
incurred. 9
10
Traditionally, prevailing metering and other technological capabilities limited the 11
ability to design and implement more advanced rate structures that could better 12
achieve cost-alignment. With the effectively full implementation of Advanced 13
Metering Infrastructure (AMI) and other supporting technological advances, the 14
Company is in a position to propose meaningful steps toward more cost-aligned 15
rates. I discuss the benefits of more cost-aligned rates later in my testimony. 16
17
Q16. Given how and when costs are incurred by the Company, what is the most 18
appropriate rate design to ensure cost-alignment? 19
A16. As described above, the Company incurs three basic types of costs – energy-related, 20
demand-related, and customer-related. As such, the most appropriate rate design to 21
achieve cost-alignment would reflect these underlying drivers of cost and 22
incorporate an energy charge, a demand-based charge, and a customer charge. This 23
is generally referred to as a “three-part” rate design. More specifically, this rate 24
design would: 25
N. T. FOLEY
Line U-20836
No.
NTF-9
• Collect energy-related costs through an energy charge. As described above, 1
energy-related costs on a per kWh basis tend to increase as aggregate system 2
usage increases and decrease as aggregate system usage decreases. 3
Therefore, a Time of Use (TOU) energy charge is most appropriate for this 4
category of costs to reflect this dynamic, with different pricing windows 5
designed to encompass periods of significantly different system usage. When 6
looking at the Company’s cost structure, fuel, purchased power, and other 7
variable Operations and Maintenance (O&M) costs are best collected 8
through this mechanism. 9
• Collect demand-related costs through a demand-based charge. As described 10
above, demand-related costs are incurred coincident with the peak demand 11
that could be placed on an asset. As such, a demand charge could either be 12
an “on-peak” demand charge with the “on-peak” time being set coincident 13
with the peak being placed on the asset(s), or a Non-Coincident Peak (NCP) 14
demand charge where the underlying asset is designed to meet demand 15
during all times. When looking at the Company’s cost structure, 16
Transmissions costs, the Capacity portion of Power Supply costs, and a 17
portion of Delivery costs are best collected through a demand charge. 18
• Collect customer-related costs through a fixed customer charge. As 19
described above, given the nature of these costs, they cannot be assigned to 20
a certain time period and do not vary based on customer usage. As such, the 21
most appropriate mechanism to recover these costs is through a fixed 22
monthly customer charge. Recovering these costs through either an energy 23
charge or a demand charge incorrectly assumes these costs vary based on 24
some characteristic of customer usage. When looking at the Company’s cost 25
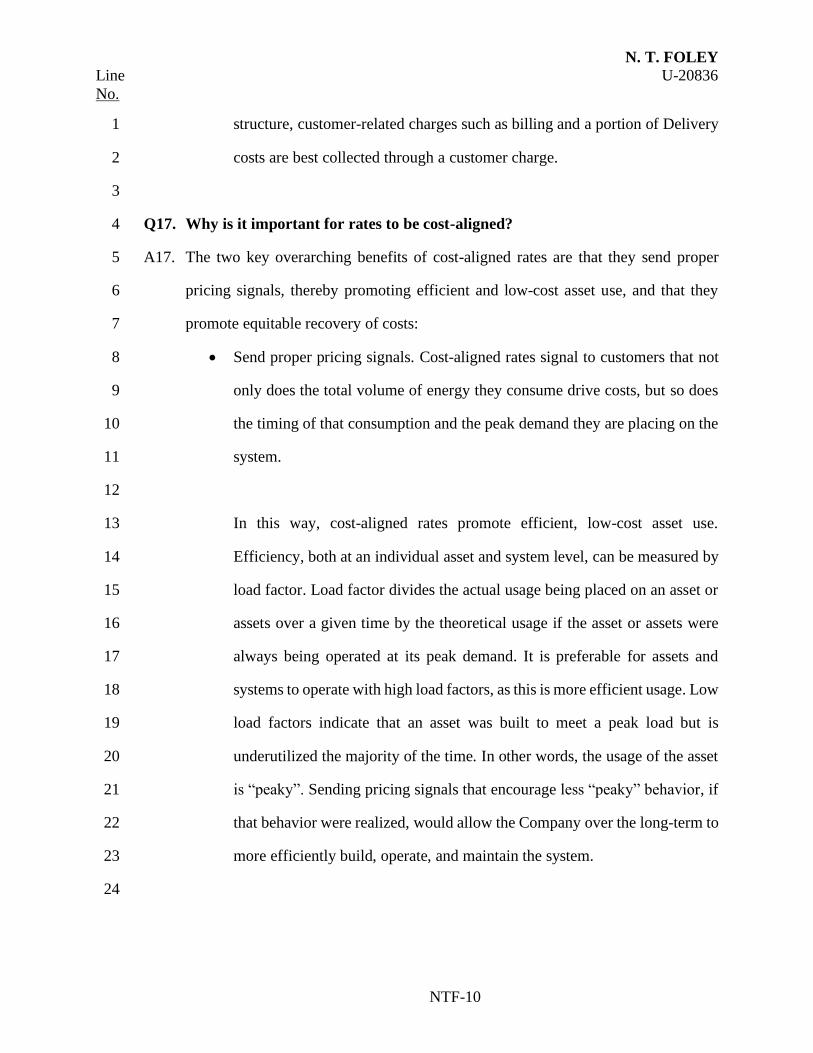
N. T. FOLEY
Line U-20836
No.
NTF-10
structure, customer-related charges such as billing and a portion of Delivery 1
costs are best collected through a customer charge. 2
3
Q17. Why is it important for rates to be cost-aligned? 4
A17. The two key overarching benefits of cost-aligned rates are that they send proper 5
pricing signals, thereby promoting efficient and low-cost asset use, and that they 6
promote equitable recovery of costs: 7
• Send proper pricing signals. Cost-aligned rates signal to customers that not 8
only does the total volume of energy they consume drive costs, but so does 9
the timing of that consumption and the peak demand they are placing on the 10
system. 11
12
In this way, cost-aligned rates promote efficient, low-cost asset use. 13
Efficiency, both at an individual asset and system level, can be measured by 14
load factor. Load factor divides the actual usage being placed on an asset or 15
assets over a given time by the theoretical usage if the asset or assets were 16
always being operated at its peak demand. It is preferable for assets and 17
systems to operate with high load factors, as this is more efficient usage. Low 18
load factors indicate that an asset was built to meet a peak load but is 19
underutilized the majority of the time. In other words, the usage of the asset 20
is “peaky”. Sending pricing signals that encourage less “peaky” behavior, if 21
that behavior were realized, would allow the Company over the long-term to 22
more efficiently build, operate, and maintain the system. 23
24

N. T. FOLEY
Line U-20836
No.
NTF-11
Under cost-aligned rates, customers that choose to respond to the pricing 1
signals and modify their load to have more efficient usage would be able to 2
lower their bill. 3
4
• Ensure equitable recovery of costs. Having cost-aligned rates better ensures 5
that customers are equitably paying for their specific usage of the system. 6
Individual customers within a single class, even if their total usage is similar, 7
can drive very different costs on the system. For example, consider two 8
theoretical customers, Customer A and Customer B, that both use 500 kWh 9
per month. Customer A has a monthly load factor of 100%, meaning they 10
use the exact same amount of energy in every hour of the month. For a month 11
with 30 days, this would equate to a peak demand (measured hourly) of ~0.7 12
kW. Customer B has a load factor of 10%, which would mean their peak 13
demand (measured hourly) during the month is ~6.9 kW. Despite having the 14
same total usage, Customer B’s peak demand is almost ten times greater than 15
Customer A’s. As such, Customer B is driving significantly greater costs on 16
the system given the Company must have the Power Supply and Delivery 17
infrastructure in place to meet a much higher demand. Depending on when 18
Customer B uses their energy, energy-related costs could also be higher or 19
lower. 20
21
While this is an extreme case, it highlights the fact that customers can drive 22
different levels of cost in the system depending on how they consume 23
energy. Having cost-aligned rates ensures customers are paying their “fair 24
share.” In the example above, Customer B would pay more than Customer 25

N. T. FOLEY
Line U-20836
No.
NTF-12
A under cost-aligned rates, but would also be receiving the proper pricing 1
signals that would encourage more efficient system use, as described above. 2
3
If rates are not cost-aligned, there is a risk customers who are using the 4
system more efficiently will be paying more than their “fair share” and 5
customers using the system less efficiently will be paying less than their “fair 6
share.” In effect, the more efficient users will be subsidizing the less efficient 7
users. The appropriate way to address this subsidization is through cost-8
aligned rates. 9
10
Q18. If a three-part rate design is the most appropriate rate design, why does the 11
Company not simply propose moving all customers to this type of rate? 12
A18. With limited exception, all the Company’s primary and higher voltage customers 13
currently take service on rate schedules which include energy charges, demand-14
based charges, and customer charges – the three elements of three-part rate design. 15
Furthermore, commercial secondary customers taking service under Rate Schedule 16
D4 are also subject to all three elements of three-part rate design. 17
18
For residential and the remaining commercial customers, the “three-part” rate design 19
described above would be a change from the D1 (Residential Service Rate - Base) 20
and D3 (General Service) rates that currently serve the vast majority of these 21
customers. A three-part rate design would potentially introduce multiple new 22
structures or changes for these customers. 23
24

N. T. FOLEY
Line U-20836
No.
NTF-13
As described above, the Company considers incrementalism an important factor 1
when contemplating new rates or rate design changes. Given that, the prudent path 2
forward is to incrementally move towards more cost-aligned rates. The Company 3
acknowledges this approach will take time, but it will better allow customers to 4
become comfortable with more advanced rate designs, and will allow the Company 5
to better learn from customers about their experience, understanding, and 6
satisfaction with these new rate structures. 7
8
In support of that approach, the Company is proposing such incremental steps in this 9
case. The Company will continue to consider whether to propose additional 10
incremental steps in future cases. 11
12
Q19. As it applies to the Company’s second principle, what does it mean to provide 13
“optionality”? 14
A19. Providing optionality essentially means giving an individual customer multiple rate 15
options under which they can take service. Optionality can be achieved through both 16
base service rates as well as through rate Riders or other provisions that respond to 17
more specific customer needs or preferences, where appropriate. 18
19
Q20. Why is it important to provide optionality? 20
A20. The Company appreciates that different customers have different needs, preferences, 21
and levels of ability when it comes to managing their usage. Some customers may 22
prefer simple rates that tend to remain more constant over time, while others may be 23
comfortable with more complex rates that allow the customer to more actively 24
modify their usage to manage their bill. 25

N. T. FOLEY
Line U-20836
No.
NTF-14
1
Customers are more likely to engage and leverage a rate that matches their needs 2
and preferences, so offering rate optionality also increases the chance of a rate being 3
a “good fit” for an individual customer. This should in turn drive increased 4
engagement with the rate, more active usage management, and improved customer 5
satisfaction. 6
7
Q21. How can the Company offer optionality while also ensuring cost-alignment? 8
A21. The Company believes it is possible to offer multiple rate options to an individual 9
customer that are all cost-aligned. For example, I have described above how the most 10
appropriate mechanism for recovery of fuel and purchased power costs is a TOU 11
energy charge. However, the structure of the TOU energy charge can be made more 12
or less complex by adjusting things like the number of pricing windows. A simple 13
TOU rate could employ a structure with two pricing windows, such as an “on-peak” 14
window and an “off-peak” window. More complex structures could incorporate 15
more windows, like a third “mid-peak” window. Taken to the extreme, the pricing 16
windows could be set differently for each hour based on expected or actual market 17
conditions. 18
19
Different rate options could be designed to incorporate different levels of complexity 20
to meet the different preferences of the Company’s customers. At the same time, the 21
rates could remain cost-aligned and adequately reflect the underlying drivers of cost. 22
23
Q22. As it applies to the Company’s third principle, what does it mean for a rate to 24
“enable broad adoption”? 25

N. T. FOLEY
Line U-20836
No.
NTF-15
A22. Enabling broad adoption means making an individual rate available to as many 1
customers as possible. To enable broad adoption, barriers to access must be carefully 2
considered and only implemented when there is a clear need to do so. The barriers 3
could include separate metering/infrastructure requirements, technology 4
requirements, customer eligibility requirements, etc. 5
6
Q23. Why is it important to enable broad adoption of rates? 7
A23. The Company serves customers that vary greatly across age, income level, 8
geography, and energy usage. Certain customer groups, such as fixed-income 9
customers or low-income customers, may not have the means to meet separate 10
metering or other technology requirements to take service under a rate. Other 11
customer groups, such as renters, may be prohibited from meeting certain 12
requirements or lack the physical space to do so. 13
14
With that said, these same customers may benefit from access to a rate because it 15
aligns well with their needs, preferences, and/or abilities to manage their usage. 16
Enabling broad adoption ultimately enhances customer optionality and results in the 17
same benefits described above - increased engagement with their chosen rate, more 18
active usage management, and improved customer satisfaction. 19
20
Q24. Do the new rates or rate changes discussed later in your testimony align with 21
these principles and other considerations? 22
A24. Yes. As I describe each new rate or rate design change, I will explain how the 23
Company used these principles and other considerations to guide our proposals. 24
25

N. T. FOLEY
Line U-20836
No.
NTF-16
Time-of-Use (TOU) Full implementation – Background and Overview 1
Q25. Please describe the Company’s recent history as it relates to TOU rates 2
A25. DTE has offered several residential time of use and/or seasonal rate products, such 3
as Rate Schedules D1.1 (Interruptible Space-Conditioning Service Rate), D1.2 4
(Residential Time-of-Day Service Rate), D1.7 (Geothermal Time-of-Day Rate), 5
D1.8 (Dynamic Peak Pricing Rate), D1.9 (Electric Vehicle Rate), and D2 6
(Residential Space Heating Rate). The most recent residential time of use / seasonal 7
products to be offered include two pilot programs, Rate Schedules D1-A and D1-B, 8
the general history of which I describe below. 9
10
In the April 18, 2018 order in Case No. U-18255, pp. 81-82, the Commission 11
directed DTE Electric to include in its next rate case filing a summer on-peak rate 12
for non-capacity charges for Rate Schedule D1 (residential customers). In the May 13
2, 2019 order in Case No. U-20162, pp. 162-165, the Commission adopted an 14
implementation plan for this transition, and directed DTE Electric to test capacity 15
and non-capacity rates through pilots. Both Rate Schedules D1-A and D1-B, along 16
with the broader Advanced Customer Pricing Pilot (ACPP), were approved by the 17
Commission in the September 26, 2019 order in Case No. U-20602, p. 3, which 18
stated, “The Commission views the approval of these two pilots as necessary to 19
implement the Commission’s decisions and guidance from prior rate case orders. 20
The Commission believes there is value to be gained by the utility, the Commission, 21
and ratepayers from these pilot programs, including learning about customers’ 22
reaction to the rate offerings and different outreach and communication methods. 23
The Commission stresses the importance of customer education for the successful 24
implementation of summer peak pricing rates.” 25
26

N. T. FOLEY
Line U-20836
No.
NTF-17
Each of the new TOU pilot rates were to be offered to 105,000 residential customers 1
on an opt-in basis, with target enrollment on each rate of 2,500 customers who 2
affirmatively chose to opt-in, after which additional customers would be allowed to 3
participate at the Company’s discretion. 4
5
Each of the pilot rates was offered to an additional 5,000 residential customers on 6
an opt-out basis as well, meaning these customers were notified that they were being 7
placed onto one of the two rates before they became effective, and then had the 8
opportunity to “opt-out” and remain on their legacy rate by notifying the Company 9
either by calling the contact center or using the Company’s self-service online 10
functionality. Absent this proactive notification from the customer, the customers 11
were automatically transitioned to TOU rates in the Spring of 2021. 12
13
Rate Schedules D1-A and D1-B both vary by time of day and by season. Both have 14
an on-peak period consisting of 3:00 pm to 7:00 pm, Monday-Friday (with an off-15
peak period consisting of all other times), and on-peak rates which are different for 16
June-September versus October-May. 17
18
D1-A was designed with a power supply non-capacity rate that varies by time and 19
month as described above. The power supply non-capacity rate differential between 20
on-peak and off-peak is derived from differences in historical Locational Marginal 21
Prices (LMPs) for the corresponding seasonal and intraday periods. The power 22
supply capacity rate is a “flat” per kWh energy charge, meaning the per kWh price 23
remains constant throughout the year and does not vary based on the time of the day, 24
the day of the month, or the month of the year. 25

N. T. FOLEY
Line U-20836
No.
NTF-18
1
D1-B was designed with both power supply non-capacity and capacity rates that 2
vary by time and month as described above. The differential between on peak and 3
off peak are again based on historical locational marginal prices for the 4
corresponding seasonal and intraday periods. However, instead of being based on 5
the absolute difference between the different LMPs, the difference is based on the 6
relative difference. 7
8
Customers offered these pilot rates on an opt-in basis began enrolling onto the rate 9
in March 2021. The rates became effective for customers being offered them on an 10
opt-out basis in April 2021. The pilot is ongoing at the time of this filing. 11
12
Q26. Is the Company proposing a full implementation of TOU rates? 13
A26. Yes, the Company is proposing a full implementation of TOU rates using the 14
proposed Rate Schedule D1.11 (Residential Service Rate – Standard TOU), which 15
is supported by Company Witness Willis. As described below and also by Company 16
Witness Willis, this rate schedule mimics the structure of the legacy rate D1-A 17
(Residential Advanced Pricing Pilot A, TOU I) which was tested during the 18
Company’s ACPP that I described above. 19
20
Q27. What are the key elements of the Company’s TOU Full Implementation 21
proposal? 22
A27. There are five main elements of the Company’s TOU Full Implementation proposal 23
which will be supported by the following Company witnesses: 24

N. T. FOLEY
Line U-20836
No.
NTF-19
• Rate design. I will describe below the key components of the Company’s 1
proposed TOU Full Implementation rate design. Company Witness Willis 2
has prepared tariff D1.11 (Residential Service Rate – Standard TOU) at my 3
direction reflecting these components. 4
• Customer transition strategy. I will describe below the key components of 5
the Company’s proposed TOU Full Implementation transition strategy. 6
• Customer outreach and education. Company Witness Burns will describe in 7
his testimony the key components and associated costs of the Company’s 8
customer outreach and education proposal. 9
• Customer service. Company Witness Sparks will describe in his testimony 10
the key components and associated costs of the Company’s customer service 11
proposal, including impacts to billing and the contact center. 12
• IT investment. Company Witness Pizzuti will describe in her testimony the 13
IT projects and associated costs required to deliver the Company’s TOU Full 14
Implementation proposal. 15
16
Time-of-Use (TOU) Full implementation – Rate Design 17
Q28. What are the key rate design components of the Company’s proposed D1.11 18
(Residential Service Rate – Standard TOU) rate? 19
A28. The Company’s proposed rate design for TOU Full Implementation starts with the 20
D1 (Residential Service Rate - Base) rate and adjusts the rate design for the Power 21
Supply portion of costs. Specifically, those changes include: 22
• Introducing a TOU structure to the Non-Capacity portion of Power Supply 23

N. T. FOLEY
Line U-20836
No.
NTF-20
• Eliminating the “inverted block rate” structure historically utilized for the 1
Capacity portion of Power Supply, and instead implementing a “flat” per 2
kWh pricing structure 3
The Company’s proposed D1.11 rate does not include any changes to the Delivery 4
rate structure, and surcharges remain consistent with the D1 rate. 5
6
Q29. Why is the Company proposing to apply TOU pricing to only the Non-Capacity 7
portion of Power Supply? 8
A29. As discussed previously in my testimony, the most appropriate costs to recover 9
through per kWh TOU pricing are fuel and energy-related purchased power, both of 10
which are contained within the Non-Capacity portion of Power Supply costs. Power 11
Supply Capacity costs are most appropriately recovered through a demand-based 12
charge. These rate designs best align with the underlying drivers of cost for the 13
respective cost type, and therefore send the most accurate pricing signals to 14
customers to encourage efficient, low-cost asset use. As such, the Company is 15
proposing to apply TOU pricing to only the Non-Capacity portion of Power Supply 16
costs. 17
18
Q30. What is the Company’s proposed rate design for the Capacity portion of Power 19
Supply? 20
A30. The Company is proposing to move to a “flat” per kWh energy price for the Capacity 21
portion of Power Supply. A “flat” price remains constant throughout the year and 22
does not vary based on the time of the day, the day of the month, or the month of the 23
year. 24
25

N. T. FOLEY
Line U-20836
No.
NTF-21
The proposed structure would replace the “inverted block rate” incorporated into the 1
Company’s D1 rate. 2
3
Q31. Why is the Company proposing to not use the “inverted block rate” for Power 4
Supply Capacity costs for TOU Full Implementation? 5
A31. The “inverted block rate” sends a blunt pricing signal that simply encourages 6
customers to use less energy so that a smaller portion of their usage is subject to the 7
higher-priced “block” (i.e., above 17 kWh per day). However, the “inverted block 8
rate” does not provide any type of signal to customers for when to reduce their usage. 9
10
With the introduction of the TOU pricing structure applied to the Non-Capacity 11
portion of Power Supply, customers will already be receiving a more nuanced 12
pricing signal that encourages them to reduce their usage during the time of highest 13
aggregate system demand. As such, if the “inverted block rate” were retained, it 14
would send a superfluous, and potentially confusing, pricing signal to customers. 15
Therefore, the Company is proposing to not use this structure for Power Supply 16
Capacity costs in its Rate Schedule D1.11. 17
18
Q32. Is the Company proposing any rate design changes for Delivery costs? 19
A32. No, the Company’s proposal retains the D1 rate structure, which incorporates “flat” 20
energy pricing and a fixed service charge. 21
22
Q33. Is the Company’s rate design proposal consistent with Consumers Energy’s 23
recent TOU Full Implementation approved in Case No. U-20134? 24

N. T. FOLEY
Line U-20836
No.
NTF-22
A33. Not entirely. The Company’s proposed rate structure deviates from Consumers 1
Energy’s TOU rate in two key ways: 2
• The Company is proposing that TOU pricing only apply to the Non-Capacity 3
portion of Power Supply. Consumers Energy’s rate applies TOU pricing to 4
both the Capacity and Non-Capacity portion of Power Supply. 5
• The Company is proposing that TOU pricing be effective during the entire 6
year. Consumers Energy’s rate has TOU pricing effective only during the 7
summer months. 8
9
Q34. Why is the Company proposing a TOU rate design that is different from the 10
design approved for Consumers Energy’s TOU Full Implementation? 11
A34. As it relates to the application of TOU rates, the Company believes that per kWh 12
TOU rates are most appropriate to recover only Power Supply Non-Capacity costs 13
as I have discussed earlier in my testimony. As such, the Company’s proposed 14
structure represents the most appropriate use of this structure. 15
16
In addition, applying TOU pricing to Power Supply Non-Capacity rates only as the 17
Company proposes will help limit potential bill impacts. Customers will be better 18
able to get comfortable with the new rate structure without being subject to a higher 19
pricing differential between on-peak and off-peak periods. 20
21
As it relates to the effective period of TOU rates, the Company considers it 22
appropriate to have the TOU structure effective year-round for two key reasons: 23
• Customer understanding. By making the TOU structure effective year-24
round, the Company can provide a consistent message on how customers 25
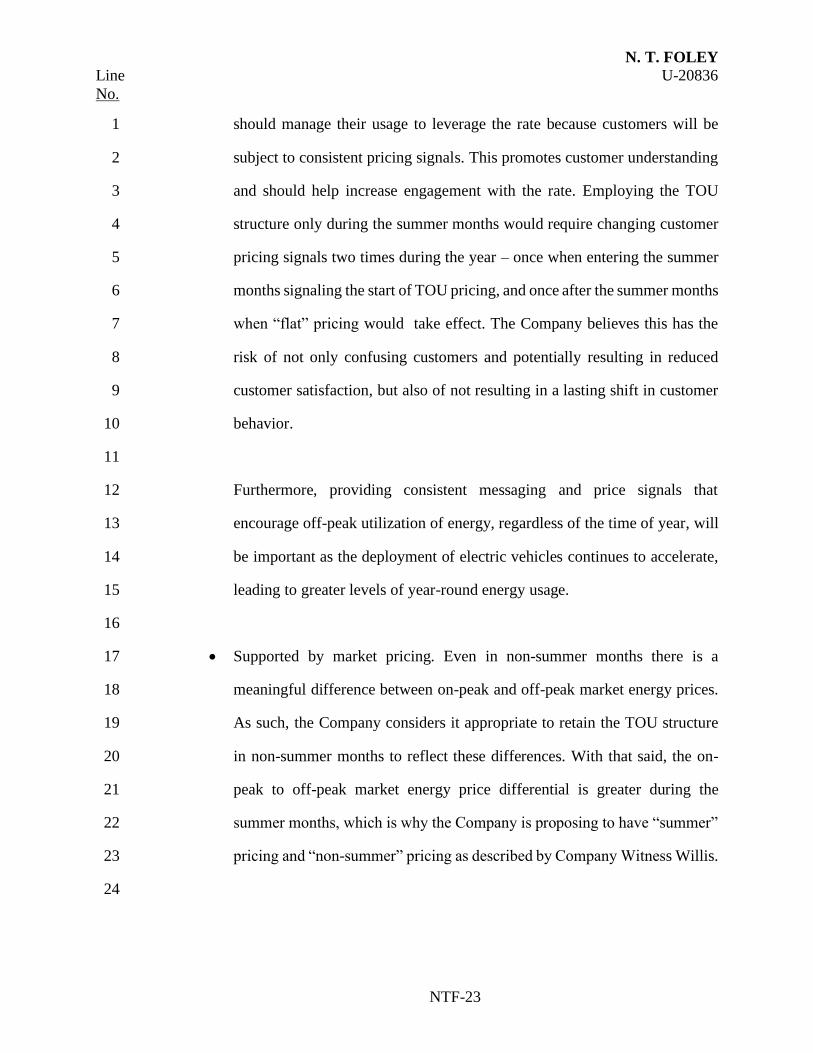
N. T. FOLEY
Line U-20836
No.
NTF-23
should manage their usage to leverage the rate because customers will be 1
subject to consistent pricing signals. This promotes customer understanding 2
and should help increase engagement with the rate. Employing the TOU 3
structure only during the summer months would require changing customer 4
pricing signals two times during the year – once when entering the summer 5
months signaling the start of TOU pricing, and once after the summer months 6
when “flat” pricing would take effect. The Company believes this has the 7
risk of not only confusing customers and potentially resulting in reduced 8
customer satisfaction, but also of not resulting in a lasting shift in customer 9
behavior. 10
11
Furthermore, providing consistent messaging and price signals that 12
encourage off-peak utilization of energy, regardless of the time of year, will 13
be important as the deployment of electric vehicles continues to accelerate, 14
leading to greater levels of year-round energy usage. 15
16
• Supported by market pricing. Even in non-summer months there is a 17
meaningful difference between on-peak and off-peak market energy prices. 18
As such, the Company considers it appropriate to retain the TOU structure 19
in non-summer months to reflect these differences. With that said, the on-20
peak to off-peak market energy price differential is greater during the 21
summer months, which is why the Company is proposing to have “summer” 22
pricing and “non-summer” pricing as described by Company Witness Willis. 23
24

N. T. FOLEY
Line U-20836
No.
NTF-24
In summary, the Company’s proposal takes an important step in more broadly 1
establishing TOU rates, while also mitigating potential negative customer impacts. 2
3
Q35. What has the Company learned from its ACPP that supports its proposal? 4
A35. As I described earlier in my testimony, the ACPP has and continues to test two 5
distinct rate structures. The first rate (D1-A) has the same structure that the Company 6
is proposing in this case for TOU Full Implementation. D1-A introduces TOU 7
pricing to the Non-Capacity portion of Power Supply and “flat” energy pricing for 8
the Capacity portion of Power Supply. The second rate (D1-B) introduces TOU 9
pricing to both the Non-Capacity and Capacity portions of Power Supply. 10
11
Using data from the pilot captured during summer months (i.e., June-September 12
2021), the Company assessed the on-peak load impacts of customers under both rate 13
structures. Specifically, the Company assessed the roughly 8,600 customers that 14
were enrolled under the “opt-out” enrollment strategy during this time. As described 15
previously, these customers had the option to leave the pilot program but did not 16
choose to do so. 17
18
Usage data during this time was analyzed by comparing pilot participants against a 19
control group made up of non-participants that had similar characteristics in terms 20
of historical usage, geography, age, and income level. In this way, the analysis 21
attempted to isolate and determine the behavior change that could be attributed to a 22
customer moving to a TOU rate. 23
24

N. T. FOLEY
Line U-20836
No.
NTF-25
The analysis described above suggests that there is no meaningful difference to 1
expected aggregate on-peak load impacts when comparing the two different rate 2
structures being tested in the pilot. In both cases, on-peak load impacts are expected 3
to be less than 1% of total load. Figure 1 below summarizes the results. 4
5
Figure 1: Comparison of average on-peak weekday usage between ACPP 6
opt-out participants and non-participants; June-September 2021 7
8
As can be seen in the figure above, the expected average impact is likely to be similar 9
by implementing rate D1-A as it would be if the Company were to implement rate 10
D1-B. 11
12
Given this information, and in addition to the arguments made previously, the 13
Company does not consider it prudent to subject customers to a higher pricing 14
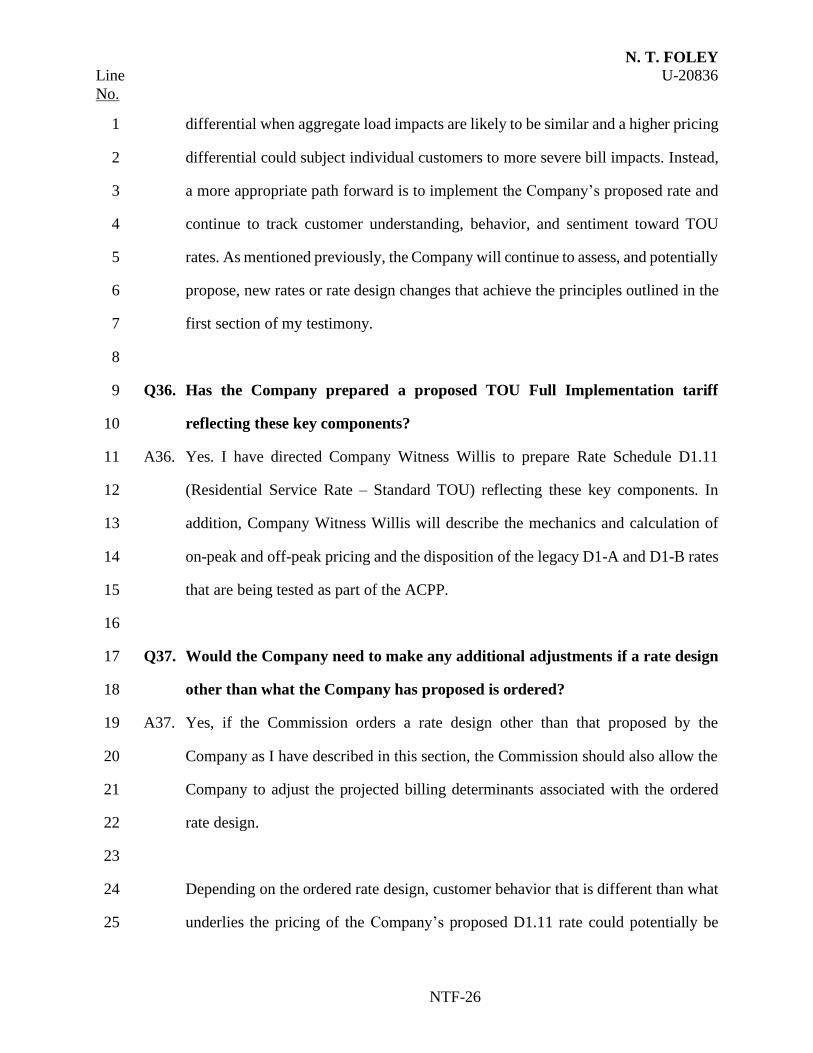
N. T. FOLEY
Line U-20836
No.
NTF-26
differential when aggregate load impacts are likely to be similar and a higher pricing 1
differential could subject individual customers to more severe bill impacts. Instead, 2
a more appropriate path forward is to implement the Company’s proposed rate and 3
continue to track customer understanding, behavior, and sentiment toward TOU 4
rates. As mentioned previously, the Company will continue to assess, and potentially 5
propose, new rates or rate design changes that achieve the principles outlined in the 6
first section of my testimony. 7
8
Q36. Has the Company prepared a proposed TOU Full Implementation tariff 9
reflecting these key components? 10
A36. Yes. I have directed Company Witness Willis to prepare Rate Schedule D1.11 11
(Residential Service Rate – Standard TOU) reflecting these key components. In 12
addition, Company Witness Willis will describe the mechanics and calculation of 13
on-peak and off-peak pricing and the disposition of the legacy D1-A and D1-B rates 14
that are being tested as part of the ACPP. 15
16
Q37. Would the Company need to make any additional adjustments if a rate design 17
other than what the Company has proposed is ordered? 18
A37. Yes, if the Commission orders a rate design other than that proposed by the 19
Company as I have described in this section, the Commission should also allow the 20
Company to adjust the projected billing determinants associated with the ordered 21
rate design. 22
23
Depending on the ordered rate design, customer behavior that is different than what 24
underlies the pricing of the Company’s proposed D1.11 rate could potentially be 25

N. T. FOLEY
Line U-20836
No.
NTF-27
expected. For example, a higher on-peak to off-peak pricing differential could result 1
in lower expected on-peak usage than was assumed for the Company’s proposed 2
D1.11 rate. As such, the Company should be allowed to update its projected billing 3
determinants if a different rate design is ordered to ensure it is able to fully recover 4
the costs allocated to the D1/Other cost of service class. 5
6
Time-of-Use (TOU) Full implementation – Customer Transition Strategy 7
Q38. What are the key components of the Company’s proposed TOU Full 8
Implementation customer transition strategy? 9
A38. The Company is proposing to utilize an “opt-out” enrollment strategy for its TOU 10
Full Implementation. Under this structure, all residential customers taking service 11
on the D1 (Residential Service Rate – Base) rate would be given at least sixty days’ 12
notice that they are being transitioned to the D1.11 (Residential Service Rate – 13
Standard TOU) rate. Prior to being transitioned onto the D1.11 rate, a customer 14
could opt-out of the transition by notifying the Company of their desire to do so. 15
16
The Company anticipates that customers will be able to provide notification of their 17
desire to opt-out through an online tool or by calling the Company’s contact center. 18
19
Customers that have notified the Company of their desire to opt-out would not be 20
transitioned onto the D1.11 rate and would instead remain on the D1 rate. Absent a 21
notification from the customer, the Company would automatically transition a 22
customer onto the D1.11 rate as described later in my testimony. 23
24

N. T. FOLEY
Line U-20836
No.
NTF-28
Once transitioned onto the D1.11 rate, customers would be able to annually change 1
rates and take service under any rate schedule for which they are eligible, including 2
the D1 rate. In other words, the D1 rate would be retained and made available to any 3
residential customers meeting its eligibility requirements. As reflected in the 4
proposed D1.11 tariff, the Company also intends to allow customers that were 5
transitioned to the D1.11 rate to change rates and take service on D1 or any other 6
rate for which they are eligible until September 30, 2023. Any such customer 7
remaining on the rate after September 30, 2023 will be subject to the Company’s 8
typical 12-month service requirement for residential TOU rates. 9
10
It is the Company’s intent to maintain a high level of enrollment on the D1.11 rate 11
and will take all reasonable actions with its customers to do so. In support of this 12
objective, the D1.11 rate would become the default rate for new residential 13
customers and customers changing premises, similar to how the D1 rate acts as the 14
default rate today. New or moving customers would still be able to take service under 15
the D1 rate but would have to proactively choose to do so. Absent this proactive 16
choice, they would be placed on the D1.11 rate. This should help support a high 17
level of enrollment on the D1.11 rate. 18
19
Q39. When does the Company anticipate this transition to occur? 20
A39. In its February 4, 2021 Order in Case No. U-20602 (“February Order”), p. 6, the 21
Commission outlined its expectation for TOU Full Implementation, stating: 22
23
“THEREFORE, IT IS ORDERED that DTE Electric Company…file its full plan 24
for implementation of summer on-peak rates for capacity and non-capacity 25

N. T. FOLEY
Line U-20836
No.
NTF-29
charges in time to achieve full implementation of the new rates for summer 1
2023.” 2
3
As such, the Company expects to complete all customer transitions to the D1.11 rate 4
by May 31, 2023. While the final solution is not yet developed, the Company 5
anticipates that a phased transition would occur during the first half of 2023, 6
whereby customers would be transitioned to the rate over time as to not overstress 7
IT systems, contact center resources, etc. 8
9
Q40. What has the Company learned from its Advanced Customer Pricing Pilot 10
(ACPP) that supports its proposal? 11
A40. As discussed above, the ACPP specifically tested an opt-out structure, and therefore 12
the Company has driven robust insights into how it should prepare for its TOU Full 13
Implementation. Specific to the opt-out structure, to date the Company has 14
experienced a 5.6% opt-out rate. The Company’s goal is for the percentage of “opt-15
out customers” to be lower than what was experienced in the pilot and will endeavor 16
through communications and the deployment of tools to help customers understand 17
the benefits of the TOU rate. 18
19
Q41. Why does the Company believe this is the most appropriate transition strategy? 20
A41. The Company considers an opt-out transition strategy to be most appropriate for two 21
key reasons: 22
• It achieves the Commission’s desire to move to TOU rates. As stated above, 23
the Company’s goal is to maximize the number of customers that take service 24

N. T. FOLEY
Line U-20836
No.
NTF-30
under the D1.11 rate, even above the roughly 94% of pilot participants that 1
did not elect to opt-out. 2
• It allows for optionality. The Company appreciates that all customers may 3
not want to take service under a TOU structure, as evidenced by the opt-out 4
rate experienced during the ACPP. As such, the Company considers it 5
appropriate to provide these customers with an option to remain on their 6
current rate if they so desire. This optionality should help mitigate risk of 7
customer dissatisfaction. 8
9
Q42. Is the Company’s proposed transition strategy consistent with Commission 10
direction on the transition to TOU rates? 11
A42. Yes. In its February Order, p. 5, the Commission communicated its expectations by 12
stating: 13
14
“…the Commission clarifies its expectation that, while the ACPP program 15
includes both opt-in and opt-out enrollment paths for each of the approved pilot 16
rates, the ultimate program to be fully implemented in 2023 will be either a 17
default or opt-out program that more closely mirrors cost of service.” 18
19
As the proposed TOU Full Implementation employs an opt-out structure, it meets 20
the Commission’s direction. 21
22
Q43. Is the Company proposing any changes to the D1 (Residential Service Rate - 23
Base) rate given its proposal for TOU Full Implementation described above? 24

N. T. FOLEY
Line U-20836
No.
NTF-31
A43. As described above, the Company is proposing that the D1 rate be maintained for 1
residential customers that notify the Company of their desire to opt-out of the 2
transition to the D1.11 rate, or that otherwise proactively choose to take service 3
under it. As such, the Company is not proposing any changes to the structure or 4
eligibility of the D1 rate. 5
6
Q44. Is the Company proposing any changes to its residential Cost of Service 7
treatment given its proposal for TOU Full Implementation described above? 8
A44. The Company is not proposing any changes to its Cost of Service (COS) classes 9
with the introduction of the D1.11 rate. The Company proposes that both the 10
proposed D1.11 rate and the existing D1 rate be a part of the D1/Other cost of service 11
class. This is appropriate as there are currently no customers taking service on the 12
D1.11 rate and the Company cannot forecast with any certainty which customers 13
will elect to opt-out of the transition to the D1.11 rate. 14
15
However, once the transition to the D1.11 rate is complete and movement between 16
rates has stabilized, the Company plans to assess if creating a new COS class 17
containing only the existing D1 rate would be appropriate. At that time the Company 18
would have better clarity on both the number and the aggregate usage characteristics 19
of customers electing to remain on the existing D1 rate and could better assess if a 20
separate COS class is warranted. 21
22
Q45. How does the Company propose to handle customers currently participating in 23
the ACPP on either legacy rate D1-A (Residential Advanced Pricing Pilot A, 24

N. T. FOLEY
Line U-20836
No.
NTF-32
Time of Use I) or rate D1-B (Residential Advanced Pricing Pilot B, Time of Use 1
II)? 2
A45. Consistent with the transition strategy described above, the Company anticipates it 3
would provide customers taking service under D1-A or D1-B with at least sixty 4
days’ notice that they are being transitioned to the D1.11 rate. The Company 5
appreciates that the specific messaging provided to D1-A and D1-B customers may 6
need to be different than what is provided to D1 customers given their involvement 7
in the ACPP. 8
9
Customers notifying the Company of their desire to opt-out of the transition would 10
not be transitioned onto the D1.11 rate and would instead be placed on the D1 rate. 11
Absent a notification from the customer, the Company would automatically 12
transition a customer onto the D1.11 rate. 13
14
As described by Company Witness Willis, the legacy D1-A and D1-B rates would 15
be retired and removed from the Company’s rate book once all Pilot customers are 16
transitioned to other rates. 17
18
Q46. What are the one-time project costs associated with the Company’s TOU Full 19
Implementation? 20
A46. Figure 2 below summarizes both the total capital and total O&M one-time project 21
costs associated with the Company’s proposal that I have described above. The table 22
also indicates the Company witness that will describe and support each category of 23
costs, including timing, within their testimony. 24
25

N. T. FOLEY
Line U-20836
No.
NTF-33
Cost Category
One-Time
Project Capital
Costs ($M)
One-Time
Project O&M
Costs ($M)
Supporting
Company
Witness
Customer Outreach $- $8.1M Burns
Customer Service $- $4.9M Sparks
Customer IT $31.7M $4.1M Pizzuti
Total $31.7M $17.1M
Figure 2: Estimated TOU Full Implementation one-time project costs and 1
supporting witnesses 2
3
Voluntary residential “Stable Bill Service Level” demand-based tariff 4
Q47. Please describe the Company’s recent history as it relates to residential demand 5
rates. 6
A47. DTE does not currently offer any residential rate schedules that utilize demand rates 7
or demand-based charges. However, DTE did propose pilot residential demand rates 8
as part of the case in which the D1-A and D1-B rates discussed above were initially 9
approved (Case No. U-20602). In that case, DTE proposed residential rate pilots 10
which included distribution demand rates. Though the September 26, 2019 11
Commission order issued in Case No. U-20602 noted that Staff had reviewed DTE’s 12
application and supported the Company’s proposals (p. 2 of order), the Commission 13
did not approve the proposed residential demand pilots, finding they should be 14
addressed separately and stating, “Additional discussions regarding demand 15
charges would be warranted prior to implementation.” (pp. 3-4 of order) 16
17

N. T. FOLEY
Line U-20836
No.
NTF-34
Q48. What are the overall benefits to customers of taking service under a rate that 1
incorporates demand-based charges? 2
A48. Demand-based rates provide customers an additional way to manage their usage and 3
better control their bill that hasn’t traditionally been available to residential 4
customers. Rates that are predominantly volumetric in nature, like the Company’s 5
D1 (Residential Service Rate – Base) rate provide a single way for customers to 6
manage their usage and potentially reduce their bill. Specifically, customers taking 7
service under these types of rates can only lower their bill by reducing their 8
aggregate usage. 9
10
TOU rates, like the Company’s proposed D1.11 (Residential Service Rate – 11
Standard TOU) or existing D1.2 (Residential Service Rate – Enhanced TOU) rates 12
provide a second way for customers to manage their usage and potentially reduce 13
their bill. Specifically, customers taking service under these types of rates can also 14
shift their usage from on-peak periods to off-peak periods to lower their bill. These 15
customers have two tools to control their bill – reduce and shift. 16
17
Rates that incorporate charges based on a customer’s demand offer a third way for 18
customers to manage their usage and potentially reduce their bill. Customers taking 19
service under these types of rates can also stagger their usage in order to reduce their 20
peak demand and lower their bill. For example, instead of using multiple high-21
demand appliances at once (e.g., electric clothes dryer, air conditioning, electric 22
oven, etc.), customers could stagger their usage and use these appliances at different 23
times, so their peak demand throughout the day and month is less. These customers 24
then have three tools to control their bill – reduce, shift, and stagger. 25

N. T. FOLEY
Line U-20836
No.
NTF-35
1
As customers become more sophisticated and tools to actively manage usage 2
become more mature, providing additional ways for customers to control the size of 3
their bill can have tremendous value. Offering a rate option that provides customers 4
with this added flexibility clearly increases customers’ ability to manage their usage 5
and control the size of their bill. 6
7
Q49. Is the Company proposing the introduction of a residential demand-based 8
tariff? 9
A49. Yes, the Company is proposing to establish Rate Schedule D1.12 (Residential 10
Service Rate – Stable Bill Service Level), which would be a voluntary tariff 11
available to all residential customers. 12
13
Q50. What are the key components of the proposed D1.12 (Residential Service Rate 14
– Stable Bill Service Level) rate? 15
A50. The D1.12 rate consists of three main components: 16
• A per kWh TOU energy charge to recover energy-related costs, such as fuel 17
and purchased power 18
• A fixed monthly Delivery Service charge set equal to the Delivery Service 19
charge incorporated into other base residential service tariffs 20
• A monthly Customer Service Level charge to recover all other costs not 21
collected through the energy and Delivery Service charges described above. 22
The Customer Service Level charge would be based on the demand an 23
individual customer places on the system 24
I further describe each of these components later in my testimony. 25

N. T. FOLEY
Line U-20836
No.
NTF-36
1
Q51. Please further describe the per kWh TOU energy charge component of the 2
proposed D1.12 (Residential Service Rate – Stable Bill Service Level) rate. 3
A51. Under the proposed D1.12 rate, the per kWh TOU energy charge is applied to Power 4
Supply Non-Capacity costs as these are generally energy-related costs. As discussed 5
earlier in my testimony, it is appropriate to recover energy-related costs through an 6
energy charge. 7
8
As described by Company Witness Willis, the TOU structure of this charge is 9
designed to mimic the Company’s proposed D1.11 (Residential Service Rate – 10
Standard TOU) rate to ensure consistency across rates. Both the TOU pricing 11
windows and the methodology for setting on-peak/off-peak pricing differentials 12
would be consistent between D1.11 and D1.12. 13
14
Q52. Please further describe the fixed Delivery Service charge component of the 15
proposed D1.12 (Residential Service Rate – Stable Bill Service Level) rate. 16
A52. The fixed Delivery Service charge is designed to match the Company’s other 17
residential service rate offerings. While the Company has proposed an increase to 18
this charge in the past, it is not proposing an increase as part of its D1.12 rate 19
proposal. 20
21
Q53. Please further describe the Customer Service Level charge component of the 22
proposed D1.12 (Residential Service Rate – Stable Bill Service Level) rate. 23
A53. The Customer Service Level charge is designed to equitably recover all other costs 24
not being collected through the per kWh TOU energy charge or the Delivery Service 25

N. T. FOLEY
Line U-20836
No.
NTF-37
charge. The Customer Service Level charge would recover those power supply 1
capacity and distribution costs currently recovered on a volumetric basis. The basic 2
structure is that each customer taking service under the D1.12 rate would be assigned 3
to a “service level” based on the demands they place on the system. The service 4
levels are pre-defined such that there is perfect clarity about why a customer is 5
assigned to a specific service level. 6
7
Each service level has a fixed monthly charge associated it, with higher service 8
levels being subjected to higher monthly charges. 9
10
Q54. Under the proposed design, how would a customer’s service level be 11
determined? 12
A54. A customer’s service level would be determined by first calculating the customer’s 13
“service size”, and then using that to assign the customer to a pre-defined service 14
level. 15
16
A customer’s “service size” would be determined by calculating the average of the 17
customer’s three highest use hours during the previous twelve billing cycles, 18
inclusive of the customer’s current billing cycle. As defined for this rate, hourly use 19
is the average demand, in kW, over a clock hour. The Company proposes that the 20
three highest use hours must occur on different calendar days. For example, if over 21
the past twelve billing cycles a customer’s highest use hours (assuming they 22
occurred on different calendar days) were 4.25 kW, 4.75 kW, and 5.5 kW, then the 23
customers “service size” would be calculated at 4.83 kW. 24
25

N. T. FOLEY
Line U-20836
No.
NTF-38
Once a customer’s “service size” has been calculated, the customer would be 1
assigned to a service level based on pre-defined thresholds. The proposed thresholds 2
are outlined below in Figure 3. 3
4
Service Level Service Size
1 less than 1.00 kW
2 at least 1.00 kW but less than 2.00 kW
3 at least 2.00 kW but less than 3.00 kW
4 at least 3.00 kW but less than 4.00 kW
5 at least 4.00 kW but less than 5.00 kW
6 at least 5.00 kW but less than 6.00 kW
7 at least 6.00 kW but less than 7.00 kW
8 at least 7.00 kW but less than 8.00 kW
9 at least 8.00 kW but less than 9.00 kW
10 at least 9.00 kW
Figure 3: Proposed D1.12 (Residential Service Rate – Stable Bill Service Level) 5
rate service levels 6
7
Continuing from the example presented above, a customer with a “service size” of 4.83 8
kW would be assigned to Service Level 5. 9
10
Q55. Under the proposed design, how would the Company determine the service 11
level for a customer without twelve months of billing history? 12
A55. If a customer does not have at least twelve months of billing history, the Company 13
proposes to use as much billing history as is available for the individual customer. 14
For example, if a new customer wishes to take service under the D1.12 rate, during 15
the customer’s first billing cycle the Company would use only that billing cycle 16

N. T. FOLEY
Line U-20836
No.
NTF-39
usage to calculate the customer’s service size and assign them to a service level. 1
During the customers second billing cycle, the Company would use the first two 2
billing cycles to determine service size and service level, and so on. Once a customer 3
has twelve months of billing history, the Company would only use the trailing twelve 4
months to determine service size and assign the customer to a service level, as 5
described above. 6
7
If an existing customer desires to switch rates onto the D1.12 rate, the Company 8
proposes to use twelve months of usage history, or as much usage history as is 9
available if less than twelve months, regardless of if that usage was served under a 10
different rate. 11
12
Q56. Why is the Company proposing to use twelve months of usage history to 13
determine a customer’s “service size”? 14
A56. Using twelve months of billing history to determine a customer’s “service size” 15
results in a much more stable bill than is provided under the Company’s other base 16
rates. Under the proposed D1.12 rate design, if a customer’s usage from year-to-year 17
is consistent, then they could expect to remain in the same service level, and be 18
subject to a consistent service level charge, subject to changes ordered during 19
general rate cases. From month to month, only the energy charge portion of their bill 20
would vary based on their usage during that month. 21
22
With that said, customers would maintain the ability to change service levels and be 23
subjected to higher or lower service level charges if they either make behavioral 24
changes (e.g., staggering their usage to manage high use hours) or by fundamentally 25

N. T. FOLEY
Line U-20836
No.
NTF-40
changing their load (e.g., installing more efficient appliances to reduce their overall 1
load). The Company believes using twelve months of usage history to determine a 2
customer’s service size strikes the right balance between providing bill stability and 3
also allowing customers to manage their usage and control the size of their bill. 4
5
In addition, using twelve months of usage history to determine a customer’s “service 6
size” better ensures equitable recovery of costs by protecting against inefficient 7
users that are driving an outsized level of costs in the system. Under the proposed 8
D1.12 rate design, inefficient users that have relatively high usage “spikes” but 9
otherwise keep usage low would have their service level determined based on these 10
“spikes” and would be subject to the associated service level charge in subsequent 11
months. In other words, they would be more equitably charged for the demands they 12
are placing on the system. 13
14
Q57. Why is the Company not proposing to simply use a customer’s single highest 15
use hour during the trailing twelve months to determine that customer’s service 16
level? 17
A57. The Company appreciates that the structure of the D1.12 is different than what a 18
typical residential customer may be used to. As such, the Company looked for 19
opportunities to provide appropriate customer-friendly features to help ensure a 20
smooth transition onto the rate. As described above, two of these customer-friendly 21
features are: 22
• Calculating a customer’s “service size” by averaging the three highest use 23
hours during the trailing twelve billing cycles, instead of simply using the 24

N. T. FOLEY
Line U-20836
No.
NTF-41
highest use hour. This provides customers taking service under the D1.12 1
rate a level of protection against a single unusually high-use hour. 2
• Requiring that a customer’s three highest use hours occur on separate 3
calendar days. This provides customers taking service under the D1.12 rate 4
a level of protection against a single unusually high-use day. 5
6
Q58. How would a customer taking service under the proposed D1.12 (Residential 7
Service Rate – Stable Bill Service Level) rate be made aware of what service 8
level they are in? 9
A58. The Company envisions updating the bill and online account to display the pertinent 10
information related to service level for any customer taking service under the 11
proposed D1.12 rate. As an illustrative example, Figure 4 displays information that 12
could be provided to customers. 13
14
Figure 4: Illustrative information that could be provided to customers taking 15
service under the D1.12 rate 16
17
The above information provides the customer with transparency in how their service 18
level was determined, and when their highest hours were set. This provides 19
You are taking service under DTE’s Stable Bill offering!
Your service level was determined based on the following:
• Highest use hour 1: 7/7/24 from 1:00-2:00pm – 4.25 kWh
• Highest use hour 2: 9/3/24 from 6:00-7:00pm – 4.53 kWh
• Highest use hour 3: 11/22/24 from 10:00-11:00am – 5.72 kWh
The average of your highest use hours is 4.83 kWh. This puts you in
Service Level 5.

N. T. FOLEY
Line U-20836
No.
NTF-42
customers with clear and compelling pricing signal to manage their usage and use 1
the system more efficiently. If customers are able to manage their high-use hours, 2
they could move to a lower service level over time and be subjected to a lower 3
service level charge. 4
5
Q59. How does the proposed D1.12 (Residential Service Rate – Stable Bill Service 6
Level) rate provide more bill stability? 7
A59. As discussed above, the proposed D1.12 rate uses a customer’s previous twelve 8
months of usage history to determine that customer’s “service size”. Under this 9
construct, customers that have consistent use from year to year could expect to 10
remain in the same service level and be subjected to a relatively consistent service 11
level charge. From month to month, only the energy charge portion of their bill 12
would change based on their actual usage during the month. 13
14
To demonstrate this phenomenon, the Company analyzed the usage history of 15
10,000 randomly selected residential customers. For each customer, monthly bills 16
were simulated based on their actual monthly usage during 2019-2020 under the 17
Company’s proposed D1.11 (Residential Service Rate – Standard TOU) rate and the 18
proposed D1.12 rate. The Company then determined for each customer the 19
difference between their highest bill and lowest bill during the two-year period. 20
21
The results of this analysis are captured below in Figure 5. Under the proposed 22
D1.11 rate, over 80% of customers would be subject to a high bill that is more than 23
double their low bill during the analysis period. Under the proposed D1.12 rate, the 24
portion of customers with a high bill more than double their low bill drops to less 25

N. T. FOLEY
Line U-20836
No.
NTF-43
than 10%. In other words, the proposed D1.12 rate drastically reduces bill volatility 1
as evidenced by the significantly reduced number of customers seeing a high bill 2
more than double their low bill. 3
4
This increased bill stability is potentially extremely valuable for customers, such as 5
those on fixed income or otherwise desiring a more consistent electric bill. 6
7
Figure 5: Customer Bill Volatility under proposed D1.11 rate vs. proposed D1.12 8
rate 9
10
Q60. How is the proposed D1.12 (Residential Service Rate – Stable Bill Service Level) 11
rate different from a traditional “fixed bill” offering 12

N. T. FOLEY
Line U-20836
No.
NTF-44
A60. A traditional “fixed bill” offering charges a customer a fixed monthly amount over 1
the term of the agreement between the customer and the utility. In general, once the 2
term and price have been agreed to by the customer, the monthly charge does not 3
vary based on the customer’s actual usage during the agreement. 4
5
The price offered to the customer is likely based on an assessment of the customer’s 6
historical usage, such that subsequent offers (i.e., after the initial fixed bill term) 7
could be more or less expensive based on the customers usage during the current 8
agreement. In this way, fixed bill offerings potentially send longer-term price signals 9
to manage usage since future offers may depend on current usage. 10
11
Under this arrangement the utility, and by extension its other customers, are taking 12
a risk that a fixed bill customer uses more energy than was estimated but is not 13
paying for the increased costs of serving that load. As such, the utility likely charges 14
a risk premium to the fixed bill customer to try to protect itself and its customers 15
from this possibility. 16
17
The proposed D1.12 rate varies from a traditional fixed bill offering in two key ways: 18
• Near-term pricing signals are maintained. Unlike a traditional fixed bill 19
offering, the proposed D1.12 rate incorporates a per kWh TOU energy 20
charge. As such, customers taking service under this rate would continue to 21
receive a pricing signal encouraging them to reduce overall usage, and to 22
shift usage out of on-peak periods. 23
24

N. T. FOLEY
Line U-20836
No.
NTF-45
As described above, customers taking service under the D1.12 rate would 1
also receive a pricing signal to stagger their usage in order to manage their 2
highest use hours. Unlike a traditional fixed bill offering where the monthly 3
charge is decoupled from actual usage for an individual month, a customer 4
taking service under the D1.12 rate could move to a higher or lower service 5
level and be subjected to a higher or lower service level charge based on their 6
current month’s usage and the timing and size of their previous high-use 7
hours. 8
• There is no risk to the utility or its other customers. The proposed D1.12 is 9
cost-aligned as it appropriately charges customers for the demands they place 10
on the system. If a customer reduces their use of the system over time, they 11
will appropriately be moved to a lower service level and charged a decreased 12
amount, and vice versa. 13
14
Q61. What are the bill impacts to customers taking service under the proposed D1.12 15
(Residential Service Rate – Stable Bill Service Level) rate? 16
A61. Consistent with the Company’s overall approach to rate design, D1.12 is designed 17
to be revenue-neutral to Rate Schedule D1. This means that if all D1 customers took 18
service under the new rate, the Company would continue to collect the total portion 19
of the Company’s overall revenue requirement that has been allocated to D1. This 20
has the effect of making the average bill impact zero when compared to the 21
Company’s Rate Schedule D1. Like with any new rate or rate change, the bill impact 22
to a specific customer will depend on that customer’s individual usage, including 23
any behavior changes they make in response to the rate. As such, it is impossible to 24

N. T. FOLEY
Line U-20836
No.
NTF-46
determine what the actual impacts will be without introducing the rate and assessing 1
the usage and bills of the customers taking service under it. 2
3
While the average bill would not change, customers would have a third way to 4
manage their usage and control their bill. Specifically, they could stagger their usage 5
to better control the demand-based component of their bill. 6
7
Q62. Is the Company proposing a pilot program to test the proposed D1.12 8
(Residential Service Rate – Stable Bill Service Level) rate? 9
A62. No, the Company is not proposing a pilot program to test the proposed rate. Instead, 10
it is the Company’s intent to notify customers of the rate’s availability and provide 11
education about the new rate through traditional channels, such as listing the rate on 12
the Company’s “pricing options” website, sending customers email 13
communications, etc. As such, the Company is not requesting approval of 14
incremental marketing or customer service O&M costs to support the rate’s 15
deployment. 16
17
With that said, the Company plans on closely tracking customers’ engagement with 18
the proposed rate. As mentioned above, the only way to understand the actual usage 19
and bill impacts of new rates or rate changes is to analyze customers that take service 20
under the rate. Among other things, the Company would track and analyze the 21
subscription rate, customer-level usage impacts, and bill impacts of the rate. The 22
Company would plan to share the results of these activities with interested 23
stakeholders. 24
25

N. T. FOLEY
Line U-20836
No.
NTF-47
The Company intends to initially limit the number of customers taking service under 1
the proposed D1.12 rate to 10,000 to ensure it can properly assess the impacts of the 2
rate while also limiting the potential for unintended consequences. Customers taking 3
service under both the D1.12 rate and Rider 18 would not count against this limit. 4
5
Q63. When would D1.12 (Residential Service Rate – Stable Bill Service Level) be 6
available to residential customers? 7
A63. As described earlier in my testimony, TOU Full Implementation, including the 8
introduction of the D1.11 (Residential Service Rate – Standard TOU) rate, will likely 9
occur during the first half of 2023. The Company acknowledges that launching any 10
new rate at the same time has the potential to overwhelm and/or confuse customers, 11
which could result in reduced engagement with either rate and lower overall 12
satisfaction. 13
14
As such, the Company anticipates that it would make the proposed D1.12 rate 15
available to customers in the first quarter of 2024. This will give the Company time 16
to complete and stabilize its TOU Full Implementation and give customers time to 17
get comfortable with TOU rates before an additional rate option becomes available. 18
The Company could accelerate or delay the launch of D1.12 depending on the 19
conditions of the TOU Full Implementation. 20
21
Q64. Has the Company prepared a tariff reflecting the proposed D1.12 (Residential 22
Service Rate – Stable Bill Service Leve) rate described above? 23
A64. Yes. I have directed Company Witness Willis to prepare a proposed D1.12 tariff that 24
reflects the structure and pricing described above. 25
26

N. T. FOLEY
Line U-20836
No.
NTF-48
Distributed Generation Program- Background and Overview 1
Q65. Please describe the Company’s recent history as it relates to its Distributed 2
Generation (DG) Program. 3
A65. Public Act 341 of 2016 included MCL 460.6a(14), which states in part, “Within 1 4
year after the effective date of the amendatory act that added this subsection, the 5
commission shall conduct a study on an appropriate tariff reflecting equitable cost 6
of service for utility revenue requirements for customers who participate in a net 7
metering program or distributed generation program under the clean and renewable 8
energy and energy waste reduction act, 2008 PA 295, MCL 460.1001 to 460.1211. 9
In any rate case filed after June 1, 2018, the commission shall approve such a tariff 10
for inclusion in the rates of all customers participating in a net metering or 11
distributed generation program under the clean and renewable energy and energy 12
waste reduction act, 2008 PA 295, MCL 460.1001 to 460.1211.” 13
14
The Commission in its April 18, 2018 order in Case No. U-18383 then directed 15
utilities to file, “the Inflow/Outflow tariff, attached to [that] Order as Exhibit A,” 16
and continued, “the rate regulated utility may also file its own distributed generation 17
tariff, if desired.” (p 18) The Company complied with this directive in its rate case 18
filed July 6, 2018, Case No. U-20162, wherein DTE proposed the Rider 18 19
Distributed Generation Program, to replace Rider 16 Net Metering on a going 20
forward basis. Rider 16 Net Metering customers who applied and were approved 21
for Rider 16 before Rider 18 was enacted can retain their Rider 16 service for ten 22
years from the date the premise began being billed on Rider 16. The Company 23
proposed that Rider 18 distributed generation customers be subject to the following 24
general rate structure: 25

N. T. FOLEY
Line U-20836
No.
NTF-49
• Inflow (energy the DG customer consumes from the Company’s distribution 1
system) charged at the retail rate of the underlying rate schedule. 2
• Outflow (energy exported from the customer’s DG system to the Company’s 3
distribution system) credited at the monthly average real-time LMP for 4
energy at the DTE Electric-appropriate load node 5
• A System Access Contribution (SAC) charge, which assigned a cost per kW 6
AC of nameplate system capacity based on the system-cost responsibility of 7
distributed generation customers. The charge was proposed to apply to 8
customers taking service under rates without demand charges. 9
10
The Commission’s May 2, 2019 Order in Case No. U-20162 approved an alternate 11
version of the Company’s proposed Rider 18. Total inflow was ordered to be 12
charged at the retail rate of the underlying rate schedule, as had been proposed by 13
the Company, however the Commission ordered the outflow credit be set at the 14
Power Supply rate less Transmission (based on the customer’s underlying rate 15
schedule), and rejected the Company’s proposed SAC charge. 16
17
In the Company’ last filed rate case, Case No. U-20561, MPSC Staff argued in its 18
testimony the Company should voluntarily raise the statutory cap that applies to DG 19
customers (comprised of Rider 16 Net Metering customers and Rider 18 Distributed 20
Generation customers). The Company declined to do so, explaining in rebuttal 21
testimony in that case that doing so may have the unintended consequence of 22
exposing the Company to uncapped revenue shifts and expose our non-DG 23
customers to increased and improper cost subsidizations (See Case No. U-20561, 4T 24
p. 496). 25

N. T. FOLEY
Line U-20836
No.
NTF-50
1
Q66. Is the Company proposing changes to Rider 18 (Distributed Generation 2
Program)? 3
A66. Yes, the Company is proposing making two changes to Rider 18: 4
• Setting the outflow credit, on a per kWh basis, to be the total of the following: 5
o The average monthly MISO hourly LMP for the DTE Electric 6
appropriate load node, calculated and applied separately for each 7
pricing window for customers taking service on TOU rates. 8
o A credit for avoided line losses as calculated through the Company’s 9
most recent line loss study. 10
• Requiring residential customers taking service under Rider 18 to also take 11
service under the Company’s proposed D1.12 (Residential Service Rate – 12
Stable Bill Service Level) rate. 13
I discuss these changes in greater detail later in my testimony. 14
15
Q67. Is the Company contemplating any other changes to its Distributed Generation 16
Program? 17
A67. Yes. If the two proposed changes to Rider 18 summarized above are ordered as 18
proposed, the Company is prepared to voluntarily increase the size of its Distributed 19
Generation Program to 3.0% of the Company's average instate peak load for Full-20
Service customers during the previous 5 calendar years. I describe this potential 21
change in greater detail later in my testimony. 22
23
Distributed Generation Program – Outflow Credit 24
Q68. Can you please describe the current structure of the Rider 18 outflow credit? 25

N. T. FOLEY
Line U-20836
No.
NTF-51
A68. As discussed above, the current Rider 18 outflow credit is equal to retail Power 1
Supply rates less retail-equivalent Transmission rates based on the customer’s 2
underlying rate schedule. In effect, the outflow credit is set equal to the total of the 3
Capacity and Non-Capacity portions of Power Supply, less the embedded 4
Transmission component. 5
6
Q69. Does the current Rider 18 outflow credit structure value outflowed energy 7
consistently? 8
A69. No. Basing the outflow credit on retail rates introduces significant inconsistency in 9
how outflowed energy is valued. For example, take two hypothetical residential 10
customers taking service under Rider 18 – Customer A and Customer B. Customer 11
A’s underlying rate is D1 (Residential Service Rate - Base) and Customer B’s 12
underlying rate is D1.2 (Residential Service Rate – Enhanced TOU). As both D1 13
and D1.2 are available to all residential customers, it is possible that Customer A 14
and Customer B are located nearby to one another, potentially on the same circuit, 15
sharing much of the same equipment. 16
17
If both customers were to outflow 1 kWh of energy between 2-3pm during a summer 18
weekday, they would receive the following compensation for that outflow1: 19
• Customer A: 7.75 cents2 20
• Customer B: 15.33 cents 21
22
Despite outflowing the exact same amount of energy at the exact same time, 23
Customer B would receive almost twice the credit received by Customer A. Said 24
1 Based on approved outflow rates in Case No. U-20561; excludes PSCR factor adjustment 2 Assumes outflow is not in excess of 17 kWh per day

N. T. FOLEY
Line U-20836
No.
NTF-52
differently, the Company’s customers would be paying nearly twice as much to 1
Customer B than they are to Customer A for the exact same energy. As such, this 2
inconsistency represents a clear deficiency in the current Rider 18 outflow credit 3
structure. 4
5
Q70. What should the Rider 18 outflow credit be based on? 6
A70. The Rider 18 outflow credit should reflect the quantifiable cost impacts, either cost 7
savings or cost increases, realized by the utility associated with that outflow. Basing 8
the credit on quantifiable cost impacts has three key benefits: 9
• It ensures that changes to costs realized by the utility as a result of the outflow 10
are appropriately passed onto Rider 18 customers. This ensures Rider 18 11
customers are neither under-compensated nor over-compensated for their 12
outflow. 13
• It provides flexibility such that as DG deployments increase, if new costs or 14
savings were to be realized by the utility as a result of DG outflow, those 15
costs or savings could be appropriately incorporated into the outflow credit. 16
• It provides more consistency across the DG Program such that customers are 17
compensated similarly for similar outflow. 18
19
Q71. What are the quantifiable cost impacts realized by the utility associated with 20
Rider 18 outflowed energy? 21
A71. There are two sources of quantifiable cost impacts related to Rider 18 outflow: 22
• A reduction in energy market purchases. Given the structure of the MISO 23
market, a Rider 18 customer outflowing energy to the grid is effectively 24

N. T. FOLEY
Line U-20836
No.
NTF-53
reducing the need for the Company to make a market purchase for the same 1
volume of energy. 2
• Avoided line losses. According to the Company’s most recent study, there is 3
an average line loss of 9.33% associated with energy delivered from its 4
generation assets to the secondary distribution system3. The outflow from a 5
Rider 18 DG system is likely consumed near the source of generation, such 6
as at a neighbor’s house. As such, there is likely little line loss associated 7
with the movement of this energy. These avoided line losses represent a 8
quantifiable savings associated with Rider 18 outflow. 9
10
Q72. Are customers taking service under Rider 18 providing a capacity service to 11
the Company that should be reflected in the outflow credit? 12
A72. No. Customers taking service under Rider 18 have no obligation, contractual or 13
otherwise, to provide capacity to the Company. In effect, customers outflow the 14
excess energy generated by their DG system after serving their onsite load at the 15
time of generation. Customers who pair their DG system with an onsite battery may 16
also choose to use the excess energy generated by their DG system to charge their 17
battery to serve future load or to store as backup for use in the event of an outage. 18
As such, there is no expectation nor obligation of total outflows, outflows during a 19
given period, or a portion of DG system capacity dedicated to outflow. A customer 20
could potentially use all of their DG system generation to offset onsite load and 21
outflow nothing to the Company, or instead they may end up outflowing a significant 22
portion of the generation. Customers are free to modify their onsite usage if they 23
desire to better match their onsite generation and outflow less to the Company. As 24
3 Sponsored by Company Witness Robinson, Exhibit A-36 Schedule AA-1

N. T. FOLEY
Line U-20836
No.
NTF-54
such, customers taking service under Rider 18 are not providing a capacity service 1
to the Company. 2
3
Q73. How significant are DG outflows compared to overall class loads? 4
A73. The relatively small number of customers taking service under Rider 18 makes the 5
aggregate outflow small when compared to class loads. In 2020, aggregate outflow 6
from Rider 18 customers accounted for 0.008% of total D1 usage. Even during 7
summer system peak times4 aggregate outflows from Rider 18 customers accounted 8
for 0.019% of total D1 usage. At these low levels (i.e., less than 1/10,000 of total D1 9
load; less than 2/10,000 of D1 summer peak load), aggregate outflows do not 10
meaningfully change either actual or forecasted class loads. 11
12
Q74. How is DG generation currently accounted for in class load forecasts? 13
A74. Currently, as described by Company Witness Leuker, the Company forecasts 14
installed DG capacity as well as the total generation expected from those DG 15
installations. The expected generation is netted out of overall class consumption 16
forecasts, to determine the net load forecast. This forecast is used by the Company 17
for allocation purposes. 18
19
As DG deployment becomes more significant, the Company will continue to assess 20
the most appropriate way to incorporate DG generation and outflow in its forecasts. 21
22
Q75. Are there other assets taking service under an MPSC-approved rate that have 23
similar characteristics to DG systems under Rider 18? 24
4 The Company’s 4CP peaks generally occur between 2-5pm with 83% of peaks occurring during this time
during 2018-2020

N. T. FOLEY
Line U-20836
No.
NTF-55
A75. Yes. Qualifying Facilities (QFs) taking service under Rider 5 and electing for 1
“Energy Only Sales” exhibit similar characteristics to customers with DG systems 2
taking service under Rider 18. 3
4
More specifically, “Energy Only Sales” apply to “customers electing to sell only 5
energy to the Company as the customer determines such energy to be available.” 6
This definition applies exactly to customers taking service under Rider 18 as well, 7
as these customers are similarly under no obligation to supply energy to the 8
Company and determine themselves when energy is available. 9
10
Q76. How are customers taking service under Rider 5 and electing for “Energy Only 11
Sales” compensated for energy provided to the Company? 12
A76. Customers taking service under Rider 5 are provided no Capacity credit for the 13
energy they provide to the Company. Instead, the energy they provide is credited at 14
the day-ahead MISO hourly LMP for the DTE Electric appropriate load node. In 15
effect, customers taking service under Rider 5 are receiving a market-based price for 16
the energy they provide. 17
18
Q77. Given these considerations, is it appropriate to include the Capacity portion of 19
Power Supply in the Rider 18 outflow credit? 20
A77. No. As described above, customers taking service under Rider 18 are under no 21
obligation to provide capacity and are therefore not providing a capacity service. In 22
effect, the rest of the Company’s customers are currently paying Rider 18 customers 23
for a service that they are not receiving. 24
25

N. T. FOLEY
Line U-20836
No.
NTF-56
In addition, continuing to include the Capacity portion of Power Supply in the Rider 1
18 outflow credit represents a clear conflict with the “Energy Only Sales” provision 2
of Rider 5. Rider 5 properly reflects that a Capacity payment is inappropriate in cases 3
where the customer is under no obligation to provide capacity to the Company. 4
Paying Rider 18 customers for capacity represents a clear overpayment to customers 5
taking service under this rider. 6
7
Q78. Is it appropriate to include the Non-Capacity portion of Power Supply in the 8
outflow credit? 9
A78. No. As described above, the Rider 18 outflow credit should reflect the cost impacts, 10
either increases or decreases, realized by the Company associated with the outflowed 11
energy. The Non-Capacity portion of Power Supply does not accurately reflect these 12
cost impacts. As described above a market-based price is the appropriate basis on 13
which to compensate Rider 18 customers for outflowed energy. 14
15
Q79. Is it appropriate to include a credit for avoided line losses in the Rider 18 16
outflow credit? 17
A79. Yes. As described above, there is likely little line loss associated with DG outflow 18
given this outflow is generally consumed relatively close to the point of generation. 19
This presumably avoids the line losses experienced by the Company for energy it 20
generates itself and delivers to customers. For secondary distribution customers, 21
these line losses are calculated at 9.33%5. In other words, 1.000 kWh of energy 22
outflowed from a Rider 18 customer effectively displaces 1.103 kWh of energy that 23
would have been generated and sent by the Company. 24
5 Sponsored by Company Witness Robinson, Exhibit A-36 Schedule AA-1

N. T. FOLEY
Line U-20836
No.
NTF-57
1
With that said, including a credit for avoided line loss would only be appropriate if 2
the other changes to Rider 18 are ordered as proposed. As described above, Rider 3
18 customers are currently already being overcompensated for their outflow, so 4
incorporating a line loss credit into the current structure would only increase this 5
overpayment. Only if Rider 18 outflow compensation is ordered to be based on 6
quantifiable utility cost impacts as described above would a credit for avoided line 7
losses be appropriate. 8
9
Q80. Given these considerations, what is the Company’s proposal for the Rider 18 10
outflow credit? 11
A80. The Company is proposing to set the Rider 18 outflow credit based on the average 12
monthly MISO hourly LMP for the DTE Electric appropriate load node. The outflow 13
credit rate would be calculated and applied separately for each pricing period for 14
customers taking service on TOU rates. 15
16
In addition, the Company is proposing to credit Rider 18 customers for the avoided 17
line losses associated with their outflow. For residential Rider 18 customers on the 18
secondary distribution system, this would effectively mean they would be 19
compensated for 1.103 kWh of energy for every 1.000 kWh they outflow. 20
21
This proposal best reflects the cost impacts realized by the utility from Rider 18 22
outflow and corrects the overpayment currently being made to Rider 18 customers 23
for the Capacity portion of Power Supply. Furthermore, it corrects the 24
inconsistencies inherent in the current Rider 18 structure and properly aligns the 25

N. T. FOLEY
Line U-20836
No.
NTF-58
Rider 18 outflow credit with the “Energy Only Sales” provision of Rider 5 in two 1
key ways: 2
• Both would appropriately value outflow energy based on the market rate at 3
the time of outflow 4
• Neither Rider 5 nor the Company’s proposal for the Rider 18 outflow credit 5
provide a payment for the Capacity portion of Power Supply 6
7
Distributed Generation Program – Delivery Cost Recovery 8
Q81. What are the main drivers of Delivery costs? 9
A81. As discussed previously in my testimony, there are two main drivers of Delivery 10
costs. First, Delivery costs are driven by the number of customers being served by 11
the Company. Second, Delivery costs are driven by the NCP demand of customers 12
or groups of customers. 13
14
Q82. Do customers installing a DG system and taking service under Rider 18 drive 15
any cost savings related to Delivery? 16
A82. No. As it relates to the number of customers being served, clearly a customer 17
installing a DG system and taking service under Rider 18 does not change the 18
number of customers being served by the Company. 19
20
As it relates to NCP demand, the Company analyzed the aggregated usage of 342 21
customers that began taking service under Rider 18 at some point in 2019 and took 22
D1 service in 2018 before installing their DG system. In other words, the Company 23
assessed customers that did not have a system installed for any part of 2018 but did 24
have a DG system installed for all of 2020. The Company compared these 25

N. T. FOLEY
Line U-20836
No.
NTF-59
customers’ average monthly NCP demand in 2018 before they installed their DG 1
systems with their average monthly NCP demand in 2020 after they had installed 2
their systems. The Company checked to make sure that these customers had 3
adequate billing history during 2018-2020 to complete a robust comparison. The 4
Company did a similar comparison for non-Rider 18, D1 customers during the same 5
period to ensure there were not structural differences between Rider 18 and non-6
Rider 18, D1 customers. The results of the analysis are summarized below in Figure 7
6. 8
9
Figure 6: comparison of average monthly NCP demand 10
11
The results of this analysis show that customers who installed their DG system and 12
took service under Rider 18 did not meaningfully reduce their average monthly NCP 13
demand. The very slight decrease in average monthly NCP demand realized by 14

N. T. FOLEY
Line U-20836
No.
NTF-60
Rider 18 customers (i.e., 1% decrease) was actually less of a decrease than that 1
realized by non-Rider 18 customers during the same period (i.e., 2% decrease). 2
3
Given that customers installing a DG system and taking service under Rider 18 do 4
not reduce the number of customers being served by the Company or their average 5
NCP demand, it is also clear that these customers are not driving any Delivery cost 6
savings. 7
8
Q83. Are customers installing DG systems and taking service under Rider 18 able to 9
reduce the Delivery portion of their monthly bill? 10
A83. Yes. Traditional recovery of Delivery costs for residential customers utilizes a “flat” 11
per kWh charge coupled with a fixed monthly charge. When a customer installs a 12
DG system, they typically consume a portion of their generation onsite, thereby 13
reducing the volume of energy they purchase from the utility. As such, customers 14
are able to reduce the Delivery portion of their bill given the volumetric nature of 15
recovery. 16
17
By looking at the change in inflow for the 342 customers that installed a DG 18
sometime during 2019, the Company calculates that on average Rider 18 customers 19
are able to reduce the Delivery portion of their bill by $19.66 per month compared 20
to what they would have paid based on their usage without a DG system. 21
22
Q84. Given these dynamics, what can you conclude about Delivery cost recovery for 23
Rider 18 customers. 24

N. T. FOLEY
Line U-20836
No.
NTF-61
A84. Since Rider 18 customers do not drive any cost savings related to the distribution 1
system, but are able to reduce their own bill, there exists a clear cost shift associated 2
with Delivery costs that is borne by non-Rider 18 customers. 3
4
Q85. How is the Company proposing to address this cost shift? 5
A85. As stated previously, the most appropriate way to recover Delivery costs is through 6
a combination of fixed monthly charges and demand-based charges. As such, the 7
Company believes the most appropriate path forward to correct the Delivery cost 8
shift described above is to move toward this rate structure. More specifically, the 9
Company is proposing that all residential customers taking service under Rider 18 10
be required to also take service under the Company’s proposed D1.12 (Residential 11
Service Rate – Stable Bill Service Level) rate that was described previously in my 12
testimony. 13
14
The proposed D1.12 rate appropriately charges customers based on the peak demand 15
they are placing on the system. If a customer installing a DG system and taking 16
service under Rider 18 can reduce the peak demand they are placing on the system, 17
then their bill will be rightfully reduced over time as they move to a lower service 18
level. This structure ensures that Rider 18 customers are contributing an equitable 19
amount toward system costs based on their usage. 20
21
Q86. Why is the Company not proposing requiring all customers to take service 22
under D1.12? 23
A86. As discussed previously, the Company believes incrementalism is a critical 24
consideration when contemplating the introduction of new rates or rate design 25

N. T. FOLEY
Line U-20836
No.
NTF-62
changes. As discussed earlier in my testimony, residential customers will already be 1
subject to the Company’s proposed TOU Full Implementation. The Company does 2
not consider it appropriate to require all residential customers to also take service 3
under a demand-based rate at this time. Customers wishing to take service under 4
D1.12 would be free to do so. 5
6
With that said, the clear presence of a Delivery cost shift described above being paid 7
for by non-Rider 18 customers compels the Company to propose an immediate 8
solution for Rider 18 customers. 9
10
Q87. Has the Company prepared a tariff reflecting the changes described above? 11
A87. Yes. I have directed Company Witness Willis to prepare a proposed Rider 18 that 12
reflects the changes discussed above. 13
14
Q88. Is the Company proposing any type of phase-in or grandfathering approach to 15
the proposed changes to Rider 18? 16
A88. The Company proposes that the changes to Rider 18 described in my testimony not 17
take effect until the later of either the Company hitting any of the category-specific 18
reservations established through MCL 460.1173(3) (i.e., 0.5% for Category 1 19
customers, 0.25% for Category 2 customers, or 0.25% for Category 3 customers)6, 20
or the first quarter of 2024. An effective date so far into the future has several 21
benefits: 22
6 If the proposed changes are triggered by the Company hitting any category-specific reservation established in statute, the Company will implement changes to Rider 18 within 90 days of formally notifying the Commission that the reservation limit(s) has been achieved.

N. T. FOLEY
Line U-20836
No.
NTF-63
• Provides adequate time for current Rider 18 customers, potential Rider 18 1
customers, and other interested stakeholders to prepare for the changes. 2
• Eliminates any customer confusion that might otherwise be present if 3
changes to Rider 18 were made at the same time as the Company’s TOU Full 4
Implementation. 5
• Allows the Company to dedicate adequate resources and focus to its TOU 6
Full Implementation. 7
8
At the later of either the Company hitting any of the category-specific reservations 9
established through MCL 460.1173(3) or the first quarter of 2024, the Company 10
proposes that these changes become immediately effective for all customers taking 11
new service under Rider 18. At that time, all new Rider 18 residential customers will 12
be required to take service under D1.12 and their DG installation, and Rider 18, must 13
be associated with their D1.12 service. All existing Rider 18 customers will be 14
subject to the updated outflow compensation but may remain on their existing 15
rates(s). Given the issues in the design of the current Rider 18 described earlier in 16
my testimony, the Company is not proposing any grandfathering of existing Rider 17
18 customers beyond the scope and effective date described above. 18
19
Distributed Generation Program – Program Size 20
Q89. Is the Company prepared to make changes to the size of the Distributed 21
Generation Program? 22
A89. Yes, if the two changes to Rider 18 discussed above and captured in the proposed 23
Rider 18 tariff are ordered by the Commission as proposed, the Company is prepared 24
to voluntarily increase the Distributed Generation Program size to 3.0% of the 25

N. T. FOLEY
Line U-20836
No.
NTF-64
Company’s average instate peak load for Full-Service customers during the previous 1
5 calendar years. As part of this voluntary increase, the Company would not enforce 2
category-specific capacity limits or reservations beyond the minimum level of 3
participation reserved for each category as authorized in MCL 460.1173(3). The 4
proposed language defining the new Distributed Generation Program size would 5
read: 6
7
“The Distributed Generation Program is voluntary and available on a first 8
come, first served basis for new customer participants or existing customer 9
participants increasing their aggregate generation. The combined net metering 10
(Rider 16) and Distributed Generation Program (Rider 18) size is equal to 3.0% 11
of the Company's average instate peak load for Full-Service customers during 12
the previous 5 calendar years. Within the Program capacity, 0.5% is reserved 13
for Category 1 Distributed Generation customers, 0.25% is reserved for 14
Category 2 Distributed Generation customers and 0.25% is reserved for 15
Category 3 Distributed Generation customers. The Company shall notify the 16
Commission upon the Program reaching capacity in any Category.” 17
18
Once again, the Company is only prepared to make this voluntary increase if the two 19
changes to Rider 18 summarized above are approved as proposed. Absent an order 20
approving the two changes as proposed, the Company may elect to retain the current 21
Distributed Generation Program size as prescribed in legislation (i.e., 1.0% of the 22
Company’s average instate peak load for Full-Service customers during the previous 23
5 calendar years) or increase the Distributed Generation Program size to a level 24
different than described above. 25

N. T. FOLEY
Line U-20836
No.
NTF-65
1
Q90. Can the Commission order the Company to increase the size of its Distributed 2
Generation Program above what was outlined in MCL 460.1173(3)? 3
A90. While I am not an attorney and I am not offering a legal analysis, my understanding 4
is the Commission cannot order the Company to increase the size of its DG program 5
above what is outlined in MCL 460.1173(3). Any required increase to the program 6
size would likewise require an amendment to MCL 460.1173(3) which either 7
explicitly increases the program size to a specified level, or grants authority to the 8
Commission to set the program size. 9
10
However, the Company is free to voluntarily increase the size of its Distributed 11
Generation Program above what is required in MCL 460.1173(3), as Consumers 12
Energy elected to do in 2021. 13
14
Q91. Why has the Company not yet voluntarily increased the size of its Distributed 15
Generation Program? 16
A91. The Company has not increased the size of its Distributed Generation Program 17
because it continues to be concerned about the underlying design of Rider 18. As 18
I’ve laid out in my testimony, the Company believes that: 19
• The current Rider 18 rate design treats outflow inconsistently and 20
overcompensates customers for their outflow by including the Capacity 21
portion of Power Supply in the outflow credit, and by not incorporating a 22
market-based mechanism for the remaining credit. 23

N. T. FOLEY
Line U-20836
No.
NTF-66
• There is a clear cost shift whereby DG customers can reduce the Delivery 1
portion of their bill without the Company being able to realize a similar cost 2
savings. 3
4
The costs associated with these issues are ultimately borne by non-Rider 18 5
customers in the form of upward rate pressure. As such, it would be inappropriate to 6
increase the size of the Distributed Generation Program as this would allow these 7
issues to grow in magnitude along with the upward rate pressure on non-participants. 8
9
With that said, the Company appreciates that various stakeholders value certainty in 10
this space and is therefore prepared to voluntarily increase the size of its Distributed 11
Generation Program if the issues outlined above are sufficiently addressed. The 12
proposals I’ve described here and which are incorporated in the proposed Rider 18 13
tariff sufficiently address these issues. 14
15
Q92. Why does the size of the Company’s Distributed Generation Program need to 16
be limited if the Company’s proposals are approved? 17
A92. Despite the growth of DG installations in the Company’s service territory, the total 18
level of installed DG capacity is still relatively low. As such, the long-term impacts 19
of higher levels of DG penetration on the Company’s costs and ability to provide 20
safe and reliable power are difficult to predict with any accuracy. 21
22
Maintaining a limit on the size of the Company’s Distributed Generation Program 23
provides a useful and transparent opportunity to evaluate the program and associated 24
rate design and determine if any adjustments are appropriate. 25

N. T. FOLEY
Line U-20836
No.
NTF-67
1
Q93. Does this complete your direct testimony? 2
A93. Yes, it does. 3

STATE OF MICHIGAN
BEFORE THE MICHIGAN PUBLIC SERVICE COMMISSION
In the matter of the Application of )
DTE ELECTRIC COMPANY )
for authority to increase its rates, amend ) Case No. U-20836
its rate schedules and rules governing the )
distribution and supply of electric energy, and )
for miscellaneous accounting authority. )
QUALIFICATIONS
AND
DIRECT TESTIMONY
OF
SHANNEN M. HARTWICK

DTE ELECTRIC COMPANY
QUALIFICATIONS AND DIRECT TESTIMONY OF SHANNEN M.
HARTWICK Line
No.
SMH-1
Q1. What is your name, business address and by whom are you employed? 1
A1. My name is Shannen M. Hartwick (she/her/hers), Director of Tree Trim, One 2
Energy Plaza, Detroit, Michigan 48226. I am employed by DTE Electric Company. 3
4
Q2. On whose behalf are you testifying? 5
A2. I am testifying on behalf of DTE Electric Company (DTE Electric or Company). 6
7
Q3. What is your educational background? 8
A3. I graduated from the University of Michigan with a Bachelor of Science in 9
Engineering in 2007. I am currently in the Executive MBA program with the Ross 10
School of Business at the University of Michigan. I plan to complete this program 11
in 2023. 12
13
Q4. What is your work experience? 14
A4. I began my career with DTE Electric in 2008 and have been employed there since. 15
I started out as an Associate Engineer in the Performance Management group where 16
I worked on several process improvement projects across Distribution Operations. 17
Over the years, I held a number of positions with increasing leadership 18
responsibilities primarily within Distribution Operations and spent a year in DTE 19
Electric’s strategy team. Within Distribution Operations I worked in areas that 20
include: Process Management Team, Substations, Asset Optimization (SOC, 21
Strategy, and dispatch), Southeast Service Operations and Tree Trim. 22
23

S. M. HARTWICK
Line U-20836
No.
SMH-2
In 2014, I took a position as a Developmental Field Supervisor – Southeast Service 1
Operations where I was responsible for leading the frontline lineman performing 2
maintenance, operations, and construction on DTE Electric’s electrical distribution 3
system. 4
5
In 2015, I was promoted to Manager – Tree Trim where I was responsible for leading 6
Operations for the Tree Trim Team, comprised of DTE Energy Employees and all 7
six of our tree trim vendors (comprising over 1200 employees in 2020). In this role, 8
I was responsible for safety, quality, productivity, customer satisfaction, storm and 9
trouble restoration efforts, and relationships with municipalities. 10
11
Q5. What are your current job responsibilities? 12
A5. Currently, I am the Director of Tree Trim. In this role, I am responsible for the 13
strategy and execution of the Enhanced Tree Trim Program. This includes contract 14
negotiations, strategy, planning, auditing, execution, outage restoration trimming, 15
customer satisfaction, tree trim technology, and scheduling. 16
17
Q6. Have you previously sponsored testimony before the Michigan Public Service 18
Commission (MPSC or Commission)? 19
A6. I have not previously sponsored testimony, however, I supported the preparation of 20
testimony on the topic of the Company’s tree trimming program in previous rate 21
cases (Case Nos. U-20162 and U-20561). 22

S. M. HARTWICK
Line U-20836
No.
SMH-3
Purpose of Testimony 1
Q7. What is the purpose of your testimony? 2
A7. The purpose of my testimony is to: 3
• Discuss the importance of DTE Electric’s vegetation management (“Tree 4
Trimming”) program; 5
• Support the historical Operations and Maintenance (O&M) expenses related to 6
tree trimming efforts for 2019 and 2020 and the projected base O&M expenses 7
and the Tree Trim Regulatory Asset Surge funding amount for November 1, 8
2022 to October 31, 2023; 9
• Request approval of the Surge Program funding for 2023-2024; 10
• Provide details related to the Company’s Tree Trimming Surge Program that 11
will deliver on the reliability goals established in the Company’s Distributed 12
Grid Plan 13
• Describe the customer benefits of the Company’s expanded Tree Trimming 14
Surge Program to date. 15
16
Q8. Are you sponsoring any exhibits in this proceeding? 17
A8. Yes. I am supporting the following exhibits: 18
Exhibit Schedule Description 19
A-13 C5.6.1 Projected Tree Trim Expenses 20
A-22 L1 Projected Value of Tree Trimming Surge Program 21
A-31 V1 2020 Tree Trim Annual Report 22
23
Q9. Were these exhibits prepared by you or under your direction? 24
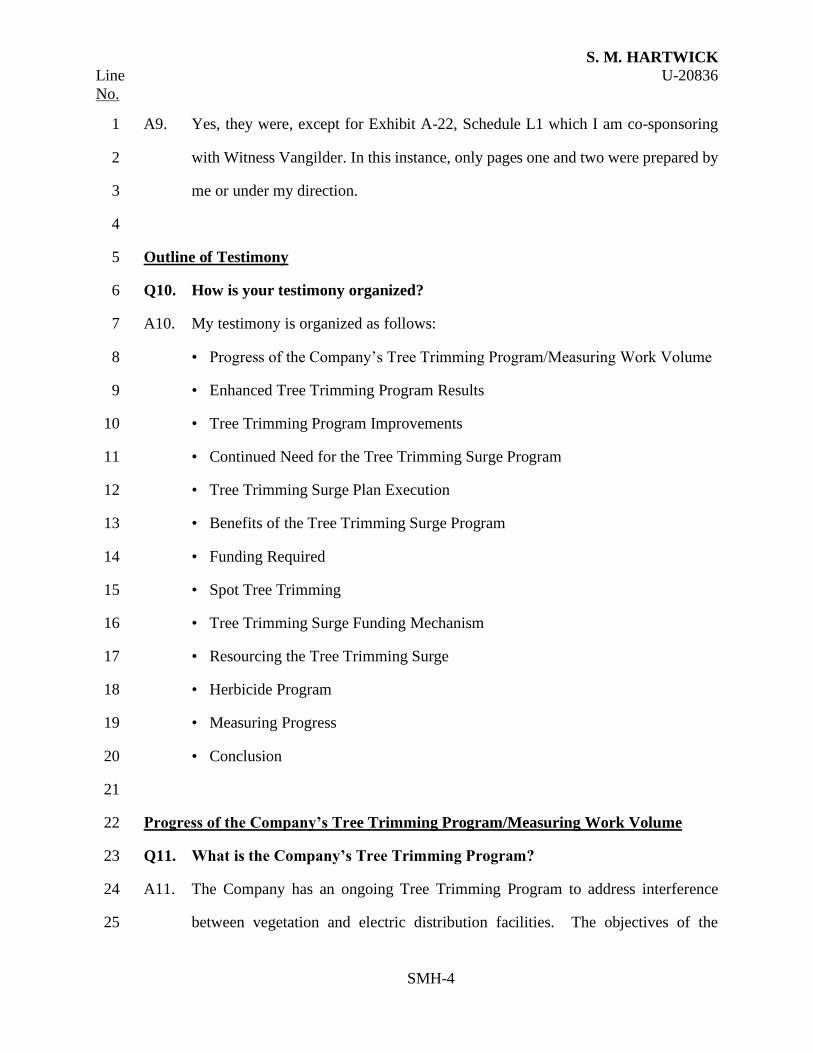
S. M. HARTWICK
Line U-20836
No.
SMH-4
A9. Yes, they were, except for Exhibit A-22, Schedule L1 which I am co-sponsoring 1
with Witness Vangilder. In this instance, only pages one and two were prepared by 2
me or under my direction. 3
4
Outline of Testimony 5
Q10. How is your testimony organized? 6
A10. My testimony is organized as follows: 7
• Progress of the Company’s Tree Trimming Program/Measuring Work Volume 8
• Enhanced Tree Trimming Program Results 9
• Tree Trimming Program Improvements 10
• Continued Need for the Tree Trimming Surge Program 11
• Tree Trimming Surge Plan Execution 12
• Benefits of the Tree Trimming Surge Program 13
• Funding Required 14
• Spot Tree Trimming 15
• Tree Trimming Surge Funding Mechanism 16
• Resourcing the Tree Trimming Surge 17
• Herbicide Program 18
• Measuring Progress 19
• Conclusion 20
21
Progress of the Company’s Tree Trimming Program/Measuring Work Volume 22
Q11. What is the Company’s Tree Trimming Program? 23
A11. The Company has an ongoing Tree Trimming Program to address interference 24
between vegetation and electric distribution facilities. The objectives of the 25
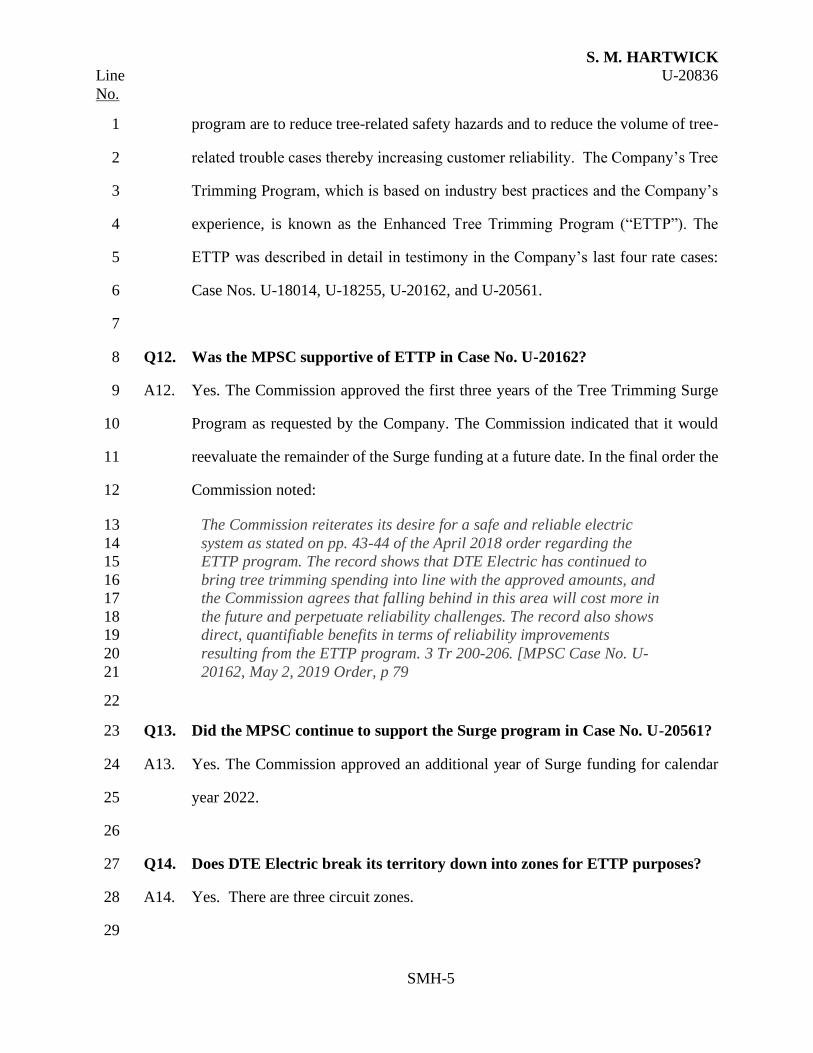
S. M. HARTWICK
Line U-20836
No.
SMH-5
program are to reduce tree-related safety hazards and to reduce the volume of tree-1
related trouble cases thereby increasing customer reliability. The Company’s Tree 2
Trimming Program, which is based on industry best practices and the Company’s 3
experience, is known as the Enhanced Tree Trimming Program (“ETTP”). The 4
ETTP was described in detail in testimony in the Company’s last four rate cases: 5
Case Nos. U-18014, U-18255, U-20162, and U-20561. 6
7
Q12. Was the MPSC supportive of ETTP in Case No. U-20162? 8
A12. Yes. The Commission approved the first three years of the Tree Trimming Surge 9
Program as requested by the Company. The Commission indicated that it would 10
reevaluate the remainder of the Surge funding at a future date. In the final order the 11
Commission noted: 12
The Commission reiterates its desire for a safe and reliable electric 13
system as stated on pp. 43-44 of the April 2018 order regarding the 14
ETTP program. The record shows that DTE Electric has continued to 15
bring tree trimming spending into line with the approved amounts, and 16
the Commission agrees that falling behind in this area will cost more in 17
the future and perpetuate reliability challenges. The record also shows 18
direct, quantifiable benefits in terms of reliability improvements 19
resulting from the ETTP program. 3 Tr 200-206. [MPSC Case No. U-20
20162, May 2, 2019 Order, p 79 21
22
Q13. Did the MPSC continue to support the Surge program in Case No. U-20561? 23
A13. Yes. The Commission approved an additional year of Surge funding for calendar 24
year 2022. 25
26
Q14. Does DTE Electric break its territory down into zones for ETTP purposes? 27
A14. Yes. There are three circuit zones. 28
29

S. M. HARTWICK
Line U-20836
No.
SMH-6
Q15. How does the ETTP define tree work to be performed based on circuit zones? 1
A15. In the right-of-way of all zones, the Company attempts to remove all small trees 2
and larger trees that pose an unacceptable risk to the electrical system. 3
Additionally, the Company attempts to mitigate all hazard trees (trees outside the 4
right of way that are dead, diseased, or dying and threaten to interrupt service to 5
customers). 6
7
Specifically, in Zone 1, the portion of the circuit from the substation to the first 8
protective device or drop down, the Company removes all branches overhanging the 9
conductors. In Zone 2, the portion of the circuit from the first protective device or 10
drop down to the fused lateral, and Zone 3, the fused laterals, the Company removes 11
all softwood and hardwood branches overhanging the conductors at less than a forty-12
five-degree angle. 13
14
Q16. What were the results of the Tree Trimming Program in 2020? 15
A16. The 2020 results will be described in terms of miles trimmed, units completed, cost 16
to achieve, reliability impact, and customer satisfaction. 17
(i) Miles Trimmed: The Company trimmed 5,589 line miles on 814 separate 18
circuits exceeding its plan of 5,500 miles. 19
(ii) Units Completed: The Company completed 25,557 tree trim comparable units 20
compared to a target of 25,319. I discuss this more later in my testimony. 21
(iii) Costs to Achieve: DTE Electric spent $151.1 million on the tree trimming 22
program in 2020. This equates to $16.5 million more than the $134.6 million1 23
of funding approved in MPSC Cases No. U-20561 and No. U-20162. 24
1 $91.3 million for base tree trim funding plus $43.3 million for Surge deferral funding

S. M. HARTWICK
Line U-20836
No.
SMH-7
(iv) Reliability Impact: Circuits trimmed as part of the ETTP since 2015 show an 1
average annual reduction of 69 percent in the number of tree-related customer 2
interruptions2 and an average annual reduction of approximately 62 percent in 3
the number of customer minutes of interruption3 in the year following trimming, 4
compared to the non-ETTP circuits. These results are discussed in more detail 5
later in my testimony and in the Company’s annual Tree Trim Report for 2020, 6
submitted in March 1st, 2021, which we have included as Exhibit A-31 Schedule 7
V1. 8
(v) Customer Satisfaction: An important measure of customer satisfaction is the 9
number of MPSC complaints filed each year related to the Company’s tree 10
trimming work. Although the complaints for tree-related service issues 11
increased slightly to 47 YTD in 2021 complaints compared to 43 for the same 12
timeframe in 2020, of the complaints were primarily driven by customers 13
asking for tree trimming. The complaints have not been driven by customer 14
concerns regarding the tree trimming work conducted on their properties; 15
rather, they demonstrate customers’ support for tree trimming and its positive 16
impacts on reliability and costs. 17
18
Q17. Is measuring miles trimmed the best way to measure tree trim progress? 19
A17. Miles trimmed is a valuable way to measure progress and understand the work, but 20
each mile can vary significantly and counting miles is not the only measure of the 21
actual work performed. DTE Electric uses “comparable units” to more accurately 22
measure tree-trim work performed. Comparable units consider the work volume 23
and the complexity of the work on the circuit to provide a clearer picture of the true 24
2,3 Weighted average of circuits trimmed from 2015 to 2019

S. M. HARTWICK
Line U-20836
No.
SMH-8
scope of work on each circuit and allow us to balance the work more evenly among 1
contractors and regions. The Company is continuing to improve this concept and is 2
actively using comparable units as one of our standard measures of tree trim 3
progress. 4
5
Q18. How does the Company define work volume? 6
A18. Work volume is defined by tree density. The more trees that need to be trimmed or 7
removed per mile, the higher the volume. The Company has circuits that range from 8
less than 10 trees per mile to circuits with more than 1,000 trees per mile. 9
10
Q19. How does the Company measure density? 11
A19. We use a combination of actual data from circuits that have been recently cut and 12
a density study that was completed in 2018 by Environmental Consultants Inc. 13
(ECI), a nationally recognized expert in utility vegetation management that has 14
been contracted by DTE Electric since 2015. The density study looked at the 15
majority of DTE Electric circuits and sampled every 10th span to give us an 16
approximate density. Any circuit that did not have data from actuals or the density 17
study is assigned the service center average density. The density values will 18
continue to be updated as we get more accurate data from the field. 19
20
Q20. How does the Company define work complexity? 21
A20. Work complexity is a measure of many factors that influence the cost to perform 22
work in a given area. These factors include: 23

S. M. HARTWICK
Line U-20836
No.
SMH-9
(1) Back lot work – The majority of DTE Electric’s distribution circuit miles are in 1
the back of residences. These portions of the circuit are often inaccessible by 2
bucket truck and require tree trimmers to climb the tree to perform trimming. 3
(2) Security – There are some areas that require our crews to work with assistance 4
from a security contractor, increasing the cost to perform work. For example, 5
in 2019, while working in the Detroit area, the tree crews had over 16 chainsaws 6
and 3 blowers stolen out of their locked trucks over 5 different occasions, 7
resulting in over $20,000 in losses. 8
(3) Off cycle work – The farther off cycle the work the more expensive it becomes. 9
Not only does the volume of wood removed increase with each growing season 10
but often the trees grow into and through the distribution lines. In these 11
situations, overhead line crews are needed to perform a circuit shutdown before 12
work can be completed. 13
(4) Customer Outreach – While DTE Electric provides equal service to all 14
customers, we tailor outreach efforts based on community feedback. As such, 15
certain areas within our service territory are more interested in the tree work we 16
are performing within their communities and require more customer contact and 17
outreach efforts before work can begin. 18
19
Q21. How does the Company measure work complexity? 20
A21. Complexity is a more complicated measure than density due to the variety of factors 21
that can influence it. To approximate complexity, we indexed the average service 22
center cost to trim a tree and used it as the complexity factor. For example, our 23
North Area Service Center has the lowest average cost per tree and is indexed to 24
1.0 complexity factor. All other service centers have higher average per tree costs 25

S. M. HARTWICK
Line U-20836
No.
SMH-10
and, as such, have higher complexity factors. Where we have actual cost or bid 1
data, we are using that data to determine a more accurate complexity factor. We 2
will continue to refine complexity and we expect that it will get increasingly more 3
precise over time. 4
5
Q22. How does the Company use density and complexity to measure work volume? 6
A22. We multiply circuit density per mile by the complexity factor and divide by 100 for 7
scaling purposes. Without the use of a scaling factor, the units would be very small 8
in terms of work volume. This calculation yields a “comparable unit” per mile 9
estimate to more accurately gauge true work volume. For example, if Circuit A had 10
1 unit per mile and Circuit B had 2 units per mile then, assuming the circuits are 11
the same length, we would expect Circuit B to cost twice as much and take twice 12
as much time to complete. Table 1 below gives examples of how units were 13
calculated on three DTE Electric circuits. 14
15
16
Unit Calculation Example 17
Service
Center Circuit
Density
Per
Mile
Complexity
Factor
Scaling
Factor
Comparable
Units Per
Mile
Caniff GDRIV1115 240 x 3.1 ÷ 100 = 7.44
Western
Wayne ALPHA9198 125 x 2.3 ÷ 100 = 2.88
Newport ACME9499 36 x 2.0 ÷ 100 = 0.72
18
Q23. Do you have additional examples that highlight the difference in density and 19
complexity? 20

S. M. HARTWICK
Line U-20836
No.
SMH-11
A23. Yes. Image 1 below shows an ASPEN circuit with low density and low complexity. 1
As can be clearly seen, there are very few trees by the line (seen in the distance). 2
Additionally, the work is right on the road making it very easy to get equipment to 3
the work site. Image 2 is a high density PLYMO (Plymouth) circuit with high work 4
complexity. The work has many more trees per mile and, while it can’t be seen in 5
the picture, the work is in backyards, which requires labor intensive climbing work 6
and limits the use of equipment to complete the work. 7
8
Image 1 – ASPEN Substation Image 2 – PLYMO Substation 9
10
Q24. How did the Company perform in 2020 in terms of comparable units? 11
A24. As shown in Table 2 DTE Electric completed 101% of its comparable unit work 12
target. 13
14
15
16

S. M. HARTWICK
Line U-20836
No.
SMH-12
Tree Trimming Mileage and Comparable Units 1
2020 Miles Comparable Units
Actual 5,589 25,557
Target 5,500 25,319
% of Target
Achieved 102% 101%
2
Q25. How many miles and comparable units did the Company anticipate trimming 3
in 2021? 4
A25. The Company plans to trim 6,156 miles and 23,524 units in 2021. This is 567 more 5
miles than were trimmed in 2020. 6
Tree Trimming Mileage 7
Annual Plan
Miles
Completed /
Planned
% of System
(miles)
Annual Plan
Units
Completed /
Planned
% of System
(units
2020 Actual 5,589 18% 25,557 21%
2021 Plan 6,156 20% 23,524 19%
8
Q26. In Case No. U-20561 the Company testified it would trim 6,455 miles in 2021 9
with Surge funding. Can you explain why your plan is to now trim 6,156 miles? 10
A26. Yes. The model used in Case No. U-20561 and updated for this instant rate case is 11
built on an average mile (average density, average complexity, and therefore 12
average units). When we develop specific plans for each year the Company 13
prioritizes circuits based on reliability and wire down reduction. Frequent outage 14
circuits generally have a high unit density when compared to the DTE Electric 15

S. M. HARTWICK
Line U-20836
No.
SMH-13
system average. Completing high unit density circuits at the start of the Surge 1
results in fewer miles trimmed but the same amount of work completed. 2
3
Q27. Does the Company expect to achieve the 2021 target? 4
A27. No. Through November 12, 2021, DTE Electric has cut 4,881 miles, currently 5
projecting to complete approximately 5,700 miles. We are projecting several 6
reasons for the Company missing the year-end target this year: 7
• Unprecedented summer storms – The frequency and intensity of storms in 8
2021 was greater than prior years. During the storms tree crews are 9
prioritized to help restore outages and minimal maintenance trimming is 10
completed during this time. While we began the summer ahead of our miles 11
target, we slowly lost the lead over the course of July and August. 12
• Unfavorable fall weather – Fall is usually one of the most productive times 13
for maintenance trimming. The cooler weather and fewer storms keep crews 14
on maintenance work. Further, as leaves fall from the trees and the ground 15
firms for the winter, crews can be more productive. Unfortunately, this fall 16
we had three-times the number of storm days and twice as many inclement 17
weather days as we projected for August to October. 18
• Focusing resources in the communities and circuits most impacted by the 19
storms this summer. These areas are harder, denser miles relative to other 20
areas of the territory; therefore, trimming these area yields fewer miles, but 21
the Company has committed to prioritizing these miles. 22
23
Q28. Can you provide additional detail on how the 2020 and 2021 circuits were 24
prioritized for trimming? 25

S. M. HARTWICK
Line U-20836
No.
SMH-14
A28. Yes. In 2019, the Company finalized a multiyear optimization of circuits for the 1
Surge program that included selections for 2020 and 2021. The optimization 2
considered multiple factors including wire downs, reliability, and trim cost. The 3
model output was then adjusted to balance comparable units, account for location 4
of trimmer resources, and prioritize customer circuits with higher outages or wire 5
downs. In 2021, the prioritization includes ensuring circuits that have previously 6
been trimmed to ETTP in 2016 will be on the plan to keep them on a 5-year trim 7
cycle. 8
In response to the severe storms this summer, the Company has allocated additional 9
funding to the Tree Trimming program for 2021. The miles added to the plan with 10
this funding focus on the communities and circuits most impacted by the storms 11
this summer. All of these circuits added were off-cycle and part of the 2022 plan, 12
therefore, pulling these circuits ahead helps to continue to bring the full system on-13
cycle as soon as possible. While the Company anticipates falling short of our 14
overall miles target, we are prioritizing completing trimming on these circuits. 15
16
Q29. How many miles have been trimmed to the ETTP standard within the City of 17
Detroit prior to 2021 compared to what is expected to be trimmed by the end 18
of 2021? 19
A29. Prior to 2021, the Company trimmed 1,896 miles to the ETTP standard in the City 20
of Detroit. In 2021, DTE Electric is trimming miles in Detroit with a plan to trim 21
529 miles. Results are highlighted in Table 4 below. By the end of 2021, 89% of 22
the City of Detroit line miles will have been trimmed to the ETTP standard 23
compared to 70% of the overall system. 24
25

S. M. HARTWICK
Line U-20836
No.
SMH-15
City of Detroit ETTP Miles 1
Trimmed to ETTP
Standard through 2020
Trimmed to ETTP
Standard by end of 2021
2021 ETTP
Miles 386 529
All ETTP Miles
Trimmed 1,896 2,216
Total Detroit Miles1 2,500 2,500
All ETTP Miles
Percentage of Detroit
Complete
74% 89%
All ETTP Miles
Percentage of System
Complete
60% 70%
(1) Includes circuits that cross into or out of Detroit. Detroit only miles are approximately 2400 but 2 miles are counted by circuit, not municipality. 3 4
Enhanced Tree Trimming Program Results 5
Q30. What methodology was used to calculate the ETTP performance? 6
A30. The Company continues to use the same methodology outlined in Case No. U-7
20561 as well as in the March 1, 2021 Tree Trim Annual Report submitted in the 8
Case No. U-20162 docket. The March 1, 2021 Tree Trim Annual Report has been 9
submitted as Exhibit A – 31, Schedule V1 for reference. The report, and results 10
mirrored below, include outage and event data through the end of the 2020 calendar 11
year. 12
13
Q31. What has been the improvement in outage events on circuits trimmed to the 14
ETTP compared to the non ETTP control group? 15
A31. The actual difference of outage events on ETTP circuits compared to the balance 16
of the system not trimmed ETTP is 76.1% in post-trim year 1, 93.5% in the second 17
year, 87.0% in the third year, and 91.2% in the fourth year. The actual reduction for 18
Years 1-4 post ETTP trim are depicted in Table 5. 19

S. M. HARTWICK
Line U-20836
No.
SMH-16
ETTP Tree-Related Outage Event Difference Compared to 1
Non ETTP Circuits 2
Number of
Dist.
Circuits
ETTP
Trimmed
% Change
in Outage
Event
Reduction
for ETTP
circuits
% Change
in Outage
Event
Reduction
for Non-
ETTP
circuits
Difference
in %
Change in
Event
Reduction
ETTP vs
Non-ETTP
circuits
U-20162
Surge
Model
Reduction
1 Year Post
Trim 1,071 -34.0% 42.1% -76.1% -57.0%
2 Years Post
Trim 642 -25.7% 67.8% -93.5% -57.0%
3 Years Post
Trim 321 -13.8% 73.2% -87.0% -50.0%
4 Years Post
Trim 193 -6.3% 84.9% -91.2% -37.0%
3
Q32. How does this reduction compare to results under the prior trimming 4
practice? 5
A32. As discussed in Case No. U-20162, (3T 202) the past practice of trimming a 6
“clearance circle” around conductors provided only a 13% reduction in tree-related 7
events in the year following trimming as compared to the average number of events 8
in the three-years preceding trimming. 9
10
Q33. Do you see similar differences for customer interruptions and the number of 11
customer minutes of interruption on ETTP vs. non-ETTP circuits? 12
A33. Yes. Using the same methodology discussed above, the Company has determined 13
that actual customer interruptions on ETTP circuits vs. Non-ETTP circuits show a 14

S. M. HARTWICK
Line U-20836
No.
SMH-17
62.9% difference in Year 1, 76.4% difference in Year 2, 71.7% difference in Year 1
3, and 75.0% difference in Year 4. These results are shown in Table 6. Customer 2
minutes of interruption, shown in Table 7, also show significant improvements. 3
Actual minutes of customer interruption on ETTP circuits vs. Non-ETTP circuits 4
show a 57.3% difference in Year 1, 84.9% difference in Year 2, 42.2% difference 5
in Year 3, and 47.9% difference in Year 4. 6
7
Post ETTP Tree-Related Customer Interruption 8
Difference Compared to Non ETTP Circuits 9
Number of
Dist.
Circuits
ETTP
Trimmed
% Change
in
Customers
Interrupted
for ETTP
circuits
% Change
in
Customers
Interrupted
for Non-
ETTP
circuits
Difference
in %
Change in
Customers
Interrupted
ETTP vs.
Non-ETTP
circuits
U-20162
Surge
Model
Reduction
1 Year Post
Trim 1,071 -34.4% 34.8% -62.9% -57.0%
2 Years Post
Trim 642 -19.7% 56.6% -76.4% -57.0%
3 Years Post
Trim 321 -22.1% 49.7% -71.7% -50.0%
4 Years Post
Trim 193 -23.3% 51.7% -75.0% -37.0%
10
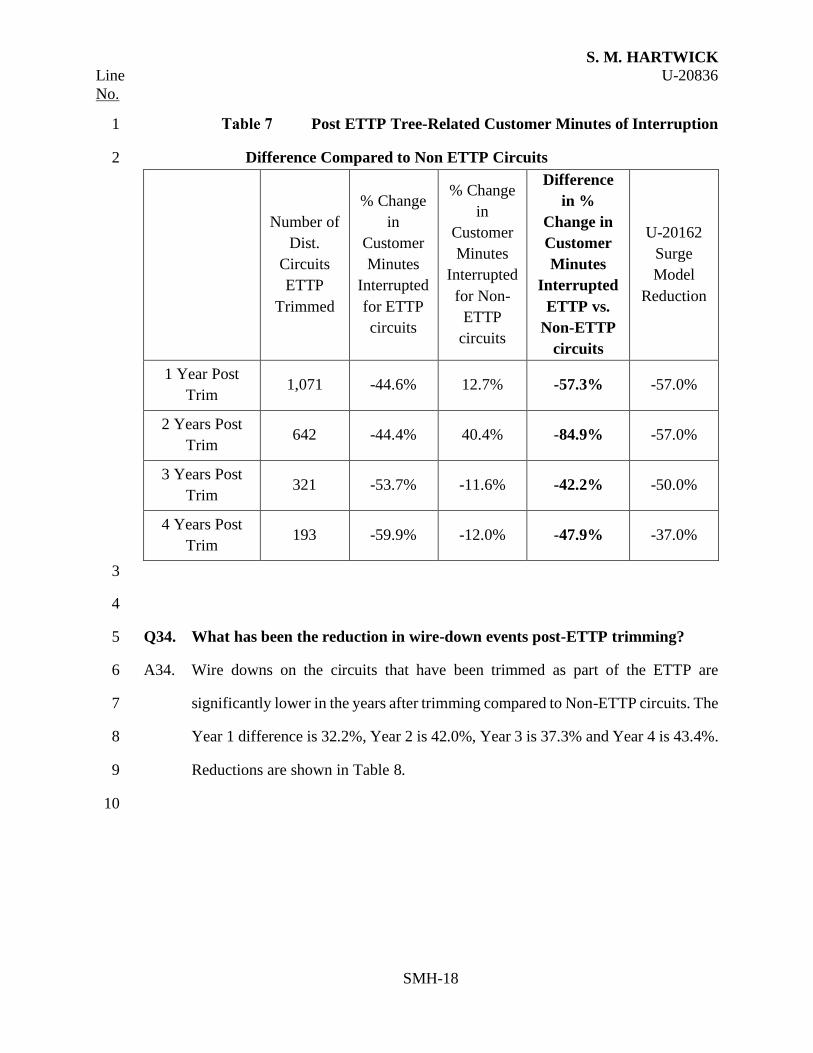
S. M. HARTWICK
Line U-20836
No.
SMH-18
Post ETTP Tree-Related Customer Minutes of Interruption 1
Difference Compared to Non ETTP Circuits 2
Number of
Dist.
Circuits
ETTP
Trimmed
% Change
in
Customer
Minutes
Interrupted
for ETTP
circuits
% Change
in
Customer
Minutes
Interrupted
for Non-
ETTP
circuits
Difference
in %
Change in
Customer
Minutes
Interrupted
ETTP vs.
Non-ETTP
circuits
U-20162
Surge
Model
Reduction
1 Year Post
Trim 1,071 -44.6% 12.7% -57.3% -57.0%
2 Years Post
Trim 642 -44.4% 40.4% -84.9% -57.0%
3 Years Post
Trim 321 -53.7% -11.6% -42.2% -50.0%
4 Years Post
Trim 193 -59.9% -12.0% -47.9% -37.0%
3
4
Q34. What has been the reduction in wire-down events post-ETTP trimming? 5
A34. Wire downs on the circuits that have been trimmed as part of the ETTP are 6
significantly lower in the years after trimming compared to Non-ETTP circuits. The 7
Year 1 difference is 32.2%, Year 2 is 42.0%, Year 3 is 37.3% and Year 4 is 43.4%. 8
Reductions are shown in Table 8. 9
10

S. M. HARTWICK
Line U-20836
No.
SMH-19
Post-ETTP Wire-Down Difference Compared to Non-1
ETTP Circuits 2
Number of
Dist. Circuits
ETTP
Trimmed
% Change
Wire-Down
Events for
ETTP circuits
% Change for
Wire-Down
Events for
Non-ETTP
circuits
Difference in
% Change in
Wire-Down
Events ETTP
vs. Non-
ETTP
circuits
1 Year After
Trimming 1,071 -17.6% 14.6% -32.2%
2 Years
After
Trimming
642 -13.1% 28.8% -42.0%
3 Years
After
Trimming4
321 -13.2% 24.1% -37.3%
4 Years
After
Trimming2
193 -23.3% 20.1% -43.4%
3
Q35. Of the four metrics shown in Tables 5-8, which one best illustrates the impact 4
of the Tree Trimming Program? 5
A35. Tree-related outage events and wire down reduction are most closely tied to the 6
effectiveness of the Tree Trimming Program. The Tree Trimming Program has the 7
capability to reduce events and wire downs by trimming and removing trees that 8
threaten the distribution system. Tree-related customer outages are also highly 9
correlated to tree-trim effectiveness but incorporates some degree of randomness 10
based on where the event occurs on the circuit. If the event is on the backbone of 11
the circuit, then more customers are likely to be impacted. Because the majority of 12
4 Sample size is relatively small for 3 & 4 years after trimming

S. M. HARTWICK
Line U-20836
No.
SMH-20
tree related minutes are the result of storms, minutes of customer interruption can 1
be more variable because they are impacted by circumstances outside of the control 2
of the tree-trim program including crew availability, travel time to outage, outage 3
prioritization, and accessibility of outage. 4
5
Q36. How does the March 2017 wind storm affect the results shown in Tables 5-8? 6
A36. The effects of the March 2017 windstorm are included in the results shown in 7
Tables 5-8 in Year 1 and Year 2. As discussed in Case No. U-20162, ETTP circuits 8
outperformed Non-ETTP circuits during that windstorm. The 2017 windstorm 9
caused a high number of healthy trees outside of the right-of-way (ROW) to blow 10
over and into our lines. These off-ROW healthy trees are not addressed as part of 11
the ETTP specification and, since the outage cause is still coded as tree, they 12
depress year one results across all metrics shown in 5-8 (wire downs are not 13
assigned a cause code). 14
15
Tree Trimming Program Improvements 16
Q37. What improvements has the Company made to its tree-trim program in the 17
last twenty-four months? 18
A37. The Company has made several significant improvements to its tree-trim program; 19
some key improvements include: 20
21
(1) Long Term Contracts – The Company is in the second year of a 3-year contract 22
with its tree trim vendors. The long-term contract has provided needed financial 23
stability for the vendors and has allowed them to invest in growing the local 24
work force to become less reliant on outsource crews and purchasing additional 25
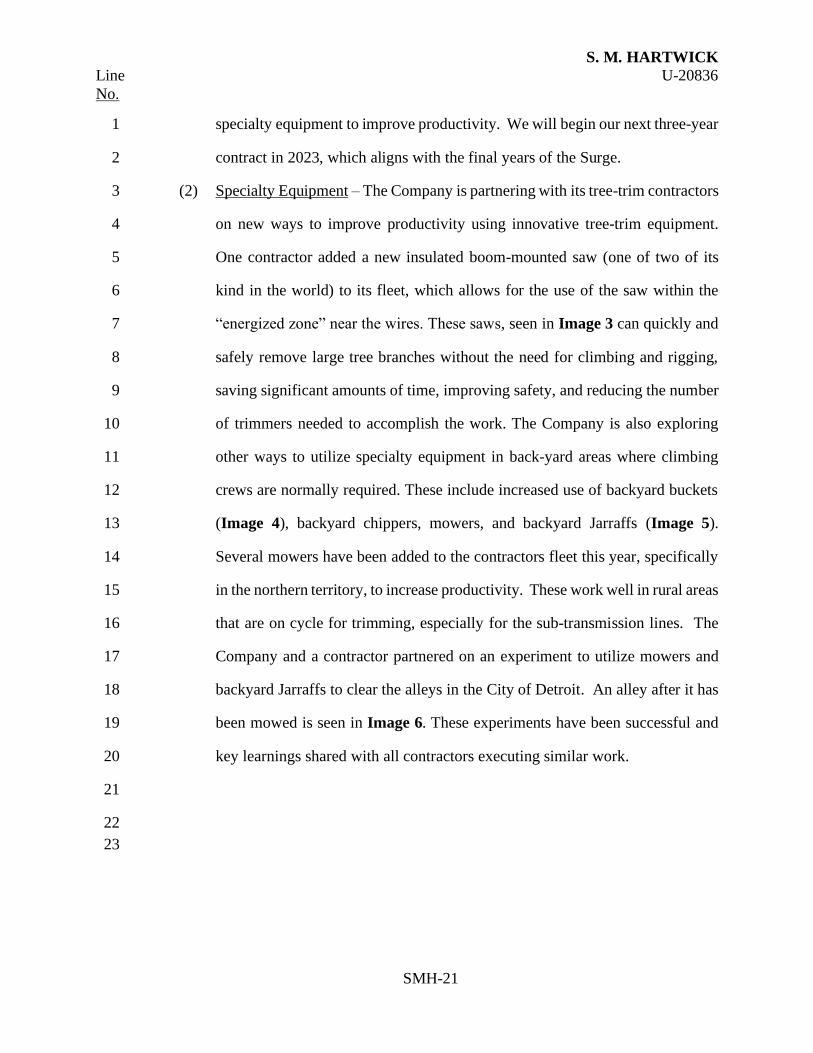
S. M. HARTWICK
Line U-20836
No.
SMH-21
specialty equipment to improve productivity. We will begin our next three-year 1
contract in 2023, which aligns with the final years of the Surge. 2
(2) Specialty Equipment – The Company is partnering with its tree-trim contractors 3
on new ways to improve productivity using innovative tree-trim equipment. 4
One contractor added a new insulated boom-mounted saw (one of two of its 5
kind in the world) to its fleet, which allows for the use of the saw within the 6
“energized zone” near the wires. These saws, seen in Image 3 can quickly and 7
safely remove large tree branches without the need for climbing and rigging, 8
saving significant amounts of time, improving safety, and reducing the number 9
of trimmers needed to accomplish the work. The Company is also exploring 10
other ways to utilize specialty equipment in back-yard areas where climbing 11
crews are normally required. These include increased use of backyard buckets 12
(Image 4), backyard chippers, mowers, and backyard Jarraffs (Image 5). 13
Several mowers have been added to the contractors fleet this year, specifically 14
in the northern territory, to increase productivity. These work well in rural areas 15
that are on cycle for trimming, especially for the sub-transmission lines. The 16
Company and a contractor partnered on an experiment to utilize mowers and 17
backyard Jarraffs to clear the alleys in the City of Detroit. An alley after it has 18
been mowed is seen in Image 6. These experiments have been successful and 19
key learnings shared with all contractors executing similar work. 20
21
22
23

S. M. HARTWICK
Line U-20836
No.
SMH-22
Image 3 Insulated Boom-Mounted Saw 1
2
Image 4 Backyard Bucket 3
4
5
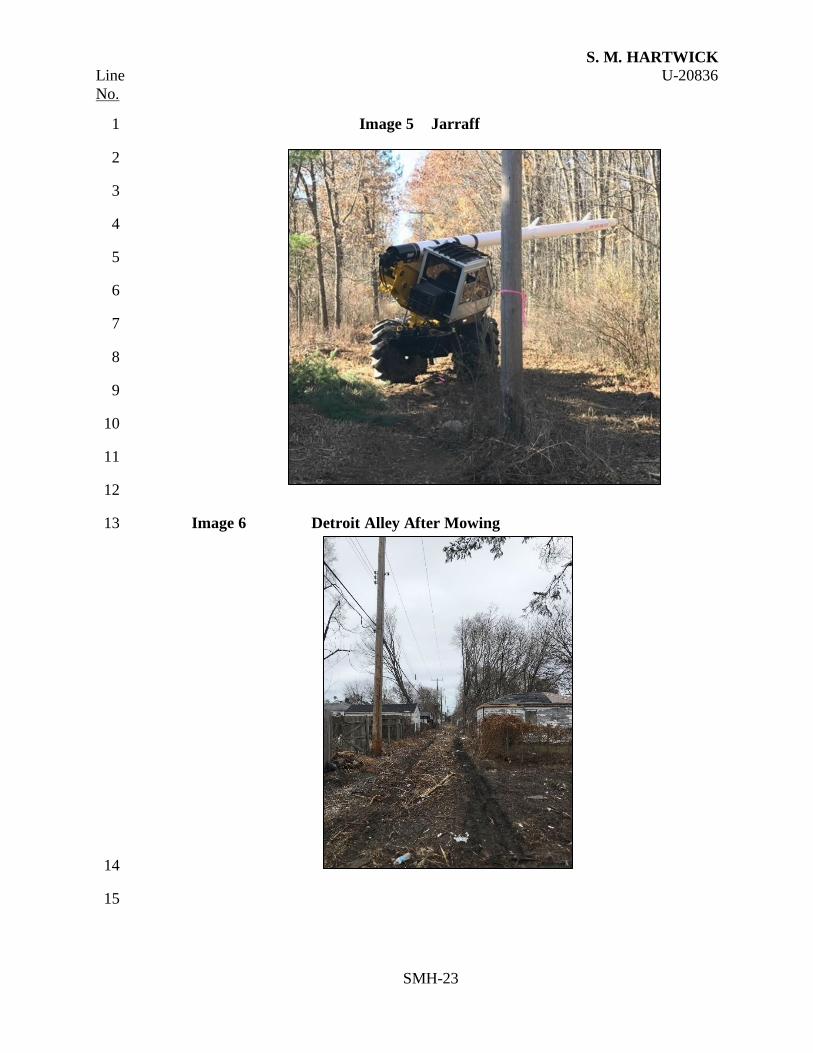
S. M. HARTWICK
Line U-20836
No.
SMH-23
Image 5 Jarraff 1
2
3
4
5
6
7
8
9
10
11
12
Image 6 Detroit Alley After Mowing 13
14
15

S. M. HARTWICK
Line U-20836
No.
SMH-24
(2) Improved Price Accuracy – The Company was successful in utilizing its arborist 1
employees to set up a specialized estimating team to price out circuits before 2
contractor bids are evaluated. The pricing estimates from this team allow us to 3
more accurately determine fair pricing for each circuit/substation during contract 4
negotiations resulting in significant cost savings. 5
(3) Improved Negotiation Timeline – The Company has adjusted its negotiation 6
timeline and streamlined the process to award contracts each year. The new 7
timeline allows for negotiations to be completed in the fall, which allows for 8
vendors to begin preparing for the next year, including right-sizing their 9
workforce, identifying equipment needs and creating an efficient schedule for 10
the year. Additionally, the Company provides a small selection of circuits that 11
the vendors can begin planning in the fall so that the vendors have planned work 12
they can start trimming first thing in January. 13
14
Q38. Are there additional improvements the Company is currently working on 15
related to its tree-trim program? 16
A38. Yes. The Company is working on several initiatives: 17
1) Scheduling Improvement Project – The Company has dedicated a team to 18
improve and advance scheduling efforts within Tree Trim. Tree Trim supports 19
the following workstreams: maintenance trimming, trouble trimming, capital 20
trimming and customer requests. Effectively prioritizing and scheduling these 21
workstreams has been disaggregated in years past, often done at the service 22
center-level. The scheduling team is working to develop an integrated 23
scheduling tool that monitors all these workstreams in a centralized format. This 24
will allow the Company to more efficiently schedule tree trimming required for 25

S. M. HARTWICK
Line U-20836
No.
SMH-25
customers and capital construction projects, while staying on-schedule for the 1
annual maintenance trimming. The scheduling team has also developed 2
dashboards to track maintenance miles trimmed on a weekly basis and are 3
available to other DTE Electric stakeholders, such as our customer support 4
teams, who use the dashboards to understand when tree trimming is taking place 5
in different communities. 6
2) Enhanced monitoring of reliability and circuit performance - As a way for the 7
Company to continually improve its Tree Trim program, a considerable 8
amount of time and effort has been put into planning and monitoring the 9
overall success of the program. Most recently these efforts have allowed the 10
Company to develop several new tools and processes to improve the speed of 11
analyses and granularity of data available to assess the reliability performance 12
of ETTP. For example, a new report was developed in PowerBI5 which 13
compares the reliability performance during any specific period, such as a 14
recent storm, at different levels of granularity, such as the circuit, service 15
center, or city. This tool was especially useful during this summer with the 16
high volume of storms. 17
18
3) Light Detection and Ranging (LiDAR) – The Company is continuing to explore 19
the opportunities and benefits of utilizing remote sensing technology such as 20
LiDAR as part of the tree trimming program. LiDAR technology provides 21
advanced data on the Company’s tree density, growth patterns and emerging 22
hot spots. This data could provide significant value to the Tree Trimming 23
program in the form of assisting in scoping and estimating costs for 24
maintenance work, and identity areas where tree encroachment may cause hot 25
spots to emerge. 26
5 PowerBI is a software platform to assist in data intelligence and visualizations

S. M. HARTWICK
Line U-20836
No.
SMH-26
1
Continued Need for the Tree Trimming Surge Program 2
Q39. What is the biggest root cause of outages? 3
A39. As discussed in the Company’s Distribution Grid Plan (U-20147), tree interference 4
remains the leading driver of customer outages. Tree-caused outages account for 5
two-thirds of the time that customers spend without power; thus, the successful 6
execution of the Tree Trimming Program will allow the Company to significantly 7
improve the overall reliability of electric service. 8
9
Q40. What is the best way to reduce tree-related outages? 10
A40. A robust Tree Trimming Program is needed to address system reliability including 11
reduction of outage events, customer interruptions, customer minutes of 12
interruption, wire downs, and other non-outage trouble events. The program must 13
be funded to maintain a tree-trim cycle that permits the subsequent trimming of a 14
circuit before the trees on that circuit grow back into the Company’s wires and 15
become hazards. 16
17
Q41. What is the Company’s vision for its Tree Trimming Program? 18
A41. The Company remains firmly committed to achieving a five-year cycle.6 This will 19
be accomplished by continuing to improve the efficiency with which trimming 20
work is executed and by working through the regulatory process to obtain the 21
funding to support the program. As stated by Company Witness Pfeuffer in her 22
testimony regarding the Company’s Global Prioritization Model, tree trimming is 23
the highest priority investment. No other program in the Company’s portfolio of 24
6 The five-year cycle applies to distribution circuits. Sub-transmission circuits require a shorter three-year cycle, which will be discussed below.

S. M. HARTWICK
Line U-20836
No.
SMH-27
distribution projects will have a greater impact on mitigating risks, improving 1
system and customer reliability, and managing the costs of operating the 2
Company’s electric distribution system. 3
4
Q42. How many miles need to be trimmed annually to achieve a five-year cycle? 5
A42. Assuming an average mile, DTE Electric currently needs to trim approximately 6
6,538 miles per year to achieve the optimal five-year cycle for distribution circuits. 7
As discussed above, miles vary significantly from year to year, so the Company can 8
be above or below the 6,538 mile mark and still be on target for a five-year cycle. 9
10
Tree-Trimming Cycle Length 11
Overhead
Miles
Cycle Length
(years)
Cycle Mileage
(miles / year)
Distribution Circuits 28,459 5 5,692
Subtransmission Circuits 2,539 3 846
Total 30,998 4.75 6,538
12
Q43. Why is the Company moving to a five-year cycle? 13
A43. The Company typically performs trimming within 15 feet on either side of the 14
distribution pole centerline, or approximately 10 feet from the conductors. The 15
Company’s target of a five-year cycle is based on the following facts: 16
(1) Trees near the Company’s distribution equipment grow approximately 10 feet 17
on average in five years. 18
(2) The five-year cycle provides a reasonable and acceptable level of tree-to-19
conductor contact comparable to the industry standard of 10% - 15%. Tree-to-20
conductor contact represents the likelihood of any portion of the tree touching the 21

S. M. HARTWICK
Line U-20836
No.
SMH-28
conductor. A tree-to-conductor contact level of 10% - 15% denotes the estimated 1
average percentage of trees in contact with the overhead electrical facilities across 2
the entire distribution system when the recommended cycle length and clearance 3
standards are reached. 4
5
Q44. How does the Company’s targeted cycle length compare to the industry 6
benchmarks? 7
A44. The Company’s targeted five-year cycle on distribution circuits is comparable to 8
the actual industry average of 4.9 years, per the report published by CN Utility 9
Consulting, Inc. (CNUC) - Distribution Utility Vegetation Management 10
Benchmark Survey Results 2016 - as shown in Figure 1. Furthermore, all but six 11
of the participating companies target a cycle of five years or less. 12
13

S. M. HARTWICK
Line U-20836
No.
SMH-29
Figure 1 Distribution Utility Vegetation Management Benchmark 1
Survey Results – Cycle Length: Target vs. Actual 2
3
Tree Trimming Surge Program Execution 4
Q45. When did the Surge Program begin? 5
A45. The company began the Surge Program in 2019, as a result of the order in Case No. 6
U-20162. 7
8
Q46. Have there been changes to the Surge Program? 9
A46. Yes. On August 31, 2021, the Company proposed a minimum of $70M in funding 10
for the Tree Trim program in ex parte Case no. U-21128. Per the application, the 11
Company will increase its investment in the Tree Trim Surge during the remainder 12
of 2021 through 2023, beyond the authorized regulatory asset amounts, and will 13
not seek recovery of the additional expenditures. This has the effect of advancing 14

S. M. HARTWICK
Line U-20836
No.
SMH-30
the Company’s tree trimming efforts while avoiding future customer expense for 1
those investments, thus providing an affordability benefit to customers. 2
3
Q47. Does the additional $70M change when the Company is able to complete the 4
Surge plan and achieve a five-year cycle? 5
A47. The Company is targeting to achieve a five-year cycle, and complete the Surge 6
program, by the end of 2024. This is one year earlier than previously proposed in 7
Case Nos. U-20162 and U-20561. 8
9
Q48. What is meant by “backlog” and “on-cycle”? 10
A48. Backlog refers to the circuit miles that have yet to be trimmed as part of the ETTP. 11
On-cycle means that the circuit miles have been trimmed within the last five years 12
to ETTP specification. 13
14
Q49. Will the Company prioritize circuits already trimmed as part of the ETTP 15
before the circuits on the backlog? 16
A49. Yes. Circuits already trimmed as part of the ETTP will be maintained on a five-17
year cycle, while also addressing the backlog of circuits that have yet to be trimmed 18
as part of the Company’s ETTP. 19
20
Q50. How many miles will be addressed annually on the backlog compared to those 21
on-cycle during the Surge? 22
A50. Figure 2 shows the miles the Company intends to trim from the backlog of circuit 23
miles that have yet to be trimmed as part of the ETTP and the miles that are on-24

S. M. HARTWICK
Line U-20836
No.
SMH-31
cycle and have been trimmed as part of the ETTP. The tree trimming model 1
submitted in this instant case populates the miles shown in Figure 2. 2
3
Figure 2 Miles Trimmed During Surge and Post-Surge 4
Q51. Are the specifications applied consistently throughout the Surge? 5
A51. Yes. Tree-trimming specifications are applied consistently throughout the 6
Company’s service territory. The Company trims and removes trees to maintain 7
circuit clearance for one five-year cycle worth of growth, which, on average, 8
necessitates ten feet of clearance to the outermost conductor. The required 9
clearance is species-specific. All circuits are audited post trimming to ensure the 10
specifications have been meet. Any deviation from specification is corrected by our 11
contractors at no additional cost to the company. 12
13
Q52. Why is a three-year cycle needed on subtransmission circuits? 14
A52. The three-year cycle is necessary because of the high customer impact of 15
subtransmission lines. A trouble event on a subtransmission circuit can potentially 16

S. M. HARTWICK
Line U-20836
No.
SMH-32
cause an entire substation to lose power, which would affect, on average, over 3,600 1
customers, while a trouble event on a distribution circuit would affect, on average, 2
approximately 700 customers. Therefore, outage events on subtransmission lines 3
have a severity effect five times greater than a similar outage event on a distribution 4
circuit. 5
6
Benefits of the Tree Trimming Surge Program 7
Q53. How will customers benefit from reducing the tree-trimming cycle length to 8
the industry benchmark of a five-year cycle? 9
A53. Reducing the tree-trimming cycle length to five years will provide tree-related 10
benefits and savings in multiple ways: 11
(1) Fewer wire-down events, resulting in improved safety, 12
(2) Fewer outage and non-outage events, leading to improved reliability and a 13
positive impact on reactive O&M and capital costs; this will also allow for the 14
re-allocation of resources to other necessary work across the Company’s 15
distribution system, 16
(3) Lower customer complaints. The Company recognizes and acknowledges that 17
tree-related outage and non-outage events are a major issue for our customers 18
that can be rectified through the tree-trim program and requested funding, 19
(4) Lower future trimming costs as the number of trees growing within the right-20
of-way are trimmed or removed more frequently, resulting in the need to 21
remove less wood from the trees near the Company’s lines, and 22
(5) Lower customer costs as tree-related outages are reduced (improved reliability 23
will reduce downtime for customers’ manufacturing processes, allow 24

S. M. HARTWICK
Line U-20836
No.
SMH-33
commercial businesses to remain open, and reduce the inconveniences that 1
residential customers experience). 2
3
Q54. How much value does the program provide to customers? 4
A54. The net present value (NPV) analysis, which is supported by Witness Vangilder, is 5
shown in Exhibit A-22, Schedule L1 pages 3 and 6. The analysis indicates that the 6
NPV associated with continued execution of the Surge program approved by the 7
Commission in Case No. U-20162 is $82.0 million favorable to customers when 8
compared to just the baseline O&M tree trimming spend without the Surge funding. 9
In this instant case, the Company is calculating the NPV using 2022 to 2042 10
timeframe. 11
12
Q55. Was the economic value to customers of the improved reliability from the tree-13
trimming surge taken into consideration when determining the NPV? 14
A55. No. The value of the program was based upon the forecasted reduction in revenue 15
requirement that customers would receive through 2042 due to the remaining 16
investment in the Surge program. The analysis did not take into consideration the 17
additional economic benefits that derive from improved reliability as could be 18
calculated utilizing the Interruption Cost Estimation (ICE) Calculator developed by 19
Nexant and the Lawrence Berkeley National Lab (LBNL) as described in “Exhibit 20
A-23, Schedule M8, Lawrence Berkeley National Laboratory Study and Results” 21
sponsored by Witness Pfeuffer. 22
23
Q56. How much does the Company expect to reduce costs per line mile trimmed 24
upon achieving a five-year trimming cycle? 25

S. M. HARTWICK
Line U-20836
No.
SMH-34
A56. Based on the work study completed by ECI, the Company expects its cost per line 1
mile to decrease, on average, by 40% compared to the initial trimming conducted 2
as part of the ETTP. 3
4
Q57. How many tree-related trouble events does the Company expect to reduce 5
upon achieving a five-year cycle through the investment surge? 6
A57. Based upon details from the Company’s outage and dispatch management systems, 7
the Company typically attributes approximately 44,700 outage and non-outage 8
events to trees, or 23% of its roughly 192,300 average annual outage and non-9
outage events the Company experiences. Upon completion of the Surge, the 10
Company’s modeling estimates that the tree-related events will be reduced by 11
approximately 43%. 12
13
Average Annual Outage and Non-Outage Events 14
Outage and
Non-Outage
Events
Pre-Surge
2014-2018 Average
5 Year Cycle
Achieved % Reduction
Tree-Related 44,716 25,379 43.2%
15
Q58. What reliability improvements will be provided through the Surge program? 16
A58. The Company expects a 40% reduction in tree-related All-Weather SAIDI. This 17
reduction is driven by fewer tree-related events. 18
19
Q59. How did the Company determine the percentage reduction in events upon 20
completion of the Surge? 21
A59. The Company based the 40% reduction upon: 22

S. M. HARTWICK
Line U-20836
No.
SMH-35
(1) Accounting for weather variability, the circuits trimmed as part of ETTP show 1
a 72% improvement reduction in events in the year after trimming as compared 2
to the three years prior to trimming the circuit; and 3
(2) Consultation with ECI indicated a reduction in the cycle length from an 4
effective eight and a half-year cycle to a five-year cycle would reduce events 5
by 35%; and 6
(3) Benchmarking of peer utilities suggests an improvement in event reductions in 7
excess of 50%. 8
9
Q60. What cost savings will be provided through the Surge program? 10
A60. At the completion of the Surge, tree-related O&M and capital costs for Reactive 11
Maintenance and storm will be lower. With fewer tree-related events, the need for 12
tree crews and Regional Customer operations’ overhead crews will be reduced. 13
There will be less of a need to repair and replace assets on the system that have 14
failed because of tree interference. Table 11 shows current O&M and capital cost 15
compared to the projected costs upon completion of the Surge, excluding inflation. 16
17

S. M. HARTWICK
Line U-20836
No.
SMH-36
1
Tree Trimming Surge Cost Savings 2
Estimated Tree-related Annual Cost Savings
($ millions, excluding inflation)
Cost Category Current
Cost
5 Year Cycle
Achieved
Tre
e-R
elat
ed
O&
M
Tree Trim Reactive $16.7 $9.4
Tree Trim Storm $15.9 $7.3
Other DO – Service Operations
Storm and Trouble $12.0 $6.0
Tre
e-R
elat
ed
Cap
ital
Tree Trim Reactive $3.0 $2.7
Tree Trim Storm $18.2 $13.7
Other DO - Service Operations
Storm and Trouble $73.8 $20.7
3
Q61. What will reliability performance be if the Surge program is defunded? 4
A61. Without the increase in funding, the backlog of circuits in need of trimming as part 5
of the ETTP will not be addressed. In 2026, there would be an approximately 6
7,000-8,000 mile backlog of distribution circuit miles that have yet to be trimmed 7
as part of the ETTP. 8
9
The base funding level, absent the Surge, would limit the Company’s ability to 10
address miles that have not been trimmed 8+ years ago in a timely manner. Delaying 11
trimming of these miles will lead to an increase in outage and non-outage events, 12
including wire downs, erode customer satisfaction would erode increasing 13
complaints to the MPSC. Ultimately, tree-related reactive and storm costs would 14
also increase, taking away from the funds that were to be allocated to planned 15
investment and maintenance activities. 16

S. M. HARTWICK
Line U-20836
No.
SMH-37
1
Q62. Does it cost more to trim a circuit if it is not trimmed on-cycle? 2
A62. Yes. As referenced by in the recent cases U-20162 and U-20561, deferring 3
maintenance results in cost escalation as described in the 1997 study funded by 4
International Society of Arboriculture (“ISA”) and conducted by ECI, LLC – The 5
Economic Impacts of Deferring Electric Utility Tree Maintenance. Table 12 shows 6
the relative cost, excluding inflation, of deferring maintenance beyond the optimum 7
time – five years after the previous trim for the Company. By deferring 8
maintenance, the Company will need to allocate more funds to trimming the 9
deferred work in a subsequent year. 10
11
Projected Impact on Cost of Deferring Maintenance 12
13
Timing of
Trimming
Years since
last trim Relative Cost
Optimum 5 $1
1-year past optimum 6 $1.16 to $1.23
2-years past optimum 7 $1.30 to $1.43
3-years past optimum 8 $1.40 to $1.59
4-years past optimum 9 $1.47 to $1.69
14
Q63. Will it take more resources to trim a circuit if it is not trimmed on-cycle? 15
A63. Yes. Longer tree trimming intervals result in higher tree trimming cost over time, 16
as also described in the 1997 ISA study. As illustrated in Figure 3, as the time since 17
last trim continues to grow, the work becomes more complex as trees begin to 18
interfere with the conductors. 19

S. M. HARTWICK
Line U-20836
No.
SMH-38
Figure 3 Illustrative Tree Growth Impact on Complexity 1
(Years since Last Trim) 2
3
Reactive Trimming 4
Q64. Has the Company increased its reactive tree trim activities above what was 5
originally planned for in the Surge plan? 6
A64. Yes. Reactive trouble activities in support of outages and wire downs are included 7
in the Surge funding. This includes reactive spot trimming which has increased 8
significantly to address circuits with high volumes of customer reliability issues. 9
10
Q65. How does spot trimming differ from ETTP trimming? 11

S. M. HARTWICK
Line U-20836
No.
SMH-39
A65. Spot trimming is conducted exclusively on poor performing circuits, not yet 1
trimmed to the ETTP specification, that have a high number of sustained and/or 2
momentary outages. Spot trimming involves targeted trimming at select trouble 3
locations to address significant ongoing emergent issues. ETTP trimming addresses 4
the entire circuit and the full trim specification, as discussed above. 5
6
Q66. Why can’t the spot trimming work wait until the circuit is scheduled for ETTP 7
trimming? 8
A66. As laid out in the Surge plan, transitioning circuits to ETTP is expensive and it 9
takes years to bring all circuits back to a 5-year cycle. Some circuits need spot 10
trimming before ETTP trimming can be completed in order to improve reliability 11
in the meantime. 12
13
Q67. What advantages does spot trimming have over ETTP maintenance 14
trimming? 15
A67. ETTP circuits are fixed bid and awarded 6-18 months before work begins. Spot 16
trimming is more agile and, when frequent outage circuits present themselves, 17
allows the Company to address some customer concerns within weeks from the 18
time they first arose. 19
20
Q68. How much spot trimming work was performed in 2019 and 2020? 21
A68. Spot trimming was conducted at approximately 8,600 pole locations in 2019, and 22
nearly 12,300 poles in 2020. To put these numbers in context, the electrical system 23
has approximately one million DTE owned pole locations. 24
25

S. M. HARTWICK
Line U-20836
No.
SMH-40
Q69. Were funds for spot tree trimming included in the Surge modeling in Case No. 1
U-20162 or U-20561? 2
A69. Yes. They were included as part of “Reactive Maintenance Costs” in Exhibit A-22, 3
Schedule L1, Line 4 on pages 1 and 2. However, the projected cost has increased 4
as the number of pole locations in need of spot trimming has increased 5
6
Q70. Why has the amount of spend for spot trimming increased? 7
A70. The original Surge plan focused almost all resources on trimming as many 8
maintenance miles as possible and didn’t accurately account for the increased need 9
for spot trimming to address customer complaints and reliability issues that have 10
resulted from overgrown circuits that have not yet been trimmed to the ETTP 11
specification. This summer highlighted the need for additional spot trimming due 12
to the severe weather and high volume of storms. While the Company is making 13
significant progress to reduce the number of backlog miles on our electrical system, 14
it will still be several years before all circuits are on-cycle. Recognizing the need 15
for additional spot trimming, a portion of the $70M incremental tree trim surge will 16
be allocated to that program. 17
18
Q71. How does the Company choose which circuits receive spot trimming? 19
A71. Circuits that are not in the tree trim maintenance plan, or scheduled for other capital 20
improvement plans, in the current year (and future 12 months) and have had four 21
or more sustained outages and/or nine or more momentary outages in a rolling 22
twelve-month period are reviewed to determine if spot tree trimming is needed. 23
Circuits are then selected and prioritized based on an index that accounts for the 24
concentration on the circuit of the number of customers affected, tree trim schedule, 25

S. M. HARTWICK
Line U-20836
No.
SMH-41
SAIFI (System Average Interruption Frequency Index), and MAIFI (Momentary 1
Average Interruption Frequency Index). This selection process has enabled DTE to 2
address a number of the Company’s high risk, in terms of service quality, customers 3
who had poor reliability. 4
5
Q72. Do you expect the need for spot tree trimming to be reduced as the backlog of 6
non-ETTP circuits are reduced? 7
A72. Yes. Spot tree trimming is an effective “bridge” for circuits that are outside of the 8
tree trim cycle. We expect the spot tree trim program to be reduced to a minimum 9
once the planned maintenance program has brought the DTE system on a 5-year 10
cycle. Table 13 shows the spot trimming budget declining in the final years of the 11
Surge. 12
13
Non-Inflation Adjusted Spot Trim Budget 2019-2024 14
15
Year 2019 A 2020A 2021 2022 2023 2024
Budget $5.2M $8.3M $8.0M $5.0 $5.0M $0.5M
16
Q73. Have you updated Exhibit A-22, Schedule L1, pages 1 and 2 to include 2020 17
funding for spot trimming expense and the associated spot trimming savings 18
as the backlog is reduced? 19
A73. Yes. All expenses and savings have been added into the in line 4, reactive trouble, 20
for the Surge program and line 16 for the Status Quo program. 21
22
Q74. Can spot trimming replace ETTP? 23

S. M. HARTWICK
Line U-20836
No.
SMH-42
A74. No. Spot trimming is not capable of delivering the clearance needed for an entire 1
circuit in order to achieve a 5-year cycle. 2
3
Funding Required 4
Q75. How much funding was included in Case No. U-20561 to trim trees in 2021? 5
A75. In Case No. U-20561, the tree trimming program was funded to $97.9 million for 6
base tree trim spending. The projected test year in that rate case was May 1, 2020 7
through April 30, 2021. Since the Company has not filed a subsequent rate case, 8
our base O&M is $97.9 million. Additional funding outside of the base level was 9
also approved as a tree trim regulatory asset – $70.5 million for 2021. 10
11
Q76. Is the Company proposing a change to the base O&M for the test period? 12
A76. Yes. In the last filed rate case (U-20561), Tree Trim’s projected base O&M 13
assumed the Company would file a rate case annually and receive inflation. Table 14
14 shows the base O&M for 2021-2025 in the previous rate case. 15
16
Base Tree Trim O&M in U-20561 17
Year 2021 2022 2023 2024 2025
O&M ($M) 99.1 101.5 103.9 106.4 109.0
18
However, the Company did not file for a rate case in 2020, therefore the current 19
base O&M is $97.9 million. The Company is seeking to “catch up” to the 2023 base 20
O&M, which is $103.9 million. Postponing filing the rate case in 2020 and 2021 21
has resulted in the Surge program being underfunded by $3.8 million in O&M as 22
laid out in Table 15. 23

S. M. HARTWICK
Line U-20836
No.
SMH-43
Comparison of Actual O&M vs. Projected O&M in U-1
20561 2
2021 2022 Total
Projected (U-20561) ($M) 99.1 101.5
Actual ($M) 97.9 98.9
Net Change -1.2 -2.6 -3.8
3
Q77. Should the Surge funding be extended through 2023 and 2024? 4
A77. Yes. Securing funding for the final years of the Surge provides the Company the 5
financial security needed to retain contractors and grow the local work force. The 6
Company is requesting $67.0 million in 2023 and $52.7 million for 2024, as 7
outlined in the previous rate cases. 8
9
Q78. Does the Company foresee needing the Surge funding in 2025? 10
A78. At this time, the Company is not seeking approval for the 2025 Surge Funding; 11
however, there is the possibility we will request it in a future rate case. While we 12
are accelerating the Surge Program with the goal to complete it by the end of 2024, 13
the Company recognizes there are potential risks (e.g. labor market challenges, 14
unknown cost of remaining reclaim miles, etc.) to completing the Surge a year 15
earlier than planned; however, there are too many unknowns to project the need or 16
magnitude of Surge funding required in 2025. 17
18
Q79. Can you please describe Exhibit A-13, Schedule C5.6.1? 19
A79. This page shows the calculation supporting Tree Trimming expenses for the 20
projected test period. The annual amounts approved by the Commission in Case 21

S. M. HARTWICK
Line U-20836
No.
SMH-44
No. U-20561 are broken down into two categories: tree trim O&M – Base Level 1
(Line 5) and Tree Trim Regulatory Asset – Surge Funding (Line 1). Lines 7 through 2
9 calculate the projected period O&M amount for the base plan. Line 7 shows the 3
approved O&M Base Level amount of $103.9 million for 2023. Lines 8 and 9 show 4
the historical O&M and adjustment needed to align with the approved base O&M 5
from Case No. U-20561. The $2.748 million adjustment in line 9, column (f) is 6
simply the difference between the historical amount and the approved amount. This 7
adjustment is made to ensure the projected period reflects the amount approved in 8
U-20561 instead of 2020 actual plus inflation. 9
10
Tree Trimming Surge Funding Mechanism 11
Q80. Can you please describe Exhibit A-22, Schedule L1, pages 1 and 2? 12
A80. These pages show the details of the calculation supporting the Projected Value of 13
the Tree Trimming Program through 2042. The page is broken up into four 14
sections: Surge Program O&M Costs, Status Quo Program O&M Costs, Surge 15
Program Capital Costs, and Status Quo Program Capital Costs. The first section 16
depicts the tree-related O&M costs for the Surge Program. Line (2) depicts the cost 17
to trim the miles needed to achieve a five-year cycle. Line (3) shows the cost of 18
the continuation of the Herbicide Program and is equal to Line (15) as the Herbicide 19
Program. Lines (4), (8), and (9) depict the Tree Trim Reactive Maintenance, Tree 20
Trim Storm, and Other DO Tree-Related O&M Costs, respectively. These costs 21
are dependent upon the projected event reduction resulting from the Surge in 22
investment in the Tree Trim Program. Line (6) conveys the Credit to the Regulatory 23
Asset. This is calculated by taking the Total Tree Trimming O&M Spend in Line 24
(5) and subtracting Line (17), which is the inflation adjusted tree trimming spend 25
for the Status Quo Program. Line (7) conveys the Credit to the Tree Trim 26

S. M. HARTWICK
Line U-20836
No.
SMH-45
Incremental Surge. This is calculated by taking the Total Tree Trimming O&M 1
Spend in Line (5) and subtracting Line (17), which is the inflation adjusted tree 2
trimming spend for the Status Quo Program and Line (7) which is the Credit to the 3
Regulatory Asset. 4
5
The next section demonstrates the tree-related O&M costs for the Status Quo 6
Program, which simply grows at the rate of inflation for Line (17). Lines (16), (19), 7
and (20) are impacted by the Company’s ability to maintain limited overhead circuit 8
miles on a five-year cycle. Because an inflation adjusted program does not provide 9
adequate funding to achieve a five-year cycle on the entire system, the reactive, 10
storm, and trouble costs escalate. Line (22) calculates the respective O&M savings 11
of the Surge program as compared to the Status Quo. The third section conveys the 12
Surge program capital costs. The costs shown in Lines (24), (25), and (26) are 13
driven by events and the respective reduction in events expected upon investing in 14
the tree trimming Surge. The fourth section represents the Status Quo Program 15
capital costs. Line (29) conveys the amount of tree trimming charges when 16
trimming in support of replacing an asset on a Blue Sky day, while Line (30) is for 17
Storm spend only. Line (31) depicts the capital spent by the Service Operations 18
organization as a result of tree-related events. Ultimately, the capital savings from 19
investing in the tree trimming Surge program is shown on Line (33). 20
21
Q81. What is the total forecasted cost of tree trimming from 2021 through 2024? 22
A81. Tree trimming costs are expected to be approximately $725.5 million from 2021 23
through 2024, Exhibit A-22, Schedule L1, page 1, line 5, columns c -f. 24
25
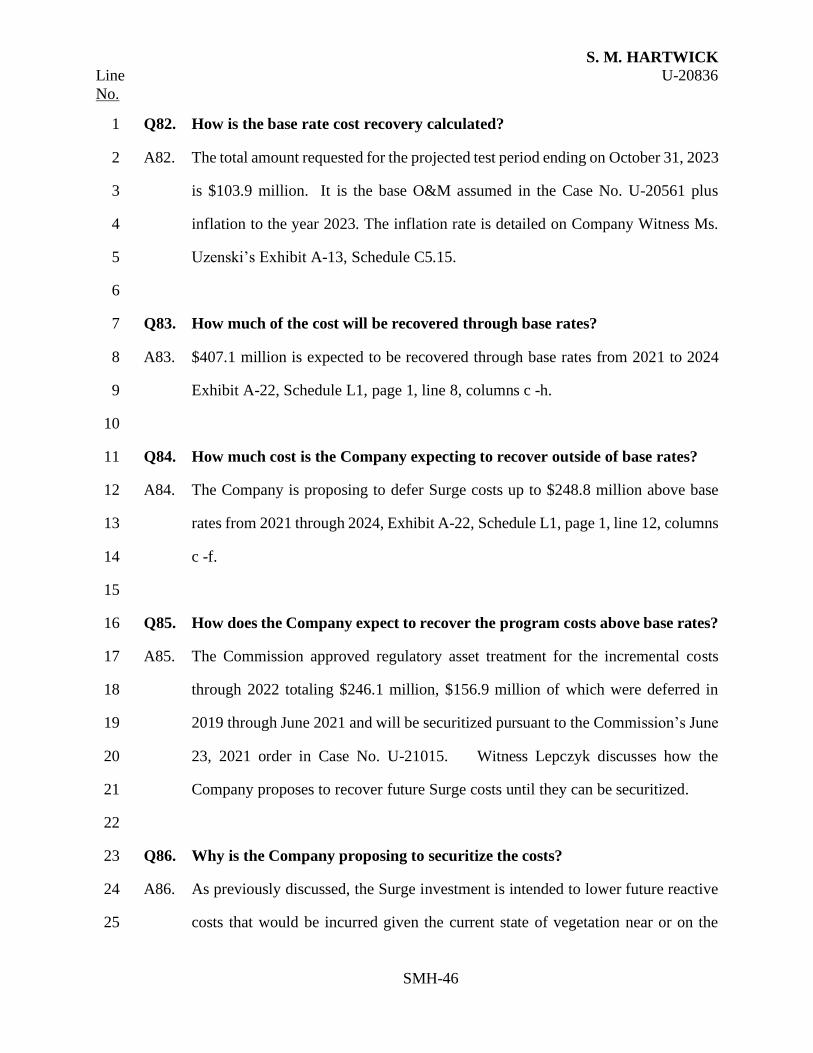
S. M. HARTWICK
Line U-20836
No.
SMH-46
Q82. How is the base rate cost recovery calculated? 1
A82. The total amount requested for the projected test period ending on October 31, 2023 2
is $103.9 million. It is the base O&M assumed in the Case No. U-20561 plus 3
inflation to the year 2023. The inflation rate is detailed on Company Witness Ms. 4
Uzenski’s Exhibit A-13, Schedule C5.15. 5
6
Q83. How much of the cost will be recovered through base rates? 7
A83. $407.1 million is expected to be recovered through base rates from 2021 to 2024 8
Exhibit A-22, Schedule L1, page 1, line 8, columns c -h. 9
10
Q84. How much cost is the Company expecting to recover outside of base rates? 11
A84. The Company is proposing to defer Surge costs up to $248.8 million above base 12
rates from 2021 through 2024, Exhibit A-22, Schedule L1, page 1, line 12, columns 13
c -f. 14
15
Q85. How does the Company expect to recover the program costs above base rates? 16
A85. The Commission approved regulatory asset treatment for the incremental costs 17
through 2022 totaling $246.1 million, $156.9 million of which were deferred in 18
2019 through June 2021 and will be securitized pursuant to the Commission’s June 19
23, 2021 order in Case No. U-21015. Witness Lepczyk discusses how the 20
Company proposes to recover future Surge costs until they can be securitized. 21
22
Q86. Why is the Company proposing to securitize the costs? 23
A86. As previously discussed, the Surge investment is intended to lower future reactive 24
costs that would be incurred given the current state of vegetation near or on the 25

S. M. HARTWICK
Line U-20836
No.
SMH-47
distribution system. Securitization funding recognizes the long-term nature of the 1
program. As the costs are incurred up front and the full savings will not be realized 2
until after the program has matured, recovery over a longer period provides a better 3
matching of costs with the anticipated savings, minimizing the cost impact to 4
customers. 5
6
Resourcing the Tree Trimming Surge 7
Q87. How many resources do you need to meet the accelerated Surge goals? 8
A87. To complete the Surge by the end of 2024, the Company estimates needing an 9
average of 1,500 trimmers. 10
11
Q88. Do you expect to maintain a stable number of trimmers on property 12
throughout the year? 13
A88. While the Company expects to employ an average of 1,500 tree trimmers beginning 14
in 2022, in practice there will likely be resource swings related to seasonality, 15
market crew availability, and natural rotation of outsource crews back to their home 16
areas. 17
18
Q89. How will the tree trimming work be resourced? 19
A89. The Company will use a mix of local and non-local crews to conduct the work. The 20
Company will not be able to achieve the plan through the utilization of local 21
trimmers only and will need to continue to utilize qualified tree-trimming crews 22
from outside of our service territory. The long-term plan is to achieve an adequate 23
level of qualified local workers to displace the non-local workers. 24
25

S. M. HARTWICK
Line U-20836
No.
SMH-48
Q90. What’s the difference between a local tree trimmer and a non-local trimmer? 1
A90. A local trimmer lives within reasonable driving distance of the DTE Electric service 2
territory and makes union wages. Non-local trimmers normally work in other parts 3
of the country but have come to work for DTE Electric contractors on a temporary 4
basis. A non-local trimmer makes union wages but also requires a daily per diem 5
rate to cover room and board. These requirements make non-local trimmers more 6
expensive than local trimmers. 7
8
Q91. Are there any risks to maintaining and growing the Company’s current level 9
of trimmer resources? 10
A91. Yes. The Company faces several risks that could erode its current non-local trimmer 11
population: 12
(1) Due to the Company’s location in a colder climate, many non-local trimmers 13
do not want to work in the area during the winter months. This is important 14
because to obtain an average of 1,500 trimmers, the Company will need to peak 15
at a higher trimmer volume during the summer months to make up for seasonal 16
shortfalls. In the winter of 2020-2021 DTE was able to maintain the majority 17
of outsource crews on property thereby reducing the need for additional summer 18
crews. 19
(2) The market for non-local trimmers has been tight for the last several years. 20
Trimmers are in high demand due to the utility industry’s collective renewed 21
focus on tree trimming. If DTE Electric does not stay on pace with market rates 22
(labor and equipment costs), non-local trimmers will leave for other utilities. 23
(3) DTE Electric requires specialized climbing tree-trimming workers due to its 24
high percentage of backlot construction. Safe and experienced climbing crews 25

S. M. HARTWICK
Line U-20836
No.
SMH-49
are difficult to acquire, and it could be difficult to grow the work force past 1
1,300 to deal with summer peaks. 2
(4) Large weather events, such as hurricanes, often draw traveling non-local 3
trimmers from across the country for the long overtime and generous per diem 4
rates. Not only could this delay implementation of our Surge program due to a 5
temporary loss of workforce, but trimmers could choose not to return after the 6
storm if other opportunities prove more attractive. 7
(5) The constraints and slow down of global supply chains due COVID-19 have 8
limited contractors ability to secure additional equipment such as bucket trucks 9
and specialized equipment. Without the proper equipment, contractors are not 10
able to efficiently add more resources on property. 11
12
Q92. Are there other resource concerns related to COVID-19? 13
A92. Yes, if a vaccine mandate is required for our workforce, we may experience 14
significant disruptions. Depending on if other utilities require the vaccine, our 15
outsource resources may leave for other opportunities. Further, we may see 16
disengagement or loss of our local workforce if individuals feel strongly against the 17
vaccine. A significant loss in our workforce, even for a short period of time in 18
response to the vaccine mandate will pose significant challenges. 19
20
Q93. What is the Company doing to mitigate these risks? 21
A93. The Company has a set of options to mitigate resource risks in the short term. We 22
will monitor market rates (labor and equipment costs) to keep pace with increases 23
and we are exploring ways to incentivize the out of area crews to remain in 24
Michigan during the colder months. This past winter, we were able to retain crews 25

S. M. HARTWICK
Line U-20836
No.
SMH-50
on property with the assurance of continued work through the remainder of the year. 1
The implementation of multi-year contracts provides the opportunity to attract and 2
retain the workforce year-to-year. Additionally, this risk is mitigated by having 4-3
5 tree trimming vendors on property each year because it provides the ability to 4
leverage multiple companies’ resourcing pools when additional resources are 5
needed. Long-term we are working on implementing different initiatives to grow 6
our local workforce as explained below. 7
8
Q94. What is the Company’s plan to create additional local tree trimmers? 9
A94. The Company has several pathways and initiatives in place or in progress to grow 10
the local workforce: 11
(1) The Company has partnered with the City of Detroit, IBEW Local 17, and its 12
tree-trimming contractors to develop and implement a pre-woodsman training 13
pilot program to satisfy the demand for qualified tree trimmers. The pilot tree 14
trimming academy is located within the City of Detroit and facilitates training 15
that is aimed at preparing local resident candidates to work as woodsmen. Once 16
candidates complete the pre-woodsman program, graduates enter the nine-day 17
boot camp that was previously designed in partnership with the Company, 18
IBEW Local 17, and the Company’s tree-trimming contractors. The boot camp 19
gives participants intensive training and hands-on work experience on subjects 20
such as safety, climbing systems, climbing techniques, arborist equipment, 21
arborist tools, commercial vehicle operation, tree species identification, 22
communication with line crews, customer relations, and aerial rescue 23
techniques. Boot camp graduates enter the Line Clearance Tree Trimming 24
Apprentice Program. The 5,000-hour apprenticeship program, which includes 25

S. M. HARTWICK
Line U-20836
No.
SMH-51
160 hours of classroom training, is recognized by the Department of Labor as 1
an approved apprenticeship program and, as one of two programs in the United 2
States, is benchmarked throughout the industry. The first cohort completed the 3
tree trimming academy this past spring, and as of November 2021, 36 4
individuals have graduated from the program, with 100% of them receiving job 5
offers upon graduation. Due to the collaborative outreach effort and positive 6
reception the academy has received thus far, there is already a waitlist for 7
2022’s cohort. 8
(2) The Company has implemented a pilot tree-trimming training program into the 9
Vocational Village at Parnall Correctional Facility in Jackson. The training 10
program was developed to allow returning citizens to directly enter the 11
apprenticeship program upon leaving the correctional facility. In selecting 12
applicants, the Vocational Village administration heavily weighs the 13
applicant’s county of residence to decrease the distance they would have to 14
commute to work once they are released. To date the Company has paired 23 15
graduates with jobs. 16
(3) The Company is working with our local contractors to encourage them to 17
continue to hire new trimmers through their normal processes. Typically, this 18
method of hiring has primarily been used to replace attrition but, due to the 19
increase in future work volume, we are requesting that they attempt additional 20
staff augmentation outside of DTE led activities. 21
22
Q95. What other efforts is the Company undertaking to recruit local talent? 23

S. M. HARTWICK
Line U-20836
No.
SMH-52
A95. The Company is partnering with Local 17 and its contractors to reach out to local 1
high schools, career fairs, and local nonprofit organizations to introduce the tree-2
trimming trade to interested candidates. 3
4
Herbicide Program 5
Q96. What is the herbicide program? 6
A96. The Company uses EPA-regulated herbicides to replace mechanical removal of 7
vegetation from the right-of-way with a chemical treatment, which will only control 8
the tree species with the potential to grow into electrical wires. The Company has 9
created the program using industry best practices that were collected and developed 10
through benchmarking and by working with an outside consultant – ECI. The 11
Company uses herbicides that include foliar herbicide treatment, basal herbicide 12
treatment, and dormant stem treatment. 13
14
Q97. How much did the herbicide program cost in 2019 and 2020, and how much is 15
it expected to cost in 2021 16
A97. The Company spent $0.7 million in 2019 as it was starting up the program and 17
spent $1.3 million on its herbicide program in 2020. Forecasted spend for 2021 is 18
$1.2 million 19
20
Q98. How much does the Company plan to spend on the herbicide program in 2022? 21
A98. The Company plans to spend $2.0 million as outlined in previous rate cases. 22
23
Q99. What are the benefits of the herbicide program? 24

S. M. HARTWICK
Line U-20836
No.
SMH-53
A99. The herbicide treatment will reduce the future cost of maintenance trimming in the 1
right-of-way by reducing tree density. There are other advantages besides realizing 2
cost savings. As tree density and brush height decreases, the electrical system 3
becomes more reliable and the right-of-way becomes more accessible and safer. 4
5
Q100. Are there any additional benefits to treating the right-of-way with herbicides? 6
A100. Yes. Treating the right of ways increases accessibility for our overhead crews, 7
making it safer and easier to access areas in the event of downed wires or broken 8
equipment. Also, because grasses and shrubs are not affected by the herbicide 9
treatment, the area will become a habitat for pollinators, birds, and small mammals. 10
The treatment will also target invasive plant species, limiting their spread. 11
12
Measuring Progress 13
Q101. How will the Company evaluate the results of the Tree Trimming Surge? 14
A101. In compliance with the Commission’s Order in Case Nos. U-20162 and U-20561, 15
the Company will provide an annual report detailing circuit performance on March 16
1st until the Surge program is complete. In addition, the Company will submit a 17
Tree Trimming Effectiveness Report in 2022 to the Commission. 18
19
Q102. How will circuit performance be measured in this annual report? 20
A102. Per the Commission’s direction, the Company will provide details on ETTP and 21
surge miles broken out by geographical region and will include: 22
(1) All activity, costs, and miles trimmed under any and all tree-trimming 23
programs (including 4.8kV Hardening) in the city of Detroit; 24
(2) Miles completed by service center annually; 25
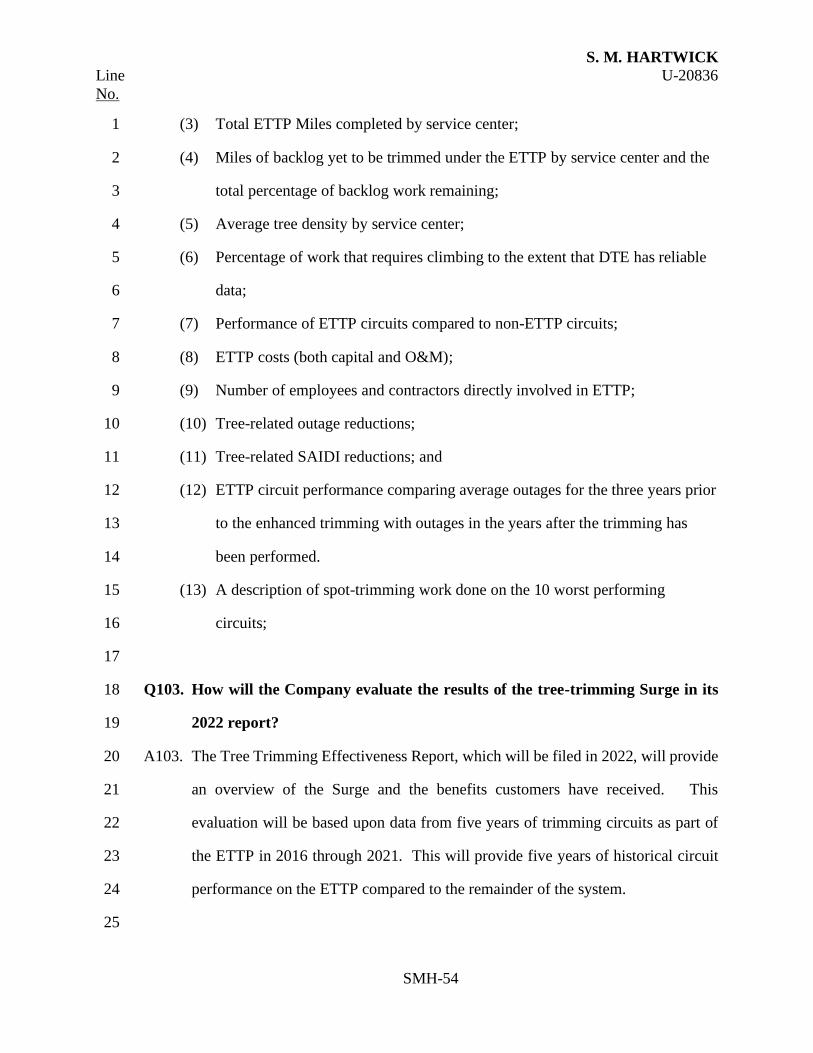
S. M. HARTWICK
Line U-20836
No.
SMH-54
(3) Total ETTP Miles completed by service center; 1
(4) Miles of backlog yet to be trimmed under the ETTP by service center and the 2
total percentage of backlog work remaining; 3
(5) Average tree density by service center; 4
(6) Percentage of work that requires climbing to the extent that DTE has reliable 5
data; 6
(7) Performance of ETTP circuits compared to non-ETTP circuits; 7
(8) ETTP costs (both capital and O&M); 8
(9) Number of employees and contractors directly involved in ETTP; 9
(10) Tree-related outage reductions; 10
(11) Tree-related SAIDI reductions; and 11
(12) ETTP circuit performance comparing average outages for the three years prior 12
to the enhanced trimming with outages in the years after the trimming has 13
been performed. 14
(13) A description of spot-trimming work done on the 10 worst performing 15
circuits; 16
17
Q103. How will the Company evaluate the results of the tree-trimming Surge in its 18
2022 report? 19
A103. The Tree Trimming Effectiveness Report, which will be filed in 2022, will provide 20
an overview of the Surge and the benefits customers have received. This 21
evaluation will be based upon data from five years of trimming circuits as part of 22
the ETTP in 2016 through 2021. This will provide five years of historical circuit 23
performance on the ETTP compared to the remainder of the system. 24
25

S. M. HARTWICK
Line U-20836
No.
SMH-55
Conclusion 1
Q104. Do you recommend this continued investment in the tree-trimming program? 2
A104. Yes. The tree-trimming program is the most impactful and important program in 3
the Company’s long-term investment strategy. The program has shown that it 4
significantly decreases system risk (specifically reduced wire downs), increases 5
reliability (fewer and shorter outages), and will decrease reactive trouble costs. 6
The tree trimming program as proposed is required to provide safe, reliable and 7
affordable electricity to the Company’s customers. Without continuing the Surge 8
investment, the distribution system will continue to degrade, resulting in higher 9
risks and lower reliability. I believe this program is right for our customers and I 10
appreciate the Commission’s continued support for the program in Case No. U-11
20561. The Company is requesting approval of 2023 and 2024 Surge funding 12
including continued regulatory asset treatment of the Surge costs in order to execute 13
the program in a way that makes it affordable for customers. 14
15
Q105. In your opinion are these expenses reasonable? 16
A105. Yes, they are. I base my opinion on analysis of past expenses, and the projected 17
requirements for labor and materials to conduct the necessary tree trimming. 18
19
Q106. Does this complete your direct testimony? 20
A106. Yes, it does. 21
22

STATE OF MICHIGAN
BEFORE THE MICHIGAN PUBLIC SERVICE COMMISSION
In the matter of the Application of ) DTE ELECTRIC COMPANY ) for authority to increase its rates, amend ) Case No. U-20836 its rate schedules and rules governing the ) distribution and supply of electric energy, and ) for miscellaneous accounting authority. )
QUALIFICATIONS
AND
DIRECT TESTIMONY
OF
TAMARA D. JOHNSON
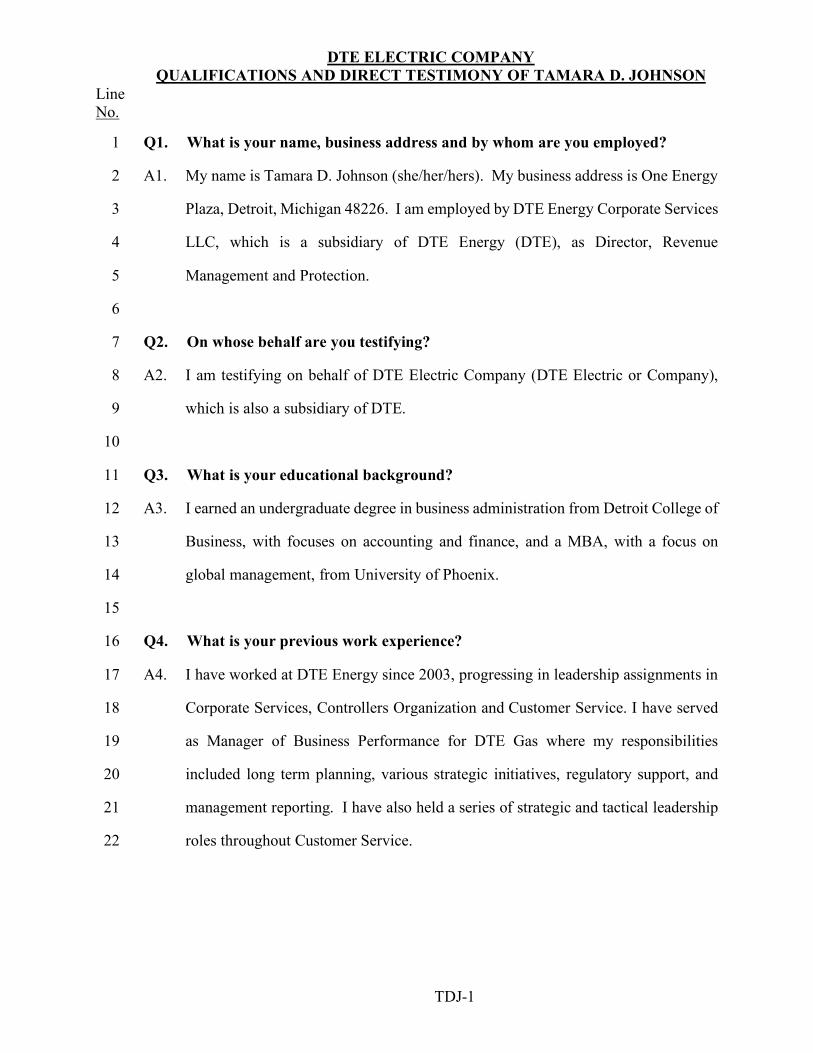
DTE ELECTRIC COMPANY QUALIFICATIONS AND DIRECT TESTIMONY OF TAMARA D. JOHNSON
Line No.
TDJ-1
Q1. What is your name, business address and by whom are you employed?1
A1. My name is Tamara D. Johnson (she/her/hers). My business address is One Energy 2
Plaza, Detroit, Michigan 48226. I am employed by DTE Energy Corporate Services 3
LLC, which is a subsidiary of DTE Energy (DTE), as Director, Revenue 4
Management and Protection. 5
6
Q2. On whose behalf are you testifying? 7
A2. I am testifying on behalf of DTE Electric Company (DTE Electric or Company), 8
which is also a subsidiary of DTE. 9
10
Q3. What is your educational background? 11
A3. I earned an undergraduate degree in business administration from Detroit College of 12
Business, with focuses on accounting and finance, and a MBA, with a focus on 13
global management, from University of Phoenix. 14
15
Q4. What is your previous work experience? 16
A4. I have worked at DTE Energy since 2003, progressing in leadership assignments in 17
Corporate Services, Controllers Organization and Customer Service. I have served 18
as Manager of Business Performance for DTE Gas where my responsibilities 19
included long term planning, various strategic initiatives, regulatory support, and 20
management reporting. I have also held a series of strategic and tactical leadership 21
roles throughout Customer Service. 22
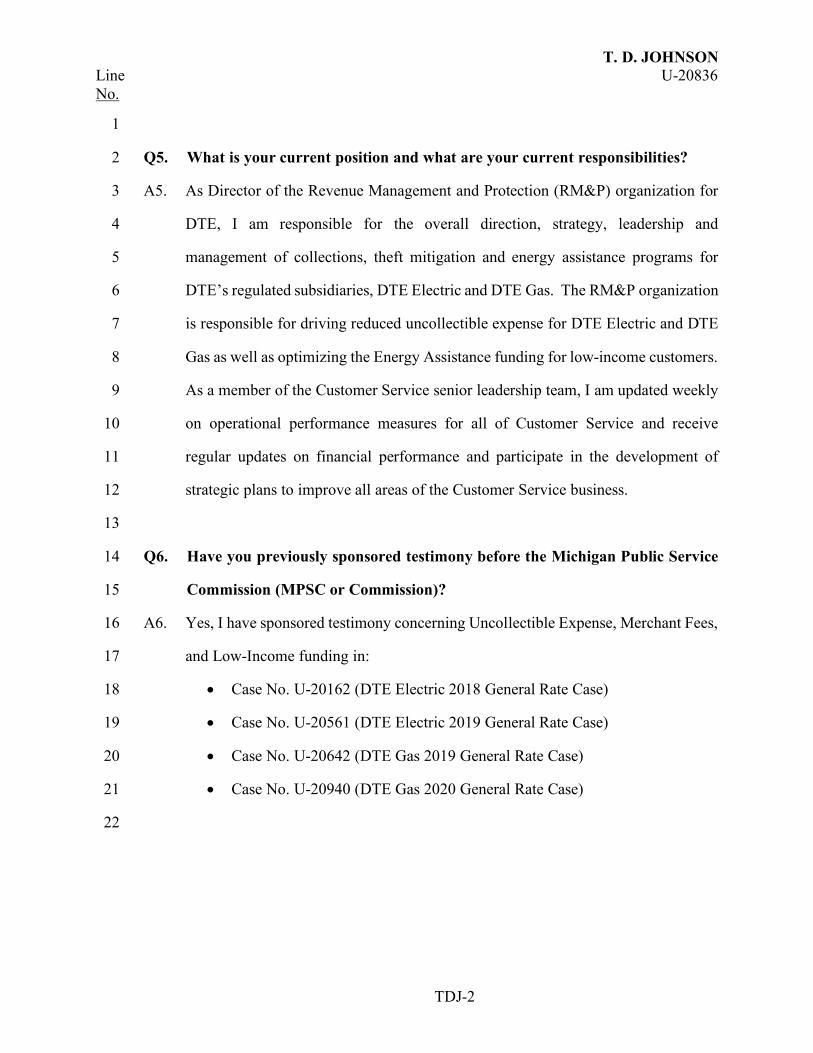
T. D. JOHNSON Line U-20836 No.
TDJ-2
1
Q5. What is your current position and what are your current responsibilities? 2
A5. As Director of the Revenue Management and Protection (RM&P) organization for 3
DTE, I am responsible for the overall direction, strategy, leadership and 4
management of collections, theft mitigation and energy assistance programs for 5
DTE’s regulated subsidiaries, DTE Electric and DTE Gas. The RM&P organization 6
is responsible for driving reduced uncollectible expense for DTE Electric and DTE 7
Gas as well as optimizing the Energy Assistance funding for low-income customers. 8
As a member of the Customer Service senior leadership team, I am updated weekly 9
on operational performance measures for all of Customer Service and receive 10
regular updates on financial performance and participate in the development of 11
strategic plans to improve all areas of the Customer Service business. 12
13
Q6. Have you previously sponsored testimony before the Michigan Public Service 14
Commission (MPSC or Commission)? 15
A6. Yes, I have sponsored testimony concerning Uncollectible Expense, Merchant Fees, 16
and Low-Income funding in: 17
• Case No. U-20162 (DTE Electric 2018 General Rate Case) 18
• Case No. U-20561 (DTE Electric 2019 General Rate Case) 19
• Case No. U-20642 (DTE Gas 2019 General Rate Case) 20
• Case No. U-20940 (DTE Gas 2020 General Rate Case) 21
22

T. D. JOHNSON Line U-20836 No.
TDJ-3
Purpose of Testimony 1
Q7. What is the purpose of your testimony? 2
A7. The purpose of my testimony is to: 3
• provide details of Low-Income programs responding to the impact of the 4
COVID-19 Pandemic 5
• explain the details of the Company’s Low-Income programs 6
• provide details of DTE’s Low-Income Assistance (LIA) credits 7
• provide details of DTE’s Residential Income Assistance credits (RIA) 8
• propose changes to the tariff language for DTE’s Low-Income energy 9
assistance credits 10
• propose changes to the DTE Electric Company Rate Book 11
• explain and support the $59.6 million of projected uncollectible expense 12
• update the level of uncollectible expense 13
14
Q8. What exhibits are you sponsoring in this proceeding? 15
A8. I am supporting the following exhibit: 16
Exhibit Schedule Description 17
A-13 C5.8 Projected Operation and Maintenance Expenses 18
Uncollectible Accounts 19
20
Q9. Was this exhibit prepared by you or under your direction? 21
A9. Yes, it was. 22
23

T. D. JOHNSON Line U-20836 No.
TDJ-4
COVID-19 Pandemic Impact to Low-Income Programs 1
Q10. What guiding principles did the Company use when initiating responses to the 2
COVID-19 Pandemic? 3
A10. To better assist our employees in making decisions in moments of service and enable 4
service excellence, the Company has established Four Keys of Service Excellence. 5
These keys include Safe, Caring, Dependable and Efficient. All Customer Service 6
activities pass through the Service Keys. Our desired culture is one where all 7
employees have a service mindset and a strong emotional connection to caring for 8
our customers and each other. 9
10
Q11. What programs did the Company initiate as a response to the COVID-19 11
Pandemic? 12
A11. The Company devised and implemented several programs in response to the 13
unprecedented COVID-19 pandemic and the Commission’s Order in Case No. U-14
20757, establishing a case for the Commission’s response to the COVID-19 15
pandemic. These programs leveraged government, faith-based, and agency 16
partnerships to effectively coordinate our response to the impact of the COVID-19 17
pandemic. The Company intensified efforts on community outreach and tapped into 18
creative payment solutions to ensure that our most vulnerable communities were 19
taken care of during this time of crisis. 20
21
These programs included: 22
• Disconnect Suspension 23
• Expanded Wellness Checks 24
• Virtual Customer Assistance Days (CAD) 25

T. D. JOHNSON Line U-20836 No.
TDJ-5
• Low Income Home Energy Assistance Program (LIHEAP) Direct Support 1
• One Time Balance Reduction Initiative 2
• Personalized Service Protection Plans 3
• Low Income Self Sufficiency Plan (LSP) extension 4
• Medical Hold Policy Extension (including COVID affected customers) 5
• Agency Partnerships for additional customer assistance 6
• Community Outreach for Energy Assistance 7
o Feet on the street 8
o Public Affairs activity 9
10
Q12. What was the Company’s Disconnect Suspension Program? 11
A12. Understanding the unprecedented and overwhelming financial impact of the 12
COVID-19 pandemic on communities, DTE was quick to respond by implementing 13
a halt on disconnects for both commercial and residential accounts, that began mid-14
March 2020 and continued through July 20, 2020. In addition, to ensure the safety 15
and well-being of all customers, the Company took steps to restore any previously 16
disconnected customers. 17
18
Q13. What were the Company’s Expanded Wellness Checks? 19
A13. In Spring of 2020, the onset of the COVID-19 pandemic, it was vitally important 20
that customers who may have had their service discontinued for non-pay and had 21
not yet been restored, had access to energy. The Revenue Management & Protection 22
(RM&P) Field Operations Team completed over 1,800 wellness checks that 23
involved door to door inquiries of customers with disconnected service. 24
Restorations were implemented without deposits nor re-connect fees. 25

T. D. JOHNSON Line U-20836 No.
TDJ-6
Q14. What are Virtual Customer Assistance Days (CAD)? 1
A14. The COVID-19 Pandemic created a new landscape of reaching out to our 2
communities. The Company met the challenge by creating avenues to assist our 3
most vulnerable customers at a time when many were unsure of what the future held. 4
The Company held a total of 22 in-person CAD’s in 2018-2019. The onsite services 5
included energy assistance, energy efficiency and education and access to various 6
human services agencies. With COVID-19 and the Governor’s Executive Orders in 7
2020, meeting face to face with our customers was no longer a safe option. In 8
response, the Company developed the Virtual CAD. The Virtual CAD utilized 63 9
CAD representatives trained to identify and assist customers in agency referrals for 10
Low Income Self Sufficiency Program (LSP) and personalized service protection 11
plans and assist customers in State Emergency Relief (SER) applications. The 12
Virtual CAD allowed for resolution of customer issues at a single point of contact. 13
Over 5,000 customers were able to complete a SER application during the 2020 14
Company’s Virtual CAD events. As of October 2021, the Company continues to 15
host virtual CAD events and has completed an additional 4,429 SER applications. 16
17
Q15. What is the Low-Income Home Energy Assistance Program (LIHEAP) Direct 18
Support Initiative? 19
A15. The LIHEAP assists eligible low-income households with their heating and cooling 20
energy costs, bill payment assistance, energy crisis assistance, weatherization and 21
energy-related home repairs. In partnership with the Michigan Department of 22
Health and Human Services (MDHHS) and as part of the Coronavirus Aid, Relief, 23
and Economic Security (CARES) Act, the Company used funding to reduce the 24
arrears of low-income customers. The program supported over 20,000 customers 25

T. D. JOHNSON Line U-20836 No.
TDJ-7
and provided over $13 million in energy assistance over a 30-day period. This 1
collaboration required swift action in defining and identifying eligible customers as 2
well as a team effort in the coordination of communication and system requirements. 3
In addition, the Michigan State Housing Development Authority (MHSDA) through 4
the COVID Emergency Rental Assistance (CERA) has as of October 1, 2021, 5
provided $9.4 million in energy assistance. 6
7
Q16. What is the Company’s One Time Balance Reduction Initiative? 8
A16. To assist customers with limited resources during the pandemic, DTE designed a 9
One-Time Balance Reduction Initiative. The initiative targeted three specific 10
segments and Federal Poverty Levels (FPL): 11
• Priority Segment 1 “Moderate Income” 12
o Customers who range from >150%-250% FPL, haven’t received 13
assistance and are not eligible to, had good paying history, and are 14
past due as a result of the pandemic 15
• Priority Segment 2 “Low-Income Senior” 16
o Criteria: Customers who are 200% FPL, seniors, received maximum 17
assistance, not eligible for LSP, and are past due. 18
• Priority Segment 3 “Low-Income (non-Senior)” 19
o Criteria: Customers who are 200% FPL, not seniors, received 20
maximum assistance, not eligible for LSP due to account balance, 21
and are past due. 22
23
Each segment contained specific criteria with distinct outreach campaigns and 24
customer experiences with the Company also known as customer journeys. In 25

T. D. JOHNSON Line U-20836 No.
TDJ-8
addition, customers were encouraged to achieve at least two Energy Waste 1
Reduction (EWR) offerings within 60 days after program enrollment. Those 2
offerings included: 3
• Download of DTE’s Insight App 4
• Free Home Energy Consultation 5
• DTE Interactive Home Tour 6
• Energy Efficiency Assistance Program 7
• MI Saves Program (200%-250% FPL) 8
Customers were identified by arrears balance totals and account aging. Based on 9
these criteria customers were required to pay a percentage of their balances. DTE 10
then applied an arrears forgiveness payment to achieve a zero balance for the 11
customer. Customers were also evaluated for the Company’s affordable payment 12
plan and enrolled where eligible. Table 1 “One-time Balance Reduction Program 13
Metrics” provides metrics of the initiative. 14
15
Table 1 One Time Balance Reduction Program Metrics 16
Segment 1 Segment 2 Segment 3 Total
Total Customers Enrolled 665 541 852 2,058
Total Payments Made by
Customers (cumulative) $172,615 $177,810 $184,597 $535,023
Count of Payments Made by
Customers (cumulative) 628 528 753 1,909
% of Customers with
Payments Made 94% 98% 88% 93%

T. D. JOHNSON Line U-20836 No.
TDJ-9
DTE Balance Reduction ($)
Applied (cumulative)
$371,567 $1,222,369 $1,048,330 $2,642,267
Segment 3 LSP Enrollments* 387 387
*These are accounts that became eligible and enrolled in LSP after account 1
balance reduction 2
3
Q17. What are the Company’s Personalized Service Protection Plans? 4
A17. The Company quickly recognized the expanding population of customers in need of 5
energy assistance as a result of economic impact of the COVID-19 pandemic. 6
Where customers required more than the standard payment arrangements, the 7
Company demonstrated flexibility in creating personalized payment arrangements 8
that addressed the customer’s energy burden, acknowledged the customer’s 9
vulnerability and appreciated the need to maintain the customer’s dignity during the 10
challenging times. 11
12
Q18. What did the Low-Income Self Sufficiency Program Extension entail? 13
A18. The LSP program allows customers to make affordable monthly payments based on 14
a customer’s income with the remaining portion of the customer’s bill paid monthly 15
with energy assistance funds. During the pandemic, customers who were unable to 16
meet their plan payment requirements were able to remain in the program. Customer 17
advocates reached out and communicated with gentle reminders and offers of 18
assistance. Additionally, customers were advised of partner agency assistance in 19
catching up with any missed payments. 20
21
Q19. What is the Medical Hold Policy Extension? 22

T. D. JOHNSON Line U-20836 No.
TDJ-10
A19. The Company’s 30-day medical hold policy was broadened to include low-income 1
customers that were physically exposed, infected or quarantined by COVID-19 virus 2
(including influenza). 3
4
Q20. What agency partnerships did the Company leverage for additional customer 5
energy assistance? 6
A20. During the pandemic the Company improved accessibility of energy assistance and 7
activated community partners such as The Salvation Army, United Way, The Heat 8
And Warmth Fund (THAW), and St Vincent DePaul to reach our vulnerable 9
households. This initiative included $10 million in DTE Foundation donation 10
dollars that assisted reducing arrears for customers in crisis. As part of the settlement 11
approved in Case No. U-20642, DTE Gas made a $1.0 million donation in 2020 to 12
THAW, an independent 501(c)3 nonprofit agency providing limited-income 13
individuals and families throughout the State of Michigan with emergency utility 14
assistance. 15
16
Q21. What activities were included in the community outreach energy assistance? 17
A21. As part of the Feet on the Street initiative in August 2020, DTE delivered door 18
hangers to approximately 12,000 residents in the city of Detroit. The doorhanger 19
encouraged customers to call DTE to find ways to lower their bill with payment 20
plans, restore their service, get financial aid, and identify opportunities to improve 21
energy efficiency. Public Affairs collaborated with peer utilities to create a public 22
service announcement campaign connecting customers with pathways to resources 23
for payment assistance. Additional collaborations included community 24

T. D. JOHNSON Line U-20836 No.
TDJ-11
organizations to deploy teams of neighborhood canvassers that reached nearly 1
130,000 households in targeted communities. 2
3
Q22. Are there additional activities centered around COVID-19 relief? 4
A22. Yes, the Company in partnership with agencies is developing a process to assist 5
customers waiting on the distribution of CERA funds. In addition to the CERA 6
initiative, the Company is working on the next round of LIHEAP Direct Support for 7
December 2021. The Company anticipates matching 25% of the LIHEAP funds 8
provided by MDHHS to be applied to customers between 151%-400%FPL. This 9
will assist customers not eligible for other types of low-income funding due to 10
exceeding the 150% FPL requirement. 11
12
Low-Income Program 13
Q23. What is the goal of the Company’s energy assistance programs? 14
A23. The goal of the Company’s energy assistance programs is to gradually reduce arrears 15
owed while encouraging and supporting good payment habits and reducing 16
consumption. This program structure leads to participants reducing their arrear over 17
time and adopting a habit of making regular, affordable payments, albeit subsidized 18
in the short term. The end goal is customers reaching self-sufficiency and being able 19
to afford the actual costs of the energy they consume. 20
21
Q24. What are energy assistance programs the Company provides for its low- 22
income customers? 23
A24. The Company provides a variety of low-income energy assistance through a variety 24
of programs. Those programs include Shut Off Protection Plan (SPP), Energy 25

T. D. JOHNSON Line U-20836 No.
TDJ-12
Efficiency Assistance (EEA), Low Income Self Sufficiency Plan (LSP) and Low- 1
Income credits such as the Residential Income Assistance (RIA) and Low-Income 2
Assistance (LIA) credits. 3
4
Q25. How does the Company’s Customer Service group help provide Energy 5
Efficiency Services for low-income customers? 6
A25. Through partnerships with participating agencies, customers facing challenges 7
paying their utility bills can apply for the Company’s Energy Efficiency Services. 8
Customers at or below 200% FPL are then eligible to receive services such as home 9
energy consultations, appliance replacement and home weatherization. 10
11
Q26. What is the Shut Off Protection Plan (SPP)? 12
A26. The SPP is designed to help low-income customers pay overdue balances by 13
dividing it into equal portions that are added to future DTE Electric bills. The 14
payment amount is calculated by dividing the past due balance into smaller 15
payments and projected future monthly bills. These two amounts are combined into 16
a new monthly payment. 17
Enrollment in SPP is available to low-income customers and senior citizens year-18
round. Enrollment requires income verification and an initial down payment. The 19
amount of the down payment will affect the monthly payment amount. Making a 20
larger down payment will result in a lower monthly payment amount. 21
22
Q27. How many low-income customers are enrolled in the SPP? 23
A27. As of October 2021, there are an estimated 27,000 identified low-income customers 24
at or below 200% Federal Poverty Level (FPL) enrolled in the SPP. 25
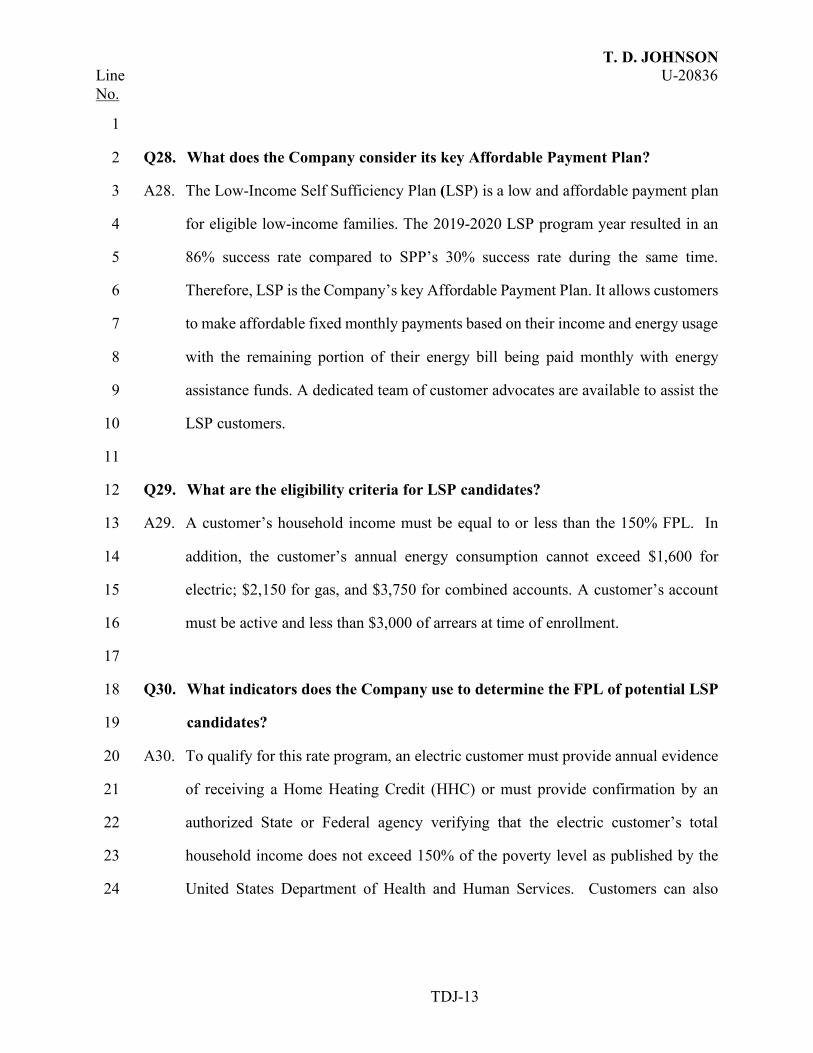
T. D. JOHNSON Line U-20836 No.
TDJ-13
1
Q28. What does the Company consider its key Affordable Payment Plan? 2
A28. The Low-Income Self Sufficiency Plan (LSP) is a low and affordable payment plan 3
for eligible low-income families. The 2019-2020 LSP program year resulted in an 4
86% success rate compared to SPP’s 30% success rate during the same time. 5
Therefore, LSP is the Company’s key Affordable Payment Plan. It allows customers 6
to make affordable fixed monthly payments based on their income and energy usage 7
with the remaining portion of their energy bill being paid monthly with energy 8
assistance funds. A dedicated team of customer advocates are available to assist the 9
LSP customers. 10
11
Q29. What are the eligibility criteria for LSP candidates? 12
A29. A customer’s household income must be equal to or less than the 150% FPL. In 13
addition, the customer’s annual energy consumption cannot exceed $1,600 for 14
electric; $2,150 for gas, and $3,750 for combined accounts. A customer’s account 15
must be active and less than $3,000 of arrears at time of enrollment. 16
17
Q30. What indicators does the Company use to determine the FPL of potential LSP 18
candidates? 19
A30. To qualify for this rate program, an electric customer must provide annual evidence 20
of receiving a Home Heating Credit (HHC) or must provide confirmation by an 21
authorized State or Federal agency verifying that the electric customer’s total 22
household income does not exceed 150% of the poverty level as published by the 23
United States Department of Health and Human Services. Customers can also 24

T. D. JOHNSON Line U-20836 No.
TDJ-14
qualify for the credit if they receive any of the following: i) assistance from a state 1
emergency relief program; ii) food stamps; or iii) Medicaid. 2
3
Q31. What other methods of assistance are there for low-income customers? 4
A31. The Company continues to administer the LIA credit pilot and RIA credits for 5
qualifying low-income customers. 6
7
Q32. What are the key features of the LIA Credit? 8
A32. The LIA credit (contained in Rate Schedule D1.6) offers qualifying low-income 9
electric customers a $40 per month credit on their bill. While assisting customers 10
with their monthly consumption, the credit allows customers who may not meet 11
eligibility requirements of other programs such as LSP to benefit from the $40 bill 12
reduction each month. 13
14
Q33. What currently makes a customer qualified to receive the LIA credit? 15
A33. To qualify for this rate an electric customer must be at or below 150% FPL. 16
17
Q34. Can any qualifying low-income customer currently be eligible to receive the 18
LIA credit? 19
A34. Yes. 20
21
Q35. What are the current key features of the RIA credit? 22
A35. The RIA credit offers low-income electric customers $7.50 per month credit on their 23
bill. To be eligible, the total household income cannot exceed the 150% FPL, 24
verified by confirmation of an authorized State or Federal agency. The credit is 25
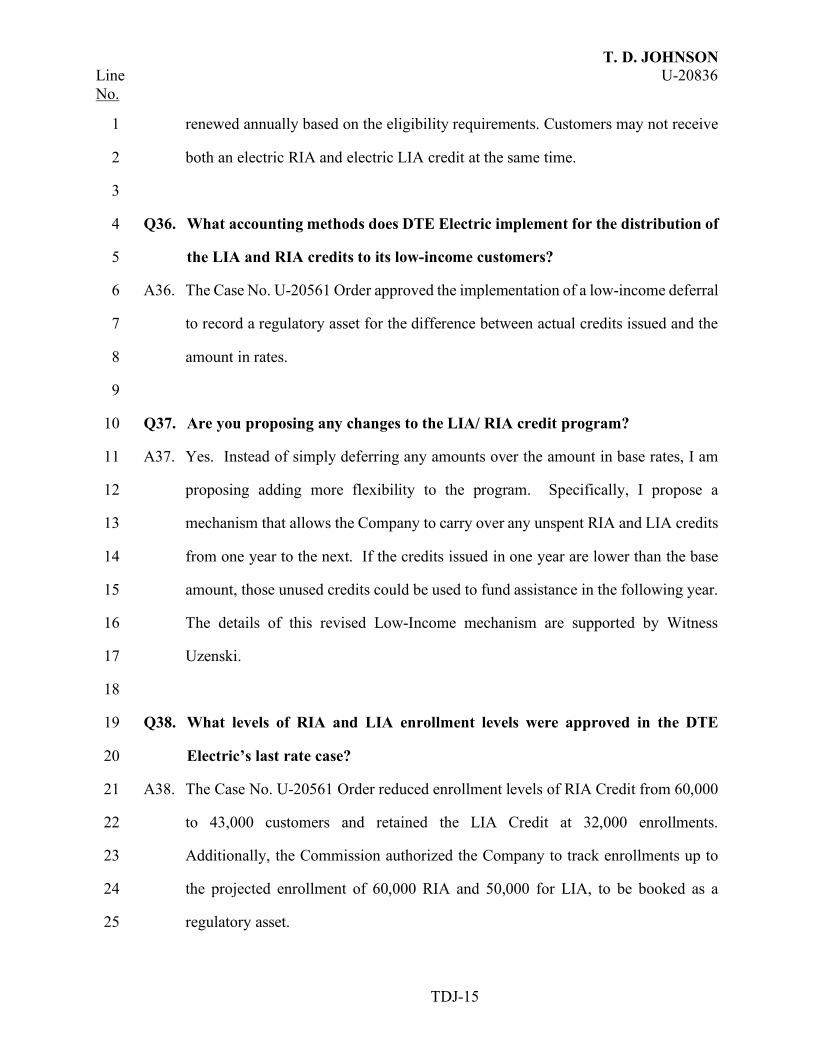
T. D. JOHNSON Line U-20836 No.
TDJ-15
renewed annually based on the eligibility requirements. Customers may not receive 1
both an electric RIA and electric LIA credit at the same time. 2
3
Q36. What accounting methods does DTE Electric implement for the distribution of 4
the LIA and RIA credits to its low-income customers? 5
A36. The Case No. U-20561 Order approved the implementation of a low-income deferral 6
to record a regulatory asset for the difference between actual credits issued and the 7
amount in rates. 8
9
Q37. Are you proposing any changes to the LIA/ RIA credit program? 10
A37. Yes. Instead of simply deferring any amounts over the amount in base rates, I am 11
proposing adding more flexibility to the program. Specifically, I propose a 12
mechanism that allows the Company to carry over any unspent RIA and LIA credits 13
from one year to the next. If the credits issued in one year are lower than the base 14
amount, those unused credits could be used to fund assistance in the following year. 15
The details of this revised Low-Income mechanism are supported by Witness 16
Uzenski. 17
18
Q38. What levels of RIA and LIA enrollment levels were approved in the DTE 19
Electric’s last rate case? 20
A38. The Case No. U-20561 Order reduced enrollment levels of RIA Credit from 60,000 21
to 43,000 customers and retained the LIA Credit at 32,000 enrollments. 22
Additionally, the Commission authorized the Company to track enrollments up to 23
the projected enrollment of 60,000 RIA and 50,000 for LIA, to be booked as a 24
regulatory asset. 25

T. D. JOHNSON Line U-20836 No.
TDJ-16
1
Q39. Is the Company seeking changes to the level of the RIA credits? 2
A39. Yes, the Company is forecasting the RIA credit enrollment forecast to be 61,745 3
customers in the projected test year. Current RIA enrollment is at 64,000 electric 4
low-income customers. All eligible customers seeking the RIA credit are granted 5
enrollment. The numbers continue to trend upward so it is reasonable to expect that 6
enrollments will remain at or above the 60,000 level. 7
8
Q40. What is the Company doing to meet the LIA enrollment levels? 9
A40. In addition to partnering the LIA credit with LSP enrollees, the Company is 10
reviewing and prioritizing the enrollment of 5,000 eligible non-LSP senior 11
customers who currently are receiving the RIA credit. 12
13
Low Income Rate Book Language Changes 14
Q41. Does the Company propose any changes to the rate book language related to 15
the RIA or LIA credits? 16
A41. Yes, The Company is proposing changes to the RIA and LIA sections of the tariff 17
to standardize and clarify the two sections. The changes are provided in Exhibit A-18
16 Schedule F8, which is sponsored by Witness Willis, and are summarized below: 19
1. RIA and LIA already contain qualification provisions including the customer 20
providing annual evidence of receiving Home Heating Credit (HHC) or 21
Medicaid. The Company proposes to modify customer qualification 22
requirements such that customers must verify receipt of one of the following in 23
the last 12 months: HHC, State Emergency Relief, Michigan Energy Assistance 24
Program, Medicaid, or Supplementary Nutrition Assistance Program. The 25

T. D. JOHNSON Line U-20836 No.
TDJ-17
Company also proposes that if the customer cannot verify that they meet any of 1
these requirements, a self-attestation form must be completed and provided to 2
the Company. For LIA, the Company is also proposing that in addition to the 3
income verification methods listed above, a customer may qualify with proof of 4
enrollment in the Company’s affordable payment plan as sanctioned under the 5
Michigan Energy Assistance Program (MEAP) or having received one-time 6
MEAP assistance in the last 12 months. 7
2. Clarifying that the LIA credits will be distributed at the Company’s discretion. 8
3. Clarifying that if participation results in a credit balance that it may only be 9
applied to future billed amounts, and that in no case will a refund be issued. 10
11
Q42. Is the Company proposing any other changes to the rate book language? 12
A42. Yes, the Company is updating the tariff to conform with the billing rules as they 13
relate to the age of senior citizen customers. 14
15
Q43. Did the COVD-19 pandemic affect any of DTE Electric’s programs for low 16
income and seniors? 17
A43. Yes. On March 10, 2020, the Governor issued Executive Order 2020-4, which was 18
the Declaration of a State of Emergency due to the COVID-19 pandemic. In 19
response, the Company expanded its shutoff protections for low-income and seniors 20
beyond the March 31, 2020 end date through July 10, 2020 to ensure these customers 21
would not experience an interruption of service during this critical time. 22
23
Q44. What new initiatives is the Company undertaking to create comprehensive 24
energy assistance for its low-income customer population? 25

T. D. JOHNSON Line U-20836 No.
TDJ-18
A44. As a result of the Case No. U-20561 Order and approval of the Case No. U-20929 1
ex-parte filing, the Company will be launching the Payment Stability Plan (PSP) 2
pilot in January 2022. PSP is the Company’s percentage of income payment plan 3
(PIPP). 4
5
Q45. What are the details of the PSP pilot? 6
A45. The PSP pilot is a percentage of income-based program directed at low-income 7
customers at or below 200% of the FPL. PSP is a 2-year pilot starting in first quarter 8
2022 targeting a maximum of 2,000 low-income customers. The pilot will focus on 9
the importance of affordable energy as it relates to energy burdens for low-income 10
customers by developing a payment program that is based upon a percentage of gross 11
income. The payment amount is based on the household’s income during the 12
previous 12 months. 13
14
Customers who receive either gas or electric utility service from DTE Gas or DTE 15
Electric will have flat bill payments equivalent to 6% of the household gross income. 16
Customers who receive both gas and electric utility service from the Companies will 17
have flat bill payments equivalent to 10% of the household gross income. PSP 18
Customers will be enrolled in Energy Waste Reduction education and wrap around 19
services where applicable. 20
21
Q46. What is the Company doing to capture data to measure the success of the pilot? 22
A46. The Company is preparing methods to capture data across several characteristics 23
including but not limited to historical consumption, arrears, payment plans, every 24
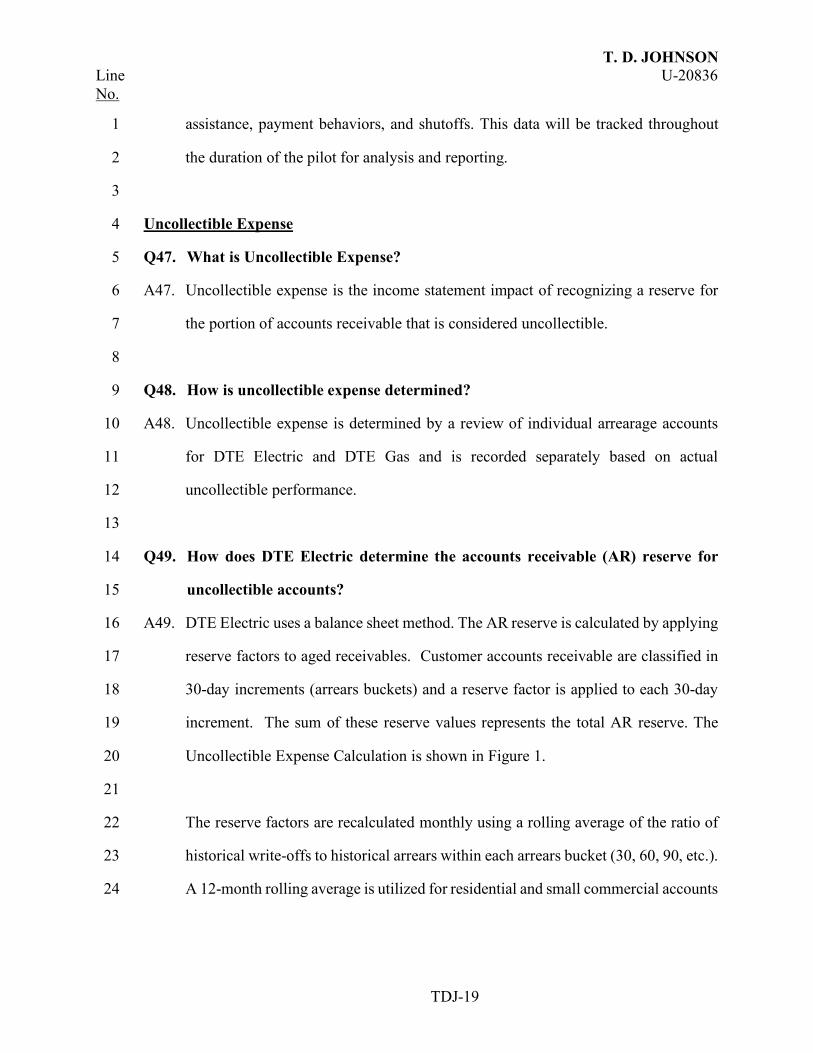
T. D. JOHNSON Line U-20836 No.
TDJ-19
assistance, payment behaviors, and shutoffs. This data will be tracked throughout 1
the duration of the pilot for analysis and reporting. 2
3
Uncollectible Expense 4
Q47. What is Uncollectible Expense? 5
A47. Uncollectible expense is the income statement impact of recognizing a reserve for 6
the portion of accounts receivable that is considered uncollectible. 7
8
Q48. How is uncollectible expense determined? 9
A48. Uncollectible expense is determined by a review of individual arrearage accounts 10
for DTE Electric and DTE Gas and is recorded separately based on actual 11
uncollectible performance. 12
13
Q49. How does DTE Electric determine the accounts receivable (AR) reserve for 14
uncollectible accounts? 15
A49. DTE Electric uses a balance sheet method. The AR reserve is calculated by applying 16
reserve factors to aged receivables. Customer accounts receivable are classified in 17
30-day increments (arrears buckets) and a reserve factor is applied to each 30-day 18
increment. The sum of these reserve values represents the total AR reserve. The 19
Uncollectible Expense Calculation is shown in Figure 1. 20
21
The reserve factors are recalculated monthly using a rolling average of the ratio of 22
historical write-offs to historical arrears within each arrears bucket (30, 60, 90, etc.). 23
A 12-month rolling average is utilized for residential and small commercial accounts 24

T. D. JOHNSON Line U-20836 No.
TDJ-20
and a 60-month rolling average is utilized for large commercial and industrial 1
accounts. 2
Figure 1 Uncollectible Expense Calculation 3
4
Q50. How does the Company account for uncollectible expense? 5
A50. Uncollectible expense is recorded in the income statement to reflect the change in 6
the AR reserve. This is calculated as the required increase/decrease in the AR 7
reserve based on the aging analysis just described, plus accounts that were written-8
off that month, minus accounts that were recovered (on previously written off 9
accounts) that month, plus any DTE Electric matches of low-income funding 10
received. 11
12
Q51. What are the Company’s write-off procedures? 13
A51. Routine customer accounts are generally written off once they age to 150 days past 14
the final bill due date, which is issued after service is disconnected. Often, however, 15
there are circumstances that warrant keeping the account on the books until a 16
resolution is obtained – for example, customers with payment arrangements, 17
disputes, etc. Once an account is written off, any payments received on that account 18
are recognized as a recovery. The write-off period of 150 days past the final billing 19

T. D. JOHNSON Line U-20836 No.
TDJ-21
is generally defined as the latest of either the last effective closed agreement date or 1
the last bill due date. 2
3
Q52. How is uncollectible expense calculated in this case? 4
A52. In this instant case the Company is utilizing a three-year average based on actual 5
uncollectible expense for 2017-2020, excluding 2018, resulting in a $59.6 million 6
of uncollectible expense. This amount is calculated on Exhibit A-13, Schedule C5.8 7
and shown on line 1, column (e) of that same exhibit. The $59.6 million projected 8
amount reflects DTE Electric’s planned efforts to keep uncollectible expenses from 9
increasing despite continuing economic challenges for many of our customers. 10
11
Q53. Why is the Company excluding the 2018 Uncollectible Expense from the three-12
year average calculation? 13
A53. Uncollectible expense was abnormally high during 2018 due to system issues and 14
delayed collections, resulting from the Customer 360 (C360) billing system 15
implementation. This type of system upgrade occurs perhaps once in 10 to 15 years 16
and had a significant impact on collection activities. The impact of those issues is 17
not easily quantified. Therefore, the Company excluded 2018 uncollectible expense 18
from the calculation. When including the 2018 uncollectible expense, the three-year 19
average from 2018-2020 is $71 million. In comparison, when using the 3-year 20
average of 2017, 2019, and 2020, uncollectible expense is $59.6 million which 21
results in a ($2.0) million adjustment from the historical test period. For comparison 22
purposes, the 3-year average of historical net write-offs (including charges to direct 23
expense) is $64 million. This results in a forecast that is more appropriate and 24
beneficial for our customers. 25

T. D. JOHNSON Line U-20836 No.
TDJ-22
1
Q54. Is the Company aware of Staff’s cash basis methodology of calculating 2
uncollectible expense that was adopted in the Case No. U-20162 Order? 3
A54. Yes, in the Case No. U-20162 Order, Staff’s cash basis methodology for 4
uncollectible expense was adopted by the Commission. The Commission found 5
Staff’s method to be the most accurate and least prone to potential forecasting error. 6
7
Q55. Are there any reasons the cash basis method should not be used? 8
A55. Yes. The cash basis method for estimating uncollectible expense is inconsistent with 9
how expense is recorded and with how other costs and revenues are calculated for 10
both MPSC reporting and ratemaking. The Company determines uncollectible 11
accounts expense based on an accrual method as required by the Uniform System of 12
Accounts (USofA); General Instruction number 11. Rates are set to cover the 13
Company’s expenses expected to be recorded for account purposes. The estimation 14
of future expenses should therefore be consistent with the practice used to record the 15
actual expenses to ensure recovery of the Company’s prudent and reasonable costs. 16
An average of the amounts charged to account 904 provides such consistency. In 17
addition, the cash-basis method does not factor in special circumstances that are 18
accounted for under the accrual method. For example, the write-off of some 19
accounts is delayed because they are being disputed or negotiated and need to show 20
as open in the billing system until a final decision is made. Another example is the 21
decision to temporarily suspend disconnects during 2020 due to the pandemic which 22
drove a significant temporary decline in write-offs. The balances in these examples 23
are expected to be charged-off, so under the Company’s accrual method they are 24
fully reserved. These situations would not be reflected in the cash basis method. In 25

T. D. JOHNSON Line U-20836 No.
TDJ-23
addition, direct charges relating to the Company’s forgiveness match to low-income 1
customers (Low Income Self Sufficiency Program (LSP) and Low-Income Home 2
Energy Assistance Program (LIHEAP) support), must be included in uncollectible 3
expense. These direct charges related to customer assistance are not accounted for 4
as write-offs; however, they are included in uncollectable expense and reduce the 5
probability that these customers will be disconnected, and the associated balances 6
will be written-off. 7
8
Q56. What is the Company’s historical net Charge-offs from 2017-2020? 9
A56. The figure below provides the net Charge-offs from 2017-2020 10
11
Figure 2 Net Charge-offs (2017-2019) 12
Q57. What events may impact uncollectibles in the projected test period? 13
A57. There are many factors that could impact or influence uncollectibles during the 14
projected test period. Though we continue to utilize our partnerships to take 15
advantage of all funding opportunities for our customers, unemployment rates, the 16
ending of extended benefits and eviction moratorium, all could impact 17
uncollectibles. Without continued state and federal assistance as provided in the 18
CARES Act and the Coronavirus Response and Relief Supplement Appropriations 19
Act of 2021, there is the potential that bad debt could materially increase. 20

T. D. JOHNSON Line U-20836 No.
TDJ-24
1
Q58. What efforts will the Company employ in anticipation of the reduction of 2
COVID-19 relief? 3
A58. The Company is focusing strategies on collection reform, energy assistance 4
optimization, and refinement of COVID-19 programs that were offered in 2020. Our 5
Customer Advocacy team is developing targeted proactive outreach to drive income 6
challenged customers to existing energy assistance programs through United Way 7
211. Additionally, to continue driving arrears reduction and accessibility to energy 8
assistance, we are leveraging our existing processes and targeted proactive outreach 9
initiatives for income-challenged customers. Those activities include: 10
• Outbound call campaign to SPP customers for SER application assistance 11
• Automated letter campaign to motivate potentially energy assistance eligible 12
customers to seek assistance early to avoid service interruption 13
• Email blasts to past recipients of SER funding 14
• Email outreach to customers receiving Notice of Intent (NOI) letters 15
Accessibility tactics will focus on strategies around expanding the SER application 16
process and community partnerships involving virtual webinars to raise awareness 17
and virtual CADs to promote MEAP and other energy assistance. Understanding the 18
possible mail delivery delays through the United States Postal Service (USPS), the 19
proactive NOI email initiative will notify customers more quickly and will help to 20
prevent service interruption. 21
22
Q59. Does this complete your direct testimony? 23
A59. Yes, it does. 24

STATE OF MICHIGAN
BEFORE THE MICHIGAN PUBLIC SERVICE COMMISSION
In the matter of the Application of ) DTE ELECTRIC COMPANY ) for authority to increase its rates, amend ) Case No. U-20836 its rate schedules and rules governing the ) distribution and supply of electric energy, and ) for miscellaneous accounting authority. )
QUALIFICATIONS
AND
DIRECT TESTIMONY
OF
THOMAS W. LACEY

DTE ELECTRIC COMPANY QUALIFICATIONS AND DIRECT TESTIMONY OF THOMAS W. LACEY
Line No.
TWL-1
Q1. What is your name, business address and by whom are you employed?1
A1. My name is Thomas W. Lacey (he/him/his). My business address is One Energy 2
Plaza, Detroit, Michigan, 48226. I am employed by DTE Energy Corporate 3
Services, LLC (DTE Energy or DTE) as a Principal Financial Analyst in the 4
Revenue Requirements Department of the Regulatory Affairs Organization. 5
6
Q2. On whose behalf are you testifying? 7
A2. I am testifying on behalf of DTE Electric Company (DTE Electric or the Company). 8
9
Q3. What is your educational background and business experience? 10
A3. I received a Bachelor of Science Degree in Accounting from Michigan State 11
University in 1981 and a Master’s in Business Administration from Wayne State 12
University in 1992. From 1982 until 2001, I was employed by ANR Pipeline 13
Company (ANR) in the Rates and Regulatory Affairs department. I had several 14
positions of increasing responsibilities within the Rates area, ultimately rising to 15
the position of Senior Rates Analyst. During my nineteen years with ANR, I 16
worked on numerous rate proceedings and filings before the Federal Energy 17
Regulatory Commission (FERC) including rate cases (FERC Docket Nos. RP82-18
80, RP83-79, RP86-169, RP89-161, RS92-1 and RP94-43). My work was 19
primarily in the areas of cost-of-service and rate design. In 2002, I joined DTE as 20
a Financial Analyst in the Load Research department of Regulatory Affairs. I 21
worked in Load Research until December 2005. My responsibilities within Load 22
Research included extensive work on the 2003 Michigan Consolidated Gas 23
Company (MichCon) rate case (U-13898) and The Detroit Edison Company 24
(Detroit Edison) rate filings. In December 2005, I accepted my current position. 25

T. W. LACEY Line U-20836 No.
TWL-2
1
Q4. What are your responsibilities as a Principal Financial Analyst for both DTE 2
Electric and DTE Gas? 3
A4. As a Principal Financial Analyst, my responsibilities include the preparation of 4
revenue requirements, cost of service and rate design, testimony, exhibits and 5
workpapers, in cases for both DTE Gas and DTE Electric. 6
7
Q5. Have you previously sponsored testimony in cases before the Michigan Public 8
Service Commission (MPSC or Commission)? 9
A5. Yes, I have. I have sponsored testimony in the following cases: 10
U-13898 MichCon’s 2006 Uncollectible Expense True-up Mechanism and 11
Safety and Training Related Expenditure Report 12
U-15985 MichCon’s 2009 General Rate Case Proceeding 13
U-16290 Reconciliation of MichCon’s 2010 Energy Optimization (EO) 14
Program 15
U-16730 MichCon’s 2011 Updated Energy Optimization Plan 16
U-16751 Reconciliation of the MichCon 2011 EO Program 17
U-16999 MichCon 2011 General Rate Case Proceeding 18
U-17288 Reconciliation of the DTE Gas 2012 EO Program 19
U-17602 Reconciliation of the DTE Electric 2013 EO Program 20
U-17608 Reconciliation of the DTE Gas 2013 EO Program 21
U-17632 Reconciliation of the DTE Electric 2013 REP Program 22
U-17762 DTE Electric 2016/2017 Energy Optimization Plan 23
U-17763 DTE Gas 2016/2017 Energy Optimization Plan 24
U-17804 Reconciliation of the DTE Electric 2014 REP Program 25

T. W. LACEY Line U-20836 No.
TWL-3
U-17832 Reconciliation of the DTE Electric 2014 EO Program 1
U-17841 Reconciliation of the DTE Gas 2014 EO Program 2
U-18014 DTE Electric General Rate Case Proceeding 3
U-18111 DTE Electric REP Plan Proceeding 4
U-18232 DTE Electric REP (2018) Amended Plan Proceeding 5
U-18232 DTE Electric REP (2020) Amended Plan Proceeding 6
U-18248 DTE Electric Capacity Charge 7
U-18255 DTE Electric General Rate Case Proceeding 8
U-20029 Reconciliation of the DTE Electric 2017 EWR Program 9
U-20035 Reconciliation of the DTE Gas 2017 EWR Program 10
U-20105 DTE Electric Tax Credit A Proceeding 11
U-20162 DTE Electric General Rate Case Proceeding 12
U-20172 Reconciliation of the DTE Electric 2017 REP Program 13
U-20366 Reconciliation of the DTE Electric 2018 EWR Program 14
U-20369 Reconciliation of the DTE Gas 2018 EWR Program 15
U-20561 DTE Electric General Rate Case Proceeding 16
U-20723 Reconciliation of the DTE Electric 2019 REP Program 17
U-20851 DTE Electric REP (August 2020) Amended Plan Proceeding 18
U-20866 Reconciliation of the DTE Electric 2020 EWR Program 19
U-20871 Reconciliation of the DTE Gas 2020 EWR Program 20
U-21010 Reconciliation of the DTE Electric 2020 REP Program 21
22
Q6. Have you previously testified or submitted testimony in any other regulatory 23
proceedings? 24

T. W. LACEY Line U-20836 No.
TWL-4
A6. Yes. I sponsored testimony in ANR’s general rate case in FERC Docket No. RP94-1
43. I testified at a hearing before the FERC in Docket No. RP94-43. 2

T. W. LACEY Line U-20836 No.
TWL-5
Purpose of Testimony 1
Q7. What is the purpose of your testimony?2
A7. The purpose of my testimony is to support the revenue requirements by 3
unit/grouping study (Plant Study) which is being filed in compliance with the 4
Commission’s May 8, 2020 Order in DTE Electric’s last main rate case (Case No. 5
U-20561). The May 8, 2020 order at pages 220-1 states: “the Commission agrees 6
with the ALJ’s determination that the company should provide revenue 7
requirements by plant/unit in its next general rate case. If some or all necessary data 8
is unavailable by plant/unit, DTE Electric should, in consultation with Staff, 9
determine a reasonable method for allocating the available data to plant/units, and 10
provide explanations and evidentiary support in its next rate case filing.” 11
12
Q8. Did you meet with the Commission’s Staff on the methods you used to allocate 13
costs to the plant/units? 14
A8. Yes. Staff’s recommendations are incorporated into Exhibit A-32 15
16
Q9. Are you sponsoring any exhibits in this proceeding?17
A9. Yes. I am sponsoring the following exhibits: 18
Exhibit Schedule Description 19
A-32 W1 Production COSS by Unit/Grouping 20
21
Q10. Was this exhibit prepared by you or under your direction? 22
A10. Yes, it was. 23
24
Q11. What does Exhibit A-32 show?25

T. W. LACEY Line U-20836 No.
TWL-6
A11. Exhibit A-32 shows the revenue requirements, based on the Plant Study, by 1
unit/grouping, as required in the Commission’s May 8, 2020 order in Case No. U-2
20561. The total forecasted production costs shown in column (a) of Exhibit A-32, 3
matches, line by line, column (a) of Exhibit A-16, Schedule F1.1,the Company’s 4
forecasted production unbundled cost of service (UCOS), supported by Company 5
Witness Maroun. The amounts in column (a) of Exhibit A-32 are allocated to DTE 6
Electric’s forty-two (42) production generation unit/groupings, in columns (b) 7
through (as) on Exhibit A-32. The line items in total on Exhibit A-32 match the 8
same line items on Exhibit A-16, Schedule F1.1 in the Company’s UCOS. 9
10
Q12. Does DTE Electric own any generation resources not included in Exhibits A-11
16 and A-32?12
A12. Yes. The costs associated with Renewable Energy Plan (REP) assets are not 13
included in the Company’s UCOS, as they are included in the Company’s REP 14
filings, and as a result are not reflected on Exhibit A-32. 15
16
Q13. What sources of information did you rely on to determine the revenue 17
requirement by plant/unit?18
A13. The inputs for the Plant Study rely on a combination of historic amounts, and 19
forecasted amounts from the projected bridge period and test year in this 20
proceeding. Primarily I relied upon: (1) 2020 historical actual amounts for plant, 21
accumulated reserve, depreciation expense and property taxes, determined by the 22
Company’s Asset Management and Tax departments, and (2) forecasted amounts 23
reflected in the various capital, O&M, and financial exhibits supported in this 24

T. W. LACEY Line U-20836 No.
TWL-7
instant case, as more fully described by Company Witness Uzenski in her direct 1
testimony in this case. 2
3
Q14. Can you describe how you developed the Plant Study?4
A14. I began with Exhibit A-16, Schedule F1.1 from the Company’s UCOS. This exhibit 5
is developed by various workpapers, which allocates the various cost, expense and 6
revenue items to rate classes in the Company’s UCOS. I used the Production UCOS 7
workpaper produced by Witness Maroun, but instead of allocating costs to rate 8
classes like in a typical UCOS, I allocated these same costs to the forty-two 9
generation units/groupings (17 steam/fossil units, 1 nuclear unit, 1 hydro unit, 21 10
peaker/other units, Midwest Energy Resource Company (MERC), and 11
Transmission). 12
13
Q15. How did you determine how much to allocate to each generation unit?14
A15. I performed the allocations in various steps. The Company’s breaks costs into five 15
sub-groups based on the MPSC Uniform System of Accounts (USofA): Steam, 16
Nuclear, Hydraulic, Other and Transmission. I assign the costs directly related to 17
plant for each generation type (Steam, Nuclear, Hydraulic, Other and 18
Transmission) to the corresponding group of units of the appropriate type. Next, I 19
allocate the costs amongst the units within each type. 20
21
Q16. How did you allocate plant-related costs to the 17 steam units?22
A16. In general, I first started with actual 2020 plant, accumulated reserve, and 23
depreciation expenses by unit, supplied to me by the Company’s Asset 24
Management group. Second, I determined by plant, the projected changes for these 25

T. W. LACEY Line U-20836 No.
TWL-8
items as reflected in Exhibit A-12, Schedule B5.1, pages 2 and 3 and added them 1
to the 2020 amounts. However, Exhibit A-12, Schedule B5.1, pages 2 and 3, does 2
not breakout capital expenditures by unit. Therefore, I split the plant amounts, by 3
unit, by using ratios based on the project list on page 4 of Schedule B5.1, which 4
does show projects by unit. Next, I adjusted the by amounts on B5.1 page 3, as 5
follows: 85% was added to plant and 15% to accumulated reserve. These 6
adjustments were necessary, to match the plant and accumulated reserve balances 7
reflected in the Company’s UCOS. The capital expenditures reflected on Exhibit 8
A-12, Schedule B5.1 page 2 required no adjustment because it had no adjustment 9
in the balances reflected in the Company’s UCOS. Finally, I reduced the by unit 10
amounts for projected retirements, as reflected in the Company’s reflected in the 11
various capital and financial exhibits supported in this instant case, including the 12
projected retirements of the St, Clair and Trenton plants and the securitization of 13
the River Rouge plant. 14
15
Q17. How did you allocate the plant-related costs to the 21 peaker/other units? 16
A17. Generally, in the same manner as the steam units as described above, except that 17
Exhibit A-12, Schedule B5.1 pages 2 and 3, does not breakout peaker costs by plant, 18
so I used ratios based on the project list on page 4 of Schedule B5.1, which does 19
show peaker/other projects by plant. 20
21
Q18. How did you allocate General and Intangible (G&I) plant related costs to the 22
42 generation units/groupings? 23
A18. G&I plant related costs were allocated to the 42 generation groupings based on a 24
ratio of the direct total projected plant balance. 25

T. W. LACEY Line U-20836 No.
TWL-9
1
Q19. How did you allocate Construction Work in Progress (CWIP) to the 42 2
generation units/groupings? 3
A19. CWIP is projected in a manner like plant, into Steam, Nuclear, Hydraulic, Other 4
and Transmission. Nuclear, Hydraulic, and Transmission were directly assigned in 5
the Plant Study; Steam and Other were allocated based on direct plant ratios. 6
7
Q20. How did you allocate revenues to the 42 generation units/groupings? 8
A20. In various ways. Other revenues were allocated based on direct plant. Revenue from 9
Electricity Sales was allocated in order to result in a uniform rate of return for each 10
generation unit/grouping. Specifically, I allocated revenue to each generation unit 11
based on its expenses, net of revenue credits and AFUDC, times that unit’s 12
proportion of total rate base times total revenue minus total expenses minus total 13
revenue credits and AFUDC. In other words, I assigned the remainder of the 14
revenue requirement needed after accounting for total expenses and AFUDC, in 15
order to produce a net operating income that results in a uniform rate of return for 16
each generation unit/grouping. 17
18
Q21. How did you allocate taxes to the 42 generation units/groupings? 19
A21. In various ways. For example, property taxes were allocated based on projected 20
direct plant. Income taxes were allocated on each unit’s rate base. Payroll taxes 21
were allocated on each unit’s direct labor cost. Property taxes were allocated on 22
ratios based on actual 2020 property taxes by plant, as calculated by the Company’s 23
Tax Department. 24
25

T. W. LACEY Line U-20836 No.
TWL-10
Q22. How did you allocate working capital to the 42 generation units/groupings? 1
A22. Working capital items were allocated by four different methods: direct assignment, 2
direct plant ratios, historic direct labor ratios and net plant by unit. 3
4
Q23. How did you allocate Operation and Maintenance (O&M) expenses to the 42 5
generation units/groupings? 6
A23. Like plant, direct O&M is projected in the financial model using the MPSC 7
Uniform System of Accounts which facilitates assigning costs by generation type 8
and Transmission. I assign the O&M expenses for each generation type (Steam, 9
Nuclear, Hydraulic, and Other) to the corresponding group of units of the 10
appropriate type. Next, I allocate the costs amongst the units within each type. 11
Steam O&M expenses were allocated based on historic O&M ratios, excluding 12
plants that will be retired, during the bridge and projected test periods. Other O&M 13
expenses were allocated based on projected direct plant ratios. 14
15
Q24. How did you allocate fuel expenses to the 42 generation units/groupings? 16
A24. Fuel expenses are projected in manner like plant; into Steam, Nuclear, Hydraulic, 17
and Other (Peakers). Nuclear, and Hydraulic (which has a $0 fuel cost in the 18
UCOS) were directly assigned, Steam and Other fuel expenses were allocated based 19
on historic 2020 fuel costs, except fuel expenses for BWEC. Fuel for BWEC was 20
imputed, as BWEC was not in operation in 2020. 21
22
Q25. How did you allocate purchased power expenses to the 42 generation 23
units/groupings? 24

T. W. LACEY Line U-20836 No.
TWL-11
A25. Since purchased power is not projected in manner like plant or fuel; into Steam, 1
Nuclear, Hydraulic, and Other (Peakers). I used the projected plant allocator as a 2
default allocator for purchased power. 3
4
Q26. How did you allocate Administrative and General O&M expenses to the 42 5
generation units? 6
A26. Administrative and General O&M expenses were allocated based on direct historic 7
labor ratios. 8
9
Q27. Does this conclude your direct testimony? 10
A27. Yes, it does. 11

STATE OF MICHIGAN
BEFORE THE MICHIGAN PUBLIC SERVICE COMMISSION
In the matter of the Application of )
DTE ELECTRIC COMPANY )
for authority to increase its rates, amend ) Case No. U-20836
its rate schedules and rules governing the )
distribution and supply of electric energy, and )
for miscellaneous accounting authority. )
QUALIFICATIONS
AND
DIRECT TESTIMONY
OF
ROBERT J. LEE

DTE ELECTRIC COMPANY
QUALIFICATIONS AND DIRECT TESTIMONY OF ROBERT J. LEE
Line
No.
RJL-1
What is your name, business address and by whom are you employed? 1
A1. My name is Robert J. Lee (he/him/his) and my business address is One Energy 2
Plaza, Detroit, Michigan 48226-1279. I am employed by DTE Energy Corporate 3
Services, LLC as Manager of Environmental Management and Safety and am 4
currently the Manager of Environmental Strategy for the Company. 5
6
On whose behalf are you testifying? 7
A2. I am testifying on behalf of DTE Electric. 8
9
What is your educational and work background? 10
A3. I received a Bachelor of Science Degree in Geology in 1992 and a Master of Science 11
Degree in Environmental Geochemistry in 1994 from the University of Wales. Since 12
completing my formal education, I have practiced continuously in the environmental 13
field with a focus on State and Federal programs mostly in Michigan. My past and 14
current responsibilities include management of several State and Federal 15
environmental programs, including Effluent Limitations Guidelines (ELG), Coal 16
Combustion Residual (CCR), remediation program management, State and Federal 17
construction permit programs, and coal plant retirement. Additionally, I have State 18
and Federal level experience supporting and developing legislative and rule-19
making initiatives. 20
21
What are your current job responsibilities? 22
A4. I have worked for DTE Energy for 17 years. I am currently the Manager of 23
Environmental Strategy and my focus is on complex and strategic environmental 24
initiatives that are critical to DTE. In this role I focus on environmental strategy, 25

R. J. LEE
Line U-20836
No.
RJL-2
policy, and regulatory development and am responsible for key environmental 1
programs at the State and Federal level that are critical to the Company’s 2
compliance, strategic direction, and generation strategy. I am responsible for the 3
Company’s strategy and approach for compliance with the CCR and ELG 4
programs, coal plant retirement, asset reuse, and waste program. 5
6
What was your professional experience prior to joining DTE Energy? 7
A5. From 1994 to 2004, I worked in the environmental consulting and environmental 8
engineering fields in several different capacities, and in roles with progressively 9
increasing responsibilities. During this time, I was a Project Manager of complex 10
multi-media environmental projects. I managed a wide variety of projects for 11
various industries focusing on remediation project management, solid waste 12
compliance and project management, National Pollutant Discharge Elimination 13
System (NPDES) permit management, and obtaining and managing State and 14
Federal permits. I also performed complex multi-site due diligence and liability 15
management. I worked for a variety of industries including utility, cement 16
production, and landfill industry sectors. 17
18
Have you previously sponsored testimony before the Michigan Public Service 19
Commission (MPSC or Commission)? 20
A6. Yes. I have sponsored testimony in the following cases: 21
U-16999 2012 DTE Gas General Rate Case 22
U-17999 2015 DTE Gas General Rate Case 23
U-20642 2019 DTE Gas General Rate Case 24
U-20940 2021 DTE Gas General Rate Case 25

R. J. LEE
Line U-20836
No.
RJL-3
Purpose of Testimony 1
What is the purpose of your testimony? 2
A7. I will describe the status of two significant Environmental Protection Agency 3
(EPA) regulations, the Steam Electric Effluent Limitation Guidelines (ELG) Rule 4
and the Coal Combustion Residuals (CCR) Rule, which impact the Company’s 5
coal-fired power plants. 6
7
Are you sponsoring any exhibits? 8
A8. I am supporting the following exhibit: 9
Exhibit Schedule Description 10
A-12 B5.1.1 Coal Combustion Residual Unit Closures 11
12
Was this exhibit prepared by you or under your direction? 13
A9. Yes, it was. 14
15
Is the Company requesting recovery of capital expenditures associated with 16
compliance to upcoming EPA regulations? 17
A10. Yes. As shown in Company Witness Morren’s Exhibit A-12, Schedule B5.1, the 18
Company is in the process of developing and implementing several ELG and CCR 19
compliance projects including: 20
• Monroe Dry Fly Ash Conversion (ELG) 21
• Monroe Bottom Ash Conversion (ELG) 22
• Monroe FGD Wastewater (ELG) 23
• Sibley Quarry Landfill Modification (CCR) 24
• Monroe Bottom Ash Basin Closure (CCR) 25
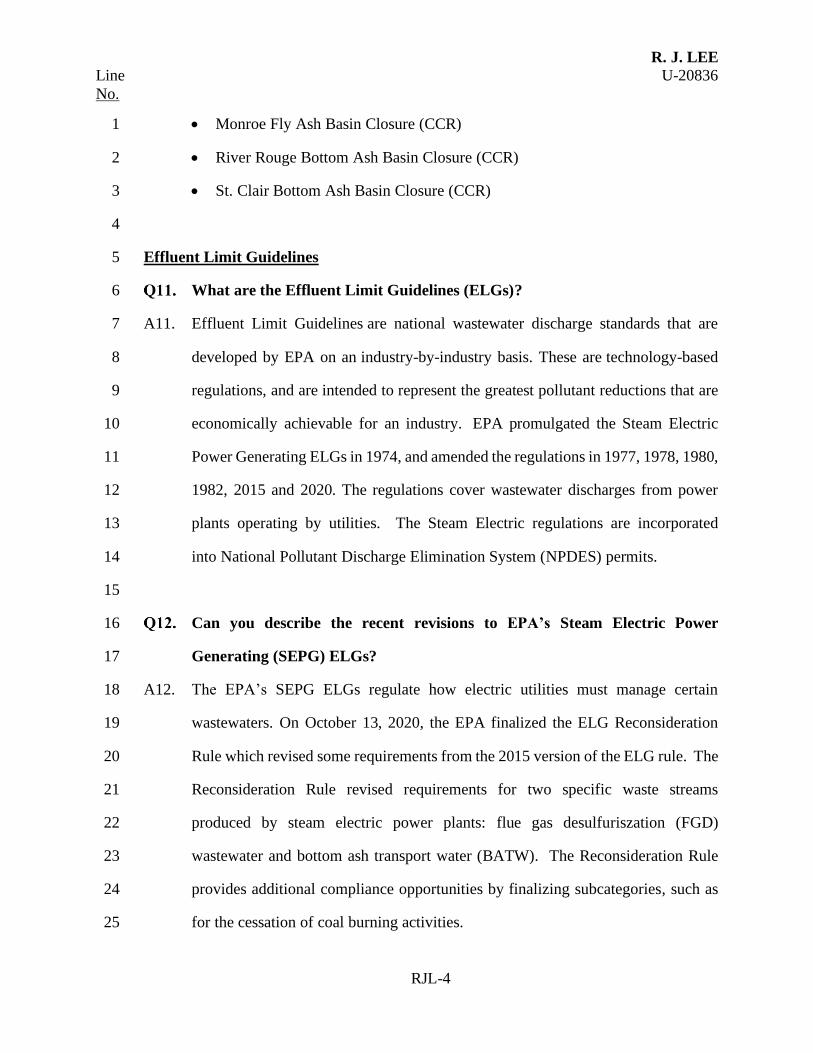
R. J. LEE
Line U-20836
No.
RJL-4
• Monroe Fly Ash Basin Closure (CCR) 1
• River Rouge Bottom Ash Basin Closure (CCR) 2
• St. Clair Bottom Ash Basin Closure (CCR) 3
4
Effluent Limit Guidelines 5
What are the Effluent Limit Guidelines (ELGs)? 6
A11. Effluent Limit Guidelines are national wastewater discharge standards that are 7
developed by EPA on an industry-by-industry basis. These are technology-based 8
regulations, and are intended to represent the greatest pollutant reductions that are 9
economically achievable for an industry. EPA promulgated the Steam Electric 10
Power Generating ELGs in 1974, and amended the regulations in 1977, 1978, 1980, 11
1982, 2015 and 2020. The regulations cover wastewater discharges from power 12
plants operating by utilities. The Steam Electric regulations are incorporated 13
into National Pollutant Discharge Elimination System (NPDES) permits. 14
15
Can you describe the recent revisions to EPA’s Steam Electric Power 16
Generating (SEPG) ELGs? 17
A12. The EPA’s SEPG ELGs regulate how electric utilities must manage certain 18
wastewaters. On October 13, 2020, the EPA finalized the ELG Reconsideration 19
Rule which revised some requirements from the 2015 version of the ELG rule. The 20
Reconsideration Rule revised requirements for two specific waste streams 21
produced by steam electric power plants: flue gas desulfuriszation (FGD) 22
wastewater and bottom ash transport water (BATW). The Reconsideration Rule 23
provides additional compliance opportunities by finalizing subcategories, such as 24
for the cessation of coal burning activities. 25

R. J. LEE
Line U-20836
No.
RJL-5
When does DTE need to comply with revised ELGs? 1
A13. The Reconsideration Rule provides new opportunities for DTE Electric to evaluate 2
existing ELG compliance strategies and make any necessary adjustments to ensure 3
full compliance with the ELGs in a cost-effective manner. The EPA set the 4
applicability dates for BATW and FGD wastewater retrofits to be "as soon as 5
possible" beginning October 13, 2021, and no later than December 31, 2025. For 6
facilities pursuing the FGD wastewater Voluntary Incentives Program, detailed 7
further below, compliance shall be achieved no later than December 31, 2028. 8
Compliance schedules for individual facilities and individual waste streams are 9
determined through issuance of new NPDES permits by the State of Michigan. 10
11
What are DTE’s options for ELG compliance? 12
A14. The Company has two options to achieve compliance under the Reconsideration 13
Rule for BATW and FGD wastewater. The first option is to design and engineer 14
new technologies that are compliant with the ELG requirements for BATW and 15
FGD wastewater. The second option is to pursue a compliance subcategory for 16
BATW and FGD wastewater that EPA has established within the Reconsideration 17
Rule. One compliance subcategory would allow for companies to attain compliance 18
with the ELGs for both BATW and FGD wastewater by ceasing coal burning 19
activities, which includes retiring coal-fired unit(s), or converting unit(s) to other 20
fuels. If companies are willing to certify that unit(s) will retire the use of coal or 21
refuel, they can continue to operate those units until their specified coal retirement 22
date, which is required to be before December 31, 2028. For the electrical 23
generating unit(s) that certify under this subcategory, companies will need to 24

R. J. LEE
Line U-20836
No.
RJL-6
maintain the existing standard limits already in effect for BATW and FGD 1
wastewater discharges. 2
3
In addition to the cessation of coal burning activities subcategory, the 4
Reconsideration Rule also provides a compliance subcategory specific to FGD 5
wastewater. The Reconsideration Rule established Best Available Technology 6
(BAT) standard discharge limits for FGD wastewater discharges, and further, 7
finalized a subcategory called the Voluntary Incentive Program (VIP). Under the 8
VIP, companies may choose to meet more stringent effluent limits established by 9
EPA based on the model technology of membrane filtration or zero-liquid 10
discharge. If a company chooses the VIP option, then the applicability date for FGD 11
wastewater compliance will be December 31, 2028. 12
13
To establish compliance for either of the subcategories detailed previously, 14
companies were required to submit a Notice of Planned Participation (NOPP) to 15
the state permitting agency (Environment, Great Lakes & Energy [EGLE]) by 16
October 13, 2021. Once submitted, companies are required to submit annual 17
progress reports to EGLE to ensure the commitment of compliance under the 18
subcategories. 19
20
Can you describe the NOPP filing? 21
A15. To establish compliance for the compliance subcategories detailed above, 22
companies were required to submit an NOPP to the state permitting agency (EGLE) 23
by October 13, 2021. 24
25

R. J. LEE
Line U-20836
No.
RJL-7
The cessation of coal NOPP included: (1) identification of the electric generating 1
unit (EGU) intended to achieve permanent cessation of coal combustion; (2) 2
expected date that each EGU is projected to achieve permanent cessation of coal 3
combustion; (3) whether each date represents a retirement or a fuel conversion; (4) 4
whether each retirement or fuel conversion has been approved by a regulatory body; 5
and (5) identification of the relevant regulatory body. In addition, the NOPP must 6
include a copy of the most recent Integrated Resource Plan (IRP) for which the 7
applicable state agency approved the retirement or repowering of the unit subject 8
to the ELGs, certification of EGU cessation under the CCR rule, or other 9
documentation supporting that the EGU will permanently cease the combustion of 10
coal by December 31, 2028. The NOPP must include, for each such EGU, a 11
timeline to achieve the permanent cessation of coal combustion. Each timeline 12
must include interim milestones and the projected dates of completion. A cessation 13
of coal NOPP was submitted for Belle River Power Plant. 14
15
The VIP NOPP for FGD wastewater included: (1) Identification of the facility 16
opting to comply with the VIP discharge requirements; (2) Specify what 17
technology or technologies are projected to be used to comply with those 18
requirements; (3) Provide a detailed engineering dependency chart and 19
accompanying narrative demonstrating when and how the system(s) and any 20
accompanying disposal requirements will be achieved by December 31, 2028. A 21
VIP NOPP was submitted for Monroe Power Plant. 22
23
24
25

R. J. LEE
Line U-20836
No.
RJL-8
What is DTE Electric’s compliance strategy for Belle River Power Plant? 1
A16. At Belle River Power Plant, fly ash is currently collected dry and therefore there 2
are no Fly Ash Transport Water (FATW) implications. Additionally, the power 3
plant was constructed and operates without FGDs, therefore, there is no FGD 4
wastewater. However, the bottom ash is currently collected using transport water 5
and the ELG Reconsideration Rule requires the Company to achieve compliance 6
with BATW discharge requirements. DTE submitted the NOPP for cessation of 7
coal at Belle River Power Plant on October 13, 2021. Please see Company Witness 8
Morren’s testimony for pathways the Company is considering for Belle River 9
Power Plant ELG compliance. 10
11
What is DTE Electric’s compliance strategy for Monroe Power Plant? 12
A17. At the Monroe Power Plant, the Company is currently implementing projects for 13
FATW ELG compliance according to the 2015 ELG Rule that will allow the plant 14
to continue operating beyond 2023. For BATW wastewater ELG compliance, the 15
Company will achieve compliance by the end of 2025. For FGD wastewater ELG 16
compliance, the Company will achieve compliance based on one of two compliance 17
options detailed above. If a BAT is selected, compliance must be achieved by 18
December 31, 2025. If a technology that qualifies for the VIP is selected, 19
compliance must be achieved by December 31, 2028. DTE submitted the NOPP 20
for the VIP at Monroe Power Plant on October 13, 2021. Please see Company 21
Witness Morren’s testimony for pathways the Company is considering for Monroe 22
Power Plant ELG compliance. 23
24

R. J. LEE
Line U-20836
No.
RJL-9
The ELG rule does not impact the Tier 2 plants as River Rouge power plant retired 1
in 2021, and St. Clair and Trenton Channel Power Plants will retire by 2022. 2
3
Coal Combustion Residuals 4
Can you describe the EPA’s Coal Combustion Residuals (CCR) Rule and its 5
impact on the Company’s coal-fired units? 6
A18. The EPA’s CCR Rule regulates how electric utilities must manage and dispose of 7
coal combustion residuals in landfills and impoundments. On August 28, 2020, the 8
EPA published an amendment to the CCR rule (the Part A Rule) that requires all 9
unlined surface impoundments to cease receipt of waste and initiate closure as soon 10
as technically feasible but by no later than April 11, 2021. The August 28, 2020 11
amendment also provided utilities the ability to request site-specific alternative 12
closure deadlines through a demonstration process to obtain EPA approval. On 13
November 12, 2020, EPA published an additional amendment to the CCR rule (the 14
Part B Rule) that allows utilities the opportunity to demonstrate that their unlined 15
surface impoundments have an alternate liner system that is as protective as a CCR 16
rule compliant liner system. The demonstration processes included in the Part A 17
Rule and Part B Rule require EPA approval to continue operating the companies 18
unlined CCR surface impoundments. 19
20
Can you describe the Company’s strategy to comply with the amended closure 21
provisions of the CCR Rule? 22
A19. The Company has submitted a Part A Rule demonstration for St. Clair Bottom Ash 23
Basins, requesting an alternative closure deadline based on cessation of coal fired 24
generation in spring of 2022, and a commitment to complete closure of the unit by 25

R. J. LEE
Line U-20836
No.
RJL-10
October 17, 2023. The company has submitted Part B applications to perform 1
Alternate Liner Demonstrations for Monroe Fly Ash Basin, Belle River Bottom 2
Ash Basins, and Belle River Diversion Basin. The EPA is currently reviewing the 3
submittals, the outcome of their review will determine the timeline for closure of 4
these unlined surface impoundments. 5
6
As shown in Company Witness Morren’s testimony, the Company is closing and 7
has removed all ash from the River Rouge Bottom Ash Basin, which requires 8
groundwater remediation before the closure can be considered complete. The 9
company is currently closing the Monroe Bottom Ash Basin by removal of all ash 10
and making infrastructure improvements at Sibley Quarry Landfill to enhance the 11
storage capability to be able to accept the CCR material coming from the Monroe 12
Bottom Ash Basin. 13
14
Closure of the River Rouge and Monroe Bottom Ash Basins were initiated in 15
accordance with the timeline required by the CCR rule, and closure is required to 16
be complete within five years (with the opportunity for five 2-year extensions if 17
necessary). 18
19
The Company’s coal ash landfills—Range Road Landfill, Monroe CCR Landfill, 20
and Sibley Quarry Landfill, will continue to receive CCR through the active life of 21
the respective power plants that deposit ash at these locations. The above 22
mentioned landfills will be closed in place by installing cover material over the ash 23
deposits at the end of their active life. 24
25

R. J. LEE
Line U-20836
No.
RJL-11
CCR Unit Expenditures 1
How is the Company addressing the Commission’s request as noted on page 2
75 in MPSC Case No. U-20561 for a more holistic presentation of CCR-related 3
project components, costs, and timing in this case? 4
A20. The Company is providing details on the historic and the projected expenditures 5
required to comply with CCR regulations at Company facilities. Expected timing 6
and preliminary cost projections for CCR-related projects are shown in more detail 7
in this attached Exhibit A-12 Schedule B5.1.1. Additionally, Company Witness 8
Uzenski provides details on the recovery of CCR-related costs through regulated 9
rates in Exhibit A-30 Schedule U-1 and discussed in her testimony. 10
11
What information are you presenting in this case related to CCR expenses and 12
projects? 13
A21. The Company is providing details on the historic and the projected expenditures 14
required to comply with CCR regulations at Company facilities. 15
16
Please provide additional details on Company CCR expenditures. 17
A22. Attached Exhibit A-12 Schedule B5.1.1 provides the historic and projected CCR 18
O&M and capital expenditures at the Company’s ten (10) CCR sites. Those ten 19
sites include the bottom ash basins at Belle River, Monroe, River Rouge, and St. 20
Clair Power Plants, the St. Clair Scrubber Basin, the Belle River diversion basin, 21
the Monroe Fly Ash Impoundment, and the landfills at Range Road, Sibley Quarry, 22
and Monroe. 23
24
25

R. J. LEE
Line U-20836
No.
RJL-12
What capital expenditures are shown in Exhibit A-12 Schedule B5.1.1? 1
A23. Actual and projected CCR facility closure cost expenditures are shown in columns 2
f, g, and h of Exhibit A-12 Schedule B5.1.1. For those facilities closing by removal, 3
the capital expenditures reflect dewatering the basins and excavating and disposing 4
of the CCR material. For those facilities closing in-place, the capital expenditures 5
reflect capping the facility with clay, soil, and vegetation; and for Sibley Quarry, 6
also include projected capital expenditures for installation of subsequent chimney 7
drain lifts. It should be noted that these capital expenditures are being provided for 8
time periods beyond those relevant to this rate case proceeding and conform to the 9
requirements of the Commission Order in Case No. U-20561. 10
11
What O&M expenditures are shown in Exhibit A-12 Schedule B5.1.1? 12
A24. Historic and projected test period O&M costs are shown for each CCR site. Beyond 13
the date of site closure, forecasted O&M costs for ongoing monitoring and site 14
preservation are also provided, in addition to O&M costs for remediation that are 15
accounted for in environmental reserve accounts. 16
17
What does the environmental reserve represent in Exhibit A-12 Schedule 18
B5.1.1? 19
A25. The Company has two environmental reserves associated with CCR expenses. At 20
River Rouge, an environmental reserve addresses the liability to remedy 21
groundwater contamination at the River Rouge Bottom Ash Basin. Groundwater 22
remediation is required by the corrective action and closure sections of the CCR 23
rule. Groundwater concentrations must meet the groundwater protection standards 24
established for the unit in order to fully certify the closure of the basin under the 25

R. J. LEE
Line U-20836
No.
RJL-13
CCR rule. At Range Road Landfill, an environmental reserve addresses 1
groundwater contamination at the landfill. Groundwater remediation at Range 2
Road Landfill is required by Part 115 of the Natural Resources and Environmental 3
Protection Act of 1994, as amended. The groundwater is managed through an 4
EGLE approved Remedial Action Plan that includes operation and maintenance of 5
two french drain systems to capture off-site shallow groundwater to the northwest, 6
northeast, and east of the landfill. 7
8
How did the Company develop forecasts for future CCR-related costs that in 9
some cases will not come to fruition for more than 20 years? 10
A26. Forecasted capital expenditures are best estimates of site modifications required to 11
meet currently known State and Federal regulations. O&M expenditures are based 12
on current costs to operate CCR sites and engineering judgement of future site 13
preservation and monitoring costs. 14
15
Are other Company witnesses providing CCR-related information? 16
A27. Yes. Company Witness Uzenski provides details on the recovery of CCR-related 17
costs through regulated rates. Additionally, Company Witness Morren describes 18
CCR-related projects and supports the corresponding costs. 19
20
Does this complete your direct testimony? 21
A28. Yes, it does. 22

STATE OF MICHIGAN
BEFORE THE MICHIGAN PUBLIC SERVICE COMMISSION
In the matter of the Application of )
DTE ELECTRIC COMPANY )
for authority to increase its rates, amend ) Case No. U-20836
its rate schedules and rules governing the )
distribution and supply of electric energy, and )
for miscellaneous accounting authority. )
QUALIFICATIONS
AND
DIRECT TESTIMONY
OF
TIMOTHY J. LEPCZYK

DTE ELECTRIC COMPANY
QUALIFICATIONS AND DIRECT TESTIMONY OF TIMOTHY J LEPCZYK
Line
No.
TJL-1
Q1. What is your name, business address and by whom are you employed?1
A1. My name is Timothy J. Lepczyk (he/him/his). My business address is DTE Energy 2
Company, One Energy Plaza, Detroit, Michigan 48226. I am employed by DTE 3
Energy Corporate Services, LLC. 4
5
Q2. What is your position and on whose behalf are you testifying? 6
A2. I am Assistant Treasurer and Director of Corporate Finance, Insurance and 7
Development for DTE Energy Company (DTE Energy) and its subsidiaries 8
including DTE Electric Company (DTE Electric or Company). I accepted the 9
position of Assistant Treasurer and Director of Corporate Finance in August 2021. 10
I am testifying on behalf of DTE Electric. 11
12
Q3. What are your responsibilities as Assistant Treasurer and Director of 13
Corporate Finance for DTE Electric? 14
A3. I am responsible for assisting the Treasurer in managing the capital needs of the 15
Company. These responsibilities include managing corporate liquidity and 16
financing activities such as the raising of both equity capital and capital markets 17
debt for DTE Energy, DTE Electric, and DTE Gas Company (DTE Gas). I assist 18
in maintaining relationships with the commercial and investment banking 19
community, interact with the rating agencies, and execute corporate financial 20
policies, particularly in the areas of balance sheet management, debt issuances, and 21
agency ratings. In addition, I manage the Company’s capital investment approval 22
and review process along with managing the Company’s property and liability 23
insurance function. 24
25

T. J. LEPCZYK
Line U-20836
No.
TJL-2
Q4. What is your educational background? 1
A4. I graduated from Georgetown University in 2004 with a Bachelor of Business 2
Administration degree, with a concentration in International Business. In 2008, I 3
graduated with my MBA from the University of Michigan, with a focus in Finance 4
and Corporate Strategy. 5
6
Q5. What is your professional experience? 7
A5. I began my employment with Ford Motor Company in the summer of 2004 as a 8
financial analyst within that company’s Dearborn Stamping facility. In 2006, I left 9
to pursue my MBA. In 2008, after graduation, I went to work for Booz & Company, 10
a management consultancy, where I focused on the automotive and industrial 11
sectors. I worked at Booz & Company from 2008 until 2013 when I joined DTE 12
Energy. 13
14
In 2013, I joined DTE Energy as a Manager on the Corporate Strategy team where 15
I was the lead analyst for various projects and studies primarily relating to the Gas 16
Storage and Pipeline business. In 2014, I formally accepted a position within the 17
Gas Storage and Pipeline team as Manager in their strategy group where I was 18
responsible for various economic analyses (e.g., natural gas supply and demand 19
fundamentals) and for assessing potential new acquisition opportunities. 20
21
In 2016, I accepted the position of Manager for the Corporate Development team 22
where I was responsible for managing DTE Energy’s capital investment process 23
and various valuation processes (for example, DTE Energy’s annual Goodwill 24
impairment assessment). In addition, I led broader strategy initiatives including the 25

T. J. LEPCZYK
Line U-20836
No.
TJL-3
analysis, which ultimately led to our decision to spin off the Midstream business 1
segment. 2
3
In 2021, I accepted my current position, Assistant Treasurer and Director of 4
Corporate Finance, Insurance and Development 5
6
Q6. Have you previously sponsored testimony before the Michigan Public Service 7
Commission (MPSC or Commission)? 8
A6. No. 9
10

T. J. LEPCZYK
Line U-20836
No.
TJL-4
Purpose of Testimony 1
Q7. What is the purpose of your testimony?2
A7. The purpose of my testimony is to support DTE Electric’s projected capital 3
structure and the cost of its long and short-term debt to be used in the determination 4
of DTE Electric’s overall rate of return in this proceeding. I also am recommending 5
that any of the Company’s future tree trim surge expenditures be financed through 6
the issuance of long-term debt and equity. 7
8
Q8. How is your testimony organized? 9
A8. My testimony is organized as follows: 10
I. Summary of Recommendations 11
II. Development of Capital Structure 12
III. Development of Cost Rates 13
IV Securitization 14
V. Summary and Conclusions 15
16
Q9. Are you supporting any exhibits? 17
A9. Yes, I am supporting the following exhibits: 18
Exhibit Schedule Description 19
A-1 A2 Historical Financial Metrics 20
A-4 D2 Cost of Long-Term Debt – as of December 31, 2020 21
A-4 D3 Cost of Short-Term Debt – Twelve Month 22
Period Ended December 31, 2020 23
A-4 D4 Cost of Preferred and Preference Stock – Twelve 24
Month Period Ended December 31, 2020 25

T. J. LEPCZYK
Line U-20836
No.
TJL-5
A-4 D5 Cost of Common Shareholders’ Equity – Twelve 1
Month Period Ended December 31, 2020 2
A-11 A2 Projected Financial Metrics 3
A-14 D1.1 Peer Group Common Equity 4
A-14 D2 Cost of Long-Term Debt – as of October 31, 2023 5
A-14 D3 Cost of Short-Term Debt – Twelve Month 6
Period Ended October 31, 2023 7
A-14 D4 Cost of Preferred and Preference Stock – Twelve 8
Month Period Ended October 31, 2023 9
A-18 H1 Current and Historical Credit Ratings 10
A-18 H2 Recent Utility Corporate Bond Issuances 11
12
Q10. Were these exhibits prepared by you or under your direction? 13
A10. Yes, they were. 14
15
I. SUMMARY OF RECOMMENDATIONS 16
Q11. What permanent capital structure are you recommending for the projected test 17
year to be utilized in determining the overall rate of return calculation for DTE 18
Electric? 19
A11. I am recommending a projected permanent capital structure of 50% long-term debt 20
and 50% common equity. Permanent capital is long-term perpetual capital. 21
Common equity, preferred stock and long-term debt are sources of permanent 22
capital. Since the Company does not have any preferred stock, I am recommending 23
the permanent capital structure to be made up of 50% long-term debt and 50% 24
common equity. This permanent capital structure is reflected in DTE Electric’s 25

T. J. LEPCZYK
Line U-20836
No.
TJL-6
projected permanent capital structure as of October 31, 2023, as shown in Exhibit 1
A-14, Schedule D1, which is supported by Company Witness Vangilder. This 2
capital structure is necessitated by the business and financial risks confronting DTE 3
Electric, which I will discuss in greater detail later in my testimony. 4
5
Q12. What is your forecast for DTE Electric’s cost of long-term debt, short-term 6
debt and preferred stock for the 12-month period ending October 31, 2023? 7
A12. I am forecasting 3.69% for the cost of DTE Electric’s long-term debt, and 1.74% 8
for the cost of DTE Electric’s short-term debt. The Company does not have 9
preferred stock and therefore it has no cost rate. Exhibit A-14, Schedule D2 10
supports the cost rate for long-term debt. Exhibit A-14, Schedule D3 supports the 11
cost rate for short-term debt. 12
13
II. DEVELOPMENT OF CAPITAL STRUCTURE 14
Q13. What do you mean by capital structure? 15
A13. A company’s capital structure includes the amount of equity and debt necessary to 16
support the operations of its business and is defined differently by regulators, 17
finance professionals and rating agencies. Total regulatory capital structure 18
typically includes long-term debt, short-term debt, preferred stock, common equity, 19
deferred taxes, deferred job development investment tax credits, and deferred 20
investment tax credits. Permanent capital structure includes only long-term debt 21
and equity. Rating agencies calculate a company’s capital structure using short-22
term debt, long-term debt, preferred stock, common equity and other adjustments. 23
The rating agencies adjust debt to include items like capital and operating leases, 24

T. J. LEPCZYK
Line U-20836
No.
TJL-7
unfunded pension liabilities, power purchase agreements and asset retirement 1
obligations. 2
3
Q14. Why is a sound capital structure important? 4
A14. It is important to have a financially sound capital structure in order to ensure that a 5
company can obtain needed capital. A sound capital structure produces capital 6
costs that are reasonable and equitable. Also, it is important that the overall return 7
on capital be sufficient to assure financial confidence in a firm and to allow it to 8
raise the funds that are necessary to operate its business at reasonable costs and 9
terms. A sound capital structure is in the best interests of the customers as it ensures 10
the continued viability of the company. 11
12
Q15. How does risk affect a firm’s capital structure? 13
A15. In general, a firm such as DTE Electric faces two types of risk: business risk and 14
financial risk. Business risk is a result of systemic and non-systemic risk. Systemic 15
risks are broad economic risks faced by all firms. Non-systemic risks are risks 16
specifically identified as those faced by the individual firm. Financial risk is the 17
risk that common equity shareholders face to the extent that a firm issues debt to 18
finance real assets. Debtholders (also known as bondholders) have priority over 19
equity shareholders in the event of corporate bankruptcy. Thus, the greater the 20
amount of debt held by a firm, the greater the risk to common shareholders. It is 21
essential that a firm recognizes the dynamics of these risks and adjusts its 22
underlying debt and equity components to produce a sound capital structure. 23
24
Q16. How does a company’s capital structure impact its ability to attract capital? 25
T. J. LEPCZYK
Line U-20836
No.
TJL-8
A16. Having a weak or highly leveraged capital structure may lead to higher required 1
returns on equity and a higher cost of debt. It also can impact the company’s ability 2
to obtain capital. For example, a company with a highly leveraged capital structure 3
may lose its investment grade rating from the rating agencies. Non-investment 4
grade companies have a limited investor base and a more limited access to capital 5
than investment grade companies. Moreover, during periods of diminished capital 6
liquidity, even investment grade companies can have limited access to new capital 7
sources. It is important to consider how extreme market reactions to singular events 8
impact how easily capital will be able to be accessed during the future test period 9
should an unforeseen market shock occur. Furthermore, rating agencies allow little 10
or no time for a company to correct and improve its capital structure before 11
lowering its credit rating. Conversely, companies must be proactive to target and 12
achieve the midpoint of the range of rating agency financial metrics to have a better 13
chance to maintain current ratings. 14
15
Q17. Will higher debt levels in a capital structure affect the cost of debt? 16
A17. Yes. The cost of debt increases as more debt is added to the capital structure. 17
Further, higher debt levels can increase the risk of a downgrade by the rating 18
agencies. A lower credit rating means greater credit risk such that investors will 19
require a higher return to invest in a company, thereby increasing the cost of debt 20
for that company. 21
22
Q18. For DTE Electric’s defined projected test year, what capital structure are you 23
recommending for DTE Electric in this case? 24
T. J. LEPCZYK
Line U-20836
No.
TJL-9
A18. For the projected test year, the permanent capital structure that I am recommending 1
includes long-term debt and equity as shown on Exhibit A-14, Schedule D1, that is 2
supported by Witness Vangilder. Within this regulatory capital structure, I am 3
recommending a projected test year permanent capital structure that has 50% long-4
term debt and 50% common equity. This is the same permanent capital structure 5
authorized by the Commission in the last general rate case, Case No. U-20561. 6
7
Q19. Does the Company believe that a 50/50 capital structure is the optimal capital 8
structure for DTE Electric? 9
A19. No. To reduce the number of contested positions in the instant case, the Company 10
is using the structure authorized in the May 8, 2020 order in Case No. U-20561. 11
However, as the Company has argued in past rate cases, it believes the more 12
appropriate capital structure for DTE Electric is closer to that of its peers. Exhibit 13
A-14, Schedule D1.1 shows DTE Electric peers having a capital structure made up 14
of 48% long-term debt and 52% common equity. A 50% equity level gives the 15
Company less protection in the event of an unforeseen market event and may 16
impact DTE Electric’s ability to access capital during the future test period should 17
an unforeseen market shock occur. 18
19
Q20. Is the proposed ratio of 50% common equity to total permanent capitalization 20
in line with DTE Electric’s peers? 21
A20. No. The common equity ratio requested in this case is lower than that of the 22
Company’s peers. As shown on Exhibit A-14 Schedule D1.1, the average equity 23
ratio for DTE Electric peers was approximately 52%. DTE Electric’s targeted 50% 24
equity ratio is a reasonable level given that the average ratio of the peer group is 25

T. J. LEPCZYK
Line U-20836
No.
TJL-10
higher at 52%. The data was obtained from S&P Global Market Intelligence (SNL) 1
for the most recent fiscal year available per peer company. 2
3
DTE Electric believes its requested 50% is reasonable and below the equity ratio 4
of its peers across the country and within Michigan. 5
6
Q21. Does the intense capital investment program contribute to the need for a higher 7
level of equity within the capital structure? 8
A21. It is imperative that DTE Electric be viewed as a financially sound firm with a solid 9
investment grade rating to ensure the reasonableness and competitiveness of capital 10
costs. DTE Electric will be financing and funding over $6.5 billion of electric 11
capital expenditures for the period January 2021 through October 2023. In a period 12
of intense capital investment, a sound capital structure and a favorable regulatory 13
environment are essential to maintain the financial well-being of the Company. 14
Should the Company face any unforeseen or negative impacts to its financial health, 15
a higher equity balance may be needed. The common equity balance and equity 16
ratio projected for the test year in the instant case will hopefully enable the 17
Company to maintain strong credit ratings and withstand any shocks in the financial 18
markets, thereby ensuring a smooth implementation of its capital expenditure 19
program. 20
21
Q22. Is DTE Electric committed to maintaining a 50% equity ratio in its capital 22
structure? 23
A22. Yes. At December 31, 2020, DTE Electric’s equity ratio was 50%. DTE Electric 24
is committed to maintaining a 50% equity ratio and has demonstrated its 25

T. J. LEPCZYK
Line U-20836
No.
TJL-11
commitment to its targeted equity ratio by receiving equity infusions from DTE 1
Energy. DTE Energy has made reasonable efforts to strengthen DTE Electric’s 2
credit quality by infusing over $1.3 billion of common equity from 2016-2020. 3
DTE Electric has received equity infusion of about $550 million in 2021 and will 4
infuse the amounts necessary in future years to maintain a 50% common equity 5
ratio. 6
7
III. DEVELOPMENT OF COST RATES 8
Q23. What were DTE Electric’s historical financial and ratemaking metrics from 9
2016 through 2020? 10
A23. DTE Electric’s historical financial and ratemaking metrics for each of the previous 11
five years (2016 through 2020) are detailed in Exhibit A-1, Schedule A2. The 12
historical financial calculations include year-end financial metrics and are 13
calculated on a financial basis from DTE Electric’s financial reports. The historical 14
ratemaking metrics include year-end financial metrics and are calculated from DTE 15
Electric’s annual regulatory filings. 16
17
Q24. What is the cost of long-term debt outstanding at December 31, 2020? 18
A24. Exhibit A-4, Schedule D2 calculates the cost of the long-term debt outstanding at 19
December 31, 2020. As shown in the exhibit and schedule, the cost of long-term 20
debt also includes agent’s fees, commissions and financing expenses and is 21
calculated on the net proceeds to the Company. The weighted average cost of debt 22
is computed based on the total annual costs to the Company divided by the total 23
principal amount outstanding at year-end. The cost of long-term debt at December 24
31, 2020 was 3.98%. 25
T. J. LEPCZYK
Line U-20836
No.
TJL-12
1
Q25. What is the cost of short-term debt outstanding at December 31, 2020? 2
A25. The cost of short-term borrowings for the 13-month period ended December 31, 3
2020 was 2.47%. The cost of short-term debt consists of the 1) interest rate on short-4
term borrowings, and 2) credit facility fees associated with the credit agreements 5
necessary for the issuance of short-term debt. See Exhibit A-4, Schedule D3. 6
7
Q26. What was the approved cost of equity as of December 31, 2020? 8
A26. DTE Electric’s authorized cost of common shareholders’ equity as of December 9
31, 2020 was 9.9% and was approved in Case No. U-20561. DTE Electric does not 10
have any preferred stock. See Exhibit A-4, Schedules D4 and D5. 11
12
Q27. What does DTE Electric project its financial metrics to be in the test year? 13
A27. DTE Electric’s forecasted ratemaking metrics are available in Exhibit A-11, 14
Schedule A2. Forecasted calculations include metrics for the fully projected test 15
year. The forecasted ratemaking metrics for the projected test year are to be 16
reported assuming (i) full rate relief as requested, and (ii) zero rate relief. 17
18
Q28. What is the purpose of Exhibit A-14, Schedule D2? 19
A28. The purpose of Exhibit A-14, Schedule D2 is to calculate DTE Electric’s projected 20
weighted average long-term debt costs as of October 31, 2023. Starting with the 21
actual December 31, 2020 long-term debt outstanding, any known and measurable 22
changes for each year were made to arrive at the projected balance as of October 23
31, 2023. Known and measurable changes that have occurred or are projected to 24
occur from January 1, 2021 through October 31, 2023 include: 25

T. J. LEPCZYK
Line U-20836
No.
TJL-13
Issuances and Redemptions 1
2
The interest rate for the debt issuances is based on forward long-term borrowing 3
rates of A-rated utilities, which is comparable to DTE Electric’s credit rating. 4
These forward rates were obtained from Bloomberg, which is a leading provider of 5
financial data, news and analytics, in October 2021. Including the planned long-6
term debt issuance, the weighted average long-term debt cost as of October 31, 7
2023 is projected to be 3.69%. 8
9
Q29. Why did you use long-term debt cost on a net proceeds basis? 10
A29. The actual costs would be understated if the net proceeds were not used in the base 11
calculation. The net proceeds methodology accounts for underwriters’ 12
compensation and other financing expenses and is shown on Exhibit A-14, 13
Amount
($000)
Date Rate
Issuance $575,000 March 2021 1.90%
Issuance $425,000 March 2021 3.25%
Redemption ($250,000) April 2021 3.90%
Redemption ($32,800) May 2021 7.00%
Redemption ($37,600) August 2021 6.90%
Issuance $82,350 September 2021 1.45%
Issuance $59,175 September 2021 1.35%
Redemption ($82,350) September 2021 1.45%
Redemption ($59,175) September 2021 1.45%
Issuance $500,000 March 2022 3.10%
Issuance $400,000 May 2022 3.10%
Redemption ($250,000) June 2022 2.65%
Redemption ($66,000) September 2022 6.95%
Issuance $400,000 February 2023 3.20%
Issuance $340,000 October 2023 3.20%
Net change in debt $2,003,600

T. J. LEPCZYK
Line U-20836
No.
TJL-14
Schedule D2. A portion of any amount financed is used to fund these costs, such 1
that the Company has access to less than the full amount financed. As a result, 2
these fees and expenses are shown as a reduction in proceeds from the issuance of 3
new securities, thereby increasing the effective cost of the issuance above the stated 4
coupon rate. 5
6
Q30. How did you determine the interest rate on short-term debt on Exhibit A-14, 7
Schedule D3? 8
A30. The cost of short-term debt consists of: 1) the interest rate on short-term 9
borrowings, and 2) facility fees associated with the credit agreements necessary for 10
the issuance of short-term debt (Facility Fees). 11
12
The interest rate on short-term borrowings was determined by adding a 90-basis 13
point (bps) spread to forecasted three-month short-term debt rate. A spread of 90 14
bps was used because that is the spread for borrowings under DTE Electric’s credit 15
facility. 16
17
The average forecast for the three-month short-term debt rate for the 13-month 18
period ending October 31, 2023 is 0.50%. The forecast was obtained from 19
Bloomberg in October 2021. Adding the spread of 90 bps to the forecasted 3-month 20
rate of 0.50% brings the interest rate on short-term borrowings to a total of 1.40%. 21
22
The cost of short-term debt also includes Facility Fees associated with maintaining 23
credit facilities. Credit facilities provide short-term liquidity and can be used to 24
support the issuance of commercial paper or can be drawn upon to provide short-25

T. J. LEPCZYK
Line U-20836
No.
TJL-15
term funding. DTE Electric presently has a $500 million credit agreement that 1
expires in April 2024, so the costs related to the facility are known and measurable. 2
Facility Fees for the credit agreement for the 12 months ending October 31, 2023 3
are $0.9 million. The cost of short-term debt including Facility Fees for the 4
projected test period is 1.74%. 5
6
Q31. What is the purpose of Exhibit A-14, Schedule D4? 7
A31. Exhibit A-14, Schedule D4 shows that DTE Electric does not plan to have preferred 8
or preference stock during the projected test period. 9
10
Q32. What are the Company’s current and historical credit ratings? 11
A32. Exhibit A-18, Schedule H1 shows DTE Electric’s and DTE Energy’s current and 12
historical credit ratings, along with associated rating agency outlooks, for the 13
previous five years as published by Standard & Poor’s (S&P), Moody’s Investors 14
Service (Moody’s), and Fitch Ratings. The credit ratings include senior unsecured 15
debt, senior secured debt, and commercial paper ratings. 16
17
Q33. Have there been recent public utility bond issuances? 18
A33. Yes. I have provided details of public utility bond issuances for the three-month 19
period prior to, through the three-month period after, each of DTE Electric’s long-20
term debt offerings issued during the 24 months prior to September of 2021. This 21
summary includes the issue date, issuing company, type of offering (either secured 22
or unsecured), amount of offering, coupon rate, maturity date, structure of offering, 23
S&P and Moody’s ratings, and issue spread. See Exhibit A-18, Schedule H2. 24
25

T. J. LEPCZYK
Line U-20836
No.
TJL-16
IV. SECURITIZATION 1
Q34. How has the tree trim surge regulatory asset been financed in prior rate cases? 2
A34. On May 2, 2019, the Commission issued its order in Case No. U-20162 whereby 3
the Company was authorized a return on the tree trim surge regulatory asset at the 4
short-term debt cost rate of 3.56%. (p. 80). In Case No. U-20561, the return on tree 5
trim surge regulatory asset was calculated at that same authorized short-term debt 6
rate. 7
8
Q35. How does the Company propose to treat the tree trim surge regulatory asset in 9
this instant case? 10
A35. The Company now recommends that any future tree trimming surge expenditures 11
by the Company be financed through the issuance of long-term debt and equity 12
until the time the Company can execute a securitization financing for these 13
amounts. 14
15
Q36. Why is the Company recommending this change? 16
A36. Given the temporary status, defined in Case No. U-20162, of the Tree Trim Surge 17
regulatory asset, the Company did not pursue financing with permanent long-term 18
debt and equity capital, but rather financed with short-term working capital 19
including short-term debt. Thus, this was matching the financing costs with the 20
return the Company was earning on the regulatory asset. In its order for Case No. 21
U-21015, the Commission considered the regulatory asset to have been financed 22
with permanent capital and specified that proceeds of the securitization should be 23
used for the repayment of long-term debt and equity. Consistent with that financing 24
order, any future tree trim surge regulatory asset amounts should be treated as being 25

T. J. LEPCZYK
Line U-20836
No.
TJL-17
financed with permanent long-term debt and equity capital and receive the 1
respective return. I have directed Witness Vangilder to calculate the return on 2
projected tree trim surge regulatory asset in that fashion. 3
4
V. SUMMARY AND CONCLUSIONS 5
Q37. Can you summarize your recommendation and conclusions? 6
A37. Due to the financial and business risks faced by the Company, a projected 7
permanent capital structure of 50% long-term debt and 50% common equity is 8
reasonable and prudent. DTE Energy has taken reasonable actions to strengthen 9
DTE Electric’s credit quality and has done so by infusing over $1.3 billion of 10
common equity from 2016 through 2020 and will continue to do so as needed. The 11
plan calls for additional equity infusions and retained earnings growth through the 12
test period in the amount necessary to maintain the Company at no less than a ratio 13
of 50% equity to permanent capital at October 31, 2023. For the projected year, 14
the cost of short-term debt is projected to be 1.74%, and the cost of long-term debt 15
is projected to be 3.69%. I believe these expenses and measures are reasonable, 16
prudent and necessary. In addition, I recommend that any of the Company’s future 17
tree trim surge expenditures be financed through the issuance of long-term debt and 18
equity. 19
20
Q38. Does this complete your direct testimony? 21
A38. Yes, it does. 22

STATE OF MICHIGAN
BEFORE THE MICHIGAN PUBLIC SERVICE COMMISSION
In the matter of the Application of )
DTE ELECTRIC COMPANY )
for authority to increase its rates, amend ) Case No. U-20836
its rate schedules and rules governing the )
distribution and supply of electric energy, and )
for miscellaneous accounting authority. )
QUALIFICATIONS
AND
DIRECT TESTIMONY
OF
MARKUS B. LEUKER

DTE ELECTRIC COMPANY
QUALIFICATIONS AND DIRECT TESTIMONY OF MARCUS B. LEUKER
Line
No.
MBL-1
Q1. What is your name, business address and by whom are you employed?1
A1. My name is Markus B. Leuker (he/him/his). My business address is: One Energy 2
Plaza, Detroit, Michigan 48226. I am testifying on behalf of DTE Electric 3
Company (DTE Electric or the Company). 4
5
Q2. What is your present position with the Company? 6
A2. I am the Manager of Corporate Energy Forecasting. 7
8
Q3. What is your educational background? 9
A3. I received a Bachelor of Science in Business Administration from Xavier 10
University in Cincinnati, Ohio with a concentration in Marketing and Management 11
in 1991. I received a Master of Business Administration from Xavier University in 12
Cincinnati, Ohio in 1998. I have also completed several Company sponsored 13
courses and attended various seminars to further my professional development. 14
15
Q4. What is your work experience? 16
A4. I joined the Company in November 2010 as Manager, Corporate Energy 17
Forecasting. Prior to DTE Electric, I worked for IHS/CSM Worldwide as a Sr. 18
Manager, North American Advisory Services where I led the pursuit, development, 19
execution and delivery of key client projects. Some of my experiences at IHS/CSM 20
Worldwide included: Market Research & Analysis, Market Opportunity Analysis, 21
Business Modeling and Strategic Analysis, Regulatory Market Assessment, and 22
Financial and Scenario Analysis. In addition to my experience with DTE Electric 23
and IHS, I worked as North American Manager, Market Research & Analysis for 24
Visteon Corporation where I managed global coordination of the research function 25

M. B. LEUKER
Line U-20836
No.
MBL-2
and led a team of researchers in various studies including customer and competitor 1
research, new product creation, and customer satisfaction. I have also had prior 2
experience in the utility industry working as a Senior Analyst at Cinergy 3
Corporation (currently Duke Energy). While at Cinergy, I worked on various non-4
regulated activities and regulated marketing activities. 5
6
Q5. What are your duties as Manager, Corporate Energy Forecasting? 7
A5. I am responsible for the development of the economic and electric sales forecasting 8
activities for DTE Electric. These activities include data collection, statistical 9
analysis of data, forecast model building and interaction with other departments on 10
forecast-related activities. My role also includes the preparation of long-term (one 11
year or greater) sales forecasts, short-term (monthly) forecasts, next day forecasts, 12
and the economic forecast that supports the sales forecast. 13
14
Q6. Do you belong to any professional organizations? 15
A6. I am a member of Edison Electric Institute’s (EEI) Load Forecasting Group (LFG). 16
The LFG’s purpose is to enhance load forecasting capabilities by exchanging 17
information among the group’s base of experienced and knowledgeable load 18
forecasters. I am also a member of the Detroit Association for Business Economics 19
(DABE). DABE discusses economic issues affecting Southeastern Michigan. 20
21
Q7. Have you previously sponsored testimony before the Michigan Public Service 22
Commission? 23
A7. Yes. I sponsored testimony in the following cases: 24
U-17049 2012 Energy Optimization Plan 25

M. B. LEUKER
Line U-20836
No.
MBL-3
U-17097 2013 PSCR Plan 1
U-17302 2013 Renewable Energy Plan Update 2
U-17319 2014 PSCR Plan 3
U-17680 2015 PSCR Plan 4
U-17762 2016-17 Energy Optimization Plan 5
U-17767 DTE Electric General Rate Case 6
U-17793 2015 Renewable Energy Plan 7
U-17920 2016 PSCR Plan 8
U-18014 DTE Electric General Rate Case 9
U-18111 2016 Amended Renewable Energy Plan 10
U-18143 2017 PSCR Plan 11
U-18255 DTE Electric General Rate Case 12
U-18262 2018-19 Energy Waste Reduction Plan 13
U-18403 2018 PSCR Plan 14
U-18419 2017 Certificate of Necessity 15
U-18232 2018 Renewable Energy Plan 16
U-20162 DTE Electric General Rate Case 17
U-20221 2019 PSCR Plan 18
U-20471 2019 Integrated Resource Plan 19
U-20561 DTE Electric General Rate Case 20
U-18232 2020 Amended Renewable Plan21

M. B. LEUKER
Line U-20836
No.
MBL-4
Purpose of Testimony 1
Q8. What is the purpose of your testimony?2
A8. The purpose of my testimony is to provide the Company’s current electric sales, 3
maximum demand and system output forecast for the period 2021-2026, including 4
the projected 12-month test period November 2022 through October 2023. I will 5
discuss the outlook for the national and local economy which is the basis of the 6
forecast. I will describe how the forecast of electric sales, maximum demand and 7
system output is developed. My testimony will support the reasonableness of the 8
electric sales forecast used by DTE Electric in this proceeding. 9
10
Q9. Are you supporting any exhibits? 11
A9. Yes. I am sponsoring the following exhibits: 12
Exhibit Schedule Description 13
A-5 E1 Annual Sales by Major Customer Classes and System 14
Output 2016-2020 Historical 15
A-15 E1 Annual Sales by Major Customer Classes and System 16
Output 2021-2026 Forecast 17
A-15 E2 Annual System Output, Maximum Demand and Load 18
Factor 19
A-15 E3 Projected Period Known and Measurable Changes to 20
Sales 21
A-15 E4 Summary of Economic Outlook 22
A-15 E5 Variance of Weather-Normalized Electric Sales and 23
Peak and ITRON’s Benchmarking Survey Results 24
25

M. B. LEUKER
Line U-20836
No.
MBL-5
Q10. Were these exhibits prepared by you or under your direction? 1
A10. Yes, they were. 2
3
Q11. How is your testimony organized? 4
A11. My testimony consists of the following parts: 5
Part I: Economic Outlook 6
Part II: Forecast Development and Assumptions 7
Part III: Historical and Current Electric Forecast Sales and Demand 8
Part IV: Electric Load Forecast Accuracy 9
10
Part I: Economic Outlook 11
12
Q12. What effect has the Coronavirus (COVID-19 or COVID) outbreak had on the 13
national economy? 14
A12. COVID infections and fears caused the economy to contract sharply in the first half 15
of 2020, but after suffering that initial setback and still enduring local COVID 16
outbreaks, economic activity has been recovering. Starting with the third quarter of 17
2020, real gross domestic product has expanded each quarter. At present, real gross 18
domestic product is tracking to grow by 7.4 percent over 2021, while real personal 19
consumption expenditures and real disposable personal income are heading toward 20
8.4 percent and 3.4 percent annual growth, respectively. The Consumer Price Index 21
for All Urban Consumers (CPI-U) is tracking to increase by 3.3 percent in 2021, 22
and U.S. light vehicle production for the year is pointed toward 10.02 million units, 23
or 16.2 percent growth. 24
25

M. B. LEUKER
Line U-20836
No.
MBL-6
Q13. What is the outlook for the national economy in 2022 and 2023 compared to 1
2021? 2
A13. Gross domestic product is expected to increase by 4.8 percent in 2022 and by 1.7 3
percent in 2023. Disposable personal income is expected to decrease by 1.8 percent 4
in 2022 and increase by 1.9 percent in 2023. Personal consumption expenditures 5
are expected to increase by 4.3 percent in 2022 and by 2.4 percent in 2023. These 6
measures from the national income and product accounts are in real terms, meaning 7
that inflation has been removed from them. The CPI-U is forecast to increase by 8
2.1 percent in 2022 and by 2.0 percent in 2023. Total light vehicle production in 9
the United States is forecast to reach 11.67 million units in 2022 and 11.66 million 10
in 2023. 11
12
Q14. What is the outlook for Southeast Michigan’s economy in 2022 and 2023 13
compared to 2021? 14
A14. Total non-farm employment is forecast to increase by 4.8 percent in 2022 and by 15
2.1 percent in 2023. Natural resources, mining, and construction employment is 16
expected to rise by 0.2 percent in 2022 and decline by 1.4 percent in 2023. Total 17
private non-manufacturing employment is forecast to rise by 5.7 percent in 2022 18
and by 2.6 percent in 2023. In the government sector employment is expected to 19
rise by 2.9 percent in 2022 and by 0.2 percent in 2023. Manufacturing employment 20
is forecast to increase by 1.8 percent in 2022 and by 0.7 percent in 2023. Southeast 21
Michigan automotive production is expected to attain a level of 1.82 million 22
vehicles in 2022 and 2.03 million in 2023. Population is forecast to decline by 0.15 23
percent in 2022 and by 0.06 percent in 2023. 24

M. B. LEUKER
Line U-20836
No.
MBL-7
Part II: Forecast Development and Assumptions 1
2
Q15. What is the general approach used in developing the forecast of DTE Electric's 3
service area electric sales and system output? 4
A15. The general approach reflects widely accepted industry standards for electricity 5
forecasting, including end-use and regression modeling. This approach has, over 6
time, provided reasonable forecasts for DTE Electric service area electric sales. For 7
most sectors of the forecast, electric sales levels are related to the various economic, 8
technological, regulatory, and demographic factors that have affected them in the 9
past. 10
11
The procedure begins with the assembly of historical data relating to the various 12
sectors of the forecast. The data is examined and the factors that are statistically 13
significant in explaining electric sales are identified using regression techniques. 14
The forecast models are developed internally, employing the appropriate regression 15
equations. The Company receives national and local economic forecasts from various 16
sources1 that are then used as inputs in the forecast models to calculate projected future 17
sales levels. Economic variables (explanatory factors) include motor vehicle 18
production, population, employment, and others. 19
20
The forecast is developed separately for each of the major customer classifications: 21
Residential, Small Commercial and Industrial (C&I), Large C&I and Other. The 22
sales in the Residential and Small C&I classes are forecast using separate 23
Statistically Adjusted End-Use (SAE) models in Metrix ND, an ITRON software 24
1 Sources include, but are not limited to: IHS Markit, Auto Forecast Solutions, Automotive News, Moody’s Analytics, Bureau of
Economic Analysis, Bureau of Labor Statistics, Energy Information Administration

M. B. LEUKER
Line U-20836
No.
MBL-8
program. The Large C&I class sales are forecast using a combination of regression 1
equations and trend models for seven supersector markets. The Other (Street 2
Lighting) forecast is provided by Company Witness Bellini. Net system output is 3
forecast as the sum of the electric sales values for the four categories and the 4
projected losses. 5
6
Q16. What weather assumptions are in the load forecast? 7
A16. Weather is one of the primary variables used in each customer class forecast model. 8
In each model, actual weather is used to understand the unique relationship that a 9
customer class’s energy consumption has with weather. In regression modeling, a 10
coefficient is measured to quantify this impact. Once the coefficient is calculated, 11
it is applied to the weather assumed in the forecast horizon. In the forecast horizon, 12
normal weather is assumed as the most prudent form of weather expectations for 13
the future. 14
15
Q17. How does DTE Electric define normal weather? 16
A17. Normal weather is defined as a 15-year average of historical values from 2006-17
2020. Daily average temperature is converted to weather variables such as heating 18
degree days (HDDs) and cooling degree days (CDDs) using a base of 65 degrees. 19
HDDs are calculated by subtracting average daily temperature from 65 degrees 20
Fahrenheit. Conversely, CDDs are calculated by subtracting 65 degrees Fahrenheit 21
from average daily temperature. As a result, this process calculates and defines 22
normal HDDs and CDDs for a given day, month and year. 23
24
Q18. How was the Residential Class forecast developed? 25

M. B. LEUKER
Line U-20836
No.
MBL-9
A18. Electricity sales in the Residential class were forecast using the SAE model which 1
specifies energy use as a function of 15 end-uses, including customer owned solar 2
and electric vehicle demand, along with factors that affect the end-use requirements 3
such as economic activity and weather. The Residential class forecast begins with 4
a basic end-use model with appliance saturation projections and average electricity 5
usage per end-use provided by a Company-conducted residential appliance 6
saturation survey and the Energy Information Administration’s (EIA) Residential 7
Energy Consumption Survey (RECS) for the East North East Central region in 8
which DTE Electric operates. Residential Energy Waste Reduction (EWR) 9
programs are applied directly to the corresponding end-uses in the SAE model. The 10
combination of appliance saturations and average electricity per end-use is indexed 11
and calibrated to the Company’s usage per customer for the base year to create an 12
electricity forecast for each end use. 13
14
End-use intensities are combined with utilization variables which reflect how much 15
the end-use is utilized. For Residential, the primary variables used to explain 16
utilization are weather, real personal income, population, and households. 17
Additionally, resulting from the COVID-19 pandemic, Michigan mobility data was 18
integrated into the model through a “wedge” due to the shift in electricity 19
consumption patterns caused by shelter-in-place and social distancing policies. The 20
wedge and associated shifts in electricity consumption are described later in my 21
testimony. The utilization variables are then combined with the end-use intensities 22
to compute an explanatory variable. Along with seasonal factors, the resulting 23
explanatory variable is then regressed against the Company’s Residential monthly 24

M. B. LEUKER
Line U-20836
No.
MBL-10
use per customer sales. The model effectively acts as the statistical adjustment and 1
calibrates the end-use forecast to the Company’s historical sales. 2
3
The number of residential customers was forecasted using historical and projected 4
households for southeast Michigan provided by IHS Markit. Customer counts are 5
modeled using a regression, with households as the primary explanatory variable. 6
The customer forecast is then multiplied by the use per customer from the SAE 7
model to produce the total Residential class sales forecast. For more conceptual 8
detail about residential SAE modeling, refer to Figure 1 below2. 9
10
Figure 1 11
12
13
14
15
16
17
18
19
Q19. How was the Small C&I forecast developed? 20
A19. Similar to the Residential class forecast, Small C&I class sales are also forecast 21
using the SAE model, utilizing 11 end-uses including customer owned solar and 22
electric vehicle demand. Additionally, Small C&I EWR programs are incorporated 23
directly into the SAE model. The Small C&I sales forecast begins with a basic end-24
use model with saturation projections and average electricity usage per end-use 25
2 Source: ITRON, Inc.

M. B. LEUKER
Line U-20836
No.
MBL-11
derived from the EIA’s Commercial Building Energy Consumption Survey 1
(CBECS) for the East North Central region in which DTE Electric operates. Since 2
Small C&I buildings within the DTE Electric service territory consume electricity 3
differently, the projections are weighted by intensity and prevalence of 11 different 4
building types as defined by the EIA. To better calibrate these projections to the 5
Company’s service area, employment values are used to weight the saturations and 6
average electricity usage per end-use is enhanced with the Company’s service area 7
employment data. The combination of saturations and average electricity per end-8
use is indexed and calibrated to the Company’s usage per customer for the base 9
year to create an electricity forecast for each end-use. 10
11
For Small C&I, the primary variables used to explain utilization are weather, gross 12
state product, non-manufacturing employment and households. Additionally, 13
resulting from the COVID-19 pandemic, Michigan mobility data was integrated 14
into the model through a “wedge” due to the shift in electricity consumption 15
patterns caused by shelter-in-place and social distancing policies. The utilization 16
variables are then combined with the end-use intensities to compute an explanatory 17
variable. Along with seasonal factors, the resulting explanatory variable is then 18
regressed against the Company’s Small C&I monthly use per customer sales. 19
20
Small C&I customers are modeled using a regression with Residential customers 21
as the primary variable. The customer forecast is then multiplied by the use per 22
customer from the SAE model to produce the total Small C&I class sales forecast. 23
For more conceptual information regarding Commercial SAE modeling, refer to 24
Figure 2 shown below. 3 25
3 Source: ITRON, Inc.
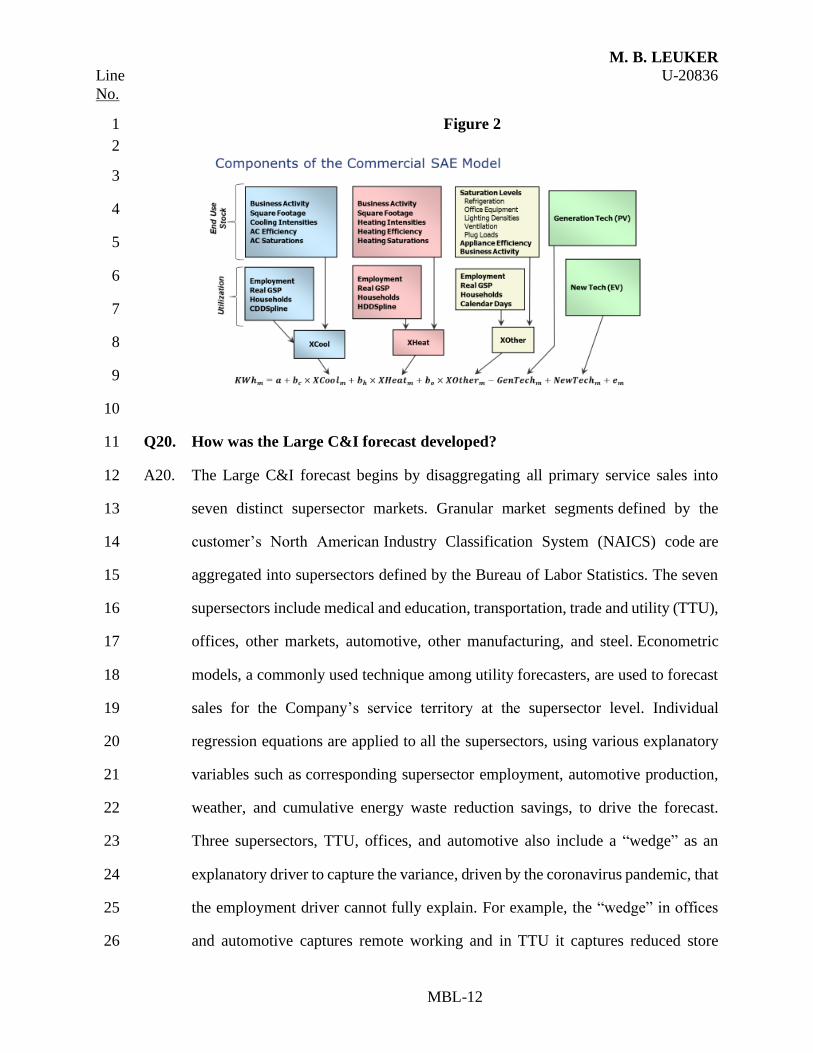
M. B. LEUKER
Line U-20836
No.
MBL-12
Figure 2 1
2
3
4
5
6
7
8
9
10
Q20. How was the Large C&I forecast developed? 11
A20. The Large C&I forecast begins by disaggregating all primary service sales into 12
seven distinct supersector markets. Granular market segments defined by the 13
customer’s North American Industry Classification System (NAICS) code are 14
aggregated into supersectors defined by the Bureau of Labor Statistics. The seven 15
supersectors include medical and education, transportation, trade and utility (TTU), 16
offices, other markets, automotive, other manufacturing, and steel. Econometric 17
models, a commonly used technique among utility forecasters, are used to forecast 18
sales for the Company’s service territory at the supersector level. Individual 19
regression equations are applied to all the supersectors, using various explanatory 20
variables such as corresponding supersector employment, automotive production, 21
weather, and cumulative energy waste reduction savings, to drive the forecast. 22
Three supersectors, TTU, offices, and automotive also include a “wedge” as an 23
explanatory driver to capture the variance, driven by the coronavirus pandemic, that 24
the employment driver cannot fully explain. For example, the “wedge” in offices 25
and automotive captures remote working and in TTU it captures reduced store 26
M. B. LEUKER
Line U-20836
No.
MBL-13
hours. The steel market uses a regression for the first forecast year and an 1
exponential smoothing model for the remainder of the forecast. The regression 2
results are evaluated for reasonableness and validated through various model 3
statistics. 4
5
Regression modeling does not account for incremental growth of emerging 6
technologies (photovoltaics and electric vehicles). Therefore, it is necessary to 7
make post-regression adjustments to the forecast to incorporate future technology 8
and customer specific closings or expansions. The three main post-regression 9
adjustments include distributed generation growth, fleet electrification growth, and 10
large customer projects that are informed by customer account managers. 11
12
Q21. Can you describe the “wedge” used in the models as a result of the COVID-19 13
pandemic? 14
A21. Since March 2020, mitigation strategies to reduce the spread of COVID-19 have 15
caused a shift in electricity consumption throughout DTE Electric’s service 16
territory. In general, these mitigation strategies had an inverse effect on Residential 17
and C&I sales. Specifically, Residential sales increased as a result of shelter in place 18
orders and the general population curtailing activities occurring outside of the 19
home. Small C&I sales have decreased due to closures of movie theaters, gyms, 20
bars and restaurants. Large C&I sales also decreased as a result of temporary 21
cessation of manufacturing, limits on large social gatherings such as sporting 22
events, and work from home policies. Due to the nature of some of these policies, 23
historical relationships between economics and energy consumption cannot fully 24
capture the variances associated with the impact of COVID-19. 25

M. B. LEUKER
Line U-20836
No.
MBL-14
1
For example, C&I sales have historically shared a relationship with employment 2
levels in The Company’s Service Area. Among other factors, if employment levels 3
increase or decline, C&I sales would follow respectively. However, if an employer 4
elects to move their employees to a remote environment, rather than lay them off, 5
the end-use stock utilization within the C&I building will be reduced with less need 6
for office equipment, HVAC and lighting. Since these employees are still 7
employed, although not physically present, the employment numbers remain 8
unchanged. Thus, there is a decline in C&I electric usage consistent with lower 9
employment levels even though employment has not declined. The regression 10
models cannot fully capture the changing end-use utilization in C&I sales with only 11
employment, creating a need for an additional variable. 12
13
Conversely, these sales would be shifted to Residential homes where the work is 14
occurring, driving increases in the utilization of end-use stock at times where it may 15
have not previously been as high, such as running air conditioning at higher levels 16
in the middle of the day. 17
18
The wedge aims to capture these unusual changes by beginning with an assessment 19
of daily loads from class and market level Daily Tracking models. Using interval 20
or aggregated hourly data helps provide better clarity in terms of how customers 21
use energy in real time. These models provide insight into how the various customer 22
class electric consumption patterns change from day to day depending on weather, 23
day of the week, and time of year. 24
25

M. B. LEUKER
Line U-20836
No.
MBL-15
In a status quo environment, these Daily Tracking models perform well at 1
forecasting short and medium-term loads. The wedge can be thought of as the 2
percent deviation from these models. Formally, the wedge is calculated as: 3
4
𝑊𝑒𝑑𝑔𝑒 = (𝐴𝑐𝑡𝑢𝑎𝑙 𝐿𝑜𝑎𝑑 − 𝐵𝑎𝑠𝑒𝑙𝑖𝑛𝑒 𝐿𝑜𝑎𝑑)
𝐵𝑎𝑠𝑒𝑙𝑖𝑛𝑒 𝐿𝑜𝑎𝑑 𝑋 100 5
6
Actual load is defined as the observed load by customer class from AMI data, and 7
Baseline load is defined as the “business as usual estimates” from The Daily 8
Tracking models. Business as usual estimates are derived by halting the model’s 9
estimation period prior to the effects of the COVID-19 pandemic. 10
11
The wedge is explained and forecast through deviations in consumer mobility 12
patterns provided by sources such as Google or The Institute for Health Metrics 13
Evaluation4. Since the beginning of the COVID-19 pandemic, Google has provided 14
public access to data that provides insight into changes in consumer behavior in 15
response to policies aimed at combating COVID-19. The data is expressed as a 16
percentage deviation from “normal” or before the start of the COVID-19 pandemic. 17
This data, and the trends present in the history, provides a baseline for forecasting 18
the wedge used in the class level regression models. 19
20
The resulting wedge estimates the COVID-19 impact in the history and forecast by 21
customer class or market segment, which is used as an input variable alongside 22
economic, weather and other variables in the long-term forecasting models. 23
24
4Institute of Health Metrics Evaluation and Google COIVD-19 Community Mobility Reports. Retrieved at https://covid19.healthdata.org/global and https://www.google.com/covid19/mobility/
M. B. LEUKER
Line U-20836
No.
MBL-16
Q22. What level of Energy Waste Reduction (EWR) is assumed in the forecast? 1
A22. The load forecast assumes EWR savings to be 2.0 percent starting in 2021 through 2
the forecast horizon. This is consistent with the levels approved in The Company’s 3
Integrated Resource Plan filing in Case No. U-20471. 4
5
Q23. How was the Distributed Generation outlook applied to the forecast? 6
A23. The Distributed Generation outlook (encompassing behind-the-meter solar 7
photovoltaics) was developed utilizing the Company’s residential and non-8
residential interconnection history. The Company engaged with ICF Resources 9
LLC (ICF), a global consulting service company, to conduct a market study. ICF 10
produced forecasts of photovoltaic (PV) economics for both residential and C&I 11
customers and estimated the customer PV capacity and electricity output that will 12
be added in DTE Electric’s service territory for each year between 2021 and 2030. 13
14
In the Residential and Small C&I models, the historical and forecast Distributed 15
Generation is input directly as an end-use into the model. In the Large C&I models, 16
the incremental Distributed Generation is subtracted as a post-regression 17
adjustment. 18
19
Q24. How was the Electric Vehicle (EV) outlook applied to the forecast? 20
A24. For the EV forecast, the cumulative vehicle stock forecast presented by Witness 21
Burns was used as a starting point to estimate the historical and forecasted load in 22
the Company’s service territory. 23
24

M. B. LEUKER
Line U-20836
No.
MBL-17
The EV volume is multiplied by the KWh/vehicle and the assumed vehicle miles 1
traveled unique to each vehicle segment to arrive at the load associated with the 2
forecasted vehicle volumes. 3
4
For light-duty vehicles, numerous national studies5 suggest approximately 80 5
percent of EV charging is done at personal residences while the other 20 percent is 6
done at non-residential locations, such as workplace or public charging stations. 7
Therefore, 80 percent of the light-duty EV sales forecast was applied to the 8
residential model as an additional end-use. The remaining 20 percent was applied 9
to the Small C&I model as an additional end-use. 10
11
For fleet (medium-duty and heavy-duty) vehicles, 100 percent of the fleet EV sales 12
forecast was applied to the Large C&I model as an incremental adjustment to the 13
forecast. 14
15
Q25. How was the Electric Choice sales forecast developed? 16
A25. The Electric Choice sales forecast was based on 10 percent of retail sales. Previous 17
year’s class ratios are applied to the Choice cap and new customer load is added 18
separately. 19
20
Q26. How was the DTE Electric system peak demand forecast developed? 21
A26. HELM 2.0 was used to forecast annual peak demand. HELM 2.0 was also utilized 22
to determine monthly peak demands in the forecast period. 23
5 NRDC Electric Vehicle Charging 101 Electric Vehicle Charging 101 | NRDC
JD Power Study: Electric Vehicle Owners Prefer Dedicated Home Charging Stations JD Power Study:
Electric Vehicle Owners Prefer Dedicated Home Charging Stations - Forbes Wheels

M. B. LEUKER
Line U-20836
No.
MBL-18
1
Q27. What is HELM 2.0? 2
A27. HELM 2.0 is an internal model based on the Electric Power Research Institute 3
(EPRI) hourly model. It has been updated to include profiles for each sales class 4
using historical hourly AMI interval data. The Residential and Small C&I classes 5
were broken into base, cooling, and heating end-uses which allowed more detailed 6
modeling than in the past. Annual and/or monthly sales, along with hourly demand 7
profiles for each sales class or end-use, are key inputs into the HELM 2.0 model. 8
9
Q28. What temperature assumptions were made regarding the DTE Electric service 10
area and DTE Electric bundled peak demand forecast? 11
A28. Normal temperature on the day of the annual peak is assumed to be 82.7 F, which 12
is the mean temperature from Detroit Metropolitan Airport. This value is based 13
upon an average peak-day mean temperature for a 15-year period (2006 through 14
2020). The mean temperature is calculated as the average of the high and low 15
temperature for the day. The peak day is assumed to occur on a weekday in July 16
or August. In addition, normal weather conditions were utilized for the projection 17
of weather-sensitive sales. 18
19
Q29. Are Demand Response programs included in the Company’s peak forecast? 20
A29. Demand Response programs are not explicitly included in the peak forecast. Non-21
dispatchable programs such as time-of-use pricing, is embedded in the historical 22
load-shapes used to forecast the peak demand. However, dispatchable Demand 23
Response programs, such as Interruptible Air Conditioning, are used to meet the 24
Company’s required amount of unforced capacity needed to meet the MISO 25

M. B. LEUKER
Line U-20836
No.
MBL-19
resource adequacy requirements. The dispatchable Demand Response programs are 1
accounted for on the supply side as load modifying resources. For further detail on 2
resource adequacy requirements see the testimony of Company Witness Burgdorf. 3
4
Part III: Historical and Current Electric Forecast Sales and Demand 5
6
Q30. What has been the compound annual growth rate of DTE Electric sales over 7
the last five years? 8
A30. As shown in Exhibit A-5, Schedule E1, page 4 of 4, weather normalized service 9
area sales from 2016 to 2020 have declined during the five-year historical period. 10
In 2016, total service area sales were 47,551 GWh and 2020 sales were 44,003 11
GWh, representing a compound annual growth rate (CAGR) of -1.9 percent, which 12
is a more pronounced decrease than what has been historically seen. In 2019 13
weather normalized service area sales were 46,222, representing a CAGR of -0.9 14
percent when comparing 2016 through 2019. The primary reason for the more 15
notable decrease in sales in 2020 is due to business customers shutdown from the 16
coronavirus pandemic. 17
18
Bundled sales have decreased from 42,660 GWh in 2016 to 40,256 GWh in 2020, 19
representing a CAGR of -1.4 percent. The electric choice sales declined from 4,892 20
GWh in 2016 to 3,747 GWh in 2020 by a CAGR of -6.4 percent. Refer to Exhibit 21
A-5, pages 1 through 3 for additional detail regarding historical actual sales for the 22
service area, bundled and electric choice. 23
24

M. B. LEUKER
Line U-20836
No.
MBL-20
Q31. What has been the CAGR of DTE Electric peak demand over the last five 1
years? 2
A31. As shown in Exhibit A-5, Schedule E1, page 4 of 4, the service area peak demand 3
in 2016 was 11,332 MW and 2020 peak demand was 11,246 MW, representing a 4
CAGR of -0.2 percent. The bundled peak demand was 10,351 MW in 2016 and 5
10,578 MW in 2020 at a CAGR of 0.5 percent. 6
7
Q32. What are sales for the projected test period, November 2022 through October 8
2023? 9
A32. The service area sales for the projected test period, November 2022 through 10
October 2023 are 45,047 GWh and bundled sales are 40,438 GWh. The projected 11
test period service area, bundled, and electric choice sales are displayed in Exhibit 12
A-15, Schedule E1, pages 1 through 3. The projected known and measurable 13
changes for bundled sales from 2020 to the projected test year are detailed in 14
Exhibit A-15, Schedule E3. 15
16
Q33. What are the system output and annual peak demand for the projected test 17
period, November 2022 through October 2023? 18
A33. The service area system output and annual peak demand for the projected test 19
period, November 2022 through October 2023 are 48,427 GWh and 11,158 MW, 20
respectively. The projected test period bundled system output and annual peak 21
demand are 43,548 GWh and 10,341 MW, respectively. The service area and 22
bundled system outputs and peak demand can be found on Exhibit A-15, Schedule 23
E2, pages 1 and 2. The Electric Choice impact is displayed in Exhibit A-15, 24
Schedule E2, page 2 of 2. Ten percent (10%) and 90 percent (90%) confidence 25

M. B. LEUKER
Line U-20836
No.
MBL-21
bands on forecasted summer peak demand is provided for DTE Electric’s service 1
area and DTE Electric’s bundled sales levels and can be found on Exhibit A-15, 2
Schedule E2, pages 1 and 2. 3
4
Q34. Can you summarize how the bundled retail sales forecast and the Electric 5
Choice sales forecast for the projected test period November 2022 through 6
October 2023 compare to the historical period? 7
A34. In general, electric sales from 2016 through 2019 have declined largely as a result 8
of relatively flat economic growth, combined with increased EWR efforts. In 2020, 9
electric sales were impacted by COVID-19 and the resulting mitigation strategies 10
that came with it. Given that many business customers halted operations, electric 11
sales experienced an exceptionally sharp decline in 2020. 12
13
As mitigation strategies continue to subside, electric sales are on a recovering 14
trajectory, specifically, weather-normalized bundled retail sales are forecasted to 15
increase from 40,256 GWh in 2020 to 40,438 GWh in the projected test period. 16
Electric Choice sales are forecasted to increase from 3,747 GWh in 2020 to 4,609 17
GWh in the projected test period. 18
19
Although the trajectory of sales in the projected period is increasing from 2020 20
electric sales levels, service area sales are projected to remain below 2019 levels, 21
consistent with the decreasing trend in electric sales seen from 2016 through 2019. 22
23
Q35. What is the CAGR of the DTE Electric service area electric sales from 2020 24
through the forecast period to 2026? 25

M. B. LEUKER
Line U-20836
No.
MBL-22
A35. The service area sales are expected to increase to 44,629 GWh in 2026. This 1
represents a 0.2 percent average annual increase. The forecast of annual sales and 2
system output for DTE Electric’s service area for the years 2021 through 2026 is 3
reflected on Exhibit A-15, Schedule E1, page 1 of 3. 4
5
Q36. What is the CAGR of DTE Electric bundled electric sales from 2020 through 6
the forecast period to 2026? 7
A36. The bundled sales are projected to decrease over the forecast period, consistent with 8
the declining trend seen in the historical data. The bundled sales are expected to 9
decline to 40,061 GWh in 2026. This represents a -0.1 percent CAGR. The current 10
forecast of bundled sales and system output are shown on Exhibit A-15, Schedule 11
E1, page 2 of 3. 12
13
Q37. What is the CAGR of Electric Choice sales from 2020 through the forecast 14
period to 2026? 15
A37. Electric Choice sales are expected increase to 4,567 GWh in 2026. This represents 16
a 3.4 percent CAGR. The current forecast of electric choice sales and system output 17
are shown on Exhibit A-15, Schedule E1, page 3 of 3. 18
19
Q38. What is the outlook for Residential Class sales? 20
A38. DTE Electric's service area Residential Class sales are forecast to decline 5.2 21
percent annually, on average, between 2020 and the projected test period in this 22
case and increase by 0.6 percent annually, on average between 2020 and 2026. The 23
sharp decline in sales from 2020 to the test period is due to the artificial increase in 24
2020 Residential sales as a result of COVID-19, which is expected to reverse by 25

M. B. LEUKER
Line U-20836
No.
MBL-23
the end of 2022. Modest average annual growth of 0.6 percent in residential 1
customer count is expected through 2026 due to a moderating housing market. 2
However, use-per-customer through 2026 is expected to decrease by 1.2 percent 3
annually on average. This is due to the long-term trend of increases in the saturation 4
of appliances being offset by more efficient electric appliances and the adoption of 5
energy efficient lighting. For a graphical view of the residential forecast, refer to 6
Figure 3 below. 7
Figure 3 8
9
10
11
12
13
14
15
16
17
Q39. What is the outlook for Small C&I class sales? 18
A39. DTE Electric's service area Small C&I class sales are forecast to increase 6.9 19
percent annually, on average, between 2020 and the projected test period. Small 20
C&I class sales are forecast to increase by 0.9 percent annually, on average between 21
2020 through 2026. The sharp increase in sales is due to a strong economic recovery 22
reversing the lower sales seen in Small C&I in 2020 due to COVID-19. Modest 23
average annual growth of 0.7 percent in Small C&I customer count is expected 24
through 2026 due to Residential customer growth. Use-per-customer through 2026 25
is expected to increase by 0.3 percent annually on average. Growth in the Small 26

M. B. LEUKER
Line U-20836
No.
MBL-24
C&I class is also constrained by the increase of energy efficiency programs 1
targeting Commercial and Industrial customers. For a graphical view of the small 2
C&I forecast, refer to Figure 4 below. 3
Figure 4 4
5
6
7
8
9
10
11
12
13
Q40. What is the outlook for Large C&I class sales? 14
A40. DTE Electric's service area Large C&I class sales are expected to increase by 6.7 15
percent annually on average from 2020 to the projected test period in this case. The 16
Large C&I class sales will increase 0.6 percent annually, on average, from 2020 17
through 2026. Because Large C&I sales move so robustly with conditions of the 18
local economy, it is necessary to understand the differences in near term and long-19
term growth rates. 20
21
Known and measurable events that result in a decline within the short-term were 22
incorporated into the modeling, which includes a new natural gas cogeneration 23
facility at a university. The changes are found on Exhibit A-15, Schedule E3. 24
Economic activity is expected to return to more stable levels in the mid to long- 25

M. B. LEUKER
Line U-20836
No.
MBL-25
term, which, based on historical trends, would cause the Large C&I class sales to 1
stabilize as well. As mentioned previously, Large C&I class sales are allocated 2
between seven supersector markets: education and health, trade, transportation, and 3
utilities (TTU), offices, other markets, automotive, steel and other manufacturing. 4
5
Annually, on average, from 2020 through 2026, the education and health 6
supersector is expected to decrease by 0.4 percent due to energy efficiency efforts 7
pressing down on sales. The TTU supersector is projected to decrease 2.1 percent 8
annually, on average, through 2026 due to a decrease in TTU employment and 9
energy efficiency. The office supersector is forecasted to increase 0.6 percent due 10
to an increase in employment and people returning to the office. The other markets 11
supersector is forecasted to increase 2.5 percent due to an increase in other services 12
employment. 13
14
Automotive sales will increase 1.1 percent annually, on average, from 2020 through 15
2026. The increase in automotive sales is mostly due to increased production and 16
an increase in manufacturing employment. However, other manufacturing sales are 17
projected to decrease 0.4 percent annually, on average, from 2020 through 2026. 18
The slight reduction in sales is driven by increased energy efficiency initiatives 19
outweighing the increase in production and manufacturing employment for this 20
sector. Steel sales will increase 2.8 percent annually, on average, from 2020 through 21
2026 as primary metal employment continues to increase. For a graphical view of 22
the large C&I forecast, refer to Figure 5 below. 23
24
25

M. B. LEUKER
Line U-20836
No.
MBL-26
1
2
Figure 5 3
4
5
6
7
8
9
10
11
12
Q41. What is the outlook for Other Class sales? 13
A41. DTE Electric's service area Other Class sales are expected to decrease 1.6 14
percent annually, on average, from 2020 through 2026. The Other Class consists 15
of street lighting and traffic signals. The main reason for the decline in sales is the 16
use of more energy efficient lighting. For further detail on street lighting see the 17
testimony of Company Witness Bellini. 18
19
Q42. What is the CAGR of the DTE Electric service area system peak demand from 20
2020 over the forecast period to 2026? 21
A42. As shown in Exhibit A-15, Schedule E2, page 1 of 2, DTE Electric's temperature 22
normalized service area peak demand declines from 11,246 MW in 2020 to 10,981 23
MW in 2026, representing a CAGR of -0.4 percent. The decline in peak demand 24

M. B. LEUKER
Line U-20836
No.
MBL-27
is mainly due to a decline in residential air-conditioning electricity sales, which is 1
2.1 percent on average annually, due to improvements in energy efficiency. 2
3
Q43. What is the CAGR of the DTE Electric bundled peak demand from 2020 over 4
the forecast period to 2026? 5
A43. DTE Electric’s bundled peak demand forecast declines to 10,169 MW in 2026, an 6
average compound annual growth rate of -0.7 percent. The bundled peak demand 7
forecast from 2021 to 2026 is shown in Exhibit A-15, Schedule E2, page 2 of 2. 8
9
Part IV: Electric Load Forecast Accuracy 10
11
Q44. How were the sales forecast and methodologies validated? 12
A44. DTE Electric's service area sales forecast is tracked annually for metrics purposes. 13
The Company continuously checks the accuracy of the sales forecast models. For 14
example, as shown in Exhibit A-15, Schedule E5, page 1, the DTE Electric total 15
service area forecast in 2019 was 47,081 GWh. Total weather-normalized service 16
area sales in 2019 were 46,222 GWh. This represents a 98.2 percent accuracy of 17
the 2019 total sales forecast. On average, for historical years 2016 through 2019, 18
the absolute percent variance for the total sales forecast is 0.77 percent using the 19
Company’s forecasting methods, as shown in Exhibit A-15, Schedule E5, page 1. 20
21
The Company also assesses the accuracy of the individual forecast models. For 22
example, the DTE Electric Residential service area forecast in 2019 was 14,910 23
GWh. Weather-normalized Residential sales in 2019 were 14,820 GWh. This 24
represents a 99.4 percent accuracy of the 2019 forecast. On average, for historical 25

M. B. LEUKER
Line U-20836
No.
MBL-28
years 2016 through 2019, the absolute percent variance for the Residential sales 1
forecast using the Company's Residential forecast method is 0.83 percent, as shown 2
on Exhibit A-15, Schedule E5, page 1. The forecast accuracy achieved validates 3
DTE’s forecast methodology. 4
5
Q45. Does the Company perform any benchmarking on forecast accuracy? 6
A45. Yes. The Company conducts benchmarking activity by researching forecast 7
accuracy studies. A study, conducted by ITRON in 2020, found the average 8
absolute percent variance among peer utilities in total for years 2015 through 2019 9
is 1.4 percent, as shown in Exhibit A-15, Schedule E5, page 2, while DTE’s average 10
is 0.9 percent. DTE Electric achieves better accuracy than peer utilities across the 11
nation in forecasting various customer classes, total sales, and peak demand, as 12
shown in Figure 3 below. 13
14
Figure 6 DTE Electric vs. ITRON Forecast Accuracy Benchmark 15
16
17
18
19
20
21
22
23
24
25

M. B. LEUKER
Line U-20836
No.
MBL-29
Q46. Does this complete your direct testimony? 1
A46. Yes, it does. 2