A comparison of international HRM practices by Indian and European MNEs: evidence from Africa
Upload
khangminh22Category
view
0download
0
Flexibility vs. Commitment: MNEs’ Ownership Strategy
1
FLEXIBILITY VERSUS COMMITMENT:
MNES’ OWNERSHIP STRATEGY IN CHINA
Jing Li
Faculty of business administration Simon Fraser University
8888 university drive Burnaby, BC, V5A 1S6 Phone: 1-778-782-4568 Fax: 1-778-782-2910 Email: [email protected]
URL: www.beedie.sfu.ca/profiles/JingLi
Yong Li
School of Management State University of New York at Buffalo
326K Jacobs Management Center Amherst, NY 14260
Phone: (716) 645 2522 Fax: (716) 645-5078
Email: [email protected] URL: www.buffalo.edu/~yl67
Journal of International Business Studies

Flexibility vs. Commitment: MNEs’ Ownership Strategy
2
FLEXIBILITY VERSUS COMMITMENT:
MNES’ OWNERSHIP STRATEGY IN CHINA
ABSTRACT
We investigate the following important questions in international business: How do MNEs choose
ownership strategies when facing strong uncertainty in foreign market entries? How are the choices
affected by industry contingencies? Following the key tenets of real options theory, we propose that,
under a high level of market uncertainty, MNEs choose more flexible (rather than more committed)
ownership strategies that allow adjustment of investment decisions in future. We further suggest that
using flexible strategies in response to uncertainty becomes less valuable for MNEs when the industry
they enter in the host country enjoys strong sales growth potential, requires less irreversible investments,
and has intense competition. Empirically, we analyze the ownership strategies (ownership structure and
equity share) of over 5,000 new foreign investments in manufacturing industries in China during 2000-
2006. We find qualified support for our hypotheses and discuss the industry boundary conditions of
adopting flexible ownership strategies in foreign market entries.
Key words: uncertainty, ownership strategy, real options, flexibility, commitment, China.
Flexibility vs. Commitment: MNEs’ Ownership Strategy
3
INTRODUCTION
Investing overseas presents substantial challenges for multinational enterprises (MNEs). One
fundamental challenge is how to design an appropriate ownership strategy when MNEs make new
investments in a foreign market. MNEs can commit to the market by establishing wholly owned
subsidiaries (WOSs) or taking higher equity shares; or MNEs can resort to more flexible strategies by
forming joint ventures (JVs) with local partners or taking lower equity shares. One stream of research has
often framed such a choice as determined by the need for control to minimize transaction costs arising
from asset specificity and potential partner opportunism (Anderson & Gatignon, 1986; Williamson,
1985). Another stream of research has suggested that such a choice is shaped by the institutional
environment and proposed that MNEs may exchange ownership for legitimacy in the host country (Chan
& Makino, 2007; Yiu & Makino, 2002). The current study posits that in addition to control and
legitimacy, MNE ownership strategy is also fundamentally concerned with the choice between flexibility
and commitment, an aspect that has received increasing attention in recent foreign direct investment
(FDI) research (Buckley & Casson, 1998; Chi & McGuire, 1996; Kouvelis, Axarloglou, & Sinha, 2001).
This study examines the choice between a flexible and a committed ownership strategy from a
real options perspective. This choice is important because MNEs typically face substantial uncertainty
regarding the host country market, which makes the future profit streams unpredictable (Buckley &
Casson, 1998). We propose that under highly volatile market conditions in a host country, MNEs prefer a
flexible strategy (e.g., JVs or lower equity share) over a committed strategy (e.g., WOSs or higher equity
share). We further suggest that a flexible ownership strategy, despite its value under high market
uncertainty, can incur significant opportunity costs in certain circumstances. Three such industry
contingency conditions are growth potential, investment irreversibility, and market competition (Dixit &
Pindyck, 1994, 2000; Smit & Trigeorgis, 2004). We analyze how these industry conditions may increase
or decrease the value of an ownership strategy in response to market uncertainty.
The current study contributes to real options research on international investment strategies in at
least two aspects. First, our study builds on and extends a limited number of real options studies on

Flexibility vs. Commitment: MNEs’ Ownership Strategy
4
MNEs' ownership strategies. Existing literature has examined MNEs' ownership strategies by focusing on
either switch options or growth options.1 Kouvelis and colleagues analyze how MNEs switch across
different ownership strategies in response to exchange rate volatility and adjustment costs (Axarlogiou &
Kouvelis, 2007; Kouvelis, Axarloglou, & Sinha, 2001), whereas other studies investigate how MNEs
choose an initial entry mode such as the JV under uncertainty in order to capture growth opportunities in a
host country in the future (Brouthers, Brouthers, & Werner, 2008; Chi & McGuire, 1996; Cuypers &
Martin, 2010). Our study falls in the second line of research, which suggests that MNEs tend to take a
smaller equity share or choose a JV over a WOS in response to uncertainty. We extend this line of
research by examining important industry contingency conditions (growth potential, irreversibility, and
competition) that affect the growth option value of an ownership strategy.
By testing boundary conditions of real options value embedded in an ownership strategy, our
study also helps to differentiate real options predictions from other theoretical predictions. Alternative
theoretical perspectives on risk aversion and information asymmetry (Driver & Whelan, 2001; Ghosal &
Loungani, 2000) may partially explain the negative relationship between uncertainty and investment.2 It is
thus important to examine how options value under uncertainty further depends on industry contingency
conditions (e.g., Campa, 1993; Driver, Temple, & Urga, 2006; Folta & O'Brien, 2004; Guiso & Parigi,
1999).
Second, our analysis contributes to the broader real options literature on international investment
strategy by emphasizing the impact of industry competition. A survey of the empirical research suggests
that the contingent effect of competition on the options value of an international investment remains
underexplored as compared with that of irreversibility (Li, 2007; Li, James, Madhavan, & Mahoney,
2007). We propose that competition is a critical contingency condition in the choice of international
ownership strategies under uncertainty because intense competition may reduce the exclusiveness of an
owner's right to exercise an option and thus reduce the option value of a flexible ownership strategy in
response to uncertainty (Kester, 1984; Rivoli & Salorio, 1996; Trigeorgis, 1988). While theoretical
research has discussed the importance of examining real options and international investment strategy

Flexibility vs. Commitment: MNEs’ Ownership Strategy
5
under different competitive conditions (Chi & Seth, 2009; Rivoli & Salorio, 1996), to our best knowledge,
the current study represents one of the first empirical attempts.
Our empirical analysis is based on the information of over 5,000 new foreign investments in
China’s manufacturing industries during 2000-2006. The empirical results provide largely corroborative
evidence for the real options view of MNE ownership strategy that focuses on the choice between
flexibility and commitment and the role of industry contingency conditions in shaping the choice.
Specifically, we find that MNEs are inclined to choose a more flexible ownership strategy (e.g., a
minority JV) over a more committed strategy (e.g., a WOS) under high demand volatility. However,
MNEs' sensitivity to demand volatility in making their ownership choice is reduced in industries with
strong growth potential or intense competition. Under these industry conditions, using a flexible
ownership strategy to deal with demand volatility is less valuable for MNEs.
The remainder of the study is organized as follows. We first review the literature on MNE
ownership strategies and discuss the application of real options theory to international strategy. Next, we
present our theory and hypotheses. We then discuss the methods and present the empirical results. We
conclude with a discussion of the implications of our research for theory and practice.
THEORY AND HYPOTHESES
Theoretical background
Existing research has extensively examined MNEs’ ownership strategies, mainly using
transaction cost economics (TCE) as the theoretical tool (e.g., Anderson & Gatignon, 1986; Hennart,
1988). The central tenet of TCE is to align transactions that differ in their attributes with ownership
structures in a way that minimizes transaction costs (Williamson, 1985). According to TCE, for
investments characterized by high asset specificity, integrated ownership structures, such as WOSs,
should be used to enhance MNEs’ strategic and operational control over the assets (Anderson & Gatignon,
1986) and to protect MNEs from the risk of knowledge dissemination to their partners (Davidson &
McFetridge, 1985; Hill, Hwang, & Kim, 1990). Thus, TCE advocates the use of ex ante control

Flexibility vs. Commitment: MNEs’ Ownership Strategy
6
mechanisms to minimize transaction costs arising from asset specificity and potential partner opportunism
(Williamson, 1985).
More recent research has emphasized the importance of the institutional environment and its
effect on ownership structure. When foreign ownership is not prevalent or well accepted in the host
country industry, MNEs can partner with local firms or keep the ownership level lower (Chan & Makino,
2007). By doing so, MNEs can show the local communities that their activities are not ethnocentric or
harmful to local firms, and they also obtain the local identity and legitimacy to acquire the resources that
they need in the local environment (Xu & Shenkar, 2002). On the other hand, when FDI is well accepted
in the local market, MNEs can pursue integrated ownership structures and high equity shares. Choice of
an ownership structure thus does not necessarily reflect MNEs’ deliberate efforts to economize on
transaction costs for an efficient governance mechanism but may rather be a response to pressures from
the institutional environment (Yiu & Makino, 2002).
This study offers a real options perspective on MNEs’ ownership strategy. Different from the
existing transaction cost studies that focus on control and the institutional studies that focus on legitimacy,
real options theory suggests that MNEs’ ownership strategy is also fundamentally concerned with the
choice between flexibility and commitment under uncertainty (Dixit & Pindyck, 1994; Trigeorgis, 1996).
Making international investments creates real options when managers in MNEs obtain the right but not
the obligation to take a future action (e.g., deferring, expanding, contracting, or abandoning). Real options
are valuable because they provide management with the flexibility to increase commitment or to control
losses according to the resolution of uncertainty in the business environment (Dixit & Pindyck, 1994;
Trigeorgis, 1996). Such flexibility allows MNEs to respond to future changes more quickly and smoothly
and has been considered a key to MNEs’ international competitiveness under market turbulence (Buckley
& Casson, 1998).
Existing literature that adopts a real options perspective has offered insights concerning MNEs'
ownership strategies (for a review, see Li, 2007). Among the studies that focus on switch options,
Kouvelis et al. (2001) found that MNEs are less responsive to exchange rate changes in switching among

Flexibility vs. Commitment: MNEs’ Ownership Strategy
7
WOSs, JVs, and exporting when exchange rate volatility is high, or when adjustment costs are high.
Axarlogiou & Kouvelis (2007) observed that MNEs are less likely to increase equity share in the presence
of high adjustment costs, and that this hysteresis effect of adjustment costs is stronger with higher
exchange rate volatility but weaker with higher sales growth. While the Kouvelis studies focus on the
influence of adjustment costs on subsequent ownership changes conditional on exchange rate volatility
(Axarlogiou & Kouvelis, 2007; Kouvelis, Axarloglou, & Sinha, 2001), our study examines the effects of
demand uncertainty on the initial choice of ownership strategies for new foreign investments conditional
on growth potential, investment irreversibility, and industry competition.
Empirical tests of real options predictions on MNEs' initial entry modes are rather limited, even
though existing theoretical research has elaborated on the options features of JVs compared with other
investment modes (Buckley & Casson, 1998; Chi, 2000; Lee, 2004; Pennings & Sleuwaegen, 2004).
Cuypers and Martin (2010) observed that foreign investors are inclined to take a smaller equity share in a
JV when they face strong exogenous uncertainty (e.g., exchange rate uncertainty) rather than endogenous
uncertainty (e.g., cultural uncertainty). Brouthers et al. (2008) showed that, in choosing international entry
modes, MNEs tend to adopt JVs (over WOSs) under high demand uncertainty. In this study, we have a
finer-grained analysis of MNEs’ ownership strategies by considering a full spectrum of ownership
strategies: choice of minority JVs, majority JVs, and WOSs as well as choice of equity share. More
important, our study focuses on industry contingencies under which firms design their ownership
strategies in response to uncertainty. We discuss our hypotheses below.
Uncertainty and ownership strategy
International investments are usually made under conditions of uncertainty about host-country
market developments. Real options theory suggests that it is important to keep options open and maintain
flexibility whenever an investment entails significant uncertainty and cannot be costlessly reversed (Dixit
& Pindyck, 1994; Kogut & Kulatilaka, 1994; McDonald & Siegel, 1986). It follows that, under strong

Flexibility vs. Commitment: MNEs’ Ownership Strategy
8
market uncertainty, there is a value to an ownership strategy that provides MNEs with the flexibility to act
upon new information and to change the course of action in the future. With a flexible ownership strategy,
MNEs have the opportunity to capitalize on the upside potential by increasing their level of resource
commitment if market conditions turn favorable, but to contain downside losses to the initial sunk
investment if market conditions turn adverse. On the other hand, if MNEs adopt a strategy with strong
initial commitment, they forgo the possibility of adjusting decisions in response to new information in the
future and may suffer significant losses if the environment becomes hostile. We thus expect that market
uncertainty will motivate MNEs to choose an ownership strategy that affords strong flexibility in foreign
investments.
One flexible strategy is for MNEs to use less integrated ownership structures such as JVs
(Buckley & Casson, 1998; Chi & McGuire, 1996; Reuer & Tong, 2005).3 Compared with more integrated
ownership structures such as WOSs, JVs typically require less initial resource commitment, which affords
more managerial flexibility for MNEs to adjust future decisions (for a review, see Cuypers & Martin,
2007). JVs allow MNEs to build their local presence and accumulate local experience while waiting for
further resolution of market uncertainty (Kouvelis, Axarloglou, & Sinha, 2001). If uncertainty from
market environment resolves to MNEs’ favor, MNEs can increase their investment level or acquire local
partners’ equity (Chi & McGuire, 1996). It is worth noting that WOSs can also enable MNEs to expand
their businesses without incurring extra costs. Thus, the major difference between JVs and WOSs is that
JVs provide MNEs with a stronger capability to contain downside losses when market conditions turn
hostile; MNEs can contain their losses to the initial investment (typically smaller than that in WOSs) or
sell their equity stakes to local partners (Chi & McGuire, 1996). Local JV partners provide a ready market
for divested assets from MNEs (Buckley & Casson, 1998). As insiders in the JVs, local partners
understand better the value of MNEs’ assets in the JVs than other potential outside buyers in an imperfect
market; with less information asymmetry, local partners have a higher propensity to acquire or to pay
higher prices for MNEs’ equity stakes (Akerlof, 1970; Buckley & Casson, 1998; Chi & McGuire, 1996;

Flexibility vs. Commitment: MNEs’ Ownership Strategy
9
Nanda & Williamson, 1995). Compared with divesting equity shares in JVs, divesting WOSs will likely
involve higher transaction costs due to the lack of insider buyers.
The above arguments taken together suggest that JVs provide higher options value for MNEs than
WOSs in a volatile market because JVs offer a more valuable combination of growth and abandonment
options. JVs not only serve as platforms for business expansions but also limit MNEs’ investment losses
when the future unfolds unfavorably (Buckley & Casson, 1998; Kogut, 1991; Kouvelis, Axarloglou, &
Sinha, 2001). Thus, we expect that, as the level of market uncertainty increases, so is the likelihood of
choosing a JV over a WOS.
MNEs can also improve their flexibility in response to a volatile environment by taking smaller
equity shares in their subsidiaries. Besides the above mentioned benefits provided by JVs, smaller stakes
in foreign subsidiaries (or minority JVs) can further limit the downside risk of exploration for MNEs due
to the mere fact that investment costs are smaller, especially if MNEs have to abandon their subsidiaries
(Tong, Reuer, & Peng, 2008). Meanwhile, smaller stakes (or minority JVs) still allow MNEs to take
advantage of future growth opportunities; MNEs may take actions to increase their commitment by taking
larger equity stakes, becoming majority shareholders in their JVs, or acquiring their JVs, when growth
opportunities arise. Thus, relative to more committed ownership strategies, smaller stakes (or minority
JVs) allow MNEs to be more responsive to environmental uncertainty and offer management more
flexibility to act upon new information. In a theoretical model, Lee (2004) showed that, among other
things, higher uncertainty leads to a lower optimal share of MNEs in their foreign subsidiaries. Similarly,
Cuypers and Martin (2007) suggested that an investor who intends to capture the option value of JVs will
take a smaller share, and Cuypers and Martin (2010) found that exogenous uncertainty leads foreign firms
to take lower equity shares in JVs in China.
The above arguments lead us to propose the following two hypotheses to capture 1) the impact of
uncertainty on MNEs’ choice on entry mode (a minority JV, majority JV, or WOS) and 2) the impact of
uncertainty on MNEs' equity stakes in foreign subsidiaries. Formally,

Flexibility vs. Commitment: MNEs’ Ownership Strategy
10
Hypothesis 1a: When the level of market uncertainty in a host country increases, the likelihood of choosing a minority JV by an MNE for a new investment is higher than that of choosing a majority JV, which in turn is higher than the likelihood of choosing a WOS, other things being equal.
Hypothesis 1b: The higher the level of market uncertainty in a host country, the lower the
equity shares in a new investment by an MNE, other things being equal.
H1a and H1b discuss the benefits of adopting flexible strategies under market uncertainty—that
is, the ability to adjust decisions contingent upon new information in the future. However, the option
value of a flexible ownership strategy is affected not only by market uncertainty but also by other industry
factors. Following theoretical real options studies, we consider three industry contingency factors which
affect the value of flexibility embedded in an international investment and thus alter an MNE's propensity
to use flexible strategies under uncertainty. These industry factors include growth potential (Dixit &
Pindyck, 1994; Kouvelis, Axarloglou, & Sinha, 2001), investment irreversibility (Abel, Dixit, Eberly, &
Pindyck, 1996; Dixit & Pindyck, 2000), and industry competition (Kester, 1984; Smit & Ankum, 1993;
Smit & Trigeorgis, 2004). Prior real options studies have examined how one or more of these factors and
their interaction with uncertainty influence investment level (Guiso & Parigi, 1999), market entry (Folta
& O'Brien, 2004), foreign entry (Campa, 1993), and ownership adjustments (Axarlogiou & Kouvelis,
2007; Kouvelis, Axarloglou, & Sinha, 2001). We discuss below how each factor moderates an MNE's
propensity to use a flexible ownership strategy in response to market uncertainty.
Industry growth potential
Industry growth potential has been found an important factor in affecting the value of MNE
ownership strategy. For example, Axarlogiou & Kouvelis (2007) observed that the hysteresis in adjusting
the ownership structure of a foreign subsidiary becomes weaker in the presence of high demand in the
foreign market. Belderbos & Zou (2007) found that foreign affiliates grow faster under greater demand
growth in the host country. In our context, MNEs expect higher payoffs from their investments in
industries with high growth potential. While forming a minority JV or taking a lower equity share in

Flexibility vs. Commitment: MNEs’ Ownership Strategy
11
response to uncertainty may still be sensible in a high-growth scenario, such a flexible strategy can incur
significant opportunity costs. This is because MNEs are not able to capture fully the upside potential of
their investments; they have to share the profits with their local partners or may even obtain a smaller
portion of the profits (Belderbos & Zou, 2007). Moreover, in industries with strong growth potential, the
possibility for downside scenarios to occur is relatively low, and thus downside loss protection, a major
advantage of a flexible strategy over a committed one, becomes less valuable for MNEs. In a low-growth
scenario, however, MNEs should be more concerned with the potential downside losses of their
investments. Collaborating with local partners or having smaller equity shares will thus bring in more
value for MNEs in terms of downside loss protection.
In summary, in industries with low growth potential, the opportunity costs of a flexible strategy
are lower, and we expect that MNEs will be more concerned with the negative consequences associated
with environmental shocks and be motivated to use more flexible strategies in order to deal with
undesirable situations in the future. Formally, we have the following hypothesis.
Hypothesis 2: The positive relationships between market uncertainty and the use of flexible ownership strategies, as specified in H1, are stronger in industries with lower growth potential than in industries with higher growth potential.
Investment irreversibility
In addition to industry uncertainty and growth, the real options literature has also pointed to the
importance of investment irreversibility (Dixit & Pindyck, 1994), defined as the extent to which the resale
value of an asset decreases vis-à-vis the purchase price (Abel & Eberly, 1996). When international
investments can be fully recovered or costlessly redeployed in an industry, MNEs can always choose a
committed strategy to ensure the capture of any upside potential or competitive advantage, and disinvest
should market conditions turn worse than anticipated (Rivoli & Salorio, 1996). If so, a flexible strategy
will not offer any additional benefits over a committed strategy because the downside economic loss is
completely contained with fully reversible investments. Thus, as the degree of irreversibility decreases,
the benefits of using flexible strategies in response to uncertainty will also decrease. On the other hand, in

Flexibility vs. Commitment: MNEs’ Ownership Strategy
12
industries that require highly irreversible investments, high initial commitment will substantially limit
managerial flexibility in dealing with uncertainty and may expose MNEs to significant losses if MNEs
decide to contract the investment project or withdraw from the market. In fact, Campa (1993) found that
for a given level of exchange rate volatility, when the irreversible investments necessary to enter the US
market are higher, there is a lower likelihood of entry. Axarlogiou and Kouvelis (2007) and Kouvelis et
al. (2001) also found that MNEs are less likely to make ownership adjustments under high adjustment
costs (which increase investment irreversibility). Kogut and Kulatilaka (1994) observed that investment
irreversibility (e.g., due to high switch costs from one location to another) lowers an MNE's ability to
switch across locations in response to uncertainty and thus reduces the value of establishing a
multinational network. Taken together, the above arguments suggest that adopting flexible strategies to
deal with uncertainty is more valuable when there is high investment irreversibility in an industry. Hence,
we reach the following hypothesis.
Hypothesis 3: The positive relationships between uncertainty and the use of flexible ownership strategies, as specified in H1, are stronger in industries with higher investment irreversibility than in industries with lower irreversibility.
Competition
Existing real options literature suggests that the more exclusive an owner's right to exercise a
growth option, the more valuable the option is to the owner, and that competition can considerably reduce
the exclusiveness of a firm's right to exercise a growth option and thus reduce the value of the growth
option to the firm (Kester, 1984; Rivoli & Salorio, 1996; Trigeorgis, 1988). Therefore, we consider
competition as an important force that moderates a firm's propensity to create growth options (by
adopting a flexible ownership strategy) in response to market uncertainty. In industries with intense
competition, creating an option under uncertainty is less valuable (than in industries with weak
competition) because many incumbents share the same growth option, and shared options are less
valuable "collective" opportunities (Kester, 1984: 156). When future market demand turns favorable, the
foreign entrant can exercise its growth option by increasing the investment level or equity share in its JV

Flexibility vs. Commitment: MNEs’ Ownership Strategy
13
subsidiary, but many incumbent competitors can take similar actions, which ultimately lowers the value
of the growth option possessed by the foreign entrant. It follows that in a competitive industry, the foreign
entrant will be less concerned about adopting flexible ownership strategies under uncertainty to obtain
future growth opportunities (but be more concerned about the net present value of an investment
strategy). In contrast, when entering industries with weak competition, the foreign firm will find growth
options more valuable and will thus more likely adopt flexible ownership strategies in dealing with
market uncertainty. Hence, we have the following hypothesis.
Hypothesis 4: The positive relationships between uncertainty and the use of flexible ownership strategies, as specified in H1, are stronger in industries with lower competition than in industries with higher competition.
METHOD
Data and sampling
We test our hypotheses in the context of foreign direct investments in China. China, as an
emerging market, represents a proper setting to test real options predictions because MNEs usually face
significant environmental uncertainty (Luo, 2005; Puck, Holtbrugge & Mohr, 2009; Tong & Reuer, 2007;
Xu, Zhou & Phan, 2009) and because the uncertainty MNEs face varies across different industries and
across different time periods. For instance, market and technological uncertainties have remained
significant in China due to evolving industry structures and technological standards.
We construct a sample with 5,055 new foreign investments in manufacturing industries in China
during 2000–2006, using the 2000-2006 editions of China’s Annual Census of Industrial Enterprises. The
census data, compiled by the National Bureau of Statistics of China (NBSC), contain detailed information
about a company’s operational profile including total equity, equity possessed by domestic and foreign
owners, founding year, industry type, and so on. The companies included have an assessed sales capacity
of at least five million Chinese Yuan per year. The NBSC has maintained high consistency in data
collection across time, industries, and regions, and existing international business studies have used the
census data (e.g., Buckley, Clegg, & Wang, 2002; Zhou & Li, 2008).

Flexibility vs. Commitment: MNEs’ Ownership Strategy
14
We choose the time period, 2000-2006, due to data availability. For this time period, the census
dataset includes detailed information about how much equity share is owned by foreign and domestic
investors. We need such information to measure the main variables of interest (i.e., ownership structure
and foreign equity share). During 2000-2006, government restrictions on foreign ownership in
manufacturing industries are very limited, and MNEs can thus choose their ownership strategies in most
cases. We revisit the issue of government ownership restrictions in the robustness checks. We identify
new foreign entries according to their founding-year information in China contained in the census data.
Note that these new entries are not necessarily MNEs’ first-time investments in China, and the census
data do not have information about the identity of MNEs. We manually collect information on the home
countries of MNEs, but we do not have other parent level information such as R&D and advertising
investments for our analysis. This remains a limitation of our dataset.
Our data suggest that WOSs are used in 64% of the new foreign entries in China during 2000-
2006. Recent research studies (e.g. Xia, Tan, & Tan, 2008) also suggested that WOSs represent a more
frequently adopted entry mode than JVs in recent years in China. Specifically, WOSs became a
predominant entry mode in 1997, accounting for more than half of all FDI in terms of both number and
value, and the ratio of the number of WOSs to the number of JVs has increased steadily since 1997 (Xia,
Tan, & Tan, 2008). Our sample thus indicates a similar overall trend of foreign entry modes as found in
existing studies.
Dependent variables
We use two dependent variables to measure an MNE’s ownership strategy for a new foreign
investment. Foreign equity share is constructed as the ratio of foreign equity investment divided by total
equity in a subsidiary.4 For ownership structure, we construct a categorical variable, mode, which takes
the value one if foreign equity share is no less than 95% in a subsidiary (i.e., a WOS), two if foreign
equity share is between 50% and 95% (i.e., a majority JV), and three if foreign equity share is less than
50% (i.e., a minority JV). In the robustness checks shown later, we deal with the issue whether classifying

Flexibility vs. Commitment: MNEs’ Ownership Strategy
15
50/50 JVs in the majority JV category leads to biased results. Since existing studies have primarily
examined the choice of ownership structure and research on equity share has been relatively modest (for
exceptions, see Chan & Makino, 2007; Cuypers & Martin, 2010; Delios & Beamish, 1999), our study
provides further analysis on the determinants of equity share.
Explanatory variables
Uncertainty. There are multiple sources of uncertainty that account for the randomness in a
market. We focus on demand uncertainty because it drives the fluctuation of product price which in turn
largely determines profitability (Brouthers, Brouthers, & Werner, 2008; Dixit & Pindyck, 1994). Existing
real options literature suggests that the uncertainty measure should capture the unpredictable and volatile
components of environmental uncertainty (Carruth, Dickerson, & Henley, 2000; Dixit & Pindyck, 1994;
Ghosal & Loungani, 2000). The empirical implication is that we need to forecast a trend in demand in
order to obtain the unpredictable component in market demand. The China census data available to us
contain three-digit industry information only for 2000-2006. Therefore, we do not have enough data
points to forecast the demand trend or obtain volatility for years such as 2000. We decide to use another
data source (China Statistical Yearbook, 1995-2006)5 published by NBSC, which is publicly available
and gives us at least five years to predict demand (e.g., using data between 1995 and 1999 to predict the
demand in 2000). The drawback of the yearbook data is that it only provides sales information at the two-
digit industry level.
We generate a time-varying and industry-specific measure of demand volatility. For each two-
digit industry, we first regress sales growth on its lagged value and on a linear time trend recursively from
1995-2006 (i.e., using the 1995-1999 data to predict sales growth for 2000, then using the 1995-2000 data
to predict sales growth for 2001, and so on). The forecasting equation is a variant of the rational
expectations model with a linear trend (Favero, Pesaran, & Sharma, 1994; Ghosal & Loungani, 2000). We
then measure demand volatility as the squared standard error of the regression (Favero, Pesaran, &
Sharma, 1994). Such residual-based measures of uncertainty are commonly used in real options literature

Flexibility vs. Commitment: MNEs’ Ownership Strategy
16
(Ferderer, 1993; Ghosal & Loungani, 2000; Henley, Carruth, & Dickerson, 2003; Hurn & Wright, 1994).
We consider an alternative uncertainty measure for robustness checks.
Industry growth potential. We focus on current demand growth in an industry. Accordingly, we
compute industry-level sales growth by first calculating the sales growth of each firm in a three-digit
industry at year t relative to year t-1 and then taking the average of the sales growth of all firms in the
industry.
Irreversibility. We follow previous literature (Campa, 1993) and use fixed asset ratio to capture
industry investment irreversibility. Campa (1993) suggested that an industry with a higher average fixed
asset ratio requires more sunk cost investments, possibly resulting in higher irreversibility of investments.
We first calculate the ratio of fixed assets to total assets of all firms in a three-digit industry at year t and
then take the average. We consider an alternative irreversibility measure for robustness checks.
Competition. We employ a Herfindahl measure for market concentration by utilizing firm-level
sales information contained in the census data. Due to strong regional segmentation and variation in
China (Luo, 2007), we take into consideration different provinces and municipalities in calculating
industry competition. It is reasonable to expect that foreign firms entering Beijing will be more affected
by industry competition in Beijing than by competition in Guangdong.6 We thereby use industry-level
Herfindahl index for each province or municipality to measure market competition. For a given province
(or municipality) and a given three-digit industry with n firms, we compute the Herfindahl measure as
follows:
Market concentration = 2
1
1
][∑∑=
=
n
jn
jj
j
Sales
Sales.
Our competition measure is thus time varying, industry specific, and province specific. As a high value of
market concentration indicates a low level of market competition, we measure market competition as (1 –
market concentration).

Flexibility vs. Commitment: MNEs’ Ownership Strategy
17
Control variables
While our main variables of interest are derived from real options theory, we also control for the
important determinants of ownership strategy examined by other theoretical perspectives such as TCE
and the institutional theory.
Transaction cost considerations. TCE suggests that when asset specificity is high, safeguarding
specific assets and minimizing the potential opportunistic behavior of transacting partners become crucial
for the success of MNEs. For the purpose of gaining control, MNEs would choose integrated ownership
structures (e.g., WOSs) or high equity shares for foreign investments characterized by great asset
specificity (Anderson & Gatignon, 1986). Since technology-intensive industries typically involve high
asset specificity and require strong intellectual property protection from partner opportunism (Brouthers,
2002; Gomes-Casseres, 1989; Hennart, 1991), we examine whether MNEs prefer to enter the Chinese
market using a WOS or higher equity share in such industries. We use a dummy variable, high tech
industry, to capture whether an industry is technology-intensive. We follow the classification by the
Ministry of Science and Technology of China to categorize the following as high technology industries:
medical and pharmaceutical products, special purpose equipment, transport equipment, electronic
equipment and machinery, electronics and telecommunications, and instruments and meters.7
We further control for transaction cost considerations by including industry R&D intensity and
industry adv intensity (industry advertising intensity) in China (Gomes-Casseres, 1990). Because our
census data contain firms' R&D and advertising expenditure information only for 2005 and 2006 (not for
all the other years), we generate two time-invariant intensity measures. Specifically, we first calculate the
mean level of R&D intensity (advertising intensity) for each three-digit industry in 2005 and 2006,
respectively. We then take the average of the 2005 and 2006 means to obtain a proxy for industry R&D
intensity (industry advertising intensity) for 2000-2006. We finally take a natural logarithm of the
measures for industry R&D intensity and industry advertising intensity to normalize their distributions.

Flexibility vs. Commitment: MNEs’ Ownership Strategy
18
Institutional concerns. Institutional studies suggest that MNEs may exchange ownership for
legitimacy in the host country (Chan & Makino, 2007; Yiu & Makino, 2002). To capture FDI legitimacy
in an industry, we use foreign presence, which is calculated as the ratio of the employment by all foreign
firms in operation, including JVs and WOSs, to the employment by all domestic and foreign firms in a
three-digit industry i at year t (Zhou & Li, 2008). Foreign presence in an industry may, to some extent,
reflect government ownership restrictions in the industry. However, as shown in the robustness checks
later, we find similar results after removing industries with government restrictions.
Other controls. We include a number of country, industry, and firm level variables that are likely
to influence MNEs’ ownership strategy in China. Since the census data do not contain home country
information, we collect such information from Baidu.com and Google.com (see the Appendix for more
details). As a result, we are able to include three sets of variables to control for home country
characteristics of each foreign firm in our sample. First, we include sixty-one country dummies in the
regressions. Second, we control for patent number, that is, the number of patent applications of each
home country. Since patents are indicative of national technological capabilities (Furman, Porter, & Stern,
2002), transaction cost economics would suggest that firms that are from countries with more patents are
more likely to choose integrated ownership strategies in China in order to better protect their intellectual
properties. We obtain the annual patent information from the World Intellectual Property Organization,
and our patent measure is country-specific and time-varying. Third, we control for exchange rate
volatility. Real options theory predicts that exchange rate volatility may lead to the use of flexible
ownership strategies. Following existing research (e.g., Belderbos & Zou, 2009), we measure exchange
rate volatility using the coefficient of variation of the monthly real exchange rate of the home currency
against the US dollar for each year during 2000-2006. We collect the monthly exchange rate data from
the Federal Reserve Bank Reports available in Wharton Research Data Services. Due to the Yuan-dollar
peg until 2005, we use the exchange rate between the US dollar and the home currency to proxy the
exchange rate between the Chinese Yuan and the home currency. One drawback of the exchange rate
Flexibility vs. Commitment: MNEs’ Ownership Strategy
19
volatility measure is its reduced variation due to the fact that firms from the United States face almost
zero volatility during 2000-2006.
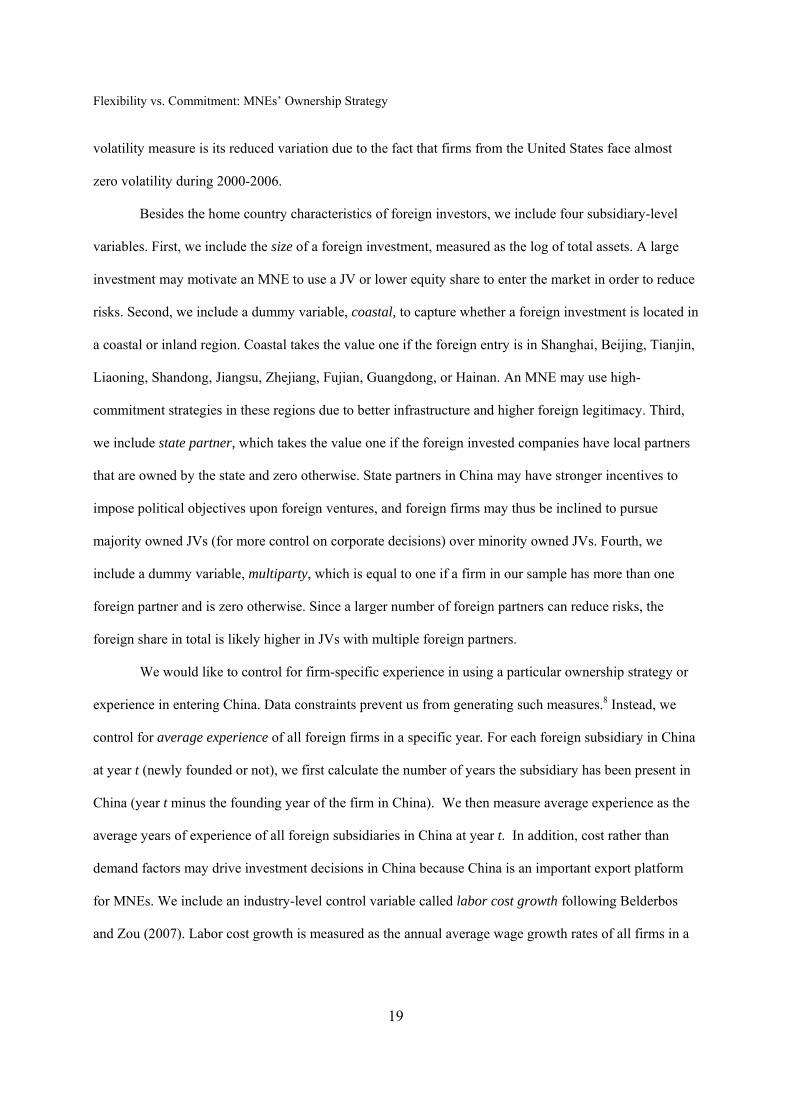
Besides the home country characteristics of foreign investors, we include four subsidiary-level
variables. First, we include the size of a foreign investment, measured as the log of total assets. A large
investment may motivate an MNE to use a JV or lower equity share to enter the market in order to reduce
risks. Second, we include a dummy variable, coastal, to capture whether a foreign investment is located in
a coastal or inland region. Coastal takes the value one if the foreign entry is in Shanghai, Beijing, Tianjin,
Liaoning, Shandong, Jiangsu, Zhejiang, Fujian, Guangdong, or Hainan. An MNE may use high-
commitment strategies in these regions due to better infrastructure and higher foreign legitimacy. Third,
we include state partner, which takes the value one if the foreign invested companies have local partners
that are owned by the state and zero otherwise. State partners in China may have stronger incentives to
impose political objectives upon foreign ventures, and foreign firms may thus be inclined to pursue
majority owned JVs (for more control on corporate decisions) over minority owned JVs. Fourth, we
include a dummy variable, multiparty, which is equal to one if a firm in our sample has more than one
foreign partner and is zero otherwise. Since a larger number of foreign partners can reduce risks, the
foreign share in total is likely higher in JVs with multiple foreign partners.
We would like to control for firm-specific experience in using a particular ownership strategy or
experience in entering China. Data constraints prevent us from generating such measures.8 Instead, we
control for average experience of all foreign firms in a specific year. For each foreign subsidiary in China
at year t (newly founded or not), we first calculate the number of years the subsidiary has been present in
China (year t minus the founding year of the firm in China). We then measure average experience as the
average years of experience of all foreign subsidiaries in China at year t. In addition, cost rather than
demand factors may drive investment decisions in China because China is an important export platform
for MNEs. We include an industry-level control variable called labor cost growth following Belderbos
and Zou (2007). Labor cost growth is measured as the annual average wage growth rates of all firms in a

Flexibility vs. Commitment: MNEs’ Ownership Strategy
20
three-digit industry. Finally, we include thirty-seven two-digit industry dummies and six year dummies in
all the estimations to control for unobservable industry- and time-varying effects.
Estimation models
We employ multinomial logit regression techniques to analyze the impact of uncertainty and
other factors on the choice among a minority JV, a majority JV, and a WOS. Multinomial logit models
should be used in cases where the alternative choices are conceptually dissimilar (Amemiya, 1981; Long
& Freese, 2006; McFadden, 1973). Our theory suggests that minority JVs, majority JVs, and WOSs are
distinct choices. Hausman tests on the assumption of the independence of irrelevant alternatives show that
eliminating one alternative does not affect the coefficient estimates specific to the remaining alternatives,
suggesting that the multinomial logit model is appropriate for our analysis.
We specify Tobit estimation models to analyze the determinants of foreign equity share. A
foreign firm chooses its equity share in a foreign subsidiary in order to maximize its profitability subject
to the constraint that the equity share cannot be larger than 100%. The constraint leads to a corner
solution where many foreign firms choose ones (in our sample 64% of the observations have 100% equity
share). Tobit models can be used to address the corner solution issue (Wooldridge, 2002).
To examine the impact of demand volatility under different industry conditions, we perform split
sample tests.9 We divide the full sample into two subsamples according to the mean or median values of
the industry conditions (sales growth, fixed asset ratio, or competition) and examine the effect of demand
volatility in each subsample. We further conduct Wald tests with the seemingly unrelated estimation
procedure to examine whether the coefficients of demand volatility are significantly different for different
subsamples.
RESULTS
We report the descriptive statistics and correlations in Table 1. As expected, demand volatility is
negatively correlated with foreign equity share, but positively with choice of a JV over a WOS. The

Flexibility vs. Commitment: MNEs’ Ownership Strategy
21
average foreign equity share in new foreign investments across different industries is 80%; 64% of new
investments use WOSs, 14% use majority JVs, and 22% use minority JVs, all suggesting strong
commitment of MNEs to the Chinese market during 2000-2006. Table 1 also suggests that none of the
correlations are concerns for multicollinearity.
----------------------------------------------------------------
INSERT TABLE 1 ABOUT HERE
----------------------------------------------------------------
We report the results on the main effects of uncertainty in Table 2. Model 1 reports the
multinomial logit regression results, and Model 2 the Tobit estimation results. Model 1 shows that
demand volatility positively affects the likelihood of choosing a majority JV over a WOS and that of
choosing a minority JV over a majority JV, but the effects are statistically insignificant. Model 1 also
shows that demand volatility has a significant positive effect on the propensity of using a minority JV
over a WOS, which is consistent with the prediction in H1a. Model 2 shows that demand volatility has a
significant negative effect on foreign equity share in a subsidiary, suggesting that an MNE commits lower
equity share to an industry with higher demand volatility. H1b thus receives empirical support. Taken
together, Table 2 provides some support for the core prediction of real options theory; that is, market
volatility encourages MNEs to choose a more flexible strategy.
----------------------------------------------------------------
INSERT TABLE 2 ABOUT HERE
----------------------------------------------------------------
We report in Tables 3a, 3b, and 3c the choice of ownership structure contingent on sales growth
potential, irreversibility, and competition, respectively. Table 3a presents how demand volatility affects
the choice of ownership structure in industries with high versus low sales growth (depending on whether
sales growth is above the mean value or not). Model 3 shows that in industries with low sales growth,
industry demand volatility significantly increases the likelihood of choosing a majority JV over a WOS as

Flexibility vs. Commitment: MNEs’ Ownership Strategy
22
well as the likelihood of choosing a minority JV over a WOS. However, as shown in Model 4, these
significant relationships disappear in industries with high sales growth. We also conduct a Wald test to
compare the coefficients of demand volatility for the two subsamples. The hypothesis that the effects of
demand volatility are the same in the subsamples with high and low sales growth is rejected (Chi2 = 8.26,
p<0.02). Taken together, these results support H2, that is, the positive relationships between market
uncertainty and the use of flexible ownership strategies are stronger in industries with lower growth
potential.
In Table 3b, Models 5 and 6 present the effects of demand volatility on choice of ownership
structure in low versus high industry investment irreversibility (depending on whether fixed asset ratio is
above the median value or not). We do not find any significant differences between the effects of demand
volatility in the two subsamples (Chi2 = 0.23, p<0.89). Models 5-6 offer no evidence supporting H3 that
industry investment irreversibility strengthens the positive effect of uncertainty on the use of a flexible
ownership strategy.
In Table 3c, Models 7 and 8 summarize how demand volatility affects ownership structure choice
in low versus high competition (depending on whether competition is above the median value or not).
Model 7 shows that, for an industry in a province with weak competition, demand volatility has
significant positive effects on the likelihood of choosing a majority JV over a WOS as well as on the
likelihood of choosing a minority JV over a WOS, whereas Model 8 does not provide evidence for such
effects under strong competition. Our Wald test also rejects the hypothesis that the effects of demand
volatility are the same in the two subsamples with high and low competition (Chi2 = 4.81, p<0.09). These
results offer support for our prediction in H4, that is, market competition reduces the positive effect of
uncertainty on the use of a flexible ownership strategy.10
----------------------------------------------------------------
INSERT TABLES 3A, 3B, AND 3C ABOUT HERE
----------------------------------------------------------------

Flexibility vs. Commitment: MNEs’ Ownership Strategy
23
Table 4 reports the effects of demand volatility on foreign equity share in three different sets of
subsamples. These results are based on Tobit estimations. Comparing results in Models 9 and 10 suggests
that demand volatility has a significant negative effect on foreign equity share only in industries with low
sales growth. We also test the hypothesis that the effects of demand volatility on equity share are
statistically the same in the subsamples with high versus low sales growth, and we find this hypothesis
rejected (Chi2 = 3.68, p< 0.06). These results provide additional support for H2, that is, the effect of
uncertainty on the use of a flexible ownership strategy is less salient in high-growth industries.
Models 11 and 12 do not show significant differences for the impact of demand volatility in
industries with high versus low investment irreversibility (Chi2 = 0.10, p<0.75). Thus, H3 is not
supported. The overall insignificant results of the irreversibility measures probably reflect the significant
difficulty in measuring irreversibility in practice, despite its theoretical importance (Campa, 1993).
Finally, Models 13 and 14 present the contrasting effects of demand volatility on foreign equity
share under competition: Demand volatility has a significant negative effect only in the subsample with
low competition. The Wald test also rejects the hypothesis that the effects of demand volatility on equity
share are the same in the subsamples with high versus low market competition (Chi2 = 4.13, p< 0.04).
These results provide further support for H4, that is, competition reduces the attractiveness of using a
flexible strategy such as lower equity share in response to market uncertainty.
----------------------------------------------------------------
INSERT TABLE 4 ABOUT HERE
----------------------------------------------------------------
To address more systematically the economic impact of demand volatility, we report in Table 5
the predicted probabilities at the mean values of all variables (Table 5a), marginal effects of demand
volatility (Table 5b), and odds ratios in response to demand volatility (Table 5c). Marginal effects refer to
how the predicted probabilities of choosing one entry mode over another changes with regard to changes
in demand volatility. Odds ratios refer to how the relative probabilities of choosing one entry mode over

Flexibility vs. Commitment: MNEs’ Ownership Strategy
24
another change in response to one unit increase in demand volatility, where one unit increase roughly
corresponds to one standard deviation change in demand volatility. Table 5c indicates that in industries
with low sales growth potential, the odds of choosing a minority JV over a WOS increase by 33%, and
the odds of choosing a majority JV over a WOS increase by 27%, with one unit increase in demand
volatility. In industries with weak competition, the odds of choosing a minority JV over a WOS increase
by 25%, and the odds of choosing a majority JV over a WOS increase by 21%, with one unit increase in
demand volatility.
----------------------------------------------------------------
INSERT TABLE 5 ABOUT HERE
----------------------------------------------------------------
Several results on the control variables are worth noting. First, Table 2 shows that the high tech
industry dummy is significantly and positively related to the choice of a WOS (Model 1). This result is
consistent with the transaction cost prediction that high tech industries require more integrated ownership
structures for tighter control of intellectual properties. Second, Table 2 shows that foreign presence in an
industry has a negative effect on the likelihood of using a majority or minority JV over a WOS by an
MNE (Model 1) and a significant positive effect on the level of foreign ownership (Model 2). These
results lend support to the institutional argument about exchanging ownership for legitimacy. Third, the
investment size has a positive effect on the use of a minority JV over a WOS and a negative effect on
foreign equity share in a subsidiary, suggesting that firms tend to use minority JVs for sharing costs and
risks. Finally, Table 2 suggests that MNEs investing in coastal regions (characterized by better investment
environments for FDI) tend to choose more committed ownership strategies.
Robustness Checks
We conduct several robustness checks. First, we re-estimate the regressions after omitting the
industries with government ownership restrictions. The Chinese government policies on entry modes of
foreign firms have evolved over time. WOSs were first made lawful in China in 1986. Since 1997, the

Flexibility vs. Commitment: MNEs’ Ownership Strategy
25
foreign investments in WOSs have surpassed those in JVs in China partially due to relaxation of
government restrictions on entry modes (Xia, Tan, & Tan, 2008). After China joined WTO in 2001,
restrictions on FDI were further relaxed. In the manufacturing industries, the only explicit ownership
restriction by the government is on auto assembly plants--foreign firms can only use JVs to enter this
industry (EIU Country Commerce, 2005, Teng, 2004). According to the 2002 Catalogue for Guiding
Foreign Investment in Industries in China, restricted foreign investments include projects in industries
requiring central planning by the state (EIU Country Commerce, 2005). We suspect that, in these
industries, foreign firms may face implicit ownership restrictions imposed by the government. We use the
census data to determine which industries may have strong central planning. Specifically, we obtain the
ratio of equity investments by the state to total equity investments in all firms in an industry. We define
an industry as a central planning industry if the ratio is no less than 60% (we also use 70% as a cutoff
point and obtain the same results). We drop twenty-six observations from the auto assembly industry and
central planning industries and rerun our regressions for the remaining sample. The results remain
unaltered.
Second, since exchange rate volatility represents an important type of macroeconomic uncertainty
affecting an MNE's investment and divestment decisions (Belderbos & Zou, 2009; Kouvelis, Axarloglou,
& Sinha, 2001), we examine how an MNE responds to exchange rate volatility under different industry
conditions as an additional test of our hypotheses. We find that exchange rate volatility has a more
significant positive effect on the use of flexible strategies in industries with lower sales growth potential,
which provides support for H2.
Third, we test our hypotheses using an alternative measure of uncertainty.11 Specifically, we
regress sales growth on its lagged value and a linear time trend and use the standard deviation of the
residuals for the past four years (Ghosal & Loungani, 2000). We find additional supportive evidence for
H2 and H4; that is, industry growth potential and competition weaken the positive relationship between
uncertainty and the use of flexible strategies.

Flexibility vs. Commitment: MNEs’ Ownership Strategy
26
Fourth, we use an industry's minimum efficient scale (MES) as an alternative measure of
irreversibility. Folta et al. (2006) argued that irreversibility is related to the amount of capital required for
entry which may be represented by the minimum efficient scale. We first rank all firms that compete in
each three-digit industry for each year, based on total assets. MES is represented by the value of the 20th
percentile of firm assets in an industry. We do not find any moderating effect of irreversibility on the
relationship between uncertainty and choice of ownership strategies.
Finally, we conduct two additional robustness tests regarding the role of 50/50 JVs. We first
exclude 50/50 JVs (191 observations) from the full sample and find consistent results in the subsample,
that is, minority JVs are more likely to be chosen over WOSs under higher uncertainty, and the choice
between minority and majority JVs as well as that between majority JVs and WOSs are not significantly
affected by uncertainty. In the second test, we treat 50/50 JVs as a separate entry mode besides minority
JVs, majority JVs, and WOSs. Using multinomial logit models, we do not find significant results with
regard to the choice of 50/50 JVs over other entry modes in response to uncertainty changes. We thereby
conclude that empirically treating 50/50 JVs as part of majority JVs does not alter our regression results.
DISCUSSION AND CONCLUSION
The current study theoretically and empirically addresses how MNEs design ownership strategies
in response to market uncertainty in foreign market entry. We proposed from a real options perspective
that MNEs’ foreign ownership strategy under market uncertainty involves the choice between flexibility
and commitment. This perspective complements existing views on MNE ownership strategies such as
transaction cost economics and the institutional theory (Anderson & Gatignon, 1986; Chan & Makino,
2007; Yiu & Makino, 2002). Our study suggests that when choosing ownership strategies in foreign
markets, MNEs should consider not only the need for control or legitimacy, but also the need for
flexibility so as to respond to future opportunities or threats. Using the ownership information for over
5,000 new foreign investments in China during 2000-2006, we found supportive evidence for the real
options view of MNE ownership strategy.

Flexibility vs. Commitment: MNEs’ Ownership Strategy
27
Our study contributes to the real options research on MNEs’ ownership strategy. Prior studies
have shown that an MNE is inclined to adopt a flexible ownership strategy in response to uncertainty
(Buckley & Casson, 1998). We found consistent evidence in our study: High demand volatility motivates
MNEs to choose a minority JV over a WOS and lower equity share over higher equity share. We
extended prior research by further investigating industry contingencies that affect the value of a flexible
ownership strategy under uncertainty. Our results suggest several industry boundary conditions for taking
an options approach towards designing ownership strategies in foreign market entries: MNEs should be
responsive to host country market uncertainty primarily in industries with low growth opportunities or
low competition. Future research can further explore the boundary conditions for the real options value of
international investment strategy along this line.
Our study suggests the importance of considering the impact of competition on firms'
international strategy under uncertainty. The result that using flexible ownership strategies (a minority JV
or lower equity share) in response to market volatility is less valuable under intense competition indicates
that adopting flexible ownership strategies to deal with market uncertainty is less beneficial for MNEs
when the options are collective or shared opportunities in an industry.
Our study also complements the stages model of internationalization (Delios & Beamish, 1999;
Johanson & Vahlne, 1977). This model predicts that as experiential learning about a foreign market
increases, uncertainty reduces and MNEs can incrementally increase their commitment in the foreign
market through a staged process (Johanson & Vahlne, 1977). Uncertainty in the stages model relates
primarily to the lack of market knowledge and as such is largely reducible through experience and
knowledge accumulation. Our study complements the internationalization theory by examining strategies
to deal with uncertainty that is largely out of control of any individual firm and is revealed over time.
Our paper has important implications for a firm’s international strategy. MNEs, when entering a
foreign market, should consider multiple sources of factors in designing their ownership strategies.
Besides concerns for transaction costs and legitimacy, MNEs must respond to market volatility and
consider the choice between flexibility and commitment. MNEs can use a minority JV or lower equity

Flexibility vs. Commitment: MNEs’ Ownership Strategy
28
share to maintain flexibility in response to future information revelation. However, MNEs should also be
aware that using a flexible ownership strategy to deal with uncertainty becomes less valuable in the
presence of high growth potential or intense competition.
There are several opportunities for future research to extend the current study and address some
of its limitations. First, as Chi and McGuire (1996) suggested, the divergent valuations of partners over a
JV’s assets may enhance the option value provided by a JV. One can extend our study by comparing the
characteristics of both partners in a JV (e.g., their relative size and capabilities) and analyzing how these
characteristics may affect an MNE’s preference for a JV in a volatile market. For example, the bargaining
costs arising from JV partners’ divergent objectives can hamper MNEs’ ability to respond to future
environmental changes and reduce the flexibility value of a JV (Belderbos & Zou, 2007; Chi & Seth,
2009).
Second, the effect of competition on options value has been a subject of discussion in both studies
that adopt a real options perspective (Kester, 1984; Rivoli & Salorio, 1996; Trigeorgis, 1988) and studies
that take a combined real options and game theoretical approach (Belderbos & Sleuwaegen, 2005; Chi &
Seth, 2009; Kulatilaka & Perotti, 1998; Smit & Ankum, 1993; Smit & Trigeorgis, 2004). The first stream
of studies emphasizes how competition may affect the exclusiveness of a firm's right to exercise an option
and thus the value of the option to the firm. The second stream stresses how strategic commitment may
generate strategic value by influencing the reactions of competitors or deterring entry by rivals, thus
reducing the value of a flexible strategy in response to uncertainty (for a review, see Li et al., 2007). Our
study followed the first stream of literature in analyzing the moderating effect of competition in firms'
adoption of a flexible ownership strategy under uncertainty. Future studies can examine more closely the
impact of competitive rivalry on a foreign firm's choice of ownership strategy by adding a competitive
dynamics perspective into real options analysis. In particular, future studies can examine the conditions
under which commitment leads to positive strategic value, which may, in turn, motivate a foreign firm to
adopt a committed ownership strategy despite strong market uncertainty.

Flexibility vs. Commitment: MNEs’ Ownership Strategy
29
Third, since our data do not contain parent firm information for an investment, future studies
could incorporate such information as an MNE’s previous experience and its firm specific advantages,
and examine whether and how parent firm characteristics may alleviate the negative impact of market
volatility on an MNE’s commitment. We suspect that the experience effect would be minimal with regard
to demand volatility because such volatility is largely out of control of individual firms.
Finally, one could extend our real options analyses of MNEs’ ownership strategies in a specific
location by considering networks of subsidiaries that MNEs have in other locations and the role of switch
options in MNEs’ ownership decisions (Belderbos & Zou, 2007). Indeed, there could be a tradeoff with
joint ventures increasing local flexibility but potentially decreasing network flexibility (the use of switch
options).

Flexibility vs. Commitment: MNEs’ Ownership Strategy
30
ACKNOWLEDGEMENT
We are grateful for the constructive guidance and insightful comments provided by the Editor, Rene Belderbos. We also thank three anonymous reviewers for their invaluable suggestions. The paper has benefited from helpful comments by Keith D. Brouthers, Lance Eliot Brouthers, and other participants at the 2009 AIB conference. We acknowledge the financial support from the Social Sciences and Humanities Research Council of Canada.
APPENDIX
Since the census data do not contain home country information for the partners or owners of each company (i.e., a JV or WOS), we hired two RAs to collect the information on the country of origin of the foreign investors in each of the 7,180 companies in our sample. Using the company names contained in our data, the RAs searched the information for each company’s foreign investor(s). The RAs mainly relied on two websites: google.com and baidu.com (the dominant web search engine in China). Originally, we also wanted to collect more firm-specific information, such as foreign investors’ names, but such information is unavailable for many companies. With this data collection effort, we were able to obtain the nations of foreign investors for 5,326 companies (the final sample size is further reduced to 5,055 due to the missing values of other variables). We had the two RAs crosscheck 100 companies of each other's work and found highly consistent results (about 99%). We also randomly checked the country of origin information for the foreign investors of 100 companies and found a 100% consistency rate. One hundred and twenty companies in our sample have more than one foreign investor, and we used the nation of the partner with a higher equity share to represent the home country of the foreign investors. Because we lost almost 2000 observations after adding the home country information, we also examined whether our new sample has similar distributions in terms of industry, year, and ownership strategies (investment mode and equity shares) with the original sample. Chi2 tests suggest no significant differences between the two samples.

Flexibility vs. Commitment: MNEs’ Ownership Strategy
31
REFERENCES
Abel, A. B., Dixit, A. K., Eberly, J. C., & Pindyck, R. S. 1996. Options, the value of capital, and investment. Quarterly Journal of Economics, 111(3): 753-777.
Abel, A. B. & Eberly, J. C. 1996. Optimal investment with costly reversibility. Review of Economic Studies, 63(4): 581-593.
Akerlof, G. A. 1970. The market for lemons: Qualitative uncertainty and the market mechanism. Quarterly Journal of Economics, 84(November): 488-500.
Allison, P. D. 1999. Comparing logit and probit coefficients across groups. Sociological Methods and Research, 28(2): 186–208.
Amemiya, T. 1981. Qualitative response models: A survey. Journal of Economic Literature, 19(4): 1483-1536.
Anderson, E. & Gatignon, H. 1986. Modes of foreign entry: A transaction cost analysis and propositions. Journal of International Business Studies, 17(3): 1-26.
Axarlogiou, K. & Kouvelis, P. 2007. Hysteresis in adjusting the ownership structure of foreign subsidiaries. International Business Review, 16(4): 494-506.
Belderbos, R. & Sleuwaegen, L. 2005. Competitive drivers and internaional plant configuration strategies: A product-level test. Strategic Management Journal, 26(6): 577-593.
Belderbos, R. & Zou, J. L. 2007. On the growth of foreign affiliates: Multinational plant networks, joint ventures, and flexibility. Journal Of International Business Studies, 38(7): 1095-1112.
Belderbos, R. & Zou, J. L. 2009. Real options and foreign affiliate divestments: A portfolio perspective. Journal Of International Business Studies, 40(4): 600-620.
Brouthers, K. D. 2002. Institutional, cultural and transaction cost influences on entry mode choice and performance. Journal of International Business Studies, 33(2): 203-221.
Brouthers, K. D., Brouthers, L. E., & Werner, S. 2008. Real options, international entry mode choice and performance. Journal of Management Studies, 45(5): 936-960.
Buckley, P. J. & Casson, M. C. 1998. Models of the multinational enterprise. Journal of International Business Studies, 29(1): 21-44.
Buckley, P. J., Clegg, J., & Wang, C. Q. 2002. The impact of inward fdi on the performance of chinese manufacturing firms. Journal of International Business Studies, 33(4): 637-655.
Campa, J. M. 1993. Entry by foreign firms in the united states under exchange-rate uncertainty. Review of Economics and Statistics, 75(4): 614-622.
Carruth, A., Dickerson, A., & Henley, A. 2000. What do we know about investment under uncertainty? Journal of Economic Survey, 14(2): 119-153.
Chan, C. M. & Makino, S. 2007. Legitimacy and multi-level institutional environments: Implications for foreign subsidiary ownership structure. Journal of International Business Studies, 38(4): 621–638.
Chi, T. 2000. Option to acquire or divest a joint venture. Strategic Management Journal, 21(6): 665-687. Chi, T. & McGuire, D. J. 1996. Collaborative ventures and value of learning: Integrating the transaction
cost and strategic option perspectives on the choice of market entry modes. Journal of International Business Studies, 27(2): 285-307.
Chi, T. & Seth, A. 2009. A dynamic model of the choice of mode for exploiting complementary capabilities. Journal Of International Business Studies, 40(3): 365-387.
Cuypers, I. R. & Martin, X. 2010. What makes and what does not make a real option? A study of equity shares in international joint ventures. Journal of International Business Studies, 41: 47–69.
Cuypers, I. R. P. & Martin, X. 2007. Joint ventures and real options: An extended perspective. Advances in Strategic Management, 24: 107-148.
Davidson, W. H. & McFetridge, D. G. 1985. Key characteristics in the choice of international technology transfer mode. Journal of International Business Studies, 16(2): 5-21.

Flexibility vs. Commitment: MNEs’ Ownership Strategy
32
Delios, A. & Beamish, P. W. 1999. Ownership strategy of japanese firms: Transactional, institutional, and experience influences. Strategic Management Journal, 20(10): 915-933.
Dixit, A. K. & Pindyck, R. S. 2000. Expandability, reversibility, and optimal capacity choice.In Brennan, M. J. & L. G. Trigeorgis, editors, Project flexibility, agency, and competition: New developments in the theory and application of real options. New York: Oxford University Press.
Dixit, A. K. & Pindyck, R. S. 1994. Investment under uncertainty. Princeton, NJ: Princeton University Press.
Driver, C., Temple, P., & Urga, G. 2006. Contrasts between types of assets in fixed investment equations as a way of testing real options theory. Journal of Business & Economic Statistics, 24(4): 432-443.
Driver, C. & Whelan, B. 2001. The effect of business risk on manufacturing investment - sectoral survey evidence from ireland. Journal of Economic Behavior & Organization, 44(4): 403-412.
Economist Intelligent Unit. 2005. China country commerce. Favero, C. A., Pesaran, M. H., & Sharma, S. 1994. A duration model of irreversible oil investment -
theory and empirical-evidence. Journal of Applied Econometrics, 9: S95-S112. Ferderer, J. P. 1993. The impact of uncertainty on aggregate investment spending: An empirical analysis.
Journal of Money Credit and Banking, 25(1): 30-48. Folta, T. B., Johnson, D. R., & O'Brien, J. 2006. Uncertainty, irreversibility, and the likelihood of entry:
An empirical assessment of the option to defer. Journal of Economic Behavior & Organization, 61(3): 432-452.
Folta, T. B. & O'Brien, J. P. 2004. Entry in the presence of dueling options. Strategic Management Journal, 25(2): 121-138.
Furman, J. L., Porter, M. E., & Stern, S. 2002. The determinants of national innovative capacity. Research Policy, 31(6): 899-933.
Ghosal, V. & Loungani, P. 2000. The differential impact of uncertainty on investment in small and large businesses. Review of Economics and Statistics, 82(2): 338-343.
Gomes-Casseres, B. 1989. Ownership structures of foreign subsidiaries - theory and evidence. Journal Of Economic Behavior & Organization, 11(1): 1-25.
Gomes-Casseres, B. 1990. Firm ownership preferences and host government restrictions: An integrated approach. Journal of International Business Studies, 21(1): 1-22.
Guiso, L. & Parigi, G. 1999. Investment and demand uncertainty. Quarterly Journal of Economics, 114(1): 185-227.
Henley, A., Carruth, A., & Dickerson, A. 2003. Industry-wide versus firm-specific uncertainty and investment: British company panel data evidence. Economics Letters, 78(1): 87-92.
Hennart, J.-F. 1991. The transaction costs theory of joint ventures: An empirical study of japanese subsidiaries in the united states. Management Science, 37(4): 483-497.
Hennart, J. F. 1988. A transaction costs theory of equity joint ventures. Strategic Management Journal, 9(4): 361-374.
Hill, C. W. L., Hwang, P., & Kim, W. C. 1990. An eclectic theory of the choice of international entry mode. Strategic Management Journal, 11(2): 117-128.
Hoetker, G. 2007. The use of logit and probit models in strategic management research: Critical issues. Strategic Management Journal, 28(4): 331-343.
Hurn, A. S. & Wright, R. E. 1994. Geology or economics? Testing models of irreversible investment using north sea oil data. Economic Journal, 104(March): 363-371.
Johanson, J. & Vahlne, J.-E. 1977. The internationalization process of the firm - a model of knowledge development and increasing foreign market commitments. Journal of International Business Studies, 8(1): 23-32.
Kester, W. C. 1984. Todays options for tomorrows growth. Harvard Business Review, 62(2): 153-160. Kogut, B. 1991. Joint ventures and the option to expand and acquire. Management Science, 37(1): 19-33.

Flexibility vs. Commitment: MNEs’ Ownership Strategy
33
Kogut, B. & Kulatilaka, N. 1994. Operating flexibility, global manufacturing, and the option value of a multinational network. Management Science, 40(1): 123-139.
Kouvelis, P., Axarloglou, K., & Sinha, V. 2001. Exchange rates and the choice of ownership structure of production facilities. Management Science, 47(8): 1063-1080.
Kulatilaka, N. & Perotti, E. C. 1998. Strategic growth options. Management Science, 44(8): 1021-1031. Lee, T. 2004. Determinants of the foreign equity share of international joint ventures. Journal of
Economic Dynamics & Control, 28(11): 2261-2275. Li, J. 2007. Real options theory and international strategy: A critical review. Advances in Strategic
Management, 24: 67-101. Li, Y., James, B., Madhavan, R., & Mahoney, J. T. 2007. Real options: Taking stock and looking ahead.
Advances in Strategic Management, 24: 31-66. Long, J. S. & Freese, J. 2006. Regression models for categorical dependent variables using stata. College
Station, TX: Stata Press. Luo, Y. D. 2007. From foreign investors to strategic insiders: Shifting parameters, prescriptions and
paradigms for mncs in china. Journal of World Business, 42(1): 14-34. Luo, Y. D. 2005. Transactional characteristics, institutional environment and joint venture contracts.
Journal of International Business Studies, 36(2): 209-230. Mason, S. & Merton, R. C. 1985. The role of contingent claims analysis in corporate finance.In Altman,
E. & M. Subrahmanyam, editors, Recent advances in corporate finance. Homewood, IL: Richard D Irwin.
McDonald, R. L. & Siegel, D. 1986. The value of waiting to invest. Quarterly Journal of Economics, 101(4): 707-727.
McFadden, D. 1973. Conditional logit analysis of qualitative choice behavior.In Zarembka, P., editor, Frontiers of econometrics. New York: Academic Press.
Nanda, A. & Williamson, P. J. 1995. Use joint ventures to ease the pain of restructuring. Harvard Business Review, 73(6): 119-128.
Pennings, E. & Sleuwaegen, L. 2004. The choice and timing of foreign direct investment under uncertainty. Economic Modelling, 21(6): 1101-1115.
Reuer, J. J. & Tong, T. W. 2005. Real options in international joint ventures. Journal of Management, 31(3): 403-423.
Rivoli, P. & Salorio, E. 1996. Foreign direct investment and investment under uncertainty. Journal of International Business Studies, 27(2): 335-357.
Seth, A. & Chi, T. L. 2005. What does a real options perspedtive add to the understanding of strategic alliances.In Rauer, J. & O. Shenker, editors, Handbook for strategic alliances. Thousand Oaks, CA: Sage Publications.
Smit, H. T. J. & Ankum, L. A. 1993. A real options and game-theoretic approach to corporate-investment strategy under competition. Financial Management, 22(3): 241-250.
Smit, H. T. J. & Trigeorgis, L. G. 2004. Strategic investment: Real options and games. Princeton, NJ: Princeton University Press.
Teng, B.-S. 2004. The wto and entry modes in china. Thunderbird International Business Review, 46(4): 381-400.
Tong, T. W. & Reuer, J. J. 2007. Real options in multinational corporations: Organizational challenges and risk implications. Journal of International Business Studies, 38(2): 215-230.
Tong, T. W., Reuer, J. J., & Peng, M. W. 2008. International joint ventures and the value of growth options. Academy Of Management Journal, 51(5): 1014-1029.
Trigeorgis, L. 1988. A conceptual options framework for capital budgeting. Advances in Futures and Options Research, 3: 145-167.
Trigeorgis, L. 1996. Real options: Managerial flexibility and strategy in resource allocation. Cambridge and London: MIT Press.
Williamson, O. E. 1985. The economic institutions of capitalism. New York: The Free Press.

Flexibility vs. Commitment: MNEs’ Ownership Strategy
34
Wooldridge, J. M. 2002. Econometric analysis of cross section and panel data. Cambridge, MA: The MIT Press.
Xia, J., Tan, J., & Tan, D. 2008. Mimetic entry and bandwagon effect: The rise and decline of international equity joint venture in china. Strategic Management Journal, 29(2): 195-217.
Xu, D. & Shenkar, O. 2002. Institutional distance and the multinational enterprise. The Academy of Management Review, 27(4): 608-618.
Yiu, D. & Makino, S. 2002. The choice between joint venture and wholly owned subsidiary: An institutional perspective. Organization Science, 13(6): 667-683.
Zhou, C. & Li, J. 2008. Product innovation in emerging market-based international joint ventures: An organizational ecology perspective. Journal of International Business Studies, 39: 1114-1132.
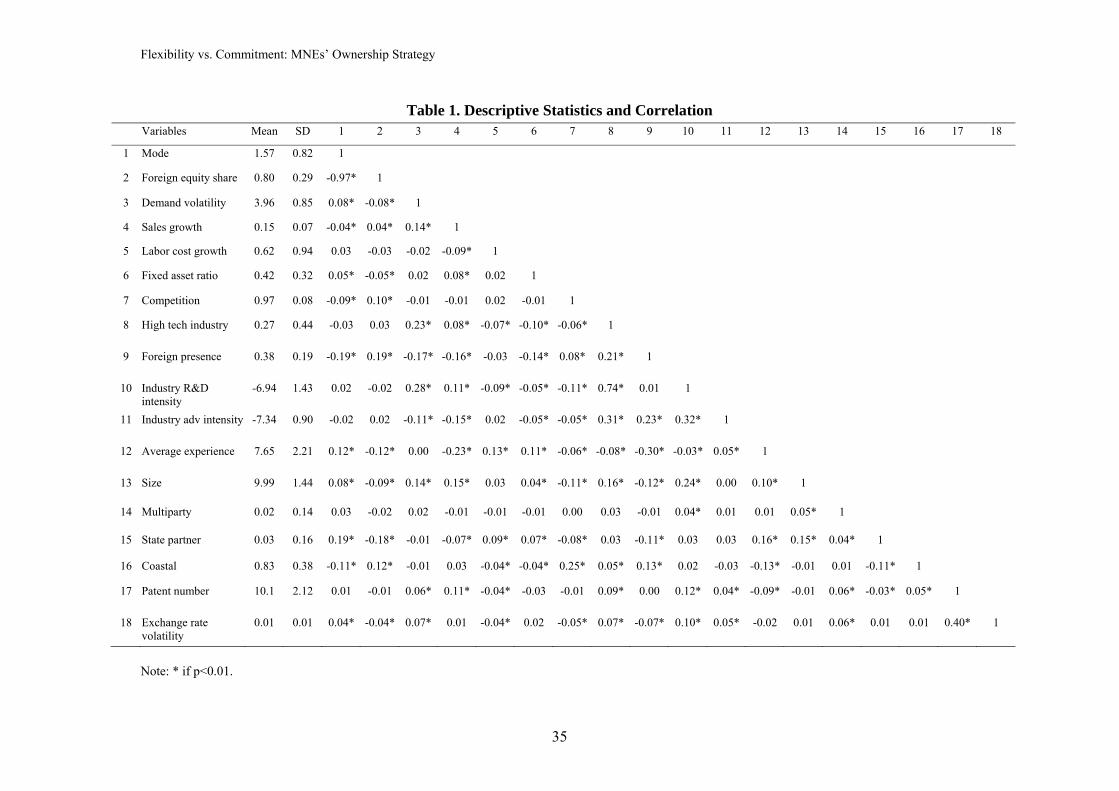
Flexibility vs. Commitment: MNEs’ Ownership Strategy
35
Table 1. Descriptive Statistics and Correlation Variables Mean SD 1 2 3 4 5 6 7 8 9 10 11 12 13 14 15 16 17 18
1 Mode 1.57 0.82 1
2 Foreign equity share 0.80 0.29 -0.97* 1
3 Demand volatility 3.96 0.85 0.08* -0.08* 1
4 Sales growth 0.15 0.07 -0.04* 0.04* 0.14* 1
5 Labor cost growth 0.62 0.94 0.03 -0.03 -0.02 -0.09* 1
6 Fixed asset ratio 0.42 0.32 0.05* -0.05* 0.02 0.08* 0.02 1
7 Competition 0.97 0.08 -0.09* 0.10* -0.01 -0.01 0.02 -0.01 1
8 High tech industry 0.27 0.44 -0.03 0.03 0.23* 0.08* -0.07* -0.10* -0.06* 1
9 Foreign presence 0.38 0.19 -0.19* 0.19* -0.17* -0.16* -0.03 -0.14* 0.08* 0.21* 1
10 Industry R&D intensity
-6.94 1.43 0.02 -0.02 0.28* 0.11* -0.09* -0.05* -0.11* 0.74* 0.01 1
11 Industry adv intensity -7.34 0.90 -0.02 0.02 -0.11* -0.15* 0.02 -0.05* -0.05* 0.31* 0.23* 0.32* 1
12 Average experience 7.65 2.21 0.12* -0.12* 0.00 -0.23* 0.13* 0.11* -0.06* -0.08* -0.30* -0.03* 0.05* 1
13 Size 9.99 1.44 0.08* -0.09* 0.14* 0.15* 0.03 0.04* -0.11* 0.16* -0.12* 0.24* 0.00 0.10* 1
14 Multiparty 0.02 0.14 0.03 -0.02 0.02 -0.01 -0.01 -0.01 0.00 0.03 -0.01 0.04* 0.01 0.01 0.05* 1
15 State partner 0.03 0.16 0.19* -0.18* -0.01 -0.07* 0.09* 0.07* -0.08* 0.03 -0.11* 0.03 0.03 0.16* 0.15* 0.04* 1
16 Coastal 0.83 0.38 -0.11* 0.12* -0.01 0.03 -0.04* -0.04* 0.25* 0.05* 0.13* 0.02 -0.03 -0.13* -0.01 0.01 -0.11* 1
17 Patent number 10.1 2.12 0.01 -0.01 0.06* 0.11* -0.04* -0.03 -0.01 0.09* 0.00 0.12* 0.04* -0.09* -0.01 0.06* -0.03* 0.05* 1
18 Exchange rate volatility
0.01 0.01 0.04* -0.04* 0.07* 0.01 -0.04* 0.02 -0.05* 0.07* -0.07* 0.10* 0.05* -0.02 0.01 0.06* 0.01 0.01 0.40* 1
Note: * if p<0.01.

Flexibility vs. Commitment: MNEs’ Ownership Strategy
36
Table 2. Main effects of uncertainty on choice of ownership structure and foreign equity share Model 1 Model 2
Majority JV (vs. WOS)
Minority JV(vs. WOS)
Minority JV (vs. majority JV)
Foreign equity share
Demand volatility 0.06 0.13* 0.06 -0.04* (0.08) (0.07) (0.09) (0.02) Sales growth -1.74* -0.65 1.09 0.31 (1.04) (0.84) (1.12) (0.24) Labor cost growth -0.01 -0.03 -0.02 0.01 (0.05) (0.04) (0.05) (0.01) Fixed assets ratio -0.56 -0.20 0.36 0.02 (0.71) (0.56) (0.77) (0.16) Competition -0.72 -1.37*** -0.65 0.45*** (0.55) (0.45) (0.56) (0.13) High tech industry -31.87*** -26.19** 5.68 0.61 (1.32) (12.07) (11.98) (2.57) Foreign presence -0.91* -1.35*** -0.44 0.46*** (0.50) (0.42) (0.55) (0.12) Industry R&D intensity 0.01 0.05 0.04 -0.02 (0.07) (0.07) (0.08) (0.02) Industry adv intensity -0.06 -0.05 0.01 0.02 (0.09) (0.08) (0.10) (0.02) Average experience 0.04* 0.00 -0.04* 0.00 (0.02) (0.02) (0.02) (0.01) Size 0.04 0.07*** 0.04 -0.02*** (0.03) (0.03) (0.04) (0.01) Multiparty 0.94*** -0.04 -0.98*** -0.12* (0.25) (0.29) (0.30) (0.07) State partner 3.98*** 3.38*** -0.60*** -0.49*** (0.48) (0.48) (0.20) (0.06) Coastal -0.34*** -0.32*** 0.01 0.10*** (0.12) (0.10) (0.13) (0.03) Patent number -0.11 0.07 0.17 0.00 (0.14) (0.12) (0.15) (0.01) Exchange rate volatility -0.24 6.10 6.34 -1.17 (7.54) (6.69) (8.23) (0.91) McFadden's R2 0.10 0.07 Count R2 0.67 - Chi2 896.98*** 543.97***Notes: The table reports multinomial logit results for Model 1 and Tobit results for Model 2. N=5055 (1,096 minority JVs, 693 majority JVs, and 3,262 WOSs). Home country, industry, year dummies, and constant are all included but not reported due to space limitation. Measures concerning the host country (China) include demand volatility, sales growth, labor cost growth, fixed asset ratio, competition, foreign presence, industry R&D intensity, and industry adv intensity. Standard errors appear in parentheses; *** if p<0.01, ** if p<0.05, * if p<0.10.

Flexibility vs. Commitment: MNEs’ Ownership Strategy
37
Table 3a. The impact of uncertainty on ownership choice: high versus low sales growth potential
Notes: The table reports multinomial logit results. N=5055. Model 3 has 498 minority JVs, 327 majority JVs, and 1,334 WOSs, and Model 4 has 598 minority JVs, 369 majority JVs, and 1,929 WOSs. Home country, industry, year dummies, and constant are all included but not reported due to space limitation. Measures for the host country (China) include demand volatility, sales growth, labor cost growth, fixed asset ratio, competition, foreign presence, industry R&D intensity, and industry adv intensity. Standard errors appear in parentheses; *** if p<0.01, ** if p<0.05, * if p<0.10.
Model 3 (Low growth) Model 4 (High growth) Majority JV
(vs. WOS) Minority JV(vs. WOS)
Minority JV (vs. majority
JV)
Majority JV (vs. WOS)
Minority JV
(vs. WOS)
Minority JV (vs. majority
JV) Demand volatility 0.24** 0.29*** 0.04 -0.17 -0.04 0.13 (0.11) (0.11) (0.13) (0.15) (0.13) (0.17)Sales growth -0.48 2.50 2.98 -0.15 0.76 0.91 (2.85) (2.48) (3.11) (1.60) (1.26) (1.73)Labor cost growth 0.00 -0.04 -0.04 -0.06 -0.05 0.01 (0.05) (0.05) (0.05) (0.17) (0.15) (0.20)Fixed assets ratio -0.55 -0.17 0.39 -0.78 -0.26 0.53 (1.44) (1.20) (1.52) (0.84) (0.67) (0.93)Competition -1.66* -1.88** -0.23 0.02 -1.42** -1.44* (0.88) (0.75) (0.84) (0.80) (0.60) (0.83)High tech industry 17.64 15.78 0.10 -30.61 -22.66 7.94 (6300) (3100) (6100) (5200) (5200) (14.44)Foreign presence -1.26 -1.47** -0.22 -0.47 -1.64*** -1.17 (0.80) (0.68) (0.84) (0.73) (0.60) (0.85)Industry RD intensity -0.03 -0.01 0.02 0.05 0.05 0.00 (0.12) (0.10) (0.13) (0.10) (0.09) (0.12)Industry adv intensity 0.02 0.17 0.14 -0.25 -0.09 0.16 (0.15) (0.14) (0.16) (0.16) (0.13) (0.18)Average experience 0.07** 0.03 -0.03 -0.01 -0.09* -0.08 (0.03) (0.03) (0.02) (0.06) (0.05) (0.07)Size 0.08 0.09* 0.01 0.00 0.07* 0.07 (0.06) (0.05) (0.06) (0.05) (0.04) (0.05)Multiparty 0.86** -0.11 -0.96** 0.95*** 0.05 -0.90** (0.39) (0.42) (0.45) (0.35) (0.40) (0.42)State partner 3.79*** 3.39*** -0.40 4.37*** 3.56*** -0.81** (0.63) (0.63) (0.28) (0.75) (0.75) (0.32)Coastal -0.25 -0.25 0.00 -0.38** -0.34** 0.05 (0.18) (0.16) (0.19) (0.17) (0.14) (0.18)Patent number -0.19 -0.08 0.11 0.75 0.43 -0.32 (0.17) (0.14) (0.18) (1.09) (0.72) (1.18)Exchange rate volatility 3.35 2.45 -0.90 -1.40 10.37 11.76 (11.80) (10.15) (12.09) (10.95) (9.63) (12.59)Observations McFadden's R2
2159
0.13 2896
0.11 Count R2
0.67 0.68Chi2 534.72*** 543.18***

Flexibility vs. Commitment: MNEs’ Ownership Strategy
38
Table 3b. The impact of uncertainty on ownership choice: high versus low irreversibility
Notes: The table reports multinomial logit results. N=5055. Model 5 has 492 minority JVs, 322 majority JVs, and 1,735 WOSs, and Model 6 has 604 minority JVs, 374 majority JVs, and 1,528 WOSs. Home country, industry, year dummies, and constant are all included but not reported due to space limitation. Measures concerning the host country (China) include demand volatility, sales growth, labor cost growth, fixed asset ratio, competition, foreign presence, industry R&D intensity, and industry adv intensity. Standard errors appear in parentheses; *** if p<0.01, ** if p<0.05, * if p<0.10.
Model 5 (Low irreversibility) Model 6 (High irreversibility) Majority
JV (vs. WOS)
Minority JV
(vs. WOS)
Minority JV (vs. majority
JV)
Majority JV(vs. WOS)
Minority JV
(vs. WOS)
Minority JV (vs. majority
JV)
Demand volatility 0.05 0.19 0.14 0.09 0.14 0.05 (0.13) (0.12) (0.16) (0.12) (0.11) (0.14)Sales growth -5.12*** -1.94 3.18* 0.79 0.13 -0.66 (1.68) (1.29) (1.86) (1.50) (1.23) (1.59)Labor cost growth -0.14 -0.02 0.13 0.01 -0.01 -0.02 (0.19) (0.15) (0.22) (0.05) (0.05) (0.05)Fixed assets ratio 3.76 -0.48 -4.24 -1.37* -0.23 1.14 (4.54) (3.72) (5.07) (0.81) (0.60) (0.87)Competition 0.18 -0.71 -0.89 -1.52** -2.08*** -0.57 (0.89) (0.72) (0.96) (0.75) (0.62) (0.73)High tech industry 14.51 -0.62 -15.13 -85.10*** -23.97 60.71*** (1400) (1.49) (1400) (1.61) (36000) (2.97)Foreign presence -1.33 -3.31*** -1.98** 0.21 -0.05 -0.27 (0.86) (0.76) (0.99) (0.70) (0.56) (0.76)Industry RD intensity 0.03 0.05 0.03 0.06 0.01 -0.05 (0.11) (0.10) (0.12) (0.15) (0.12) (0.16)Industry adv intensity 0.08 0.01 -0.07 -0.32* -0.12 0.20 (0.16) (0.13) (0.18) (0.16) (0.14) (0.17)Average experience -0.02 0.04 0.06 0.05** 0.00 -0.05** (0.07) (0.05) (0.07) (0.02) (0.02) (0.02)Size -0.04 0.09* 0.13** 0.12** 0.09** -0.03 (0.05) (0.04) (0.06) (0.05) (0.04) (0.05)Multiparty 1.04*** -0.15 -1.20*** 0.83** 0.06 -0.77* (0.35) (0.43) (0.46) (0.38) (0.40) (0.41)State partner 5.19*** 4.42*** -0.77** 3.32*** 2.87*** -0.45 (1.03) (1.04) (0.32) (0.55) (0.55) (0.28)Coastal -0.43** -0.31* 0.13 -0.24 -0.32** -0.08 (0.19) (0.16) (0.21) (0.16) (0.13) (0.17)Patent number -0.15 0.16 0.32 -0.10 -0.02 0.09 (0.21) (0.18) (0.23) (0.19) (0.16) (0.20)Exchange rate volatility -2.65 8.83 11.47 3.98 4.71 0.73 (11.05) (9.97) (12.40) (10.85) (9.41) (11.52)Observation McFadden's R2
2549 0.12
2506 0.11
Count R2 0.70 0.64 Chi2 505.44*** 505.26***

Flexibility vs. Commitment: MNEs’ Ownership Strategy
39
Table 3c. The impact of uncertainty on ownership choice: high versus low competition
Notes: The table reports multinomial logit results. N=5055. Model 7 has 609 minority JVs, 406 majority JVs, and 1,431 WOSs, and Model 8 has 487 minority JVs, 290 majority JVs, and 1,832 WOSs. Home country, industry, year dummies, and constant are all included but not reported due to space limitation. Measures concerning the host country (China) include demand volatility, sales growth, labor cost growth, fixed asset ratio, competition, foreign presence, industry R&D intensity, and industry adv intensity. Standard errors appear in parentheses; *** if p<0.01, ** if p<0.05, * if p<0.10.
Model 7 (Low competition) Model 8 (High competition) Majority JV
(vs. WOS) Minority JV (vs. WOS)
Minority JV (vs. majority JV)
Majority JV (vs. WOS)
Minority JV (vs. WOS)
Minority JV (vs. majority JV)
Demand volatility 0.19* 0.22** 0.04 -0.17 -0.02 0.14 (0.11) (0.10) (0.13) (0.14) (0.13) (0.18)Sales growth -2.56** -0.60 1.96 0.35 -0.99 -1.34 (1.31) (1.09) (1.38) (2.01) (1.59) (2.28)Labor cost growth -0.03 -0.06 -0.03 0.01 0.06 0.05 (0.05) (0.05) (0.06) (0.13) (0.12) (0.13)Fixed assets ratio -1.69 -0.80 0.89 -0.14 0.66 0.79 (1.17) (0.96) (1.23) (1.01) (0.77) (1.11)Competition -0.04 -0.90* -0.85 -120.00* 66.65 190.02** (0.63) (0.49) (0.64) (69.45) (57.95) (78.64)High tech industry -49.89*** -35.78* 14.11 -2.16 15.94 19.53 (2.45) (19.60) (19.26) (1.39) (4700) (9200)Foreign presence -0.99 -1.07* -0.07 -0.16 -1.54* -1.38 (0.67) (0.57) (0.72) (1.05) (0.80) (1.16)Industry RD intensity 0.01 0.08 0.08 -0.16 -0.21 -0.05 (0.08) (0.07) (0.09) (0.22) (0.16) (0.23)Industry adv intensity -0.13 -0.24** -0.10 0.03 0.15 0.12 (0.12) (0.10) (0.12) (0.24) (0.19) (0.27)Average experience 0.03 0.00 -0.03 0.09** -0.02 -0.10** (0.03) (0.03) (0.02) (0.04) (0.04) (0.04)Size 0.07 0.05 -0.02 -0.04 0.10** 0.14** (0.04) (0.04) (0.05) (0.06) (0.05) (0.07)Multiparty 1.40*** -0.25 -1.65*** 0.15 0.29 0.14 (0.33) (0.42) (0.41) (0.51) (0.41) (0.55)State partner 3.79*** 3.31*** -0.48** 5.06*** 3.94*** -1.11** (0.54) (0.54) (0.24) (1.13) (1.14) (0.46)Coastal -0.52*** -0.57*** -0.04 -0.06 0.02 0.08 (0.15) (0.13) (0.16) (0.22) (0.18) (0.25)Patent number -0.03 0.27* 0.30 -0.03 -0.16 -0.13 (0.18) (0.16) (0.19) (0.24) (0.18) (0.26)Exchange rate volatility 1.48 8.29 6.81 9.44 3.93 -5.51 (9.76) (8.74) (10.52) (13.64) (11.66) (15.80)Observations McFadden's R2
24460.12
26090.11
Count R2 0.63 0.71Chi2
581.51*** 445.52***

Flexibility vs. Commitment: MNEs’ Ownership Strategy
40
Table 4. Moderating effects of industry factors on the impact of uncertainty on foreign equity share
Notes: The table reports Tobit results. N=5055. Home country, industry, year dummies, and constant are all included but not reported due to space limitation. Measures concerning the host country (China) include demand volatility, sales growth, labor cost growth, fixed asset ratio, competition, foreign presence, industry R&D intensity, and industry adv intensity. Standard errors appear in parentheses; *** if p<0.01, ** if p<0.05, * if p<0.10.
Model 9 Model 10 Model 11 Model 12 Model 13 Model 14
Low growth
High growth
Low irreversibility
High irreversibility
Low competition
High competition
Demand volatility -0.06*** -0.01 -0.05 -0.03 -0.06** 0.01 (0.02) (0.04) (0.03) (0.03) (0.03) (0.04)Sales growth 0.18 -0.04 1.00*** -0.24 0.29 0.24 (0.60) (0.39) (0.37) (0.35) (0.28) (0.49)Labor cost growth 0.01 -0.06 0.01 0.01 0.02 -0.01 (0.01) (0.04) (0.04) (0.01) (0.01) (0.03)Fixed assets ratio -0.14 0.02 0.48 0.08 0.17 -0.16 (0.31) (0.21) (0.62) (0.17) (0.25) (0.24)Competition 0.49*** 0.47** 0.16 0.67*** 0.29** -12.27 (0.18) (0.19) (0.20) (0.17) (0.13) (17.73)High tech industry 0.46 0.48 0.10 1.85 3.04 0.53 (0.40) (3.22) (0.54) (2.73) (3.91) (0.43)Foreign presence 0.40** 0.60*** 0.87*** -0.05 0.38*** 0.41* (0.16) (0.19) (0.19) (0.16) (0.15) (0.25)Industry R&D intensity -0.01 -0.03 -0.03 0.01 -0.03 0.04 (0.03) (0.03) (0.02) (0.04) (0.02) (0.05)Industry adv intensity -0.02 0.05 0.01 0.05 0.06** -0.03 (0.03) (0.04) (0.04) (0.04) (0.03) (0.06)Average experience 0.00 0.029* -0.01 0.00 0.00 0.00 (0.01) (0.02) (0.01) (0.01) (0.01) (0.01)Size -0.03** -0.02* -0.03** -0.03** -0.02* -0.03* (0.01) (0.01) (0.01) (0.01) (0.01) (0.01)Multiparty -0.08 -0.16 -0.18* -0.06 -0.08 -0.17 (0.10) (0.10) (0.10) (0.11) (0.08) (0.13)State partner -0.45*** -0.62*** -0.63*** -0.37*** -0.47*** -0.63*** (0.07) (0.09) (0.09) (0.08) (0.06) (0.14)Coastal 0.05 0.13*** 0.11** 0.09** 0.16*** -0.03 (0.04) (0.04) (0.04) (0.04) (0.03) (0.05)Patent number -0.02*** 0.02*** 0.00 0.00 0.01* -0.01 (0.01) (0.01) (0.01) (0.01) (0.01) (0.01)Exchange rate volatility -1.09 -0.85 -1.40 -0.85 -0.31 -2.24 (1.26) (1.28) (1.26) (1.33) (1.09) (1.58)Observations 2159 2896 2549 2506 2446 2609McFadden's R2 0.09 0.07 0.08 0.06 0.09 0.06Chi2
308.4*** 283.0*** 320.8*** 203.9*** 324.6*** 230.8***

Flexibility vs. Commitment: MNEs’ Ownership Strategy
41
Table 5. Effects of demand volatility under different industry conditions
Table 5a. Predicted probability Full sample Sales growth Competition Low High Low High
Minority JV 0.21 0.22 0.17 0.21 0.11Majority JV 0.12 0.09 0.10 0.16 0.08WOS 0.67 0.69 0.73 0.63 0.81
Table 5b. Marginal effectMinority JV 0.020 0.044 -0.003 0.032 -0.001Majority JV 0.003 0.014 -0.015 0.017 -0.012WOS -0.023 -0.058 0.018 -0.049 0.013 Table 5c. Odds ratio Minority JV vs. WOS 1.13* 1.33** 0.96 1.25** 0.98Majority JV vs. WOS 1.06 1.27** 0.84 1.21* 0.85Minority JV vs. Majority JV 1.07 1.05 1.14 1.04 1.15
Notes: *** if p<0.01, ** if p<0.05, * if p<0.10. The predicted probabilities and marginal effects are calculated at the mean values of all variables.

Flexibility vs. Commitment: MNEs’ Ownership Strategy
42
1 Belderbos and Zou (2009) analyzed how portfolio redundancy influences the value of switch and growth
options under exchange rate volatility, but the focus is on divestment of foreign subsidiaries.
2 For example, Ghosal and Loungani (2000) found that uncertainty has a negative impact on investment
level and suggested that risk aversion and financial constraints (asymmetric information in the financial
market) are alternative explanations for these results.
3 Several studies have suggested that JV contracts may not contain explicit option clauses (Reuer & Tong,
2005; Seth & Chi, 2005). Real options theory is often applied to study investment decisions embedded
with implicit options (Mason & Merton, 1985; Trigeorgis, 1996).
4 In cases with multiple foreign partners, we use total foreign equity investment divided by total equity to
obtain foreign equity share.
5 The yearbook does not provide comparable industry-level sales information prior to 1995. It is also
worth noting that our sales measure includes both domestic and international sales (we are not able to
distinguish the two). So the uncertainty measure we calculate captures demand volatility for both local
and international sales. Thus, even for firms that are largely export oriented, our demand volatility
measure can still capture the market environment they face and affect their ownership strategies.
6 We thank the Editor for this insight.
7 http://www.stats.gov.cn.
8 We cannot track the parent firm's previous entry experience in China since the China Census data do not
contain sufficient information (e.g., the name) for us to identify the parent firm of a foreign subsidiary.
We believe that our results still hold even without a measure of firm-specific experience. Since demand
volatility is largely out of control of an individual firm, firm-specific experience may play a limited role
in affecting a firm's strategy under demand volatility. We conduct several additional robustness tests
below.
9 Results from analysis of the interaction terms between demand volatility and industry contingency
factors are consistent with those of the split sample analysis. Wald tests suggest that the subsamples are

Flexibility vs. Commitment: MNEs’ Ownership Strategy
43
significantly different from each other. Thus, we report results from the split sample analysis when
comparing the effects of our main variable (i.e., demand volatility) across different groups (Allison, 1999;
Hoetker, 2007).
10 We conducted another set of subsample analysis by dividing the full sample into one with perfect
competition (i.e., market concentration≤0.01) and the other with imperfect competition (i.e., market
concentration>0.01). We found results supporting H4, that is, a foreign firm is more likely to use flexible
ownership strategies to respond to uncertainty in industries with imperfect competition than in industries
with perfect competition.
11 Another uncertainty measure that is commonly used in real options studies is the conditional variance
of stock market returns based on GARCH models (e.g., Folta & O'Brien, 2004). It is not possible for us to
obtain such a measure for the Chinese industries because, unlike the more developed U.S. stock market,
the Chinese stock market is still at an emerging stage and does not have sufficient time series data for a
GARCH analysis.
Copyright © 2022 FDOKUMEN