
Phase joint transform sequential correlator for nonlinear binary correlations
12
Phase joint transform sequential correlator for nonlinear binary correlations Joaquı ´n Oto ´n a , Pascuala Garcia-Martinez a , Ignacio Moreno b , Javier Garcia a, * a Departament dÕOptica, Facultat de Fisica, Universitat de Vale `ncia. c/Dr. Moliner, 50. E-46100, Burjassot, Vale `ncia, Spain b Departamento de Ciencia y Tecnologı ´a de Materiales, Universidad Miguel Herna ´ ndez Avda, Ferrocarril s/n, E-03202 Elche (Alicante), Spain Received 27 July 2004; received in revised form 15 October 2004; accepted 18 October 2004 Abstract We study the performance of nonlinear optical correlations using a joint transform correlator that operates in phase- only spatial light modulation at input joint transform plane. Amplitude input nonlinear optical time sequential corre- lations have shown better discrimination and noise robustness than conventional linear correlations. Those nonlinear correlations are based on decomposing the reference and the target into binary slices and to add the contribution of all linear correlations between them. Those correlations can be easily implemented using a conventional joint transform correlator. However, the system has poor efficiency and low cross-correlation peak intensity, mainly because of the spa- tial light modulators working in amplitude mode. We use a phase-transformed input joint transform correlator in order to increase the efficiency and the discrimination. The phase morphological correlation and the phase sliced orthogonal nonlinear generalized correlation are implemented optically. We applied the method to images degraded with high degrees of substitutive noise and nonoverlapping background noise. Results show that those nonlinear phase input- encoded correlations detect the target with high discrimination capability in cases where other well-known methods fall. Ó 2004 Elsevier B.V. All rights reserved. PACS: 42.79.H; 42.30; 42.30.S Keywords: Pattern recognition; Nonlinear correlations; Joint transform correlator; Phase codification 1. Introduction The joint transform correlator (JTC) has been known for many time as a convenient way of opti- cally correlating two input images [1,2]. Most JTCs use an amplitude spatial light modulator 0030-4018/$ - see front matter Ó 2004 Elsevier B.V. All rights reserved. doi:10.1016/j.optcom.2004.10.044 * Corresponding author. Tel.: +34963544611; fax: +34963544715. E-mail address: [email protected] (J. Garcia). Optics Communications 245 (2005) 113–124 www.elsevier.com/locate/optcom
Transcript of Phase joint transform sequential correlator for nonlinear binary correlations
Optics Communications 245 (2005) 113–124
www.elsevier.com/locate/optcom
Phase joint transform sequential correlator fornonlinear binary correlations
Joaquın Oton a, Pascuala Garcia-Martinez a, Ignacio Moreno b, Javier Garcia a,*
a Departament d�Optica, Facultat de Fisica, Universitat de Valencia. c/Dr. Moliner, 50. E-46100, Burjassot, Valencia, Spainb Departamento de Ciencia y Tecnologıa de Materiales, Universidad Miguel Hernandez Avda, Ferrocarril s/n,
E-03202 Elche (Alicante), Spain
Received 27 July 2004; received in revised form 15 October 2004; accepted 18 October 2004
Abstract
We study the performance of nonlinear optical correlations using a joint transform correlator that operates in phase-
only spatial light modulation at input joint transform plane. Amplitude input nonlinear optical time sequential corre-
lations have shown better discrimination and noise robustness than conventional linear correlations. Those nonlinear
correlations are based on decomposing the reference and the target into binary slices and to add the contribution of all
linear correlations between them. Those correlations can be easily implemented using a conventional joint transform
correlator. However, the system has poor efficiency and low cross-correlation peak intensity, mainly because of the spa-
tial light modulators working in amplitude mode. We use a phase-transformed input joint transform correlator in order
to increase the efficiency and the discrimination. The phase morphological correlation and the phase sliced orthogonal
nonlinear generalized correlation are implemented optically. We applied the method to images degraded with high
degrees of substitutive noise and nonoverlapping background noise. Results show that those nonlinear phase input-
encoded correlations detect the target with high discrimination capability in cases where other well-known methods fall.
� 2004 Elsevier B.V. All rights reserved.
PACS: 42.79.H; 42.30; 42.30.S
Keywords: Pattern recognition; Nonlinear correlations; Joint transform correlator; Phase codification
0030-4018/$ - see front matter � 2004 Elsevier B.V. All rights reserv
doi:10.1016/j.optcom.2004.10.044
* Corresponding author. Tel.: +34963544611; fax:
+34963544715.
E-mail address: [email protected] (J. Garcia).
1. Introduction
The joint transform correlator (JTC) has beenknown for many time as a convenient way of opti-
cally correlating two input images [1,2]. Most
JTCs use an amplitude spatial light modulator
ed.
114 J. Oton et al. / Optics Communications 245 (2005) 113–124
(SLM) to input the joint transform data into the
optical Fourier transform system that produces
the output peaks [3]. The introduction of some
nonlinearities such as thresholding the joint power
spectrum in the JTC has shown to improve sub-stantially the discrimination [4,5]. However, in
such cases the input is introduced in the JTC as
intensity distribution. Because of that, the system
has poor efficiency and low cross-correlation peak
intensity, mainly because of the fundamentally
poor diffraction efficiency and high absorption
intrinsic to gratings written on amplitude modula-
tors. In attempt to overcome this problem, manyresearchers have used a phase SLM instead. The
optical efficiency of a system using a phase SLM
is usually high because the SLM has no absorp-
tion. So, the influence of the codification of the
amplitude distributions as phase functions in opti-
cal correlation has been widely investigated, both
in the Fourier plane (codification of the filter) [6–
9] and in the input image [10–12]. Those works re-fer mainly to Vander Lugt correlators. However,
the application to joint transform correlator is
quite direct. In fact previous to those phase input
codification systems, Johnson et al. [13] analyzed
the performance of a JTC in which the joint trans-
form intensity distribution is converted onto a
phase distribution before being input to the second
Fourier transform system. Like Vander Lugtphase only filters, the system proposed by Johnson
et al. [13] improves the light efficiency and so the
discrimination capability, however with multiple
test objects they show that multiple output peaks
appears due to nonlinearities in the system, and
some of those peaks might be false alarms. The
same result was obtained for the case of binariza-
tion nonlinearities in the JTC Fourier plane [14].Nevertheless in all previous works the conversion
from amplitude distribution to phase was done in
the Fourier plane. Lu et al. [15] introduced the
concept to using phase-encoded input representa-
tion in a joint transform correlator. In this system,
a phase-only joint input is used, the joint power
spectrum is recorded and then sent back on the liq-
uid crystal television (LCTV) panel which is mod-ulated in amplitude mode for the correlation
operation. The authors justified mathematically
the pattern discrimination improvements in com-
parison with amplitude conventional joint trans-
form correlators. Afterwards Lu and Yu [16]
showed a detailed analysis on the performance of
system proposed in [15]. They studied the advan-
tages in pattern discriminability, detection effi-ciency and noise robustness compared to
conventional JTC. An analogous study was done
also by Erbach et al. [17]. The difference was that
for Ref. [17] the JPS was encoded as a phase distri-
bution. Furthermore Ledesma et al. [18] proposed
different methods for pattern recognition that used
phase mode in joint transform correlator. They
considered three different codifications of theJPS, one in phase encoding of the JPS, the second
the binarization of the JTC and the third one was
extracting the phase of the joint transform correla-
tor. They confirmed the improvements of those
systems in comparison with amplitude JTC. In a
more recent paper, Iemmi and La Mela [19] de-
fined a JTC were the joint input scene is intro-
duced in phase modulation and the JPS isrecorded dynamically in amplitude using a photo-
refractive material. However, a preprocessed refer-
ence that provides the phase-only information of
the target in the Fourier plane is used to improve
the pattern discriminability. Regarding with noise
robustness, Page and Goudail [20] showed that if
the object to be located is perturbed with nonover-
lapping background noise, phase encoding can im-proved the performance compared with amplitude
encoding. Other papers discuss the phase encoding
in JTC introducing a phase mask in the input
plane in order to reduce the influence of the extra-
neous signals, namely autocorrelations or complex
conjugate correlations [21,22]. Note that phase
encoding methods improve the discrimination
ability of the process, and as a consequence theyare more sensitive to changes in the objects,
namely illumination, shadowing or geometrical
distortions.
All methods mentioned above deal with differ-
ent ways to obtain improvements in light efficiency
and pattern discriminability using phase spatial
light modulators, however all of them use a linear
correlation idea. From the last six years we haveproposed nonlinear correlations characterized by
a better discrimination for pattern recognition
than linear filters such as conventional matched fil-
J. Oton et al. / Optics Communications 245 (2005) 113–124 115
ters and even other well-known filtering techniques
like inverse filtering [23–25]. These correlations use
the addition of many linear correlations between
the elements of a binary decomposition of the in-
put scene and of the reference object. They canbe implemented optically using a time sequential
joint transform correlator (JTC) for adding the
joint power spectra of all the binary slices
[26,27]. In this paper, we use the phase-
transformed input joint transform correlation in
the optical implementation of the nonlinear corre-
lation. We compared the correlation obtained with
previous methods and the nonlinear correlations.Better discrimination and high noise robustness
are obtained. We have studied different noise mod-
els as correlated disjoint noise and substitutive
noise, which has been shown mathematically that
some of those nonlinear correlations are optimum
for object location in the presence of such a noise.
In Section 2 we revised the performance of the
phase-transformed input joint transform correla-tor. Section 3 deals with the definition of nonlinear
correlation using the phase codification of the joint
inputs. Optical experimental results are obtained
using a time sequential phase joint transform
correlator.
2. Performance of a phase-transformed input jointtransform correlator
We review the typical expression for a conver-
sion of an amplitude image in a phase image.
The technique of using phase-encoded images,
originally represented in gray-levels, has been pro-
ven as a process that improves, in general, the per-
formance of optical correlators. As we mention inSection 1, the approach has been implemented in
Vander Lugt correlators [11,12], and JTCs
[16,17]. The phase encoding of the amplitude
transmittance distribution s(x,y) can be expressed
as
psðx; yÞ ¼ expfjT ½sðx; yÞ�g; ð1Þ
where
T ½sðx; yÞ� ¼ sðx; yÞ � smin
smax � smin
p; ð2Þ
where smax and smin are the highest and lowest val-
ues of s(x,y), respectively. The aim of using a pphase modulation range is to maximize the dis-
tance between the maximum and the minimum
values of s(x,y) in the complex plane.As applied to JTC, the phase-encoded input can
be written as ps(x + a,y) + pr(x � a,y), where
pr(x,y) is the phase codification of the reference
object and a is a constant value that indicates the
relative displacement between the two objects.
The corresponding joint transform power spec-
trum is given by
JPSðu; vÞ ¼ jPSðu; vÞ expð�j/ðuÞÞþ PRðu; vÞ expðj/ðuÞÞj2; ð3Þ
where PS(u,v) and PR(u,v) are the Fourier trans-forms of ps(x,y) and pr(x,y), respectively, and /(u) = 2pua/(kf), with the f focal length of the lens
and k the wavelength of the illumination coherent
light.
By an inverse transformation of the JPS, the
output light field can be shown as
CP ðx; yÞ ¼ psðx; yÞ � psðx; yÞ þ prðx; yÞ � prðx; yÞþ psðx; yÞ � prðx; yÞ � dðx� 2a; yÞþ prðx; yÞ � psðx; yÞ � dðxþ 2a; yÞ; ð4Þ
where * and � denote correlation and convolu-tion, respectively.
In [15], it was shown that under certain condi-
tions the cross-correlation peak between the
phase distribution of the scene and the phase dis-
tribution of the reference is proportional to an
arbitrary constant which is related with the size
of the reference function. This value is greater
than the one obtained in the conventional JTC.Moreover, it was shown that the phase-encoded
input JTC is an optimal filtering system in terms
of maximum signal-to-noise (SNR) with additive
noise. At the same time, the signal-to-clutter ratio
[12] (SCR) was higher than that obtained for the
conventional JTC. In the following section, we
will show that although the discrimination of
those systems is improved in comparison withconventional amplitude JTC, it is not as good
as that obtained with the nonlinear correlation
define below.
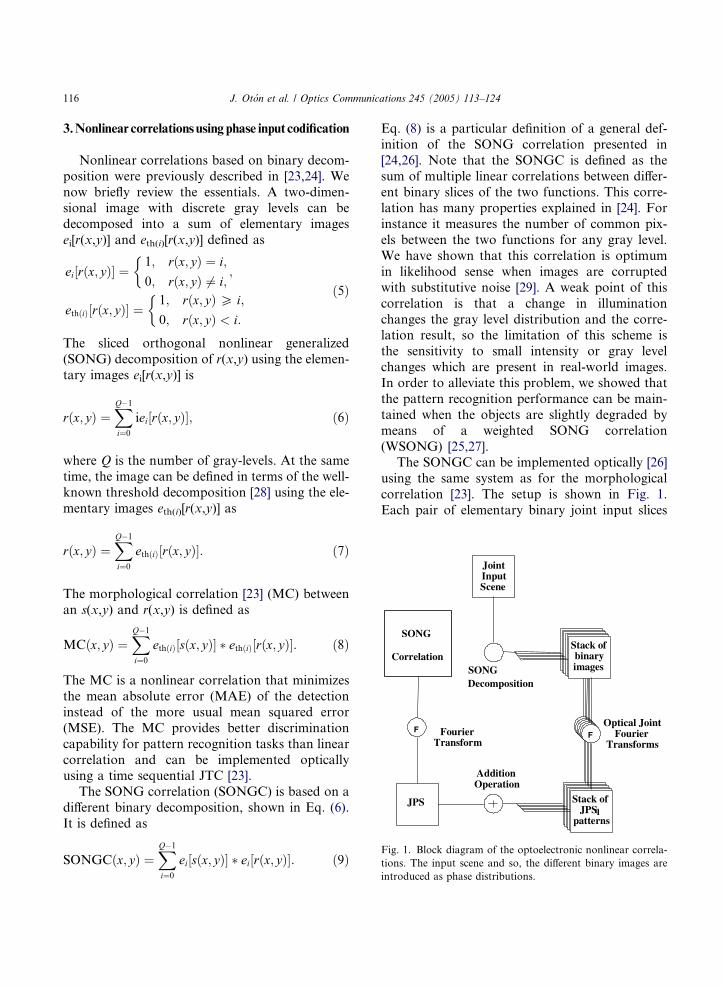
SONGDecomposition
Stack of binaryimages
Stack of JPSq
patterns
Optical Joint Fourier
Transforms
AdditionOperation
Joint Input Scene
SONG
Correlation
JPS
Fourier Transform
FF
Fig. 1. Block diagram of the optoelectronic nonlinear correla-
tions. The input scene and so, the different binary images are
introduced as phase distributions.
116 J. Oton et al. / Optics Communications 245 (2005) 113–124
3.Nonlinear correlations using phase input codification
Nonlinear correlations based on binary decom-
position were previously described in [23,24]. We
now briefly review the essentials. A two-dimen-sional image with discrete gray levels can be
decomposed into a sum of elementary images
ei[r(x,y)] and eth(i)[r(x,y)] defined as
ei½rðx; yÞ� ¼1; rðx; yÞ ¼ i;
0; rðx; yÞ 6¼ i;
�;
ethðiÞ½rðx; yÞ� ¼1; rðx; yÞ P i;
0; rðx; yÞ < i:
� ð5Þ
The sliced orthogonal nonlinear generalized
(SONG) decomposition of r(x,y) using the elemen-
tary images ei[r(x,y)] is
rðx; yÞ ¼XQ�1
i¼0
iei½rðx; yÞ�; ð6Þ
where Q is the number of gray-levels. At the same
time, the image can be defined in terms of the well-
known threshold decomposition [28] using the ele-
mentary images eth(i)[r(x,y)] as
rðx; yÞ ¼XQ�1
i¼0
ethðiÞ½rðx; yÞ�: ð7Þ
The morphological correlation [23] (MC) between
an s(x,y) and r(x,y) is defined as
MCðx; yÞ ¼XQ�1
i¼0
ethðiÞ½sðx; yÞ� � ethðiÞ½rðx; yÞ�: ð8Þ
The MC is a nonlinear correlation that minimizes
the mean absolute error (MAE) of the detection
instead of the more usual mean squared error
(MSE). The MC provides better discrimination
capability for pattern recognition tasks than linear
correlation and can be implemented opticallyusing a time sequential JTC [23].
The SONG correlation (SONGC) is based on a
different binary decomposition, shown in Eq. (6).
It is defined as
SONGCðx; yÞ ¼XQ�1
i¼0
ei½sðx; yÞ� � ei½rðx; yÞ�: ð9Þ
Eq. (8) is a particular definition of a general def-
inition of the SONG correlation presented in
[24,26]. Note that the SONGC is defined as the
sum of multiple linear correlations between differ-
ent binary slices of the two functions. This corre-lation has many properties explained in [24]. For
instance it measures the number of common pix-
els between the two functions for any gray level.
We have shown that this correlation is optimum
in likelihood sense when images are corrupted
with substitutive noise [29]. A weak point of this
correlation is that a change in illumination
changes the gray level distribution and the corre-lation result, so the limitation of this scheme is
the sensitivity to small intensity or gray level
changes which are present in real-world images.
In order to alleviate this problem, we showed that
the pattern recognition performance can be main-
tained when the objects are slightly degraded by
means of a weighted SONG correlation
(WSONG) [25,27].The SONGC can be implemented optically [26]
using the same system as for the morphological
correlation [23]. The setup is shown in Fig. 1.
Each pair of elementary binary joint input slices

J. Oton et al. / Optics Communications 245 (2005) 113–124 117
(one slice from the reference object and one from
the input scene) are placed next to each other in
the input plane. For each pair, the joint power
spectrum is performed. The summation of the
joint power spectrum for all the slices and a sec-ond Fourier transformation gives the nonlinear
correlation. If the binary representation is defined
in terms of the threshold decomposition the MC
will be obtained. If the binary representation is
the SONG decomposition then the SONGC will
be obtained. In all the previous implementations
we have used liquid crystal panels working in
amplitude modulation. As a novelty in this paper,we will use the same panels working in phase
modulation. We will perform a phase-trans-
formed input time sequential JTC to implement
the MC and SONGC. These correlation are
now defined as
PSONGCðx; yÞ ¼XQ�1
i¼0
pei½sðx; yÞ� � pei½rðx; yÞ�;
ð10Þ
where
pei½sðx; yÞ� ¼ expfjT ½ei½sðx; yÞ��g;pei½rðx; yÞ� ¼ expfjT ½ei½rðx; yÞ��g:
ð11Þ
So, Eq. (10) represents binary phase distributions
with values 0 and p, since only values one and zero
are possible for the elementary functions. So, as it
was shown in all pattern recognition optical sys-
tems, the binarization of the input in JTC is supe-rior to the classical JTC, providing significantly
higher peak intensity, a larger peak-to-sidelobe
ratio, narrower correlation width and better
cross-correlation sensitivity. Moreover, the imple-
mentation of PSONGC and PMC (defined as
Eq. (9) but changing the subscripts i by th(i)) will
have better light efficiency than the linear correla-
tion with phase only gray-scale images (see Eq. (4))because nonlinear correlations are defined in terms
of binary phase distributions. Besides the light effi-
ciency, we will obtain better discrimination than
linear correlation as we pointed out in previous
references.
So taking into account the setup showed in Fig.
1, and using a phase input, the JPS is
JPSRðu;vÞ ¼XQ�1
i¼1
JPSi
¼XQ�1
i¼1
jFTfpeiðsÞgj2 þ
XQ�1
i¼1
jFTfpeiðrÞgj2
þXQ�1
i¼1
FTfpeiðsÞg�FTfpeiðrÞgexp½�i2/iðuÞ�
þXQ�1
i¼1
FTfpeiðsÞgFTfpeiðrÞg�exp½i2/iðuÞ�:
ð12Þ
The Fourier transform of the third term of Eq.
(11) yields the PSONGC. In addition, the Fourier
transform of the fourth term is the conjugate of
the PSONGC.
4.Noise robustness in the phase nonlinear correlations
One of the aims in pattern recognition is to test
the versatility of those operations in images cor-rupted with different noise sources. We have stud-
ied the noise robustness of the PSONGC and the
PMC using two noise models: the substitutive
noise and the nonoverlapping background noise
like disjoint correlated noise. We carried out some
computer experiments to determine the stability of
various correlation methods in the presence of
such noises. We will compare the PSONGC,PMC and the phase linear correlation (see for in-
stance [15,16]).
The substitutive noise is viewed as an impul-
sive noise or outliers from a statistical point of
view. The noise will destroy part of an image,
whereas other parts remain unaffected. So an
optimum detection solution may be to find a
technique for which only this unaffected part willbe considered. This is indeed what a specific def-
inition of the SONGC [29] does, because it counts
the number of pixels of an image that remain
unaffected by the noise. In [29] we demonstrate
that SONGC is optimum using maximum likeli-
hood criteria. Now we are introducing a phase
codification of the input, so we expect that the
PSONGC will have also good performance forrecognition in the presence of substitutive noise.
Fig. 2 shows the input image used for the compu-

Fig. 2. Input scene containing reference objects (two) and a
false object.
118 J. Oton et al. / Optics Communications 245 (2005) 113–124
ter simulations. This figure contains two different
objects. The reference object is the tank placed in
the lower part. In order to compare the correla-
Fig. 3. Performance of the DC for the PSONGC (solid points), the PM
lines) when the number of pixel corrupted is varied.
tions we have defined the discrimination capabil-
ity (DC) as
DC ¼ 1� CrossCorr
AutoCorr; ð13Þ
where AutoCorr stands for the maximum value of
the autocorrelation of the reference, and Cros-
sCorr stands for the maximum value of the
cross-correlation between the two objects. A high
value of DC means that the value of the cross-
correlation is low compared to the auto-correla-tion, which means that good discrimination and
good noise robustness are achieved. On the other
hand, a low value of the ratio means that the en-
ergy of the cross-correlation has almost the same
value as that of the auto-correlation. Fig. 3 is the
performance of the DC for the PSONGC, PMC
and the phase linear correlation. Note that the
DC for the PSONGC is almost constant for thedifferent percentage of number of pixels corrupted.
Even for a highly number of pixels corrupted the
PSONGC is still able to detect the targets. In
Fig. 4 we show an input scene for a 95% of the to-
tal amount of pixels corrupted. At the same time,
C (empty points) and linear correlation with phase-input (cross-
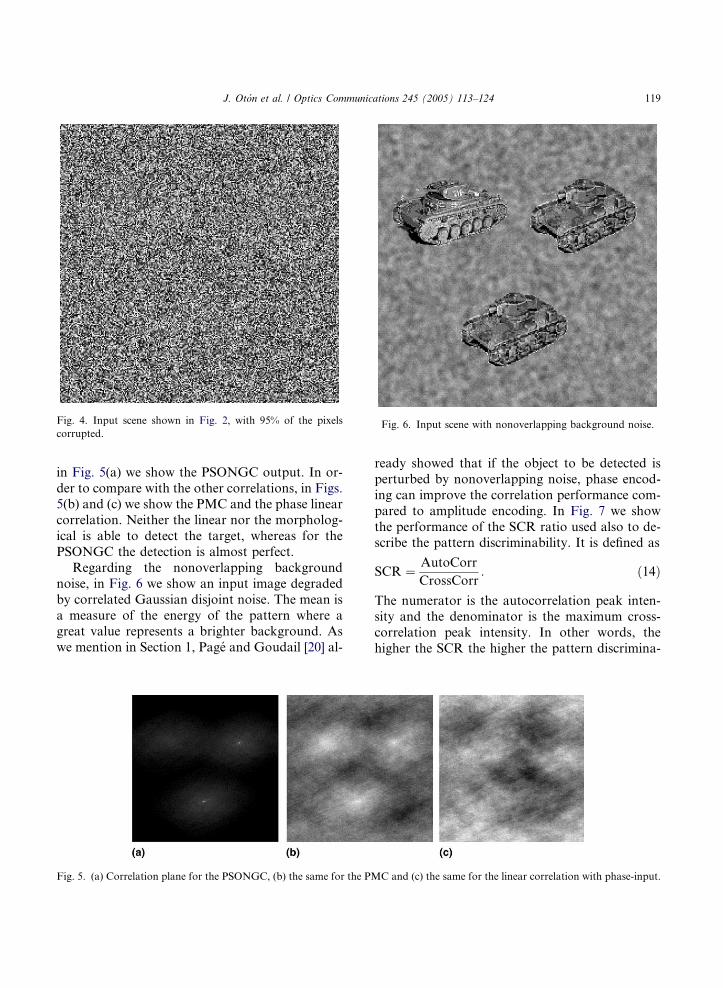
Fig. 6. Input scene with nonoverlapping background noise.Fig. 4. Input scene shown in Fig. 2, with 95% of the pixels
corrupted.
J. Oton et al. / Optics Communications 245 (2005) 113–124 119
in Fig. 5(a) we show the PSONGC output. In or-
der to compare with the other correlations, in Figs.5(b) and (c) we show the PMC and the phase linear
correlation. Neither the linear nor the morpholog-
ical is able to detect the target, whereas for the
PSONGC the detection is almost perfect.
Regarding the nonoverlapping background
noise, in Fig. 6 we show an input image degraded
by correlated Gaussian disjoint noise. The mean is
a measure of the energy of the pattern where agreat value represents a brighter background. As
we mention in Section 1, Page and Goudail [20] al-
Fig. 5. (a) Correlation plane for the PSONGC, (b) the same for the PM
ready showed that if the object to be detected is
perturbed by nonoverlapping noise, phase encod-
ing can improve the correlation performance com-
pared to amplitude encoding. In Fig. 7 we show
the performance of the SCR ratio used also to de-scribe the pattern discriminability. It is defined as
SCR ¼ AutoCorr
CrossCorr: ð14Þ
The numerator is the autocorrelation peak inten-sity and the denominator is the maximum cross-
correlation peak intensity. In other words, the
higher the SCR the higher the pattern discrimina-
C and (c) the same for the linear correlation with phase-input.
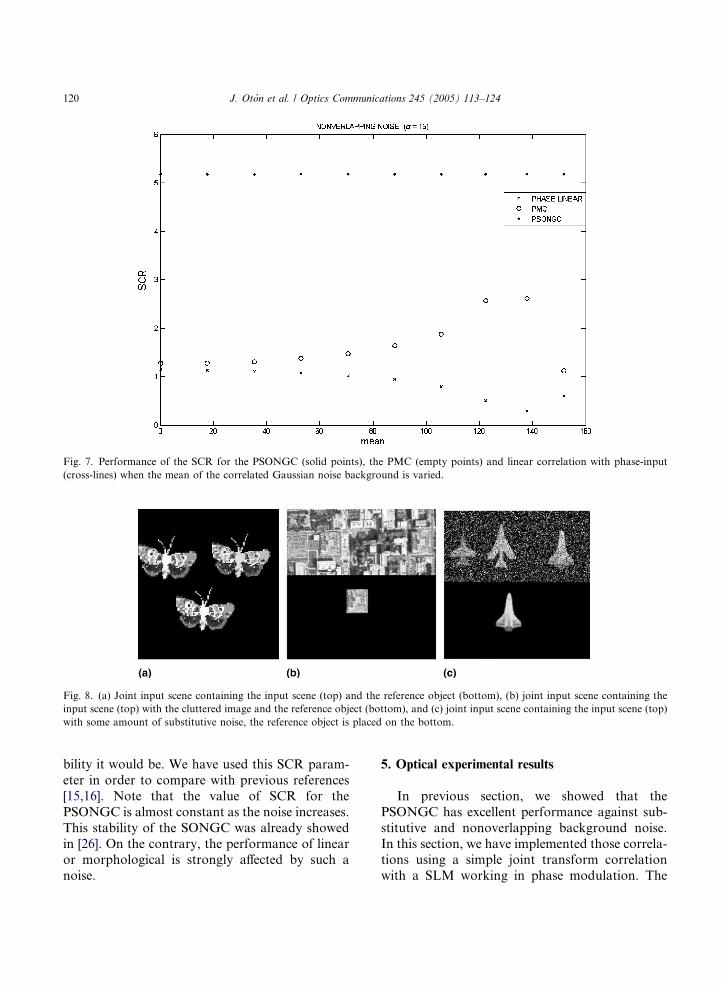
Fig. 7. Performance of the SCR for the PSONGC (solid points), the PMC (empty points) and linear correlation with phase-input
(cross-lines) when the mean of the correlated Gaussian noise background is varied.
Fig. 8. (a) Joint input scene containing the input scene (top) and the reference object (bottom), (b) joint input scene containing the
input scene (top) with the cluttered image and the reference object (bottom), and (c) joint input scene containing the input scene (top)
with some amount of substitutive noise, the reference object is placed on the bottom.
120 J. Oton et al. / Optics Communications 245 (2005) 113–124
bility it would be. We have used this SCR param-
eter in order to compare with previous references
[15,16]. Note that the value of SCR for the
PSONGC is almost constant as the noise increases.
This stability of the SONGC was already showed
in [26]. On the contrary, the performance of linearor morphological is strongly affected by such a
noise.
5. Optical experimental results
In previous section, we showed that the
PSONGC has excellent performance against sub-
stitutive and nonoverlapping background noise.
In this section, we have implemented those correla-tions using a simple joint transform correlation
with a SLM working in phase modulation. The
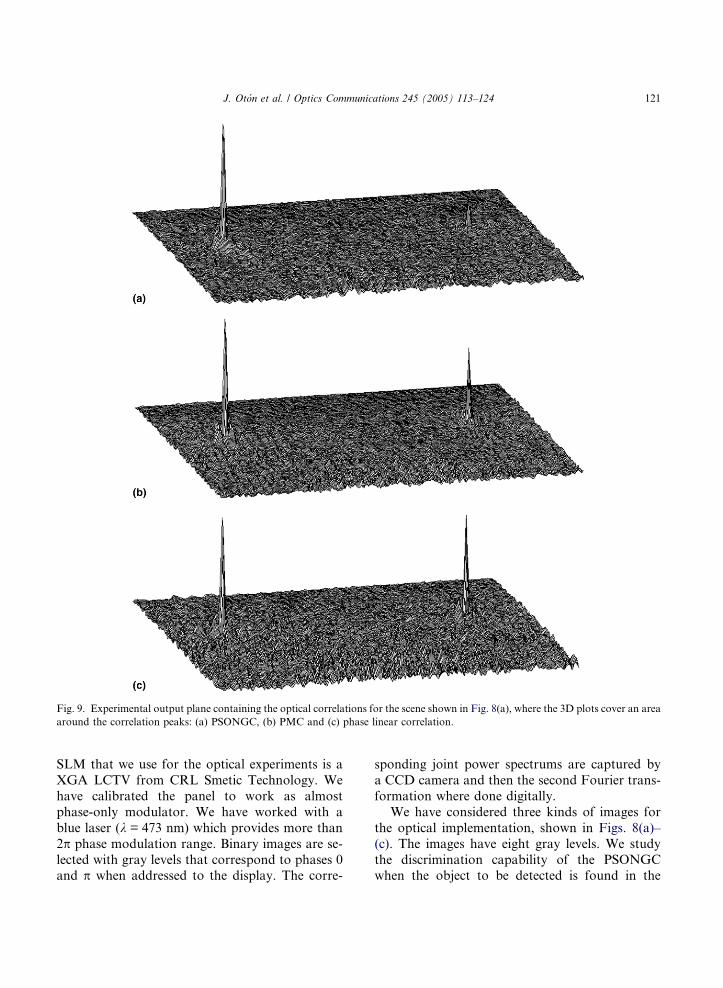
Fig. 9. Experimental output plane containing the optical correlations for the scene shown in Fig. 8(a), where the 3D plots cover an area
around the correlation peaks: (a) PSONGC, (b) PMC and (c) phase linear correlation.
J. Oton et al. / Optics Communications 245 (2005) 113–124 121
SLM that we use for the optical experiments is a
XGA LCTV from CRL Smetic Technology. We
have calibrated the panel to work as almost
phase-only modulator. We have worked with a
blue laser (k = 473 nm) which provides more than
2p phase modulation range. Binary images are se-
lected with gray levels that correspond to phases 0and p when addressed to the display. The corre-
sponding joint power spectrums are captured by
a CCD camera and then the second Fourier trans-
formation where done digitally.
We have considered three kinds of images for
the optical implementation, shown in Figs. 8(a)–
(c). The images have eight gray levels. We study
the discrimination capability of the PSONGCwhen the object to be detected is found in the
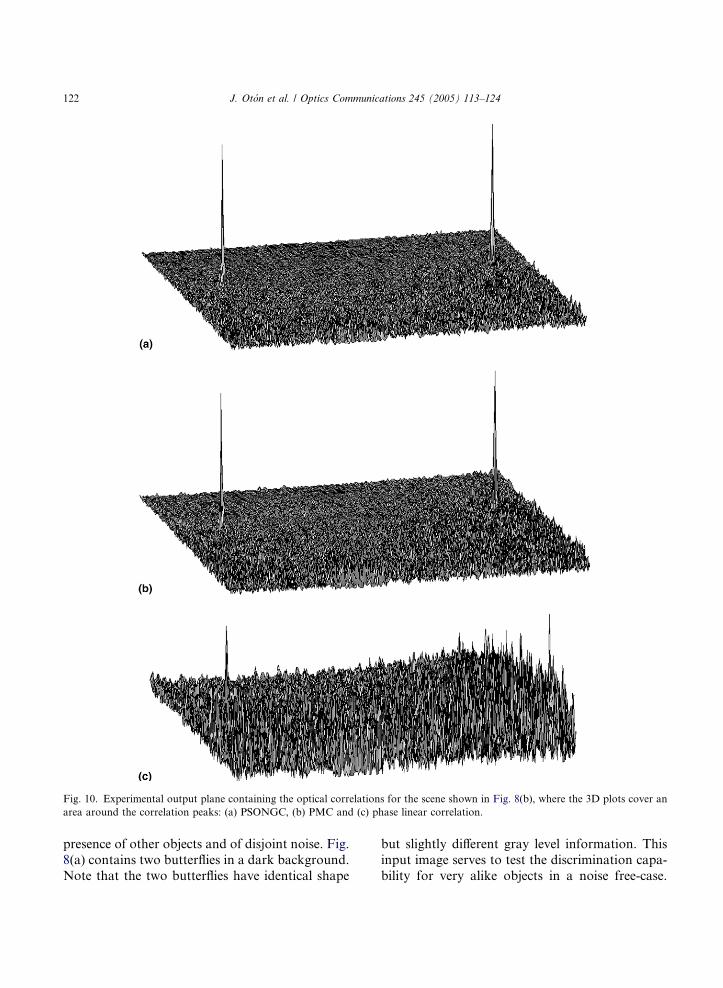
Fig. 10. Experimental output plane containing the optical correlations for the scene shown in Fig. 8(b), where the 3D plots cover an
area around the correlation peaks: (a) PSONGC, (b) PMC and (c) phase linear correlation.
122 J. Oton et al. / Optics Communications 245 (2005) 113–124
presence of other objects and of disjoint noise. Fig.
8(a) contains two butterflies in a dark background.
Note that the two butterflies have identical shape
but slightly different gray level information. This
input image serves to test the discrimination capa-
bility for very alike objects in a noise free-case.
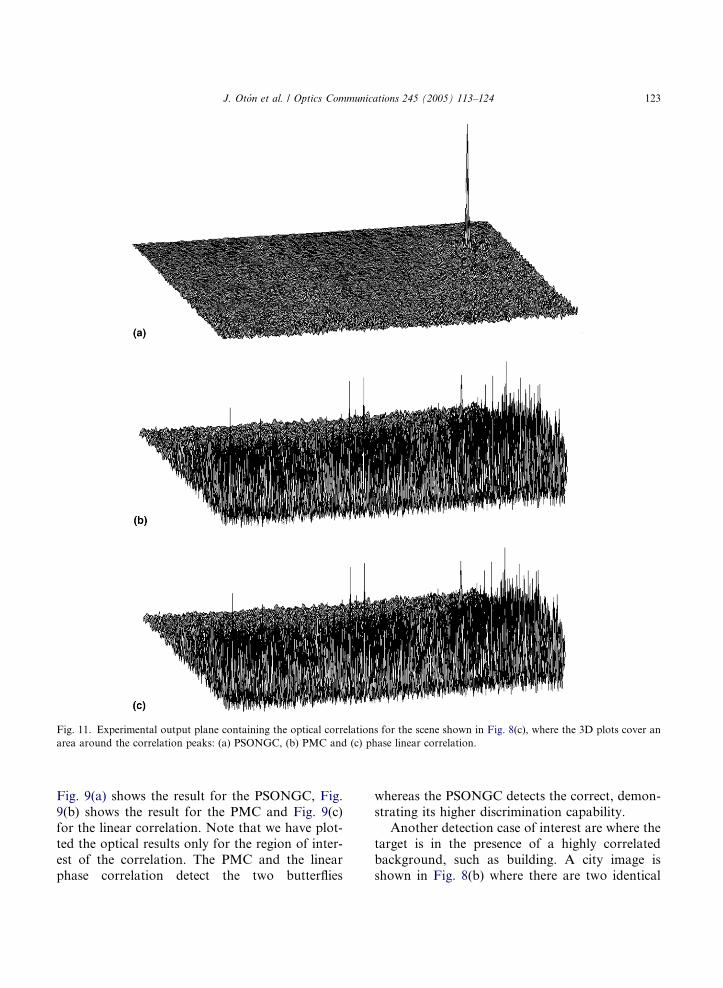
Fig. 11. Experimental output plane containing the optical correlations for the scene shown in Fig. 8(c), where the 3D plots cover an
area around the correlation peaks: (a) PSONGC, (b) PMC and (c) phase linear correlation.
J. Oton et al. / Optics Communications 245 (2005) 113–124 123
Fig. 9(a) shows the result for the PSONGC, Fig.
9(b) shows the result for the PMC and Fig. 9(c)
for the linear correlation. Note that we have plot-
ted the optical results only for the region of inter-
est of the correlation. The PMC and the linear
phase correlation detect the two butterflies
whereas the PSONGC detects the correct, demon-
strating its higher discrimination capability.
Another detection case of interest are where the
target is in the presence of a highly correlated
background, such as building. A city image is
shown in Fig. 8(b) where there are two identical
124 J. Oton et al. / Optics Communications 245 (2005) 113–124
building to be found in a specific place. The
PSONGC for Fig. 8(b) is shown in Fig. 10(a)
and PMC in Fig. 10(b). The buildings are perfectly
isolated from the background. The linear correla-
tion is plotted in Fig. 10(c). Note that the previouscorrelation fails in the detection.
As a final optical implementation case we have
studied the presence of substitutive noise. Fig. 8(c)
contains several airplanes where the target is
placed at the left part. Fig. 11(a) shows PSONGC
when Fig. 8(c) is introduced in the phase JTC.
Note that this correlation allows correct detection
for the correct target. On the contrary, the PMC(Fig. 11(b)) and the phase linear (Fig. 11(c)) corre-
lations fail again in the detection.
6. Conclusion
We have investigated the performance of non-
linear correlations when the input is phase en-coded. The nonlinear correlations are the
morphological and the SONG correlations,
respectively. We have compared the correlation
outputs with the common linear correlation.
Although the results for linear correlation with
phase-transformed input JTC give better results
in pattern discriminability, detection efficiency
and noise robustness than common amplitude in-put JTC, the use of binary decompositions of the
input still improves the pattern recognition per-
formance. Moreover, we would like to emphasize
that for strong amounts of substitutive noise, the
PSONGC is an excellent alternative for pattern
recognition where common methods fail.
Acknowledgments
This research was supported by FEDER funds,
the spanish Ministerio de Educacion y Ciencia,
project BFM2001-3004, and la Agencia Valen-
ciana de Ciencia y Tecnologia (AVCT), project
GRUPOS03/117.
References
[1] C.S Weaver, J.W. Goodman, Appl. Opt. 5 (1966) 1248.
[2] J.E. Rau, J. Opt. Soc. Am. 56 (1966) 1490.
[3] F.T.S. Yu, X.J. Lu, Opt. Commun. 52 (1984) 10.
[4] B. Javidi, Appl. Opt. 28 (1989) 2358.
[5] B. Javidi, J. Wang, Q. Tang, Appl. Opt. 30 (1991) 4234.
[6] J.L. Horner, Appl. Opt. 21 (1982) 4511.
[7] D. Psaltis, E.G. Paek, S.S. Wenkatesh, Opt. Eng. 23 (1984)
668.
[8] F.M. Dickey, L.A. Romero, Opt. Lett. 14 (1989) 4.
[9] Ph. Refregier, Opt. Lett. 16 (1991) 829.
[10] J.L. Horner, P.D. Gianino, Appl. Opt. 26 (1987) 2484.
[11] S. Maze, Ph. Refregier, Appl. Opt. 33 (1994) 6788.
[12] R.R. Kallman, D.H. Goldstein, Opt. Eng. 33 (1994)
1806.
[13] F.T.J. Johnson, T.H. Barnes, T. Eiju, T.G. Haskell, K.
Matsuda, Opt. Eng. 30 (1991) 1947.
[14] F.T.S. Yu, F. Cheng, T. Nagata, D.A. Gregory, Appl.
Opt. 28 (1989) 2988.
[15] G. Lu, Z. Zhang, F.T.S. Yu, Opt. Lett. 20 (1995) 1307.
[16] G. Lu, F.T.S. Yu, Appl. Opt. 35 (1996) 304.
[17] P.S. Erbach, D.A. Gregory, J.B. Hammock, Appl. Opt. 35
(1996) 3091.
[18] S. Ledesma, C. Iemmi, J. Campos, M.J. Yzuel, Opt.
Commun. 151 (1998) 101.
[19] C. Iemmi, C. La Mela, Opt. Commun. 209 (2002) 255.
[20] V. Page, F. Goudail, Opt. Commun. 175 (2000) 57.
[21] T. Nomura, Appl. Opt. 37 (1998) 3651.
[22] G. Lu, Z. Zhang, S. Wu, F.T.S. Yu, Appl. Opt. 36 (1997)
470.
[23] P. Garcia-Martinez, D. Mas, J. Garcia, C. Ferreira, Appl.
Opt. 37 (1998) 2112.
[24] P. Garcia-Martinez, H.H. Arsenault, Opt. Commun. 172
(1999) 181.
[25] M. Tejera, P. Garcia-Martinez, C. Ferreira, D. Lefebvre,
H.H. Arsenault, Opt. Commun. 201 (2002) 29.
[26] P. Garcia-Martinez, H.H. Arsenault, S. Roy, Opt. Com-
mun. 173 (2000) 185.
[27] P. Garcia-Martinez, M. Tejera, C. Ferreira, D. Lefebvre,
H.H. Arsenault, Appl. Opt. 41 (2002) 6867.
[28] J.P. Fitch, E.J. Coyle, N.C. Gallaguer Jr., IEEE Trans.
Acoust. Speech Signal Process. ASSP-32 (1984) 1183.
[29] P. Garcia-Martinez, Ph. Refregier, H.H. Arsenault, C.
Ferreira, Appl. Opt. 40 (2001) 3855.