Phase Decomposition and Magnetic Properties of Spinel ...
76
Phase Decomposition and Magnetic Properties of Spinel Ferrites Synthesized via High-energy Ball Mill by Yiwen Wang Bachelor of Science, Xi’an Jiaotong University, 2019 Submitted to the Graduate Faculty of the Swanson School of Engineering in partial fulfillment of the requirements for the degree of Master of Science in Materials Science and Engineering University of Pittsburgh 2021
-
Upload
khangminh22 -
Category
Documents
-
view
3 -
download
0
Transcript of Phase Decomposition and Magnetic Properties of Spinel ...
Title Page
Phase Decomposition and Magnetic Properties of Spinel Ferrites Synthesized via
High-energy Ball Mill
by
Yiwen Wang
Bachelor of Science, Xi’an Jiaotong University, 2019
Submitted to the Graduate Faculty of the
Swanson School of Engineering in partial fulfillment
of the requirements for the degree of
Master of Science in Materials Science and Engineering
University of Pittsburgh2021
ii
Committee Membership Page
UNIVERSITY OF PITTSBURGH
SWANSON SCHOOL OF ENGINEERING
This thesis was presented
by
Yiwen Wang
It was defended on
March 31, 2021
and approved by
Paul Ohodnicki, Ph.D., Associated Professor, Department of Mechanical Engineering andMaterials Science
Ahmed Talaat, Ph.D., Department of Mechanical Engineering and Materials Science
Thesis Advisor: Jung-Kun Lee, Ph.D., Professor, Department of Mechanical Engineering andMaterials Science

iii
Copyright © by Yiwen Wang
2021
iv
Abstract
Phase Decomposition and Magnetic Properties of Spinel Ferrites Synthesized via
High-energy Ball Mill
Yiwen Wang, M.S.
University of Pittsburgh, 2021
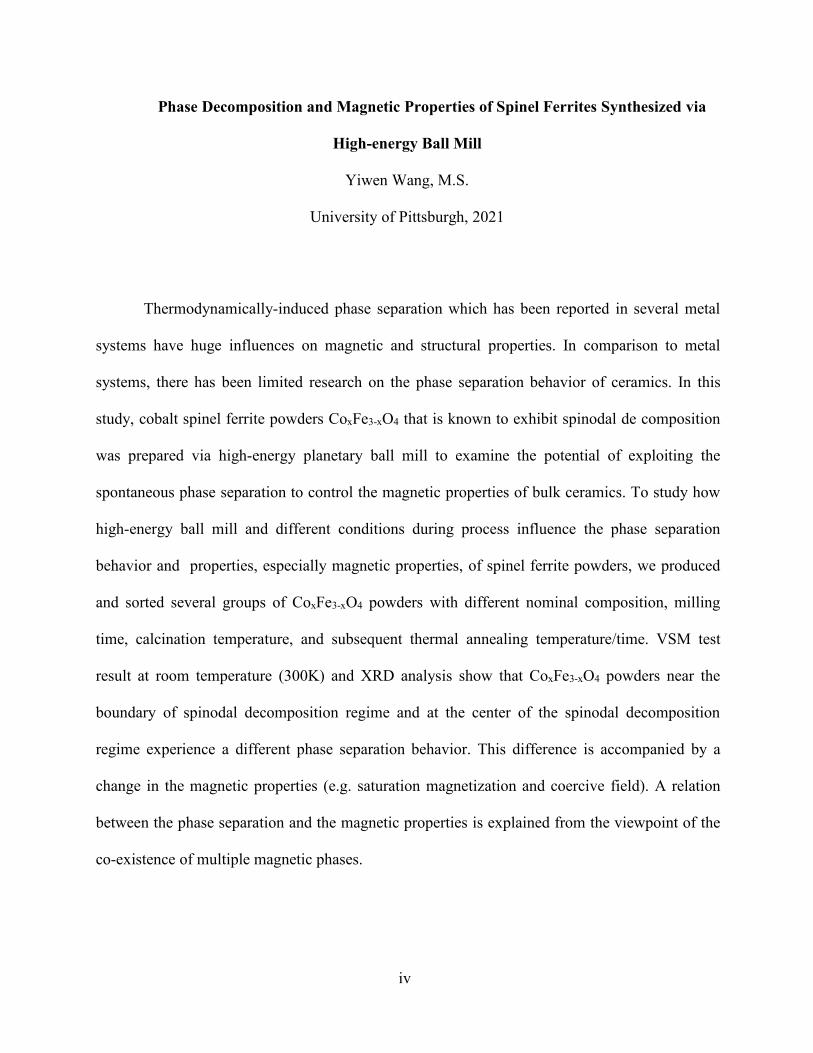
Thermodynamically-induced phase separation which has been reported in several metal
systems have huge influences on magnetic and structural properties. In comparison to metal
systems, there has been limited research on the phase separation behavior of ceramics. In this
study, cobalt spinel ferrite powders CoxFe3-xO4 that is known to exhibit spinodal de composition
was prepared via high-energy planetary ball mill to examine the potential of exploiting the
spontaneous phase separation to control the magnetic properties of bulk ceramics. To study how
high-energy ball mill and different conditions during process influence the phase separation
behavior and properties, especially magnetic properties, of spinel ferrite powders, we produced
and sorted several groups of CoxFe3-xO4 powders with different nominal composition, milling
time, calcination temperature, and subsequent thermal annealing temperature/time. VSM test
result at room temperature (300K) and XRD analysis show that CoxFe3-xO4 powders near the
boundary of spinodal decomposition regime and at the center of the spinodal decomposition
regime experience a different phase separation behavior. This difference is accompanied by a
change in the magnetic properties (e.g. saturation magnetization and coercive field). A relation
between the phase separation and the magnetic properties is explained from the viewpoint of the
co-existence of multiple magnetic phases.
v
Table of Contents
1.0 Background and Literature Review.......................................................................................1
1.1 Spinel Ferrites..................................................................................................................2
1.2 Synthesis......................................................................................................................... 10
1.2.1 Solid State Reaction........................................................................................... 11
1.2.2 Ball Mill...............................................................................................................14
1.2.3 Other Methods....................................................................................................17
1.3 Phase Decomposition.....................................................................................................20
1.4 Analysis Tools................................................................................................................ 25
1.4.1 XRD..................................................................................................................... 25
1.4.2 SEM..................................................................................................................... 26
1.4.3 VSM.....................................................................................................................28
2.0 Research Description............................................................................................................. 30
2.1 Hypothesis...................................................................................................................... 30
2.2 Objectives....................................................................................................................... 30
2.3 Tasks............................................................................................................................... 30
3.0 Experiment Procedure and Details...................................................................................... 32
3.1 Ball Milling.....................................................................................................................34
3.2 Calcination and Annealing........................................................................................... 34
3.3 Characterization............................................................................................................ 34
4.0 Results and Discussion...........................................................................................................36
4.1 Composition Near Spinodal Curve Boundary............................................................ 37
vi
4.1.1 Calcination Temperature.................................................................................. 38
4.1.2 Annealing Time.................................................................................................. 42
4.1.3 Milling Time....................................................................................................... 48
4.1.4 Fe-Co Ratio.........................................................................................................53
4.1.5 Brief Summary................................................................................................... 56
4.2 Composition In Center of Spinodal Area....................................................................57
4.3 Chemical composition................................................................................................... 61
5.0 Conclusion and prospect....................................................................................................... 63
Bibliography................................................................................................................................. 65
vii
List of Tables
Table 1 Samples made under different conditions...................................................................32
Table 2 Coercivity and Saturation Magnetization of Sample 01, 02, 03 and 04................... 41
ix
List of Figures
Fig. 1 Two octants of the unit cell of the spinel structure. A ions are on tetrahedral sites
and B ions on octahedral sites of the X2- anion packing. [1].......................................... 3
Fig. 2 Coercivity as a function of particle size [14].................................................................... 9
Fig. 3 Magnetic loss of Fe and Fe-Ni-Zn ferrite composite samples as a function of
frequency [17]...................................................................................................................13
Fig. 4 Retsch Planetary Ball Mill PM 100.................................................................................17
Fig. 5 (a) Schematic phase diagram of a binary alloy displaying a miscibility gap; (b) TEM
dark field image of precipitates in Ni–37at.%Cu–8at.%Al aged for 167 h at T =
580 ◦C; (c) TEM bright field image of Cu–36at.%Ni4at.%Cr aged for 240 h at T =
650 ◦C displaying particle alignment along the <100> matrix directions [28]........... 22
Fig. 6 TEM micrographs of samples prepared at 900 ℃ and annealed 36 h at 700 ℃
showing Moire´ fringes in different places within the crystal [30]..............................24
Fig. 7 XRD pattern of Co1.73Fe1.27O4 powder quenched at 900 ℃ and annealed at 700 ℃ 36
h and 120 h [31]................................................................................................................26
Fig. 8 Microstructure of Ni–Zn ferrite samples prepared by a solid-state reaction, b sol–gel
route [32]...........................................................................................................................27
Fig. 9 VSM [33]........................................................................................................................... 29
Fig. 10 phase diagram of Fe-Co-O system [29]........................................................................ 36
Fig. 11 XRD result of Sample 01, 02, 03 and 04 (from bottom to top)...................................38
Fig. 12 Mean particle size of sample 01, 02, 03 and 04 (from left to right)............................39
x
Fig. 13 Hysteresis loops of sample 01, 02, 03 and 04................................................................40
Fig. 14 XRD result of Sample 05, 06, 07 and 08 (from bottom to top)...................................43
Fig. 15 SEM (10000×) pictures of sample 06 (a), 07 (b), 08 (c)..............................................44
Fig. 16 Mean particle size of sample 05, 06, 07 and 08 (from left to right)............................45
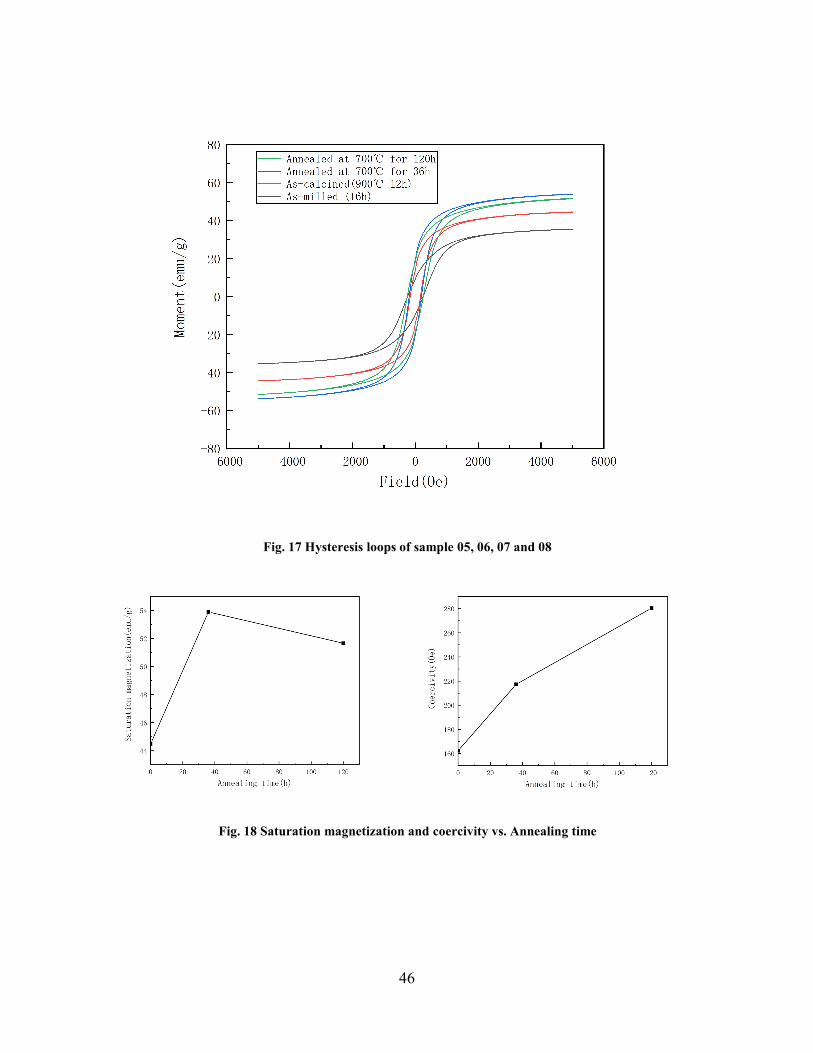
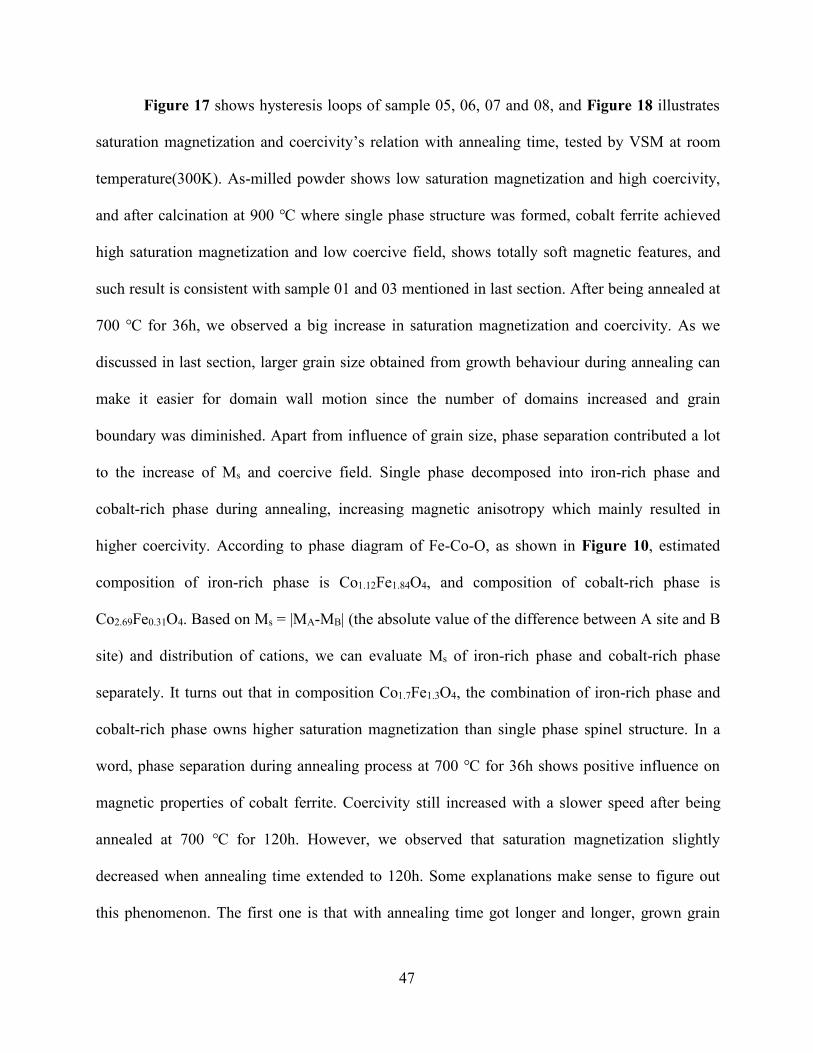
Fig. 17 Hysteresis loops of sample 05, 06, 07 and 08................................................................46
Fig. 18 Saturation magnetization and coercivity vs. Annealing time.....................................46
Fig. 19 XRD result of sample (a) 01, 05 and 09; (b) 04, 07 and 11........................................ 48
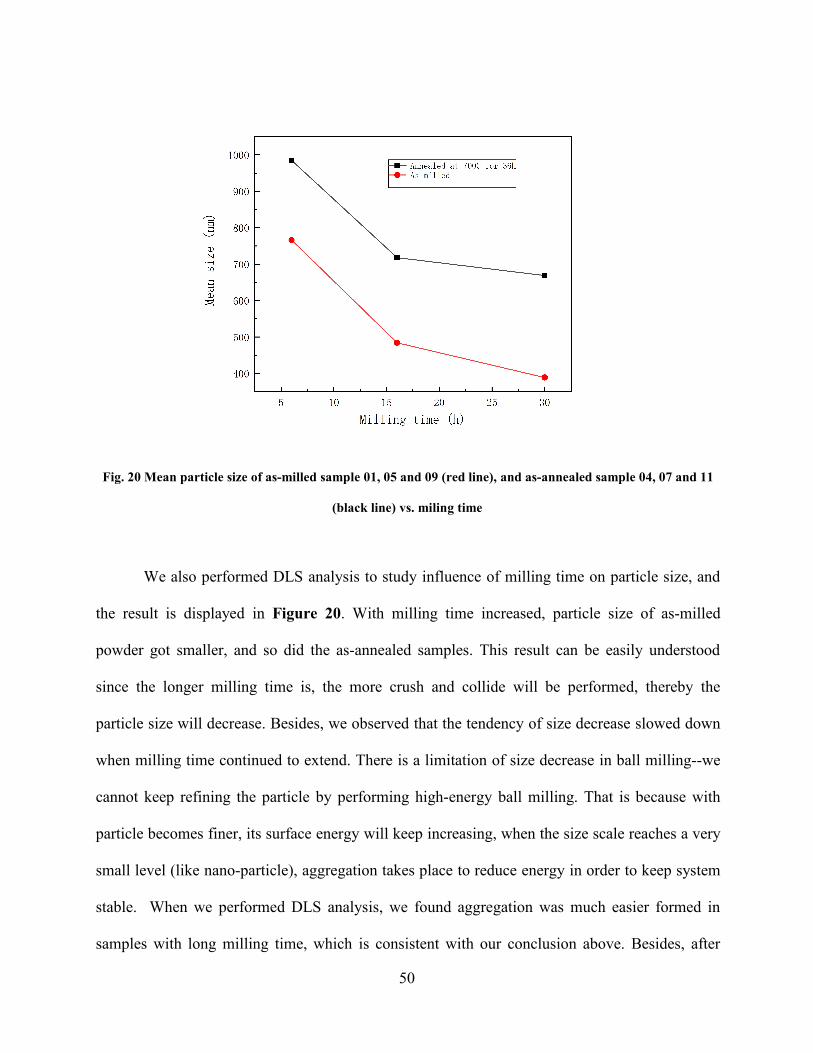
Fig. 20 Mean particle size of as-milled sample 01, 05 and 09 (red line), and as-annealed
sample 04, 07 and 11 (black line) vs. miling time..........................................................50
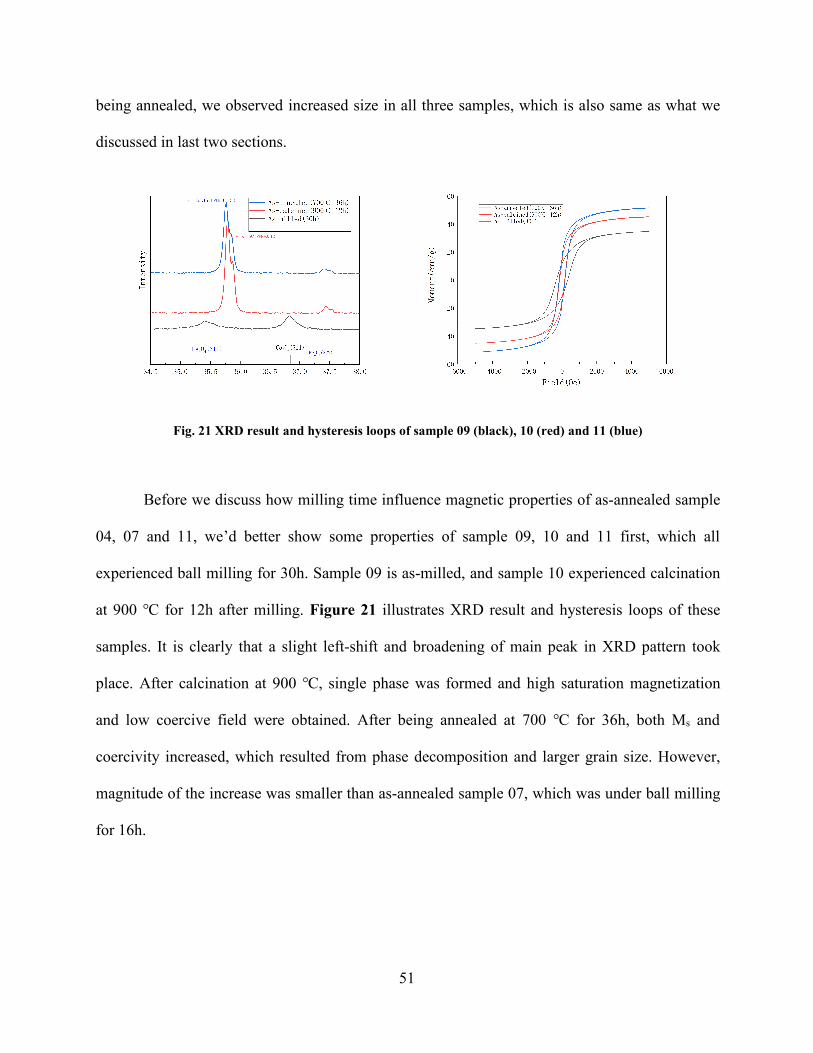
Fig. 21 XRD result and hysteresis loops of sample 09 (black), 10 (red) and 11 (blue) ........ 51
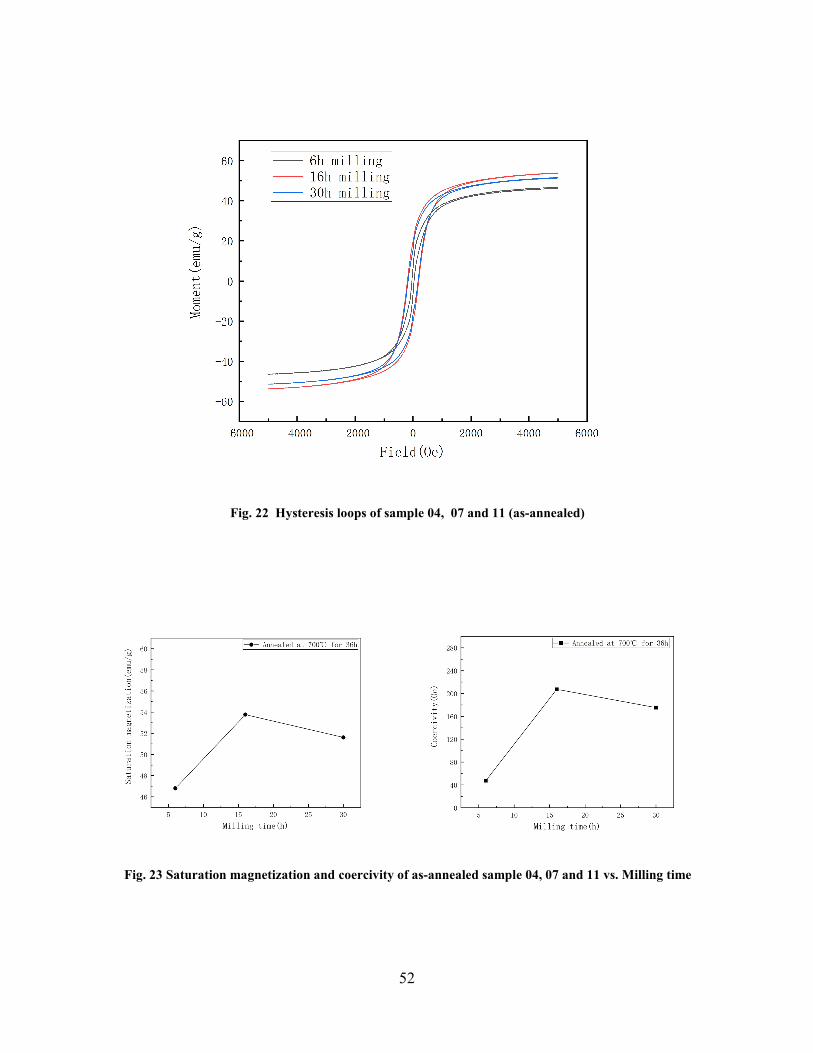
Fig. 22 Hysteresis loops of sample 04, 07 and 11 (as-annealed)............................................52
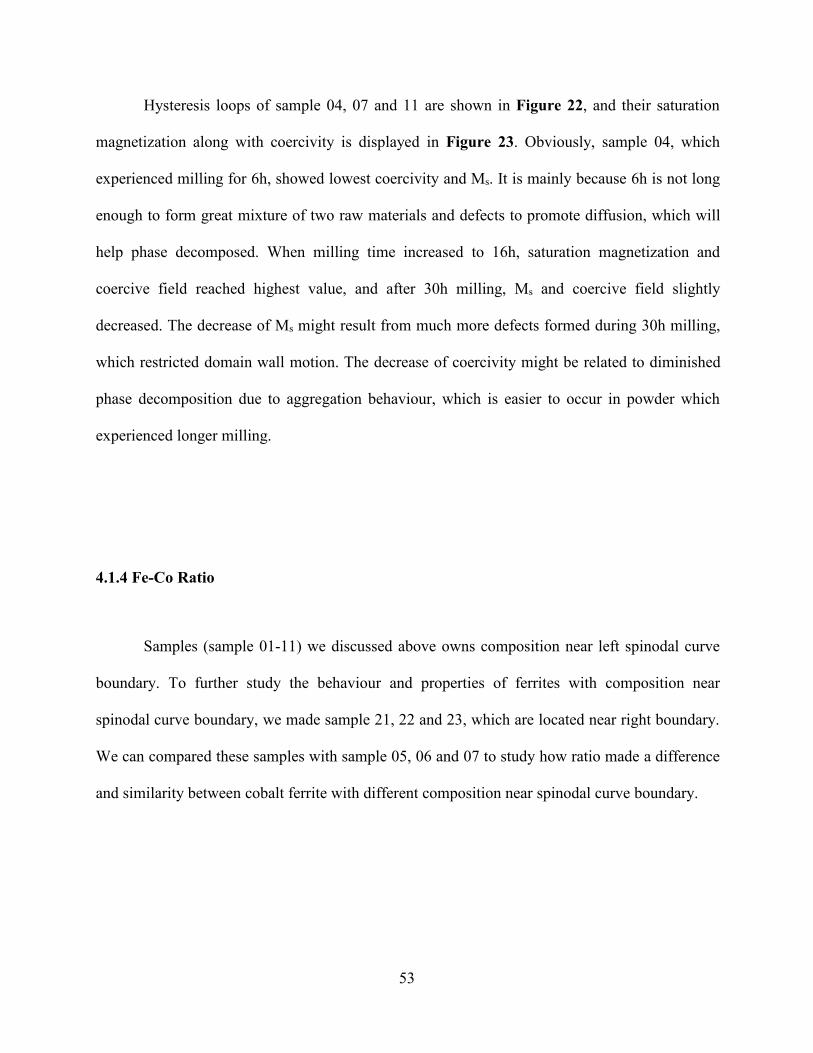
Fig. 23 Saturation magnetization and coercivity of as-annealed sample 04, 07 and 11 vs.
Milling time.......................................................................................................................52
Fig. 24 XRD result of sample 21 (as-milled), 22 (as-calcined) and 23 (as-annealed)............ 54
Fig. 25 Hysteresis loops of (a) sample 21, 22 and 23; (b) sample 22 and 23 enlarged view..55
Fig. 26 XRD result of sample 16, 17, 13, 14, 19 and 20 (from bottom to top) ......................57
Fig. 27 hysteresis loops of (a) sample 15, 16 and 17; (b) sample 12, 13 and 14; (c) sample 18,
19 and 20........................................................................................................................... 58
Fig. 28 hysteresis loops of as-annealed samples (sample 14, 17 and 20)................................ 60
Fig. 29 Coercivity vs. Cobalt content fraction..........................................................................61
Fig. 30 Saturation magnetization vs. Cobalt content fraction................................................ 62
1
1.0 Background and Literature Review
Magnetic material is a kind of functional material with a long history and a wide range of
uses, which is closely related to informatization, automation, national defense, national economy
and many other aspects. Among them, spinel ferrite materials are widely used and have great
application value in various fields. The research on its preparation and magnetic properties has
become one of the research hotspots. At the same time, the requirements on its performance are
also increasingly high, and these properties largely depend on the preparation process.
With the development of industry and technology, the demand for high performance
magnetic materials is increasing, especially under the condition of high work frequency. Some
technologies like power generation and conversion required by not only enormous systems, but
also some smaller systems, such as mobile communication platforms and components, are
shifting to higher operation frequency. One of the most hot area at present, 5G communications,
is in desperate need of the evolution of these technologies towards ultrahigh frequencies.
Scientific studies by materials researchers have been continuously directed toward
developing the performance and properties of such materials. The goals are mainly about
improving efficiency, reducing weight and cost in electronic devices, and reduce core loss
(particularly eddy current loss at high frequency), and so on. There is no doubt that the synthesis,
like mechanical alloying(MA), and processing, like spinodal decomposition(SD), are important
steps to achieve the goals and many researchers have also applied a number of special techniques
over the years that are being used to improve the property and performance of soft magnetic
composites. In the future, the development and research will strengthen the combination of
research, production and application, and constantly open up new application fields.
2
In this chapter, spinel ferrites especially cobalt ferrites, synthesis methods, processing and
analysis tools will be involved.
1.1 Spinel Ferrites
Spinel ferrites are materials with a general chemical formula of AB2O4, where A and B
are metallic cations positioned at two different crystallographic sites, which are called tetrahedral
(A sites) and octahedral (B sites), composed of Fe as one of the main elements in such structure.
At present, magnetic oxides play an important role in many areas, like electronics
industry and power applications. For each specific application, different material parameters play
a role. Intrinsic parameters are different form those that are related to the microstructure. The
intrinsic parameters such as the saturation magnetization, the magnetic anisotropy and the
electrical conductivity, highly depend on the chemical composition, the electronic structure of
the magnetic ions and the crystal symmetry in the lattice. Some important quantities for technical
applications, such as permeability, coercive force or losses, depend strongly on grain size,
porosity and inclusions, in other words, on the microstructure of the product. Therefore a
combined effort of various scientific and technical disciplines is required to improve the
performance.
Nowadays the design of many devices is considered to be satisfactory, although it is not
totally ideal. Many efforts are made to improve the material properties, for instance, by looking
at the periodic system in order to hit upon useful chemical additions or by changes in firing
3
techniques to improve the microstructure. However only very limited improvements can be
achieved. More essential improvements are obtained by advances in technology, such as the use
of very pure raw materials, or taking advantages of wet-chemical preparation methods.
Microwave materials with unique properties have been obtained by relatively novel processing
techniques such as hot-pressing.
Apparently superior properties, in other word, great parameters, means a lot. In order to
make ideal products, fundamental research is required to control the various material parameters,
related to their application. For instance, It is necessary to study exchange interactions to control
the temperature dependence of the saturation magnetization. And when it comes to ceramics
materials, the fundamental study of sintering processes and grain growth phenomena is of vital
importance, which can lead to control of microstructure.
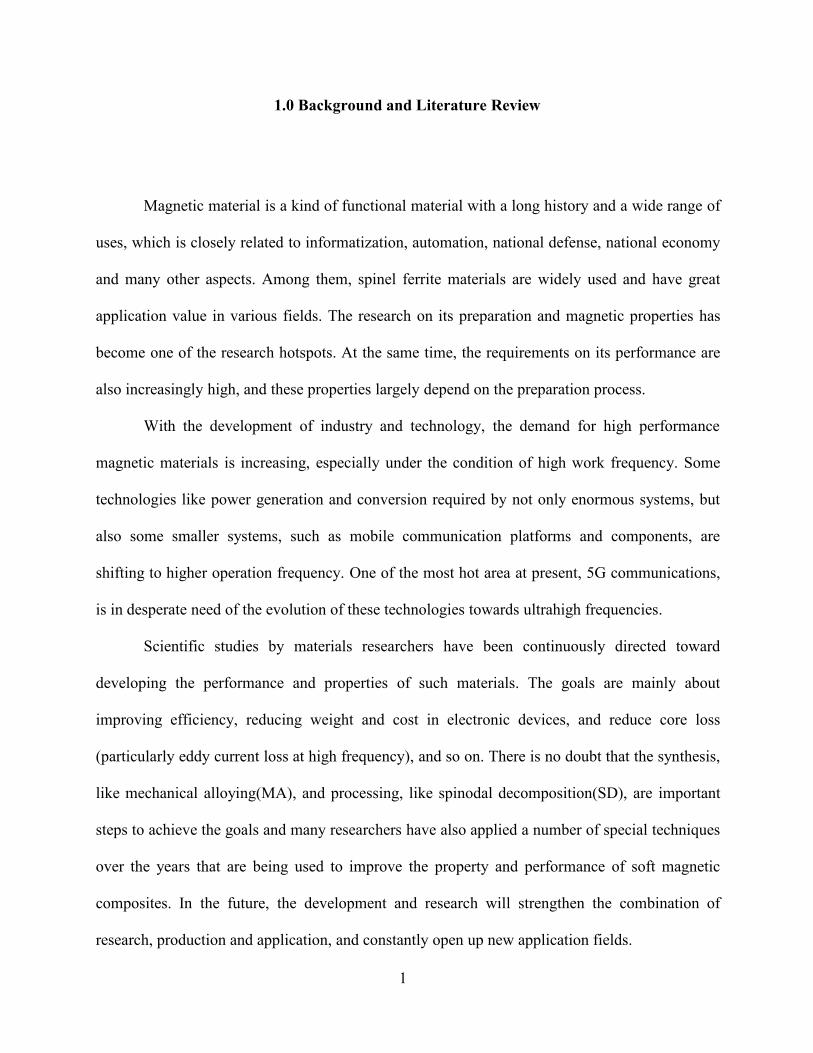
Fig. 1 Two octants of the unit cell of the spinel structure. A ions are on tetrahedral sites and B ions on
octahedral sites of the X2- anion packing. [1]
4
To achieve rational utilization and improvement of spinel ferrites, their structure should
be learned at first. Compounds with the cubic spinel structure have the general composition
AB2X4. The anions X, in most cases O2-, form a cubic close-packed lattice. The A ions fill
tetrahedral interstices and the B ions octahedral interstices of the anion packing. Figure 1 shows
two units AB2O4 in a quarter of the unit cell. In a tetrahedral site, like A ions in Figure 1, the
interstitial is in the center of a tetrahedra forms by four lattice atoms. Three atoms, touching each
other, are in plane; the fourth atom sits in the symmetrical position on top. Differently, an
octahedral position for an (interstitial) atom is the space in the interstices between 6 regular
atoms that form an octahedra, as B ions shown in Figure 1. Four regular atoms are positioned in
a plane, the other two are in a symmetrical position just above or below. All spheres can be
considered to be hard and touching each other. The six spheres define a regular octahedra, in its
interior there is a defined space for an interstitial atom, bordered by six spheres.
The valency of the cations in spinels can range from monovalent to hexavalent and the
most important magnetic ferrites are based on the composition Me2+Fe 3 +2 O4, which is also our
focus. This kind of spinel structure, which can also be called 2-3 spinels, can either have a
"normal" structure or an "inverse" structure. In a normal structure, the divalent ions are on
tetrahedral sites, the composition can be noted as Me2+[Fe 3 +2 ]O4 (the ions at the octahedrally
coordinated B sites are placed between brackets, in this case, Fe3 +2 ), and in an inverse structure,
the composition can be noted as Fe3+[MeFe3+]O4, in which the divalent ions are on octahedral
sites. Zinc ferrite, and some metallic oxide like cobalt oxide are normal spinels, whereas nickel
ferrite, Fe[NiFe]O4, and Fe3O4 are common inverse spinels.
5
It is obvious that distribution of the cation will influence spinel structure, and the
importance of the distribution of the cations over A and B sites for the magnetic properties can
be clearly revealed in Fe3O4, a representative inverse spinel. Fe3O4 contains both Fe2+ and Fe3+,
so it often be viewed as a combination of FeO ∙ Fe2O3, or we can rewrite as FeFe2O4, which is,
clearly, a spinel structure. Fe3O4 has a cubic inverse spinel group structure which consists of a
cubic close packed array of oxide ions where all of the Fe2+ ions (A) occupy half of the
octahedral sites and the Fe3+ (B) are split evenly across the remaining octahedral sites and the
tetrahedral sites. Both FeO and γ-Fe2O3 have a similar cubic close packed array of oxide ions and
this accounts for the ready interchangeability between the three compounds on oxidation and
reduction as these reactions entail a relatively small change to the overall structure. The
ferrimagnetism of Fe3O4 arises because the electron spins of the Fe2+ and Fe3+ ions in the
octahedral sites are coupled and the spins of the Fe3+ ions in the tetrahedral sites are coupled but
anti-parallel to the former. The net effect is that the magnetic contributions of both sets are not
balanced and there is a permanent magnetism. To further understand how distribution of the
cations affects other spinel ferrites, we can look at the differences between ZnFe2O4 and
MgFe2O4 [1]. Both zinc ferrites and magnesium ferrites contain Fe3+ and a non-magnetic divalent
ion, Zn2+ or Mg2+. ZnFe2O4 has no spontaneous magnetization at room temperature, and when
temperature goes below 9 K it shows antiferromagnetism. On the other hand, MgFe2O4 with
cation distribution Fe0.9Mg0.1[Fe1.1Mg0.9]O4 is ferrimagnetic below 715°K. In this case the
magnetic moment of the octahedral Fe3+ dominates the antiparallel-oriented moment of the iron
on tetrahedral sites, resulting in overall ferrimagetism.
It is better for us to first consider the factors that influence the cation distribution in
spinels. Simply speaking, the cation distribution in spinel structures are related to some of
6
parameters, such as the interstices size, ions atomic radii, orbital preference for certain
coordination and temperature [2]. The relative size of ions in comparison with the lattice size is
the most effective factor. Trivalent ions are normally smaller than the divalent due to the
formation of greater electrostatic attraction in the larger charge and results in the outer orbits to
pull inward. With these considerations, however, it was not always able to obtain a consistent
picture of the cation distribution as found experimentally. For instance, it is known that Zn2+ and
Co2+ have equal ionic radii, but they own different structure. CoFe2O4 is an inverse spinel while
ZnFe2O4 is a normal spinel. This can be explained by an individual site preference of the various
ions. Some ions may have a distinct preference for the octahedral site depending on the d-
electron count. If the A2+ ions have a strong preference for the octahedral site, they will displace
some of the B3+ ions from the octahedral sites to tetrahedral sites. Similarly, if the B3+ ions have
a low octahedral site stabilization energy, they will occupy tetrahedral sites, leaving octahedral
sites for the A2+ ions.
There is interaction between A and B sites in spinel ferrites, which to a huge extent
influences their properties. The strength of interaction between the moments of different metal
ions on the sites of A and B is determined by the distance between the oxygen ions and metal
ions and the angle between them. The A-B configurations are the most ideal combination due to
the shortest distance between the related ions and generation of 180 degree angle. When it comes
to the A-A and B-B interactions, they are often viewed as the most unfavorable and weakest
states, respectively [3]. Neel[4] described the ferromagnetism behavior of ferrites by
consideration of A-B configurations. The net A and B magnetic moments are normally aligned in
ferrites. Therefore, the discrepancy in the moments in the A and B sites result in partial
7
counteraction of the B sites moments by the A sites moments. The ferrimagnetism of Fe3O4
mentioned above is such an example.
We have already seen how intrinsic interaction and configurations affect properties of
spinel ferrites. Besides, some morphological properties, such as porosity and density, grain size,
and lattice constant, can also make a huge contribution.
Density and porosity play a key role in controlling the properties of polycrystalline
ferrites. These two parameters are inversely proportional to one another and are functions of
theoretical density of the material. According to Kim et al. [5], calcination temperatures can
significantly influenced the final microstructure, especially density, thus varying the magnetic
properties of the sintered ferrite. Any changes in ferrite’s microstructure features would cause
variation in the materials properties, which are commonly revealed by B–H or M–H curves.
Porosity is an important microstructure feature limiting the movement of domain walls. Pores
would appear to fix domain wall and restrict their movement [6]. A problem encountered in
growing large grains in ferrite is that many pores will be crushed by the grain boundary and
remain inside the larger grains during the process of growing large grains [7]. The intragranular
porosity is more troublesome than the intergranular porosity. Guillaud [8] revealed that the
permeability of Ni–Zn ferrite decreased with grain size exceeding 15 μm. It was concluded that
this decrease was probably due to the induced porosity within the large grain. The presence of
porosity within the grains results in the hindrance of the domain wall motion and is harmful to
the initial permeability [9].
The grain boundaries and grain size can also influence properties. The permeability in
ferrites, particularly for smaller grain sizes can be viewed as an example. The monodomain state
will be made where no magnetic domain walls when small grains are formed eventually, which
8
can exist inside single grains [10]. Under this circumstance, it is clear that the grain size
dependent permeability cannot be explained by phenomena related to domain walls. An attempt
to understand the decreasing in permeability to smaller grains sizes was presented by Johnson
and Visser [11]. In their non-magnetic grain boundary model, they assumed that grain
boundaries consist of regions with low permeability which causes internal demagnetization fields.
Within that model, the relative importance of the grain boundaries increases for decreasing grain
size. However, it was not totally agreed by some other researchers.
The high resistivity of sintered ferrite could be dominated by the relatively high
resistance of grain boundaries [12]. The conductivity and therefore the eddy current losses
occurring at the high frequencies, for example, Mn–Zn ferrites in telecommunication application,
depend strongly on the resistivity [13]. The eddy current loss can be reduced by increasing the
resistivity of the material. The resistivity of the polycrystalline ferrite can be increased by
increasing grain boundary resistivity and reducing grain size. For example, the presence of
defects and the segregation of impurities to the grain interface can greatly increase the resistivity
of the grain boundary [13]. The engineering of grain size and grain boundary tends to give
different characteristics on the magnetic properties, which is an advantage to the researchers as
this effect could be used to achieve the magnetic properties of desired materials.
Grain size, grain boundaries and porosity also affected the value of saturation induction
and coercivity. The increased number of domains and easier movement of domain walls in larger
grain with diminished grain boundaries result in high magnetization value. On the other hand, the
presence of pores would hinder the movement of the domain walls, as mentioned before, thus
reducing the magnetization. The coercivity value is very sensitive to porosity and grain size. It
9
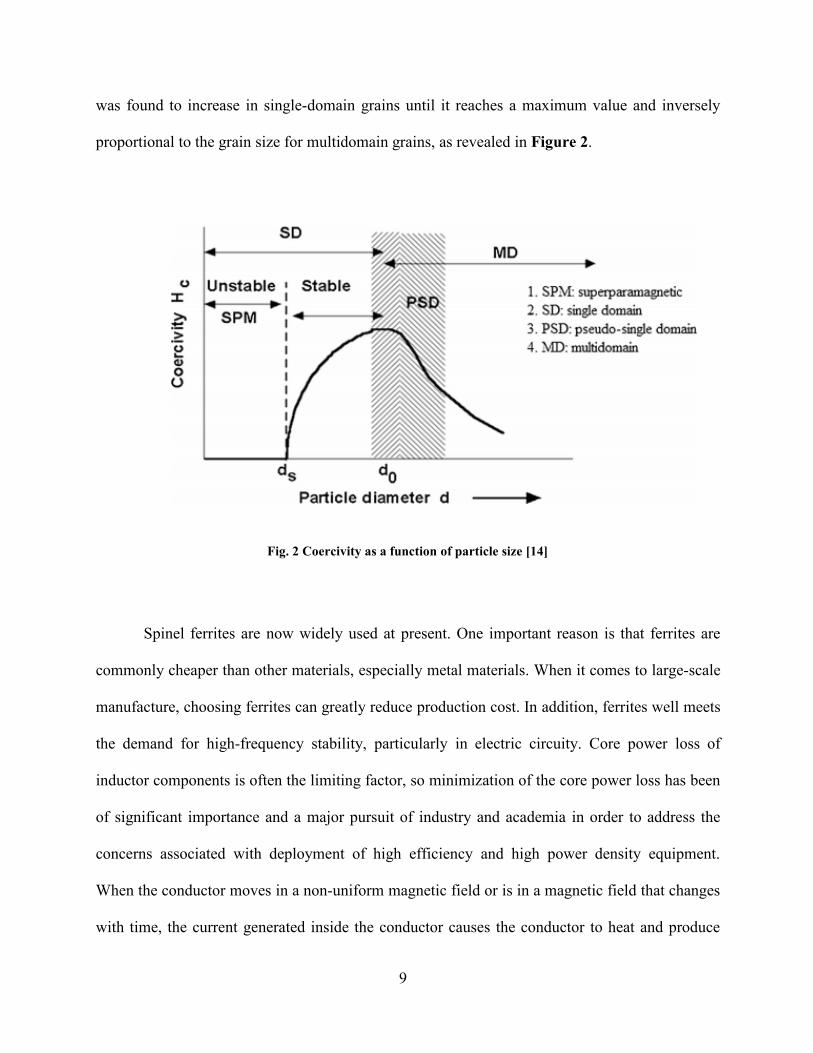
was found to increase in single-domain grains until it reaches a maximum value and inversely
proportional to the grain size for multidomain grains, as revealed in Figure 2.
Fig. 2 Coercivity as a function of particle size [14]
Spinel ferrites are now widely used at present. One important reason is that ferrites are
commonly cheaper than other materials, especially metal materials. When it comes to large-scale
manufacture, choosing ferrites can greatly reduce production cost. In addition, ferrites well meets
the demand for high-frequency stability, particularly in electric circuity. Core power loss of
inductor components is often the limiting factor, so minimization of the core power loss has been
of significant importance and a major pursuit of industry and academia in order to address the
concerns associated with deployment of high efficiency and high power density equipment.
When the conductor moves in a non-uniform magnetic field or is in a magnetic field that changes
with time, the current generated inside the conductor causes the conductor to heat and produce
10
energy loss, which is called eddy current loss. Eddy current loss, which dominates at high
frequency, can highly restrict performance of metals. As mentioned above, different from metals,
ferrites own high resistance, greatly reduce the effect of eddy current.
There are many kinds of spinel ferrites applied in different fields. In this study, cobalt
ferrites are our focus. Cobalt ferrites own unique physical, chemical, catalytic and magnetic
properties. These ferrites show stable chemical performance, corrosion resistance and wear
resistance, and is widely used in magnetic recording media, pigments, aerospace, magnetic
sensors and so on. In addition, cobalt ferrites own high coercivity and resistivity, and also exhibit
great permeability at high frequencies, so they are also commonly applied in the high frequency
area. Besides, cobalt ferrite is a typical spinel ferrite which can show spinodal decomposition
under specific conditions. This will be discussed later.
1.2 Synthesis
Synthesis route can significantly influence the microstructure and parameters of products,
in our case, spinel ferrites, and this issue also involves the consumption of resources and energy.
Therefore, choosing proper methods, improving and innovating techniques and procedure is of
vital importance from aspects of demands, environment and economy. In this section, several
methods will be introduced, and ball mill, which was used in our work, will be emphasized.
Some information from our review article will also be involved [34].
11
1.2.1 Solid State Reaction
The term solid-state reaction route is commonly used to explain interactions where neither
controlled vapor-phase interactions nor a solvent medium is carried out. The solid-state route is
often employed where other methods are not sufficed, like the fabrication of refractory ceramics,
glasses and bulk crystals. Moreover, this route is also applied to produce advanced materials with
unique compositions. The solid-state method is known as the simplest way to form various
materials. Applying this technique enables one to produce desired products by mixing high-
purity oxide materials with certain proportion. However, some obvious disadvantages of the
method may also be shown such as sintering at higher temperatures for long times (huge cost)
and long milling time, and sometimes, it is difficult to control the process due to the formation of
unwanted phases especially when producing metal-oxide composites.
A number of studies on solid-state synthesis of ferrites have been reported, among them
doping is one of the most popular topic. Tokatlidis et al. [15] produced MnZn ferrite with Co2+
and Mg2+ as additives. Co2+ resulted in the reduction of power loss, although at the expense of
lowering the initial permeability. The addition of Co broadens the B-B distances and impedes the
conductivity between Fe2+ and Fe3+. Additionally, the presence of Co2+ can stabilizes the Fe3+, in
that third ionization energy of Co2+ is higher than that of Fe2+. Mg2+ stabilizes the resistivity in
the high frequency region, and the conductivity of the ferrite is further hindered by the
introduction of Mg2+. The addition of Mg with a remarkably low melting point (650℃) is
believed to promote the densification mechanisms, thus reducing energy barriers, such as pores
or secondary phases, which are harmful to permeability.
12
Kalarus et al. [16] reported on solid-state reaction of Fe2O3, Mn3O4 and ZnO to produce high
permeability MnZn ferrites. The authors carried a systematic study to optimize the processing
conditions to enable (1) large grains necessary for high initial permeability, and (2) high grain
boundary resistivity for exceptional frequency stability. The optimization is based on the
homogeneous dissolution of dopants under oxidative conditions and their subsequent
precipitation along grain boundaries. This was accomplished by integrating isothermal plateaus
at the first part of the cooling stage of the final firing process.
Ni-Zn ferrite (Ni0.64Zn0.36Fe2O4) powder was synthesized from Fe2O3, ZnO and NiO via the
conventional ceramic method by heating the stoichiometric amount of Fe2O3, ZnO and NiO at
1100℃ for 2 h [17]. The average size of the Ni-Zn ferrite particle was is smaller than 5 μm. As
shown in Figure 3, the magnetic loss in the Ni-Zn ferrite composite samples decreases as a result
of increasing Ni-Zn ferrite amount, which proves that the contribution of the surrounding ferrite
shell to reduce eddy current effects is effective. High-resistivity ferrite insulation coating of
every iron particle with a high-resistivity ferrite produces tiny eddy current paths inside the
particles and develops relatively high resistivity in the bulk material. In addition, the magnetic
properties of high-resistivity Ni-Zn ferrite is also responsible for the low loss in the composites
with high ferrite component, for instance, their permeability remains stable instead of
dramatically dropping at high frequency.

13
Fig. 3 Magnetic loss of Fe and Fe-Ni-Zn ferrite composite samples as a function of frequency [17]
Mechanical alloying method like ball mill is a good replacement for the solid state method
with greater advantage of shortening the milling time. In this method apart from practicality,
speeding up of material preparation of nanocomposites, advanced ceramics, amorphous alloys,
metastables and other important powders in large tonnages are also achieved. The technique
itself is easy and fast to get a desired product relatively in short time of milling. Therefore, it can
save time and energy. These benefits made it a choice to prepare spinel ferrites, which will be
discussed in detail in next section.
14
1.2.2 Ball Mill
Ball mill is a powder processing technique that allows production of homogeneous materials
starting from blended elemental powder mixtures. The technique has been used to produce a
variety of soft magnetic composites. Essentially two processing routes are carried out: the first
involves reactive milling of precursor oxide mixtures, and the second applies traditional powder
techniques either wet or dry milling to form nanostructured materials.
Rashidi et al. [18] synthesized polyvinyl alcohol/cobalt ferrite nanocomposites upon
employing a two-step procedure: the spherical single-phase cobalt ferrite of 20-4 nm mean
particle size was synthesized via mechanical alloying method and then embedded into polymer
matrix by intensive milling. Magnetization and coercivity of produced samples have been
decreased in comparison to pure cobalt ferrite as a result of the presence of non-magnetic
polymer layer.
Moustafa et al. [19] reported on preparation of Mg ferrite by either mechanical milling only,
or mechanical milling followed by sintering. In the latter case, Mg-ferrite has been produced at
relatively low temperature or with short heating times.
CoFe1.95Ho0.05O4 spinel ferrite was produced by mechanical alloying from Fe2O3, CoO and
Ho2O3 followed by annealing [20]. The magnetic grains showed single domain or pseudo-single
domain behavior below the critical annealing temperature 1050℃ above which grains became
multi-domains. Consequently, a significant transformation in the magnetic behavior of the
material was noted around 1050℃, with changes in magnetic parameters as a result of increasing
the grain size. The added Ho3+ occupies B site, which means there is a replacement of
antiferromagnetic Fe3+(B)-O-Co2+(B) interactions by the equivalent amount of ferromagnetic Fe3
15
+(B)-O-Ho3+(B) interactions. The substantial enhancement of TC in CoFe1.95Ho0.05O4 spinel
ferrite, in spite of expected weaker exchange interaction between Fe3+ (3d) and Ho3+ (4f) ions,
suggest that a strong superexchange (A-O-B) interaction appears between A site (Fe3+) and B site
(Fe3+/Co2+) moments in the presence of Ho3+ ions, which enhanced the magnetic property.
Milling atmosphere is another critical factor affecting the resultant composites. Due to the
interaction between the grinding balls and powder, the mechanical energy is converted into heat
so that temperatures inside the ball mill pot rise substantially which means it is much easier to
react with oxygen. Therefore, mechanical alloying of soft magnetic composites is typically
processed under inert gases such as argon. Ding et al. [21] operated ball milling to form Mn
ferrite in air and under Ar separately. The product milled in air contained plenty of oxide
impurity, while the sample milled under Ar reached single phase. Equally important is the
milling media and powder agglomeration where stearic acid, solid paraffin, liquid alcohol and
carbon tetrachloride, are often used as a milling media in order to reduce the agglomeration of
powder.
Fe-Ni nanocrystallite powders display particularly interesting soft magnetic properties such
as low coercivity and high saturation magnetization. Koohkan et al. [22] studied the milling time
effect on magnetic properties of Fe-Ni nanocrystallite powders. Increasing the milling time (up
to 100 h) has resulted in decreasing the crystallite size, whereas microstrain and lattice
parameters have increased. A trend in the coercivity increase with milling time (up to 100 h) as
well as the intrinsic flux density increases has been observed.
As technology is developing, some ball milling machines with higher efficiency has been
used more frequently, which is known as high energy ball milling. Difference between high-
energy ball milling and traditional low energy ball milling is that the speed of the balls of high-
16
energy ball milling is higher, promoting plastic deformation and phase transformation, otherwise
the traditional ball milling process can only have crush and mix. High-energy ball milling’s
energy utilization rate is greatly increased, so as to improve the performance of the material, is a
kind of energy-saving and efficient material preparation technology, and has become one of the
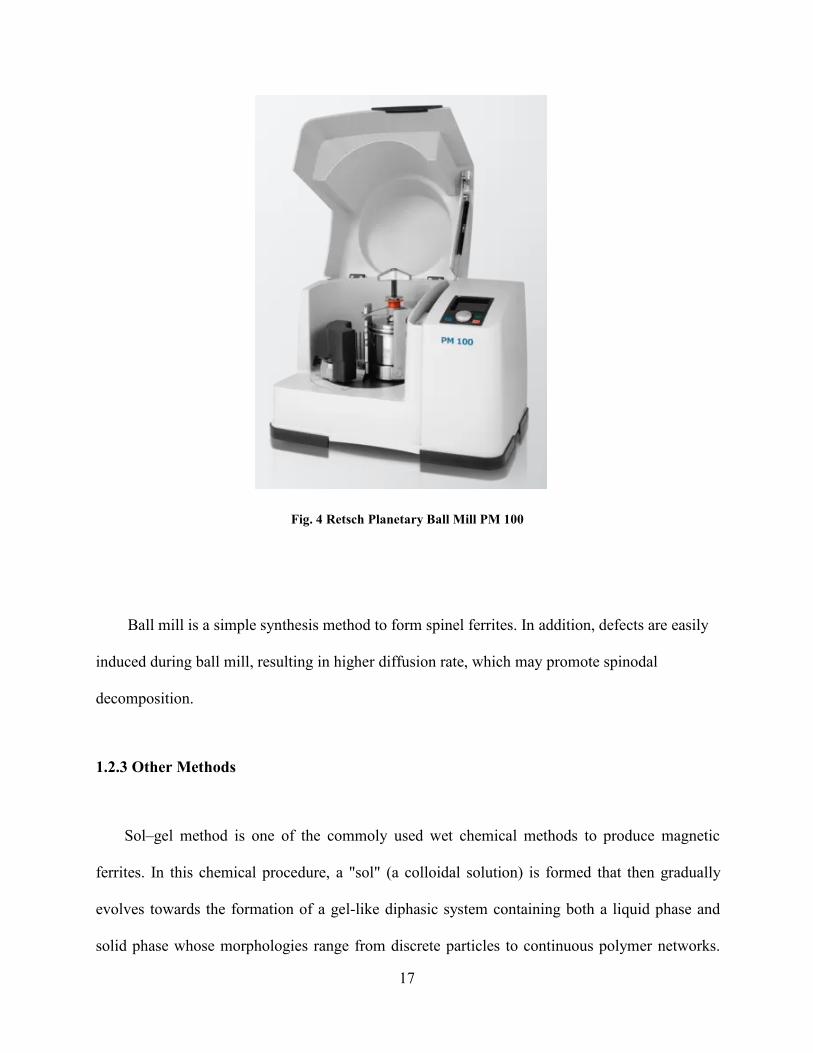
important methods for the preparation of nanometer materials. Figure 4 shows the planetary ball
milling machine which is used in this work. Planetary ball mills are usually smaller than
common ball mills and mainly used in laboratories for grinding sample material down to very
small sizes. A planetary ball mill consists of at least one grinding jar which is arranged
eccentrically on a so-called sun wheel. The direction of movement of the sun wheel is opposite
to that of the grinding jars (ratio: 1:−2 or 1:−1). The grinding balls in the grinding jars are
subjected to superimposed rotational movements, the so-called Coriolis forces. The difference in
speeds between the balls and grinding jars produces an interaction between frictional and impact
forces, which releases high dynamic energies. The interplay between these forces produces the
high and very effective degree of size reduction of the planetary ball mill.
17
Fig. 4 Retsch Planetary Ball Mill PM 100
Ball mill is a simple synthesis method to form spinel ferrites. In addition, defects are easily
induced during ball mill, resulting in higher diffusion rate, which may promote spinodal
decomposition.
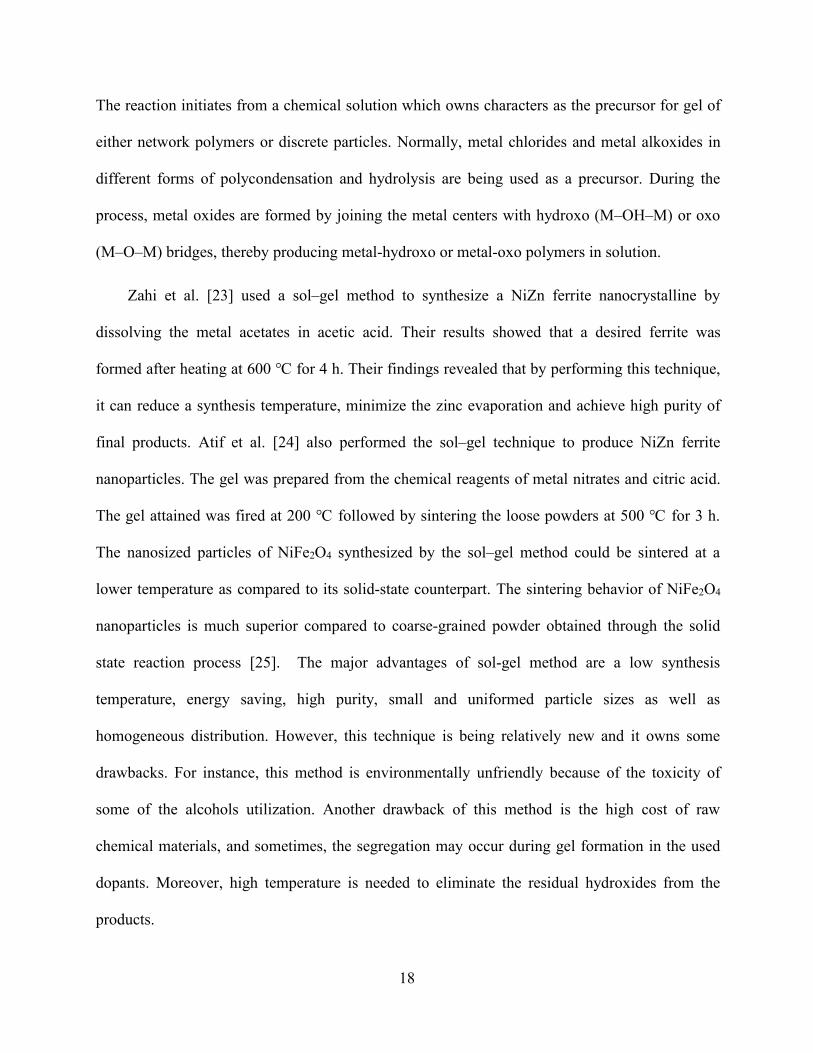
1.2.3 Other Methods
Sol–gel method is one of the commoly used wet chemical methods to produce magnetic
ferrites. In this chemical procedure, a "sol" (a colloidal solution) is formed that then gradually
evolves towards the formation of a gel-like diphasic system containing both a liquid phase and
solid phase whose morphologies range from discrete particles to continuous polymer networks.
18
The reaction initiates from a chemical solution which owns characters as the precursor for gel of
either network polymers or discrete particles. Normally, metal chlorides and metal alkoxides in
different forms of polycondensation and hydrolysis are being used as a precursor. During the
process, metal oxides are formed by joining the metal centers with hydroxo (M–OH–M) or oxo
(M–O–M) bridges, thereby producing metal-hydroxo or metal-oxo polymers in solution.
Zahi et al. [23] used a sol–gel method to synthesize a NiZn ferrite nanocrystalline by
dissolving the metal acetates in acetic acid. Their results showed that a desired ferrite was
formed after heating at 600 ℃ for 4 h. Their findings revealed that by performing this technique,
it can reduce a synthesis temperature, minimize the zinc evaporation and achieve high purity of
final products. Atif et al. [24] also performed the sol–gel technique to produce NiZn ferrite
nanoparticles. The gel was prepared from the chemical reagents of metal nitrates and citric acid.
The gel attained was fired at 200 ℃ followed by sintering the loose powders at 500 ℃ for 3 h.
The nanosized particles of NiFe2O4 synthesized by the sol–gel method could be sintered at a
lower temperature as compared to its solid-state counterpart. The sintering behavior of NiFe2O4
nanoparticles is much superior compared to coarse-grained powder obtained through the solid
state reaction process [25]. The major advantages of sol-gel method are a low synthesis
temperature, energy saving, high purity, small and uniformed particle sizes as well as
homogeneous distribution. However, this technique is being relatively new and it owns some
drawbacks. For instance, this method is environmentally unfriendly because of the toxicity of
some of the alcohols utilization. Another drawback of this method is the high cost of raw
chemical materials, and sometimes, the segregation may occur during gel formation in the used
dopants. Moreover, high temperature is needed to eliminate the residual hydroxides from the
products.
19
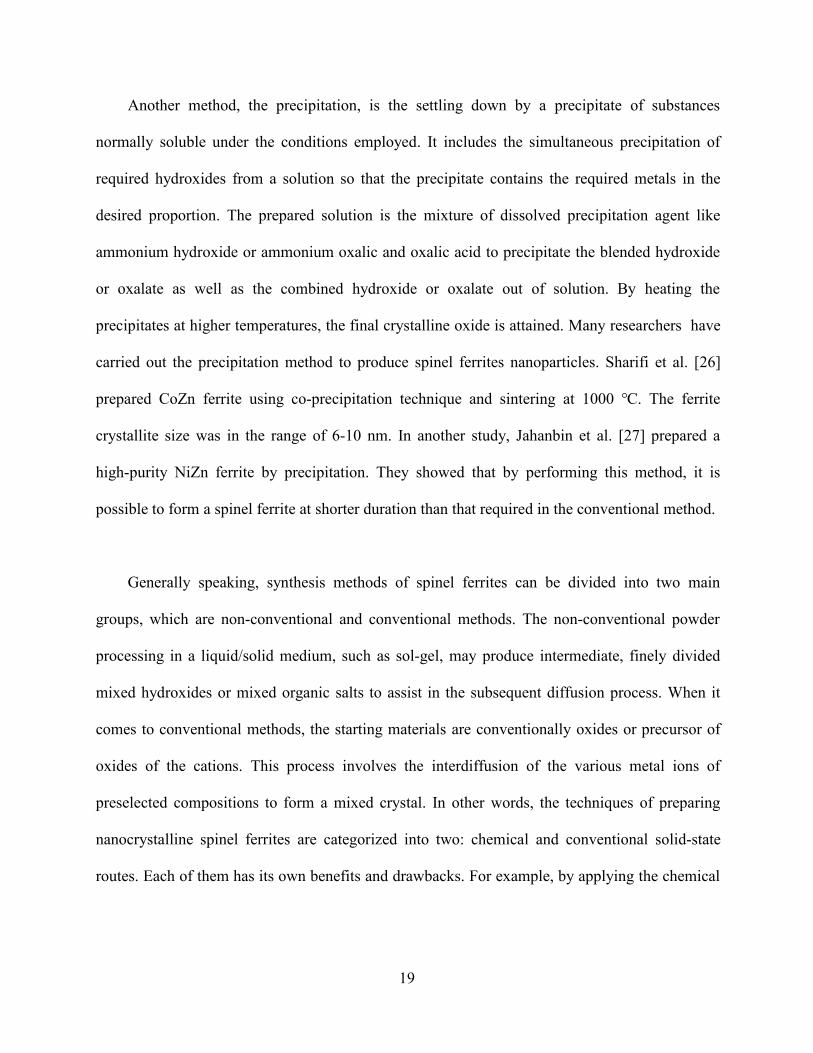
Another method, the precipitation, is the settling down by a precipitate of substances
normally soluble under the conditions employed. It includes the simultaneous precipitation of
required hydroxides from a solution so that the precipitate contains the required metals in the
desired proportion. The prepared solution is the mixture of dissolved precipitation agent like
ammonium hydroxide or ammonium oxalic and oxalic acid to precipitate the blended hydroxide
or oxalate as well as the combined hydroxide or oxalate out of solution. By heating the
precipitates at higher temperatures, the final crystalline oxide is attained. Many researchers have
carried out the precipitation method to produce spinel ferrites nanoparticles. Sharifi et al. [26]
prepared CoZn ferrite using co-precipitation technique and sintering at 1000 ℃. The ferrite
crystallite size was in the range of 6-10 nm. In another study, Jahanbin et al. [27] prepared a
high-purity NiZn ferrite by precipitation. They showed that by performing this method, it is
possible to form a spinel ferrite at shorter duration than that required in the conventional method.
Generally speaking, synthesis methods of spinel ferrites can be divided into two main
groups, which are non-conventional and conventional methods. The non-conventional powder
processing in a liquid/solid medium, such as sol-gel, may produce intermediate, finely divided
mixed hydroxides or mixed organic salts to assist in the subsequent diffusion process. When it
comes to conventional methods, the starting materials are conventionally oxides or precursor of
oxides of the cations. This process involves the interdiffusion of the various metal ions of
preselected compositions to form a mixed crystal. In other words, the techniques of preparing
nanocrystalline spinel ferrites are categorized into two: chemical and conventional solid-state
routes. Each of them has its own benefits and drawbacks. For example, by applying the chemical
20
methods, it is possible to produce a finer crystallite size as well as synthesize at lower
temperatures as compared to the conventional solid-state routes. However, it is believed that the
chemical homogeneity of the gel is often disturbed by the differences in the chemistries of the
cations. On the other hand, the conventional solid-state routes are relatively simple techniques,
but the control of particle size and powder quality during the process sometimes is difficult.
Furthermore, the synthesis of them sometimes needs higher temperature, and as a result, an
expensive furnace is required. Furthermore, the non-conventional techniques may have
environmental drawbacks, but the high temperatures required in conventional sintering also
carried a significant carbon footprint.
1.3 Phase Decomposition
Binodal decomposition is a kind of phase decomposition based on nucleation and growth
mechanism, and it is known to occur in between spinodal and binodal curve (i.e. miscibility gap),
which is shown in Figure 5(a) [28]. Nucleation is the first step in the formation of a new
thermodynamic phase, then followed by growth. Generally, when the second derivative of the
free energy with respect to the components is greater than 0, there is a certain barrier need to be
overcome in order to form a stable nucleus, at this point phase decomposition obey nucleation-
growth mechanism, and binodal decomposition occurs. This mechanism is characterized by a
large degree of initial concentration variation and a small spatial range involved.
The nucleation-growth model works for the description of phase formation starting from
metastable initial states, while thermodynamically unstable states are believed to decay via
21
spinodal decomposition. Spinodal decomposition is a process by which a homogeneous solution
inside a miscibility gap spontaneously decomposes into a mixture of two phases. This process is
fundamentally different from nucleation and growth. When there is a nucleation barrier to the
formation of a second phase, the system takes time to overcome that barrier. As there is no
barrier to spinodal decomposition, some fluctuations start growing instantly. Infinitesimal
compositional fluctuations in the unstable homogenous solution lower Gibbs free energy and
proceed until resultant phases are in an equilibrium state. Moreover, in spinodal decomposition
fluctuations start growing everywhere, uniformly throughout the volume, whereas a nucleated
phase form at a discrete number of points. Different co-existence behaviour of spinodal
decomposition and binodal decomposition(nucleation) is shown in Fig. 5(b) and 5(c), and T-c
phase diagram is shown schematically in Fig. 5(a) [28]. The miscibility gap, which refers to the
curve outside nucleation area, and the spinodal curve, which is the curve separating spinodal
decomposition area and nucleation area, are found by equating the first and second derivatives of
the ΔGmix respectively to zero.
22
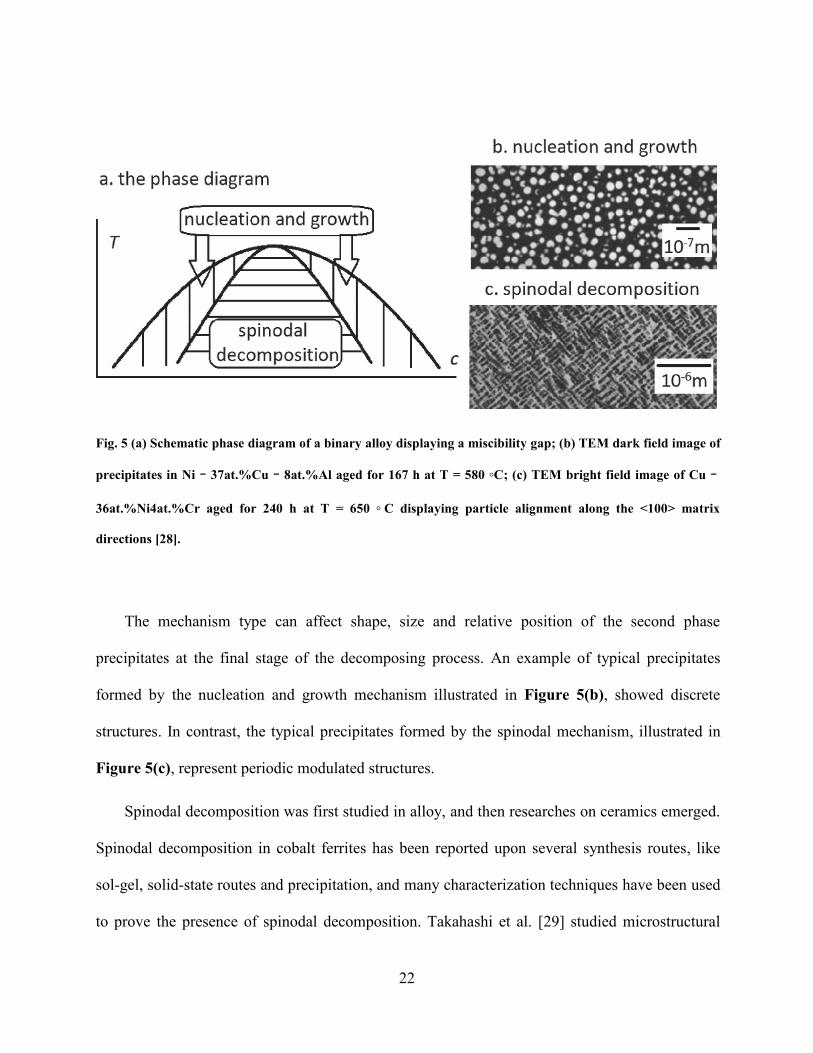
Fig. 5 (a) Schematic phase diagram of a binary alloy displaying a miscibility gap; (b) TEM dark field image of
precipitates in Ni–37at.%Cu–8at.%Al aged for 167 h at T = 580 ◦C; (c) TEM bright field image of Cu–
36at.%Ni4at.%Cr aged for 240 h at T = 650 ◦ C displaying particle alignment along the <100> matrix
directions [28].
The mechanism type can affect shape, size and relative position of the second phase
precipitates at the final stage of the decomposing process. An example of typical precipitates
formed by the nucleation and growth mechanism illustrated in Figure 5(b), showed discrete
structures. In contrast, the typical precipitates formed by the spinodal mechanism, illustrated in
Figure 5(c), represent periodic modulated structures.
Spinodal decomposition was first studied in alloy, and then researches on ceramics emerged.
Spinodal decomposition in cobalt ferrites has been reported upon several synthesis routes, like
sol-gel, solid-state routes and precipitation, and many characterization techniques have been used
to prove the presence of spinodal decomposition. Takahashi et al. [29] studied microstructural
23
changes using XRD and TEM. Occurrence of the phenomenon upon aging was characterized by
the appearance of side bands in XRD pattern, implying a modulated structure. After further aging,
separation between side bands decreased and finally disappeared and two discrete bands were
observed, implying loss of coherency. TEM analysis revealed the presence of period
microstructures with confirmed spinodal decomposition.
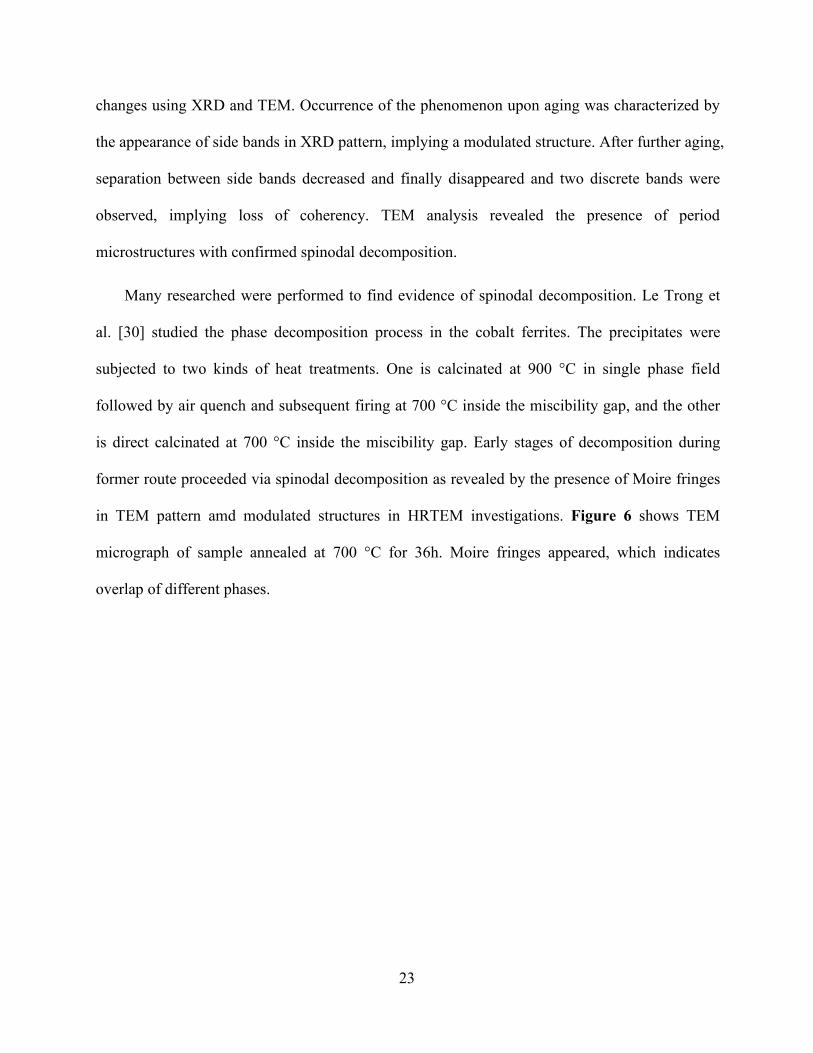
Many researched were performed to find evidence of spinodal decomposition. Le Trong et
al. [30] studied the phase decomposition process in the cobalt ferrites. The precipitates were
subjected to two kinds of heat treatments. One is calcinated at 900 °C in single phase field
followed by air quench and subsequent firing at 700 °C inside the miscibility gap, and the other
is direct calcinated at 700 °C inside the miscibility gap. Early stages of decomposition during
former route proceeded via spinodal decomposition as revealed by the presence of Moire fringes
in TEM pattern amd modulated structures in HRTEM investigations. Figure 6 shows TEM
micrograph of sample annealed at 700 °C for 36h. Moire fringes appeared, which indicates
overlap of different phases.
24
Fig. 6 TEM micrographs of samples prepared at 900 ℃ and annealed 36 h at 700 ℃ showing Moire´
fringes in different places within the crystal [30].
In addition, side bands in XRD patterns also showed up. These modulated structures
disappeared with annealing time increasing and two distinct incoherent Co-rich and Fe-rich
phases appeared instead. However, in latter route, no spinodal decomposition was observed.
Calcinated at 900 °C resulted in the formation of a single phase which was unstable during firing
at 700 °C. However, when directly calcinated at 700 °C, no such phase was present and hence
nucleation and growth took the lead instead of spinodal decomposition.
25
1.4 Analysis Tools
In this section, some characterization techniques commonly used in research on spinel
ferrites will be simply introduced.
1.4.1 XRD
XRD is the abbreviation for X-ray diffraction. It is known that crystals are regular arrays of
atoms, and X-rays can be considered waves of electromagnetic radiation. Atoms scatter X-ray
waves, primarily through the atoms' electrons. Just as an ocean wave striking a lighthouse
produces secondary circular waves emanating from the lighthouse, so an X-ray striking an
electron produces secondary spherical waves emanating from the electron. This phenomenon is
known as elastic scattering, and the electron (or lighthouse) is known as the scatterer. A regular
array of scatterers produces a regular array of spherical waves. Although these waves cancel one
another out in most directions through destructive interference, they add constructively in a few
specific directions, determined by Bragg's law. These specific directions appear as spots on the
diffraction pattern called reflections. Thus, X-ray diffraction results from an electromagnetic
wave (the X-ray) impinging on a regular array of scatterers (the repeating arrangement of atoms
within the crystal). If structure of crystals is known, the wavelength of the X-ray can be
calculated after the direction θ of the diffraction line is determined, thus determining the element
that produces the characteristic X-ray. This is called X-ray spectroscopy, and can be used to
analyze the composition of materials.
XRD is a fundamental analysis method in research on spinel ferrites. Composition, lattice
parameter, and crystallographic structure of spinel ferrites can be determined via XRD technique.
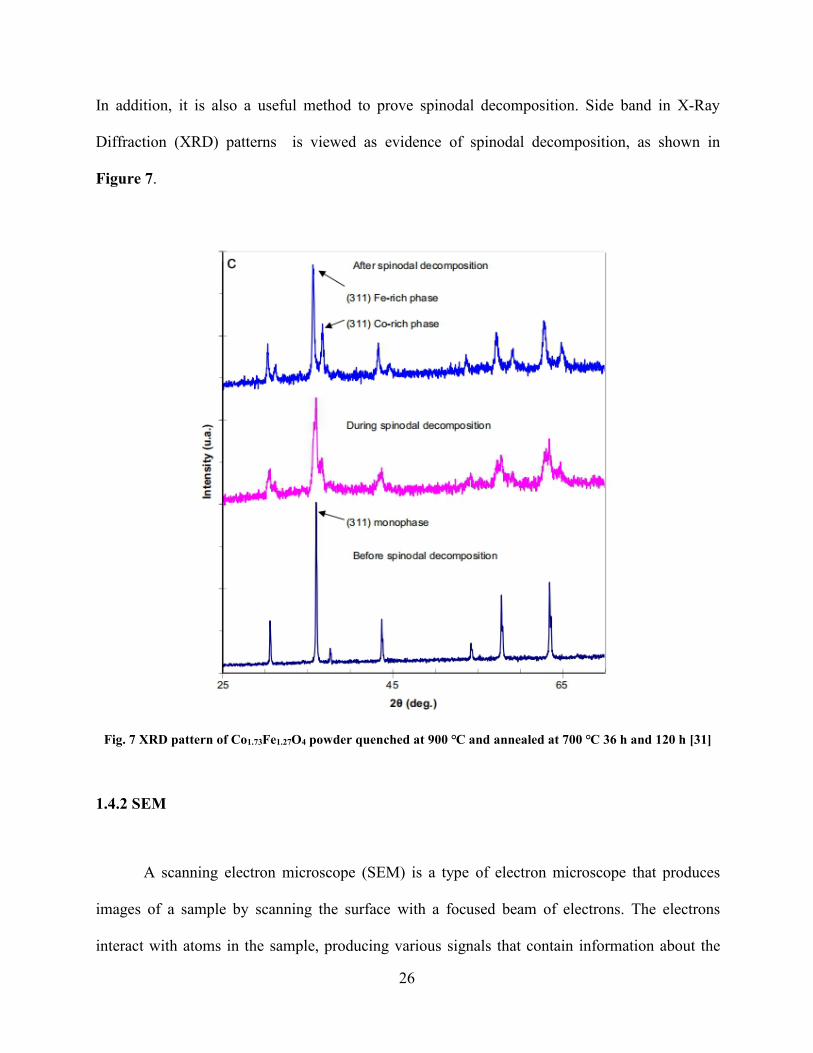
26
In addition, it is also a useful method to prove spinodal decomposition. Side band in X-Ray
Diffraction (XRD) patterns is viewed as evidence of spinodal decomposition, as shown in
Figure 7.
Fig. 7 XRD pattern of Co1.73Fe1.27O4 powder quenched at 900 ℃ and annealed at 700 ℃ 36 h and 120 h [31]
1.4.2 SEM
A scanning electron microscope (SEM) is a type of electron microscope that produces
images of a sample by scanning the surface with a focused beam of electrons. The electrons
interact with atoms in the sample, producing various signals that contain information about the
27
surface topography and composition of the sample. The electron beam is scanned in a raster scan
pattern, and the position of the beam is combined with the intensity of the detected signal to
produce an image. In the most common SEM mode, secondary electrons emitted by atoms
excited by the electron beam are detected using a secondary electron detector, which is called
Everhart-Thornley detector. The number of secondary electrons that can be detected, and thus
the signal intensity depends on specimen topography. Some SEMs can achieve resolutions better
than 1 nanometer.
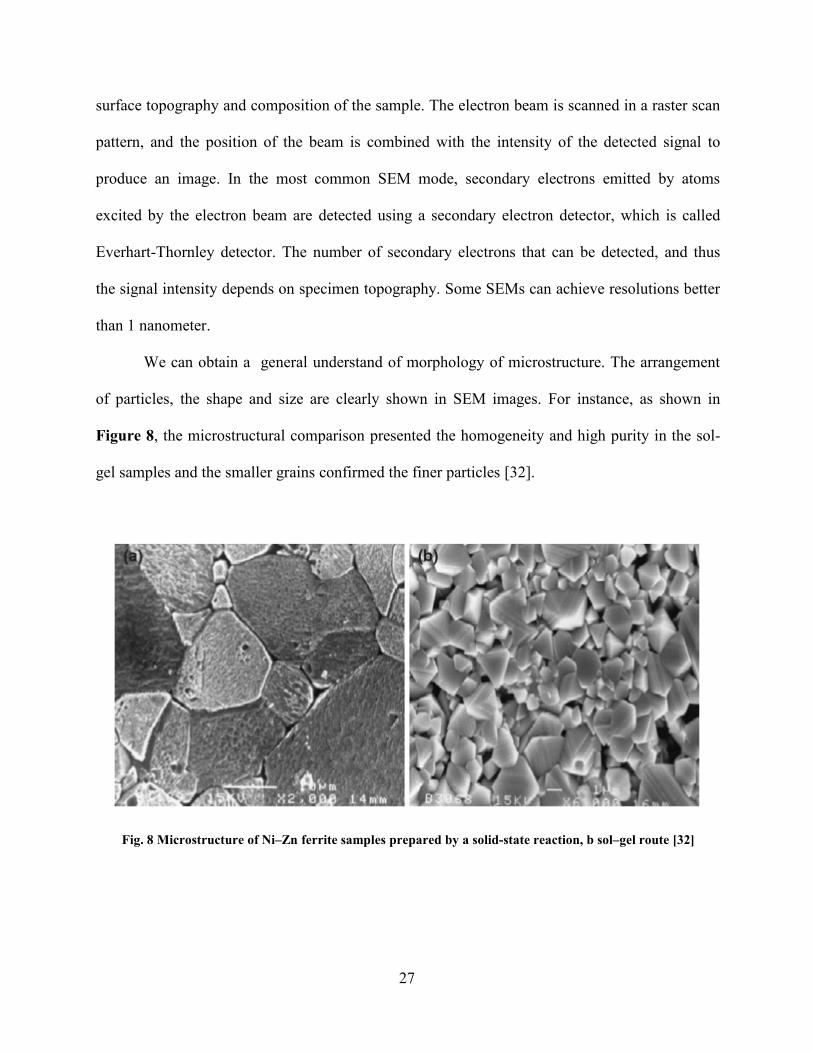
We can obtain a general understand of morphology of microstructure. The arrangement
of particles, the shape and size are clearly shown in SEM images. For instance, as shown in
Figure 8, the microstructural comparison presented the homogeneity and high purity in the sol-
gel samples and the smaller grains confirmed the finer particles [32].
Fig. 8 Microstructure of Ni–Zn ferrite samples prepared by a solid-state reaction, b sol–gel route [32]
28
1.4.3 VSM
The vibrating sample magnetometer (VSM) is one of the most successful
implementations of a magnetometer. In comparison with alternating gradient magnetometer, the
VSM is indifferent to mass and size of sample up to a considerable range. In this scheme the
sample is introduced in a constant uniform external magnetic field which induces a
magnetisation in the sample. As the magnetized sample is then vibrated, it introduces
perturbations in the external magnetic field. A set of coils or some magnetic field sensors can be
arranged around the sample to measure these perturbations. For example in the case of coils,
magnetic flux piercing the coils will change resulting in generation of an emf (electro motive
force) in coils. For a particular coil geometry, the emf generated in coils will depend on (a) the
amplitude and frequency of vibration, (b) external magnetic field and (c) the magnetization of
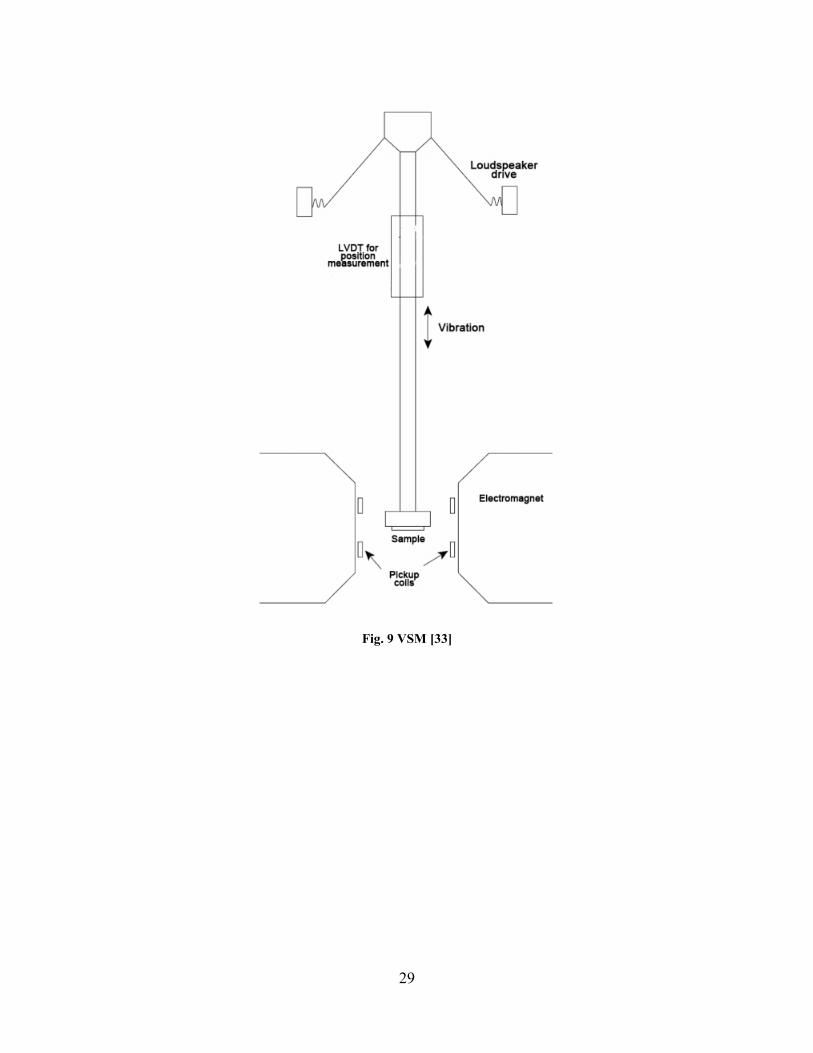
sample. With proper manipulation, we can deduce the value for magnetisation from emf. A
schematic for VSM is shown in Figure 9 [33].
When we study spinel ferrites, we need VSM to obtain magnetic parameters, such as
coercivity, hysteresis and magnetic saturation, which is important for understanding the magnetic
properties of spinel ferrites.
29
Fig. 9 VSM [33]
30
2.0 Research Description
2.1 Hypothesis
Spinel ferrites can undergo phase decomposition inside miscibility gap and form different
new phases, which are ferromagnetic phase and nonmagnetic phase. These mixed new phases
will greatly impact the magnetic property of spinel ferrittes, and the decomposition behavior will
be significantly influenced by composition and processing.
2.2 Objectives
To find out how composition and processing such as annealing influence the phase
decomposition, we synthesized different samples under various conditions. We took advantages
of several analytic instruments to characterize these samples in order to learn how magnetic
properties changed during decomposition and the influences of different process conditions and
composition.
2.3 Tasks
In this research, magnetic parameters such as coercivity and saturation magnetization
should be compared. In addition, parameters related to structure and composition like particle
size, phase peak and lattice constant are also important to learn the influences.

31
There are some key points during the research that we need to notice. The first is that we
should carefully synthesize various samples to achieve high-quality spinel ferrites products,
especially when perform ball milling. Ball milling, as a simple mechanical alloying method, may
result in inhomogeneous mixing of powder, and aggregation as well. High-quality products will
make our result more credible.
32
3.0 Experiment Procedure and Details
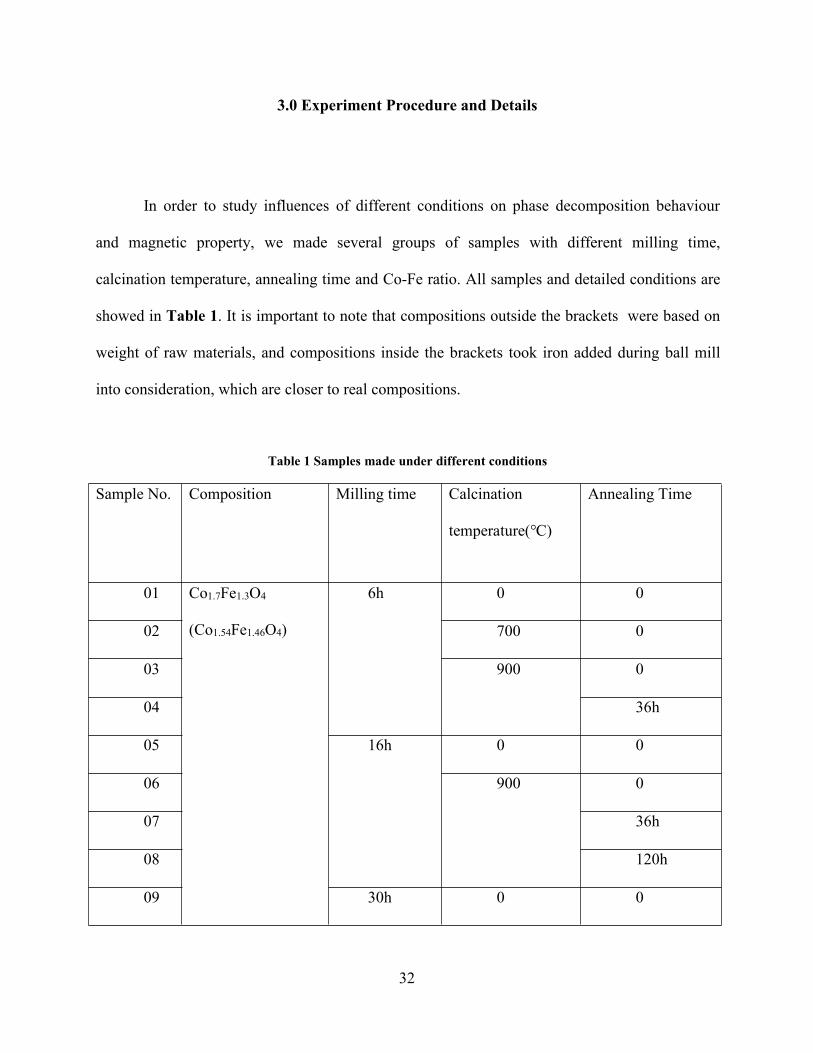
In order to study influences of different conditions on phase decomposition behaviour
and magnetic property, we made several groups of samples with different milling time,
calcination temperature, annealing time and Co-Fe ratio. All samples and detailed conditions are
showed in Table 1. It is important to note that compositions outside the brackets were based on
weight of raw materials, and compositions inside the brackets took iron added during ball mill
into consideration, which are closer to real compositions.
Table 1 Samples made under different conditions
Sample No. Composition Milling time Calcination
temperature(℃)
Annealing Time
01 Co1.7Fe1.3O4
(Co1.54Fe1.46O4)
6h 0 0
02 700 0
03 900 0
04 36h
05 16h 0 0
06 900 0
07 36h
08 120h
09 30h 0 0

33
Table 1 (continued)
Sample No. Composition Milling time Calcination
temperature(℃)
Annealing Time
10 Co1.7Fe1.3O4
(Co1.54Fe1.46O4)
30h 900 0
11 36h
12 Co2FeO4
(Co1.8Fe1.2O4)
16h 0 0
13 900 0
14 36h
15 Co1.9Fe1.1O4
(Co1.75Fe1.25O4)
16h 0 0
16 900 0
17 36h
18 Co2.1Fe0.1O4
(Co1.94Fe1.06O4)
0 0
19 900 0
20 36h
21 Co2.5Fe0.5O4
(Co2.32Fe0.68O4)
0 0
22 900 0
23 36h
34
3.1 Ball Milling
Solid solution Fe-Co-O system was first formed via planetary ball milling. The
stoichiometric amount of high purity Fe3O4 and Co3O4 were mixed to obtain the composition
CoxFe3-xO4 shown in Table 1. The mixed powder and the steel balls (5 mm) were taken into the
steel bowl (125 ml). The ball to material ratio was maintained at 8:1. The mixed powder was
subjected to high-energy mechanical milling using Retsch planetary ball mill PM 100, and we
chose ethanol (25 mL) as dispersant. The milling was continued at rotational speed 450 rpm, and
we applied different milling time as Table 1 reveals. After milling, we dried the products we got
and performed grinding, then conserved these samples.
3.2 Calcination and Annealing
We performed calcination after ball milling via Lindberg Blue M tube furnace in air.
Different calcination temperature were applied at 700 ℃ and 900 ℃ for 12 h. Afterwards,
samples were annealed in tube furnace in air at 700 ℃ for different time as Table 1 notes.
3.3 Characterization
Structural characterization of our powder was performed at room temperature using
Bruker D8 XRD system. The copper Kα X-ray radiation (Kα1 = 0.15405 nm and Kα2 = 0.15443
nm) was used for the diffractometer.

35
Imaging and elemental analyses were performed using a Apreo scanning electron
microscope (SEM) operating at 200 kV and equipped with an X-ray energy dispersive
spectroscopy (X-EDS) system.
The magnetic properties were measured at room temperature using a 8600 series
vibrating sample magnetometer (VSM) from Lake Shore Cryotronics. The maximal applied field
for the measurements was 5 kOe. Particle size of our powder samples was measured using
HORIBA LB-550 DLS.
36
4.0 Results and Discussion
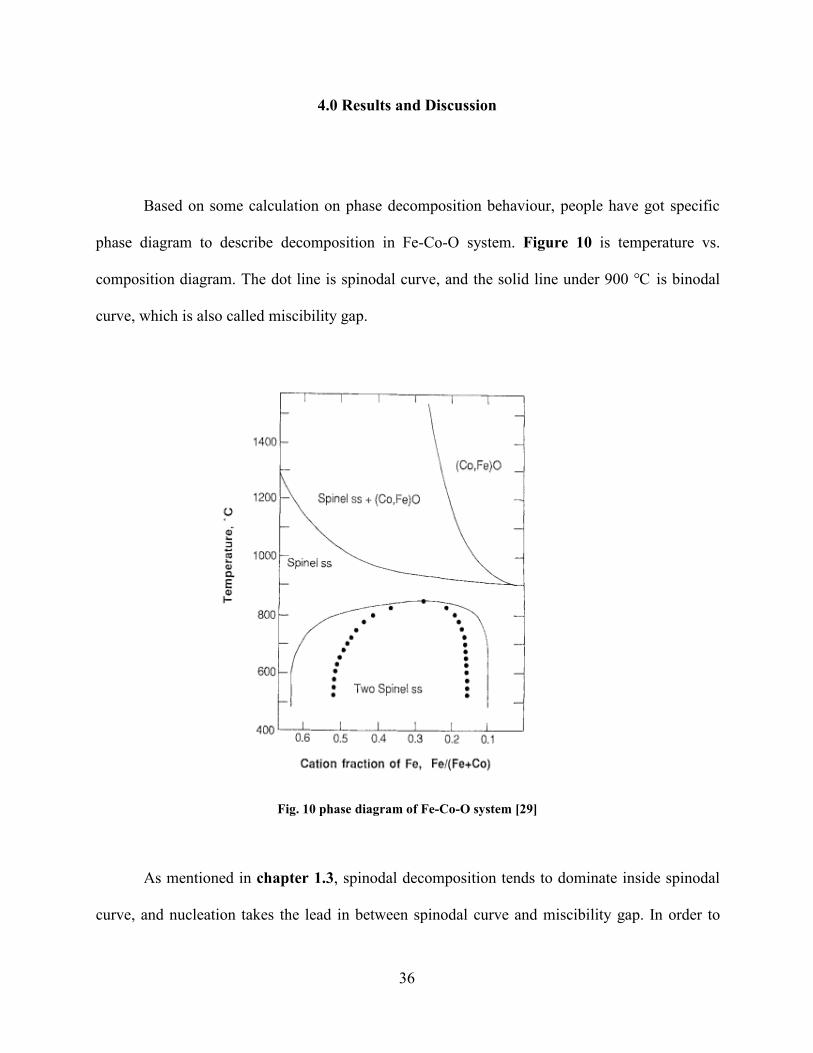
Based on some calculation on phase decomposition behaviour, people have got specific
phase diagram to describe decomposition in Fe-Co-O system. Figure 10 is temperature vs.
composition diagram. The dot line is spinodal curve, and the solid line under 900 ℃ is binodal
curve, which is also called miscibility gap.
Fig. 10 phase diagram of Fe-Co-O system [29]
As mentioned in chapter 1.3, spinodal decomposition tends to dominate inside spinodal
curve, and nucleation takes the lead in between spinodal curve and miscibility gap. In order to
37
get most clear result, we choose 700 ℃ as annealing temperature since it owns relatively broad
space inside spinodal curve and high chemical energy which makes decomposition much easier.
Also, we first formed Co1.7Fe1.3O4 in that such Fe-Co ratio is near center of spinodal area, so that
we can observe obvious decomposition behavior. However, when we perform ball milling, we
need to take the weight loss of steel balls into consideration. During milling, Fe of balls
dissolved into Fe-Co-O solution making Fe-Co ratio increased. Consequently, the overall
composition shifted to spinodal curve boundary, making its decomposition behaviour different.
Afterwards, we produced several samples with different Fe-Co ratio distributed in different areas
inside spinodal curve to observe their behaviour. Accordingly, our discussion will be divided
into two parts, based on composition near spinodal curve boundary and in center of spinodal area.
4.1 Composition Near Spinodal Curve Boundary
We added 5.763 g Co3O4 and 4.237 g Fe3O4 to form Co1.7Fe1.3O4, and the real
composition is expected to be around Co1.54Fe1.46O4 when we take weight loss of steel balls
during milling into consideration. 11 samples with such composition are made under different
condition, which are marked from sample 01 to sample 11 shown in Table 1. We will discuss
how these different conditions influence decomposition behaviour and property below.

38
4.1.1 Calcination Temperature
Sample 01, 02, 03, 04 which were all under 6 h ball milling, are used to figure out how
calcination and distinct calcination temperature make a difference. It is clearly shown in Table 1
that we calcined sample 02 at 700 ℃ , and sample 03 and 04 at 900 ℃ , then sample 04
experienced being annealed at 700 ℃ for 36 h after calcination.
Fig. 11 XRD result of Sample 01, 02, 03 and 04 (from bottom to top)
Figure 11 shows XRD result of these samples. It can be clearly seen that two
components mixed together after 6h ball milling but there was no new phase formed. After
calcination at 700 ℃, the two main peaks which represent Fe3O4 and Co3O4 got closer, and a
new peak shows up around 37.3°. This new peak probably derived from Fe3O4 secondary peak
39
around 37.07°, which is marked by blue line in standard spectra on the bottom, since it shows
similar shift behaviour to main peak of Fe3O4 around 35.7 ° . Obviously, the Fe-Co-O solid
solution after calcination at 700 ℃ is a mixture of three phases--Fe3O4, Co3O4 and CoxFe3-xO4.
Differently, when calcination temperature increased to 900 ℃, the Fe-Co-O solid solution shows
single phase structure, which only contains CoxFe3-xO4. These results are consistent with phase
diagram shown in Figure 10. Sample 04 was annealed at 700 ℃ for 36 h after calcination at
900 ℃. It is revealed that main peak got slight broader after anneal, but no other significant
evidence for spinodal decomposition was found in XRD patterns.
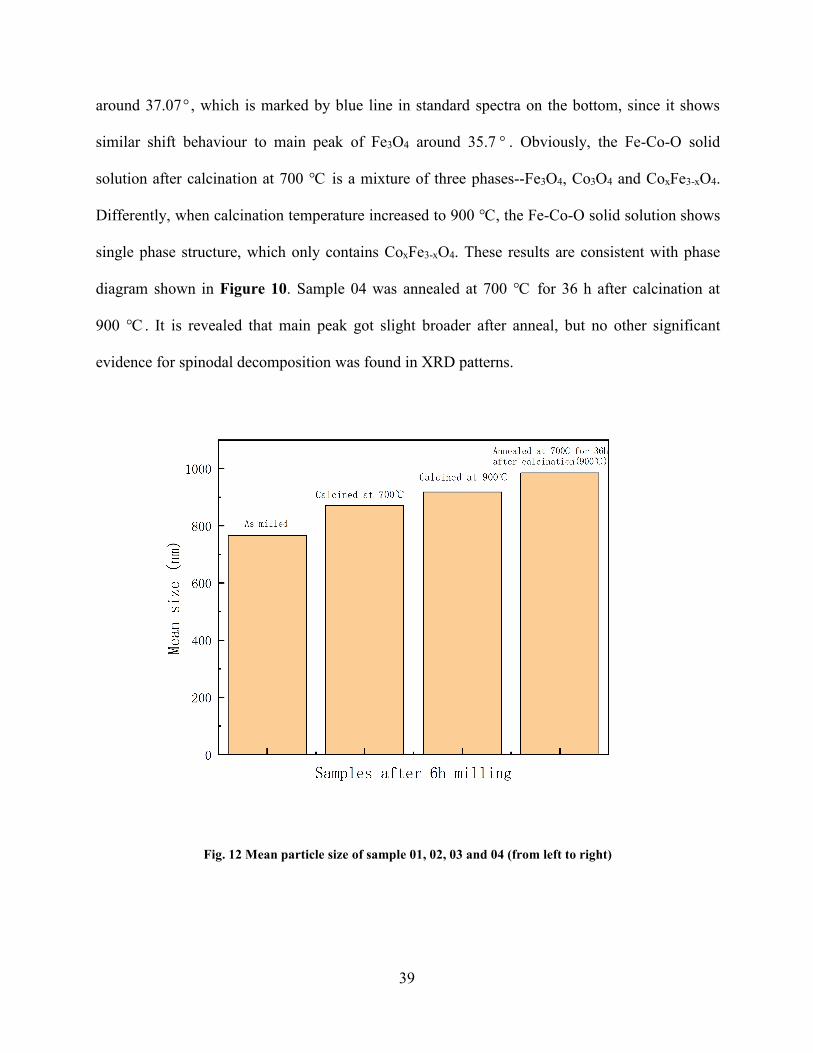
Fig. 12 Mean particle size of sample 01, 02, 03 and 04 (from left to right)
40
We performed DLS test on these four samples to obtain their particle size, and the result
is revealed in Figure 12. After calcination, particle size slightly increased, and kept increasing
with higher calcination temperature and longer treatment time. The increase of particle size
mainly result from growth of particles during calcination and anneal, which is greatly influenced
by thermal conditions.
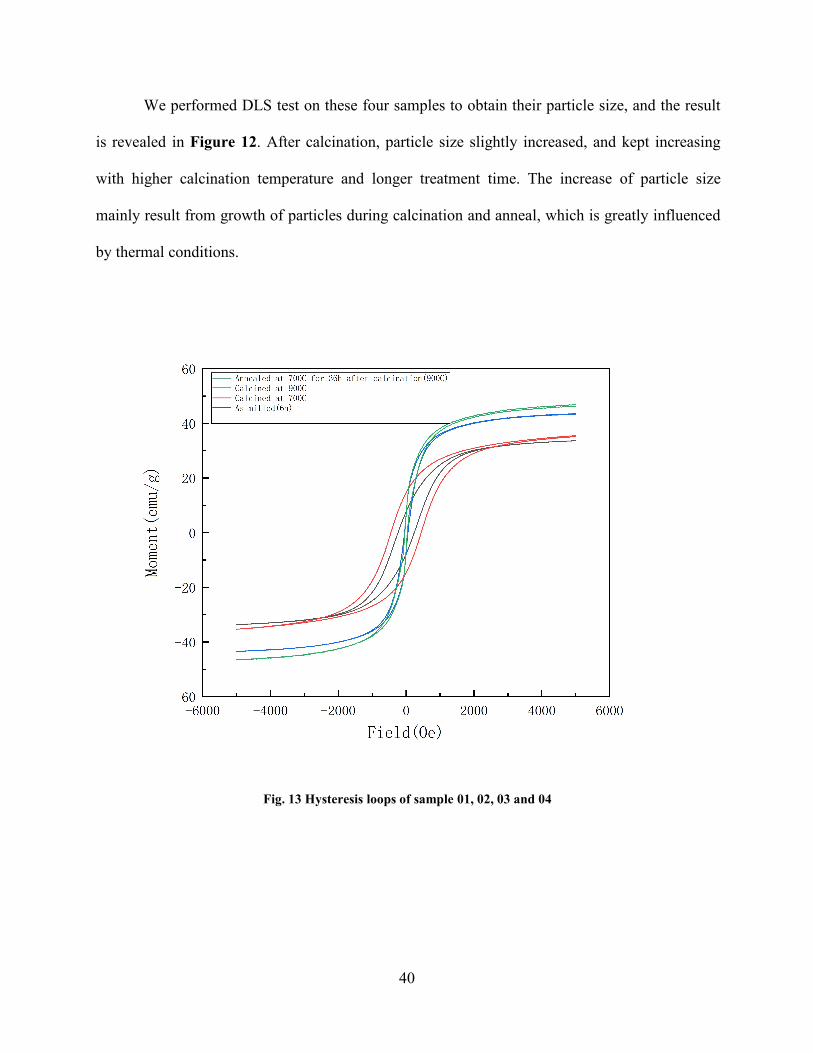
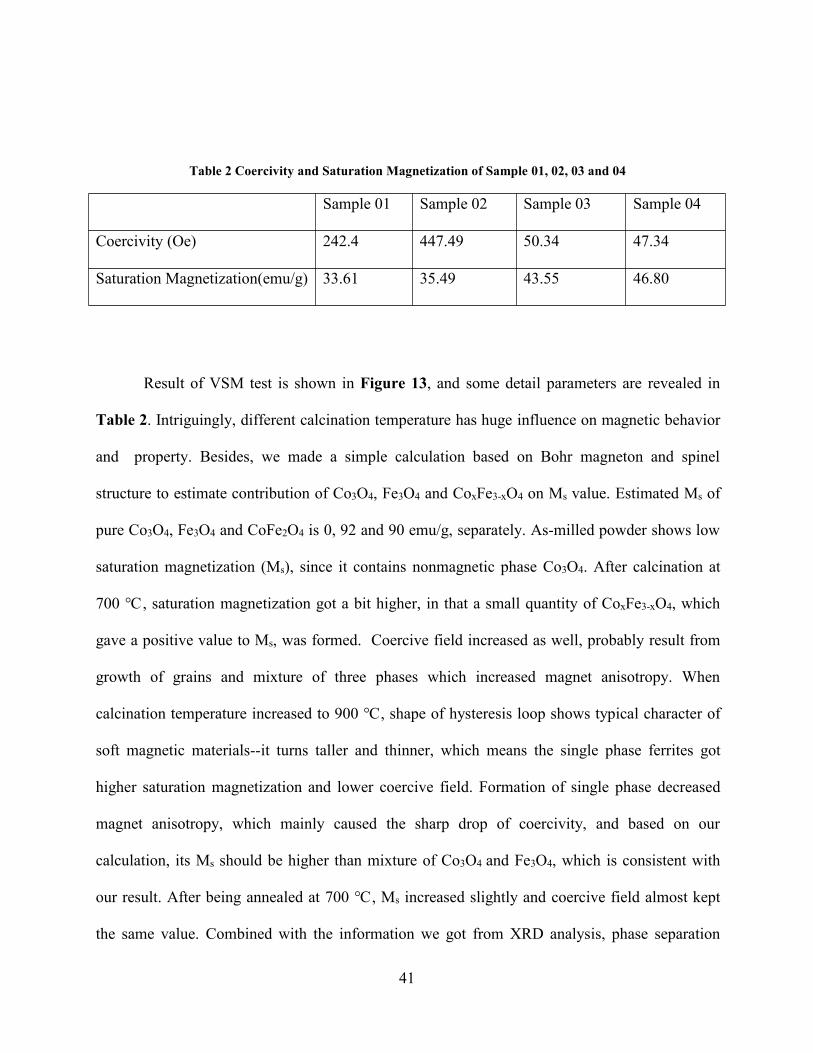
Fig. 13 Hysteresis loops of sample 01, 02, 03 and 04
41
Table 2 Coercivity and Saturation Magnetization of Sample 01, 02, 03 and 04
Sample 01 Sample 02 Sample 03 Sample 04
Coercivity (Oe) 242.4 447.49 50.34 47.34
Saturation Magnetization(emu/g) 33.61 35.49 43.55 46.80
Result of VSM test is shown in Figure 13, and some detail parameters are revealed in
Table 2. Intriguingly, different calcination temperature has huge influence on magnetic behavior
and property. Besides, we made a simple calculation based on Bohr magneton and spinel
structure to estimate contribution of Co3O4, Fe3O4 and CoxFe3-xO4 on Ms value. Estimated Ms of
pure Co3O4, Fe3O4 and CoFe2O4 is 0, 92 and 90 emu/g, separately. As-milled powder shows low
saturation magnetization (Ms), since it contains nonmagnetic phase Co3O4. After calcination at
700 ℃, saturation magnetization got a bit higher, in that a small quantity of CoxFe3-xO4, which
gave a positive value to Ms, was formed. Coercive field increased as well, probably result from
growth of grains and mixture of three phases which increased magnet anisotropy. When
calcination temperature increased to 900 ℃, shape of hysteresis loop shows typical character of
soft magnetic materials--it turns taller and thinner, which means the single phase ferrites got
higher saturation magnetization and lower coercive field. Formation of single phase decreased
magnet anisotropy, which mainly caused the sharp drop of coercivity, and based on our
calculation, its Ms should be higher than mixture of Co3O4 and Fe3O4, which is consistent with
our result. After being annealed at 700 ℃, Ms increased slightly and coercive field almost kept
the same value. Combined with the information we got from XRD analysis, phase separation
42
hardly took place in this case, and the higher saturation magnetization may credit to larger grain
size formed during anneal, since domain wall motion got easier in larger grain size.
4.1.2 Annealing Time
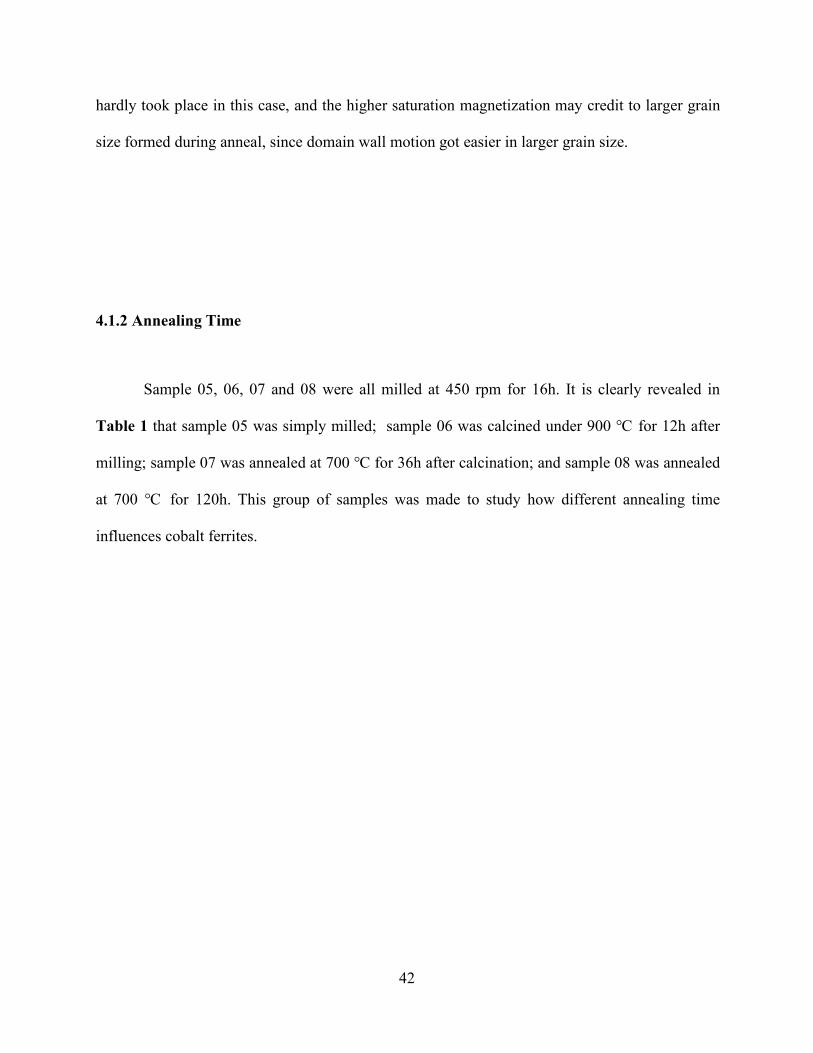
Sample 05, 06, 07 and 08 were all milled at 450 rpm for 16h. It is clearly revealed in
Table 1 that sample 05 was simply milled; sample 06 was calcined under 900 ℃ for 12h after
milling; sample 07 was annealed at 700 ℃ for 36h after calcination; and sample 08 was annealed
at 700 ℃ for 120h. This group of samples was made to study how different annealing time
influences cobalt ferrites.
43
Fig. 14 XRD result of Sample 05, 06, 07 and 08 (from bottom to top)
Fig. 14 shows the result of XRD analysis of sample 05, 06, 07 and 08. After calcination
at 900 ℃, single phase structure was formed, as discussed in last section. With annealing time
increased, the main peak around 35.7° became slightly broader and a small left shift took place,
but no obvious peak separation observed. In addition, when annealing time increased to 120h, a
peak split can be observed at secndary peak around 37.5°. These information may tell that phase
decomposition took place during long time annealing process, and the decomposition behaviour
involves both spinodal decomposition and binodal decomposition.
44
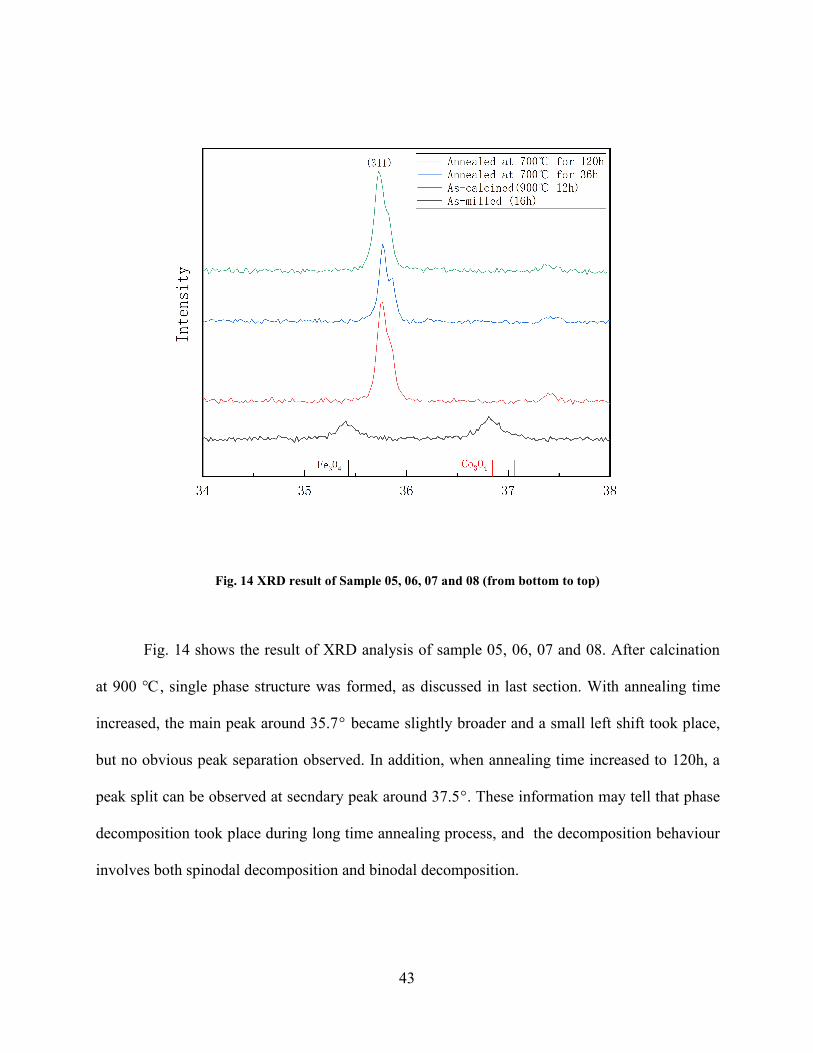
Fig. 15 SEM (10000×) pictures of sample 06 (a), 07 (b), 08 (c)
We performed SEM analysis to observe the morphology of cobalt ferrites we obtained, as
shown in Figure 15. It can be easily observed that after annealing larger grain size was achieved
due to growth behaviour at high temperature. This increase are positive correlated with annealing
time.
a b
c
45
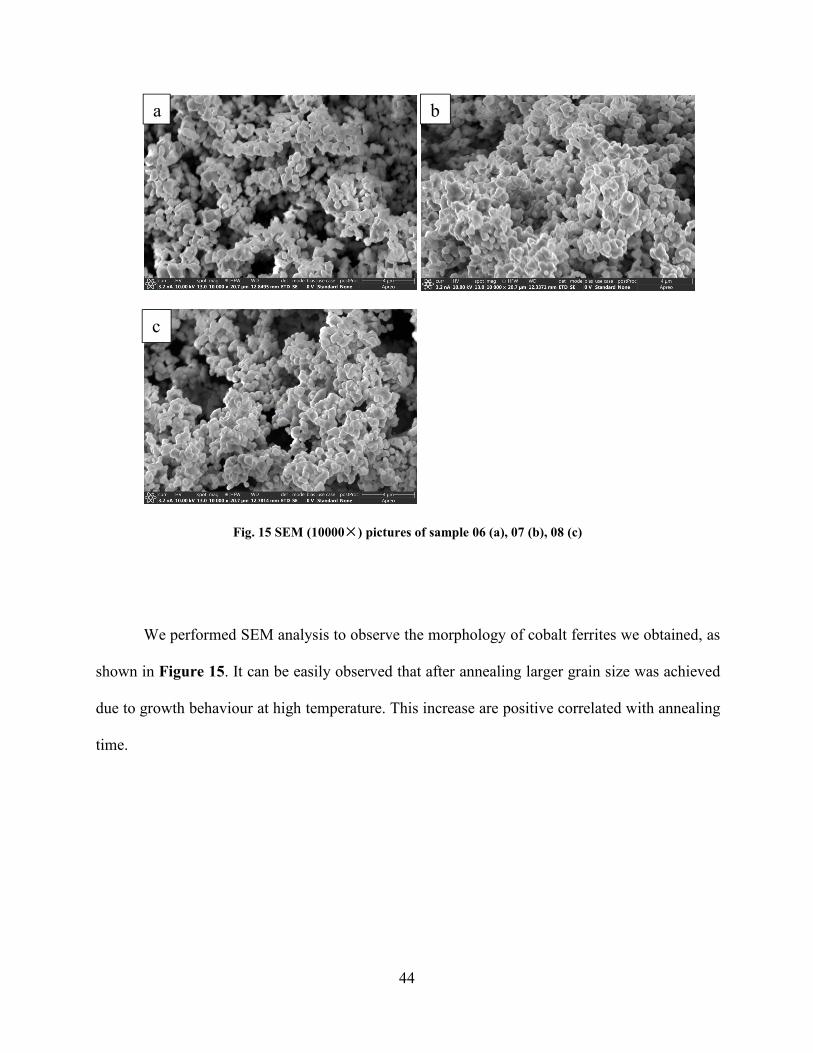
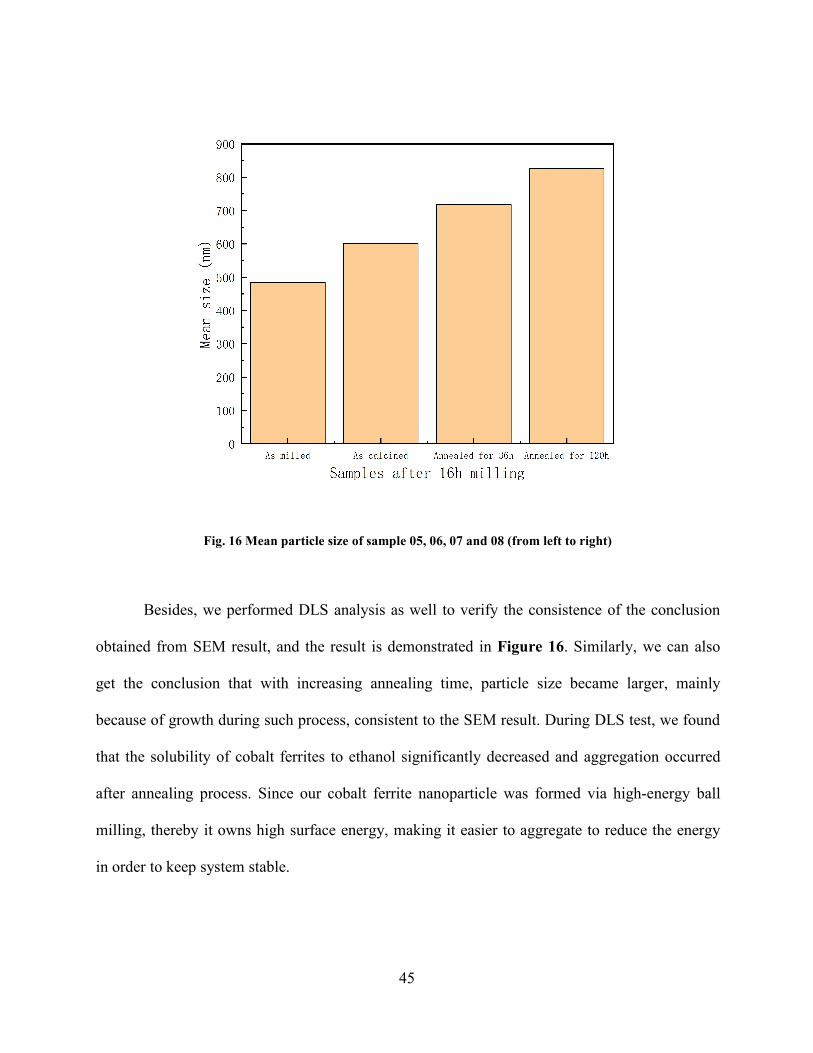
Fig. 16 Mean particle size of sample 05, 06, 07 and 08 (from left to right)
Besides, we performed DLS analysis as well to verify the consistence of the conclusion
obtained from SEM result, and the result is demonstrated in Figure 16. Similarly, we can also
get the conclusion that with increasing annealing time, particle size became larger, mainly
because of growth during such process, consistent to the SEM result. During DLS test, we found
that the solubility of cobalt ferrites to ethanol significantly decreased and aggregation occurred
after annealing process. Since our cobalt ferrite nanoparticle was formed via high-energy ball
milling, thereby it owns high surface energy, making it easier to aggregate to reduce the energy
in order to keep system stable.
46
Fig. 17 Hysteresis loops of sample 05, 06, 07 and 08
Fig. 18 Saturation magnetization and coercivity vs. Annealing time
47
Figure 17 shows hysteresis loops of sample 05, 06, 07 and 08, and Figure 18 illustrates
saturation magnetization and coercivity’s relation with annealing time, tested by VSM at room
temperature(300K). As-milled powder shows low saturation magnetization and high coercivity,
and after calcination at 900 ℃ where single phase structure was formed, cobalt ferrite achieved
high saturation magnetization and low coercive field, shows totally soft magnetic features, and
such result is consistent with sample 01 and 03 mentioned in last section. After being annealed at
700 ℃ for 36h, we observed a big increase in saturation magnetization and coercivity. As we
discussed in last section, larger grain size obtained from growth behaviour during annealing can
make it easier for domain wall motion since the number of domains increased and grain
boundary was diminished. Apart from influence of grain size, phase separation contributed a lot
to the increase of Ms and coercive field. Single phase decomposed into iron-rich phase and
cobalt-rich phase during annealing, increasing magnetic anisotropy which mainly resulted in
higher coercivity. According to phase diagram of Fe-Co-O, as shown in Figure 10, estimated
composition of iron-rich phase is Co1.12Fe1.84O4, and composition of cobalt-rich phase is
Co2.69Fe0.31O4. Based on Ms = |MA-MB| (the absolute value of the difference between A site and B
site) and distribution of cations, we can evaluate Ms of iron-rich phase and cobalt-rich phase
separately. It turns out that in composition Co1.7Fe1.3O4, the combination of iron-rich phase and
cobalt-rich phase owns higher saturation magnetization than single phase spinel structure. In a
word, phase separation during annealing process at 700 ℃ for 36h shows positive influence on
magnetic properties of cobalt ferrite. Coercivity still increased with a slower speed after being
annealed at 700 ℃ for 120h. However, we observed that saturation magnetization slightly
decreased when annealing time extended to 120h. Some explanations make sense to figure out
this phenomenon. The first one is that with annealing time got longer and longer, grown grain
48
squeezed pores inside ferrite which may come from air and those pores remained in between
boundaries, thereby domain wall motion was restricted. Another possible reason is small amount
of antiferromagnetic Fe2O3 was precipitated during long time annealing, resulting in reduced
Fe3+ cations and increased bivalent ions inside cobalt ferrite, consequently saturation
magnetization decreased.
4.1.3 Milling Time
Sample 01, 05 and 09 are as-milled powder with different milling time, and sample 04,
07 and 11 are as-annealed powder (700 ℃, 36h) based on sample 01, 05 and 09, separately.
These two groups of samples were prepared to study how different milling time influenced
properties and phase decomposition behaviour of cobalt ferrite.
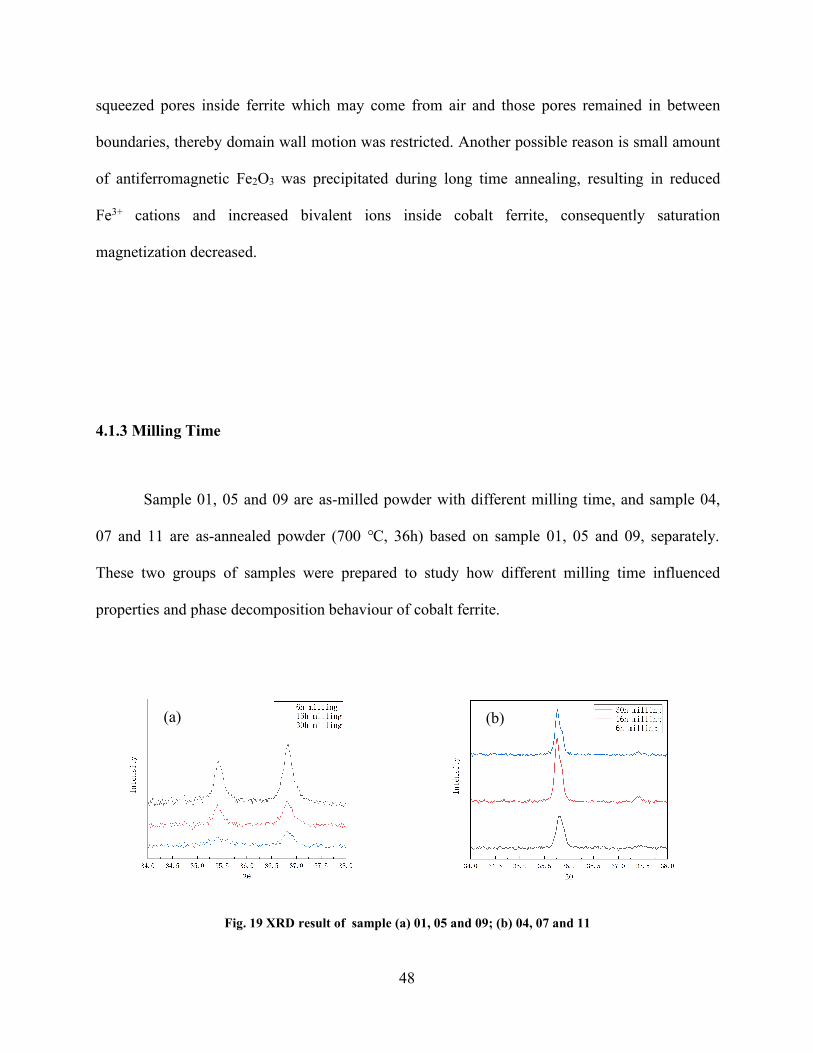
Fig. 19 XRD result of sample (a) 01, 05 and 09; (b) 04, 07 and 11
(a) (b)
49
Figure 19 shows XRD result of these two group of samples. In Figure 19(a), peak
position of three as-milled powder are almost the same, indicating that no new main phase
showed up after simply milling process. It’s obviously with milling time decreased, peaks of
Co3O4 and Fe3O4 which are our raw materials, became sharper. That implies the degree of
mixing is positively correlated with milling time. The same conclusion could be found in Figure
19(b). Secondary peak around 37.5° seems sharp in sample 07 and sample 11, furthermore, peak
split took place in sample 11. However, in sample 04, secondary peak around 37.5° looks flat.
This phenomenon could be explained by difference in mixing degree due to different milling
time. In addition, main peak of sample 07 and 11 shows a slight left shift, indicating that phase
separation took place. It is well known that high-energy ball milling could form numerous
defects inside powder, which contributes to diffusion behaviour. Combined with the XRD result,
we can conclude that long time ball milling could help promote phase decomposition during
annealing process.
50
Fig. 20 Mean particle size of as-milled sample 01, 05 and 09 (red line), and as-annealed sample 04, 07 and 11
(black line) vs. miling time
We also performed DLS analysis to study influence of milling time on particle size, and
the result is displayed in Figure 20. With milling time increased, particle size of as-milled
powder got smaller, and so did the as-annealed samples. This result can be easily understood
since the longer milling time is, the more crush and collide will be performed, thereby the
particle size will decrease. Besides, we observed that the tendency of size decrease slowed down
when milling time continued to extend. There is a limitation of size decrease in ball milling--we
cannot keep refining the particle by performing high-energy ball milling. That is because with
particle becomes finer, its surface energy will keep increasing, when the size scale reaches a very
small level (like nano-particle), aggregation takes place to reduce energy in order to keep system
stable. When we performed DLS analysis, we found aggregation was much easier formed in
samples with long milling time, which is consistent with our conclusion above. Besides, after
51
being annealed, we observed increased size in all three samples, which is also same as what we
discussed in last two sections.
Fig. 21 XRD result and hysteresis loops of sample 09 (black), 10 (red) and 11 (blue)
Before we discuss how milling time influence magnetic properties of as-annealed sample
04, 07 and 11, we’d better show some properties of sample 09, 10 and 11 first, which all
experienced ball milling for 30h. Sample 09 is as-milled, and sample 10 experienced calcination
at 900 ℃ for 12h after milling. Figure 21 illustrates XRD result and hysteresis loops of these
samples. It is clearly that a slight left-shift and broadening of main peak in XRD pattern took
place. After calcination at 900 ℃, single phase was formed and high saturation magnetization
and low coercive field were obtained. After being annealed at 700 ℃ for 36h, both Ms and
coercivity increased, which resulted from phase decomposition and larger grain size. However,
magnitude of the increase was smaller than as-annealed sample 07, which was under ball milling
for 16h.
52
Fig. 22 Hysteresis loops of sample 04, 07 and 11 (as-annealed)
Fig. 23 Saturation magnetization and coercivity of as-annealed sample 04, 07 and 11 vs. Milling time
53
Hysteresis loops of sample 04, 07 and 11 are shown in Figure 22, and their saturation
magnetization along with coercivity is displayed in Figure 23. Obviously, sample 04, which
experienced milling for 6h, showed lowest coercivity and Ms. It is mainly because 6h is not long
enough to form great mixture of two raw materials and defects to promote diffusion, which will
help phase decomposed. When milling time increased to 16h, saturation magnetization and
coercive field reached highest value, and after 30h milling, Ms and coercive field slightly
decreased. The decrease of Ms might result from much more defects formed during 30h milling,
which restricted domain wall motion. The decrease of coercivity might be related to diminished
phase decomposition due to aggregation behaviour, which is easier to occur in powder which
experienced longer milling.
4.1.4 Fe-Co Ratio
Samples (sample 01-11) we discussed above owns composition near left spinodal curve
boundary. To further study the behaviour and properties of ferrites with composition near
spinodal curve boundary, we made sample 21, 22 and 23, which are located near right boundary.
We can compared these samples with sample 05, 06 and 07 to study how ratio made a difference
and similarity between cobalt ferrite with different composition near spinodal curve boundary.
54
Fig. 24 XRD result of sample 21 (as-milled), 22 (as-calcined) and 23 (as-annealed)
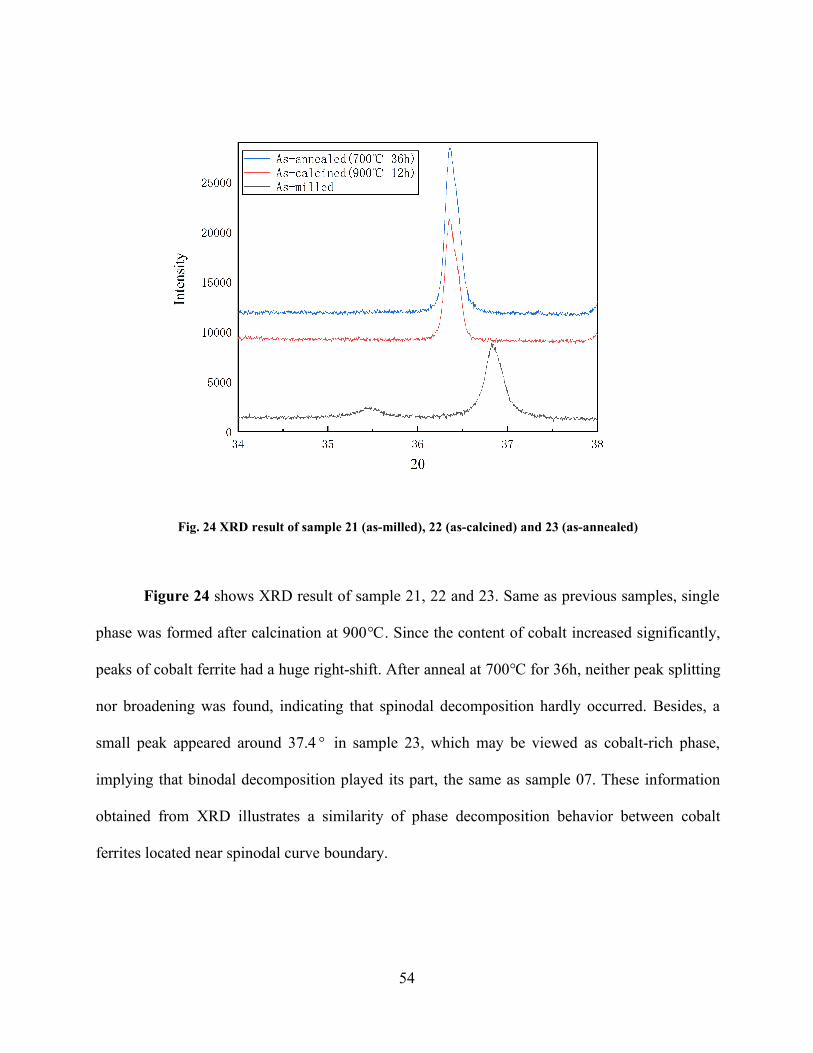
Figure 24 shows XRD result of sample 21, 22 and 23. Same as previous samples, single
phase was formed after calcination at 900℃. Since the content of cobalt increased significantly,
peaks of cobalt ferrite had a huge right-shift. After anneal at 700℃ for 36h, neither peak splitting
nor broadening was found, indicating that spinodal decomposition hardly occurred. Besides, a
small peak appeared around 37.4 ° in sample 23, which may be viewed as cobalt-rich phase,
implying that binodal decomposition played its part, the same as sample 07. These information
obtained from XRD illustrates a similarity of phase decomposition behavior between cobalt
ferrites located near spinodal curve boundary.
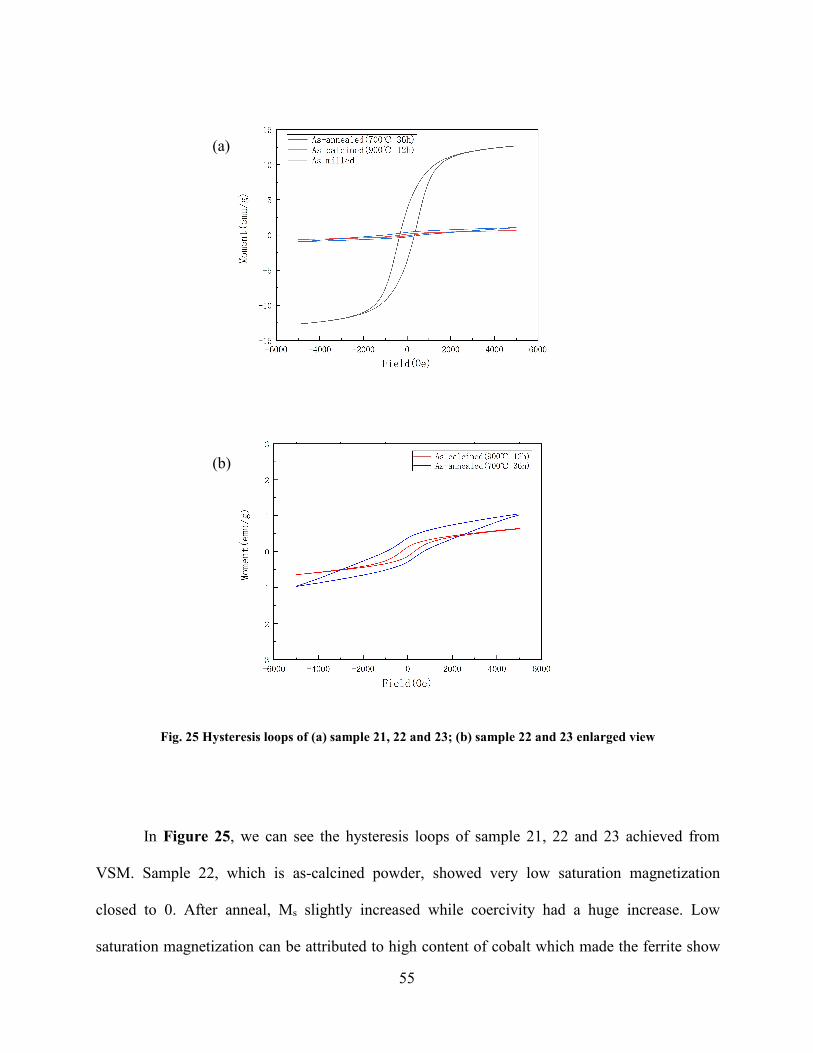
55
Fig. 25 Hysteresis loops of (a) sample 21, 22 and 23; (b) sample 22 and 23 enlarged view
In Figure 25, we can see the hysteresis loops of sample 21, 22 and 23 achieved from
VSM. Sample 22, which is as-calcined powder, showed very low saturation magnetization
closed to 0. After anneal, Ms slightly increased while coercivity had a huge increase. Low
saturation magnetization can be attributed to high content of cobalt which made the ferrite show
(a)
(b)
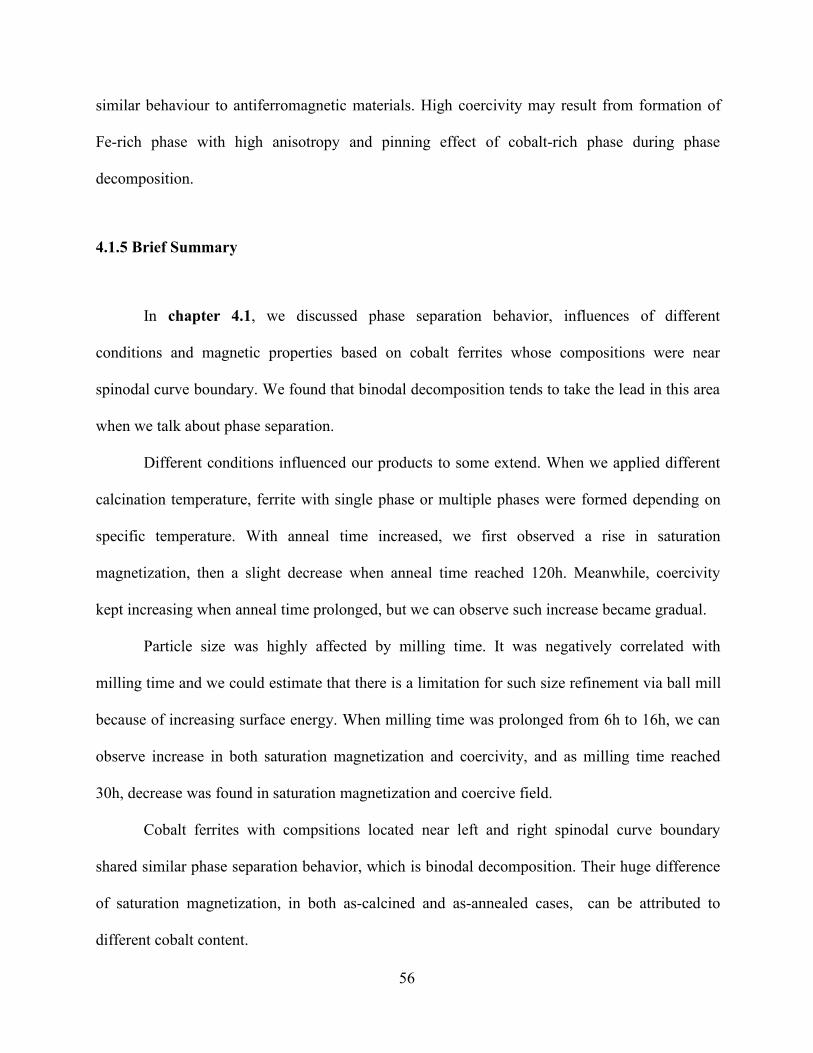
56
similar behaviour to antiferromagnetic materials. High coercivity may result from formation of
Fe-rich phase with high anisotropy and pinning effect of cobalt-rich phase during phase
decomposition.
4.1.5 Brief Summary
In chapter 4.1, we discussed phase separation behavior, influences of different
conditions and magnetic properties based on cobalt ferrites whose compositions were near
spinodal curve boundary. We found that binodal decomposition tends to take the lead in this area
when we talk about phase separation.
Different conditions influenced our products to some extend. When we applied different
calcination temperature, ferrite with single phase or multiple phases were formed depending on
specific temperature. With anneal time increased, we first observed a rise in saturation
magnetization, then a slight decrease when anneal time reached 120h. Meanwhile, coercivity
kept increasing when anneal time prolonged, but we can observe such increase became gradual.
Particle size was highly affected by milling time. It was negatively correlated with
milling time and we could estimate that there is a limitation for such size refinement via ball mill
because of increasing surface energy. When milling time was prolonged from 6h to 16h, we can
observe increase in both saturation magnetization and coercivity, and as milling time reached
30h, decrease was found in saturation magnetization and coercive field.
Cobalt ferrites with compsitions located near left and right spinodal curve boundary
shared similar phase separation behavior, which is binodal decomposition. Their huge difference
of saturation magnetization, in both as-calcined and as-annealed cases, can be attributed to
different cobalt content.
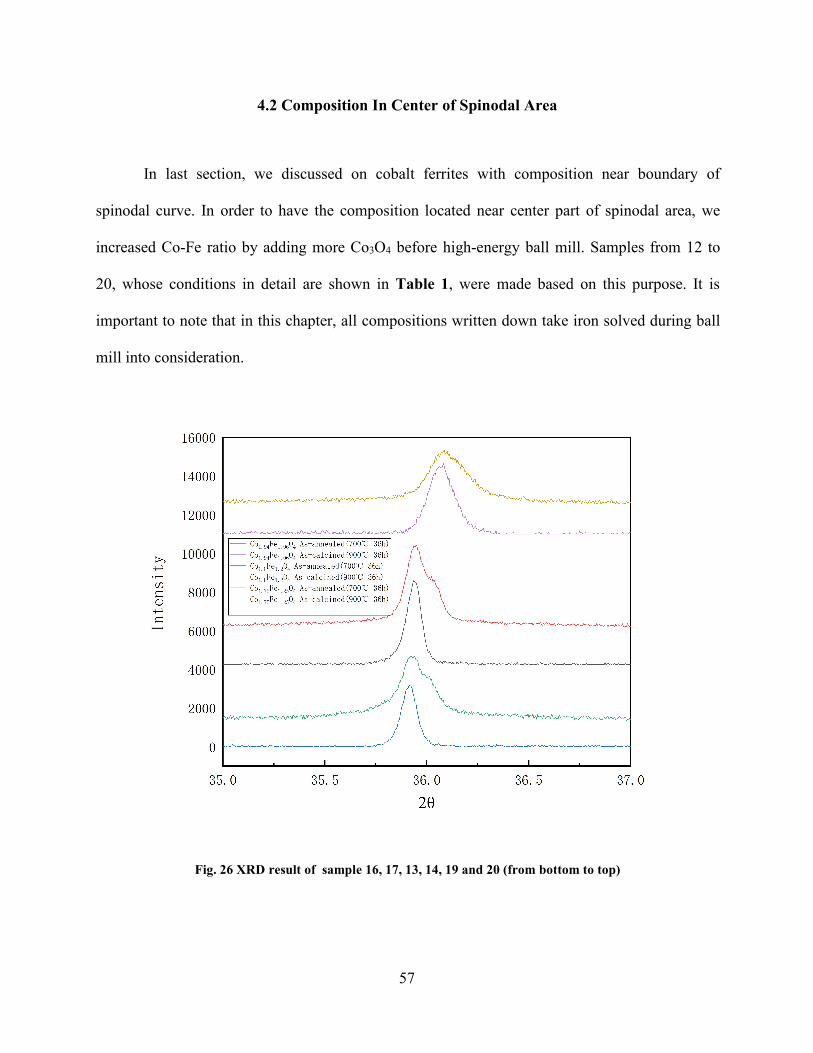
57
4.2 Composition In Center of Spinodal Area
In last section, we discussed on cobalt ferrites with composition near boundary of
spinodal curve. In order to have the composition located near center part of spinodal area, we
increased Co-Fe ratio by adding more Co3O4 before high-energy ball mill. Samples from 12 to
20, whose conditions in detail are shown in Table 1, were made based on this purpose. It is
important to note that in this chapter, all compositions written down take iron solved during ball
mill into consideration.
Fig. 26 XRD result of sample 16, 17, 13, 14, 19 and 20 (from bottom to top)
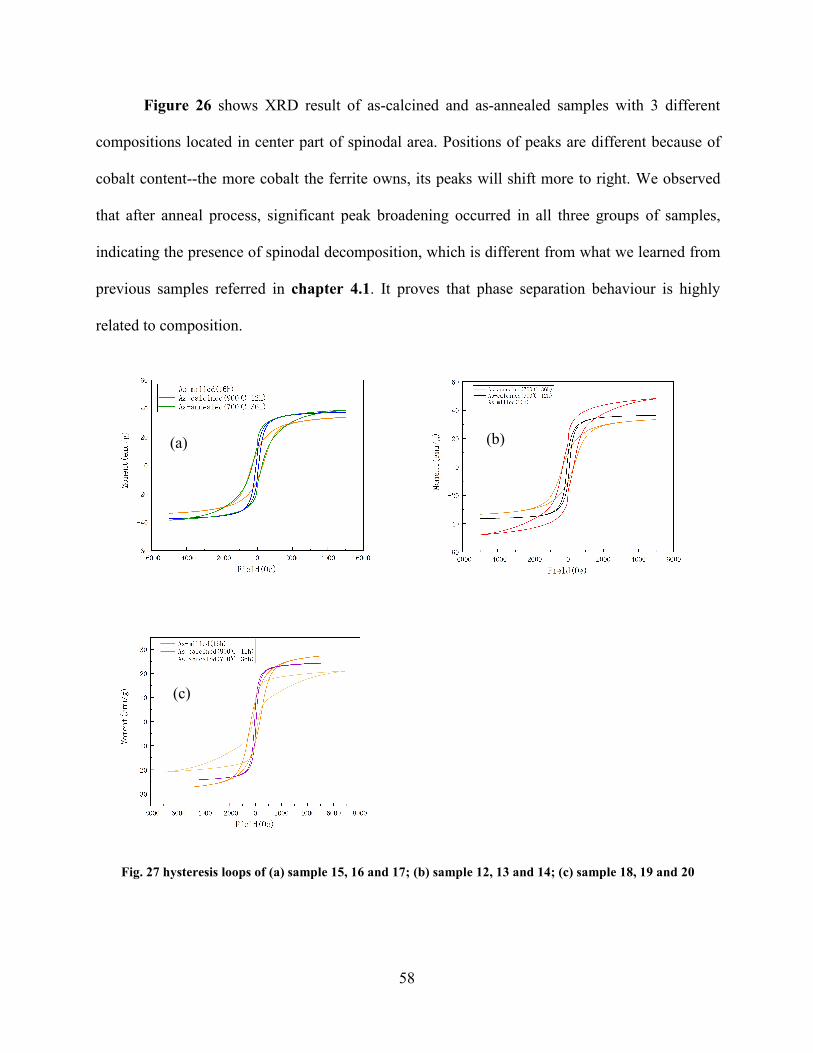
58
Figure 26 shows XRD result of as-calcined and as-annealed samples with 3 different
compositions located in center part of spinodal area. Positions of peaks are different because of
cobalt content--the more cobalt the ferrite owns, its peaks will shift more to right. We observed
that after anneal process, significant peak broadening occurred in all three groups of samples,
indicating the presence of spinodal decomposition, which is different from what we learned from
previous samples referred in chapter 4.1. It proves that phase separation behaviour is highly
related to composition.
Fig. 27 hysteresis loops of (a) sample 15, 16 and 17; (b) sample 12, 13 and 14; (c) sample 18, 19 and 20
(a) (b)
(c)
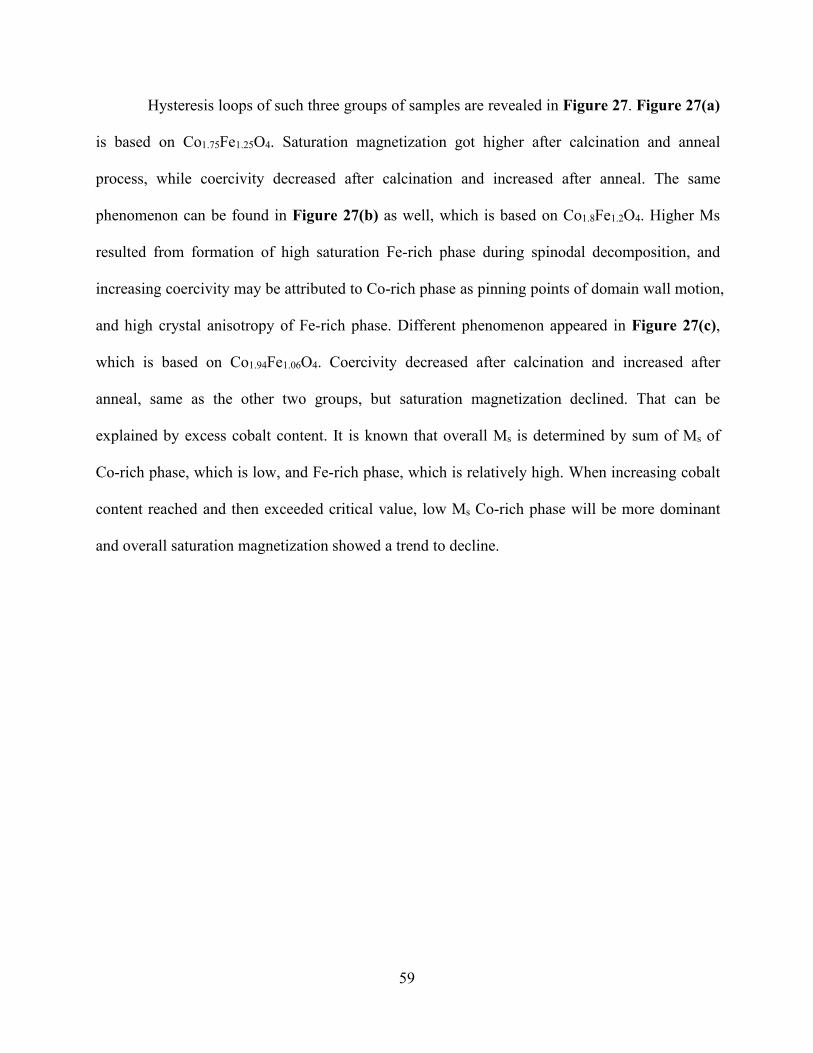
59
Hysteresis loops of such three groups of samples are revealed in Figure 27. Figure 27(a)
is based on Co1.75Fe1.25O4. Saturation magnetization got higher after calcination and anneal
process, while coercivity decreased after calcination and increased after anneal. The same
phenomenon can be found in Figure 27(b) as well, which is based on Co1.8Fe1.2O4. Higher Ms
resulted from formation of high saturation Fe-rich phase during spinodal decomposition, and
increasing coercivity may be attributed to Co-rich phase as pinning points of domain wall motion,
and high crystal anisotropy of Fe-rich phase. Different phenomenon appeared in Figure 27(c),
which is based on Co1.94Fe1.06O4. Coercivity decreased after calcination and increased after
anneal, same as the other two groups, but saturation magnetization declined. That can be
explained by excess cobalt content. It is known that overall Ms is determined by sum of Ms of
Co-rich phase, which is low, and Fe-rich phase, which is relatively high. When increasing cobalt
content reached and then exceeded critical value, low Ms Co-rich phase will be more dominant
and overall saturation magnetization showed a trend to decline.
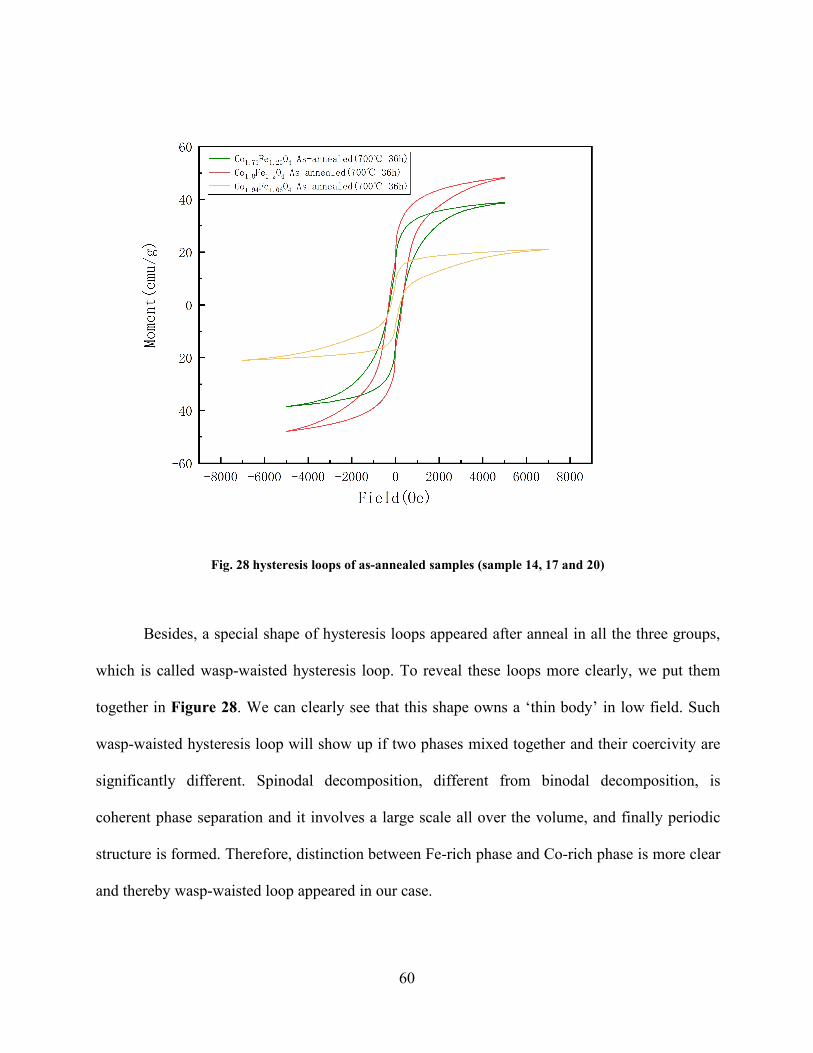
60
Fig. 28 hysteresis loops of as-annealed samples (sample 14, 17 and 20)
Besides, a special shape of hysteresis loops appeared after anneal in all the three groups,
which is called wasp-waisted hysteresis loop. To reveal these loops more clearly, we put them
together in Figure 28. We can clearly see that this shape owns a ‘thin body’ in low field. Such
wasp-waisted hysteresis loop will show up if two phases mixed together and their coercivity are
significantly different. Spinodal decomposition, different from binodal decomposition, is
coherent phase separation and it involves a large scale all over the volume, and finally periodic
structure is formed. Therefore, distinction between Fe-rich phase and Co-rich phase is more clear
and thereby wasp-waisted loop appeared in our case.
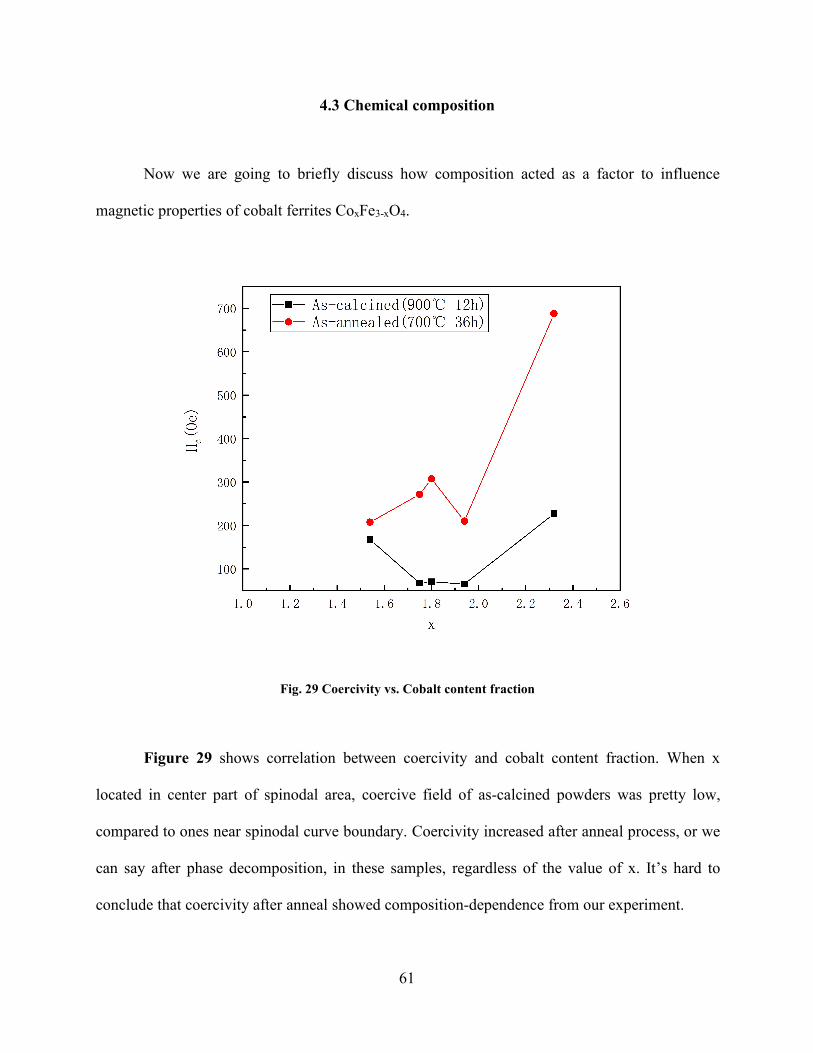
61
4.3 Chemical composition
Now we are going to briefly discuss how composition acted as a factor to influence
magnetic properties of cobalt ferrites CoxFe3-xO4.
Fig. 29 Coercivity vs. Cobalt content fraction
Figure 29 shows correlation between coercivity and cobalt content fraction. When x
located in center part of spinodal area, coercive field of as-calcined powders was pretty low,
compared to ones near spinodal curve boundary. Coercivity increased after anneal process, or we
can say after phase decomposition, in these samples, regardless of the value of x. It’s hard to
conclude that coercivity after anneal showed composition-dependence from our experiment.
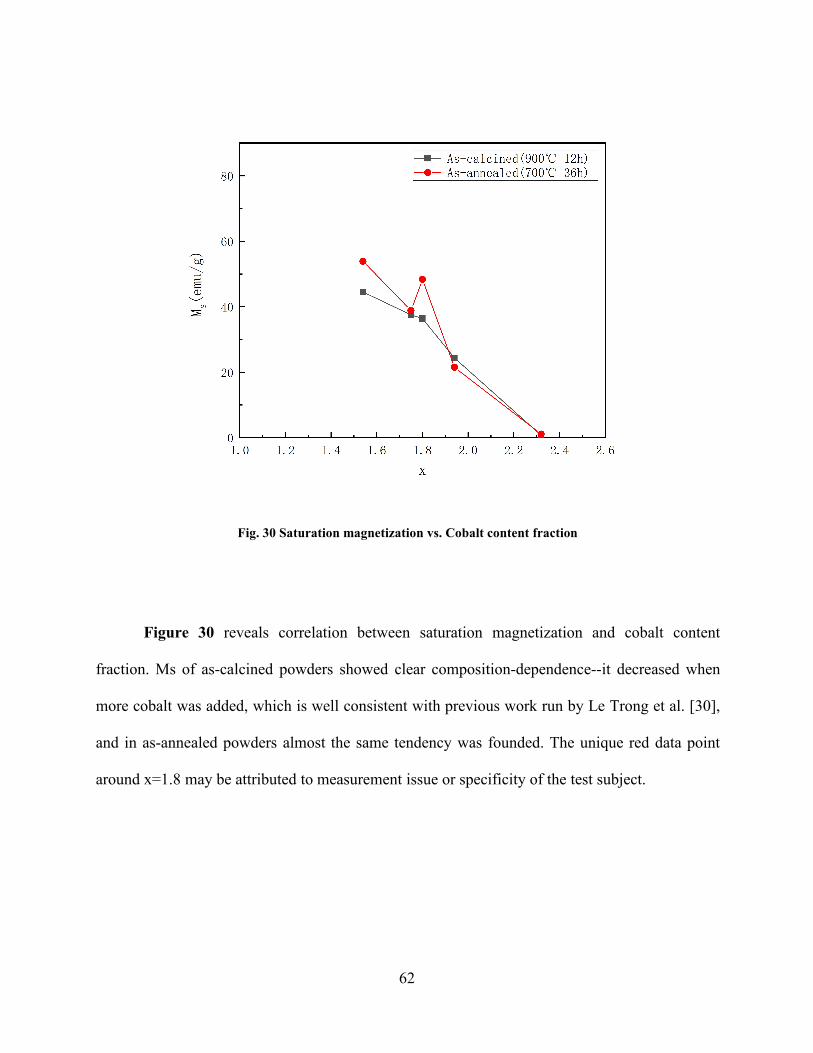
62
Fig. 30 Saturation magnetization vs. Cobalt content fraction
Figure 30 reveals correlation between saturation magnetization and cobalt content
fraction. Ms of as-calcined powders showed clear composition-dependence--it decreased when
more cobalt was added, which is well consistent with previous work run by Le Trong et al. [30],
and in as-annealed powders almost the same tendency was founded. The unique red data point
around x=1.8 may be attributed to measurement issue or specificity of the test subject.
63
5.0 Conclusion and prospect
Cobalt ferrites nanopowders(CoxFe3-xO4) were successfully made via high-energy
planetary ball mill and subsequent calcination. After anneal, phase separation was observed. The
phase separation behaviour and influence of different conditions, such as calcination temperature,
annealing time, milling time, cobalt content fraction were characterized.
Saturation magnetization showed composition-dependence, to be more specific,
negatively correlated to cobalt content fraction (x≤2.34), which is attributed to increase of
antiferromagnetic cobalt ions. Coercive field did not show consistent composition-dependence.
Different phase separation behaviour was observed between samples with compositions
located near spinodal curve boundary and ones around the center part of spinodal area. In former
situation, binodal decomposition based on nucleation mechanism played the lead role, while
spinodal decomposition dominated in latter situation. It may indicate that high-energy ball mill
made a difference.
Proper calcination temperature is of vital for formation of single phase ferrites. Mixture
of three phases appeared when the temperature was set at 700 ℃, while single phase structure
showed up as the temperature rose to 900 ℃, consistent with how phase diagram revealed.
Annealing time played a important part in ferrites. Particle size got bigger with increasing
annealing time, because of growth mechanism. Saturation magnetization increased in the early
stage, which mainly resulted from Fe-rich phase with higher Ms formed during spinodal
decomposition. With annealing time prolonged to 120h, saturation magnetization slightly
decreased. It is likely that grown grain squeezed pores inside ferrite and those pores remained in
between boundaries, thereby domain wall motion was restricted. Another possible reason is
64
small amount of antiferromagnetic Fe2O3 was precipitated during long time annealing, resulting
in reduced Fe3+ cations and increased bivalent ions inside cobalt ferrite, consequently saturation
magnetization decreased. Coercivity increased with annealing time, since Fe-rich phase with
high crystal anisotropy and Co-rich phase acting as pinning point of domain wall motion were
formed during phase separation. This means it is possible to control coercivity to some extent via
anneal, which may help further optimize engineering.
Particle size was significantly influenced by milling time. It got smaller when more
milling time was applied, and the refinement had a limitation. As-annealed sample under milling
for 6h, showed lowest coercivity and Ms. It is mainly because 6h is not long enough to form
great mixture of two raw materials and defects to promote diffusion. When milling time
increased to 16h, saturation magnetization and coercive field reached highest value, and after
30h milling, Ms and coercive field slightly decreased. The decrease of Ms might be attributed to
excess defects formed during 30h milling, which acted as pinning point restricting domain wall
motion. The decrease of coercivity might be related to aggregation behaviour.
In our work, high-energy ball mill was proved to be a effective method to form spinel
ferrite nanopowders. In further research, more samples based on different annealing time should
be produced and tested to get more precise and consistent result. Besides, different annealing
temperature is a good stand point. In addition to properties characterization, tests on performance
are of vital, such as resistance test to see how periodic, incoherent phase mixture formed by
spinodal decomposition performed differently from phase mixture formed by nucleation.
65
Bibliography
[1] A. Broese Van Groenou, P. F. Bongers, A. L. Stuyts. Magnetism, Microstrueture and CrystalChemistry of Spinel Ferrites. Mater. Sci. Eng., 3 (1968/69) 317-392
[2] A. Goldman, Handbook of Modern Ferromagnetic Materials (Springer, Berlin, 1999)
[3] W. Kingery, H. Bowen, D. Uhlmann, Introduction to ceramics (John Wiley & Sons, NewYork, 1976)
[4] L. Neel, Magnetic properties of ferrites: ferrimagnetism and antiferromagnetism. Ann. Phys.3, 137–198 (1948)
[5] J.S. Kim, W.H. Chang, The effect of calcining temperature on the magnetic properties of theultra-fine NiCuZn-ferrites. Mater. Res. Bull. 44, 633–637 (2009)
[6] R.C. Pohanka, P.L. Smith, S.W. Freiman, L.M. Levinson, Electronic Ceramics, Properties,Devices and Applications. Recent Advances in Piezoelectric Ceramics, ElectronicCeramics (Marcel Dekker, New York, 1988)
[7] A. Goldman, Modern Ferrite Technology (Van Nostrand Reinhold, New York, 1990)
[8] C. Guillaud, The properties of manganese-zinc ferrites and the physical processes governingthem. Proc. IEE-Part B Radio Electron. Eng. 104(5S), 165–173 (1957)
[9] T. Pannaparayil, R. Marande, S. Komarneni, Magnetic properties of high-density Mn–Znferrites. J. Appl. Phys. 69(8), 5349 (1991)
[10] J. Pankert, Influence of grain boundaries on complex permeability in MnZn ferrites. J. Magn.Magn. Mater. 138(1–2), 45–51 (1994)
[11] M.T. Johnson, E.G. Visser, A coherent model for the complex permeability inpolycrystalline ferrites. IEEE Trans. Magn. 26(5), 1987–1989 (1990)
[12] A. Znidarsic, M. Drofenik, High-resistivity grain boundaries in CaO-doped MnZn ferritesfor high-frequency power application. J. Am. Ceram. Soc. 82(2), 359–365 (1999)
[13] H. Shokrollahi, K. Janghorban, Influence of additives on the magnetic properties,microstructure and densification of Mn–Zn soft ferrites. Mater. Sci. Eng. B 141(3), 91–107 (2007)
[14] Abdollah Hajalilou, Saiful Amri Mazlan, A review on preparation techniques for synthesisof nanocrystalline soft magnetic ferrites and investigation on the effects of microstructurefeatures on magnetic properties. Appl. Phys. A (2016) 122:680
66
[15] Tokatlidis S, Kogias G, Zaspalis VT. Low loss MnZn ferrites for applications in thefrequency region of 1–3 MHz. J Magn Magn Mater 2018;465:727–35.
[16] Kalarus J, Kogias G, Holz D, Zaspalis VT. High permeability–high frequency stable MnZnferrites. J Magn Magn Mater 2012;324:2788–94.
[17] Gheisari Kh, Javadpour S, Shokrollahi H, Hashemi B. Magnetic losses of the soft magneticcomposites consisting of iron and Ni–Zn ferrite. J Magn Magn Mater 2008;320:1544–8.
[18] Rashidi S, Ataie A. Structural and magnetic characteristics of PVA/CoFe2O4 nano-composites prepared via mechanical alloying method. Mater Res Bull 2016;80:321–8.
[19] Moustafa SF, Morsi MB. The formation of Mg ferrite by mechanical alloying and sintering.Mater Lett 1998;34:241–7.
[20] Panneer Muthuselvam I, Bhowmik RN. Mechanical alloyed Ho3+ doping in CoFe2O4 spinelferrite and understanding of magnetic nanodomains. J Magn Magn Mater 2010;322:767–76.
[21] Ding J, McCormick PG, Street R. Formation of spinel Mn-ferrite during mechanicalalloying. J Magn Magn Mater 1997;171:309–14.
[22] Koohkan R, Sharafi S, Shokrollahi H, Janghorban K. Preparation of nanocrystalline Fe–Nipowders by mechanical alloying used in soft magnetic composites. J Magn Magn Mater2008;320:1089–94.
[23] S. Zahi, M. Hashim, A.R. Daud, Synthesis, Magnetic properties and microstructure of Ni–Zn ferrite by sol–gel technique. J. Magn. Magn. Mater. 308(2), 177–182 (2007)
[24] M. Atif, M. Nadeem, R. Grossinger, R.S. Turtelli, Studies on the magnetic, magnetostrictiveand electrical properties of sol–gel synthesized Zn doped nickel ferrite. J. Alloys Compd.509(18), 5720–5724 (2011)
[25] C.F. Zhang, X.C. Zhong, H.Y. Yu, Z.W. Liu, D.C. Zeng, Effects of cobalt doping on themicrostructure and magnetic properties of Mn–Zn ferrites prepared by the co-precipitation method. Phys. B Condens. Matter 404(16), 2327–2331 (2009)
[26] I. Sharifi, H. Shokrollahi, M.M. Doroodmand, R. Safi, Magnetic and structural studies onCoFe2O4 nanoparticles synthesized by co-precipitation, normal micelles and reversemicelles methods. J. Magn. Magn. Mater. 324(10), 1854–1861 (2012)
[27] T. Jahanbin, M. Hashim, K. Amin Mantori, Comparative studies on the structure andelectromagnetic properties of Ni–Zn ferrites prepared via co-precipitation andconventional ceramic processing routes. J. Magn. Magn. Mater. 322(18), 2684–2689(2010)
[28] S. Lomaev, L. Vasil’ev, Thermodynamically stable compositional inhomogeneous zones inthe process of spinodal decomposition. Eur. Phys. J. Special Topics 229, 295-304 (2020)
67
[29] TAKAHASHI M, GUIMARÃES JRC, FINE ME. Spinodal Decomposition in the SystemCoFe2O4‐Co3O4. J Am Ceram Soc 1971;54:291–5.
[30] Le Trong H, Barnabé A, Presmanes L, Tailhades P. Phase decomposition study inCoxFe3−xO4 iron cobaltites: Synthesis and structural characterization of the spinodaltransformation. Solid State Sci 2008;10:550–6.
[31] Le Trong H, Presmanes L, De Grave E, Barnabé A, Bonningue C, Tailhades P. Mössbauercharacterisations and magnetic properties of iron cobaltites CoxFe3-xO4 (1≤x≤2.46) beforeand after spinodal decomposition. J Magn Magn Mater 2013;334:66–73.
[32] S. Zahi, A.R. Daud, M. Hashim, A comparative study of nickel–zinc ferrites by sol–gelroute and solid-state reaction. Mater. Chem. Phys. 106(2), 452–456 (2007)
[33] Syed Alamdar Hussain Shah, Vibrating Sample Magnetometery: Analysis and Construction,2013
[34] A. Talaata, M.V. Suraj, K. Byerly, A. Wang, Y. Wang, J.K. Lee, P.R. Ohodnicki Jr, Reviewon soft magnetic metal and inorganic oxide nanocomposites for power applications.Journal of Alloys and Compounds 870 (2021) 159500