
Influence of processing route on microstructure and mechanical properties of MgAl2O4 spinel
Upload
independentCategory
view
0download
0
www.elsevier.com/locate/jpcs
Author’s Accepted Manuscript
Magnetic characterization of Li1+xMn2-xO4 spinel(0 ≤ x ≤ 1/3)
M. Kopec, J.R. Dygas, F. Krok,A. Mauger, F. Gendron,C.M. Julien
PII: S0022-3697(07)00721-4DOI: doi:10.1016/j.jpcs.2007.11.005Reference: PCS 5311
To appear in: Journal of Physics andChemistry of Solids
Received date: 12 January 2007Revised date: 29 October 2007Accepted date: 3 November 2007
Cite this article as: M. Kopec, J.R. Dygas, F. Krok, A. Mauger, F. Gendron and C.M. Julien,Magnetic characterization of Li1+xMn2-xO4 spinel (0 ≤ x ≤ 1/3), Journal of Physics andChemistry of Solids (2007), doi:10.1016/j.jpcs.2007.11.005
This is a PDF file of an unedited manuscript that has been accepted for publication. Asa service to our customers we are providing this early version of the manuscript. Themanuscript will undergo copyediting, typesetting, and review of the resulting galley proofbefore it is published in its final citable form. Please note that during the production processerrors may be discovered which could affect the content, and all legal disclaimers that applyto the journal pertain.
peer
-005
1932
8, v
ersi
on 1
- 20
Sep
201
0Author manuscript, published in "Journal of Physics and Chemistry of Solids 69, 4 (2009) 955"
DOI : 10.1016/j.jpcs.2007.11.005

Accep
ted m
anusc
ript
Magnetic characterization of Li1+xMn2−xO4
spinel (0 ≤ x ≤ 1/3)
M. Kopec†, J. R. Dygas†, F. Krok†,
A. Mauger‡, F. Gendron¶, C. M. Julien¶,
†Faculty of Physics, Warsaw University of Technology,
Koszykowa 75, 00-662 Warsaw (Poland)
‡Institut de Minéralogie et de Physique des Milieux Condensés,
Université Pierre et Marie Curie, 140 rue de Lourmel, 75015 Paris (France)
¶Institut des Nano-Sciences de Paris,
Université Pierre et Marie Curie, 140 rue de Lourmel 75015 Paris (France)
PA Classification Numbers: 81.05.-t, 82.45.Vp, 75.50. Pp
1
* Manuscriptpe
er-0
0519
328,
ver
sion
1 -
20 S
ep 2
010
Accep
ted m
anusc
ript
Abstract
Li1+xMn2−xO4 spinels have been prepared by wet route technique
in the whole concentration range 0 ≤ x ≤ 1/3. Structural analysis has
been performed by X-ray diffraction and scanning electron microscopy
and Raman spectroscopy. The investigation of impurity phases by mag-
netic experiments complete the sample characterization, allowing for
a comparison with samples obtained by other chemical routes. The
analysis of the intrinsic magnetic properties show that the magnetic in-
teractions are Mn3+-O-Mn3+ interactions in a geometrically frustrated
lattice, while the Mn4+-Mn4+ interactions are negligible, with the con-
sequence that the paramagnetic Curie temperature vanishes in the limit
x ≃ 1/3 where only Mn4+ ions remain. A consistent description of both
the extrinsic and the intrinsic properties including former investigations
of electron paramagnetic resonance has been achieved in relation to the
electrochemical properties.
2
peer
-005
1932
8, v
ersi
on 1
- 20
Sep
201
0

Accep
ted m
anusc
ript
1 Introduction
The lithium manganese spinel LiMn2O4 is currently the subject of many in-vestigations, since this material is promising for use as positive electrode foradvanced lithium-ion batteries [1, 2, 3, 4]. The major difficulty for wide scaleapplications, however, comes from the difficulty to prepare samples of goodquality, because the Jahn-Teller Mn3+ ion favors lattice distortions. Cationicsubstitution in LiMn2O4 spinel is beneficial to the structural stability of thecubic lattice, because increasing the Mn4+ concentration at the expense of theMn3+ concentration avoids both the dilution of electrode and the onset of theJahn-Teller effect [5]. In this framework, the substitution of Li for manganeseaccording to the chemical formula Li1+xMn2−xO4, 0 ≤ x ≤ 1/3, is associatedto a shift of the average valence of the Mn from +3.5 (case x = 0) to +4
(case x = 1/3). The chemical formula can also be written Li[LixMn2−x]O4, toemphasize that the Li+ ions occupy all the tetrahedral 8a sites of the spinellattice, the part in excess residing on the octahedral positions on the 16d sites,in substitution to manganese.
The fragility of the lattice also explains that the structural properties ofthe material are very sensitive to the mode of preparation. This is evidencedby the different local structure of Li1+xMn2−xO4 from different sources, inves-tigated in the past by X-ray diffraction [6, 7], electron paramagnetic resonance(EPR) [7, 8, 9, 10], and optical spectroscopy (Raman and Fourier transform in-frared spectroscopy) [11]. Different results have been found, depending on themethod of preparation of the samples. In particular, a very nice study of theformation of such materials from the reactive system MnO/Li2CO3 has beenperformed by XRD, EPR [6, 7] and nuclear magnetic resonance (NMR) [12].The result is that such samples with lithium cationic fraction larger than 0.35prepared by this method are multi-phased, including a stoichiometric phaseLiMn2O4, a non stoichiometric phase Li1+xMn2−xO4, and the Li2MnO3 impu-rity phase, in addition of the Mn3O4 impurity phase. To avoid these impurityphases, wet chemistry has been considered has a promising route to preparethe samples. The EPR characterization of samples prepared by this techniquehas been performed in [10]. The main features of the EPR spectra are es-sentially the same, irrespective of the two modes of preparation we have justoutlined. In particular, in both cases, the spectra show a sharp line at x > 0.1,in addition of the broad asymmetric line observed in nearly stoichiometric(x<0.05) samples. The origin of the additional peak, however, is questionable.In samples prepared by the MnO/Li2CO3 route, the additional peak has been
3
peer
-005
1932
8, v
ersi
on 1
- 20
Sep
201
0

Accep
ted m
anusc
ript
attributed to the secondary phase Li2MnO3 and a sharp line when x > 0.This attribution has been questioned by the fact that the peak is observed insamples prepared by the wet chemical route which should avoid the formationof this secondary phase [10]. In addition, the paramagnetic Curie temperaturededuced from the values of the Weiss constant was found to remain negativein the whole range 0 ≤ x ≤ 1/3, unlike results of direct measurements ofthe magnetic susceptibility, rising again the question whether this is due tothe better accuracy of magnetic measurements, or the difference in synthesismethod.
In this context, we found desirable to perform direct magnetic measure-ments and XRD characterization on samples prepared by the wet chemistryroute. We show that the wet chemistry route decreases the proportion of sec-ondary phases with respect to the reactive MnO/Li2CO3 route, in agreementwith [10], but not to the point than they all disappear as it was suggested inthis prior work. The secondary phase LiMn2O4 is still evidenced in the sam-ples prepared by wet chemistry for x>0.2, but the phase percentage is typically12 % for x > 0.25, against 30% for the same Li excess in samples preparedby the MnO/Li2CO3 route. On another hand, the LiMn2O4 secondary phaseis not observed in the Li-rich samples prepared by the wet chemistry route.The presence of Mn3O4 impurity phase depends on the sintering temperature.We could detect it for a sintering temperature of 800˚C, but no longer whendecreasing the sintering temperature to 750˚C.
Another result of this paper concerns the intrinsic magnetic propertiesof the material. We confirm that the material remains dominated by antiferro-magnetic interactions, which vanish in the limit x = 1/3 where all the Mn ionsare tetravalent. The magnetic properties are dominated by the geometric frus-tration of these antiferromagnetic interactions in the lattice. This feature is abasic reason why the magnetic properties are very sensitive to the structuralproperties, with the consequence that the study of the magnetic properties isfound to be an efficient tool to probe the crystallinity and structural order ata local scale.
Electrochemical properties show that Mn4+ ions are electrochemicallyinactive and so is the end-member at x = 1/3 that contains only manganese inthis ionic configuration. This is also the reason for the decrease of the capacityas a function of x from the initial value of 108.7 mAh/g at x = 0.
4
peer
-005
1932
8, v
ersi
on 1
- 20
Sep
201
0

Accep
ted m
anusc
ript
2 Experimental
Li1+xMn2−xO4 powders with 0.00 ≤ x ≤ 0.33 were prepared by the succinicacid-assisted wet chemistry technique [13]. In this technique, the succinic acidplays the role of chelating agent. Stoichiometric amounts of lithium acetateand manganese acetate are dissolved in distilled water. The above solutions areadded to aqueous solution of succinic acid (the complexing agent) and heated.The homogeneous precipitates are obtained owing to the poor solubility ofmanganese and lithium succinates, which are finely dispersed in the solutionmedium. It is believed that the carboxylic groups on the succinic acid formchemical bond with the metal ions and these mixtures develop the extremelyviscous paste-like substance upon slow evaporation of water. The lithiumand transition metal cations are trapped homogeneously within the paste andensure molecular level mixing. The paste is further dried at 110˚C to obtainthe dried precursor mass. The precursor is then allowed to decompose in airat around 400˚C and heated at 750˚C. Additionally stoichiometric powder(LiMn2O4) was heated at 800˚C, in order to investigate the influence of thesintering temperature.
The structure of Li1+xMn2−xO4 samples was characterized by the X-ray powder diffraction (XRD) using a diffractometer Philips X’Pert apparatusequipped with a CuKα X-ray source. The diffraction patterns were taken atroom temperature in the range 10˚≤ 2θ ≤80˚using step scans of 0.0167˚.
Electrical properties were studied on pressed pellets with gold electrodessputtered on the polished surface. Impedance measurements were carried outon the Solartron 1260 analyzer from 0.01Hz to 10MHz in the temperature rangeof 200˚K to 400˚K. The impedance spectra are illustrated for two differentcompositions.
Raman spectra have been measured in the spectral range 200-800 cm−1 atroom temperature in a quasi-backscattering geometry. A Jobin-Yvon (modelU1000)) double monochromator with holographic gratings and a computer-controlled photon-counting system was used. The laser light source was the514.5 nm line radiation from a Spectra-Physics 2020 argon-ion laser. To have alarge signal to noise ratio, 12 successive scans recorded at a spectral resolutionof 2 cm−1 are averaged.
Magnetic measurements were made on SQUID (Superconducting Quan-tum Interference Device), using a liquid helium cooled amplifier to measurethe magnetic moment in the range from 10−7 to 300 emu. Two kinds of mea-surements were recorded in the temperature range 4 - 300 K : isothermal
5
peer
-005
1932
8, v
ersi
on 1
- 20
Sep
201
0

Accep
ted m
anusc
ript
magnetization M(H) recorded in the field range 0-30 kOe, and temperaturedependence of the magnetic susceptibility χ(T ). The magnetic susceptibil-ity was recorded during heating the samples using zero-field cooled (ZFC) andfield-cooled (FC) modes at magnetic field 10 kOe. The χ(T ) and M(H) curveswere correlated to achieve a complete analysis of the magnetic properties ofthe materials.
3 Structural properties
3.1 XRD characterization
The XRD diagrams of the x = 0 samples display only the cubic spinel phase,and are in agreement with the standard pattern (JCPDS, Card n˚89-0118). Atlarge values of x, however, the Li2MnO3 impurity phase is also detected. Thespectra are illustrated at such compositions in Fig. (1). The analysis of thespectra has been performed by Rietveld refinement. The refinement strategyis based on the maximum neighborhood method of Marquardt (Levenberg-Marquardt method [14]), which overcomes the problem of highly correlatedparameters in a non-linear least-square refinement. In each cycle, the algorithmoptimizes an extra parameter λ that is added to all the diagonal elementsin order to improve this usually ill-conditioned matrix. λ is reduced duringthe refinement to a value between 10−3 and 10−8. The results are displayedin Table 1, for both the spinel Li1+xMn2−xO4 and the monoclinic Li2MnO3
impurity phase, when it is detected, i.e. at x > 0.2. For x ≤ 0.2, the amountof this impurity phase is below the detection threshold estimated to few %.Therefore, at any concentration x of Li excess, the amount of this impurityphase is about 2-3 times less than in materials prepared by other chemical route[6, 7]. On another hand, the lattice parameters and volume of the unit cellfor this impurity phase, also reported in the Table 1, are found in quantitativeagreement with the results reported in these prior works. Therefore, only theamount of this impurity phase is dependent of the mode of preparation, but notits local structure. This is actually expected, because the lattice parameters(and the volume of the unit cell) of this impurity phase are not significantlydependent on x, and close to those of single-phased Li2MnO3, so that XRDdoes not give evidence of any chemical pressure or strain on this impurityphase, coming from its Li1+xMn2−xO4 environment.
6
peer
-005
1932
8, v
ersi
on 1
- 20
Sep
201
0

Accep
ted m
anusc
ript
The lattice parameter a(x) of the Li1+xMn2−xO4 series as a function ofx, reported in Fig. (2) shows a large deviation form the linear Vegard’s law.This is fully consistent with FTIR experiments [11] , which show that theshift of the stretching frequency of the infrared band as a function of x isnot linear, and almost saturates at x = 1/3 in x, just like a(x). This ratherunusual behavior comes from the fact that an increase of x does not reduceto a chemical pressure effect, which is the implicit condition for obtaining theVegard’s law. It also reduces the amount of Mn3+ ions, so that it changes theionicity of the chemical bonds in the lattice.
The crystallite size was calculated by using Scherrer’s formula 〈L〉 =
kλ/(B cos θ) for the broadening of the spinel (111) and (222) reflections ofthe Li1+xMn2−xO4 spectrum with k = 0.9 and λ = 1.54056 Å. The widthB of the Bragg peaks due to the size effects has been separated from thebroadening associated to the microstrain effects Bstrain by the different (tan θ)dependence of Bstrain on the Bragg angle θ. The results, compared with thecrystallite size 〈D〉 measured from scanning electron microscopy (SEM) arereported in Table 2. Note the size deduced from the SEM experiments is anaverage length of a line parallel to the diffracting plane, passing through the3-dimensional powder grains. It is then different in essence from the averagesize 〈L〉 deduced from the Scherrer’s law. Assuming spherical particles, therelation is 〈D〉/〈L〉 = 4/3. After table 2, 〈D〉/〈L〉 is not the same for both(111) and (222) lines, which is not a surprise since the particles are not perfectlyspherical. More important is the fact that 〈D〉/〈L〉 is in the range [1, 4/3], sothat the crystallites probed by XRD have about the same size as the grainsprobed by SEM. This length measured on the SEM images present a Gaussian-like distribution, with a standard deviation σ = 5%. This is an evidence thatthe grains are the crystallites, so that this size is a test of the crystallinity ofthe samples. With this regard, the crystallinity of LiMn2O4 is better for thesample sintered at 800˚C than the sample sintered at 750˚C.
3.2 Characterization by transport properties
LiMn2O4 presents a first order Verwey transition at temperature Tv ≃ 290K
with an hysteresis of 10 K [5, 15]. Above Tv, the material adopts the normalspinel-type structure (cubic, Fd3m) with the octahedral sites occupied by Mnions in the mixed valence state 3.5. At Tv the lattice undergoes a transitionto a very complex orthorhombic phase with incomplete charge ordering [16,17] of Mn3+ and Mn4+ ions. The Verwey transition can be evidenced by
7
peer
-005
1932
8, v
ersi
on 1
- 20
Sep
201
0

Accep
ted m
anusc
ript
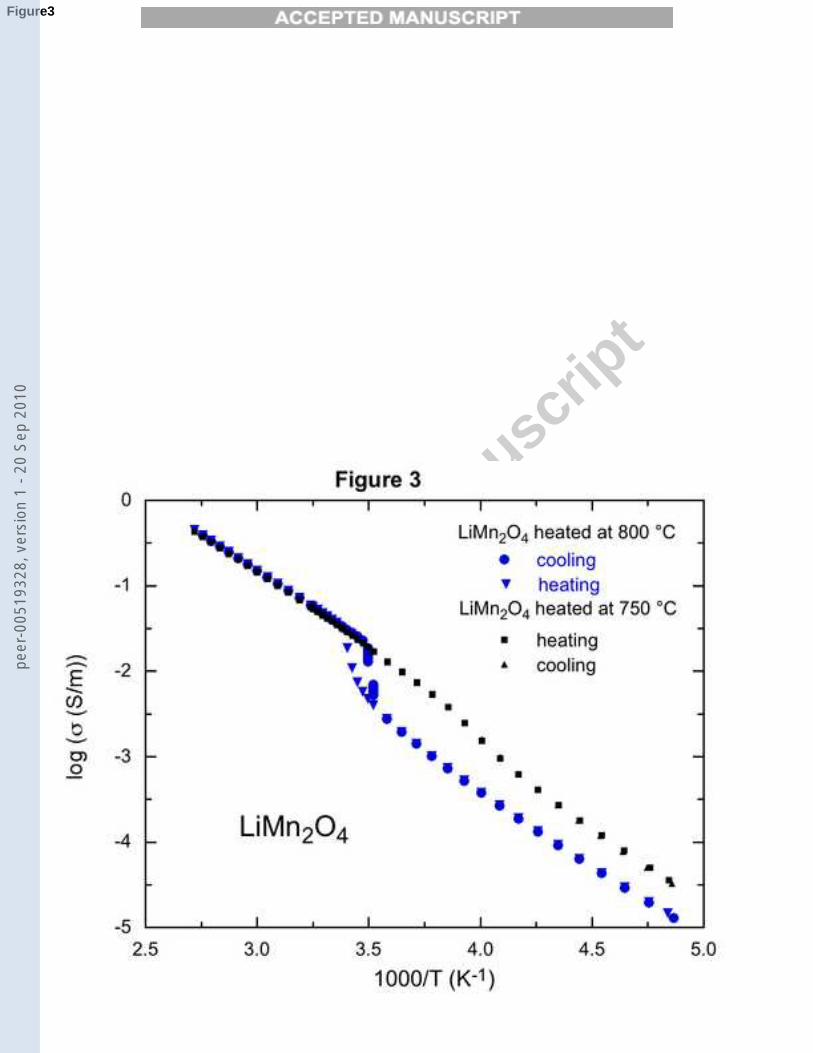
different experimental techniques. The structural transition associated to thecooperative Jahn-Teller distortion is best studied by neutron experiments [16,17], while the partial charge ordering related to it can be evidenced by a jumpof the electric resistivity ρ(T ) at Tv. The existence of this jump can be used as asensitive test for the crystallinity of the samples, because the Verwey transitionis known to be destroyed by structural defects. The resistivity curves of thetwo LiMn2O4 samples are reported in Fig. (3). The jump of resistivity at Tv
is clearly evidenced in the sample sintered at 800˚C, but is barely detectablein the sample sintered at 750˚C. We then conclude that the crystallinity isbetter in the sample sintered at the higher temperature, which is consistentwith this conclusion we had drawn from the XRD analysis.
3.3 Characterization by Raman spectroscopy
The Raman spectroscopic studies of lithium manganates with spinel structure,including Li1+xMn2−xO4 in the spectral range 100-800 cm−1 have been inves-tigated in a prior work [18]. The Raman spectra for our x=0 samples is notreported here, since it does not differ from the spectrum published on anothersample (see Fig. 2 in [19]) of the same composition, although the mode ofpreparation was different. Instead, we have reported in Fig. (4) the Ramanspectrum for the x = 0.30 sample sintered at 750˚C, as an illustration of theRaman spectrum of the x 6= 0 samples.
Six Raman bands are observed in LiMn2O4. The low frequency modeat ≃ 300 cm−1, labeled LF-mode in Fig. (4), is an unexpected mode alwaysobserved in this material, which could be Raman active due to the cationic dis-order that induced a breakdown of the translation symmetry [19]. This modeis tentatively related to the stretching mode of Li in octahedral coordination[20]. The five other modes correspond to the allowed Raman-active modeswhich can be labeled by their symmetry under O7
h spectroscopic group ac-cording to the irreducible representation A1g
⊕Eg
⊕3F2g. The assignment of
these modes to the corresponding peaks in the Raman spectra has been madeearlier in LiMn2O4 both experimentally [21] or theoretically by lattice dynam-ics calculations [22] and force constant model [23]. We can follow up theseRaman lines as a function of x, since they are only slightly shifted towardslarger wavenumbers as x increases. They are labelled in Fig. (4) accordingto their symmetry. In particular, a Raman band located at about 625 cm−1
in LiMn2O4, shifted to 634 cm−1 in the x=0.3 sample in Fig. (4) is the A1g
symmetric Mn-O stretching vibration of MnO6 groups.
8
peer
-005
1932
8, v
ersi
on 1
- 20
Sep
201
0

Accep
ted m
anusc
ript
Only these six Raman lines can be seen on the Raman spectra of thesamples for compositions in the range 0 ≤ x < 0.15. However, at x = 0.15
and at higher Li concentration, an additional line at higher frequency can bedetected, with an intensity which increases with x. This external mode is illus-trated for x = 0.3 in Fig.(4). The range of Li-concentrations where this Ramanline can be observed is also the range where the Li2MnO3 impurity phase hasbeen detected in our samples. This result suggest a correlation between thetwo events, with the attribution of this Raman line to a vibration of a molec-ular edifice of the impurity phase, namely the Mn4+-O stretching vibration ofLi2MnO3, since Mn is tetravalent in this compound. To investigate the valid-ity of such an assignment, we have studied the x-dependence of the positionof this mode. The result, reported in Fig. (5), shows that the wavenumberof this mode shifts from 646 to 656 cm−1, as x increases from 0.15 to 1/3 inLi1+xMn2−xO4. However, we know from the XRD analysis in section 3.1, thatthere is no chemical pressure nor strain induced by the host on the Li2MnO3
particles, so that the A1g Mn4+-O stretching vibration of the impurity phaseshould be essentially independent on x, and roughly unchanged with respectto bulk Li2MnO3, that is 612 cm−1 [24]. Instead, Fig. (5) shows that theadditional Raman mode is at higher frequency, and shifts roughly in parallelwith the A1g intrinsic mode in the whole composition range x > 0.15. Thisfeature opposes the attribution of the additional Raman line to a vibrationmode of the impurity phase. Instead, it must be related to the emergence ofadditional infrared bands in the Fourier transform infrared (FTIR) spectrumof Li1.33Mn1.67O4 attributed to the presence of Li ions in the 16d octahedralsites [18]. As x increases, more and more octahedral sites are occupied by twocations with different masses and charges, and the group-factor analysis of thespinel structure in that case gives two additional infrared components. Thebreaking of the translational symmetry by the Li-substitution implies that thisinfrared mode can also be observed in the Raman spectrum, and indeed, theposition of the additional Raman mode for x = 1/3 in Fig. (5) is the sameas that of the FTIR peak reported for this composition in Fig. (7) of ref.[18], namely 665 cm−1. The fact that the additional Raman line is observedonly at x ≥ 0.15 should then mean that, in the range 0 < x < 0.15 of smallLi-substitution, the intensity of this additional Raman line associated to thissymmetry-breaking is too small to be detected. The frequency shift of theintrinsic A1g mode and the additional one with x is mainly due to the increasein the mixed valence of the Mn as a function of x in the Li1+xMn2−xO4 phase.
Note the Raman efficiency of LiMn2O4 is weakened by the electrons,
9
peer
-005
1932
8, v
ersi
on 1
- 20
Sep
201
0

Accep
ted m
anusc
ript
as this material is a small-polaron semiconductor in which the electron con-ductivity arises from hopping between the two oxidation states of manganeseions [25]. This electronic property is also responsible for a baseline which isnot flat, and can be represented by a very broad peak illustrated in Fig. (4).The tailing structure around 200 cm−1 is due to the Rayleigh scattering. Inthe fitting procedure, this tailing structure is assumed to be of the Lorentzianform and is added to the baseline. Note it is always possible to fit such atailing structure in such a small range of wavenumbers 200 - 250 cm−1 by aLorentzian function, as only this ’wing’ of the Rayleigh peak is detected in ourexperiments. Therefore the choice of the Lorentzian shape should be simplyconsidered as a simple way to get rid of this contribution in the spectrum ofFig. (4), without any physical meaning that would imply extrapolation of thislaw to the unexplored region of smaller wavenumbers.
4 Magnetic properties
4.1 LiMn2O4 (x = 0)
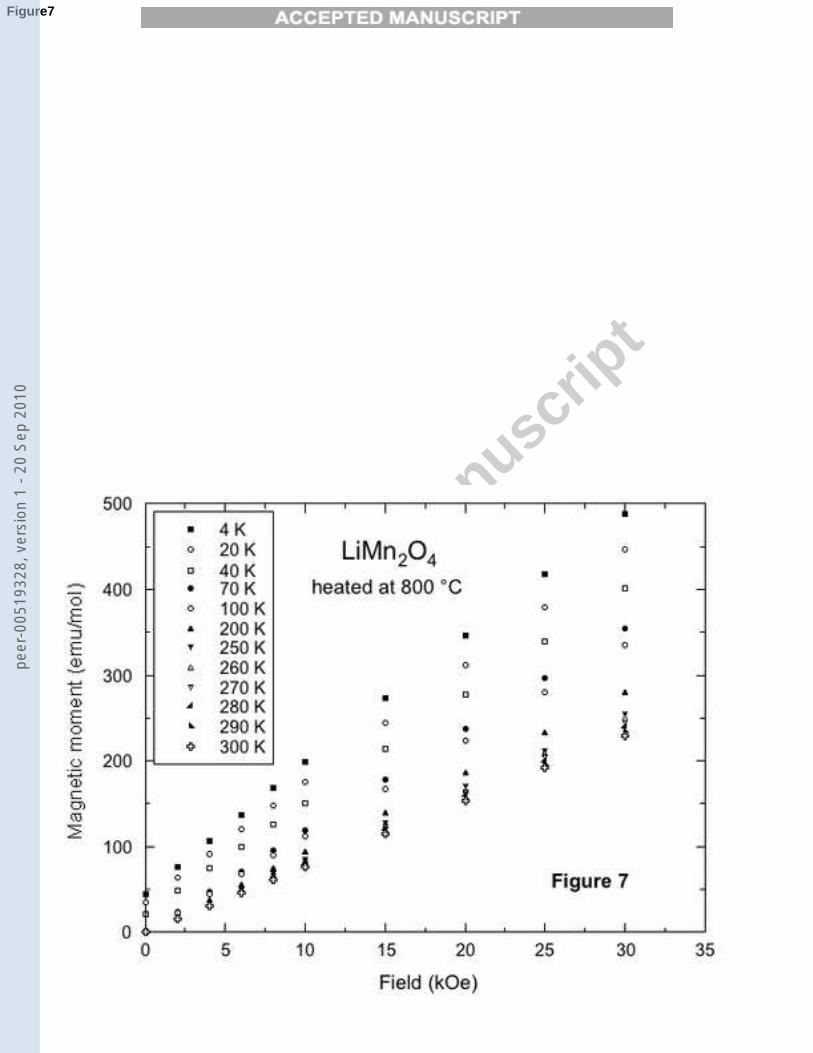
The temperature dependence of the magnetization M of the LiMn2O4 samplesmeasured under an applied field H = 10 kOe are reported in Fig (6) underthe form of H/M(T ). The main difference is an anomaly in the temperaturerange 40-50 K for the sample sintered at 800˚C. The magnetization curveson this sample, illustrated in Fig. (7) show that this anomaly corresponds tothe onset of an extrinsic magnetic component which saturates very fast withthe magnetic field, superposed to the paramagnetic intrinsic component. Thisis the signature of ferrimagnetic Mn3O4 impurity phase, identified by its spinordering temperature at 42 K [26] . The comparison at T = 4.2 K between thelow field magnetization in our sample and the magnetization of Mn3O4 [27]allows us to deduce the amount of this impurity phase in the sample, namely0.5%. This is below the detection threshold of the X-ray diffraction analysis,which explains that it could not be detected by XRD. On another hand, thisimpurity phase does not exist in the sample sintered at 750˚C. Therefore,both sintering temperatures have an advantage and a disadvantage: sinteringat 750˚C avoids the formation of Mn3O4 impurity phase, but the crystallinityof the host LiMn2O4 matrix is not as good as in the case of a sintering at800˚C.
10
peer
-005
1932
8, v
ersi
on 1
- 20
Sep
201
0

Accep
ted m
anusc
ript
Both LiMn2O4 samples show an anomaly at low temperature T ≃ 15
K where the zero-field-cooled magnetic susceptibility goes through a maxi-mum. The large difference between field-cooled and zero-field-cooled data,best evidenced on the sample sintered at 750˚C, is very similar to the stan-dard behavior of spin glasses. Actually, a spin glass ordering for this materialhas been proposed by several authors [28, 29]. However, data in Fig. (6) havebeen recorded in a very large magnetic field H = 10 kOe, while any spin glassbehavior is known to be destroyed under applied field one order of magnitudesmaller. Therefore, the spin freezing evidenced in our sample below 15 K can-not be the onset of a spin glass phase. Instead, it could be the onset of someantiferromagnetic domains of finite size. This behavior is consistent with thecoexistence of antiferromagnetic Bragg peaks with the magnetic diffuse peakin the range 10-65 K observed in the neutron spectra of some LiMn2O4 samples[30]. On another hand, no long range antiferromagnetic ordering takes placein our samples. Such an ordering has been observed in one prior work, at aNéel temperature TN = 65 K [31]. The antiferromagnetic ordering might alsobe a criterion for the crystallinity of the sample too. Indeed, an antiferromag-netic ordering should be associated to the onset of a complete charge ordering,and then also to a transition to an insulating phase, just like in Fe3O4 wherea jump in resistivity by two orders of magnitude has been observed. To ourknowledge, the resistivity curves of LiMn2O4 reported in the literature do notshow an anomalous behavior on the resistivity curves at 65 K (nor actuallyat any temperature except at Tv) but they have only been reported in thosesamples which do have a Néel temperature. The complete spin and chargeordering might then be a criterion for crystallinity more stringent than thesimple observation of the Verwey transition at Tv. In this context, our sam-ple sintered at 800˚C is an intermediate between two categories of samples.Samples of poorer crystallinity are characterized by the lack of any spin freez-ing [32, 34, 35], with only the antiferromagnetic diffusive peak in the neutronspectra [36]. Samples of better crystallinity show long range antiferromagneticordering evidenced by both the magnetic susceptibility data and the existenceof Bragg neutron diffraction peaks [31].
The Curie-Weiss law is approximately satisfied in the range 200-300 K,from which we can find the paramagnetic temperature θ = −260 K for thesample LiMn2O4 sintered at 800˚C. This value is in quantitative agreementwith former results [37]. On another hand, it is markedly different from thevalue θ = −296 K we found for the sample sintered at 750˚C, close to thevalue θ = −315 K reported in another work [32]. This huge variation from
11
peer
-005
1932
8, v
ersi
on 1
- 20
Sep
201
0

Accep
ted m
anusc
ript
one sample to another is quite unusual, and is again a specificity of LiMn2O4.The explanation comes from different factors. First we note that | θ | is of thesame order of magnitude as room temperature. However, the Curie-Weiss lawis a mean field law which is justified only in the limit where spin correlationsare negligible. Such correlations are negligible only at temperatures typicallyT > 2θ. Therefore, the analysis of the magnetic properties at T < Tv isnot justified, although it is systematically done and never discussed in all theprior works. The importance of such short range spin correlations can beevidenced by a small upward curvature of the inverse magnetic susceptibility.The difference in the values of θ among samples, when forcing the fit of thesusceptibility curve by the Curie-Weiss law, is then attributable to a sensitivityof the local spin correlations to the conditions under which the samples havebeen prepared. This is consistent with the extreme dependence of the physicalproperties of these samples to the mode of preparation. Note however thatwe cannot find any relation between θ and charge ordering. In particular, thevalue | θ |= 315 K in ref. [32] has been found for a sample which undergoesthe Verwey transition with a jump in the resisitivity curve at Tv. This is closeto the value we found for our sample in which the transition is smeared out,while our sample which presents such a transition has a much lower | θ |. Thislack of correlation suggests that θ and the Verwey transition are a probe ofthe crystallinity at two different scales. The lack of partial charge orderingand long-range magnetic ordering results from disorder effects at a mesoscopicscale, the deviation from a Curie law, which affects the experimental value ofθ is due to short-range spin fluctuations, i.e. at a local scale.
The substitution of Mn by Li at the octahedral site has been exploredalready by [32] for x ≤ 0.065. The main effect of this substitution at such smallvalues of x is the destruction of the Verwey transition. This is consistent withthe strong sensitivity of charge ordering with the structural defects, alreadydiscussed. Since the Verwey transition cannot be observed in this case, wehave chosen to prepare all the Li1+xMn2−xO4 samples in this work using asintering temperature 750˚C, to minimize the pollution of the sample (andtheir magnetic properties) by Mn3O4. Since the samples investigated for x 6= 0
are in the range 0.05 ≤ x ≤ 0.33, the present work can be considered as anextension of this prior work in [32].
12
peer
-005
1932
8, v
ersi
on 1
- 20
Sep
201
0

Accep
ted m
anusc
ript
4.2 Li1+xMn2−xO4 (0 < x ≤ 0.33)
The susceptibility curves of Li1+xMn2−xO4 series are illustrated in Fig. (8).As x increases, | θ | decreases, so that the antiferromagnetic spin correlationsdecrease. It also means that the analysis of the magnetic susceptibility is nowjustified. The smaller values of | θ | and the correlated fact that H/M(T )
curves are also linear down to lower temperature now fully validates the anal-ysis of the magnetic susceptibility according to the Curie-Weiss law. If weassume that only the manganese ions contribute efficiently to the magnetiza-tion, the Curie constant C can be written:
C =NAp2
effµ2B
3kB
, (1)
with NA the Avogadro number (since we have expressed the magnetizationper mole unit in this work), µB is the Bohr magneton, and peff the effectivemoment (in µB unit) associated to the (2-x) Mn ions in the chemical formula.Assuming that Mn3+ and Mn4+ in proportion y and (1− y) respectively, carryan effective moment µ(Mn3+,4+) in µB unit, we find:
p2eff = (2− x)[yµ(Mn3+)2 + (1− y)µ(Mn4+)2]. (2)
y is determined by the equation of neutrality of the electronic charge :
y =1− 3x
2− x. (3)
The two Curie-Weiss parameters θ, peff and their dependence on x are reportedin Figs. (9, 10). For the samples x > 0.2 which contain Li2MnO3, the contri-bution of this impurity phase has been subtracted first. For this purpose, themagnetic susceptibility of a Li2MnO3 has been measured (not shown here), andhas been weighted by the ratio [Li1+xMn2−xO4]/[Li2MnO3] determined fromX-ray analysis for each sample. The resulting signal has been subtracted fromthe rough data measured for the Li1+xMn2−xO4 samples to extract the intrinsiccomponent. For the samples with the highest concentration in Li2MnO3, thiscorrection was found non negligible, lowering peff by about 0.2.
13
peer
-005
1932
8, v
ersi
on 1
- 20
Sep
201
0

Accep
ted m
anusc
ript
5 Electrochemical properties
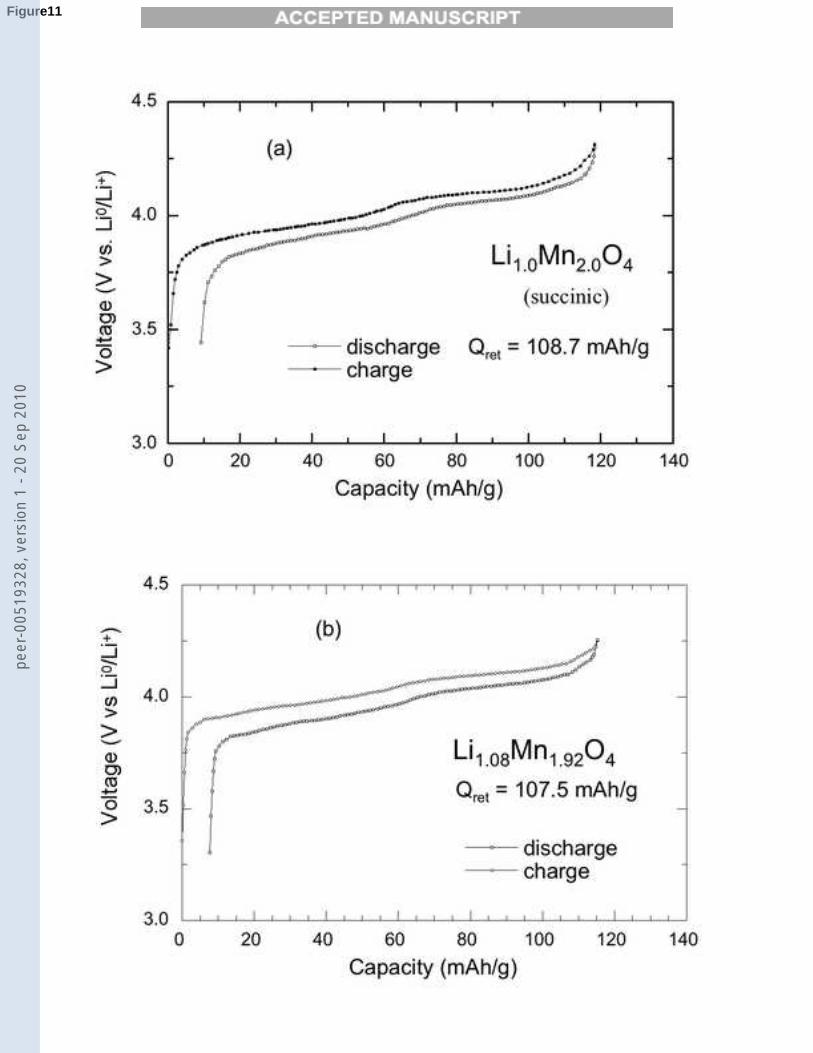
Charge-discharge profiles were obtained for all the compounds at current den-sity 0.25 mA/cm2 (C/10 rate). Figures 11, 12 show the typical voltage profilesof the Li1+xMn2−xO4/LiPF6-EC-DEC/Li cells at 25 ˚C for different molarratios of Li to Mn. The compound Li1Mn2O4 displays a voltage profile of aspinel cathode with the characteristic two-step reaction at 3.95 and 4.10 V [38],and delivers an initial capacity of 108.7 mAh/g. The initial capacity decreasesupon increasing the molar ratio of Li to Mn, due to the increase of the electro-chemically inactive Mn4+ ions in the Li1+xMn2−xO4 spinel lattice. It is easilyobserved that the decreasing capacity is associated with the disappearance ofthe first voltage plateau. Finally, a capacity 70.8 mAh/g is obtained for theLi-rich compound (x=0.20) in which the average oxidation state of manganeseis 3.77. Moreover, the end-member compound with x = 0.33 is a non activematerial for a 4-volt electrode, as expected since all the Mn ions are in theMn4+ ionization state in that case.
6 Analysis
According to Fig. (9), | θ | decreases almost linearly with x at small x andthen vanishes at x = 0.3. In prior works where data were available at smallx, i.e. in the quasi-linear regime of θ(x), a simple extrapolation at larger x
suggested that the decrease of | θ | when x increases was related to an in-crease in ferromagnetic interactions at the expense of antiferromagnetic ones[32]. Indeed, looking at the superexchange interactions associated to the bond-ing at 90˚, the Mn4+ -O- Mn4+ interaction is ferromagnetic, while the Mn4+
-O- Mn3+ and Mn3+ -O- Mn3+ ones are antiferromagnetic according to theGoodenough-Kanamori rules [33]. The increase in the concentration of Mn4+
upon x was then expected to increase the density of ferromagnetic interac-tions at the expense of the antiferromagnetic ones if only these superexchangeinteractions between Mn nearest neighbors via oxygen at 90˚are taken intoaccount. However, the fact that θ does not vary linearly with x at larger x,and saturates at θ = 0 instead of changing sign, opposes this former analysis.In particular, an increase in the ferromagnetic interactions would result in theonset of ferrimagnetism which is clearly not observed. Instead, the increase inx results in a dilution of the antiferromagnetic interactions. The reluctanceof the material to undergo a transition to long-range magnetic order is then
14
peer
-005
1932
8, v
ersi
on 1
- 20
Sep
201
0

Accep
ted m
anusc
ript
attributable to the geometrical frustration of Mn magnetic moments on theB sites of the spinel lattice. Similar geometrical frustration effects inherentto this topology of the spinel lattice on the magnetic properties with nearestneighbor antiferromagnetic interactions only have been also observed in othermaterials with Fe as magnetic ions instead of Mn [39]. This is quite consis-tent with the fact that the long range (antiferromagnetic) magnetic orderingin Li1+xMn2−xO4 takes place only in samples which have undergone a Verweytransition, i.e. in these samples which have crystallized (below Tv) in a lat-tice with a different geometrical arrangement of lower symmetry, owing to thecooperative Jahn-Teller distortion. Actually, if we consider the sample withx = 1/3 in which only the Mn ions are in the Mn4+ valence state, we find θ ≃ 0
which can be considered as the direct evidence that the ferromagnetic Mn4+-O-Mn4+ interactions are totally negligible in this material, and thus do notplay any significant role. In particular, the ferromagnetic component reportedin M(H) at low temperature on the x = 0.003 and x = 0.065 samples in ref.[32] is not related to the Mn4+ -O- Mn4+ interaction, as it was suggested inthis work at a time where the influence of the sintering temperature and modeof preparation of the samples on the impurity phases has not been realized.Instead, it is an extrinsic property most likely due to the presence of Mn3O4
clusters in the matrix, like in our own sample x = 0 sintered at 800˚C.According to Eq. (3), the increase of x means a decrease of the pro-
portion y of Mn3+ in the matrix. The fact that the Mn4+-O-Mn4+ magneticinteractions are negligible suggests that the increase in x only results in thedilution of the antiferromagnetic short range interactions associated to Mn3+
on a geometrically frustrated lattice. In such a case, we expect that θ ≃ 0 forx > xc with xc the value of x corresponding to the situation where the Mn3+
concentration (2 − x)y reaches the percolation threshold. As the percolationthreshold for the Mn sublattice is 0.16, Eq. (3) shows that this situation isreached at 1 − 3xc = 0.16, namely xc = 0.28, in good agreement with theexperimental results displayed in Fig. (9). On another hand, in case all mag-netic correlations would exist in Mn4+-O-Mn4+, Mn3+-O-Mn4+, Mn3+-O-Mn3+
paths, the dilution effect associated to the Li-substitution would imply that θ
goes to zero when the total Mn concentration 2 − x would reach the criticalvalue 0.16, namely an unphysical result xc = 1.84. The vanishing of θ close toxc = 0.28 in Fig. (9) is then also the evidence that only the antiferromagneticMn3+-Mn3+ interactions mediated via oxygen ions are responsible for the mag-netic properties. The present work is then in quantitative agreement with thedependence of θ with x, which was deduced from the analysis of the integrated
15
peer
-005
1932
8, v
ersi
on 1
- 20
Sep
201
0

Accep
ted m
anusc
ript
intensity of the EPR line associated to the Li1+xMn2−xO4. The contradictionbetween magnetic and EPR results outlined in [10] just came form a positivevalue θ = +40 K in Li4Mn5O12 deduced from magnetic measurements [40].Actually, there is no contradiction but quantitative agreement between EPRanalysis in [10] and our direct magnetic measurements reported here. Indeed,extrapolation of these results to Li4Mn5O12 would predict θ ≃ 0 for this ma-terial. We then suspect that the larger value of θ reported in [40] comes fromsome extrinsic effect in the particular sample which had been measured. Thisis supported by the fact that the authors themselves outlined the large sample-dependence of the value of θ in this material, since they found θ ≃ +2 K inanother Li4Mn5O12 sample [40].
The theoretical effective moment carried by Mn4+ (spin S = 3/2) isµ(Mn4+) = 3.87 µB. That of Mn3+ depends on the strength of the crystalfield. In high spin complexes it is 4.90 µB, in low spin complexes it is 2.83µB. The theoretical value of peff as a function of x are also reported in Fig.(10) together with experimental data for comparison, for both the low and highspin configurations of Mn3+. Since the low spin state would lead to an increaseof peff with x, while the experimental value is decreasing monotonously withx in the whole range of concentrations x we have explored, we can concludethat the Mn3+ remains in the high spin configuration at all concentrationsx. On another hand, the theoretical value is systematically larger than theexperimental one. This is the case, in particular, for x = 1/3 where onlyMn4+ are present so that the magnetization of this ion is below theoretical.This is consistent with the observation of an effective magnetic moment belowtheoretical observed as a function of the average oxidation state of manganesefor lithium magnetospinels in the LiMn2O4-Li2Mn4O9-Li4Mn5O12 [40]. Theexperimental value of the magnetic moment of Mn4+ as deduced from thedata at x = 1/3 is µ(Mn4+) = 3.11 µB instead of the value 3.87 µB predictedfor this ion in an octahedral field (note that peff differs from µ(Mn4+) by afactor
√2 due to the factor (2 − x) entering our definition of peff). We then
have reported the full line in Fig. (10) that is the theoretical function peff asa function of x, assuming µ(Mn4+) = 3.11 µB and µ(Mn3+) = 4.90 µB. Theresult is found in reasonable agreement with the experiments, which shows thatthe effective moment carried by Mn3+ is in agreement with the value 4.90 µB
predicted for this ion in the high spin state. The rather low moment observedin the samples is then primarily due to a value of the magnetic moment carriedby Mn4+ ions which is found to be significantly smaller than expected for aspin S = 3/2. This lower value suggests a strong crystal field effects on the
16
peer
-005
1932
8, v
ersi
on 1
- 20
Sep
201
0
Accep
ted m
anusc
ript
sites occupied by these ions that may give rise to an unexpected magneticanisotropy originating from these ions.
The lowering of the magnetic moment carried by Mn4+ ions is anotherevidence that the material is not purely ionic, and the bond between Mn4+ andits neighbors is partly covalent. Such a covalent effect has been investigatedin other manganese compound including MnSb [41]. In this compound, Mnis essentially in the divalent Mn2+ configuration, since the charge transfer ofMn to Sb is very small in the paramagnetic phase. Nevertheless, the magneticmoment carried by Mn2+ ions is reduced to 3.24 µB instead of 5 µB, as a re-sult of a small covalent bonding that leads to just a very small charge transferbetween Mn and Sb (the reason why the magnetic moments remain localizedon the manganese ions), but leads to a spin depolarization of the d-states thatreduce the localized magnetic moment. Such a behavior is also met in othermaterials involving transition metal elements (and not only manganese) suchas the Heusler alloys [42]. We are in the same situation here, although thereduction of the magnetic moment is smaller. Note the non-vanishing covalentmixing between the 3d states of the Mn4+ ions and the electronic states ofneighboring atoms also explains the presence of electrons previously detectedby transport experiments and affecting the baseline of the Raman spectra ofour samples (see section 3.3). Note the value of the effective moment in thex = 1/3 sample is sufficient to determine unambiguously the effective magneticmoment of Mn4+, since all the manganese ions are in this ionization sate inthat case. The agreement beween the dot/broken curve and the experimentsin Fig. (10) at any other Li-concentration is thus the experimental evidencethat the reduction of the magnetic moment is entirely located on the Mn4+ ionand not on the Mn3+ ions. This is due of the relative energies of the differentionic states of the manganese ions. Since these energies are the result of ex-change plus Coulomb correlations of the multi-electron system in the d-shell,the quantitative estimate in the present case would require a calculation ofthe electronic structure of our compound within the DFT+U method that isappropriate for these highly correlated electron systems. The concept is totreat the localized d-states by the Hubbard Hamiltonian (correlation potentialU) while retaining the Hamiltonian in a density functional theory (DFT) forthe other more delocalized states. Such a calculation that has been done suc-cessfully on few highly correlated systems (including MnSb compound abovementioned) does not exist yet on LiMn2O4 and is beyond the scope of thispaper. However, we can qualitatively explain why the covalent effect is onthe Mn4+ ions as follows. The most stable electronic state of manganese is
17
peer
-005
1932
8, v
ersi
on 1
- 20
Sep
201
0

Accep
ted m
anusc
ript
the divalent state Mn2+, since it realizes the configuration of half-filled d-shell.The larger and larger exchange plus correlation energy of the d-electrons asthe charge on the manganese increases in the sequence 2+ → 3+ → 4+ fa-vors the covalent effect that amounts to a charge transfer reducing the positiveelectrostatic charge on the d-shell of the manganese. This effect is naturallymuch larger for Mn4+ than for Mn3+ since the departure of the electrostaticcharge from the divalent state is twice larger for the Mn4+ configuration.
These results provide us with some enlightenment on EPR data publishedso far on this material. In Li-rich samples (x > 0), two main lines have beenobserved. A broad line attributed to the Li1+xMn2−xO4 spinel phase, and asharp line attributed to the Li2MnO3 phase [7]. Since the sharp line is notobserved in LiMn2O4 [7] and since its existence in x 6= 0 depends on thesintering temperature [9], its attribution to this impurity phase is justified.The fact that this line has been observed when Li2MnO3 impurity phase isnot evidenced by XRD analysis should then attributed to the fact that EPRexperiments are much more sensitive to the existence of this phase. As a result,the existence of this line in the EPR spectra in [10] should be considered asan indication that the Li2MnO3 impurity phase is only the order of the %, i.e.below the threshold of detection by XRD analysis rather than questioning onthe origin of this EPR line. On another hand, the ESR spectra of LiMn2O4
in [9] show at low temperature an additional structure made of 6 hyperfinelines with nearly equal splitting, which appear as the sample is heated from3.5 to 80 K. This feature has been attributed at that time to Mn4+ ions.Such an interpretation, however, is made difficult by the fact that the twosharp discontinuities associated to the | +1/2〉 ←→| −1/2〉 transitions are notobserved in the spectra. The reason invoked is that the Mn4+ ions are notimpurities, so that fluctuations of the magnetic interactions and crystal fieldeffects from site to site should broaden the spectrum. But actually, such effectsare expected to broaden the ESR spectrum to the point where no hyperfinestructure can be detected, so that the spectrum associated to Mn4+ should bea single broad line, and this is what is observed. Another hypothesis is thatthis line structure is the spectrum characteristics of Mn2+ impurities in such asmall concentration that the hyperfine structure can be seen [43]. Such Mn2+
in concentration lower than 1% can be found in the Mn3O4 impurity phasewe have detected by magnetic measurements on the LiMn2O4 sample sinteredat 800˚C in the present work. The fact that the linewidth of this hyperfinestructure does not depend on x [9] also suggests a lack of coupling with theLi1+xMn2−xO4 spinel phase, i.e. Mn2+ ions in an impurity phase. We are
18
peer
-005
1932
8, v
ersi
on 1
- 20
Sep
201
0

Accep
ted m
anusc
ript
thus led to suggest that the 6-lines structure of the EPR spectrum evidencedin some samples [9] is attributable to this impurity phase. Additional proofis provided by the fact that this hyperfine structure is not observed at lowtemperature (i.e. in the temperature range where Mn3O4 is ferromagnetic);it can be observed only at (or above) 40 K, while the Curie temperature ofMn3O4 is 42 K. Finally, another proof is provided by the comparison with theEPR spectra obtained on samples which have been prepared by following thewet chemical route, and sintered at 700˚C [10]. No such 6-line structure hasbeen detected in the EPR spectra for such materials. This is consistent withthe results of the present work that show lowering the sintering temperaturefrom 800˚C to 750˚C is sufficient to get rid of the Mn3O4 impurity phase.
7 Conclusion
Li1+xMn2−xO4 magnetic and transport properties are strongly dependent onthe structural properties. The magnetic measurements allowed us to detectMn3O4 impurity phase in concentration (0.5 %) too small to be detected byX-ray analysis, in sample sintered at 800˚C. This impurity phase is cured bydecreasing the sintering temperature at 750˚C. On another hand, Li2MnO3
impurity phase is observed at x ≥ 0.15 in concentration which increases withx. The wet-chemical route did not allow us to get rid of this impurity phase,although its concentration is significantly reduces with respect to other prepa-ration techniques. The impurity phases, when they exist, are not expected toalter the intrinsic properties of Li1+xMn2−xO4. At least for x = 0, the proofis provided by the fact that the Verwey transition and the long-range anti-ferromagnetic measurements have been reported in a recent past on a samplewhich also contains Mn3O4 as an impurity phase [31]. On another hand thesintering temperature also affects the intrinsic properties. In particular, thedegree of charge ordering is very much dependent on the structural properties,and the sample preparation. The x-dependence of the magnetic propertiesshow that these properties are dominated by the geometrical frustration of theantiferromagnetic interactions inherent to the spinel lattice, while the ferro-magnetic interactions associated to Mn4+-Mn4+ bonding at 90˚are negligiblein this material. This frustration is in essence the reason why the samples donot undergo a transition to a long-range magnetic ordering despite the stronglyantiferromagnetic interactions, except at x = 0 in those of the samples presum-ably with the highest crystallinity. The Mn4+ ions that are electrochemically
19
peer
-005
1932
8, v
ersi
on 1
- 20
Sep
201
0

Accep
ted m
anusc
ript
inactive also carry a small effective moment that we can attribute to cova-lent effects evidenced otherwise by transport and optical properties, and maybe also linked to the fact that the Mn4+-Mn4+ magnetic interactions abovementioned are negligible. The separation between intrinsic an extrinsic effectsallowed us to achieve an overall understanding of the various physical proper-ties (magnetic properties, optical properties, EPR spectra) of this material.
20
peer
-005
1932
8, v
ersi
on 1
- 20
Sep
201
0

Accep
ted m
anusc
ript
References
[1] M. M. Tackeray, W.I.F. David, P.G. Bruce, J.B. Goodenough, Mater. Res.Bull. 18, 461 (1983).
[2] J. B. Goodenough, M. M. Tackeray, W.I.F. David, P.G. Bruce, ReV. Chim.Miner. 21, 435 (1984).
[3] T. Ohzuku, M. Tikagawa, T. Hirai, J. Electrochem. Soc. 137, 769 (1990).
[4] J. M. Tarascon, W. R. McKinnon, F. Coowar, T. N. Bowmer, G. Amatucci,and D. Guyomard, J. Electrochem. Soc. 141, 1421 (1994).
[5] A. Yamada, J. Solid State Chem. 122, 160 (1996).
[6] V. Massarotti„ M. Bini, , and D. Capsoni, Z. Naturforsch. A51, 267 (1996).
[7] V. Massarrotti, D. Capsoni, D. Bini, C. B. Azzoni, and A. Paleari, J. SolidStat. Chem. 128, 80 (1997).
[8] V. Massarrotti, D. Capsoni, D. Bini, G. Chiodelli, C. B. Azzoni, M. C.Mozzati, A. Paleari, J. Solid Stat. Chem. 147, 509 (1999).
[9] F. Gendron, C. Julien, in Materials for Lithium-ion Batteries, eds. C. Julienand Z. Stoynov, Kluwer Academic Publ., Dordrecht 2000, p 543.
[10] J. R. Dygas, M. Kopc, F. Krok, F. Gendron, and C. M. Julien, Elec-trochem. Soc. Proc. 11, 63 (2005).
[11] C.M. Julien, Solid State Ionics 177, 11 (2006).
[12] P. Mustarelli, V. Massarotti, M. Bini, and D. Capsoni, Phys. Rev. B 55,12018 (1997).
[13] S.R.S. Prabaharan, S.S. Michael, C. Julien, J. Inorganic Mat. 1, 21 (1999).
[14] K. Levenberg, Quart. Appl. Math. 2, 164, 1944; D. Marquardt, SIAM J.Appl. Math. 11, 431, 1963
[15] A. Yamada and M. Takena, Mater. Res. Bull. 30, 715 (1995).
[16] J. Rodriguez-Carvajal, G. Rousse, C. Masquelier, and M. Hervieu, Phys.Rev. Lett. 81, 4660 (1998).
[17] M. Takahashi and K.-I. Ohshima, J. Cryst. Soc. Jpn. 48, 17-24 (2006).
21
peer
-005
1932
8, v
ersi
on 1
- 20
Sep
201
0

Accep
ted m
anusc
ript
[18] C. M. Julien, Solid Stat. Ionics 177, 11 (2006).
[19] C. M. Julien and M. Massot, J. Phys.: Condens. Matter 15, 3151 (2003).
[20] C. Julien, C. Letranchant, M. Lemal, S. Ziokiewicz, S. Castro-Garcia, J.Mater. Sci. 37, 2367 (2002).
[21] C. M. Julien, A. Rougier, E. Haro-Poniatowski and G. Nazri, Mol. Crys.Liq. Crys. 311, 81 (1998).
[22] B. Ammundsen, G.R. Burns, M.S. Islam, H. Kanoh, and J. Rozière, J.Phys. Chem B 103, 5175 (1999).
[23] M.M. Sinha and H.C. Gupta, Physica B 316/317, 166 (2002).
[24] C. M. Julien and M. Massot, Mater. Science. Engin. B 100, 69 (2003).
[25] J. B. Goodenough, A. Manthiram, and B. Wnetrzewski, J. Power Sources43/44, 269 (1993).
[26] K. Dwight and N. Menyuk, Phys. Rev. 119, 1470 (1960).
[27] O. V. Nielsen, and L. W. Roeland, J. Phys. C: Solid State Phys. 9, 1307(1976).
[28] P. Endres, B. Fuchs, S. Kemmler-Sack, K. Brandt, G. Faust-Becker, andH. -W. Praas, Solid State Ionics 89, 221 (1996).
[29] Y. Jang, F. C. Chou, and Y. Chiang, Appl. Phys. Lett. 74, 2504 (1996).
[30] A. S. Wills, N. P. Raju, and J. E. Greedan, Chem. mater. 11, 1510 (1999).
[31] I. Tomeno, Y. Kasuya and Y. Tsunoda, Phys. Rev. B 64, 094422 (2001).
[32] Y. Shimakawa, T. Numata, and J. Tabuchi, J. Solid State Chem. 131,138 (1997).
[33] B. Goodenough, Magnetism and the Chemical Bond (Wiley, New York,1963).
[34] G. Blasse, J. Phys. Chem. Solids 27, 383 (1966).
[35] C. B. Azzoni, M. C. Mozzati, A. Paleari, D. Capsoni, and M. Bini, Z.Naturforsch. A 53, 693 (1998).
[36] Y. Oohra, J. Sugiyama, and M. Kontani, J. Phys. Soc. Jpn. 68, 242 (1999).
22
peer
-005
1932
8, v
ersi
on 1
- 20
Sep
201
0

Accep
ted m
anusc
ript
[37] C. M. Julien, A. Ait-Salah, A. Mauger, and F. Gendron in Portable and
emergency energy sources, ed. by Z. Stoynov and D. Vladikova, MarinDynov Publishing House, Sofia 2006, p 71.
[38] M.M. Thackeray, Prog. Solid State Chem. 25, 1 (1997).
[39] M. Ostorero, A. Mauger, M. Guillot, and M. Escorne, Phys. Rev. B 40,391 (1989).
[40] C. Masquelier, M. Tabuchi, K. Ado, R. Kanno, Y. Kobayasi, Y. Maki, O.Nakamura, J. B. Goodenough, J. Solid State Chem. 123, 255 (1996).
[41] R. Coehoorn and C. Haas, Phys. Rev. B 31, 1980 (1985) and referencestherein.
[42] J. Kübler, A. R. Williams, and C. B. Sommers, Phys. Rev. B28, 1745(1983).
[43] J. S. van Wieringen, Discussions of the Faraday Society 19, 118 (1955).
23
peer
-005
1932
8, v
ersi
on 1
- 20
Sep
201
0

Accep
ted m
anusc
ript
Figure 1: X-ray diffraction pattern of Li1+xMn2−xO4 for two different compo-
sitions x. The insert emphasizes the region between the (311) and (400) lines,
including the (222) line that has been used to determine the size of the crystal-
lites according to the Scherrer’s law. The Miller indices for the Li1+xMn2−xO4
have been reported (for the x = 0.33 sample). The symbol (*) in the insert
associated with this spectrum points out two lines associated to the Li2MnO3
impurity phase.
24
peer
-005
1932
8, v
ersi
on 1
- 20
Sep
201
0

Accep
ted m
anusc
ript
Figure 2: Lattice parameter of Li1+xMn2−xO4 as a function of x deduced form
Rietveld refinement of XRD spectra. The square symbol is the experimental
result for LiMn2O4 sintered at 800˚C. Triangles are experimental points for
the samples sintered at 750˚C. The full line is a guide for the eyes.
25
peer
-005
1932
8, v
ersi
on 1
- 20
Sep
201
0
Accep
ted m
anusc
ript
Figure 3: Arrhenius plot of the electrical conductivity of the LiMn2O4 sintered
at 800 and 750 ˚C.
26
peer
-005
1932
8, v
ersi
on 1
- 20
Sep
201
0

Accep
ted m
anusc
ript
Figure 4: Raman spectrum of Li1+xMn2−xO4 sample for x=0.30. The thick
solid line is the spectrum calculated by fitting the data with decomposition
of the spectrum in Raman peaks with Gaussian profile (in addition to the
baseline). The decomposition of the spectrum is also reported in the figure.
The LF (low frequency)-mode is related to Li vibrations. The five modes at
higher energy are labeled according to their symmetry under O7h spectroscopic
group. The mode at the highest energy is the external mode associated to
the Mn4+-O stretching mode in the Li2MnO3 impurity phase (observed only
at x ≥ 0.15).
27
peer
-005
1932
8, v
ersi
on 1
- 20
Sep
201
0

Accep
ted m
anusc
ript
Figure 5: x-dependence of the A1g Raman peak (full dots) and the external
mode (squares). The external mode exists only. at x ≥ 0.15) in Li1+xMn2−xO4
samples.
28
peer
-005
1932
8, v
ersi
on 1
- 20
Sep
201
0

Accep
ted m
anusc
ript
Figure 6: H/M where M is the magnetization measured under applied mag-
netic field H=10 kOe, for the LiMn2O4 sintered at 800 and 750 ˚C. Data
have been recorded following zero-field cooled (ZFC) and field-cooled (FC)
procedures described in the text.
29
peer
-005
1932
8, v
ersi
on 1
- 20
Sep
201
0

Accep
ted m
anusc
ript
Figure 7: M(H) of the LiMn2O4 sintered at 800 ˚C as a function of the applied
magnetic field, for different temperatures.
30
peer
-005
1932
8, v
ersi
on 1
- 20
Sep
201
0

Accep
ted m
anusc
ript
Figure 8: Same as in Fig.(6) for x 6= 0.
31
peer
-005
1932
8, v
ersi
on 1
- 20
Sep
201
0

Accep
ted m
anusc
ript
Figure 9: Paramagnetic Curie temperature as a function of x in Li1+xMn2−xO4.
32
peer
-005
1932
8, v
ersi
on 1
- 20
Sep
201
0

Accep
ted m
anusc
ript
Figure 10: Effective magnetic moment in Bohr magneton unit as a function of
x in Li1−xMn2−xO4.
33
peer
-005
1932
8, v
ersi
on 1
- 20
Sep
201
0

Accep
ted m
anusc
ript
Figure 11: Voltage profiles of the Li1+xMn2−xO4/LiPF6-EC-DEC/Li cells at
25 ˚C for charge/discharge at C/10 rate.
34
peer
-005
1932
8, v
ersi
on 1
- 20
Sep
201
0

Accep
ted m
anusc
ript
Figure 12: Same as Fig. 11, for two other compositions.
35
peer
-005
1932
8, v
ersi
on 1
- 20
Sep
201
0

Accep
ted m
anusc
ript
powders phases % phase cell constants (Å) volume (Å3)
x=0 (800˚C) LiMn2O4 100 8.2509(2) 571.71(4)
x=0 (750˚C) LiMn2O4 100 8.23716(2) 558.90(4)
x=0.05 Li1.05Mn1.95O4 100 8.22126(2) 555.67(3)
x=0.10 Li1.10Mn1.90O4 100 8.20576(2) 552.53(3)
x=0.15 Li1.15Mn1.85O4 100 8.19304(2) 549.97(3)
x=0.20 Li1.20Mn1.80O4 100 8.18158(2) 547.66(3)
x=0.25 Li1.25Mn1.75O4 90.54 8.17446(2) 546.22(3)
Li2MnO3 9.46 a=4.9047(2) b=8.5406(4)
c=5.0264(1), β = 108.72
199.41(0)
x=0.30 Li1.30Mn1.70O4 88.7 8.16712(2) 544.73(3)
Li2MnO3 11.3 a=4.9293(2) b=8.5050(3)
c=5.0322(1), β = 109.05
199.42(6)
x=0.33 Li1.33Mn1.67O4 87.32 8.16873(2) 545.08(5)
Li2MnO3 12.68 a=4.9327(2) b=8.4989(3)
c=5.0240(1), β = 108.87
199.30(5)
Table 1: Rietveld analysis of the powders investigated in this work. Since the
Li1+xMn2−xO4 is crystallized in the cubic spinel phase, so that the lattice is
entirely defined by the lattice parameter a = b = c. Only the LiMn2O4 sample
labelled x=0 (800˚C) has been heated at 800˚C. For all the other samples,
the sintering temperature is 750˚C.
36
peer
-005
1932
8, v
ersi
on 1
- 20
Sep
201
0

Accep
ted m
anusc
ript
crystallite size from XRD (nm) from SEM (nm)
(111) (222)
x=0 (800˚C) 100.4 139.7 140
x=0 (750˚C) 74.4 84.2 87
Li1.05Mn1.95O4 71.1 80.2 86
Li1.10Mn1.90O4 70.5 62.4 86
Li1.15Mn1.85O4 75.7 66.1 78
Li1.20Mn1.80O4 71.2 58.3 75
Li1.25Mn1.75O4 62.7 45.6 78
Li1.30Mn1.70O4 60.4 42.8 65.5
Li1.33Mn1.67O4 60.0 43.9 70
Table 2: Crystallite size deduced from Rietveld refinement on (111) and (222)
XRD lines of Li1+xMn2−xO4 (same samples as in table 1). For comparison, the
grain size measured from SEM is also reported (last column).
37
peer
-005
1932
8, v
ersi
on 1
- 20
Sep
201
0

Accep
ted m
anusc
ript
Figure1pe
er-0
0519
328,
ver
sion
1 -
20 S
ep 2
010

Accep
ted m
anusc
ript
Figure2pe
er-0
0519
328,
ver
sion
1 -
20 S
ep 2
010
Accep
ted m
anusc
ript
Figure3pe
er-0
0519
328,
ver
sion
1 -
20 S
ep 2
010

Accep
ted m
anusc
ript
Figure4pe
er-0
0519
328,
ver
sion
1 -
20 S
ep 2
010

Accep
ted m
anusc
ript
Figure5pe
er-0
0519
328,
ver
sion
1 -
20 S
ep 2
010

Accep
ted m
anusc
ript
Figure(s)pe
er-0
0519
328,
ver
sion
1 -
20 S
ep 2
010
Accep
ted m
anusc
ript
Figure7pe
er-0
0519
328,
ver
sion
1 -
20 S
ep 2
010

Accep
ted m
anusc
ript
Figure8pe
er-0
0519
328,
ver
sion
1 -
20 S
ep 2
010

Accep
ted m
anusc
ript
Figure9pe
er-0
0519
328,
ver
sion
1 -
20 S
ep 2
010

Accep
ted m
anusc
ript
Figure10pe
er-0
0519
328,
ver
sion
1 -
20 S
ep 2
010
Accep
ted m
anusc
ript
Figure11pe
er-0
0519
328,
ver
sion
1 -
20 S
ep 2
010

Accep
ted m
anusc
ript
Figure12pe
er-0
0519
328,
ver
sion
1 -
20 S
ep 2
010
Copyright © 2022 FDOKUMEN