Phase 2 XPSWMM Model Report
87
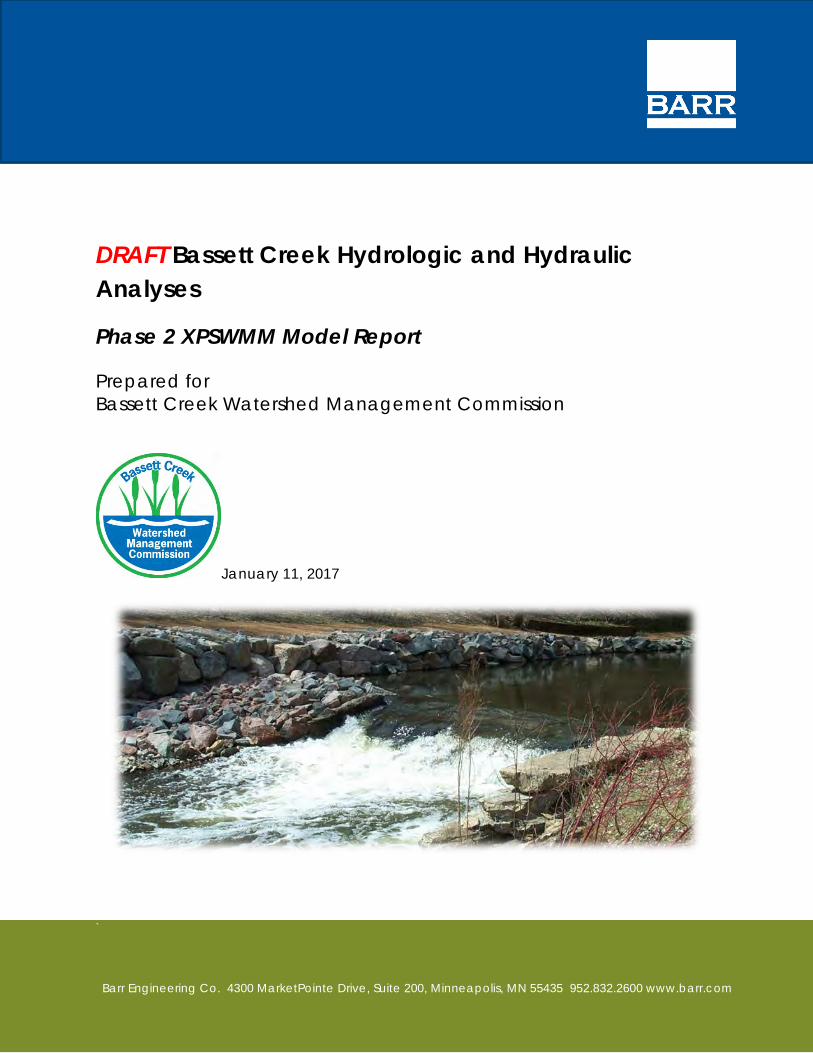
` Barr Engineering Co. 4300 MarketPointe Drive, Suite 200, Minneapolis, MN 55435 952.832.2600 www.barr.com DRAFT Bassett Creek Hydrologic and Hydraulic Analyses Phase 2 XPSWMM Model Report Prepared for Bassett Creek Watershed Management Commission January 11, 2017
-
Upload
khangminh22 -
Category
Documents
-
view
2 -
download
0
Transcript of Phase 2 XPSWMM Model Report
`
Barr Engineering Co. 4300 MarketPointe Drive, Suite 200, Minneapolis, MN 55435 952.832.2600 www.barr.com
DRAFT Bassett Creek Hydrologic and Hydraulic Analyses
Phase 2 XPSWMM Model Report
Prepared for Bassett Creek Watershed Management Commission
January 11, 2017
Keystone Waters
Text Box
Item 5B. BCWMC 1-19-17 Full Document

P:\Mpls\23 MN\27\2327051\WorkFiles\XP SWMM Phase II\Report\BCWMC_Ph2_XPSWMMReport_Draft_01112017.docx i
Bassett Creek Hydrologic and Hydraulic Analyses
January 11, 2017
Contents Executive Summary .............................................................................................................................................................................. 1
1.0 Background and Purpose ................................................................................................................................................. 5
1.1 Past Water Management Planning .......................................................................................................................... 5
1.2 Stormwater Model Uses, Structure, & Updates .................................................................................................. 6
1.2.1 Model Applications ................................................................................................................................................... 6
1.2.2 Model Structure & Management ........................................................................................................................ 7
1.2.3 Model Updates ........................................................................................................................................................... 8
2.0 Methodology for Hydrologic and Hydraulic Modeling ......................................................................................10
2.1 Model Overview ............................................................................................................................................................10
2.1.1 XPSWMM Computer Modeling Software ......................................................................................................10
2.1.2 Project Extents ..........................................................................................................................................................10
2.1.3 Subwatersheds .........................................................................................................................................................11
2.1.4 Naming Convention ...............................................................................................................................................15
2.1.5 Boundary Conditions .............................................................................................................................................15
2.1.5.1 Downstream Boundary Conditions ........................................................................................................16
2.1.5.2 Water Surface Elevations of Small Waterbodies ...............................................................................17
2.1.5.3 Water Surface Elevations of Select Large Waterbodies .................................................................17
2.1.6 Elevation Data ...........................................................................................................................................................17
2.1.7 Datum ..........................................................................................................................................................................17
2.2 Hydrologic Model Parameters .................................................................................................................................19
2.2.1.1 Impervious ........................................................................................................................................................19
2.2.1.2 Watershed Width...........................................................................................................................................23
2.2.1.3 Watershed Slope ...........................................................................................................................................23
2.2.1.4 Infiltration Parameters (Soils and Open Water Areas) ....................................................................23
2.2.1.5 Depression Storage and Overland Flow Roughness .......................................................................26
2.3 Hydraulic Model Parameters ....................................................................................................................................27
2.3.1 Storm Sewer Data....................................................................................................................................................27
2.3.2 Stormwater Storage Areas ...................................................................................................................................27
2.3.3 Stream Cross Sections ...........................................................................................................................................28
ii
2.3.4 Overland Flow Network ........................................................................................................................................28
2.4 Model Calibration and Validation ..........................................................................................................................30
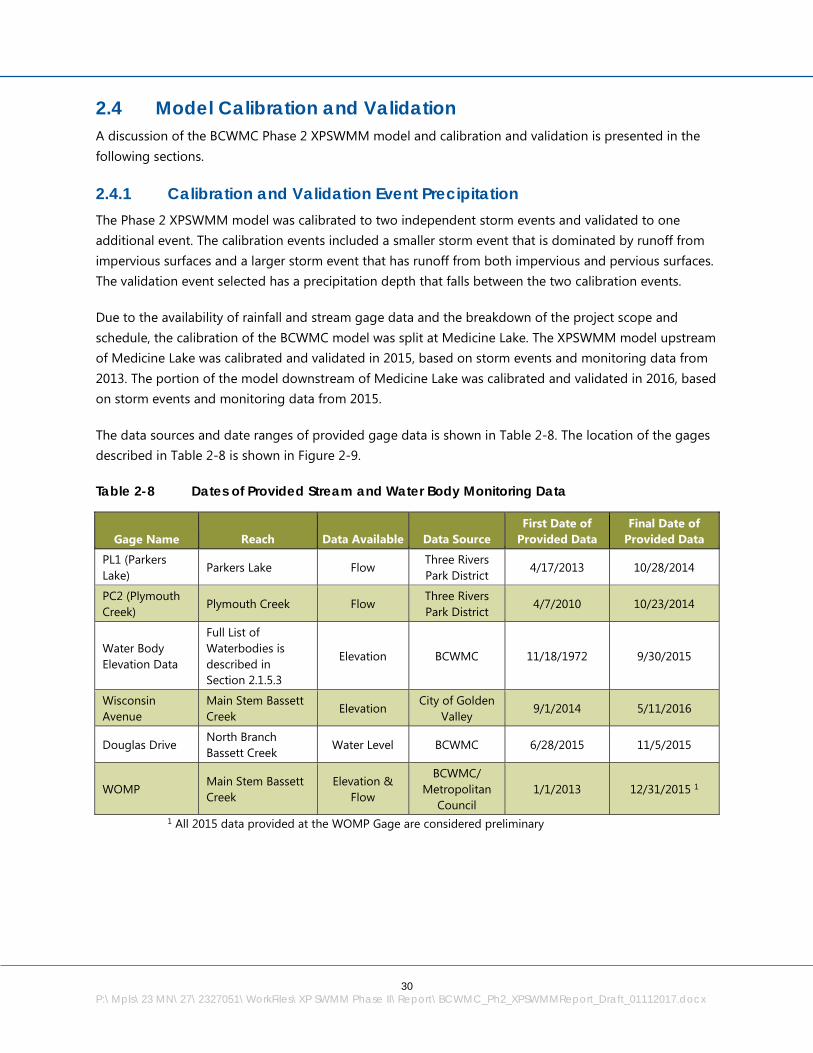
2.4.1 Calibration and Validation Event Precipitation ............................................................................................30
2.4.2 Location of Rainfall Gages ...................................................................................................................................33
2.4.3 Observed Runoff Coefficient at Monitoring Sites ......................................................................................36
2.4.4 Calibration Methodology .....................................................................................................................................36
3.0 Calibration and Validation Results ..............................................................................................................................40
3.1.1 Calibration Events Results ....................................................................................................................................40
3.1.1.1 Calibration of the Watershed Upstream of Medicine Lake ..........................................................41
3.1.1.2 Calibration of the Watershed Downstream of Medicine Lake (Bassett Creek Main Stem and North Branch Bassett Creek) ............................................................................................................47
3.1.2 Validation Event Results .......................................................................................................................................57
3.1.2.1 Validation of the Watershed Upstream of Medicine Lake ............................................................57
3.1.2.2 Validation of the Watershed Downstream of Medicine Lake (Bassett Creek Main stem and North Branch Bassett Creek) ............................................................................................................60
3.2 Evaluation of the Atlas 14 100-Year (1% Chance) Event ...............................................................................65
3.2.1 Atlas 14 100-Year (1% Chance) Event Results and Discussion ..............................................................65
4.0 References ............................................................................................................................................................................73
iii
List of Tables
Table 1-1 BCWMC Phase 2 XPSWMM Model Structure .......................................................................................... 7 Table 2-1 Naming Convention ........................................................................................................................................ 15 Table 2-2 Joint probability tailwater recommendations – adapted from MnDOT Drainage Manual . 16 Table 2-3 Land Use Categories and Initial Impervious Percentage Assumptions ...................................... 20 Table 2-4 Horton Infiltration Parameters .................................................................................................................... 24 Table 2-5 Depression Storage Coefficients ................................................................................................................ 26 Table 2-6 Overland Roughness Values ........................................................................................................................ 26 Table 2-7 Pipe Type with Modeled Manning’s Roughness ................................................................................. 27 Table 2-8 Dates of Provided Stream and Water Body Monitoring Data ........................................................ 30 Table 2-9 Calibration and Validation Events Used Upstream of Medicine Lake ......................................... 32 Table 2-10 Calibration and Validation Events Used Downstream of Medicine Lake (Bassett Creek
Main stem and North Branch Bassett Creek) ........................................................................................ 32 Table 2-11 Precipitation Gages used for XPSWMM Model Calibration ............................................................ 33 Table 2-12 Observed Runoff Coefficients for Model Calibration and Validation Upstream of Medicine
Lake ........................................................................................................................................................................ 36 Table 2-13 Observed Runoff Coefficients for Model Calibration and Validation Downstream of
Medicine Lake1 .................................................................................................................................................. 36 Table 2-14 Final Calibration Parameters for the BCWMC XPSWMM Model as Applied to Calibration
Watersheds ......................................................................................................................................................... 38 Table 3-1 Model Calibration Summary Statistics for Calibration Event 1(Large Event) ........................... 42 Table 3-2 Model Calibration Summary Statistics for Calibration Event 2 (Small Event) .......................... 42 Table 3-3 Model Calibration Summary Statistics for Calibration Event 3 (Large Event) .......................... 50 Table 3-4 Model Calibration Summary Statistics for Calibration Event 4 (Small Event) .......................... 50 Table 3-5 Model Validation Summary Statistics for Validation Event 1 ......................................................... 57 Table 3-6 Model Validation Summary Statistics for Validation Event 2 ......................................................... 60 Table 3-7 Comparison of BCWMC Watershed Management Plan to the Phase 2 XPSWMM Model -
Flood Elevations and Peak Discharges .................................................................................................... 72
List of Figures
Figure 1-1 Model Structure ................................................................................................................................................... 9 Figure 2-1 Subwatersheds .................................................................................................................................................. 12 Figure 2-2 Location of Cities within Watershed ......................................................................................................... 13 Figure 2-3 Subwatershed Groupings ............................................................................................................................. 14 Figure 2-4 Downstream Boundary Conditions ........................................................................................................... 18 Figure 2-5 Land Use .............................................................................................................................................................. 21 Figure 2-6 Directly-Connected Impervious Percentage ......................................................................................... 22 Figure 2-7 Hydrologic Soil Groups .................................................................................................................................. 25 Figure 2-8 Modeled Conveyance System ..................................................................................................................... 29
iv
Figure 2-9 Location of Stream Monitoring Gages .................................................................................................... 31 Figure 2-10 Location of Rainfall Gages ............................................................................................................................ 34 Figure 2-11 Spatially Adjusted Rainfall Groupings ...................................................................................................... 35 Figure 3-1 Calibration Event 1 at PL1 (Parkers Lake) ............................................................................................... 43 Figure 3-2 Calibration Event 1 at PC2 (Plymouth Creek) ........................................................................................ 44 Figure 3-3 Calibration Event 2 at PL1 (Parker's Lake) .............................................................................................. 45 Figure 3-4 Calibration Event 2 at PC2 (Plymouth Creek) ........................................................................................ 46 Figure 3-5 Calibration Event 3 at Wisconsin Avenue (Main Stem) ..................................................................... 51 Figure 3-6 Calibration Event 3 at Douglas Drive (North Branch) ........................................................................ 52 Figure 3-7 Calibration Event 3 at WOMP Station (Main Stem) ............................................................................ 53 Figure 3-8 Calibration Event 4 at Wisconsin Avenue (Main Stem) ..................................................................... 54 Figure 3-9 Calibration Event 4 at Douglas Drive (North Branch) ........................................................................ 55 Figure 3-10 Calibration Event 4 at WOMP Station (Main Stem) ............................................................................ 56 Figure 3-11 Validation Event 1 at Parkers Lake 1 (PL1) ............................................................................................. 58 Figure 3-12 Validation Event 1 at Plymouth Creek 2 (PC2) ..................................................................................... 59 Figure 3-13 Validation Event 2 at Wisconsin Avenue (Main Stem) ...................................................................... 61 Figure 3-14 Validation Event 2 at Douglas Drive (North Branch) .......................................................................... 63 Figure 3-15 Validation Event 2 at WOMP Station (Main Stem) ............................................................................. 64 Figure 3-16 Plymouth Creek, Turtle Lake, and Parkers Lake Subwatersheds Atlas 14 100-year
Inundation Extents ........................................................................................................................................... 68 Figure 3-17 Lost Lake, Northwood Lake, Crane Lake, and Medicine Subwatersheds Atlas 14 100-year
Inundation Extents ........................................................................................................................................... 69 Figure 3-18 Bassett Creek Main Stem (Upstream), Westwood Lake, Bassett Creek Park Pond, and
Sweeney Lake Atlas 14 100-year Inundation Extents ........................................................................ 70 Figure 3-19 Grimes Pond, North and South Rice Lake, Bassett Creek Main Stem (Downstream), and
With Lake Subwatersheds Atlas 14 100-year Inundation Extents................................................. 71
P:\Mpls\23 MN\27\2327051\WorkFiles\XP SWMM Phase II\Report\BCWMC_Ph2_XPSWMMReport_Draft_01112017.docx v
Certifications
I hereby certify that this engineering document was prepared by me or under my direct personal supervision and that I am a duly licensed Professional Engineer under the laws of the State of Minnesota.
date Jennifer Koehler, PE MN PE #: 47500
Date
vi
Acronyms
Acronym Description BCWMC Bassett Creek Watershed Management Commission DEM Digital Elevation Model FEMA Federal Emergency Management Agency FIS Flood Insurance Study HEC Hydrologic Engineering Center HEC-RAS Hydrologic Engineering Center River Analysis System JPA joint powers agreement LiDAR Light Detection and Ranging MnDOT Minnesota Department of Transportation MnDNR Minnesota Department of Natural Resources MSL 1912 Mean Sea Level Datum of 1912 NAVD88 North American Vertical Datum of 1988 NCDC National Climatic Data Center NEXRAD Next-Generation Radar NGIA National Geospatial Intelligence Agency NGVD29 National Geodetic Vertical Datum of 1929 NOAA National Oceanic and Atmospheric Administration NRCS Natural Resources Conservation Service NWL Normal Water Level NWS National Weather Service PCSWMM Storm Water Management Module (interface by PC Solutions) SSURGO Soil Survey Geographic Dataset maintained by the NRCS TAC Technical Advisory Committee TMDL Total Maximum Daily Load TP40 Technical Paper 40 USACE United States Army Corps of Engineers WOMP Watershed Outlet Monitoring Program WMO Watershed Management Organization WRMP Water Resources Management Plan XPSWMM Storm Water Management Module (interface by XP Solutions)

1
P:\Mpls\23 MN\27\2327051\WorkFiles\XP SWMM Phase II\Report\BCWMC_Ph2_XPSWMMReport_Draft_01112017.docx
Executive Summary The Bassett Creek Watershed Management Commission (BCWMC) Phase 2 XPSWMM model update incorporated more detailed subwatershed, storage, and storm sewer information for the watershed, including the major ponds and wetlands. The Phase 2 XPSWMM modeling effort included the following items:
• Increasing the number of the subwatersheds for the entire BCWMC watershed from approximately 55 to approximately 1,156 (see Figure 2-1)
• Developing revised watershed hydrology inputs based on more current soils data and impervious coverage information for the Twin Cities area.
• Modeling of storm sewer and outlet structures based on data provided by the member cities and agencies.
• Integrating detailed storage (e.g. ponds and wetlands) within each of the subwatersheds based on recent topographic data.
• Ensuring consistent vertical datum in the model with the entire Phase 2 XPSWMM model updated to be in the NAVD88 vertical datum.
• Developing the model to fully capture and route the Atlas 14 100-year design storm event. • Performing flow/elevation monitoring at Douglas Drive on the North Branch of Bassett Creek (in
2015). • Calibrating at several locations including Plymouth Creek, Wisconsin Avenue, the North Branch of
Bassett Creek (at Douglas Drive), and at the Watershed Outlet Monitoring Program (WOMP) gage. • Using the calibrated model to estimate the Atlas 14 100-year flood elevations along the Bassett
Creek system and within the contributing watershed.
The Phase 2 XPSWMM model is a tool that can be utilized by the BCWMC, member cities, and other entities to evaluate projects and make informed watershed management decisions. One of the primary applications is evaluating and updating flood management elevations to reflect current and future infrastructure and land use conditions. However, there are a variety of other uses of the BCWMC Phase 2 XPSWMM model, such as assessing the capacity of the existing and proposed storm sewer systems, identifying localized flooding issues in the watershed, verifying and designing outlet and storm sewer modifications, and estimating various flow regimes for stream stabilization and restoration analysis and design projects. Section 1.2.1 further discusses other potential uses of the Phase 2 XPSWMM model, and Section 1.2.2 outlines the model structure and organization. Additionally, the BCWMC may update the XPSWMM model annually to include projects built within the nine member cities.
The BCWMC Phase 2 XPSWMM model was calibrated at flow/elevation monitoring gages at various points within the watershed, including two locations upstream of Medicine Lake (Parkers Lake storm sewer inflow and on Plymouth Creek), two locations on the Main Stem of Bassett Creek (Wisconsin Avenue control structure and the WOMP station), and one location on the North Branch of Bassett Creek (Douglas Drive). Calibration was performed for both a small precipitation event and a large precipitation event. Once calibrated, the model was run for a third validation event that was a precipitation depth

2
P:\Mpls\23 MN\27\2327051\WorkFiles\XP SWMM Phase II\Report\BCWMC_Ph2_XPSWMMReport_Draft_01112017.docx
between the small and large event. To evaluate the calibration and validation results, we used several parameters to compare the Phase 2 XPSWMM model performance with the monitoring data. These parameters include the percent error in peak flow and/or peak elevation/flow depth, percent error in volume (if flow monitoring data was available), and the Nash-Sutcliffe efficiency index. The calculated Nash-Sutcliffe efficiency indices and the percent error statistics indicate a good fit for both the small and large calibration events as well as the validation events for the various monitoring stations in the watershed. Also, review of the calibration plots indicate that the XPSWMM model results are closely matching the monitoring data magnitudes and hydrograph shapes for the various storm events. Additional discussion related to the modeling methodology and calibration results can be found in Sections 2.0 and 3.0, respectively, in the report.
The historic 100-year flood elevations reported in the current BCWMC Watershed Management Plan were based on the Technical Paper 40 (TP40) precipitation data which was equivalent to a storm event with 6.0 inches of precipitation falling within a 24-hour period. In 2013, the precipitation depths outlined in the Atlas 14 Precipitation Frequency Atlas of the United States (Atlas 14), Volume 8 replaced the TP40 design storm events; the new 100-year (1% chance) storm event is 7.42 inches of precipitation falling within a 24-hour period (~25% increase in the design storm precipitation depth). The final, calibrated XPSWMM model was used to evaluate the Atlas 14 100-year (1% chance) design storm event.
Table 3-7 summarizes the flood elevations and peaks discharges as summarized in the BCWMC Watershed Management Plan, the corresponding flood elevations and peak discharges as estimated by the Phase 2 XPSWMM model, and the difference between the data sources. Figure 3-16 through Figure 3-19 show the expected extents of inundation based on the peak flood elevations from BCWMC Phase 2 XPSWMM model for the Atlas 14 100-year as applied to the 2011 MnDNR LiDAR elevation data. T The inundation mapping was developed using a level pool mapping methodology, based on the modeled peak flood elevation for each subwatershed and the MnDNR LiDAR elevation data. This method is more accurate for lakes, wetlands, and ponds, whereas the inundation extents shown along Plymouth Creek, North Branch Bassett Creek, and Bassett Creek Main Stem are approximate. To more accurately determine the flood inundation along the creeks, the elevations summarized in Table 3-7 should be used.
In general, it would be expected that evaluating the Atlas 14 design storm event across the Bassett Creek watershed would result in increases of the peak flood elevations and discharge rates throughout the watershed due to the larger magnitude of the design storm precipitation depth. However, the Phase 2 XPSWMM model also incorporated significantly more detail, including the refined subwatersheds, the storage available in all of the ponds and wetlands throughout the watershed, and the incorporation of storm sewer systems connecting the ponds and wetlands, compared to the previous modeling efforts for the watershed. As a result, the estimated peak flood elevations and discharge rates for the Atlas 14 design storm event are higher than the values included in the BCWMC Watershed Management Plan in some locations, while in other locations in the watershed, a slight decrease in the peak flood elevations are observed.

3
P:\Mpls\23 MN\27\2327051\WorkFiles\XP SWMM Phase II\Report\BCWMC_Ph2_XPSWMMReport_Draft_01112017.docx
The following are some general observations regarding the changes in the 100-year flood elevations and flows from the BCWMC Watershed Management Plan to the Phase 2 XPSWMM modeling (organized by location in the watershed):
Bassett Creek Main Stem
• Flood elevations upstream of the New Tunnel inlet increased significantly (approximately 3.7 ft), as well as along the channel to the Cedar Lake Road Bridge (0.5-2.6 ft increase).
• Flood elevations generally increased upstream of the Freun Mill Dam to Noble Lane, with flood elevations between Golden Valley Road and Noble Lane increasing significantly (2.4 to 4.4 feet)
• Flood elevations near Highway 100 and the confluence with the North Branch of Bassett Creek rose significantly (1.5 to 2.7 feet).
• Flood elevations between Duluth Street and the Golden Valley Country Club increased moderately (between 0.4 and 1.5 feet).
• Flood elevations between the Golden Valley Country Club control structure and Wisconsin Avenue increased significantly (2.0 to 2.5 feet). Flood elevations near Hampshire Avenue increased between 0.5 and 1.0 feet.
• Flood elevations upstream of Wisconsin Avenue, including the Brookview Golf Course, to Medicine Lake are similar to, but slightly lower than, the Bassett Plan water surface elevations (-0.2 to -1.2 feet).
North Branch of Bassett Creek
• Flood elevations between Highway 100 through Bassett Creek Park Pond Park increased significantly (1.8 to 2.3 feet).
• Flows between Brunswick Avenue and 32nd Avenue decreased. • Flood elevations upstream of the Edgewood Embankment and especially upstream of Winnetka
Pond East increased significantly (2.0 to 3.4 feet) • The flood elevation of Northwood Lake increased by 1.7 feet.
Sweeney Branch
• Flood elevations between the upstream side of Highway 100 to the Ravine Storage Area increased substantially (0.5 to 6.3 feet).
• The flood elevation of Sweeney and Twin Lakes increased by 0.4 feet.
Plymouth Creek/Medicine Lake
• Flood elevations in the Dunkirk flood storage area increased substantially (3.1 to 5.4 feet). • Flood elevations upstream of County Road 9 (Rockford Road) decreased substantially (-4.1 feet). • The flood elevation of Medicine Lake decreased slightly (-0.2 feet). • The Crane Lake flood elevation decreased by 0.5 feet.
Based on a review of the inundation mapping, the LiDAR data, and aerial photos, the new flood elevations and inundation mapping indicate several structures are potentially at-risk of flooding during the Atlas 14
4
P:\Mpls\23 MN\27\2327051\WorkFiles\XP SWMM Phase II\Report\BCWMC_Ph2_XPSWMMReport_Draft_01112017.docx
100-year design storm event. Some of the potentially at-risk structures are located along the Bassett Creek Main Stem; however, other potentially at-risk properties are located in upstream portions of the watershed. Topographic surveys of these structures are needed to confirm if these structures are at-risk of flooding.
5
P:\Mpls\23 MN\27\2327051\WorkFiles\XP SWMM Phase II\Report\BCWMC_Ph2_XPSWMMReport_Draft_01112017.docx
1.0 Background and Purpose 1.1 Past Water Management Planning The Bassett Creek Watershed Management Commission (BCWMC) has a long history of water management planning. The BCWMC was originally created in 1968 as the Bassett Creek Flood Control Commission to address flooding concerns. In 1984, the Bassett Creek Flood Control Commission revised its joint powers agreement (JPA) and created the Bassett Creek Watershed Management Commission.
The United States Army Corps of Engineers (USACOE) developed hydrologic and hydraulic (HEC-1 and HEC-2) models of the Bassett Creek watershed and Bassett Creek in partnership with the BCWMC for the evaluation of the BCWMC Flood Control Project. The most recent model updates occurred in 1998. The Minnesota Department of Natural Resources (MnDNR) was also involved in the review of these models.
In 2012, the BCWMC updated the HEC-1 and HEC-2 models to the XPSWMM modeling software to account for changes in the watershed (the Phase 1 XPSWMM model). XPSWMM is a software package that incorporates both hydrology and hydraulics and determines flood elevations, calculates channel flow rates and velocities, and effectively models backwater conditions and complex outlet structures. The intent of updating the models to XPSWMM was to create a tool for the BCWMC and the member cities to use when evaluating how changes to the watershed will effect flow rates and flood elevations in Bassett Creek. However, because of the coarse level of detail in the number of subwatersheds and associated storage in this model, calibration was not feasible without incorporating unrealistic inputs into the model. The differences between the modeled and observed hydrographs was likely due to the coarse level of detail in the modeled subwatersheds and not accounting for upstream storage in the smaller ponds and wetlands throughout the watershed (1). Ultimately, the Phase 1 XPSWMM model was used to evaluate the TP-40 design storm events including the 100-year, 24 hour storm.
In 2015, the BCWMC authorized updating the Phase 1 XPSWMM model to incorporate more detailed subwatershed and storage information for the watershed, including the major ponds and wetlands as well as the storm sewer data for the systems connecting the upstream ponds and wetlands to the major water resources within the watershed (the Phase 2 XPSWMM model). The major changes from the Phase 1 XP-SWMM model to the Phase 2 model included the following items:
• Increasing the resolution of the subwatersheds for the entire BCWMC watershed from approximately 55 to approximately 1,156 based on the ponds and wetlands within the watershed, more current topographic data, and storm sewer data provided by the member cities
• Developing revised watershed hydrology inputs based on more current soils data and impervious coverage information for the Twin Cities area.
• Modeling of storm sewer and outlet structures based on storm sewer GIS data and construction/as-built drawings provided by the member cities.
• Integrating detailed storage within each of the subwatersheds based on recent topographic data to account for the storage available in the upper watershed.
6
P:\Mpls\23 MN\27\2327051\WorkFiles\XP SWMM Phase II\Report\BCWMC_Ph2_XPSWMMReport_Draft_01112017.docx
• Ensuring consistent vertical datum in the model. The entire Phase 2 XPSWMM model was updated to be in the NAVD88 vertical datum. Historically, the flood elevations along the creek have been summarized in NGVD 1929.
• Developing the Phase 2 XPSWMM model to fully capture and route the Atlas 14 precipitation data and design storm events, including the 100-year event using the MN MSE3 storm distribution. Once calibrated, the model will be used to estimate the Atlas 14 100-year flood elevations along the Bassett Creek system and within the watershed.
• Performing flow/elevation monitoring and calibration at several locations including Plymouth Creek, Wisconsin Avenue, the North Branch of Bassett Creek (at Douglas Drive), and at the Watershed Outlet Monitoring Program (WOMP) gage at Irving Avenue.
The following report summarizes the BCWMC Phase 2 XPSWMM modeling methodology, calibration, and results.
1.2 Stormwater Model Uses, Structure, & Updates 1.2.1 Model Applications There are many useful applications of the BCWMC’s updated Phase 2 XPSWMM model, which can be used by the BCWMC, member cities, and other entities to evaluate projects and make informed watershed management decisions. One of the primary applications is evaluating and updating flood management elevations to reflect current and future infrastructure and land use conditions. Other uses include assessing the capacity of the existing and proposed storm sewer system and optimizing future system modifications, thereby reducing long-term infrastructure costs. Potential uses of the model span several BCWMC and municipal functions, including planning, public safety, flood protection, and water quality protection. The following list identifies numerous specific model applications:
• Re-evaluating flood management elevations for waterbodies throughout the BCWMC with Atlas 14 rainfall.
• Identifying localized flooding issues. • Verifying and designing outlet and storm sewer modifications • Identifying impacts of infrastructure changes on upstream and downstream flood elevations • Characterizing stormwater discharges (flows and velocities) throughout the BCWMC, including
discharges to the stream systems. • Assisting in Total Maximum Daily Load (TMDL) studies for the creeks and lakes within the BCWMC
with respect to estimating incoming water flows. • Using in conjunction with water quality models to evaluate and design potential best
management practices (BMP) for stormwater treatment and water quality improvements. • Evaluating and estimating various flow regimes for stream stabilization and restoration analysis
and design projects.
7
P:\Mpls\23 MN\27\2327051\WorkFiles\XP SWMM Phase II\Report\BCWMC_Ph2_XPSWMMReport_Draft_01112017.docx
1.2.2 Model Structure & Management Because XPSWMM is a proprietary software, a license key (either a stand-alone physical key that plugs into your computer or a network key) is required to open and utilize the software. XPSWMM license keys come in a variety of sizes depending on the needs of the user and can range from 200 nodes to 10,000 or even unlimited nodes (with the cost of the license increasing with size). A common size for XPSWMM license keys is 1,000 or 2,000 nodes.
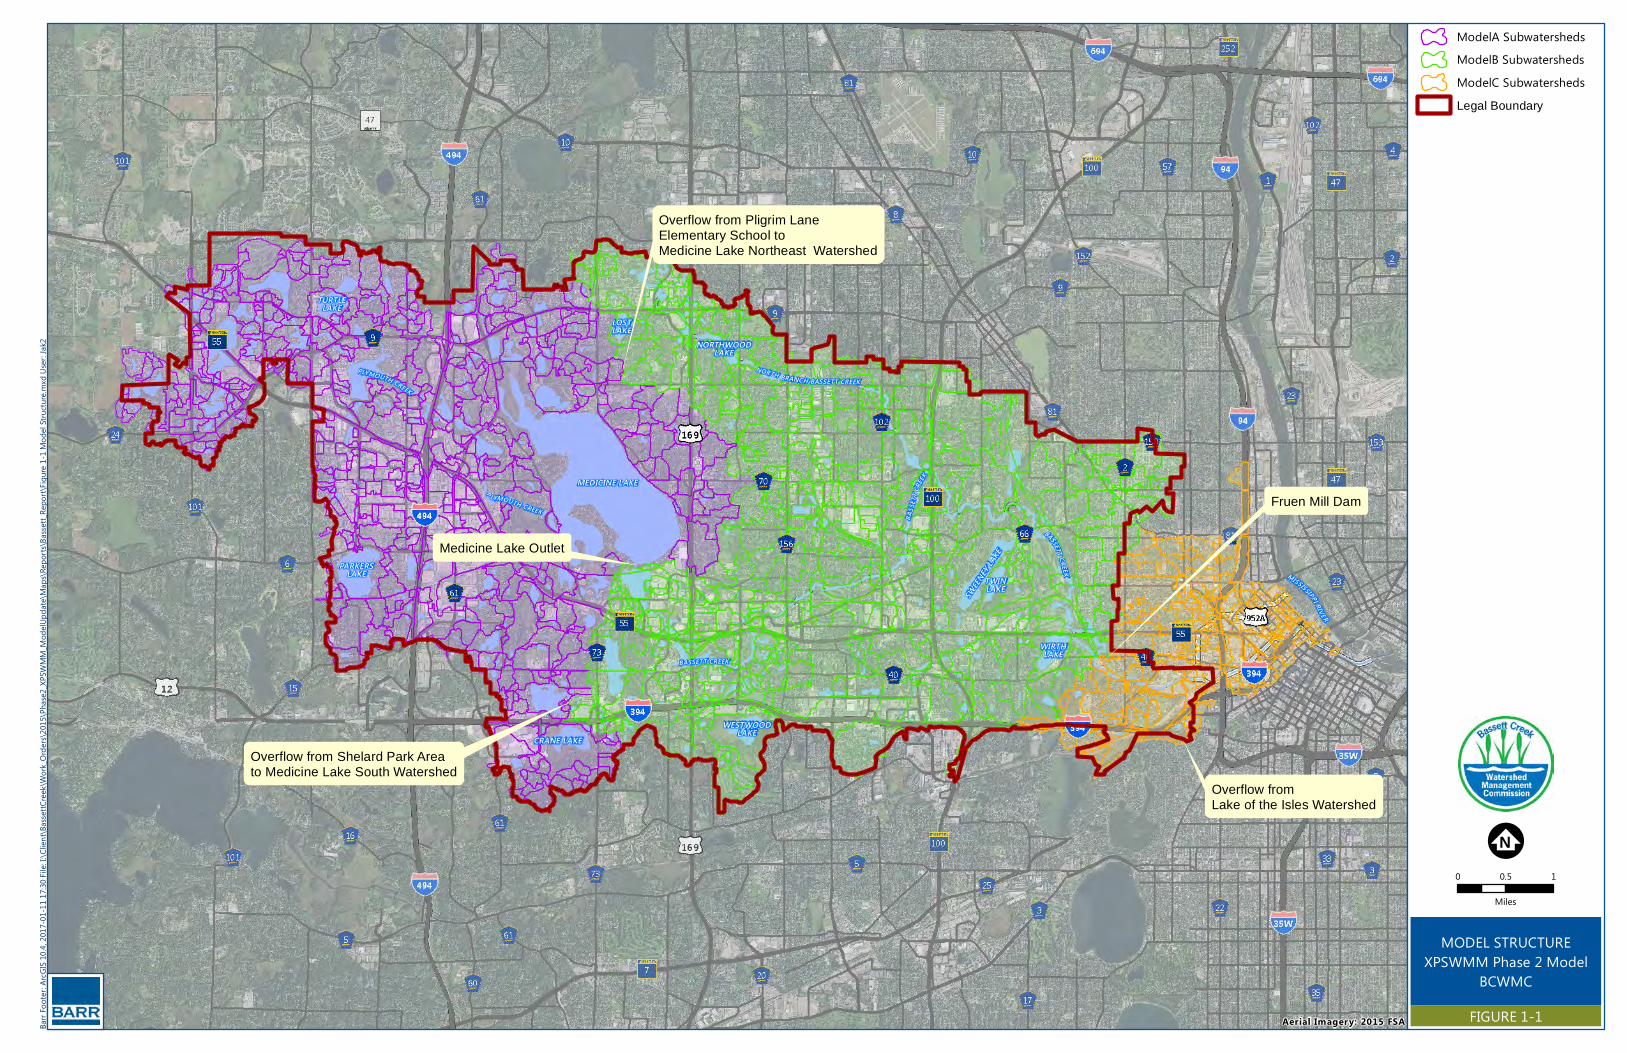
The final calibrated BCWMC Phase 2 XPSWMM model has a total of 4,695 links and 4,135 nodes. As combined, the model would require a 5,000 node XPSWMM license key. Recognizing that BCWMC will be sharing the final calibrated Phase 2 XPSWMM model with the member cities (and their consultants) for a variety of uses, we have subdivided the Phase 2 XPSWMM model for the BCWMC in two locations to create three separate XP-SWMM models (see Figure 1-1) to encompass the entire Bassett Creek watershed. To open and utilize these separate models will require a 2,000 node XPSWMM license key.
The breaks points in the XP-SWMM model are located at:
• The outlet from Medicine Lake in the City of Plymouth • The Fruen Mill dam downstream of Glenwood Avenue in the City of Minneapolis
These break points were selected as locations where downstream tailwater conditions will have minimal impact on the estimated upstream flood elevations.
To accommodate the break points in the model, outflow hydrographs must be exported from the upstream models and imported as a boundary condition for the downstream models. Table 1-1 summarizes the three XP-SWMM models that cover the BCWMC watershed.
Table 1-1 BCWMC Phase 2 XPSWMM Model Structure
XPSWMM Model Model Description Inflow Hydrograph Hydrograph Source
Model A: BCWMC_XPSWMM_Ph2_ModelA.xp
Watershed to Outlet from Medicine Lake, including Plymouth Creek, Turtle Lake, Parkers Lake, Crane Lake, and Medicine Lake
A) Inflow hydrograph at node MLNE-024A (overflows from Pilgrim Lane Elementary School)
B) Inflow hydrograph at node MLS-024 (overflow from Shelard Park area)
A) Link LNWD057.O2 from the BCWMC_XPSWMM_Ph2_ModelB.xp
B) Link L-BUW-115O from the BCWMC_XPSWMM_Ph2_ModelB.xp
Model B: BCWMC_XPSWMM_Ph2_ModelB.xp
Watershed from Medicine Lake to the Fruen Mill Dam, including the Main Stem and North Branch of Bassett Creek, Lost Lake, Northwood Lake, Westwood Lake,
A) Inflow hydrograph at node • N-BUW-135 (discharge from Medicine Lake)
A) Link L-MLD-197 from the BCWMC_XPSWMM_Ph2_ModelA.xp
8
P:\Mpls\23 MN\27\2327051\WorkFiles\XP SWMM Phase II\Report\BCWMC_Ph2_XPSWMMReport_Draft_01112017.docx
XPSWMM Model Model Description Inflow Hydrograph Hydrograph Source
North & South Rice Pond, Grimes Pond, Sweeney Lake, Twin Lake, and Wirth Lake
Model C: BCWMC_XPSWMM_Ph2_ModelC.xp
Watershed from Fruen Mill Dam to the Mississippi River, including the watersheds to both the New and Old Tunnels
A) Inflow hydrograph at node N-BCD-055 (discharge immediately downstream of Fruen Mill Dam)
B) Inflow hydrograph at node LOTI_100yr (overflows from Lake of the Isles)
A) Link L-BCD-056 from the BCWMC_XPSWMM_Ph2_ModelB.xp
B) Hydrograph provided by the City of Minneapolis from the Lake of the Isles XPSWMM model on 12/2/2016
BCWMC is the owner of the Phase 2 XPSWMM model. Requests for the XPSWMM model should come to the BCWMC through the member cities. Currently the BCWMC does not have a Conditional Use License regarding the sharing of the XPSWMM model files. In the past, the BCWMC has used the Barr Engineering Standard Conditional Use License prior to sharing the XPSWMM model files.
When the BCWMC Phase 2 XPSWMM model is requested, the following information will be shared upon receiving a signed Conditional Use License:
• Three XPSWMM model files (Models A, B, & C) – final calibrated model • The BCWMC Phase 2 XPSWMM subwatershed divides (in GIS format) • This Bassett Creek Hydrologic and Hydraulic Analyses report
1.2.3 Model Updates The final calibrated BCWMC Phase 2 XPSWMM model may be updated annually by the BCWMC to incorporate information on projects constructed within the watershed, as provided by member cities. The updates to the XP-SWMM model will be coordinated with the P8 water quality model updates.
MEDICINE LAKE
NORTHWOODLAKE
LOSTLAKE
SWEEN
EY LA
KE
TURTLELAKE
TWINLAKE
WESTWOODLAKE
WIRTHLAKE
PARKERSLAKE
CRANE LAKE
BASS
ETT C
REEK
BASSETT CREEK
PLYMOUTH CREEK
BASSETT CREEK
P LYMOUTH CREEK
BASSETT CREEKBRANCHNORTH
MISSISSIPPI RIVER
Barr F
ooter
: ArcG
IS 10
.4, 20
17-01
-11 17
:30 Fi
le: I:\C
lient\
Basse
ttCree
k\Work
_Orde
rs\20
15\Ph
ase2_X
PSWM
M_Mo
delUp
date\
Maps
\Repo
rts\Ba
ssett_
Repo
rt\Fig
ure 1-
1 Mod
el Str
uctur
e.mxd
User
: Jak2
MODEL STRUCTUREXPSWMM Phase 2 Model
BCWMC
FIGURE 1-1
ModelA SubwatershedsModelB SubwatershedsModelC SubwatershedsLegal Boundary
!;N0 0.5 1
Miles
Aerial Imagery: 2015 FSA
Overflow from Pligrim Lane Elementary School to Medicine Lake Northeast Watershed
Overflow from Shelard Park Area to Medicine Lake South Watershed
Medicine Lake Outlet
Fruen Mill Dam
Overflow from Lake of the Isles Watershed

10
P:\Mpls\23 MN\27\2327051\WorkFiles\XP SWMM Phase II\Report\BCWMC_Ph2_XPSWMMReport_Draft_01112017.docx
2.0 Methodology for Hydrologic and Hydraulic Modeling
2.1 Model Overview The following sections include a general discussion about the BCWMC Phase 2 modeling.
2.1.1 XPSWMM Computer Modeling Software The U.S. EPA’s Storm Water Management Model (SWMM), with a computerized graphical interface provided by XP Software (XPSWMM), was chosen as the computer modeling package for the BCWMC Phase 2 model update. XPSWMM uses rainfall and watershed characteristics to generate local runoff, which is routed simultaneously through complicated pipe and overland flow networks. The model can account for detention in ponding areas, backflow in pipes, surcharging of manholes, as well as tailwater conditions that may exist and affect upstream storage or pipe flows. Version XPSWMM 2014, Service Pack 1, was the most current version of the model available at the beginning of the study and used to model the storm sewer, ponding and overland flow systems within the study area.
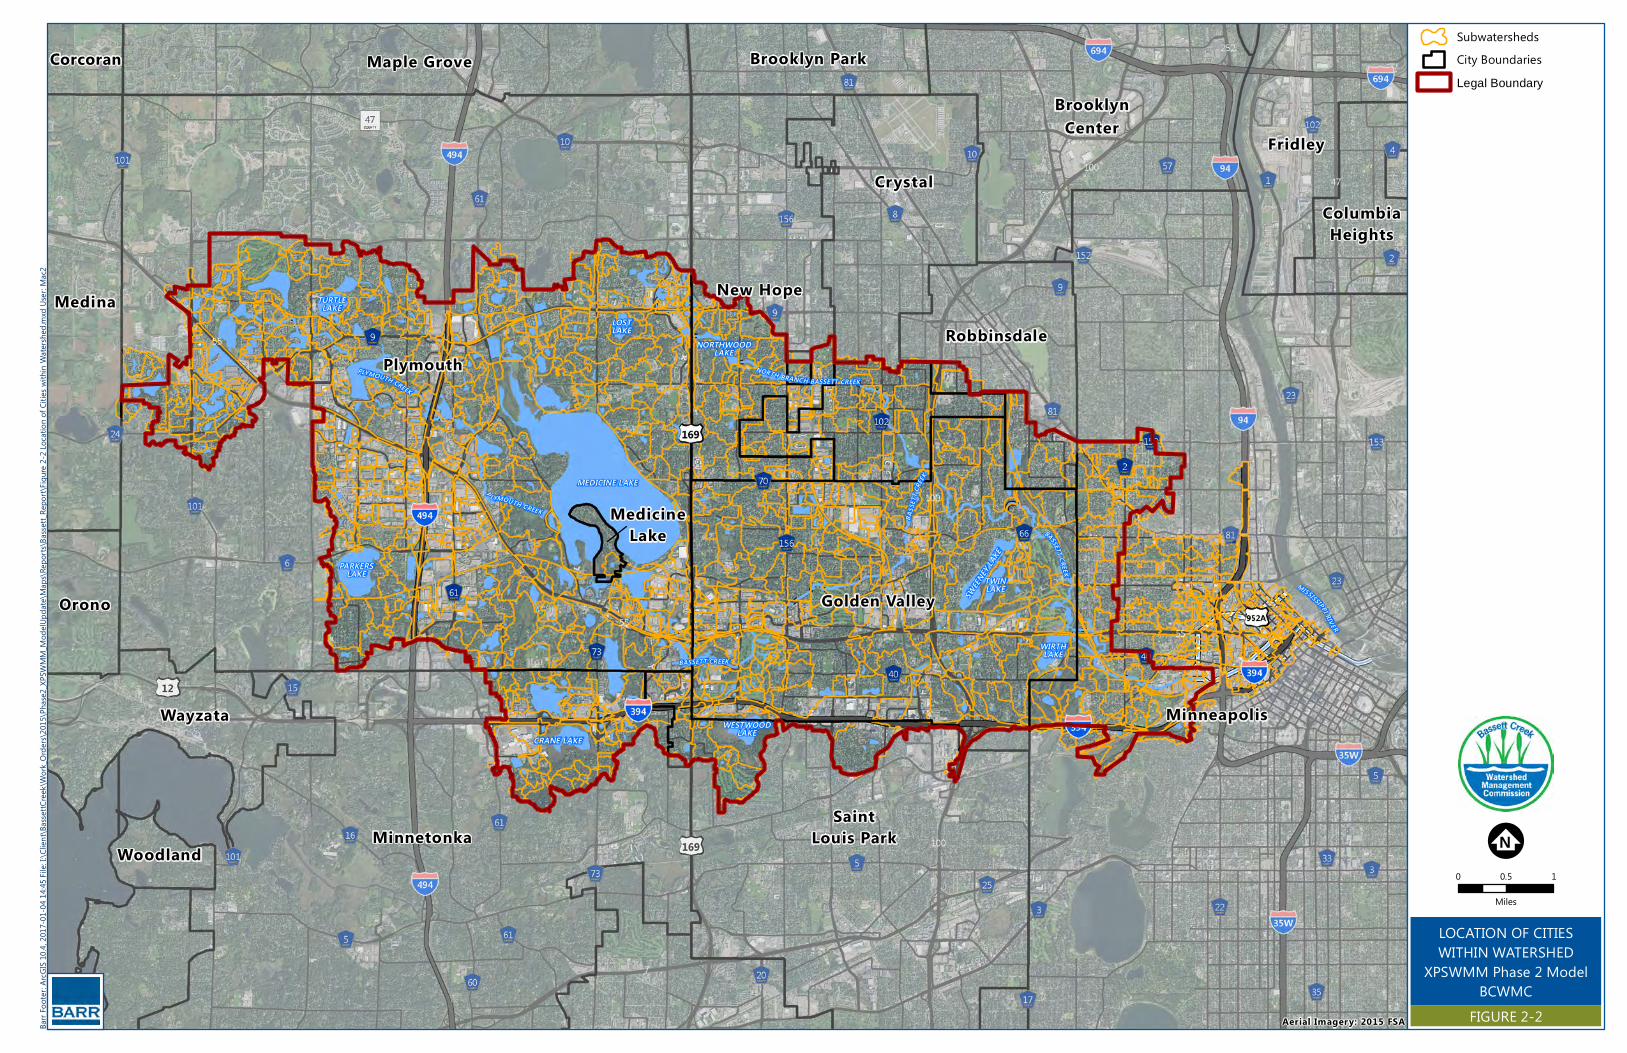
2.1.2 Project Extents The Bassett Creek watershed is located entirely within Hennepin County, in the northwestern portion of the Twin Cities. The watershed of Bassett Creek covers all or part of the following nine cities:
• Crystal • Golden Valley • Medicine Lake • Minneapolis • Minnetonka • New Hope • Plymouth • Robbinsdale • St. Louis Park
The downstream end of the Bassett Creek watershed is a tunnel (the “New” Tunnel) which conveys Bassett Creek under downtown Minneapolis and discharges into the Mississippi River below St. Anthony Falls. The legal boundary of the BCWMC, as shown in Figure 2-1, ends at the entrance to the “New” Tunnel. The total drainage area of the Bassett Creek watershed upstream of the New Tunnel is 39.4 square miles. In 2000, the BCWMC and the Mississippi Watershed Management Organization (MWMO) entered into a joint and cooperative agreement for a boundary change. This boundary change transferred approximately 1,002 acres from the BCWMC to the MWMO to reflect the changed drainage conditions upon completion of the Bassett Creek Flood Control Project. The drainage area within the MWMO drains to what is often referred to as the “Old Tunnel”. With the project in place, the watershed areas tributary to the Old Tunnel and directly tributary to the “New Tunnel” are under jurisdiction of the City of Minneapolis and MWMO (2). However, because high flows from the Bassett Creek main stem are occasionally diverted to the Old
11
P:\Mpls\23 MN\27\2327051\WorkFiles\XP SWMM Phase II\Report\BCWMC_Ph2_XPSWMMReport_Draft_01112017.docx
Tunnel (just upstream from the inlet to the New Tunnel), the Phase 2 XPSWMM model also includes the Old Tunnel watershed as well as the portions of Minneapolis that discharge to the New Tunnel (even through the jurisdiction of these areas falls within the MWMO).
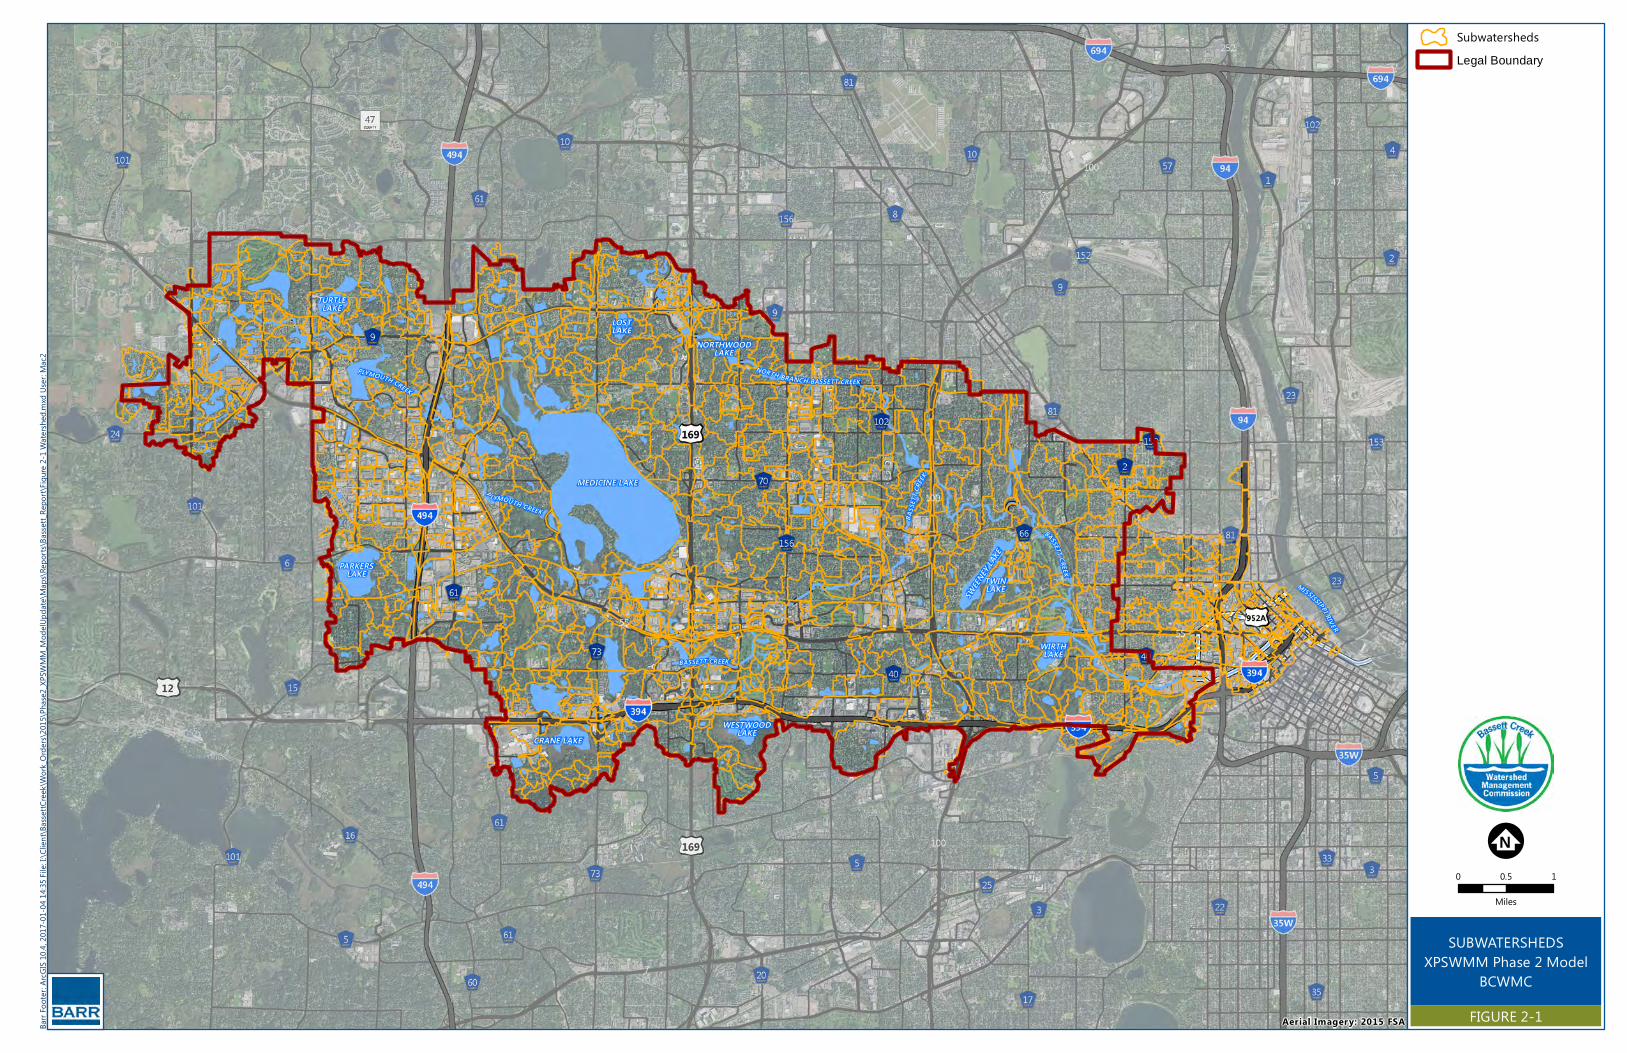
2.1.3 Subwatersheds The subwatersheds from the 2012 P8 water quality study (3) were used as the starting point for the development of the Phase 2 XPSWMM model. The subwatersheds were evaluated and revised based on the available digital mapping for both public and private storm sewer systems and updated topographic data (the MnDNR 2011 LiDAR elevation dataset). Subwatersheds were delineated at a scale that represents the direct drainage area to each of the waterbodies (ponds, wetlands, or lakes), low points in the streets and parking lots, and at key connections to the storm sewer system. In areas where the direction of flow was not clear based on the digital topographic data, watershed delineations were field verified. A total of 1,156 separate subwatersheds were delineated within this study area. The delineated subwatersheds are shown in Figure 2-1. Figure 2-2 shows the subwatersheds in relation to the municipal boundaries for each of the cities.
Historically the Bassett Creek watershed has been subdivided into smaller subwatersheds groupings. Those historic subwatershed groupings are shown in Figure 2-3, and match the map included in the current BCWMC Watershed Management Plan.
MEDICINE LAKE
NORTHWOODLAKE
LOSTLAKE
SWEEN
EY LA
KE
TURTLELAKE
TWINLAKE
WESTWOODLAKE
WIRTHLAKE
PARKERSLAKE
CRANE LAKE
BASS
ETT C
REEK
BASSETT CREEK
PLYMOUTH CREEK
BASSETT CREEK
P LYMOUTH CREEK
BASSETT CREEKBRANCHNORTH
MISSISSIPPI RIVER
Barr F
ooter
: ArcG
IS 10
.4, 20
17-01
-04 14
:35 Fi
le: I:\C
lient\
Basse
ttCree
k\Work
_Orde
rs\20
15\Ph
ase2_X
PSWM
M_Mo
delUp
date\
Maps
\Repo
rts\Ba
ssett_
Repo
rt\Fig
ure 2-
1 Wate
rshed
.mxd
User:
Mac
2
SUBWATERSHEDSXPSWMM Phase 2 Model
BCWMC
FIGURE 2-1
SubwatershedsLegal Boundary
!;N0 0.5 1
Miles
Aerial Imagery: 2015 FSA
MEDICINE LAKE
NORTHWOODLAKE
LOSTLAKE
SWEEN
EY LA
KE
TURTLELAKE
TWINLAKE
WESTWOODLAKE
WIRTHLAKE
PARKERSLAKE
CRANE LAKE
BASS
ETT C
REEK
BASSETT CREEK
PLYMOUTH CREEK
BASSETT CREEK
P LYMOUTH CREEK
BASSETT CREEKBRANCHNORTH
MISSISSIPPI RIVER
Minneapolis
MedicineLake
Orono
Minnetonka
Golden Valley
Medina New Hope
Wayzata
BrooklynCenter
SaintLouis Park
Maple Grove
Fridley
Brooklyn Park
Crystal
Plymouth
Woodland
ColumbiaHeights
Robbinsdale
CorcoranBa
rr Foo
ter: A
rcGIS
10.4,
2017
-01-04
14:45
File:
I:\Clie
nt\Ba
ssettC
reek\W
ork_O
rders\
2015
\Phase
2_XPS
WMM_
Mode
lUpda
te\Ma
ps\Re
ports
\Basse
tt_Re
port\
Figure
2-2 L
ocati
on of
Citie
s with
in Wa
tersh
ed.m
xd Us
er: M
ac2
LOCATION OF CITIESWITHIN WATERSHED
XPSWMM Phase 2 ModelBCWMC
FIGURE 2-2
!;N
SubwatershedsCity BoundariesLegal Boundary
0 0.5 1
Miles
Aerial Imagery: 2015 FSA

Plymo uth Cre ekWe st
Plymo uthCr ee k
Ce ntr a lTur t le Lake
Plymo uth Cre ekEast
Par ker sLake
Par ker s LakeEast Ar ea Me d ic ine
LakeSout h
Cr an e Lake
Ba sse tt Cr ee kMa in Ste m
(Upstr eam ) We st
We stwo odLake
Me dic ineLake Nor th
Me d ic ineLake NE
Me dic ine L akeDi re ct
LostLake
No r thwoo dLake
Ba sse tt Cr ee k Par k Pon d
Gr imesLake
Ba sse tt Cr ee k Ma in Ste m(M ids tre am)
Ba sse tt Cr ee kMa in Ste m
(Upstr eam ) E ast
Swe en ey La keWir thLake
Ba sse tt Cr ee kMa in Ste m (D owns tre am)
Barr F
ooter
: ArcG
IS 10
.4, 20
17-01
-04 14
:49 Fi
le: I:\C
lient\
Basse
ttCree
k\Work
_Orde
rs\20
15\Ph
ase2_X
PSWM
M_Mo
delUp
date\
Maps
\Repo
rts\Ba
ssett_
Repo
rt\Fig
ure 2-
3 Sub
water
shed
Grou
pings
.mxd
User:
Mac2
SUBWATERSHEDGROUPINGS
XPSWMM Phase 2 ModelBCWMC
FIGURE 2-3
Legal Boundary
Subwatershed GroupingsBassett Creek Main Stem(Downstream)Bassett Creek Main Stem(Midstream)Bassett Creek Main Stem(Upstream) EastBassett Creek Main Stem(Upstream) WestBassett Creek Park PondCrane LakeGrimes LakeLost LakeMedicine Lake DirectMedicine Lake NEMedicine Lake NorthMedicine Lake SouthNorthwood LakeParkers LakeParkers Lake East AreaPlymouth Creek CentralPlymouth Creek EastPlymouth Creek WestSweeney LakeTurtle LakeWestwood LakeWirth Lake
!;N0 0.5 1
Miles
Aerial Imagery: 2015 FSA

15
P:\Mpls\23 MN\27\2327051\WorkFiles\XP SWMM Phase II\Report\BCWMC_Ph2_XPSWMMReport_Draft_01112017.docx
2.1.4 Naming Convention Subwatersheds used were named using an abbreviation and numbering system. Abbreviations for each subwatershed were assigned based on the historical subwatershed groupings (Figure 2-3). Nodes used to model channel features, catch basins, and manholes use the same naming convention, but are preceded by “N-“. Links throughout this historical groupings use the same convention as nodes, but are preceded by “L-“. Table 2-1 Naming Convention
Historical Subwatershed Group XPSWMM Node Prefix
Bassett Creek Main Stem Downstream1 BCD
Bassett Creek Main Stem Midstream BCM
Bassett Creek Park Pond BPP
Bassett Creek Main Stem Upstream East BUE
Bassett Creek Main Stem Upstream West BUW
Crane Lake CL
Grimes Pond GRL
Lost Lake LLK
Medicine Lake North MLN
Medicine Lake North East MLNE
Medicine Lake South MLS
Medicine Lake Direct MLD
Medicine Lake North MLN
Northwood Lake NWD
Parkers Lake PL
Parkers Lake East Area PLE
Plymouth Creek West PCW
Plymouth Creek Central PCC
Plymouth Creek East PCE
Sweeney Lake SW
Turtle Lake TL
Westwood Lake WWL
Wirth Lake WL
1 – Bassett Creek Main Stem Downstream (BCD) includes the watershed areas contributing to the Old Tunnel and the portion of the City of Minneapolis contributing to the New Tunnel downstream of the tunnel inlet.
2.1.5 Boundary Conditions The following sections discuss boundary conditions used in the Phase 2 XPSWMM model.

16
P:\Mpls\23 MN\27\2327051\WorkFiles\XP SWMM Phase II\Report\BCWMC_Ph2_XPSWMMReport_Draft_01112017.docx
2.1.5.1 Downstream Boundary Conditions The downstream boundary conditions of the model are the Mississippi River at the outlet of Bassett Creek New Tunnel and Old Tunnel. The New Tunnel discharges to the Mississippi River between the Upper and Lower Falls, while the Old Tunnel discharges to the Mississippi River upstream of the Upper Falls approximately 700 feet downstream of the Plymouth Avenue North Bridge, as shown in Figure 2-4.
Calibration and Validation Events
Stage hydrographs from the USACE St. Paul District Water Control Center were used at each of these locations for the calibration and validation events. The vertical datum specified in the records from the USACE St. Paul District Water Control Center were converted from MSL 1912 to NAVD88.
Frequency Events
The methodology follows guidance from the Minnesota Department of Transportation (MnDOT) Drainage Manual (4). The MnDOT drainage manual recommends evaluating the coincidental probability of two events occurring at the same time. The relative independence of the events can be qualitatively evaluated by the ratio of the drainage areas. A short duration storm, which causes a peak discharge in the study area, will likely not similarly affect the Mississippi River drainage basin upstream of the study area. Recommendations from the MnDOT Drainage Manual are shown in Table 2-2.
The stage elevation of the river is based on a ratio of the study area, approximately 26,900 acres (see Section 2.1.2), to the drainage area of the Mississippi River upstream of the study area (approximately 12,600,000 acres). This results in a ratio of approximately 1:500. For the purposes of this study an interpolated value between the 10-year and the 50-year Mississippi River stage was used as the tailwater condition for the 100-year storm event.
Table 2-2 Joint probability tailwater recommendations – adapted from MnDOT Drainage Manual
Drainage Area Ratio
Frequencies for Coincidental Occurrence
Bassett Creek Region Study Area Outlet Mississippi River
1:1,000 100-year return interval 10-year stage
1:200 100-year return interval 25-year stage
The effective Federal Emergency Management Agency (FEMA) Flood Insurance Study (FIS) study for Hennepin County provides established peak elevation frequency relationships for the 10-, 50-, 100-, and 500-year recurrence intervals for the Mississippi River (5). These profiles were used to select the Mississippi River elevations for the downstream boundary conditions for the Atlas 14 100-year design storm runs. The tailwater elevation used for the Upper Pool of the Mississippi River was 806.0 ft MSL
17
P:\Mpls\23 MN\27\2327051\WorkFiles\XP SWMM Phase II\Report\BCWMC_Ph2_XPSWMMReport_Draft_01112017.docx
NAVD88. The tailwater elevation used for the Lower Pool of the Mississippi River was 756.0 ft MSL NAVD88.
2.1.5.2 Water Surface Elevations of Small Waterbodies Water levels of waterbodies and the creek network were assumed to be at the normal water level (NWL)-the outlet invert elevation for pipes and other hydraulic structures. Initial water levels of land-locked basins were placed at apparent water levels from the 2011 MnDNR LiDAR data. Designed infiltration basins were assumed to be empty prior to rainfall.
2.1.5.3 Water Surface Elevations of Select Large Waterbodies The BCWMC has conducted long term water level monitoring of lake levels throughout the watershed. Monitoring data from the BCWMC was used for the calibration events for select lake levels prior to the beginning of the analysis. The lakes with specified elevations include: Bassett Creek Park Pond, Crane Lake, Medicine Lake, Northwood Lake, Parkers Lake, Sweeney Lake, Westwood Lake, and Wirth Lake. For the 100-year event, the initial water level of these lakes was placed at the normal water levels.
2.1.6 Elevation Data Existing topography was defined using LiDAR data, which is available from the Minnesota Geospatial Information Office. The LiDAR data was collected for the Twin Cities by the MnDNR in the spring and fall of 2011 (6). The one meter cell size was selected.
Water bodies with known bathymetric data were updated according to historical surveys.
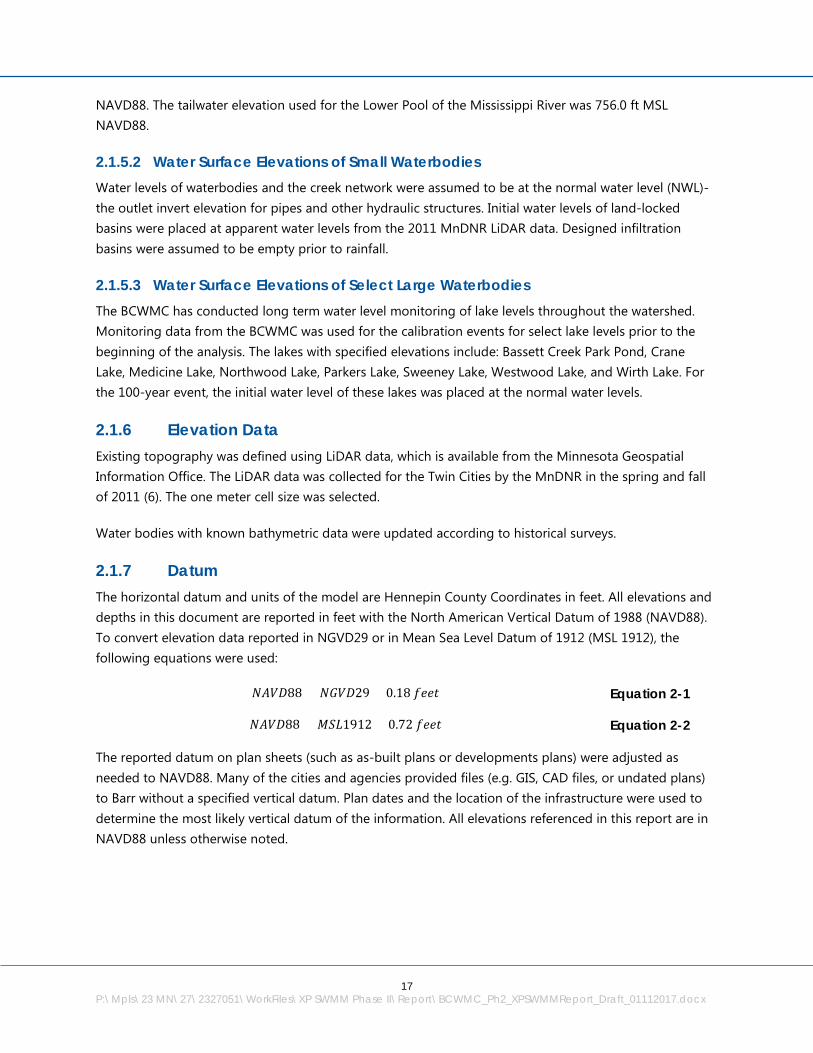
2.1.7 Datum The horizontal datum and units of the model are Hennepin County Coordinates in feet. All elevations and depths in this document are reported in feet with the North American Vertical Datum of 1988 (NAVD88). To convert elevation data reported in NGVD29 or in Mean Sea Level Datum of 1912 (MSL 1912), the following equations were used:
𝑁𝑁𝑁𝑁𝑁𝑁𝑁𝑁88 = 𝑁𝑁𝑁𝑁𝑁𝑁𝑁𝑁29 + 0.18 𝑓𝑓𝑓𝑓𝑓𝑓𝑓𝑓 Equation 2-1
𝑁𝑁𝑁𝑁𝑁𝑁𝑁𝑁88 = 𝑀𝑀𝑀𝑀𝑀𝑀1912 + 0.72 𝑓𝑓𝑓𝑓𝑓𝑓𝑓𝑓 Equation 2-2
The reported datum on plan sheets (such as as-built plans or developments plans) were adjusted as needed to NAVD88. Many of the cities and agencies provided files (e.g. GIS, CAD files, or undated plans) to Barr without a specified vertical datum. Plan dates and the location of the infrastructure were used to determine the most likely vertical datum of the information. All elevations referenced in this report are in NAVD88 unless otherwise noted.

!
<
!
<
MISSISSIPPI RIVER
New TunnelOutfall
<
LowerSt. Anthony
Falls
<
<
UpperSt. Anthony
Falls
<
Old TunnelOutfall
Bassett
Old Bassett
Creek Tunnel
CreekTunnel
Bassett
Creek
Barr F
ooter
: ArcG
IS 10
.4, 20
17-01
-04 15
:06 Fi
le: I:\C
lient\
Basse
ttCree
k\Work
_Orde
rs\20
15\Ph
ase2_X
PSWM
M_Mo
delUp
date\
Maps
\Repo
rts\Ba
ssett_
Repo
rt\Fig
ure 2-
4 Dow
nstre
am Bo
unda
ry Co
nditio
n.mxd
User:
Mac2
DOWNSTREAM BOUNDARYCONDITIONS
XPSWMM Phase 2 ModelBCWMC
FIGURE 2-4
Subwatersheds!
<
Outfalls to MississippiLegal Boundary
!;N0 1,000 2,000
Feet
Aerial Imagery: 2015 FSA
19
P:\Mpls\23 MN\27\2327051\WorkFiles\XP SWMM Phase II\Report\BCWMC_Ph2_XPSWMMReport_Draft_01112017.docx
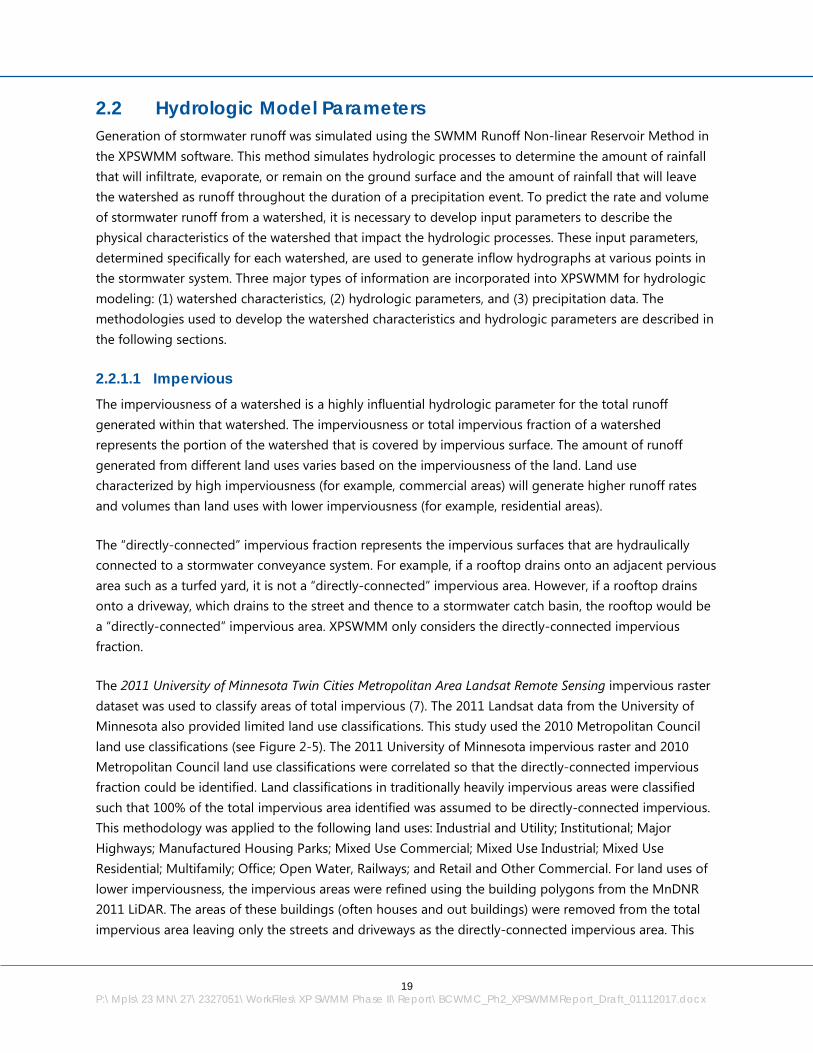
2.2 Hydrologic Model Parameters Generation of stormwater runoff was simulated using the SWMM Runoff Non-linear Reservoir Method in the XPSWMM software. This method simulates hydrologic processes to determine the amount of rainfall that will infiltrate, evaporate, or remain on the ground surface and the amount of rainfall that will leave the watershed as runoff throughout the duration of a precipitation event. To predict the rate and volume of stormwater runoff from a watershed, it is necessary to develop input parameters to describe the physical characteristics of the watershed that impact the hydrologic processes. These input parameters, determined specifically for each watershed, are used to generate inflow hydrographs at various points in the stormwater system. Three major types of information are incorporated into XPSWMM for hydrologic modeling: (1) watershed characteristics, (2) hydrologic parameters, and (3) precipitation data. The methodologies used to develop the watershed characteristics and hydrologic parameters are described in the following sections.
2.2.1.1 Impervious The imperviousness of a watershed is a highly influential hydrologic parameter for the total runoff generated within that watershed. The imperviousness or total impervious fraction of a watershed represents the portion of the watershed that is covered by impervious surface. The amount of runoff generated from different land uses varies based on the imperviousness of the land. Land use characterized by high imperviousness (for example, commercial areas) will generate higher runoff rates and volumes than land uses with lower imperviousness (for example, residential areas).
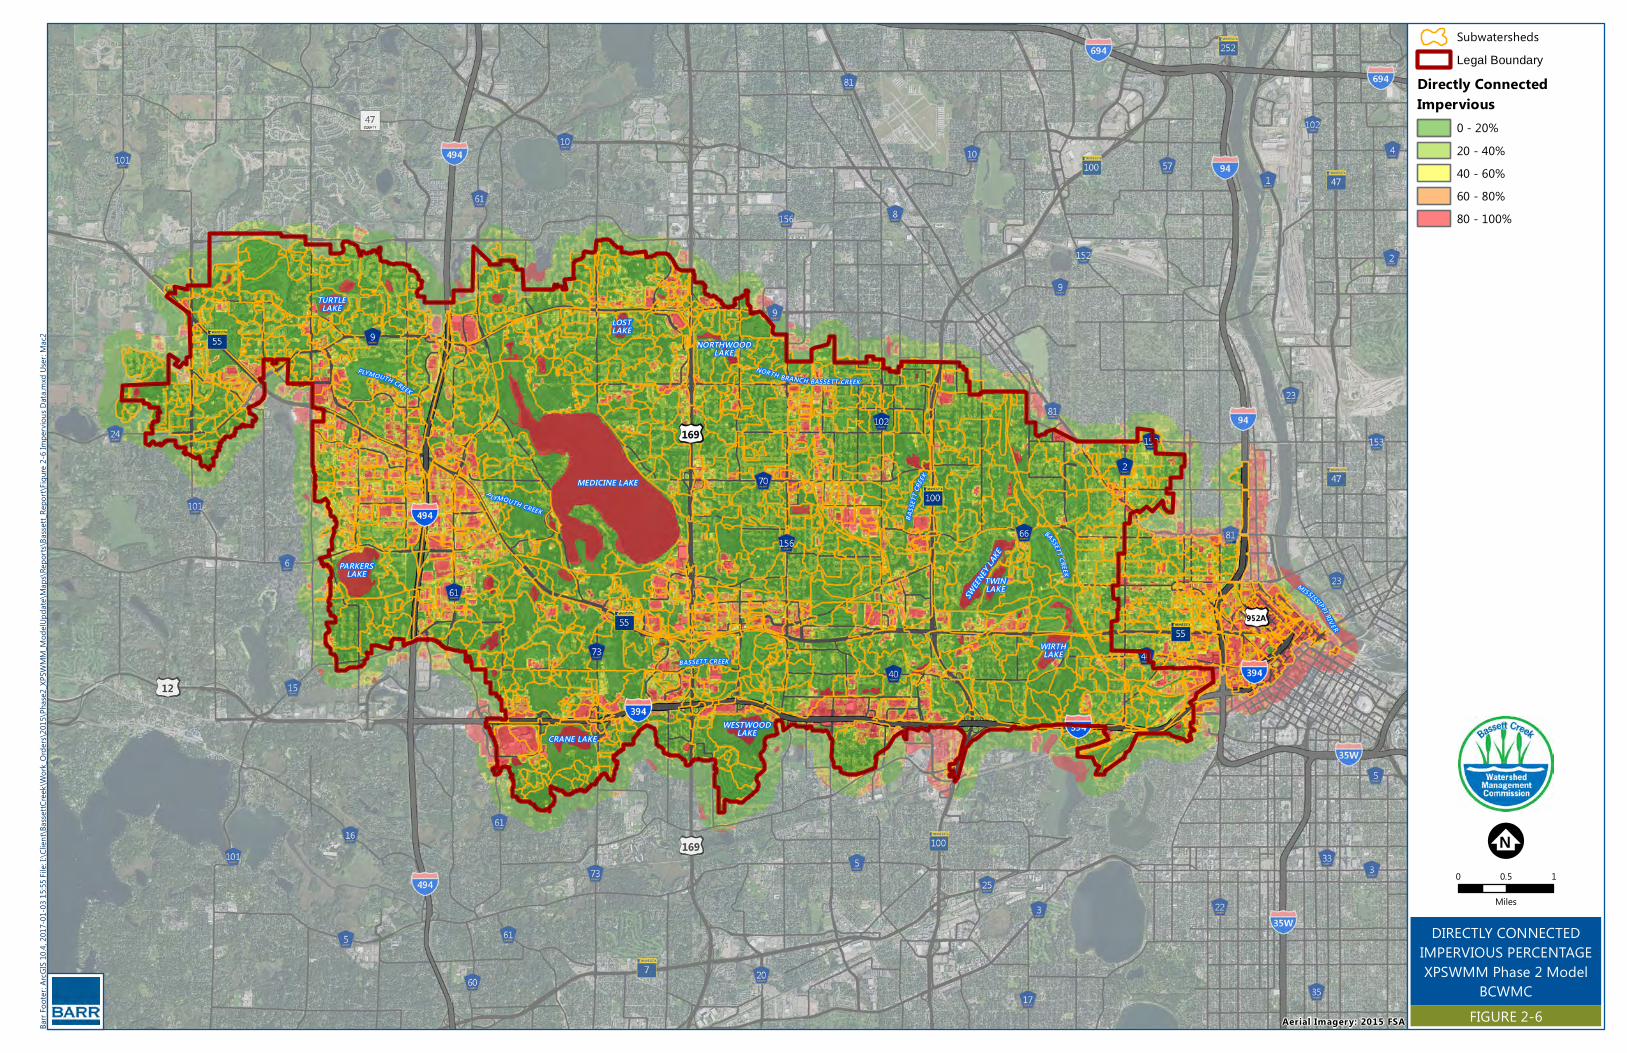
The “directly-connected” impervious fraction represents the impervious surfaces that are hydraulically connected to a stormwater conveyance system. For example, if a rooftop drains onto an adjacent pervious area such as a turfed yard, it is not a “directly-connected” impervious area. However, if a rooftop drains onto a driveway, which drains to the street and thence to a stormwater catch basin, the rooftop would be a “directly-connected” impervious area. XPSWMM only considers the directly-connected impervious fraction.
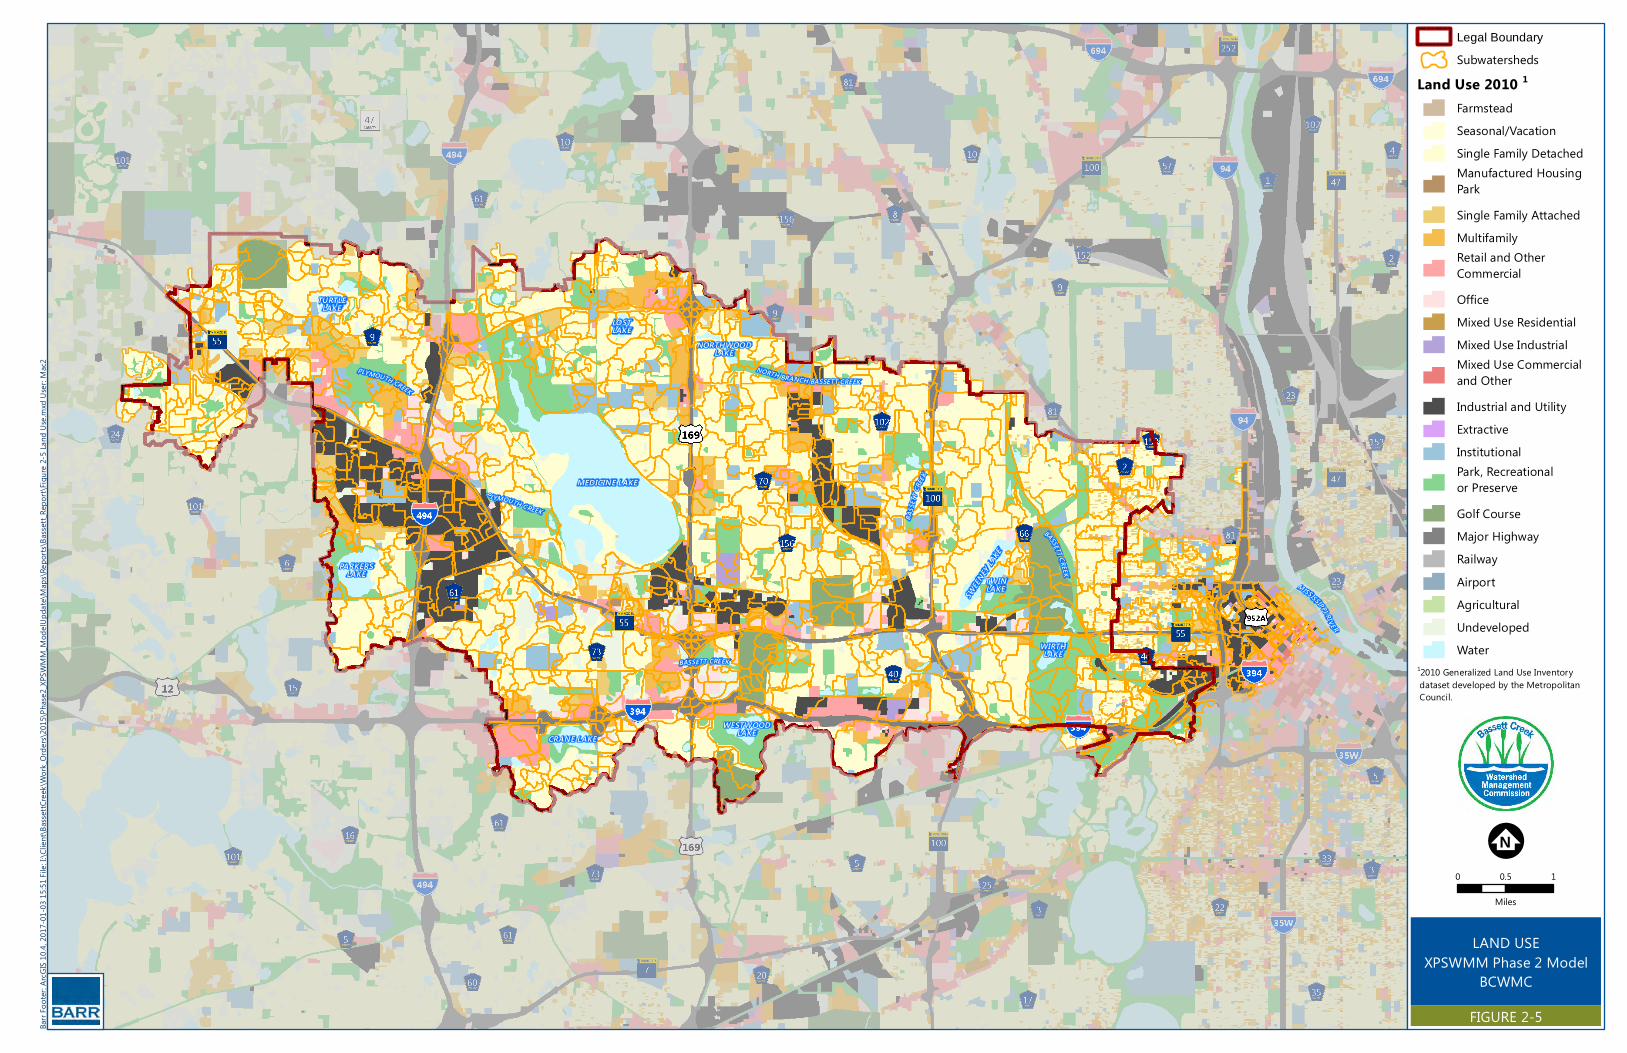
The 2011 University of Minnesota Twin Cities Metropolitan Area Landsat Remote Sensing impervious raster dataset was used to classify areas of total impervious (7). The 2011 Landsat data from the University of Minnesota also provided limited land use classifications. This study used the 2010 Metropolitan Council land use classifications (see Figure 2-5). The 2011 University of Minnesota impervious raster and 2010 Metropolitan Council land use classifications were correlated so that the directly-connected impervious fraction could be identified. Land classifications in traditionally heavily impervious areas were classified such that 100% of the total impervious area identified was assumed to be directly-connected impervious. This methodology was applied to the following land uses: Industrial and Utility; Institutional; Major Highways; Manufactured Housing Parks; Mixed Use Commercial; Mixed Use Industrial; Mixed Use Residential; Multifamily; Office; Open Water, Railways; and Retail and Other Commercial. For land uses of lower imperviousness, the impervious areas were refined using the building polygons from the MnDNR 2011 LiDAR. The areas of these buildings (often houses and out buildings) were removed from the total impervious area leaving only the streets and driveways as the directly-connected impervious area. This
20
P:\Mpls\23 MN\27\2327051\WorkFiles\XP SWMM Phase II\Report\BCWMC_Ph2_XPSWMMReport_Draft_01112017.docx
methodology was applied to the following land uses: Agricultural; Farmstead; Golf courses, Parks; Recreational, or Preserve; Single Family Attached, Single Family Detached, and Undeveloped areas.
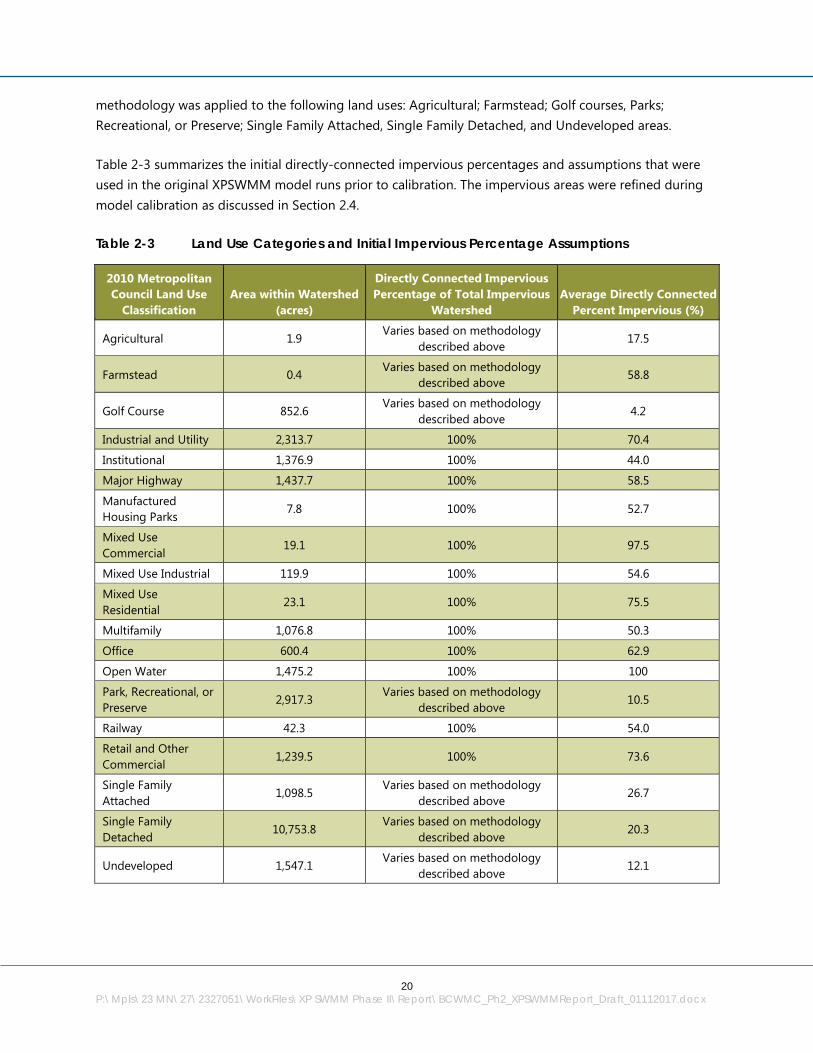
Table 2-3 summarizes the initial directly-connected impervious percentages and assumptions that were used in the original XPSWMM model runs prior to calibration. The impervious areas were refined during model calibration as discussed in Section 2.4.
Table 2-3 Land Use Categories and Initial Impervious Percentage Assumptions
2010 Metropolitan Council Land Use
Classification Area within Watershed
(acres)
Directly Connected Impervious Percentage of Total Impervious
Watershed Average Directly Connected
Percent Impervious (%)
Agricultural 1.9 Varies based on methodology
described above 17.5
Farmstead 0.4 Varies based on methodology
described above 58.8
Golf Course 852.6 Varies based on methodology
described above 4.2
Industrial and Utility 2,313.7 100% 70.4
Institutional 1,376.9 100% 44.0
Major Highway 1,437.7 100% 58.5
Manufactured Housing Parks
7.8 100% 52.7
Mixed Use Commercial
19.1 100% 97.5
Mixed Use Industrial 119.9 100% 54.6
Mixed Use Residential
23.1 100% 75.5
Multifamily 1,076.8 100% 50.3
Office 600.4 100% 62.9
Open Water 1,475.2 100% 100
Park, Recreational, or Preserve
2,917.3 Varies based on methodology
described above 10.5
Railway 42.3 100% 54.0
Retail and Other Commercial
1,239.5 100% 73.6
Single Family Attached
1,098.5 Varies based on methodology
described above 26.7
Single Family Detached
10,753.8 Varies based on methodology
described above 20.3
Undeveloped 1,547.1 Varies based on methodology
described above 12.1
MEDICINE LAKE
NORTHWOODLAKE
LOSTLAKE
SWEEN
EY LA
KE
TURTLELAKE
TWINLAKE
WESTWOODLAKE
WIRTHLAKE
PARKERSLAKE
CRANE LAKE
BASS
ETT C
REEK
BASSETT CREEK
PLYMOUTH CREEK
BASSETT CREEK
P LYMOUTH CREEK
BASSETT CREEKBRANCHNORTH
MISSISSIPPI RIVE R
Barr
Foote
r: ArcG
IS 10
.4, 20
17-01
-03 15
:51 Fi
le: I:\
Clien
t\Bass
ettCre
ek\W
ork_O
rders\
2015
\Pha
se2_X
PSWM
M_Mo
delUp
date\
Maps
\Repo
rts\B
assett
_Rep
ort\F
igure
2-5 La
nd U
se.mx
d User
: Mac2
LAND USEXPSWMM Phase 2 Model
BCWMC
FIGURE 2-5
Legal Boundary
SubwatershedsLand Use 2010 1
FarmsteadSeasonal/VacationSingle Family DetachedManufactured HousingParkSingle Family AttachedMultifamilyRetail and OtherCommercialOfficeMixed Use ResidentialMixed Use IndustrialMixed Use Commercialand OtherIndustrial and UtilityExtractiveInstitutionalPark, Recreationalor PreserveGolf CourseMajor HighwayRailwayAirportAgriculturalUndevelopedWater
!;N0 0.5 1
Miles
12010 Generalized Land Use Inventory dataset developed by the Metropolitan Council.
MEDICINE LAKE
NORTHWOODLAKE
LOSTLAKE
SWEEN
EY LA
KE
TURTLELAKE
TWINLAKE
WESTWOODLAKE
WIRTHLAKE
PARKERSLAKE
CRANE LAKE
BASS
ETT C
REEK
BASSETT CREEK
PLYMOUTH CREEK
BASSETT CREEK
P LYMOUTH CREEK
BASSETT CREEKBRANCHNORTH
MISSISSIPPI RIVER
Barr F
ooter
: ArcG
IS 10
.4, 20
17-01
-03 15
:55 Fi
le: I:\C
lient\
Basse
ttCree
k\Work
_Orde
rs\20
15\Ph
ase2_X
PSWM
M_Mo
delUp
date\
Maps
\Repo
rts\Ba
ssett_
Repo
rt\Fig
ure 2-
6 Imp
erviou
s Data
.mxd
User:
Mac2
DIRECTLY CONNECTEDIMPERVIOUS PERCENTAGEXPSWMM Phase 2 Model
BCWMCFIGURE 2-6
SubwatershedsLegal Boundary
Directly ConnectedImpervious
0 - 20%20 - 40%40 - 60%60 - 80%80 - 100%
!;N0 0.5 1
Miles
Aerial Imagery: 2015 FSA
23
P:\Mpls\23 MN\27\2327051\WorkFiles\XP SWMM Phase II\Report\BCWMC_Ph2_XPSWMMReport_Draft_01112017.docx
2.2.1.2 Watershed Width In XPSWMM, surface runoff from subwatersheds is routed to the stormwater system via the nonlinear reservoir methodology. During each time-step XPSWMM calculates the surface runoff from the watershed.
The flow rate from a subwatershed is directly related to the watershed slope, overland flow surface roughness, depression storage, and width parameter. As the subwatershed width increases, the flow rate from the subwatershed also increases. With a higher runoff rate, less runoff is stored within the subwatershed and less infiltration occurs. This increases the runoff volume for a given rainfall event. However, as the subwatershed width decreases the opposite occurs; the flow rate from the subwatershed decreases, infiltration increases, and less runoff volume is generated.
The XPSWMM User’s Manual suggests estimating the subwatershed width by dividing the subwatershed area by the longest flow path (8). Initial subwatershed widths were estimated using this methodology. The longest flow path of each subwatershed was digitized based on the MnDNR 2011 one meter LiDAR data and the available storm sewer information.
Watershed widths were revised during the calibration, as discussed in Section 2.4.
2.2.1.3 Watershed Slope The area-weighted average watershed slope (feet/feet) for each subwatershed was calculated using GIS and a digital elevation model (DEM) created from MnDNR LiDAR data (2011) three meter grid for Hennepin County. For comparison purposes, the subwatershed slope was also calculated using the 2011 LiDAR one meter grid data that is publically available from the MnDNR as well as the National Geospatial-Intelligence Agency (NGIA) 2008 LiDAR dataset which used 20 foot grid cells. On average the three datasets produced similar values for subwatershed slope; however, the three meter grid results were used as it reduces statistical variation of the one meter grid and is a more updated elevation dataset than the 2008 LiDAR dataset.
2.2.1.4 Infiltration Parameters (Soils and Open Water Areas)
Infiltration is the movement of water into the soil surface. For a given storm event, the infiltration rate will vary with time. The infiltration rate at the beginning of the storm is the maximum rate because the soil surface is typically drier and full of voids. As the storm event continues, the infiltration rate will gradually decrease as the voids fill with water. For long storms, the infiltration rate will reach a constant value—the minimum infiltration rate or the soil’s hydraulic conductivity. The Horton infiltration equation was used to simulate the relationship between infiltration rate and time. The Natural Resource Conservation Service (NRCS) soil survey geographic database (SSURGO) released in 2014 was used to determine the hydrologic soil group classifications of the soils within the study area. Between 2013 and 2014, the NRCS revised many of the soils from B soils classification to C soils classification (reduced infiltration capacity).
24
P:\Mpls\23 MN\27\2327051\WorkFiles\XP SWMM Phase II\Report\BCWMC_Ph2_XPSWMMReport_Draft_01112017.docx
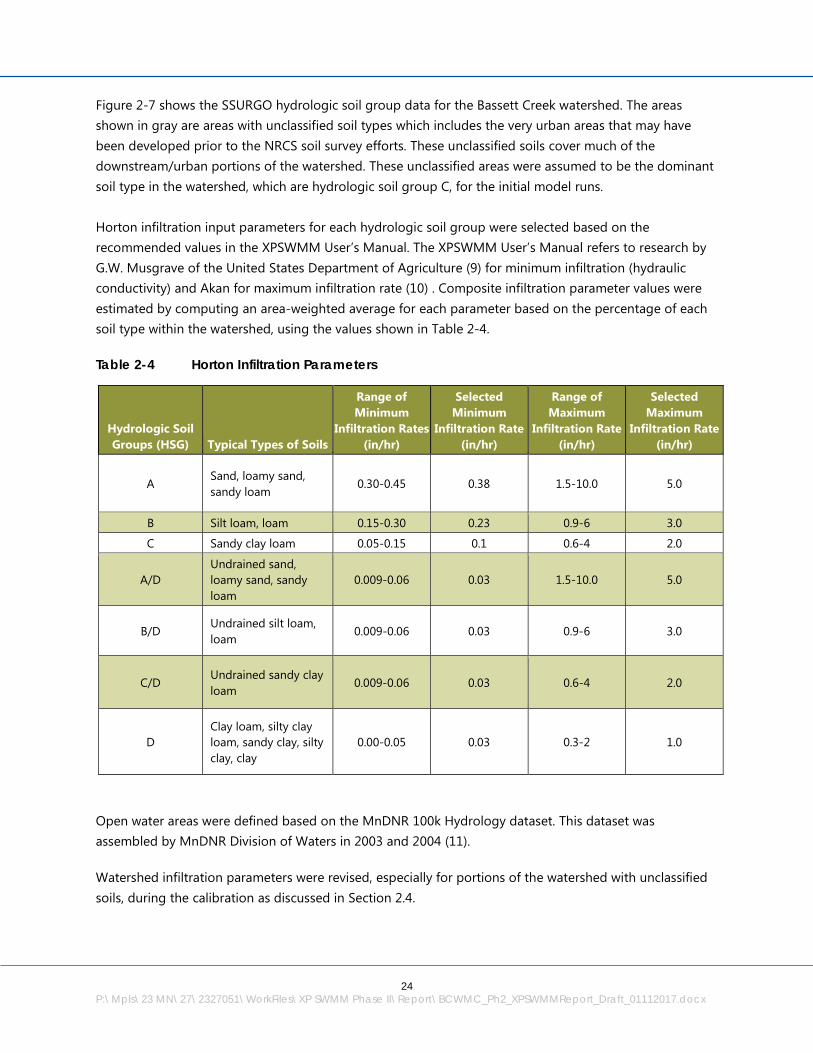
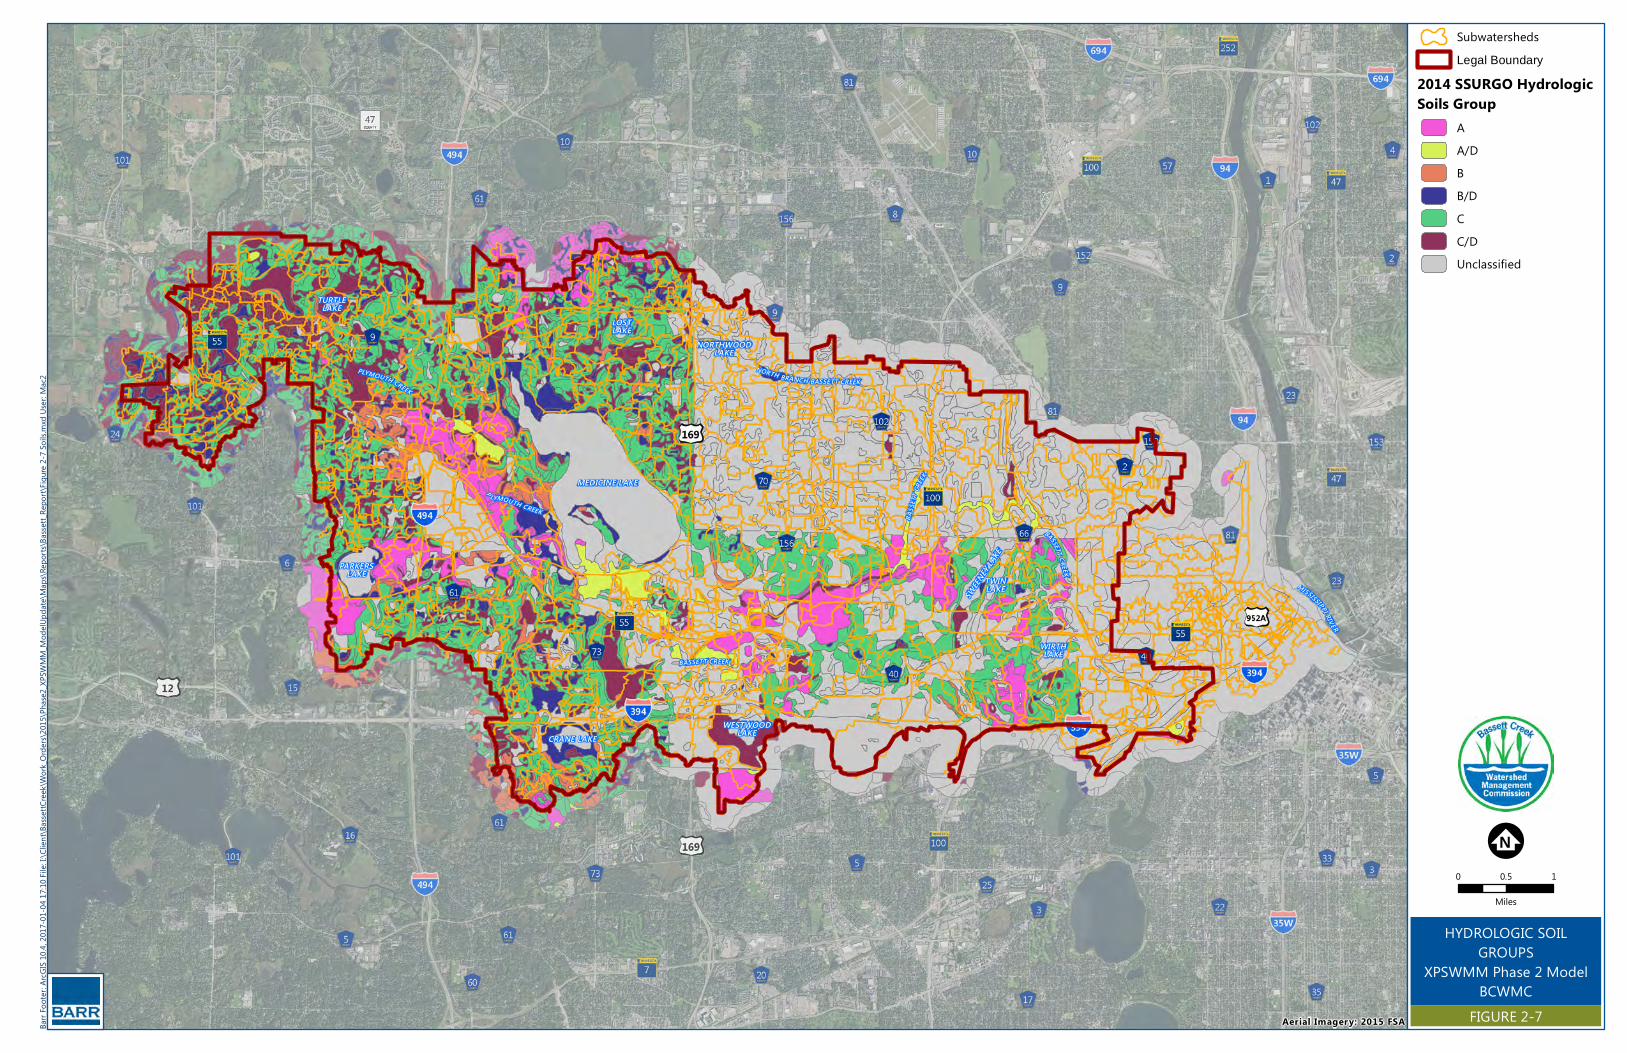
Figure 2-7 shows the SSURGO hydrologic soil group data for the Bassett Creek watershed. The areas shown in gray are areas with unclassified soil types which includes the very urban areas that may have been developed prior to the NRCS soil survey efforts. These unclassified soils cover much of the downstream/urban portions of the watershed. These unclassified areas were assumed to be the dominant soil type in the watershed, which are hydrologic soil group C, for the initial model runs. Horton infiltration input parameters for each hydrologic soil group were selected based on the recommended values in the XPSWMM User’s Manual. The XPSWMM User’s Manual refers to research by G.W. Musgrave of the United States Department of Agriculture (9) for minimum infiltration (hydraulic conductivity) and Akan for maximum infiltration rate (10) . Composite infiltration parameter values were estimated by computing an area-weighted average for each parameter based on the percentage of each soil type within the watershed, using the values shown in Table 2-4.
Table 2-4 Horton Infiltration Parameters
Hydrologic Soil Groups (HSG) Typical Types of Soils
Range of Minimum
Infiltration Rates (in/hr)
Selected Minimum
Infiltration Rate (in/hr)
Range of Maximum
Infiltration Rate (in/hr)
Selected Maximum
Infiltration Rate (in/hr)
A Sand, loamy sand, sandy loam
0.30-0.45 0.38 1.5-10.0 5.0
B Silt loam, loam 0.15-0.30 0.23 0.9-6 3.0
C Sandy clay loam 0.05-0.15 0.1 0.6-4 2.0
A/D Undrained sand, loamy sand, sandy loam
0.009-0.06 0.03 1.5-10.0 5.0
B/D Undrained silt loam, loam
0.009-0.06 0.03 0.9-6 3.0
C/D Undrained sandy clay loam
0.009-0.06 0.03 0.6-4 2.0
D Clay loam, silty clay loam, sandy clay, silty clay, clay
0.00-0.05 0.03 0.3-2 1.0
Open water areas were defined based on the MnDNR 100k Hydrology dataset. This dataset was assembled by MnDNR Division of Waters in 2003 and 2004 (11).
Watershed infiltration parameters were revised, especially for portions of the watershed with unclassified soils, during the calibration as discussed in Section 2.4.
MEDICINE LAKE
NORTHWOODLAKE
LOSTLAKE
SWEEN
EY LA
KE
TURTLELAKE
TWINLAKE
WESTWOODLAKE
WIRTHLAKE
PARKERSLAKE
CRANE LAKE
BASS
ETT C
REEK
BASSETT CREEK
PLYMOUTH CREEK
BASSETT CREEK
P LYMOUTH CREEK
BASSETT CREEKBRANCHNORTH
MISSISSIPPI RIVER
Barr F
ooter
: ArcG
IS 10
.4, 20
17-01
-04 17
:10 Fi
le: I:\C
lient\
Basse
ttCree
k\Work
_Orde
rs\20
15\Ph
ase2_X
PSWM
M_Mo
delUp
date\
Maps
\Repo
rts\Ba
ssett_
Repo
rt\Fig
ure 2-
7 Soil
s.mxd
User:
Mac2
HYDROLOGIC SOILGROUPS
XPSWMM Phase 2 ModelBCWMC
FIGURE 2-7
SubwatershedsLegal Boundary
2014 SSURGO HydrologicSoils Group
AA/DBB/DCC/DUnclassified
!;N0 0.5 1
Miles
Aerial Imagery: 2015 FSA
26
P:\Mpls\23 MN\27\2327051\WorkFiles\XP SWMM Phase II\Report\BCWMC_Ph2_XPSWMMReport_Draft_01112017.docx
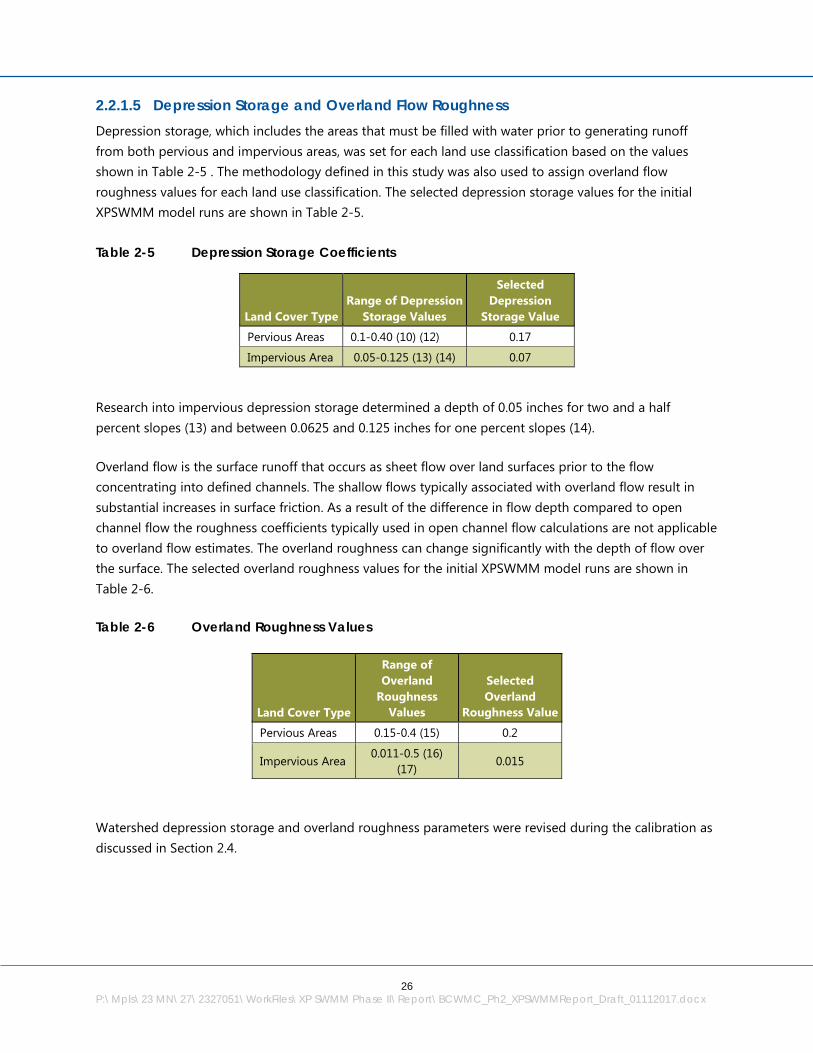
2.2.1.5 Depression Storage and Overland Flow Roughness Depression storage, which includes the areas that must be filled with water prior to generating runoff from both pervious and impervious areas, was set for each land use classification based on the values shown in Table 2-5 . The methodology defined in this study was also used to assign overland flow roughness values for each land use classification. The selected depression storage values for the initial XPSWMM model runs are shown in Table 2-5. Table 2-5 Depression Storage Coefficients
Land Cover Type Range of Depression
Storage Values
Selected Depression
Storage Value
Pervious Areas 0.1-0.40 (10) (12) 0.17
Impervious Area 0.05-0.125 (13) (14) 0.07 Research into impervious depression storage determined a depth of 0.05 inches for two and a half percent slopes (13) and between 0.0625 and 0.125 inches for one percent slopes (14).
Overland flow is the surface runoff that occurs as sheet flow over land surfaces prior to the flow concentrating into defined channels. The shallow flows typically associated with overland flow result in substantial increases in surface friction. As a result of the difference in flow depth compared to open channel flow the roughness coefficients typically used in open channel flow calculations are not applicable to overland flow estimates. The overland roughness can change significantly with the depth of flow over the surface. The selected overland roughness values for the initial XPSWMM model runs are shown in Table 2-6.
Table 2-6 Overland Roughness Values
Land Cover Type
Range of Overland
Roughness Values
Selected Overland
Roughness Value
Pervious Areas 0.15-0.4 (15) 0.2
Impervious Area 0.011-0.5 (16)
(17) 0.015
Watershed depression storage and overland roughness parameters were revised during the calibration as discussed in Section 2.4.
27
P:\Mpls\23 MN\27\2327051\WorkFiles\XP SWMM Phase II\Report\BCWMC_Ph2_XPSWMMReport_Draft_01112017.docx
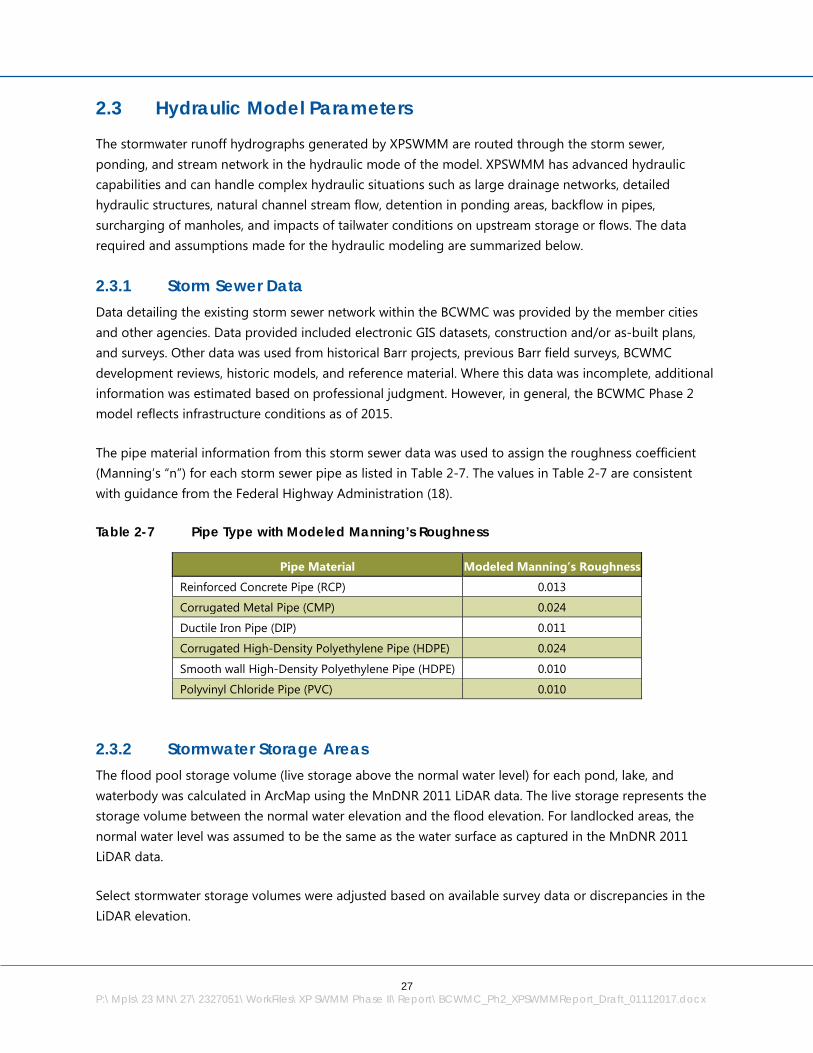
2.3 Hydraulic Model Parameters
The stormwater runoff hydrographs generated by XPSWMM are routed through the storm sewer, ponding, and stream network in the hydraulic mode of the model. XPSWMM has advanced hydraulic capabilities and can handle complex hydraulic situations such as large drainage networks, detailed hydraulic structures, natural channel stream flow, detention in ponding areas, backflow in pipes, surcharging of manholes, and impacts of tailwater conditions on upstream storage or flows. The data required and assumptions made for the hydraulic modeling are summarized below.
2.3.1 Storm Sewer Data Data detailing the existing storm sewer network within the BCWMC was provided by the member cities and other agencies. Data provided included electronic GIS datasets, construction and/or as-built plans, and surveys. Other data was used from historical Barr projects, previous Barr field surveys, BCWMC development reviews, historic models, and reference material. Where this data was incomplete, additional information was estimated based on professional judgment. However, in general, the BCWMC Phase 2 model reflects infrastructure conditions as of 2015.
The pipe material information from this storm sewer data was used to assign the roughness coefficient (Manning’s “n”) for each storm sewer pipe as listed in Table 2-7. The values in Table 2-7 are consistent with guidance from the Federal Highway Administration (18).
Table 2-7 Pipe Type with Modeled Manning’s Roughness
Pipe Material Modeled Manning’s Roughness
Reinforced Concrete Pipe (RCP) 0.013
Corrugated Metal Pipe (CMP) 0.024
Ductile Iron Pipe (DIP) 0.011
Corrugated High-Density Polyethylene Pipe (HDPE) 0.024
Smooth wall High-Density Polyethylene Pipe (HDPE) 0.010
Polyvinyl Chloride Pipe (PVC) 0.010
2.3.2 Stormwater Storage Areas The flood pool storage volume (live storage above the normal water level) for each pond, lake, and waterbody was calculated in ArcMap using the MnDNR 2011 LiDAR data. The live storage represents the storage volume between the normal water elevation and the flood elevation. For landlocked areas, the normal water level was assumed to be the same as the water surface as captured in the MnDNR 2011 LiDAR data.
Select stormwater storage volumes were adjusted based on available survey data or discrepancies in the LiDAR elevation.
28
P:\Mpls\23 MN\27\2327051\WorkFiles\XP SWMM Phase II\Report\BCWMC_Ph2_XPSWMMReport_Draft_01112017.docx
2.3.3 Stream Cross Sections The majority of the stream cross sections used in the Phase 2 XPSWMM model utilized cross sections in the same locations as the USACE HEC-2 model. Cross sections from the USACE HEC-2 models were georeferenced in GIS and the cross sections were recut from the MnDNR 2011 LiDAR data in the floodplain areas while the channel bathymetry (e.g. between the banks) was replaced with the USACE HEC-2 model information which is based on surveys of the creek.
Manning’s roughness values were assigned based on apparent vegetation and land use. Guidance on the selection of Manning’s roughness was taken from the USACE HEC-RAS Reference Manual (19). Channel roughness values vary between 0.030 and 0.050 for Plymouth Creek, 0.035 and 0.05 for North Branch Bassett Creek, and 0.025 and 0.035 for Bassett Creek Main Stem. Floodplain roughness values vary between 0.06 and 0.12 for Plymouth Creek, are 0.08 for North Branch Bassett Creek, and vary between 0.05 and 0.08 for Bassett Creek Main Stem.
2.3.4 Overland Flow Network An overland flow channel network was included in the XPSWMM model to account for runoff that surcharges from the storm sewer system or overflows from waterbodies and other storage areas and flows along streets or natural drainage channels. The characteristics of the overland flow channels were approximated utilizing the MnDNR 2011 LiDAR data and aerial photos of the area.

Barr F
ooter
: ArcG
IS 10
.4, 20
17-01
-03 15
:57 Fi
le: I:\C
lient\
Basse
ttCree
k\Work
_Orde
rs\20
15\Ph
ase2_X
PSWM
M_Mo
delUp
date\
Maps
\Repo
rts\Ba
ssett_
Repo
rt\Fig
ure 2-
8 Mod
eled C
onve
yanc
e Syst
em.m
xd Us
er: M
ac2
MODELED CONVEYANCESYSTEM
XPSWMM Phase 2 ModelBCWMC
FIGURE 2-8
Legal Boundary
! XPSWMM NodesXPSWMM Links
Subwatershed GroupingsBassett Creek Main Stem(Downstream)Bassett Creek Main Stem(Midstream)Bassett Creek Main Stem(Upstream) EastBassett Creek Main Stem(Upstream) WestBassett Creek Park PondCrane LakeGrimes LakeLost LakeMedicine Lake DirectMedicine Lake NEMedicine Lake NorthMedicine Lake SouthNorthwood LakeParkers LakeParkers Lake East AreaPlymouth Creek CentralPlymouth Creek EastPlymouth Creek WestSweeney LakeTurtle LakeWestwood LakeWirth Lake
!;N0 0.5 1
Miles
Aerial Imagery: 2015 FSA
30
P:\Mpls\23 MN\27\2327051\WorkFiles\XP SWMM Phase II\Report\BCWMC_Ph2_XPSWMMReport_Draft_01112017.docx
2.4 Model Calibration and Validation A discussion of the BCWMC Phase 2 XPSWMM model and calibration and validation is presented in the following sections.
2.4.1 Calibration and Validation Event Precipitation The Phase 2 XPSWMM model was calibrated to two independent storm events and validated to one additional event. The calibration events included a smaller storm event that is dominated by runoff from impervious surfaces and a larger storm event that has runoff from both impervious and pervious surfaces. The validation event selected has a precipitation depth that falls between the two calibration events.
Due to the availability of rainfall and stream gage data and the breakdown of the project scope and schedule, the calibration of the BCWMC model was split at Medicine Lake. The XPSWMM model upstream of Medicine Lake was calibrated and validated in 2015, based on storm events and monitoring data from 2013. The portion of the model downstream of Medicine Lake was calibrated and validated in 2016, based on storm events and monitoring data from 2015.
The data sources and date ranges of provided gage data is shown in Table 2-8. The location of the gages described in Table 2-8 is shown in Figure 2-9.
Table 2-8 Dates of Provided Stream and Water Body Monitoring Data
Gage Name Reach Data Available Data Source First Date of
Provided Data Final Date of
Provided Data
PL1 (Parkers Lake)
Parkers Lake Flow Three Rivers Park District
4/17/2013 10/28/2014
PC2 (Plymouth Creek)
Plymouth Creek Flow Three Rivers Park District
4/7/2010 10/23/2014
Water Body Elevation Data
Full List of Waterbodies is described in Section 2.1.5.3
Elevation BCWMC 11/18/1972 9/30/2015
Wisconsin Avenue
Main Stem Bassett Creek
Elevation City of Golden
Valley 9/1/2014 5/11/2016
Douglas Drive North Branch Bassett Creek
Water Level BCWMC 6/28/2015 11/5/2015
WOMP Main Stem Bassett Creek
Elevation & Flow
BCWMC/ Metropolitan
Council 1/1/2013 12/31/2015 1
1 All 2015 data provided at the WOMP Gage are considered preliminary
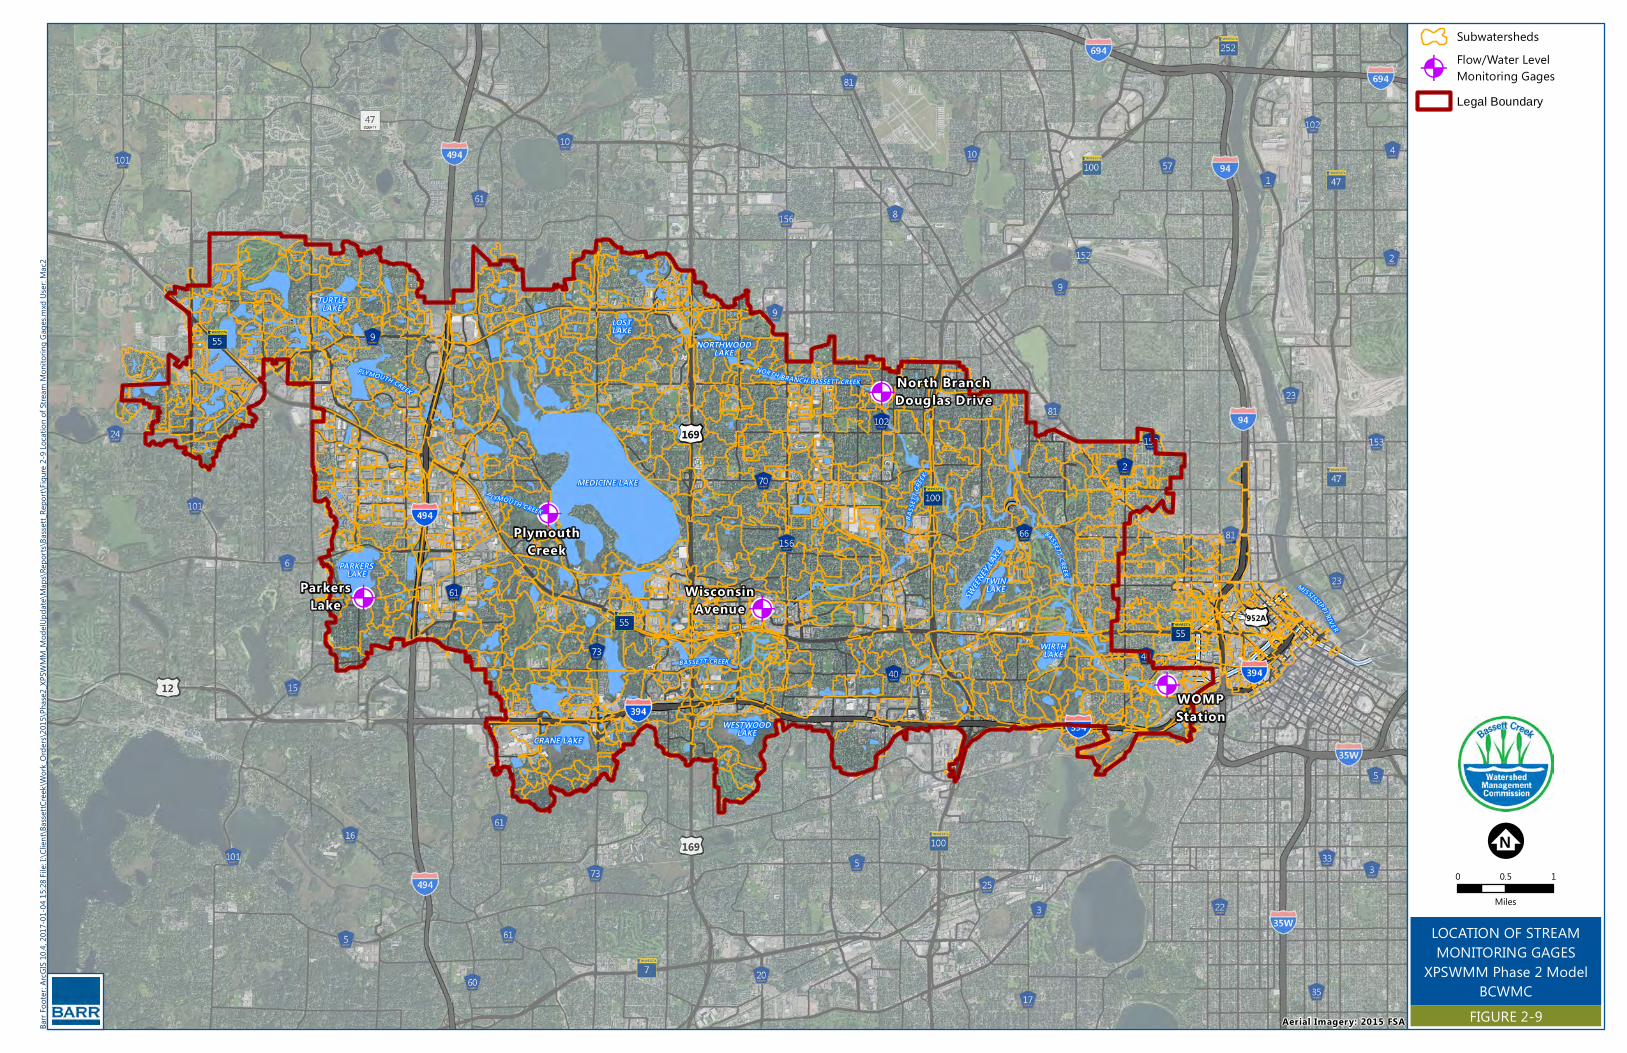
!A
!A
!A
!A
!A
MEDICINE LAKE
NORTHWOODLAKE
LOSTLAKE
SWEEN
EY LA
KE
TURTLELAKE
TWINLAKE
WESTWOODLAKE
WIRTHLAKE
PARKERSLAKE
CRANE LAKE
BASS
ETT C
REEK
BASSETT CREEK
PLYMOUTH CREEK
BASSETT CREEK
P LYMOUTH CREEK
BASSETT CREEKBRANCHNORTH
MISSISSIPPI RIVER
ParkersLake
PlymouthCreek
North BranchDouglas Drive
WisconsinAvenue
WOMPStation
Barr F
ooter
: ArcG
IS 10
.4, 20
17-01
-04 15
:28 Fi
le: I:\C
lient\
Basse
ttCree
k\Work
_Orde
rs\20
15\Ph
ase2_X
PSWM
M_Mo
delUp
date\
Maps
\Repo
rts\Ba
ssett_
Repo
rt\Fig
ure 2-
9 Loc
ation
of St
ream
Monit
oring
Gage
s.mxd
User:
Mac
2
LOCATION OF STREAMMONITORING GAGES
XPSWMM Phase 2 ModelBCWMC
FIGURE 2-9
Subwatersheds
!AFlow/Water LevelMonitoring GagesLegal Boundary
!;N0 0.5 1
Miles
Aerial Imagery: 2015 FSA
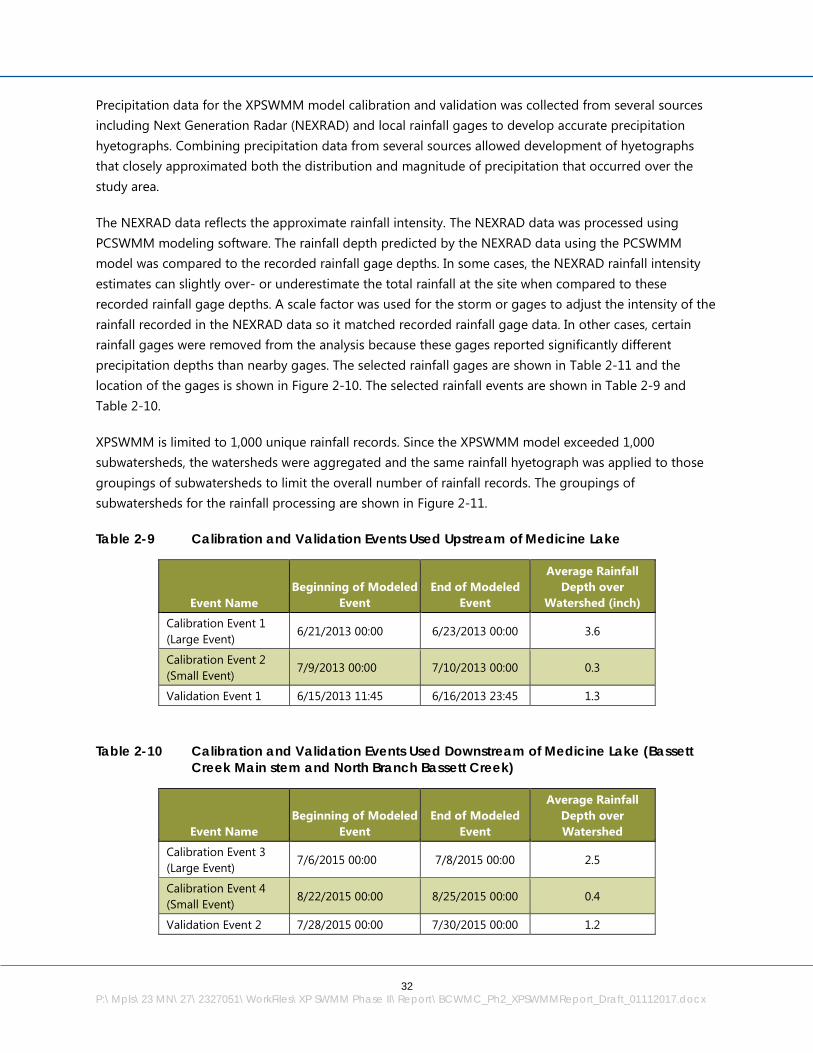
32
P:\Mpls\23 MN\27\2327051\WorkFiles\XP SWMM Phase II\Report\BCWMC_Ph2_XPSWMMReport_Draft_01112017.docx
Precipitation data for the XPSWMM model calibration and validation was collected from several sources including Next Generation Radar (NEXRAD) and local rainfall gages to develop accurate precipitation hyetographs. Combining precipitation data from several sources allowed development of hyetographs that closely approximated both the distribution and magnitude of precipitation that occurred over the study area.
The NEXRAD data reflects the approximate rainfall intensity. The NEXRAD data was processed using PCSWMM modeling software. The rainfall depth predicted by the NEXRAD data using the PCSWMM model was compared to the recorded rainfall gage depths. In some cases, the NEXRAD rainfall intensity estimates can slightly over- or underestimate the total rainfall at the site when compared to these recorded rainfall gage depths. A scale factor was used for the storm or gages to adjust the intensity of the rainfall recorded in the NEXRAD data so it matched recorded rainfall gage data. In other cases, certain rainfall gages were removed from the analysis because these gages reported significantly different precipitation depths than nearby gages. The selected rainfall gages are shown in Table 2-11 and the location of the gages is shown in Figure 2-10. The selected rainfall events are shown in Table 2-9 and Table 2-10.
XPSWMM is limited to 1,000 unique rainfall records. Since the XPSWMM model exceeded 1,000 subwatersheds, the watersheds were aggregated and the same rainfall hyetograph was applied to those groupings of subwatersheds to limit the overall number of rainfall records. The groupings of subwatersheds for the rainfall processing are shown in Figure 2-11.
Table 2-9 Calibration and Validation Events Used Upstream of Medicine Lake
Event Name Beginning of Modeled
Event End of Modeled
Event
Average Rainfall Depth over
Watershed (inch)
Calibration Event 1 (Large Event)
6/21/2013 00:00 6/23/2013 00:00 3.6
Calibration Event 2 (Small Event)
7/9/2013 00:00 7/10/2013 00:00 0.3
Validation Event 1 6/15/2013 11:45 6/16/2013 23:45 1.3
Table 2-10 Calibration and Validation Events Used Downstream of Medicine Lake (Bassett Creek Main stem and North Branch Bassett Creek)
Event Name Beginning of Modeled
Event End of Modeled
Event
Average Rainfall Depth over Watershed
Calibration Event 3 (Large Event)
7/6/2015 00:00 7/8/2015 00:00 2.5
Calibration Event 4 (Small Event)
8/22/2015 00:00 8/25/2015 00:00 0.4
Validation Event 2 7/28/2015 00:00 7/30/2015 00:00 1.2
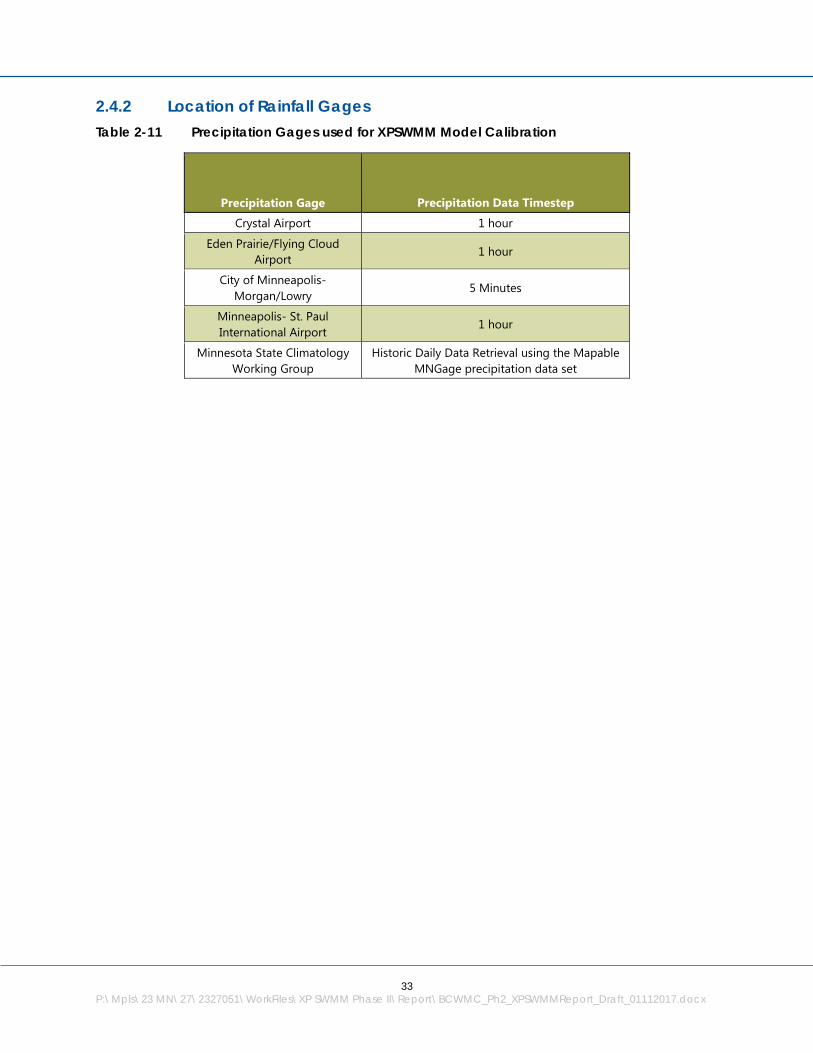
33
P:\Mpls\23 MN\27\2327051\WorkFiles\XP SWMM Phase II\Report\BCWMC_Ph2_XPSWMMReport_Draft_01112017.docx
2.4.2 Location of Rainfall Gages Table 2-11 Precipitation Gages used for XPSWMM Model Calibration
Precipitation Gage Precipitation Data Timestep
Crystal Airport 1 hour
Eden Prairie/Flying Cloud Airport
1 hour
City of Minneapolis- Morgan/Lowry
5 Minutes
Minneapolis- St. Paul International Airport
1 hour
Minnesota State Climatology Working Group
Historic Daily Data Retrieval using the Mapable MNGage precipitation data set
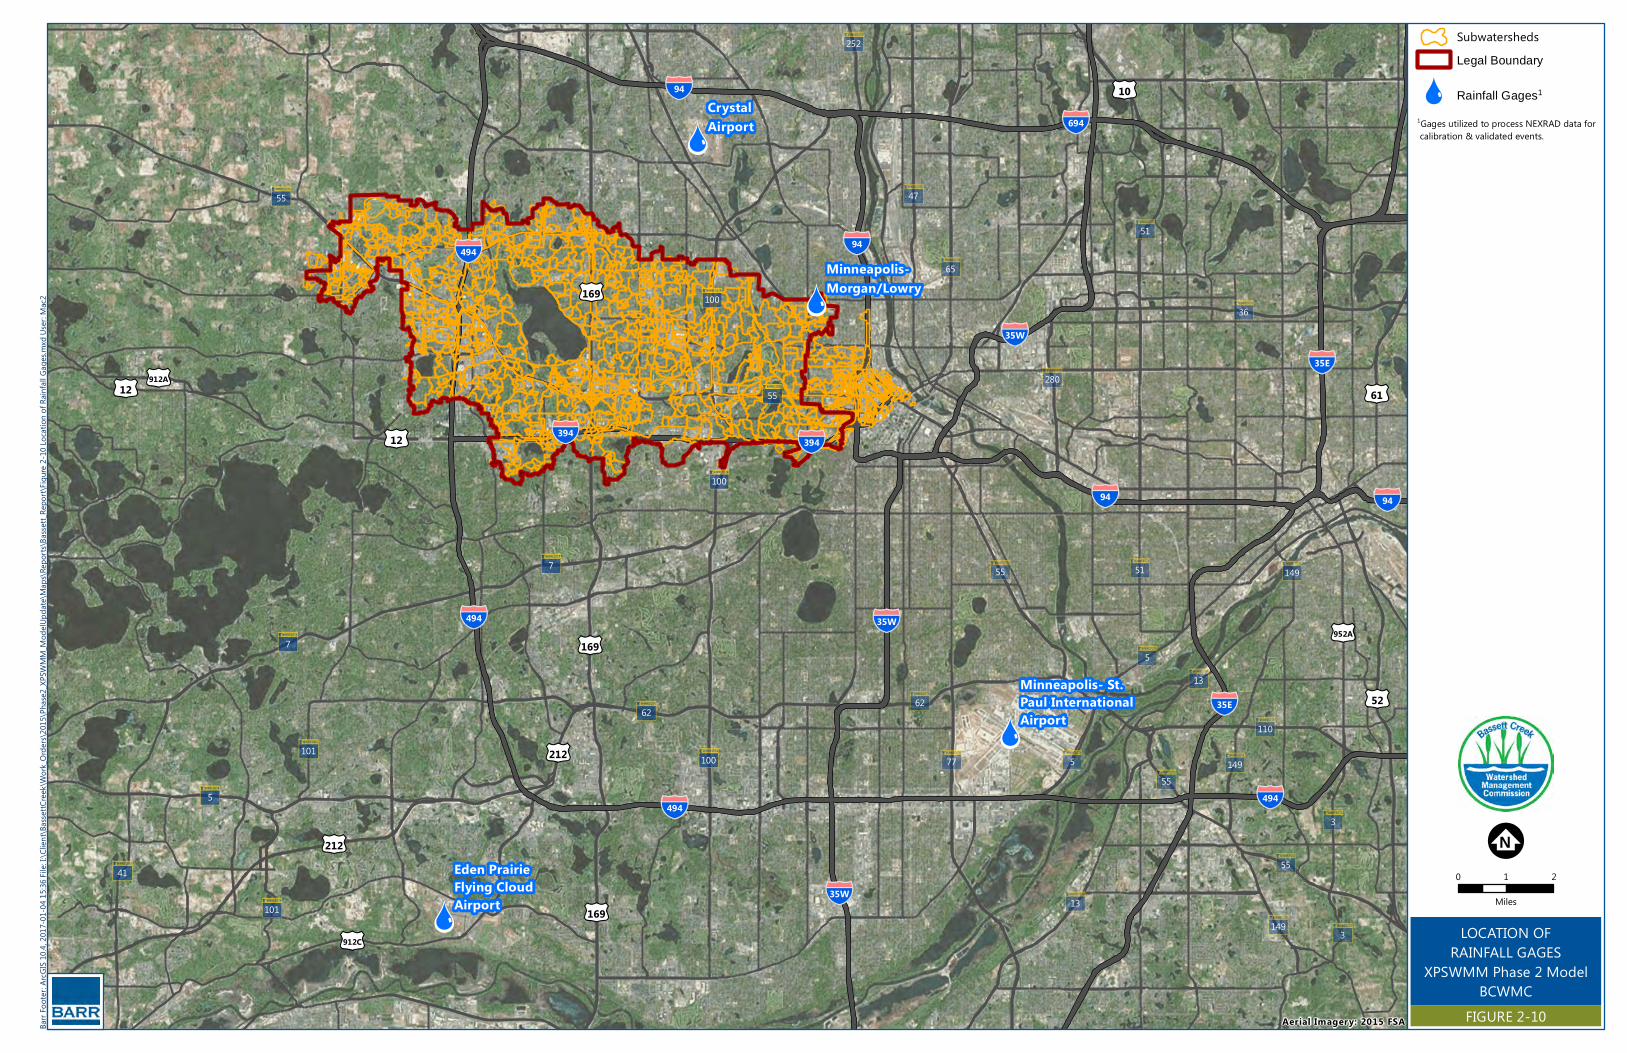
ÔÕ
ÔÕ
ÔÕ
ÔÕ
§̈¦494
§̈¦94§̈¦94
§̈¦35W
§̈¦35W
§̈¦94
§̈¦394
§̈¦94
§̈¦394
§̈¦494
§̈¦494
§̈¦35E
§̈¦694
£¤10
£¤169
£¤952A
£¤912A
£¤61
£¤912C
£¤169
£¤52
£¤12
£¤212
£¤169
£¤212
£¤212
£¤12
51 149
65
5
149
55
13
7
100
280
13
101
5101
55
51
3
100
7
252
47
62
36
41 55
149
77
55
62
100
5
110
3
55
§̈¦35W
§̈¦494
§̈¦35E
Minneapolis-Morgan/Lowry
CrystalAirport
Minneapolis- St.Paul InternationalAirport
Eden PrairieFlying CloudAirport
Barr F
ooter
: ArcG
IS 10
.4, 20
17-01
-04 15
:36 Fi
le: I:\C
lient\
Basse
ttCree
k\Work
_Orde
rs\20
15\Ph
ase2_X
PSWM
M_Mo
delUp
date\
Maps
\Repo
rts\Ba
ssett_
Repo
rt\Fig
ure 2-
10 Lo
cation
of Ra
infall
Gage
s.mxd
User:
Mac2
LOCATION OFRAINFALL GAGES
XPSWMM Phase 2 ModelBCWMC
FIGURE 2-10
SubwatershedsLegal Boundary
ÔÕ Rainfall Gages1
!;N0 1 2
Miles
1Gages utilized to process NEXRAD data for calibration & validated events.
Aerial Imagery: 2015 FSA
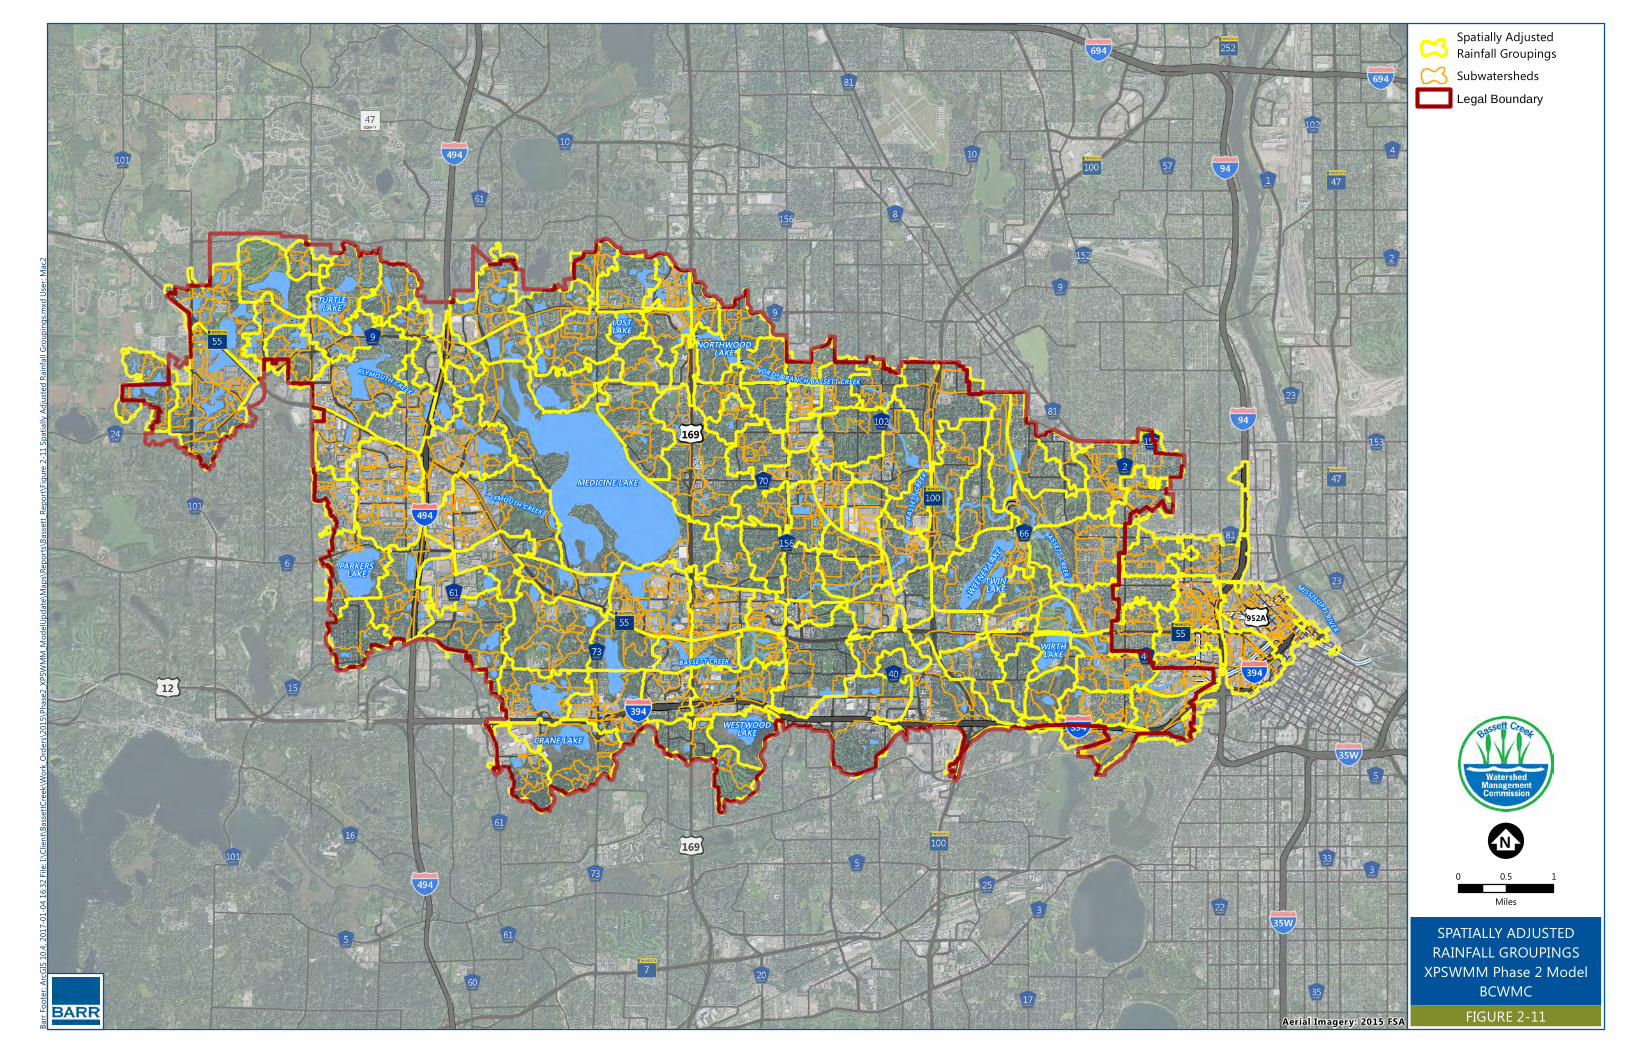
MEDICINE LAKE
NORTHWOODLAKE
LOSTLAKE
SWEEN
EY LA
KE
TURTLELAKE
TWINLAKE
WESTWOODLAKE
WIRTHLAKE
PARKERSLAKE
CRANE LAKE
BASS
ETT C
REEK
BASSETT CREEK
PLYMOUTH CREEK
BASSETT CREEK
P LYMOUTH CREEK
BASSETT CREEKBRANCHNORTH
MISSISSIPPI RIVER
Barr F
ooter
: ArcG
IS 10
.4, 20
17-01
-04 16
:32 Fi
le: I:\C
lient\
Basse
ttCree
k\Work
_Orde
rs\20
15\Ph
ase2_X
PSWM
M_Mo
delUp
date\
Maps
\Repo
rts\Ba
ssett_
Repo
rt\Fig
ure 2-
11 Sp
atiall
y Adju
sted R
ainfal
l Grou
pings
.mxd
User:
Mac2
SPATIALLY ADJUSTEDRAINFALL GROUPINGS
XPSWMM Phase 2 ModelBCWMC
FIGURE 2-11
Spatially AdjustedRainfall GroupingsSubwatershedsLegal Boundary
!;N0 0.5 1
Miles
Aerial Imagery: 2015 FSA
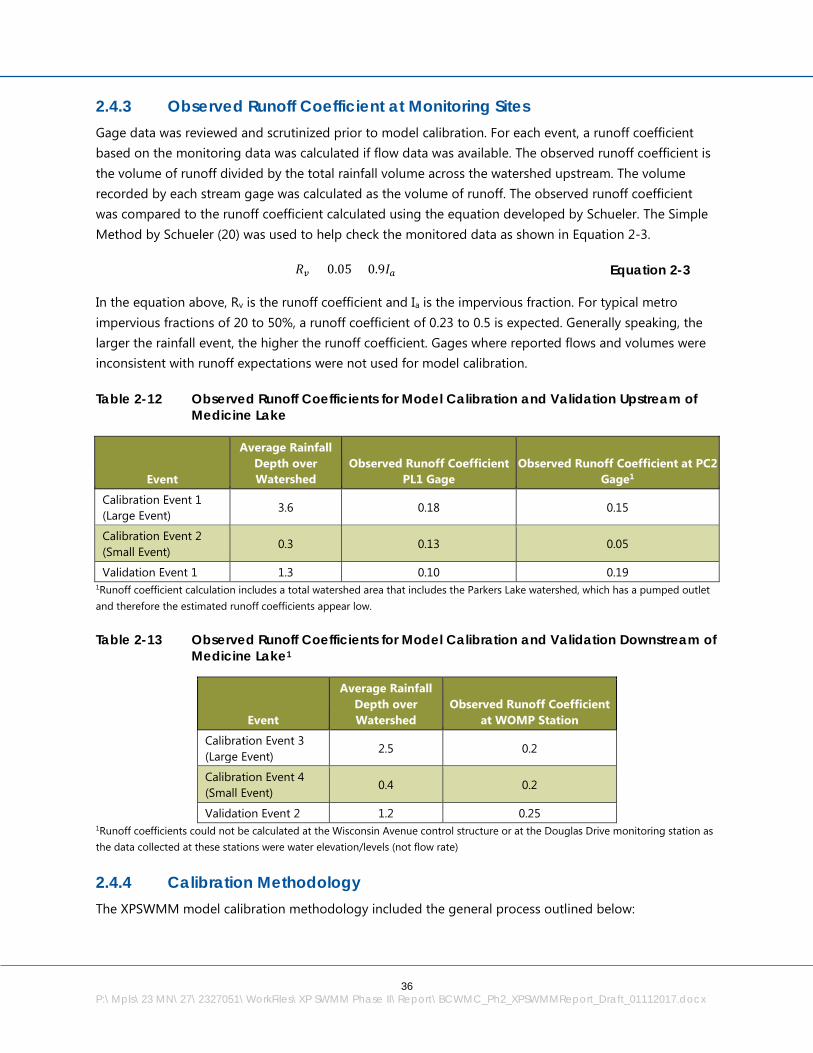
36
P:\Mpls\23 MN\27\2327051\WorkFiles\XP SWMM Phase II\Report\BCWMC_Ph2_XPSWMMReport_Draft_01112017.docx
2.4.3 Observed Runoff Coefficient at Monitoring Sites Gage data was reviewed and scrutinized prior to model calibration. For each event, a runoff coefficient based on the monitoring data was calculated if flow data was available. The observed runoff coefficient is the volume of runoff divided by the total rainfall volume across the watershed upstream. The volume recorded by each stream gage was calculated as the volume of runoff. The observed runoff coefficient was compared to the runoff coefficient calculated using the equation developed by Schueler. The Simple Method by Schueler (20) was used to help check the monitored data as shown in Equation 2-3.
𝑅𝑅𝑣𝑣 = 0.05 + 0.9𝐼𝐼𝑎𝑎 Equation 2-3
In the equation above, Rv is the runoff coefficient and Ia is the impervious fraction. For typical metro impervious fractions of 20 to 50%, a runoff coefficient of 0.23 to 0.5 is expected. Generally speaking, the larger the rainfall event, the higher the runoff coefficient. Gages where reported flows and volumes were inconsistent with runoff expectations were not used for model calibration.
Table 2-12 Observed Runoff Coefficients for Model Calibration and Validation Upstream of Medicine Lake
Event
Average Rainfall Depth over Watershed
Observed Runoff Coefficient PL1 Gage
Observed Runoff Coefficient at PC2 Gage1
Calibration Event 1 (Large Event)
3.6 0.18 0.15
Calibration Event 2 (Small Event)
0.3 0.13 0.05
Validation Event 1 1.3 0.10 0.19 1Runoff coefficient calculation includes a total watershed area that includes the Parkers Lake watershed, which has a pumped outlet and therefore the estimated runoff coefficients appear low.
Table 2-13 Observed Runoff Coefficients for Model Calibration and Validation Downstream of Medicine Lake1
Event
Average Rainfall Depth over Watershed
Observed Runoff Coefficient at WOMP Station
Calibration Event 3 (Large Event)
2.5 0.2
Calibration Event 4 (Small Event)
0.4 0.2
Validation Event 2 1.2 0.25 1Runoff coefficients could not be calculated at the Wisconsin Avenue control structure or at the Douglas Drive monitoring station as the data collected at these stations were water elevation/levels (not flow rate)
2.4.4 Calibration Methodology The XPSWMM model calibration methodology included the general process outlined below:

37
P:\Mpls\23 MN\27\2327051\WorkFiles\XP SWMM Phase II\Report\BCWMC_Ph2_XPSWMMReport_Draft_01112017.docx
1) Calibrating to the smaller storm event, focusing on modifying parameters related to runoff generation from impervious surfaces and system hydraulics,
2) Calibrating to the larger storm event, focusing on modifying parameters related to runoff generation from pervious surfaces and system hydraulics,
3) Running the validation event to confirm the model calibration is appropriate.
Through the calibration process, the following model input parameters were modified from the original assumptions to improve the model predictions to better match the monitoring data:
- Subwatershed width - Percentage of directly- connected impervious surfaces - Impervious depression storage - Impervious roughness - Horton infiltration assumptions related to soil types (especially areas with undefined soils) - Pervious depression storage - Pervious roughness - Channel roughness
Table 2-14 summarizes the final calibrated model parameters for the subwatersheds based on the calibration points within the watershed.
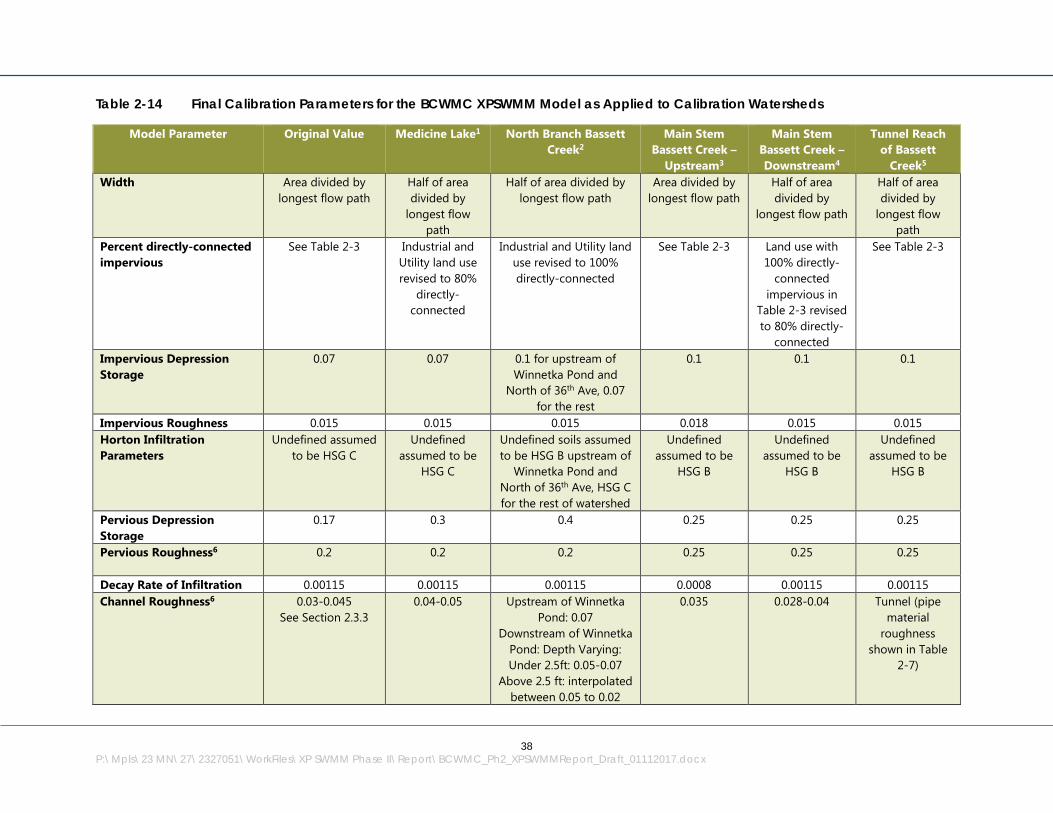
38
P:\Mpls\23 MN\27\2327051\WorkFiles\XP SWMM Phase II\Report\BCWMC_Ph2_XPSWMMReport_Draft_01112017.docx
Table 2-14 Final Calibration Parameters for the BCWMC XPSWMM Model as Applied to Calibration Watersheds
Model Parameter Original Value Medicine Lake1 North Branch Bassett Creek2
Main Stem Bassett Creek –
Upstream3
Main Stem Bassett Creek – Downstream4
Tunnel Reach of Bassett
Creek5 Width Area divided by
longest flow path Half of area divided by
longest flow path
Half of area divided by longest flow path
Area divided by longest flow path
Half of area divided by
longest flow path
Half of area divided by
longest flow path
Percent directly-connected impervious
See Table 2-3 Industrial and Utility land use revised to 80%
directly-connected
Industrial and Utility land use revised to 100% directly-connected
See Table 2-3 Land use with 100% directly-
connected impervious in
Table 2-3 revised to 80% directly-
connected
See Table 2-3
Impervious Depression Storage
0.07 0.07 0.1 for upstream of Winnetka Pond and
North of 36th Ave, 0.07 for the rest
0.1 0.1 0.1
Impervious Roughness 0.015 0.015 0.015 0.018 0.015 0.015 Horton Infiltration Parameters
Undefined assumed to be HSG C
Undefined assumed to be
HSG C
Undefined soils assumed to be HSG B upstream of
Winnetka Pond and North of 36th Ave, HSG C for the rest of watershed
Undefined assumed to be
HSG B
Undefined assumed to be
HSG B
Undefined assumed to be
HSG B
Pervious Depression Storage
0.17 0.3 0.4 0.25 0.25 0.25
Pervious Roughness6 0.2 0.2 0.2 0.25 0.25 0.25
Decay Rate of Infiltration 0.00115 0.00115 0.00115 0.0008 0.00115 0.00115 Channel Roughness6 0.03-0.045
See Section 2.3.3
0.04-0.05 Upstream of Winnetka Pond: 0.07
Downstream of Winnetka Pond: Depth Varying: Under 2.5ft: 0.05-0.07
Above 2.5 ft: interpolated between 0.05 to 0.02
0.035 0.028-0.04 Tunnel (pipe material
roughness shown in Table
2-7)
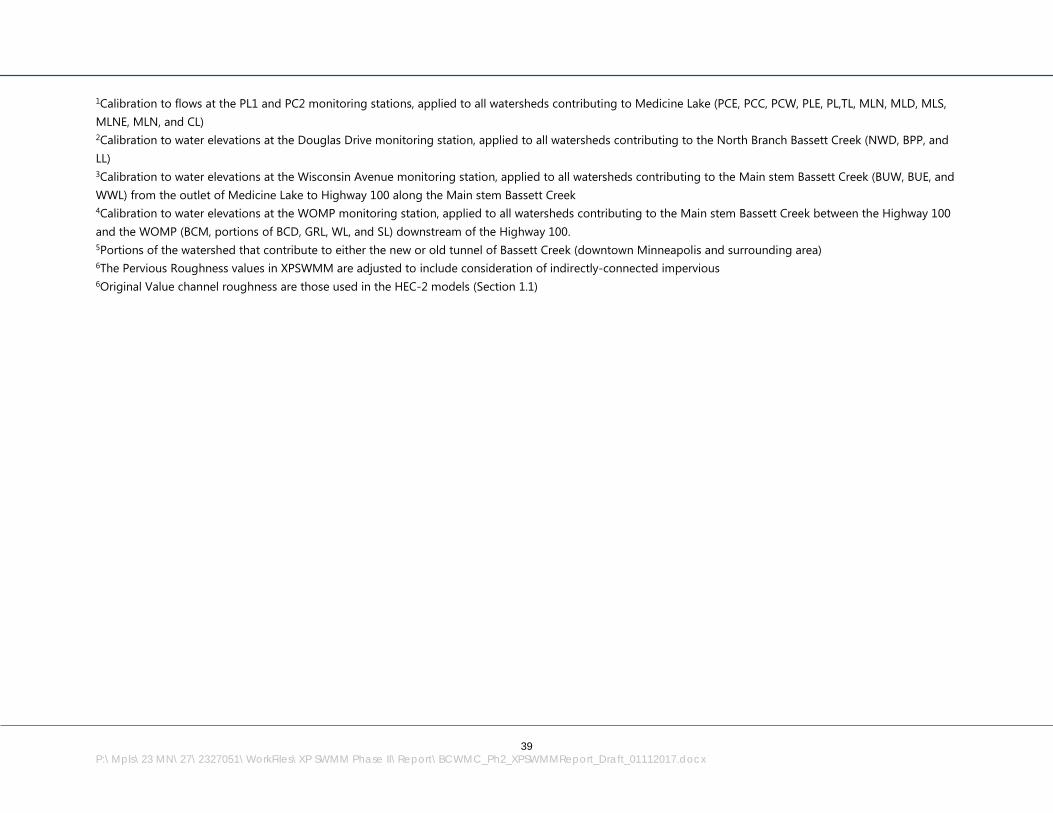
39
P:\Mpls\23 MN\27\2327051\WorkFiles\XP SWMM Phase II\Report\BCWMC_Ph2_XPSWMMReport_Draft_01112017.docx
1Calibration to flows at the PL1 and PC2 monitoring stations, applied to all watersheds contributing to Medicine Lake (PCE, PCC, PCW, PLE, PL,TL, MLN, MLD, MLS, MLNE, MLN, and CL) 2Calibration to water elevations at the Douglas Drive monitoring station, applied to all watersheds contributing to the North Branch Bassett Creek (NWD, BPP, and LL) 3Calibration to water elevations at the Wisconsin Avenue monitoring station, applied to all watersheds contributing to the Main stem Bassett Creek (BUW, BUE, and WWL) from the outlet of Medicine Lake to Highway 100 along the Main stem Bassett Creek 4Calibration to water elevations at the WOMP monitoring station, applied to all watersheds contributing to the Main stem Bassett Creek between the Highway 100 and the WOMP (BCM, portions of BCD, GRL, WL, and SL) downstream of the Highway 100. 5Portions of the watershed that contribute to either the new or old tunnel of Bassett Creek (downtown Minneapolis and surrounding area) 6The Pervious Roughness values in XPSWMM are adjusted to include consideration of indirectly-connected impervious 6Original Value channel roughness are those used in the HEC-2 models (Section 1.1)
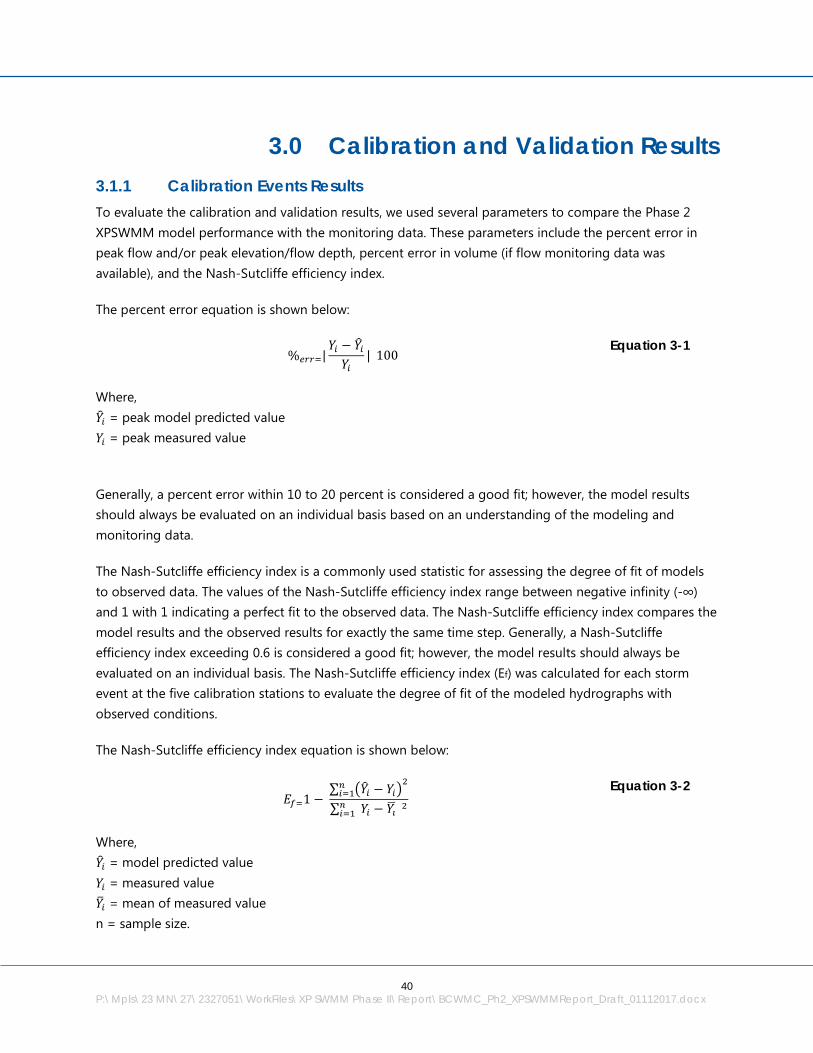
40
P:\Mpls\23 MN\27\2327051\WorkFiles\XP SWMM Phase II\Report\BCWMC_Ph2_XPSWMMReport_Draft_01112017.docx
3.0 Calibration and Validation Results 3.1.1 Calibration Events Results To evaluate the calibration and validation results, we used several parameters to compare the Phase 2 XPSWMM model performance with the monitoring data. These parameters include the percent error in peak flow and/or peak elevation/flow depth, percent error in volume (if flow monitoring data was available), and the Nash-Sutcliffe efficiency index.
The percent error equation is shown below:
%𝑒𝑒𝑒𝑒𝑒𝑒=|𝑌𝑌𝑖𝑖 − 𝑌𝑌�𝑖𝑖𝑌𝑌𝑖𝑖
|(100) Equation 3-1
Where, 𝑌𝑌�𝑖𝑖 = peak model predicted value 𝑌𝑌𝑖𝑖 = peak measured value
Generally, a percent error within 10 to 20 percent is considered a good fit; however, the model results should always be evaluated on an individual basis based on an understanding of the modeling and monitoring data.
The Nash-Sutcliffe efficiency index is a commonly used statistic for assessing the degree of fit of models to observed data. The values of the Nash-Sutcliffe efficiency index range between negative infinity (-∞) and 1 with 1 indicating a perfect fit to the observed data. The Nash-Sutcliffe efficiency index compares the model results and the observed results for exactly the same time step. Generally, a Nash-Sutcliffe efficiency index exceeding 0.6 is considered a good fit; however, the model results should always be evaluated on an individual basis. The Nash-Sutcliffe efficiency index (Ef) was calculated for each storm event at the five calibration stations to evaluate the degree of fit of the modeled hydrographs with observed conditions.
The Nash-Sutcliffe efficiency index equation is shown below:
𝐸𝐸𝑓𝑓=1 − ∑ �𝑌𝑌�𝑖𝑖 − 𝑌𝑌𝑖𝑖�
2𝑛𝑛𝑖𝑖=1
∑ (𝑌𝑌𝑖𝑖 − 𝑌𝑌𝚤𝚤�)2𝑛𝑛𝑖𝑖=1
Equation 3-2
Where, 𝑌𝑌�𝑖𝑖 = model predicted value 𝑌𝑌𝑖𝑖 = measured value 𝑌𝑌�𝑖𝑖 = mean of measured value n = sample size.
41
P:\Mpls\23 MN\27\2327051\WorkFiles\XP SWMM Phase II\Report\BCWMC_Ph2_XPSWMMReport_Draft_01112017.docx
However, because the Nash-Sutcliffe efficiency equation is based on a comparison of values at corresponding time steps, in some cases, subtle differences in the time step resolution of the precipitation data, the monitoring data, and the modeling results, may indicate the model is poorly calibrated when the model is actually performing well. The aggregation of the NEXRAD precipitation to the larger rainfall watersheds (typically 5-10 subwatersheds) can also result in slight differences in the XPSWMM model timing when compared to the monitoring data. A modified Nash-Sutcliffe efficiency index can be estimated using the equation above by altering the modeled time step by a small amount of time (typically less than the data collection time (e.g. 15-minutes)) to better align the modeled data with the time step of the observed data.
Also, antecedent soil conditions, starting elevations of waterbodies, debris in the channel, and groundwater inflow are all parameters that cannot be captured by the XPSWMM model unless monitoring data or observations are available. There is no additional data beyond the monitoring stations, the major lake level monitoring data, and the annual flood control project inspection photos to better define these parameters for the smaller ponds and wetlands located throughout the watershed. However, the assumptions related to these parameters can significantly impact the model results and the estimated calibration parameters.
3.1.1.1 Calibration of the Watershed Upstream of Medicine Lake The original BCWMC Phase 2 XPSWMM model update scope called for calibration to the Plymouth Creek gage. We utilized the PC2 monitoring station for calibration along Plymouth Creek upstream of Medicine Lake. This monitoring station is located immediately downstream of a rock weir and W. Medicine Lake Drive in West Medicine Lake Park. The flows at this station are also impacted by the downstream water levels in Medicine Lake.
In addition to calibration to the monitoring station on Plymouth Creek, we also calibrated to monitoring data available in the Parkers Lake watershed (PL1) to help refine hydrologic parameters for the larger Parkers Lake, Plymouth Creek, and Medicine Lake watersheds. The monitoring site PL1 is located in a 48-inch diameter storm sewer that discharges to Parkers Lake and collects runoff from a small residential watershed with limited ponding or storage upstream.
For the Phase 2 XPSWMM model upstream of Medicine Lake, the two monitoring gages collect flow data at 15-minute intervals. The precipitation data used in the XPSWMM model from processed NEXRAD data is aggregated at approximately 5-minute intervals, a much finer resolution than the monitoring data. As a result, it is possible that the XPSWMM model will result in a higher peak that may not be captured in the monitoring data due to the longer time step.
The monitoring data at the Parkers Lake site (PL1) is particularly ‘peaky’- meaning the flow hydrograph rapidly rises and falls back to no flow in a short period of time, in some cases almost within the 15-minute data collection interval. However, the timestep of the XPSWMM model is much finer and resulted in a higher peak than captured by the monitoring data. Because of this, the modified Nash-Sutcliffe efficiency indices were calculated for this site as well as the site at Plymouth Creek.
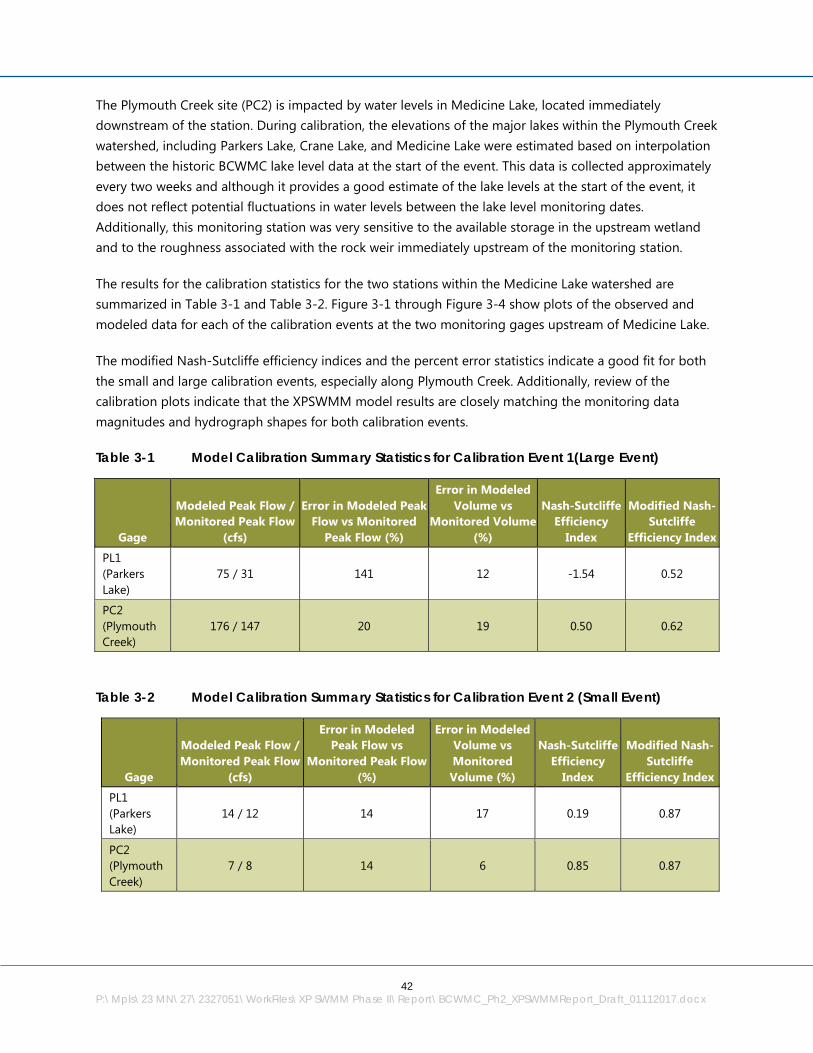
42
P:\Mpls\23 MN\27\2327051\WorkFiles\XP SWMM Phase II\Report\BCWMC_Ph2_XPSWMMReport_Draft_01112017.docx
The Plymouth Creek site (PC2) is impacted by water levels in Medicine Lake, located immediately downstream of the station. During calibration, the elevations of the major lakes within the Plymouth Creek watershed, including Parkers Lake, Crane Lake, and Medicine Lake were estimated based on interpolation between the historic BCWMC lake level data at the start of the event. This data is collected approximately every two weeks and although it provides a good estimate of the lake levels at the start of the event, it does not reflect potential fluctuations in water levels between the lake level monitoring dates. Additionally, this monitoring station was very sensitive to the available storage in the upstream wetland and to the roughness associated with the rock weir immediately upstream of the monitoring station.
The results for the calibration statistics for the two stations within the Medicine Lake watershed are summarized in Table 3-1 and Table 3-2. Figure 3-1 through Figure 3-4 show plots of the observed and modeled data for each of the calibration events at the two monitoring gages upstream of Medicine Lake.
The modified Nash-Sutcliffe efficiency indices and the percent error statistics indicate a good fit for both the small and large calibration events, especially along Plymouth Creek. Additionally, review of the calibration plots indicate that the XPSWMM model results are closely matching the monitoring data magnitudes and hydrograph shapes for both calibration events.
Table 3-1 Model Calibration Summary Statistics for Calibration Event 1(Large Event)
Gage
Modeled Peak Flow / Monitored Peak Flow
(cfs)
Error in Modeled Peak Flow vs Monitored
Peak Flow (%)
Error in Modeled Volume vs
Monitored Volume (%)
Nash-Sutcliffe Efficiency
Index
Modified Nash- Sutcliffe
Efficiency Index
PL1 (Parkers Lake)
75 / 31 141 12 -1.54 0.52
PC2 (Plymouth Creek)
176 / 147 20 19 0.50 0.62
Table 3-2 Model Calibration Summary Statistics for Calibration Event 2 (Small Event)
Gage
Modeled Peak Flow / Monitored Peak Flow
(cfs)
Error in Modeled Peak Flow vs
Monitored Peak Flow (%)
Error in Modeled Volume vs Monitored Volume (%)
Nash-Sutcliffe Efficiency
Index
Modified Nash- Sutcliffe
Efficiency Index
PL1 (Parkers Lake)
14 / 12 14 17 0.19 0.87
PC2 (Plymouth Creek)
7 / 8 14 6 0.85 0.87

43
P:\Mpls\23 MN\27\2327051\WorkFiles\XP SWMM Phase II\Report\BCWMC_Ph2_XPSWMMReport_Draft_01112017.docx
Figure 3-1 Calibration Event 1 at PL1 (Parkers Lake)
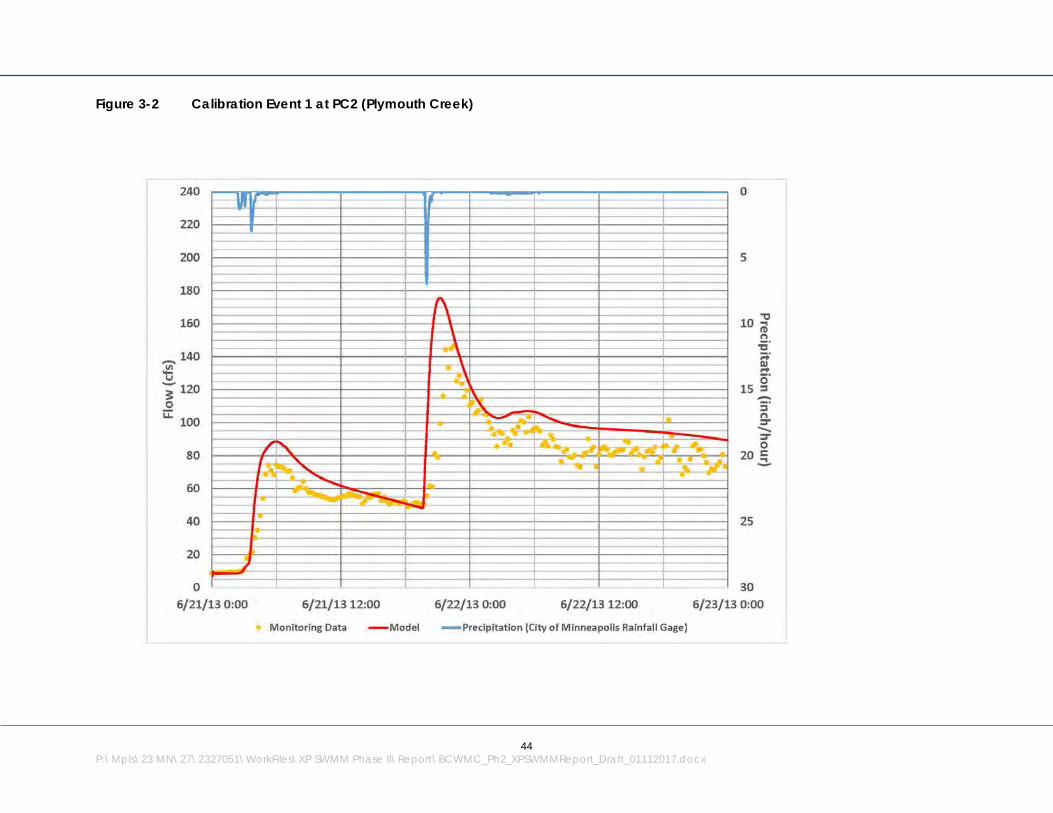
44
P:\Mpls\23 MN\27\2327051\WorkFiles\XP SWMM Phase II\Report\BCWMC_Ph2_XPSWMMReport_Draft_01112017.docx
Figure 3-2 Calibration Event 1 at PC2 (Plymouth Creek)
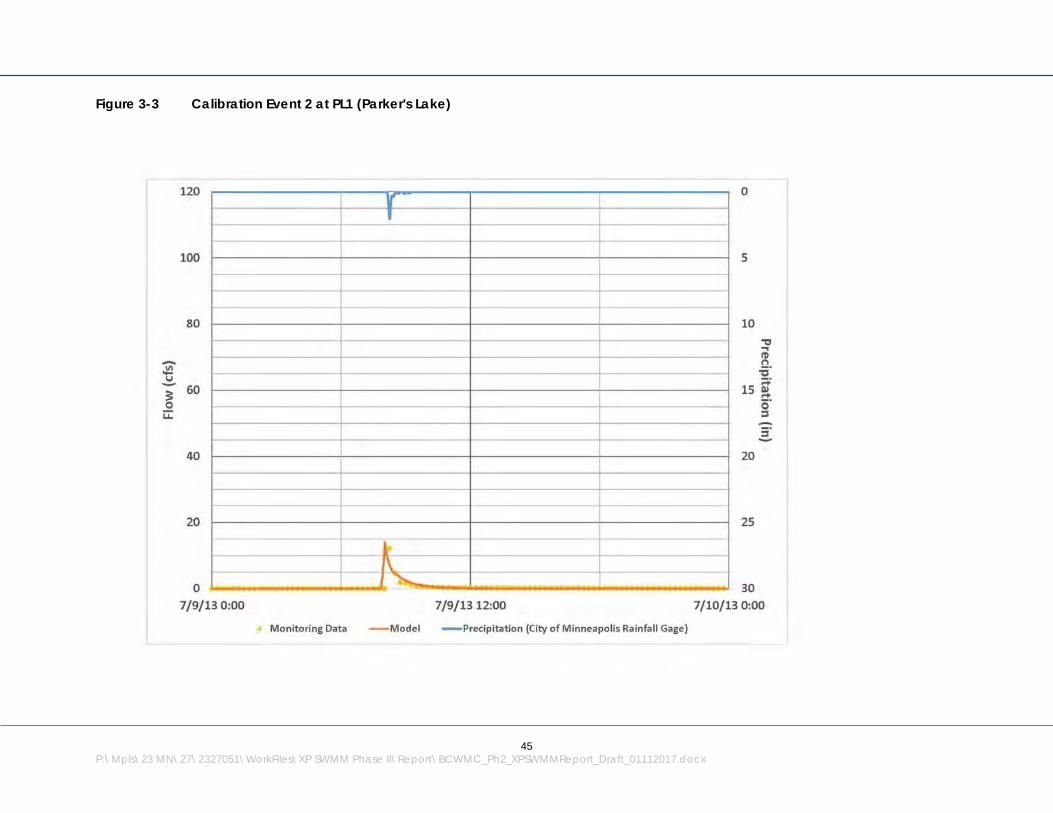
45
P:\Mpls\23 MN\27\2327051\WorkFiles\XP SWMM Phase II\Report\BCWMC_Ph2_XPSWMMReport_Draft_01112017.docx
Figure 3-3 Calibration Event 2 at PL1 (Parker's Lake)

46
P:\Mpls\23 MN\27\2327051\WorkFiles\XP SWMM Phase II\Report\BCWMC_Ph2_XPSWMMReport_Draft_01112017.docx
Figure 3-4 Calibration Event 2 at PC2 (Plymouth Creek)
47
P:\Mpls\23 MN\27\2327051\WorkFiles\XP SWMM Phase II\Report\BCWMC_Ph2_XPSWMMReport_Draft_01112017.docx
3.1.1.2 Calibration of the Watershed Downstream of Medicine Lake (Bassett Creek Main Stem and North Branch Bassett Creek)
We utilized three monitoring stations for calibration in the portion of the BCWMC watershed downstream of Medicine Lake.
The Wisconsin Avenue control structure is located along the main stem of the creek and is part of the larger Bassett Creek Flood Control Project. The Wisconsin Avenue Control Structure is an adjustable gate structure on the upstream side of Wisconsin Avenue. The purpose of the structure, as stated in the Wisconsin Avenue Operations and Maintenance Manual, is to minimize the length of time that flooding (inundation) occurs on the Brookview Golf Course without increasing downstream flood elevations. The adjustable gate is automated except in the event of power outages or other malfunctions. The gate is operated by leaving the gate at its minimum setting (there is a 2-foot tall by 8-foot wide orifice at the channel bottom) during the initial part of a storm event, while the water level of the creek is rising. When the level of the creek has crested and begins to fall, it must first be verified that the water surface elevation at Hampshire Avenue is at or below 869.5 feet. The gate may then be opened if the water level is falling or stable for more than four hours. At all times, the flow level at Hampshire Avenue will be monitored by the system to minimize potential flooding of local residences (21).
The complex communication between monitoring equipment at Hampshire Avenue and the automated adjustments to the Wisconsin Avenue Control Structure cannot be easily simulated in XPSWMM. The calibration reviewed several modeling options for the condition at the Wisconsin Avenue control structure including a time-varying orifice and a time-weighted rectangular orifice based on the gate opening information provided by the City of Golden Valley. However, we selected a 2-foot tall by 8-foot wide box culvert of incremental length as the final assumptions for the Wisconsin Avenue control structure. Since the 2-foot by 8-foot opening is used through the peak of a given storm event, this assumption is appropriate for the evaluation of the Atlas 14 100-year event, as well as the calibration and validation events.
The monitoring station along the North Branch of Bassett Creek was installed in the upstream end of a 4-foot tall by 12-foot wide box culvert at Douglas Drive. This box culvert is immediately downstream of the Edgewood Embankment (constructed as part of the BCWMC Flood Control Project) and a section of channel that was stabilized with riprap on the channel banks. During calibration, the elevations of the major lakes within the North Branch watershed, including Northwood Lake were estimated based on interpolation between the historic BCWMC lake level data at the start of the event. This data is collected approximately every two weeks and although it provides a good estimate of the lake levels at the start of the event, it does not reflect potential fluctuations in water levels between the lake level monitoring dates.
The WOMP station is located in the main stem of the creek near Irving Avenue in the City of Minneapolis. The station is located in between the Freun Mill Dam and the inlet to the New Tunnel. During calibration, the elevations of the major lakes within the main stem watershed, including Sweeney and Twin Lakes, Westwood Lake, and Wirth Lake, were estimated based on interpolation between the historic BCWMC lake level data at the start of the event. This data is collected approximately every two weeks and although it provides a good estimate of the lake levels at the start of the event, it does not reflect potential
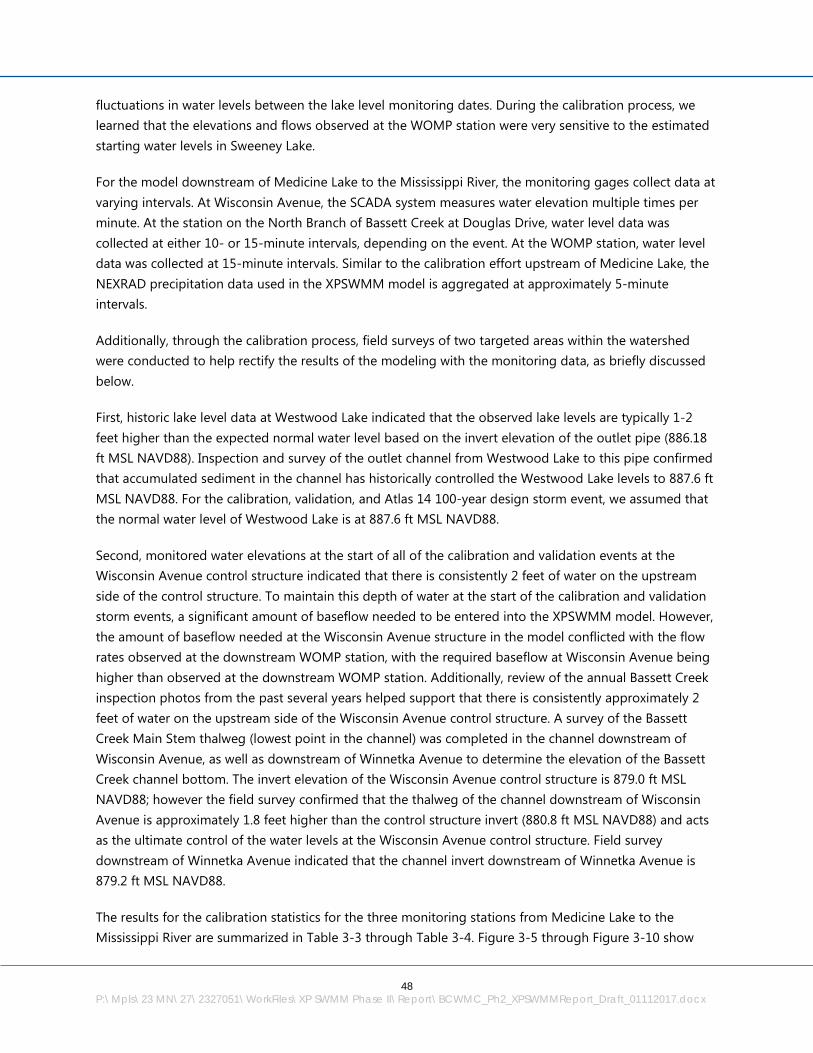
48
P:\Mpls\23 MN\27\2327051\WorkFiles\XP SWMM Phase II\Report\BCWMC_Ph2_XPSWMMReport_Draft_01112017.docx
fluctuations in water levels between the lake level monitoring dates. During the calibration process, we learned that the elevations and flows observed at the WOMP station were very sensitive to the estimated starting water levels in Sweeney Lake.
For the model downstream of Medicine Lake to the Mississippi River, the monitoring gages collect data at varying intervals. At Wisconsin Avenue, the SCADA system measures water elevation multiple times per minute. At the station on the North Branch of Bassett Creek at Douglas Drive, water level data was collected at either 10- or 15-minute intervals, depending on the event. At the WOMP station, water level data was collected at 15-minute intervals. Similar to the calibration effort upstream of Medicine Lake, the NEXRAD precipitation data used in the XPSWMM model is aggregated at approximately 5-minute intervals.
Additionally, through the calibration process, field surveys of two targeted areas within the watershed were conducted to help rectify the results of the modeling with the monitoring data, as briefly discussed below.
First, historic lake level data at Westwood Lake indicated that the observed lake levels are typically 1-2 feet higher than the expected normal water level based on the invert elevation of the outlet pipe (886.18 ft MSL NAVD88). Inspection and survey of the outlet channel from Westwood Lake to this pipe confirmed that accumulated sediment in the channel has historically controlled the Westwood Lake levels to 887.6 ft MSL NAVD88. For the calibration, validation, and Atlas 14 100-year design storm event, we assumed that the normal water level of Westwood Lake is at 887.6 ft MSL NAVD88.
Second, monitored water elevations at the start of all of the calibration and validation events at the Wisconsin Avenue control structure indicated that there is consistently 2 feet of water on the upstream side of the control structure. To maintain this depth of water at the start of the calibration and validation storm events, a significant amount of baseflow needed to be entered into the XPSWMM model. However, the amount of baseflow needed at the Wisconsin Avenue structure in the model conflicted with the flow rates observed at the downstream WOMP station, with the required baseflow at Wisconsin Avenue being higher than observed at the downstream WOMP station. Additionally, review of the annual Bassett Creek inspection photos from the past several years helped support that there is consistently approximately 2 feet of water on the upstream side of the Wisconsin Avenue control structure. A survey of the Bassett Creek Main Stem thalweg (lowest point in the channel) was completed in the channel downstream of Wisconsin Avenue, as well as downstream of Winnetka Avenue to determine the elevation of the Bassett Creek channel bottom. The invert elevation of the Wisconsin Avenue control structure is 879.0 ft MSL NAVD88; however the field survey confirmed that the thalweg of the channel downstream of Wisconsin Avenue is approximately 1.8 feet higher than the control structure invert (880.8 ft MSL NAVD88) and acts as the ultimate control of the water levels at the Wisconsin Avenue control structure. Field survey downstream of Winnetka Avenue indicated that the channel invert downstream of Winnetka Avenue is 879.2 ft MSL NAVD88.
The results for the calibration statistics for the three monitoring stations from Medicine Lake to the Mississippi River are summarized in Table 3-3 through Table 3-4. Figure 3-5 through Figure 3-10 show

49
P:\Mpls\23 MN\27\2327051\WorkFiles\XP SWMM Phase II\Report\BCWMC_Ph2_XPSWMMReport_Draft_01112017.docx
plots of the observed and modeled data for each of the calibration events at the monitoring stations in the portion of the watershed between Medicine Lake and the Mississippi River, including the two stations along the Bassett Creek Main Stem and the one station along the North Branch of Bassett Creek.
The smaller storm events for these stations downstream of Medicine Lake tend to have lower Nash-Sutcliffe efficiency indices than the validation and larger events. In these cases, the smaller events are typically more sensitive to the initial assumptions (e.g. starting water elevations for the ponds and wetlands in the model, baseflows, etc.) at the start of the XPSWMM model run than for the larger calibration and validation events.
For example, for the small storm calibration event (calibration event 4), there was little to no rain in the 4-5 of days prior to the start of the event, which is reflective of dry antecedent moisture conditions. It was possible that there was additional storage available in the ponds and wetlands throughout the contributing watershed (e.g. water levels slightly below their normal water levels). An analysis of flows from the contributing watershed at the Wisconsin Avenue station suggested that portions of the watershed may not have contributed significant flow during this event; however, there is no monitoring data available to justify changing the assumption that all of the ponds and wetlands were at their normal water level at the start of the event.
Both the Nash-Sutcliffe efficiency indices and the modified Nash-Sutcliffe efficiency indices (accounting for small shifts in timing) were calculated for the three monitoring stations. Although the Nash-Sutcliffe efficiency indices and the modified Nash-Sutcliffe efficiency indices do not indicate a good fit for the small calibration event at two of the three monitoring locations downstream of Medicine Lake, the percent error statistics are acceptable and review of the calibration plots indicate that the XPSWMM model results are closely matching the magnitudes and hydrograph shapes for the small event.
For the large calibration event the Nash-Sutcliffe efficiency indices and the percent error statistics indicate a good fit between the XPSWMM model data and the monitored data at all three monitoring locations downstream of Medicine Lake. The calibration plots also indicate that the XPSWMM model results are closely matching the magnitudes and hydrograph shapes for this event.

50
P:\Mpls\23 MN\27\2327051\WorkFiles\XP SWMM Phase II\Report\BCWMC_Ph2_XPSWMMReport_Draft_01112017.docx
Table 3-3 Model Calibration Summary Statistics for Calibration Event 3 (Large Event)
Gage
Modeled Peak Flow (or Elevation) / Monitored Peak
Flow (or Elevation) (cfs or ft MSL
NAVD88)
Error in Modeled Peak Flow (or
Depth1) vs Monitored Peak
Flow (or Depth) (%)
Error in Modeled Volume vs Monitored Volume (%)
Nash-Sutcliffe Efficiency
Index
Modified Nash-
Sutcliffe Efficiency
Index
Wisconsin Avenue (Main Stem) (Elevation)
884.2 / 884.2 0.5 N/A 0.96 0.97
Douglas Drive (North Branch) (Elevation)
866.7 / 866.3 1 N/A 0.96 0.97
WOMP (Main Stem) (Flow)
315 / 234 35 28 0.24 0.64
WOMP (Main Stem) (Elevation)
805.2 / 804.9 11 N/A 0.90 0.90
1Error in depth estimated based on difference between the peak elevation and the channel/bottom invert
Table 3-4 Model Calibration Summary Statistics for Calibration Event 4 (Small Event)
Gage
Modeled Peak Flow (or
Elevation) / Monitored
Peak Flow (or Elevation) (cfs
or ft MSL NAVD88)
Error in Modeled Peak Flow (or
Depth1) vs Monitored Peak Flow (or Depth)
(%)
Error in Modeled Volume vs Monitored Volume (%)
Nash-Sutcliffe Efficiency Index
Modified Nash- Sutcliffe
Efficiency Index
Wisconsin Avenue (Main Stem) (Elevation)
882.4 / 882.1 1 N/A -5.27 -4.73
Douglas Drive (North Branch) (Elevation)
864.5 / 864.6 6 N/A -1.17 -0.84
WOMP (Main Stem) (Flow)
65 / 57 14 6 0.65 0.65
WOMP (Main Stem) (Elevation)
803.8 / 803.7 7 N/A 0.04 0.04
1Error in depth estimated based on difference between the peak elevation and the channel/bottom invert
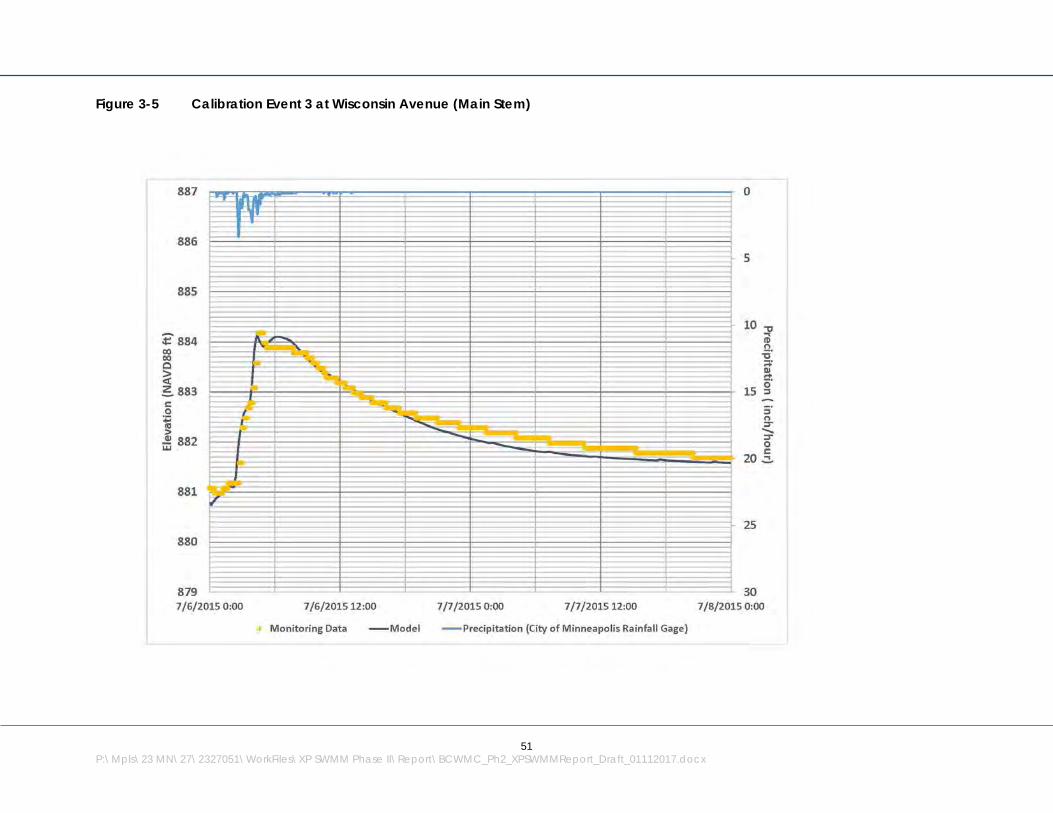
51
P:\Mpls\23 MN\27\2327051\WorkFiles\XP SWMM Phase II\Report\BCWMC_Ph2_XPSWMMReport_Draft_01112017.docx
Figure 3-5 Calibration Event 3 at Wisconsin Avenue (Main Stem)
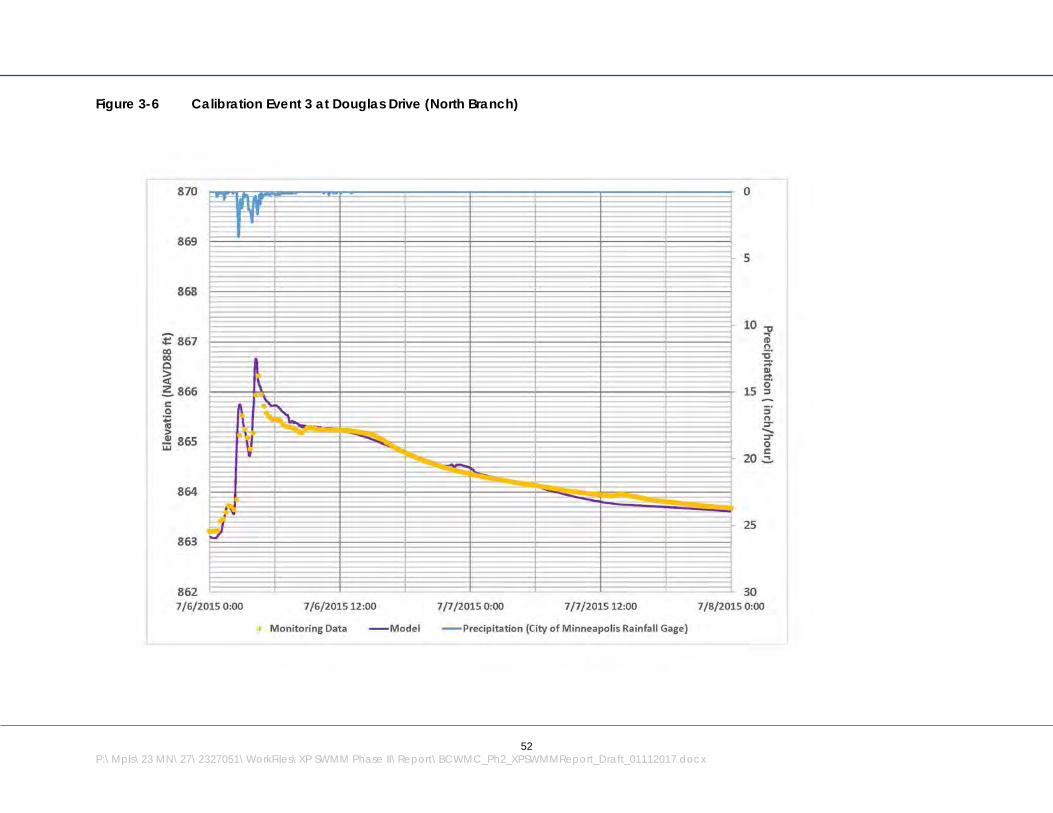
52
P:\Mpls\23 MN\27\2327051\WorkFiles\XP SWMM Phase II\Report\BCWMC_Ph2_XPSWMMReport_Draft_01112017.docx
Figure 3-6 Calibration Event 3 at Douglas Drive (North Branch)
53
P:\Mpls\23 MN\27\2327051\WorkFiles\XP SWMM Phase II\Report\BCWMC_Ph2_XPSWMMReport_Draft_01112017.docx
Figure 3-7 Calibration Event 3 at WOMP Station (Main Stem)
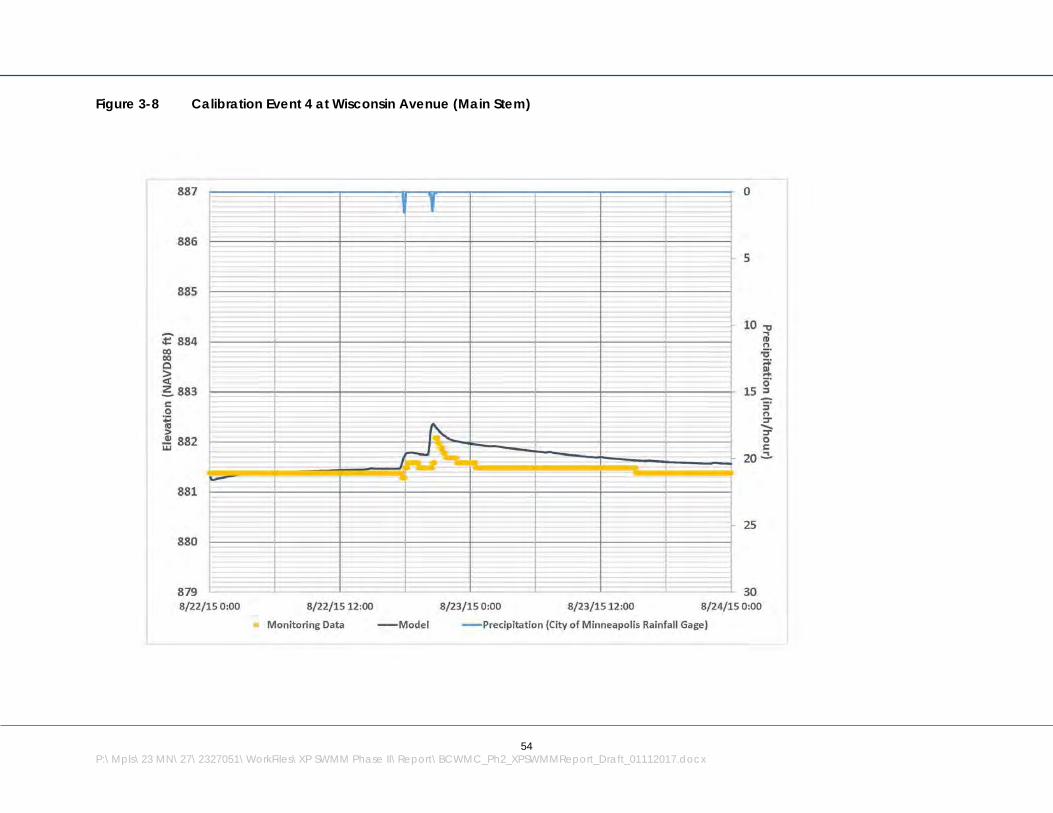
54
P:\Mpls\23 MN\27\2327051\WorkFiles\XP SWMM Phase II\Report\BCWMC_Ph2_XPSWMMReport_Draft_01112017.docx
Figure 3-8 Calibration Event 4 at Wisconsin Avenue (Main Stem)

55
P:\Mpls\23 MN\27\2327051\WorkFiles\XP SWMM Phase II\Report\BCWMC_Ph2_XPSWMMReport_Draft_01112017.docx
Figure 3-9 Calibration Event 4 at Douglas Drive (North Branch)
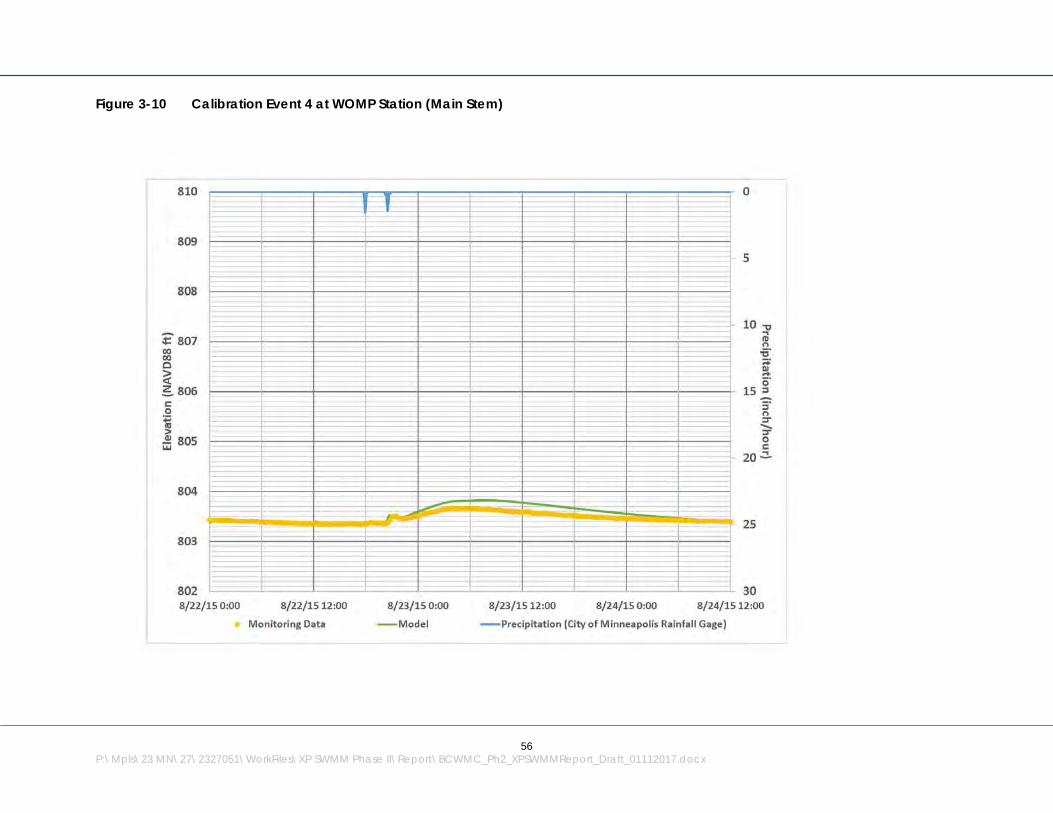
56
P:\Mpls\23 MN\27\2327051\WorkFiles\XP SWMM Phase II\Report\BCWMC_Ph2_XPSWMMReport_Draft_01112017.docx
Figure 3-10 Calibration Event 4 at WOMP Station (Main Stem)
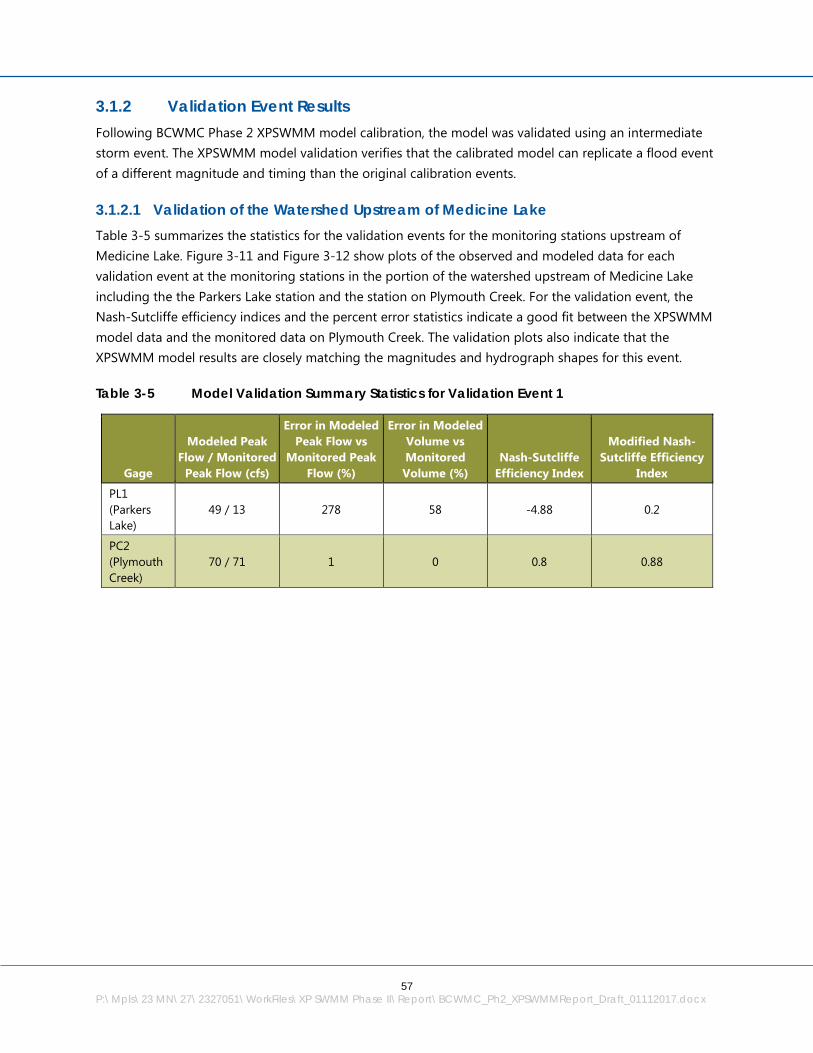
57
P:\Mpls\23 MN\27\2327051\WorkFiles\XP SWMM Phase II\Report\BCWMC_Ph2_XPSWMMReport_Draft_01112017.docx
3.1.2 Validation Event Results Following BCWMC Phase 2 XPSWMM model calibration, the model was validated using an intermediate storm event. The XPSWMM model validation verifies that the calibrated model can replicate a flood event of a different magnitude and timing than the original calibration events.
3.1.2.1 Validation of the Watershed Upstream of Medicine Lake Table 3-5 summarizes the statistics for the validation events for the monitoring stations upstream of Medicine Lake. Figure 3-11 and Figure 3-12 show plots of the observed and modeled data for each validation event at the monitoring stations in the portion of the watershed upstream of Medicine Lake including the the Parkers Lake station and the station on Plymouth Creek. For the validation event, the Nash-Sutcliffe efficiency indices and the percent error statistics indicate a good fit between the XPSWMM model data and the monitored data on Plymouth Creek. The validation plots also indicate that the XPSWMM model results are closely matching the magnitudes and hydrograph shapes for this event.
Table 3-5 Model Validation Summary Statistics for Validation Event 1
Gage
Modeled Peak Flow / Monitored
Peak Flow (cfs)
Error in Modeled Peak Flow vs
Monitored Peak Flow (%)
Error in Modeled Volume vs Monitored Volume (%)
Nash-Sutcliffe Efficiency Index
Modified Nash- Sutcliffe Efficiency
Index
PL1 (Parkers Lake)
49 / 13 278 58 -4.88 0.2
PC2 (Plymouth Creek)
70 / 71 1 0 0.8 0.88
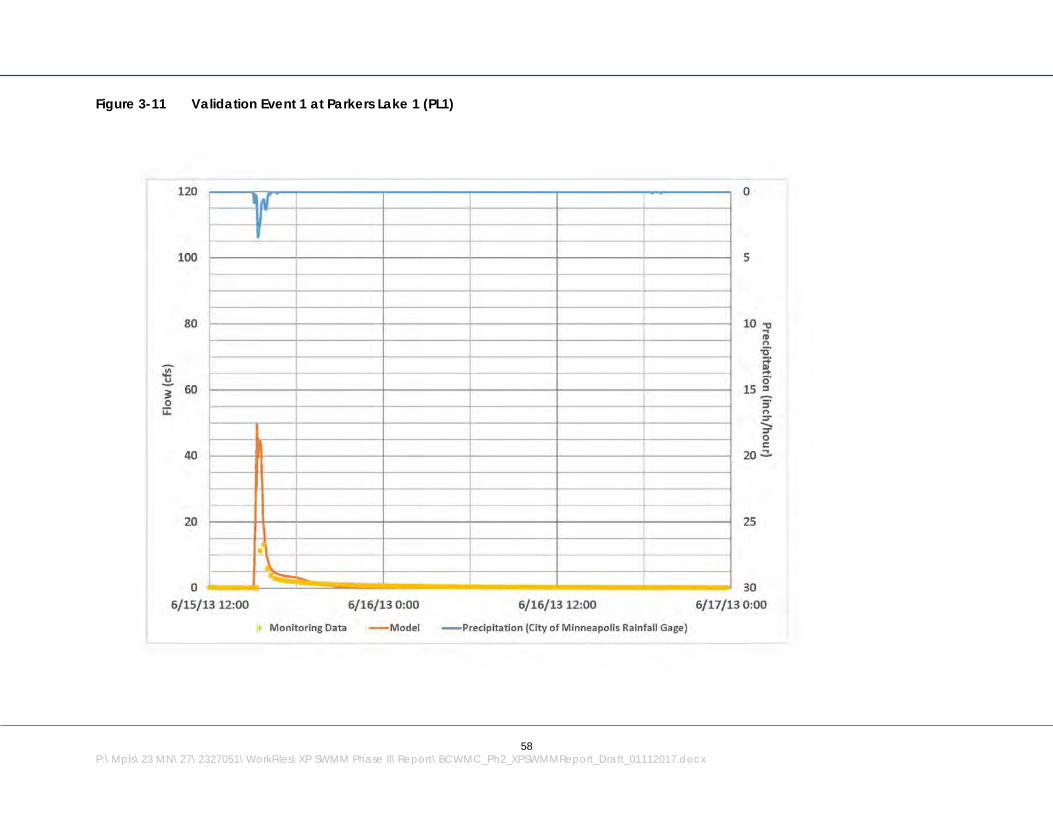
58
P:\Mpls\23 MN\27\2327051\WorkFiles\XP SWMM Phase II\Report\BCWMC_Ph2_XPSWMMReport_Draft_01112017.docx
Figure 3-11 Validation Event 1 at Parkers Lake 1 (PL1)
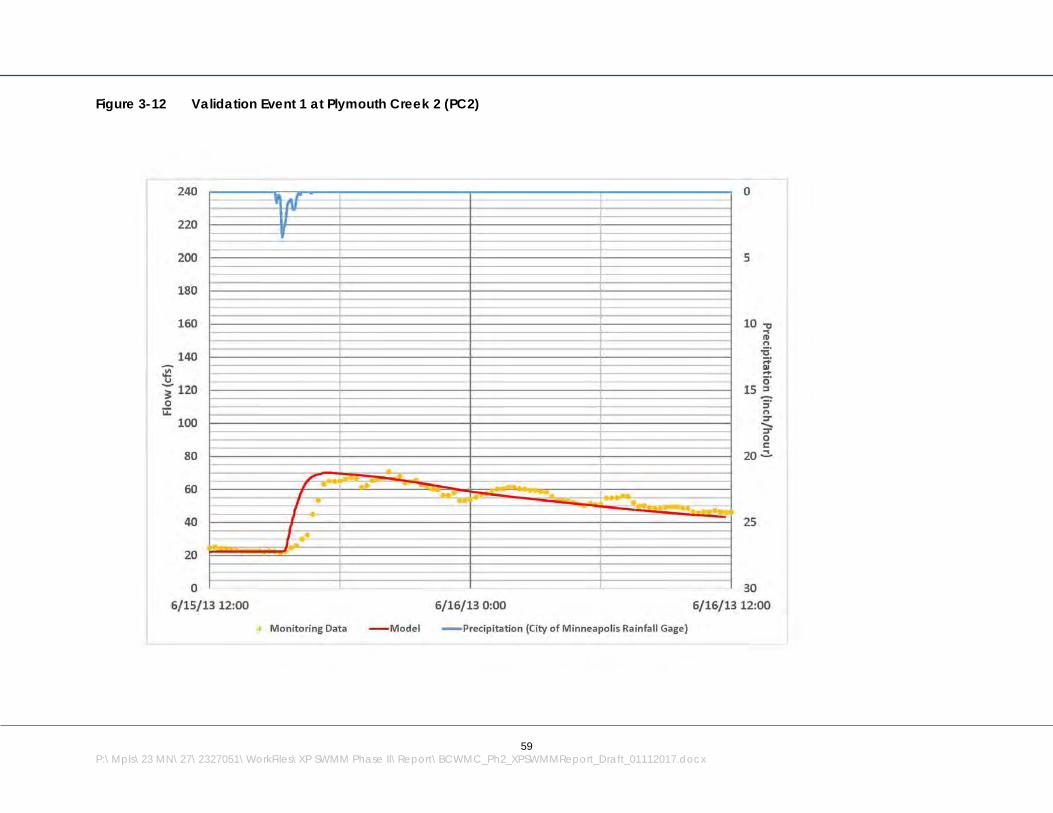
59
P:\Mpls\23 MN\27\2327051\WorkFiles\XP SWMM Phase II\Report\BCWMC_Ph2_XPSWMMReport_Draft_01112017.docx
Figure 3-12 Validation Event 1 at Plymouth Creek 2 (PC2)

60
P:\Mpls\23 MN\27\2327051\WorkFiles\XP SWMM Phase II\Report\BCWMC_Ph2_XPSWMMReport_Draft_01112017.docx
3.1.2.2 Validation of the Watershed Downstream of Medicine Lake (Bassett Creek Main stem and North Branch Bassett Creek)
Table 3-6 summarizes the statistics for the validation events for the monitoring stations downstream of Medicine Lake to the Mississippi River. Figure 3-13 through Figure 3-15 show plots of the observed and modeled data for each validation event at the monitoring stations in the portion of the watershed downstream of Medicine Lake to the Mississippi River, including the Wisconsin Avenue control structure, the Douglas Drive monitoring station, and the WOMP station. For the validation event, the Nash-Sutcliffe efficiency indices and the percent error statistics indicate a good fit between the XPSWMM model data and the monitored data. The validation plots also indicate that the XPSWMM model results are closely matching the magnitudes and hydrograph shapes for this event at all locations.
Table 3-6 Model Validation Summary Statistics for Validation Event 2
Gage
Modeled Peak Flow (or
Elevation) / Monitored Peak
Flow (or Elevation) (cfs or ft MSL NAVD88)
Error in Modeled Peak Flow (or
Depth1) vs Monitored Peak Flow (or Depth)
(%)
Error in Modeled Volume vs Monitored Volume (%)
Nash-Sutcliffe Efficiency Index
Modified Nash- Sutcliffe
Efficiency Index
Wisconsin Avenue (Main Stem) (Elevation)
883.9 / 884.2 5 N/A 0.76 0.81
Douglas Drive (North Branch) (Elevation)
867.7 /866.9 4 N/A 0.87 0.92
WOMP (Main Stem) (Flow)
209 / 157 33 31 0.18 0.2
WOMP (Main Stem) (Elevation)
804.6 / 804.4 7 N/A 0.80 0.80
1Error in depth estimated based on difference between the peak elevation and the channel/bottom invert
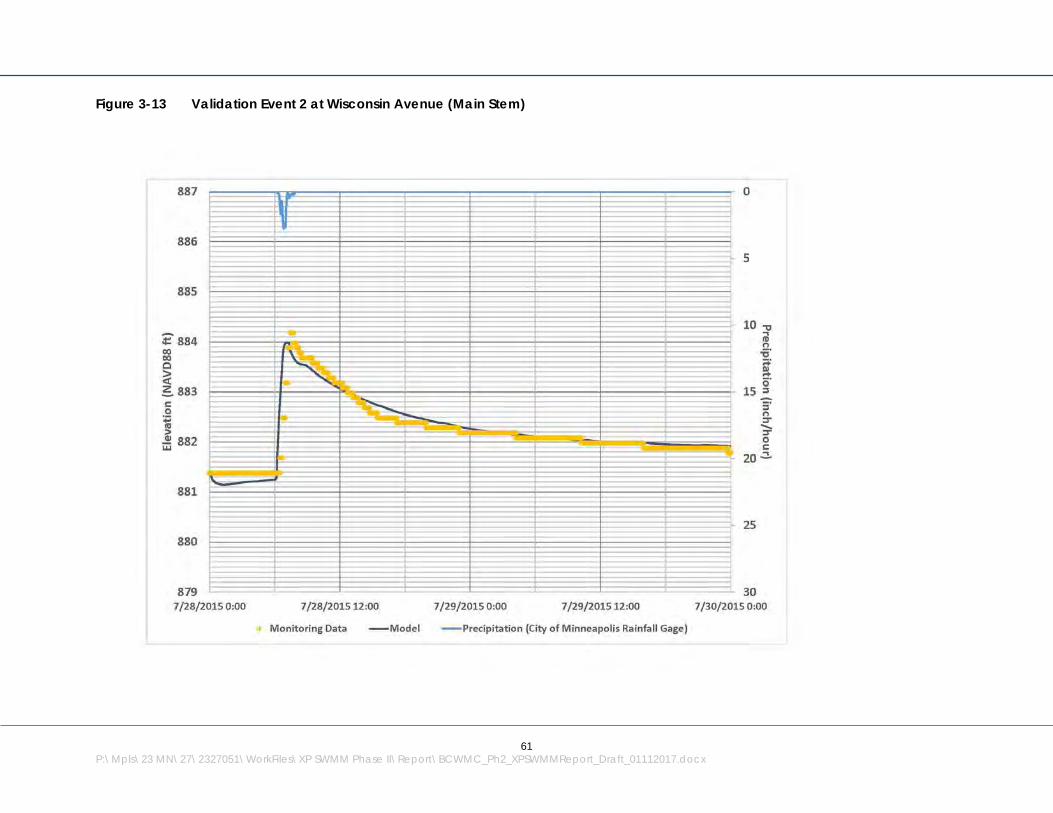
61
P:\Mpls\23 MN\27\2327051\WorkFiles\XP SWMM Phase II\Report\BCWMC_Ph2_XPSWMMReport_Draft_01112017.docx
Figure 3-13 Validation Event 2 at Wisconsin Avenue (Main Stem)
62
P:\Mpls\23 MN\27\2327051\WorkFiles\XP SWMM Phase II\Report\BCWMC_Ph2_XPSWMMReport_Draft_01112017.docx
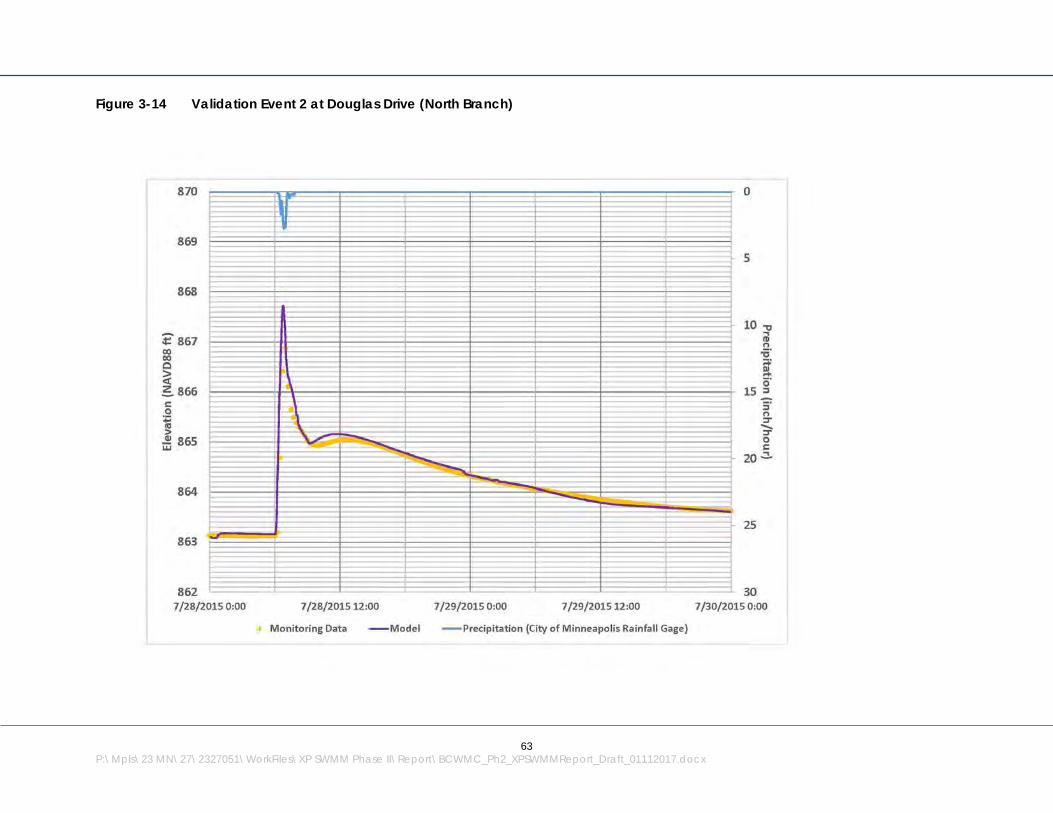
63
P:\Mpls\23 MN\27\2327051\WorkFiles\XP SWMM Phase II\Report\BCWMC_Ph2_XPSWMMReport_Draft_01112017.docx
Figure 3-14 Validation Event 2 at Douglas Drive (North Branch)

64
P:\Mpls\23 MN\27\2327051\WorkFiles\XP SWMM Phase II\Report\BCWMC_Ph2_XPSWMMReport_Draft_01112017.docx
Figure 3-15 Validation Event 2 at WOMP Station (Main Stem)
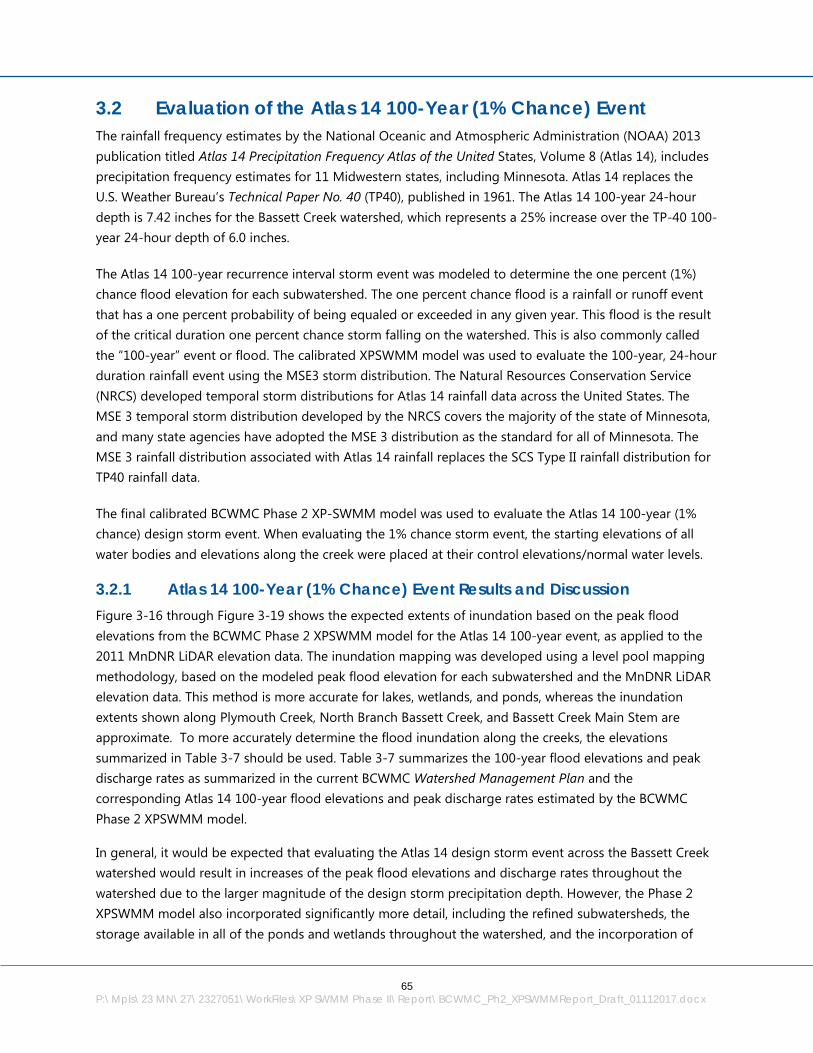
65
P:\Mpls\23 MN\27\2327051\WorkFiles\XP SWMM Phase II\Report\BCWMC_Ph2_XPSWMMReport_Draft_01112017.docx
3.2 Evaluation of the Atlas 14 100-Year (1% Chance) Event The rainfall frequency estimates by the National Oceanic and Atmospheric Administration (NOAA) 2013 publication titled Atlas 14 Precipitation Frequency Atlas of the United States, Volume 8 (Atlas 14), includes precipitation frequency estimates for 11 Midwestern states, including Minnesota. Atlas 14 replaces the U.S. Weather Bureau’s Technical Paper No. 40 (TP40), published in 1961. The Atlas 14 100-year 24-hour depth is 7.42 inches for the Bassett Creek watershed, which represents a 25% increase over the TP-40 100-year 24-hour depth of 6.0 inches.
The Atlas 14 100-year recurrence interval storm event was modeled to determine the one percent (1%) chance flood elevation for each subwatershed. The one percent chance flood is a rainfall or runoff event that has a one percent probability of being equaled or exceeded in any given year. This flood is the result of the critical duration one percent chance storm falling on the watershed. This is also commonly called the “100-year” event or flood. The calibrated XPSWMM model was used to evaluate the 100-year, 24-hour duration rainfall event using the MSE3 storm distribution. The Natural Resources Conservation Service (NRCS) developed temporal storm distributions for Atlas 14 rainfall data across the United States. The MSE 3 temporal storm distribution developed by the NRCS covers the majority of the state of Minnesota, and many state agencies have adopted the MSE 3 distribution as the standard for all of Minnesota. The MSE 3 rainfall distribution associated with Atlas 14 rainfall replaces the SCS Type II rainfall distribution for TP40 rainfall data.
The final calibrated BCWMC Phase 2 XP-SWMM model was used to evaluate the Atlas 14 100-year (1% chance) design storm event. When evaluating the 1% chance storm event, the starting elevations of all water bodies and elevations along the creek were placed at their control elevations/normal water levels.
3.2.1 Atlas 14 100-Year (1% Chance) Event Results and Discussion Figure 3-16 through Figure 3-19 shows the expected extents of inundation based on the peak flood elevations from the BCWMC Phase 2 XPSWMM model for the Atlas 14 100-year event, as applied to the 2011 MnDNR LiDAR elevation data. The inundation mapping was developed using a level pool mapping methodology, based on the modeled peak flood elevation for each subwatershed and the MnDNR LiDAR elevation data. This method is more accurate for lakes, wetlands, and ponds, whereas the inundation extents shown along Plymouth Creek, North Branch Bassett Creek, and Bassett Creek Main Stem are approximate. To more accurately determine the flood inundation along the creeks, the elevations summarized in Table 3-7 should be used. Table 3-7 summarizes the 100-year flood elevations and peak discharge rates as summarized in the current BCWMC Watershed Management Plan and the corresponding Atlas 14 100-year flood elevations and peak discharge rates estimated by the BCWMC Phase 2 XPSWMM model.
In general, it would be expected that evaluating the Atlas 14 design storm event across the Bassett Creek watershed would result in increases of the peak flood elevations and discharge rates throughout the watershed due to the larger magnitude of the design storm precipitation depth. However, the Phase 2 XPSWMM model also incorporated significantly more detail, including the refined subwatersheds, the storage available in all of the ponds and wetlands throughout the watershed, and the incorporation of
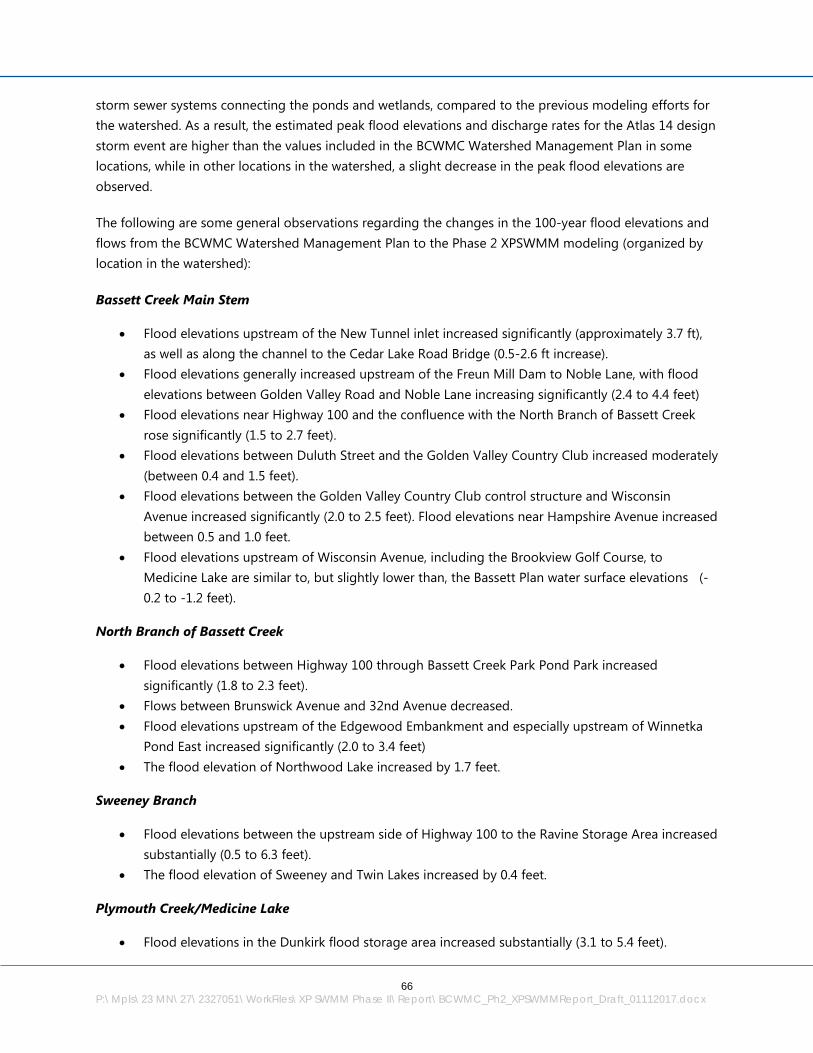
66
P:\Mpls\23 MN\27\2327051\WorkFiles\XP SWMM Phase II\Report\BCWMC_Ph2_XPSWMMReport_Draft_01112017.docx
storm sewer systems connecting the ponds and wetlands, compared to the previous modeling efforts for the watershed. As a result, the estimated peak flood elevations and discharge rates for the Atlas 14 design storm event are higher than the values included in the BCWMC Watershed Management Plan in some locations, while in other locations in the watershed, a slight decrease in the peak flood elevations are observed.
The following are some general observations regarding the changes in the 100-year flood elevations and flows from the BCWMC Watershed Management Plan to the Phase 2 XPSWMM modeling (organized by location in the watershed):
Bassett Creek Main Stem
• Flood elevations upstream of the New Tunnel inlet increased significantly (approximately 3.7 ft), as well as along the channel to the Cedar Lake Road Bridge (0.5-2.6 ft increase).
• Flood elevations generally increased upstream of the Freun Mill Dam to Noble Lane, with flood elevations between Golden Valley Road and Noble Lane increasing significantly (2.4 to 4.4 feet)
• Flood elevations near Highway 100 and the confluence with the North Branch of Bassett Creek rose significantly (1.5 to 2.7 feet).
• Flood elevations between Duluth Street and the Golden Valley Country Club increased moderately (between 0.4 and 1.5 feet).
• Flood elevations between the Golden Valley Country Club control structure and Wisconsin Avenue increased significantly (2.0 to 2.5 feet). Flood elevations near Hampshire Avenue increased between 0.5 and 1.0 feet.
• Flood elevations upstream of Wisconsin Avenue, including the Brookview Golf Course, to Medicine Lake are similar to, but slightly lower than, the Bassett Plan water surface elevations (-0.2 to -1.2 feet).
North Branch of Bassett Creek
• Flood elevations between Highway 100 through Bassett Creek Park Pond Park increased significantly (1.8 to 2.3 feet).
• Flows between Brunswick Avenue and 32nd Avenue decreased. • Flood elevations upstream of the Edgewood Embankment and especially upstream of Winnetka
Pond East increased significantly (2.0 to 3.4 feet) • The flood elevation of Northwood Lake increased by 1.7 feet.
Sweeney Branch
• Flood elevations between the upstream side of Highway 100 to the Ravine Storage Area increased substantially (0.5 to 6.3 feet).
• The flood elevation of Sweeney and Twin Lakes increased by 0.4 feet.
Plymouth Creek/Medicine Lake
• Flood elevations in the Dunkirk flood storage area increased substantially (3.1 to 5.4 feet).
67
P:\Mpls\23 MN\27\2327051\WorkFiles\XP SWMM Phase II\Report\BCWMC_Ph2_XPSWMMReport_Draft_01112017.docx
• Flood elevations upstream of County Road 9 (Rockford Road) decreased substantially (-4.1 feet). • The flood elevation of Medicine Lake decreased slightly (-0.2 feet). • The Crane Lake flood elevation decreased by 0.5 feet.
Based on a review of the inundation mapping, the LiDAR data, and aerial photos, the new flood elevations and inundation mapping indicate several structures are potentially at-risk of flooding during the Atlas 14 100-year design storm event. Some of the potentially at-risk structures are located along the Bassett Creek Main Stem; however, other potentially at-risk properties are located in upstream portions of the watershed. Topographic surveys of these structures are needed to confirm if these structures are at-risk of flooding.

TURTLELAKE
PARKERSLAKE
CRANE LAKE
PLYMOUTH CREEK
P LYMOUTH CREEK
Plymouth Creek EastSubwatershed
Parkers LakeSubwatershed
Plymouth Creek WestSubwatershed
Parkers Lake East AreaSubwatershed
Medicine Lake SouthSubwatershed
Medicine Lake DirectSubwatershed
Plymouth Creek CentralSubwatershed
Crane LakeSubwatershed
Turtle LakeSubwatershed
Medicine Lake NorthSubwatershed Medicine Lake NE
Subwatershed
Plymouth
Minnetonka
Wayzata
MinnetonkaShorewood
Woodland
Barr Footer: ArcGIS 10.4, 2017-01-11 17:07 File: I:\Client\BassettCreek\Work_Orders\2015\Phase2_XPSWMM_ModelUpdate\Maps\Reports\Bassett_Report\Figure 3-16 Atlas 14 100-year Inundation Extents Plymouth creek.mxd User: Mac2
!;NAtlas 14 100yr Inundation ExtentsSubwatershedsMajor SubwatershedsLegal BoundaryCity Boundaries FIGURE 3-16
PLYMOUTH CREEK, TURTLE LAKE AND PARKERS LAKE SUBWATERSHEDS
ATLAS 14 100-YEAR INUNDATION EXTENTSBassett Creek Water
Management Commission0 2,500 5,000
Feet
Inundation extents shown in this figure werecreated using a level pool mappingmethodology based on the modeled peakflood elevation for each subwatershed and theMnDNR LiDAR elevation data. The inundationextents shown along Plymouth Creek, NorthBranch Bassett Creek, and Bassett Creek (mainstem) are approximate and should bedetermined based on elevations presented inTable 3-7.
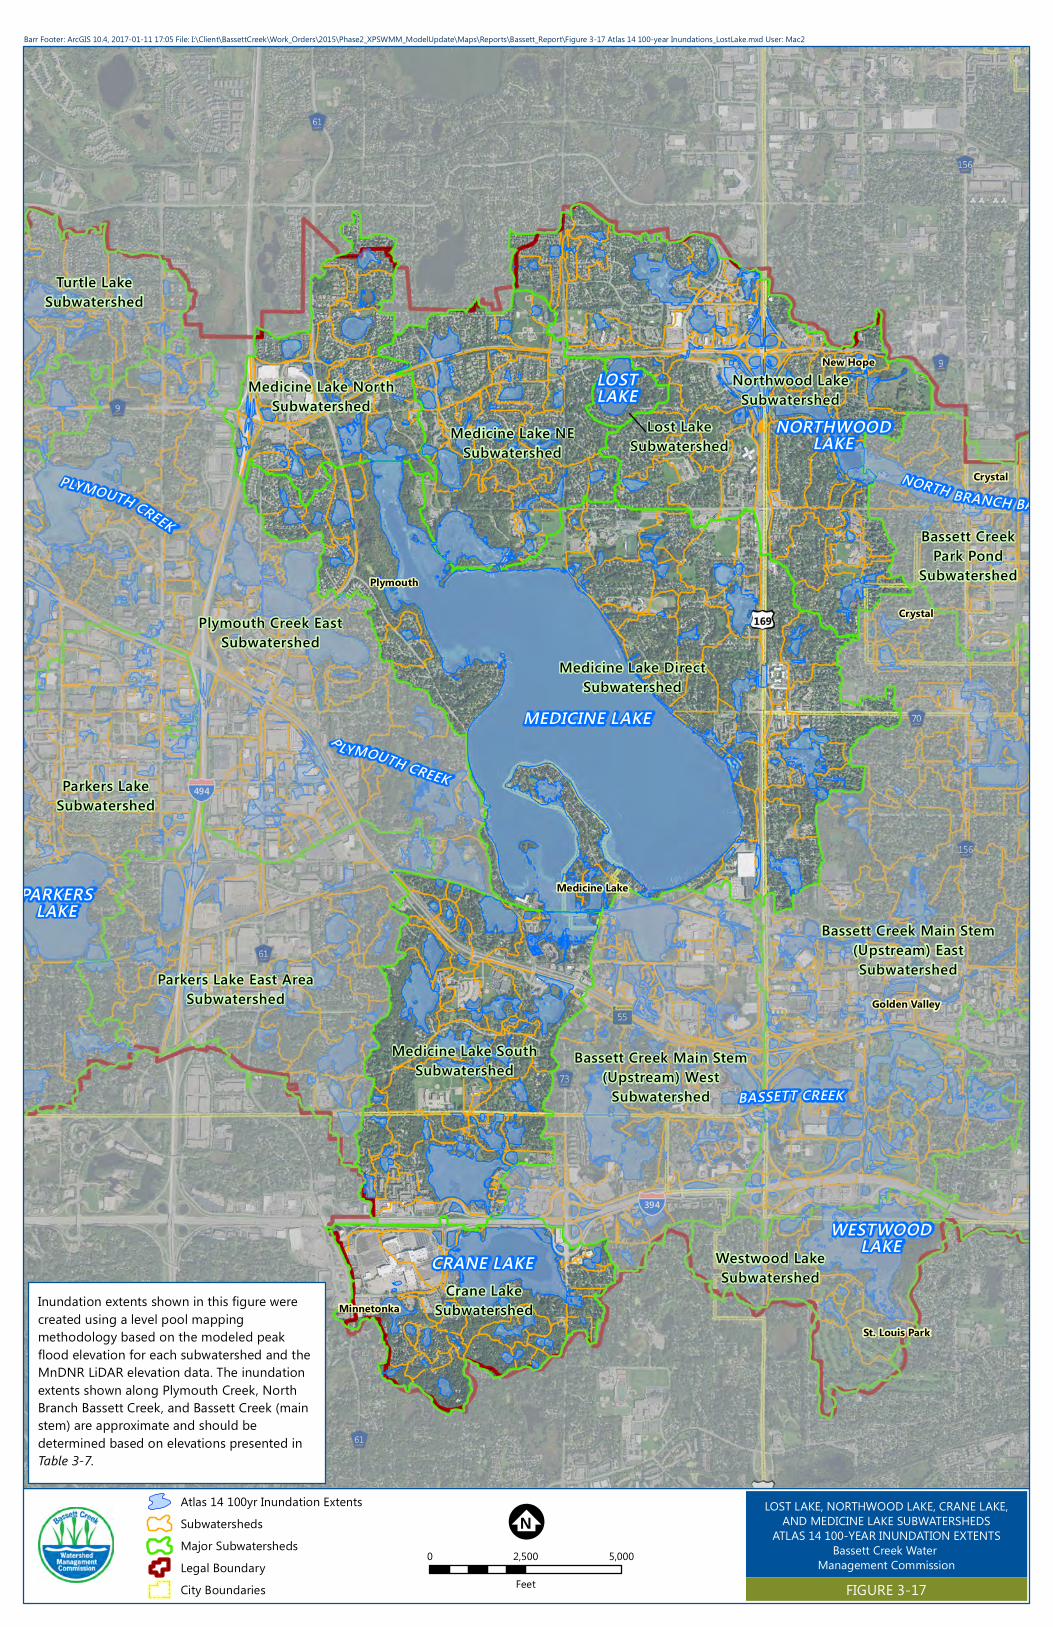
MEDICINE LAKE
NORTHWOODLAKE
LOSTLAKE
WESTWOODLAKE
PARKERSLAKE
CRANE LAKE
BASSETT CREEK
PLYMOUTH CREEK
P LYMOUTH CREEK
BASSETT CREEKBRANCHNORTH
Medicine Lake DirectSubwatershed
Plymouth Creek EastSubwatershed
Northwood LakeSubwatershed
Parkers LakeSubwatershed
Parkers Lake East AreaSubwatershed
Medicine Lake SouthSubwatershed
Crane LakeSubwatershed
Medicine Lake NESubwatershed
Westwood LakeSubwatershed
Medicine Lake NorthSubwatershed
Turtle LakeSubwatershed
Bassett Creek Main Stem(Upstream) EastSubwatershed
Bassett Creek Main Stem(Upstream) West
Subwatershed
Bassett CreekPark Pond
Subwatershed
Lost LakeSubwatershed
Plymouth
Minnetonka
New Hope
Golden Valley
St. Louis Park
Crystal
Crystal
Medicine Lake
Barr Footer: ArcGIS 10.4, 2017-01-11 17:05 File: I:\Client\BassettCreek\Work_Orders\2015\Phase2_XPSWMM_ModelUpdate\Maps\Reports\Bassett_Report\Figure 3-17 Atlas 14 100-year Inundations_LostLake.mxd User: Mac2
Atlas 14 100yr Inundation ExtentsSubwatershedsMajor SubwatershedsLegal BoundaryCity Boundaries FIGURE 3-17
LOST LAKE, NORTHWOOD LAKE, CRANE LAKE,AND MEDICINE LAKE SUBWATERSHEDS
ATLAS 14 100-YEAR INUNDATION EXTENTSBassett Creek Water
Management Commission
!;N0 2,500 5,000
Feet
Inundation extents shown in this figure werecreated using a level pool mappingmethodology based on the modeled peakflood elevation for each subwatershed and theMnDNR LiDAR elevation data. The inundationextents shown along Plymouth Creek, NorthBranch Bassett Creek, and Bassett Creek (mainstem) are approximate and should bedetermined based on elevations presented inTable 3-7.
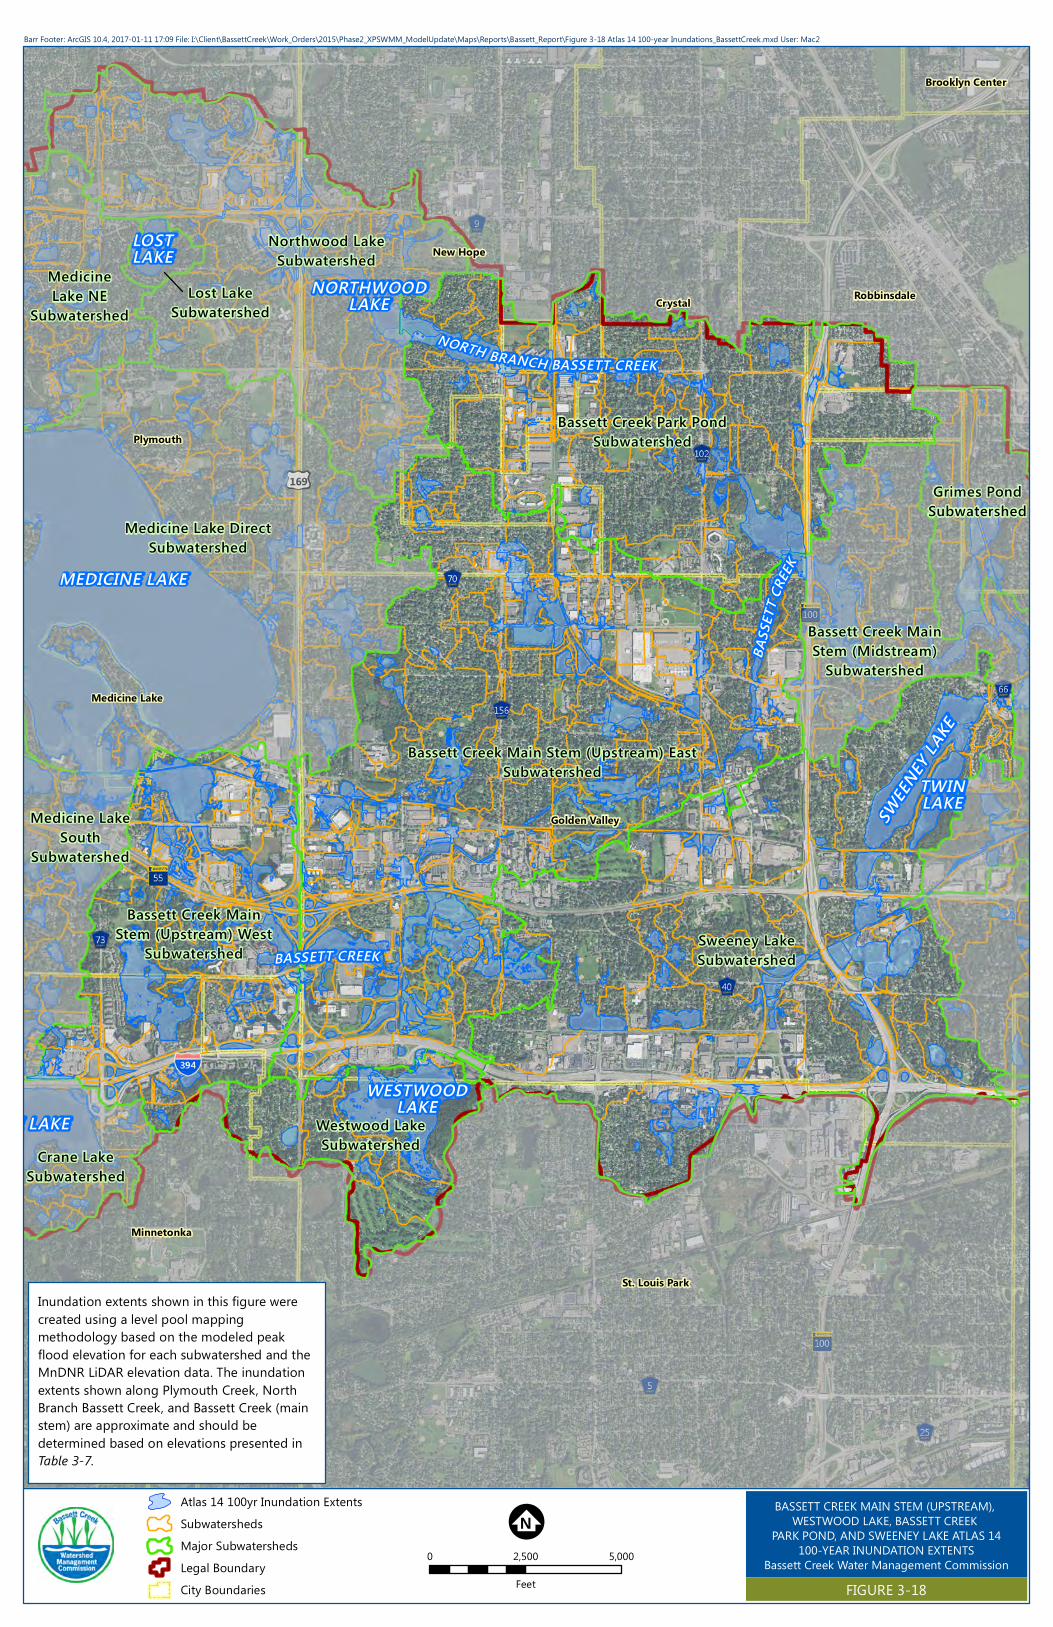
MEDICINE LAKE
NORTHWOODLAKE
LOSTLAKE
SWEEN
EY LA
KE
TWINLAKE
WESTWOODLAKE
CRANE LAKE
BASS
ETT C
REEK
BASSETT CREEK
BASSETT CREEKBRANCHNORTH
Sweeney LakeSubwatershed
Medicine Lake DirectSubwatershed
Northwood LakeSubwatershed
Bassett Creek Main Stem (Upstream) EastSubwatershed
Bassett Creek Park PondSubwatershed
Westwood LakeSubwatershedCrane Lake
Subwatershed
Bassett Creek MainStem (Upstream) West
Subwatershed
Grimes PondSubwatershed
Bassett Creek MainStem (Midstream)
Subwatershed
Lost LakeSubwatershed
MedicineLake NE
Subwatershed
Medicine LakeSouth
Subwatershed
Golden Valley
Plymouth
St. Louis Park
Crystal
New Hope
Minnetonka
Robbinsdale
Hopkins
Brooklyn Center
Medicine Lake
Barr Footer: ArcGIS 10.4, 2017-01-11 17:09 File: I:\Client\BassettCreek\Work_Orders\2015\Phase2_XPSWMM_ModelUpdate\Maps\Reports\Bassett_Report\Figure 3-18 Atlas 14 100-year Inundations_BassettCreek.mxd User: Mac2
FIGURE 3-18
BASSETT CREEK MAIN STEM (UPSTREAM), WESTWOOD LAKE, BASSETT CREEK
PARK POND, AND SWEENEY LAKE ATLAS 14100-YEAR INUNDATION EXTENTS
Bassett Creek Water Management Commission
!;N0 2,500 5,000
Feet
Atlas 14 100yr Inundation ExtentsSubwatershedsMajor SubwatershedsLegal BoundaryCity Boundaries
Inundation extents shown in this figure werecreated using a level pool mappingmethodology based on the modeled peakflood elevation for each subwatershed and theMnDNR LiDAR elevation data. The inundationextents shown along Plymouth Creek, NorthBranch Bassett Creek, and Bassett Creek (mainstem) are approximate and should bedetermined based on elevations presented inTable 3-7.

SWEEN
EY LA
KE
TWINLAKE
WIRTHLAKE
BASS
ETT C
REEK
BASSETT CREEK
BASSETT CREEK
MISSISSIPPI RIVER
Sweeney LakeSubwatershed
Bassett Creek Main Stem (Downstream)Subwatershed
Bassett Creek Park PondSubwatershed Grimes Pond
Subwatershed
Wirth LakeSubwatershed
Bassett Creek Main Stem(Midstream)
SubwatershedBassett Creek
Main Stem(Upstream) EastSubwatershed
Minneapolis
Golden Valley
St. Louis Park
Crystal
Robbinsdale
Fridley Columbia Heights
Barr Footer: ArcGIS 10.4, 2017-01-11 17:11 File: I:\Client\BassettCreek\Work_Orders\2015\Phase2_XPSWMM_ModelUpdate\Maps\Reports\Bassett_Report\Figure 3-19 Atlas 14 100-year Inundations_Grimes.mxd User: Mac2
Atlas 14 100yr Inundation ExtentsSubwatershedsMajor SubwatershedsLegal BoundaryCity Boundaries FIGURE 3-19
GRIMES POND, NORTH AND SOUTH RICE PONDS, BASSETT CREEK MAIN STEM (DOWNSTREAM), AND WIRTH LAKE SUBWATERSHEDS ATLAS 14
100-YEAR INUNDATION EXTENTSBassett Creek Water
Management Commission
!;N0 2,500 5,000
Feet
Inundation extents shown in this figure werecreated using a level pool mappingmethodology based on the modeled peakflood elevation for each subwatershed and theMnDNR LiDAR elevation data. The inundationextents shown along Plymouth Creek, NorthBranch Bassett Creek, and Bassett Creek (mainstem) are approximate and should bedetermined based on elevations presented inTable 3-7.
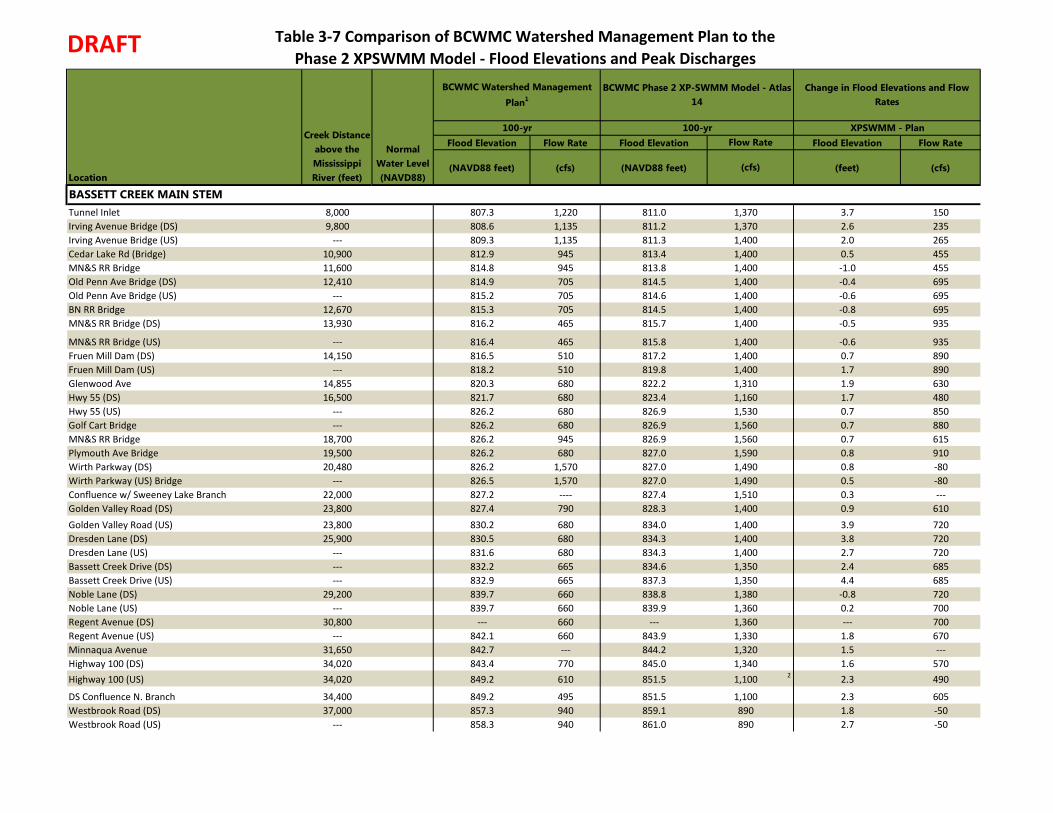
DRAFT Table 3-7 Comparison of BCWMC Watershed Management Plan to the Phase 2 XPSWMM Model - Flood Elevations and Peak Discharges
Flood Elevation Flow Rate Flood Elevation Flood Elevation Flow Rate
(NAVD88 feet) (cfs) (NAVD88 feet) (feet) (cfs)
Tunnel Inlet 8,000 807.3 1,220 811.0 1,370 3.7 150Irving Avenue Bridge (DS) 9,800 808.6 1,135 811.2 1,370 2.6 235Irving Avenue Bridge (US) --- 809.3 1,135 811.3 1,400 2.0 265Cedar Lake Rd (Bridge) 10,900 812.9 945 813.4 1,400 0.5 455MN&S RR Bridge 11,600 814.8 945 813.8 1,400 -1.0 455Old Penn Ave Bridge (DS) 12,410 814.9 705 814.5 1,400 -0.4 695Old Penn Ave Bridge (US) --- 815.2 705 814.6 1,400 -0.6 695BN RR Bridge 12,670 815.3 705 814.5 1,400 -0.8 695MN&S RR Bridge (DS) 13,930 816.2 465 815.7 1,400 -0.5 935
MN&S RR Bridge (US) --- 816.4 465 815.8 1,400 -0.6 935Fruen Mill Dam (DS) 14,150 816.5 510 817.2 1,400 0.7 890Fruen Mill Dam (US) --- 818.2 510 819.8 1,400 1.7 890Glenwood Ave 14,855 820.3 680 822.2 1,310 1.9 630Hwy 55 (DS) 16,500 821.7 680 823.4 1,160 1.7 480Hwy 55 (US) --- 826.2 680 826.9 1,530 0.7 850Golf Cart Bridge --- 826.2 680 826.9 1,560 0.7 880MN&S RR Bridge 18,700 826.2 945 826.9 1,560 0.7 615Plymouth Ave Bridge 19,500 826.2 680 827.0 1,590 0.8 910Wirth Parkway (DS) 20,480 826.2 1,570 827.0 1,490 0.8 -80Wirth Parkway (US) Bridge --- 826.5 1,570 827.0 1,490 0.5 -80Confluence w/ Sweeney Lake Branch 22,000 827.2 ---- 827.4 1,510 0.3 ---Golden Valley Road (DS) 23,800 827.4 790 828.3 1,400 0.9 610Golden Valley Road (US) 23,800 830.2 680 834.0 1,400 3.9 720Dresden Lane (DS) 25,900 830.5 680 834.3 1,400 3.8 720Dresden Lane (US) --- 831.6 680 834.3 1,400 2.7 720Bassett Creek Drive (DS) --- 832.2 665 834.6 1,350 2.4 685Bassett Creek Drive (US) --- 832.9 665 837.3 1,350 4.4 685Noble Lane (DS) 29,200 839.7 660 838.8 1,380 -0.8 720Noble Lane (US) --- 839.7 660 839.9 1,360 0.2 700Regent Avenue (DS) 30,800 --- 660 --- 1,360 --- 700Regent Avenue (US) --- 842.1 660 843.9 1,330 1.8 670Minnaqua Avenue 31,650 842.7 --- 844.2 1,320 1.5 ---Highway 100 (DS) 34,020 843.4 770 845.0 1,340 1.6 570Highway 100 (US) 34,020 849.2 610 851.5 1,100 2 2.3 490
DS Confluence N. Branch 34,400 849.2 495 851.5 1,100 2.3 605Westbrook Road (DS) 37,000 857.3 940 859.1 890 1.8 -50Westbrook Road (US) --- 858.3 940 861.0 890 2.7 -50
Location
Creek Distance above the Mississippi River (feet)
Change in Flood Elevations and Flow Rates
XPSWMM - Plan100-yr
BCWMC Watershed Management Plan1
Normal Water Level (NAVD88)
BCWMC Phase 2 XP-SWMM Model - Atlas 14
100-yrFlow Rate
(cfs)
BASSETT CREEK MAIN STEM

DRAFT Table 3-7 Comparison of BCWMC Watershed Management Plan to the Phase 2 XPSWMM Model - Flood Elevations and Peak Discharges
Flood Elevation Flow Rate Flood Elevation Flood Elevation Flow Rate
(NAVD88 feet) (cfs) (NAVD88 feet) (feet) (cfs)Location
Creek Distance above the Mississippi River (feet)
Change in Flood Elevations and Flow Rates
XPSWMM - Plan100-yr
BCWMC Watershed Management Plan1
Normal Water Level (NAVD88)
BCWMC Phase 2 XP-SWMM Model - Atlas 14
100-yrFlow Rate
(cfs)
Duluth Street (DS) 38,400 861.5 850 862.0 870 0.5 20Duluth Street (US) --- 862.0 850 862.7 850 0.7 0St. Croix Avenue (DS) 39,800 863.2 850 864.6 850 1.4 0St. Croix Avenue (US) --- 864.3 850 864.7 820 0.4 -30MN&S RR (DS) 41,660 869.7 760 870.4 720 0.7 -40MN&S RR (US) --- 869.7 760 870.6 710 0.9 -50Douglas Drive (DS) 42,130 870.4 670 871.0 710 0.7 40Douglas Drive (US) --- 871.2 670 871.9 710 0.7 40Florida Avenue (DS) 42,820 871.8 670 872.7 710 0.9 40Florida Avenue (US) --- 872.5 670 873.1 710 0.6 40Hampshire Ave (DS) 43,410 872.7 630 873.4 710 0.7 80Hampshire Ave (US) --- 873.2 630 874.0 680 0.9 50GV Country Club (DS) 44,320 874.6 365 876.1 670 1.5 305GV Country Club (US) --- 878.6 405 880.7 670 2.1 265Pennsylvania Avenue (DS) 46,500 879.5 380 881.7 670 2.2 290Pennsylvania Avenue(US) --- 880.7 375 883.1 570 2.4 195C&NW RR (DS) 47,200 881.9 375 884.4 590 2.5 215C&NW RR (US) --- 883.1 375 884.9 470 1.8 95Winnetka Ave (DS) 48,000 883.5 360 885.0 450 1.5 90Winnetka Ave (US) --- 883.7 360 885.3 440 1.6 80Wisconsin Ave (DS) 49,750 884.9 360 886.0 440 1.1 80Wisconsin Ave (US) 50,100 888.2 340 887.7 360 -0.5 20Golden Valley Road (DS) --- 888.2 290 887.8 330 -0.4 40Golden Valley Road (US) --- 888.2 290 887.8 330 -0.4 40Westbound Hwy 55 (DS) 51,250 888.2 290 887.8 330 -0.4 40Eastbound Hwy 55 (US) --- 888.3 290 887.8 400 -0.4 110Boone Ave (DS) --- 888.4 280 887.9 320 -0.5 40Boone Ave (US) --- 888.5 280 888.0 220 -0.5 -60Hwy 169 (DS) 56,500 888.6 255 888.3 300 -0.2 45Hwy 169 (US) --- 888.7 250 888.4 240 -0.3 -10Hwy 55 Ramp (DS) 58,300 888.7 235 888.4 210 -0.3 -25Hwy 55 Ramp (US) --- 888.7 235 888.4 210 -0.2 -25Hwy 55 Eastbound (DS) 58,500 888.7 235 888.4 210 -0.2 -25Hwy 55 Eastbound (US) --- 888.7 235 888.5 210 -0.2 -25Hwy 55 Westbound (DS) --- 888.7 235 888.5 210 -0.2 -25Hwy 55 Westbound (US) --- 889.0 235 888.5 210 -0.5 -25Hwy 169 ramp to W 55 (DS) 58,750 889.0 235 888.5 210 -0.5 -25Hwy 169 ramp to W 55 (US) --- 889.0 235 888.5 210 -0.5 -25Hwy 55 N Frontage Rd (DS) 58,850 889.2 235 888.5 210 -0.7 -25
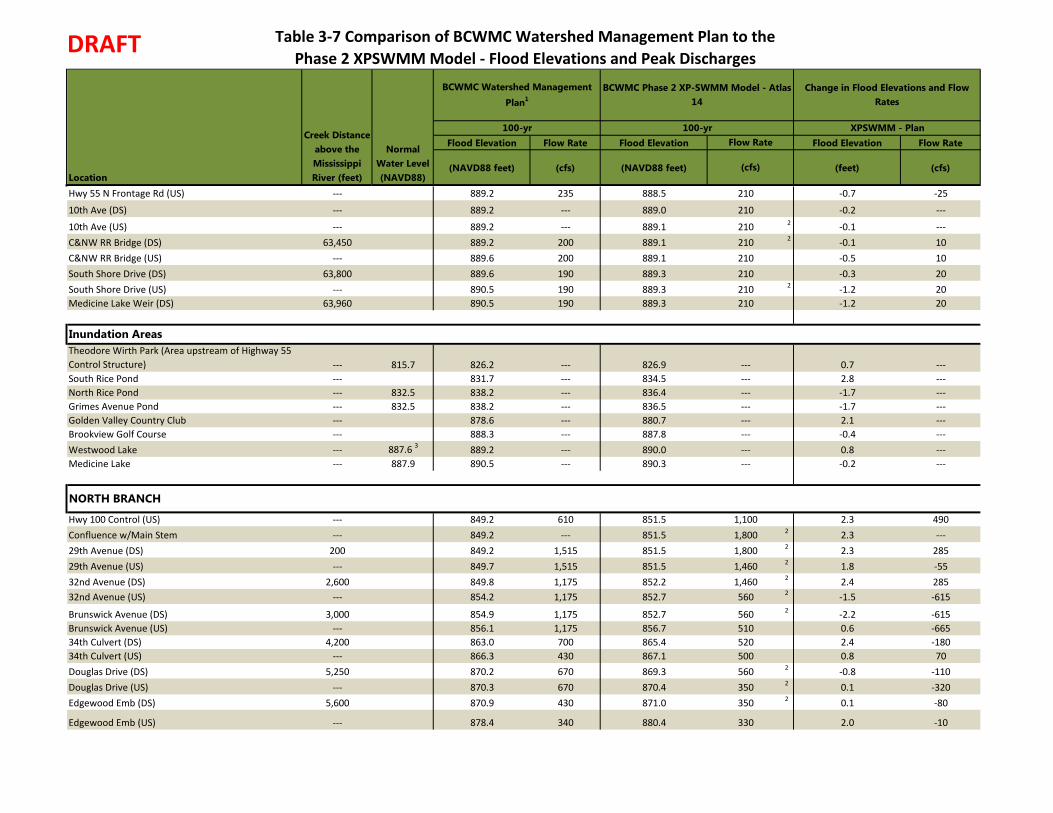
DRAFT Table 3-7 Comparison of BCWMC Watershed Management Plan to the Phase 2 XPSWMM Model - Flood Elevations and Peak Discharges
Flood Elevation Flow Rate Flood Elevation Flood Elevation Flow Rate
(NAVD88 feet) (cfs) (NAVD88 feet) (feet) (cfs)Location
Creek Distance above the Mississippi River (feet)
Change in Flood Elevations and Flow Rates
XPSWMM - Plan100-yr
BCWMC Watershed Management Plan1
Normal Water Level (NAVD88)
BCWMC Phase 2 XP-SWMM Model - Atlas 14
100-yrFlow Rate
(cfs)
Hwy 55 N Frontage Rd (US) --- 889.2 235 888.5 210 -0.7 -25
10th Ave (DS) --- 889.2 --- 889.0 210 -0.2 ---
10th Ave (US) --- 889.2 --- 889.1 210 2 -0.1 ---C&NW RR Bridge (DS) 63,450 889.2 200 889.1 210 2 -0.1 10C&NW RR Bridge (US) --- 889.6 200 889.1 210 -0.5 10South Shore Drive (DS) 63,800 889.6 190 889.3 210 -0.3 20South Shore Drive (US) --- 890.5 190 889.3 210 2 -1.2 20Medicine Lake Weir (DS) 63,960 890.5 190 889.3 210 -1.2 20
Theodore Wirth Park (Area upstream of Highway 55 Control Structure) --- 815.7 826.2 --- 826.9 --- 0.7 ---South Rice Pond --- 831.7 --- 834.5 --- 2.8 ---North Rice Pond --- 832.5 838.2 --- 836.4 --- -1.7 ---Grimes Avenue Pond --- 832.5 838.2 --- 836.5 --- -1.7 ---Golden Valley Country Club --- 878.6 --- 880.7 --- 2.1 ---Brookview Golf Course --- 888.3 --- 887.8 --- -0.4 ---Westwood Lake --- 887.6 3 889.2 --- 890.0 --- 0.8 ---Medicine Lake --- 887.9 890.5 --- 890.3 --- -0.2 ---
Hwy 100 Control (US) --- 849.2 610 851.5 1,100 2.3 490Confluence w/Main Stem --- 849.2 --- 851.5 1,800 2 2.3 ---29th Avenue (DS) 200 849.2 1,515 851.5 1,800 2 2.3 28529th Avenue (US) --- 849.7 1,515 851.5 1,460 2 1.8 -5532nd Avenue (DS) 2,600 849.8 1,175 852.2 1,460 2 2.4 28532nd Avenue (US) --- 854.2 1,175 852.7 560 2 -1.5 -615
Brunswick Avenue (DS) 3,000 854.9 1,175 852.7 560 2 -2.2 -615Brunswick Avenue (US) --- 856.1 1,175 856.7 510 0.6 -66534th Culvert (DS) 4,200 863.0 700 865.4 520 2.4 -18034th Culvert (US) --- 866.3 430 867.1 500 0.8 70Douglas Drive (DS) 5,250 870.2 670 869.3 560 2 -0.8 -110Douglas Drive (US) --- 870.3 670 870.4 350 2 0.1 -320Edgewood Emb (DS) 5,600 870.9 430 871.0 350 2 0.1 -80
Edgewood Emb (US) --- 878.4 340 880.4 330 2.0 -10
NORTH BRANCH
Inundation Areas

DRAFT Table 3-7 Comparison of BCWMC Watershed Management Plan to the Phase 2 XPSWMM Model - Flood Elevations and Peak Discharges
Flood Elevation Flow Rate Flood Elevation Flood Elevation Flow Rate
(NAVD88 feet) (cfs) (NAVD88 feet) (feet) (cfs)Location
Creek Distance above the Mississippi River (feet)
Change in Flood Elevations and Flow Rates
XPSWMM - Plan100-yr
BCWMC Watershed Management Plan1
Normal Water Level (NAVD88)
BCWMC Phase 2 XP-SWMM Model - Atlas 14
100-yrFlow Rate
(cfs)
Georgia Avenue (DS) 6,250 878.4 305 880.4 450 2.0 145
Georgia Avenue (US) --- 878.6 305 880.7 500 2 2.1 19536th & Hampshire (DS) 6,800 878.6 260 880.7 460 2 2.1 20036th & Hampshire (US) 6,980 879.2 260 881.2 290 2 2.0 30
Louisiana Ave. (DS) (Street Elevation Approx. 882.4) 8,000 881.2 --- 883.3 500 2 2.1 ---Maryland Ave. (Street Elevation Approx. 885.7) 8,500 --- --- 886.0 270 2 --- ---Oregon Ave. (Street Elevation Approx. 885.4) 9,000 --- --- 888.9 90 2 --- ---MN & S RR (Street Elevation Approx. 889.1) 9,300 --- --- 889.8 90 2 --- ---Inlet of 42" CMP (East Winnetka Pond) 9,500 888.2 --- 891.0 100 2 2.8 ---Service Road (West Winnetka Pond) 10,000 888.2 --- 891.2 190 2 3.1 ---Winnetka Ave. (DS) 10,600 888.2 --- 891.3 240 2 3.1 ---Winnetka Ave. (US) --- 889.2 --- 891.4 280 2.2 ---Boone Ave. (DS) 13,500 889.5 --- 891.4 680 2 1.9 ---Boone Ave. (US) --- 889.7 --- 891.4 270 2 1.7 ---Northwood Lake --- 889.7 --- 891.4 270 2 1.7 ---TH 169 (DS) 16,850 889.7 --- 893.0 270 2 3.4 ---TH 169(US) --- 890.7 --- 893.1 760 2 2.4 ---Rockford Road (DS) 18,350 890.7 --- 893.1 760 2 2.4 ---Rockford Road (US) --- 898.7 --- 901.4 20 2 2.8 ---
Bassett Creek Park --- 840.6 849.7 --- 851.5 --- 1.8 ---Edgewood Avenue Pond --- 878.4 --- 880.4 --- 2.0 ---Winnetka Pond (DS of Winnetka Avenue) --- 879.8 888.2 --- 891.0 --- 2.8 ---Northwood Park --- 889.5 --- 891.4 --- 1.9 ---Northwood Lake --- 884.6 889.7 --- 891.4 --- 1.7 ---
Confluence w/Main Stem --- 827.2 --- 827.4 1,510 0.3 ---France Ave extension (DS) 700 827.2 --- 827.8 170 2 0.7 ---France Ave (US) --- 829.2 --- 828.1 170 2 -1.0 ---
Courage Center & Hidden Lakes Parkway (DS) 900 829.2 --- 830.7 170 1.5 ---Courage Center & Hidden Lakes Parkway (US) --- 831.2 --- 832.0 170 0.9 ---
SWEENEY LAKE BRANCH
Inundation Areas
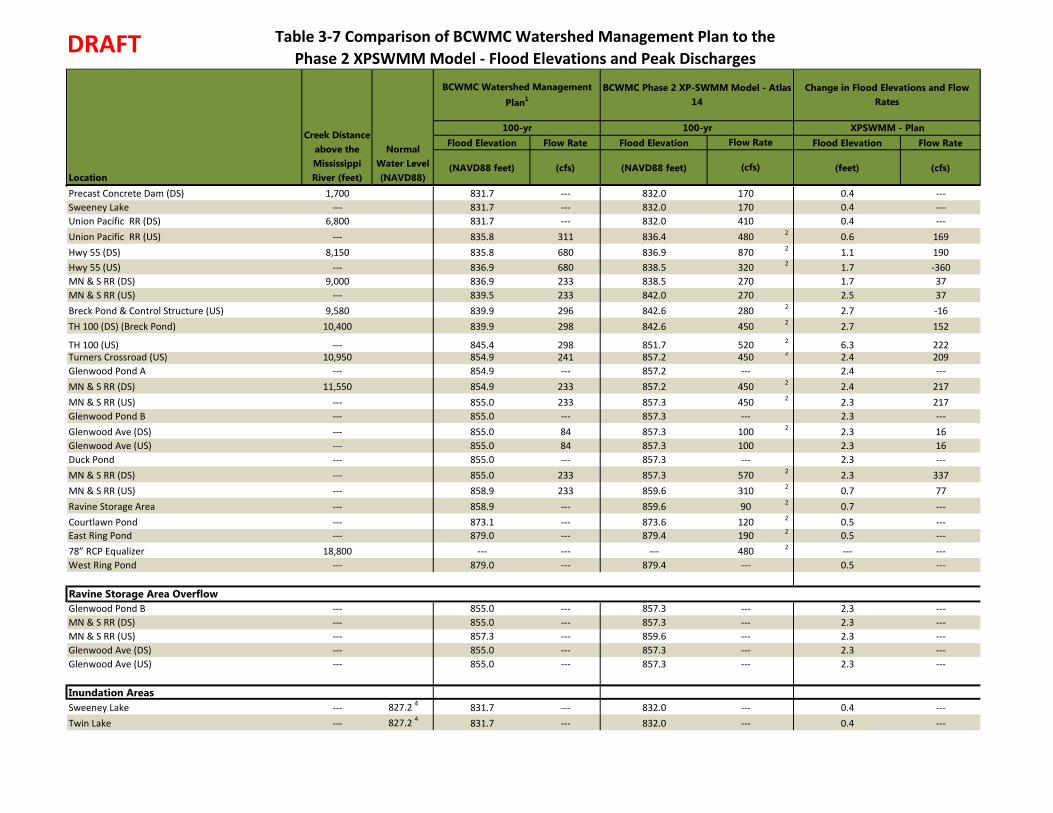
DRAFT Table 3-7 Comparison of BCWMC Watershed Management Plan to the Phase 2 XPSWMM Model - Flood Elevations and Peak Discharges
Flood Elevation Flow Rate Flood Elevation Flood Elevation Flow Rate
(NAVD88 feet) (cfs) (NAVD88 feet) (feet) (cfs)Location
Creek Distance above the Mississippi River (feet)
Change in Flood Elevations and Flow Rates
XPSWMM - Plan100-yr
BCWMC Watershed Management Plan1
Normal Water Level (NAVD88)
BCWMC Phase 2 XP-SWMM Model - Atlas 14
100-yrFlow Rate
(cfs)
Precast Concrete Dam (DS) 1,700 831.7 --- 832.0 170 0.4 ---Sweeney Lake --- 831.7 --- 832.0 170 0.4 ---Union Pacific RR (DS) 6,800 831.7 --- 832.0 410 0.4 ---Union Pacific RR (US) --- 835.8 311 836.4 480 2 0.6 169Hwy 55 (DS) 8,150 835.8 680 836.9 870 2 1.1 190Hwy 55 (US) --- 836.9 680 838.5 320 2 1.7 -360MN & S RR (DS) 9,000 836.9 233 838.5 270 1.7 37MN & S RR (US) --- 839.5 233 842.0 270 2.5 37Breck Pond & Control Structure (US) 9,580 839.9 296 842.6 280 2 2.7 -16TH 100 (DS) (Breck Pond) 10,400 839.9 298 842.6 450 2 2.7 152
TH 100 (US) --- 845.4 298 851.7 520 2 6.3 222Turners Crossroad (US) 10,950 854.9 241 857.2 450 2 2.4 209Glenwood Pond A --- 854.9 --- 857.2 --- 2.4 ---MN & S RR (DS) 11,550 854.9 233 857.2 450 2 2.4 217MN & S RR (US) --- 855.0 233 857.3 450 2 2.3 217Glenwood Pond B --- 855.0 --- 857.3 --- 2.3 ---Glenwood Ave (DS) --- 855.0 84 857.3 100 2 2.3 16Glenwood Ave (US) --- 855.0 84 857.3 100 2.3 16Duck Pond --- 855.0 --- 857.3 --- 2.3 ---MN & S RR (DS) --- 855.0 233 857.3 570 2 2.3 337MN & S RR (US) --- 858.9 233 859.6 310 2 0.7 77Ravine Storage Area --- 858.9 --- 859.6 90 2 0.7 ---Courtlawn Pond --- 873.1 --- 873.6 120 2 0.5 ---East Ring Pond --- 879.0 --- 879.4 190 2 0.5 ---78” RCP Equalizer 18,800 --- --- --- 480 2 --- ---West Ring Pond --- 879.0 --- 879.4 --- 0.5 ---
Glenwood Pond B --- 855.0 --- 857.3 --- 2.3 ---MN & S RR (DS) --- 855.0 --- 857.3 --- 2.3 ---MN & S RR (US) --- 857.3 --- 859.6 --- 2.3 ---Glenwood Ave (DS) --- 855.0 --- 857.3 --- 2.3 ---Glenwood Ave (US) --- 855.0 --- 857.3 --- 2.3 ---
Inundation AreasSweeney Lake --- 827.2 4 831.7 --- 832.0 --- 0.4 ---Twin Lake --- 827.2 4 831.7 --- 832.0 --- 0.4 ---
Ravine Storage Area Overflow

DRAFT Table 3-7 Comparison of BCWMC Watershed Management Plan to the Phase 2 XPSWMM Model - Flood Elevations and Peak Discharges
Flood Elevation Flow Rate Flood Elevation Flood Elevation Flow Rate
(NAVD88 feet) (cfs) (NAVD88 feet) (feet) (cfs)Location
Creek Distance above the Mississippi River (feet)
Change in Flood Elevations and Flow Rates
XPSWMM - Plan100-yr
BCWMC Watershed Management Plan1
Normal Water Level (NAVD88)
BCWMC Phase 2 XP-SWMM Model - Atlas 14
100-yrFlow Rate
(cfs)
Breck Pond --- 831.6 839.9 --- 842.6 --- 2.7 ---Courtlawn Pond --- 870.1 873.1 --- 873.6 --- 0.5 ---East Ring Pond --- 874.1 879.0 --- 879.4 --- 0.5 ---West Ring Pond --- 874.1 879.0 --- 879.4 --- 0.5 ---
West Medicine Lake Drive (DS) 10,450 890.5 --- 890.7 300 0.2 ---West Medicine Lake Drive (US) --- 891.7 --- 893.6 700 2 1.9 ---
26th Avenue N. (DS) 16,500 925.2 --- 924.4 230 -0.8 ---26th Avenue N. (US) --- 925.7 --- 925.0 230 -0.7 ---28th Avenue N. Dike (DS) --- 928.2 --- 929.9 230 1.7 ---28th Avenue N. Dike (US) --- 931.0 --- 932.3 270 2 1.3 ---County Road 61 (DS) --- 931.0 --- 932.3 270 1.3 ---County Road 61 (US) --- 931.4 --- 933.9 230 2.5 ---Xenium Lane (DS) 20,850 931.4 --- 933.9 440 2.6 ---Xenium Lane (US) --- 931.7 --- 934.3 470 2 2.6 ---I-494 (DS) 22,500 935.2 --- 938.1 440 2.9 ---I-494 (US) --- 938.7 --- 939.0 410 0.3 ---Fernbrook Lane (DS) 25,000 947.2 --- 946.6 260 -0.6 ---Fernbrook Lane (US) --- 948.2 --- 946.7 260 -1.5 ---Central Park Pond Outlet Structure (DS) --- 949.2 --- 949.7 260 0.5 ---Central Park Pond Outlet Structure (US) --- 953.2 --- 954.8 690 2 1.6 ---37th Avenue 28,900 956.2 --- 954.9 690 2 -1.3 ---County Road 9 30,450 959.2 --- 955.0 400 -4.1 ---Vicksburg Lane (DS) 31,300 961.2 --- 963.1 390 1.9 ---Vicksburg Lane (US) --- 962.2 --- 963.8 290 1.6 ---Dunkirk Lane (DS) --- 979.2 --- 979.4 80 0.2 ---
Dunkirk Lane (US) 34,450 982.2 --- 985.3 90 3.1 ---T.H. 55 (DS) 38,300 982.2 --- 987.6 40 5.4 ---T.H. 55 (US) --- 982.7 --- 987.6 --- 4.9 ---
Xenium Lane --- 931.7 --- 934.3 --- 2.6 ---Central Park Pond --- 948.2 952.2 --- 954.8 --- 2.6 ---Turtle Lake --- 962.9 5 964.2 --- 967.0 --- 2.8 ---Rockford Road --- 968.2 --- 968.5 --- 0.3 ---Dunkirk Lane --- 982.2 --- 982.2 --- 0.1 ---
Inundation Areas
MEDICINE LAKE BRANCH (PLYMOUTH CREEK)

DRAFT Table 3-7 Comparison of BCWMC Watershed Management Plan to the Phase 2 XPSWMM Model - Flood Elevations and Peak Discharges
Flood Elevation Flow Rate Flood Elevation Flood Elevation Flow Rate
(NAVD88 feet) (cfs) (NAVD88 feet) (feet) (cfs)Location
Creek Distance above the Mississippi River (feet)
Change in Flood Elevations and Flow Rates
XPSWMM - Plan100-yr
BCWMC Watershed Management Plan1
Normal Water Level (NAVD88)
BCWMC Phase 2 XP-SWMM Model - Atlas 14
100-yrFlow Rate
(cfs)
Oak Knoll Pond --- 914.4 917.3 --- 918.5 --- 1.2 ---Crane Lake --- 917.3 920.7 --- 920.2 --- -0.5 ---
1Historical reporting for the Bassett Plan were presented in NGVD29 (NAVD88=NGVD29+0.18ft)2Multiple inflows to node. The reported peak inflow reflects the sum all inflow peaks.
Notes
3Barr study surveyed outlet of Westwood Lake and found the outlet ditch has filled with sediment to evelevation 887.6ft. The outlet pipe invert elevation (historical normal water level) is at 886.18ft
73
P:\Mpls\23 MN\27\2327051\WorkFiles\XP SWMM Phase II\Report\BCWMC_Ph2_XPSWMMReport_Draft_01112017.docx
4.0 References 1. Barr Engineering Company. Watershed-wide XP-SWMM Model. Minneapolis, M N : s.n., 2013.
2. Bassett Creek Watershed Management Commission. 2015-2025 Watershed Management Plan. 2015.
3. Barr Engineering Company. Bassett Creek Watershed-Wide Water Quality (P8) Modeling Study. 2013.
4. Minnesota Department of Transportation (MnDOT). Drainage Manual. St. Paul, MN : MnDOT, 2000.
5. Federal Emergency Management Agency . Hennepin County Flood Insurance Study. s.l. : FEMA, 2016.
6. Minnesota Department of Natural Resources. Hennepin County LiDAR data. 2011.
7. Remote Sensing and Geospatial Analysis Laboratory, University of Minnesota. Twin Cities Metropolitan Area Land Cover Classification and Impervious Surface Area by Landsat Remote Sensing: 2011 Update. St. Paul, MN : University of Minnesota, 2011.
8. U.S. Environmental Protection Agency. Storm Water Management Model Version 4 User's Manual. Washington D.C. : s.n., 1988.
9. Musgrave, G.W. How Much Water Enters the Soils U.S.DA. Yearbook. Washington D.C. : United States Department of Agriculture, 155.
10. Akan, A.O. Urban Stormwater Hydrology: A Guide to Engineering Calculations. Lancaster : Technomic Publishing Co. Inc, 1993.
11. Minnesota Department of Natural Resources. DNR 100K Lakes and Rivers . St. Paul, MN : s.n., 2003-2004.
12. Barr Engineering Company. Abstractions (Interception and Depression Storage) . Minneapolis : s.n., 2010.
13. Viewssman, W. and Lewis, G.>. Introduction to Hydrology Chapter 3: Interception and Depression Storage. New York : s.n., 1996. Pages 40-51.
14. Tholin, A.L. and Keifer, G.J. Hydrology of Urban Runoff. New York : American Society of Civil Engineer, 1960. Vol.125 PArt 1 Parges 1317-1319.
15. US Department of Agriculture Natural Resources Conservation Service. Urban Hydrology for Small Watersheds Technical Release 55. 1986. 210-VI-TR-55.
16. US Army Corps of Engineers Hydrologic Engineering Center. HEC-1 Flood Hydrograph Package User's Manual. Davis, CA : s.n., 1998.
74
P:\Mpls\23 MN\27\2327051\WorkFiles\XP SWMM Phase II\Report\BCWMC_Ph2_XPSWMMReport_Draft_01112017.docx
17. US Environmental Protection Agency National Risk Management Research Laboratory. Storm Water Management Module User's Manual version 5.0. Cincinnati, Ohio : s.n., 2010.
18. Federal Highway Administration. Hydraulic Design Series No. 4 Introduction to Highway Hydraulics. s.l. : National Highway Institute, 2008.
19. U.S. Army Corps of Engineers Hydrologic Engineering Center. HEC-RAS 5.0 Reference Manual. Davis, CA : Institute for Water Resources, 2016.
20. Schueler, T. Controlling urban runoff; a pratical manual for planning and designing urban BMPs. Washington D.C. : Metropolitan Washington Council of Governments, 1987.
21. Metropolitan Council. Generalized Land Use for the Twin Cities Metropolitan Area. St. Paul : s.n., 2010.