A Two-Phase Model for Personnel Selection Based on Multi ...
20
mathematics Article A Two-Phase Model for Personnel Selection Based on Multi-Type Fuzzy Information Chen-Tung Chen 1, * and Wei-Zhan Hung 2 1 Department of Information Management, National United University, No.1, Lien-Da, Kung-Ching Li, Miaoli 36003, Taiwan 2 FinTech Innovation Center, National Kaohsiung University of Science and Technology, No. 415, Jiangong Rd., Sanmin Dist., Kaohsiung City 807618, Taiwan; [email protected] * Correspondence: [email protected] Received: 14 September 2020; Accepted: 30 September 2020; Published: 3 October 2020 Abstract: From the viewpoint of human resource management, personnel selection is one of the more important issues for enterprises in a high-level competitive environment. In general, many influence factors, quantitative and qualitative, affect the decision-making process of personnel selection. For considering qualitative factors, decision-makers cannot always easily judge the suitable degree of each applicant. Under this situation, this research proposes a systematic decision-making method based on computing with linguistic variables. First, unsuitable applicants are filtered by considering the quantitative information of each applicant. At this stage, technique for order of preference by similarity to ideal solution (TOPSIS) and entropy methods are aggregated to eliminate unsuitable applicants in accordance with their closeness coefficient values. Second, experts (or decision-makers) use different types of 2-tuple linguistic variables to express their opinions of suitable candidates with respect to qualitative criteria. At this stage, we consider different preference functions in the preference ranking organization method for enrichment evaluation (PROMETHEE) method to calculate the outranking index of each suitable candidate. Next, we aggregate the closeness coefficient and outranking index of each suitable applicant to determine the ranking order. In order to illustrate the computational processes, an example demonstrates the practicability of the two-phase personnel selection method. The benefit of the proposed method is as follows. (1) It reduces the time for reviewing and evaluating the huge numbers of applicants. (2) It avoids subjective judgment by experts to determine the weights of all criteria. Finally, conclusions and contributions are discussed at the end of this paper. Keywords: personnel selection; quantitative and qualitative factors; 2-tuple linguistic variable; closeness coefficient; outranking index 1. Introduction Human capital is one of the most important core assets for enterprises competing with other companies to survive in a high-level competitive environment. Personnel recruitment affects the quality of work and the operational performance of an enterprise [1]. In order to enhance an enterprise’s competitiveness, it needs to select the right persons for the right jobs [2]. On the contrary, this will reduce the competitiveness of the enterprise and cost a lot of time and money for training workers to operate their jobs well if employees are assigned to the wrong position. Therefore, personnel selection is one of the important decision-making problems for managers of every enterprise. However, many quantitative and qualitative factors should be considered in dealing with the personnel selection problem. By considering the influential factors, a personnel evaluation and selection process can be formed like a multiple-criteria decision-making (MCDM) problem. Mathematics 2020, 8, 1703; doi:10.3390/math8101703 www.mdpi.com/journal/mathematics
-
Upload
khangminh22 -
Category
Documents
-
view
1 -
download
0
Transcript of A Two-Phase Model for Personnel Selection Based on Multi ...
mathematics
Article
A Two-Phase Model for Personnel Selection Based onMulti-Type Fuzzy Information
Chen-Tung Chen 1,* and Wei-Zhan Hung 2
1 Department of Information Management, National United University, No.1, Lien-Da, Kung-Ching Li,Miaoli 36003, Taiwan
2 FinTech Innovation Center, National Kaohsiung University of Science and Technology, No. 415,Jiangong Rd., Sanmin Dist., Kaohsiung City 807618, Taiwan; [email protected]
* Correspondence: [email protected]
Received: 14 September 2020; Accepted: 30 September 2020; Published: 3 October 2020�����������������
Abstract: From the viewpoint of human resource management, personnel selection is one of themore important issues for enterprises in a high-level competitive environment. In general, manyinfluence factors, quantitative and qualitative, affect the decision-making process of personnelselection. For considering qualitative factors, decision-makers cannot always easily judge the suitabledegree of each applicant. Under this situation, this research proposes a systematic decision-makingmethod based on computing with linguistic variables. First, unsuitable applicants are filtered byconsidering the quantitative information of each applicant. At this stage, technique for order ofpreference by similarity to ideal solution (TOPSIS) and entropy methods are aggregated to eliminateunsuitable applicants in accordance with their closeness coefficient values. Second, experts (ordecision-makers) use different types of 2-tuple linguistic variables to express their opinions of suitablecandidates with respect to qualitative criteria. At this stage, we consider different preference functionsin the preference ranking organization method for enrichment evaluation (PROMETHEE) method tocalculate the outranking index of each suitable candidate. Next, we aggregate the closeness coefficientand outranking index of each suitable applicant to determine the ranking order. In order to illustratethe computational processes, an example demonstrates the practicability of the two-phase personnelselection method. The benefit of the proposed method is as follows. (1) It reduces the time forreviewing and evaluating the huge numbers of applicants. (2) It avoids subjective judgment byexperts to determine the weights of all criteria. Finally, conclusions and contributions are discussedat the end of this paper.
Keywords: personnel selection; quantitative and qualitative factors; 2-tuple linguistic variable;closeness coefficient; outranking index
1. Introduction
Human capital is one of the most important core assets for enterprises competing with othercompanies to survive in a high-level competitive environment. Personnel recruitment affects the qualityof work and the operational performance of an enterprise [1]. In order to enhance an enterprise’scompetitiveness, it needs to select the right persons for the right jobs [2]. On the contrary, this willreduce the competitiveness of the enterprise and cost a lot of time and money for training workers tooperate their jobs well if employees are assigned to the wrong position. Therefore, personnel selectionis one of the important decision-making problems for managers of every enterprise. However, manyquantitative and qualitative factors should be considered in dealing with the personnel selectionproblem. By considering the influential factors, a personnel evaluation and selection process can beformed like a multiple-criteria decision-making (MCDM) problem.
Mathematics 2020, 8, 1703; doi:10.3390/math8101703 www.mdpi.com/journal/mathematics
Mathematics 2020, 8, 1703 2 of 20
The multi-criteria decision-making (MCDM) is the systematic procedure to find a suitablealternative from a set of feasible alternatives in accordance with multiple evaluation criteria [3,4]. Upto now, MCDM methodologies have been widely used to solve problems in the sciences, business,government, and engineering fields [5] (relative studies in the literature are in Section 2). In fact, somesituations arise in the personnel selection problem. First, many applicants compete with each otherfor some kinds of jobs that have a high salary. Second, all high-level managers do not have enoughtime to interview all applicants, and the opportunity cost is too high to interview all applicants fora high-level manager position. Third, not all applicants fit the requirement of the job. Therefore,two-phase multi-criteria decision-making (TPMCDM) method is presented here to deal with thepersonnel selection problem. In the proposed method, TOPSIS, preference ranking organizationmethod for enrichment evaluation (PROMETHEE), entropy method, and 2-tuple linguistic variableswill be integrated to handle the personnel selection problem.
TOPSIS is one of the famous MCDM methods that deals with decision-making problems [6]. Upto now, TOPSIS has been applied in different management areas such as personnel selection [7,8],project selection [9], weapon selection [10], bridge risk assessment [11], total quality management(TQM) consultant selection [12], etc. The way of thinking of TOPSIS is to determine the ranking orderof all alternatives in accordance with the relative distance between the positive ideal and negative idealalternatives [13]. Brans et al. [14] developed PROMETHEE (preference ranking organization methodfor enrichment evaluation) to deal with multi-criteria decision-making problems. In the PROMETHEEmethod, there are six types of preference functions provided for experts to express their opinions withrespect to each criterion [15]. This method is also used to deal with many decision-making problemssuch as personnel selection [16], financial [17,18], and factory location decisions [19].
Different criteria should have different levels of importance in the decision-making process. Theentropy method can be used to compute the weight of each criterion effectively [20]. In fact, theentropy method has been widely used in many areas such as engineering [21,22], economic analysis,and finance management [23]. The concept of entropy is an index to measure the uncertainties anddegree of messiness of a system [24]. Entropy can provide useful information in accordance with theevaluation data in the decision-making process. For an evaluation criterion, if the difference amongthe data is low, then the entropy value for this criterion is high. It means that this criterion cannotprovide important information for making comparisons among alternatives. Therefore, the weight ofthis criterion should be low in the decision-making process. On the contrary, if the entropy value ofdata for this criterion is lower, then the weight of this criterion will be higher than other criteria inthe decision-making process [23]. In essence, the entropy method is a systematic way to compute theweight of each criterion based on the evaluation data.
As many qualitative criteria should be considered in the MCDM process, it is suitable for expertsor decision-makers to use the linguistic variables to express their opinions. Based on the differentbackgrounds and experiences of experts, multi-type linguistic variables are suitable for expressing theevaluation values [25,26]. The 2-type linguistic variable can express the opinions of decision-makersand make the information translation more effective [27]. Therefore, multi-type linguistic variablesbased on 2-type linguistic terms are used to express the evaluation values of decision-makers inthis paper.
According to the above narrations, this paper is organized into seven sections. Section 2 discussesthe literature. Section 3 introduces the definitions and operations of a 2-tuple linguistic variable.Section 4 explains the details of the proposed model. Section 5 presents an example to describe thepracticability of the proposed model. Section 6 executes a simulation experiment in order to prove theeffectiveness of the proposed model. Finally, Section 7 offers the advantages of the proposed model.
2. Literature Review
Ertugrul Karsak [28] used fuzzy objective programming to choose the person. Korvin et al. [29]selected the suitable person by considering the levels of compatibility and acceptable levels of quality
Mathematics 2020, 8, 1703 3 of 20
to compute the fuzzy fitness of each person to do the right jobs. Chien and Chen [30] proposed aneffective data mining method based on the rough set theory to select the right person from a humanresource database. Gungor et al. [31] considered many quantitative and qualitative factors and usedfuzzy analytic hierarchy process (AHP) to cope with the personnel selection problem. According tomaritime human resources data, Celik et al. [32] combined fuzzy AHP with fuzzy TOPSIS to deal withthe academic personnel selection problem. Some researchers used the objective programming modeland machine learning method to deal with the personnel selection problem for a project team [33,34].
Zhang and Liu [35] combined intuitionistic fuzzy numbers with the grey relational methodto select suitable engineers for a software company. Chen et al. [36] used the linguistic VIKOR(Vlsekriterijumska Optimizacija I Kompromisno Resenje) method and skill knowledge map to choosenew staff in accordance with the job requirement. Bangerter et al. [37] selected a suitable personaccording to past performance of applicants based on the signaling theory. Afshari et al. [38] appliedthe fuzzy integral to perform personnel selection when the personnel selection criteria dependedon each other. Sang et al. [39] used fuzzy number to evaluate the weight of each criterion and theperformance of an applicant. Fuzzy TOPSIS was used to rank the applicants. Compared with thetraditional TOPSIS method, their method can maintain computational efficiency to some extent andavoid information loss. Ji et al. [40] considered the risk preference of decision-makers by using amulti-valued linguistic variable to let experts express their opinions. After that, the projection-basediterative multi-criteria decision making (TODIM) method was applied to handle the personnel selectionproblem. The projection-based TODIM method was compared with some traditional MCDM methodsfor verifying feasibility of this method.
Heidary Dahooie et al. [41] designed the competency framework with five criteria in order tochoose the best information technology expert. Grey additive ratio assessment (ARAS-G) and thestepwise weight assessment ratio analysis (SWARA) were integrated to derive the criteria weights andto determine the final ranking order of all candidates. Yalçın and Yapıcı Pehlivan [42] used the hesitantfuzzy linguistic terms to express the evaluation opinions of experts to deal with the personnel selectionproblem. In order to justify the usefulness of this method, fuzzy WASPAS (Weighted Aggregated SumProduct Assessment), fuzzy ARAS, fuzzy EDAS (Evaluation based on Distance from Average Solution),fuzzy TOPSIS, and fuzzy WASPAS were used to analyze and evaluate the personnel selection resultsby using the same data. The experiment result showed that this methodology is stable and efficientfor solving personnel selection problems. Chuang et al. [43] designed a data-driven multi-attributedecision-making model. This model applied a machine learning mechanism to reduce the influence bythe subjectivity experience of the experts. Rough set theory was used to derive an initial influentialsignificance-relation matrix from real assessment data. A dynamic analytic network process wasapplied to acquire the influential significance-network relation map and influential weights from theinitial matrix. PROMETHEE-AS can then be applied to evaluate the gap between the aspiration andcurrent levels for each applicant. Kilic et al. [44] applied DEMATEL and ELECTRE methods to rankthe air-filter manufacturing applicants. Krishankumar et al. [45] used intuitionistic fuzzy set (IFS) toexpress the opinions of experts and combined VIKOR method with IFS to effectively handle personnelselection problem. Ozdemir and Nalbant [46] used five main criteria for evaluating the applicantsin Turkey. They combined consistent fuzzy preference relation (CFPR) with fuzzy analytic hierarchyprocess (FAHP) to rank the performances of those applicants.
3. The 2-Tuple Linguistic Variables
Many quantitative and qualitative factors in general will influence the decision-making of thepersonnel selection. For quantitative criteria, it is easy to use crisp values to express the evaluationvalues, such as working years, the grade of a language test such as TOEIC (Test of English forInternational Communication) grade or TOEFL (Test of English as a Foreign Language) grade, the levelof education, and work licenses [1]. However, decision-makers always find it difficult to express theiropinions for qualitative criteria, such as professionalism, working ability, leadership, communication
Mathematics 2020, 8, 1703 4 of 20
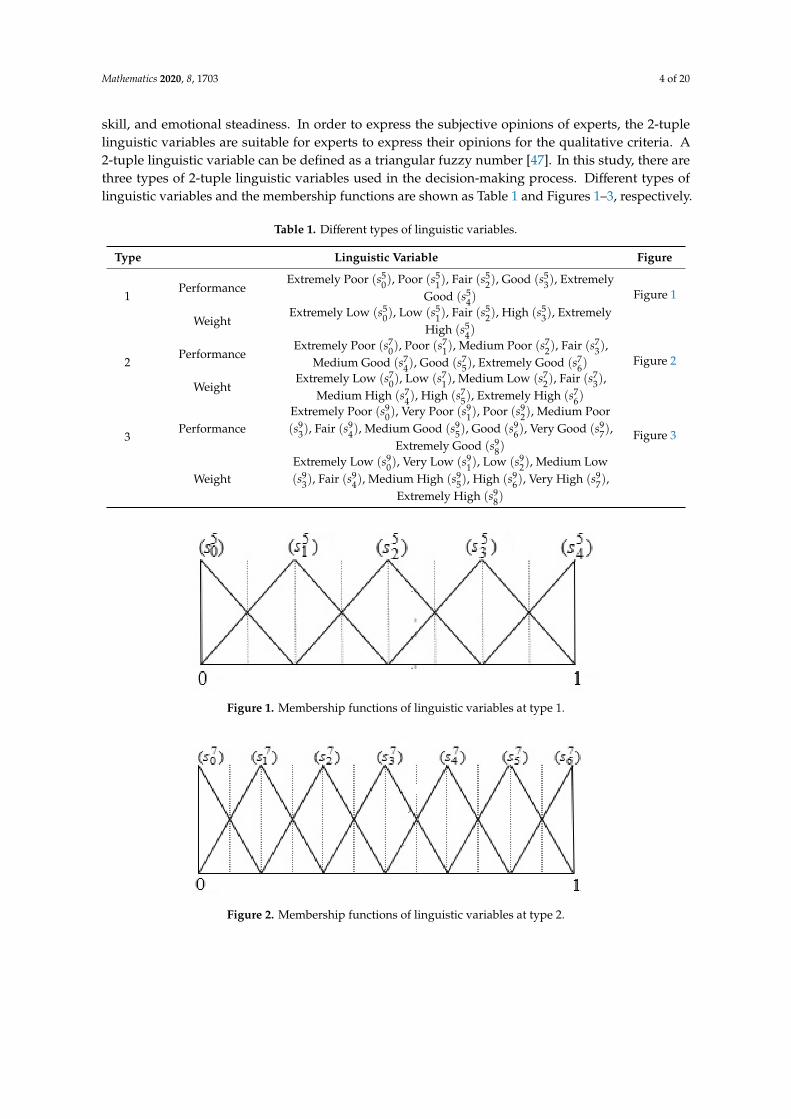
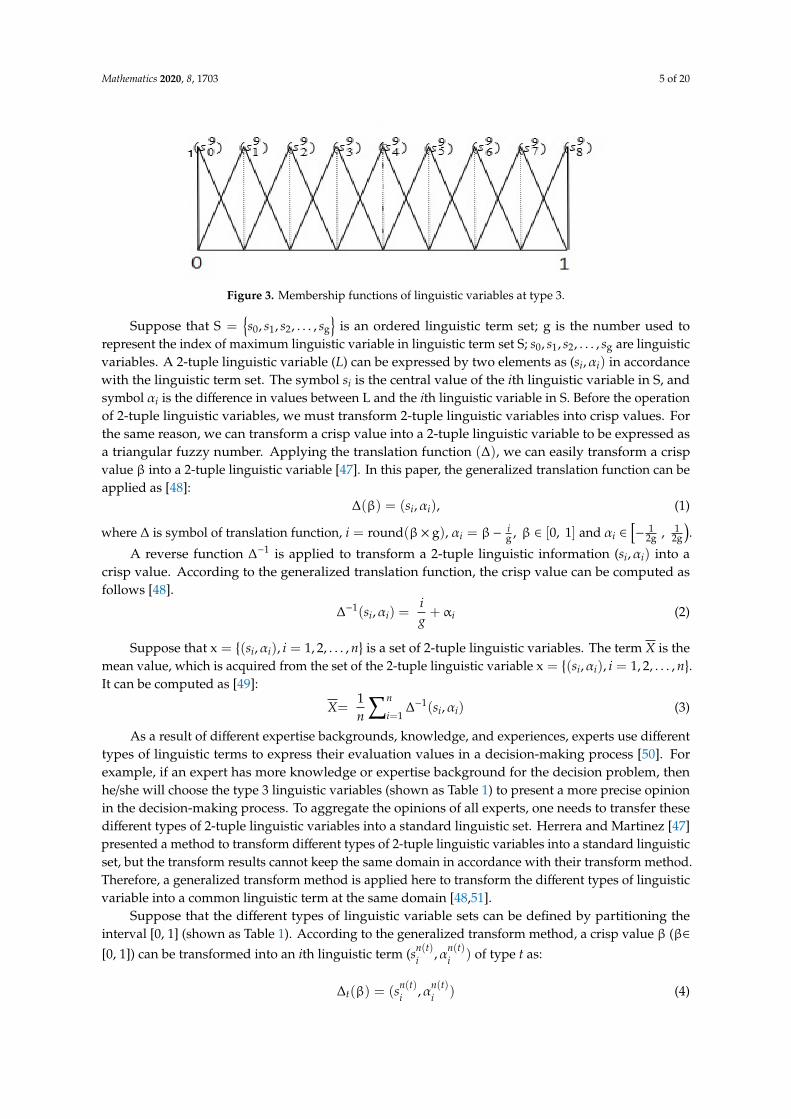
skill, and emotional steadiness. In order to express the subjective opinions of experts, the 2-tuplelinguistic variables are suitable for experts to express their opinions for the qualitative criteria. A2-tuple linguistic variable can be defined as a triangular fuzzy number [47]. In this study, there arethree types of 2-tuple linguistic variables used in the decision-making process. Different types oflinguistic variables and the membership functions are shown as Table 1 and Figures 1–3, respectively.
Table 1. Different types of linguistic variables.
Type Linguistic Variable Figure
1Performance
Extremely Poor (s50), Poor (s5
1), Fair (s52), Good (s5
3), ExtremelyGood (s5
4)Figure 1
WeightExtremely Low (s5
0), Low (s51), Fair (s5
2), High (s53), Extremely
High (s54)
2Performance
Extremely Poor (s70), Poor (s7
1), Medium Poor (s72), Fair (s7
3),Medium Good (s7
4), Good (s75), Extremely Good (s7
6)Figure 2
WeightExtremely Low (s7
0), Low (s71), Medium Low (s7
2), Fair (s73),
Medium High (s74), High (s7
5), Extremely High (s76)
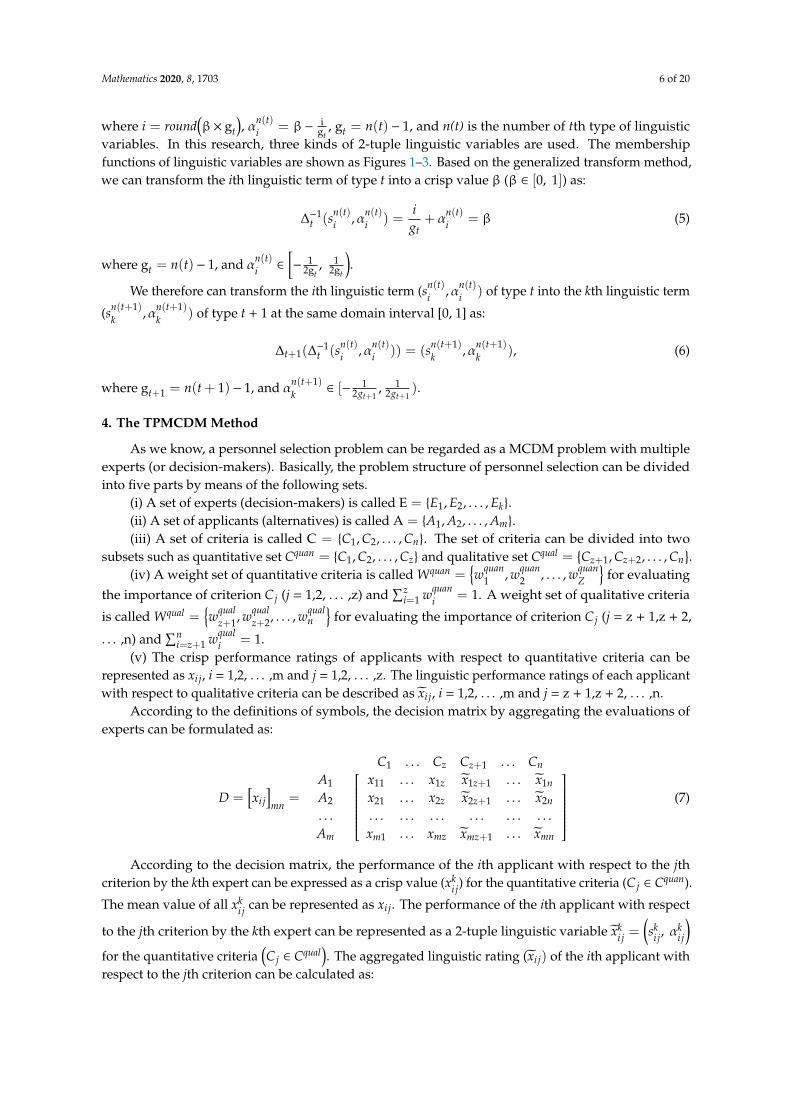
3Performance
Extremely Poor (s90), Very Poor (s9
1), Poor (s92), Medium Poor
(s93), Fair (s9
4), Medium Good (s95), Good (s9
6), Very Good (s97),
Extremely Good (s98)
Figure 3
WeightExtremely Low (s9
0), Very Low (s91), Low (s9
2), Medium Low(s9
3), Fair (s94), Medium High (s9
5), High (s96), Very High (s9
7),Extremely High (s9
8)
Figure 1. Membership functions of linguistic variables at type 1.
Figure 2. Membership functions of linguistic variables at type 2.
Mathematics 2020, 8, 1703 5 of 20
Figure 3. Membership functions of linguistic variables at type 3.
Suppose that S ={s0, s1, s2, . . . , sg
}is an ordered linguistic term set; g is the number used to
represent the index of maximum linguistic variable in linguistic term set S; s0, s1, s2, . . . , sg are linguisticvariables. A 2-tuple linguistic variable (L) can be expressed by two elements as (si,αi) in accordancewith the linguistic term set. The symbol si is the central value of the ith linguistic variable in S, andsymbol αi is the difference in values between L and the ith linguistic variable in S. Before the operationof 2-tuple linguistic variables, we must transform 2-tuple linguistic variables into crisp values. Forthe same reason, we can transform a crisp value into a 2-tuple linguistic variable to be expressed asa triangular fuzzy number. Applying the translation function (∆), we can easily transform a crispvalue β into a 2-tuple linguistic variable [47]. In this paper, the generalized translation function can beapplied as [48]:
∆(β) = (si,αi), (1)
where ∆ is symbol of translation function, i = round(β× g), αi = β− ig , β ∈ [0, 1] and αi ∈
[−
12g , 1
2g
).
A reverse function ∆−1 is applied to transform a 2-tuple linguistic information (si,αi) into acrisp value. According to the generalized translation function, the crisp value can be computed asfollows [48].
∆−1(si,αi) =ig+ αi (2)
Suppose that x ={(si,αi), i = 1, 2, . . . , n
}is a set of 2-tuple linguistic variables. The term X is the
mean value, which is acquired from the set of the 2-tuple linguistic variable x ={(si,αi), i = 1, 2, . . . , n
}.
It can be computed as [49]:
X=1n
∑n
i=1∆−1(si,αi) (3)
As a result of different expertise backgrounds, knowledge, and experiences, experts use differenttypes of linguistic terms to express their evaluation values in a decision-making process [50]. Forexample, if an expert has more knowledge or expertise background for the decision problem, thenhe/she will choose the type 3 linguistic variables (shown as Table 1) to present a more precise opinionin the decision-making process. To aggregate the opinions of all experts, one needs to transfer thesedifferent types of 2-tuple linguistic variables into a standard linguistic set. Herrera and Martinez [47]presented a method to transform different types of 2-tuple linguistic variables into a standard linguisticset, but the transform results cannot keep the same domain in accordance with their transform method.Therefore, a generalized transform method is applied here to transform the different types of linguisticvariable into a common linguistic term at the same domain [48,51].
Suppose that the different types of linguistic variable sets can be defined by partitioning theinterval [0, 1] (shown as Table 1). According to the generalized transform method, a crisp value β (β∈[0, 1]) can be transformed into an ith linguistic term (sn(t)
i ,αn(t)i ) of type t as:
∆t(β) = (sn(t)i ,αn(t)
i ) (4)
Mathematics 2020, 8, 1703 6 of 20
where i = round(β× gt
), αn(t)
i = β− igt
, gt = n(t) − 1, and n(t) is the number of tth type of linguisticvariables. In this research, three kinds of 2-tuple linguistic variables are used. The membershipfunctions of linguistic variables are shown as Figures 1–3. Based on the generalized transform method,we can transform the ith linguistic term of type t into a crisp value β (β ∈ [0, 1]) as:
∆−1t (sn(t)
i ,αn(t)i ) =
igt
+ αn(t)i = β (5)
where gt = n(t) − 1, and αn(t)i ∈
[−
12gt
, 12gt
).
We therefore can transform the ith linguistic term (sn(t)i ,αn(t)
i ) of type t into the kth linguistic term
(sn(t+1)k ,αn(t+1)
k ) of type t + 1 at the same domain interval [0, 1] as:
∆t+1(∆−1t (sn(t)
i ,αn(t)i )) = (sn(t+1)
k ,αn(t+1)k ), (6)
where gt+1 = n(t + 1) − 1, and αn(t+1)k ∈ [− 1
2gt+1, 1
2gt+1).
4. The TPMCDM Method
As we know, a personnel selection problem can be regarded as a MCDM problem with multipleexperts (or decision-makers). Basically, the problem structure of personnel selection can be dividedinto five parts by means of the following sets.
(i) A set of experts (decision-makers) is called E = {E1, E2, . . . , Ek}.(ii) A set of applicants (alternatives) is called A = {A1, A2, . . . , Am}.(iii) A set of criteria is called C = {C1, C2, . . . , Cn}. The set of criteria can be divided into two
subsets such as quantitative set Cquan = {C1, C2, . . . , Cz} and qualitative set Cqual ={Cz+1, Cz+2, . . . , Cn
}.
(iv) A weight set of quantitative criteria is called Wquan ={wquan
1 , wquan2 , . . . , wquan
Z
}for evaluating
the importance of criterion C j (j = 1,2, . . . ,z) and∑z
i=1 wquani = 1. A weight set of qualitative criteria
is called Wqual ={wqual
z+1, wqualz+2, . . . , wqual
n
}for evaluating the importance of criterion C j (j = z + 1,z + 2,
. . . ,n) and∑n
i=z+1 wquali = 1.
(v) The crisp performance ratings of applicants with respect to quantitative criteria can berepresented as xi j, i = 1,2, . . . ,m and j = 1,2, . . . ,z. The linguistic performance ratings of each applicantwith respect to qualitative criteria can be described as xi j, i = 1,2, . . . ,m and j = z + 1,z + 2, . . . ,n.
According to the definitions of symbols, the decision matrix by aggregating the evaluations ofexperts can be formulated as:
D =[xi j
]mn
=
C1 . . . Cz Cz+1 . . . Cn
A1
A2
. . .Am
x11 . . . x1z x1z+1 . . . x1nx21 . . . x2z x2z+1 . . . x2n
. . . . . . . . . . . . . . . . . .xm1 . . . xmz xmz+1 . . . xmn
(7)
According to the decision matrix, the performance of the ith applicant with respect to the jthcriterion by the kth expert can be expressed as a crisp value (xk
i j) for the quantitative criteria (C j ∈ Cquan).
The mean value of all xki j can be represented as xi j. The performance of the ith applicant with respect
to the jth criterion by the kth expert can be represented as a 2-tuple linguistic variable xki j =
(sk
i j, αki j
)for the quantitative criteria
(C j ∈ Cqual
). The aggregated linguistic rating (xi j) of the ith applicant with
respect to the jth criterion can be calculated as:
Mathematics 2020, 8, 1703 7 of 20
xij = ∆(1K
K∑k=1
∆−1(ski j, α
ki j)) = (si j,αi j) (8)
Formula (8) is used to integrate experts’ opinions. The concept of Formula (8) is that an expert’sopinion is transferred as a crisp value by Formula (2). The average value of experts’ opinions (crispvalue type) can be calculated. Finally, experts’ integrated opinions (crisp value type) will be transferredas a 2-tuple linguistic variable by Formula (1).
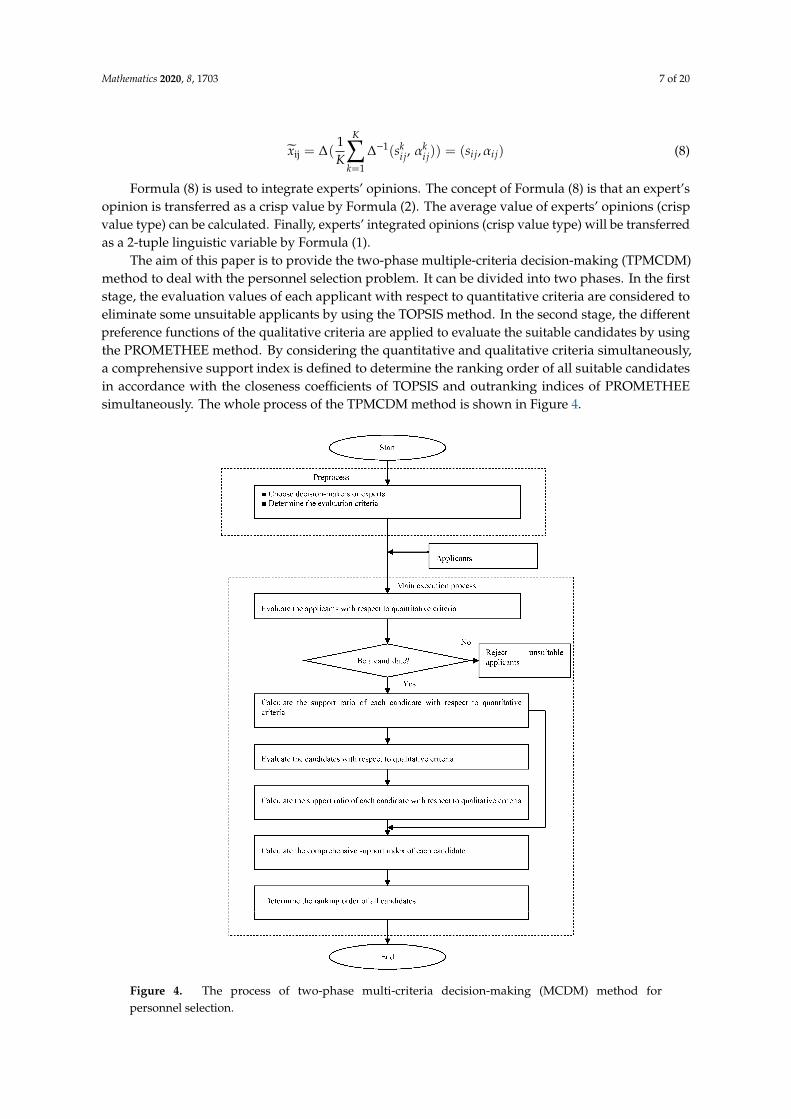
The aim of this paper is to provide the two-phase multiple-criteria decision-making (TPMCDM)method to deal with the personnel selection problem. It can be divided into two phases. In the firststage, the evaluation values of each applicant with respect to quantitative criteria are considered toeliminate some unsuitable applicants by using the TOPSIS method. In the second stage, the differentpreference functions of the qualitative criteria are applied to evaluate the suitable candidates by usingthe PROMETHEE method. By considering the quantitative and qualitative criteria simultaneously,a comprehensive support index is defined to determine the ranking order of all suitable candidatesin accordance with the closeness coefficients of TOPSIS and outranking indices of PROMETHEEsimultaneously. The whole process of the TPMCDM method is shown in Figure 4.Mathematics 2020, 8, 1703 8 of 21
Figure 4. The process of two-phase multi-criteria decision-making (MCDM) method for personnel selection.
4.1. The First Phase
In order to compare the performance ratings of applicants with respect to quantitative criteria more objectively, the performance ratings of applicants can be normalized as:
zjmix
xt
m
iij
ijij ,...,1,...,1,
1
2==
=
=
(9)
The entropy value of the jth quantitative criterion (𝑒 ) can be computed as:
==−==
m
iijij
quanj zjmitt
me
1,..,1,..,1ln
ln1 (10)
Therefore, the weight of the jth quantitative criterion (w ) can be computed as:
Figure 4. The process of two-phase multi-criteria decision-making (MCDM) method forpersonnel selection.
Mathematics 2020, 8, 1703 8 of 20
4.1. The First Phase
In order to compare the performance ratings of applicants with respect to quantitative criteriamore objectively, the performance ratings of applicants can be normalized as:
ti j =xi j√m∑
i=1x2
i j
, i = 1, . . . , m j = 1, . . . , z (9)
The entropy value of the jth quantitative criterion (equanj ) can be computed as:
equanj = −
1ln m
m∑i=1
ti j ln ti ji = 1, . . . , m j = 1, . . . , z (10)
Therefore, the weight of the jth quantitative criterion (wquanj ) can be computed as:
wquanj =
1− equanj
z∑j=1
1− equanj
i = 1, . . . , m j = 1, . . . , z (11)
We construct the weighted normalized decision matrix as:
V = [vi j], i = 1, . . . , m j = 1, . . . , z, (12)
where vi j = ti j ∗wquanj .
According to the weighted normalized decision matrix, the positive-ideal solution (PIS, A∗) andnegative-ideal solution (NIS, A−) can be defined as A∗ =
(v∗1, v∗2, . . . , v∗Z
)and A− =
(v−1 , v−2 , . . . , v−Z
),
where v∗j = maxi{vi j
}and v−j = mini
{vi j
}.
The distance of each applicant Ai (i = 1, 2, . . . , m) from A∗ and A− can be currently calculated as:
d∗i = d(Ai, A∗) =
√√√ z∑j=1
(v+j − vi j
)2(13)
d−i = d(Ai, A−) =
√√√ z∑j=1
(vi j − v−j
)2(14)
The closeness coefficient (CC(Ai)) of each applicant is calculated as:
CC(Ai) =d−i
d∗i + d−i, (15)
where 0 ≤ CC(Ai) ≤ 1.If CC(Ai) = 1, then Ai is the best applicant. If CC(Ai) = 0, then Ai is the worst applicant. If
CC(Ai) ≥ CC(A j
), then applicant Ai is preferred to A j. Therefore, we can determine the ranking order
of all applicants in accordance with closeness coefficients.From the closeness coefficients of all applicants, we choose some suitable applicants to evaluate in
accordance with their ranking order. If we set the elimination ratio as Re, then the number of qualifiedapplicants can be determined as:
Gb ={Ai
∣∣∣Rank(Ai) ≤ Round(m ∗ (1−Re))}, (16)
Mathematics 2020, 8, 1703 9 of 20
where Gb represents the set of qualified applicants. Rank(Ai) represents the rank of applicant Ai inaccordance with the closeness coefficient. Round(m ∗ (1−Re)) represents the number of applicantsneeded to be evaluated at the next stage.
According to the closeness coefficients of qualified applicants, a support ratio of each qualifiedapplicant with respect to quantitative criteria can be defined as:
SRquan(Ai) =CC(Ai)∑
Ai∈Gb
CC(Ai), (17)
where 0 ≤ SRquan(Ai) ≤ 1.
4.2. The Second Phase
At the second stage, we evaluate the qualified applicants (suitable applicants or candidates) inaccordance with qualitative criteria. For any two suitable applicants Ai and AS (Ai,As∈Gb), the differencevalue between them with respect to qualitative criterion j can be expressed as dis
j= ∆−1
(xij
)− ∆−1
(xsj
).
Therefore, a preference degree of suitable applicant Ai over AS for qualitative criterion j is defined as:
P j(Ai, As) = Hj(xij, xsj
)= H j(dis
j ), (18)
where 0 ≤ P j(Ai, As) ≤ 1. The symbol P j(Ai, As) represents the preference degree of suitable applicantAi over AS with respect to the jth criterion. Here, H j(∗) is a preference function of the jth criterion.
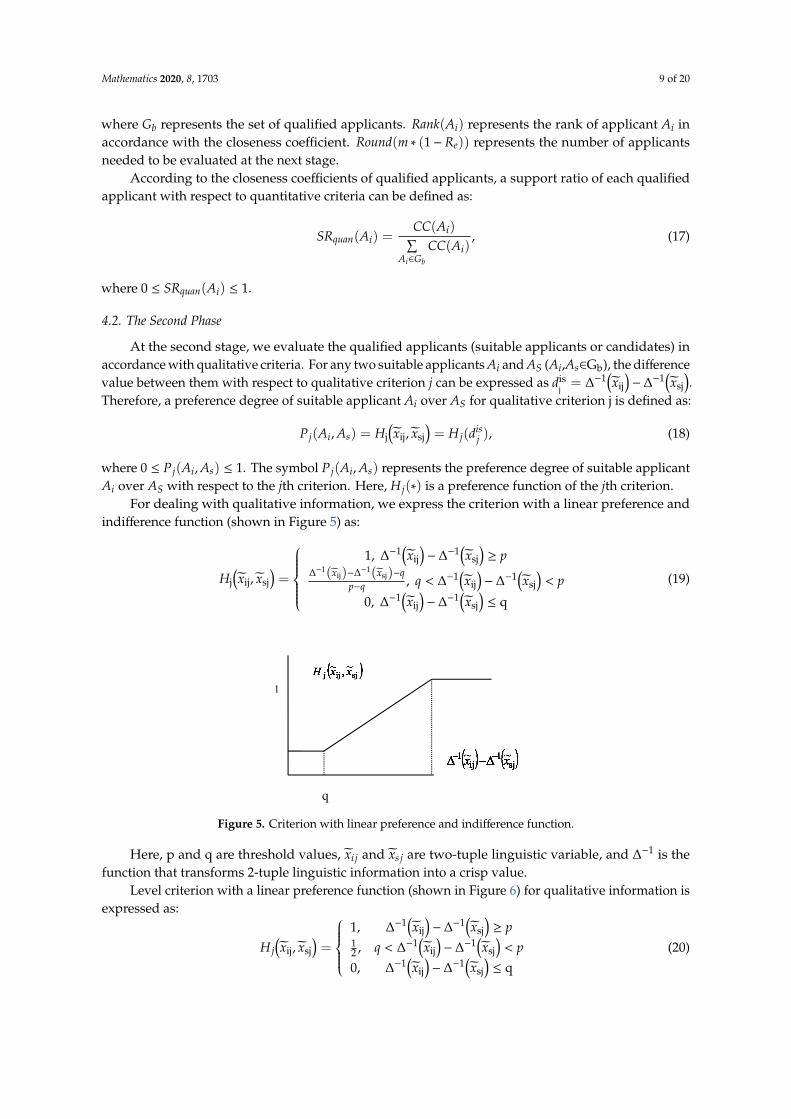
For dealing with qualitative information, we express the criterion with a linear preference andindifference function (shown in Figure 5) as:
Hj(xij, xsj
)=
1, ∆−1
(xij
)− ∆−1
(xsj
)≥ p
∆−1(xij)−∆−1(xsj)−qp−q , q < ∆−1
(xij
)− ∆−1
(xsj
)< p
0, ∆−1(xij
)− ∆−1
(xsj
)≤ q
(19)
Mathematics 2020, 8, 1703 10 of 21
( ) ( ) )(~,~, sjijjisjjsij dHxxHAAP == , (18)
where ( ) 1,0 ≤≤ sij AAP . The symbol ( )sij AAP , represents the preference degree of suitable
applicant 𝐴 over 𝐴 with respect to the jth criterion. Here, ( )*jH is a preference function of the
jth criterion. For dealing with qualitative information, we express the criterion with a linear preference and
indifference function (shown in Figure 5) as:
( )
( ) ( )( ) ( ) ( ) ( )
( ) ( )
≤Δ−Δ
<Δ−Δ<−
−Δ−Δ
≥Δ−Δ
=
−−
−−−−
−−
q~~,0
~~,~~
~~,1
~,~
sj1
ij1
sj1
ij1sj
1ij
1
sj1
ij1
sjijj
xx
pxxqqp
qxx
pxx
xxH
(19)
Here, p and q are threshold values, 𝑥 and 𝑥 are two-tuple linguistic variable, and ∆ is the function that transforms 2-tuple linguistic information into a crisp value.
Figure 5. Criterion with linear preference and indifference function.
Level criterion with a linear preference function (shown in Figure 6) for qualitative information is expressed as:
( )
( ) ( )
( ) ( )( ) ( )
≤Δ−Δ
<Δ−Δ<
≥Δ−Δ
=
−−
−−
−−
q~~,0
~~,21
~~,1
~,~
sj1
ij1
sj1
ij1
sj1
ij1
sjij
xx
pxxq
pxx
xxH j
(20)
Figure 6. Level criterion with linear preference function.
The entropy value of the jth qualitative criterion (𝑒 ) can be computed as:
q
1
q
1
0.5
Figure 5. Criterion with linear preference and indifference function.
Here, p and q are threshold values, xi j and xsj are two-tuple linguistic variable, and ∆−1 is thefunction that transforms 2-tuple linguistic information into a crisp value.
Level criterion with a linear preference function (shown in Figure 6) for qualitative information isexpressed as:
H j(xij, xsj
)=
1, ∆−1
(xij
)− ∆−1
(xsj
)≥ p
12 , q < ∆−1
(xij
)− ∆−1
(xsj
)< p
0, ∆−1(xij
)− ∆−1
(xsj
)≤ q
(20)

Mathematics 2020, 8, 1703 10 of 20
Mathematics 2020, 8, 1703 10 of 21
( ) ( ) )(~,~, sjijjisjjsij dHxxHAAP == , (18)
where ( ) 1,0 ≤≤ sij AAP . The symbol ( )sij AAP , represents the preference degree of suitable
applicant 𝐴 over 𝐴 with respect to the jth criterion. Here, ( )*jH is a preference function of the
jth criterion. For dealing with qualitative information, we express the criterion with a linear preference and
indifference function (shown in Figure 5) as:
( )
( ) ( )( ) ( ) ( ) ( )
( ) ( )
≤Δ−Δ
<Δ−Δ<−
−Δ−Δ
≥Δ−Δ
=
−−
−−−−
−−
q~~,0
~~,~~
~~,1
~,~
sj1
ij1
sj1
ij1sj
1ij
1
sj1
ij1
sjijj
xx
pxxqqp
qxx
pxx
xxH
(19)
Here, p and q are threshold values, 𝑥 and 𝑥 are two-tuple linguistic variable, and ∆ is the function that transforms 2-tuple linguistic information into a crisp value.
Figure 5. Criterion with linear preference and indifference function.
Level criterion with a linear preference function (shown in Figure 6) for qualitative information is expressed as:
( )
( ) ( )
( ) ( )( ) ( )
≤Δ−Δ
<Δ−Δ<
≥Δ−Δ
=
−−
−−
−−
q~~,0
~~,21
~~,1
~,~
sj1
ij1
sj1
ij1
sj1
ij1
sjij
xx
pxxq
pxx
xxH j
(20)
Figure 6. Level criterion with linear preference function.
The entropy value of the jth qualitative criterion (𝑒 ) can be computed as:
q
1
q
1
0.5
Figure 6. Level criterion with linear preference function.
The entropy value of the jth qualitative criterion (equalj ) can be computed as:
equalj = −
1ln|Gb|
∑Ai∈Gb
∆−1(xij
)∗ ln
(∆−1
(xij
)), i = 1, . . . , |Gb| j = z + 1, . . . , n (21)
Here, |Gb| is the number of elements in set Gb.The weight of the jth qualitative criterion (wqual
j ) can be computed as:
wqualj =
1− equalj
n∑j=z+1
(1− equal
j
) i = 1, . . . , |Gb| j = z + 1, . . . , n (22)
The overall preference index of suitable applicant Ai over As can be represented as:
π(Ai, As) =n∑
j=z+1
wqualj ∗H j
(dis
j
)(23)
The leaving flow of Ai can be calculated as:
ϕ+(Ai) =∑
As∈Gb
π(Ai, As), (24)
where ϕ+(Ai) is the dominating degree of Ai over the other suitable applicants.The entering flow of Ai can be calculated as:
ϕ−(Ai) =∑
As∈Gb
π(As, Ai), (25)
where ϕ−(Ai) is the dominating degree of Ai by the other suitable applicants.The net flow of Ai can be calculated as:
ϕ(Ai) = ϕ+(Ai) −ϕ−(Ai) (26)
We define the outranking index of candidate Ai as:
OTI(Ai) =
ϕ(Ai)
|Gb|−1+ 1
2, (27)
where 0 ≤ OTI(Ai) ≤ 1, and Ai ∈ Gb.
Mathematics 2020, 8, 1703 11 of 20
According to the outranking index of each suitable applicant by using the PROMETHEE method,a support ratio of each suitable applicant with respect to qualitative criteria is calculated as:
SRqual(Ai) =OTI(Ai)∑
Ai∈Gb
OTI(Ai), (28)
where 0 ≤ SRqual(Ai) ≤ 1.We can therefore define a comprehensive support index of each suitable applicant by considering
the quantitative and qualitative criteria simultaneously as:
SRcomp(Ai) = DP ∗(SRquan(Ai)
)+
(1−Dp
)∗
(SRqual(Ai)
), (29)
where DP is the preference index of the final decision-maker, and 0 ≤ DP ≤ 1.If DP = 1, then it means that the decision-maker selects a qualified applicant according to
quantitative information. If DP = 0, then it means that the decision-maker depends on qualitativeinformation to select the qualified applicants. The higher the comprehensive support index SRcomp(Ai)
is, the better suitable applicant Ai is. Finally, the ranking order of all suitable applicants in Gb can bedetermined in accordance with the comprehensive support indices.
5. Numerical Example
In order to illustrate the computational process of the two-phase multiple-criteria decision-making(TPMCDM) method for the personnel selection clearly, a selection problem of an overseas marketingmanager is shown in this section. A decision-making committee consists of three experts to choose thebest overseas marketing manager from twenty applicants. The influence factors of personnel selectionwere first collected from the literatures and a questionnaire was designed for asking managers ofenterprises to obtain the evaluation criteria. There are eight criteria (shown as Table 2) used to evaluatethe applicants. Quantitative criteria include English ability (C1), educational background (C2), workexperience (C3), and license (C4). Qualitative criteria include communication skill (C5), innovationability (C6), advertise design ability (C7), and emotional steadiness (C8). According to the TPMCDMmethod, the computational steps of this selection problem are summarized as follows.
Table 2. The description of each criterion.
Criterion Data Type Preference Function
C1 Language ability (TOEIC) Quantitative Criterion with linear preference and indifference areaC2 Educational background Quantitative Level criterion with linear preferenceC3 Work experience (Year) Quantitative Level criterion with linear preferenceC4 License Quantitative Criterion with linear preference and indifference areaC5 Communication skill Qualitative Criterion with linear preference and indifference areaC6 Innovation ability Qualitative Level criterion with linear preferenceC7 Advertise design ability Qualitative Criterion with linear preference and indifference areaC8 Emotional steadiness Qualitative Level criterion with linear preference
5.1. The Computational Steps Based on Quantitative Criteria
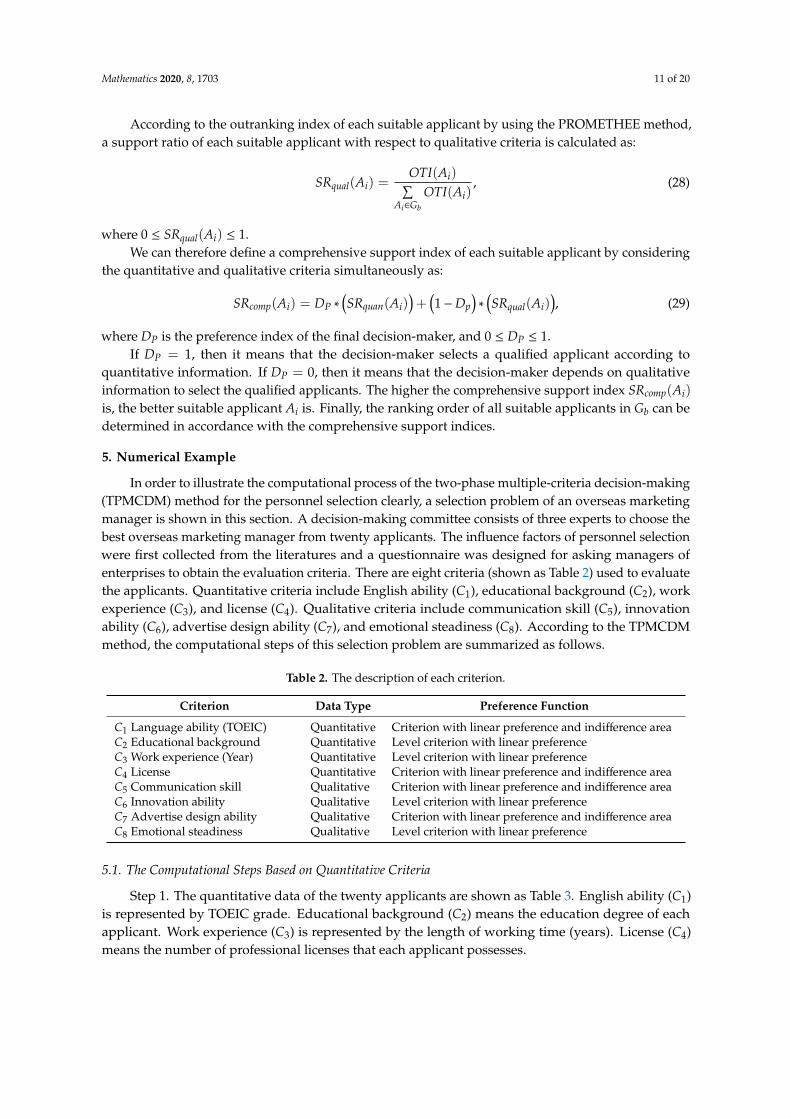
Step 1. The quantitative data of the twenty applicants are shown as Table 3. English ability (C1)is represented by TOEIC grade. Educational background (C2) means the education degree of eachapplicant. Work experience (C3) is represented by the length of working time (years). License (C4)means the number of professional licenses that each applicant possesses.
Mathematics 2020, 8, 1703 12 of 20
Table 3. Quantitative information of each applicant.
A1 A2 A3 A4 A5 A6 A7 A8 A9 A10
C1 815 280 220 550 290 870 450 840 150 330C2 1 8 1 6 2 5 6 4 3 7C3 3 4 3 4 1 4 3 2 3 1C4 2 7 3 4 5 6 3 2 7 4
A11 A12 A13 A14 A15 A16 A17 A18 A19 A20
C1 660 330 450 480 640 220 280 600 720 440C2 1 5 7 10 3 4 5 6 7 2C3 2 4 2 3 2 1 4 2 3 2C4 8 8 4 10 4 5 1 7 2 1
Step 2. Based on Table 3, calculate the normalized values and the weights of quantitative criteriaby using the entropy method as Table 4.
Table 4. The weight of each quantitative criterion.
w1 w2 w3 w4
0.243 0.243 0.260 0.243
Step 3. Calculate the weighted normalized matrix and determine the positive ideal solution (A∗,PIS) and the negative ideal solution (A−, NIS).
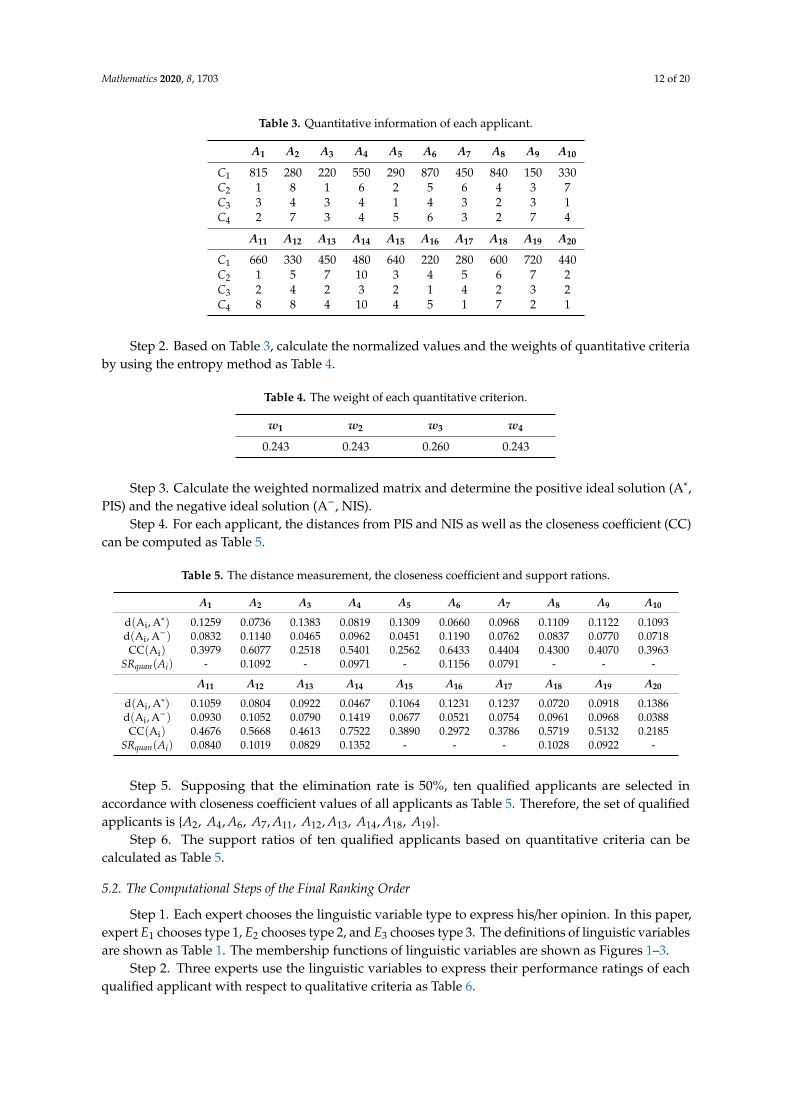
Step 4. For each applicant, the distances from PIS and NIS as well as the closeness coefficient (CC)can be computed as Table 5.
Table 5. The distance measurement, the closeness coefficient and support rations.
A1 A2 A3 A4 A5 A6 A7 A8 A9 A10
d(Ai, A∗) 0.1259 0.0736 0.1383 0.0819 0.1309 0.0660 0.0968 0.1109 0.1122 0.1093d(Ai, A−) 0.0832 0.1140 0.0465 0.0962 0.0451 0.1190 0.0762 0.0837 0.0770 0.0718CC(Ai) 0.3979 0.6077 0.2518 0.5401 0.2562 0.6433 0.4404 0.4300 0.4070 0.3963
SRquan(Ai) - 0.1092 - 0.0971 - 0.1156 0.0791 - - -
A11 A12 A13 A14 A15 A16 A17 A18 A19 A20
d(Ai, A∗) 0.1059 0.0804 0.0922 0.0467 0.1064 0.1231 0.1237 0.0720 0.0918 0.1386d(Ai, A−) 0.0930 0.1052 0.0790 0.1419 0.0677 0.0521 0.0754 0.0961 0.0968 0.0388CC(Ai) 0.4676 0.5668 0.4613 0.7522 0.3890 0.2972 0.3786 0.5719 0.5132 0.2185
SRquan(Ai) 0.0840 0.1019 0.0829 0.1352 - - - 0.1028 0.0922 -
Step 5. Supposing that the elimination rate is 50%, ten qualified applicants are selected inaccordance with closeness coefficient values of all applicants as Table 5. Therefore, the set of qualifiedapplicants is {A2, A4, A6, A7, A11, A12, A13, A14, A18, A19}.
Step 6. The support ratios of ten qualified applicants based on quantitative criteria can becalculated as Table 5.
5.2. The Computational Steps of the Final Ranking Order
Step 1. Each expert chooses the linguistic variable type to express his/her opinion. In this paper,expert E1 chooses type 1, E2 chooses type 2, and E3 chooses type 3. The definitions of linguistic variablesare shown as Table 1. The membership functions of linguistic variables are shown as Figures 1–3.
Step 2. Three experts use the linguistic variables to express their performance ratings of eachqualified applicant with respect to qualitative criteria as Table 6.
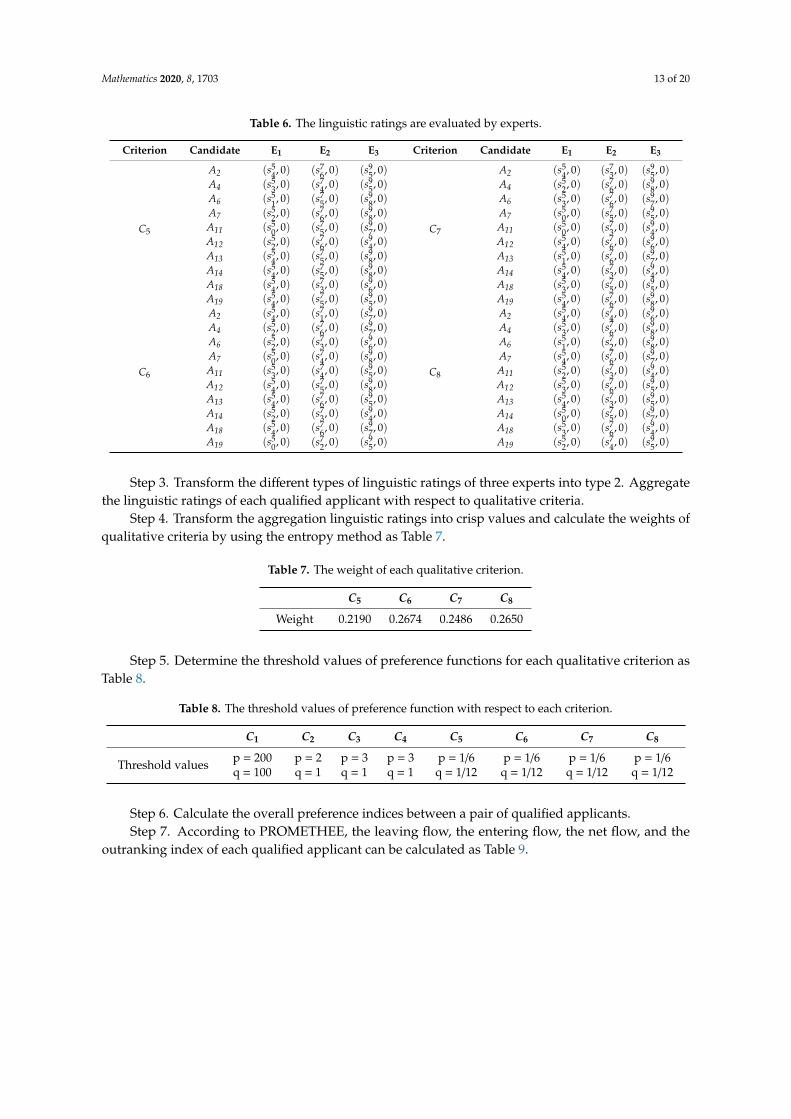
Mathematics 2020, 8, 1703 13 of 20
Table 6. The linguistic ratings are evaluated by experts.
Criterion Candidate E1 E2 E3 Criterion Candidate E1 E2 E3
C5
A2 (s54, 0) (s7
6, 0) (s95, 0)
C7
A2 (s54, 0) (s7
3, 0) (s95, 0)
A4 (s53, 0) (s7
4, 0) (s95, 0) A4 (s5
2, 0) (s76, 0) (s9
8, 0)A6 (s5
1, 0) (s75, 0) (s9
8, 0) A6 (s53, 0) (s7
6, 0) (s97, 0)
A7 (s52, 0) (s7
6, 0) (s98, 0) A7 (s5
0, 0) (s75, 0) (s9
5, 0)A11 (s5
0, 0) (s75, 0) (s9
7, 0) A11 (s50, 0) (s7
3, 0) (s94, 0)
A12 (s52, 0) (s7
6, 0) (s94, 0) A12 (s5
4, 0) (s76, 0) (s9
6, 0)A13 (s5
4, 0) (s75, 0) (s9
8, 0) A13 (s51, 0) (s7
6, 0) (s97, 0)
A14 (s54, 0) (s7
5, 0) (s98, 0) A14 (s5
4, 0) (s73, 0) (s9
4, 0)A18 (s5
4, 0) (s73, 0) (s9
6, 0) A18 (s53, 0) (s7
5, 0) (s95, 0)
A19 (s54, 0) (s7
5, 0) (s95, 0) A19 (s5
4, 0) (s76, 0) (s9
8, 0)
C6
A2 (s54, 0) (s7
1, 0) (s97, 0)
C8
A2 (s54, 0) (s7
4, 0) (s96, 0)
A4 (s52, 0) (s7
6, 0) (s97, 0) A4 (s5
3, 0) (s76, 0) (s9
8, 0)A6 (s5
2, 0) (s73, 0) (s9
6, 0) A6 (s51, 0) (s7
2, 0) (s98, 0)
A7 (s50, 0) (s7
4, 0) (s98, 0) A7 (s5
4, 0) (s76, 0) (s9
7, 0)A11 (s5
3, 0) (s74, 0) (s9
5, 0) A11 (s52, 0) (s7
3, 0) (s94, 0)
A12 (s54, 0) (s7
5, 0) (s98, 0) A12 (s5
3, 0) (s76, 0) (s9
5, 0)A13 (s5
4, 0) (s76, 0) (s9
5, 0) A13 (s54, 0) (s7
3, 0) (s95, 0)
A14 (s52, 0) (s7
3, 0) (s94, 0) A14 (s5
0, 0) (s75, 0) (s9
7, 0)A18 (s5
4, 0) (s76, 0) (s9
7, 0) A18 (s53, 0) (s7
6, 0) (s94, 0)
A19 (s50, 0) (s7
2, 0) (s95, 0) A19 (s5
2, 0) (s74, 0) (s9
5, 0)
Step 3. Transform the different types of linguistic ratings of three experts into type 2. Aggregatethe linguistic ratings of each qualified applicant with respect to qualitative criteria.
Step 4. Transform the aggregation linguistic ratings into crisp values and calculate the weights ofqualitative criteria by using the entropy method as Table 7.
Table 7. The weight of each qualitative criterion.
C5 C6 C7 C8
Weight 0.2190 0.2674 0.2486 0.2650
Step 5. Determine the threshold values of preference functions for each qualitative criterion asTable 8.
Table 8. The threshold values of preference function with respect to each criterion.
C1 C2 C3 C4 C5 C6 C7 C8
Threshold values p = 200q = 100
p = 2q = 1
p = 3q = 1
p = 3q = 1
p = 1/6q = 1/12
p = 1/6q = 1/12
p = 1/6q = 1/12
p = 1/6q = 1/12
Step 6. Calculate the overall preference indices between a pair of qualified applicants.Step 7. According to PROMETHEE, the leaving flow, the entering flow, the net flow, and the
outranking index of each qualified applicant can be calculated as Table 9.
Mathematics 2020, 8, 1703 14 of 20
Table 9. The leaving flow, the entering flow, the net flow and outranking index of each candidate.
ϕ+(Ai) ϕ−(Ai) ϕ(Ai) OTI(Ai)
A2 3.5602 2.0710 1.4893 0.5827A4 4.2924 1.6354 2.6570 0.6476A6 1.9195 3.9636 −2.0440 0.3864A7 3.0959 3.3062 −0.2102 0.4883A11 0.8021 6.3876 −5.5855 0.1897A12 4.3260 1.3237 3.0023 0.6668A13 4.1420 2.0393 2.1027 0.6168A14 2.0424 4.1897 −2.1473 0.3807A18 3.6810 1.6495 2.0314 0.6129A19 2.6544 3.9501 −1.2957 0.4280
Step 8. Based on the support ratios of quantitative and qualitative criteria, a comprehensivesupport index of each qualified applicant can be calculated as Table 10. If the preference index of the finaldecision-maker is 0.5 (i.e., DP = 0.5), then the ranking order of all qualified applicants in accordancewith comprehensive support indices is {A12 > A4 > A2 > A18 > A14 > A13 > A6 > A19 > A7 > A11}.
Table 10. Comprehensive support indices of candidates.
SRquan(Ai) SRqual(Ai) SRcomp(Ai)
A2 0.1092 0.1165 0.1129A4 0.0971 0.1295 0.1133A6 0.1156 0.0773 0.0965A7 0.0791 0.0977 0.0884A11 0.0840 0.0379 0.0610A12 0.1019 0.1334 0.1176A13 0.0829 0.1234 0.1031A14 0.1352 0.0761 0.1057A18 0.1028 0.1226 0.1127A19 0.0922 0.0856 0.0889
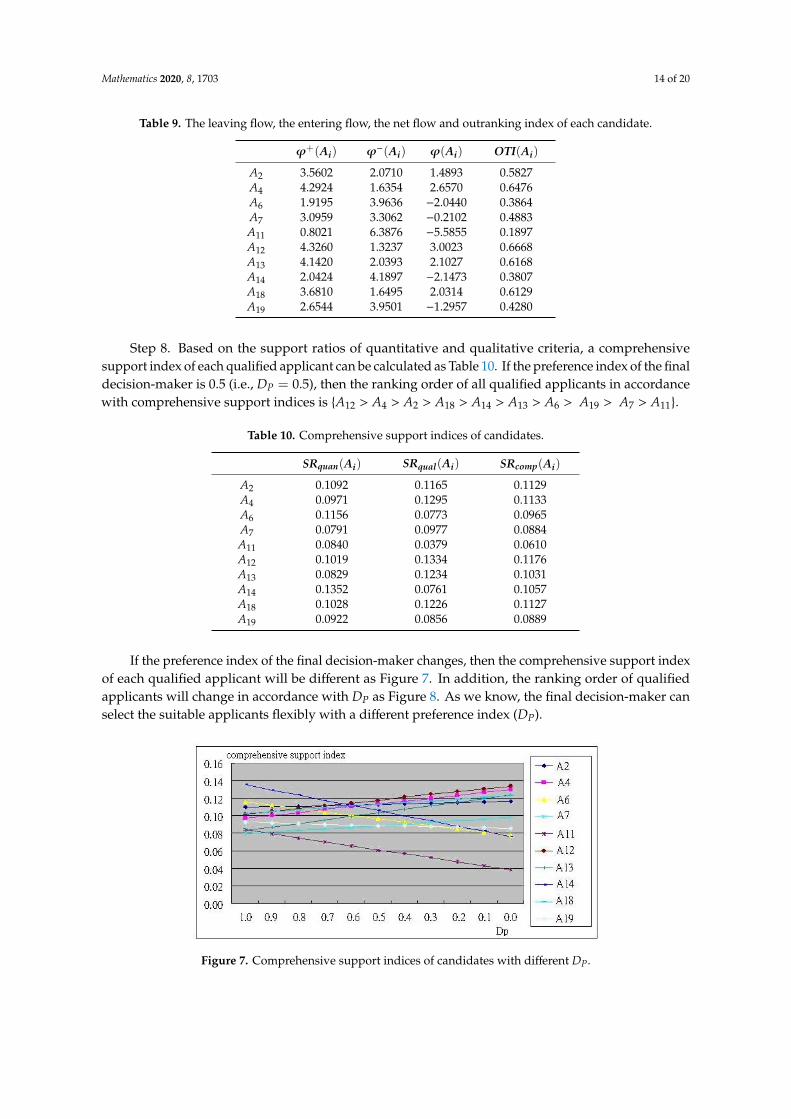
If the preference index of the final decision-maker changes, then the comprehensive support indexof each qualified applicant will be different as Figure 7. In addition, the ranking order of qualifiedapplicants will change in accordance with DP as Figure 8. As we know, the final decision-maker canselect the suitable applicants flexibly with a different preference index (DP).
Mathematics 2020, 8, 1703 15 of 21
A12 4.3260 1.3237 3.0023 0.6668 A13 4.1420 2.0393 2.1027 0.6168 A14 2.0424 4.1897 −2.1473 0.3807 A18 3.6810 1.6495 2.0314 0.6129 A19 2.6544 3.9501 −1.2957 0.4280
Table 10. Comprehensive support indices of candidates.
𝑺𝑹𝒒𝒖𝒂𝒏(𝑨𝒊) 𝑺𝑹𝒒𝒖𝒂𝒍(𝑨𝒊) 𝑺𝑹𝒄𝒐𝒎𝒑(𝑨𝒊) A2 0.1092 0.1165 0.1129 A4 0.0971 0.1295 0.1133 A6 0.1156 0.0773 0.0965 A7 0.0791 0.0977 0.0884 A11 0.0840 0.0379 0.0610 A12 0.1019 0.1334 0.1176 A13 0.0829 0.1234 0.1031 A14 0.1352 0.0761 0.1057 A18 0.1028 0.1226 0.1127 A19 0.0922 0.0856 0.0889
Figure 7. Comprehensive support indices of candidates with different PD .
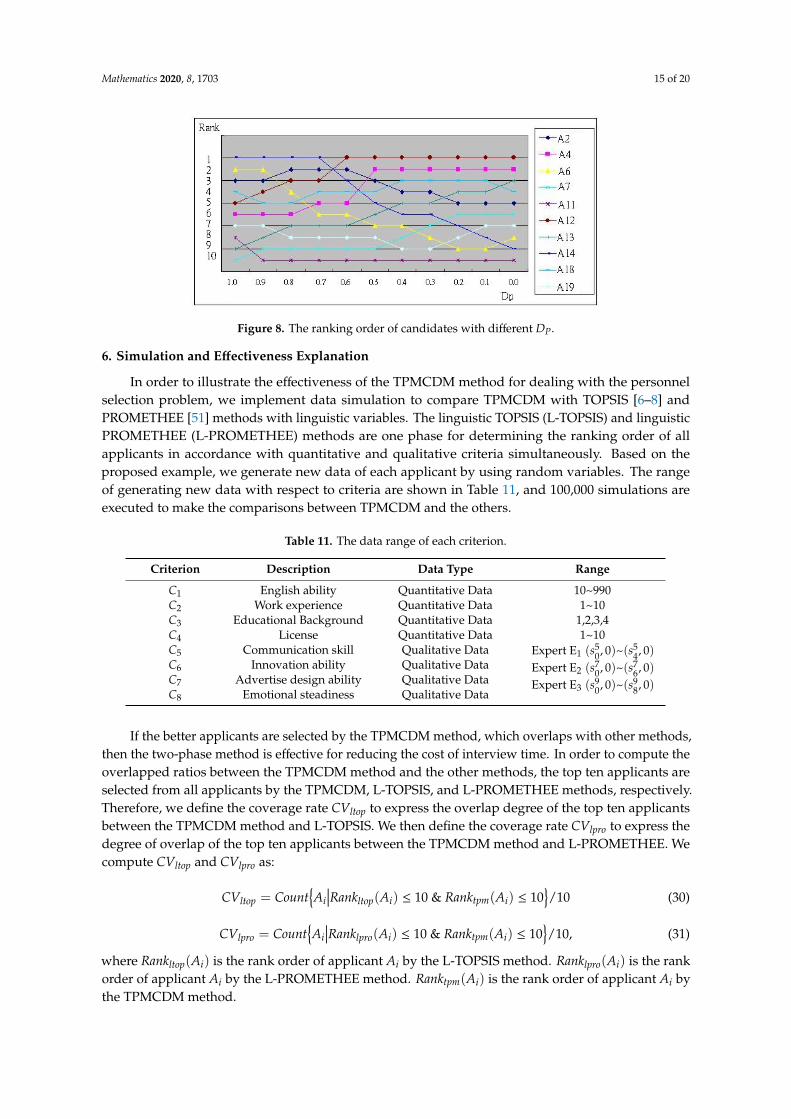
Figure 8. The ranking order of candidates with different PD .
6. Simulation and Effectiveness Explanation
In order to illustrate the effectiveness of the TPMCDM method for dealing with the personnel selection problem, we implement data simulation to compare TPMCDM with TOPSIS [6–8] and PROMETHEE [51] methods with linguistic variables. The linguistic TOPSIS (L-TOPSIS) and linguistic PROMETHEE (L-PROMETHEE) methods are one phase for determining the ranking order of all
Figure 7. Comprehensive support indices of candidates with different DP.
Mathematics 2020, 8, 1703 15 of 20
Mathematics 2020, 8, 1703 15 of 21
A12 4.3260 1.3237 3.0023 0.6668 A13 4.1420 2.0393 2.1027 0.6168 A14 2.0424 4.1897 −2.1473 0.3807 A18 3.6810 1.6495 2.0314 0.6129 A19 2.6544 3.9501 −1.2957 0.4280
Table 10. Comprehensive support indices of candidates.
𝑺𝑹𝒒𝒖𝒂𝒏(𝑨𝒊) 𝑺𝑹𝒒𝒖𝒂𝒍(𝑨𝒊) 𝑺𝑹𝒄𝒐𝒎𝒑(𝑨𝒊) A2 0.1092 0.1165 0.1129 A4 0.0971 0.1295 0.1133 A6 0.1156 0.0773 0.0965 A7 0.0791 0.0977 0.0884 A11 0.0840 0.0379 0.0610 A12 0.1019 0.1334 0.1176 A13 0.0829 0.1234 0.1031 A14 0.1352 0.0761 0.1057 A18 0.1028 0.1226 0.1127 A19 0.0922 0.0856 0.0889
Figure 7. Comprehensive support indices of candidates with different PD .
Figure 8. The ranking order of candidates with different PD .
6. Simulation and Effectiveness Explanation
In order to illustrate the effectiveness of the TPMCDM method for dealing with the personnel selection problem, we implement data simulation to compare TPMCDM with TOPSIS [6–8] and PROMETHEE [51] methods with linguistic variables. The linguistic TOPSIS (L-TOPSIS) and linguistic PROMETHEE (L-PROMETHEE) methods are one phase for determining the ranking order of all
Figure 8. The ranking order of candidates with different DP.
6. Simulation and Effectiveness Explanation
In order to illustrate the effectiveness of the TPMCDM method for dealing with the personnelselection problem, we implement data simulation to compare TPMCDM with TOPSIS [6–8] andPROMETHEE [51] methods with linguistic variables. The linguistic TOPSIS (L-TOPSIS) and linguisticPROMETHEE (L-PROMETHEE) methods are one phase for determining the ranking order of allapplicants in accordance with quantitative and qualitative criteria simultaneously. Based on theproposed example, we generate new data of each applicant by using random variables. The rangeof generating new data with respect to criteria are shown in Table 11, and 100,000 simulations areexecuted to make the comparisons between TPMCDM and the others.
Table 11. The data range of each criterion.
Criterion Description Data Type Range
C1 English ability Quantitative Data 10~990C2 Work experience Quantitative Data 1~10C3 Educational Background Quantitative Data 1,2,3,4C4 License Quantitative Data 1~10C5 Communication skill Qualitative Data Expert E1 (s5
0, 0)~(s54, 0)
Expert E2 (s70, 0)~(s7
6, 0)Expert E3 (s9
0, 0)~(s98, 0)
C6 Innovation ability Qualitative DataC7 Advertise design ability Qualitative DataC8 Emotional steadiness Qualitative Data
If the better applicants are selected by the TPMCDM method, which overlaps with other methods,then the two-phase method is effective for reducing the cost of interview time. In order to compute theoverlapped ratios between the TPMCDM method and the other methods, the top ten applicants areselected from all applicants by the TPMCDM, L-TOPSIS, and L-PROMETHEE methods, respectively.Therefore, we define the coverage rate CVltop to express the overlap degree of the top ten applicantsbetween the TPMCDM method and L-TOPSIS. We then define the coverage rate CVlpro to express thedegree of overlap of the top ten applicants between the TPMCDM method and L-PROMETHEE. Wecompute CVltop and CVlpro as:
CVltop = Count{Ai
∣∣∣Rankltop(Ai) ≤ 10 & Ranktpm(Ai) ≤ 10}/10 (30)
CVlpro = Count{Ai
∣∣∣Ranklpro(Ai) ≤ 10 & Ranktpm(Ai) ≤ 10}/10, (31)
where Rankltop(Ai) is the rank order of applicant Ai by the L-TOPSIS method. Ranklpro(Ai) is the rankorder of applicant Ai by the L-PROMETHEE method. Ranktpm(Ai) is the rank order of applicant Ai bythe TPMCDM method.
Mathematics 2020, 8, 1703 16 of 20
As we know, the TPMCDM method eliminates some applicants in the first step for saving oninterview time and cost. Under this situation, the elimination ratio and coverage rate exhibit a trade-off
relationship to select the better applicants for managers. A higher elimination ratio at the first step mayproduce a lower coverage rate. A lower elimination ratio at the first step cannot reduce the interviewtime and cost for managers effectively.
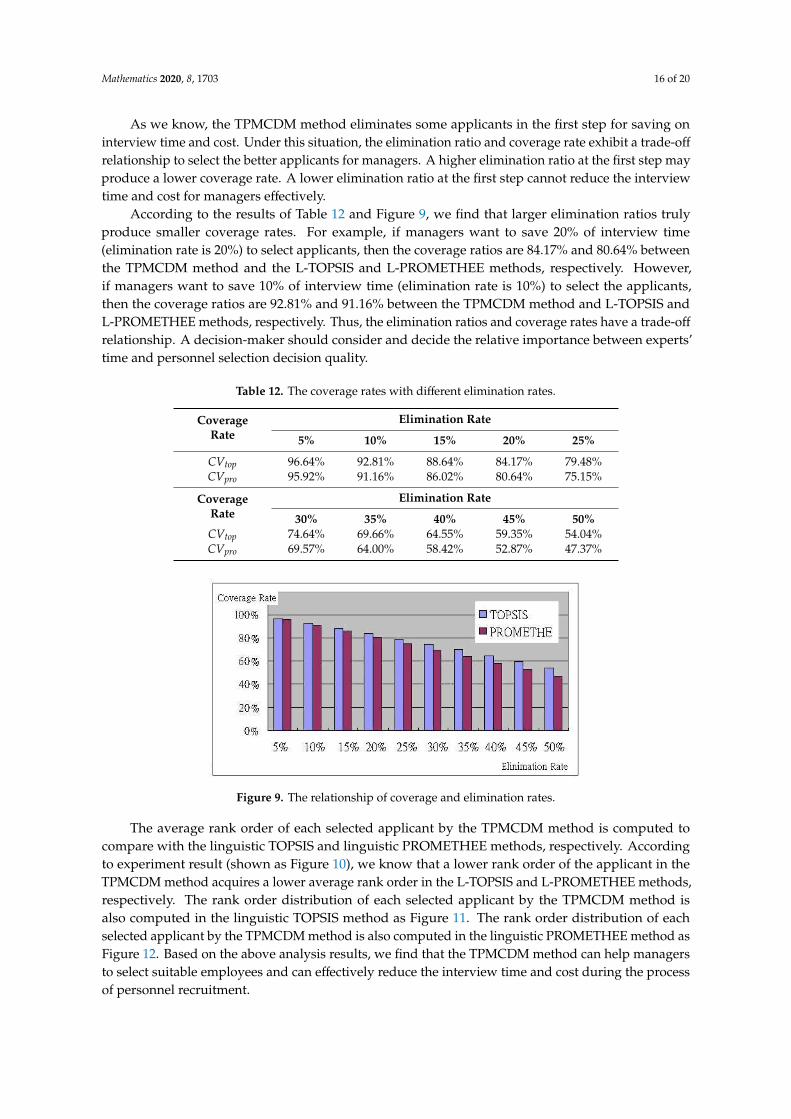
According to the results of Table 12 and Figure 9, we find that larger elimination ratios trulyproduce smaller coverage rates. For example, if managers want to save 20% of interview time(elimination rate is 20%) to select applicants, then the coverage ratios are 84.17% and 80.64% betweenthe TPMCDM method and the L-TOPSIS and L-PROMETHEE methods, respectively. However,if managers want to save 10% of interview time (elimination rate is 10%) to select the applicants,then the coverage ratios are 92.81% and 91.16% between the TPMCDM method and L-TOPSIS andL-PROMETHEE methods, respectively. Thus, the elimination ratios and coverage rates have a trade-off
relationship. A decision-maker should consider and decide the relative importance between experts’time and personnel selection decision quality.
Table 12. The coverage rates with different elimination rates.
CoverageRate
Elimination Rate
5% 10% 15% 20% 25%
CVtop 96.64% 92.81% 88.64% 84.17% 79.48%CVpro 95.92% 91.16% 86.02% 80.64% 75.15%
CoverageRate
Elimination Rate
30% 35% 40% 45% 50%CVtop 74.64% 69.66% 64.55% 59.35% 54.04%CVpro 69.57% 64.00% 58.42% 52.87% 47.37%
Mathematics 2020, 8, 1703 17 of 21
method as Figure 12. Based on the above analysis results, we find that the TPMCDM method can help managers to select suitable employees and can effectively reduce the interview time and cost during the process of personnel recruitment.
Table 12. The coverage rates with different elimination rates.
Coverage Rate
Elimination Rate 5% 10% 15% 20% 25%
topCV 96.64% 92.81% 88.64% 84.17% 79.48% proCV 95.92% 91.16% 86.02% 80.64% 75.15%
Coverage Rate
Elimination Rate 30% 35% 40% 45% 50%
topCV 74.64% 69.66% 64.55% 59.35% 54.04% proCV 69.57% 64.00% 58.42% 52.87% 47.37%
Figure 9. The relationship of coverage and elimination rates.
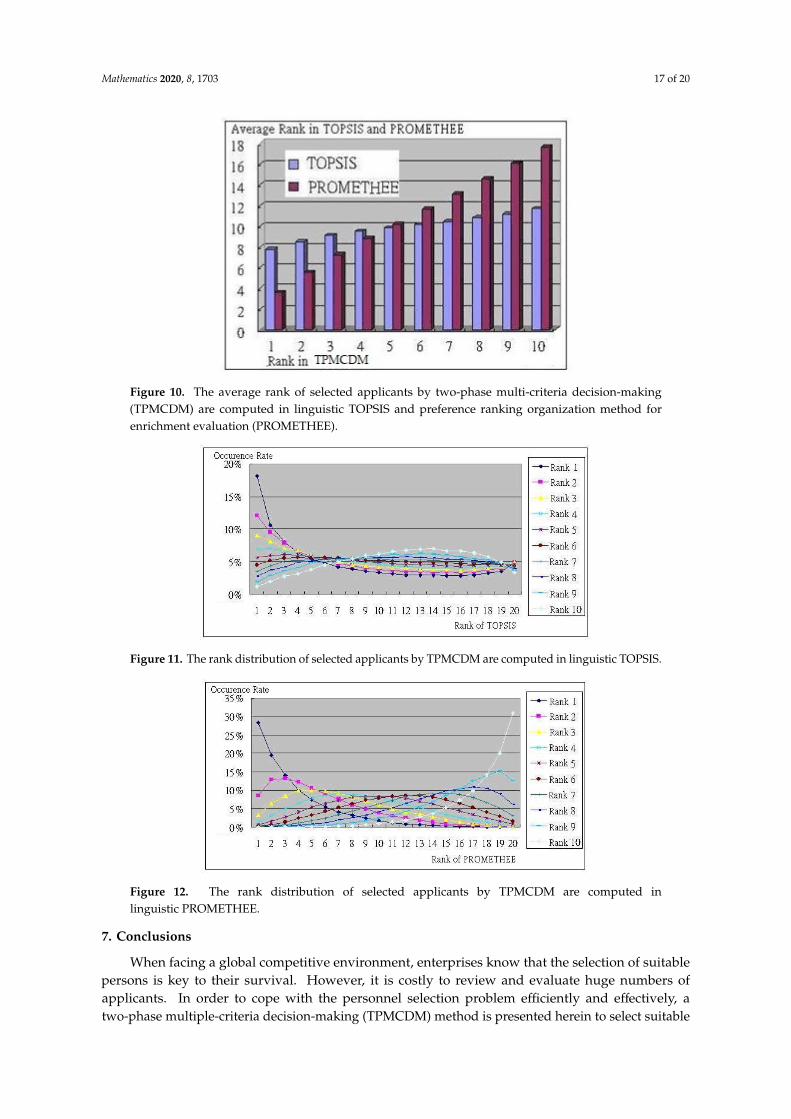
Figure 10. The average rank of selected applicants by two-phase multi-criteria decision-making (TPMCDM) are computed in linguistic TOPSIS and preference ranking organization method for enrichment evaluation (PROMETHEE).
Figure 9. The relationship of coverage and elimination rates.
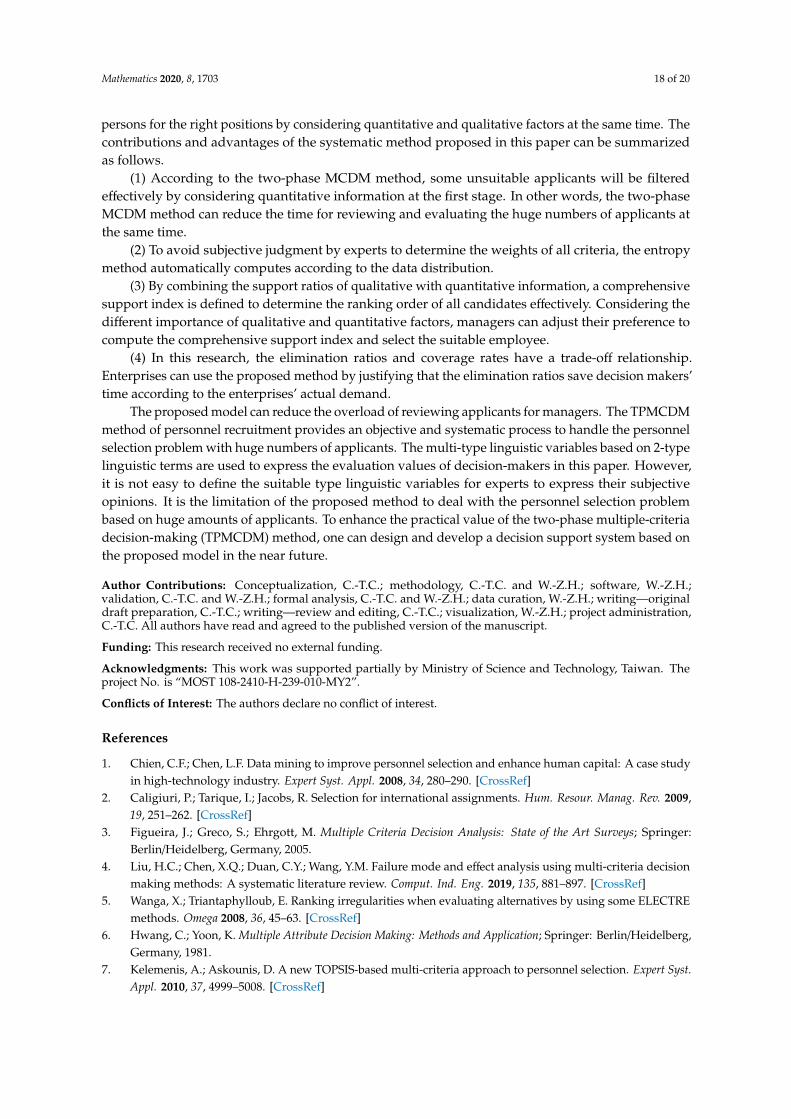
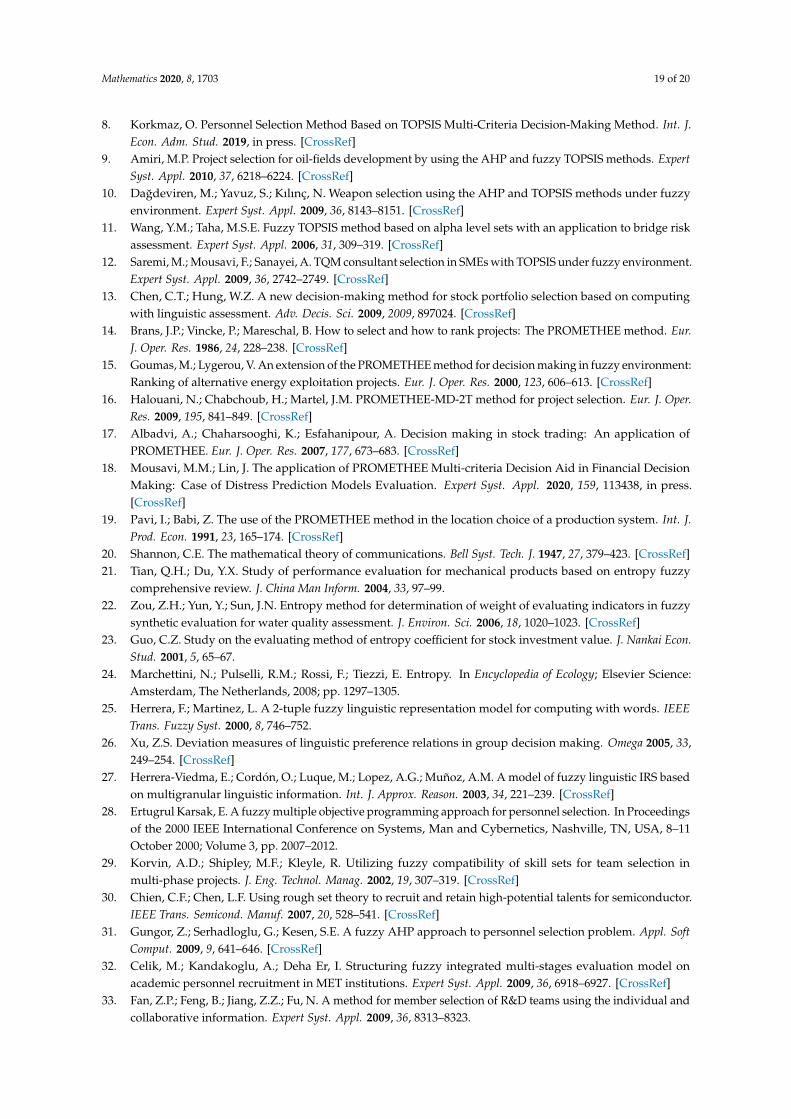
The average rank order of each selected applicant by the TPMCDM method is computed tocompare with the linguistic TOPSIS and linguistic PROMETHEE methods, respectively. Accordingto experiment result (shown as Figure 10), we know that a lower rank order of the applicant in theTPMCDM method acquires a lower average rank order in the L-TOPSIS and L-PROMETHEE methods,respectively. The rank order distribution of each selected applicant by the TPMCDM method isalso computed in the linguistic TOPSIS method as Figure 11. The rank order distribution of eachselected applicant by the TPMCDM method is also computed in the linguistic PROMETHEE method asFigure 12. Based on the above analysis results, we find that the TPMCDM method can help managersto select suitable employees and can effectively reduce the interview time and cost during the processof personnel recruitment.
Mathematics 2020, 8, 1703 17 of 20
Mathematics 2020, 8, 1703 17 of 21
method as Figure 12. Based on the above analysis results, we find that the TPMCDM method can help managers to select suitable employees and can effectively reduce the interview time and cost during the process of personnel recruitment.
Table 12. The coverage rates with different elimination rates.
Coverage Rate
Elimination Rate 5% 10% 15% 20% 25%
topCV 96.64% 92.81% 88.64% 84.17% 79.48% proCV 95.92% 91.16% 86.02% 80.64% 75.15%
Coverage Rate
Elimination Rate 30% 35% 40% 45% 50%
topCV 74.64% 69.66% 64.55% 59.35% 54.04% proCV 69.57% 64.00% 58.42% 52.87% 47.37%
Figure 9. The relationship of coverage and elimination rates.
Figure 10. The average rank of selected applicants by two-phase multi-criteria decision-making (TPMCDM) are computed in linguistic TOPSIS and preference ranking organization method for enrichment evaluation (PROMETHEE).
Figure 10. The average rank of selected applicants by two-phase multi-criteria decision-making(TPMCDM) are computed in linguistic TOPSIS and preference ranking organization method forenrichment evaluation (PROMETHEE).Mathematics 2020, 8, 1703 18 of 21
Figure 11. The rank distribution of selected applicants by TPMCDM are computed in linguistic TOPSIS.
Figure 12. The rank distribution of selected applicants by TPMCDM are computed in linguistic PROMETHEE.
7. Conclusions
When facing a global competitive environment, enterprises know that the selection of suitable persons is key to their survival. However, it is costly to review and evaluate huge numbers of applicants. In order to cope with the personnel selection problem efficiently and effectively, a two-phase multiple-criteria decision-making (TPMCDM) method is presented herein to select suitable persons for the right positions by considering quantitative and qualitative factors at the same time. The contributions and advantages of the systematic method proposed in this paper can be summarized as follows.
(1) According to the two-phase MCDM method, some unsuitable applicants will be filtered effectively by considering quantitative information at the first stage. In other words, the two-phase MCDM method can reduce the time for reviewing and evaluating the huge numbers of applicants at the same time.
(2) To avoid subjective judgment by experts to determine the weights of all criteria, the entropy method automatically computes according to the data distribution.
(3) By combining the support ratios of qualitative with quantitative information, a comprehensive support index is defined to determine the ranking order of all candidates effectively. Considering the different importance of qualitative and quantitative factors, managers can adjust their preference to compute the comprehensive support index and select the suitable employee.
(4) In this research, the elimination ratios and coverage rates have a trade-off relationship. Enterprises can use the proposed method by justifying that the elimination ratios save decision makers’ time according to the enterprises’ actual demand.
The proposed model can reduce the overload of reviewing applicants for managers. The TPMCDM method of personnel recruitment provides an objective and systematic process to handle the personnel selection problem with huge numbers of applicants. The multi-type linguistic variables
Figure 11. The rank distribution of selected applicants by TPMCDM are computed in linguistic TOPSIS.
Mathematics 2020, 8, 1703 18 of 21
Figure 11. The rank distribution of selected applicants by TPMCDM are computed in linguistic TOPSIS.
Figure 12. The rank distribution of selected applicants by TPMCDM are computed in linguistic PROMETHEE.
7. Conclusions
When facing a global competitive environment, enterprises know that the selection of suitable persons is key to their survival. However, it is costly to review and evaluate huge numbers of applicants. In order to cope with the personnel selection problem efficiently and effectively, a two-phase multiple-criteria decision-making (TPMCDM) method is presented herein to select suitable persons for the right positions by considering quantitative and qualitative factors at the same time. The contributions and advantages of the systematic method proposed in this paper can be summarized as follows.
(1) According to the two-phase MCDM method, some unsuitable applicants will be filtered effectively by considering quantitative information at the first stage. In other words, the two-phase MCDM method can reduce the time for reviewing and evaluating the huge numbers of applicants at the same time.
(2) To avoid subjective judgment by experts to determine the weights of all criteria, the entropy method automatically computes according to the data distribution.
(3) By combining the support ratios of qualitative with quantitative information, a comprehensive support index is defined to determine the ranking order of all candidates effectively. Considering the different importance of qualitative and quantitative factors, managers can adjust their preference to compute the comprehensive support index and select the suitable employee.
(4) In this research, the elimination ratios and coverage rates have a trade-off relationship. Enterprises can use the proposed method by justifying that the elimination ratios save decision makers’ time according to the enterprises’ actual demand.
The proposed model can reduce the overload of reviewing applicants for managers. The TPMCDM method of personnel recruitment provides an objective and systematic process to handle the personnel selection problem with huge numbers of applicants. The multi-type linguistic variables
Figure 12. The rank distribution of selected applicants by TPMCDM are computed inlinguistic PROMETHEE.
7. Conclusions
When facing a global competitive environment, enterprises know that the selection of suitablepersons is key to their survival. However, it is costly to review and evaluate huge numbers ofapplicants. In order to cope with the personnel selection problem efficiently and effectively, atwo-phase multiple-criteria decision-making (TPMCDM) method is presented herein to select suitable
Mathematics 2020, 8, 1703 18 of 20
persons for the right positions by considering quantitative and qualitative factors at the same time. Thecontributions and advantages of the systematic method proposed in this paper can be summarizedas follows.
(1) According to the two-phase MCDM method, some unsuitable applicants will be filteredeffectively by considering quantitative information at the first stage. In other words, the two-phaseMCDM method can reduce the time for reviewing and evaluating the huge numbers of applicants atthe same time.
(2) To avoid subjective judgment by experts to determine the weights of all criteria, the entropymethod automatically computes according to the data distribution.
(3) By combining the support ratios of qualitative with quantitative information, a comprehensivesupport index is defined to determine the ranking order of all candidates effectively. Considering thedifferent importance of qualitative and quantitative factors, managers can adjust their preference tocompute the comprehensive support index and select the suitable employee.
(4) In this research, the elimination ratios and coverage rates have a trade-off relationship.Enterprises can use the proposed method by justifying that the elimination ratios save decision makers’time according to the enterprises’ actual demand.
The proposed model can reduce the overload of reviewing applicants for managers. The TPMCDMmethod of personnel recruitment provides an objective and systematic process to handle the personnelselection problem with huge numbers of applicants. The multi-type linguistic variables based on 2-typelinguistic terms are used to express the evaluation values of decision-makers in this paper. However,it is not easy to define the suitable type linguistic variables for experts to express their subjectiveopinions. It is the limitation of the proposed method to deal with the personnel selection problembased on huge amounts of applicants. To enhance the practical value of the two-phase multiple-criteriadecision-making (TPMCDM) method, one can design and develop a decision support system based onthe proposed model in the near future.
Author Contributions: Conceptualization, C.-T.C.; methodology, C.-T.C. and W.-Z.H.; software, W.-Z.H.;validation, C.-T.C. and W.-Z.H.; formal analysis, C.-T.C. and W.-Z.H.; data curation, W.-Z.H.; writing—originaldraft preparation, C.-T.C.; writing—review and editing, C.-T.C.; visualization, W.-Z.H.; project administration,C.-T.C. All authors have read and agreed to the published version of the manuscript.
Funding: This research received no external funding.
Acknowledgments: This work was supported partially by Ministry of Science and Technology, Taiwan. Theproject No. is “MOST 108-2410-H-239-010-MY2”.
Conflicts of Interest: The authors declare no conflict of interest.
References
1. Chien, C.F.; Chen, L.F. Data mining to improve personnel selection and enhance human capital: A case studyin high-technology industry. Expert Syst. Appl. 2008, 34, 280–290. [CrossRef]
2. Caligiuri, P.; Tarique, I.; Jacobs, R. Selection for international assignments. Hum. Resour. Manag. Rev. 2009,19, 251–262. [CrossRef]
3. Figueira, J.; Greco, S.; Ehrgott, M. Multiple Criteria Decision Analysis: State of the Art Surveys; Springer:Berlin/Heidelberg, Germany, 2005.
4. Liu, H.C.; Chen, X.Q.; Duan, C.Y.; Wang, Y.M. Failure mode and effect analysis using multi-criteria decisionmaking methods: A systematic literature review. Comput. Ind. Eng. 2019, 135, 881–897. [CrossRef]
5. Wanga, X.; Triantaphylloub, E. Ranking irregularities when evaluating alternatives by using some ELECTREmethods. Omega 2008, 36, 45–63. [CrossRef]
6. Hwang, C.; Yoon, K. Multiple Attribute Decision Making: Methods and Application; Springer: Berlin/Heidelberg,Germany, 1981.
7. Kelemenis, A.; Askounis, D. A new TOPSIS-based multi-criteria approach to personnel selection. Expert Syst.Appl. 2010, 37, 4999–5008. [CrossRef]
Mathematics 2020, 8, 1703 19 of 20
8. Korkmaz, O. Personnel Selection Method Based on TOPSIS Multi-Criteria Decision-Making Method. Int. J.Econ. Adm. Stud. 2019, in press. [CrossRef]
9. Amiri, M.P. Project selection for oil-fields development by using the AHP and fuzzy TOPSIS methods. ExpertSyst. Appl. 2010, 37, 6218–6224. [CrossRef]
10. Dagdeviren, M.; Yavuz, S.; Kılınç, N. Weapon selection using the AHP and TOPSIS methods under fuzzyenvironment. Expert Syst. Appl. 2009, 36, 8143–8151. [CrossRef]
11. Wang, Y.M.; Taha, M.S.E. Fuzzy TOPSIS method based on alpha level sets with an application to bridge riskassessment. Expert Syst. Appl. 2006, 31, 309–319. [CrossRef]
12. Saremi, M.; Mousavi, F.; Sanayei, A. TQM consultant selection in SMEs with TOPSIS under fuzzy environment.Expert Syst. Appl. 2009, 36, 2742–2749. [CrossRef]
13. Chen, C.T.; Hung, W.Z. A new decision-making method for stock portfolio selection based on computingwith linguistic assessment. Adv. Decis. Sci. 2009, 2009, 897024. [CrossRef]
14. Brans, J.P.; Vincke, P.; Mareschal, B. How to select and how to rank projects: The PROMETHEE method. Eur.J. Oper. Res. 1986, 24, 228–238. [CrossRef]
15. Goumas, M.; Lygerou, V. An extension of the PROMETHEE method for decision making in fuzzy environment:Ranking of alternative energy exploitation projects. Eur. J. Oper. Res. 2000, 123, 606–613. [CrossRef]
16. Halouani, N.; Chabchoub, H.; Martel, J.M. PROMETHEE-MD-2T method for project selection. Eur. J. Oper.Res. 2009, 195, 841–849. [CrossRef]
17. Albadvi, A.; Chaharsooghi, K.; Esfahanipour, A. Decision making in stock trading: An application ofPROMETHEE. Eur. J. Oper. Res. 2007, 177, 673–683. [CrossRef]
18. Mousavi, M.M.; Lin, J. The application of PROMETHEE Multi-criteria Decision Aid in Financial DecisionMaking: Case of Distress Prediction Models Evaluation. Expert Syst. Appl. 2020, 159, 113438, in press.[CrossRef]
19. Pavi, I.; Babi, Z. The use of the PROMETHEE method in the location choice of a production system. Int. J.Prod. Econ. 1991, 23, 165–174. [CrossRef]
20. Shannon, C.E. The mathematical theory of communications. Bell Syst. Tech. J. 1947, 27, 379–423. [CrossRef]21. Tian, Q.H.; Du, Y.X. Study of performance evaluation for mechanical products based on entropy fuzzy
comprehensive review. J. China Man Inform. 2004, 33, 97–99.22. Zou, Z.H.; Yun, Y.; Sun, J.N. Entropy method for determination of weight of evaluating indicators in fuzzy
synthetic evaluation for water quality assessment. J. Environ. Sci. 2006, 18, 1020–1023. [CrossRef]23. Guo, C.Z. Study on the evaluating method of entropy coefficient for stock investment value. J. Nankai Econ.
Stud. 2001, 5, 65–67.24. Marchettini, N.; Pulselli, R.M.; Rossi, F.; Tiezzi, E. Entropy. In Encyclopedia of Ecology; Elsevier Science:
Amsterdam, The Netherlands, 2008; pp. 1297–1305.25. Herrera, F.; Martinez, L. A 2-tuple fuzzy linguistic representation model for computing with words. IEEE
Trans. Fuzzy Syst. 2000, 8, 746–752.26. Xu, Z.S. Deviation measures of linguistic preference relations in group decision making. Omega 2005, 33,
249–254. [CrossRef]27. Herrera-Viedma, E.; Cordón, O.; Luque, M.; Lopez, A.G.; Muñoz, A.M. A model of fuzzy linguistic IRS based
on multigranular linguistic information. Int. J. Approx. Reason. 2003, 34, 221–239. [CrossRef]28. Ertugrul Karsak, E. A fuzzy multiple objective programming approach for personnel selection. In Proceedings
of the 2000 IEEE International Conference on Systems, Man and Cybernetics, Nashville, TN, USA, 8–11October 2000; Volume 3, pp. 2007–2012.
29. Korvin, A.D.; Shipley, M.F.; Kleyle, R. Utilizing fuzzy compatibility of skill sets for team selection inmulti-phase projects. J. Eng. Technol. Manag. 2002, 19, 307–319. [CrossRef]
30. Chien, C.F.; Chen, L.F. Using rough set theory to recruit and retain high-potential talents for semiconductor.IEEE Trans. Semicond. Manuf. 2007, 20, 528–541. [CrossRef]
31. Gungor, Z.; Serhadloglu, G.; Kesen, S.E. A fuzzy AHP approach to personnel selection problem. Appl. SoftComput. 2009, 9, 641–646. [CrossRef]
32. Celik, M.; Kandakoglu, A.; Deha Er, I. Structuring fuzzy integrated multi-stages evaluation model onacademic personnel recruitment in MET institutions. Expert Syst. Appl. 2009, 36, 6918–6927. [CrossRef]
33. Fan, Z.P.; Feng, B.; Jiang, Z.Z.; Fu, N. A method for member selection of R&D teams using the individual andcollaborative information. Expert Syst. Appl. 2009, 36, 8313–8323.
Mathematics 2020, 8, 1703 20 of 20
34. Feng, B.; Jiang, Z.Z.; Fan, Z.P.; Fu, N. A method for member selection of cross-functional teams using theindividual and collaborative performances. Eur. J. Oper. Res. 2010, 203, 652–661. [CrossRef]
35. Zhang, S.F.; Liu, S.Y. A GRA-based intuitionistic fuzzy multi-criteria group decision making method forpersonnel selection. Expert Syst. Appl. 2011, 38, 11401–11405. [CrossRef]
36. Chen, C.T.; Pai, P.F.; Hung, W.Z. Applying Linguistic VIKOR and Knowledge Map in Personnel Selection.Asia Pac. Manag. Rev. 2011, 16, 491–502.
37. Bangerter, A.; Roulin, N.; König, C.J. Personnel selection as a signaling game. J. Appl. Psychol. 2012, 97,719–738. [CrossRef]
38. Afshari, A.R.; Yusuff, R.M.; Derayatifar, A.R. Linguistic extension of fuzzy integral for group personnelselection problem. Arab. J. Sci. Eng. 2013, 38, 2901–2910. [CrossRef]
39. Sang, X.; Liu, X.; Qin, J. An analytical solution to fuzzy TOPSIS and its application in personnel selection forknowledge-intensive enterprise. Appl. Soft Comput. 2015, 30, 190–204. [CrossRef]
40. Ji, P.; Zhang, H.Y.; Wang, J.Q. A projection-based TODIM method under multi-valued neutrosophicenvironments and its application in personnel selection. Neural Comput. Appl. 2018, 29, 221–234. [CrossRef]
41. Heidary Dahooie, J.; Beheshti Jazan Abadi, E.; Vanaki, A.S.; Firoozfar, H.R. Competency-based IT personnelselection using a hybrid SWARA and ARAS-G methodology. Hum. Factors Ergon. Manuf. Serv. Ind. 2018, 28,5–16. [CrossRef]
42. Yalçın, N.; Yapıcı Pehlivan, N. Application of the fuzzy CODAS method based on fuzzy envelopes forhesitant fuzzy linguistic term sets: A case study on a personnel selection problem. Symmetry 2019, 11, 493.[CrossRef]
43. Chuang, Y.C.; Hu, S.K.; Liou, J.J.; Tzeng, G.H. A data-driven MADM model for personnel selection andimprovement. Technol. Econ. Dev. Econ. 2020, 26, 751–784. [CrossRef]
44. Kilic, H.S.; Demirci, A.E.; Delen, D. An integrated decision analysis methodology based on IF-DEMATELand IF-ELECTRE for personnel selection. Decis. Support Syst. 2020, 137, 113360, in press. [CrossRef]
45. Krishankumar, R.; Premaladha, J.; Ravichandran, K.S.; Sekar, K.R.; Manikandan, R.; Gao, X.Z. A novelextension to VIKOR method under intuitionistic fuzzy context for solving personnel selection problem. SoftComput. 2020, 24, 1063–1081. [CrossRef]
46. Ozdemir, Y.; Nalbant, K.G. Personnel selection for promotion using an integrated consistent fuzzy preferencerelation—Fuzzy analytic hierarchy process methodology: A real case study. Asian. J. Interdiscip. Res. 2020, 3,219–236. [CrossRef]
47. Herrera, F.; Martinez, L. A model based on linguistic 2-tuples for dealing with multigranular hierarchicallinguistic contexts in multi-expert decision-making. IEEE Trans. Syst. Man Cybern. Part B 2001, 31, 227–234.[CrossRef] [PubMed]
48. Tai, W.S.; Chen, C.T. A new evaluation model for intellectual capital based on computing with linguisticvariable. Expert Syst. Appl. 2009, 36, 3483–3488. [CrossRef]
49. Herrera-Viedma, E.; Herrera, F.L.; Martínez, L.; Herrera, J.C.; López, A.G. Incorporating filtering techniquesin a fuzzy linguistic multi-agent model for information gathering on the web. Fuzzy Sets Syst. 2004, 148,61–83. [CrossRef]
50. Herrera, F.; Martinez, L.; Sanchez, P.J. Managing non-homogeneous information in group decision making.Eur. J. Oper. Res. 2005, 166, 115–132. [CrossRef]
51. Chen, C.T.; Pai, P.F.; Hung, W.Z. An integrated methodology using linguistic PROMETHEE and maximumdeviation method for third-party logistics supplier selection. Int. J. Comput. Intell. Sys. 2010, 3, 438–451.[CrossRef]
© 2020 by the authors. Licensee MDPI, Basel, Switzerland. This article is an open accessarticle distributed under the terms and conditions of the Creative Commons Attribution(CC BY) license (http://creativecommons.org/licenses/by/4.0/).