Island of Hawaii Whole System Project Phase I Report
85
Island of Hawaii Whole System Project Phase I Report Rocky Mountain Institute Christina Page, Lionel Bony, and Laura Schewel March 2007
-
Upload
khangminh22 -
Category
Documents
-
view
6 -
download
0
Transcript of Island of Hawaii Whole System Project Phase I Report
Island of Hawaii Whole System Project Phase I Report Rocky Mountain Institute Christina Page, Lionel Bony, and Laura Schewel March 2007
1
Table of Contents Introduction..................................................................................................................... 5
This Document............................................................................................................ 5 The Project ................................................................................................................. 5 Local Food, Sustainability, and Quality of Life ............................................................. 6
I. Overview ..................................................................................................................... 7 Strategic Risk Mitigation Through Local, Diversified Agriculture and Food .................. 7
Unintended Consequences: A Real Danger ............................................................ 8 Mitigating Unintended Consequences ....................................................................11 Local Success Story for Mitigating Unintended Consequences: Volcano Island Honey.....................................................................................................................11
Current Local Market Share: Strong Pockets but Room to Improve............................12 Barriers ......................................................................................................................13 Leverage Points .........................................................................................................14
II. Methodology ..............................................................................................................15 III. Food and Agriculture in Hawaii: Brief History and Current Situation ..........................17
Agriculture on the Island of Hawaii .............................................................................17 History ....................................................................................................................17 Economic Value......................................................................................................17 Local Market Share ................................................................................................20 Crossing Local Market Share with Actual Food Consumption .................................22 Cost Breakdown for Local Food..............................................................................24 The Price of Locally Produced Food .......................................................................26
The Dangers of Monocropping and Economic Homogeneity ......................................27 The Rise and Fall of Hawaii’s Sugar Plantations.....................................................27 The Aloha Papaya ..................................................................................................29 Tourism and 9/11....................................................................................................31
Local Success Stories ................................................................................................33 Kona Coffee (Niche/Export) ....................................................................................33 Hirabara Farms (Niche/Local).................................................................................34 Hawaii Vanilla Company (Ag-tourism/Luxury) .........................................................35 Adaptations (Niche production/distribution).............................................................36
Development of Support Activities..............................................................................37 Island of Hawaii Slow Food Convivium ...................................................................37 Waimea Middle School Garden ..............................................................................37 Hāmākua Agricultural Plan .....................................................................................38
IV. Whole System Analysis ............................................................................................39 Whole System Thinking Applied to Hawaii .................................................................39 Barriers ......................................................................................................................40
Water......................................................................................................................41 Availability of Land..................................................................................................43 High Cost of Labor..................................................................................................43 High Cost of Inputs .................................................................................................44 High Information and Transaction Costs .................................................................45 Lack of Secure Demand and Supply Channels .......................................................46 Lack of Distribution Infrastructure ...........................................................................46
Leverage Points .........................................................................................................47
2
Improve Market Channel and Distribution Infrastructure .........................................47 Bring Down Input Costs ..........................................................................................48 Improve Labor Availability and Cost........................................................................49 Improve Availability of Land....................................................................................50 Get a Higher Price for Goods..................................................................................50 Capitalize on Overlaps with Energy ........................................................................51 Create Direct Relationships between Consumers and Producers ...........................52 Enhance the Agricultural Sense of Community .......................................................52
V. Top Opportunities......................................................................................................53 Criteria for Evaluating Opportunities...........................................................................53
Individual Merit Screening ......................................................................................53 Supporting the Entire Value Chain..........................................................................54 The Tortoise and the Hare Both Win Strategy.........................................................54 The Top Twelve Opportunities................................................................................55
VI. Conclusion ...............................................................................................................56 Phase II......................................................................................................................56 Phase III.....................................................................................................................56
Appendix A: Commodity Cycles.....................................................................................57 Appendix B: Individual Interviews ..................................................................................59 Appendix C: Local Market Shares for Produce ..............................................................61 Appendix D: Water Availability .......................................................................................62 Appendix E: Land Issues ...............................................................................................66 Appendix F: 40 Opportunities ........................................................................................69
Top 40 Ideas ..............................................................................................................69 Bring Down Input Costs ..........................................................................................69 Capitalize on Overlaps with Energy ........................................................................70 Improve Opportunities to Acquire Land...................................................................70 Get Higher Prices for Goods...................................................................................70 Create Relationships between Consumers and Producers .....................................72 Develop Market Channel Infrastructure...................................................................72 Enhance Agricultural Sense of Community .............................................................73
Appendix G: More Complete Description of Criteria .......................................................75 Appendix H: Descriptions of Top Opportunities..............................................................77
“Hawaii Feeds Itself for a Day” Event......................................................................77 Distribution Trucking Group and/or Distribution Strategy Using Existent Infrastructure ..........................................................................................................77 Barefoot MBA/Credit Facility...................................................................................79 Biodiesel Crops and Production..............................................................................79 Packaged/Pre-cooked Meals ..................................................................................80 Fruit Park................................................................................................................81 Community Commercial Kitchen.............................................................................81 School Gardens......................................................................................................82 Marketing and Consumer Education Body..............................................................82 Production of Commodity Vegetables .....................................................................83 Mechanization R&D................................................................................................83 Long-Term Landlord ...............................................................................................84
3
Figures and Tables Figure 1: Major Agricultural Areas on the Island of Hawaii...........................................18 Figure 2: Cash Receipts from Agriculture in the State of Hawaii, 1975–2006. (Source:
USDA, HASS).......................................................................................................20 Figure 3: Locally Grown Fruit Market Share Favors Tropical Climate Fruits (Source:
HASS) ...................................................................................................................20 Figure 4: Locally Grown Vegetable Market Share Favors Vegetables Associated with
Asian Cuisine (Source: HASS)...............................................................................21 Figure 5: Locally Grown Beef Market Share is at 10 Percent, with Eggs, Milk, and Hog
Much Less .............................................................................................................21 Figure 6: Actual Local Market Share Is 15 Percent ........................................................23 Figure 7: Breakdown of Away-from-home Food Expenditures in the State of Hawaii....24 Figure 8 - Approximate Cost Breakdown of Produce Farming in the State of Hawaii.....25 Figure 9: Approximate Cost Breakdown for Raising Animals in the State of Hawaii .....25 Figure 10: Cost Component Breakdown for Retail Food in Hawaii and the U.S. ............26 Figure 11: Papaya, Value of Utilized Production for the State of Hawaii, 1964–2004
(Source: HASS) .....................................................................................................30 Figure 12: Abrupt Decline in Tourist Numbers After 9/11; U.S. Domestic Visitors Have
Recovered, Japanese Still Down 20 Percent (Source: First Bank of Hawaii)...........31 Figure 13: The Impact of 9/11 on Real Income and Wages (Source: First Bank of Hawaii)
..............................................................................................................................32 Figure 14: Price History of Hawaii-Grown Coffee, 1946–2003 (Parchment Equivalent
Basis Price) (Source: HASS)..................................................................................33 Figure 15: Complete Island of Hawaii Whole system Map for Food ..............................40 Figure 16: Barriers for Local Food in System ................................................................41 Figure 17: Rainfall on the Island of Hawaii in Inches (Source: Hawaii GIS) ..................41 Figure 18: Leverage Points in the Local Food System....................................................47 Figure 19: Commodity Supply Growth and Price Decline across Markets......................57 Figure 20: Commodity Systems and Agriculture............................................................57 Figure 21: Map of Aquifer Regions and Sustainable Yields (Source: CWRM)...............62 Figure 22: State Land Use Districts for the Island of Hawaii (Source: Hawaii GIS) .......66 Figure 23: Department of Hawaiian Home Lands Land for the Island of Hawaii (Source:
DHHL) ..................................................................................................................67 Figure 24: Major Landowners on the Island of Hawaii, Parker Ranch and Kamehameha
Schools. (Source: Hawaii GIS)...............................................................................68 Table 1: Matrix of Four Potential Paths for Agriculture on the Island of Hawaii, With
Pros and Cons ........................................................................................................10 Table 2: Range in Crop Values to County of Hawaii (Source: HASS)............................18 Table 3: Range in Revenue Per Acre for Crops (Source: HASS)....................................19 Table 4 - Physical Water Capacity Calculation Results ..................................................42 Table 5: Comparison of Wages, Hawaii Average to U.S. Average.* ..............................44 Table 6: Market Share of Specific Fruits and Vegetables (Source: HDOA)....................61 Table 7: Island of Hawaii Irrigation Capacity.................................................................64

4
5
Introduction
This Document This document reports on the state of the locally produced food and agriculture sectors on the Island of Hawaii, and analyzes these sectors to identify key barriers and leverage points for increasing local market share. It does not contain or mean to imply moral judgment on any actor within. This document is not a community action plan, nor a policy guide. It is intended to provide background research and analysis to ground business and non-profit ventures related to locally produced food. We will use it as a foundation for further research into some specific business ventures and non-profit activities outlined in the final section, but it is also intended to be of service to entrepreneurs, philanthropists, and local businessmen and farmers. It also may be helpful to communities or policy makers, but we have purposefully stayed clear of specific community or policy recommendations as they are outside the scope of this report. Our suggestions are designed to work within existing policy frameworks.
The Project The Hawaii Whole System Project is a research and action project conducted by Rocky Mountain Institute on behalf of the Omidyar family. The Omidyar Family is pleased to sponsor this project to promote innovative, long-term planning and local self-reliance. With the underlying assumption that local food and agriculture can be good for a community (expanded upon below), the goal of the first phase of this project, the phase contained in this document, is to understand the agricultural system on the Island of Hawaii in order to: I. Identify the reasons why locally produced food holds such a small market share
(about 85 percent of locally consumed food is imported according to several sources),
II. Define the barriers to increasing local market share and strengthening agriculture,
III. Locate leverage points that, when targeted with time or investment, could have multiple positive effects on local food and agriculture, and
IV. Identify business or non-profit opportunities that could activate these leverage points.
In order to identify the barriers to more local production and consumption, Phase I of the project focused on mapping the Hawaiian agriculture and food system. The research for Phase I consisted of gathering and studying published academic and government documents and analyzing agriculture and local food statistics from diverse sources, as well as interviewing people from up and down the food and agriculture value chain, from farmer to consumer, in order to understand the whole system, how it interacts with other systems such as energy, and how to influence it. In Phase II, based on this preliminary research, the RMI team will analyze the feasibility of the opportunities. Finally in Phase III, the RMI team will work with The Kohala Center and other partners to bring together potential entrepreneurs and investors, as well as
6
other people who might have an interest in local food and agriculture in order to act on the research findings.
Local Food, Sustainability, and Quality of Life This project, and this document, rest on an underlying assumption: that the low local market share (15 percent) for food and the high price residents of Hawaii pay for it (22 percent of average income, opposed to 13 percent on the mainland) are problems that degrade the Island’s economic and environmental sustainability, as well as quality of life. If developed properly, vibrant agricultural and local food production sectors have the potential to lead to the following benefits:
• Economic benefits: The Island’s reliance on tourism is an unstable position. Through greater economic diversification an expanded agricultural sector could reduce economic risk. • Security benefits: The Island of Hawaii’s reliance on imports for 85 percent of its food is an insecure position for an isolated island. Fossil-fuel shortages, dock strikes, or war could isolate the Island for long periods of time. • Environmental benefits: These include protecting land from urbanization and development, using less fuel for transporting food long distances, reducing waste for the already overflowing landfills, and preserving ecosystem services such as water retention and purification. • Social benefits: Locally produced food can increase local pride and community identity and connectedness. It can bring people together through cooking, the sharing of food traditions, and the preservation of vibrant communities. It gives families the option to work together and close to the home, instead of spending time on long commutes to work at resorts. Locally produced food and agriculture can help residents of Hawaii maintain the traditional lifestyle that is quickly eroding. • Health benefits: Though adult citizens of Hawaii are traditionally healthier than mainlanders, recent studies have shown that children in Hawaii are almost at the same troubling levels of obesity and diabetes as their mainland counterparts due the adoption of the same eating and exercise habits. Locally produced food is generally fresher and healthier than processed or imported food and could improve health.
However, improving the agriculture sector and local food market share does not necessarily lead to these benefits for reasons we will examine below. The background research presented in this report is aimed at helping those interested in locally produced food avoid the pitfalls and maximize the benefits of local food and agriculture.
7
I. Overview Our research in Phase I indicates that it is possible to improve the quality of life on the Island of Hawaii by improving agriculture and locally produced food consumption. Such improvement could be achieved via investments in new enterprises, both for-profit and not-for-profit. Our main findings are:
• Diversified local agriculture, strong local market base, and reduced dependence on commodity crops form a powerful risk mitigation strategy. • The Island of Hawaii has pockets of self-sufficiency in food, a growing local market pull, and a strong future potential. Fresh produce, especially vegetables used in Asian cuisine, have a large local market share. • There are two large opportunities for increased self-sufficiency: first, to focus on the biggest gaps in local market share (non-tropical fruits, meat, and processed food), and second to shift food preferences to favor products more conducive to the island climate and small farms and gardens. • The greatest barriers to increasing food self-sufficiency are cost and distribution infrastructure. • The key leverage points include reducing cost along the value chain, building better distribution infrastructure, and growing high-end markets and resident market base. • Business and non-profit opportunities fall into three primary groups: increasing production, developing support infrastructure, and expanding markets.
Strategic Risk Mitigation Through Local, Diversified Agriculture and Food From biological disasters to warfare, geological catastrophes to economic collapse, islands are by nature vulnerable places. Introduced species wreak havoc on local ecosystems; conquering nations overwhelm local defense systems with superior numbers and technology; cheap labor in other parts of the world undercut local prices. In an island’s closed system, feedback is immediate, and resilience is limited. The Island of Hawaii is simultaneously vulnerable to intrusion from the outside world and heavily dependent upon it. Eighty-five percent of food consumed upon the Island of Hawaii is imported. The Island also depends on imports for power: 90 percent of energy (for electricity and transportation) comes from imported fossil fuels. The two systems (energy and food) are not independent: for example, without energy used to pump water from aquifers and for irrigation, Hawaii’s farming capacity would be drastically reduced. Hawaii is a limited-scale, closed system that has difficulty competing on economic grounds whenever economy of scale is the most important consideration. The collapse of the sugarcane industry in the ’80s and ’90s and the struggles of the local papaya industry to battle disease while remaining a desirable crop in terms of price and GMO-status demonstrate the challenges associated with commodity crops on the Island.
8
Repeatedly, dependence upon commodity goods intended for export has proven a vulnerable strategy. In the global race to the lowest prices and costs that is agribusiness, Hawaii is already handicapped by its isolation, small size, and high input costs. Continued investment in raw commodity crops for export will only ensure the same sad events playing out over and over again, as they have for sugar and papaya. For a schematic description of commodity crop cycles, see Appendix A. Tourism, which replaced sugar as the dominant contributor to the economy in the ’80s, is only slightly less vulnerable. The tourism industry, accounting for 22.3 percent of civilian jobs on Hawaii and 17 percent of the Gross State Product (GSP), is entirely dependent on the availability of cheap jet transportation from the mainland and Asia and the willingness of people to travel. Factors such as rising oil prices, economic depression, war, and terrorism could swiftly curtail jet travel, as was the case immediately following 9/11. Given all of the above, Hawaii’s best response to the increasing pressures of a global marketplace may be to discover ways to increase its independence and cease efforts to mimic the economies of non-island states and nations. The agriculture and locally produced food sectors can help. These sectors cannot only build their own resilience; they can also increase economic and environmental sustainability of Hawaii as a whole. In order to assess the sustainability and whole system aspects of locally produced food and agriculture opportunities for the Island of Hawaii, we suggest screening them through the following criteria:
• Reduce dependence on imported food, • Improve local market share for food, • Be profitable for an outside investor, • Increase farmers’ profits, • Complement other opportunities, • Have more than one positive impact, • Have a meaningful impact on Island residents’ food behavior, and • Add family-sustaining jobs to the economy.
We also suggest the following, supplementary criteria:
• Reduce non-food imports, • Enjoy existing community backing, • Do not rely on tourism for sustainability, • Generate synergies with the energy sector, • Be environmentally responsible, and • Have a balance between short-, medium-, and long-term impact projects.
Unintended Consequences: A Real Danger In keeping with a whole system approach, business and non-profit opportunities should be explored for the benefits that we seek and carefully scrutinized for unexpected side effects.
9
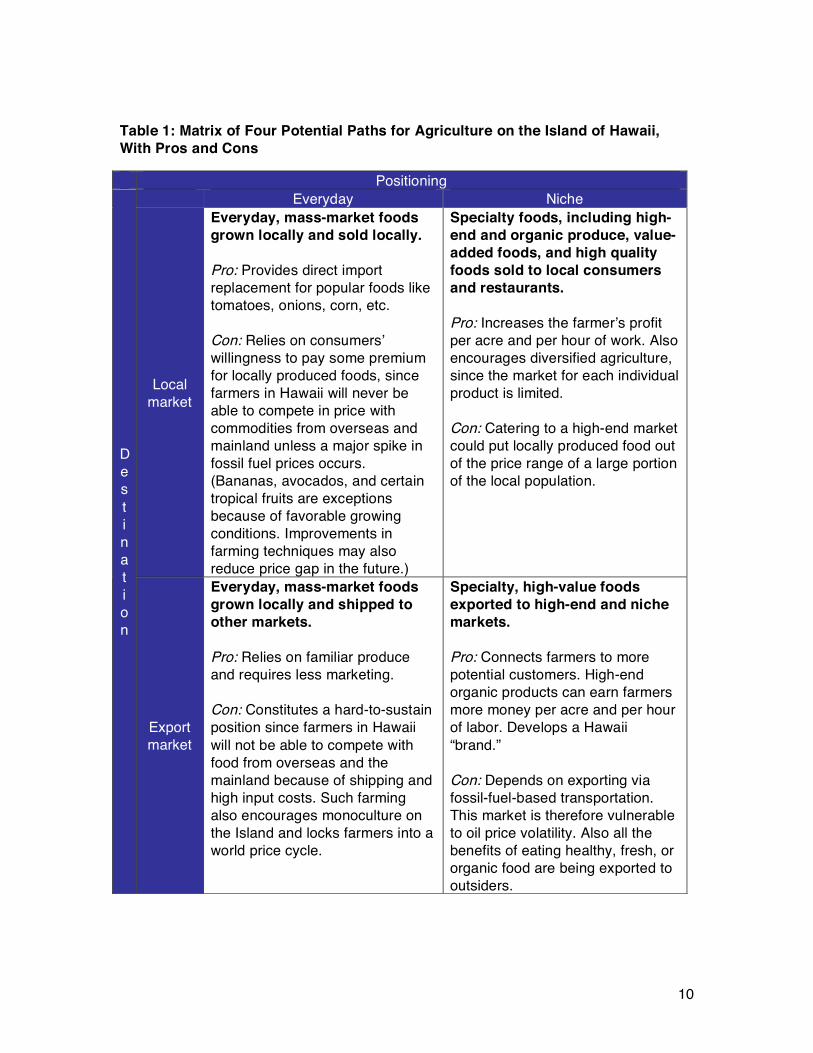
One of the most important lessons learned in the course of this study is that increasing the value of the agricultural sector is not necessarily a boon for the Island of Hawaii. High-value, non-commodity crops have obvious advantages for Hawaii farmers and are rapidly developing. However, increasing the value of Hawaii-grown food products without increasing the volume grown—or, in the long run, the percentage of food consumed locally—may result in Hawaii’s agricultural sector simply feeding the tourists and supplying high-end mainland markets rather than local people. The unintended consequence of this would be an increase in the price of already expensive food, a pricing out of the middle class, and a shifting of consumption of local produce to high-end restaurants and resorts. As a consequence, the percentage of food grown and consumed on the Island may remain at 15 percent, but a greater percent of the local population’s diet may consist of imported foods. Given the possibility of unintended outcomes, it is important to consider all four paths of agriculture that the Island could pursue, and examine their potential consequences. The following matrix summarizes these four potential paths:
10
Table 1: Matrix of Four Potential Paths for Agriculture on the Island of Hawaii, With Pros and Cons
Positioning Everyday Niche
Local market
Everyday, mass-market foods grown locally and sold locally. Pro: Provides direct import replacement for popular foods like tomatoes, onions, corn, etc. Con: Relies on consumers’ willingness to pay some premium for locally produced foods, since farmers in Hawaii will never be able to compete in price with commodities from overseas and mainland unless a major spike in fossil fuel prices occurs. (Bananas, avocados, and certain tropical fruits are exceptions because of favorable growing conditions. Improvements in farming techniques may also reduce price gap in the future.)
Specialty foods, including high-end and organic produce, value-added foods, and high quality foods sold to local consumers and restaurants. Pro: Increases the farmer’s profit per acre and per hour of work. Also encourages diversified agriculture, since the market for each individual product is limited. Con: Catering to a high-end market could put locally produced food out of the price range of a large portion of the local population.
Dest inat ion
Export market
Everyday, mass-market foods grown locally and shipped to other markets. Pro: Relies on familiar produce and requires less marketing. Con: Constitutes a hard-to-sustain position since farmers in Hawaii will not be able to compete with food from overseas and the mainland because of shipping and high input costs. Such farming also encourages monoculture on the Island and locks farmers into a world price cycle.
Specialty, high-value foods exported to high-end and niche markets. Pro: Connects farmers to more potential customers. High-end organic products can earn farmers more money per acre and per hour of labor. Develops a Hawaii “brand.” Con: Depends on exporting via fossil-fuel-based transportation. This market is therefore vulnerable to oil price volatility. Also all the benefits of eating healthy, fresh, or organic food are being exported to outsiders.
11
As the matrix shows, there is a potential disconnect between maximizing profitability and success in the agriculture sector and feeding locally produced food to local people.
Mitigating Unintended Consequences As the matrix shows, there can be a disconnect between maximizing profitability and success in the local agriculture sector and feeding locally produced food to local people. One way around this disconnect is to increase margin and increase local food production. Certainly the tourist market— where the tourists are generally willing to spend liberally on food—is a boon to local agriculture, but it is neither economically secure nor fully beneficial to the community to rely too heavily on tourists. As our research and several success stories explained later in this document show, however, the disconnect between local production and local consumption is not an inevitable one. Through a careful combination of projects that fall within three of the four boxes on the matrix (local commodity, local niche, and export niche), education of consumers, and cost-saving farming practices, it is possible to simultaneously generate profit for farmers and to make more locally produced food available at prices local residents are willing to pay, therefore benefiting the local community.
Local Success Story for Mitigating Unintended Consequences: Volcano Island Honey A brief positive example of such a balance is Volcano Island Honey Company. The company, located near Honokaa, makes fine, unprocessed honey. The honey is sold to on-line customers and through Wholefoods stores on the mainland where it is marketed under the chain’s “authentic food artisan” seal, which is accorded only to food producers from family farms that are committed to handcrafting the finest foods using traditional methods.1 Volcano Island Honey offers some of the highest quality and most expensive honey in the world. Richard Spiegel, the owner of Volcano Island Honey, is committed to sustainability and has found ways to allow his endeavor to be a contributor to the local community, despite the export-heavy nature of his business. First, Volcano Island Honey makes a certain amount of honey available for kama’aina (local—literally, “of this land”) buyers at affordable prices. Volcano Island Honey does not make a profit on this kama’aina portion. Second, Volcano Island employs several people from the community as bee-hands and administrative staff, and keeps a four-day workweek during most of the year to allow employees to pursue their own farming operations, spend time with family, or do other things. Finally, Volcano Island Honey's bees gather their honey and pollen from several locations. In the case of one rare, large Kiawe forest, the company sustainably utilizes the resource and provides an incentive and focal point for the effort to save this forest from being razed for development. In order to address the potential disconnect between local production and consumption, we suggest using a strategy we call “The Tortoise and the Hare Both Win.” Under this strategy, the Island keeps developing its production of
1 “Authentic Food Artisan Standards.” www.wholefoodsmarket.com/products/afa/index.html. Accessed January 11, 2007.
12
high-end products for use in resorts and for exportation as a means to earn strong returns, justify new investments, diversify the economy, keep land in agriculture, and build up agriculture and food production experience. This is the “hare” portion. Simultaneously, but more slowly, the Island increases its production of everyday foods at reasonable prices for local people, while also educating citizens on the importance and the benefits of buying locally produced food and food that grows efficiently on the Island. This “tortoise” portion will increase independence and stability, improve health on the Island, secure a stable market for farmers, and reduce the environmental impact of Islanders.
Current Local Market Share: Strong Pockets but Room to Improve The local food movement has strong energy behind it in Hawaii. Many small farmers and residents in Hawaii we met in the course of this project are passionate about sustainable farming and feeding their own community, and they have made considerable effort to live by their ideals. Beyond local farmers, other examples of this strong movement include the presence of a Slow Food convivium, several school gardens, and successful restaurants that specialize in locally produced food, such as Merriman’s and Kenichi. Additionally, the new Keauhou farmers’ market, which opened last year, is experiencing success and growth, while the Waimea and Hilo farmers’ markets have continued to be extremely popular. The State Farm Bureau supports local agriculture with a poster and bumper sticker campaign. Since 1994, KTA, a local grocery store chain, has started Mountain Apple Brand, a successful line of 300 locally grown or made products and processed foods, which it sells in its stores.2 Foodland features locally grown produce and beef in its stores, and is striving to increase the amount of locally produced food it sells. Even chains like Costco have shown some initiative carrying and marketing some locally grown produce. In spite of this support, the market share for locally produced food on the Island has much room for improvement. Statewide, locally produced fruit has a 42 percent market share, and locally grown fresh vegetables have a 36 percent market share.3 Although these figures are relatively high, fruits and vegetables do not constitute a large share of residents’ food expenses. Only thirteen percent of the average statewide food budget is spent on fruits and vegetables, while 20 percent goes to prepared foods and 24 percent to meat. The share of locally produced meat is negligible, consisting mainly of grass-fed beef and lamb that ends up in high-end restaurants and occasionally in some local supermarkets, such as KTA and Foodland. The share of locally produced seafood is substantial, though not 100 percent due to the popularity of imported species like Alaskan salmon and shrimp and crab. The local agriculture community has undergone several major shifts in the past two hundred years. Starting in the 1840s, the state developed a major sugar industry, and its 2 Hawaii Business Staff. "Q&A: Derek Kurisu." Hawaii Business. 1 December 2002.
3 In Hawaii, most trade statistics are compiled at the state level, making it difficult to obtain county-level figures, so State numbers were used as a proxy.
13
agricultural sector eventually became reliant on sugar. Most of the immigration to the islands was based on the need for plantation workers. That industry began to collapse in the 1970s, leading to the loss of traditional agricultural jobs and lifestyles. In 1982, sugar represented 1.4 percent of gross state product (GSP), 2.6 percent of jobs, and 44 percent of sales from agricultural products. By 1997, it had shrunk to 0.64 percent of jobs, 0.37 percent of GSP, and just 15.4 percent of agricultural sales. With the complete disappearance of sugar plantations on the Island of Hawaii by 1996, farming has come to be centered on Kona coffee, macadamia nuts, flowers, pasture, and industrial papaya. Although diversified agriculture has been steadily growing, it has not been able to offset the impacts of the loss of the sugar industry in terms of agricultural sector contribution to the economy.
Barriers Though agriculture and locally produced food are intimately related on the Island, they do each have their own concerns. Agriculture on Hawaii faces two main obstacles: the price of land and the availability of labor. Both are linked to the massive development of tourism on the Island. Because of the high demand for the Island of Hawaii’s lush landscape and ocean views, the cost of undeveloped land can be astronomically high, hundreds of times more than agricultural activity could economically support. Thus, long-established farmers can make much more selling their land for development than farming it. The tourism industry also soaks up most of the supply of low-skill labor for maintenance, service, or construction jobs, paying well above mainland wages for these jobs. Overall the cost of living in Hawaii is higher than that in most mainland communities, which also increases wages. Farms are therefore forced to pay comparatively high wages for labor, therefore driving up their input costs, or farm without supplemental labor, thus limiting their yields. Locally Produced Food on the Island of Hawaii faces two main barriers: lack of distribution infrastructure and a lack of connection between supply and demand. Without a distribution infrastructure that is accessible to food-producers at all scales, locally produced food cannot get to consumers and small businessmen/farmers cannot sell their products. The mismatch between supply and demand is equally critical and takes several forms: small local farmers have trouble supplying food that is of consistent quality and quantity, the demand (in terms of product preference, organic versus not organic, timing of demand, etc.) from consumers is not transparent to farmers, and both consumers and farmers have few ways to rectify this mismatch.
Our research found that there are several major blockage points that are currently preventing the improvement of the combined agriculture and food sector:
• High information and transaction costs, • High input costs, • High cost of labor, • High cost of land (with the exception of Kamehameha leases on the Kona side), • Water availability, and • Lack of secure demand and supply channels.
14
Leverage Points Leverage points can help address these barriers. Leverage points are places in the system where an investment of time and/or money could have multiple positive benefits. Our analysis of the entire system and our search for leverage points are detailed later in this document. For the most part, the leverage points attack the specific barriers mentioned above, and target the biggest gaps in local market share. We found several key leverage points:
• Bring down input costs, • Improve availability of farming land, • Get higher prices for food, • Build a direct relationship between the farmer and the consumer, • Improve market channel infrastructure, and • Enhance sense of agricultural community.
The way we determined the findings in this overview is laid out below, through an explanation of our methodology, a summary of our research into the state of the agricultural and food situation on the island, and a discussion of whole system thinking and how we applied it to analyzing the Island of Hawaii. Finally, we discuss a series of opportunities that can best overcome the blockage points and activate the leverage points, and we recommend the most promising opportunities for deeper financial analysis in Phase II of the project.
15
II. Methodology In order to write this report, we took the following steps: 1. Literature Review: We performed an extensive review of the literature published
about agriculture and food production on the Island of Hawaii. This included food and agriculture statistics published by the government (for example, county historical production, yields, farm values, etc.), other relevant published data such as shipping records, academic journal articles about specific crops or issues, State and County reports about related issues such as water and tourism, legal documents, and newspaper articles. The purpose of this review was to understand the basic agriculture and food production situation on the Island, to identify the most important areas, and to guide the interview phase of research.
2. Interview Phase: We interviewed more than fifty people involved in the food value chain, from farmers to end-users. Using our contacts from previous RMI projects in Hawaii, as well as the Kohala Center’s extensive network, we identified individuals on the Island who were making sustainable farming work well, helping increase local consumption of Hawaii-grown food, and had strong visions for the future. For a complete list of interviewees, see Appendix B. We asked each interviewee specific questions about his or her own operations, what they identified as the main obstacles to local consumption, the opportunities that they saw in the area, and their own ideas about what business-oriented or NGO solutions could help overcome those blockages and build on these opportunities.
3. Creation of the Whole System Diagram: Using the literature review, information from interviews, and our own experience in Hawaii, we created a whole-system diagram of the agriculture and food sector, and extended that diagram to show how each sector interacts with other sectors, such as housing and energy. For a full discussion of the whole-system diagram, see section IV.
4. Analysis: We organized the ideas and information from our interviewees in several lists. First, we identified “blockages”—obstacles to the growing and consumption of locally produced food—that came up recurrently in our research. Next, in association with each blockage we found a few potential leverage points, which are places where an investment of energy or money would have multiple positive effects on the community and locally produced food consumption. Finally, we created a list of forty relatively specific business-oriented or non-profit solutions, which are ventures that could activate the leverage points. We chose ideas for each list based on how often they came up in interviews, on our own understanding of the Island agriculture system, and using sustainability (business, social, and environmental) metrics.
5. Reality Check: The reality check was two-fold. First, we returned to our literature review and available data to calculate physical barriers (such as land and water availability) and legal barriers to expanded local food production and consumption, as well as economic threats (such as competition from tourism). Second, we interviewed another set of people involved in the food and agriculture world whom we believed had a more traditional view of agriculture, or who had long-term or a high-level experience on the Island. We asked for their reaction to our preliminary findings and guidance about avoiding pitfalls associated with our ideas as the project moved forward.

16
6. Preliminary “Best Options” Selection: Using a set of criteria we developed ourselves we rated the specific ideas that originated from our interviews and research and choose the ones most likely to get more people in Hawaii eating locally produced food. For a complete discussion of selection criteria, see Section V.
17
III. Food and Agriculture in Hawaii: Brief History and Current Situation
Agriculture on the Island of Hawaii
History Hawaiians have been successfully cultivating the land for centuries. Archaeological evidence indicates that the pre-Cook Hawaiians lived well above the subsistence level, but there were a few periods of hardship due to droughts. Taro, sweet potatoes, and yams were all crucial starches. Traditional Hawaiian agriculture used the ahupua'a system, whereby land was divided into units according to watershed and the units ran from the mountain to the sea so that each unit included land appropriate for several kinds of crops, as well as fishing grounds. The islands’ population was generally estimated at several hundred thousand people. The Island of Hawaii’s population was thought to be around 100,000, with some estimates suggesting a much greater population.4
Captain James Cook initiated Hawaii’s contact with the trading world in the late 18th century. This, in turn, brought about the first adverse impacts on agriculture due to commodity trade. Once contact was established with Asia, Hawaii became a major exporter of sandalwood to China. King Kamehameha I managed the forests sustainably, but when King Kamehameha II came into power (1819) he decentralized production. Because of the decentralized management, no one authority had an incentive to maintain the sandalwood population as a whole or to balance sandalwood production with other uses for land. "The reallocation of resources from agricultural production to sandalwood production not only led to rapid exhaustion of the sandalwood resource and widespread ecological degradation, but also to famine."5
Contact with the outside world brought other large agricultural industries to Hawaii, including the provision of food to whalers, and eventually sugar. The rise and fall of the sugar plantations is discussed in more detail below. Pineapple followed sugar as the main cash crop.
Economic Value The Island of Hawaii has the most agricultural land of any island in the state: of all agricultural lands in use in the state, 63 percent are on the Island of Hawaii. In the 2000s, the agricultural sector contributed roughly 3 percent of GSP and 5 percent of state jobs. The Island of Hawaii represented 36 percent of all agricultural sales (crops, livestock, and aquaculture). As Figure 1 shows, the Island produces a wide array of fruits, vegetables, and protein products. The Island of Hawaii has many microclimates so
4 La Croix, Sumner. "The Economic History of Hawaii: A Short Introduction." Working Paper No. 02-3. University of Hawaii, Department of Economics. January 2002. (3) 5 La Croix, Sumner. "The Economic History of Hawaii: A Short Introduction." Working Paper No. 02-3. University of Hawaii, Department of Economics. January 2002. (6)
18
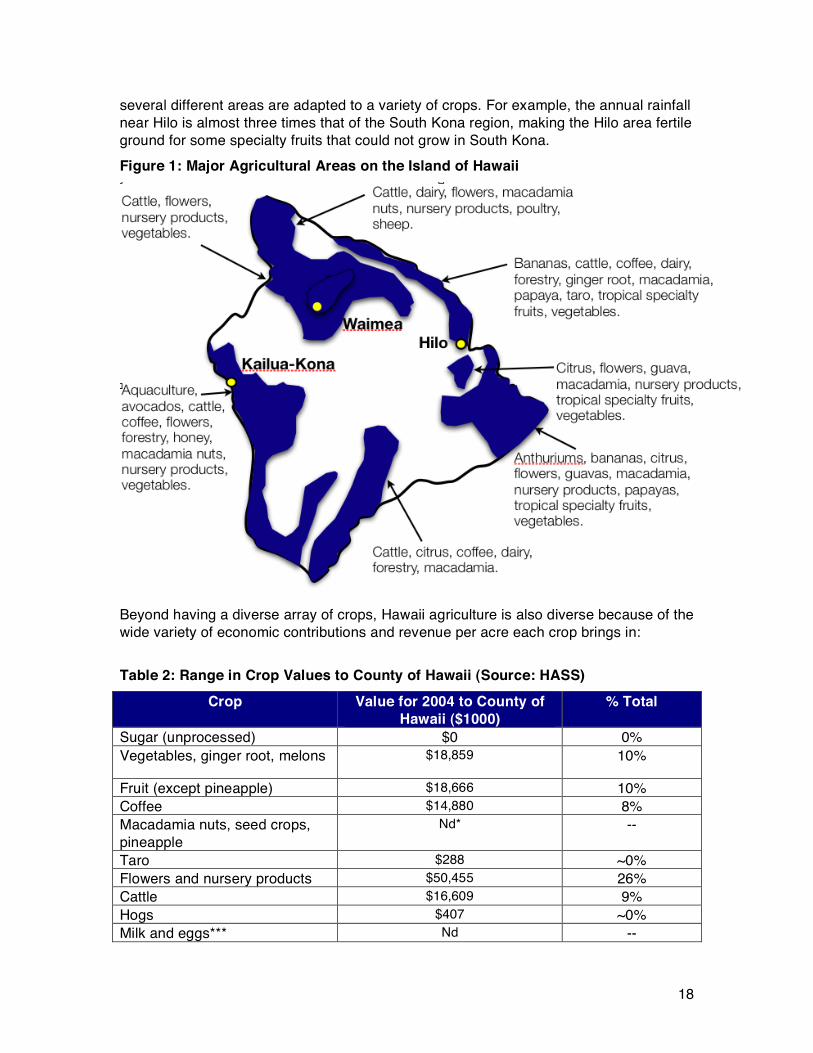
several different areas are adapted to a variety of crops. For example, the annual rainfall near Hilo is almost three times that of the South Kona region, making the Hilo area fertile ground for some specialty fruits that could not grow in South Kona. Figure 1: Major Agricultural Areas on the Island of Hawaii
Beyond having a diverse array of crops, Hawaii agriculture is also diverse because of the wide variety of economic contributions and revenue per acre each crop brings in: Table 2: Range in Crop Values to County of Hawaii (Source: HASS)
Crop Value for 2004 to County of Hawaii ($1000)
% Total
Sugar (unprocessed) $0 0% Vegetables, ginger root, melons $18,859 10%
Fruit (except pineapple) $18,666 10% Coffee $14,880 8% Macadamia nuts, seed crops, pineapple
Nd* --
Taro $288 ~0% Flowers and nursery products $50,455 26% Cattle $16,609 9% Hogs $407 ~0% Milk and eggs*** Nd --
19
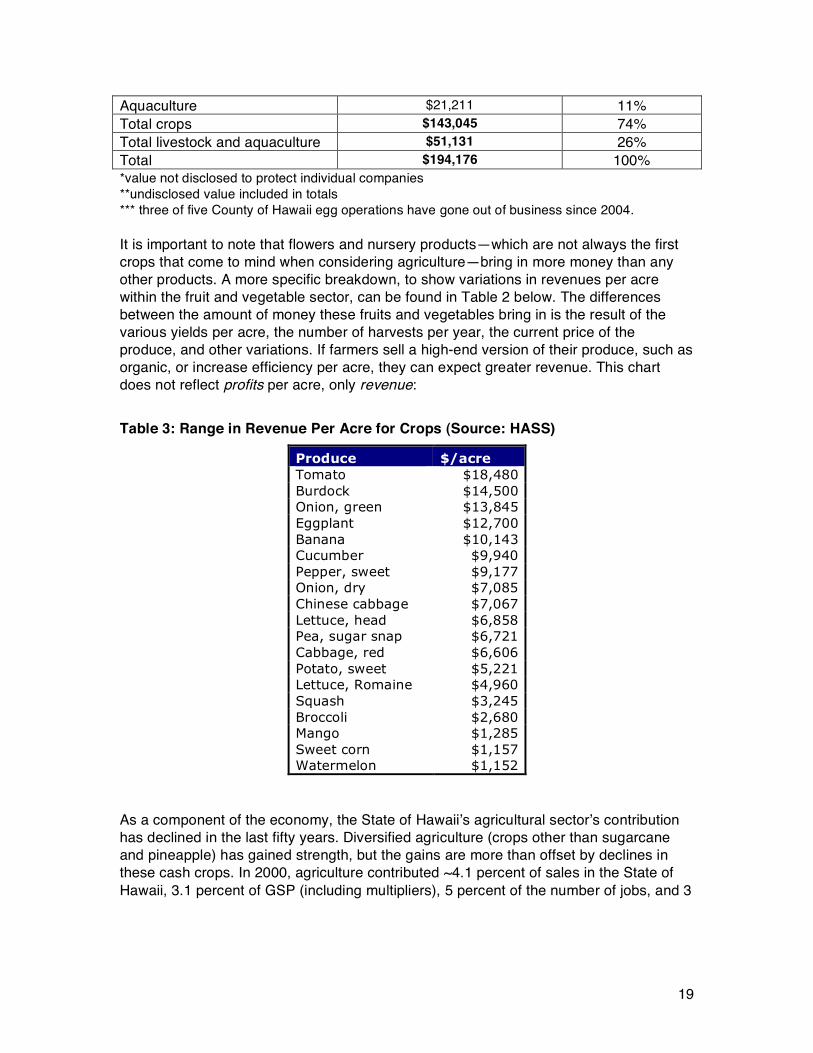
Aquaculture $21,211 11% Total crops $143,045 74% Total livestock and aquaculture $51,131 26% Total $194,176 100% *value not disclosed to protect individual companies **undisclosed value included in totals *** three of five County of Hawaii egg operations have gone out of business since 2004. It is important to note that flowers and nursery products—which are not always the first crops that come to mind when considering agriculture—bring in more money than any other products. A more specific breakdown, to show variations in revenues per acre within the fruit and vegetable sector, can be found in Table 2 below. The differences between the amount of money these fruits and vegetables bring in is the result of the various yields per acre, the number of harvests per year, the current price of the produce, and other variations. If farmers sell a high-end version of their produce, such as organic, or increase efficiency per acre, they can expect greater revenue. This chart does not reflect profits per acre, only revenue: Table 3: Range in Revenue Per Acre for Crops (Source: HASS)
Produce $/acre Tomato $18,480 Burdock $14,500 Onion, green $13,845 Eggplant $12,700 Banana $10,143 Cucumber $9,940 Pepper, sweet $9,177 Onion, dry $7,085 Chinese cabbage $7,067 Lettuce, head $6,858 Pea, sugar snap $6,721 Cabbage, red $6,606 Potato, sweet $5,221 Lettuce, Romaine $4,960 Squash $3,245 Broccoli $2,680 Mango $1,285 Sweet corn $1,157 Watermelon $1,152
As a component of the economy, the State of Hawaii’s agricultural sector’s contribution has declined in the last fifty years. Diversified agriculture (crops other than sugarcane and pineapple) has gained strength, but the gains are more than offset by declines in these cash crops. In 2000, agriculture contributed ~4.1 percent of sales in the State of Hawaii, 3.1 percent of GSP (including multipliers), 5 percent of the number of jobs, and 3
20
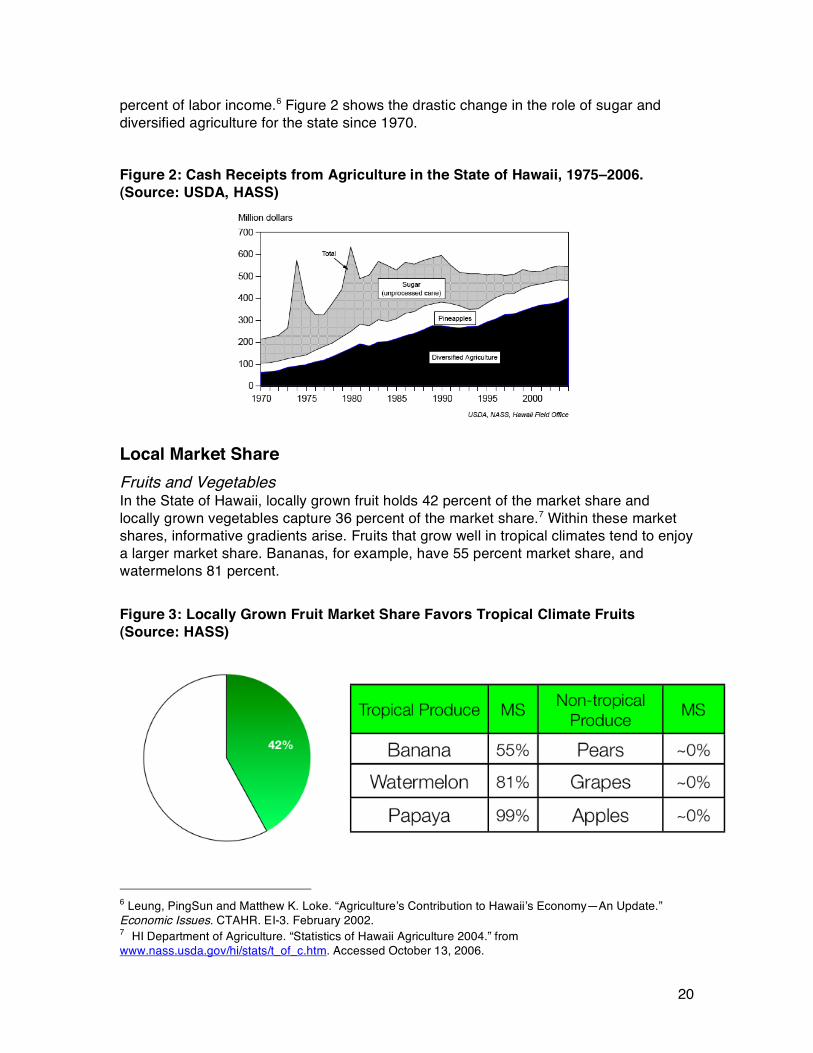
percent of labor income.6 Figure 2 shows the drastic change in the role of sugar and diversified agriculture for the state since 1970.
Figure 2: Cash Receipts from Agriculture in the State of Hawaii, 1975–2006. (Source: USDA, HASS)
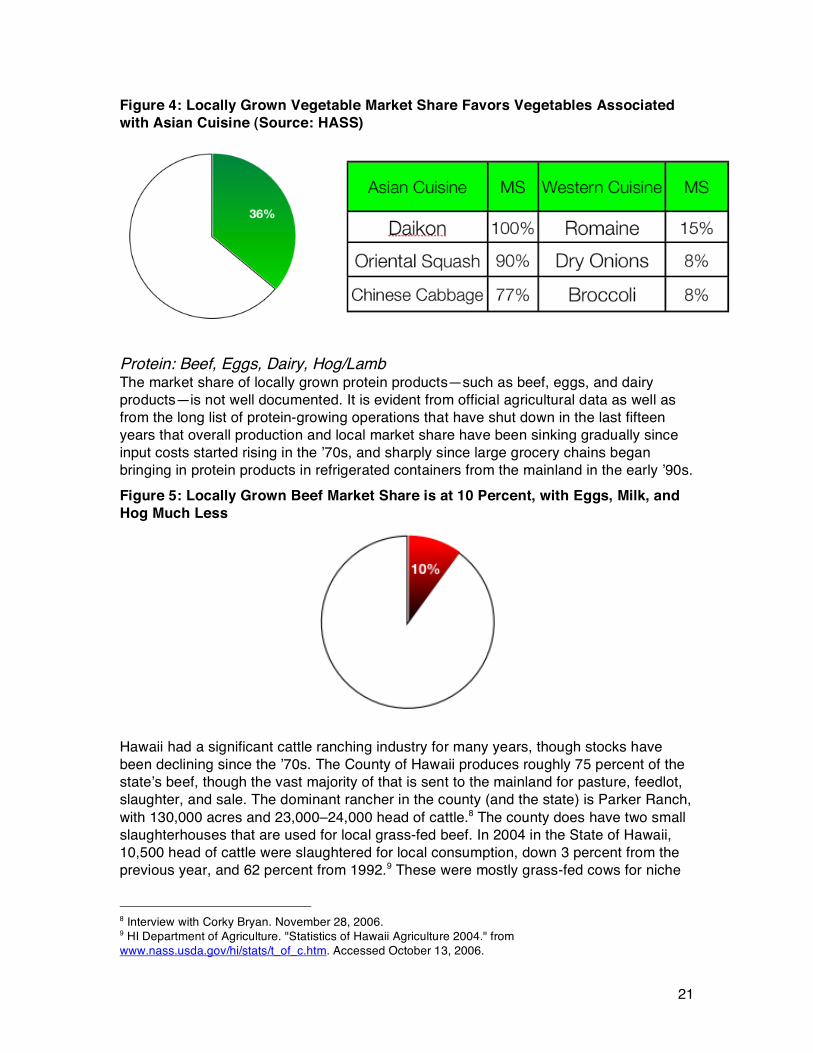
Local Market Share Fruits and Vegetables In the State of Hawaii, locally grown fruit holds 42 percent of the market share and locally grown vegetables capture 36 percent of the market share.7 Within these market shares, informative gradients arise. Fruits that grow well in tropical climates tend to enjoy a larger market share. Bananas, for example, have 55 percent market share, and watermelons 81 percent. Figure 3: Locally Grown Fruit Market Share Favors Tropical Climate Fruits (Source: HASS)
6 Leung, PingSun and Matthew K. Loke. “Agriculture’s Contribution to Hawaii’s Economy—An Update.” Economic Issues. CTAHR. EI-3. February 2002. 7 HI Department of Agriculture. “Statistics of Hawaii Agriculture 2004.” from www.nass.usda.gov/hi/stats/t_of_c.htm. Accessed October 13, 2006.
21
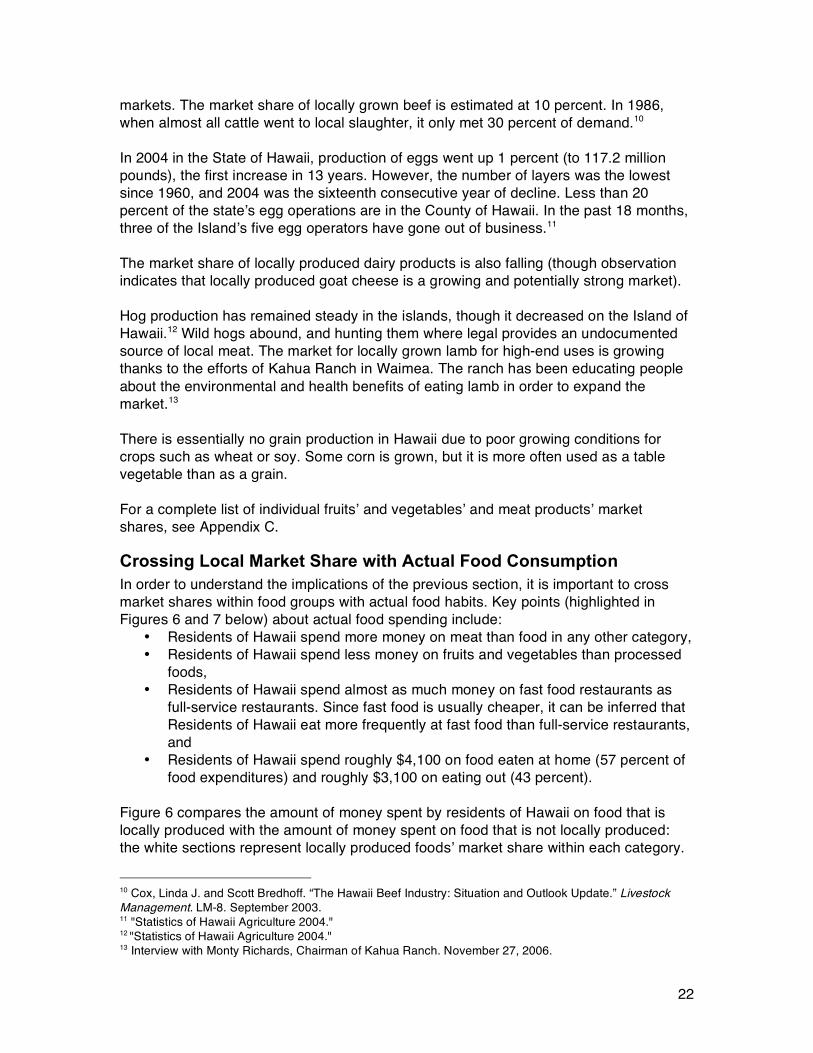
Figure 4: Locally Grown Vegetable Market Share Favors Vegetables Associated with Asian Cuisine (Source: HASS)
Protein: Beef, Eggs, Dairy, Hog/Lamb The market share of locally grown protein products—such as beef, eggs, and dairy products—is not well documented. It is evident from official agricultural data as well as from the long list of protein-growing operations that have shut down in the last fifteen years that overall production and local market share have been sinking gradually since input costs started rising in the ’70s, and sharply since large grocery chains began bringing in protein products in refrigerated containers from the mainland in the early ’90s. Figure 5: Locally Grown Beef Market Share is at 10 Percent, with Eggs, Milk, and Hog Much Less
Hawaii had a significant cattle ranching industry for many years, though stocks have been declining since the ’70s. The County of Hawaii produces roughly 75 percent of the state’s beef, though the vast majority of that is sent to the mainland for pasture, feedlot, slaughter, and sale. The dominant rancher in the county (and the state) is Parker Ranch, with 130,000 acres and 23,000–24,000 head of cattle.8 The county does have two small slaughterhouses that are used for local grass-fed beef. In 2004 in the State of Hawaii, 10,500 head of cattle were slaughtered for local consumption, down 3 percent from the previous year, and 62 percent from 1992.9 These were mostly grass-fed cows for niche
8 Interview with Corky Bryan. November 28, 2006. 9 HI Department of Agriculture. "Statistics of Hawaii Agriculture 2004." from www.nass.usda.gov/hi/stats/t_of_c.htm. Accessed October 13, 2006.
22
markets. The market share of locally grown beef is estimated at 10 percent. In 1986, when almost all cattle went to local slaughter, it only met 30 percent of demand.10 In 2004 in the State of Hawaii, production of eggs went up 1 percent (to 117.2 million pounds), the first increase in 13 years. However, the number of layers was the lowest since 1960, and 2004 was the sixteenth consecutive year of decline. Less than 20 percent of the state’s egg operations are in the County of Hawaii. In the past 18 months, three of the Island’s five egg operators have gone out of business.11 The market share of locally produced dairy products is also falling (though observation indicates that locally produced goat cheese is a growing and potentially strong market). Hog production has remained steady in the islands, though it decreased on the Island of Hawaii.12 Wild hogs abound, and hunting them where legal provides an undocumented source of local meat. The market for locally grown lamb for high-end uses is growing thanks to the efforts of Kahua Ranch in Waimea. The ranch has been educating people about the environmental and health benefits of eating lamb in order to expand the market.13 There is essentially no grain production in Hawaii due to poor growing conditions for crops such as wheat or soy. Some corn is grown, but it is more often used as a table vegetable than as a grain. For a complete list of individual fruits’ and vegetables’ and meat products’ market shares, see Appendix C.
Crossing Local Market Share with Actual Food Consumption In order to understand the implications of the previous section, it is important to cross market shares within food groups with actual food habits. Key points (highlighted in Figures 6 and 7 below) about actual food spending include:
• Residents of Hawaii spend more money on meat than food in any other category, • Residents of Hawaii spend less money on fruits and vegetables than processed
foods, • Residents of Hawaii spend almost as much money on fast food restaurants as
full-service restaurants. Since fast food is usually cheaper, it can be inferred that Residents of Hawaii eat more frequently at fast food than full-service restaurants, and
• Residents of Hawaii spend roughly $4,100 on food eaten at home (57 percent of food expenditures) and roughly $3,100 on eating out (43 percent).
Figure 6 compares the amount of money spent by residents of Hawaii on food that is locally produced with the amount of money spent on food that is not locally produced: the white sections represent locally produced foods’ market share within each category.
10 Cox, Linda J. and Scott Bredhoff. “The Hawaii Beef Industry: Situation and Outlook Update.” Livestock Management. LM-8. September 2003. 11 "Statistics of Hawaii Agriculture 2004." 12 "Statistics of Hawaii Agriculture 2004." 13 Interview with Monty Richards, Chairman of Kahua Ranch. November 27, 2006.
23
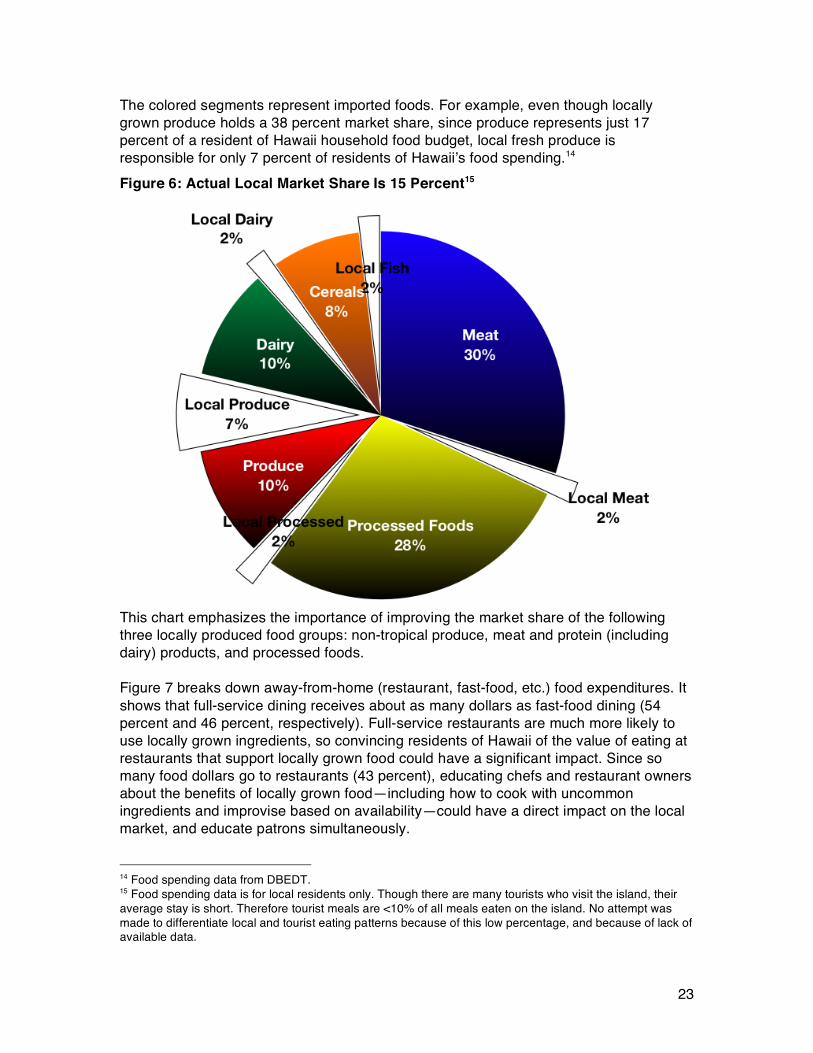
The colored segments represent imported foods. For example, even though locally grown produce holds a 38 percent market share, since produce represents just 17 percent of a resident of Hawaii household food budget, local fresh produce is responsible for only 7 percent of residents of Hawaii’s food spending.14 Figure 6: Actual Local Market Share Is 15 Percent15
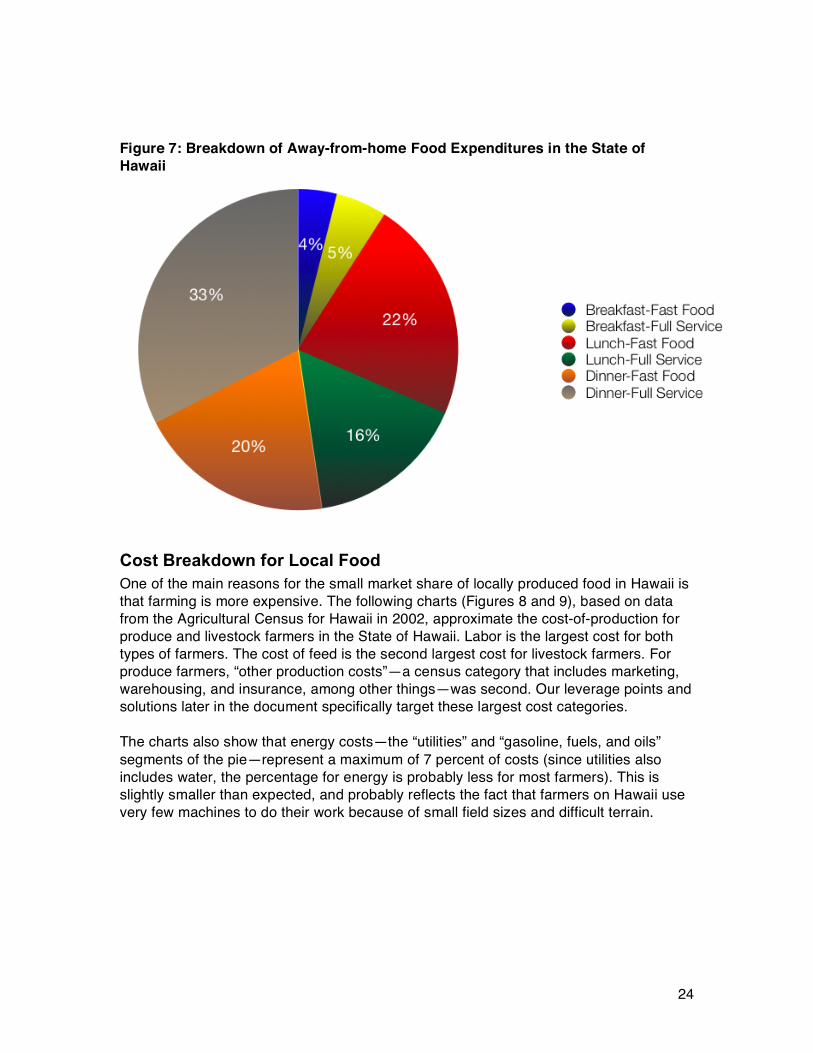
This chart emphasizes the importance of improving the market share of the following three locally produced food groups: non-tropical produce, meat and protein (including dairy) products, and processed foods. Figure 7 breaks down away-from-home (restaurant, fast-food, etc.) food expenditures. It shows that full-service dining receives about as many dollars as fast-food dining (54 percent and 46 percent, respectively). Full-service restaurants are much more likely to use locally grown ingredients, so convincing residents of Hawaii of the value of eating at restaurants that support locally grown food could have a significant impact. Since so many food dollars go to restaurants (43 percent), educating chefs and restaurant owners about the benefits of locally grown food—including how to cook with uncommon ingredients and improvise based on availability—could have a direct impact on the local market, and educate patrons simultaneously.
14 Food spending data from DBEDT. 15 Food spending data is for local residents only. Though there are many tourists who visit the island, their average stay is short. Therefore tourist meals are <10% of all meals eaten on the island. No attempt was made to differentiate local and tourist eating patterns because of this low percentage, and because of lack of available data.
24
Figure 7: Breakdown of Away-from-home Food Expenditures in the State of Hawaii
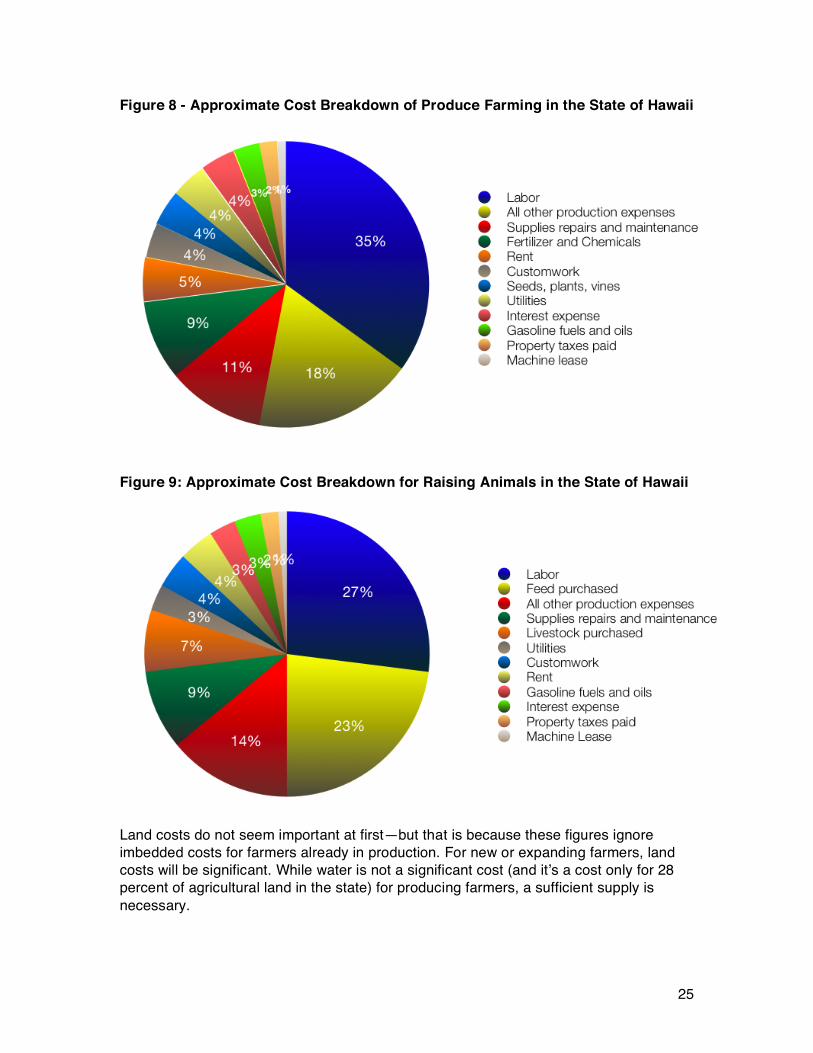
Cost Breakdown for Local Food One of the main reasons for the small market share of locally produced food in Hawaii is that farming is more expensive. The following charts (Figures 8 and 9), based on data from the Agricultural Census for Hawaii in 2002, approximate the cost-of-production for produce and livestock farmers in the State of Hawaii. Labor is the largest cost for both types of farmers. The cost of feed is the second largest cost for livestock farmers. For produce farmers, “other production costs”—a census category that includes marketing, warehousing, and insurance, among other things—was second. Our leverage points and solutions later in the document specifically target these largest cost categories. The charts also show that energy costs—the “utilities” and “gasoline, fuels, and oils” segments of the pie—represent a maximum of 7 percent of costs (since utilities also includes water, the percentage for energy is probably less for most farmers). This is slightly smaller than expected, and probably reflects the fact that farmers on Hawaii use very few machines to do their work because of small field sizes and difficult terrain.
25
Figure 8 - Approximate Cost Breakdown of Produce Farming in the State of Hawaii
Figure 9: Approximate Cost Breakdown for Raising Animals in the State of Hawaii
Land costs do not seem important at first—but that is because these figures ignore imbedded costs for farmers already in production. For new or expanding farmers, land costs will be significant. While water is not a significant cost (and it’s a cost only for 28 percent of agricultural land in the state) for producing farmers, a sufficient supply is necessary.
26
These production cost breakdowns can help prioritize ways of cutting costs in order to bring farmers’ margins up or the cost of locally produced food down.
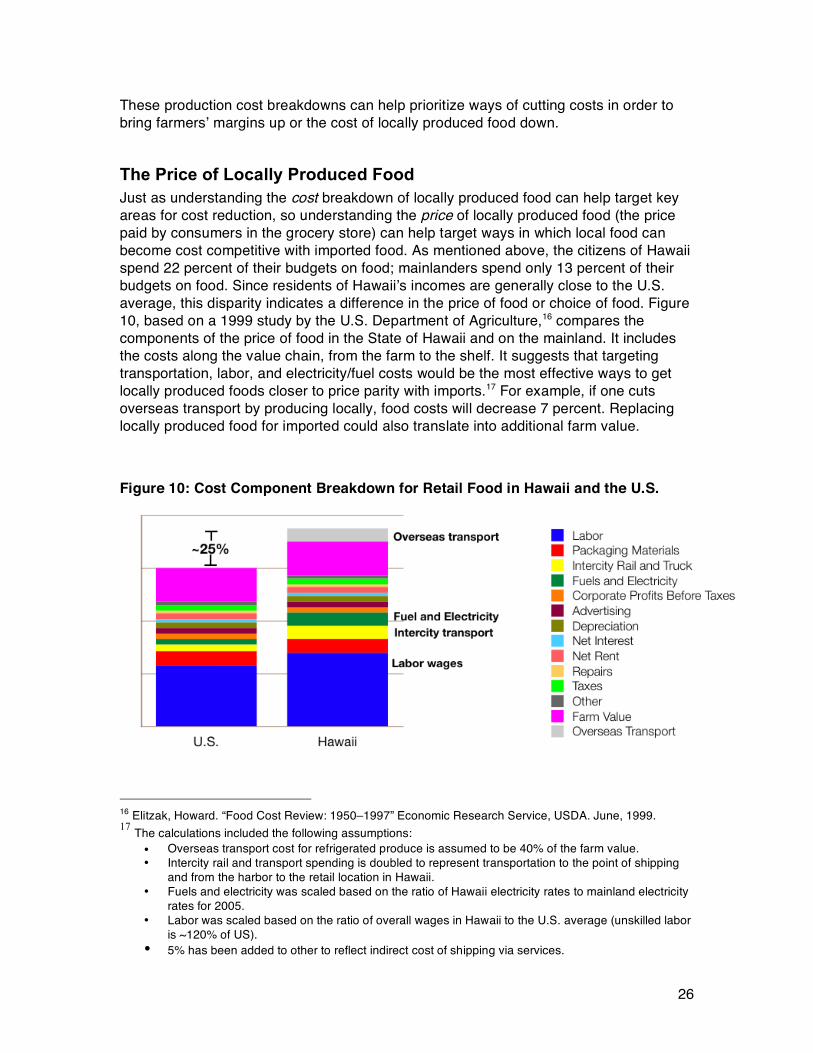
The Price of Locally Produced Food Just as understanding the cost breakdown of locally produced food can help target key areas for cost reduction, so understanding the price of locally produced food (the price paid by consumers in the grocery store) can help target ways in which local food can become cost competitive with imported food. As mentioned above, the citizens of Hawaii spend 22 percent of their budgets on food; mainlanders spend only 13 percent of their budgets on food. Since residents of Hawaii’s incomes are generally close to the U.S. average, this disparity indicates a difference in the price of food or choice of food. Figure 10, based on a 1999 study by the U.S. Department of Agriculture,16 compares the components of the price of food in the State of Hawaii and on the mainland. It includes the costs along the value chain, from the farm to the shelf. It suggests that targeting transportation, labor, and electricity/fuel costs would be the most effective ways to get locally produced foods closer to price parity with imports.17 For example, if one cuts overseas transport by producing locally, food costs will decrease 7 percent. Replacing locally produced food for imported could also translate into additional farm value. Figure 10: Cost Component Breakdown for Retail Food in Hawaii and the U.S.
16 Elitzak, Howard. “Food Cost Review: 1950–1997” Economic Research Service, USDA. June, 1999. 17 The calculations included the following assumptions:
• Overseas transport cost for refrigerated produce is assumed to be 40% of the farm value. • Intercity rail and transport spending is doubled to represent transportation to the point of shipping
and from the harbor to the retail location in Hawaii. • Fuels and electricity was scaled based on the ratio of Hawaii electricity rates to mainland electricity
rates for 2005. • Labor was scaled based on the ratio of overall wages in Hawaii to the U.S. average (unskilled labor
is ~120% of US). • 5% has been added to other to reflect indirect cost of shipping via services.
27
Clearly there is much room to improve Hawaii’s agricultural sector and locally produced foods’ market share, both for produce and for protein products. However, aiming solely to ramp up the agricultural sector or increase the market share of locally produced food is not necessarily the best choice for the community on the Island of Hawaii, as shown by several historical examples. The next section includes examples of dangerously unsustainable developments in agriculture, as well as the economic fragility of an undiversified agricultural sector and economy. These examples offer lessons for anyone working to improve local agriculture. Following the negative examples of the past are several examples of agricultural and local food businesses on the Island of Hawaii that are economically successful and responsible in regards to the environment and community. They prove that it is possible to improve the agriculture and locally grown food sectors in a sustainable way, and offer models for new businesses.
The Dangers of Monocropping and Economic Homogeneity After the agricultural and ecological disaster brought on by over-reliance on the sandalwood trade detailed above, Hawaii continued to rely on monocrop cash crops and a non-diverse economy, and suffered many negative consequences. The following histories show the fragility and potential for economic depression that accompany an economy without diversity. The first history tells of the rise of the State of Hawaii’s sugar plantations, their complete domination over the islands’ economy, and the consequences of their collapse due to economic factors and competition. The next history concerns the severe impact of a biological disaster on Hawaii’s papaya industry—which represents 57 percent of the Island of Hawaii’s agricultural value. This type of disaster could affect every crop on the Island. The final history relates how the State replaced sugar with tourism as the disproportionately dominant economic force, and how 9/11 provided a flash of insight into the fragility of tourism.
The Rise and Fall of Hawaii’s Sugar Plantations The history of sugarcane demonstrates the dangers of monocropping. However, this history also matters because the reverberations of the sugarcane collapse are still present in today’s Island society, and because the physical skeleton of the industry (land, irrigation infrastructure, roads) remains. In telling the story, we hope not only to explain why monocrop commodity agriculture cannot work on the Island, but also to explain the current situation and set the stage for looking for ways to utilize the sugar industry’s skeleton for the benefit of diversified agriculture and local food. Since 1883, sugarcane had been the dominant cash crop for Hawaii. Soon after the establishment of plantations, five companies came to dominate 96 percent of the fields. These companies wielded immense political power, and were able to lobby successfully for policies that benefited sugar agriculture. They helped overthrow the monarchy and push Hawaii towards statehood. The plantations also yielded enormous social power: workers lived on plantations; schools and stores were located on plantations; and families worked for the same plantation for generations. The success of the plantations relied heavily on their practice of importing contracted workers, mostly from Asia, and
28
paying them extremely low wages (half to two-thirds of comparable wages elsewhere in the world).18 The factors leading to the decline of the sugar plantations emerged during World War II. Effectively all of Hawaii's sugar plantations were unionized during and immediately after the war.19 There was a large sugar worker strike in 1946. Demands for fair pay and treatment continued and escalated after Hawaii became a state in 1959. At the same time, South American and Caribbean countries began to increase production (meanwhile paying the low wages no longer possible in Hawaii), causing sugar prices to drop. In 1975, high fructose corn syrup entered the market, providing a low-cost sugar substitute and driving down the price of sugar further. Cost of imports also went up. By the early ’80s, Hawaii’s sugar plantations began to fold. In the wake of the closings, life for many on the Island of Hawaii underwent drastic economic and social change. The plantations provided housing and other services for their workers, creating company towns where life revolved around the plantation. Three generations of people from the Island of Hawaii, notably those on the Hilo side of the Island, grew up within the plantation community, naturally progressing to plantation jobs after school. The closing of the final three Island of Hawaii plantations, in 1993, 1994, and 1995, was socially and economically traumatic. The University of Hawaii–Manoa collected oral histories concerning the closings of the Island of Hawaii’s plantations. The workers expressed shock at the disappearance of a job market and lifestyle on which they had depended for years, and which they had believed to be permanent:
Well, the plantation has been really the only way of life we knew, growing up as children. And at that time, we just assumed that the plantation would be here forever. And growing up in the plantation town, you knew about the company, you were familiar what was going on, you knew who was doing what, and so it was an easy transition for me, coming out of school and needing a job and going to work. —Clyde Silva, former Ka'u Agribusiness Company worker. [After the closings] I used to always hear [from the old-timers] like, 'Ah, you young guys, you don't care. How come you folks not out looking for job? How come you folks still here?' kind of questions. So I gotta explain to them, 'You know, I see you guys work thirty, forty years on the plantation. . . . We always wanted to work for the plantation, you know, drive truck . . . or tractors. . . . For see this [sugar industry] just put away on the side is really hard to accept. Even for us, being the younger
18 La Croix, Sumner. “The Economic History of Hawaii: A Short Introduction.” Working Paper No. 02-3. University of Hawaii, Department of Economics. January 2002. (11) 19 La Croix, Sumner. “The Economic History of Hawaii: A Short Introduction.” Working Paper No. 02-3. University of Hawaii, Department of Economics. January 2002. (11)
29
generation.' —Darren Gamayo, former Hāmākua Sugar Company worker.20
The University of Manoa’s Center for the Family did a study about the impact of the sweeping job losses on the Island of Hawaii following the closures of the final three plantations, and the general economic stagnation in the state during the mid-1990s. Half the interviewees were former plantation workers, and all had at least one family member who worked on the plantations. The study found:
• Fifteen months after being laid-off, 35 percent of workers were still unemployed, • More than 50 percent of families reported a notable decline in the family’s
standard of living, • Ten to twenty percent of families used or applied for public assistance, and 40
percent used other forms of assistance such as food banks, and • Families with laid-off workers had sharply increased levels of psychological
complaints and distress. The increased level of psychological complaints (such as depression and anxiety) persisted after finding a new job. Interviewees and the researchers suggested that this was due to the general disruption of the community, and the effects of 1.5–4 hour commutes required of most ex-plantation workers to get to new jobs, as well as less time with their families.21
While the sugarcane industry’s impact on the Island is unparalleled, other monocrop situations have been grown; they also fared poorly on the Island.
The Aloha Papaya As the history of sugar showed, undiversified agriculture is economically fragile. These economic dangers are compounded by the ecological fragility of monocrops, which are more susceptible to disease or other biological challenge. The story of the Aloha Papaya shows how these two weaknesses combined to damage the agricultural sector. The vulnerability of Hawaii Island’s important papaya industry to market prices, and the problematic efforts to save the industry via genetically engineered varieties, demonstrate the dangers of trying to produce commodity crops in Hawaii and the biological fragility of single-crop agriculture. Papaya production has been declining rapidly because of the ecological disaster of ringspot virus and attempts to cope with it via genetic engineering, which has serious impacts on agriculture in the County of Hawaii. This decline is all the more damaging because it happened simultaneously with a more than doubling of per capita consumption of papaya on the mainland. In 1992, the ringspot virus was detected in Hawaii’s papayas. To combat the virus, the University of Hawaii and other organizations developed the Aloha Papaya, a genetically engineered species resistant to the disease. About 60 percent of the state’s papaya growers (mainly on the Island of Hawaii) eventually adopted the variety, with the support of the University, starting in 1998. As shown on Figure 11, papaya sales experienced a
20 “University of Hawaii at Manoa Center for Oral Histories: The Closing of Sugar Plantations: Interviews with Families of Hāmākua and Ka’u, Hawai’i.” www.oralhistory.hawaii.edu/pages/community/hamakua.html. Accessed January 13, 2007. 21 DeBaryshe, Barbara, Ivette Rodriguez-Stern, and Sylvia Yuen. “Family Report: Job Losses and Families.” UH–Manoa Center on the Family. Honolulu, Hawaii. Summer, 1998.
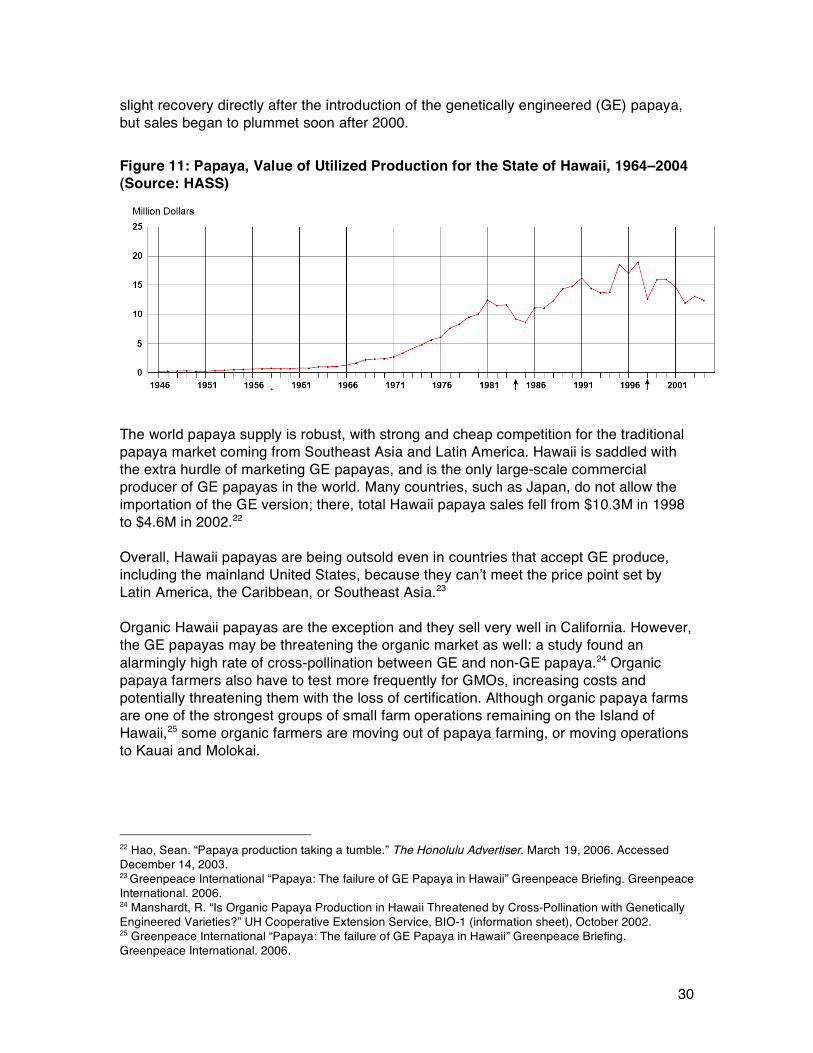
30
slight recovery directly after the introduction of the genetically engineered (GE) papaya, but sales began to plummet soon after 2000. Figure 11: Papaya, Value of Utilized Production for the State of Hawaii, 1964–2004 (Source: HASS)
The world papaya supply is robust, with strong and cheap competition for the traditional papaya market coming from Southeast Asia and Latin America. Hawaii is saddled with the extra hurdle of marketing GE papayas, and is the only large-scale commercial producer of GE papayas in the world. Many countries, such as Japan, do not allow the importation of the GE version; there, total Hawaii papaya sales fell from $10.3M in 1998 to $4.6M in 2002.22
Overall, Hawaii papayas are being outsold even in countries that accept GE produce, including the mainland United States, because they can’t meet the price point set by Latin America, the Caribbean, or Southeast Asia.23
Organic Hawaii papayas are the exception and they sell very well in California. However, the GE papayas may be threatening the organic market as well: a study found an alarmingly high rate of cross-pollination between GE and non-GE papaya.24 Organic papaya farmers also have to test more frequently for GMOs, increasing costs and potentially threatening them with the loss of certification. Although organic papaya farms are one of the strongest groups of small farm operations remaining on the Island of Hawaii,25 some organic farmers are moving out of papaya farming, or moving operations to Kauai and Molokai.
22 Hao, Sean. “Papaya production taking a tumble.” The Honolulu Advertiser. March 19, 2006. Accessed December 14, 2003. 23 Greenpeace International “Papaya: The failure of GE Papaya in Hawaii” Greenpeace Briefing. Greenpeace International. 2006. 24 Manshardt, R. “Is Organic Papaya Production in Hawaii Threatened by Cross-Pollination with Genetically Engineered Varieties?” UH Cooperative Extension Service, BIO-1 (information sheet), October 2002. 25 Greenpeace International “Papaya: The failure of GE Papaya in Hawaii” Greenpeace Briefing. Greenpeace International. 2006.
31
The Aloha papaya demonstrates difficulties Hawaii products face if they try to compete in a commodity market, the instability of a non-diversified agriculture sector, and the potential ecological and economic ramifications of GE produce in Hawaii.
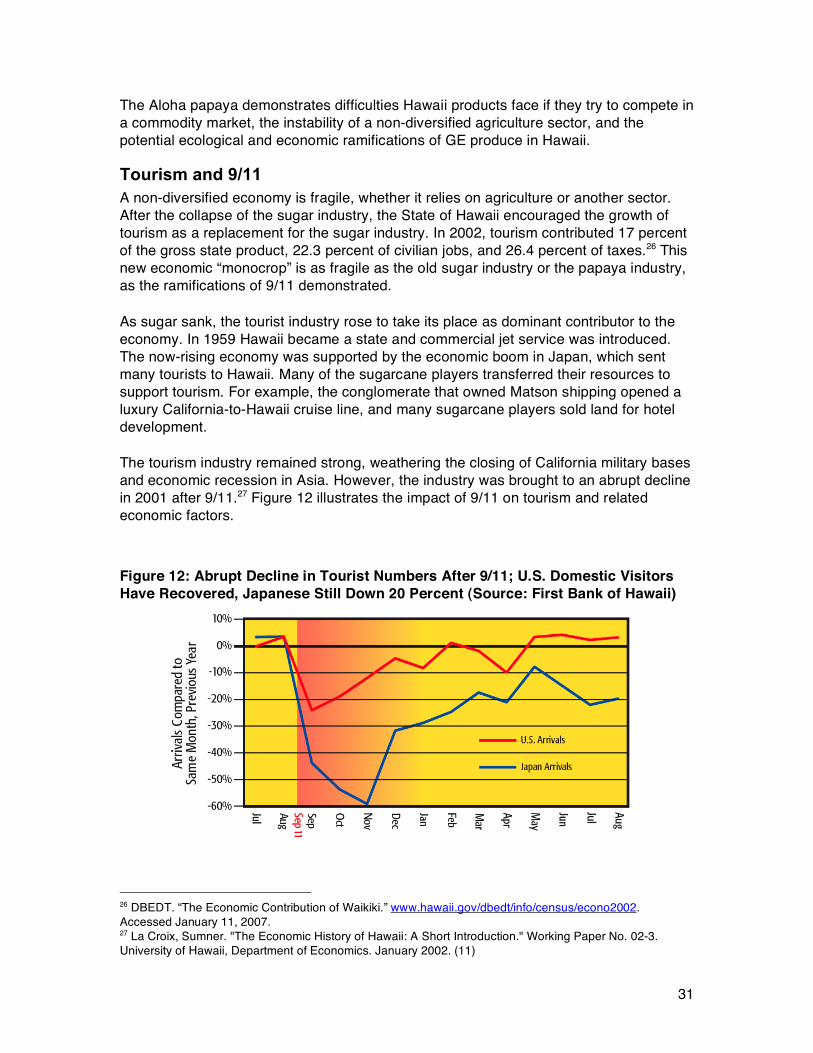
Tourism and 9/11 A non-diversified economy is fragile, whether it relies on agriculture or another sector. After the collapse of the sugar industry, the State of Hawaii encouraged the growth of tourism as a replacement for the sugar industry. In 2002, tourism contributed 17 percent of the gross state product, 22.3 percent of civilian jobs, and 26.4 percent of taxes.26 This new economic “monocrop” is as fragile as the old sugar industry or the papaya industry, as the ramifications of 9/11 demonstrated. As sugar sank, the tourist industry rose to take its place as dominant contributor to the economy. In 1959 Hawaii became a state and commercial jet service was introduced. The now-rising economy was supported by the economic boom in Japan, which sent many tourists to Hawaii. Many of the sugarcane players transferred their resources to support tourism. For example, the conglomerate that owned Matson shipping opened a luxury California-to-Hawaii cruise line, and many sugarcane players sold land for hotel development. The tourism industry remained strong, weathering the closing of California military bases and economic recession in Asia. However, the industry was brought to an abrupt decline in 2001 after 9/11.27 Figure 12 illustrates the impact of 9/11 on tourism and related economic factors. Figure 12: Abrupt Decline in Tourist Numbers After 9/11; U.S. Domestic Visitors Have Recovered, Japanese Still Down 20 Percent (Source: First Bank of Hawaii)
26 DBEDT. “The Economic Contribution of Waikiki.” www.hawaii.gov/dbedt/info/census/econo2002. Accessed January 11, 2007. 27 La Croix, Sumner. "The Economic History of Hawaii: A Short Introduction." Working Paper No. 02-3. University of Hawaii, Department of Economics. January 2002. (11)
32
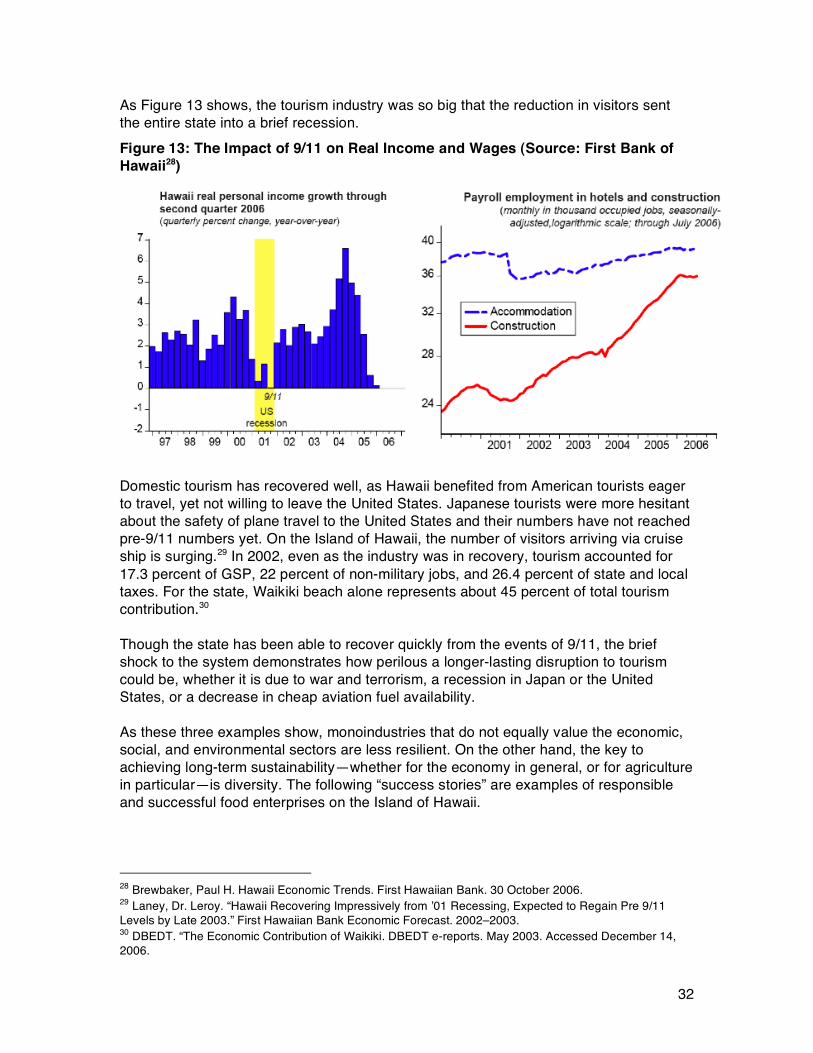
As Figure 13 shows, the tourism industry was so big that the reduction in visitors sent the entire state into a brief recession. Figure 13: The Impact of 9/11 on Real Income and Wages (Source: First Bank of Hawaii28)
Domestic tourism has recovered well, as Hawaii benefited from American tourists eager to travel, yet not willing to leave the United States. Japanese tourists were more hesitant about the safety of plane travel to the United States and their numbers have not reached pre-9/11 numbers yet. On the Island of Hawaii, the number of visitors arriving via cruise ship is surging.29 In 2002, even as the industry was in recovery, tourism accounted for 17.3 percent of GSP, 22 percent of non-military jobs, and 26.4 percent of state and local taxes. For the state, Waikiki beach alone represents about 45 percent of total tourism contribution.30 Though the state has been able to recover quickly from the events of 9/11, the brief shock to the system demonstrates how perilous a longer-lasting disruption to tourism could be, whether it is due to war and terrorism, a recession in Japan or the United States, or a decrease in cheap aviation fuel availability. As these three examples show, monoindustries that do not equally value the economic, social, and environmental sectors are less resilient. On the other hand, the key to achieving long-term sustainability—whether for the economy in general, or for agriculture in particular—is diversity. The following “success stories” are examples of responsible and successful food enterprises on the Island of Hawaii.
28 Brewbaker, Paul H. Hawaii Economic Trends. First Hawaiian Bank. 30 October 2006. 29 Laney, Dr. Leroy. “Hawaii Recovering Impressively from ’01 Recessing, Expected to Regain Pre 9/11 Levels by Late 2003.” First Hawaiian Bank Economic Forecast. 2002–2003. 30 DBEDT. “The Economic Contribution of Waikiki. DBEDT e-reports. May 2003. Accessed December 14, 2006.
33
Local Success Stories These success stories cover a wide range of businesses and markets, and together provide a series of examples of business models that this report’s ultimate suggestions draw from.
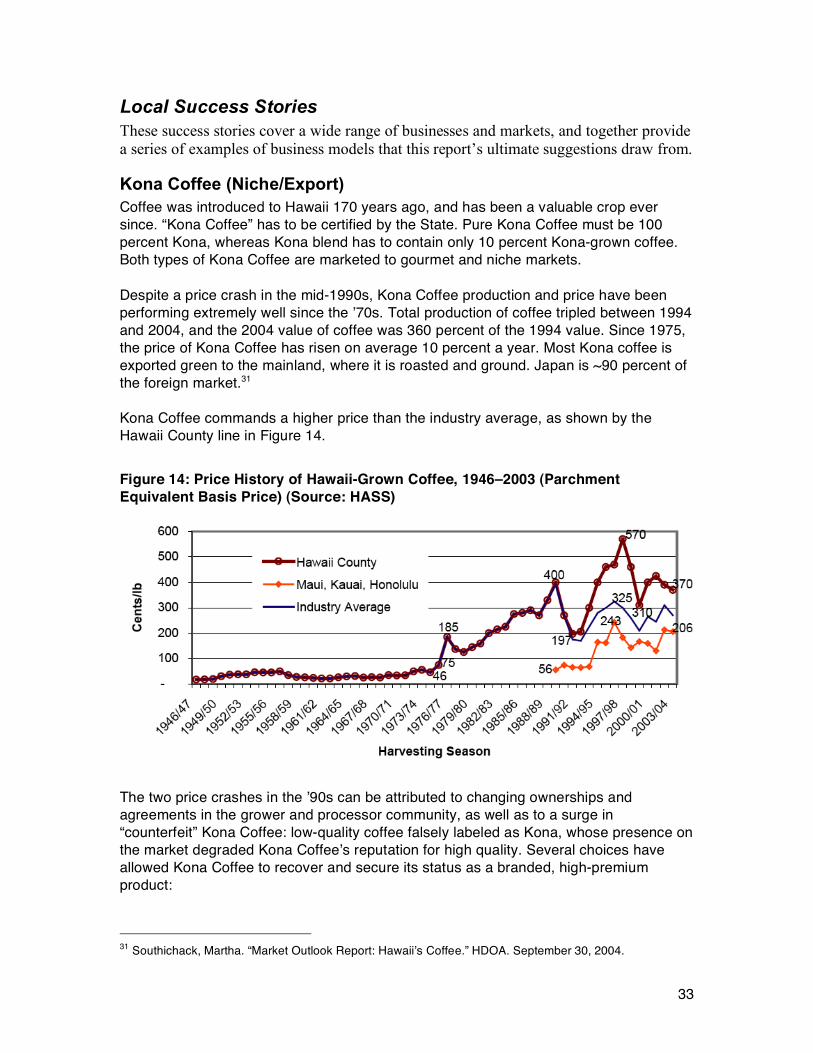
Kona Coffee (Niche/Export) Coffee was introduced to Hawaii 170 years ago, and has been a valuable crop ever since. “Kona Coffee” has to be certified by the State. Pure Kona Coffee must be 100 percent Kona, whereas Kona blend has to contain only 10 percent Kona-grown coffee. Both types of Kona Coffee are marketed to gourmet and niche markets. Despite a price crash in the mid-1990s, Kona Coffee production and price have been performing extremely well since the ’70s. Total production of coffee tripled between 1994 and 2004, and the 2004 value of coffee was 360 percent of the 1994 value. Since 1975, the price of Kona Coffee has risen on average 10 percent a year. Most Kona coffee is exported green to the mainland, where it is roasted and ground. Japan is ~90 percent of the foreign market.31 Kona Coffee commands a higher price than the industry average, as shown by the Hawaii County line in Figure 14. Figure 14: Price History of Hawaii-Grown Coffee, 1946–2003 (Parchment Equivalent Basis Price) (Source: HASS)
The two price crashes in the ’90s can be attributed to changing ownerships and agreements in the grower and processor community, as well as to a surge in “counterfeit” Kona Coffee: low-quality coffee falsely labeled as Kona, whose presence on the market degraded Kona Coffee’s reputation for high quality. Several choices have allowed Kona Coffee to recover and secure its status as a branded, high-premium product:
31 Southichack, Martha. “Market Outlook Report: Hawaii’s Coffee.” HDOA. September 30, 2004.
34
• Requirement for official “Kona” certification from the government to ward off counterfeiters,
• High-quality growing practices, beans, and drying practices leading to better coffee,
• Maintenance of packaging and marketing quality, making customers willing to pay a premium,
• Seeking of long-term contracts with buyers such as Starbucks and the Army, • Increase in the number of producers who grow and roast their coffee on-island,
capturing the full value, • Increase in micro-brands—farms who have their own processed coffee label, • Increase in direct marketing, via ag-tourism, farmers’ markets, and websites,32
and • Increase in organic coffee, capturing two premiums at once.
Kona Coffee’s success has generated interest in other Hawaii coffees from Ka’u and from other islands, as well as in the development of a similar premium tea industry. The biggest threats to Kona Coffee are labor shortages and invasive pests,33 but overall, Kona Coffee exemplifies the success Hawaii’s farmers can achieve when they target a high-end market with a high-quality product. Whereas Kona Coffee comprises a wide group of farmers working with a largely export market, the Hirabara Farms profiled in the next example demonstrate that the same strategy can apply to smaller farms growing for the on-island community.
Hirabara Farms (Niche/Local) Hirabara Farms, run by Kurt and Pam Hirabara in Waimea since 1992, is one of the most successful small farms on the Island of Hawaii. The farm specializes in growing lettuce and other greens. The Hirabaras are reaping the benefits of targeting the high-end food market, of stable and direct relationships between farmers and consumers, and of efficient farming techniques. The Hirabaras supply 18 resorts and hotels around the state. Many of their clients used to be in Honolulu, but after 9/11 and the grounding of planes (to deliver quality goods to other islands, the Hirabaras used plane delivery), they realized the vulnerability of this business model to external shock, and have been shifting their client base to Hawaii Island ever since. Currently, 70 percent of their clientele is on-island. The Hirabaras are able to cope with the high input prices of farming on the Island of Hawaii by producing a high-quality, organic product that commands a premium and by implementing efficient and adaptive farming and farm management techniques. Examples of this strategy include:
• Paying relatively high wages and creating good working conditions to attract and keep the best employees, and training those employees to produce the most and best crop,
32 Interview with Melanie and Colehaur Bondera. 33 Southichack, Martha. “Market Outlook Report: Hawaii’s Coffee.” HDOA. September 30, 2004.
35
• Paying strict attention to the impacts of soil and weather on their greens, and learning to foster plants through adverse conditions,
• Using land extremely efficiently. Kurt Hirabara estimates that they can farm the same amount of lettuce on 20 percent less space now than when they began. They have converted that 20 percent into a kitchen and kitchen garden so they can tap into the ag-tourism business by hosting farm tours and special dinners,
• Reducing costs by about 50 percent through learning how to farm efficiently, • Maintaining relationships with chefs to assure that supply meets demand, and • Sharing clients with other local green producers (such as Adaptations) so that the
client always receives enough greens, even in the event of extremely bad weather or other impediments to the crop.
Hirabara greens are so popular that they are featured by name on menus of well-known local restaurants like Merriman’s and Daniel Thiebault’s.34 One of the Hirabara’s adaptations mentioned above was a small ag-tourism business. “Ag-tourism” happens when farmers give tours of their operations to tourists visiting the Island, thereby teaching the tourists about local agriculture and food culture. The farmers earn money from the tours, as well as from the sale of products resulting from the tours. Ag-tourism allows local farmers to draw value from keeping their farm local and unique. In other words, it allows them to reap profit by valuing their natural and human capital. The Hawaii Vanilla Company has created a large and profitable ag-tourism business associated with its farm.
Hawaii Vanilla Company (Ag-tourism/Luxury) Jim Reddekopp is the owner of Hawaii Vanilla Company, an organic vanilla farm and ag-tourism destination. His ag-tourism is a brilliant example of the benefits ag-tourism can bring to individual farming operations, as well as the community around them. Mr. Reddekopp, who has a background in hospitality, tapped into several grants available to farmers interested in ag-tourism to get the capital for his operation (e.g., Rural Economic Transition Assistance Grant). The farm has several acres and a 30,000-square-foot greenhouse, not all yet in production. Any visitor can come for the tour of the farm and a top-quality locally grown lunch, with many vanilla-flavored dishes. Hawaii Vanilla Company also has agreements with several cruise ships to bring visitors on an all-day ag-tour to several farms whose products revolve around the concept of flavor (e.g., coffee, chocolate, vanilla, etc.). Mr. Reddekopp supplies 23 restaurants with vanilla, but the retail sales from his gift shop now make up about 80 percent of revenues. The success of Hawaii Vanilla and other ag-tourism ventures, according to Mr. Reddekopp, relies on the following factors:
• Excellent service: if people are paying a premium, they want the event to “blow them away,”
• Commercial kitchen: without the ability to cook food and sell processed products, no ag-tourism venture can really flourish,
34 Conversation with Kurt and Pam Hirabara on November 14, 2006.
36
• An array of finished products: Hawaii Vanilla incorporates their extract into value-added products to meet any need, from lotions and perfumes to brownies, and
• Community support: ag-tourism relies on increased traffic in rural areas. Without community buy-in and support, the venture may not succeed. Hawaii Vanilla has “community dinners” and events, and maintains good relations with their neighbors.
Hawaii Vanilla has become and economic hub for the region’s agricultural entities. In order to serve the all-local lunch, Mr. Reddekopp purchases $15,000 in lettuce and $12,000 in goat cheese from his neighbors, in addition to mushrooms and other produce. As the organization looks to expand to dinners and start a network of similar ag-tourism destinations on the east side of Hawaii, the benefits to local agriculture will increase in parallel.35
Adaptations (Niche production/distribution) Tane and Maurine Datta founded Adaptations in 1993. Today, the company focuses on growing produce that has a high value per hour of labor and per square foot used, and they distribute it to local high-end restaurants. They have increased their value of production 25 percent since 1993. Adaptations also acts as an aggregator for more than 30 farmers, ensuring that they have a market for their products. The company is constantly innovating, and working with chefs on research and development. This tight relationship with customers enables the Dattas to bring new, high-value products to markets, from mushrooms to edible flowers. However, Adaptations is suffering from what they consider sometimes-unfair competition from bigger distributors that use their market dominance to take away smaller producers’ accounts. Overall though, the demand for their high-quality products remains high and unsaturated.36 Other noteworthy success stories include:
• Hāmākua Springs, a brand of hydroponic vegetables started by Richard Ha, after he successfully revived local production of bananas. (Innovative mass market/Local),
• Atebara Chips, founded in Hilo in 1936, and now one of the most sought after brand of gourmet chips. (Consumer good/Local and export), and
• The Machu taro family farm, whose production cannot keep up with demand, and whose second generation represented the Big Island of Hawaii at the Slow Food Terra Madre worldwide gathering in October 2006. (Niche/Local).
Aside from these entrepreneurial success stories, there are also initiatives on the Big Island of Hawaii that support the strengthening of local agriculture and food consumption.
35 Interview with Jim Reddekopp on November 16, 2006. 36 Interviews with Tane Datta, November and January 2007.
37
Development of Support Activities
Island of Hawaii Slow Food Convivium As explained on its website, Slow Food is a “eco-gastronomic” non-profit that was created in 1989 to “counteract fast food and fast life, the disappearance of local food traditions and people’s dwindling interest in the food they eat, where it comes from, how it tastes and how our food choices affect the rest of the world.” Today, the NGO has 80,000 members worldwide, and two convivia in Hawaii: one in Oahu, and one in Waimea, on the Big Island of Hawaii. The Waimea convivium is headed by Nancy Piianaia and has 100 members. Mrs. Piianaia’s main goal is the education of kids, of adult consumers, and also of the farmers. In 2006, the convivium raised money to help fund the Waimea Public School garden, and to send four Hawaiian delegates to Terra Madre, Slow Foods bi-annual gathering in Italy.
Waimea Middle School Garden School gardens go far beyond offering pleasant extra-curricular activities for students, and work to remedy some of the deepest root causes of local food’s demise—citizens don’t have the habit of eating fresh unprocessed food, much less local food—as well as other related social ills such as childhood obesity and ohana breakdown. Students’ experience with the school garden at Waimea Middle School, led by Amanda Rieux and supported financially by the Waimea Slowfood convivium, demonstrates the potential boon school gardens could be for the entire island. Ms. Rieux has been developing the school garden for two years. It went from being a rocky square of land beside the school playground to a vibrant garden that produces a dozen types of vegetables and plants. According to Ms. Rieux, the garden has multiple benefits for the local food economy as well as the students:
• School gardens make fresh local food fun, building life-long customers for foods like Taro and fresh greens. This is similar to the way McDonald’s builds life-long customers by making their meals fun for children with toys and play parks;
• School gardens expose children to foods, such as salads, and ways of preparing foods that they may not get at home;
• School gardens teach children to appreciate the complexity of the food chain and to consider where their food originates, beyond the supermarket;
• School gardens give children a taste for the profession of farming, teaching the next generation of farmers sustainable methods;
• School gardens not only expose students to healthy food, but are a form of exercise, therefore helping address the rising childhood obesity problem in Hawaii; and
• School gardens are a laboratory and location for hands-on learning about biology and environmental science, which not only enforce classroom lessons, but also provide alternate forms of learning for students who do not excel in the normal classroom environment.
Ms. Rieux tells stories that go far beyond the basic points above—of students who cut classes but show up religiously for “garden day,” and of students beginning to explore local traditional culture through foods like Taro. The biggest threat to the sustainability of a local food economy is the homogenization of American eating habits, as more and more Americans purchase processed and easy-to-prepare meals from chain
38
supermarkets. School gardens are a crucial tool to ensure the long-term success of any local food and agricultural movement.
Hāmākua Agricultural Plan Based on soil quality, land availability, and rainfall, the Hāmākua region of the Island of Hawaii appears to be one of the best suited places to develop agriculture. It also happens that the region has done considerable reflection on the issue. Based on intense community involvement, this thought process culminated in the first half of 2006 with the drafting of the Hāmākua Agricultural Plan. The plan notes in its vision statement that “Agriculture in the District of Hāmākua is the heart of the community, providing profitable, sustainable, repeatable, healthy opportunities in which agricultural producers, their families and the community can thrive”37 The report identifies the following key issues:
• Land use: how to let the community self-determine land use and agriculture use practices;
• Environment: what attitude to adopt with regard to GMO; • Access: how to ensure access to oceans and mountains; • Information/Education/Political Action: how to ensure the plan is implemented in
a consistent way; • Business Development/Marketing: how to support diversified/sustainable
agriculture and ensure profitability. How to develop infrastructure such as roads, processing facilities, and water systems; and
• Community Values: How to protect and maintain the rural lifestyle and “honor Hawaiian values.”
According to the authors, some opportunities include: • The presence of significant acreage, • The existence of local commitment to agriculture, • The fact that “current and projected consumer trends point to more demand for
local produce,” • The arrival of technological advances that make worldwide exports markets for
fresh produce viable, • The disappearance of agricultural lands in Oahu and Maui that creates a demand
for Hāmākua products there, and • The motivation of the community to increase local agriculture because by doing
so it helps them feel that they are determining their own future and participating in important decision.
Given the area’s favorable physical conditions, and the high level of thinking that its inhabitants have already reached, Hāmākua seems to be a prime candidate for more sustainable agriculture development. These positive examples of what works within the system help elucidate exactly how the agriculture system is situated on the Island of Hawaii and how it can be connected to other systems, such as tourism. The following section presents the results of our deeper investigation—using whole system thinking—of the agriculture system in Hawaii. 37 Hāmākua Agriculture Plan: Sustaining Rural Hāmākua Through Agriculture, May 2006. Retrieved on January 8th, from: www.ruralhamakua.org/plan.html#Vision%20Statement
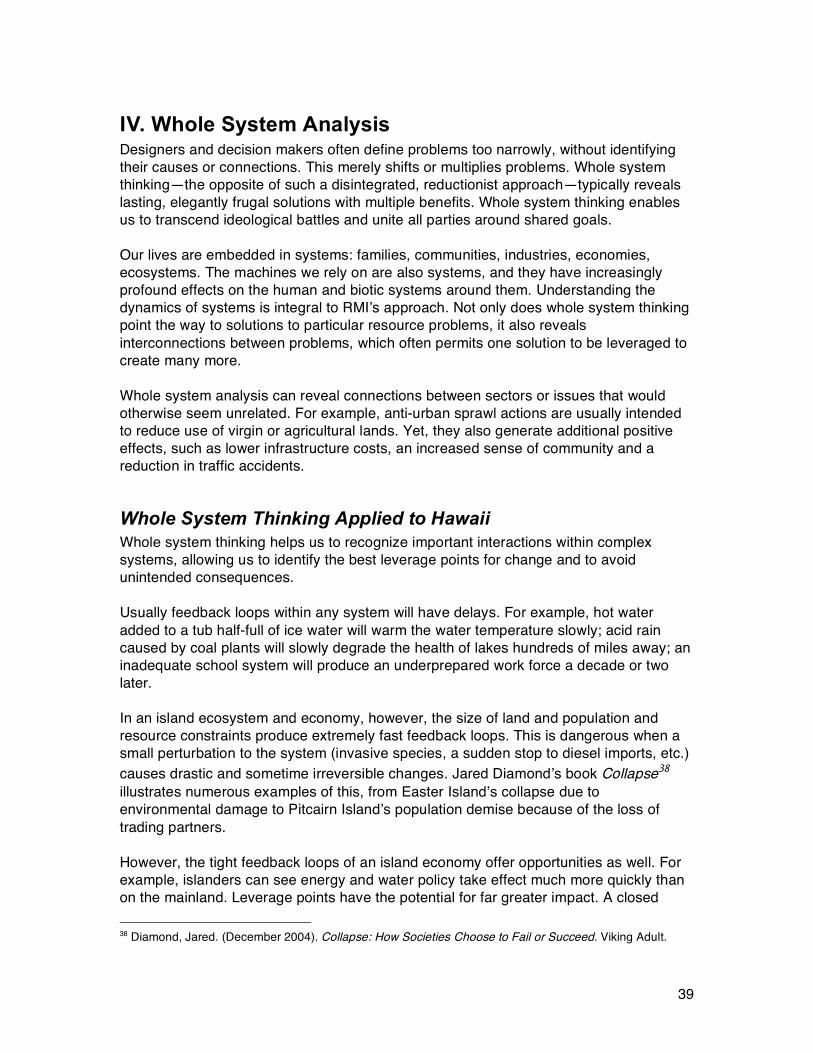
39
IV. Whole System Analysis Designers and decision makers often define problems too narrowly, without identifying their causes or connections. This merely shifts or multiplies problems. Whole system thinking—the opposite of such a disintegrated, reductionist approach—typically reveals lasting, elegantly frugal solutions with multiple benefits. Whole system thinking enables us to transcend ideological battles and unite all parties around shared goals. Our lives are embedded in systems: families, communities, industries, economies, ecosystems. The machines we rely on are also systems, and they have increasingly profound effects on the human and biotic systems around them. Understanding the dynamics of systems is integral to RMI’s approach. Not only does whole system thinking point the way to solutions to particular resource problems, it also reveals interconnections between problems, which often permits one solution to be leveraged to create many more. Whole system analysis can reveal connections between sectors or issues that would otherwise seem unrelated. For example, anti-urban sprawl actions are usually intended to reduce use of virgin or agricultural lands. Yet, they also generate additional positive effects, such as lower infrastructure costs, an increased sense of community and a reduction in traffic accidents.
Whole System Thinking Applied to Hawaii Whole system thinking helps us to recognize important interactions within complex systems, allowing us to identify the best leverage points for change and to avoid unintended consequences. Usually feedback loops within any system will have delays. For example, hot water added to a tub half-full of ice water will warm the water temperature slowly; acid rain caused by coal plants will slowly degrade the health of lakes hundreds of miles away; an inadequate school system will produce an underprepared work force a decade or two later. In an island ecosystem and economy, however, the size of land and population and resource constraints produce extremely fast feedback loops. This is dangerous when a small perturbation to the system (invasive species, a sudden stop to diesel imports, etc.) causes drastic and sometime irreversible changes. Jared Diamond’s book Collapse38 illustrates numerous examples of this, from Easter Island’s collapse due to environmental damage to Pitcairn Island’s population demise because of the loss of trading partners. However, the tight feedback loops of an island economy offer opportunities as well. For example, islanders can see energy and water policy take effect much more quickly than on the mainland. Leverage points have the potential for far greater impact. A closed 38 Diamond, Jared. (December 2004). Collapse: How Societies Choose to Fail or Succeed. Viking Adult.
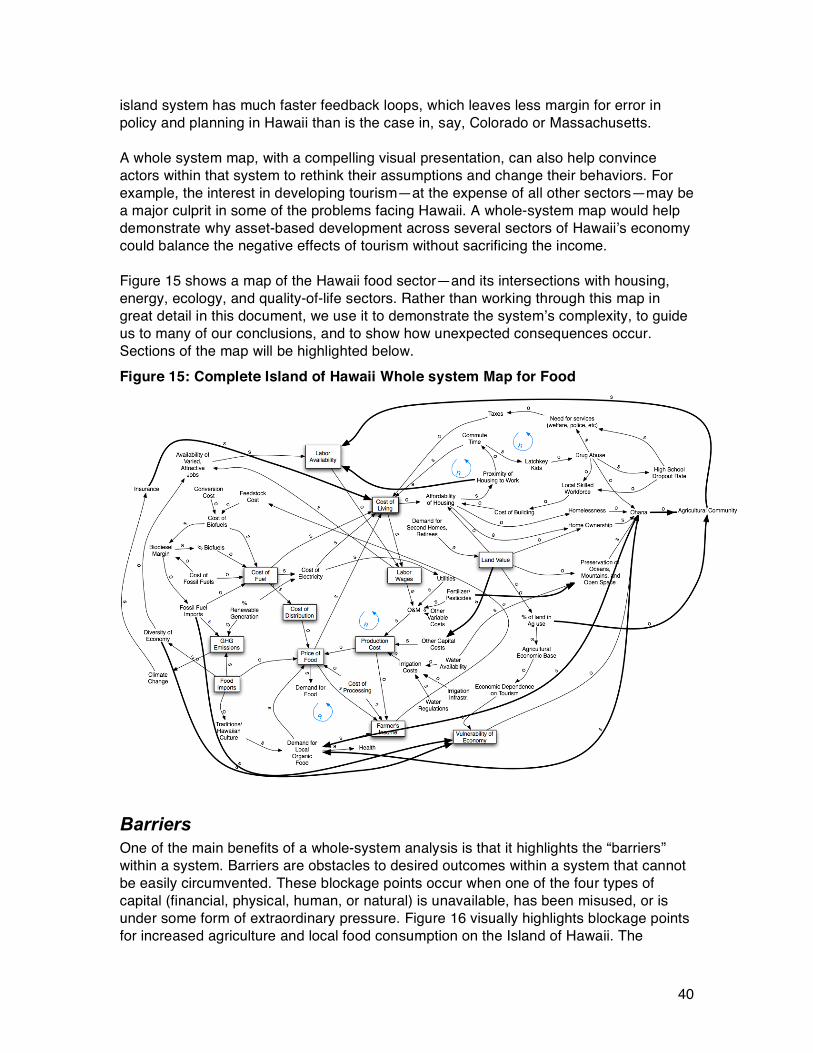
40
island system has much faster feedback loops, which leaves less margin for error in policy and planning in Hawaii than is the case in, say, Colorado or Massachusetts. A whole system map, with a compelling visual presentation, can also help convince actors within that system to rethink their assumptions and change their behaviors. For example, the interest in developing tourism—at the expense of all other sectors—may be a major culprit in some of the problems facing Hawaii. A whole-system map would help demonstrate why asset-based development across several sectors of Hawaii’s economy could balance the negative effects of tourism without sacrificing the income. Figure 15 shows a map of the Hawaii food sector—and its intersections with housing, energy, ecology, and quality-of-life sectors. Rather than working through this map in great detail in this document, we use it to demonstrate the system’s complexity, to guide us to many of our conclusions, and to show how unexpected consequences occur. Sections of the map will be highlighted below. Figure 15: Complete Island of Hawaii Whole system Map for Food
Barriers One of the main benefits of a whole-system analysis is that it highlights the “barriers” within a system. Barriers are obstacles to desired outcomes within a system that cannot be easily circumvented. These blockage points occur when one of the four types of capital (financial, physical, human, or natural) is unavailable, has been misused, or is under some form of extraordinary pressure. Figure 16 visually highlights blockage points for increased agriculture and local food consumption on the Island of Hawaii. The
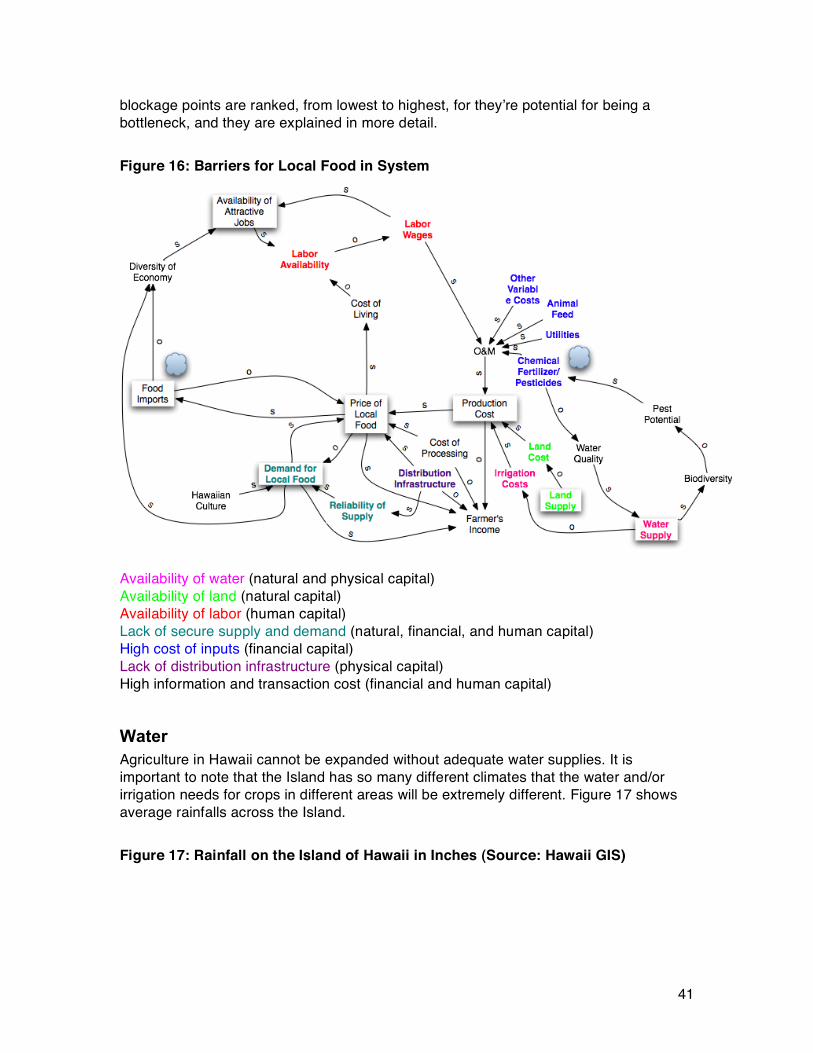
41
blockage points are ranked, from lowest to highest, for they’re potential for being a bottleneck, and they are explained in more detail. Figure 16: Barriers for Local Food in System
Availability of water (natural and physical capital) Availability of land (natural capital) Availability of labor (human capital) Lack of secure supply and demand (natural, financial, and human capital) High cost of inputs (financial capital) Lack of distribution infrastructure (physical capital) High information and transaction cost (financial and human capital)
Water Agriculture in Hawaii cannot be expanded without adequate water supplies. It is important to note that the Island has so many different climates that the water and/or irrigation needs for crops in different areas will be extremely different. Figure 17 shows average rainfalls across the Island. Figure 17: Rainfall on the Island of Hawaii in Inches (Source: Hawaii GIS)
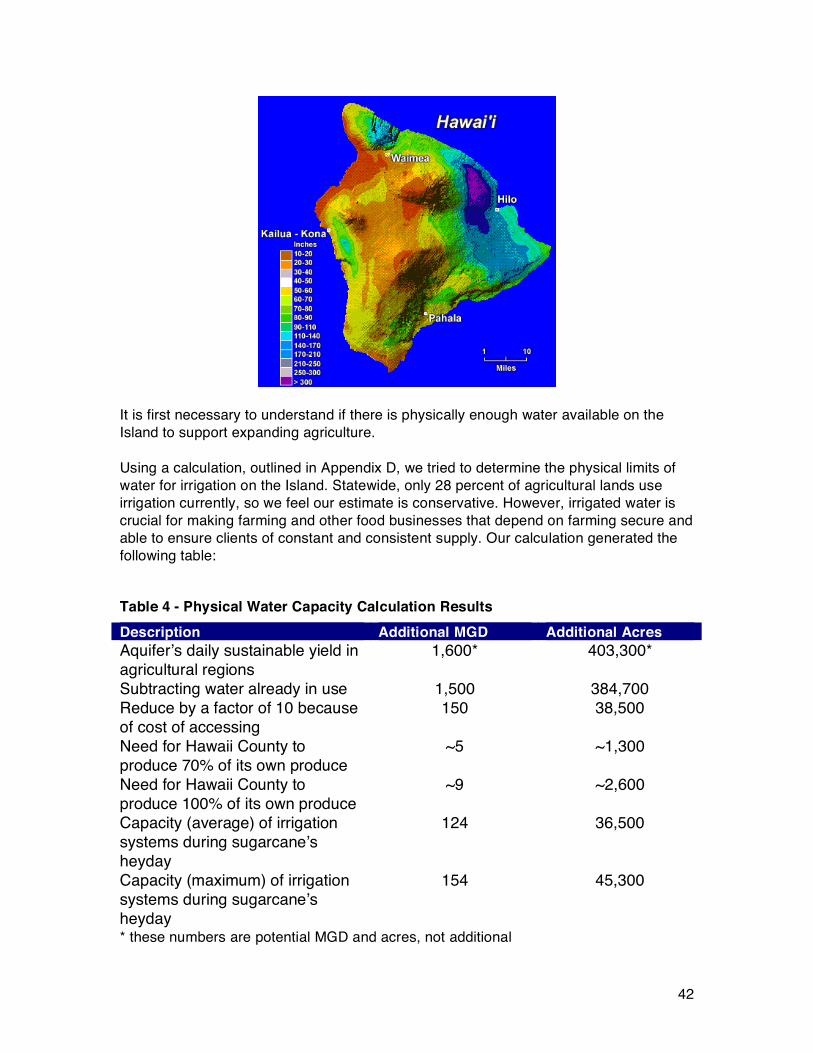
42
It is first necessary to understand if there is physically enough water available on the Island to support expanding agriculture. Using a calculation, outlined in Appendix D, we tried to determine the physical limits of water for irrigation on the Island. Statewide, only 28 percent of agricultural lands use irrigation currently, so we feel our estimate is conservative. However, irrigated water is crucial for making farming and other food businesses that depend on farming secure and able to ensure clients of constant and consistent supply. Our calculation generated the following table: Table 4 - Physical Water Capacity Calculation Results Description Additional MGD Additional Acres Aquifer’s daily sustainable yield in agricultural regions
1,600* 403,300*
Subtracting water already in use 1,500 384,700 Reduce by a factor of 10 because of cost of accessing
150 38,500
Need for Hawaii County to produce 70% of its own produce
~5 ~1,300
Need for Hawaii County to produce 100% of its own produce
~9 ~2,600
Capacity (average) of irrigation systems during sugarcane’s heyday
124 36,500
Capacity (maximum) of irrigation systems during sugarcane’s heyday
154 45,300
* these numbers are potential MGD and acres, not additional
43
Overall, while water is physically not a barrier, in order to activate the local food and agriculture sector in a meaningful way, the financial and policy barriers to irrigation need to be overcome. These barriers are also detailed in Appendix D. Rehabilitating some of the old sugarcane irrigation infrastructures, considered the best option, will cost around $30 million according to the Agricultural Water Use and Development Plan, an excellent document explaining the situation and state of disrepair of the various sugarcane systems.39
Availability of Land Because of the real-estate and tourism booms that the Island has undergone since the late ’90s, the cost of land on the Island of Hawaii is drastically higher than that of farmland in other states or countries. Even so, the farmland on the Island of Hawaii is, for the most part, less expensive than that on the other islands, making it the most attractive land for farmers. Overall “cash rent for land and buildings” represents only 5 percent of the cost of growing crops in Hawaii. This figure, however, reflects the historic situation, and does not show recent trends. When considering land, it is important to distinguish between incremental and imbedded cost of land. Many current farmers in Hawaii inherited their land or bought it before land prices started to rise. They therefore have a low imbedded cost. The situation is extremely different for new entrants, who are faced with purchase prices of as much as $100,000 to $500,000 per acre, and long-term leases that range from $200 to $500 per acre (versus a mainland average of $79/acre/yr for crop land and $11/acre/yr for pasture). Though many farmers and residents feel the price of land is an insurmountable barrier to overcome, some feel that good, reasonably priced land is available, and that lack of information or initiative on the part of new farmers keeps the agriculture sector from expanding. Specifically, Kamehameha Schools offer $200/acre/yr leases near Kona for agricultural land. Major drivers of improvements in land availability will include policy and large landowners. These are detailed in Appendix E. Based on average yields, we have calculated that producing 70 percent of the Island’s demand for fresh produce would require an additional 1,300 acres. One hundred percent local production would require 2,600 additional acres. Additional acreage would be required if some of the production were to be exported.
High Cost of Labor Hawaii currently has the lowest unemployment rate in the nation. As a result, wages for less-skilled jobs are relatively high, as Table 5 shows. The overall average wage in Hawaii is lower than the U.S. average because there are fewer skilled jobs available in the state.
39 Water Resource Associates. "Agricultural Water Use and Development Plan." HDOA. December, 2004.
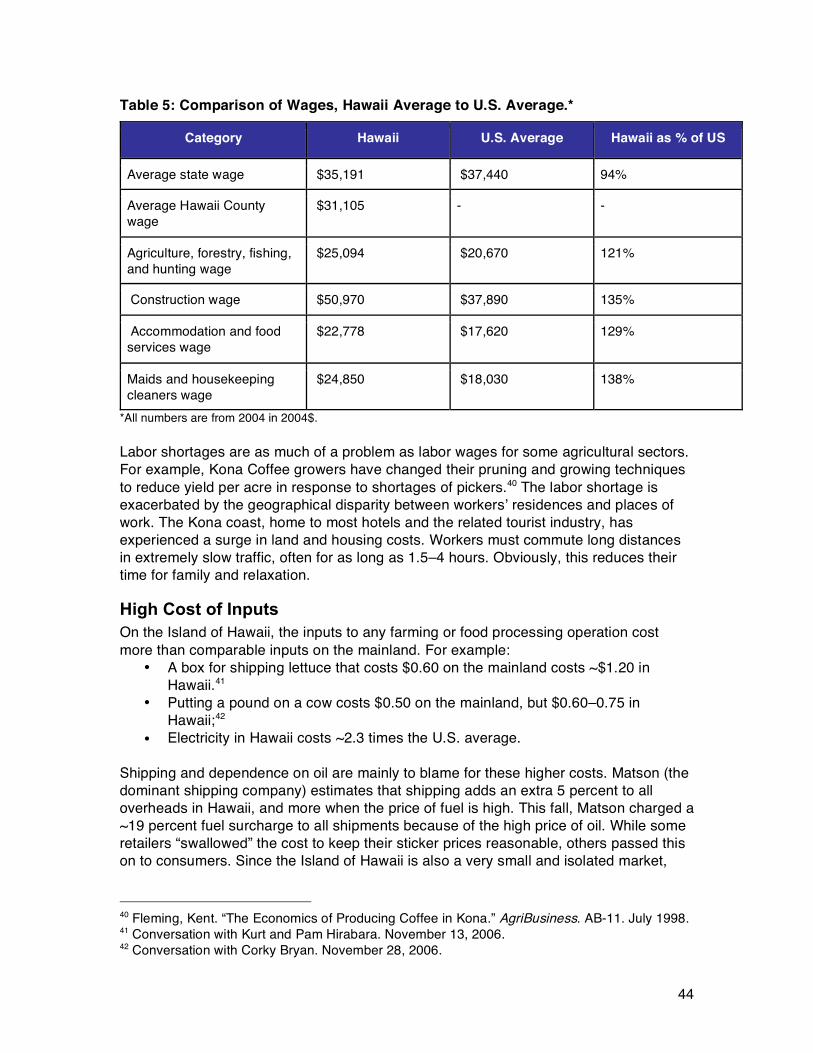
44
Table 5: Comparison of Wages, Hawaii Average to U.S. Average.*
Category Hawaii U.S. Average Hawaii as % of US
Average state wage $35,191 $37,440 94%
Average Hawaii County wage
$31,105 - -
Agriculture, forestry, fishing, and hunting wage
$25,094 $20,670 121%
Construction wage $50,970 $37,890 135%
Accommodation and food services wage
$22,778 $17,620 129%
Maids and housekeeping cleaners wage
$24,850 $18,030 138%
*All numbers are from 2004 in 2004$. Labor shortages are as much of a problem as labor wages for some agricultural sectors. For example, Kona Coffee growers have changed their pruning and growing techniques to reduce yield per acre in response to shortages of pickers.40 The labor shortage is exacerbated by the geographical disparity between workers’ residences and places of work. The Kona coast, home to most hotels and the related tourist industry, has experienced a surge in land and housing costs. Workers must commute long distances in extremely slow traffic, often for as long as 1.5–4 hours. Obviously, this reduces their time for family and relaxation.
High Cost of Inputs On the Island of Hawaii, the inputs to any farming or food processing operation cost more than comparable inputs on the mainland. For example:
• A box for shipping lettuce that costs $0.60 on the mainland costs ~$1.20 in Hawaii.41
• Putting a pound on a cow costs $0.50 on the mainland, but $0.60–0.75 in Hawaii;42
• Electricity in Hawaii costs ~2.3 times the U.S. average. Shipping and dependence on oil are mainly to blame for these higher costs. Matson (the dominant shipping company) estimates that shipping adds an extra 5 percent to all overheads in Hawaii, and more when the price of fuel is high. This fall, Matson charged a ~19 percent fuel surcharge to all shipments because of the high price of oil. While some retailers “swallowed” the cost to keep their sticker prices reasonable, others passed this on to consumers. Since the Island of Hawaii is also a very small and isolated market,
40 Fleming, Kent. “The Economics of Producing Coffee in Kona.” AgriBusiness. AB-11. July 1998. 41 Conversation with Kurt and Pam Hirabara. November 13, 2006. 42 Conversation with Corky Bryan. November 28, 2006.
45
many products (such as bottles for jams) have to be specially ordered and shipped, adding to cost. As we have seen in part III of this report, when looking at production costs, it is important to distinguish between fruits and vegetables on the one hand, and meat on the other hand. With fruits and vegetables, an important blockage is labor, whereas for meat, it is feed.
High Information and Transaction Costs In the United States agricultural sector, the availability of capital is usually not an issue. For example, the USDA offers several types of low-interest loans. The main hurdle for agricultural entrepreneurs is credit worthiness. Therefore, a more positive impact on local agriculture might be achieved through the creation of a credit facility that issues letters of credit rather than low-interest financing. Additionally, interviews with agriculture services representatives have shed light on the high information and transaction costs associated with obtaining public funding. Complex application forms seems to be an important issue especially since —many farmers of Latin or Asian origin do not have a good enough grasp of the English language to successfully complete the applications. Any measures that lower these information and transaction barriers, whether through human or technological means, could go a long way. Case Study: The End of the Local Beef Industry The shift from slaughtering Hawaii-grown beef on-island to shipping them to the mainland, as told by Corky Bryan of Parker Ranch, exemplifies the magnitude of the shipping and land hurdles. Though many external factors were responsible for the end of Hawaii Meat Company in the late ’80s, high land costs were largely to blame for the company’s inability to build a new slaughterhouse. The Hawaii Meat Company had been in operation since 1909. Parker Ranch held an 80 percent interest. The slaughterhouse for the Hawaii Meat Company, built in 1909, had was very inefficient by the end of the ’80s, and badly needed renovation. When the lease for the land came up for renewal, Campbell Estates, the owner of the land under the slaughterhouse, asked for 10 times the previous rent. Simultaneously, the County of Honolulu attempted to condemn the company’s packinghouse in Honolulu to use the land for tourism. Parker Ranch looked into opening a new slaughterhouse in Honolulu in 1989–90, but the input, labor, and land costs were so high, that the operation would have had to slaughter 300 head a day to be profitable. This rate of slaughter would mean that every cow currently raised for beef production in the state would come through the same slaughterhouse, and that the rate of cow-raising would have to stay the same or increase. This was an impossible goal. Parker’s experiments with shipping cattle to the West Coast and Canada for pasture and feedlot were very successful, so they pulled out of Hawaii Meat Company and started sending virtually all their cattle to the mainland. Beyond the Hawaii Meat Company history, there are several reasons for the low market share of local beef. First, if the animals are to be grain-finished, it is more economical to ship them to the mainland (a cow is about 500 pounds) than to ship the feed to Hawaii (fattening a cow requires about 2,500 pounds of grain). Alternatively, fattening cows on grass requires flat land with access to water at the lower altitudes, and these lands are
46
being devoted more and more to real estate. Finally, the quality of grass-fed beef, and the consistency of its supply are major issues. According to agricultural extension agent Mark Thorn, this issue could be addressed through better pasture and animal management. For rancher Freddy Rice, it is better to focus on the cow and calf cycle, and export the animals to the mainland for fattening. If people really wanted to slaughter them on the Island, Freddie Rice argues that cows could be fattened on grass, but their meat would be only good enough to be used in hamburgers and processed food.
Lack of Secure Demand and Supply Channels Most interviewees explained that lack of secure supply and demand was a critical hurdle for local agriculture on the Island of Hawaii. Small farmers simply cannot guarantee a consistent supply of a certain produce at a certain level of quality. This inhibits chefs and grocery stores from committing to buying local produce. Likewise, since chefs and grocery stores are hesitant to commit themselves to buying local produce, farmers have no guaranteed markets and are unwilling to risk growing diversified food crops. Chef James Babian, of the Fairmont Orchid Hotel, who has been using local produce in his restaurant, says he is hesitant to advertise certain local products on his menu because he cannot be assured of supply.43 The lack of communication between farmers and end-users also makes demand opaque: farmers simply do not know the types of produce or level of quality that local end-users are looking for. The lack of organization among small farmers also damages the supply chain. Chefs and grocery stores do not want to have forty different agreements with forty different farmers to supply all their lettuce. Also, each of those forty farmers may be growing a different variety of lettuce. Finally, farmers may not know exactly what type of lettuce they grow, and they may offer a variety of prices for similar products. The success of Adaptations demonstrates how big the distribution barrier is. Adaptations organizes its growers so that they produce consistent supplies of the same species of vegetables, and Adaptations communicates the needs of chefs and restaurants to their farmers so that farmers can respond to demand.
Lack of Distribution Infrastructure Distribution infrastructure—even the most basic way to get products to market—is severely lacking for Hawaii’s farmers, particularly small farmers. As mentioned above, Adaptations Farm’s success is an excellent example of the need for distribution infrastructure, but its scope is limited. Currently, most small farmers have to take their own produce to grocery stores, negotiate sales, and/or spend mornings at farmers markets to sell food. This can be an insurmountable barrier in terms of time, willingness, and cost of fuel for distribution.
43 Conversation with Chef James Babian. November 12, 2006.
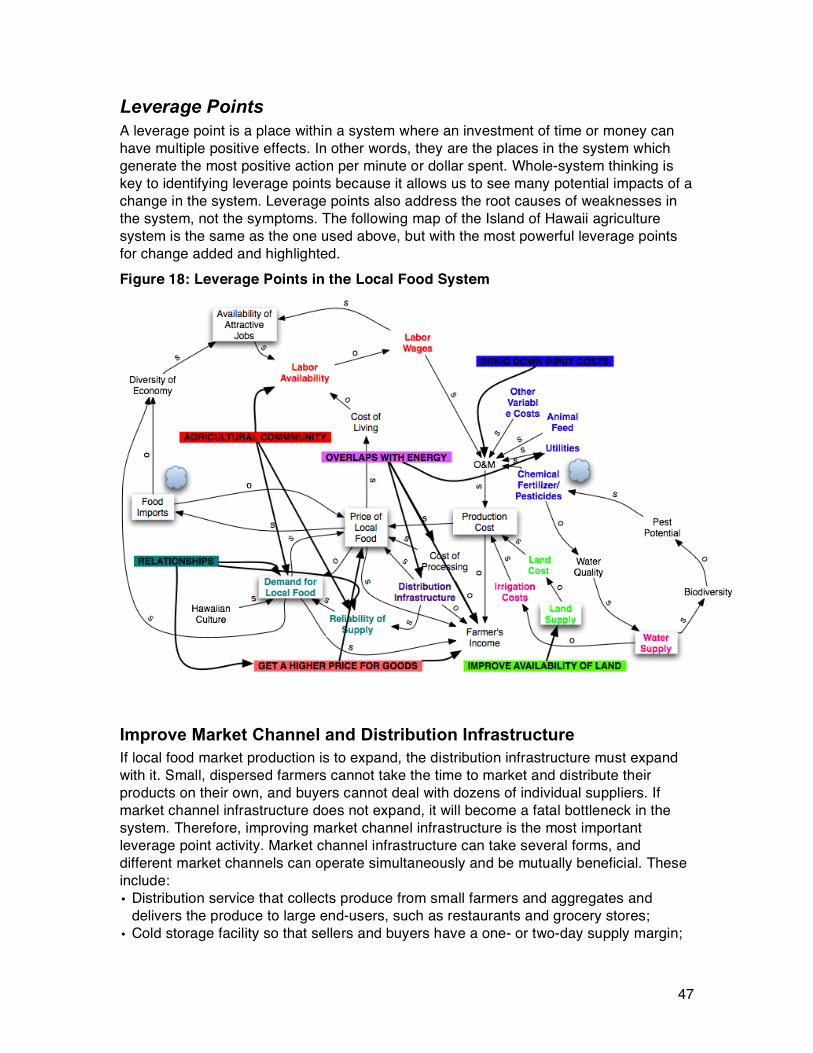
47
Leverage Points A leverage point is a place within a system where an investment of time or money can have multiple positive effects. In other words, they are the places in the system which generate the most positive action per minute or dollar spent. Whole-system thinking is key to identifying leverage points because it allows us to see many potential impacts of a change in the system. Leverage points also address the root causes of weaknesses in the system, not the symptoms. The following map of the Island of Hawaii agriculture system is the same as the one used above, but with the most powerful leverage points for change added and highlighted. Figure 18: Leverage Points in the Local Food System
Improve Market Channel and Distribution Infrastructure If local food market production is to expand, the distribution infrastructure must expand with it. Small, dispersed farmers cannot take the time to market and distribute their products on their own, and buyers cannot deal with dozens of individual suppliers. If market channel infrastructure does not expand, it will become a fatal bottleneck in the system. Therefore, improving market channel infrastructure is the most important leverage point activity. Market channel infrastructure can take several forms, and different market channels can operate simultaneously and be mutually beneficial. These include: • Distribution service that collects produce from small farmers and aggregates and
delivers the produce to large end-users, such as restaurants and grocery stores; • Cold storage facility so that sellers and buyers have a one- or two-day supply margin;
48
• Direct farmer-to-consumer channel, by which farmers are matched with families who agree to buy their produce, along the lines of community-supported agriculture (CSA);
• Larger-scale direct produce delivery service, which aggregates produce from several farmers to give consumers more of a variety than a typical CSA;
• Development of existing farmer’s markets, including making them available to a larger number of people, and on more days per week;
• Clearinghouse/Information exchange whereby farmers publish their available produce so consumers can see what is or will be available; and
• Negotiation with grocery stores to make shelf space for local produce more affordable.
Bring Down Input Costs General Because the cost of overseas transportation is embedded in almost every input to agriculture in Hawaii, finding local substitutes for inputs is a powerful strategy for bringing down input costs. Examples include: • Using local sources of electricity, such as solar panels and wind turbines; • Growing feedstock crops for livestock, egg, and dairy operations (see below); • Producing organic fertilizer from greenwaste and animal waste available on the Island;
and • Locally producing manufactured inputs for value-added products, such as bottles for
jams. Clustering—locating business that either share resources or use each other’s wastes as inputs near each other—around agriculture is another opportunity to reduce input costs. For example, a business that produced large amounts of gray water as a waste product (perhaps used as a coolant) could be co-located near agricultural operations to save on irrigation and water. The third way to reduce input costs is to use fewer inputs. Educating farmers about energy and water efficiency techniques can help them save money and resources. Educating farmers about soil stewardship and organic farming methods can also reduce the inputs of fertilizers and pesticides. Feed Costs Animal feed constitutes a large portion (23 percent) of input costs for husbandry on the Island. The feed expense was also one of the driving factors that caused Parker Ranch to move their feedlots and slaughterhouse off the Island. However, reducing the costs of animal feed is a difficult task. Here are a few possibilities:
• Increase the market for grass-fed beef: Grass is cheap. However, mainstream consumers do not always appreciate the taste and consistency of grass-fed beef, and shy away from the slightly higher prices. Consumer education about the benefits of grass-fed beef could overcome this resistance, as it has in the higher-end, organic market. Another barrier to grass-fed beef is that the high-end market only asks for the best cuts of the beef, and the rest is often wasted, increasing costs. Processed food (such as canned stews or meat pouches) that used the lower-quality cuts could increase market and reduce costs for grass-fed meat.
• Increase market for other meats: Beef is currently the preferred meat on the Island. Marketing and education to replace beef with more local fish, pork, or
49
lamb (all of which can be grown without imported feed) could decrease the sector’s feed expenses.
• Find a local feed substitute: Soy and corn, the typical mainland animal feeds, do not grow well in Hawaii. HARC and HDOA have been looking at growing other forage and feed, such as barley.44 This feed could be used for beef, poultry, or pork. Because of Hawaii’s high humidity, a key barrier has been drying feed crops. Expanded research about which crops can be most efficiently grown and provide the most protein needs to be done. Drying facilities that use waste heat from power plants could solve the drying problem at low cost.
Improve Labor Availability and Cost The lack of available labor and the high agricultural labor wages are both significant blockages. The two issues may be tackled separately in the following ways: Improve labor availability:
• Import labor in the form of migrant or new immigrant workers to the Island; • Reduce tourist industry, freeing up labor for agriculture; and • Pay higher agriculture labor wages.
Improve labor costs: • Mechanize farming, reducing the need for labor.
Improve availability and cost in tandem: Build housing (or renovate old plantation housing) near farms, and provide housing for agricultural laborers after the plantation model. Workers would demand less pay if their housing was covered or subsidized, and they would prefer to live near their work instead of making long commutes, increasing agricultural labor availability. It is important to keep in mind ohana or quality of community, when tackling the labor issue. The first three options to improve labor alone act against ohana, for the most part. Mechanization, if it can be made to work, is a crucial tool to making farmers on Hawaii competitive. It will not threaten current jobs since unemployment is so low on the Island and farms already short-handed. The housing solution improves ohana by keeping work close to home and increasing family time by decreasing commuting time; it also improves cost of labor over time. Mechanization Labor is 32 percent of the cost of growing produce, and labor rates in Hawaii are 20 percent higher than those on the mainland. Agriculture labor is also very difficult to find, leading some growers to purposefully decrease productivity per acre because they cannot find enough hands at harvest time. Around the globe, mechanization has brought down labor costs while improving productivity in all fields, including agriculture. However, traditional agricultural mechanization has not taken hold on the Big Island of Hawaii because the small farm sizes make investment in large machines uneconomical, and because the steep and rocky terrain makes it difficult, if not impossible, to operate most agricultural machinery. This report does not advocate huge, Midwestern-style or plantation-scale farms using traditional farming machines such as combines on the Island. This would be both 44 Water Resource Associates. "Agricultural Water Use and Development Plan." HDOA. December, 2004.
50
economically difficult (if not impossible) and environmentally dangerous, and could damage the agricultural lifestyle. However, if residents of Hawaii were able to develop technology that was suited to smaller acreage, difficult terrain, and local crops, it could save money in the largest segment of input costs. The larger macadamia nut farms are starting to use specialized machines, which is one-fifth the cost of hand picking.45 Since the agricultural labor demand is not currently being met, mechanization is not a major threat to jobs. The R&D for such technology development would probably need to take the form of a public-private partnership, co-sponsored by the State government. The State already has money and support available for high-tech development and innovation. Though farm equipment is more often seen as “low-tech,” innovative and radical farming technology development could be appropriate for these State opportunities, and it might prove just as important for the State’s economy as a new high-tech sector. These machines would not work for every farm or every crop grown on the Island. For example, farmers growing organic, artisinal produce for high-end restaurants will probably still not use machines for harvesting. Nevertheless, such R&D could be beneficial to the overall agriculture sector as it exists now, and as it expands.
Improve Availability of Land Most of the variables that could improve the land situation rest with policy-makers and are outside the scope of this report. However, one business-related opportunity to improve land availability for farming does exist: Long-Term Lease Landlord: Though land rent is a small portion of input costs for farmers who have good land deals (often leases that are long term and began long ago), the purchase or rent of a few acres of land for new farmers is extremely high. Large landholders, such as Kamehameha Schools are also loath to lease small portions of land because of the related administrative burden. Kamehameha Schools is also mandated to capture reasonable revenues from their land to support the schools. A long-term lease landlord would rent a large tract of land at a reduced bulk price for a long period of time (50–100 years). This would save the land manager/owner the administrative hassle of several lessees. Then, the long-term lease landlord could sublet small portions of the land (5–20 acres) for agricultural purposes that capture efficiencies of scale. Giving farmers long-term leases provides security for making investment in the land, and an incentive to treat the soil well. Kamehameha Schools has portions of former plantations that already have some infrastructure, such as roads and housing. This land is preferable. The land manager at Kamehameha Schools has already stated that he is open to discussing such a scheme.46
Get a Higher Price for Goods As the sugar story—and several other examples—shows, commodity farming is a difficult option for Hawaii because of the Island’s high input and labor costs. Given the cost and opportunity disadvantages suffered by Hawaii agriculture, farmers must strive
45 Conversation with Rick Vidgen. December 4, 2006. 46 Conversation with Peter Simmons. November 20, 2006.
51
to obtain higher prices for their production. There are two ways to reach this goal. First, farmers can create value-added products. Second, they can find more effective ways to market their products. Of course, whenever possible these two approaches (make it special or market it differently) can be combined. The main idea behind the production of added-value products is to keep local as much revenue as possible. Prepared food is an obvious target of this approach, and given that it represents 20 percent of at-home food expenditures in the State of Hawaii (see part III), the opportunity is significant. There is also great potential in the away-from-home food market, as restaurants are demanding of innovations that might make their processes more efficient. Marketing, mostly by exploring new channels, or cutting steps—in order to capture their margins—in existing channels can help farmers increase revenues as well. While the recent development of sales of specialty produces to high-end hotels and restaurants is a good example of the first way, farmers’ markets constitute a successful illustration of the second one. Farmers and food producers on Hawaii have had much success in creating products for which consumers will pay a premium, including Kona Coffee or individual brands like Volcano Island Honey. There are several channels through which farmers and food producers can earn premiums: • Tap into high-end niche markets, specifically those at local resorts and high-end
communities around the island; • Tap into high-end niche markets using internet marketing and export to the mainland
and Asia; • Educate local consumers about health, community, and environmental benefits of
eating local food and convince them that the premium is worthwhile; and • Initiate value-added food processing on the Island.
Capitalize on Overlaps with Energy Though energy costs constitute a relatively low percentage of input costs for farmers, many opportunities exist to improve the competitiveness of Hawaii food and agriculture using overlaps with energy. The importance of using oil efficiently will increase if farms move to mechanized production to avoid high labor costs. Some examples of oil-savings opportunities are: • Growing fuel for tractors and pumps locally, in the form of biodiesel; • Growing fuel for a larger market, such as utilities or the mainland, in the form of
biodiesel; • Renting out portions of farmland for wind-turbines; • Creating clusters that use a facility’s waste heat as an energy source for another
facility; • Producing foods that do not travel well, giving the local product an advantage over
imports which rely on fossil-fuel-based transportation; and • Increasing consumer awareness of the energy/carbon dioxide impact of importing food
in order to increase willingness to pay the “local” premium. Because of current high oil costs and a growing awareness of the problems with energy inefficiency and the environmental impacts of fossil fuels, the time is ripe for business opportunities that capitalize on overlaps with energy by improving efficiency or reducing fossil-fuel use.
52
Create Direct Relationships between Consumers and Producers Bringing consumers closer to the producers they buy has multiple valuable results including: • Creating demand transparency, so that farmers know what crops (and what quality of
crops) will have buyers; • Encouraging farmers to provide crops at better quality and consistency, because they
are assured of buyers; • Encouraging consumers to pay a premium for a product/producer they have a
relationship with; • Providing education about the benefits of local food and agriculture; • Increasing reactivity between demand and supply, making local food more appealing
as a business decision; and • Cutting costs by eliminating middle-men. The agriculture value chain can be closed by bringing individual consumers, chefs, and grocery store buyers closer to farmers and processors, through CSA or other relationships, and also via websites to bring farmers and ag-tourists/mainland customers together.
Enhance the Agricultural Sense of Community Agriculture needs community support to succeed. Creating pride and support for local agriculture involves the following elements: • Pride in local food, both in producing and consuming it; • Knowledge of how to prepare fresh, locally produced food; and • Willingness to pay higher prices for locally produced food. School gardens can also be strong community builders through students’ promotion of them, and if their managers strive to make them a center of local activities. The positive effect of school gardens could be reinforced by the creation of strong school demand through policy. After identifying the main categories of leverage points and describing the best forms they could take, RMI developed a list of business and non-profit opportunities that respond to each leverage point.

53
V. Top Opportunities RMI developed a list of 40 business and non-profit opportunities that could activate the leverage points mentioned above. These ideas came from interviewees, existing reports, or our own analysis. The entire list can be found in Appendix F. The original list has been narrowed down to a set of 12 based on the criteria described below. For a matrix that shows which criteria are met by each opportunity, see Appendix F.
Criteria for Evaluating Opportunities We chose the best opportunities using three angles. First, we measured each opportunity against a series of questions for its individual merit. Second, we made sure we had a group of projects scattered across the value chain so as to tackle the whole chain simultaneously. Third, we chose opportunities that are in line with the “tortoise and the hare both win” strategy discussed in the overview (i.e., producing for both high-end and daily markets). For a longer discussion of criteria, see Appendix G.
Individual Merit Screening First, the 40 opportunities were measured across four broad categories: project goals, business investment, environmental and social sustainability, and across-the-board synergies. Each broad category contained a series of questions: Project Goals
• Does it reduce dependence on food imports and other imports? • Does it have a meaningful and positive impact on food behavior? • Does it positively impact local food market share on a large scale? • Does it add family-sustaining jobs?
Business Investment
• Does it have the potential to be profitable? • What is the investment timeframe? • How risky is the investment (as stand alone and in a portfolio)?
Environmental and Social Sustainability
• Does it have community backing? • Is it environmentally sound and socially acceptable? • Would it succeed without support from the tourism industry?
Across-the-board Synergies
• Does it have more than one positive impact? • Does it complement other ideas (e.g., reduce energy consumption)? • Does it have short, medium, and long-term benefits?
Eventually, a group of twelve opportunities that have positive answers to most of these questions emerged. These ideas were also widely supported by the people we interviewed and seem to provide a strong way to leap over the barriers we identified.
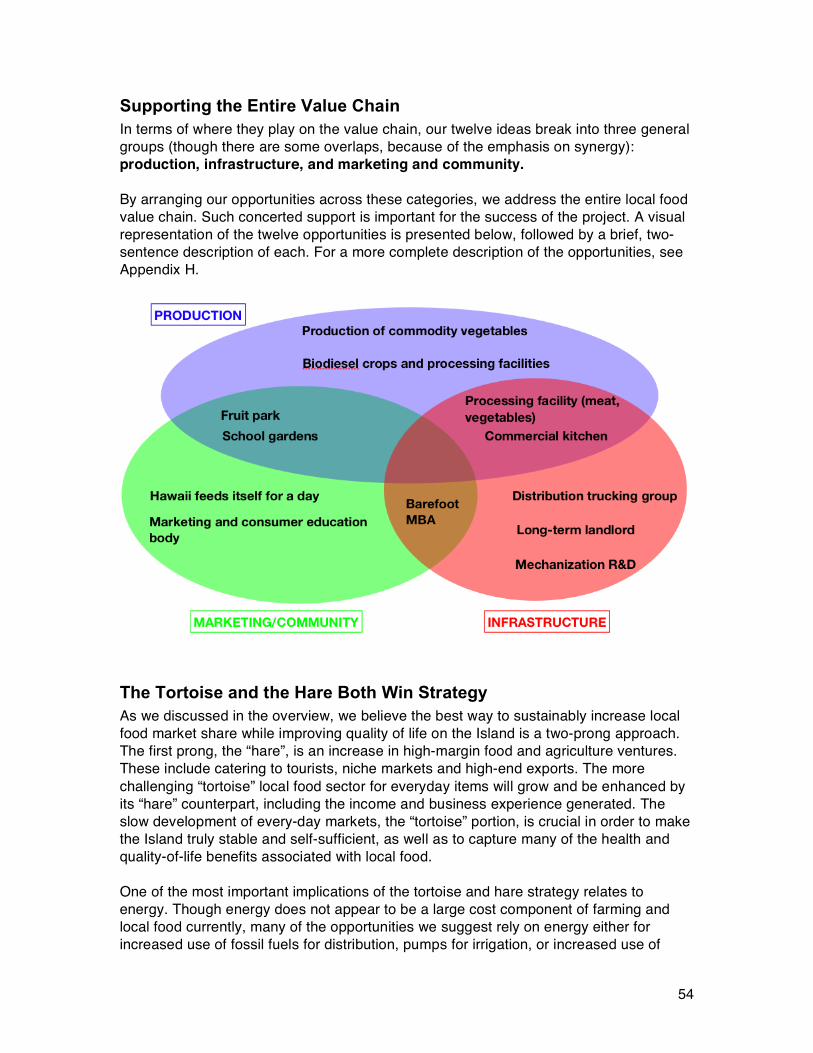
54
Supporting the Entire Value Chain In terms of where they play on the value chain, our twelve ideas break into three general groups (though there are some overlaps, because of the emphasis on synergy): production, infrastructure, and marketing and community. By arranging our opportunities across these categories, we address the entire local food value chain. Such concerted support is important for the success of the project. A visual representation of the twelve opportunities is presented below, followed by a brief, two-sentence description of each. For a more complete description of the opportunities, see Appendix H.
The Tortoise and the Hare Both Win Strategy As we discussed in the overview, we believe the best way to sustainably increase local food market share while improving quality of life on the Island is a two-prong approach. The first prong, the “hare”, is an increase in high-margin food and agriculture ventures. These include catering to tourists, niche markets and high-end exports. The more challenging “tortoise” local food sector for everyday items will grow and be enhanced by its “hare” counterpart, including the income and business experience generated. The slow development of every-day markets, the “tortoise” portion, is crucial in order to make the Island truly stable and self-sufficient, as well as to capture many of the health and quality-of-life benefits associated with local food. One of the most important implications of the tortoise and hare strategy relates to energy. Though energy does not appear to be a large cost component of farming and local food currently, many of the opportunities we suggest rely on energy either for increased use of fossil fuels for distribution, pumps for irrigation, or increased use of
55
machines to bring down costs. Also, growing energy (in the form of biodiesel) could be a cash-crop as well as a means to make the Island energy-independent, as well as food-independent.
The Top Twelve Opportunities For a more complete description of each opportunity, please see Appendix G. Hawaii Feeds Itself Day: A one-day, Island-wide event where all restaurants, schools, public administration, companies and stores would be “local food only.” Distribution Trucking and/ or Use of Extant Infrastructure for Distribution: A small fleet of refrigerated trucks or vans that would visit small farms to pick up produce and deliver them to grocery stores, restaurants or markets. And/or use of existing modes of distribution to get local food to residents. Credit and “Barefoot MBA”: A credit facility that would provide loans, letters of credit and advice to farmers applying to government and other grants. Biodiesel Crop and Processing: Biodiesel crops may be able to grow effectively on the Island at small- to large-scale. Depending on the feedstock, byproducts can be used as compost or animal feed. Processing Facility for Prepared Foods: Home cooking is often a hurdle, so providing Residents of Hawaii with an option for locally grown processed food could boost local market share. Fruit Park: Modeled on Japanese fruit parks, an ag-tourism destination featuring a large variety of fruit trees, as well as a restaurant and fruit/fruit product store. Also includes a research station. School Gardens: Spaces in schools where students have the opportunity to go to “garden class”, take special garden electives or after-school classes. School garden also provides food for school or families. Mechanization R&D: Develop machines that can perform on the Island’s difficult terrain. This is most applicable to large farms, and could be funded through public/private efforts. Long-term Lease Landlord: Investment in 100s of acres to benefit from buying in bulk. The land-lord then leases small plots (1-5 acres) at reasonable rates for long periods (30-50 years) to farmers. Marketing/Education Body: A body that helps farmers organize to market their brand and products and educate consumers through outreach, chef education, adult cooking classes, etc. Support Commodity Vegetables: Focus on farmers who want to grow fruits and vegetables consumed every day by residents of Hawaii. Ventures might include greenhouse and hydroponic operations.
56
VI. Conclusion The research has led us to conclude that the potential to increase the local food market share and the agriculture sector on the Island of Hawaii does exist, and that business-driven opportunities may be able to unlock that potential. The level of support for this project—from the enthusiasm expressed by interviewees, to the energetic and committed local food support groups and customers already in place, to the several previous community and government documents searching for ways to improve diversified agriculture—give much support to the underlying assumption of this project: that local food and agriculture can be a boon to a community. Therefore, the client and the RMI team agree that it is worthwhile continuing with Phases II and III of the project, which are explained below. Though our research for Phase I indicates that it is possible to improve the quality of life on the island through increasing local food and agriculture, it has also reveals many pitfalls by which local food and agriculture can have no impact on, or even be a detriment to, quality of life. Phases II and III will be performed with as much care as possible to avoid these pitfalls.
Phase II After the January meeting with the client, the group of twelve best opportunities was amended to reflect the client’s interest. Phase II will involve a more rigorous exploration of these twelve opportunities, from an economic and financial perspective. In conjunction with Jeremiah Johnson, who is working on The Kohala Center’s energy study for the Island of Hawaii, the RMI team will continue to look for new potential overlaps with energy and opportunities for industrial clustering as The Kohala Center research project progresses and incorporate these findings into our analysis. Phase II will reveal which projects are worth putting into action, and which are too financially or economically hobbled for future consideration. The feasible projects will move into Phase III.
Phase III After presentation of Phase II findings to the client, Phase III will focus on forging societal consensus and gather momentum around the business and philanthropic opportunities. Concretely, Phase III will consist in publicizing Phase I and II findings so as to trigger the interest of potential volunteers, employees, entrepreneurs and/or investors, whether they be individuals, companies, nonprofits or public bodies. Then, RMI and the Kohala Center will bring together parties who have expressed interest in specific opportunities, and foster these parties through the stages of implementation. Additionally, this public phase will also raise awareness of, and build support from the larger Hawaii community.
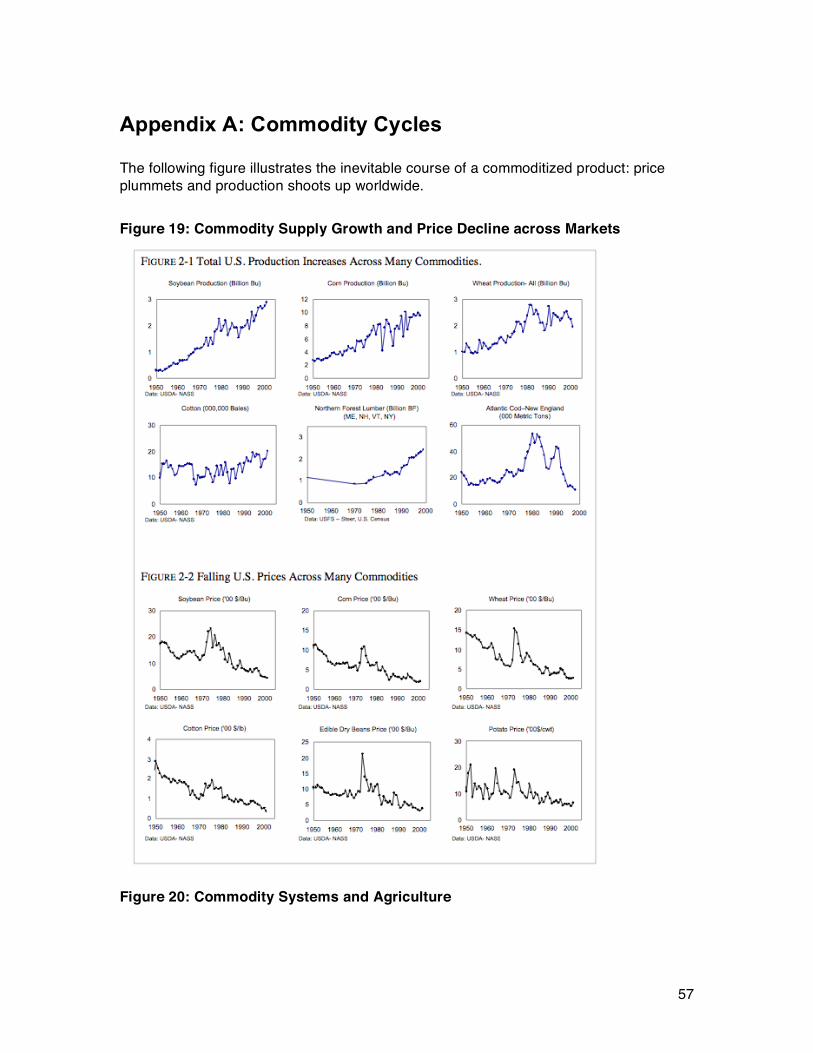
57
Appendix A: Commodity Cycles The following figure illustrates the inevitable course of a commoditized product: price plummets and production shoots up worldwide. Figure 19: Commodity Supply Growth and Price Decline across Markets
Figure 20: Commodity Systems and Agriculture
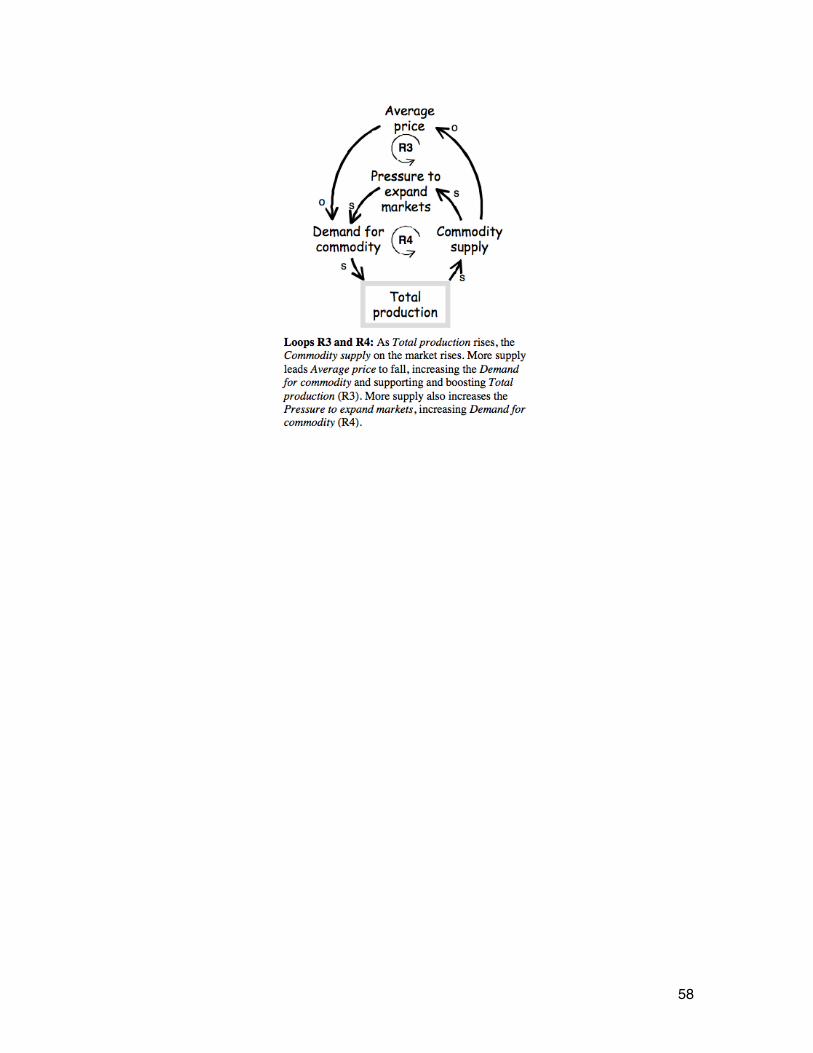
58

59
Appendix B: Individual Interviews The individuals interviewed help contribute to our evolving understanding of the local food and agriculture systems on the Island of Hawaii, and we are very grateful for their time. The opinions or conclusions expressed in the document do not necessarily reflect the beliefs of our interviewees. Name Occupation Babien, James Head chef at Fairmont Orchid Hotel Bondera, Colehaur and Melanie
Organic farmers and community activists
Bryan, Corky Land Manager, Parker Ranch Cole, Dr. Elizabeth Co-Director of The Kohala Center Cox, Dr. Linda Professor of Natural Resources and Environmental
Management, University of Hawaii Datta, Kyle CEO of U.S. Biodiesel Group Datta, Tane Founder of Adaptations and organic farmer Discoe, Ben and Deb Egg farmers Fleming, Dr. Kent Economist with University of Hawaii Greenway, Una Organic farmer, Farm Bureau member Ha, Richard Owner, Mauna Kea Banana and Hamakua Springs Hirabara, Kurt and Pam Owners and farmers at Hirabara Farms, local food
activists Johnson, Dr. Jeremiah Yale University, energy consultant Kraan, Maha Chef, restaurateur, and private cook Lange, Kelly Educational Program Director and Hawaiian Organic
Farmers Association Love, Ken Researcher and head of Twelve Trees Project, College
of Tropical Agriculture and Human Resources (CTAHR), University of Hawaii, farmer
Namkoong, Joan Food writer and farmers market organizer O’Connell, Tim USDA/Rural Development, Assistant to the State
Director Piianaia, Nancy Chair of Waimea Slowfoods Convivium Reddekopp, Jim Owner, Hawaii Vanilla Company Redfeather, Nancy and Gerry Herbert
Organic farmers, community advocates, run small CSA, former school garden teacher
Rice, Sally Responsible land manager Richard, Monty Chairman, Kahua Ranch Rieux, Amanda Garden teacher at Waimea Middle School Simmons, Peter Land Manager at Kamehameha Schools Smith, Virginia Easton CTAHR extension agent Spiegel, Richard Owner of Volcano Island Honey Company Steiner, Dr. William Dean of College of Agriculture, Forestry, and Natural
Resource Management. University of Hawaii–Hilo Thorne, Dr. Mark Range Extension Specialist, CTAHR
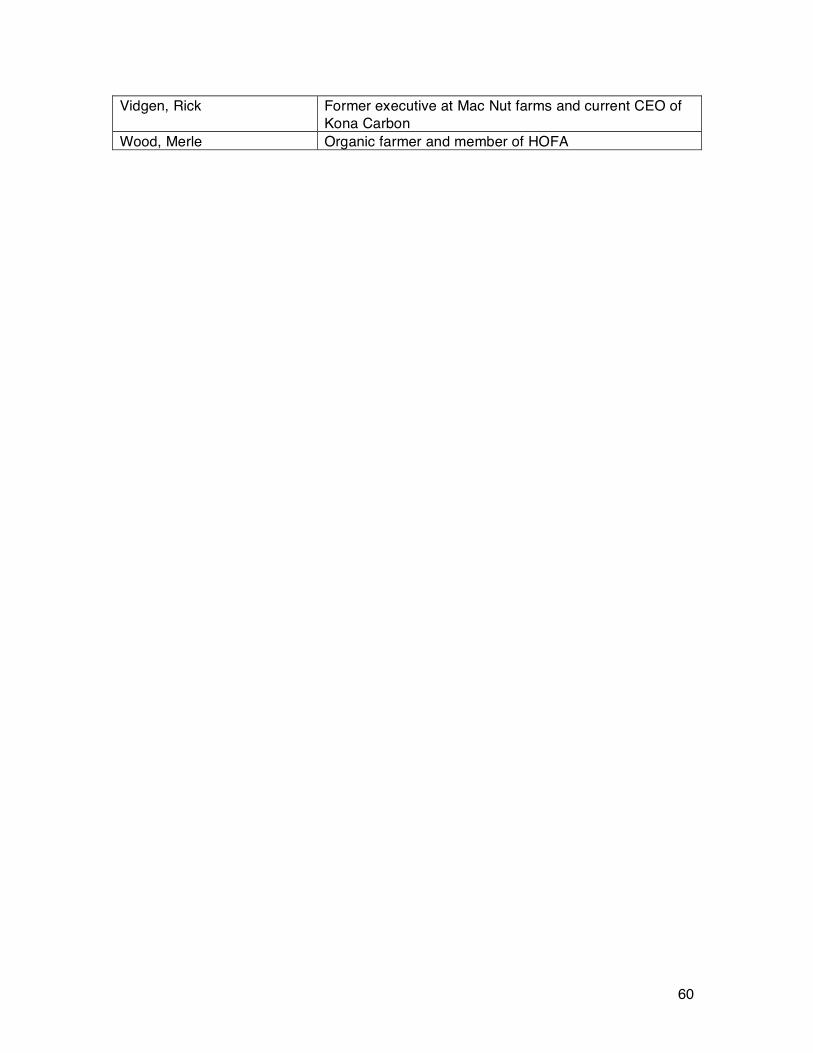
60
Vidgen, Rick Former executive at Mac Nut farms and current CEO of Kona Carbon
Wood, Merle Organic farmer and member of HOFA
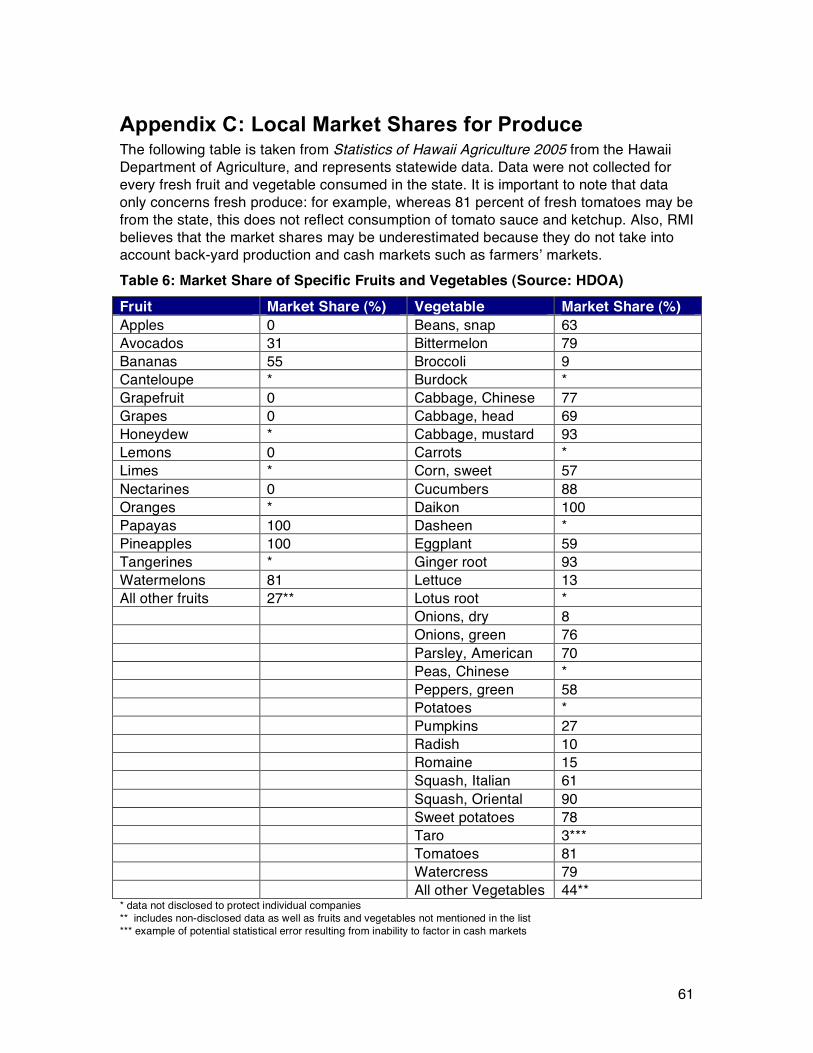
61
Appendix C: Local Market Shares for Produce The following table is taken from Statistics of Hawaii Agriculture 2005 from the Hawaii Department of Agriculture, and represents statewide data. Data were not collected for every fresh fruit and vegetable consumed in the state. It is important to note that data only concerns fresh produce: for example, whereas 81 percent of fresh tomatoes may be from the state, this does not reflect consumption of tomato sauce and ketchup. Also, RMI believes that the market shares may be underestimated because they do not take into account back-yard production and cash markets such as farmers’ markets. Table 6: Market Share of Specific Fruits and Vegetables (Source: HDOA) Fruit Market Share (%) Vegetable Market Share (%) Apples 0 Beans, snap 63 Avocados 31 Bittermelon 79 Bananas 55 Broccoli 9 Canteloupe * Burdock * Grapefruit 0 Cabbage, Chinese 77 Grapes 0 Cabbage, head 69 Honeydew * Cabbage, mustard 93 Lemons 0 Carrots * Limes * Corn, sweet 57 Nectarines 0 Cucumbers 88 Oranges * Daikon 100 Papayas 100 Dasheen * Pineapples 100 Eggplant 59 Tangerines * Ginger root 93 Watermelons 81 Lettuce 13 All other fruits 27** Lotus root * Onions, dry 8 Onions, green 76 Parsley, American 70 Peas, Chinese * Peppers, green 58 Potatoes * Pumpkins 27 Radish 10 Romaine 15 Squash, Italian 61 Squash, Oriental 90 Sweet potatoes 78 Taro 3*** Tomatoes 81 Watercress 79 All other Vegetables 44** * data not disclosed to protect individual companies ** includes non-disclosed data as well as fruits and vegetables not mentioned in the list *** example of potential statistical error resulting from inability to factor in cash markets
62
Appendix D: Water Availability In order to determine if water availability is the limiting factor to the growth of agriculture, we estimated the amount of additional cultivated acres that Hawaii’s water resources could support. We have calculated this assuming that all expanded agriculture relies on irrigation. Since only 28 percent of the state’s farms currently use irrigation, and the rest use rainfall or catchments, we feel this makes our conclusions very conservative. However, some see increased use of irrigation as crucial to an expanded diversified agriculture sector because it lends more consistency to produce quality and availability.47 Many irrigation systems exist on Hawaii on old sugarcane land, but they are not in use or running at full capacity. The southern part of the Island is not connected to the water system, and relies on catchments. The Island of Hawaii receives a wide variety of rainfall. Because of Hawaii’s volcanic origins and its lava rock, the ground is extraordinarily permeable. Most of the rainfall goes into underground aquifers, and there is very little run-off into the ocean. Streams exist, and are fed by springs originating in the aquifers. Rainstorms lead to temporary increases in the springs’ volume. Hawaii’s aquifers are charged entirely by accumulated rainwater.48 First, we investigated whether the physical availability of water on the Island would be a limiting factor. Using data from the Hawaii Commission on Water Resource Management that estimated the sustainable yield of each of the Island’s 21 aquifer regions, we calculated how may acres each aquifer region could “afford” to irrigate. Our estimate was based upon the Agricultural Water Use and Development Plan’s findings that irrigated, diversified agriculture on the island needs 3,400 gallons per acre per day. We also subtracted current ground water use, as well as water available in aquifers in non-agricultural areas. We estimate the ground water in Hawaii could physically support 384,700 additional acres of irrigated agriculture. This number would increase if farmers used efficient irrigation technology widely. For a map of aquifer regions, see Figure 21. Figure 21: Map of Aquifer Regions and Sustainable Yields (Source: CWRM)
47 AWUDP. 48 AWUDP.
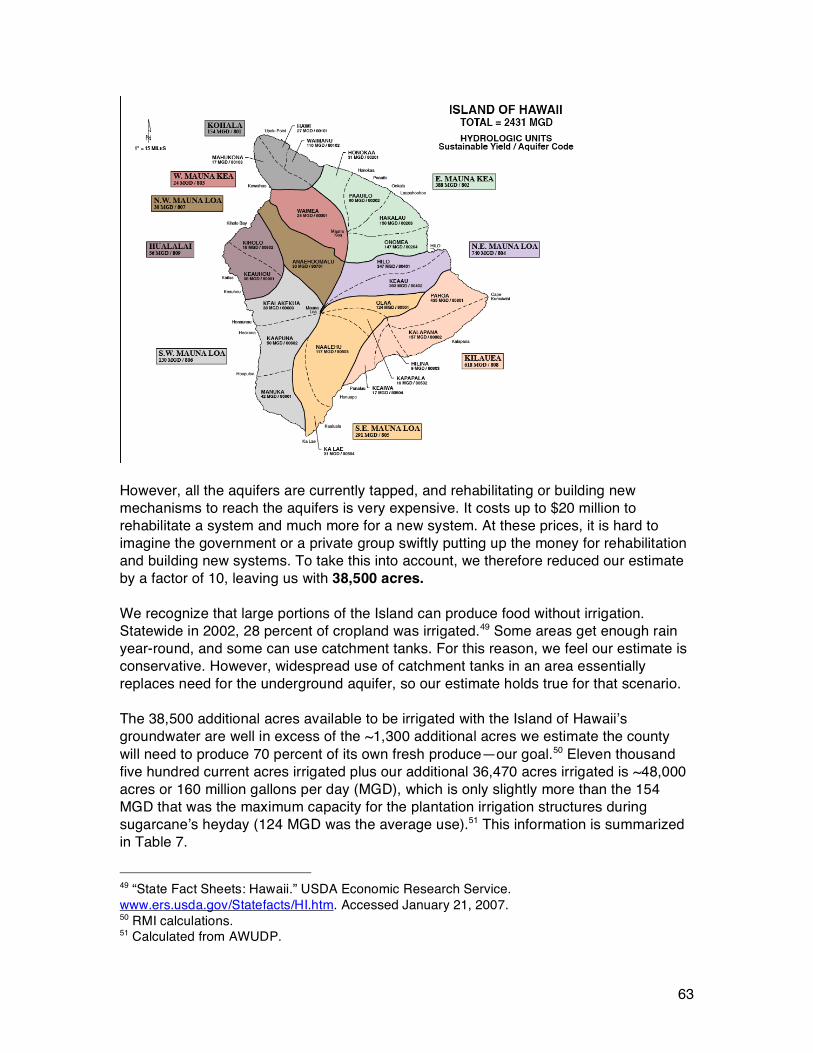
63
However, all the aquifers are currently tapped, and rehabilitating or building new mechanisms to reach the aquifers is very expensive. It costs up to $20 million to rehabilitate a system and much more for a new system. At these prices, it is hard to imagine the government or a private group swiftly putting up the money for rehabilitation and building new systems. To take this into account, we therefore reduced our estimate by a factor of 10, leaving us with 38,500 acres. We recognize that large portions of the Island can produce food without irrigation. Statewide in 2002, 28 percent of cropland was irrigated.49 Some areas get enough rain year-round, and some can use catchment tanks. For this reason, we feel our estimate is conservative. However, widespread use of catchment tanks in an area essentially replaces need for the underground aquifer, so our estimate holds true for that scenario. The 38,500 additional acres available to be irrigated with the Island of Hawaii’s groundwater are well in excess of the ~1,300 additional acres we estimate the county will need to produce 70 percent of its own fresh produce—our goal.50 Eleven thousand five hundred current acres irrigated plus our additional 36,470 acres irrigated is ~48,000 acres or 160 million gallons per day (MGD), which is only slightly more than the 154 MGD that was the maximum capacity for the plantation irrigation structures during sugarcane’s heyday (124 MGD was the average use).51 This information is summarized in Table 7.
49 “State Fact Sheets: Hawaii.” USDA Economic Research Service. www.ers.usda.gov/Statefacts/HI.htm. Accessed January 21, 2007. 50 RMI calculations. 51 Calculated from AWUDP.
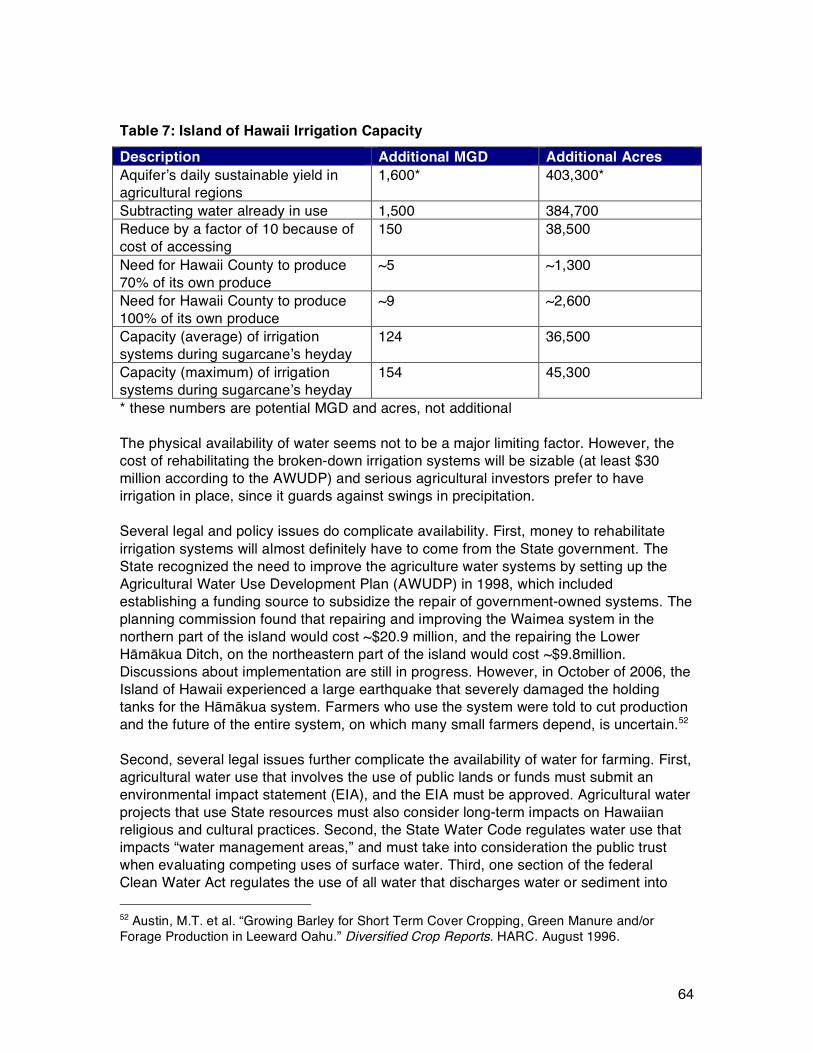
64
Table 7: Island of Hawaii Irrigation Capacity Description Additional MGD Additional Acres Aquifer’s daily sustainable yield in agricultural regions
1,600* 403,300*
Subtracting water already in use 1,500 384,700 Reduce by a factor of 10 because of cost of accessing
150 38,500
Need for Hawaii County to produce 70% of its own produce
~5 ~1,300
Need for Hawaii County to produce 100% of its own produce
~9 ~2,600
Capacity (average) of irrigation systems during sugarcane’s heyday
124 36,500
Capacity (maximum) of irrigation systems during sugarcane’s heyday
154 45,300
* these numbers are potential MGD and acres, not additional The physical availability of water seems not to be a major limiting factor. However, the cost of rehabilitating the broken-down irrigation systems will be sizable (at least $30 million according to the AWUDP) and serious agricultural investors prefer to have irrigation in place, since it guards against swings in precipitation. Several legal and policy issues do complicate availability. First, money to rehabilitate irrigation systems will almost definitely have to come from the State government. The State recognized the need to improve the agriculture water systems by setting up the Agricultural Water Use Development Plan (AWUDP) in 1998, which included establishing a funding source to subsidize the repair of government-owned systems. The planning commission found that repairing and improving the Waimea system in the northern part of the island would cost ~$20.9 million, and the repairing the Lower Hāmākua Ditch, on the northeastern part of the island would cost ~$9.8million. Discussions about implementation are still in progress. However, in October of 2006, the Island of Hawaii experienced a large earthquake that severely damaged the holding tanks for the Hāmākua system. Farmers who use the system were told to cut production and the future of the entire system, on which many small farmers depend, is uncertain.52 Second, several legal issues further complicate the availability of water for farming. First, agricultural water use that involves the use of public lands or funds must submit an environmental impact statement (EIA), and the EIA must be approved. Agricultural water projects that use State resources must also consider long-term impacts on Hawaiian religious and cultural practices. Second, the State Water Code regulates water use that impacts “water management areas,” and must take into consideration the public trust when evaluating competing uses of surface water. Third, one section of the federal Clean Water Act regulates the use of all water that discharges water or sediment into 52 Austin, M.T. et al. “Growing Barley for Short Term Cover Cropping, Green Manure and/or Forage Production in Leeward Oahu.” Diversified Crop Reports. HARC. August 1996.
65
navigable waters of the United States, which applies to all water in Hawaii. Finally, the Endangered Species Act requires that all development that might impact endangered species follow Best Management Practices. Hawaii’s ecosystems are home to several endangered species and the water sources of most irrigation systems are in these habitats. But since these species are little studied, best management practices are not available. 53 All these legal issues result in a very complex permitting and application process that may require legal consultants to successfully navigate. This is a major disincentive for farmers, especially small farmers, to open new farms that need irrigation or improve existing irrigation infrastructure.
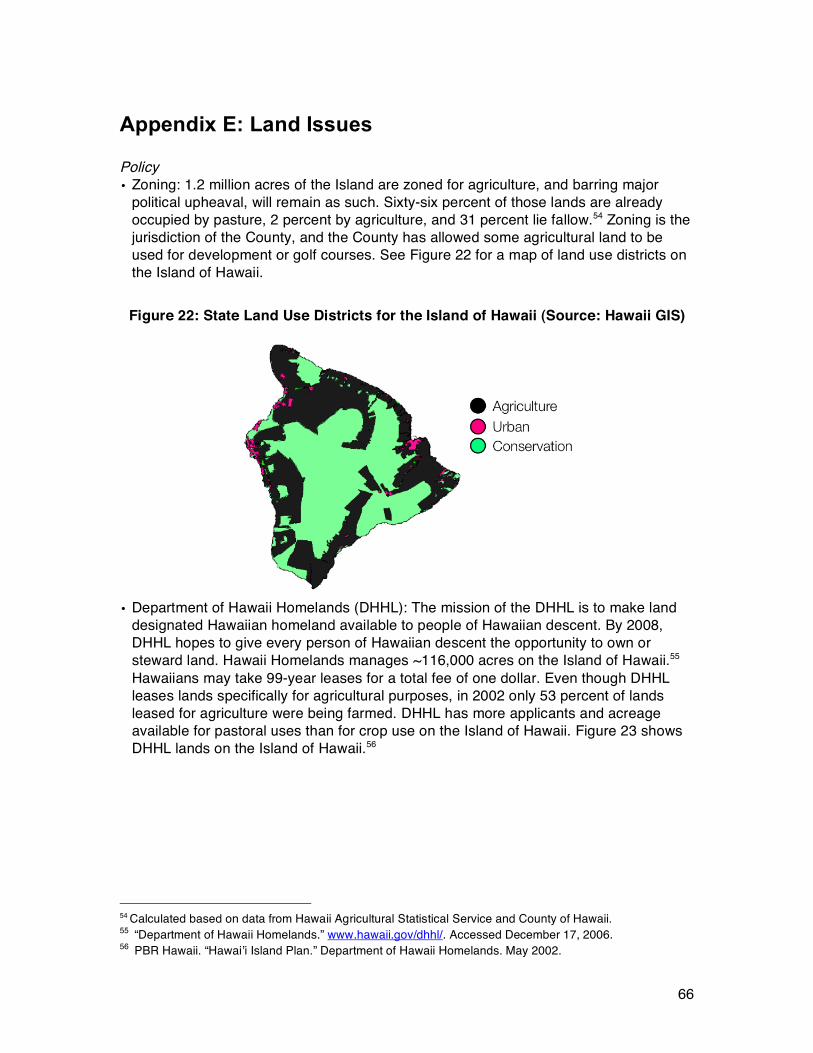
66
Appendix E: Land Issues Policy • Zoning: 1.2 million acres of the Island are zoned for agriculture, and barring major
political upheaval, will remain as such. Sixty-six percent of those lands are already occupied by pasture, 2 percent by agriculture, and 31 percent lie fallow.54 Zoning is the jurisdiction of the County, and the County has allowed some agricultural land to be used for development or golf courses. See Figure 22 for a map of land use districts on the Island of Hawaii.
Figure 22: State Land Use Districts for the Island of Hawaii (Source: Hawaii GIS)
• Department of Hawaii Homelands (DHHL): The mission of the DHHL is to make land
designated Hawaiian homeland available to people of Hawaiian descent. By 2008, DHHL hopes to give every person of Hawaiian descent the opportunity to own or steward land. Hawaii Homelands manages ~116,000 acres on the Island of Hawaii.55 Hawaiians may take 99-year leases for a total fee of one dollar. Even though DHHL leases lands specifically for agricultural purposes, in 2002 only 53 percent of lands leased for agriculture were being farmed. DHHL has more applicants and acreage available for pastoral uses than for crop use on the Island of Hawaii. Figure 23 shows DHHL lands on the Island of Hawaii.56
54 Calculated based on data from Hawaii Agricultural Statistical Service and County of Hawaii. 55 “Department of Hawaii Homelands.” www.hawaii.gov/dhhl/. Accessed December 17, 2006. 56 PBR Hawaii. “Hawai’i Island Plan.” Department of Hawaii Homelands. May 2002.
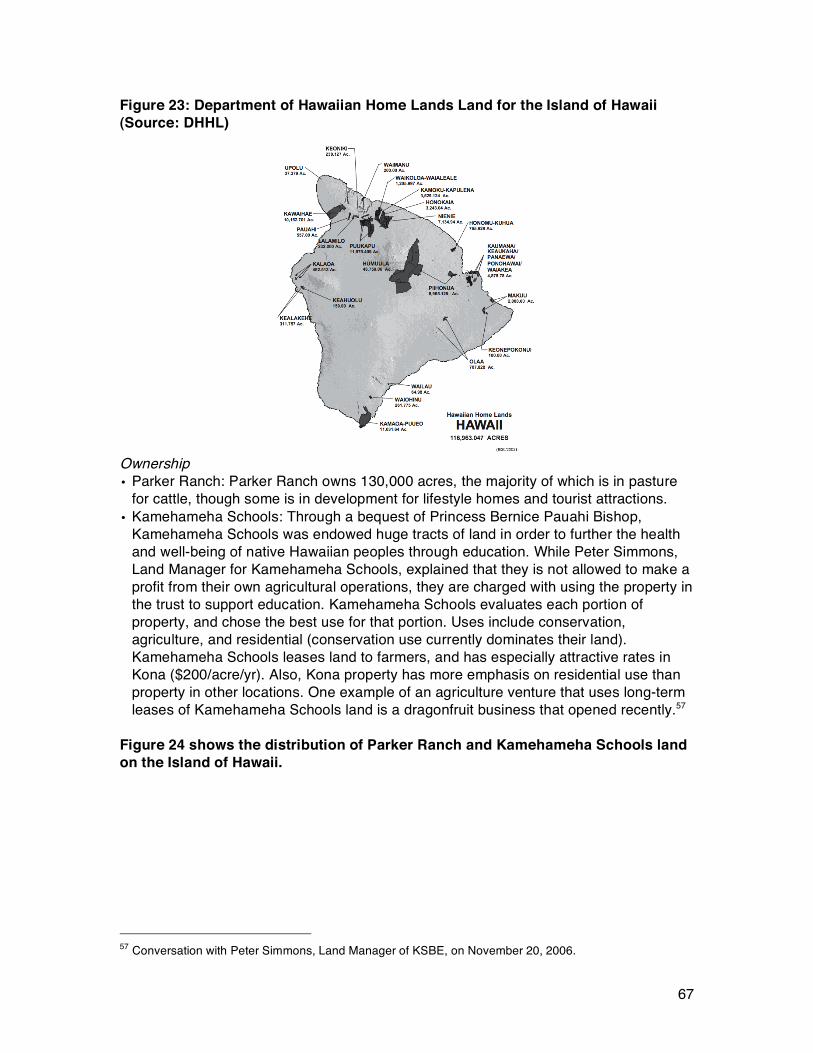
67
Figure 23: Department of Hawaiian Home Lands Land for the Island of Hawaii (Source: DHHL)
Ownership • Parker Ranch: Parker Ranch owns 130,000 acres, the majority of which is in pasture
for cattle, though some is in development for lifestyle homes and tourist attractions. • Kamehameha Schools: Through a bequest of Princess Bernice Pauahi Bishop,
Kamehameha Schools was endowed huge tracts of land in order to further the health and well-being of native Hawaiian peoples through education. While Peter Simmons, Land Manager for Kamehameha Schools, explained that they is not allowed to make a profit from their own agricultural operations, they are charged with using the property in the trust to support education. Kamehameha Schools evaluates each portion of property, and chose the best use for that portion. Uses include conservation, agriculture, and residential (conservation use currently dominates their land). Kamehameha Schools leases land to farmers, and has especially attractive rates in Kona ($200/acre/yr). Also, Kona property has more emphasis on residential use than property in other locations. One example of an agriculture venture that uses long-term leases of Kamehameha Schools land is a dragonfruit business that opened recently.57
Figure 24 shows the distribution of Parker Ranch and Kamehameha Schools land on the Island of Hawaii.
57 Conversation with Peter Simmons, Land Manager of KSBE, on November 20, 2006.
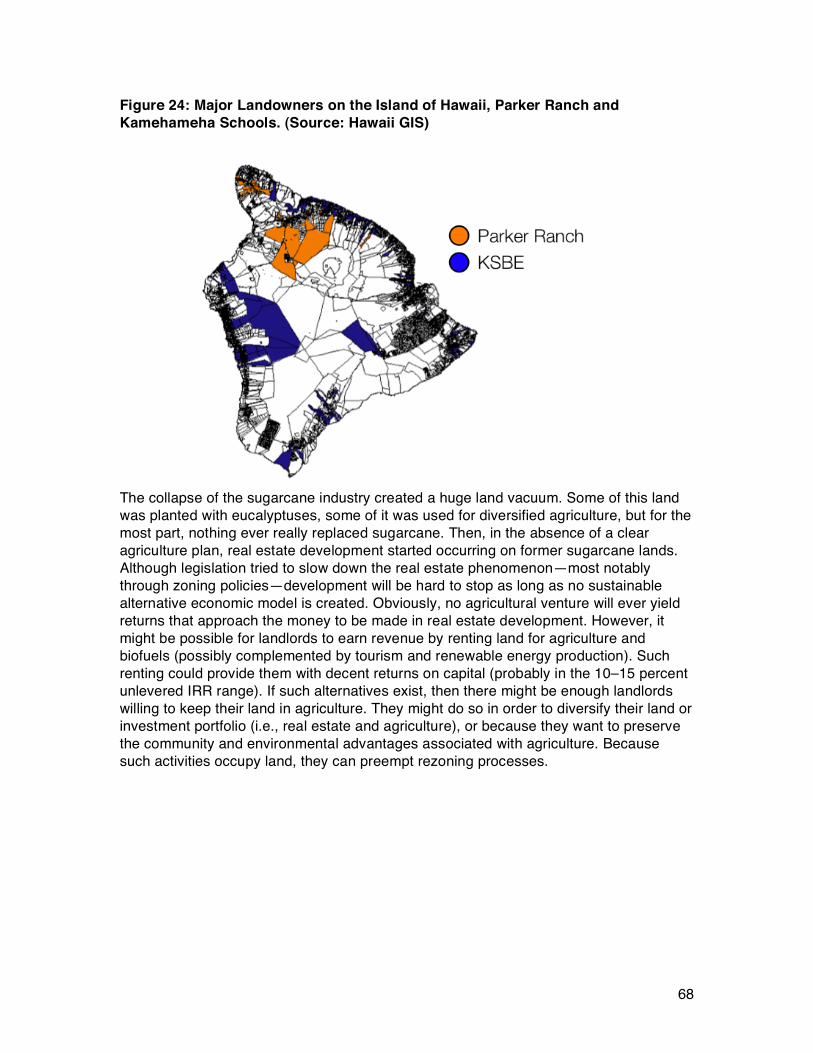
68
Figure 24: Major Landowners on the Island of Hawaii, Parker Ranch and Kamehameha Schools. (Source: Hawaii GIS)
The collapse of the sugarcane industry created a huge land vacuum. Some of this land was planted with eucalyptuses, some of it was used for diversified agriculture, but for the most part, nothing ever really replaced sugarcane. Then, in the absence of a clear agriculture plan, real estate development started occurring on former sugarcane lands. Although legislation tried to slow down the real estate phenomenon—most notably through zoning policies—development will be hard to stop as long as no sustainable alternative economic model is created. Obviously, no agricultural venture will ever yield returns that approach the money to be made in real estate development. However, it might be possible for landlords to earn revenue by renting land for agriculture and biofuels (possibly complemented by tourism and renewable energy production). Such renting could provide them with decent returns on capital (probably in the 10–15 percent unlevered IRR range). If such alternatives exist, then there might be enough landlords willing to keep their land in agriculture. They might do so in order to diversify their land or investment portfolio (i.e., real estate and agriculture), or because they want to preserve the community and environmental advantages associated with agriculture. Because such activities occupy land, they can preempt rezoning processes.

69
Appendix F: 40 Opportunities
Top 40 Ideas This section includes a list and descriptions of the specific business opportunities that emerged in the course of interviews. Our interviewees generated some of the ideas, and some were generated by RMI as we learned about Hawaii’s agriculture system. They are organized by “leverage point category” from Section VI. Several ideas are in more than one category.
Bring Down Input Costs For profit ideas • Compost business: Create a local compost business that uses green waste, food
waste, fish waste, etc., and sells compost as fertilizer via local gardening stores, etc. • Bamboo or other fiber operation: Wood is very hard to come by on the island, and
expensive to ship in. A local source of fiber from an ecologically responsible tree could save costs for other farmers.
• Glass recycler/bottle maker: Several value-adding strategies—such as the use of greenhouses and the production of jams, jellies, and juices—need glass, which is expensive to import. A local glass recycling facility might be able to produce glass to meet these demands while saving valuable landfill space. Glass can be recycled using heat from waste oil.
• Revolving fund with low-interest loans for new businesses within the mission of this project: Individual islanders have more of their own ideas for new agricultural businesses that this RMI study could ever hope to cover. Often, capital costs pose an impossible hurdle. Low- or no-interest loans for projects that enhance agriculture or local food consumption on the Island could trigger the implementation of many new projects.
• Develop/market island-capable mechanization: One way to avoid high labor costs is to develop machines or find machines that can perform on the difficult terrain of the Island. This strategy is most applicable to larger farms, such as those that grow macadamia nuts, coffee, papaya, or potential biodiesel crop.
Non-profit ideas • Farmers’ education organization: A non-profit with a well-trained staff dedicated to
educating farmers about farming and marketing techniques to make their businesses successful. To be effective, this non-profit would need some local people on staff. The organization would also need its own demonstration farm, which could be done in conjunction with an ag-tourism site.
• “Barefoot MBA”/Grant extension agent: One or more people with business/MBA background who act as extension agents for the business and management side of farming, which would mirror the horticultural extension agents from the university. These agents would visit farms to provide business advice, and also to guide farmers through complex grant and permit application processes.
70
Capitalize on Overlaps with Energy • Biodiesel crops and processing: Though many local farms rely on manual labor
because of small fields and rocky terrain, electricity and diesel for pumping water can still be a major expense (7 percent). Small-scale biodiesel crops and small processing centers could be profitable and supply biodiesel to farmers at potentially a lower cost than diesel. Biodiesel could also be used in a new truck-based distribution service. Furthermore, the byproduct of biodiesel processing is a low-cost, high-protein feedstock appropriate for animals.
• Dried fruit or grain operation using waste heat: A barrier to opening a drying facility is the high cost of generating heat. A drying facility that used a combination of solar and waste heat from a power plant could avoid such a cost. Low-cost local dried grain could allow livestock ranchers to fatten some cattle on the Island.
• Grants/Loans for energy and water saving devices for small farmers: This could also be not for profit. Several energy- and water-saving devices exist (such as solar panels, insulation, catchment tanks, micro-irrigation hoses, sensors that give real-time feedback about soil’s water content, etc.) and could save farmers money, as well as conserve resources. Providing funding or loans for the capital costs of these devices would bring them within the reach of small farmers.
Improve Opportunities to Acquire Land For-profit ideas • Long-term lease landlord: An individual or organization with extensive capital buys or
rents a large piece of land, capturing economic benefits of buying in bulk. Then the landlord leases out small pieces of the land (1–5 acres) at reasonable rates and for long periods (30–50 years) to people interested in farming.
• Revolving fund with low-interest loans for land: A fund that gives low- or no-interest loans to those wishing to buy farming land.
Get Higher Prices for Goods Higher prices for goods can be realized either through adding value via processing to products or by convincing buyers to pay a premium for products (for their quality, for responsible production, or for being local) already on the market. Value Adding For-profit ideas • Ag-tourism destinations and demo farms: These facilities would be working farms that
offer educational tours to tourists and have the facilities for “all-local” meals or taste-tests, as well as gift shops featuring locally produced food. These facilities can also host experimental farming methods and crops, to benefit the farming community.
• Commercial kitchens: Commercial kitchens are facilities that are certified for food processing. Without using a commercial kitchen, farmers/entrepreneurs cannot sell processed food. The commercial kitchen could be divided into stations used for various
71
processes. They could be rented out by the hour, and the kitchens manager/owner could purchase basic supplies in bulk for customers.
• Meat-pouching operation: Along the line of popular tuna pouches, UH is researching the possibility of a meat-pouching operation that creates serving-sized prepared meals using non-prime cuts of grass-fed beef and locally produced vegetables.
• Slaughterhouse: A slaughterhouse is necessary to provide local meat and poultry to Island residents. Currently, most meat grown on the Island is shipped to the mainland for slaughter, and Island chickens are only used for laying eggs. Only two small, old-fashioned slaughterhouses are in operation on the Island.
• Feedlot: Customers demand grain-fed beef, so for locally produced beef to make serious progress in the Island market, a local feedlot is necessary.
• Jam/jelly/dried fruit operation: The simplest way to add value to Hawaii’s extensive fruit offerings is to produce processed, longer-lasting foodstuffs, such as jams, jellies, and dried fruits (for snacks and granola).
• Line of frozen dinners/prepared foods: Residents of Hawaii, and mainlanders, will probably never be convinced to purchase only fresh foods and cook all the time. Locally produced frozen or prepared dinners are a powerful way to affect people’s eating habits. Frozen dinners could also be exported, especially if they use organic food. Waste heat from power/industrial facilities or NELHA water could be used for freezing.
• Dried fruit or grain operation using waste heat: A barrier to opening a drying facility is the high cost of creating heat. A drying facility that used a combination of solar and waste heat from a power plant, for example, could avoid such a cost. Low-cost local dried grain could allow livestock ranchers to fatten some cattle on the Island.
Premium Adding For-profit ideas • Fruit park: A specific ag-tourism destination, a fruit park would be modeled on
Japanese fruit parks and offer tourists the chance to see dozens of different types of fruit growing. A fruit stand would sell to tourists and local shoppers, and a restaurant could offer tourists “all-local” meals. The fruit park could also serve as a demonstration farm, and have a commercial kitchen for creating value-added fruit products.
• Other niche-market products: A wide array of niche and high-end markets exist. • Greenhouse/hydroponic farm: Greenhouses have had success on Hawaii, especially
those using hydroponics. They allow farmers to grow high-quality produce, especially produce that do not usually succeed in Hawaii’s climate.
For-profit OR non-profit ideas • Kiawe tree reserve: The Kiawe tree forest could be the center of an agricultural cluster
and offer large-scale ecosystem services (water retention, cooling, habitat, etc.): high-end honey, fiber, and protein from Kiawe beans.
• Cooking demos in-store: A local chef (e.g., Maha of Maha’s Café) sets up a small cooking station in KTA or other stores or farmers’ markets once a week and
72
demonstrates how to cook meals using fresh, locally produced food (specifically, what’s on sale that week) and gives out samples and recipe cards.
Not for profit • Local food marketing NGO: A not-for-profit dedicated to marketing locally produced
food and educating consumers about the benefits of locally produced food. This non-profit could also organize farmers so that they can provide consistent supplies of produce and cooperate to market their wares.
• Chef education: Chefs are one of the most influential buyers of food. Making education about how to chose locally produced food, how to cope with the variations in local food supply, and how to educate their patrons about locally produced food a standard part of chef training on the Island is a powerful way to increase locally produced food consumption.
Create Relationships between Consumers and Producers For profit ideas • Ag-tourism destinations and demo farms: Farms that offer education tours for tourists
and have the facilities for “all-local” meals or taste-tests, as well as gift shops featuring locally produced food. These locations can also serve as demonstration facilties for experimental methods and crops, which would benefit the farming community.
• Fruit park: A specific ag-tourism destination, a fruit park would be modeled on Japanese fruit parks and offer tourists the chance to see dozens of different types of fruit growing. A fruit stand would sell to tourists and local shoppers, and a restaurant could provide tourists “all-local” meals. The fruit park could also be used as a demonstration farm, and have a commercial kitchen for creating value-added fruit products.
• Direct-to-consumer distribution channel: Either a web-resource like eBay or a produce basket delivery service that delivers locally grown produce directly to consumers once a week. The web-based resource would allow consumers to chose their own food, and the basket would contain whatever produce is available that week. Direct marketing also includes websites that allow shoppers to learn about the farms and what they offer, and purchase products online.
Non-profit ideas • Education about direct marketing: A non-profit that teaches farmers the benefits of
direct marketing and helps develop websites and provides server space. • More local food journalism, media coverage: Food writing is becoming increasingly
popular but Big Island food writing is often pulled from mainland news wire services. Truly local food journalism could help consumers feel like they have more of a relationship to locally produced food.
Develop Market Channel Infrastructure For profit ideas • Refrigerated truck delivery service: Refrigerated delivery trucks that pick up produce
from small farmers and deliver it to end-users like restaurants, grocery stores, and
73
individuals. The trucks could run on biodiesel to save costs. The service could either be a wholesale operation, or charge farmers/end-users a fee. This could also be an at-cost operation, or not-for-profit.
• Roadside produce stand/kiosk group: Small kiosks that sell coffee or lunches are popular in Kona, as are roadside fruit stands. The market is by no means saturated and such kiosks/stands could be a low-overhead way to sell local produce without the consistent supply constraints of mainstream grocery stores.
• Direct-to-consumer distribution channel: Either a web-resource or a produce basket delivery service that delivers locally grown produce directly to consumers once a week. The web-based resource would allow consumers to chose their own food, and the basket would contain whatever produce is available that week. Direct marketing also includes websites that allow shoppers to learn about the farms and what they offer, and purchase products online.
• Healthy local snacks/lunches in schools: This program would provide a local market for farmers and give children healthier food while making them accustomed to fresh and locally produced foods, thereby creating lifelong customers.
• “Big Island Feeds Itself Day”: As a way to raise awareness and set up distribution infrastructure and introduce players along the food chain, have a “Big Island Feeds Itself Day,” where all restaurants, hotels, schools, and stores feature only locally produced food. It would take about 2 years to build up the farming and distribution network needed to accomplish this.
Non-profit ideas • Chef education: Chefs are one of the most influential buyers of food. Educating chefs
about how to chose locally produced food, how to cope with the variations in locally produced food supply, and how to educate their patrons about locally produced food is a powerful way to increase locally produced food consumption.
• Clearinghouse: An either digital or physical location, where farmers bring/post their available produce for the week and consumers (individual and large-scale) can come to shop.
Enhance Agricultural Sense of Community For-profit ideas • Business training facility: an MBA or management school that focuses on farmers and
small businesses. • Health insurance group/retirement fund for farmers: Several farmers have explained
that the lack of insurance and retirement funds is a major disincentive to enter the farming profession full time. A reasonably priced health insurance and retirement fund service would take away two of the major impediments for people who want to be full-time farmers.
• Healthy local snacks/lunches in school: This program would provide a local market for farmers and give children healthier food while making them accustomed to fresh and locally produced foods, thereby creating lifelong customers.
Non-profit ideas
74
• Community dinners and farmers’ exchange: Groups of co-located farmers would have biweekly potlucks that are also exchanges of weekly surplus. Besides keeping food from going to waste, such dinners could help strengthen the farming community and be a place to share information.
• Kama’aina sales, grants for kama’aina pricing: Because many of the products that will be successful go to high-end or niche markets, they won’t be available to all local people. Kama’aina prices (a discount for locals) could allow the whole community to benefit from healthy, locally grown produce. Farmers would have to be willing to just break even on a certain percent of crop if there was no donor to fund the difference.
• Baba In-store cooking demos: A local chef (e.g., Maha) sets up a small cooking station in KTA or other stores or farmers’ markets once a week and demonstrates how to cook meals using fresh, locally produced food (specifically, what’s on sale that week) and gives out samples and recipe cards. This could be profitable for a grocery store who funds and hosts the demos itself.
• Kiawe tree reserve: The Kiawe tree forest could be the center of an agricultural cluster and offer large-scale ecosystem services (water retention, cooling, habitat, etc.): high-end honey, fiber, and protein from Kiawe beans.
• “Big Island Feeds Itself Day”: As a way to raise awareness and set up distribution infrastructure and introduce players along the food chain, have a “Big Island Feeds Itself Day,” where all restaurants, hotels, schools, and stores feature only locally produced food. It would take about 2 years to build up the farming and distribution networks needed to accomplish this.
• School gardens: Create small gardens at schools where students can learn gardening techniques and understand the origin of food. Students could grow salad bar items or snacks for their own cafeterias. School gardens also provide exercise, offer hands-on learning about ecology, and create life-long customers for local produce. School gardens can also provide fresh produce for other community members, such as the elderly or soup kitchens. Finally, school gardens can become strong community builders if students promote them, and if their managers strive to make them centers of local activities.
• Community gardens: Provide convenient garden space within the community where families pay a very small fee for a plot of land to grow food for their own use. An ideal community garden would have a full time staffer who tends to the daily tasks of gardening while residents are at work. Such gardens also allow users to learn gardening skills.
75
Appendix G: More Complete Description of Criteria
Most important criteria:
• Reduces dependence on food imports: Opportunities that directly replace imported food with food grown on the island
• Impacts locally produced food’s market share on the largest possible scale: Opportunities that address the largest areas of potential change, such as types of food which are most consumed by locals.
• Profitability: Opportunities that are potentially profitable may either be viable under standard business evaluation criteria, only slightly profitable, profitable, or profitable over a very long period of time.
• Increases the farmer’s profit: Opportunities that either reduce costs or increase value so that a farmer can overcome hurdles like high labor and land costs, and opportunities that make farming on the Island a more attractive career.
• Complements other idea(s) well: Opportunities that will benefit other specific opportunities. The best opportunities will be those that are mutually supportive. Opportunities that complement each other should be considered in tandem.
• More than one positive impact: Opportunities that positively impact more than one of the leverage points.
• Meaningful impact on food behavior: Opportunities that will give local people and institutions an incentive to change their food buying habits and consume more locally produced food.
Other criteria • Reduces other imports: Opportunities that directly replace other imports (such as fuel,
wood, or packaging material) with goods made on the island.
• Existing community backing: Opportunities on which local people are already working, or are very excited about. Even though some are underway, these opportunities may lack funding or the organization necessary to succeed. Tapping into existing community support increases the chances that opportunities will succeed and will be accepted by the community.
• Free from reliance on tourism: Opportunities that will continue to function regardless of the tourism on the Island. If all opportunities depend on tourism, then we have not achieved true self-sufficiency. However, some opportunities that utilize the strong tourism industry will be very valuable. It is important to achieve a balance between tourism- and non-tourism-related opportunities.
• Adds family-sustaining jobs: One of the important benefits of increasing the agricultural sector is to diversify the Island of Hawaii’s economy, and to offer more and better jobs in the community. “Good jobs” include farming with reasonable hours, a decent salary, and support; unskilled jobs at attractive hours and salary; and high-tech jobs generated by some of the opportunities farther down the value chain.
76
• Good overlaps with energy: Opportunities that overlap well with the Kohala Center and RMI’s prior research on energy, either by utilizing waste energy, providing opportunities for the use of renewable energy and biofuels, or increasing energy efficiency.
• Environmentally responsible: Opportunities that benefit the environment in various ways, such as reducing dependence on oil, providing ecosystem services, reducing waste, or improving land or water quality. Any action that improves locally produced food consumption or replaces development with agriculture will probably benefit the environment—these opportunities are ones that provide extra benefits.
• Short-/medium-/long-term fruition: In selecting a suite of opportunities, it is important to achieve a balance between timeframes. “Short” means ~1–5 years, “medium” means ~5–10 years, and “long” means 10+ years.
77
Appendix H: Descriptions of Top Opportunities The twelve opportunities are organized from shortest to longest timeframe for implementation.
“Hawaii Feeds Itself for a Day” Event This event would be a one-day, Island-wide event where all participating restaurants, schools, and stores would be “local only.” This project would take 1–2 years to come to fruition as farmers would have to spend time planting and raising all the produce Hawaii eats in one day, as well as setting up distribution and marketing for the day. The chief benefits of such an event would be to coordinate elements of a distribution and marketing infrastructure and enabling producers, distributors, and marketers to network, thus preparing the grounds for a longer-term food economy based on locally produced food. Pam and Kurt Hirabara of Hirabara Farms (one of the “local success stories” mentioned in this report) suggested this idea. They have already begun to research, assemble a team, and search for funding opportunities. Additional funding could ensure that their venture takes off and succeeds at a meaningful scale. Benefits of such a day include: • Excellent publicity for locally produced food, including getting residents to literally
“taste the difference”; • An impetus to set up distribution infrastructure and create networks between producers
and buyers that can be expanded in the future; • An incentive to experiment with growing certain vegetables that are currently very
popular but have no local market share (potatoes and carrots, for example) while figuring out cost-of-production and the response of certain species to local conditions; and
• A foundation for networks of people who are interested in bolstering the locally produced food movement, and a means to introduce them to other projects sponsored by participants at the event.
Distribution Trucking Group and/or Distribution Strategy Using Existent Infrastructure A lack of distribution infrastructure is preventing many farmers from connecting to customers. There are three potential ways to overcome this gap: with a new food distribution infrastructure; with a distribution network that uses existing infrastructure. Both could be pursued simultaneously; or with distributed places of cultivation. The new distribution infrastructure that would likely best suit Hawaii’s agriculture and food situation is a small fleet of refrigerated trucks or vans. These vans would visit small farms on a regular basis, pick up produce, and deliver it to customers such as grocery stores, restaurants, and markets. This model of distribution service would offer many benefits. It would:
78
• Aggregate produce from many farmers, thereby providing customers with a more sizable and constant supply and helping overcome restaurant’s/grocery stores’ doubts about local produce;
• Accept only certain varieties of a type of produce (there are several hundred types of avocados on island), assuring more consistent supply for end-users;
• Communicate between end-users and farmers, so that, for example, if restaurants/grocery stores expect a soaring demand for salad greens in the next 6 months, farmers can adapt;
• Simplify distribution so that buyers wishing to buy locally produced food only have to deal with one seller, and one price, not fifty;
• Capture economies of scale for marketing and distribution, saving farmers money and time;
• Achieve higher margins for delivery thanks to refrigeration; • Provide customer feedback for farmers, so that they can adapt; and • Pre-sort acceptable and unacceptable produce for end-users who wish to buy local but
are loath to commit to the extra time for the effort of sorting. Such a distribution service could adopt one of the following revenue models:
• Purchase produce from farmers, then resell to end-users (wholesale model); • Charge a percentage of the final sale from the farmer to the end-user; or • Provide services at a monthly fee, with the possibility to be a for profit or a not for
profit, depending on the willingness to pay of users. An example of this type of business is Adaptations, which is mentioned in this report. Adaptations organizes a number of small farmers to produce a certain array of organic, high-quality vegetables and distributes them to high-end restaurants. The market for high-end and organic produce is by no means saturated, and the market for conventional produce is limited to big distributors such as Armstrong. A system that utilizes current infrastructure could operate with limited expense and avoid all the logistics hurdles associated with new businesses and trucking. This might ensure the long-term success of distribution, and encourage quick adoption of the system by local people. Research into the benefits of each option needs to be conducted before further decisions are made:
• U.S. Postal Service (or FedEx/UPS?): several companies such as eBay and Amazon.com have successfully used these institutional distribution systems for their own businesses. The Postal Service is the only distribution system that already goes to every house in America, six days a week. However, it should be noted that mail going across the Island of Hawaii (from Kona to Hilo, for example) often goes through Honolulu. Further study into mail routing patterns and how to maximize speed/efficiency, as well as an understanding of the legality and preservative/packaging issues associated with mailing food, will be part of the investigation of this option;
• Dead time for existing distribution trucks: use empty, returning trucks to distribute local food;
• Utilize existing trips within a non-distribution infrastructure: school buses, metering, and coconut cutting trucks, are all examples of vehicles that frequently traverse the Island and could double as food distribution vehicles; and
79
• Utilize ready-made gathering places: distributing food at schools, churches, or shopping centers could greatly reduce the complexity of distribution.
By cultivating food in distributed locations, the challenge of creating a product distribution infrastructure could be lessened. For Hawaii, this would mean a flourishing of backyard personal vegetable gardens, home fruit trees, and cultivation of other small, privately owned plots of land throughout the island communities. Neighbors could exchange surpluses of certain foods, or families with larger plots of land could enter into more formal CSA agreements with neighbors. Models for such arrangements already exist, for example, Nancy Redfeather and Gerry Herbert grow 150-175 pounds of food a week for 3 neighboring families plus themselves, as well as coffee for many more. Their inputs are largely from the neighborhood: cow manure from fields nearby, kelp from the ocean, ground-up leaves from the county waste department. The impact of micro-local food economies should not be underrated, though it is difficult to quantify. A growth in micro-local food economies will rely on education about farming techniques and the benefits of homegrown foods, through Marketing/Education NGO and School Gardens mentioned as opportunities elsewhere in the document.
Barefoot MBA/Credit Facility Much capital is available to farmers in America through the USDA and other organizations. These funds are drastically underused in the State of Hawaii. The problem is often not the availability of funds: it is the ability of farmers/small businesspeople to access these funds, and the strings attached to them (such as having to partner with the university, which gets part of the grant). These problems can be addressed by improving two issues: creditworthiness and a farmer’s ability to apply for funds. A “Barefoot MBA” is a person with business training who can help farmers and small businesspeople turn their ideas and needs into successful grant and loan applications. The hurdles—from language barriers to difficult and complex forms to merely accessing applications—are many and require bureaucratic competence beyond that of many farmers, who are busy with farming. The Barefoot MBA would complement the university’s horticultural extension agents and give general business advice as a sort of “business extension agent.” The ideal institution would have a minimum of two-to-three Barefoot MBAs—at least one of whom would have local roots—in order to ensure mutual support and maximum efficacy. The institution would also be able to back applicants’ credit and could have its own revolving fund for mission-specific projects, such as water or energy efficiency improving devices. The benefits of such an institution include:
• Giving farmers access to existing sources of capital; • Giving farmers the ability to be creditworthy for loans; • Giving farmers business advice so that their enterprises will succeed; and • Creating a network of farmers and food businesspeople across the Island.
Biodiesel Crops and Production Many groups and individuals on the Island are interested in the potential for producing biodiesel from locally grown feedstocks. Biodiesel processing can be economically successful at both a small scale (local co-op of farmers) and at a large scale (industrial-scale processing facility). While ethanol production from sugarcane is being considered
80
for other islands in the state, RMI analysis has shown that ethanol from sugarcane is not commercially viable in Hawaii County because of less productive soil types and steeper grades. On the other hand, the economics might be different for biodiesel tree crops such as jatropha, kukui, and oil palm due to their different growing and harvesting requirements. Although more research needs to be conducted, it is possible that they could be economically grown for biodiesel production on the Island of Hawaii. Biodiesel can be used as a substitute for transportation diesel fuel or No. 2 fuel oil, and could therefore meet demand on the Island from trucks (such as those for the proposed distribution trucking service), electric power plants, irrigation pumps, and some farm equipment. If the farming industry increases mechanization to reduce labor costs, the on-Island demand for biodiesel could increase as well. Depending on the feedstock used, the byproducts from biodiesel processing can be used as compost for crops and protein-rich feed for cattle and chickens. Biodiesel grown and processed in Hawaii County would do the following: • Hedge against volatile fossil-fuel prices; • Be a potential cash crop to support food-farming operations; • Reduce input costs for fuel used in farming and distribution if biodiesel could be produced more cheaply than diesel prices. (Unfortunately, little is known about the precise costs of growing biodiesel feedstock crops in Hawaii. Based on production costs elsewhere, it is reasonable to assume that biodiesel could be cost-competitive, but trial plots must be planted to determine viability.); • Reduce dependence on oil imports. (A blend of 5 percent biodiesel with transportation diesel would use 2 million gallons per year of biodiesel, and a blend of 20 percent biodiesel would use 8 million gallons per year. If biodiesel were substituted for No. 2 fuel oil in the electric power sector at a 20 percent blend, approximately 3 million gallons of biodiesel could be demanded.); • Be a potential low-cost animal feed or compost from by-products; and • Reduce waste if waste oil or green waste could be used as feedstock (there are approximately 200,000 gallons per year of waste oil produced in Hawaii County).
Packaged/Pre-cooked Meals Convincing residents of Hawaii to buy locally produced foods may be a smaller challenge than convincing them to cook with fresh, unprocessed foods. Many residents of Hawaii (and mainlanders) have shied away from cooking in favor of frozen or pre-prepared meals that save time and effort. Therefore, having a locally prepared meal option could be the most powerful way to impact food behavior for the majority of residents. The benefits of packaged or pre-cooked meals are that they: • Do not require a change in eating habits as switching to locally grown fresh produces
does; • Add value to farmers’ products; • Increase demand for locally produced protein and produce; • Constitute an important demand for non-prime cuts of meat as well as aesthetically
imperfect vegetables, increasing farmers’ revenues per acre; • Could use waste heat in the production process to save costs; and • Can turn into a niche export, if quality was high, marketing as “Hawaiian” was strong,
and the ingredients were organic.
81
The University of Hawaii is already researching the potential for “meat pouches” that use non-prime cuts of grass-fed beef and local vegetables. Peter Merriman (a famous chef who uses local foods produced on the Island) has already expressed interest in helping create recipes and co-branding with the meat-pouching operation, and other local chefs might be willing to cooperate as well.
Fruit Park A fruit park, featuring a large variety of fruit trees as well as a restaurant and fruit/fruit product store, would be an ag-tourism destination. The concept is modeled on Japanese fruit parks that Ken Love and other people at CTAHR (College of Tropical Agriculture and Human Resources) have developed. Benefits of a fruit park would include: • Creating a flag-ship and model for the ag-tourism industry; • Launching a local-produce only restaurant could provide a constant market for local
farmers; • Creating fruit stands that could provide additional income to local producers, as well as
a new source of fruit for residents; • Building a commercial kitchen that could be an important resource for value-adding, as
well as a gift shop to market the products; • Conserving rare type of fruits and performing seed trials for varieties; and • Acting as a demonstration and educational facility for horticulture methods and new
techniques, such as organic farming. A possible location has already been identified at CTAHR extension farm site. The university has expressed a willingness to use land for this purpose if the park project is deemed acceptable. The location is on the main highway to Volcano, thus making the site easily accessible to tourists traveling on their own and buses from cruise ships.
Community Commercial Kitchen Overwhelmingly, our interviewees said that a community commercial kitchen was the key to supporting entrepreneurial food producers and creating a vibrant value-adding industry on the Island. Commercial kitchens are those that are certified to process food for commercial sale. A community commercial kitchen would be available to rent by the hour (and have several stations for different types of food processing) for small entrepreneurs. The kitchen could also buy supplies in bulk to save on input costs. Benefits of a community commercial kitchen include: • Constitutes a low-risk way for small entrepreneurs to get started and learn a business; • Helps create a network of small entrepreneurs interested in food, who can support
each other, co-market products, and share information and best practices; • Creates a more constant market for local producers; • Allows local produce to keep longer, making distribution more flexible; • Adds value to local produce; and • Provides potential nexus for “Made in Hawaii” branding. There is one commercial kitchen in Hamakua that has been underutilized. Another very small commercial kitchen may be opening in a church basement on the Kona coast soon. During Phase II, we will investigate why the Hamakua kitchen is struggling, and
82
the benefits and detriments of working with these existing kitchens or establishing new ones. Our analysis will also draw on the extremely successful community commercial kitchen on Oahu, where several successful businesses have been incubated.
School Gardens Almost every interviewee expressed support for school gardens. School gardens are more than just spaces set aside for growing plants. Schools that have them can offer students “garden” classes (special classes like music or PE) or take special garden elective or after-school classes. The school garden is overseen by a teacher who both instructs the students and maintains the garden. The food grown in the school garden can be used for snacks or lunches (school regulations permitting) or sold/given to another institution, such as a local soup kitchen. School gardens many benefits. They: • Create lifelong consumers for locally produced food by giving children direct food-
growing experience and by giving them a relationship with local foods, such as taro. School gardens also teach them to appreciate the reality of the food value chain and consider the origins of their food. If the students eat what they grow, it gives them a taste for fresh, locally produced food. Following the McDonald’s happy meal model, school gardens make locally produced food fun, and that association remains through life. This form of education will have more of an impact than any poster or media education campaign;
• Constitute an opportunity for students to exercise and spend time outdoors: with funding and support lagging for PE, and childhood obesity rates shooting up in Hawaii, the outdoor activities and exercise offered by gardening are very valuable;
• Give students basic skills and exposure to farming. Students who have successfully grown their own crops at school will be more likely to start gardens at home and continue gardening or farming throughout life;
• Create a sense of pride associated with farming and local food. One school garden teacher reported that students who previously remained quiet about their family’s farming or consumption of locally produced and traditional food started sharing these elements of their home life.
• Generate opportunities for hands-on learning about science, ecology, and the environment. The garden is a form of lab that supports science and environmental education; and
• Provide alternative learning structures for students. Garden teachers have realized that some students that do not do well in the standard classroom model often excel and find confidence in garden class.
Marketing and Consumer Education Body This institution, a more traditional non-profit, would work to improve consumers’ willingness to buy locally produced food. Long-term consumer pull is crucial to the success of the project. The organization would pursue marketing and education campaigns including:
• Consumer postering; • Chef education; • Cooking demonstrations with locally produced food in grocery stores; • Publicity of locally produced food producers and sellers;
83
• Organization of coherent marketing strategy for Island of Hawaii produce as a group brand; and
• Helping individual farms create brands. Several organizations are already working on this front, including the Farm Bureau and KTA’s and Foodland’s internal marketing departments. However, efforts need to be consolidated and the issue needs to be approached more dynamically and creatively than traditional marketing strategies can deliver. The Hawaii Organic Farmers Association has made progress in marketing a local brand, and could be a potential partner.
Production of Commodity Vegetables The production of everyday fruits and vegetables (as well as processed foods), the “tortoise” portion of RMI’s strategy, is more difficult and tenuous than developing foods for niche markets because they enjoy higher selling prices and the presence of a ready market. However, some farmers, such as the Hirabaras and Richard Ha, think that it is possible to grow some of the commodity vegetables that are currently being imported using innovative methods (hydroponics, greenhouses) and best practices. Specifically, the Hirabaras want to try and grow five Western produce products that are currently not being cultivated on the Island, and could use funding. Benefits of producing commodity vegetable on the Island include:
• Allowing customers to eat locally produced food without changing their consumption habits;
• Broadening the range of locally produced foods offered, thus allowing chefs and grocery stores that want to sell local food—but sometimes cannot because of lack of availability—to do so; and • Diversifying local production.
Mechanization R&D Labor is 32 percent of the cost of growing produce, and labor rates in Hawaii are 120 percent those on the mainland. Agriculture labor is also very difficult to find, prompting some growers to purposefully decrease productivity per acre because they do not have the hands necessary at harvest time. Around the globe, mechanization has brought down labor costs while improving productivity in all fields, including agriculture. However, traditional agricultural mechanization has not taken hold in Hawaii because the small farm sizes make investment in large machines uneconomical, and because the steep and rocky terrain makes the farms inaccessible for many agricultural machines. If residents of Hawaii were able to develop technology that was suited to smaller acreage, difficult terrain, and local crops, farmers might be able to save money in the largest segment of input costs. The larger macadamia nut farms are starting to use specialized machines, which is one-fifth the cost of hand picking.58 Since the agricultural 58 Conversation with Rick Vidgen. December 4, 2006.
84
labor demand is not currently being met, mechanization does not prove a major threat to jobs. The R&D for such technology development would probably need to take the form of a public-private partnership, co-sponsored by the State government. The State already has money and support available for high-tech development and innovation. Though farm equipment is often seen as “low-tech,” innovative and radical farming technology development could benefit from these State opportunities, and it could be just as important for the State’s economy as a new high-tech sector. These machines would not work for every farm or every crop grown on the Island. For example, farmers growing organic, artisinal produce for high-end restaurants would probably still not use machines for harvesting. Nevertheless, such R&D could be very beneficial to the overall agriculture sector as it exists now, and as it expands. Benefits of mechanization R&D include:
• Cutting agricultural production costs; and • Creating a new industry with jobs ranging from industrial to research.
Long-Term Landlord Though land rent is a small portion of input costs for farmers who have good land deals—leases that are long term and began long ago—the purchase price or rent of a few acres for new farmers is extremely high. Large landholders, such as Kamehameha Schools, are also loath to lease small portions of land because of the related administrative burden. Kamehameha Schools is also mandated to capture reasonable revenues from their land to support the schools.
A long-term lease landlord would rent a large tract of land at a reduced bulk price for a long period of time (50–100 years). This would save the land owner/manager the administrative hassle of several lessees. Then the long-term lease landlord could sublet small portions of the land (5–20 acres) for agricultural purposes that capture efficiencies of scale. Giving farmers long-term leases provides security for making investment in the land, and an incentive to treat the soil well. Kamehameha Schools has portions of former plantations that already have some infrastructure, such as roads and housing. This land is preferable. The land manager at Kamehameha Schools has already stated that he is open to discussing such a scheme.59
Benefits of having a long-term landlord include:
• Cost reduction for farmers; • Better access to land for farmers; and • Preservation of agricultural land.